  1 As of June 30, 2009 The Phoenix Companies, Inc. Investment Portfolio Supplement Exhibit 99.1 |
  2 Important disclosures This presentation may contain forward-looking statements within the meaning of the Private Securities Litigation Reform Act of 1995 which, by their nature, are subject to risks and uncertainties. We intend for these forward-looking statements to be covered by the safe harbor provisions of the federal securities laws relating to forward-looking statements. These include statements relating to trends in, or representing management’s beliefs about, our future transactions, strategies, operations and financial results, as well as other statements including words such as “anticipate,” “believe,” “plan,” “estimate,” “expect,” “intend,” “may,” “should” and other similar expressions. Forward-looking statements are made based upon our current expectations and beliefs concerning trends and future developments and their potential effects on the company. They are not guarantees of future performance. Our actual business, financial condition and results of operations may differ materially from those suggested by forward-looking statements as a result of risks and uncertainties, which include, among others: (i) unfavorable general economic developments including, but not limited to, specific related factors such as the performance of the debt and equity markets and changes in interest rates; (ii) the effect of continuing adverse capital and credit market conditions on our ability to meet our liquidity needs, our access to capital and our cost of capital; (iii) the possibility of losses due to defaults by others including, but not limited to, issuers of fixed income securities; (iv) changes in our investment valuations based on changes in our valuation methodologies, estimations and assumptions; (v) the effect of guaranteed benefits within our products; (vi) the consequences related to variations in the amount of our statutory capital due to factors beyond our control; (vii) downgrades in our debt or financial strength ratings; (viii) the possibility that mortality rates, persistency rates, funding levels or other factors may differ significantly from our pricing expectations; (ix) the availability, pricing and terms of reinsurance coverage generally and the inability or unwillingness of our reinsurers to meet their obligations to us specifically; (x) our dependence on non-affiliated distributors for our product sales; (xi) our dependence on third parties to maintain critical business and administrative functions; (xii) our ability to attract and retain key personnel in a competitive environment; (xiii) the strong competition we face in our business from banks, insurance companies and other financial services firms; (xiv) our reliance, as a holding company, on dividends and other payments from our subsidiaries to meet our financial obligations and pay future dividends, particularly since our insurance subsidiaries’ ability to pay dividends is subject to regulatory restrictions; (xv) the potential need to fund deficiencies in our Closed Block; (xvi) tax developments that may affect us directly, or indirectly through the cost of, the demand for or profitability of our products or services; (xvii) the possibility that the actions and initiatives of the U.S. Government, including those that we elect to participate in, may not improve adverse economic and market conditions generally or our business, financial condition and results of operations specifically (xviii) other legislative or regulatory developments; (xix) legal or regulatory actions; (xx) changes in accounting standards; (xxi) the potential effects of the spin-off of our former asset management subsidiary; (xxii) the potential effect of a material weakness in our internal control over financial reporting on the accuracy of our reported financial results; (xxiii) the risks related to a man-made or natural disaster; and (xxiv) other risks and uncertainties described herein or in any of our filings with the SEC. This information is provided as of June 30, 2009. We undertake no obligation to update or revise publicly any forward-looking statement, whether as a result of new information, future events or otherwise. |
  3 Table of contents Summary 4 Invested Assets 5 Historical Portfolio Ratings 6 - 7 Bond Portfolio 8 Financial Sector Holdings 9 Structured Securities Portfolio 10 Realized Credit Impairment Losses 11 Unrealized Losses 12 - 13 Commercial Mortgage-Backed Securities (CMBS) 14 - 15 Residential Mortgage-Backed Securities (RMBS) 16 - 23 Collateralized Debt Obligations (CDO) Holdings 24 Appendix: 25 - 28 Phoenix Life Insurance Company (PLIC) Closed Block Page(s) |
  4 Summary > Well diversified and liquid general account investment portfolio, managed by a team with a successful track record of investing over a variety of market cycles, following a disciplined monitoring process > Approximately 90% of bond investments are investment grade. Emphasis is on liquidity with 71% of bonds invested in public securities > Strict limits on individual financial exposures that mitigate our loss potential to any one particular entity; as a result, we have limited exposure to the financial institutions that have been in the news > Net unrealized losses improved by $502 million during the second quarter. Approximately 67% of unrealized losses are rated investment grade > Residential mortgage-backed securities exposure is high quality and diversified. Exposure is concentrated in agency and prime-rated securities with only 2.2% of invested assets in Alt-A and subprime investments of which 86% is rated AAA and AA > Commercial mortgage exposure is in highly rated commercial mortgage-backed securities with minimal direct loan or real estate holdings > No subprime collateralized debt obligations (CDO) exposure. CDO holdings are backed by bank loans, investment grade bonds and commercial mortgage-backed securities > No credit default swap (CDS) exposure |
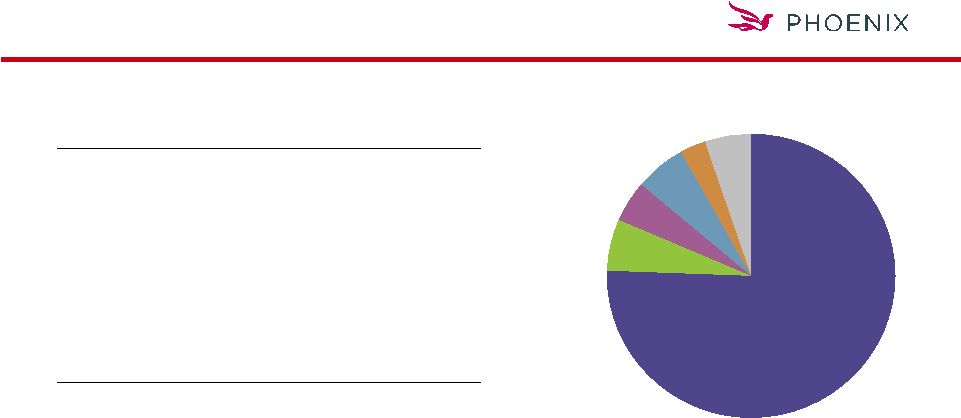
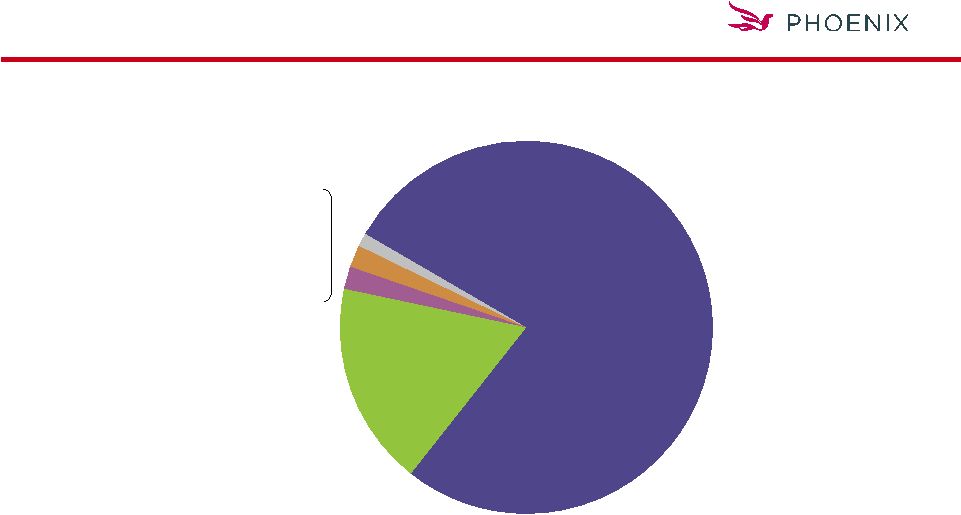
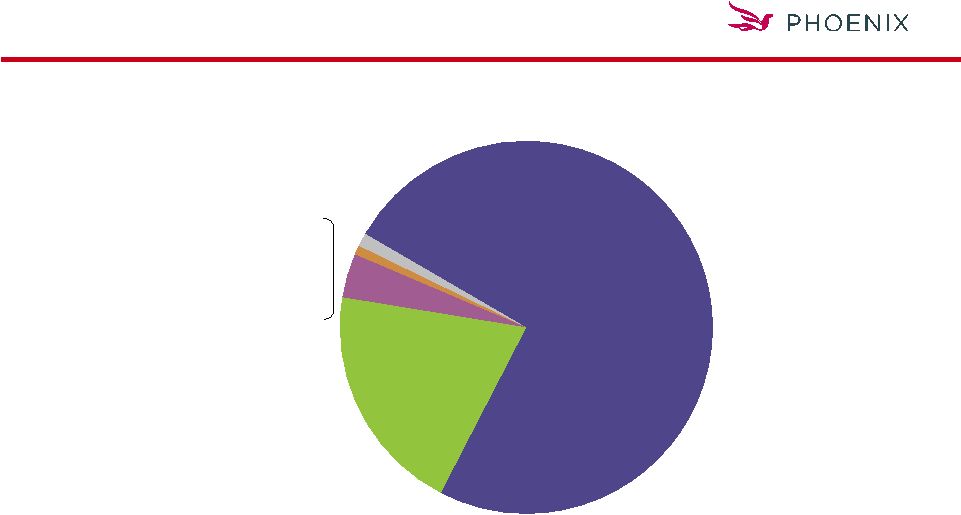  5 Portfolio comprised primarily of fixed income securities Bonds $10,053 75% Policy Loans $2,647 19% Cash & Cash Equivalents $138 1% Venture Capital $180 1% Stock $24 0% Mortgages & Real Estate $49 0% Other Invested Assets $509 4% Invested Assets: $13.6 Billion $ in millions Market value as of June 30, 2009 |
  6 High quality portfolio Percentages based on GAAP Value As of June 30, 2009 29.1 29.6 27.5 25.6 Private Bonds 70.4 41.0 59.0 8.2 91.8% 2008 70.9 42.0 58.0 10.5 89.5% 2Q 2009 72.5 74.4 Public Bonds 35.3 27.5 Percentage of BIG in NAIC 4-6 64.7 72.5 Percentage of BIG in NAIC 3 7.7 8.3 Below Investment Grade (BIG) Bonds 92.3% 91.7% Investment Grade Bonds 2006 2007 |
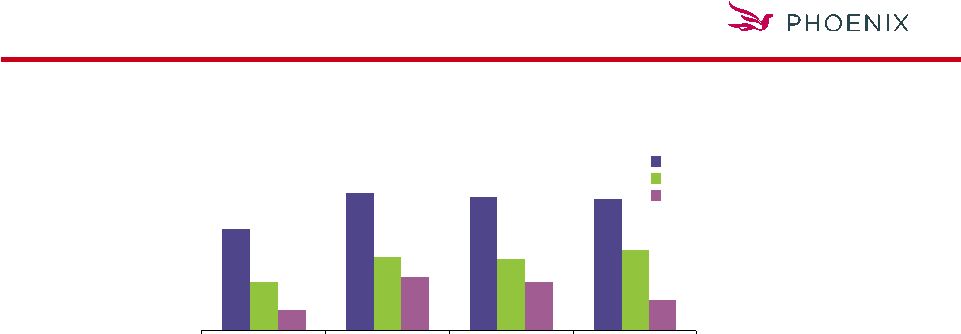  7 Rating downgrades of asset-backed securities > Rating agency downgrade activity dominated the market in 2008 and early in 2009 > 88% of the Phoenix ABS, RMBS, and CMBS portfolio are Aaa/AAA and Aa/AA > The Phoenix portfolio held up well despite the challenging markets 2009 Twelve Month Ratings Transition Data - % of ABS, CMBS, RMBS Downgraded Based on # of issues Source: Moody’s June 2009 Structured Rating Transitions, S&P Structured Finance Rating Transition as of June, 2009 44% 60% 58% 57% 32% 21% 31% 35% 21% 23% 13% 9% Aaa/AAA Aa/AA A/A Baa/BBB Moody's S & P Phoenix |
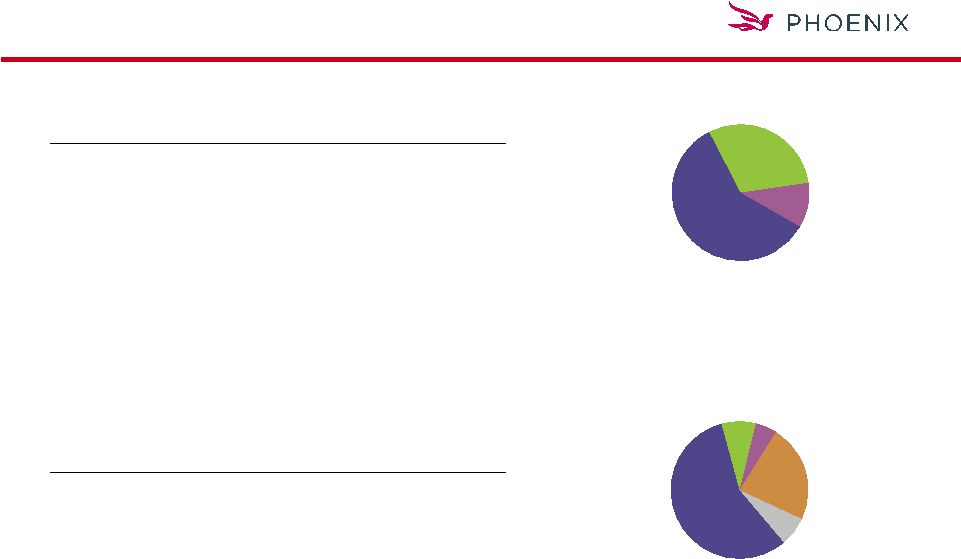  8 Bond portfolio diversified by sector U.S. Corporates 57% Foreign Corporates 8% ABS 23% Emerging Markets 5% $ in millions Market value as of June 30, 2009 1 Includes $175.7 million of Home Equity Asset Backed Securities also included in the RMBS exhibits Below Investment Grade Bonds RMBS 7% 4.1 415 Utilities 2.2 223 CDO/CLO 11.2 1,129 U.S. Treasuries / Agencies 14.4 1,450 Financials 14.1 1,412 Foreign Corporates Bond Portfolio 100.0% $10,053 Total 1.1 113 Emerging Markets 1.7 173 Taxable Municipals 4.1 407 Asset Backed Securities 1 As of June 30, 2009 9.8 981 Commercial MBS 14.6 1,464 Residential MBS $2,286 22.7% Industrials Bonds by Rating NAIC 1 59.1% NAIC 2 30.4% NAIC 3 & Lower 10.5% |
  9 Diverse financial sector holdings 56.3 0.3 36.6 45.2 Consumer Finance 58.2% 10.6% $1,450.1 $1,741.0 Total - - 0.7 0.7 Project Finance 56.2 1.5 199.6 220.0 REITS 55.8 0.7 95.2 95.6 Leasing/Rental 61.9 2.4 331.0 375.7 Insurance 46.0 1.7 238.7 344.6 Diversified Financial 50.1 0.5 61.5 78.3 Commercial Finance 54.9 0.7 98.2 107.1 Broker-Dealer 66.4% 2.8% $388.6 $473.8 Bank Book Value Market Value % General Account % in Closed Block Sector As of June 30, 2009 Percentages based on market value $ in millions |
  10 High quality structured securities portfolio > Structured portfolio is approximately 90% investment grade > RMBS (48%) and CMBS (32%) dominate the structured portfolio AAA 75.5% B or less – 5.8% BBB – 6.0% AA – 5.2% A – 2.8% BB – 4.7% 1 Includes $22.5 million of CMBS CDOs Market value as of June 30, 2009 $ in millions 7.3% 222.9 CDO/CLO 1 1.0% 30.8 Aircraft Equipment Trust Structured Securities Portfolio 100.0% $3,074.1 Total 0.5% 15.8 Auto Loans As of June 30, 2009 1.3% 40.1 Manufactured Housing 31.9% 980.8 Commercial MBS 5.7% 175.7 Home Equity 4.7% 144.1 Other ABS $ 1,463.9 47.6% Residential MBS |
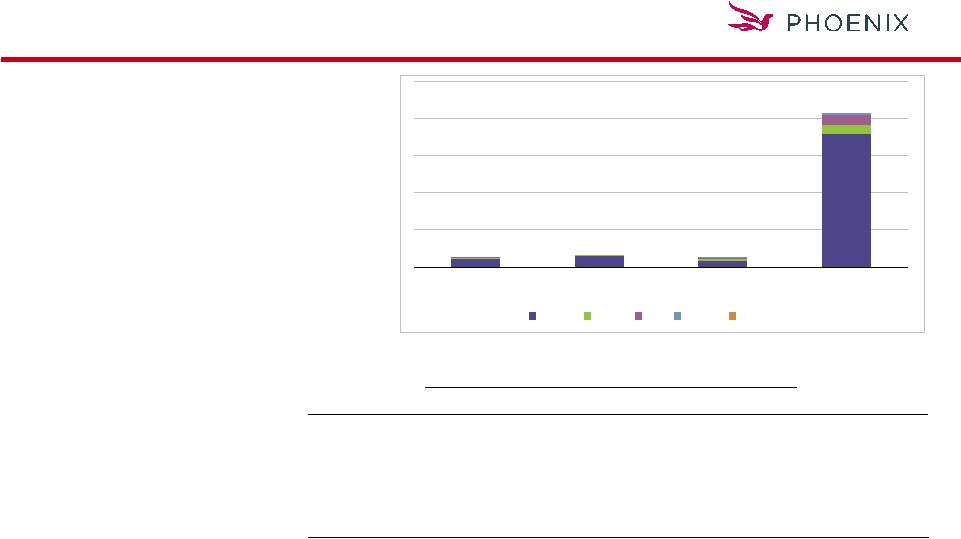
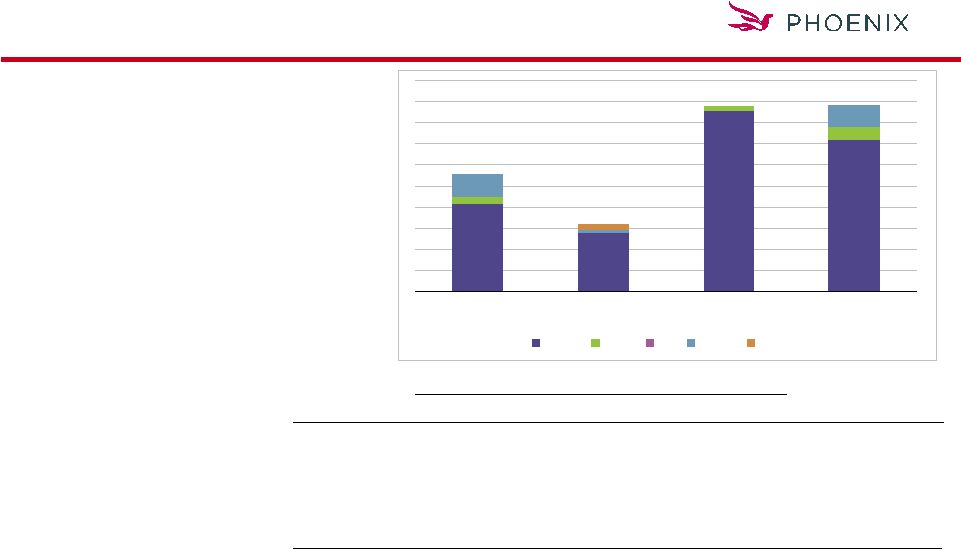
  11 Moderation in credit impairments As of June 30, 2009 $ in millions $137.7 8.2 $129.5 5.7 75.7 1.7 19.0 17.5 8.2 $1.7 4Q 2008 $38.3 6.9 $31.4 3.8 19.5 - 2.6 0.7 3.6 $1.2 1Q 2009 $20.9 1.8 $19.1 - 4.6 - 7.1 5.4 1.6 $0.4 2Q 2009 Total Debt Schedule BA Total Credit Impairments Other ABS/MBS Corporate CMBS CLO/CDO Subprime RMBS Alt-A RMBS Prime RMBS GAAP Credit Impairments |
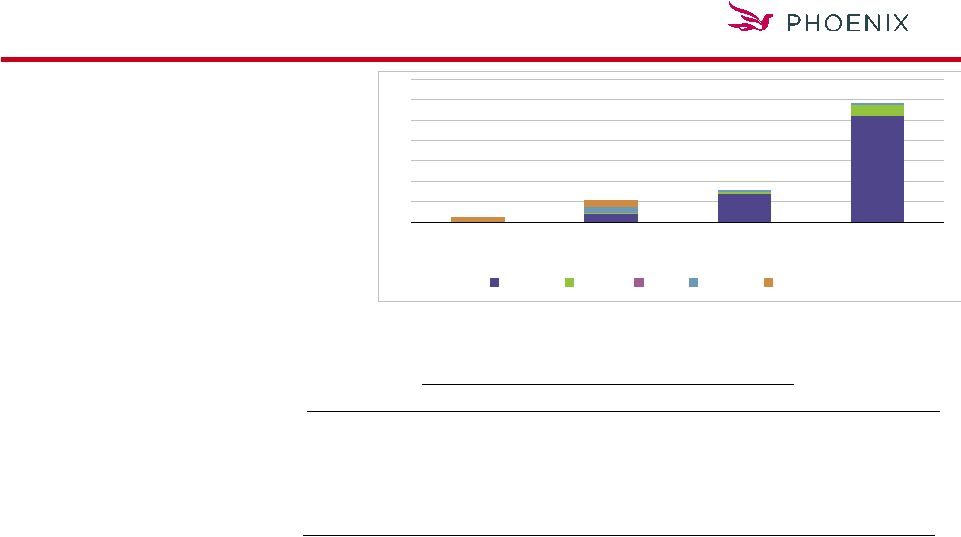
  12 Improved net unrealized loss position 1 All Other – Corporates, RMBS, Other ABS, Foreign As of June 30, 2009 $ in millions $(1,645.2) (388.9) (192.3) (410.6) (160.9) (214.4) (155.4) $(122.7) December 31, 2008 $ (1,574.6) (294.4) (185.7) (469.9) (160.7) (154.7) (199.6) $ (109.6) March 31, 2009 $501.9 $(1072.7) Total 171.7 (122.7) All Other 1 68.8 (116.9) All Other High Yield 179.1 (290.9) Financial 29.7 (131.0) CMBS 8.4 (146.3) CDO/CLO 34.4 (165.1) Subprime/Alt-A $9.8 $(99.8) RMBS Prime 2Q 2009 Change June 30, 2009 |
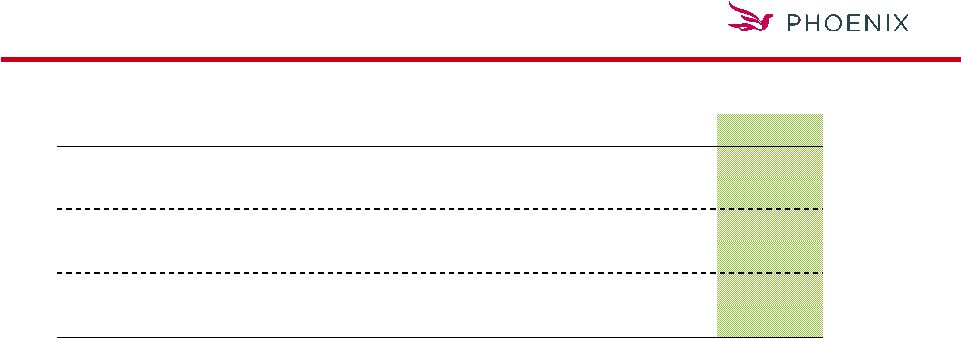
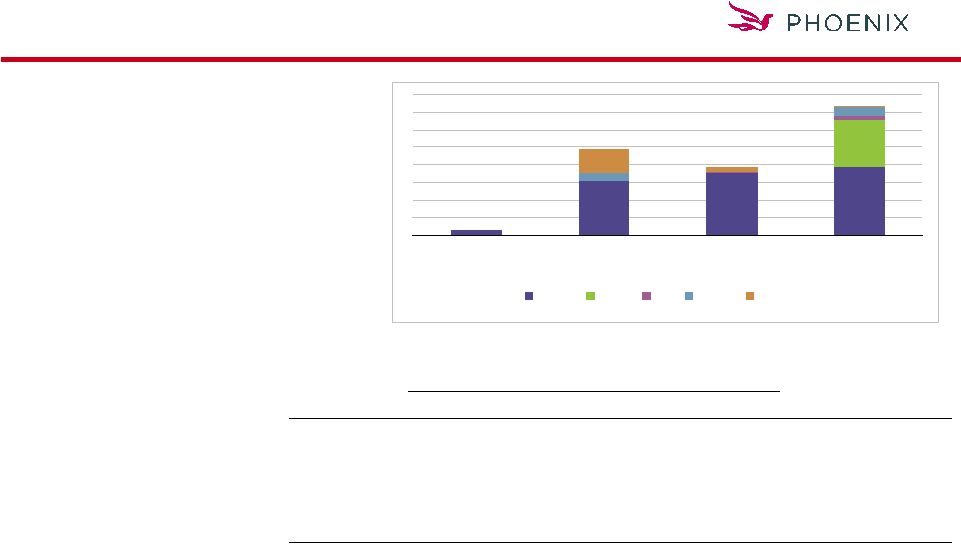
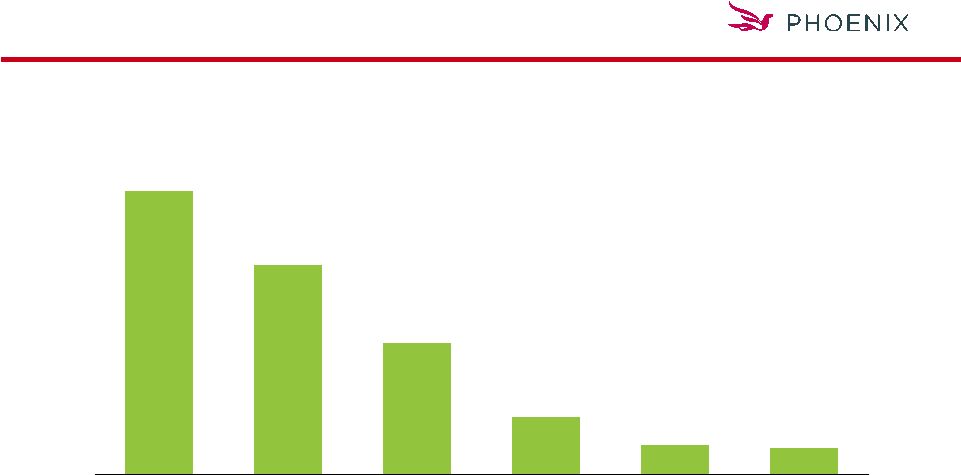  13 Gross unrealized losses concentrated in investment grade issues Market value as of June 30, 2009 $ in millions $477.7 $353.4 $221.8 $96.9 $49.6 $46.1 NAIC 1 NAIC 2 NAIC 3 NAIC 4 NAIC 5 NAIC 6 |
  14 Well constructed CMBS portfolio Phoenix CMBS Portfolio > High levels of credit enhancement > Excellent credit characteristics vs. market > Avoided 2006 and 2007 aggressive underwriting 48 months 69.4% 5.92% 64% 29% 26% Market 1 6.87% Weighted average coupon 70.0% Weighted average LTV 29% Weighted average credit enhancement 88 months Weighted average loan age 27% Interest Only (I/O) loans 38% Weighted average credit enhancement (U.S. Treasury defeasance adjusted) Phoenix 1 Sources: Barclays CMBS Index, Trepp As of June 30, 2009 |
  15 AAA $44.4 $56.2 $33.1 $717.7 $851.4 84.9% AA 3.3 5.7 9.0 48.8 66.8 6.7 A 7.3 2.6 8.5 51.1 69.5 6.9 BBB - 0.9 0.9 13.4 15.2 1.5 Below BBB - - 0.4 - 0.4 - Total $55.0 $65.4 $51.9 $831.0 $1,003.3 % Yr of Issue 5.5% 6.5% 5.2% 82.8% Highly rated, seasoned CMBS portfolio > $1.0 billion in market value > $168 million Government guaranteed > 84.8% AAA and less than 2% BBB or below > 88% 2005 and prior origination > Only 2% in CMBS CDO’s Market value as of June 30, 2009 Percentages based on market value $ in millions 2007 2006 2005 2004 & Prior AAA AA A BBB Below BBB $55.0 $65.4 $51.9 $831.0 2007 2006 2005 2004 and Prior Total % by Rating Year of Issue |
  16 High quality,diversified RMBS portfolio As of June 30, 2009 Percentages based on market value $ in millions 3.1% 1.2% 10.6% 7.3% - BB & Below 2.7% 0.2% 3.9% 90.1% 12.0% $1,639.6 $1,876.1 Total 8.6% - 4.4% 85.8% 1.0% 132.2 199.0 Subprime 5.9% 1.9% 15.7% 65.9% 1.2% 164.0 262.3 Alt-A 5.3% 0.2% 7.3% 79.9% 3.2% 438.0 537.8 Prime - - - 100.0% 6.6% $905.4 $877.0 Agency BBB A AA AAA % General Account Market Value Book Value Rating |
  17 Well constructed RMBS portfolio 27.6 89.3 66.9 90.2 1.0 Subprime 34.0 100.0 68.5 81.6 1.2 Alt-A 3.2% % of General Account Non-Agency Prime 84.1% % of Portfolio Originated in 2005 & Prior 87.2% % Rated AAA & AA 91.0% % of Portfolio Backed by Fixed Rate Collateral 47.0% % of Market Backed by Fixed Rate Collateral Market value as of June 30, 2009 Source: JP Morgan MBS Research, Bank of America/Merrill Lynch Credit Round-up |
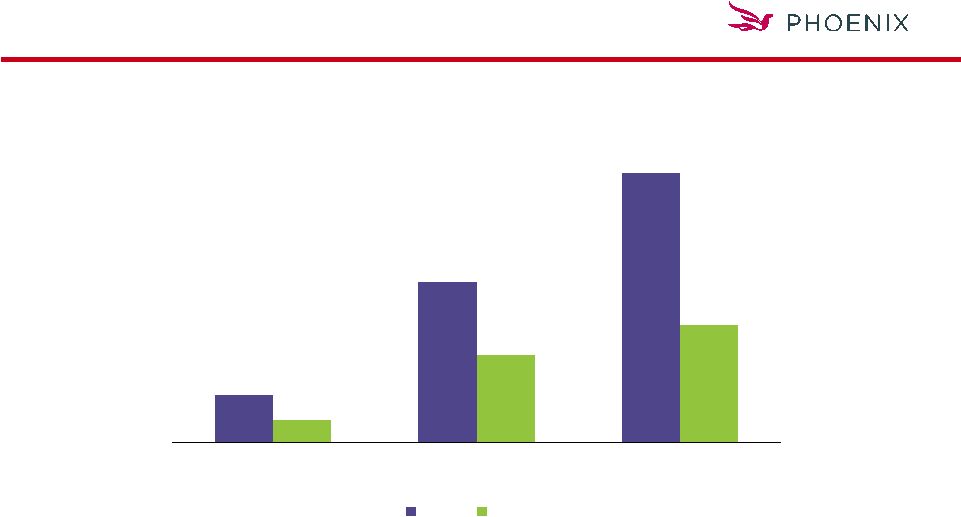  18 RMBS delinquencies better than market As of June 30, 2009 Source: JP Morgan MBS Research 60+ day 7.4% 24.8% 41.5% 3.5% 18.1% 13.6% Non-Agency Prime Alt-A Subprime Market Phoenix |
  19 AAA - $19.9 $68.5 $261.3 $349.7 79.9% AA - 2.9 5.6 23.6 32.1 7.3 A - - 0.4 0.3 0.7 0.2 BBB - 14.6 1.9 6.9 23.4 5.3 Below BBB 12.6 19.5 - - 32.1 7.3 Total $12.6 $56.9 $76.4 $292.1 $438.0 % Yr of Issue 2.9% 13.0% 17.4% 66.7% High quality, seasoned non-agency prime RMBS holdings > $438.0 million market value > 80% AAA rated > 84% 2005 and prior origination > 91% fixed rate > 100% of 2007 originations are super senior classes As of June 30, 2009 Percentages based on market value $ in millions 2007 2006 2005 2004 and Prior AAA AA A BBB Below BBB $12.6 $56.9 $76.4 2007 2006 2005 2004 and Prior Total % by Rating $292.1 Year of Issue |
  20 Well constructed non-agency prime RMBS holdings As of June 30, 2009 Source: JP Morgan MBS Research – June 2009, Bloomberg Market Phoenix Weighted average credit enhancement 4.97% 9.62% Weighted average 60+ day delinquent loan 7.37% 3.51% Phoenix prime portfolio loss coverage: using 25% loss severity 2.7x 10.8x |
  21 AAA $2.7 $30.9 $35.5 $39.0 $108.1 65.9% AA - - - 25.8 25.8 15.7 A - - 0.6 2.5 3.1 1.9 BBB - 4.0 - 5.5 9.5 5.9 BB & Below - 14.1 2.8 0.6 17.5 10.6 Total $2.7 $49.0 $38.9 $73.4 $164.0 % Yr of Issue 1.6% 29.9% 23.7% 44.8% High quality, seasoned non-agency Alt-A RMBS holdings > $164 million market value > 82% AAA or AA rated > 69% 2005 and prior originations 2007 2006 2005 2004 and Prior AAA AA A BBB Below BBB Market value as of June 30, 2009 Percentages based on market value $ in millions $2.7 $49.0 $38.9 $73.4 2007 2006 2005 2004 and Prior Total % by Rating Year of Issue |
  22 Well constructed non-agency Alt-A RMBS portfolio As of June 30, 2009 Sources: JP Morgan MBS Research – June 2009 Bank of America/Merrill Lynch – June 2009 Option ARM 32% 0.1% Alt-A ARM 35% - Alt-A Fixed 33% 99.9% 60+ Delinquent 24.8% 13.6% Alt-A Market Phoenix |
  23 AAA $20.8 $13.8 $42.9 $35.9 $113.4 85.8% AA 1.7 - 1.1 3.0 5.8 4.4 A - - - - - - BBB 5.4 0.8 - 5.2 11.4 8.6 Below BBB - 1.3 0.1 0.2 1.6 1.2 Total $27.9 $15.9 $44.1 $44.3 $132.2 % Yr of Issue 21.1% 12.0% 33.3% 33.6% High quality non-agency subprime RMBS portfolio > $132.2 million market value > 90.2% rated AAA or AA > Phoenix 60+ day delinquent 18.1% vs. 41.5% for the subprime market > Phoenix weighted average credit support is 33.9% 2007 2006 2005 2004 and Prior AAA AA A BBB Below BBB $ in millions As of June 30, 2009 Percentages based on market value Source: JP Morgan MBS Research June 2009 $27.9 $15.9 $44.1 $44.3 2007 2006 2005 2004 and Prior Total % by Rating Year of Issue |
  24 Diversified CDO holdings As of June 30, 2009 Percentages based on market value $ in millions 25.3% - 1.7% - 56.5% 24.9% BB & Below 24.3% 4.3% 34.7% 35.0% 0.2% 22.5 58.1 CMBS 32.2% 24.5% 12.3% 5.7% 1.6% $222.9 $373.0 Total - - - - - - - RMBS 100.0% - - - - 3.8 3.9 High-Yield Debt 11.2% - 32.3% - 0.1% 22.6 35.3 Inv Grade Debt 34.4% 30.9% 7.1% 2.7% 1.3% $174.0 $275.7 Bank Loans BBB A AA AAA % General Account Market Value Book Value Collateral |
  Appendix |
  26 PLIC Closed Block investments primarily fixed income Bonds $6,124 78% Policy Loans $1,414 18% Cash & Cash Equivalents $17 0% Venture Capital $168 2% Stock $8 0% Mortgages & Real Estate $7 0% Other Invested Assets $137 2% Invested Assets: $7.9 Billion $ in millions Market value as of June 30, 2009 |
  27 PLIC Closed Block portfolio high quality Percentages based on GAAP Value As of June 30, 2009 32.1 67.9 36.1 63.9 6.4 93.6% 2008 32.2 67.8 37.2 62.8 8.3 91.7% 2Q 2009 30.7 28.7 Private Bonds 69.3 71.3 Public Bonds 32.4 23.4 Percentage of BIG in NAIC 4-6 67.6 76.6 Percentage of BIG in NAIC 3 6.8 7.4 Below Investment Grade (BIG) Bonds 93.2% 92.6% Investment Grade Bonds 2006 2007 |
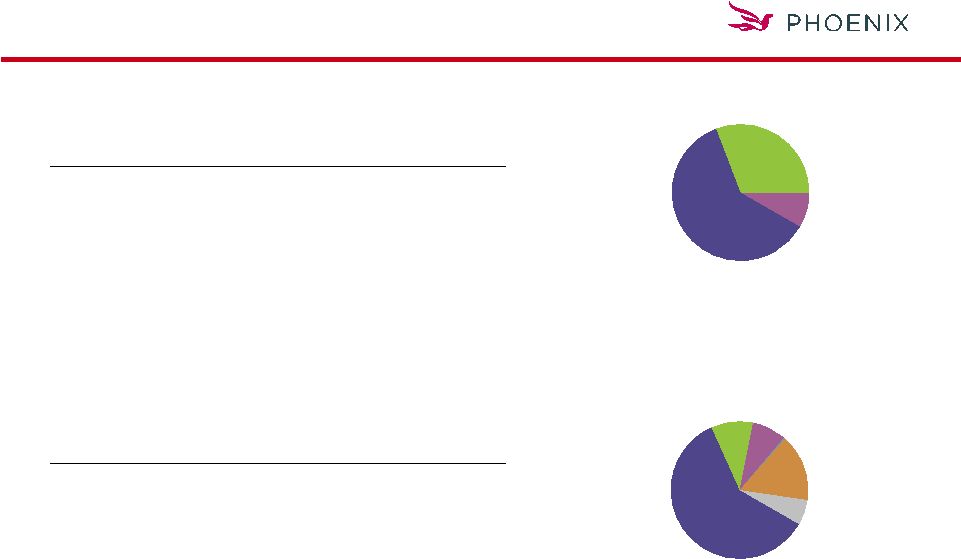  28 PLIC Closed Block portfolio diversified U.S. Corporates 60% Foreign Corporates 10% ABS 16% Emerging Markets 8% $ in millions Market value as of June 30, 2009 Below Investment Grade Bonds 4.8 293.8 Utilities 12.2 746.0 Commercial MBS 13.7 841.3 Foreign Corporates Bond Portfolio Phoenix Closed Block 100.0% $6,123.6 Total 1.8 107.9 Emerging Markets 2.1 126.2 Taxable Municipals 3.2 199.9 Asset Backed Securities As of June 30, 2009 7.8 477.0 U.S. Treasuries / Agencies 15.2 931.5 Residential MBS 13.8 843.3 Financials $1,556.7 25.4% Industrials Bonds by Rating AAA/AA/A 60.8% BBB 30.9% BB & Lower 8.3% RMBS 6% |
  |