
1
EXHIBIT 99.1
The Phoenix Companies, Inc.
Investment Portfolio Supplement
Investment Portfolio Supplement
As of June 30, 2010

2
Important disclosures
This presentation may contain “forward-looking statements” within the meaning of the Private Securities Litigation Reform Act of 1995. We intend for these
forward-looking statements to be covered by the safe harbor provisions of the federal securities laws relating to forward-looking statements. These forward-
looking statements include statements relating to trends in, or representing management’s beliefs about, our future transactions, strategies, operations and
financial results, and often contain words such as “will,” “anticipate,” “believe,” “plan,” “estimate,” “expect,” “intend,” “may,” “should” and other similar words or
expressions. Forward-looking statements are made based upon management’s current expectations and beliefs concerning trends and future developments
and their potential effects on us. They are not guarantees of future performance. Our actual business, financial condition and results of operations may differ
materially from those suggested by forward-looking statements as a result of risks and uncertainties, which include, among others: (i) unfavorable general
economic developments including, but not limited to, specific related factors such as the performance of the debt and equity markets and changes in interest
rates; (ii) the potential adverse affect of interest rate fluctuations on our business and results of operations; (iii) the effect of adverse capital and credit market
conditions on our ability to meet our liquidity needs, our access to capital and our cost of capital; (iv) changes in our investment valuations based on changes
in our valuation methodologies, estimations and assumptions; (v) the effect of guaranteed benefits within our products; (vi) potential exposure to unidentified or
unanticipated risk that could adversely affect our businesses or result in losses; (vii) the consequences related to variations in the amount of our statutory
capital due to factors beyond our control; (viii) the possibility that we not be successful in our efforts to implement a new business plan; (ix) the impact on our
results of operations and financial condition of any required increase in our reserves for future policyholder benefits and claims if such reserves prove to be
inadequate; (x) further downgrades in our debt or financial strength ratings; (xi) the possibility that mortality rates, persistency rates, funding levels or other
factors may differ significantly from our assumptions used in pricing products; (xii) the possibility of losses due to defaults by others including, but not limited to,
issuers of fixed income securities; (xiii) the availability, pricing and terms of reinsurance coverage generally and the inability or unwillingness of our reinsurers
to meet their obligations to us specifically; (xiv) our ability to attract and retain key personnel in a competitive environment; (xv) our dependence on third parties
to maintain critical business and administrative functions; (xvi) the strong competition we face in our business from banks, insurance companies and other
financial services firms; (xvii) our reliance, as a holding company, on dividends and other payments from our subsidiaries to meet our financial obligations and
pay future dividends, particularly since our insurance subsidiaries’ ability to pay dividends is subject to regulatory restrictions; (xviii) the potential need to fund
deficiencies in our closed block; (xix) tax developments that may affect us directly, or indirectly through the cost of, the demand for or profitability of our
products or services; (xx) the possibility that the actions and initiatives of the U.S. Government, including those that we elect to participate in, may not improve
adverse economic and market conditions generally or our business, financial condition and results of operations specifically; (xxi) legislative or regulatory
developments; (xxii) regulatory or legal actions; (xxiii) potential future material losses from our discontinued reinsurance business; (xxiv) changes in accounting
standards; (xxv) the potential impact of a material weakness in our internal control over financial reporting on the accuracy of our reported financial results,
investor confidence and our stock price;(xxvi) the risks related to a man-made or natural disaster; (xxvii) risks related to changing climate conditions; and
(xxviii) other risks and uncertainties described herein or in any of our filings with the SEC.
This information is provided as of June 30, 2010. Certain other factors which may impact our business, financial condition or results of operations or which
may cause actual results to differ from such forward-looking statements are discussed or included in our periodic reports filed with the SEC and are available
on our web site at www.phoenixwm.com under “Investor Relations”. You are urged to carefully consider all such factors. We do not undertake or plan to
update or revise forward-looking statements to reflect actual results, changes in plans, assumptions, estimates or projections, or other circumstances occurring
after the date of this presentation, even if such results, changes or circumstances make it clear that any forward-looking information will not be realized. If we
make any future public statements or disclosures which modify or impact any of the forward-looking statements contained in or accompanying this
presentation, such statements or disclosures will be deemed to modify or supersede such statements in this presentation.

3
Page(s)
Table of contents
Summary 4
Invested Assets 5
Historical Portfolio Ratings 6
Bond Portfolio 7
Financial Sector Holdings 8
Structured Securities Portfolio 9
Realized Credit Impairment Losses 10
Unrealized Losses 11
Commercial Mortgage-Backed Securities (CMBS) 12 - 14
Residential Mortgage-Backed Securities (RMBS) 15 - 22
Collateralized Debt Obligations (CDO) Holdings 23
Appendix: 24 - 27
Phoenix Life Insurance Company (PLIC) Closed Block

4
As of June 30, 2010
Summary
> General account investment portfolio is well diversified and liquid; managed by a team with a
successful track record of investing over a variety of market cycles, following a disciplined monitoring
process
successful track record of investing over a variety of market cycles, following a disciplined monitoring
process
> Approximately 91% of bond investments are investment grade. Emphasis is on liquidity with 71% of
bonds invested in public securities
bonds invested in public securities
> Strict limits on individual financial exposures that mitigate loss potential to any one particular entity; as
a result, there is limited exposure to the financial institutions that have been in the news
a result, there is limited exposure to the financial institutions that have been in the news
> Net unrealized gains of $115.2 million versus net unrealized losses of $1,073 million a year ago
> Residential mortgage-backed securities (RMBS) exposure is high quality and diversified. Exposure is
concentrated in agency and prime-rated securities with only 2.6% of invested assets in Alt-A and
subprime investments
concentrated in agency and prime-rated securities with only 2.6% of invested assets in Alt-A and
subprime investments
> Commercial mortgage exposure is in highly rated commercial mortgage-backed securities with
minimal direct loan or real estate holdings
minimal direct loan or real estate holdings
> No subprime collateralized debt obligations (CDO) exposure. CDO holdings are backed by bank
loans, investment grade bonds and commercial mortgage-backed securities
loans, investment grade bonds and commercial mortgage-backed securities
> No credit default swap (CDS) exposure
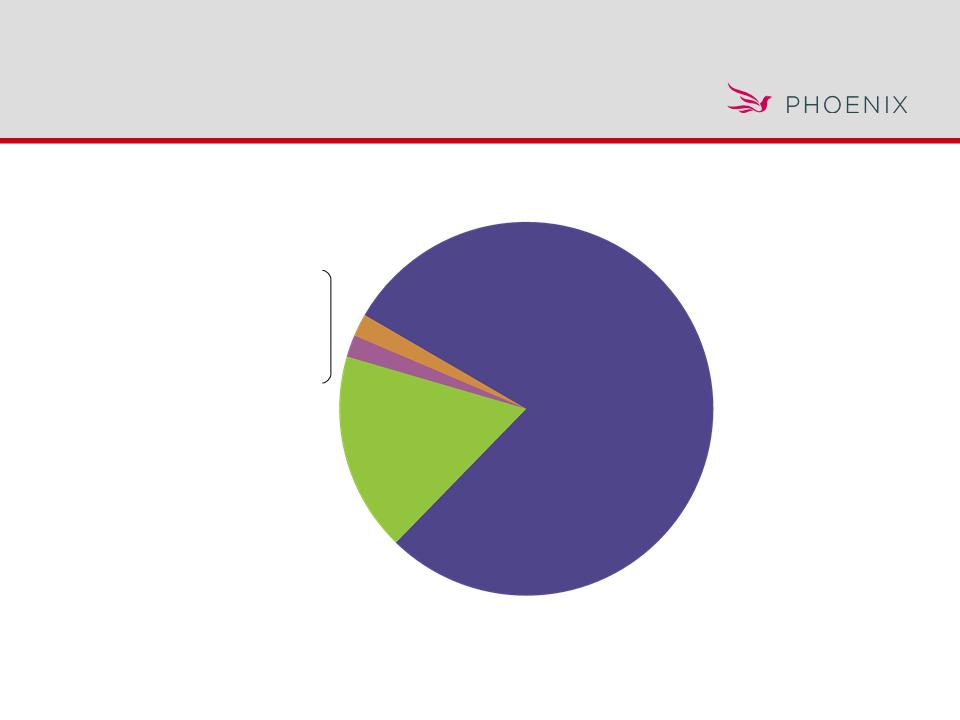
5
Bonds $10,813
76%
Policy Loans $2,338
17%
Cash & Cash Equivalents $120 1%
Venture Capital $207 2%
Stock $38 0%
Mortgages & Real Estate $37 0%
Other Invested Assets $622 4%
Total Invested Assets: $14.2 Billion
$ in millions
Market value as of June 30, 2010
Portfolio comprised
primarily of fixed income securities
primarily of fixed income securities

6
Percentages based on GAAP Value
As of June 30, 2010
2Q09 | 3Q09 | 4Q09 | 1Q10 | 2Q10 | |
Investment Grade Bonds | 89.5% | 88.6% | 89.2% | 89.9% | 90.9% |
Below Investment Grade (BIG) Bonds | 10.5 | 11.4 | 10.8 | 10.1 | 9.1 |
Percentage of BIG in NAIC 3 | 58.0 | 51.7 | 57.9 | 53.8 | 55.1 |
Percentage of BIG in NAIC 4-6 | 42.0 | 48.3 | 42.1 | 46.2 | 44.9 |
Corporate | |||||
Investment Grade | 89.6 | 89.3 | 89.6 | 90.3 | 91.0 |
Below Investment Grade | 10.4 | 10.7 | 10.4 | 9.7 | 9.0 |
Structured | |||||
Investment Grade | 89.5 | 87.2 | 88.6 | 89.6 | 90.7 |
Below Investment Grade | 10.5 | 12.8 | 11.4 | 10.4 | 9.3 |
Portfolio quality improved
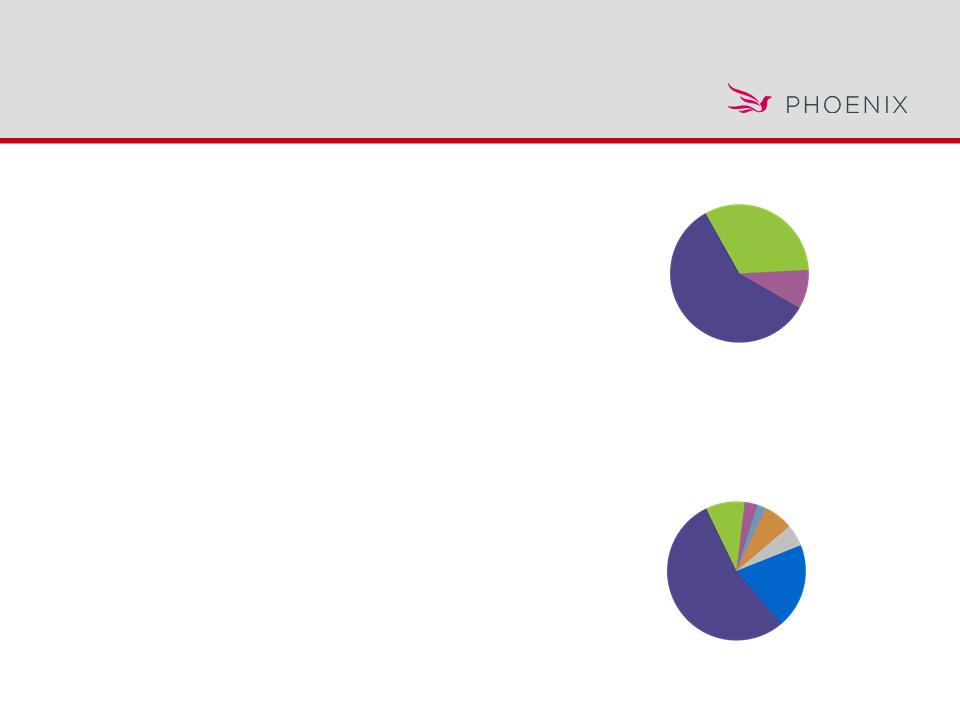
7
U.S. Corporates
54%
Foreign Corporates
9%
ABS 7%
Emerging Markets
3%
$ in millions
Market value as of June 30, 2010
1 Includes $204.6 million of Home Equity Asset Backed Securities also included in the RMBS exhibits
2 Includes $33.9 million of CMBS CDO’s also included in the CMBS exhibits
Below Investment Grade (BIG) Bonds
by Sector
RMBS
5%
Bond Portfolio | ||
As of June 30, 2010 | Market Value | % of Total |
Industrials | $2,470.4 | 22.9% |
Residential MBS1 | 2,117.4 | 19.6 |
Foreign Corporates | 1,550.9 | 14.4 |
Financials | 1,453.4 | 13.4 |
Commercial MBS | 1,102.9 | 10.2 |
U.S. Treasuries / Agencies | 734.8 | 6.8 |
Utilities | 501.3 | 4.6 |
Asset Backed Securities | 357.5 | 3.3 |
CBO/CDO/CLO2 | 248.9 | 2.3 |
Taxable Municipals | 175.6 | 1.6 |
Emerging Markets | 99.6 | 0.9 |
Total | $10,812.7 | 100.0% |
Bonds by Rating
NAIC 1
58.7%
NAIC 2
32.2%
NAIC 3 & Lower
(BIG)
(BIG)
9.1%
CDO/CLO
20%
CMBS 2%
Bond portfolio diversified by sector

8
Sector | Book Value | Market Value | % General Account | % in Closed Block |
Bank | $471.1 | $444.5 | 3.1% | 68.5% |
Broker-Dealer | 80.2 | 78.7 | 0.6 | 47.4 |
Commercial Finance | 59.7 | 59.1 | 0.4 | 40.5 |
Consumer Finance | 47.2 | 46.1 | 0.3 | 68.7 |
Diversified Financial | 251.9 | 196.2 | 1.4 | 49.5 |
Insurance | 343.4 | 347.3 | 2.5 | 65.3 |
Leasing/Rental | 79.1 | 86.7 | 0.6 | 61.4 |
REITS | 186.8 | 194.4 | 1.4 | 61.3 |
Project Finance | 0.3 | 0.4 | - | - |
Total | $1,519.7 | $1,453.4 | 10.3% | 61.5% |
$ in millions
As of June 30, 2010
Percentages based on market value
Diverse financial sector holdings
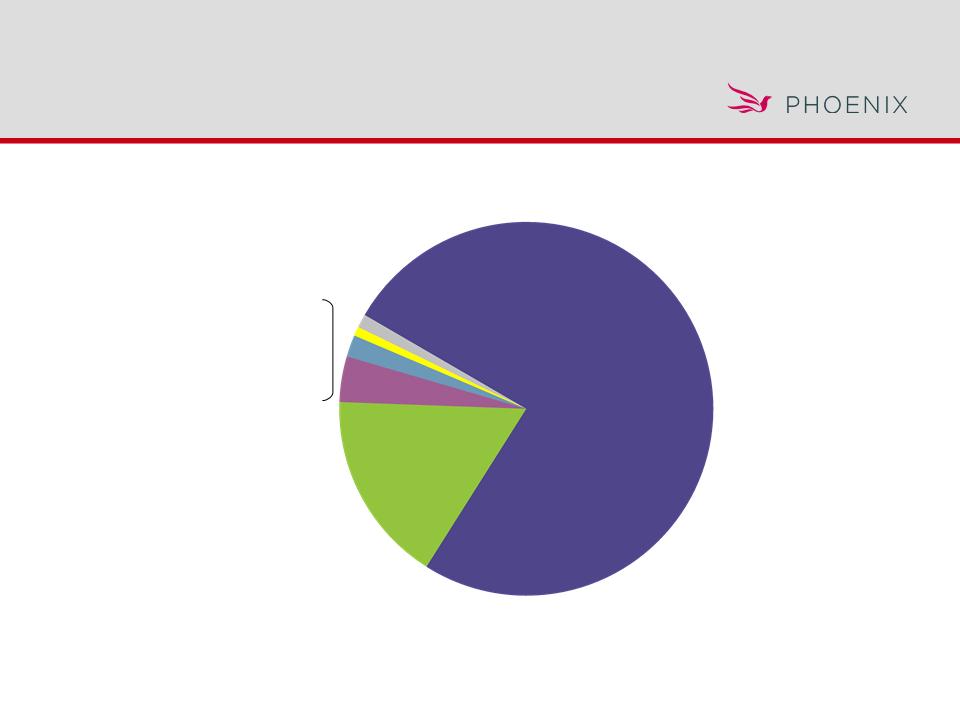
9
AAA
71.6%
B or less - 5.3%
BBB - 6.4%
AA - 4.2%
A - 8.5%
BB - 4.0%
$ in millions
Quality rating breakdown based on NAIC ratings
Market value as of June 30, 2010
1 Includes $33.9 million of CMBS CDOs
Structured Securities Portfolio | ||
As of June 30, 2010 | Market Value | % of Total |
Residential MBS | $1,912.8 | 50.0% |
Commercial MBS | 1,102.9 | 28.8 |
CBO/CDO/CLO1 | 248.9 | 6.5 |
Other ABS | 215.1 | 5.6 |
Home Equity | 204.6 | 5.4 |
Auto Loans | 78.3 | 2.0 |
Manufactured Housing | 38.0 | 1.0 |
Aircraft Equipment Trust | 26.1 | 0.7 |
Total | $3,826.7 | 100.0% |
High quality
structured securities portfolio
structured securities portfolio
> Structured portfolio is approximately 91% investment grade
> RMBS (50.0%) and CMBS (28.8%) dominate the structured portfolio

10
Moderation in credit impairments
GAAP Credit Impairments
2Q09 | 3Q09 | 4Q09 | 1Q10 | 2Q10 | |
Prime RMBS | $0.4 | $1.3 | $0.6 | $0.7 | $1.9 |
Alt-A RMBS | 1.6 | 2.1 | 6.6 | 4.6 | 2.4 |
Subprime RMBS | 5.4 | - | 0.2 | 0.1 | - |
CLO/CDO | 7.1 | 6.0 | 3.8 | 5.5 | 3.4 |
CMBS | - | - | 1.5 | 1.4 | 0.7 |
Corporate | 4.6 | 0.9 | 15.0 | 1.9 | 1.7 |
Other ABS/MBS | - | - | 4.5 | - | 2.1 |
Total Debt | $19.1 | $10.3 | $32.2 | $14.2 | $12.2 |
Schedule BA | 1.8 | 1.1 | 0.4 | - | - |
Equity | - | 3.5 | 1.7 | 0.3 | 0.2 |
Total Credit Impairments | $20.9 | $14.9 | $34.3 | $14.5 | $12.4 |
$ in millions
As of June 30, 2010

11
$ in millions
1 All Other - Corporates, RMBS Agency, Other ABS, Foreign, US Government
March 31, 2010 | June 30, 2010 | 2Q10 Change | |
RMBS Prime | $(62.6) | $(42.7) | $19.9 |
Subprime/Alt-A | (86.6) | (73.0) | 13.6 |
CDO/CLO | (77.2) | (85.9) | (8.7) |
CMBS | (18.0) | 0.9 | 18.9 |
Financial | (80.4) | (66.3) | 14.1 |
All Other High Yield | (5.0) | (15.4) | (10.4) |
All Other1 | 260.2 | 397.6 | 137.4 |
Total | $(69.6) | $115.2 | $184.8 |
Portfolio appreciated into a gain position

12
Market1 | Phoenix | |
Weighted average credit enhancement | 27% | 27% |
Weighted average credit enhancement (U.S. Treasury defeasance adjusted) | 29% | 33% |
Interest Only (I/O) loans | 67% | 29% |
Weighted average coupon | 5.82% | 6.47% |
Weighted average LTV | 73% | 69% |
Weighted average loan age | 57 months | 89 months |
As of June 30, 2010
1Sources: Barclays CMBS Index,Trepp, Bloomberg
Well constructed CMBS portfolio
Phoenix CMBS Portfolio
> High levels of credit enhancement
> Excellent credit characteristics vs.
market
market
> Avoided 2006 and 2007 aggressive
underwriting
underwriting

13
Vintage | 4Q09 |
2007 | 14.7% |
2006 | 12.2 |
2005 | 8.4 |
2004 | 4.4 |
2003 and prior | 3.5 |
Phoenix CMBS
Stress Test Results
Source: Moody’s Outlook for US CRE/CMBS - November 23, 2009, TREPP, Bloomberg
1 Coverage = Credit Enhancement/Deal Stress Loss
> 66% of the Phoenix CMBS portfolio can withstand >4.0x Moody’s stress loss estimates
> PNX Portfolio Weighted Average Credit Enhancement is 27%
> PNX Portfolio Weighted Average Loss Estimate is 5.4%
PNX Conduit/Fusion Portfolio Weighted Average Coverage1 5.1x
Stress Loss Coverage1 | |
≥ 4.0x | 66% |
≤ 4.0x | 34% |
≤ 2.0x | 4.0% |
≤ 1.0x | 0.8% |
Phoenix CMBS portfolio stress testing
Moody’s Stress Loss Forecasts
(Conduit/Fusion)
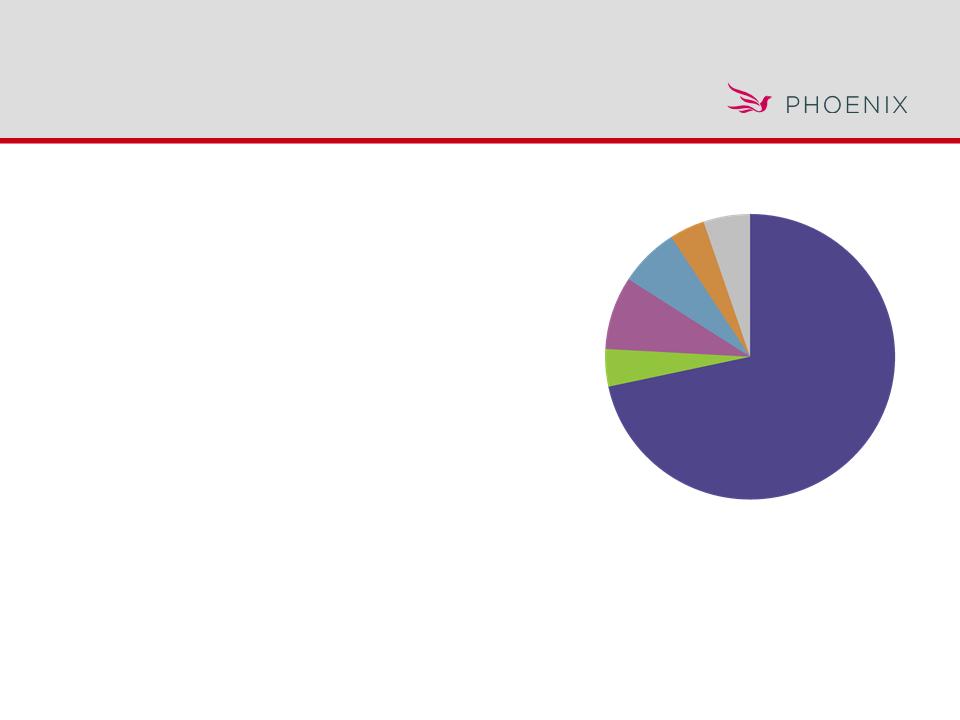
14
Market value as of June 30, 2010
Percentages based on market value
$ in millions
Highly rated, seasoned
CMBS portfolio
CMBS portfolio
> $1.1 billion in market value
> $151.7 million or 13.3% Government
guaranteed
guaranteed
> 81.8% AAA and 3.1% BBB or below
> 81.2% 2005 and prior origination
> Only 3% in CMBS CDO’s

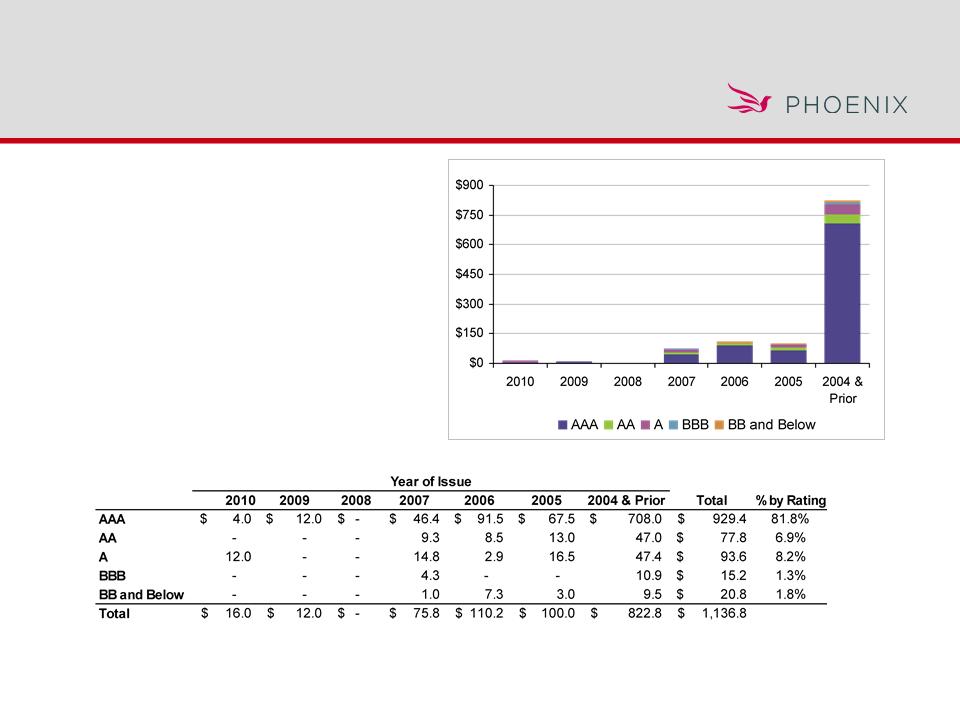
15
High quality, diversified RMBS portfolio
$ in millions
Market value as of June 30, 2010
Does not incorporate re-rating of RMBS securities by PIMCO
Rating | Book Value | Market Value | % General Account | AAA | AA | A | BBB | BB & Below |
Agency | $1,178.5 | $1,239.6 | 8.8% | 100.0% | - | - | - | - |
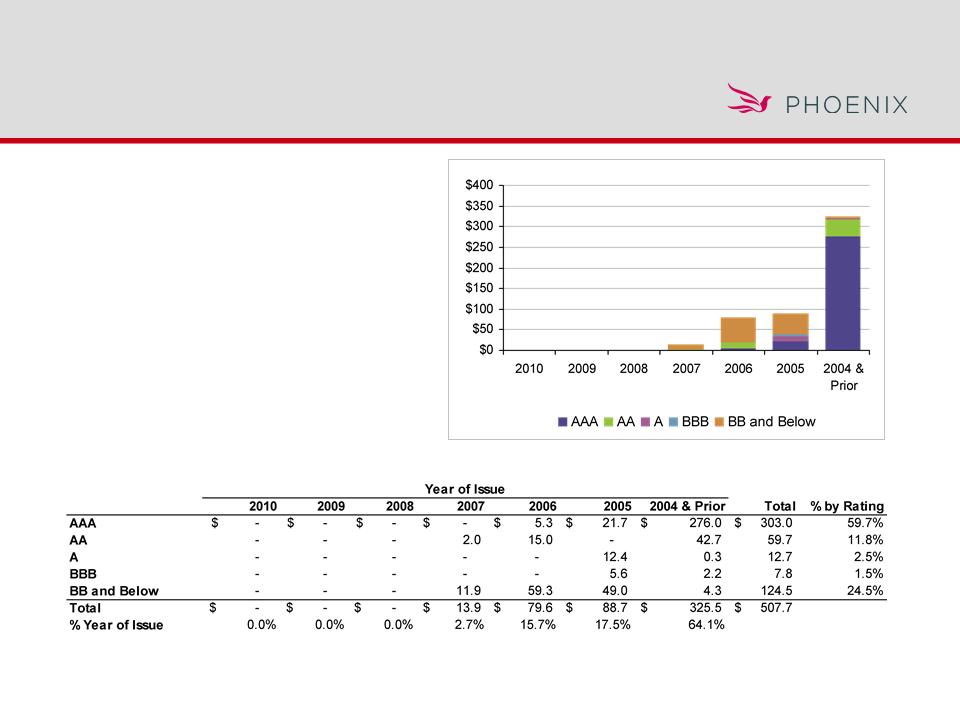
Prime | 550.4 | 507.7 | 3.6% | 59.7% | 11.8% | 2.5% | 1.5% | 24.5% |
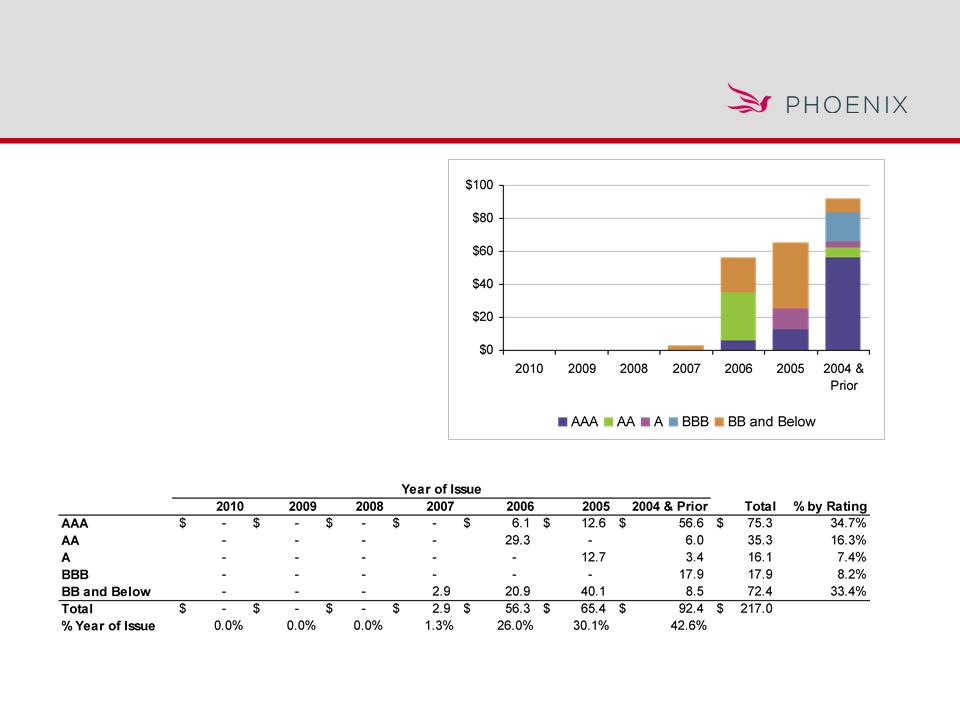
Alt-A | 259.2 | 217.0 | 1.5% | 34.7% | 16.3% | 7.4% | 8.2% | 33.4% |
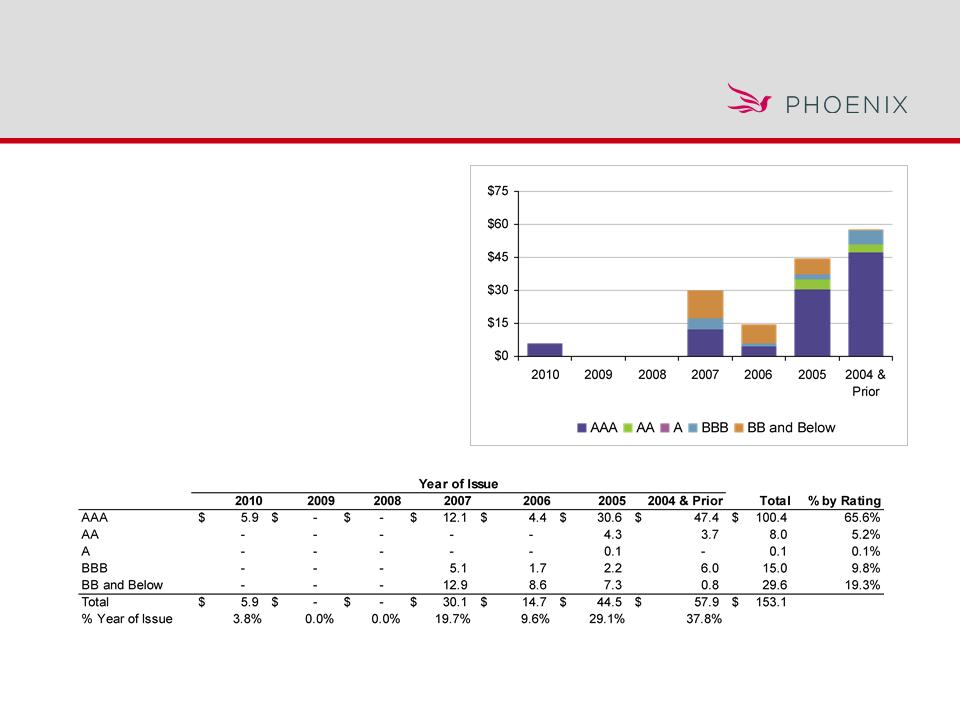
Subprime | 183.9 | 153.1 | 1.1% | 65.6% | 5.2% | 0.1% | 9.8% | 19.3% |
Total | $2,172.0 | $2,117.4 | 15.0% | 81.1% | 4.9% | 1.4% | 1.9% | 10.7% |

16
% of General Account | % Rated AAA & AA | % of Portfolio Originated in 2005 & Prior | % of Portfolio Backed by Fixed Rate Collateral | �� % of Market Backed by Fixed Rate Collateral | |
Non-Agency Prime | 3.6% | 71.5% | 81.6% | 94.0% | 48.0% |
Alt-A | 1.5 | 51.0 | 72.8 | 100.0 | 34.0 |
Subprime | 1.1 | 70.8 | 66.9 | 86.7 | 32.0 |
Market value as of June 30, 2010
Source: JP Morgan MBS Research, Bank of America/Merrill Lynch Credit Round-up
Does not incorporate re-rating of RMBS securities by PIMCO
Well constructed RMBS portfolio
17
RMBS delinquencies
better than market
better than market
Market value as of June 30, 2010
Source: JP Morgan MBS Research 60+ day
18
$ in millions
As of June 30, 2010
Does not incorporate re-rating of RMBS securities by PIMCO
High quality, seasoned
non-agency prime RMBS holdings
non-agency prime RMBS holdings
> $507.7 million market value
> 71.5% AAA and AA rated
> 81.6% 2005 and prior origination
> 94% fixed rate

19
As of June 30, 2010
Source: JP Morgan MBS Research - June 2010, Bloomberg
Market Phoenix
Weighted average credit enhancement 4.67% 10.4%
Weighted average 60+ day delinquent loan 11.8% 5.4%
Phoenix prime portfolio loss coverage: using 40% loss severity 0.99x 4.8x
Well constructed
non-agency prime RMBS portfolio
non-agency prime RMBS portfolio
20
$ in millions
Market value as of June 30, 2010
Does not incorporate re-rating of RMBS securities by PIMCO
Seasoned
non-agency Alt-A RMBS holdings
non-agency Alt-A RMBS holdings
> $217.0 million market value
> 51.0% AAA or AA rated
> 72.8% 2005 and prior originations

21
As of June 30, 2010
Sources: JP Morgan MBS Research - June 2010
Bank of America/Merrill Lynch - June 2010
Option ARM 32% -
Alt-A ARM 34% -
Alt-A Fixed 34% 100%
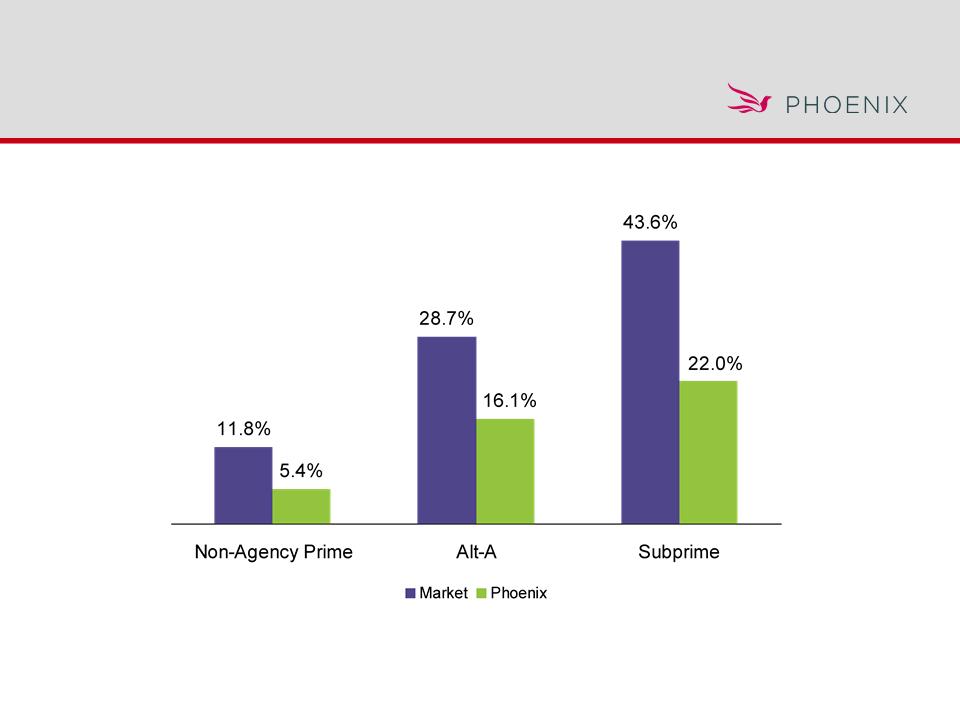
60+ Delinquent 28.7% 16.1%
Alt-A Market Phoenix
Fixed-rate non-agency Alt-A RMBS
portfolio
portfolio
22
$ in millions
Market value as of June 30, 2010
Source: JP Morgan MBS Research June 2010
Does not incorporate re-rating of RMBS securities by PIMCO
High quality
non-agency subprime RMBS portfolio
non-agency subprime RMBS portfolio
> $153.1 million market value
> 70.8% rated AAA or AA
> Phoenix 60+ day delinquent
22.0% vs. 43.6% for the subprime
market
22.0% vs. 43.6% for the subprime
market
> Phoenix weighted average credit
support is 39.4%
support is 39.4%

23
Diversified CDO holdings
$ in millions
As of June 30, 2010
Percentages based on market value
No affiliated CDO holdings as of June 30, 2010
Collateral | Book Value | Market Value | % General Account | AAA | AA | A | BBB | BB & Below |
Bank Loans | $250.5 | $193.1 | 1.4% | - | 3.3% | 8.1% | 26.8% | 61.8% |
Inv Grade Debt | 25.3 | 21.9 | 0.2% | - | 12.5% | - | 12.9% | 74.6% |
CMBS | 59.0 | 33.9 | 0.2% | 31.5% | 44.5% | 6.2% | 5.3% | 12.5% |
Total | $334.8 | $248.9 | 1.8% | 4.3% | 9.7% | 7.2% | 22.6% | 56.2% |

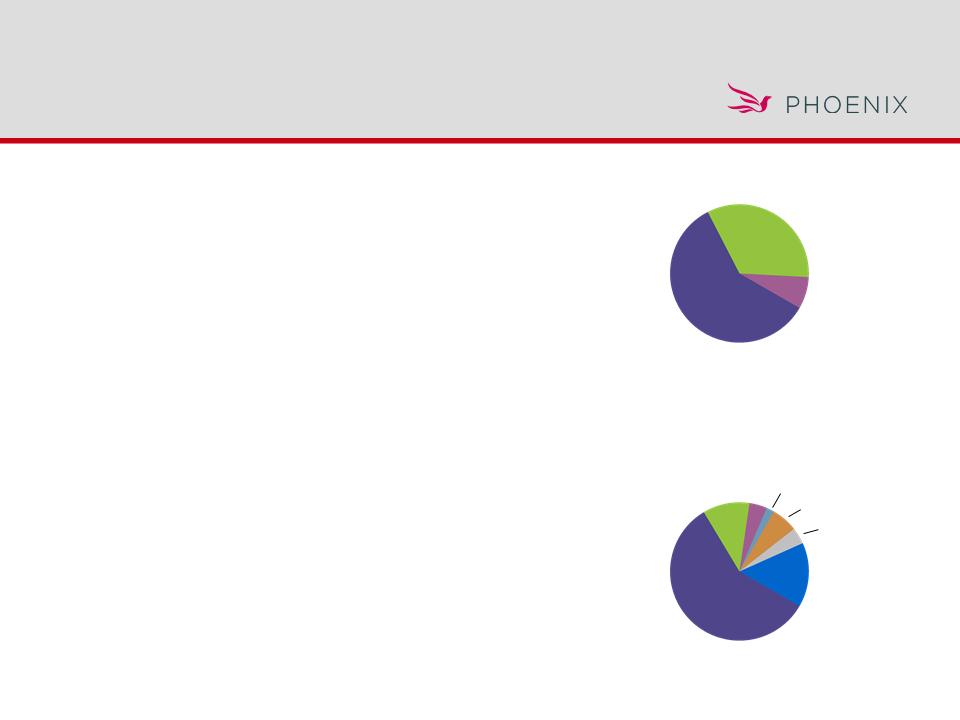
24
Appendix
25
Bonds $6,481
79%
Policy Loans $1,371
17%
Cash & Cash Equivalents $23 0%
Venture Capital $198 2%
Stock $12 0%
Mortgages & Real Estate $5 0%
Other Invested Assets $148 2%
Invested Assets: $8.2 Billion
$ in millions
Market value as of June 30, 2010
PLIC Closed Block investments
primarily fixed income
primarily fixed income

26
Percentages based on GAAP Value
As of June 30, 2010
2Q09 | 3Q09 | 4Q09 | 1Q10 | 2Q10 | |
Investment Grade Bonds | 91.7% | 90.9% | 91.6% | 92.0% | 92.5% |
Below Investment Grade (BIG) Bonds | 8.3 | 9.1 | 8.4 | 8.0 | 7.5 |
Percentage of BIG in NAIC 3 | 62.7 | 60.7 | 64.3 | 62.1 | 62.6 |
Percentage of BIG in NAIC 4-6 | 37.3 | 39.3 | 35.7 | 37.9 | 37.4 |
Public Bonds | 67.8 | 67.7 | 67.4 | 68.2 | 67.5 |
Private Bonds | 32.2 | 32.3 | 32.6 | 31.8 | 32.5 |
PLIC Closed Block
portfolio high quality
portfolio high quality
27
U.S. Corporates
58%
Foreign Corporates
11%
ABS - 6%
Emerging Markets -4%
$ in millions
Market value as of June 30, 2010
1 Includes $22.7 million of Home Equity Asset Backed Securities
Below Investment Grade (BIG) Bonds
by Sector
Bond Portfolio Phoenix Closed Block | ||
As of June 30, 2010 | ||
Industrials | $1,660.9 | 25.6% |
Residential MBS1 | 1,066.0 | 16.5% |
Foreign Corporates | 976.2 | 15.1% |
Financials | 893.8 | 13.8% |
Commercial MBS | 720.6 | 11.1% |
U.S. Treasuries / Agencies | 425.9 | 6.6% |
Utilities | 344.4 | 5.3% |
Taxable Municipals | 124.2 | 1.9% |
Asset Backed Securities | 105.2 | 1.6% |
CBO/CDO/CLO’s | 99.1 | 1.5% |
Emerging Markets | 64.4 | 1.0% |
Total | $6,480.7 | 100.0% |
Bonds by Rating
NAIC 1
59.3%
NAIC 2
33.2%
NAIC 3 & Lower
7.5%
RMBS - 4%
CLO/CDO
15%
CMBS - 2%
PLIC Closed Block
portfolio diversified
portfolio diversified

28