UNITED STATES
SECURITIES AND EXCHANGE COMMISSION
Washington, D.C. 20549
—————————
FORM 10-K
—————————
| |
þ | ANNUAL REPORT PURSUANT TO SECTION 13 OR 15 (d) OF THE SECURITIES EXCHANGE ACT OF 1934 |
For the fiscal year endedDecember 31, 2012
OR
| |
o | TRANSITION REPORT PURSUANT TO SECTION 13 OR 15(d) OF THE SECURITIES EXCHANGE ACT OF 1934 |
For the transition period from ________ to ________
Commission file number001-16517

THE PHOENIX COMPANIES, INC.
(Exact name of registrant as specified in its charter)
| |
Delaware | 06-1599088 |
(State or other jurisdiction of incorporation or organization) | (I.R.S. Employer Identification No.) |
One American Row, Hartford, Connecticut |
06102-5056 |
(Address of principal executive offices) | (Zip Code) |
(860) 403-5000 |
(Registrant’s telephone number, including area code) |
|
Securities registered pursuant to Section 12(b) of the Act: |
Title of each class | Name of each exchange on which registered |
Common stock, $.01 par value | New York Stock Exchange |
7.45% Quarterly Interest Bonds, due 2032 | New York Stock Exchange |
| |
Securities registered pursuant to Section 12(g) of the Act:None. |
Indicate by check mark if the registrant is a well-known seasoned issuer, as defined in Rule 405 of the Securities Act. YES o NO þ
Indicate by check mark if the registrant is not required to file reports pursuant to Section 13 or Section 15(d) of the Act. YES o NO þ
Indicate by check mark whether the registrant (1) has filed all reports required to be filed by Section 13 or 15(d) of the Securities Exchange Act of 1934 during the preceding 12 months (or for such shorter period that the registrant was required to file such reports), and (2) has been subject to such filing requirements for the past 90 days. YES o NO þ
Indicate by check mark whether the registrant has submitted electronically and posted on its corporate Web site, if any, every Interactive Data File required to be submitted and posted pursuant to Rule 405 of Regulation S-T during the preceding 12 months (or for such shorter period that the registrant was required to submit and post such files). YES o NO þ
Indicate by check mark if disclosure of delinquent filers pursuant to Item 405 of Regulation S-K is not contained herein, and will not be contained, to the best of registrant’s knowledge, in definitive proxy or information statements incorporated by reference in Part III of this Annual Report on Form 10-K or any amendment to this Annual Report on Form 10-K. o
Indicate by check mark whether the registrant is a large accelerated filer, an accelerated filer, a non-accelerated filer, or a smaller reporting company. See definition of “large accelerated filer”, “accelerated filer” and “smaller reporting company” in Rule 12b-2 of the Exchange Act. (Check one):
| | | |
Large accelerated filer ¨ | Accelerated filer þ | Non-accelerated filer ¨ | Smaller reporting company ¨ |
| | (Do not check if smaller reporting company) | |
Indicate by check mark whether the registrant is a shell company (as defined in Rule 12b-2 of the Exchange Act). YES o NO þ
As of June 30, 2012, the aggregate market value of voting common equity held by non-affiliates of the registrant was approximately $0.2 billion based on the last reported sale price of $37.00 per share on a split adjusted basis of the common stock on the New York Stock Exchange on that date. On March 26, 2014, the registrant had 5.7 million shares of common stock outstanding; it had no non-voting common equity.
Explanatory Note
This Annual Report on Form 10-K for the year ended December 31, 2012 (this “2012 Form 10-K”), being filed by The Phoenix Companies, Inc. (“we,” “our,” “us,” the “Company,” “PNX” or “Phoenix”), contains audited financial statements of the Company for the years ended December 31, 2012, 2011 and 2010 and interim unaudited financial statements presented for each quarter during the fiscal years 2012 and 2011, which in each case are presented on a restated basis to the extent previously filed in a periodic report by the Company with the Securities and Exchange Commission (the “SEC”).
The Company filed a Current Report on Form 8-K with the SEC on November 8, 2012 (as was amended by Forms 8-K/A filed by the Company on March 15, 2013 and April 24, 2013, respectively (collectively, the “Restatement Form 8-K”)) disclosing its conclusion that certain of its previously issued annual audited and interim unaudited financial statements contained in its historical Annual Reports on Form 10-K and Quarterly Reports on Form 10-Q should no longer be relied upon and should be restated.
This 2012 Form 10-K restates and corrects the following financial statements of the Company (the “Restatement”): (i) the audited consolidated balance sheet as of December 31, 2011 and consolidated statements of comprehensive income, changes in stockholders’ equity and cash flows for each of the years ended December 31, 2011 and 2010; (ii) the selected financial data as of and for each of the years ended December 31, 2011, 2010, 2009 and 2008; and (iii) the unaudited consolidated statements of comprehensive income, unaudited consolidated balance sheets, unaudited statements of cash flow and unaudited statements of changes in stockholders’ equity for the quarterly periods ended March 31 and June 30, 2012 and for each of the quarterly periods in fiscal year 2011.
This 2012 Form 10-K is being filed by the Company in lieu of the Company separately filing with the SEC amendments to its previously filed Annual Reports on Form 10-K for each of the years ended December 31, 2011 and 2010 and its previously filed Quarterly Reports on Form 10-Q for the quarterly periods ended March 31 and June 30, 2012, and March 31, June 30 and September 30, 2011. The Company will not file restated annual audited consolidated financial statements for the year ended December 31, 2009 and quarterly income statements and comprehensive income, balance sheets and cash flow statements in previously filed Quarterly Reports on Form 10-Q for each of the quarterly periods ended during the year ended December 31, 2010. Except to the extent contained in this 2012 Form 10-K, the Company does not intend to separately file consolidated statements of comprehensive income for the three and six month periods ending March 31 and June 30, 2012 and March 31, and June 30, 2011, or any management’s discussion and analysis related to these quarterly periods. On February 12, 2014, the Company and PHL Variable Insurance Company (“PHLVIC”) submitted an Offer of Settlement with the SEC pursuant to which the Company and PHLVIC consented to the issuance of the form of an Order Instituting Cease-and-Desist Proceedings Pursuant to Section 21C of the Exchange Act, Making Findings and Imposing a Cease-and-Desist Order (the “Order”). The Order was approved by the SEC on March 21, 2014. Pursuant to the Order, the Company and PHLVIC have been directed to cease and desist from committing or causing any violations and any future violations of Section 13(a) of the Exchange Act and Rules 13a-1, 13a-13 thereunder and Section 15(d) of the Exchange Act and Rules 15d-1 and 15d-13 thereunder. In addition, the Company and PHLVIC agreed to perform certain undertakings, including for the Company to file its delayed Quarterly Report on Form 10-Q for the quarterly period of September 30, 2012 (the “Third Quarter 2012 Form 10-Q”) Form 10-Q by no later than April 15, 2014 and its Annual Report on Form 10-K for the year ended December 31, 2013 (the “2013 Form 10-K”) by no later than June 4, 2014. Also pursuant to the undertakings, the Company would file its 2013 Forms 10-Q after the filing of its 2013 Form 10-K. The Company intends to become timely with its periodic filings under the Exchange Act with the filing of its Quarterly Report on Form 10-Q for the period ending June 30, 2014. Finally, the Company and PHLVIC each paid a civil monetary penalty in the amount of $375,000 to the United States Treasury following the entry of the Order. For additional information regarding certain risks associated with our failure to file timely periodic reports and resume a timely filing schedule, please see the risk factors under “Risks Related to the Restatement, Failure to File Timely Periodic Reports with the SEC and our Internal Control Over Financial Reporting” contained in “Item 1A: Risk Factors” in Part I of this 2012 Form 10-K.
The Company has not amended, and does not intend to amend, its previously filed Annual Report on Form 10-K for the years ended on or prior to December 31, 2011 or its Quarterly Reports on Form 10-Q for the periods ended on or prior to June 30, 2012, affected by the Restatement. For this reason, the financial statements and supplementary data, selected financial data and other financial information, related reports of the Company’s independent registered public accountants, management’s discussion and analysis of financial condition and results of operations and reports on disclosure controls and procedures and internal control over financial reporting contained in those filings should no longer be relied upon and are superseded by the information contained in this 2012 Form 10-K. This 2012 Form 10-K supersedes the financial information disclosed by the Company since its announcement of the Restatement on November 8, 2012, including the information contained in the Restatement Form 8-K. The Company intends to include in an amendment to this 2012 Form 10-K the separate financial statements of certain entities in which the Company holds an interest for years ended December 31, 2012, 2011 and 2010 pursuant to Rule 3-09 of Regulation S-X, which have been accounted for by the Company under the equity method of accounting.
Because of the amount of time that has passed since the Company’s last periodic report was filed with the SEC, the information relating to our business, risk factors, legal proceedings and related matters is updated to include certain information for periods after December 31, 2012.
During the preparation of the Third Quarter 2012 Form 10-Q, certain errors were identified in the Company’s consolidated statement of cash flows for the nine months ended September 30, 2012, as well as for previously reported periods. During the process of restatement, material errors were identified and corrected related to actuarial finance and valuation, investments, reinsurance accounting, pensions, limited partnerships and other investments, taxable income reporting and cash flows and changes in classifications, which are described in more detail in Note 2: “Restatement and Amendment of Previously Reported Financial Information”. Certain reclassifications were also made during the restatement process which impacted total assets and total liabilities on the consolidated balance sheets. In addition, adjustments were made to correct previously identified out of period errors that were determined to be not material individually, or in the aggregate. The correction of these errors affected the financial statements for each of the years ended December 31, 2011 and 2010. In addition, prior periods have been amended for the retrospective adoption of amendments to ASC 944,Financial Services – Insurance (ASU 2010-26, “Accounting for Costs Associated with Acquiring or Renewing Insurance Contracts”), and correction of accounting errors related to the adoption as reported in the Company’s Quarterly Report on Form 10-Q for the period ended March 31, 2012.
In October 2010, the FASB issued amended guidance to ASC 944,Financial Services – Insurance, to address the diversity in practice for accounting for costs associated with acquiring or renewing insurance contracts. This guidance was retrospectively adopted by the Company on January 1, 2012 and such retrospective adoption resulted in amendments to previously reported balances in all applicable reporting periods as if the guidance was applied at the inception of all policies in force. As a result of the restatement, the effects of retrospective adoption also reflect the impact of the adoption after consideration of correcting the errors noted above and errors in the initial adoption of ASC 944 reported in the Quarterly Report on Form 10-Q for the period ended March 31, 2012.
2
The restatement and the retrospective adoption of accounting guidance had the following impact on income from continuing operations, net income and stockholders’ equity:
| | | | | | | | | | | | | | |
($ in millions) | As previously reported | | Correction of errors(1) | | Adjusted prior to the retrospective adoption | | Retrospective adoption(2) | | As restated and amended |
|
|
|
Income (Loss) from Continuing Operations: | | | | | | | | | | | | | | |
For the year ended December 31, 2011 | $ | 30.1 | | $ | (62.1) | | $ | (32.0) | | $ | 22.4 | | $ | (9.6) |
For the year ended December 31, 2010 | | (24.6) | | | (36.2) | | | (60.8) | | | 29.5 | | | (31.3) |
| | | | | | | | | | | | | | |
Net Income (Loss) attributable to
The Phoenix Companies, Inc.: | | | | | | | | | | | | | | |
For the year ended December 31, 2011 | $ | 8.1 | | $ | (61.2) | | $ | (53.1) | | | 22.4 | | $ | (30.7) |
For the year ended December 31, 2010 | | (12.6) | | | (51.3) | | | (63.9) | | | 29.5 | | | (34.4) |
| | | | | | | | | | | | | | |
Stockholders’ Equity: | | | | | | | | | | | | | | |
As of December 31, 2011 | $ | 1,126.2 | | $ | (264.0) | | $ | 862.2 | | $ | (166.5) | | $ | 695.7 |
———————
(1)
See Note 2 to our consolidated financial statements under “Item 8: Financial Statements and Supplementary Data” in this 2012 Form 10-K for additional information for a description of the errors.
(2)
The impact of the adoption of this amended accounting guidance was previously disclosed within the First Quarter 2012 Quarterly Report on Form 10-Q filing. The table above illustrates adjustments made related to errors identified in conjunction with restatement as previously described in this Explanatory Note as well as to correct errors identified related to the initial adoption of the amended guidance.
As a result of the errors discussed above, management identified material weaknesses in our internal control over financial reporting. As a result, management has concluded that the Company did not maintain effective internal control over financial reporting as of December 31, 2012. Further, the Company’s Chief Executive Officer and Chief Financial Officer have concluded that the Company’s disclosure controls and procedures were not effective as of December 31, 2012. These material weaknesses have not been fully remediated as of the filing date of this report.
For more information on the matters that have led to the Restatement and data previously reported, see Note 2 “Restatement and Amendment of Previously Reported Financial Information” and Note 27 “Supplemental Unaudited Quarterly Financial Information” to our consolidated financial statements under “Item 8: Financial Statements and Supplementary Data” in this 2012 Form 10-K. In addition, this 2012 Form 10-K reflects, as applicable, the effects of the Restatement and the adoption of amended accounting guidance in “Item 6: Selected Financial Data” for the fiscal years ended December 31, 2012, 2011, 2010, 2009 and 2008 and “Item 7: Management’s Discussion and Analysis of Financial Condition and Results of Operations” for the fiscal years ended December 31, 2011 and 2010. A description of material weaknesses and management’s evaluation of the effectiveness of the design and operation of the Company’s disclosure controls and procedures, as well as management’s plan to remediate, is more fully described in “Item 9A: Controls and Procedures” in Part II of this 2012 Form 10-K.
3
4
PART I
Item 1.
Business
Overview
The Phoenix Companies, Inc. (“we,” “our,” “us,” the “Company,” “PNX” or “Phoenix”) is a holding company incorporated in Delaware. Our operating subsidiaries provide life insurance and annuity products through independent agents and financial advisors. Our principal insurance company subsidiaries are Phoenix Life Insurance Company (“Phoenix Life”), domiciled in New York, and PHL Variable Insurance Company (“PHLVIC”), domiciled in Connecticut. Collectively with Phoenix Life and Annuity Company and American Phoenix Life and Reassurance, both domiciled in Connecticut, they are our “Life Companies.” Our policyholder base includes both affluent and middle market consumers, with our more recent business concentrated in the middle market. Most of our life insurance in force is permanent life insurance (whole life, universal life and variable universal life) insuring one or more lives. Our annuity products include fixed and variable annuities with a variety of death benefit and guaranteed living benefit options. As of December 31, 2012, we had $41.1 billion of net life insurance in force and $5.0 billion of annuity assets under management.
In 2012, 99% of Phoenix product sales, as defined by total annuity deposits and total life premium, were annuities, and 90% of those sales were fixed indexed annuities. In addition, we have expanded sales of other insurance companies’ policies through our distribution subsidiary, Saybrus Partners, Inc. (“Saybrus”).
We operate two businesses segments: Life and Annuity and Saybrus. The Life and Annuity segment includes individual life insurance and annuity products, including our closed block. Saybrus provides dedicated life insurance and other consulting services to financial advisors in partner companies, as well as support for sales of Phoenix’s product line through independent distribution organizations.
Restatement
As discussed in this report in the Explanatory Note and in Note 2 to our consolidated financial statements under “Item 8: Financial Statements and Supplementary Data” in this Annual Report on Form 10-K (and as previously reported in the Restatement Form 8-K), we concluded that certain of the Company’s previously issued financial statements should no longer be relied upon and should be restated because of certain errors in those financial statements.
During the Restatement process, the Company identified and corrected certain material errors, made certain reclassifications and adjustments to correct previously identified non-material out of period errors and retrospectively adopted accounting guidance. Management also identified material weaknesses in the Company’s internal control over financial reporting and concluded that the Company’s disclosure controls and procedures were not effective as of December 31, 2012. These weaknesses, an evaluation of the effectiveness of the Company’s disclosure controls and procedures, and the Company’s remediation plans are more fully described in “Item 9A: Controls and Procedures” in Part II of this Annual Report on Form 10-K.
Because of the amount of time that has passed since the Company’s last periodic report was filed with the SEC, the information relating to the Company’s business contained in this report is updated to include certain information for periods after December 31, 2012.
Target Market
Our current target market consists of middle market households with a variety of financial planning needs, such as tax-deferred savings, safety of principal, guaranteed income during retirement, income replacement and death benefits. Our typical customer is between 65 and 75 years old, with an annual income ranging from $45,000 to $65,000 and a net worth ranging from $325,000 to $650,000. Historically, our marketing strategies focused on high-net-worth and affluent households with sophisticated estate planning and other financial needs, and the majority of our life insurance and annuities in force reflects this market focus.
5
Competition
We operate in a highly competitive industry. While there is no single company that we identify as a dominant competitor in our business, many of our competitors are substantially larger, have better financial strength ratings, more financial resources and greater marketing and distribution capabilities. Our products compete with similar products sold by other insurance companies and also with savings and investment products offered by banks, asset managers and broker-dealers.
We believe our competitive strengths include product features, underwriting and mortality risk management expertise, partnering capabilities and value-added support provided to our distributors. Our ability to compete is based on these as well as other factors, including investment performance, service, price, distribution capabilities, scale, commission structure, brand recognition and financial strength ratings.
Major Products
Annuities
Fixed Indexed Annuities: This product provides single premium deferred annuities that offer a fixed interest account and a variety of indexed accounts that allow contract owners to earn index credits based on the performance of specific equity market or other price indices. Our major source of revenue on these contracts is the excess of investment income earned over interest and index credits, if any. Most contracts allow contract owners to change accounts once a year. One of the most popular indexed accounts credits contract owners’ accounts with a return equal to the annual appreciation of the S&P 500 index, subject to a specified cap. Caps are changed regularly to reflect current market conditions; during 2012, caps ranged from 1.00% to 4.00%. Certain contracts also provide “premium bonuses,” which we contribute to contract owner account balances at issue and which also earn interest or index credits. Approximately 28% of indexed annuity deposits in 2012 included premium bonuses ranging from 4% to 9% of the initial deposit.
Contract owners also may elect a guaranteed minimum withdrawal benefit (“GMWB”), which for a separate fee provides a guaranteed income stream for the lifetime of the contract owners. The amount of income available is based on a separate “benefit base” that increases independent of the growth of the contract owner account balance. Withdrawals may begin immediately or after several years. Once a contract owner elects to receive income, withdrawals are first made from the account balance. If and when the balance is depleted, we continue to make the guaranteed income payments. In 2012, approximately 94% of all indexed annuity contracts sold included a GMWB. Certain fixed indexed annuities include a guaranteed minimum death benefit (“GMDB”), pursuant to which beneficiaries receive an amount in excess of contract value if the annuitant dies in exchange for an additional fee. In 2012, approximately 16% of all indexed annuity contracts sold included a GMDB.
Fixed Annuities: This product meets the needs of clients who want a guaranteed rate of return over a specified period. The contract owner receives a guaranteed rate of return over the initial interest rate guarantee period and has the option to elect a new guarantee period at the end of the initial term, at then current rates, subject to certain minimums.
Single Premium Immediate Annuities: This product provides guaranteed income beginning immediately, including one product that is designed for use in elder-care planning in conjunction with government benefits.
Variable Annuities: This product allows contract owners to direct deposits into a variety of separate investment accounts (accounts that are maintained separately from the other assets of the Life Companies) or into the general accounts of the Life Companies. Deposits allocated to the general account earn interest at a specified rate of return determined by us, subject to certain minimums. In the separate investment accounts, the contract owner bears the risk of investment results. We credit to the separate investment accounts a return net of fees and charges.
We collect fees for the management of these various investment accounts and assess charges against these accounts for the administrative services we provide. Our major sources of revenue from variable annuities are mortality and expense fees charged to the contract owner, generally determined as a percentage of the market value of any underlying separate account balances and a portion of the fees we collect for the management of the various investment accounts.
Many of our variable annuities include guaranteed minimum death, accumulation, withdrawal and income benefits.
6
Life Insurance
Whole Life: This product provides permanent insurance coverage and tax-deferred savings in return for predetermined premium payments. Premiums are invested in our general account. For whole life policies in our closed block (see Note 5 to our consolidated financial statements under “Item 8: Financial Statements and Supplementary Data” in this Annual Report on Form 10-K), policies typically provide a participation feature in the form of dividends. Policyholders may receive dividends in cash or apply them to increase death benefits, provide for paid-up additional insurance or reduce the premiums required.
Universal Life: This product provides permanent insurance coverage with a tax deferred savings element. It allows the policyholder to adjust the frequency and amount of premium payments subject to certain limitations. Premiums, net of charges for mortality costs and administrative expenses, are invested in our general account and are credited interest at rates determined by us, subject to certain minimums. We retain the right, within limits, to adjust the fees we assess for providing administrative services. We also collect fees to cover mortality costs; these fees may be adjusted by us, but may not exceed guaranteed contractual limits.Some universal life products provide secondary guarantees that protect the policy’s death benefit even if there is insufficient value in the policy to pay the monthly charges and mortality costs.
Indexed Universal Life: This product is a type of universal life where premiums may be allocated to a fixed interest account and/or a variety of indexed accounts that allow policyholders to earn index credits based on the performance of specific equity market or other price indices.
Variable Universal Life: This product is similar to universal life, except that premiums may be directed into a variety of separate investment accounts (accounts that are maintained separately from the other assets of the Life Companies) or into the general accounts of the Life Companies. In separate investment accounts, the policyholder bears the entire risk of the investment results. We collect fees for the management of these various investment accounts and the net return is credited directly to the policyholder’s accounts. Account balances invested in the general account earn interest at rates determined by us, subject to certain minimums. Specific charges are made against the accounts for expenses. We retain the right, within limits, to adjust the fees we assess for providing administrative services. We also collect fees to cover mortality costs; these fees may be adjusted by us, but may not exceed guaranteed contractual limits. With some variable universal products, maintaining a certain premium level provides the policyholder with guarantees that protect the policy’s death benefit if, due to adverse investment experience, the policyholder’s account balance is zero.
Variable annuities, a limited number of fixed annuities and variable life products offered by the life insurance subsidiaries of the Company are registered under the federal securities laws. Since these subsidiaries have not been able to file updated audited financial statements in accordance with accounting principles generally accepted in the United States (“U.S. GAAP”) with the SEC, the life insurance subsidiaries have not offered these products to new customers since the Restatement process began in 2012. Existing customers with existing contracts have been able to continue to invest in these products, but certain investment alternatives have closed for new investment.
Distribution and Related Services
Independent Producers: We distribute our products through independent producers who serve the middle market and are typically affiliated with one or more independent marketing organizations (“IMOs”). We have established selling agreements with IMOs representing approximately 10,700 independent producers. In 2012, more than 2,400 producers sold Phoenix policies. Our distribution strategy for IMOs is to continue to expand the number of relationships and producers who do business with us by providing competitive products at competitive commission rates, providing exclusive product designs and features to certain IMOs and enhancing our servicing and support technology.
Saybrus Partners, Inc.: Saybrus, Phoenix’s distribution company, sells Phoenix products through selected independent producers and IMOs and provides consulting services to partner firms in support of policies written by companies other than Phoenix. Saybrus’ revenues primarily consist of commissions based on successful sales.
Saybrus’ partner firms include institutional financial advisories, banks, insurance retailers and broker/dealers. It brings expertise to help these firms’ financial professionals address clients’ needs with insurance solutions for basic protection as well as income, estate and business planning. Saybrus offers solutions for the middle, affluent and high net worth markets and customizes its services to best fit its partners’ businesses with capabilities ranging from traditional wholesaling to comprehensive consultation and point of sale support.
7
Investments
Investment activities are an integral part of our business and net investment income is a significant component of our total revenues. We manage investments in our general account to match the durations of our insurance liabilities. We invest primarily in high-grade public and privately placed debt securities, balancing credit risk with investment yield. As of December 31, 2012, 91.8% of our debt securities portfolio was investment grade. We invest a small percentage of our assets in limited partnerships and other investments that have variable returns. While our returns are more volatile, these asset classes have contributed substantially to our investment returns over time. As of December 31, 2012, 3.6% of cash and total investments were allocated to this asset class.
Hedging
Certain features of our annuity products expose us to risks such as equity price risk, equity volatility risk and interest rate risk. We hedge those risks using derivatives. Our focus is on hedging the economic exposure related to potential future claims. For example, we hedge fixed indexed annuity premiums directed into indexed accounts by purchasing options designed to fund the index credits on these accounts. Our hedges generally do not qualify for hedge accounting and may result in significant reported accounting gains or losses. In addition, our hedges may expose us to counterparty credit risk. As of December 31, 2012, our net mark-to-market exposure to derivative counterparties prior to credit valuation adjustment (“CVA”) was $115.1 million, and the post CVA net mark-to-market exposure was $108.9 million. All of our counterparties had a credit rating of A or better with at least one Nationally Recognized Statistical Rating Organizations (“NRSRO”). For additional information regarding hedging related business risks, please see the risk factors entitled “We may not be able to hedge our positions due to the inability to replace hedges as a result of our credit rating” and “Guaranteed benefits within our products that protect policyholders against significant downturns in equity markets may decrease our earnings, increase the volatility of our results if hedging strategies prove ineffective, result in higher hedging costs and expose us to increased counterparty risk, which may have a material adverse effect on our results of operations, financial condition and liquidity” contained in “Item 1A: Risk Factors” in Part I of this 2012 Form 10-K.
Policy Administration
As of December 31, 2012, we had 356,311 life insurance policies and 76,564 annuity contracts in force. Our Customer Care Center services policies on a number of administrative systems, supporting both policyholders and their advisors or agents. The cost of servicing policies is a significant component of our overall operating expenses. Servicing of some policies is outsourced to vendors who specialize in insurance policy administration.
Reinsurance
We use reinsurance agreements to limit potential losses, reduce exposure to larger risks and provide capital relief with regard to certain reserves. We remain liable to the extent that reinsuring companies may not be able to meet their obligations under reinsurance agreements in effect. Failure of the reinsurers to honor their obligations could result in losses to the Company. Since we bear the risk of nonpayment, on a quarterly basis we evaluate the financial condition of our reinsurers and monitor concentrations of credit risk. Based on our review of their financial statements, reputation in the reinsurance marketplace and other relevant information, we believe that we have no material exposure to uncollectible life reinsurance. At December 31, 2012, five major reinsurance companies account for approximately 64% of the reinsurance recoverable.
We cede risk to other insurers under various agreements that cover individual life insurance policies. The amount of risk ceded depends on our evaluation of the specific risk and applicable retention limits. For business sold prior to December 31, 2010, our retention limit on any one life is $10 million for single life and joint first-to-die policies and $12 million for joint last-to-die policies. Beginning January 1, 2011, our retention limit on new business is $5 million for single life and joint first-to-die policies and $6 million for second-to-die policies. We also assume reinsurance from other insurers. Typically our reinsurance contracts allow us to recapture ceded policies after a specified period. This right is valuable in the event our mortality experience is sufficiently favorable to make it financially advantageous for us to reassume the risk rather than continue paying reinsurance premiums. Effective January 1, 2013, we recaptured a block of policies from several reinsurers with total net amount at risk (“NAR”) of $625 million.
8
Effective October 1, 2011, Phoenix Life entered into an agreement that provides modified coinsurance for approximately one-third of the closed block policies. This contract did not meet the requirements of risk transfer in accordance with U.S. GAAP, and, therefore, deposit accounting is applied.
See Note 6 to our consolidated financial statements under “Item 8: Financial Statements and Supplementary Data” in this Annual Report on Form 10-K for additional information regarding reinsurance.
Regulation
Phoenix Life and PHLVIC are subject to regulation and supervision in each jurisdiction where they conduct business. Areas of regulation include the following:
·
Financial considerations, including standards of solvency, statutory reserves, reinsurance and capital adequacy;
·
Trade practices, market conduct and licensing of companies and agents;
·
Mandating certain insurance benefits and regulating certain premium rates;
·
Approval of policy forms and certain other related materials;
·
Permitted types and concentration of investments;
·
Permitted dividends or other distributions, as well as transactions between affiliates and changes in control; and
·
Approval of interest payments on surplus notes.
Our insurance subsidiaries file regular reports, including detailed annual financial statements, with insurance regulatory authorities and are subject to periodic examination by such authorities. See Notes 22 and 28 to our consolidated financial statements under “Item 8: Financial Statements and Supplementary Data” in this Annual Report on Form 10-K for additional information regarding late filings.
The National Association of Insurance Commissioners (“NAIC”) provides standardized insurance industry accounting and reporting guidance. However, statutory accounting principles continue to be established by individual state laws, regulations and permitted practices.
Most of the jurisdictions in which our U.S. insurance subsidiaries are admitted to transact business require us to participate in guaranty associations, which are organized to pay certain contractual insurance benefits owed pursuant to insurance policies issued by impaired, insolvent or failed insurers. These associations levy assessments, up to prescribed limits, on all member insurers in a particular state on the basis of the proportionate share of the premiums written by member insurers in the lines of business in which the impaired, insolvent or failed insurer is engaged.
As part of their regulatory oversight process, state insurance departments conduct periodic detailed examinations of the books, records, accounts and business practices of insurers domiciled in their states. State insurance departments also have the authority to conduct examinations of non-domiciliary insurers that are licensed in their states. Phoenix Life is currently undergoing the New York Department of Financial Services (“NYDFS”) (formerly known as the State of New York Insurance Department) quinquennial market conduct examination. PHLVIC is currently under financial examination by the Connecticut Insurance Department as well as a market conduct examination that commenced in 2013.
Annually, our insurance subsidiaries are required to conduct an analysis of the adequacy of all statutory reserves. In each case, a qualified actuary must submit an opinion which states that the statutory reserves, when considered in light of the assets held with respect to such reserves, make good and sufficient provision for the associated contractual obligations and related expenses of the insurer. If such an opinion cannot be provided, the insurer must set up additional reserves by moving funds from surplus. The most recent opinions were provided on a timely basis.
Each of our insurance subsidiaries reports its risk based capital (“RBC”) based on a formula calculated by applying factors to various risk characteristics of the insurer. The major categories of risks involved are asset risk, insurance risk, interest rate risk, market risk and business risk. The formula is used as an early warning tool by regulators to identify possible inadequately capitalized insurers for purposes of initiating regulatory action and not as a means to rank insurers generally. State insurance laws provide insurance regulators the authority to require various actions by, or take various actions against, insurers whose RBC ratio does not meet or exceed certain levels. As of December 31, 2012, our insurance subsidiaries’ RBC ratio was in excess of 250% of company action level risk based capital, the highest regulatory threshold.
9
Most states, including New York and Connecticut, have enacted legislation or adopted administrative regulations affecting the acquisition of control of insurance companies, as well as transactions between insurance companies and persons controlling them. Most states require administrative approval of the direct or indirect acquisition of 10% or more of the outstanding voting securities of an insurance company incorporated in the state.
Employees
At December 31, 2012, we employed approximately 600 people. We have experienced no work stoppages or strikes and consider our relations with our employees to be good. None of our employees are represented by a union.
10
General Development of Business
With roots dating to 1851, PNX was incorporated in Delaware in 2000. Our principal executive offices are located at One American Row, Hartford, Connecticut 06102-5056. Our telephone number is (860) 403-5000. Our web site is located at www.phoenixwm.com. (This and all other URLs included herein are intended to be inactive textual references only. They are not intended to be an active hyperlink to our web site. The information on our web site is not, and is not intended to be, part of this Annual Report on Form 10-K and is not incorporated into this report by reference.)
On December 31, 2008, we spun-off our asset management subsidiary, renamed Virtus Investment Partners, Inc. (“Virtus”), into an independent publicly traded asset management firm. The spin-off occurred through a pro rata distribution of Virtus common stock to Phoenix stockholders.
On July 31, 2009, we formed Saybrus Partners, Inc. (“Saybrus”), a distribution company providing dedicated consultation services to partner companies, as well as support for our product line within its own distribution channels. Saybrus has become one of two segments that comprise the Company.
On June 23, 2010, the Company completed the divestiture of PFG Holdings, Inc. (“PFG”) and, on September 24, 2010, the divestiture of Phoenix Life and Reassurance of New York (“PLARNY”).
On November 18, 2011, the Company completed the sale of Goodwin Capital Advisers, Inc. (“Goodwin”).
See Notes 4 and 21 to our consolidated financial statements under “Item 8: Financial Statements and Supplementary Data” in this Annual Report on Form 10-K for additional information on the sales of PFG, PLARNY and Goodwin.
The following chart illustrates our corporate structure as of December 31, 2012.
| | | | | | | | | |
| | The Phoenix Companies, Inc. | | |
| | | | | |
| | | | | | | |
100% | | 85% | | 100% |
| | | | | | | |
Phoenix Life
Insurance Company | | Saybrus Partners, Inc. | | Other Subsidiaries |
| | | | | |
100% | | | | |
| | | | | |
PM Holdings, Inc. | | | | |
| | | | | |
100% | | | | |
| | | | | | |
| | PHL Variable Insurance
Company | | | |
|
| | | | | | |
100% | | | | | |
| | | | | | |
| | Other Subsidiaries | | | |
| |
Executive Officers of the Registrant
See Part III, Item 10 herein.
Available Information
We make available free of charge on or through our Internet web site (http://www.phoenixwm.com) our Annual Report on Form 10-K, Quarterly Reports on Form 10-Q, Current Reports on Form 8-K and amendments to those reports filed or furnished pursuant to Section 13(a) of the Securities Exchange Act of 1934 (the “Exchange Act”) as soon as reasonably practicable after we electronically file such material with, or furnish it to, the SEC.
11
Item 1A.
Risk Factors
Risks Related to the Restatement, Failure to File Timely Periodic Reports with the SEC and
our Internal Control Over Financial Reporting.
We face risks related to the Restatement, the restatement of historical financial statements of one of our principal insurance company subsidiaries and that, following the filing of this report, we remain delayed in our SEC reporting obligations.
As discussed in this 2012 Form 10-K in the Explanatory Note and in Note 2 to our consolidated financial statements under “Item 8: Financial Statements and Supplementary Data” in this 2012 Form 10-K (and as previously reported in our Current Report on Form 8-K, filed with the SEC on November 8, 2012, as amended by Forms 8-K/A filed with the SEC on March 15, 2013 and April 24, 2013, respectively), we concluded that certain of the Company’s previously issued financial statements should no longer be relied upon and should be restated because of certain errors in those financial statements. Additionally, as previously reported by our insurance company subsidiary, PHLVIC, in a Current Report on Form 8-K filed with the SEC on September 8, 2012, as amended by Forms 8-K/A filed by PHLVIC with the SEC on November 8, 2012, March 15, 2013 and April 24, 2013, respectively, PHLVIC’s audit committee concluded that certain of PHLVIC’s previously issued financial statements should no longer be relied upon and should be restated because of certain errors in those financial statements.
As a result of the Restatement, our SEC reporting obligations remain delayed as of the filing date of this report, and we cannot assure when we will resume a timely filing schedule with respect to our SEC reports. Even after we complete these delayed filings, we expect to continue to face many of the risks and challenges related to the Restatement, including the following:
·
we may fail to remediate material weaknesses in our internal control over financial reporting and other material weaknesses may be identified in the future, which would adversely affect the accuracy and timing of our financial reporting;
·
the extraordinary processes undertaken to effect the Restatement may not have been adequate to identify and correct all errors in our historical financial statements and, as a result, we may discover additional errors and our financial statements remain subject to the risk of future restatement;
·
our failure to have current financial information available;
·
the risk of failure to comply with the filing deadlines included in the SEC’s Cease-and-Desist Order, dated March 21, 2014, including that the SEC may seek sanctions against or deregister the Company and PHLVIC;
·
the risk of failure to file our delayed SEC filings by March 16, 2015, the extended deadline for providing these delayed SEC filings to the bond trustee, as well as the risk associated with seeking additional consents from bondholders of our outstanding 7.45% Quarterly Interest Bonds Due 2032 regarding these delayed filings;
·
the risk that the delay in filing our annual report and any failure to satisfy other New York Stock Exchange (“NYSE”) listing requirements could cause the NYSE to commence suspension or delisting procedures with respect to our securities, including our common stock;
·
the outcome of litigation and claims as well as regulatory examinations, investigations, proceedings and orders arising out of the Restatement and the failure by the Company and PHLVIC to file SEC reports on a timely basis;
·
further downgrades or withdrawals of our debt or financial strength credit ratings, which could increase policy surrenders and withdrawals, adversely affect our relationships with distributors, reduce new sales, limit our ability to trade in derivatives and increase our costs of, or reduce our access to, future borrowings;
·
our inability to hedge our positions due to our inability to replace hedges as a result of our credit rating;
·
the incurrence of significant Restatement-related expenses;
·
diversion of management and other human resources attention from the operation of our business;
·
our inability to access alternate financing arrangements to fund our ongoing operations and our inability to register securities for offer and sale with the SEC under the Securities Act of 1933, as amended (the “Securities Act”) until we have filed the delayed SEC filings and are otherwise current with our relevant SEC filing obligations;
·
risks associated with our insurance company subsidiaries’ delay in completing their respective U.S. GAAP financial statement restatements and PHLVIC’s delay in its SEC reporting obligations; and
·
risks associated with our insurance company subsidiaries’ failure to file certain reports with state regulatory authorities.
12
We cannot assure that all of the risks and challenges described above will be eliminated and that lost business opportunities can be recaptured or that general reputational harm will not persist. If one or more of the foregoing risks or challenges persist, our business, operations and financial condition are likely to be materially and adversely affected.
We have concluded that there are material weaknesses in our internal control over financial reporting, which have materially adversely affected our ability to timely and accurately report our results of operations and financial condition. These material weaknesses have not been fully remediated as of the filing date of this 2012 Form 10-K and we cannot assure you that other material weaknesses will not be identified in the future. If we fail to maintain an effective system of internal controls, the accuracy and timing of our financial reporting may be adversely affected.
As reported in “Item 9A: Controls and Procedures” ofthis 2012 Form 10-K, we have concluded that there are material weaknesses in our internal control over financial reporting and that our disclosure controls and procedures are ineffective as of December 31, 2012. It is necessary for us to maintain effective internal control over financial reporting to prevent fraud and errors and to maintain effective disclosure controls and procedures so that we canprovide timely and reliable financialand other information. A failureto maintain adequate internal controlsmay adversely affect our ability to provide financial statements thataccurately reflect our financial conditionand timely report information. Thiscould cause investors to lose confidence in our reported financialand other information, cause our securities to trade at a decreased price and causean adverse effect on our businessand results of operations. A failure to correct material weaknesses in our internal controls could result in further restatements of financial statements and correction of other information filed with the SEC.
The extraordinary processes undertaken to effect the Restatement may not have been adequate to identify and correct all errors in our historical financial statements and, as a result, we may discover additional errors and our financial statements remain subject to the risk of future restatement.
The completion of our Restatement involved many months of review and analysis, including highly technical analyses of our contracts and business practices, estimates and assumptions made by management, tax accounting and the proper application of relevant accounting rules and pronouncements. Many of the enhancements and changes to our processes are ongoing as of the filing date of this 2012 Form 10-K and we continue to integrate the complex changes we have already made. Given the complexity and scope of these exercises, and notwithstanding the extensive time, effort and expense that went into them, we cannot assure you that these extraordinary processes were adequate to identify and correct all material errors in our historical financial statements or that additional accounting errors will not come to light in the future in these or other areas.
While we have performed additional analyses and other procedures, and either implemented or plan to implement and test remediation measures as of the filing date of this report, the previously identified material weaknesses have not been fully addressed and remediated. We continue to improve our internal control over financial reporting and disclosure controls and procedures by, among other things:
·
enhancing our existing accounting policies and procedures;
·
implementing changes in our finance and accounting organization;
·
adopting new accounting and reporting processes and procedures; and
·
introducing new or enhanced accounting systems and processes.
As a result, we cannot assure you that we will not discover additional errors, that future financial reports will not contain material misstatements or omissions, that future restatements will not be required, that we will be able to timely complete our remaining SEC filings for periods subsequent to this report, or that we will be able to timely comply with our reporting obligations in the future.
We are effecting the Restatement through the filing of this single, multi-year comprehensive Annual Report on Form 10-K for the year ended December 31, 2012. We have not received any assurance from the SEC that such a comprehensive report will satisfy our Restatement filing obligations and, if it is ultimately determined that it does not, we may be required to amend this comprehensive report and/or file amended reports to effect the Restatement. This would require us to devote substantial internal and external resources and cause us to incur significant fees and expenses for additional audit services as well as accounting and other consulting services. These fees and expenses, as well as the substantial time devoted by our management to make such filings with the SEC, could have a material adverse effect on our business, profitability and financial condition.
13
Because we remain delayed in our SEC reporting obligations, we do not have current financial information available.
We have not yet filed our Quarterly Report on Form 10-Q for the quarterly period ended September 30, 2012 (the “Third Quarter 2012 Form 10-Q”), our Quarterly Reports on Form 10-Q for each of the quarterly periods ended September 30, 2013, June 30, 2013 and March 31, 2013 and our Annual Report on Form 10-K for the year ended December 31, 2013 ( the “2013 Form 10-K”) (the “Delayed 2013SEC Reports” and collectively with the Third Quarter 2012 Form 10-Q, the “Delayed SEC Reports”). Until we file the Delayed SEC Reports and are otherwise current in our SEC filing requirements, there is a lack of current publicly available information concerning the consolidated results of operations and financial condition of the Company. Our ability to file the Delayed SEC Reports and resume a timely filing schedule with respect to our SEC reports is subject to a number of contingencies, including but not limited to, whether we continue to identify errors in our consolidated financial statements and whether existing systems and processes can be timely updated, supplemented or replaced.
Investors must evaluate certain decisions with respect to our securities in light of the lack of current financial information. Accordingly, for so long as we are not current in our SEC reporting obligations, any investment in our securities involves a greater degree of risk. The lack of current public information may have an adverse impact on investor confidence, which could lead to a reduction in our stock price and market capitalization and an increase in our cost of capital. In addition, until current periodic reports and financial statements are filed, we will be precluded from registering our securities with the SEC for offer and sale. This precludes us from raising debt or equity financing in the public markets and limits our access to the private markets and will limit our ability to use stock options and other equity-based awards to attract, retain and provide incentives to our employees.
If we fail to comply with the filing deadlines included in the SEC’s Cease-and-Desist Order, dated March 21, 2014, the SEC may seek sanctions against the Company and PHLVIC. We may be subject to further investigation and potential regulatory action.
On February 12, 2014, the Company and PHLVIC submitted an Offer of Settlement with the SEC pursuant to which the Company and PHLVIC consented to the issuance of the form of an Order Instituting Cease-and-Desist Proceedings Pursuant to Section 21C of the Securities Exchange Act of 1934, Making Findings, and Imposing a Cease-and-Desist Order (the “Order”). The Order was approved by the SEC on March 21, 2014. Pursuant to the Order, the Company and PHLVIC have been directed to cease and desist from committing or causing any violations and any future violations of Section 13(a) of the Exchange Act and Rules 13a-1, 13a-13 thereunder and Section 15(d) of the Exchange Act and Rules 15d-1 and 15d-13 thereunder. In addition, the Company and PHLVIC agreed to perform certain undertakings, including for the Company to file its delayed Third Quarter 2012 Form 10-Q by no later than April 15, 2014 and its 2013 Form 10-K by no later than June 4, 2014. Also pursuant to the undertakings, the Company would file its 2013 Forms 10-Q after the filing of its 2013 Form 10-K. The Company intends to become timely with its periodic filings under the Exchange Act with the filing of its Quarterly Report on Form 10-Q for the period ending June 30, 2014. Finally, the Company and PHLVIC each paid a civil monetary penalty in the amount of $375,000 to the United States Treasury following the entry of the Order.
The SEC has a broad range of potential actions that may be taken against the Company and PHLVIC for failure to comply with the undertakings noted above. Further, the Company is providing to the SEC certain information and documentation regarding the Restatement and the staff of the SEC has indicated to the Company that the matter remains subject to further investigation and potential further regulatory action. We cannot predict the outcome of any of such investigations or actions related to these or other matters. An adverse ruling in any SEC enforcement action or other regulatory proceeding could impose upon the Company and/or PHLVIC fines, penalties, or other remedies, including the suspension of trading of the Company’s securities or deregistration of the Company and PHLVIC under the Exchange Act, which could have a material adverse effect on our results of operations and financial condition. Even if we are successful in defending against an SEC enforcement action or other regulatory proceeding, such an action or proceeding may be time consuming, expensive and diverting management from the operation of our business and could have a material adverse effect on our business, financial condition and results of operations. In the event of any such action or proceeding, we may also become subject to costly indemnification obligations to current or former officers, directors, or employees.
14
If we fail to file our Delayed SEC Reports and Quarterly Reports on Form 10-Q for the quarterly periods ending March 31, 2014, June 30, 2014 and September 30, 2014 (the “2014 Forms 10 Q”) by March 16, 2015, we may seek additional consents from certain bondholders to extend the date for providing our Delayed 2013 SEC Reports to the Indenture Trustee.
The reporting covenant (“Reporting Covenant”) contained in the indenture (the “Indenture”) covering our outstanding 7.45% Quarterly Interest Bonds due 2032 (the “Bonds”), requires us to file with the trustee (“Trustee”), within fifteen days after we are required to file with the SEC, copies of the annual reports, quarterly reports and of the information, documents and other reports that we are required to file with the SEC pursuant to Section 13 or Section 15(d) of the Securities Exchange Act of 1934, as amended, and the rules and regulations adopted by the SEC thereunder. Additionally, under the Indenture, the Trustee or the holders (“Holders”) of 25% or more of the outstanding principal amount of the Bonds have the right to notify us if they believe we have breached a covenant under the Indenture and may, following any applicable cure periods, declare an Event of Default and cause the outstanding principal amount of the Bonds to become immediately due and payable.
Because of the delay in filing this 2012 Form 10-K and certain of our Delayed SEC Reports, the Trustee under the Indenture covering the Bonds sent notices of default under the Indenture initiating the 60-day cure periods thereunder. Consequently, we sought and successfully obtained the consents of Holders representing a majority of the outstanding principal amount of the Bonds (“Requisite Consents”) to amend the Indenture, and to provide related waivers, that allowed us to ultimately extend the date for providing this 2012 Form 10-K, the Delayed SEC Reports and the 2014 Forms 10-Q (collectively, the “Relevant SEC Reports”) to the Trustee to a date on or prior to March 16, 2015. If we fail to file one or more of the Relevant SEC Reports by March 16, 2015, we may seek an additional consent from the Holders to amend the Indenture, and to provide a related waiver, that will allow us to extend the date for providing such Relevant SEC Reports to the Trustee.
If we do seek an additional consent from Holders to amend the Indenture and to provide a related waiver, there can be no assurance that we will receive the Requisite Consents to any additional amendments and waivers of the Reporting Covenant on a timely basis, or at all, or that the extension of the Reporting Covenant for the Relevant SEC Reports will extend for a sufficient period of time to avoid an Event of Default, an acceleration event or other adverse impact on our business operations that may result therefrom. If we are unsuccessful in curing the default or obtaining the Requisite Consents to such additional amendments and waivers, the Trustee or the Holders of 25% or more of the outstanding principal amount of the Bonds will be able to accelerate payment of outstanding principal on the Bonds for the existing breach of the Reporting Covenant in accordance with the Indenture. In the event that Holders of a majority in principal amount of the Bonds do not provide us with the Requisite Consents to such amendments and waivers and determine to accelerate payment of the Bonds, we may lack the ability to meet those obligations out of our currently available cash and liquid assets available at our holding company. Although we believe that we could take actions designed to satisfy such obligations, we can provide no assurance that any of these actions would be sufficient, available or available on satisfactory terms, any of which could materially and adversely impact our business, liquidity and financial position. Even if we are successful in amending the Indenture and obtaining a waiver from the Holders, there can be no assurances that we will make the filings with the SEC or the Trustee by such extended date, which would further limit investor insight into our results of operations and financial condition and could result in a default under the Indenture.
The delay in filing the 2013 Annual Report on Form 10-K with the SEC and any failure to satisfy other NYSE listing requirements could cause the NYSE to commence suspension or delisting procedures with respect to securities issued by us, including our common stock.
The Company was notified by the NYSE that, as a result of its failure to timely file an Annual Report on Form 10-K for the fiscal year ended December 31, 2012 with the SEC, it was subject to the procedures specified in Section 802.01E (SEC Annual Report Timely Filing Criteria) of the Listed Company Manual of the NYSE. Pursuant to Section 802.01E, the Company made a request to the NYSE that its shares be permitted to continue to trade on the NYSE while the Company completed its restatement of financial statements for prior periods and prepared this 2012 Form 10-K. On September 27, 2013 via letter dated September 26, 2013, the NYSE notified the Company that its shares may continue to trade on the NYSE until January 31, 2014. On January 24, 2014, the NYSE notified the Company that its shares would be allowed to continue to trade on the NYSE until April 3, 2014, subject to reassessment on an ongoing basis. We believe that the filing of this 2012 Form 10-K prior to April 3, 2014 satisfies the NYSE requirement to file an Annual Report on Form 10-K for the fiscal year ended December 31, 2012.
15
We expect that we will not be able to timely deliver the 2013 Form 10-K, to the NYSE and, as a result, the NYSE could take action to suspend or delist our securities, which would result in there being a limited trading market for our securities.
Any other failure to satisfy NYSE listing requirements, if not waived by the NYSE, could cause the NYSE to commence suspension or delisting procedures with respect to our securities. When a company which has fallen below any of the NYSE continued listing criteria has more than one class of securities listed, the NYSE will give consideration to delisting all such classes. However, the NYSE may continue the listing of one class of securities regardless of its decision to delist another class. This circumstance would usually occur when a class of listed securities falls below certain of the NYSE’s distribution criteria. The commencement of any suspension or delisting procedures and any actual suspension or delisting of our securities by the NYSE remains, at all times, at the discretion of the NYSE and would be publicly announced by the NYSE. The delisting of our common stock from the NYSE may have a material adverse effect on us by, among other things causing investors to dispose of our shares and, limiting:
·
the liquidity of our common stock;
·
the market price of our common stock;
·
the number of institutional and other investors that will consider investing in our common stock;
·
the availability of information concerning the trading prices and volume of our common stock;
·
the number of broker-dealers willing to execute trades in shares of our common stock; and
·
our ability to obtain equity or debt financing for the continuation of our operations.
The outcome of litigation and other claims as well as regulatory examinations, investigations, proceedings and orders arising out of the Restatement and the failure by the Company and PHLVIC to file SEC reports on a timely basis are unpredictable and any orders, actions or rulings not in our favor could have a material adverse effect on our financial condition, liquidity or results of operations.
The circumstances which gave rise to the Restatement, the restatements by our insurance company subsidiaries and the related SEC filing delays continue to create the risk of litigation and claims by investors and examinations, investigations, proceedings and orders by regulatory authorities, which could be expensive and damaging to our business and financial condition.
On April 17, 2013, Robert Strougo, et al, filed a complaint against the Company and two of its officers in the United States District Court for the District of Connecticut arising out of the restatement (Case No. 13-CV-547-RNC). For additional information regarding litigation related business risks, please see the risk factor below under “Risks Related to our Business” entitled, “Legal actions and proceedings are inherent in our businesses and could adversely affect our results of operations or financial position or harm our business or reputation.”
In connection with the Restatement, the failure by the Company to file the Delayed SEC Reports and PHLVIC’s failure to file its corresponding SEC reports, as well as the reported weaknesses in internal control over financial reporting may subject the Company and PHLVIC to a broad range of potential actions that may be taken against the Company and PHLVIC by the staff of the SEC including but not limited to a cease and desist order, suspension of trading of our securities, deregistration of our securities and/or the assessment of possible civil monetary penalties.
Any orders, actions or rulings relating to any of the foregoing that are not in our favor could have a material adverse effect on our financial condition, liquidity or results of operations.
The events which caused the need for this Restatement and the failure to timely file this 2012 Form 10-K and certain of our Delayed SEC Reports have resulted in certain rating agencies placing us on negative credit watch, downgrading our credit and debt ratings and/or withdrawing these ratings and further credit rating downgrades of our debt or financial strength ratings or withdrawal of these ratings are possible. These downgrades or withdrawals could result in an increase in policy surrenders and withdrawals, adversely affect relationships with distributors, reduce new sales, limit our ability to trade in derivatives and increase ourcosts of, or reduce our access to, future borrowings.
Rating agencies assign Phoenix Lifeand its insurance companysubsidiaries financial strength ratings, and assign us debt ratings, based in each case on their opinions of the Company’s orPhoenix Life’s ability to meet their respective financial obligations.
16
Our ratings relative to other companies in the industry affect our competitive position.The Company, its insurance company subsidiaries and their securities have been placed on negative credit ratings watch and/or downgraded or withdrawn by certain rating agencies in connection with the events which caused the need for this Restatement and the failure to timely file this 2012 Form 10-K and certain of our Delayed SEC reports. These recent developments and any future rating downgrades or withdrawals may cause reputational damage, which could materially and adversely affectour ability to distribute our products through unaffiliated third parties, new sales of our products, the persistency of existing customers, increase policy surrenders and withdrawals and our ability to borrow. We cannot predict what actions rating agencies may take, or what actions we may take in response. At this time, we cannot estimate the impact of specific future rating agency actions on sales or persistency. Financial statement restatements may result in downgrades or withdrawals of our debt or financial strength credit ratings, which could increase policy surrenders and withdrawals, adversely affect relationships with distributors, reduce new sales, limit our ability to trade in derivatives and increase our costs of, or reduce our access to, future borrowings, any of which could negatively impact our liquidity. Such an increase would decrease our earnings, could reduce access to financing and have a material adverse effect on our operations.
In light of the difficulties experienced by many financial institutions, including insurance companies, rating agencies have increased the frequency and scope of their credit reviews and requested additional information from the companies that they rate, including us. They may also adjust upward the capital and other requirements employed in the rating agency models for maintenance of certain ratings levels.
We may not be able to hedge our positions due to the inability to replace hedges as a result of our credit rating.
We use derivative instruments to hedge the liability exposure and the volatility of earnings associated with certain variable and fixed indexed annuity liabilities.Certain derivative counterparty agreements of certain subsidiaries contain provisions that permit the parties to terminate the agreements upon the occurrence of a default under the Indenture covering the Bonds. In addition, certain of these agreements require our insurance companies’ financial strength rating to be above a certain threshold. Given that our financial strength ratings are belowa specified credit rating threshold in certain of our derivative agreements, thecounterparties can request immediate payment,demand immediate and ongoing full collateralization on derivative instruments in net liability positions, or trigger a termination of existing derivatives and/or future derivative transactions.In certain derivative counterparty agreements, our financial strength ratings are below the specified threshold levels and have been since March 2009.
The Company held no derivative instruments as of February 28, 2014 in an aggregate net liability position payable to any counterparty (i.e., the fair value of derivative instruments with each counterparty was in an aggregate net asset position payable to the Company if such holdings were liquidated).
If we are forced to terminate any derivative agreements, we may be unable to replace the derivative positions, thereby increasing our exposure to periods of significant and sustained downturns in equity markets, increased equity volatility, or reduced interest rates, which could result in an increase in the valuation of the future policy benefit associated with such products and result in a material adverse effect on our earnings and financial condition.
We have incurred and expect to continue to incur significant expenses related to the Restatement, the remediation of deficiencies in our internal control over financial reporting and disclosure controls and procedures and preparation of this 2012 Form 10-K, the Delayed 2013 Reports and the 2014 Forms 10-Q.
We have devoted and expect to continue to devote substantial internal and external resources to remediation relating to the Restatement, the PHLVIC restatement and the preparation and filing of this 2012 Form 10-K and the preparation of the Delayed SEC Reports and the 2014 Forms 10-Q. As a result of these efforts, we have incurred and expect that we will continue to incur significant incremental fees and expenses for additional auditor services, financial and other consulting services, legal services, consent waivers as well as the implementation and maintenance of systems and processes that will need to be updated, supplemented or replaced. These expenses, as well as the substantial time devoted by our management towards identifying and addressing any internal weaknesses, could have a material adverse effect on our business, profitability and financial condition. For additional information regarding principal accounting fees and services, please see Part III, Item 14 of this 2012 Form 10-K.
17
The Restatement process and the preparation of this 2012 Form 10-K have diverted, and the preparation of the Delayed SEC Reports continue to divert management and other human resources from the operation of our business. The absence of timely and accurate financial information may hinder our ability to effectively manage the business of the Company.
The Restatement process and the preparation of this 2012 Form 10-K and the Delayed SEC Reports have diverted, and continue to divert, management and other human resources from the operation of our business. As a result of the delay in completing the Restatement, we have delayed filing our Third Quarter 2012 Form 10-Q and Delayed 2013 SEC Reports. We believe we will not be able to timely file one or more of our 2014 Forms 10-Q. The Board of Directors, members of management, and the accounting, legal, administrative and other staff of the Company have spent, and continue to spend, significant time on the restatement of the financial statements, preparation of the Delayed SEC Reports, related disclosures and remediation of disclosure controls and procedures and internal control over financial reporting of the Company and its insurance company subsidiaries. These resources have been, and will likely continue to be, diverted from the strategic and day-to-day management of our business. In addition, current, accurate financial information is essential to the management of our complex business, including controlling the financial risk associated with the products that the Company offers and sells through its subsidiaries. The Restatement and the absence of publicly available financial information may make it more difficult to accomplish the strategic objectives of the Company.
The Restatement, the Delayed SEC Reports and the projected late filing of our First Quarter 2014 Form 10-Q adversely impact our ability to access alternate financing arrangements to fund our ongoing operations, particularly in the event the payment obligation with respect to the Bonds is accelerated as provided in the Indenture. In addition, we will be limited in our ability to register our securities for offer and sale with the SEC under the Securities Act, until we have filed the Delayed SEC Reports and are otherwise current with our relevant SEC filing obligations.
Our ability to obtain financing, if needed, depends upon many factors, including our business prospects and creditworthiness as well as external economic conditions and general liquidity in the credit and capital markets. In light of the Restatement, the delay in filing the Delayed SEC Reports and our projected late filing of our First Quarter 2014 Form 10-Q and our failure to be current with our relevant SEC filing obligations, we may be unable, if needed, to secure outside financing to fund ongoing operations, in particular in the event that our payment obligation with respect to the Bonds is accelerated as provided in the Indenture. Any sources of financing that may be available to us could also be at higher costs and require us to satisfy more restrictive covenants, which could limit or restrict our operations, cash flows and earnings. We cannot assure that additional financing would be available to us, or be sufficient or available on satisfactory terms. In addition, until current periodic reports and financial statements are filed with the SEC, we will be precluded from registering our securities with the SEC for offer and sale.
Our current financial strength and credit ratings limit our access to external sources of liquidity and financing. During periods of capital market volatility, this access could be further constrained, and the cost of financing could increase significantly. Our ongoing needs for liquidity include policy claims, surrenders, policy loans, commissions, interest and operating expenses. In addition, we may from time to time have discrete needs for liquidity, such as contributions to our pension plan or legal settlements. Our principal sources of liquidity are insurance premiums, annuity considerations, deposit funds and cash flow from our investment portfolio. Sales of assets that are readily convertible into cash represent an additional source. We do not have in place credit facilities or letters of credit that we could draw upon to meet our liquidity requirements. Without sufficient liquidity, we could be forced to realize investment losses, deplete capital or curtail certain of our operations, which would adversely impact our results of operations and financial condition.
18
Our insurance company subsidiaries are in the process of restating their respective U.S. GAAP financial statements for certain historical fiscal periods and PHLVIC is delayed in its SEC reporting obligations. This ongoing restatement process may have a material adverse impact on the business and financial condition of the Company.
We conduct the majority of our business through Phoenix Life and its indirect subsidiary, PHLVIC. As previously reported, on September 18, 2012, the audit committee of PHLVIC concluded that PHLVIC’s previously issued audited U.S. GAAP financial statements for the years ended December 31, 2011, 2010 and 2009 included in PHLVIC’s Annual Report on Form 10-K and the unaudited U.S. GAAP financial statements for the first and second quarters of 2012 and the interim periods for 2011, included in PHLVIC’s Quarterly Reports on Form 10-Q filed with the SEC, should be restated because of certain errors in those financial statements and, as a result, the related financial information in those financial statements should no longer be relied upon. As a result of the delay in completing the restatement, PHLVIC has delayed filing with the SEC its Third Quarter 2012 Quarterly Report on Form 10-Q, its 2012 Annual Report on Form 10-K and its 2013 Annual Report on Form 10-K and was unable to timely file its quarterly reports on Form 10-Q for the first, second and third quarters of 2013. In addition, PHLVIC believes it may not be able to timely file one or more of its quarterly reports on Form 10-Q for the first, second and third quarters of 2014.
PHLVIC has previously announced that until it completes its restatement, becomes current in its SEC reporting requirements and has filed with the SEC new registration statements or amendments to its existing registration statements covering its products to include required financial information, it will continue to not issue any new SEC-registered life insurance and annuity contracts. Phoenix Life similarly has announced that it will continue to not issue any new SEC-registered life insurance and annuity contracts until it has filed with the SEC amendments to its product registration statements to include updated financial information. In addition, until the Company and the insurance company subsidiaries complete their restatement process, PHLVIC becomes current in its SEC reporting requirements and the Company’s insurance company subsidiaries have filed with the SEC new registration statements or amendments to their existing registration statements covering their products to include required information, there will be ongoing uncertainty regarding our ability to continue to accept premiums, or to process certain other investment transaction requests, associated with the outstanding SEC-registered annuity and life contracts of our insurance company subsidiaries. In such an event, these actions may have a material adverse impact on our future revenues, our competitive position and consumer perception of our products, and our retention of existing contracts and may result in claims related to these SEC-registered products against us and our insurance company subsidiaries, any of which could have a material adverse effect on the Company’s business and financial results. In addition, in connection with its product offerings, PHLVIC relies on third party vendors to supply vendor-generated products. PHLVIC’s failure to be current in its SEC filings may cause such vendors to terminate their relationships with PHLVIC which in turn may cause PHLVIC to terminate many of its product offerings.
As a result of our U.S. GAAP financial statement restatement, certain errors were found in our insurance company subsidiaries’ financial statements prepared in accordance with Statements of Statutory Accounting Principles (“Statutory”) filed with the applicable state insurance regulators. Those errors were corrected in subsequent filings with the applicable state insurance regulators. We do not believe the state insurance regulators will deem it necessary to adjust our insurance company subsidiaries’ historical unaudited Statutory financial statement filings with the applicable state insurance regulators. However, the fact of the insurance company subsidiaries’ restatements, the delay in PHLVIC’s filing of periodic reports with the SEC and the Restatement could result in various regulatory bodies conducting examinations or investigations and/or making inquiries of our insurance company subsidiaries and the Company concerning compliance with applicable laws and regulations, which may increase our compliance costs and the potential for regulatory investigations or proceedings or other claims. Any existing or future litigation, investigations, proceedings or claims that we and the insurance company subsidiaries are or could become involved in, or become the subject of, could have a material adverse effect on our financial condition, liquidity or financial statements.
Our insurance company subsidiaries’ failure to file audited Statutory financial statements with state regulatory authorities may result in, among other things, the imposition of sanctions and penalties against us, which could have a material adverse effect on our financial condition, results of operations and cash flows.
Our insurance company subsidiaries are required to file audited Statutory financial statements with the applicable regulatory authorities annually. As a result of the Restatement, we did not timely file the required 2012 annual audited Statutory financial statements for our insurance company subsidiaries with applicable state insurance regulators.
19
Our insurance company subsidiaries have received from their respective domiciliary insurance regulators extensions for submission of their respective 2012 audited Statutory financial statements and management’s report on internal control over financial reporting. Our insurance company subsidiaries intend to seek further extensions, as necessary. If such extensions are not granted, failure to timely file such financial statements and management’s report can result in, among other things, the imposition of sanctions and penalties, including operating restrictions, which could have a material adverse effect on our financial condition, results of operations and cash flows.
20
Risks Related to Our Business
Our business, financial condition and results of operations could be materially and adversely affected by unfavorable economic developments and the performance of the debt and equity markets.
Economic and market conditions materially and adversely affected us in the last recession. The economy may once again deteriorate. The resulting lack of credit, increase in defaults, lack of confidence in the financial sector, volatility in the financial markets and reduced business activity could materially and adversely affect our business, financial condition and results of operations.
These effects include, but are not limited to, the following:
·
Lower fee revenue and higher expenses. Significant declines in equity markets would decrease assets in our variable annuity and variable life product lines, resulting in lower fee income and increased amortization of deferred policy acquisition costs.
·
Realized and unrealized losses in our fixed income portfolio. The value of the portfolio would be depressed by general interest rate increases or credit spread widening, as well as by illiquidity and by changes in assumptions we use to estimate the fair value of securities. Bonds supported by residential and commercial mortgages could experience losses if the delinquency rates of the underlying mortgage loans increase.
·
Realized and unrealized losses in alternative asset classes. We invest in private equity funds, mezzanine funds, hedge funds and other limited partnerships, which generate returns that are more volatile than other asset classes and are relatively illiquid and, therefore, may be harder to value or sell in adverse market conditions.
·
Higher statutory reserve and capital requirements. Certain regulatory reserve and capital requirements incorporate actual and expected future capital market conditions and could increase materially in the event of significant equity market declines or changes in interest rates, credit spreads and credit default rates.
·
Losses due to changes in accounting estimates. Significant accounting estimates may be materially affected by the equity and debt markets and their impact on expected customer behavior. For example, in setting amortization schedules for our deferred policy acquisition costs, we make assumptions about future market performance, interest rates and policyholder behavior.
·
Increased funding requirements for our pension plan. Future market declines could result in additional funding requirements. Also, the funding requirements of our pension plan are sensitive to interest rate changes. Should interest rates decrease materially, the plan liabilities would increase.
·
Hedging losses or increased reserve requirements in our variable annuity business. We use derivatives to hedge the value of certain guaranteed benefits. These hedges and other management procedures could prove ineffective, especially during times of significant market volatility. For benefits that are not hedged, such as minimum death benefits and minimum income benefits we could be required to increase reserves in the event of a significant decline in the equity markets.
Persistent low interest rates or significant increases in interest rates could adversely affect our business and results of operations.
Our products expose us to significant interest rate risk. A substantial portion of our business is spread-based, meaning that profitability depends on our ability to invest premiums at yields in excess of the rates we credit to policyholders. The current low interest rate environment has meant that we have invested or reinvested cash flows at substantially lower yields than our existing portfolio yield, while our ability to reduce credited rates has been limited by contractual minimums. Persistent low interest rates could compound this spread compression. In addition, they could cause additional premium payments on products with flexible premium features, repayment of policy loans and lower policy surrenders.
Persistent low interest rates could also result in higher statutory reserve and capital requirements. The Life Companies are subject to annual asset adequacy testing, which requires additional reserves to be posted if projected asset cash flows and future premiums are not able to support future policy claims and surrenders under a range of possible scenarios.
21
Low interest rates also have increased the liability of our pension plans and other post-employment benefits. Further declines in interest rates could result in additional increases in these liabilities.
Conversely, if interest rates rise significantly, we could face an increase in unrealized losses in our investment portfolio. At the same time, it could cause life insurance policy loans, surrenders and withdrawals to increase as policyholders seek investments with higher returns. This could require us to sell invested assets at a time when their prices are depressed, which could cause us to realize investment losses.
Legal actions and proceedings are inherent in our businesses and could adversely affect our results of operations or financial position or harm our businesses or reputation.
We are regularly involved in litigation and arbitration, both as a defendant and as a plaintiff. In addition, various regulatory bodies regularly make inquiries of us and, from time to time, conduct examinations or investigations concerning our compliance with, among other things, insurance laws, securities laws, laws governing the activities of broker-dealers and other laws and regulations affecting our registered products. We are, and in the future may be, subject to and involved in legal actions and proceedings in the ordinary course of our businesses. Some of these proceedings have been brought, and may be brought in the future, on behalf of various alleged classes of complainants. In certain of these matters, the plaintiffs are seeking large and/or indeterminate amounts, including punitive or exemplary damages. Furthermore, certain institutional investors have purchased, or may purchase in the future, large numbers of Life Companies’ policies in the secondary market and have asserted, or may assert, claims against us before regulatory agencies and in litigations. Substantial legal liability in these or future legal actions could have an adverse affect on us or cause us reputational harm, which in turn could, among other items, harm our business prospects, result in regulatory or legislative responses and have an adverse effect on our consolidated financial statements.
It is difficultto predict or determine the ultimate outcome of legal or regulatory proceedings or to provide reasonable ranges of potential losses. We believe that the outcomes of our litigation and regulatory matters are not likely, either individually or in the aggregate, tohave a material adverse effect on ourconsolidated financial statements. However, given the large or indeterminate amountsand/or other remediessought in certain of these matters and the inherent unpredictability of litigation and regulatory matters, it is possible that an adverse outcome in certain matters could, from time to time, have a material adverse effect onthe way we conduct our business and our financial condition, liquidity or consolidated financial statementsin particular quarterly or annual periods. For a more detailed discussion of certain current litigation and other proceedings please refer to the discussion under “Item 3: Legal Proceedings” of this2012 Form 10-K.
Our actuarial reserve calculations, particularly for universal life death benefits and guaranteed annuity benefits, require many assumptions and significant management judgment, which, if incorrect, could adversely affect our results of operations and financial condition.
We establish reserves to pay future policyholder benefits and claims. A significant proportion of our reserves do not represent policyholder funds but rather are actuarial estimates based on assumptions that include future premiums, benefits, claims, expenses, interest credits, investment results (including equity market returns), mortality, morbidity and persistency. As a result, we cannot be certain that the assets supporting our policy liabilities, together with future premiums, will be sufficient for payment of benefits and claims. If, in the future, we determine this to be the case, we would need to increase our reserves in the period in which we make the determination, which would adversely affect our results of operations.
We may experience losses if capital market conditions, mortality or longevity experience, policyholder behavior (e.g., persistency, premium payments, benefit utilization rates) or other factors differ significantly from the assumptions that we used in pricing products or that are reflected in our current financial results.
We set prices for our insurance and annuity products based upon capital market assumptions, expected mortality or longevity and expected policyholder behavior. For capital market assumptions such as equity market returns and investment portfolio yields we use current market observations, historical information and management judgment. For mortality and longevity rates we use standard actuarial tables, company experience and management judgment. For policyholder behavior assumptions we use available industry and company data. Assumptions used in pricing our products generally are consistent with assumptions used to initially determine the amortization of deferred policy acquisition costs. Adverse experience relative to these assumptions could have a material adverse effect on our results from operations and financial condition.
22
Recent trends in the life insurance industry may affect our mortality, persistency and funding levels. The evolution of the financial needs of policyholders and the emergence of a secondary market for life insurance and increased availability and subsequent contraction of premium financing suggest that the reasons for some purchases of our products changed. At the same time, prior to 2009, we experienced an increase in life insurance sales to older individuals. While we instituted certain controls and procedures to screen applicants, we believe that our sales of universal life products include sales of policies to third party investors who, at the time of policy origination, had no insurable interest in the insured.
Deviations in experience from our pricing assumptions have had, and could continue to have, an adverse effect on the profitability of certain universal life products. Most of our current products permit us to increase charges and adjust crediting rates during the life of the policy or contract (subject to guarantees in the policies and contracts). In 2011 and 2010, we implemented increases in the cost of insurance (“COI”) rates for certain universal life policies. However, these and any other permitted adjustments do not allow us to recoup past losses and may not be sufficient to maintain profitability in the future. In addition, increasing charges on in force policies or contracts may adversely affect our relationships with distributors, future sales and surrenders. Furthermore, some of our in force business consists of products that do not permit us to adjust the charges and credited rates of in force policies or contracts.
Our recent development of fixed indexed annuity products has required us to make pricing assumptions about the behavior of policyholders in a market segment with which we are not historically familiar and for product features for which there is limited long-term industry experience. In particular, if our pricing assumptions with respect to persistency and benefit utilization in the future prove inaccurate, we may experience an adverse impact on our results of operations or financial condition.
Adverse experience relative to our pricing assumptions could also result in higher amortization of deferred policy acquisition costs. The recovery of deferred policy acquisition costs is dependent upon the future profitability of the related business. See “Item 7: Management’s Discussion and Analysis of Financial Condition and Results of Operations—Critical Accounting Estimates” in this 2012 Form 10-K. If our estimates of future gross profits or margins cannot support the continued amortization or recovery of deferred policy acquisition costs the amortization of such costs is accelerated in the period in which the pricing assumptions are changed, resulting in an “unlocking” charge to income. Such adjustments may in the future have a material adverse effect on our results of operations or financial condition.
Guaranteed benefits within our products that protect policyholders against significant downturns in equity markets may decrease our earnings, increase the volatility of our results if hedging strategies prove ineffective, result in higher hedging costs and expose us to increased counterparty risk, which may have a material adverse effect on our results of operations, financial condition and liquidity.
Certain of our products include guaranteed benefits. These include GMDBs, guaranteed minimum accumulation benefits (“GMABs”), GMWBs and guaranteed minimum income benefits (“GMIBs”). Periods of significant and sustained downturns in equity markets, increased equity volatility or reduced interest rates could result in an increase in the valuation of the future policy benefit associated with such products, resulting in a reduction to earnings. We use derivative instruments to hedge the liability exposure and the volatility of earnings associated with some of these liabilities and, even when these and other actions would otherwise successfully mitigate the risks related to these benefits, we remain liable for the guaranteed benefits in the event that derivative counterparties are unable or unwilling to pay. In addition, we are subject to the risk that hedging and other management procedures prove ineffective or that unanticipated policyholder behavior, including lower withdrawals or mortality, combined with adverse market events, produces economic losses beyond the scope of the risk management techniques employed. Hedging instruments we hold to manage product and other risks have not, and may continue to not, perform as intended or expected, resulting in higher realized losses.Market conditions can also result in losses on product related hedges and such losses may not be recovered in the pricing of the underlying products being hedged. These factors, individually or collectively, may adversely affect our profitability, financial condition or liquidity.
23
Our risk management policies and procedures may leave us exposed to unidentified or unanticipated risk, which could adversely affect our businesses or result in losses.
We have devoted significant resources to develop and periodically update our risk management policies and procedures to reflect our ongoing review of our risks. However, our policies and procedures to monitor and manage risks may not be fully effective and may leave us exposed to unidentified and unanticipated risks. We use models in many aspects of our operations, including but not limited to the pricing of products, estimation of actuarial reserves, amortization of deferred policy acquisition costs and the valuation of certain other assets and liabilities. These models rely on assumptions and projections that are inherently uncertain. In addition, the risk of a natural or man-made catastrophe, pandemic, malicious act, terrorist act, or the occurrence of climate change, could adversely affect mortality, morbidity, or other relevant factors and, as a result, have a significant negative impact on our business. Our risk management efforts and other precautionary plans and activities may not adequately predict the impact on our business from such events.
Management of operational, legal and regulatory risks requires, among other things, policies and procedures to record properly and verify a large number of transactions and events, and these policies and procedures may not be fully effective. Past or future misconduct by our employees or employees of our vendors could result in violations of law by us, regulatory sanctions and/or serious reputational or financial harm and the precautions we take to prevent and detect this activity may not be effective in all cases. A failure of our computer systems or a compromise of their security could also subject us to regulatory sanctions or other claims, harm our reputation, interrupt our operations and adversely affect our business, results of operations or financial condition.
Our statutory capital could decrease or our capital requirements could increase and adversely affect our business.
We conduct the majority of our business through Phoenix Life and its indirect subsidiary, PHLVIC. Accounting standards and statutory capital and reserve requirements for these entities are prescribed by their respective insurance regulators and the NAIC. In addition, NAIC regulations define minimum RBC requirements relating to insurance, business, asset and interest rate risks, which are intended to be used by insurance regulators to identify deteriorating or weakly capitalized companies. Separately, some rating agencies have their own capital models that are used to assess capital adequacy as part of the rating process.
Statutory surplus and regulatory or capital requirements may increase or decrease due to a variety of factors, including but not limited to the following: the amount of statutory income generated by our insurance subsidiaries, unrealized gains or losses on equity and certain fixed income holdings, unrealized gains or losses on derivatives, changes in interest rates and equity market levels, changes in the credit quality of our fixed income investments, changes in policy reserves, funding requirements of our pension plan, additional reserve requirements as a result of annually required asset adequacy testing, changes in the capital models or applicable risk factors and changes in statutory accounting rules or regulatory determinations. Most of these factors are outside of our control. One or more of these factors could significantly decrease statutory surplus or increase required RBC. If so, we could experience downgrades, loss of distribution relationships, higher surrenders and increased regulatory supervision.
We may be unsuccessful in our efforts to generate earnings growth in new market segments, particularly the sale of fixed indexed annuities to middle market customers.
We are implementing a business plan that leverages existing product manufacturing strengths and partnering capabilities to focus new business development in areas that are less capital intensive and appeal to distributors with middle market clients. We have limited experience in the middle market and in the design and sale of fixed indexed annuities. These products have required us to institute new processes for ensuring product suitability, executing hedges using derivatives and processing transactions. In addition, the ultimate profitability of these products is significantly influenced by future investment earnings, policy holder behavior and estimates of longevity. If the new risk management processes we designed prove inadequate, or if future investment earnings, policyholder behavior or longevity differs significantly from expectations, our results from operations may be adversely affected and our growth may not be sustained.
24
Our valuation of fixed maturity securities and equity securities may include methodologies, estimations and assumptions that are subject to differing interpretations and could result in changes to investment valuations that may materially and adversely affect our results of operations and financial condition.
We record fixed maturity and equity securities at fair value on our consolidated balance sheets. During periods of market disruption, including periods of significantly rising or high interest rates, rapidly widening credit spreads or illiquidity, the valuation of securities may require the adoption of certain estimates and assumptions. In addition, prices provided by independent broker quotes or independent pricing services that are used in the determination of fair value can vary significantly for a particular security. As a result, valuations may include inputs and assumptions that require greater estimation and judgment as well as valuation methods which are more complex. These values may not be ultimately realizable in a market transaction and may change very rapidly as market conditions change or assumptions are modified. Significant changes in value may have a material adverse effect on our results of operations and financial condition.
In addition, a decline in fair value below the amortized cost of a security requires management to assess whether an other-than-temporary impairment (“OTTI”) has occurred. The decision on whether to record an OTTI or write-down is determined in part by our assessment of the financial condition and prospects of a particular issuer, projections of future cash flows and recoverability of the particular security as well as management’s assertion of whether it is more likely than not that we will sell the securities before recovery. See “Item 7: Management’s Discussion and Analysis of Financial Condition and Results of Operations—Critical Accounting Estimates” in this 2012 Form 10-K for further information regarding our impairment decision-making process. Management’s determination of whether a decline in value is other-than-temporary includes our analysis of the underlying credit and our intention and ability not to have to sell the security, versus the extent and duration of a decline in value. Our conclusions on such assessments may ultimately prove to be incorrect as facts and circumstances change, which could result in a material adverse effect on our results of operation and financial condition.
We may incur losses if our reinsurers are unwilling or unable to meet their obligations under reinsurance agreements. The availability, pricing and terms of reinsurance may not be sufficient to protect us against losses.
We use reinsurance agreements to limit potential losses, reduce exposure to larger risks and provide capital relief with regard to certain reserves. Under these reinsurance arrangements, other insurers assume a portion of our losses and related expenses; however, we remain liable as the direct insurer on all risks reinsured. Consequently, reinsurance arrangements do not eliminate our obligation to pay claims and we assume credit risk with respect to our ability to recover amounts due from our reinsurers. Although we regularly evaluate the financial condition of our reinsurers, the inability or unwillingness of any reinsurer to meet its financial obligations could negatively affect our operating results. In addition, market conditions beyond our control determine the availability and cost of reinsurance. No assurances can be made that reinsurance will remain available to the same extent and on the same terms and rates as have been historically available. If we are unable to maintain our current level of reinsurance or purchase new reinsurance protection in amounts that we consider sufficient and at prices that we consider acceptable, we would have to either accept an increase in our net exposure or develop other alternatives to reinsurance. Any of these alternatives may adversely affect our business, financial condition or operating results.
We might be unable to attract or retain personnel who are key to our business.
The success of our business is dependent to a large extent on our ability to attract and retain key employees. Competition in the job market for senior executives and professionals such as sales personnel, technology professionals, actuaries and investment professionals can be intense. In general, our employees are not subject to employment contracts or non-compete agreements. Difficulty in attracting and retaining employees could have a negative impact on us. Further, for as long as we remain delayed with our SEC reporting obligations, we are likely to continue to experience a certain amount of difficulty attracting and retaining highly qualified personnel, particularly at more senior levels, due to concerns about our status and our ability to use our common stock to retain and motivate employees also will continue to be a challenge and subject to certain restrictions.
Our business operations and results could be adversely affected by inadequate performance of third-party relationships.
We are dependent on certain third-party relationships to maintain essential business operations. These services include, but are not limited to, information technology infrastructure, application systems support, transfer agent and cash management services, custodial services, records storage management, backup tape management, security pricing services, medical information, payroll and employee benefit programs.
25
We periodically negotiate provisions and renewals of these agreements and there can be no assurance that their terms will remain acceptable to such third parties or us. An interruption in our continuing relationship with certain of these third parties or any material delay or inability to deliver essential services could materially affect our business operations and adversely affect our results of operations.
We face strong competition in our businesses from insurance companies and other financial services firms. If we are unable to price our products competitively or provide competitive service we could lose existing customers or fail to attract new customers.
We operate in a highly competitive industry. While there is no single company that we identify as a dominant competitor in our business, many of our competitors are substantially larger and enjoy better financial strength ratings, more financial resources and greater marketing and distribution capabilities. Our products compete with similar products sold by other insurance companies and also with savings and investment products offered by banks, asset managers, and broker-dealers. Larger competitors with better financial strength ratings, greater financial resources, marketing and distribution capabilities are better positioned competitively. Larger firms are also able to better withstand market disruption, offer more competitive pricing and more effectively access debt and equity capital. Moreover, a significant proportion of sales in the life insurance and annuity industries represent exchanges from one company’s to another company’s products. To the extent that a more competitive product alternative with better product features is offered by another company, we could experience higher policy surrenders.
If we fail to compete effectively in this environment, our results of operations and financial condition could be materially and adversely affected.
As a holding company, The Phoenix Companies, Inc., depends on the ability of its subsidiaries to transfer funds to meet its obligations and pay shareholder dividends.
The Phoenix Companies, Inc. is a holding company and has no operations of its own. Its ability to pay interest and principal on outstanding debt obligations and to pay dividends to shareholders and corporate expenses depends primarily upon the surplus and earnings of Phoenix Life and the ability of this subsidiary to pay dividends or to advance or repay funds. Payments of dividends and advances or repayment of funds by Phoenix Life are restricted by the applicable laws and regulations, including laws establishing minimum solvency and liquidity thresholds. Changes to these laws, or the application or implementation of those laws by regulatory agencies, could constrain the ability of PNX to meet its debt obligations and corporate expenses.
We might need to fund deficiencies in our closed block, which would adversely impact results of operations and could also result in a reduction in investments in our ongoing business.
We have allocated assets to our closed block to produce cash flows that, together with additional revenues from the closed block policies, are reasonably expected to support our obligations relating to these policies. Our allocation of assets to the closed block was based on actuarial assumptions about the performance of policies in the closed block and the continuation of the non-guaranteed policyholder dividend scales in effect for 2000, as well as assumptions about the investment earnings the closed block assets will generate over time. Since actual performance is likely to be different from these assumptions, it is possible that the cash flows generated by the closed block assets and the anticipated revenues from the policies included in the closed block will prove insufficient to provide for the benefits guaranteed under these policies even if the non-guaranteed policyholder dividend scale were to be reduced. If this were to occur, we would have to fund the resulting shortfall from assets outside of the closed block, which could adversely affect our results of operations and reduce our ability to invest in other ongoing businesses.
Tax law and policy are frequently reviewed and changed by the Internal Revenue Service and Congress and future changes inlaws or regulations could increase our tax costs and tax assets or make some of our products less attractive to consumers.
Significant and fundamental changes in U.S. federal income tax laws, Treasury and other regulations have been made in recent years and additional changes are likely. Any such change may affect us. Moreover, judicial decisions, regulations or administrative pronouncements could unfavorably affect our tax costs and tax assets or make certain of our products less attractive to consumers.
26
Certain products we offer, primarily life insurance and annuities, receive favorable tax treatment under current federal and state tax law. This favorable treatment may be considered as providing certain of our products a competitive tax advantage over non-insurance products.In particular, for individual owners of life insurance policies and annuity contracts, earnings credited to these policies and contracts are tax-deferred until such time as the amounts are withdrawn from the policies or contracts. This differs from the treatment of dividend or interest earnings on other investments. Moreover, for life insurance, the death benefit proceedsare often received tax-free. While an increasing proportion of our annuity contracts are issued in connection with Individual Retirement Accounts (“IRAs”),for which the tax-deferral benefit is the same regardless of whether the IRA is in connection with an annuity, annuities in IRAs often provide lifetime payout guarantees not offered by other IRA investments.
The tax consequences associated with our products could be altered at any time by legislative, judicial, or administrative action. Any such action that increases the taxation onour products or reduces the taxation on competing products could lessen the advantage or create a disadvantage for certain of our products making them less competitive.
In the recent past, there have been proposals to modify the tax treatment of IRAs, including one that would result in more rapid taxation of after-death distributions. These proposals do not target annuities in IRAs, but would impact all IRAs to the same extent. As a result, many of the competing IRA investment options would also be impacted.
With respect to life insurance company taxation,the administration’s budget proposals in recent years have included changes in the computation of the dividends received deduction relative to both general account and separate account dividends. If enacted, these actions could increase our taxable income and unfavorably impact our tax provision allocated to continuing operations, which would reduce our consolidated net income. The current administration has proposed certain other changes which, if adopted, could have a material adverse effect on our financial positionand our ability to sell our products and could result in the surrender of some existing contracts and policies.
We also benefit from certain tax provisions available to most insurance corporations, including but not limited to, tax-exempt bond interest, dividends-received deductions, tax credits (such as foreign tax credits) and insurance reserve deductions. Congress, as well as foreign, state and local governments, also considers from time to time legislation that could modify or eliminate these benefits, as well as other corporate tax provisions, thereby increasing our tax costs. If such legislation were to be adopted, our consolidated balance sheet and results of operations could be adversely impacted.
We cannot predict whether any relevant tax legislation will be enacted, what the impact of such legislation would be on our tax costs and sales of our products, what the specific terms of any such legislation will be or whether any such legislation would have a material adverse effect on our financial condition and results of operations.
Federal and state regulation may increase our cost of doing business, impose additional reserve or capital requirements, levy financial assessments, or constrain our operating and financial flexibility, any of which could adversely affect our business, results of operations, financial condition or liquidity.
We are subject to extensive laws and regulations administered and enforced by a number of different governmental authorities including state insurance regulators, state securities administrators, the SEC, the New York Stock Exchange, the Financial Industry Regulatory Authority, the U.S. Department of Justice, state attorneys general and foreign regulators. In light of recent events involving certain financial institutions and the last recession, the U.S. government has heightened its oversight of the financial services industry. In addition, it is possible that these authorities may adopt enhanced or new regulatory requirements intended to prevent future crises in the financial services industry and to assure the stability of institutions under their supervision. We cannot estimate whether such regulatory proposals will be adopted, or what impact, if any, such regulation could have on our business, consolidated operating results, financial condition or liquidity.
Each of the authorities that regulates us exercises a degree of interpretive latitude. Consequently, we are subject to the risk that compliance with any particular regulator’s or enforcement authority’s interpretation of a legal issue may not result in compliance with another regulator’s or enforcement authority’s interpretation of the same issue, particularly when compliance is judged in hindsight. In addition, there is risk that any particular regulator’s or enforcement authority’s interpretation of a legal issue may change over time to our detriment, or that changes in the overall legal environment may, even absent any particular regulator’s or enforcement authority’s interpretation of a legal issue changing, cause us to change our views regarding the actions we need to take from a legal risk management perspective, thus necessitating changes to our practices that may, in some cases, limit our ability to grow and improve the profitability of our business.
27
On July 21, 2010, the President signed into law the Dodd-Frank Wall Street Reform and Consumer Protection Act (the “Act”), which implements significant changes in the financial regulatory landscape and will impact institutions operating in many segments of the financial services industry, including the Company. Although certain provisions became effective immediately, many of the Act’s provisions require adoption of rules that will govern implementation. The Act may, among other things, increase our regulatory compliance burden by requiring us to invest management attention and resources to evaluate and make necessary changes to our policies and procedures and the manner in which we conduct our business. The U. S. government has created the Federal Insurance Office (“FIO”) under the Act as a branch of the U. S. Treasury Department. Under its charge to improve consumer protection, the FIO may regulate actual product design and mandate additional disclosure rules. We are uncertain as to the impact that this new legislation and regulatory guidance will have on the Company and cannot assure that it will not adversely affect our financial condition and results of operations.
State insurance laws regulate most aspects of our U.S. insurance businesses, and our insurance subsidiaries are regulated by the insurance departments of the states in which they are domiciled and licensed. State insurance regulators and the NAIC regularly re-examine existing laws and regulations applicable to insurance companies and their products. State laws in the U.S. grant insurance regulatory authorities broad administrative powers with respect to, among other things:
·
Financial considerations, including standards of solvency, statutory reserves, reinsurance and capital adequacy;
·
Trade practices, market conduct and licensing of companies and agents;
·
Mandating certain insurance benefits and regulating certain premium rates;
·
Approval of policy forms and certain other related materials;
·
Permitted types and concentration of investments;
·
Permitted dividends or other distributions, as well as transactions between affiliates and changes in control; and
·
Approval of interest payments on surplus notes.
Changes in these laws and regulations, or in interpretations thereof, are often made for the benefit of the consumer at the expense of the insurer and thus could have a material adverse effect on our business, consolidated operating results, financial condition and liquidity. Compliance with these laws and regulations is also time consuming and personnel-intensive, and changes in these laws and regulations may increase our direct and indirect compliance costs and other expenses of doing business, thus having an adverse effect on our business, consolidated operating results, financial condition and liquidity.
Regulatory actions or examinations could result in financial losses or harm to our businesses.
Various regulatory bodies regularly make inquiries of us and, from time to time, conduct examinations or investigations concerning our compliance with, among other things, insurance laws, securities laws and laws governing the activities of broker-dealers. During the past several years, there has been a significant increase in federal and state regulatory activity relating to financial services companies, with a number of recent regulatory inquiries focusing on valuation and COI increase issues. Financial services companies also have been the subject of broad industry inquiries by state regulators and attorneys general which do not appear to be company-specific, such as business practices upon notification of death. We continue to cooperate with the applicable regulatory authorities in these matters. We may be subject to further related or unrelated inquiries or actions in the future. In light of recent events involving certain financial institutions, the U.S. government has heightened its oversight of the financial services industry in general and of the insurance industry in particular. Further, recent adverse economic and market events may have the effect of encouraging litigation, arbitration and regulatory action in response to the increased frequency and magnitude of investment losses, which may result in unfavorable judgments, awards and settlements, regulatory fines and an increase in our related legal expenses.
It is not feasible to predict or determine the ultimate outcome of regulatory proceedings or to provide reasonable ranges of potential losses. We believe that the outcomes of regulatory matters are not likely, either individually or in the aggregate, to have a material adverse effect on our consolidated financial condition. However, given the inherent unpredictability of regulatory matters, it is possible that an adverse outcome in certain matters could, from time to time, have a material adverse effect on our consolidated financial statements in particular quarterly or annual periods.
28
We could have material losses in the future from our discontinued reinsurance business.
In 1999, we discontinued our reinsurance operations through a combination of sale, reinsurance and placement of certain retained group accident and health reinsurance business into run-off. We adopted a formal plan to stop writing new contracts covering these risks and to end the existing contracts as soon as those contracts would permit. However, we remain liable for claims under contracts which have not been commuted.
We have established reserves for claims and related expenses that we expect to pay on our discontinued group accident and health reinsurance business. These reserves are based on currently known facts and estimates about, among other things, the amount of insured losses and expenses that we believe we will pay, the period over which they will be paid, the amount of reinsurance we believe we will collect from our retrocessionaires and the likely legal and administrative costs of winding down the business.
We expect our reserves and reinsurance to cover the run-off of the business; however, the nature of the underlying risks is such that the claims may take years to reach the reinsurers involved. Therefore, we expect to pay claims out of existing estimated reserves as the level of business diminishes. In addition, unfavorable or favorable claims and/or reinsurance recovery experience is reasonably possible and could result in our recognition of additional losses or gains in future years. In establishing our reserves described above for the payment of insured losses and expenses on this discontinued business, we have made assumptions about the likely outcome of the disputes referred to above, including an assumption that substantial recoveries would be available from our reinsurers on all of our discontinued reinsurance business. However, the inherent uncertainty of arbitrations and lawsuits, including the uncertainty of estimating whether any settlements we may enter into in the future would be on favorable terms, makes it hard to predict outcomes with certainty. Given the need to use estimates in establishing loss reserves, our actual net ultimate exposure likely will differ from our current estimate. If future facts and circumstances differ significantly from our estimates and assumptions about future events with respect to our discontinued reinsurance business, our current reserves may need to be increased materially, with a resulting material adverse effect on our results of operations and financial condition.
Changes in accounting standards issued by the Financial Accounting Standards Board or other standard-setting bodies may adversely affect our financial statements.
Our financial statements are subject to the application of U.S. GAAP, which is periodically revised and/or expanded. Accordingly, from time to time we are required to adopt new or revised accounting standards or guidance issued by recognized authoritative bodies, including the Financial Accounting Standards Board.
It is possible that future accounting standards which we are required to adopt could change the current accounting treatment that we apply to our consolidated financial statements and that such changes could significantly affect our reported financial condition and results of operations. See Note 3 to our consolidated financial statements under “Item 8: Financial Statements and Supplementary Data—Adoption of New Accounting Standards” in this 2012 Form 10-K for more information.
Item 1B.
Unresolved Staff Comments
As of December 31, 2012, the Company had no unresolved SEC staff comments regarding its periodic or current reports.
Item 2.
Properties
Our executive headquarters consist of our main office building at One American Row in Hartford, Connecticut, which we own and occupy. We also lease space in two garages in Hartford, Connecticut for employee parking. Property is also leased for our home office in East Greenbush, New York.
29
Item 3.
Legal Proceedings
The Company is regularly involved in litigation and arbitration, both as a defendant and as a plaintiff. The litigation and arbitration naming the Company as a defendant ordinarily involves our activities as an insurer, employer, investor, investment advisor or taxpayer.
It is not feasible to predict or determine the ultimate outcome of all legal or arbitration proceedings or to provide reasonable ranges of potential losses. It is believed that the outcome of our litigation and arbitration matters are not likely, either individually or in the aggregate, to have a material adverse effect on the financial condition of the Company. However, given the large or indeterminate amounts sought in certain of these matters and the inherent unpredictability of litigation and arbitration, it is possible that an adverse outcome in certain matters could, from time to time, have a material adverse effect on the results of operations or cash flows in particular quarterly or annual periods.
SEC Cease-and-Desist Order
On February 12, 2014, the Company and PHLVIC submitted an Offer of Settlement with the SEC pursuant to which the Company and PHLVIC consented to the issuance of the form of an Order Instituting Cease-and-Desist Proceedings Pursuant to Section 21C of the Securities Exchange Act of 1934, Making Findings, and Imposing a Cease-and-Desist Order (the “Order”). The Order was approved by the SEC on March 21, 2014. Pursuant to the Order, the Company and PHLVIC have been directed to cease and desist from committing or causing any violations and any future violations of Section 13(a) of the Exchange Act and Rules 13a-1, 13a-13 thereunder and Section 15(d) of the Exchange Act and Rules 15d-1 and 15d-13 thereunder. In addition, the Company and PHLVIC agreed to perform certain undertakings, including for the Company to file its delayed Third Quarter 2012 Form 10-Q by no later than April 15, 2014 and its 2013 Form 10-K by no later than June 4, 2014. Also pursuant to the undertakings, the Company would file its 2013 Forms 10-Q after the filing of its 2013 Form 10-K. The Company intends to become timely with its periodic filings under the Exchange Act with the filing of its Quarterly Report on Form 10-Q for the period ending June 30, 2014. Finally, the Company and PHLVIC paid a civil monetary penalty in the amount of $375,000 to the United States Treasury following the entry of the Order.
Cases Brought by Policy Investors
On July 29, 2013, Wilmington Savings Fund Society, FSB, as successor in interest to Christiana Bank & Trust Company and as trustee of 59 unnamed trusts, filed a second amended complaint against Phoenix Life and PHLVIC in the United States District Court for the District of Delaware (the case was initially brought on June 5, 2012 in its original venue, the Central District of California, and had been transferred to Delaware by order dated March 28, 2013) (C.A. No. 13-499-RGA). On August 2, 2012, Lima LS PLC filed a complaint against the Company, Phoenix Life, PHLVIC, James D. Wehr, Philip K. Polkinghorn, Edward W. Cassidy, Dona D. Young and other unnamed defendants in the United States District Court for the District of Connecticut (Case No. CV12-01122). On July 1, 2013, the defendants’ motion to dismiss the complaint was granted in part and denied in part. Thereafter, on July 31, 2013, the plaintiff served an amended complaint against the same defendants, with the exception that Mr. Cassidy was dropped as a defendant.
In both cases, the plaintiffs allege that Phoenix Life and PHLVIC promoted certain policy sales knowing that the policies would ultimately be owned by investors and then challenging the validity of these policies or denying claims submitted on these policies. In the Lima LS plc case, the plaintiff claims that the Company, Phoenix Life and PHLVIC engaged in anticompetitive conduct in an attempt to monopsonize the secondary market for Phoenix Life and PHLVIC policies. Plaintiffs in both cases are seeking damages, including punitive and treble damages, attorneys’ fees and a declaratory judgment. We believe we have meritorious defenses against the lawsuits and we intend to vigorously defend against these claims. The outcome of these litigations and any potential losses are uncertain.
Cost of Insurance Cases
By order dated July 12, 2013, two separate classes were certified in an action pending in the United States District Court for the Southern District of New York (C.A. No. 1:11-cv-08405-CM-JCF (U.S. Dist. Ct; S.D.N.Y.)) brought by Martin Fleisher and another plaintiff (the “Fleisher Litigation”), on behalf of themselves and others similarly situated, against Phoenix Life. The complaint in the Fleisher Litigation, filed on November 18, 2011, challenges two COI rate adjustments implemented by Phoenix Life, which Phoenix Life maintains were based on policy language permitting such adjustments. The complaint seeks damages for breach of contract. The classes certified in the court’s July 12, 2013 order are limited to holders of Phoenix Life policies issued in New York and subject to New York law.
30
Phoenix Life’s subsidiary, PHLVIC, has been named as a defendant in four actions challenging its COI rate adjustments implemented concurrently with the Phoenix Life adjustments. These four cases, which are not styled as class actions, have been brought against PHLVIC by (1) Tiger Capital LLC (C.A. No. 1:12-cv- 02939-CM-JCF; U.S. Dist. Ct; S.D.N.Y., complaint filed on March 14, 2012; the “Tiger Capital Litigation”) and (2-4) U.S. Bank National Association, as securities intermediary for Lima Acquisition LP ((2: C.A. No. 1:12-cv-06811-CM-JCF; U.S. Dist. Ct; S.D.N.Y., complaint filed on November 16, 2011; 3: C.A. No. 1:13-cv-01580-CM-JCF; U.S. Dist. Ct; S.D.N.Y., complaint filed on March 8, 2013; collectively, the “U.S. Bank N.Y. Litigations”)); and 4: C.A. No. 1:13-cv-00368-GMS; U.S. Dist. Ct; D. Del., complaint filed on March 6, 2013; the “Delaware Litigation”). The Tiger Capital Litigation and the two U.S. Bank N.Y. Litigations have been assigned to the same judge as the Fleisher Litigation, and discovery in these four actions is being coordinated by the court; the Delaware Litigation is proceeding separately. The plaintiffs seek damages and attorneys’ fees for breach of contract and other common law and statutory claims.
Complaints to state insurance departments regarding PHLVIC’s COI rate adjustments have also prompted regulatory inquiries or investigations in several states, with two of such states (California and Wisconsin) issuing letters directing PHLVIC to take remedial action in response to complaints by a single policyholder. PHLVIC disagrees with both states’ positions and, on April 30, 2013, Wisconsin commenced an administrative hearing to obtain a formal ruling on its position, which is pending (OCI Case No. 13- C35362).
Phoenix Life and PHLVIC believe that they have meritorious defenses against all of these lawsuits and regulatory directives and intend to vigorously defend against them. The outcome of these matters is uncertain and any potential losses cannot be reasonably estimated.
On April 17, 2013, Robert Strougo, et al. filed a complaint against the Company, James D. Wehr and Peter A. Hofmann in the United States District Court for the District of Connecticut (Case No. 13-CV-547-RNC) (the “Strougo Litigation”). On November 1, 2013, the plaintiff filed an amended complaint joining Michael E. Hanrahan as an additional individual defendant. The plaintiff seeks to recover on behalf of himself and a class defined as all persons (other than the defendants) who purchased or otherwise acquired the Company’s securities between May 5, 2009 and August 14, 2013 for claims arising out of the Company’s announced intent to restate previously filed financial statements. The plaintiff alleges that, throughout the class period, the Company made materially false and misleading statements regarding the Company’s business, operational and compliance policies. The plaintiff seeks damages, attorneys’ fees and other litigation costs. We believe we have meritorious defenses against the lawsuit and we intend to vigorously defend against these claims. The outcome of this litigation is uncertain and any potential losses cannot be reasonably estimated.
Tiptree Financial Partners, LP, Indemnification
The definitive agreement to sell PFG contains a provision requiring us to indemnify Tiptree Financial Partners, LP (“Tiptree”) for any losses due to actions resulting from certain specified acts or omissions associated with the divested business prior to closing. There has been litigation filed that falls within this provision of the agreement but does not name the Company as a party to the litigation. We intend to defend these matters vigorously based on our indemnity commitment.
In September 2009, Carol Curran, et al. filed a putative class action complaint against certain subsidiaries of the Company, including AGL Life Assurance Company and Phoenix Equity Planning Corporation, as well as an officer of such subsidiaries, and two unrelated parties (Agile Group, LLC and Neal Greenberg), in the District Court (state court), Boulder County, Colorado (Case Number 2009CV907). Plaintiffs asserted claims for relief arising under Colorado statutory and common law and sought to recover damages, including punitive and treble damages, attorneys’ fees and a declaratory judgment. While the case was pending, the Company sold the subsidiaries named in the action and agreed to indemnify such subsidiaries and the officer in the action. This case was settled in the second quarter of 2013 and was resolved without material impact on the consolidated financial results of the Company.
Notice of Claim from Reinsurer
On June 6, 2012, one of the reinsurers of a Company insurance subsidiary provided notice of a claim, seeking relief under two treaties. This matter was settled effective July 1, 2013 and was resolved without material impact on the consolidated financial results of the Company.
Item 4.
Mine Safety Disclosures
Not applicable.
31
PART II
Item 5.
Market for Registrant’s Common Equity, Related Stockholder Matters and Issuer Purchases of Equity Securities
Market
Shares of our common stock trade on the New York Stock Exchange under the ticker symbol “PNX”. As of March 26, 2014, there were 98,514 registered holders of our common stock.
Unregistered Shares
We issued the following shares of common stock to eligible policyholders of Phoenix Life, effective as of June 25, 2001, in connection with Phoenix Life’s demutualization on that date: 2,808,719 shares in 2001 and 275 shares in the 11 years ended December 31, 2012. We issued these shares in exchange for their membership interests without registration in reliance on an applicable exemption from registration under the Securities Act of 1933, as amended.
Throughout 2012, we issued an aggregate of 16,497 restricted stock units (“RSUs”) to seven of our nine independent directors in lieu of current compensation as elected by the directors, without registration in reliance on an applicable exemption from registration under Section 4(2) and Regulation D of the Securities Act of 1933 as amended. Each of the RSUs is potentially convertible into one share of our common stock.
Please note that these share and RSU amounts for all periods reflect the 1-for-20 reverse stock split, which was effective August 10, 2012.See Note 11 to our consolidated financial statements under “Item 8: Financial Statements and Supplementary Data” in this Annual Report on Form 10-K for additional information on the reverse stock split.
Securities Authorized for Issuance Under Equity Compensation Plans
The Company has compensation plans under which equity securities of the Company are authorized for issuance. See “Item 12: Security Ownership of Certain Beneficial Owners and Management and Related Stockholder Matters” in this Annual Report on Form 10-K.
Stock Price
The following table presents the intraday high and low per share prices for our common stock on the New York Stock Exchange for each fiscal quarter during the years 2012 and 2011. The closing price of our common stock was $24.73 per share at December 31, 2012.
| | | | | | | | | | | | | |
| 2012(1) | | 2011(1) |
| High | | Low | | High | | Low |
| | | | | | | | | | | |
First Quarter | $ | 53.80 | | $ | 32.40 | | $ | 57.20 | | $ | 43.60 |
Second Quarter | $ | 49.40 | | $ | 29.20 | | $ | 55.40 | | $ | 41.60 |
Third Quarter | $ | 37.20 | | $ | 26.00 | | $ | 51.20 | | $ | 23.80 |
Fourth Quarter | $ | 31.31 | | $ | 20.51 | | $ | 42.40 | | $ | 19.40 |
———————
(1)
All share amounts for all periods reflect the 1-for-20 reverse stock split, which was effective August 10, 2012. See Note 11 to our consolidated financial statements under “Item 8: Financial Statements and Supplementary Data” in this Annual Report on Form 10-K for additional information on the reverse stock split.
Dividends
In 2012, 2011 and 2010, we did not pay any stockholder dividends.
32
Stock Performance
The following graph compares the cumulative total return on PNX Common Stock with the cumulative total returns of the Standard & Poor’s 500 Stock Index and the Standard & Poor’s 500 Life and Health Insurance Index for the period December 31, 2007 through December 31, 2012.
The indices assume that $100 was invested on December 31, 2007, with dividends being reinvested.
Cumulative Total Return
December 31, 2007 through December 31, 2012
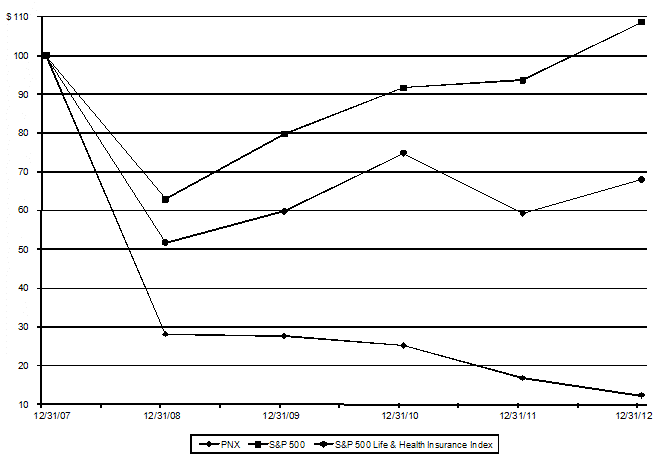
Item 6.
Selected Financial Data
Our selected historical consolidated financial data as of and for each of the five years in the period ended December 31, 2012 is reflected in the schedule that follows. We obtained the balance sheet data for the years ended December 31, 2012 and 2011 and the income statement data for the years ended December 31, 2012, 2011 and 2010 from our amended and restated audited consolidated financial statements in this Annual Report on Form 10-K. The selected consolidated financial data as of and for the years ended December 31, 2009 and 2008 has been obtained from our restated unaudited consolidated financial statements which are not contained in this report. The financial information as of and for the years ended December 31, 2009 and 2008 has been restated to reflect adjustments to our financial statements as discussed in “Explanatory Note” in the forepart of this report, in “Item 7: Management’s Discussion and Analysis of Financial Condition and Results of Operations” and in Note 2, “Restatement and Amendment of Previously Reported Financial Information” under “Item 8: Financial Statements and Supplementary Data” in this Annual Report on Form 10-K. Our historical results should not be viewed as indicative of results expected for any future period.
33
We prepared the following financial data, other than statutory data, in conformity with U.S. GAAP. We derived the statutory data from the Annual Statements of our Life Companies as filed with state insurance regulatory authorities and prepared it in accordance with statutory accounting practices prescribed or permitted by state insurance regulators, which vary in certain material respects from U.S. GAAP.
The following should be read in conjunction with “Item 7: Management’s Discussion and Analysis of Financial Condition and Results of Operations” and our consolidated financial statements in this Annual Report on Form 10-K.
| | | | | | | | | | | | | | |
Selected Financial Data: | Years Ended December 31, |
($ in millions, except per share data) | 2012 | | 2011(1) | | 2010(1) | | 2009(2) | | 2008(2) |
| | | As restated and amended | | As restated and amended | | As restated and amended | | As restated and amended |
|
Income Statement Data(3) | | | | | | | | | | | | | | |
Premiums | $ | 402.3 | | $ | 448.7 | | $ | 507.5 | | $ | 563.8 | | $ | 755.4 |
Fee income | | 556.2 | | | 596.8 | | | 633.5 | | | 647.6 | | | 598.0 |
Net investment income | | 829.3 | | | 822.9 | | | 840.5 | | | 783.9 | | | 911.4 |
Net realized investment gains (losses): | | | | | | | | | | | | | | |
Total OTTI losses | | (51.7) | | | (65.3) | | | (107.3) | | | (210.3) | | | (245.7) |
Portion of OTTI losses recognized in
other comprehensive income (“OCI”) | | 22.9 | | | 38.5 | | | 58.7 | | | 102.1 | | | — |
Net OTTI losses recognized in earnings | | (28.8) | | | (26.8) | | | (48.6) | | | (108.2) | | | (245.7) |
Net realized investment gains (losses), excluding OTTI losses | | 18.3 | | | (5.3) | | | 37.4 | | | 12.7 | | | (75.0) |
Net realized investment losses | | (10.5) | | | (32.1) | | | (11.2) | | | (95.5) | | | (320.7) |
Gain on debt repurchase | | 11.9 | | | 0.2 | | | — | | | 15.4 | | | 6.1 |
Total revenues | $ | 1,789.2 | | $ | 1,836.5 | | $ | 1,970.3 | | $ | 1,915.2 | | $ | 1,950.2 |
Total benefits and expenses | $ | 1,945.2 | | $ | 1,833.8 | | $ | 2,011.9 | | $ | 1,987.7 | | $ | 2,207.6 |
| | | | | | | | | | | | | | |
Income (loss) from continuing operations | $ | (152.3) | | $ | (9.6) | | $ | (31.3) | | $ | (283.6) | | $ | (153.4) |
Loss from discontinued operations, net of income taxes | | (15.6) | | | (21.6) | | | (3.6) | | | (121.8) | | | (520.6) |
Net loss | | (167.9) | | | (31.2) | | | (34.9) | | | (405.4) | | | (674.0) |
Less: Net income (loss) attributable to noncontrolling interests | | 0.6 | | | (0.5) | | | (0.5) | | | 1.7 | | | — |
Net loss attributable to The Phoenix Companies, Inc. | $ | (168.5) | | $ | (30.7) | | $ | (34.4) | | $ | (407.1) | | $ | (674.0) |
| | | | | | | | | | | | | | |
Basic Loss Per Share(4) | | | | | | | | | | | | | | |
Loss from continuing operations | $ | (26.40) | | $ | (1.65) | | $ | (5.39) | | $ | (48.70) | | $ | (26.62) |
Net loss attributable to The Phoenix Companies, Inc. | $ | (29.20) | | $ | (5.28) | | $ | (5.93) | | $ | (69.90) | | $ | (116.95) |
Diluted Loss Per Share(4) | | | | | | | | | | | | | | |
Loss from continuing operations | $ | (26.40) | | $ | (1.65) | | $ | (5.39) | | $ | (48.70) | | $ | (26.62) |
Net loss attributable to The Phoenix Companies, Inc. | $ | (29.20) | | $ | (5.28) | | $ | (5.93) | | $ | (69.90) | | $ | (116.95) |
| | | | | | | | | | | | | | |
Dividends per share | $ | — | | $ | — | | $ | — | | $ | — | | $ | 3.20 |
| | | | | | | | | | | | | | |
Balance Sheet Data | | | | | | | | | | | | | | |
Cash and investments | $ | 16,228.1 | | $ | 15,291.7 | | $ | 14,210.9 | | $ | 13,708.7 | | $ | 13,772.6 |
Total assets | $ | 21,629.8 | | $ | 21,488.0 | | $ | 21,113.2 | | $ | 24,628.2 | | $ | 26,056.0 |
Indebtedness | $ | 378.8 | | $ | 426.9 | | $ | 427.7 | | $ | 428.0 | | $ | 458.0 |
Total liabilities | $ | 21,119.3 | | $ | 20,792.3 | | $ | 20,312.8 | | $ | 23,845.8 | | $ | 25,479.4 |
Total stockholders’ equity | $ | 510.5 | | $ | 695.7 | | $ | 800.4 | | $ | 782.4 | | $ | 576.6 |
| | | | | | | | | | | | | | |
Combined Statutory Data | | | | | | | | | | | | | | |
Premiums, deposits and fees (5) | $ | 1,379.0 | | $ | 1,508.0 | | $ | 1,226.1 | | $ | 1,201.5 | | $ | 2,400.4 |
Net income (loss) | $ | 208.7 | | $ | 157.9 | | $ | 188.1 | | $ | (148.4) | | $ | (267.4) |
Capital and surplus (6) | $ | 793.6 | | $ | 728.8 | | $ | 658.5 | | $ | 517.2 | | $ | 758.9 |
Asset valuation reserve (“AVR”) (7) | | 136.4 | | | 124.2 | | | 108.0 | | | 59.7 | | | 94.8 |
Capital, surplus and AVR | $ | 930.0 | | $ | 853.0 | | $ | 766.5 | | $ | 576.9 | | $ | 853.7 |
34
| | | | | | | | | | | | | | | | | | |
Selected Financial Data: | Years Ended December 31, |
($ in millions, except per share data) | 2009 | | 2008 |
| As restated and amended | | As previously reported | | As restated and amended | | As previously reported |
|
Income Statement Data(3) | | | | | | | | | | | |
Premiums | $ | 563.8 | | $ | 583.9 | | $ | 755.4 | | $ | 765.9 |
Fee income | | 647.6 | | | 648.1 | | | 598.0 | | | 601.3 |
Net investment income | | 783.9 | | | 786.7 | | | 911.4 | | | 912.5 |
Net realized investment gains (losses): | | | | | | | | | | | |
Total OTTI losses | | (210.3) | | | (201.5) | | | (245.7) | | | (245.0) |
Portion of OTTI losses recognized in OCI | | 102.1 | | | 93.1 | | | — | | | — |
Net OTTI losses recognized in earnings | | (108.2) | | | (108.4) | | | (245.7) | | | (245.0) |
Net realized investment losses, excluding OTTI losses | | 12.7 | | | 6.2 | | | (75.0) | | | (50.8) |
Net realized investment losses | | (95.5) | | | (102.2) | | | (320.7) | | | (295.8) |
Gain on debt repurchase | | 15.4 | | | — | | | 6.1 | | | — |
Total revenues | $ | 1,915.2 | | $ | 1,916.5 | | $ | 1,950.2 | | $ | 1,983.9 |
Total benefits and expenses | $ | 1,987.7 | | $ | 2,003.6 | | $ | 2,207.6 | | $ | 2,279.2 |
| | | | | | | | | | | |
Loss from continuing operations | $ | (283.6) | | $ | (196.0) | | $ | (153.4) | | $ | (176.8) |
Loss from discontinued operations, net of income taxes | | (121.8) | | | (123.0) | | | (520.6) | | | (549.2) |
Net loss | | (405.4) | | | (319.0) | | | (674.0) | | | (726.0) |
Less: Net income (loss) attributable to noncontrolling interests | | 1.7 | | | — | | | — | | | — |
Net loss attributable to The Phoenix Companies, Inc. | $ | (407.1) | | $ | (319.0) | | $ | (674.0) | | $ | (726.0) |
| | | | | | | | | | | |
Basic Loss Per Share(4) | | | | | | | | | | | |
Loss from continuing operations | $ | (48.70) | | $ | (33.65) | | $ | (26.62) | | $ | (30.91) |
Net loss attributable to The Phoenix Companies, Inc. | $ | (69.90) | | $ | (54.77) | | $ | (116.95) | | $ | (126.95) |
Diluted Loss Per Share(4) | | | | | | | | | | | |
Loss from continuing operations | $ | (48.70) | | $ | (33.65) | | $ | (26.62) | | $ | (30.91) |
Net loss attributable to The Phoenix Companies, Inc. | $ | (69.90) | | $ | (54.77) | | $ | (116.95) | | $ | (126.95) |
| | | | | | | | | | | |
Dividends per share | $ | — | | $ | — | | $ | 3.20 | | $ | 3.20 |
| | | | | | | | | | | |
Balance Sheet Data | | | | | | | | | | | |
Cash and investments | $ | 13,708.7 | | $ | 13,736.9 | | $ | 13,772.6 | | $ | 13,755.9 |
Total assets | $ | 24,628.2 | | $ | 24,586.2 | | $ | 26,056.0 | | $ | 25,808.6 |
Indebtedness | $ | 428.0 | | $ | 428.0 | | $ | 458.0 | | $ | 458.0 |
Total liabilities | $ | 23,845.8 | | $ | 23,455.1 | | $ | 25,479.4 | | $ | 24,943.5 |
Total stockholders’ equity | $ | 782.4 | | $ | 1,131.1 | | $ | 576.6 | | $ | 865.1 |
———————
(1)
See Note 2 to our consolidated financial statements under “Item 8: Financial Statements and Supplementary Data” in this Annual Report on Form 10-K for additional information regarding previously reported amounts for 2011 and 2010.
(2)
See table above for information regarding previously reported amounts for 2009 and 2008.
(3)
The reclassification of PFG and PLARNY to discontinued operations has been reflected for all years.
(4)
All share amounts for all periods reflect the 1-for-20 reverse stock split, which was effective August 10, 2012. See Note 11 to our consolidated financial statements under “Item 8: Financial Statements and Supplementary Data” in this Annual Report on Form 10-K for additional information on the reverse stock split
(5)
Premiums, deposits and fees for 2011 include a reduction in premiums (ceded premiums) of $2,930.8 million related to the initial consideration of the Nomura closed block treaty. This was offset by $2,637.8 million for modified coinsurance (“MODCO”) reserve adjustments, which also flow through revenue and are offset in this line item. The remaining $293.0 million offset for the coinsurance portion was presented through benefits (ceded reserves).
(6)
In accordance with accounting practices prescribed by the NYDFS, Phoenix Life’s capital and surplus includes $126.1 million, $174.2 million, $174.1 million, $174.1 million and $174.1 million of surplus notes outstanding at December 31, 2012, 2011, 2010, 2009 and 2008, respectively.
(7)
Amounts include both the Phoenix Life and PHLVIC asset valuation reserve (“AVR”). AVR is a statutory reserve intended to mitigate changes to the balance sheet as a result of fluctuations in asset values.
35
Item 7.
Management’s Discussion and Analysis of Financial Condition and Results of Operations
FORWARD-LOOKING STATEMENTS
The discussion in this Annual Report on Form 10-K may contain “forward-looking statements” within the meaning of the Private Securities Litigation Reform Act of 1995. We intend for these forward-looking statements to be covered by the safe harbor provisions of the federal securities laws relating to forward-looking statements. These forward-looking statements include statements relating to trends in, or representing management’s beliefs about our future transactions, strategies, operations and financial results and often contain words such as “will,” “anticipate,” “believe,” “plan,” “estimate,” “expect,” “intend,” “is targeting,” “may,” “should” and other similar words or expressions. Forward-looking statements are made based upon management’s current expectations and beliefs concerning trends and future developments and their potential effects on us. They are not guarantees of future performance. Our actual business, financial condition or results of operations may differ materially from those suggested by forward-looking statements as a result of risks and uncertainties which include, among others: (A) risks related to the Restatement, failure to file timely periodic reports with the SEC and our internal control over financial reporting, which include (i) the potential failure to remediate material weaknesses in our internal control over financial reporting and other material weaknesses may be identified in the future, which would adversely affect the accuracy and timing of our financial reporting; (ii) the extraordinary processes undertaken to effect the Restatement may not have been adequate to identify and correct all errors in our historical financial statements and, as a result, we may discover additional errors and our financial statements remain subject to the risk of future restatement; (iii) our failure to have current financial information available; (iv) the risk of failure to comply with the filing deadlines included in the SEC’s Cease-and-Desist Order, dated March 21, 2014, including that the SEC may seek sanctions against or deregister the Company and PHLVIC; (v) the risk of failure to file our delayed SEC filings by March 16, 2015, the extended deadline for providing these delayed SEC filings to the bond trustee, as well as the risk associated with seeking additional consents from bondholders of our outstanding 7.45% Quarterly Interest Bonds Due 2032 regarding these delayed filings; (vi) the risk that the delay in filing our annual report and any failure to satisfy other NYSE listing requirements could cause the NYSE to commence suspension or delisting procedures with respect to our securities, including our common stock; (vii) the outcome of litigation and claims as well as regulatory examinations, investigations, proceedings and orders arising out of the Restatement and the failure by the Company and PHLVIC to file SEC reports on a timely basis; (viii) further downgrades or withdrawals of our debt or financial strength credit ratings, which could increase policy surrenders and withdrawals, adversely affect our relationships with distributors, reduce new sales, limit our ability to trade in derivatives and increase our costs of, or reduce our access to, future borrowings; (ix) our inability to hedge our positions due to our inability to replace hedges as a result of our credit rating; (x) the incurrence of significant Restatement-related expenses; (xi) diversion of management and other human resources attention from the operation of our business; (xii) our inability to access alternate financing arrangements to fund our ongoing operations and our inability to register securities for offer and sale with the SEC under the Securities Act until we have filed the delayed SEC filings and are otherwise current with our relevant SEC filing obligations; (xiii) risks associated with our insurance company subsidiaries’ delay in completing their respective U.S. GAAP financial statement restatements and PHLVIC’s delay in its SEC reporting obligations; and (xiv) risks associated with our insurance company subsidiaries’ failure to file certain reports with state regulatory authorities; (B) risks related to our business, which include (i) unfavorable general economic developments including, but not limited to, specific related factors such as the performance of the debt and equity markets; (ii) the potential adverse effect of interest rate fluctuations on our business and results of operations; (iii) the potential adverse effect of legal actions and proceedings inherent in our business on our results of operations, financial position, business or reputation; (iv) the impact on our results of operations and financial condition of any required increase in our reserves for future policyholder benefits and claims if such reserves prove to be inadequate; (v) the possibility that mortality rates, persistency rates, funding levels or other factors may differ significantly from our assumptions used in pricing products; (vi) the effect of guaranteed benefits within our products; (vii) potential exposure to unidentified or unanticipated risk that could adversely affect our businesses or result in losses; (viii) the consequences related to variations in the amount of our statutory capital could adversely affect our business; (ix) the possibility that we may not be successful in our efforts to implement a business plan focused on new market segments; (x) changes in our investment valuations based on changes in our valuation methodologies, estimations and assumptions; (xi) the availability, pricing and terms of reinsurance coverage generally and the inability or unwillingness of our reinsurers to meet their obligations to us specifically; (xii) our ability to attract and retain key personnel in a competitive environment and while delayed in our SEC reporting obligations; (xiii) our dependence on third parties to maintain critical business and administrative functions; (xiv) the strong competition we face in our business from banks, insurance companies and other financial services firms; (xv) our reliance, as a holding company, on dividends and other payments from our subsidiaries to meet our financial obligations and pay future dividends, particularly since our insurance subsidiaries’ ability to pay dividends is subject to regulatory restrictions; (xvi) the potential need to fund deficiencies in our closed block; (xvii) changes in tax law and policy may affect us directly or indirectly through the cost of, the demand for or profitability of our products or services; (xviii) the possibility that federal and state regulation may increase our cost of doing business, impose additional reserve or capital requirements, levy financial assessments or constrain our operating and financial flexibility; (xix) regulatory actions or examinations may harm our business; (xx) potential future material losses from our discontinued reinsurance business; and (xxi) changes in accounting standards; and (C) other risks and uncertainties described herein or in any of our filings with the SEC. Certain other factors which may impact our business, financial condition or results of operations or which may cause actual results to differ from such forward-looking statements are discussed or included in our periodic reports filed with the SEC and are available on our website at www.phoenixwm.com under “Investor Relations.” You are urged to carefully consider all such factors. We do not undertake or plan to update or revise forward-looking statements to reflect actual results, changes in plans, assumptions, estimates or projections, or other circumstances occurring after the date of this Form 10-K, even if such results changes or circumstances make it clear that any forward-looking information will not be realized. If we make any future public statements or disclosures which modify or impact any of the forward-looking statements contained in or accompanying this Form 10-K, such statements or disclosures will be deemed to modify or supersede such statements in this Form 10-K.
36
MANAGEMENT’S DISCUSSION AND ANALYSIS
Management’s discussion and analysis reviews our consolidated financial condition at December 31, 2012 and 2011; our consolidated results of operations for the years 2012, 2011 and 2010; and, where appropriate, factors that may affect our future financial performance. This discussion should be read in conjunction with “Item 6: Selected Financial Data” and our consolidated financial statements in this Annual Report on Form 10-K.
During the preparation of the Company’s Form 10-Q for the period ended September 30, 2012, certain errors were identified in the Company’s consolidated statement of cash flows for the nine months ended September 30, 2012, as well as for previously reported periods. The Company filed a Current Report on Form 8-K with the SEC on November 8, 2012 (as was amended by Forms 8-K/A filed by the Company on March 15, 2013 and April 24, 2013, respectively) disclosing its conclusion that certain of its previously issued annual audited and interim unaudited financial statements contained in its historical Annual Reports on Form 10-K and Quarterly Reports on Form 10-Q should no longer be relied upon and should be restated. During the restatement process, the Company identified and corrected material errors, made certain reclassifications and adjustments to correct previously identified non-material out of period errors and corrected errors in retrospectively adopted amended accounting guidance. The impact of the restatement on the Company���s consolidated financial statements is detailed in Note 2 “Restatement and Amendment of Previously Reported Financial Information” to our consolidated financial statements and under “Item 8: Financial Statements and Supplementary Data” in this 2012 Form 10-K. As a result of the errors identified during the restatement, management identified material weaknesses in our internal control over financial reporting and concluded that the Company’s disclosure controls and procedures were not effective as of December 31, 2012. These weaknesses, an evaluation of the effectiveness of the Company’s disclosure controls and procedures and the Company’s remediation plans are more fully described in “Item 9A: Controls and Procedures” in Part II of this 2012 Form 10-K.
Executive Overview
Business
The Phoenix Companies, Inc. (“we,” “our,” “us,” the “Company,” “PNX” or “Phoenix”) is a holding company incorporated in Delaware. Our operating subsidiaries provide life insurance and annuity products through independent agents and financial advisors. Our policyholder base includes both affluent and middle market consumers, with our more recent business concentrated in the middle market. Most of our life insurance in force is permanent life insurance (whole life, universal life and variable universal life) insuring one or more lives. Our annuity products include fixed and variable annuities with a variety of death benefit and guaranteed living benefit options.
We believe our competitive strengths include:
·
competitive and innovative products;
·
underwriting and mortality risk management expertise;
·
ability to develop business partnerships; and
·
value-added support provided to distributors by our wholesalers and operating personnel.
In 2012, 99% of Phoenix product sales, as defined by total annuity deposits and total life premium, were annuities, and 90% of those sales were fixed indexed annuities. In addition, we have expanded sales of other insurance companies’ policies through our distribution subsidiary, Saybrus Partners, Inc. (“Saybrus”).
We operate two businesses segments: Life and Annuity and Saybrus. The Life and Annuity segment includes individual life insurance and annuity products, including our closed block. Saybrus provides dedicated life insurance and other consulting services to financial advisors in partner companies, as well as support for sales of Phoenix’s product line through independent distribution organizations.
37
Earnings Drivers
A substantial but gradually declining amount of our Life and Annuity segment earnings derive from the closed block, which consists primarily of participating life insurance policies sold prior to our demutualization and initial public offering in 2001. We do not expect the net income contribution from the closed block to deviate materially from its actuarially projected path as long as actual cumulative earnings meet or exceed expected cumulative earnings. See Note 5 to our consolidated financial statements under “Item 8: Financial Statements and Supplementary Data” in this Annual Report on Form 10-K for more information on the closed block.
Our Life and Annuity segment’s profitability is driven by interaction of the following elements:
·
Fees on life and annuity products consist primarily of: (i) COI charges, which are based on the difference between policy face amounts and the account values (referred to as the NAR); (ii) asset-based fees (including mortality and expense charges for variable annuities) which are calculated as a percentage of assets under management within our separate accounts; (iii) premium-based fees to cover premium taxes and renewal commissions; and (iv) surrender charges.
·
Policy benefits includedeath claims net of reinsurance cash flows, including ceded premiums and recoverables, interest credited to policyholders and changes in reserves for future claims payments. Certain universal life reserves are based on management’s assumptions about future COI fees and interest margins which, in turn, are affected by future premium payments, surrenders, lapses and mortality rates. Actual experience can vary significantly from these assumptions, resulting in greater or lesser changes in reserves. In addition, we regularly review and reset our assumptions in light of actual experience, which can result in material changes to these reserves.
For fixed indexed annuities, policy benefits include the change in the liability associated with guaranteed minimum withdrawal benefits and the fair value of an embedded derivative liability. The assumptions used to calculate the guaranteed minimum withdrawal liability are consistent with those used for amortizing deferred policy acquisition costs. The fair value of the embedded derivative liability is calculated using significant management estimates, including: (i) the expected value of index credits on the next policy anniversary dates; (ii) the interest rate used to project the future growth in the contract liability; (iii) the discount rate used to discount future benefit payments, which includes an adjustment for our credit worthiness; and (iv) the expected costs of annual call options that will be purchased in the future to fund index credits beyond the next policy anniversary. These factors can vary significantly from period to period.
Certain of our variable annuity contracts include guaranteed minimum death and income benefits. The change in the liability associated with these guarantees is included in policy benefits. The value of these liabilities is sensitive to changes in equity markets, equity market volatility and interest rates, as well as subject to management assumptions regarding future surrenders, rider utilization rates and mortality.
In addition, the universal life block of business has experience which produces profits in earlier periods followed by losses in later periods for which an additional liability is required to be held above the account value liability. These reserves for future losses are determined by accruing ratably over historical and anticipated positive income. The assumptions used in estimating these liabilities are consistent with those used for amortizing deferred policy acquisition costs and are subject to the same variability and risk, and these factors can vary significantly from period to period.
·
Interest margins consist of net investment income earned on universal life, fixed indexed annuities and other policyholder funds, gains on options purchased to fund index credits less the interest or index credits applied to policyholders on those funds. Interest margins also include investment income on assets supporting the Company’s surplus.
·
Non-deferred operating expenses are expenses related to servicing policies, premium taxes, reinsurance allowances, non-deferrable acquisition expenses and commissions and general overhead. They also include pension and other benefit costs which involve significant estimates and assumptions.
38
·
Deferred policy acquisition cost amortization is based on the amount of expenses deferred, actual results in each quarter and management’s assumptions about the future performance of the business. The amount of future profit or margin is dependent principally on investment returns in our separate accounts, interest and default rates, reinsurance costs and recoveries, mortality, surrender rates, premium persistency and expenses. These factors enter into management’s estimates of gross profits or margins, which generally are used to amortize deferred policy acquisition costs. Actual equity market movements, net investment income in excess of amounts credited to policyholders, claims payments and other key factors can vary significantly from our assumptions, resulting in a misestimate of gross profits or margins, and a change in amortization, with a resulting impact to income. In addition, we regularly review and reset our assumptions in light of actual experience, which can result in material changes in amortization.
·
Net realized investment gains or losses related to investments and hedging programs include transaction gains and losses, OTTIs and changes in the value of certain derivatives and embedded derivatives.
·
Income tax expense/benefit consists of both current and deferred tax provisions. The computation of these amounts is a function of pre-tax income and the application of relevant tax law and U.S. GAAP accounting guidance. In assessing the realizability of our deferred tax assets, we make significant judgments with respect to projections of future taxable income, the identification of prudent and feasible tax planning strategies and the reversal pattern of the Company’s book-to-tax differences that are temporary in nature. We also consider the expiration dates and amounts of carryforwards related to net operating losses, capital losses, foreign tax credits and general business tax credits. Based on our assessment, we have recorded a valuation allowance against a significant portion of our deferred tax assets based upon our conclusion that there is insufficient objective positive evidence to overcome the significant negative evidence from our cumulative losses in recent years. This assessment could change in the future, resulting in a release of the valuation allowance and a benefit to income.
Under U.S. GAAP, premiums and deposits for variable life, universal life and annuity products are not immediately recorded as revenues. For certain investment options of variable products, deposits are reflected on our consolidated balance sheets as an increase in separate account liabilities. Premiums and deposits for universal life, fixed annuities and certain investment options of variable annuities are reflected on our consolidated balance sheets as an increase in policyholder deposit funds. Premiums and deposits for other products are reflected on our consolidated balance sheets as an increase in policy liabilities and accruals.
Saybrus is a fee-based business driven by the commission revenue earned on consultation services provided to partner companies as well as on sales of Phoenix Life and PHLVIC product lines. These fees are offset by compensation-related expenses attributable to our sales force.
Recent Trends in Earnings Drivers
·
Fees on life and annuity products. Fees on our life and annuity products decreased $40.6 million in the twelve months ended December 31, 2012 compared with the twelve months ended December 31, 2011. Lower fees were primarily a result of COI charges which decreased $39.6 million related to declining universal life and variable universal life insurance in force. In addition, investment fees decreased during 2012 compare with 2011 due to the sale of Goodwin during the fourth quarter of 2011. Partially offsetting these declines were higher fees related to an increase in outstanding annuity policies.
·
Policy benefits. Policy benefits increased $29.1 million in 2012 compared to 2011. The increase in policy benefit expense was a result of higher death benefits for universal life and traditional whole life products as a result of negative mortality experience during 2012, primarily in the third quarter. Annuity benefits increased largely due to changes in reserves on fixed indexed annuities associated with minimum death and income benefit guarantees which were driven by increased sales during the year. Policy benefit expenses of $36.3 million were incurred during 2012 due to reserve unlocking adjustments as a result of our annual comprehensive review of actuarial assumptions in the third quarter of 2012. These expenses were partially offset by lower policy benefits within the closed block due to positive mortality during 2012 and a decrease in outstanding policies in force as the block ages.
39
·
Interest margins. Universal life interest margins declined slightly in 2012 compared to 2011 primarily as a result of lower interest credited consistent with declining funds under management. Annuity interest margins increased primarily as a result of higher investment income attributable to growth in fixed indexed annuity funds under management.
·
Operating expenses. Non-deferred operating expenses excluding Saybrus increased $5.3 million to $234.6 million in 2012, compared to $229.3 million in 2011. The increase in operating expenses was a result of higher professional fees, outside services and commissions which were offset by lower compensation related expenses.
·
Deferred policy acquisition cost amortization. Policy acquisition cost amortization increased $42.1 million in 2012 compared to 2011. This increase in amortization was attributable to the unlocking of assumptions as a result the annual comprehensive review of assumptions in the third quarter of 2012. The unlocking resulted in amortization of $55.2 million in 2012, which included amortization of $46.2 million for traditional life policies from lower projected net yields related to investment income returns and amortization of $6.0 million for universal life policies primarily due to lower spreads due to the low interest rate environment. Excluding the impact of the unlocking, amortization related to universal life decreased as a result of negative mortality experience during the year. Amortization related to annuities decreased primarily as a result of improved market performance.
·
Net realized investment gains or losses on investments. Net realized investment losses of $10.5 million were recognized in 2012 compared to a net realized investment loss of $32.1 million in 2011. Net realized gains on sales of long-term debt securities accounted for $31.0 million of the total realized gains over the year as interest rates reached historically low levels in 2012. Common and preferred equity investments and other alternative investments accounted for gains of $13.3 million due to strong performance in global equity markets during 2012. These gains were partially offset by impairments of $28.8 million on long-term debt securities and common stock and losses of $38.3 million on derivative assets and embedded derivative liabilities. These derivative losses were primarily attributable to a loss of $34.2 million on derivative contracts which hedge the variable annuity and fixed indexed annuity guarantees, offset by $12.1 million in gains on embedded derivative liabilities associated with fixed and variable annuity guarantees. Included in the net derivative loss were gains of $9.8 million associated with the non-performance risk factor. In addition, realized losses of $15.9 million related to our surplus hedge, which utilizes futures and options to hedge against declines in equity markets and the resulting statutory capital and surplus impact.
·
Income taxes. The effective tax rate for 2012 and 2011 was 2.4% and 455.5% respectively. The principal cause of the difference between the effective rate and the U.S. statutory rate of 35% in 2012 was the dividend received deduction, expired tax attribute carryforwards and an increase in the valuation allowance on the pre-tax loss. The principal cause of the difference between the effective rate and the U.S. statutory rate of 35% in 2011 was the dividend received deduction and an increase in the valuation allowance on the pre-tax income.
Since its formation in the fourth quarter of 2009, Saybrus’ results of operations have steadily improved as revenue has increased and expenses have declined. Inclusive of intercompany transactions, revenue in 2012 was $22.9 million, compared with $18.2 million in 2011. Of these amounts, revenue of $11.4 million and $11.3 million was earned from the sales of Phoenix life and annuity products in 2012 and 2011, respectively. Operating expenses increased to $20.4 million in 2012 from $19.5 million in 2011. The increase was primarily driven by an increase in compensation related expenses.
Strategy and Outlook
We are focused on the following key strategic pillars, which have defined our strategy since 2009:
·
Balance sheet strength;
·
Policyholder service;
·
Operational efficiency; and
·
Profitable growth.
We believe this strategy has produced a firm foundation and positioned us for continued growth, even as our business remains sensitive to general economic conditions and capital market trends including equity markets and interest rates.
40
We believe there is significant demand for our products among middle market households seeking to accumulate assets and secure lifetime income during retirement. The current low interest rate environment provides limited opportunities for consumers to protect principal and generate predictable income. Our indexed annuity products are positioned favorably vis-à-vis traditional investments such as bank certificates of deposits.
Recent trends in the life insurance industry may affect our mortality, policy persistency and premium persistency. The evolution of the financial needs of policyholders, the emergence of a secondary market for life insurance and increased availability and subsequent contraction of premium financing suggest that the reasons for purchasing our products have changed. Deviations in experience from our assumptions have had, and could continue to have, an adverse effect on the profitability of certain universal life products. Most of our current products permit us to increase charges and adjust crediting rates during the life of the policy or contract (subject to guarantees in the policies and contracts). We have made, and may in the future make, such adjustments.
Each year we perform a comprehensive assumption review or an unlocking where we revise our assumptions to reflect the results of recent experience studies, thereby changing our estimate of estimated gross profits (“ EGPs”) in the deferred policy acquisition cost and unearned revenue amortization models, as well as projections within the death benefit and other insurance benefit reserving models as described more fully in Note 3 to our consolidated financial statements under “Item 8: Financial Statements and Supplementary Data” in this Annual Report on Form 10-K. While the final impact of the 2013 annual comprehensive assumption review is not yet complete, preliminary indications suggest an overall improvement in mortality experience and an increase in interest rates, both of which are significant assumptions and a driver of results. However, the ultimate impact of this experience on the annual unlock and on our consolidated results of operations has not yet been determined.
The Company incurred $63.0 million in 2013 for audit, financial and actuarial consulting, legal and bond consent solicitation expenses related to the restatement process and preparation of restated financial statements.
Recent Acquisitions and Dispositions
Goodwin Capital Advisers, Inc.
On September 14, 2011, we entered into a definitive agreement to sell Goodwin Capital Advisers, Inc. (“Goodwin”) to Conning Holdings Corp. (“Conning Holdings”). Also, on September 14, 2011, we entered into multi-year investment management agreements with Conning, Inc. (“Conning”) under which Conning will manage the Company’s publicly traded fixed income assets. Because of the ongoing cash flows associated with the investment management agreements, results of these operations have been reflected within continuing operations. The transaction closed on November 18, 2011.
Private placement and limited partnership portfolios previously managed under Goodwin continue to be managed by Phoenix under its subsidiary, Phoenix Life.
PFG Holdings, Inc.
On January 4, 2010, we signed a definitive agreement to sell PFG and its subsidiaries, including AGL Life Assurance Company, to Tiptree. Because of the divestiture, these operations are reflected as discontinued operations. On June 23, 2010, we completed the divestiture of PFG and closed the transaction.
The definitive agreement contains a provision requiring us to indemnify Tiptree for any losses due to actions resulting from certain specified acts or omissions associated with the divested business prior to closing. There has been litigation filed that falls within this provision of the agreement but does not name the Company as a party to the litigation. We intend to defend these matters vigorously based on our indemnity commitment. See Note 24 to our consolidated financial statements under “Item 8: Financial Statements and Supplementary Data” in this Annual Report on Form 10-K for additional information.
41
Phoenix Life and Reassurance Company of New York
Included within the January 4, 2010 agreement with Tiptree was a provision for the purchase of PLARNY pending regulatory approval. On September 24, 2010, approval was obtained from the NYDFS for Tiptree and PFG Holdings Acquisition Corporation to acquire PLARNY. The transaction closed on October 6, 2010. Because of the divestiture, these operations are reflected as discontinued operations. We have reclassified prior period financial statements to conform to this change.
Impact of New Accounting Standards
For a discussion of accounting standards and change in accounting, see Note 3 to our consolidated financial statements under “Item 8: Financial Statements and Supplementary Data” in this Annual Report on Form 10-K.
Critical Accounting Estimates
The discussion and analysis of our financial condition and results of operations are based upon our consolidated financial statements, which have been prepared in accordance with U.S. GAAP. U.S. GAAP requires management to make estimates and assumptions that affect the reported amounts of assets and liabilities at the date of the consolidated financial statements and the reported amounts of revenues and expenses during the reporting period. Actual results could differ from those estimates. Critical accounting estimates are reflective of significant judgments, often as a result of the need to make estimates about the effect of matters that are inherently uncertain.
Certain of our critical accounting estimates are as follows:
Deferred Policy Acquisition Costs
We amortize deferred policy acquisition costs based on the related policy’s classification. For individual participating life insurance policies, deferred policy acquisition costs are amortized in proportion to estimated gross margins (“EGMs”) arising principally from investment results, mortality, dividends to policyholders and expense margins. For universal life, variable universal life and deferred annuities, deferred policy acquisition costs are amortized in proportion to EGPs discussed more fully below. EGPs are also used to amortize other assets and liabilities in the Company’s consolidated balance sheets, such as sales inducement assets (“SIA”) and unearned revenue reserves (“URR”). Components of EGPs are used to determine reserves for universal life and fixed, indexed and variable annuity contracts with death and other insurance benefits such as guaranteed minimum death and guaranteed minimum income benefits. Both EGMs and EGPs are based on historical and anticipated future experience which is updated periodically.
Certain of our policies may be surrendered for value or exchanged for a different one of our products (internal replacement). The deferred policy acquisition costs balance associated with the replaced or surrendered policies is adjusted to reflect these surrenders.
In addition, deferred policy acquisition costs are adjusted through OCI each period as a result of unrealized gains or losses on securities classified as available-for-sale in a process commonly referred to as shadow accounting. This adjustment is required in order to reflect the impact of these unrealized amounts on interest margins as if these unrealized amounts had been realized.
The projection of EGPs and EGMs requires the extensive use of actuarial assumptions, estimates and judgments about the future. Future EGPs and EGMs are generally projected for the estimated lives of the contracts. Assumptions are set separately for each product and are reviewed at least annually based on our current best estimates of future events. The following table summarizes the most significant assumptions used in the categories set forth below:
| | | | |
Significant Assumption | | Product | | Explanation and Derivation |
| | | | |
Separate account investment return | | Variable Annuities (8.0% long-term return assumption) Variable Universal Life (8.0% long-term return assumption) | | Separate account return assumptions are derived from the long-term returns observed in the asset classes in which the separate accounts are invested. Short-term deviations from the long-term expectations are expected to revert to the long-term assumption over five years. |
42
| | | | |
Significant Assumption | | Product | | Explanation and Derivation |
| | | | |
Interest rates and default rates | | Fixed and Indexed Annuities Universal Life Participating Life | | Investment returns are based on the current yields and maturities of our fixed income portfolio combined with expected reinvestment rates given current market interest rates. Reinvestment rates are assumed to revert to long-term rates implied by the forward yield curve and long-term default rates. Contractually permitted future changes in credited rates are assumed to help support investment margins. |
Mortality / longevity | | Universal Life Variable Universal Life Fixed and Indexed Annuities Participating Life | | Mortality assumptions are based on Company experience over a rolling five-year period plus supplemental data from industry sources and trends. These assumptions vary by issue age, gender, underwriting class and policy duration. |
Policyholder behavior – policy persistency | | Universal Life Variable Universal Life Variable Annuities Fixed and Indexed Annuities Participating Life | | Policy persistency assumptions vary by product and policy year and are updated based on recently observed experience. Policyholders are generally assumed to behave rationally; hence rates are typically lower when surrender penalties are in effect or when policy benefits are more valuable. |
Policyholder behavior – premium persistency | | Universal Life Variable Universal Life | | Future premiums and related fees are projected based on contractual terms, product illustrations at the time of sale and expected policy lapses without value. Assumptions are updated based on recently observed experience and include anticipated changes in behavior based on changes in policy charges if the Company has a high degree of confidence that such changes will be implemented (e.g., change in COI charges). |
Expenses | | All products | | Projected maintenance expenses to administer policies in force are based on annually updated studies of expenses incurred. |
Reinsurance costs / recoveries | | Universal Life Variable Universal Life Variable Annuities Participating Life | | Projected reinsurance costs are based on treaty terms currently in force. Recoveries are based on the Company’s assumed mortality and treaty terms. Treaty recaptures are based on contract provisions and management’s intentions. |
During the third quarter of every year, we complete a comprehensive assumption review where management makes a determination of best estimate assumptions based on a comprehensive review of recent experience and industry trends. Assumption changes resulting from this review change our estimate of EGPs in the deferred policy acquisition cost and unearned revenue amortization models, as well as projections within the death benefit and other insurance benefit reserving models. The deferred policy acquisition cost asset, the unearned revenue reserves and death benefit and other insurance benefit reserves are then adjusted with an offsetting benefit or charge to income to reflect such changes in the period of the revision. Throughout the year, we may also update the assumptions and adjust the deferred policy acquisition cost, SIA, URR and certain guaranteed minimum income and death benefit balances if emerging data indicate a change is warranted. Our process to assess the reasonableness of the EGPs used for this purpose uses internally developed models together with consideration of applicable recent experience, analysis of market and industry trends and other events. Actual gross profits that vary from management’s estimates in a given reporting period may also result in increases or decreases in the rate of amortization recorded in the period.
All assumption changes, whether resulting from the annual comprehensive review or from other periodic assessments, are considered an unlock in the period of revision. An unlock adjusts the deferred policy acquisition cost, SIA and URR balances as well as additional death benefit reserves and COI balances in the consolidated balance sheets. An unlock that results in an after-tax benefit generally occurs as a result of actual experience or future expectations of product profitability being favorable compared to previous estimates. An unlock that results in an after-tax charge generally occurs as a result of actual experience or future expectations of product profitability being unfavorable compared to previous estimates.
43
An analysis is performed annually to assess if there are sufficient gross profits to recover the deferred policy acquisition costs associated with business written during the year. If the estimates of gross profits cannot support the recovery of deferred policy acquisition costs, the amount deferred is reduced to the recoverable amount.
Over the last several years, the Company has revised a number of assumptions, resulting in changes to expected future gross profits:
·
Separate account returns: Trends in equity markets have been reflected in the separate account return assumptions for variable annuities and variable universal life business. Our sensitivity analysis of the impact of this assumption indicates that at December 31, 2012, had we reprojected EGPs using a 100 basis point lower separate account return assumption (after fund fees and mortality and expense charges) and used our current best estimate assumptions for all other assumptions, the estimated increase to amortization and decrease to net income would have been approximately $5.7 million, before taxes. Conversely, a 100 basis point increase in the separate account return assumption would have decreased amortization and increased net income by approximately $7.1 million, before taxes.
·
Interest rates and default rates: Changes in estimates of future interest rates result in changes in the amortization of deferred policy acquisition costs associated with certain products because future EGPs include interest margins. The impacts of such a change depend on a variety of factors including the period over which the change is expected, the relative change between short-term and long-term interest rates, and management’s ability and preparedness to change policy credited rates.
·
Policyholder behavior: Changes in surrender, policy persistency and premium persistency assumptions will result in changes in the amortization of deferred policy acquisition costs. The impact of an increase or decrease in these assumptions on amortization is dependent on the manner in which the change in assumptions affects EGPs. For example, anticipated increases in future surrender rates on contracts with expected future losses may increase EGPs and reduce current period amortization. Policyholder behavior assumptions are established through an evaluation of a variety of product and policyholder specific factors and external environmental factors.
·
Expenses: The impact of future changes in policy administration expense could impact EGPs and increase or decrease net income.
Policy Liabilities and Accruals
Generally, future policy benefits are payable over an extended period of time and related liabilities are calculated recognizing future expected benefits, expenses and premiums. Such liabilities are established based on methods and underlying assumptions in accordance with U.S. GAAP and applicable actuarial standards. Principal assumptions used in the establishment of liabilities for future policy benefits are mortality, morbidity, policyholder behavior, investment returns, inflation, expenses and other contingent events as appropriate. These assumptions are intended to estimate the experience for the period the policy benefits are payable. Utilizing these assumptions, liabilities are established on a cohort basis, as appropriate. If experience is less favorable than assumed, additional liabilities may be established, resulting in a charge to policyholder benefits and claims.
Additional policyholder liabilities for guaranteed benefits on variable annuity and on fixed index annuity contracts are based on estimates of the expected value of benefits in excess of the projected account balance, recognizing the excess over the accumulation period based on total expected assessments. Because these estimates are sensitive to capital market movements, amounts are calculated using multiple future economic scenarios.
Additional policyholder liabilities are established for certain contract features that could generate significant reductions to future gross profits (e.g., death benefits when a contract has zero account value and a no-lapse guarantee). The liabilities are accrued over the lifetime of the block based on assessments. The assumptions used in estimating these liabilities are consistent with those used for amortizing deferred policy acquisition costs, and are, thus, subject to the same variability and risk. The assumptions of investment performance and volatility for variable and equity index products are consistent with historical experience of the appropriate underlying equity indices.
44
The universal life block of business has experience which produces profits in earlier periods followed by losses in later periods for which a liability is required to be held in addition to the policy liabilities recorded for the block. These liabilities are accrued ratably over the profitable periods to offset the future anticipated losses. The assumptions used in estimating these liabilities are consistent with those used for amortizing deferred policy acquisition costs and are subject to the same variability and risk.
The Company periodically reviews its estimates of actuarial liabilities for policyholder benefits and compares them with its actual experience. Differences between actual experience and the assumptions used in pricing these policies and guarantees, as well as in the establishment of the related liabilities, result in variances in profit and could result in losses.
See Note 3 to our consolidated financial statements under “Item 8: Financial Statements and Supplementary Data” and the “Enterprise Risk Management” section of “Item 7: Management’s Discussion and Analysis of Financial Condition and Results of Operations” in this Annual Report on Form 10-K for more information.
Embedded Derivative Liabilities
We make guarantees on certain variable annuity contracts, including GMAB, GMWB and COMBO as well as provide credits based on the performance of certain indices (“index credits”) on our fixed indexed annuity contracts that meet the definition of an embedded derivative. The GMAB, GMWB and COMBO embedded derivative liabilities associated with our variable annuity contracts are accounted for at fair value, using a risk neutral stochastic valuation methodology with changes in fair value recorded in realized investment gains. The inputs to our fair value methodology include estimates derived from the asset derivatives market, including the equity volatility and the swap curve. Several additional inputs are not obtained from independent sources, but instead reflect our internally developed assumptions related to mortality rates, lapse rates and policyholder behavior. The fair value of the embedded derivative liabilities associated with the index credits on our fixed indexed annuity contracts is calculated using the budget method with changes in fair value recorded in realized investment gains. The initial value under the budget method is established based on the fair value of the options used to hedge the liabilities. The value of the index credits in future years is estimated to be the budgeted amount. The budget amount is based on the impact of projected interest rates on the discounted liabilities. Several additional inputs reflect our internally developed assumptions related to lapse rates and policyholder behavior. As there are significant unobservable inputs included in our fair value methodology for these embedded derivative liabilities, we consider the above-described methodology as a whole to be Level 3 within the fair value hierarchy.
Our fair value calculation of embedded derivative liabilities includes a credit standing adjustment (the “CSA”). The CSA represents the adjustment that market participants would make to reflect the risk that guaranteed benefit obligations may not be fulfilled (“non-performance risk”). We estimate our CSA using the credit spread (based on publicly available credit spread indices) for financial services companies similar to the Company’s life insurance subsidiaries.
The CSA is updated every quarter and, therefore, the fair value will change with the passage of time even in the absence of any other changes that would affect the valuation. For example, the December 31, 2012 fair value of $27.6 million would increase to $29.8 million if the chosen spread were decreased by 50 basis points. If the chosen spread were increased by 50 basis points, the fair value would decrease to $25.5 million. The impact of the CSA related to variable annuity GMAB and GMWB embedded derivatives at December 31, 2012 and 2011 was a reduction of $17.1 million and $38.0 million in the reserves associated with these riders, respectively.
Valuation of Debt and Equity Securities
We classify our debt and equity securities as available-for-sale and report them in our consolidated balance sheets at fair value. Fair value is based on quoted market price or external third party information, where available. When quoted market prices are not available, we estimate fair value by discounting debt security cash flows to reflect interest rates currently being offered on similar terms to borrowers of similar credit quality, by quoted market prices of comparable instruments and by independent pricing sources or internally developed pricing models.
45
| | | | | |
Fair Value of Fixed Maturity Securities | As of December 31, 2012 |
by Pricing Source: | Fixed Maturities at Fair Value | | % of Total Fair Value |
($ in millions) |
|
| | | | | |
Priced via independent market quotations | $ | 8,240.4 | | 65.1% | |
Priced via matrices | | 3,277.6 | | 25.9% | |
Priced via broker quotations | | 209.8 | | 1.7% | |
Priced via other methods | | 228.6 | | 1.8% | |
Short-term investments (1) | | 699.6 | | 5.5% | |
Total | $ | 12,656.0 | | 100.0% | |
———————
(1)
Short-term investments are valued at amortized cost, which approximates fair value.
See Note 14 to our consolidated financial statements under “Item 8: Financial Statements and Supplementary Data” in this Annual Report on Form 10-K for additional disclosures of our fair value methodologies.
Other-than-Temporary Impairments
We recognize realized investment losses when declines in fair value of debt and equity securities are considered to be other-than-temporary.
For debt securities, the other-than-temporarily impaired amount is separated into the amount related to a credit loss and is reported as net realized investment losses included in earnings and any amounts related to other factors are recognized in OCI. The credit loss component represents the difference between the amortized cost of the security and the net present value of its projected future cash flows discounted at the effective interest rate implicit in the debt security prior to impairment. Any remaining difference between the fair value and amortized cost is recognized in accumulated other comprehensive income (“AOCI”). Subsequent to the recognition of an OTTI, the impaired security is accounted for as if it had been purchased on the date of impairment at an amortized cost basis equal to the previous amortized cost basis less the OTTI recognized in earnings. We will continue to estimate the present value of future expected cash flows and, if significantly greater than the new cost basis, we will accrete the difference as investment income on a prospective basis once the Company has determined that the interest income is likely to be collected.
In evaluating whether a decline in value is other-than-temporary, we consider several factors including, but not limited to, the following:
·
the extent and the duration of the decline;
·
the reasons for the decline in value (credit event, interest related or market fluctuations);
·
our intent to sell the security, or whether it is more likely than not that we will be required to sell it before recovery; and
·
the financial condition and near term prospects of the issuer.
A debt security impairment is deemed other-than-temporary if:
·
we either intend to sell the security, or it is more likely than not that we will be required to sell the security before recovery; or
·
it is probable we will be unable to collect cash flows sufficient to recover the amortized cost basis of the security.
Impairments due to deterioration in credit that result in a conclusion that the present value of cash flows expected to be collected will not be sufficient to recover the amortized cost basis of the security are considered other-than-temporary. Other declines in fair value (for example, due to interest rate changes, sector credit rating changes or company-specific rating changes) that result in a conclusion that the present value of cash flows expected to be collected will not be sufficient to recover the amortized cost basis of the security may also result in a conclusion that an OTTI has occurred.
An equity security impairment is deemed other-than-temporary if:
·
the security has traded at a significant discount to cost for an extended period of time; or
·
we determined we may not realize the full recovery on our investment.
46
Equity securities are determined to be other-than-temporarily impaired based on management judgment and the consideration of the issuer’s financial condition along with other relevant facts and circumstances. Those securities which have been in a continuous decline for over a twelve month period are generally considered impaired. Additionally, declines in value that are severe and rapid are considered for reasonability of whether the impairment would be temporary.
On a quarterly basis, we evaluate securities in an unrealized loss position for potential recognition of an OTTI. In addition, we maintain a watch list of securities in default, near default or otherwise considered by our investment professionals as being distressed, potentially distressed or requiring a heightened level of scrutiny. We also identify securities whose fair value has been below amortized cost on a continuous basis for zero to six months, six months to 12 months and greater than 12 months.
We employ a comprehensive process to determine whether or not a security in an unrealized loss position is other-than-temporarily impaired. This assessment is done on a security-by-security basis and involves significant management judgment. The assessment of whether impairments have occurred is based on management’s evaluation of the underlying reasons for the decline in estimated fair value. The Company’s review of its fixed maturity and equity securities for impairments includes an analysis of the total gross unrealized losses by severity and/or age of the gross unrealized loss, as summarized on pages 71 and 72, “Duration of Gross Unrealized Losses on Securities.” An extended and severe unrealized loss position on a fixed maturity security may not have any impact on the ability of the issuer to service all scheduled interest and principal payments and the Company’s evaluation of recoverability of all contractual cash flows or the ability to recover an amount at least equal to its amortized cost based on the present value of the expected future cash flows to be collected. In contrast, for certain equity securities, greater weight and consideration are given by the Company to a decline in market value and the likelihood such market value decline will recover.
Specifically for structured securities, to determine whether a collateralized security is impaired, we obtain underlying data from the security’s trustee and analyze it for performance trends. A security-specific stress analysis is performed using the most recent trustee information. This analysis forms the basis for our determination of whether the security will pay in accordance with the contractual cash flows.
The closed block policyholder dividend obligation, applicable deferred policy acquisition costs and applicable income taxes, which offset realized investment gains and losses and OTTIs, are each reported separately as components of net income.
See Note 9 to our consolidated financial statements under “Item 8: Financial Statements and Supplementary Data” and the “Debt and Equity Securities” and “Enterprise Risk Management” sections of “Item 7: Management’s Discussion and Analysis of Financial Condition and Results of Operations” in this Annual Report on Form 10-K for more information.
Income Taxes
We account for income taxes in accordance with ASC 740,Accounting for Income Taxes.
Deferred tax assets and/or liabilities are determined by multiplying the differences between the financial reporting and tax reporting bases for assets and liabilities by the enacted tax rates expected to be in effect when such differences are recovered or settled. U.S. GAAP requires an assessment of the realizability of deferred tax assets in order to determine whether a valuation allowance should be recorded. The total deferred tax asset, net of any valuation allowance, represents the deferred tax asset that management estimates to be realizable. The assessment of the realizability of deferred tax assets involves management making assumptions and judgments about all available positive and negative evidence including the reversal of gross deferred tax liabilities, projected future taxable income, prudent and feasible tax planning strategies and recent operating results, including the existence of cumulative income (loss) incurred over the three-year period ended December 31, 2012.
47
As of December 31, 2012, we concluded that our estimates of future taxable income, certain tax planning strategies and other sources of income did not constitute sufficient positive evidence to assert that it is more likely than not that certain deferred tax assets would be realizable. Accordingly, a valuation allowance of $523.3 million has been recorded on net deferred tax assets of $572.7 million. The remaining deferred tax asset of $49.4 million attributable to available-for-sale debt securities with gross unrealized losses does not require a valuation allowance due to our ability and intent to hold these securities until recovery of principal value through sale or contractual maturity, thereby avoiding the realization of taxable losses. This conclusion is consistent with prior periods. The impact of the valuation allowance on the allocation of tax to the components of the financial statements included an increase of $48.4 million in continuing operations, an increase of $55.1 million in OCI-related deferred tax balances and an increase of $6.0 million recorded to discontinued operations.
The calculation of tax liabilities involves uncertainties in applying certain tax laws. ASC 740 provides that a tax benefit that arises from an uncertain tax position that is more likely than not to be upheld upon IRS examination shall be recognized in the financial statements. The more likely than not threshold requires judgments made by management and the related tax liability is adjusted accordingly as new information becomes available. Due to the complexities of such uncertainties, tax payments made upon IRS examination may be materially different from the current estimate of tax liabilities in the event there is disagreement on the tax positions taken. Those payments are reflected in income tax expense in the period in which the examinations are completed.
The Company has minimal uncertain tax positions and accordingly, the liability for uncertain tax positions is not material to the financial statements.
See Note 15 to our consolidated financial statements under “Item 8: Financial Statements and Supplementary Data” in this Annual Report on Form 10-K for more information related to income taxes.
Pension and Other Post-Employment Benefits
We have three defined benefit pension plans covering our employees. The employee pension plan provides benefits up to the amount allowed under the Internal Revenue Code. The two supplemental plans provide benefits in excess of the primary plan. Retirement benefits under the plans are a function of years of service and compensation. Effective March 31, 2010, all benefit accruals under all of our funded and unfunded defined benefit plans were frozen. This change was announced in 2009 and a curtailment was recognized at that time for the reduction in the expected years of future service.
The net periodic costs for the plans consider an assumed discount (interest) rate, an expected rate of return on plan assets and trends in health care costs. Of these assumptions, our expected rate of return assumptions, and to a lesser extent our discount rate assumptions, have historically had the most significant effect on our net period costs associated with these plans. The Company uses a building block approach in estimating the long-term rate of return for plan assets by asset class. The historical relationships between equities, fixed income and other asset classes are reviewed. We apply long-term asset return estimates to the plan’s target asset allocation to determine the weighted-average long-term return. Our long-term asset allocation was determined through modeling long-term returns and asset return volatilities. Our assumed long-term rate of return for 2012 was 8.0% for our pension plan. Given the amount of plan assets as of December 31, 2011, the beginning of the measurement year, if we had assumed an expected rate of return for our pension that was 100 basis points higher or 100 basis points lower than the rates we assumed, the change in our net periodic costs would have been a decrease of $4.3 million and an increase of $4.3 million, respectively. These amounts consider only changes in our assumed long term rate of return given the level and mix of invested assets at the beginning of the measurement year, without consideration of possible changes in any of the other assumptions described above that could ultimately accompany any changes in our assumed long-term rate of return.
48
We determine our discount rate, used to value the pension and postretirement benefit obligations, based upon rates commensurate with current yields on high quality corporate bonds. Our assumed discount rate for 2012 was 4.53% for our pension plan, 4.39% for the supplemental retirement plan and 4.11%/3.35% for our other postretirement benefit plan (the discount rate for our other postretirement benefit plan was changed from 4.11% to 3.35% on October 1, 2012 due to amendments to the plan). Given the amount of pension and postretirement obligations as of December 31, 2011, the beginning of the measurement year, if we had assumed a discount rate for our pension plans and our other postretirement benefit plan that was 100 basis points higher or 100 basis points lower than the rates we assumed, the change in our net periodic costs would have been as shown in the table below. These amounts consider only changes in our assumed discount rate without consideration of possible changes in any of the other assumptions described above that could ultimately accompany any changes in our assumed discount rate.
| | | | | | |
Increase (Decrease) in Net Periodic Costs: | Year Ended |
($ in millions) | December 31, 2012 |
| Increase Discount Rate by 100bps | | Decrease Discount Rate by 100bps |
| |
| |
| | | | | |
Pension plan | $ | (0.6) | | $ | 0.3 |
Supplemental plan | | — | | | — |
Other postretirement | | (0.1) | | | (0.2) |
As of December 31, 2012, the projected benefit obligation for the Company’s pension plan, supplemental plan and other postretirement plan were $694.8 million, $150.9 million and $40.6 million, respectively.
The sensitivity of the projected benefit obligations for each of these plans to a 100 basis point change in the discount rate is presented in the table below.
| | | |
Projected Benefit Obligation: | Increase Discount Rate by 100bps | | Decrease Discount Rate by 100bps |
| |
| |
| | | |
Pension plan | (11.8%) | | 14.5% |
Supplemental plan | (11.3%) | | 13.7% |
Other postretirement | (7.1%) | | 8.3% |
The assumptions used may differ materially from actual results due to, among other factors, changing market and economic conditions and changes in participant demographics. These differences may have a significant effect on the Company’s consolidated financial statements and liquidity. See Note 17 to our consolidated financial statements under “Item 8: Financial Statements and Supplementary Data” in this Annual Report on Form 10-K information on these and other assumptions used in measuring liabilities relating to the Company’s pension and other postretirement benefits.
We have historically provided our employees with other post-employment benefits that include health care and life insurance. In December 2009, we announcedthe decision to eliminate retiree medical coverage for active employees whose age plus years of service did not equal at least 65 as of March 31, 2010. Employees who remain eligible must still meet all other plan requirements to receive benefits.
In addition, the cap on the Company’s contribution to pre-65 retiree medical costs per participant was reduced beginning with the 2011 plan year. In October 2012, we announced that effective January 1, 2013, the Company's contribution for pre-65 retiree medical and for post-65 retiree medical was reduced per covered member. These decisions affected retiree medical contributions for both past service and active employees. Curtailments were recognized as a result of the plan changes. The net effect was a reduction of our projected benefit obligation.
See Note 17 to our consolidated financial statements under “Item 8: Financial Statements and Supplementary Data” in this Annual Report on Form 10-K for more information on our pension and other post-employment benefits.
49
Litigation Contingencies
The Company is a party to legal actions and is involved in regulatory investigations. Given the inherent unpredictability of these matters, it is difficult to estimate the impact on our financial position. Liabilities are established when it is probable that a loss has been incurred and the amount of the loss can be reasonably estimated. On a quarterly and annual basis, the Company reviews relevant information with respect to liabilities for litigation, regulatory investigations, and litigation-related contingencies to be reflected in the Company’s consolidated financial statements. It is possible that an adverse outcome in certain of the Company’s litigation or the use of different assumptions in the determination of amounts recorded could have a material effect upon the Company’s consolidated net income or cash flows in particular quarterly or annual periods.
Consolidated Results of Operations
| | | | | | | | | | | | | | | | | | |
Summary Consolidated | Years Ended December 31, | | Increase (decrease) and percentage change |
Financial Data: | 2012 | | 2011 | | 2010 | | 2012 vs. 2011 | | 2011 vs. 2010 |
($ in millions) | | | As restated and amended | | As restated and amended | | | | As restated and amended |
| | | | | | |
REVENUES | | | | | | | | | | | | | | | | | | |
Premiums | $ | 402.3 | | $ | 448.7 | | $ | 507.5 | | $ | (46.4) | | (10%) | | $ | (58.8) | | (12%) |
Fee income | | 556.2 | | | 596.8 | | | 633.5 | | | (40.6) | | (7%) | | | (36.7) | | (6%) |
Net investment income | | 829.3 | | | 822.9 | | | 840.5 | | | 6.4 | | 1% | | | (17.6) | | (2%) |
Net realized investment gains (losses): | | | | | | | | | | | | | | | | | | |
Total OTTI losses | | (51.7) | | | (65.3) | | | (107.3) | | | 13.6 | | 21% | | | 42.0 | | 39% |
Portion of OTTI losses recognized in OCI | | 22.9 | | | 38.5 | | | 58.7 | | | (15.6) | | (41%) | | | (20.2) | | (34%) |
Net OTTI losses recognized in earnings | | (28.8) | | | (26.8) | | | (48.6) | | | (2.0) | | (7%) | | | 21.8 | | 45% |
Net realized investment gains (losses),
excluding OTTI losses | | 18.3 | | | (5.3) | | | 37.4 | | | 23.6 | | NM | | | (42.7) | | NM |
Net realized investment gains (losses) | | (10.5) | | | (32.1) | | | (11.2) | | | 21.6 | | 67% | | | (20.9) | | NM |
Gain on debt repurchase | | 11.9 | | | 0.2 | | | — | | | 11.7 | | NM | | | 0.2 | | NM |
Total revenues | | 1,789.2 | | | 1,836.5 | | | 1,970.3 | | | (47.3) | | (3%) | | | (133.8) | | (7%) |
| | | | | | | | | | | | | | | | | | |
BENEFITS AND EXPENSES | | | | | | | | | | | | | | | | | | |
Policy benefits, excluding policyholder
dividends | | 1,166.1 | | | 1,137.0 | | | 1,121.5 | | | 29.1 | | 3% | | | 15.5 | | 1% |
Policyholder dividends | | 294.8 | | | 259.2 | | | 301.8 | | | 35.6 | | 14% | | | (42.6) | | (14%) |
Policy acquisition cost amortization | | 200.0 | | | 157.9 | | | 268.2 | | | 42.1 | | 27% | | | (110.3) | | (41%) |
Interest expense on indebtedness | | 30.8 | | | 31.8 | | | 31.8 | | | (1.0) | | (3%) | | | — | | 0% |
Other operating expenses | | 253.5 | | | 247.9 | | | 288.6 | | | 5.6 | | 2% | | | (40.7) | | (14%) |
Total benefits and expenses | | 1,945.2 | | | 1,833.8 | | | 2,011.9 | | | 111.4 | | 6% | | | (178.1) | | (9%) |
Income (loss) from continuing operations
before income taxes | | (156.0) | | | 2.7 | | | (41.6) | | | (158.7) | | NM | | | 44.3 | | NM |
Income tax expense (benefit) | | (3.7) | | | 12.3 | | | (10.3) | | | (16.0) | | NM | | | (22.6) | | NM |
Loss from continuing operations | | (152.3) | | | (9.6) | | | (31.3) | | | (142.7) | | NM | | | 21.7 | | 69% |
Loss from discontinued operations,
net of income taxes | | (15.6) | | | (21.6) | | | (3.6) | | | 6.0 | | 28% | | | (18.0) | | NM |
Net loss | | (167.9) | | | (31.2) | | | (34.9) | | | (136.7) | | NM | | | 3.7 | | 11% |
Less: Net income (loss) attributable to
noncontrolling interests | | 0.6 | | | (0.5) | | | (0.5) | | | 1.1 | | NM | | | — | | 0% |
Net loss attributable to The Phoenix Companies, Inc. | $ | (168.5) | | $ | (30.7) | | $ | (34.4) | | $ | (137.8) | | NM | | $ | 3.7 | | 11% |
———————
Not meaningful (NM)
Analysis of Consolidated Results of Operations
Year ended December 31, 2012 compared to year ended December 31, 2011
The Company recorded a net loss from continuing operations for the twelve months ended December 31, 2012 of $152.3 million, or $(26.40) per share, compared with a net loss from continuing operations of $9.6 million, or $(1.65) per share for the twelve months ended December 31, 2011. The decrease in results from continuing operations reflects higher policy benefits and policy acquisition cost amortization and lower premium revenue and fee income. These declines in results were partially offset by higher net investment income and realized investment gains.
50
Premium revenue decreased $46.4 million in the twelve months ended December 31, 2012 compared with the twelve months ended December 31, 2011 as a result of lower renewal premiums within the closed block and lower paid up additions on policies within the closed block due to a change in the dividend scale in 2011.
Fees on our life and annuity products decreased $40.6 million in the twelve months ended December 31, 2012 compared with the twelve months ended December 31, 2011. Lower fees were primarily a result of COI charges which decreased $39.6 million related to declining universal life and variable universal life insurance in force. In addition, investment fees decreased during 2012 compared with 2011 due to the sale of Goodwin Capital Advisers, Inc. during the fourth quarter of 2011. Partially offsetting these declines were higher fees related to an increase in outstanding annuity policies.
Net investment income increased by $6.4 million to $829.3 million for the twelve months ended December 31, 2012 compared to $822.9 million for the twelve months ended December 31, 2011. The increase was due to higher investment income on long-term debt securities as a result of additional purchases during the year and higher returns on private equity investments. These increases were partially offset by lower interest income on policy loans due to the declining balance of policy loans outstanding.
Net realized investment losses of $10.5 million were recognized for the twelve months ended December 31, 2012 compared to net realized investment losses of $32.1 million for the twelve months ended December 31, 2011. Net realized gains on sales of long-term debt securities accounted for $31.0 million of the total realized gains over the year as interest rates reached historically low levels in 2012. Common and preferred equity investments and other alternative investments accounted for gains of $13.3 million due to strong performance in global equity markets during 2012. These gains were partially offset by impairments of $28.8 million on long-term debt securities and common stock and losses of $38.3 million on derivative assets and embedded derivative liabilities. These derivative losses were primarily attributable to a loss of $34.2 million on derivative contracts which hedge the variable annuity and fixed indexed annuity guarantees, offset by $12.1 million in gains on embedded derivative liabilities associated with fixed and variable annuity guarantees. Included in the net derivative loss were gains of $9.8 million associated with the non-performance risk factor. In addition, realized losses of $15.9 million related to our surplus hedge, which utilizes futures and options to hedge against declines in equity markets and the resulting statutory capital and surplus impact.
Gain on debt repurchase increased by $11.7 million for the twelve months ended December 31, 2012 compared with the twelve months ended December 31, 2011. The Company repurchased $48.3 million par value of surplus notes during 2012.
Policy benefits increased $29.1 million for the twelve months ended December 31, 2012 compared with the twelve months ended December 31, 2011. The increase in policy benefit expense was a result of higher death benefits for universal life and traditional whole life products as a result of negative mortality experience during 2012, primarily in the third quarter. Annuity benefits increased largely due to changes in reserves on fixed indexed annuities associated with minimum death and income benefit guarantees which were driven by increased sales during the year. Policy benefit expenses of $36.3 million were incurred during 2012 due to reserve unlocking adjustments as a result of our annual comprehensive review of actuarial assumptions in the third quarter of 2012. These expenses were partially offset by lower policy benefits within the closed block.
Policy acquisition cost amortization increased $42.1 million in the twelve months ended December 31, 2012 compared with the twelve months ended December 31, 2011. This increase in amortization was attributable to the unlocking of assumptions as a result the annual comprehensive review of assumptions in the third quarter of 2012. The unlocking resulted in amortization of $55.2 million in 2012, which included amortization of $46.2 million for traditional life policies from lower projected net yields related to investment income returns and amortization of $6.0 million for universal life policies primarily due to lower spreads due to the low interest rate environment. Excluding the impact of the unlocking, amortization related to universal life decreased as a result of negative mortality experience during the year. Amortization related to annuities decreased primarily as a result of improved market performance.
The effective tax rate for 2012 and 2011 was 2.4% and 455.5% respectively. The principal cause of the difference between the effective rate and the U.S. statutory rate of 35% in 2012 was an increase in the valuation allowance on the pre-tax loss, expired tax attribute carryforwards and the dividend received deduction. The principal cause of the difference between the effective rate and the U.S. statutory rate of 35% in 2011 was an increase in the valuation allowance on the pre-tax income and the dividend received deduction.
51
The Company recorded an income tax benefit of $3.7 million to continuing operations in 2012, compared to an income tax expense of $12.3 million to continuing operations in 2011. A current tax expense of $15.6 million was recognized related to the accrual of regular taxes, offset by available credits up to the alternative minimum tax liability. This current tax expense was offset by a deferred tax benefit of $19.3 million that results from the application of ASC 740 intraperiod allocation rules. These rules allow for the benefitting of current year losses in continuing operations when an increase to the valuation allowance is avoided due to the existence of current year income elsewhere reported in the financial statements (e.g., discontinued operations, other comprehensive income). In 2011, a current tax expense of $12.3 million was recognized related to alternative minimum tax.
A net loss from discontinued operations of $15.6 million was recognized for the twelve months ended December 31, 2012, primarily due to outside legal fees and the commutation of certain contracts in the second quarter of 2012.
Year ended December 31, 2011 compared to year ended December 31, 2010
The Company recorded a net loss from continuing operations for the twelve months ended December 31, 2011 of $9.6 million, or $(1.65) per share, compared with a net loss from continuing operations of $31.3 million, or $(5.39) per share for the twelve months ended December 31, 2010. The increase in results from continuing operations reflects lower policy acquisition cost amortization and other operating expenses. These increases in results were partially offset by lower premium revenue, fee income and net investment income and higher net realized investment losses.
Premium revenue decreased $58.8 million in the twelve months ended December 31, 2011 compared with the twelve months ended December 31, 2010 as a result of lower renewal premiums and lower paid up additions on policies within the closed block as a result of the change in the 2011 dividend scale. These decreases were partially offset by increases in premium revenue within the traditional life lines of business.
Fees on our life and annuity products declined as a result of lower surrenders and a decline in funds under management on universal life, variable universal life and variable annuity products. In addition, cost of insurance fees declined $23.3 million primarily related to lower insurance in force in our universal life lines of business. Offsetting these declines was an increase in non-asset based fees related to fixed indexed annuities.
Net realized investment losses of $32.1 million were recognized for the twelve months ended December 31, 2011 compared to net realized investment losses of $11.2 million for the twelve months ended December 31, 2010. Net realized gains on sales of long-term debt securities accounted for $8.6 million of the total realized gains over the year. Common equity investments accounted for gains of $3.8 million. These gains were partially offset by impairments of $26.8 million on long-term debt securities and common stock and losses of $20.0 million on derivative assets and embedded derivative liabilities. The Company recognized a realized capital gain of $4.0 million from the sale of Goodwin.
Policy acquisition cost amortization decreased $110.3 million for the twelve months ended December 31, 2011 compared to the twelve months ended December 31, 2010. This decrease in amortization was attributable to the unlocking of assumptions as a result of annual comprehensive reviews of assumptions in the third quarters of 2011 and 2010. The unlocking resulted in an overall decrease in amortization of $2.8 million in 2011, compared to an acceleration of amortization of $58.1 million in 2010. In 2010, the unlocking was primarily driven by increased lapses in portions of our universal life business which resulted in $36.6 million of additional amortization. Excluding the impact of the unlocking, amortization was lower by $52.3 million as a result of less favorable mortality experience during 2011 primarily within the universal life product line.
Operating expenses decreased $40.7 million to $247.9 million in the twelve months ended December 31, 2011, compared to $288.6 million in the twelve months ended December 31, 2010. The decrease in operating expenses was a result of lower professional fees and outside services as well as lower compensation related expenses.
A net loss from discontinued operations of $21.6 million was recognized during 2011 which was primarily attributable to our discontinued group accident and health reinsurance operations as we strengthened reserves to reflect developments in the contracts underlying the block. See Note 21 to our consolidated financial statements in this Annual Report on Form 10-K for more information on discontinued operations.
52
The effective tax rate for 2011 and 2010 was 455.5% and 24.8%, respectively. The principal cause of the difference between the effective rate and the U.S. statutory rate of 35% in 2011 was an increase in the valuation allowance on the pre-tax income and the dividend received deduction. The principal cause of the difference between the effective rate and the U.S. statutory rate of 35% in 2010 was the dividend received deduction, an increase in the valuation allowance on the pre-tax loss and the expiration of tax credits.
The Company recorded an income tax expense of $12.3 million to continuing operations in 2011, compared to an income tax benefit of $10.3 million to continuing operations in 2010. A current tax expense of $12.3 million was recognized related to alternative minimum tax. In 2010, as a result of the application of the same intraperiod allocation rules that were applicable and described above in relation to 2012, a $14.4 million tax benefit was recorded to continuing operations, which was offset by current tax expense of $4.1 million.
| | | | | | | | | | |
Summary Consolidated Financial Data: | Three Months Ended | | Increase (decrease) and |
($ in millions) | March 31, | | percentage change |
| 2012 | | 2011 | | 2012 vs. 2011 |
| As restated and amended | | As restated and amended | | As restated and amended |
| | |
REVENUES: | | | | | | | | | | |
Premiums | $ | 97.5 | | $ | 107.6 | | $ | (10.1) | | (9%) |
Fee income | | 146.7 | | | 154.7 | | | (8.0) | | (5%) |
Net investment income | | 217.9 | | | 214.0 | | | 3.9 | | 2% |
Net realized investment gains (losses): | | | | | | | | | | |
Total OTTI losses | | (10.5) | | | (7.9) | | | (2.6) | | (33%) |
Portion of OTTI losses recognized in OCI | | 3.7 | | | 1.8 | | | 1.9 | | NM |
Net OTTI losses recognized in earnings | | (6.8) | | | (6.1) | | | (0.7) | | (11%) |
Net realized investment losses, excluding OTTI losses | | (1.8) | | | (3.4) | | | 1.6 | | 47% |
Total net realized investment losses | | (8.6) | | | (9.5) | | | 0.9 | | 9% |
Gain on debt repurchase | | — | | | — | | | — | | — |
Total revenues | | 453.5 | | | 466.8 | | | (13.3) | | (3%) |
| | | | | | | | | | |
BENEFITS AND EXPENSES: | | | | | | | | | | |
Policy benefits, excluding policyholder dividends | | 258.0 | | | 266.3 | | | (8.3) | | (3%) |
Policyholder dividends | | 70.6 | | | 77.1 | | | (6.5) | | (8%) |
Policy acquisition cost amortization | | 53.4 | | | 51.8 | | | 1.6 | | 3% |
Interest expense on indebtedness | | 7.9 | | | 7.9 | | | — | | 0% |
Other operating expenses | | 65.4 | | | 65.7 | | | (0.3) | | 0% |
Total benefits and expenses | | 455.3 | | | 468.8 | | | (13.5) | | (3%) |
Income before income taxes | | (1.8) | | | (2.0) | | | 0.2 | | 10% |
Income tax expense | | 11.3 | | | 7.7 | | | 3.6 | | 47% |
Loss from continuing operations | | (13.1) | | | (9.7) | | | (3.4) | | (35%) |
Loss from discontinued operations, net of income taxes | | (0.5) | | | (1.5) | | | 1.0 | | 67% |
Net loss | | (13.6) | | | (11.2) | | | (2.4) | | (21%) |
Less: Net income (loss) attributable to noncontrolling interests | | (0.1) | | | (0.1) | | | — | | 0% |
Net loss attributable to The Phoenix Companies, Inc. | $ | (13.5) | | $ | (11.1) | | $ | (2.4) | | (22%) |
———————
Not meaningful (NM)
Analysis of Consolidated Results of Operations
Three months ended March 31, 2012 vs. March 31, 2011
The Company recorded a net loss from continuing operations for the three months ended March 31, 2012 of $13.1 million, or $(2.25) per share, compared with a net loss from continuing operations of $9.7 million, or $(1.67) per share for the three months ended March 31, 2011. The decrease in results from continuing operations reflects lower premiums and fee income and a higher income tax expense. These items were partially offset by higher net investment income and lower policy benefits.
Premium revenue decreased $10.1 million in the three months ended March 31, 2012 compared with the three months ended March 31, 2011 as a result of lower renewal premiums on traditional life lines of business, as well as lower paid up additions on policies within the closed block due to a change in the dividend scale in 2011.
53
Fees on our life and annuity products decreased $8.0 million in the three months ended March 31, 2012 compared with the three months ended March 31, 2011. Lower fees were primarily a result of COI charges which decreased $7.9 million related to declining universal life and variable universal life insurance in force.
Net investment income increased by $3.9 million to $217.9 million for the three months ended March 31, 2012 compared to $214.0 million for the three months ended March 31, 2011. The increase was due to higher investment income on long-term debt securities as a result of additional purchases during the year and higher returns on mezzanine and direct equity investments.
Net realized investment losses of $8.6 million were recognized for the three months ended March 31, 2012, compared with $9.5 million for the three months ended March 31, 2011. Realized investment losses for the quarter were due to an impairment loss of $6.8 million on long-term debt securities and a net loss of $5.6 million on derivative assets and embedded derivative liabilities. The derivative loss was primarily attributable to a $23.4 million loss associated with derivatives related to variable and fixed indexed annuity guarantees and realized losses of $6.0 million related to our surplus hedge, which utilizes futures and options to hedge against declines in equity markets and the resulting statutory capital and surplus impact. Partially offsetting these losses were gains of $24.1 million related to embedded derivative liabilities associated with variable and fixed indexed annuity guarantees and a realized gain of $7.0 million associated with the non-performance risk factor.
Policy benefits decreased $8.3 million for the three months ended March 31, 2012 compared with the three months ended March 31, 2011. The decrease in policy benefit expense was primarily a result of lower variable universal life and closed block death benefits due to positive mortality during the first quarter. These decreases were partially offset by higher benefits on tradition life policies due to negative mortality and higher annuity benefits due to changes in reserves on fixed indexed annuities associated with minimum death and income benefit guarantees which were driven by increased sales during the period.
The Company recorded income tax expense of $11.3 million and $7.7 million to continuing operations for the three months ended March 31, 2012 and 2011, respectively. The income tax expense relates primarily to the alternative minimum tax of $11.9 million. The expected deferred tax offset related to the alternative minimum tax credit carryforward was eliminated by an increase in the valuation allowance. Additionally, this alternative minimum tax impact was offset by a deferred tax benefit of $0.6 million that results from the application of ASC 740 intraperiod allocation rules. These rules allow for the benefitting of current year losses in continuing operations when an increase to the valuation allowance is avoided due to the existence of current year income elsewhere reported in the financial statements (e.g., discontinued operations, other comprehensive income).
For the three months ended March 31, 2012 and 2011, the net losses from discontinued operations of $0.5 million and $1.5 million, respectively, primarily consisted of legal expenses associated with litigation related to our indemnification of Tiptree in accordance with the definitive sales agreement.
54
| | | | | | | | | | |
Summary Consolidated Financial Data: | Three Months Ended | | Increase (decrease) and |
($ in millions) | June 30, | | percentage change |
| 2012 | | 2011 | | 2012 vs. 2011 |
| As restated and amended | | As restated and amended | | As restated and amended |
| | |
REVENUES: | | | | | | | | | | |
Premiums | $ | 98.3 | | $ | 104.1 | | $ | (5.8) | | (6%) |
Fee income | | 137.6 | | | 154.6 | | | (17.0) | | (11%) |
Net investment income | | 200.3 | | | 210.6 | | | (10.3) | | (5%) |
Net realized investment gains (losses): | | | | | | | | | | |
Total OTTI losses | | (12.9) | | | (5.8) | | | (7.1) | | NM |
Portion of OTTI losses recognized in OCI | | 7.8 | | | 3.1 | | | 4.7 | | NM |
Net OTTI losses recognized in earnings | | (5.1) | | | (2.7) | | | (2.4) | | (89%) |
Net realized investment gains (losses), excluding OTTI losses | | (12.2) | | | 4.3 | | | (16.5) | | NM |
Net realized investment gains (losses) | | (17.3) | | | 1.6 | | | (18.9) | | NM |
Gain on debt repurchase | | — | | | — | | | — | | — |
Total revenues | | 418.9 | | | 470.9 | | | (52.0) | | (11%) |
| | | | | | | | | | |
BENEFITS AND EXPENSES: | | | | | | | | | | |
Policy benefits, excluding policyholder dividends | | 278.4 | | | 289.2 | | | (10.8) | | (4%) |
Policyholder dividends | | 70.7 | | | 68.4 | | | 2.3 | | 3% |
Policy acquisition cost amortization | | 39.5 | | | 40.1 | | | (0.6) | | (1%) |
Interest expense on indebtedness | | 7.9 | | | 7.9 | | | — | | 0% |
Other operating expenses | | 59.8 | | | 64.0 | | | (4.2) | | (7%) |
Total benefits and expenses | | 456.3 | | | 469.6 | | | (13.3) | | (3%) |
Loss from continuing operations before income taxes | | (37.4) | | | 1.3 | | | (38.7) | | NM |
Income tax expense (benefit) | | (7.4) | | | 8.6 | | | (16.0) | | NM |
Loss from continuing operations | | (30.0) | | | (7.3) | | | (22.7) | | NM |
Loss from discontinued operations, net of income taxes | | (5.5) | | | (0.7) | | | (4.8) | | NM |
Net loss | | (35.5) | | | (8.0) | | | (27.5) | | NM |
Less: Net income (loss) attributable to noncontrolling interests | | (0.1) | | | — | | | (0.1) | | NM |
Net loss attributable to The Phoenix Companies, Inc. | $ | (35.4) | | $ | (8.0) | | $ | (27.4) | | NM |
———————
Not meaningful (NM)
Analysis of Consolidated Results of Operations
Three months ended June 30, 2012 compared with three months ended June 30, 2011
The Company’s net loss from continuing operations for the three months ended June 30, 2012 was $30.0 million, or ($5.16) per share, compared with a net loss from continuing operations of $7.3 million, or ($1.26) per share for the three months ended June 30, 2011. The increase in the net loss reflects declines in fee income and net investment income and an increase in net realized investment losses. These declines in results were partially offset by lower policy benefits.
Fees on our life and annuity products decreased $17.0 million in the three months ended June 30, 2012 compared with the three months ended June 30, 2011. Lower fees were primarily a result of a decrease of $9.6 million in COI charges related to declining universal life and variable universal life insurance in force and a decrease of $2.6 million in surrender charges consistent with lower policy surrenders. Other fee income decreased $5.1 million in the quarter ended June 30, 2012 compared with the quarter ended June 30, 2011, primarily attributable to a decrease in investment management fees subsequent to the sale of Goodwin in the fourth quarter of 2011.
Net investment income decreased by $10.3 million to $200.3 million for the three months ended June 30, 2012 compared to $210.6 million for the three months ended June 30, 2011. The decrease was due primarily to declines in investment income from direct equity investments and mezzanine debt and higher bond premium amortization.
55
Net realized investment losses of $17.3 million were recognized for the three months ended June 30, 2012, compared with a net realized investment gain of $1.6 million for the three months ended June 30, 2011. Realized investment losses for the quarter were due to an impairment loss of $5.1 million on common stock and long-term debt securities and a net loss of $13.7 million on derivative assets and embedded derivative liabilities. These losses were partially offset by net realized gains on $3.2 million on long-term debt securities. The derivative loss was attributable to a loss of $24.3 million on our embedded derivative liabilities associated with variable and fixed indexed annuity guarantees and a $7.0 million loss on derivative contracts associated with our fixed indexed annuity guarantees. These losses were offset by derivative gains of $15.5 million on derivative contracts related to variable annuity guarantees and a gain of $1.6 million related to our surplus hedge which utilizes futures and options to hedge against declines in equity markets and the resulting statutory capital and surplus impact. A loss of $3.5 million related to the non-performance risk factor was included in the total derivative loss.
Policy benefits decreased $10.8 million for the three months ended June 30, 2012 compared with the three months ended June 30, 2011. The decrease in policy benefit expenses was primarily a result of lower universal life and closed block death benefits due to positive mortality over the quarter. These decreases were partially offset by increases in loss recognition related to traditional life policies and higher annuity benefits due to changes in reserves on fixed indexed annuities associated with minimum death and income benefit guarantees, which were driven by increased sales during the period.
Other operating expenses decreased $4.2 million to $59.8 million for the quarter ended June 30, 2012, compared with $64.0 million for the quarter ended June 30, 2011. The decrease in operating expenses was a result of lower sales incentives and compensation expenses, which were partially offset by higher professional fees.
The Company recorded an income tax benefit of $7.4 million to continuing operations for the quarter ended June 30, 2012 compared with income tax expense of $8.6 million as of June 30, 2011. The decrease was driven by a $13.0 million benefit that results from the application of ASC 740 intraperiod allocation rules. These rules allow for the benefitting of current year losses in continuing operations when an increase to the valuation allowance is avoided due to the existence of current year income elsewhere reported in the financial statements (e.g., discontinued operations, other comprehensive income). This benefit was offset by a decrease of $5.6 million of current tax accrued.
A net loss from discontinued operations of $5.5 million was recognized for the quarter ended June 30, 2012, primarily due to the commutation of certain contracts.
56
| | | | | | | | | | |
Summary Consolidated Financial Data: | Three Months Ended September 30, | | Increase (decrease) and percentage change |
($ in millions) | |
| 2012 | | 2011 | | 2012 vs. 2011 |
| | | As restated and amended | | |
| | | | |
REVENUES: | | | | | | | | | | |
Premiums | $ | 94.8 | | $ | 111.9 | | $ | (17.1) | | (15%) |
Fee income | | 138.8 | | | 146.5 | | | (7.7) | | (5%) |
Net investment income | | 205.1 | | | 203.5 | | | 1.6 | | 1% |
Net realized investment gains (losses): | | | | | | | | | | |
Total OTTI losses | | (7.2) | | | (30.9) | | | 23.7 | | 77% |
Portion of OTTI losses recognized in OCI | | (0.2) | | | 21.2 | | | (21.4) | | NM |
Net OTTI losses recognized in earnings | | (7.4) | | | (9.7) | | | 2.3 | | 24% |
Net realized investment gains (losses), excluding OTTI losses | | 34.9 | | | (0.4) | | | 35.3 | | NM |
Net realized investment gains (losses) | | 27.5 | | | (10.1) | | | 37.6 | | NM |
Gain on debt repurchase | | 11.9 | | | — | | | 11.9 | | NM |
Total revenues | | 478.1 | | | 451.8 | | | 26.3 | | 6% |
| | | | | | | | | | |
BENEFITS AND EXPENSES: | | | | | | | | | | |
Policy benefits, excluding policyholder dividends | | 352.5 | | | 293.1 | | | 59.4 | | 20% |
Policyholder dividends | | 81.0 | | | 53.5 | | | 27.5 | | 51% |
Policy acquisition cost amortization | | 71.7 | | | 35.1 | | | 36.6 | | NM |
Interest expense on indebtedness | | 7.9 | | | 7.9 | | | — | | 0% |
Other operating expenses | | 61.9 | | | 57.4 | | | 4.5 | | 8% |
Total benefits and expenses | | 575.0 | | | 447.0 | | | 128.0 | | 29% |
Income (loss) from continuing operations before income taxes | | (96.9) | | | 4.8 | | | (101.7) | | NM |
Income tax benefit | | (4.9) | | | (6.8) | | | 1.9 | | 28% |
Income (loss) from continuing operations | | (92.0) | | | 11.6 | | | (103.6) | | NM |
Loss from discontinued operations, net of income taxes | | (6.0) | | | (3.9) | | | (2.1) | | (54%) |
Net loss | | (98.0) | | | 7.7 | | | (105.7) | | NM |
Less: Net income (loss) attributable to noncontrolling interests | | 0.8 | | | (0.3) | | | 1.1 | | NM |
Net loss attributable to The Phoenix Companies, Inc. | $ | (98.8) | | $ | 8.0 | | $ | (106.8) | | NM |
———————
Not meaningful (NM)
Analysis of Consolidated Results of Operations
Three months ended September 30, 2012 compared with three months ended September 30, 2011
The Company recorded a net loss from continuing operations for the three months ended September 30, 2012 of $92.0 million, or $(16.00) per share, compared with net income from continuing operations of $11.6 million, or $1.99 per share for the three months ended September 30, 2011. The decrease in results from continuing operations reflects higher policy benefits and policy acquisition cost amortization, and lower premium revenue and fee income. These declines in results were partially offset by higher realized investment gains.
Premium revenue decreased $17.1 million in the quarter ended September 30, 2012 compared with the quarter ended September 30, 2011 as a result of lower renewal premiums on traditional life lines of business, as well as lower paid up additions on policies within the closed block due to a change in the dividend scale in 2011.
Fees on our life and annuity products decreased $7.7 million in the quarter ended September 30, 2012 compared with the quarter ended September 30, 2011. Lower fees were primarily a result of COI charges which decreased $8.3 million related to declining universal life insurance in force.
Net investment income increased by $1.6 million to $205.1 million for the three months ended September 30, 2012 compared to $203.5 million for the three months ended September 30, 2011. The increase was due to higher investment income on long-term debt securities as a result of additional purchase over the period which was partially offset by lower interest income on policy loans due to the declining balance of loans outstanding.
57
Net realized investment gains of $27.5 million were recognized for the three months ended September 30, 2012 compared to net realized investment losses of $10.1 million for the three months ended September 30, 2011. Net realized gains on sales of long-term debt securities accounted for $22.6 million of the total realized gains as interest rates reached historically low levels during the quarter. In addition, net realized gains of $10.7 million were related to sales of preferred and common equity investments. Offsetting these gains were impairment losses of $7.4 million on long-term debt securities and $7.1 million in losses on derivative assets and embedded derivative liabilities. The derivative losses were due to a loss of $6.2 million on derivative contracts associated with variable annuity and fixed indexed annuity guarantees and losses of $7.9 million related to the surplus hedge which utilizes futures and options to hedge against declines in equity markets and the resulting statutory capital and surplus impact. Partially offsetting these losses were gains of $7.1 million on embedded derivative liabilities associated with variable and fixed indexed annuity guarantees and a gain of $3.4 million associated with the nonperformance risk factor.
Gain on debt repurchase increased by $11.9 million for the three months ended September 30, 2012 compared with the three months ended September 30, 2011. The Company repurchased $48.3 million par value of surplus notes during 2012.
Policy benefits increased $59.4 million for the three months ended September 30, 2012 compared to the three months ended September 30, 2011. The increase in policy benefit expense was driven by adverse mortality and significant claim expenses, primarily related to universal life. Fluctuations in mortality are inherent in our lines of business. Annuity benefits increased due to changes in reserves on fixed indexed annuities associated with minimum death and income benefit guarantees, which were driven by increased sales during the period. In addition, our annual comprehensive review of actuarial assumptions in the third quarter of 2012 increased benefits $36.3 million as a result of unlocking adjustments. These increases in expenses were partially offset by lower policy benefits within the closed block.
Policyholder dividends increased $27.5 million for the three months ended September 30, 2012 compared to the three months ended September 30, 2011 due to lower policy benefits from favorable mortality within the closed block and from the portion of the net investment gains attributable to the closed block.
Policy acquisition cost amortization increased $36.6 million for the three months ended September 30, 2012 compared with the three months ended September 30, 2011. This increase in amortization was attributable to the unlocking of assumptions as a result the annual comprehensive review of assumptions in the third quarter of 2012. The unlocking resulted in an overall increase in amortization of $46.3 million in the third quarter of 2012, which included an increase of $37.0 million for traditional life policies from lower projected net yields related to investment income returns and an increase of $6.7 million for universal life policies from lower spreads due to low interest rate environment. Excluding the impact of the unlocking, amortization decreased related to variable and universal life as a result of poor mortality experience during the current quarter. Amortization related to annuities decreased primarily as a result of improved market performance.
The Company recorded income tax benefit of $4.9 million to continuing operations for the quarter ended September 30, 2012 compared with $6.8 million as of September 30, 2011. The decrease was driven by a $10.8 million benefit that results from the application of ASC 740 intraperiod allocation rules. These rules allow for the benefitting of current year losses in continuing operations when an increase to the valuation allowance is avoided due to the existence of current year income elsewhere reported in the financial statements (e.g., discontinued operations, other comprehensive income). This benefit was offset by an additional $5.9 million of current tax accrued.
A net loss from discontinued operations of $6.0 million was recognized for the three months ended September 30, 2012, primarily due to outside legal expenses associated with litigation related to our indemnification of Tiptree in accordance with the definitive sales agreement.
58
| | | | | | | | | | |
Summary Consolidated Financial Data: | Three Months Ended December 31, | | Increase (decrease) and percentage change |
($ in millions) | |
| 2012 | | 2011 | | 2012 vs. 2011 |
| | | As restated and amended | | |
| | | | |
REVENUES: | | | | | | | | | | |
Premiums | $ | 111.7 | | $ | 125.1 | | $ | (13.4) | | (11%) |
Fee income | | 133.1 | | | 141.0 | | | (7.9) | | (6%) |
Net investment income | | 206.0 | | | 194.8 | | | 11.2 | | 6% |
Net realized investment losses: | | | | | | | | | | |
Total OTTI losses | | (21.1) | | | (20.7) | | | (0.4) | | (2%) |
Portion of OTTI losses recognized in OCI | | 11.6 | | | 12.4 | | | (0.8) | | (6%) |
Net OTTI losses recognized in earnings | | (9.5) | | | (8.3) | | | (1.2) | | (14%) |
Net realized investment losses, excluding OTTI losses | | (2.6) | | | (5.8) | | | 3.2 | | 55% |
Net realized investment losses | | (12.1) | | | (14.1) | | | 2.0 | | 14% |
Gain on debt repurchase | | — | | | 0.2 | | | (0.2) | | (100%) |
Total revenues | | 438.7 | | | 447.0 | | | (8.3) | | (2%) |
| | | | | | | | | | |
BENEFITS AND EXPENSES: | | | | | | | | | | |
Policy benefits, excluding policyholder dividends | | 277.2 | | | 288.4 | | | (11.2) | | (4%) |
Policyholder dividends | | 72.5 | | | 60.2 | | | 12.3 | | 20% |
Policy acquisition cost amortization | | 35.4 | | | 30.9 | | | 4.5 | | 15% |
Interest expense on indebtedness | | 7.1 | | | 8.1 | | | (1.0) | | (12%) |
Other operating expenses | | 66.4 | | | 60.8 | | | 5.6 | | 9% |
Total benefits and expenses | | 458.6 | | | 448.4 | | | 10.2 | | 2% |
Income from continuing operations before income taxes | | (19.9) | | | (1.4) | | | (18.5) | | NM |
Income tax expense (benefit) | | (2.7) | | | 2.8 | | | (5.5) | | NM |
Loss from continuing operations | | (17.2) | | | (4.2) | | | (13.0) | | NM |
Loss from discontinued operations, net of income taxes | | (3.6) | | | (15.5) | | | 11.9 | | 77% |
Net loss | | (20.8) | | | (19.7) | | | (1.1) | | (6%) |
Less: Net income (loss) attributable to noncontrolling interests | | — | | | (0.1) | | | 0.1 | | 100% |
Net loss attributable to The Phoenix Companies, Inc. | $ | (20.8) | | $ | (19.6) | | $ | (1.2) | | (6%) |
———————
Not meaningful (NM)
Analysis of Consolidated Results of Operations
Three months ended December 31, 2012 compared with three months ended December 31, 2011
The Company recorded a net loss from continuing operations for the three months ended December 31, 2012 of $17.2 million, or $(3.02) per share, compared with a net loss from continuing operations of $4.2 million, or $(0.72) per share for the three months ended December 31, 2011. The decrease in results from continuing operations reflects lower premiums and fee income. These declines in results were partially offset by higher net investment income.
Premium revenue decreased $13.4 million in the three months ended December 31, 2012 compared with the three months ended December 31, 2011 as a result of lower renewal premiums in the closed block, as well as lower paid up additions on policies within the closed block due to a change in the dividend scale in 2011.
Fees on our life and annuity products decreased $7.9 million in the three months ended December 31, 2012 compared with the three months ended December 31, 2011. Lower fees were primarily a result of COI charges which decreased $13.2 million primarily related to declining universal life insurance in force. These decreases were partially offset by a $2.6 increase in administrative fees on annuity products and a $3.0 million increase in Saybrus commissions as a result of product sales during the quarter.
Net investment income increased by $11.2 million to $206.0 million for the three months ended December 31, 2012 compared to $194.8 million for the three months ended December 31, 2011. The increase was due to higher returns on private equity and infrastructure funds, which were partially offset by lower interest income on policy loans due to the declining balance of policy loans outstanding.
59
Net realized investment losses of $12.1 million were recognized for the three months ended December 31, 2012 compared to net realized investment losses of $14.1 million for the three months ended December 31, 2011. Net realized gains of $5.3 million on long-term bonds and common stock gains of $3.3 million were offset by an impairment loss of $9.5 million on long-term debt securities and losses on derivative assets and embedded derivative liabilities totaling $11.8 million. This derivative loss was primarily attributable to a loss of $13.2 million on derivatives associated with variable fixed indexed annuity guarantees, offset by $5.2 million in gains on embedded derivatives liabilities associated with variable and fixed indexed annuity guarantees. Included in the net derivative loss were gains of $3.0 million associated with the non-performance risk factor. In addition, realized losses of $3.5 million related to our surplus hedge, which utilizes futures and options to hedge against declines in equity markets and the resulting statutory capital and surplus impact.
Policyholder dividends increased $12.3 million for the three months ended December 31, 2012 primarily due to favorable mortality experience within the closed block compared to the three months ended December 31, 2011 which experienced negative mortality.
The Company recorded income tax benefit of $2.7 million to continuing operations for the quarter ended December 31, 2012 compared with income tax expense of $2.8 million as of December 31, 2011. The decrease was driven by a $5.1 million expense recorded due to the exception to the intraperiod allocation rules in accordance with ASC 740-20,Accounting for Income Taxes – Intraperiod Tax Allocation, offset by a decrease of $7.8 million of current tax accrued.
Effects of Inflation
For the years 2012, 2011 and 2010, inflation did not have a material effect on our consolidated results of operations.
Enterprise Risk Management
We have an enterprise-wide risk management program. Our Chief Risk Officer reports to the Chief Executive Officer and monitors our risk management activities. The Chief Risk Officer provides regular reports to the Board without the presence of other members of management. Our risk management governance consists of several management committees to oversee and address issues pertaining to all our major risks—operational, market and product—as well as capital management. In all cases, these committees include one or more of our Chief Executive Officer, Chief Financial Officer, Chief Investment Officer and Chief Risk Officer.
Operational Risk
Operational risk is the risk of loss resulting from inadequate or failed internal processes, people and systems or from external events. As reported in “Item 9A: Controls and Procedures” of this Annual Report on Form 10-K, the Company has concluded that there are material weaknesses in its internal control over financial reporting, which have materially adversely affected its ability to timely and accurately report its results of operations and financial condition, and that its disclosure controls and procedures are ineffective as of December 31, 2012. These material weaknesses have not been fully remediated as of the filing date of this report and the Company cannot assure that other material weaknesses will not be identified in the future. It is necessary for the Company to maintain effective internal control over financial reporting to prevent fraud and errors, and to maintain effective disclosure controls and procedures so that it can provide timely and reliable financial and other information. If the Company fails to maintain an effective system of internal controls, the accuracy and timing of its financial reporting may be adversely affected. Further, the absence of timely and reliable financial and other information about the Company’s business operations may inhibit the Company’s ability to identify operational risk. A failure to correct material weaknesses in our internal controls could result in further restatements of financial statements and correction of other information filed with the SEC. See “Item 1A: Risk Factors” in Part I of this Annual Report on Form 10-K for a description of these and other risks that may impact the Company’s operations. Also see “Item 9A: Controls and Procedures” in Part II of this Annual Report on Form 10-K for more information regarding these weaknesses, an evaluation of the effectiveness of the Company’s disclosure controls and procedures, and the Company’s remediation plans.
The Operational Risk Committee, chaired by the Chief Risk Officer, develops an enterprise-wide framework for managing operational risks. This committee meets periodically and includes membership that represents all significant operating, financial and staff departments of the Company. Among the risks the committee reviews and manages and for which it provides general oversight are business continuity risk, disaster recovery risk and risks related to the Company’s information technology systems.
60
Market Risk
Market risk is the risk that we will incur losses due to adverse changes in market rates and prices. We have exposure to market risk through both our investment activities and our insurance operations. Our investment objective is to maximize after-tax investment return within defined risk parameters. Our primary sources of market risk are:
·
interest rate risk, which relates to the market price and cash flow variability associated with changes in market interest rates;
·
credit risk, which relates to the uncertainty associated with the ongoing ability of an obligor to make timely payments of principal and interest; and
·
equity risk, which relates to the volatility of prices for equity and equity-like investments, such as limited partnerships.
We measure, manage and monitor market risk associated with our insurance and annuity business as part of our ongoing commitment to fund insurance liabilities. We have developed an integrated process for managing the interaction between product features and market risk. This process involves our Corporate Finance, Corporate Portfolio Management and Life and Annuity Product Development departments. These areas coordinate with each other and report results and make recommendations to our Asset-Liability Management Committee (“ALCO”) chaired by the Chief Financial Officer.
We also measure, manage and monitor market risk associated with our investments, both those backing insurance liabilities and those supporting surplus. This process primarily involves Corporate Portfolio Management. This organization makes recommendations and reports results to our Investment Policy Committee, chaired by the Chief Investment Officer. Please refer to the sections that follow, including “Debt and Equity Securities,” following this discussion of Enterprise Risk Management, for more information on our investment risk exposures. Within the parameters specified in our investment policy, we regularly refine our allocations based on factors including ratings, duration and type of fixed income security to appropriately balance market risk exposure and expected return.
Interest Rate Risk Management
Interest rate risk is the risk that we will incur economic losses due to adverse changes in interest rates. Our exposure to interest rate changes results primarily from our interest-sensitive insurance liabilities and from our significant holdings of fixed rate investments. Our insurance liabilities largely comprise dividend-paying individual whole life and universal life policies and annuity contracts. Our fixed maturity investments include U.S. and foreign government bonds, securities issued by government agencies, corporate bonds, asset-backed securities and mortgage-backed securities, most of which are exposed to changes in medium-term and long-term U.S. Treasury rates.
We manage interest rate risk as part of our asset-liability management and product development processes. Asset-liability management strategies include the segmentation of investments by product line and the construction of investment portfolios designed to satisfy the projected cash needs of the underlying product liabilities. All asset-liability strategies are approved by the ALCO. We manage the interest rate risk in portfolio segments by modeling and analyzing asset and product liability durations and projected cash flows under a number of interest rate scenarios.
One of the key measures we use to quantify our interest rate exposure is duration, a measure of the sensitivity of the fair value of assets and liabilities to changes in interest rates. For example, if interest rates increase by 100 basis points, or 1%, the fair value of an asset or liability with a duration of five is expected to decrease by 5%. We believe that as of December 31, 2012, our asset and liability portfolio durations were approximately matched but reflected somewhat lower asset durations because of our continued emphasis on liquidity. We regularly undertake a sensitivity analysis that calculates liability durations under various cash flow scenarios. We also calculate key rate durations for assets and liabilities that show the impact of interest rate changes at specific points on the yield curve. In addition, we monitor the short- and medium-term asset and liability cash flows profiles by portfolio to manage our liquidity needs.
To calculate duration for liabilities, we project liability cash flows under a number of stochastically generated interest rate scenarios and discount them to a net present value using a risk-free market rate increased for our own credit risk. For interest-sensitive liabilities the projected cash flows reflect the impact of the specific scenarios on policyholder behavior as well as the effect of minimum guarantees. Duration is calculated by revaluing these cash flows at an alternative level of interest rates and by determining the percentage change in fair value from the base case.
61
We also manage interest rate risk by emphasizing the purchase of securities that feature prepayment restrictions and call protection. Our product design and pricing strategies include the use of surrender charges or restrictions on withdrawals in some products. The Company’s exposure to interest rate risk has been consistent from year to year.
The selection of a 100 basis point immediate increase or decrease in interest rates at all points on the yield curve is a hypothetical rate scenario used to demonstrate potential risk. While a 100 basis point immediate increase or decrease of this type does not represent our view of future market changes, it is a hypothetical near-term change that illustrates the potential effect of such events. Although these fair value measurements provide a representation of interest rate sensitivity, they are based on our portfolio exposures at a point in time and may not be representative of future market results. These exposures will change as a result of ongoing portfolio transactions in response to new business, management’s assessment of changing market conditions and available investment opportunities.
The table below shows the estimated interest rate sensitivity of our fixed income financial instruments measured in terms of fair value.
| | | | | | | | | | | |
Interest Rate Sensitivity of | As of December 31, 2012 |
Fixed Income Financial Instruments: | Carrying Value | | -100 Basis Point Change | | Fair Value | | +100 Basis Point Change |
($ in millions) | | | |
| | | |
| | | | | | | | | | | |
Cash and short term | $ | 946.0 | | $ | 946.7 | | $ | 946.0 | | $ | 945.2 |
Available-for-sale debt securities long term | | 11,956.4 | | | 12,600.5 | | | 11,956.4 | | | 11,329.0 |
Totals | $ | 12,902.4 | | $ | 13,547.2 | | $ | 12,902.4 | | $ | 12,274.2 |
We use derivative financial instruments, primarily interest rate swaps, to manage our residual exposure to fluctuations in interest rates. We enter into derivative contracts with a number of highly rated financial institutions, to both diversify and reduce overall counterparty credit risk exposure.
We enter into interest rate swap agreements to reduce market risks from changes in interest rates. We do not enter into interest rate swap agreements for trading purposes. Under interest rate swap agreements, we exchange cash flows with another party at specified intervals for a set length of time based on a specified notional principal amount. Typically, one of the cash flow streams is based on a fixed interest rate set at the inception of the contract and the other is based on a variable rate that periodically resets. No premium is paid to enter into the contract and neither party makes payment of principal. The amounts to be received or paid on these swap agreements are accrued and recognized in net investment income.
The table below shows the interest rate sensitivity of our derivatives measured in terms of fair value, excluding derivative liabilities embedded in products. These exposures will change as our insurance liabilities are created and discharged and as a result of ongoing portfolio and risk management activities.
| | | | | | | | | | | | | |
Interest Rate Sensitivity of | As of December 31, 2012 |
Derivatives: | Notional Amount | | Weighted- Average Term (Years) | | -100 Basis Point Change | | Fair Value | | +100 Basis Point Change |
($ in millions) | | | | |
| | | | |
| | | | |
| | | | | | | | | | | | | |
Cross currency swaps | $ | 10.0 | | 3.5 | | $ | (0.1) | | $ | (0.1) | | $ | (0.1) |
Equity futures (1) | | 184.7 | | 0.3 | | | 15.9 | | | 15.9 | | | 15.9 |
Interest rate swaps | | 180.0 | | 6.0 | | | 15.6 | | | 7.8 | | | 0.9 |
Variance swaps | | 0.9 | | 4.0 | | | (4.4) | | | (4.4) | | | (4.4) |
Call options | | 1,328.4 | | 0.6 | | | 16.9 | | | 17.0 | | | 17.7 |
Put options | | 406.0 | | 6.1 | | | 84.0 | | | 72.7 | | | 62.0 |
Swaptions | | 25.0 | | 11.3 | | | — | | | — | | | 0.1 |
Total | $ | 2,135.0 | | | | $ | 127.9 | | $ | 108.9 | | $ | 92.1 |
———————
(1)
Equity futures fair value includes margin account cash balance of $15.9 million.
See Note 13 to our consolidated financial statements under “Item 8: Financial Statements and Supplementary Data” in this Annual Report on Form 10-K for more information on derivative instruments.
62
Credit Risk Management
We manage credit risk through the fundamental analysis of the underlying obligors, issuers and transaction structures. Through internal staff and an outsource relationship, we employ experienced credit analysts who review obligors’ management, competitive position, cash flow, coverage ratios, liquidity and other key financial and non-financial information. These analysts recommend the investments needed to fund our liabilities while adhering to diversification and credit rating guidelines. In addition, when investing in private debt securities, we rely upon broad access to management information, negotiated protective covenants, call protection features and collateral protection. We review our debt security portfolio regularly to monitor the performance of obligors and assess the stability of their current credit ratings.
We also manage credit risk through industry and issuer diversification and asset allocation. Maximum exposure to an issuer or derivatives counterparty is defined by quality ratings, with higher quality issuers having larger exposure limits. We have an overall limit on below-investment-grade rated issuer exposure. In addition to monitoring counterparty exposures under current market conditions, exposures are monitored on the basis of a hypothetical “stressed” market environment involving a specific combination of declines in stock market prices and interest rates and a spike in implied option activity.
Equity Risk Management
Equity risk is the risk that we will incur economic losses due to adverse changes in equity prices. Our exposure to changes in equity prices primarily results from our variable annuity and variable life products, as well as from our holdings of common stocks, mutual funds, private equity partnership interests and other equities. We manage our insurance liability risks on an integrated basis with other risks through our liability and risk management and capital and other asset allocation strategies. We also manage equity price risk through industry and issuer diversification and asset allocation techniques. We held $34.8 and $35.7 million in available-for-sale equity securities on our consolidated balance sheets as of December 31, 2012 and 2011, respectively.
Certain variable annuity products sold by our Life Companies contain GMDBs. The GMDB feature provides annuity contract owners with a guarantee that the benefit received at death will be no less than a prescribed amount. This minimum amount is based on the net deposits paid into the contract, the net deposits accumulated at a specified rate, the highest historical account value on a contract anniversary or, if a contract has more than one of these features, the greatest of these values. To the extent that the GMDB is higher than the current account value at the time of death, the Company incurs a cost. This typically results in an increase in annuity policy benefits in periods of declining financial markets and in periods of stable financial markets following a decline. As of December 31, 2012 and 2011, the difference between the GMDB and the current account value (NAR) for all existing contracts was $39.5 million and $130.8 million, respectively. This was our exposure to loss had all contract owners died on either December 31, 2012 or 2011. See Note 12 to our consolidated financial statements under “Item 8: Financial Statements and Supplementary Data” in this Annual Report on Form 10-K for more information.
Certain variable annuity products sold by our Life Companies contain guaranteed minimum living benefits. These include guaranteed minimum accumulation, withdrawal, income and payout annuity floor benefits. The GMAB guarantees a return of deposit to a policyholder after 10 years regardless of market performance. The GMWB guarantees that a policyholder can withdraw a certain percentage for life regardless of market performance. The GMIB guarantees that a policyholder can convert his or her account value into a guaranteed payout annuity at a guaranteed minimum interest rate and a guaranteed mortality basis, while also assuming a certain level of growth in the initial deposit. We also offer a combination rider that offers both GMAB and GMDB benefits. We have established a hedging program for managing the risk associated with our guaranteed minimum accumulation and withdrawal benefit features. We continue to analyze and refine our strategies for managing risk exposures associated with all our separate account guarantees. The liabilities related to these benefits totaled $51.2 million and $66.4 million at December 31, 2012 and 2011, respectively.
We analyze the sensitivity of a change in the separate account performance assumption as it is critical to the development of the EGPs related to our variable annuity and variable life insurance business. Equity market movements have a significant impact on the account value of variable life and annuity products and fees earned. Sustained and significant changes in the equity markets could therefore have an impact on deferred policy acquisition cost amortization.
As part of our analysis of separate account returns, we perform two sensitivity tests. If at December 31, 2012 we had reprojected EGPs using a 100 basis points lower separate account return assumption (after fund fees and mortality and expense charges) for both the variable annuity and the variable life businesses and used our current best estimate assumptions for all other assumptions, the estimated increase to amortization and decrease to net income would have been approximately $5.7 million, before taxes.
63
If, instead, at December 31, 2012 we had reprojected EGPs using a 100 basis points higher separate account return assumption (after fund fees and mortality and expense charges) for both the variable annuity and variable life businesses and used our current best estimate assumptions for all other assumptions, the estimated decrease to amortization and increase to net income would have been approximately $7.1 million, before taxes.
See Note 7 to our consolidated financial statements under “Item 8: Financial Statements and Supplementary Data” in this Annual Report on Form 10-K for more information regarding deferred policy acquisition costs.
We sponsor defined benefit pension plans for our employees. For U.S. GAAP accounting purposes, we assumed an 8.0% long-term rate of return on plan assets in the most recent valuations, performed as of December 31, 2012. To the extent there are deviations in actual returns, there will be changes in our projected expense and funding requirements. As of December 31, 2012, the projected benefit obligation for our funded and unfunded defined benefit plans was in excess of plan assets by $219.0 million and $150.9million, respectively. We made contributions totaling $18.2 million and $17.4 million to the pension plans during 2012 and 2011, respectively. Over the next 12 months, we expect to make contributions of approximately $11.4 million.
Effective March 31, 2010, all benefit accruals under all of our funded and unfunded defined benefit plans were frozen. This change was announced in 2009 and a curtailment was recognized at that time for the reduction in the expected years of future service.
See Note 17 to our consolidated financial statements under “Item 8: Financial Statements and Supplementary Data” in this Annual Report on Form 10-K for more information on our employee benefit plans.
Estimated Fair Value Measurement
Fair value is based upon quoted market prices, where available. If listed prices or quotes are not available, or are based on disorderly transactions or inactive markets, fair value is based upon internally developed models that use primarily market-based or independently sourced market parameters, including interest rate yield curves, option volatilities and currency rates. Valuation adjustments may be made to ensure that financial instruments are recorded at fair value. These adjustments include amounts to reflect counterparty credit quality, our own creditworthiness, liquidity and unobservable parameters that are applied consistently over time.
Using professional judgment and experience, we evaluate and weigh the relevance and significance of all readily available market information to determine the best estimate of fair value. The fair values investments with unobservable inputs are determined by management after considering prices from our pricing vendors. Fair values for fixed maturity debt securities are primarily based on yield curve analysis along with ratings and spread data. Other inputs may be considered for fair value calculations including published indexed data, sector specific performance, comparable price sources, and similar traded securities.
See Note 14 to our consolidated financial statements under “Item 8: Financial Statements and Supplementary Data” in this Annual Report on Form 10-K for additional information regarding the estimated fair value of investments.
Debt and Equity Securities
We invest in a variety of debt and equity securities. We classify these investments into various sectors using industry conventions; however, our classifications may differ from similarly titled classifications of other companies. We classify debt securities into investment grade and below-investment-grade securities based on ratings prescribed by the National Association of Insurance Commissioners (“NAIC”). In a majority of cases, these classifications will coincide with ratings assigned by one or more Nationally Recognized Statistical Rating Organizations (“NRSROs”); however, for certain structured securities, the NAIC designations may differ from NRSRO designations based on the amortized cost of the securities in our portfolio.
Our debt securities portfolio consists primarily of investment grade publicly traded and privately placed corporate bonds, residential mortgage-backed securities (“RMBS”), commercial mortgage-backed securities (“CMBS”) and other asset-backed securities. As of December 31, 2012, our debt securities, with a fair value of $12,656.0 million, represented 79.2% of total investments.
64
| | | | | | | | | | | | | | |
Debt Securities Ratings by Percentage: | | |
($ in millions) | | As of December 31, 2012 |
| | | | Fair Value | | % of Fair Value | | Amortized Cost | | % of Amortized Cost |
NAIC | | S&P Equivalent | | | | |
Rating | | Designation | | | | |
| | | | | | | | | | | | | | |
1 | | AAA/AA/A | | $ | 6,941.8 | | | 54.9% | | $ | 6,358.9 | | | 54.3% |
2 | | BBB | | | 4,674.6 | | | 36.9% | | | 4,305.5 | | | 36.7% |
| | Total investment grade | | | 11,616.4 | | | 91.8% | | | 10,664.4 | | | 91.0% |
3 | | BB | | | 666.9 | | | 5.3% | | | 680.8 | | | 5.8% |
4 | | B | | | 190.1 | | | 1.5% | | | 198.0 | | | 1.7% |
5 | | CCC and lower | | | 134.5 | | | 1.1% | | | 132.9 | | | 1.1% |
6 | | In or near default | | | 48.1 | | | 0.3% | | | 41.9 | | | 0.4% |
| | Total debt securities | | $ | 12,656.0 | | | 100.0% | | $ | 11,718.0 | | | 100.0% |
| | | | | | | | | | | | | | | | | | | | | | | |
Debt Securities by Type: | As of December 31, 2012 |
($ in millions) | | | | | Unrealized Gains (Losses) |
| Fair Value | | Amortized Cost | | Gross Gains | | Gross Losses | | |
| | | | | Net |
| | | | | | | | | | | | | | |
U.S. government and agency | $ | 1,111.5 | | $ | 1,055.5 | | $ | 58.5 | | $ | (2.5) | | $ | 56.0 |
State and political subdivision | | 357.2 | | | 321.5 | | | 37.8 | | | (2.1) | | | 35.7 |
Foreign government | | 204.3 | | | 167.5 | | | 36.8 | | | — | | | 36.8 |
Corporate | | 7,670.0 | | | 6,996.4 | | | 745.7 | | | (72.1) | | | 673.6 |
CMBS | | 882.2 | | | 817.2 | | | 72.9 | | | (7.9) | | | 65.0 |
RMBS | | 1,771.7 | | | 1,698.2 | | | 94.3 | | | (20.8) | | | 73.5 |
CDO/CLO | | 223.7 | | | 240.5 | | | 6.4 | | | (23.2) | | | (16.8) |
Other asset-backed | | 435.4 | | | 421.2 | | | 26.6 | | | (12.4) | | | 14.2 |
Total debt securities | $ | 12,656.0 | | $ | 11,718.0 | | $ | 1,079.0 | | $ | (141.0) | | $ | 938.0 |
Debt securities outside closed block | | | | | | | | | | | | | | |
Unrealized gains | $ | 5,533.1 | | $ | 5,099.0 | | $ | 434.1 | | $ | — | | $ | 434.1 |
Unrealized losses | | 726.5 | | | 829.3 | | | — | | | (102.8) | | | (102.8) |
Total outside the closed block | | 6,259.6 | | | 5,928.3 | | | 434.1 | | | (102.8) | | | 331.3 |
Debt securities in closed block | | | | | | | | | | | | | | |
Unrealized gains | | 5,917.1 | | | 5,272.2 | | | 644.9 | | | — | | | 644.9 |
Unrealized losses | | 479.3 | | | 517.5 | | | — | | | (38.2) | | | (38.2) |
Total in the closed block | | 6,396.4 | | | 5,789.7 | | | 644.9 | | | (38.2) | | | 606.7 |
Total debt securities | $ | 12,656.0 | | $ | 11,718.0 | | $ | 1,079.0 | | $ | (141.0) | | $ | 938.0 |
| | | | | | | | | | | |
Debt Securities by Type and Credit Quality: | As of December 31, 2012 |
($ in millions) | Investment Grade | | Below Investment Grade |
| Fair Value | | Amortized Cost | | Fair Value | | Amortized Cost |
| | | |
| | | | | | | | | | | |
U.S. government and agency | $ | 1,111.5 | | $ | 1,055.5 | | $ | — | | $ | — |
State and political subdivision | | 350.2 | | | 313.2 | | | 7.0 | | | 8.3 |
Foreign government | | 158.5 | | | 130.3 | | | 45.8 | | | 37.2 |
Corporate | | 6,939.6 | | | 6,268.5 | | | 730.4 | | | 727.9 |
CMBS | | 853.0 | | | 785.5 | | | 29.2 | | | 31.7 |
RMBS | | 1,671.2 | | | 1,592.3 | | | 100.5 | | | 105.9 |
CDO/CLO | | 141.7 | | | 147.3 | | | 82.0 | | | 93.2 |
Other asset-backed | | 390.7 | | | 371.8 | | | 44.7 | | | 49.4 |
Total debt securities | $ | 11,616.4 | | $ | 10,664.4 | | $ | 1,039.6 | | $ | 1,053.6 |
| | | | | | | | | | | |
Percentage of total debt securities | | 91.8% | | | 91.0% | | | 8.2% | | | 9.0% |
We manage credit risk through industry and issuer diversification. Maximum exposure to an issuer is defined by quality ratings, with higher quality issuers having larger exposure limits. Our investment approach emphasizes a high level of industry diversification. The top five industry holdings as of December 31, 2012 in our debt securities portfolio were banking (6.7%), electrical utilities (5.6%), oil (4.1%), insurance (3.8%) and diversified financial services (3.5%).
65
Eurozone Exposure
The following table presents exposure to European debt. We have focused on the countries experiencing significant economic, fiscal or political strain that could increase the likelihood of default.
| | | | | | | | | | | | | | |
Eurozone Exposure by Country | As of December 31, 2012 |
($ in millions) | Sovereign Debt | | Financial Institutions | | All Other | | | | % of Debt Securities |
| | | | Total | |
| | | | | | �� | | | | | | | | |
Spain | $ | — | | $ | 12.1 | | $ | 48.9 | | $ | 61.0 | | | 0.5% |
Ireland | | — | | | 5.2 | | | 42.4 | | | 47.6 | | | 0.4% |
Italy | | — | | | — | | | 18.9 | | | 18.9 | | | 0.1% |
Portugal | | — | | | — | | | 1.2 | | | 1.2 | | | 0.0% |
Greece | | — | | | — | | | — | | | — | | | 0.0% |
Total | | — | | | 17.3 | | | 111.4 | | | 128.7 | | | 1.0% |
| | | | | | | | | | | | | | |
All other Eurozone (1) | | — | | | 65.9 | | | 251.2 | | | 317.1 | | | 2.5% |
Total | $ | — | | $ | 83.2 | | $ | 362.6 | | $ | 445.8 | | | 3.5% |
———————
(1)
Includes Belgium, Finland, France, Germany, Luxembourg and Netherlands.
Residential Mortgage-Backed Securities
We invest directly in RMBS. To the extent these assets deteriorate in credit quality and decline in value for an extended period, we may realize impairment losses. When making investment decisions, we have been focused on identifying those securities that could withstand significant increases in delinquencies and foreclosures in the underlying mortgage pools before incurring a loss of principal.
Most of our RMBS portfolio is highly rated. At December 31, 2012, 94.3% of the total residential portfolio was rated investment grade. We hold $321.3 million of RMBS investments backed by prime rated mortgages, $268.6 million backed by Alt-A mortgages and $136.3 million backed by sub-prime mortgages, which combined amount to 4.5% of our total investments. The majority of our prime, Alt-A and sub-prime exposure is investment grade, with 59.7% being rated NAIC-1 and 26.1% rated NAIC-2. We have employed a disciplined approach in the analysis and monitoring of our mortgage-backed securities. Our approach involves a monthly review of each security. Underlying mortgage data is obtained from the security’s trustee and analyzed for performance trends. A security-specific stress analysis is performed using the most recent trustee information. This analysis forms the basis for our determination of whether the security will pay in accordance with the contractual cash flows. RMBS impairments during the year ended December 31, 2012 totaled $10.3 million. These impairments consist of $1.9 million from prime, $6.0 million from Alt-A and $2.4 million from sub-prime.
| | | | | | | | | | | | | | | | | | | | | |
Residential Mortgage-Backed Securities: | | | | | | | | | | | | |
($ in millions) | As of December 31, 2012 |
| | | | | | | NAIC Rating | | |
| | | | | | | 1 | | 2 | | 3 | | 4 | | 5 | | 6 | | |
| Amortized Cost(1) | | Market Value(1) | | % General Account(2) | | AAA/ AA/ A | | BBB | | BB | | B | | CCC and Below | | In or Near Default | | % Closed Block |
Collateral | | | | | | | | | | | | | | | | | | | | | |
Agency | $ | 1,001.0 | | $ | 1,076.1 | | 6.6% | | 100.0% | | 0.0% | | 0.0% | | 0.0% | | 0.0% | | 0.0% | | 46.9% |
Prime | | 312.2 | | | 321.3 | | 2.0% | | 65.3% | | 30.2% | | 3.6% | | 0.8% | | 0.0% | | 0.1% | | 41.4% |
Alt-A | | 270.7 | | | 268.6 | | 1.7% | | 47.2% | | 31.1% | | 13.9% | | 3.0% | | 4.6% | | 0.2% | | 30.4% |
Sub-prime | | 143.2 | | | 136.3 | | 0.8% | | 71.3% | | 6.4% | | 12.1% | | 9.1% | | 1.1% | | 0.0% | | 9.1% |
Total | $ | 1,727.1 | | $ | 1,802.3 | | 11.1% | | 83.8% | | 10.5% | | 3.6% | | 1.3% | | 0.8% | | 0.0% | | 40.6% |
———————
(1)
Individual categories may not agree with the Debt Securities by Type table on previous page due to nature of underlying collateral. In addition, RMBS holdings in this exhibit include $30.6 million classified as fair value investments on the consolidated balance sheets. For these fair value investments, there is no impact to OCI as carrying value is equal to market value.
(2)
Percentages based on Market Value.
66
| | | | | | | | | | | | | | | | | | | | | | |
Prime Mortgage-Backed Securities: | | | | | | | | | | | | |
($ in millions) | As of December 31, 2012 |
| | | | Amortized Cost | | Market Value | | | | Year of Issue |
Rating | | S&P Equivalent Designation | | % General Account(1) | | Post- 2007 | | 2007 | | 2006 | | 2005 | | 2004 | | 2003 and Prior |
| | |
| | | | | | | | | | | | | | | | | | | | | | |
NAIC-1 | | AAA/AAA/A | | $ | 204.1 | | $ | 209.9 | | 1.3% | | 0.0% | | 0.0% | | 7.4% | | 15.2% | | 42.8% | | 34.6% |
NAIC-2 | | BBB | | | 94.2 | | | 97.2 | | 0.6% | | 0.0% | | 8.8% | | 19.1% | | 40.4% | | 14.9% | | 16.8% |
NAIC-3 | | BB | | | 11.3 | | | 11.4 | | 0.1% | | 0.0% | | 0.0% | | 63.0% | | 11.5% | | 20.2% | | 5.3% |
NAIC-4 | | B | | | 2.4 | | | 2.6 | | 0.0% | | 0.0% | | 0.0% | | 100.0% | | 0.0% | | 0.0% | | 0.0% |
NAIC-5 | | CCC and below | | | — | | | — | | 0.0% | | 0.0% | | 0.0% | | 0.0% | | 0.0% | | 0.0% | | 0.0% |
NAIC-6 | | In or near default | | | 0.2 | | | 0.2 | | 0.0% | | 0.0% | | 0.0% | | 0.0% | | 0.0% | | 16.6% | | 83.4% |
Total | | | | $ | 312.2 | | $ | 321.3 | | 2.0% | | 0.0% | | 2.7% | | 13.7% | | 22.5% | | 33.2% | | 27.9% |
———————
(1)
Percentages based on Market Value.
| | | | | | | | | | | | | | | | | | | | | | |
Alt-A Mortgage-Backed Securities: | | | | | | | | | | | | |
($ in millions) | As of December 31, 2012 |
| | | | Amortized Cost | | Market Value | | % General Account(1) | | Year of Issue |
Rating | | S&P Equivalent Designation | | | Post- 2007 | | 2007 | | 2006 | | 2005 | | 2004 | | 2003 and Prior |
| |
| | | | | | | | | | | | | | | | | | | | | | |
NAIC-1 | | AAA/AAA/A | | $ | 128.3 | | $ | 126.7 | | 0.8% | | 5.1% | | 0.0% | | 21.7% | | 22.9% | | 37.4% | | 12.9% |
NAIC-2 | | BBB | | | 85.1 | | | 83.7 | | 0.5% | | 0.0% | | 5.3% | | 6.5% | | 0.0% | | 72.4% | | 15.8% |
NAIC-3 | | BB | | | 36.3 | | | 37.2 | | 0.2% | | 0.0% | | 0.0% | | 0.4% | | 26.9% | | 32.0% | | 40.7% |
NAIC-4 | | B | | | 8.0 | | | 8.1 | | 0.1% | | 0.0% | | 0.0% | | 0.0% | | 100.0% | | 0.0% | | 0.0% |
NAIC-5 | | CCC and below | | | 12.5 | | | 12.4 | | 0.1% | | 0.0% | | 0.0% | | 53.8% | | 45.3% | | 0.9% | | 0.0% |
NAIC-6 | | In or near default | | | 0.5 | | | 0.5 | | 0.0% | | 0.0% | | 0.0% | | 100.0% | | 0.0% | | 0.0% | | 0.0% |
Total | | | | $ | 270.7 | | $ | 268.6 | | 1.7% | | 2.4% | | 1.6% | | 15.0% | | 19.7% | | 44.7% | | 16.6% |
———————
(1)
Percentages based on Market Value.
| | | | | | | | | | | | | | | | | | | | | | |
Sub-Prime Mortgage-Backed Securities: | | | | | | | | | | | | |
($ in millions) | As of December 31, 2012 |
| | | | Amortized Cost | | Market Value | | % General Account(1) | | Year of Issue |
Rating | | S&P Equivalent Designation | | Post- 2007 | | 2007 | | 2006 | | 2005 | | 2004 | | 2003 and Prior |
|
| | | | | | | | | | | | | | | | | | | | | | |
NAIC-1 | | AAA/AAA/A | | $ | 96.7 | | $ | 97.2 | | 0.6% | | 0.0% | | 11.2% | | 9.4% | | 35.7% | | 24.7% | | 19.0% |
NAIC-2 | | BBB | | | 9.2 | | | 8.7 | | 0.0% | | 0.0% | | 0.0% | | 0.0% | | 67.3% | | 0.0% | | 32.7% |
NAIC-3 | | BB | | | 19.9 | | | 16.5 | | 0.1% | | 0.0% | | 43.7% | | 32.8% | | 16.9% | | 0.0% | | 6.6% |
NAIC-4 | | B | | | 15.1 | | | 12.4 | | 0.1% | | 0.0% | | 0.0% | | 0.0% | | 98.2% | | 0.0% | | 1.8% |
NAIC-5 | | CCC and below | | | 2.1 | | | 1.5 | | 0.0% | | 0.0% | | 100.0% | | 0.0% | | 0.0% | | 0.0% | | 0.0% |
NAIC-6 | | In or near default | | | 0.2 | | | — | | 0.0% | | 0.0% | | 0.0% | | 0.1% | | 0.2% | | 0.0% | | 99.7% |
Total | | | | $ | 143.2 | | $ | 136.3 | | 0.8% | | 0.0% | | 14.4% | | 10.7% | | 40.7% | | 17.6% | | 16.6% |
———————
(1)
Percentages based on Market Value.
67
Commercial Mortgage-Backed Securities
We invest directly in CMBS. To the extent these assets deteriorate in credit quality and decline in value for an extended period, we may realize impairment losses. When making investment decisions, we have been focused on identifying those securities that could withstand significant increases in delinquencies and foreclosures in the underlying mortgage pools before incurring a loss of principal.
| | | | | | | | | | | | | | | | | | | | | | |
Commercial Mortgage-Backed Securities: | | | | | | | | | | | | |
($ in millions) | As of December 31, 2012 |
| | | | | | | | | Year of Issue |
Rating | | S&P Equivalent Designation | | Amortized Cost | | Market Value(1) | | % General Account(2) | | Post- 2007 | | 2007 | | 2006 | | 2005 | | 2004 and Prior | | % Closed Block |
| | | | | | | | | |
| | | | | | | | | | | | | | | | | | | | | | |
NAIC-1 | | AAA/AAA/A | | $ | 787.9 | | $ | 859.3 | | 5.3% | | 29.2% | | 6.4% | | 16.8% | | 10.5% | | 37.1% | | 44.8% |
NAIC-2 | | BBB | | | 20.4 | | | 16.0 | | 0.1% | | 0.0% | | 0.0% | | 48.7% | | 51.3% | | 0.0% | | 37.6% |
NAIC-3 | | BB | | | 18.6 | | | 17.0 | | 0.1% | | 0.0% | | 49.0% | | 19.8% | | 31.2% | | 0.0% | | 26.2% |
NAIC-4 | | B | | | 19.6 | | | 12.7 | | 0.1% | | 0.0% | | 0.0% | | 0.0% | | 76.4% | | 23.6% | | 40.6% |
NAIC-5 | | CCC and below | | | 9.8 | | | 7.7 | | 0.1% | | 0.0% | | 0.0% | | 0.0% | | 0.0% | | 100.0% | | 67.4% |
NAIC-6 | | In or near default | | | 6.1 | | | 4.9 | | 0.0% | | 0.0% | | 62.0% | | 0.0% | | 0.0% | | 38.0% | | 28.1% |
Total | | | | $ | 862.4 | | $ | 917.6 | | 5.7% | | 27.4% | | 7.2% | | 16.9% | | 12.4% | | 36.1% | | 44.3% |
———————
(1)
Includes commercial mortgage-backed CDOs with amortized cost and market values of $34.2 million and $24.7 million, respectively.
(2)
Percentages based on Market Value. CMBS holdings in this exhibit include $10.6 million classified as fair value investments on the consolidated balance sheets. For these fair value investments, there is no impact to OCI as carrying value is equal to market value.
68
Realized Gains and Losses
The following table presents certain information with respect to realized investment gains and losses including those on debt securities pledged as collateral, with losses from OTTI charges reported separately in the table. These impairment charges were determined based on our assessment of factors enumerated below, as they pertain to the individual securities determined to be other-than-temporarily impaired.
| | | | | | | | |
Sources and Types of Net Realized Investment Gains (Losses): | Years Ended December 31, |
($ in millions) | 2012 | | 2011 | | 2010 |
| | | As restated and amended | | As restated and amended |
|
| | | | | | | | |
Total other-than-temporary debt impairments | $ | (45.7) | | $ | (64.5) | | $ | (107.0) |
Portion of loss recognized in OCI | | 22.9 | | | 38.5 | | | 58.7 |
Net debt impairments recognized in earnings | $ | (22.8) | | $ | (26.0) | | $ | (48.3) |
| | | | | | | | |
Debt security impairments: | | | | | | | | |
U.S. government and agency | $ | — | | $ | — | | $ | — |
State and political subdivision | | (0.6) | | | — | | | — |
Foreign government | | — | | | — | | | — |
Corporate | | (3.0) | | | (9.0) | | | (7.3) |
CMBS | | (4.1) | | | (3.6) | | | (6.6) |
RMBS | | (10.3) | | | (10.1) | | | (15.9) |
CDO/CLO | | (3.8) | | | (2.1) | | | (15.0) |
Other asset-backed | | (1.0) | | | (1.2) | | | (3.5) |
Net debt security impairments | | (22.8) | | | (26.0) | | | (48.3) |
Equity security impairments | | (5.7) | | | (0.8) | | | (0.2) |
Limited partnerships and other investment impairments | | (0.3) | | | — | | | (0.1) |
Impairment losses | | (28.8) | | | (26.8) | | | (48.6) |
Debt security transaction gains | | 52.3 | | | 13.6 | | | 57.9 |
Debt security transaction losses | | (11.1) | | | (6.0) | | | (16.0) |
Equity security transaction gains | | 8.5 | | | 3.8 | | | — |
Equity security transaction losses | | (0.4) | | | (0.1) | | | — |
Limited partnerships and other investment gains | | 7.7 | | | 4.8 | | | 13.8 |
Limited partnerships and other investment losses | | (2.5) | | | (4.8) | | | (6.9) |
Sale of Goodwin | | — | | | 4.0 | | | — |
Net transaction gains | | 54.5 | | | 15.3 | | | 48.8 |
Derivative instruments | | (50.4) | | | 14.4 | | | (26.6) |
Embedded derivatives(1) | | 12.1 | | | (34.4) | | | 12.3 |
Assets valued at fair value | | 2.1 | | | (0.6) | | | 2.9 |
Net realized investment gains (losses), excluding impairment losses | | 18.3 | | | (5.3) | | | 37.4 |
Net realized investment gains (losses), including impairment losses | $ | (10.5) | | $ | (32.1) | | $ | (11.2) |
———————
(1)
Includes the change in fair value of embedded derivatives associated with variable annuity GMWB, GMAB and COMBO riders. See Note 12 to our consolidated financial statements under “Item 8: Financial Statements and Supplementary Data” in this Annual Report on Form 10-K for additional disclosures.
Other-than-Temporary Impairments
Management assessed all securities in an unrealized loss position in determining whether impairments were temporary or other-than-temporary. In reaching its conclusions, management exercised significant judgment and used a number of issuer-specific quantitative indicators and qualitative judgments to assess the probability of receiving a given security’s contractual cash flows. This included the issue’s implied yield to maturity, cumulative default rate based on rating, comparisons of issue-specific spreads to industry or sector spreads, specific trading activity in the issue and other market data such as recent debt tenders and upcoming refinancing requirements. Management also reviewed fundamentals such as issuer credit and liquidity metrics, business outlook and industry conditions. Management maintains a watch list of securities that is reviewed for impairments. Each security on the watch list was evaluated, analyzed and discussed, with the positive and negative factors weighed in the ultimate determination of whether or not the security was other-than-temporarily impaired. For securities for which no OTTI was ultimately indicated at December 31, 2012, management does not have the intention to sell, nor does it expect to be required to sell, these securities prior to their recovery.
69
Fixed income OTTIs recorded in 2012 were primarily concentrated in structured securities. These impairments were driven primarily by increased collateral default rates. In our judgment, these credit events and other adverse conditions of the collateral have caused, or will most likely lead to, a deficiency in the contractual cash flows related to the investment. Therefore, based upon these credit events, we have determined that OTTIs exist. Total debt impairments recognized through earnings related to such credit-related circumstances were $22.8 million in 2012, $26.0 million in 2011 and $48.3 million in 2010. There were equity security OTTIs of $5.7 million in 2012, $0.8 in 2011 and $0.2 million in 2010. There were limited partnerships and other investment OTTIs of $0.3 million in 2012, $0.0 in 2011 and $0.1 million in 2010.
In addition to these credit-related impairments recognized through earnings, we impaired securities to fair value through other comprehensive loss for any impairments related to non-credit related factors. These types of impairments were driven primarily by market or sector credit spread widening or by a lack of liquidity in the securities. The amount of impairments recognized as an adjustment to other comprehensive loss due to these factors was $22.9 million in 2012, $38.5 million in 2011 and $58.7 million in 2010.
The following table presents a roll-forward of pre-tax credit losses recognized in earnings related to debt securities for which a portion of the OTTI was recognized in OCI.
| | | | | | | | |
Credit Losses Recognized in Earnings on Debt Securities for | As of December 31, |
which a Portion of the OTTI Loss was Recognized in OCI: | 2012 | | 2011 | | 2010 |
($ in millions) | | | As restated and amended | | As restated and amended |
| | |
| | | | | | | | |
Balance, beginning of period | $ | (79.1) | | $ | (65.8) | | $ | (50.6) |
Add: Credit losses on securities not previously impaired (1) | | (6.7) | | | (11.8) | | | (14.9) |
Add: Credit losses on securities previously impaired (1) | | (13.3) | | | (8.6) | | | (22.4) |
Less: Credit losses on securities impaired due to intent to sell | | — | | | — | | | — |
Less: Credit losses on securities sold | | 26.5 | | | 7.1 | | | 11.4 |
Less: Credit losses upon adoption of new accounting guidance (2) | | — | | | — | | | 10.7 |
Less: Increases in cash flows expected on previously impaired securities | | — | | | — | | | — |
Balance, end of period | $ | (72.6) | | $ | (79.1) | | $ | (65.8) |
———————
(1)
Additional credit losses on securities for which a portion of the OTTI loss was recognized in AOCI are included within net OTTI losses recognized in earnings on the statements of comprehensive income.
(2)
Adjustment relates to the impact of adoption in 2010 of Accounting Standards Update 2010-11, Derivatives and Hedging (Topic 815), Scope Exception Related to Embedded Credit Derivatives.
Unrealized Gains and Losses
The following tables present certain information with respect to our gross unrealized gains and losses related to our investments in debt securities as of December 31, 2012. We separately present information that is applicable to unrealized losses both outside and inside the closed block. See Note 9 to our consolidated financial statements under “Item 8: Financial Statements and Supplementary Data” in this Annual Report on Form 10-K for more information regarding the closed block. Applicable deferred policy acquisition costs and deferred income taxes further reduce the effect of unrealized gains and losses on our comprehensive income.
Net unrealized investment gains and losses on securities classified as available-for-sale and certain other assets are included in our consolidated balance sheets as a component of AOCI. The table below presents the special category of AOCI for debt securities that are other-than-temporarily impaired when the impairment loss has been split between the credit loss component (in earnings) and the non-credit component (separate category of AOCI).
70
| | | | | |
Fixed Maturity Non-Credit OTTI Losses in AOCI, by Security Type: | As of December 31, |
($ in millions) | 2012(1) | | 2011(1) |
| | | As restated and amended |
| | |
| | | | | |
U.S. government and agency | $ | — | | $ | — |
State and political subdivision | | (1.4) | | | — |
Foreign government | | — | | | — |
Corporate | | (8.9) | | | (5.8) |
CMBS | | (21.8) | | | (29.2) |
RMBS | | (64.0) | | | (92.2) |
CDO/CLO | | (33.4) | | | (36.2) |
Other asset-backed | | 5.9 | | | 2.8 |
Total fixed maturity non-credit OTTI losses in AOCI | $ | (123.6) | | $ | (160.6) |
———————
(1)
Represents the amount of non-credit OTTI losses recognized in AOCI excluding net unrealized gains or losses subsequent to the date of impairment.
| | | | | | | | | | | |
Duration of Gross Unrealized Losses on Securities: | As of December 31, 2012 |
($ in millions) | | | 0 – 6 | | 6 – 12 | | Over 12 |
| Total | | Months | | Months | | Months |
Debt Securities Outside Closed Block | | | | | | | | | | | |
Total fair value | $ | 726.5 | | $ | 244.4 | | $ | 40.3 | | $ | 441.8 |
Total amortized cost | | 829.3 | | | 248.9 | | | 43.3 | | | 537.1 |
Unrealized losses | $ | (102.8) | | $ | (4.5) | | $ | (3.0) | | $ | (95.3) |
Number of securities (1) | | 266 | | | 76 | | | 21 | | | 169 |
| | | | | | | | | | | |
Investment grade: | | | | | | | | | | | |
Unrealized losses | $ | (37.4) | | $ | (3.7) | | $ | (1.8) | | $ | (31.9) |
| | | | | | | | | | | |
Below investment grade: | | | | | | | | | | | |
Unrealized losses | $ | (65.4) | | $ | (0.8) | | $ | (1.2) | | $ | (63.4) |
| | | | | | | | | | | |
Equity Securities Outside Closed Block | | | | | | | | | | | |
Unrealized losses | $ | (1.1) | | $ | (0.6) | | $ | (0.1) | | $ | (0.4) |
Number of securities (1) | | 11 | | | 1 | | | 4 | | | 6 |
__________
(1)
Certain securities are held in both the open and closed blocks.
For debt securities outside of the closed block with gross unrealized losses, 36.3% of the unrealized losses after offsets pertain to investment grade securities and 63.7% of the unrealized losses after offsets pertain to below-investment-grade securities at December 31, 2012.
The following table represents those securities whose fair value is less than 80% of amortized cost (significant unrealized loss) that have been at a significant unrealized loss position on a continuous basis.
| | | | | | | | | | | |
Duration of Gross Unrealized Losses on | As of December 31, 2012 |
Securities Outside Closed Block: | | | 0 – 6 | | 6 – 12 | | Over 12 |
($ in millions) | Total | | Months | | Months | | Months |
| | | | | | | | | | | |
Debt securities outside closed block | | | | | | | | | | | |
Unrealized losses over 20% of cost | $ | (70.4) | | $ | (1.3) | | $ | (2.1) | | $ | (67.0) |
Number of securities (1) | | 40 | | | 2 | | | 2 | | | 36 |
| | | | | | | | | | | |
Investment grade: | | | | | | | | | | | |
Unrealized losses over 20% of cost | $ | (18.1) | | $ | (1.1) | | $ | (2.1) | | $ | (14.9) |
| | | | | | | | | | | |
Below investment grade: | | | | | | | | | | | |
Unrealized losses over 20% of cost | $ | (52.3) | | $ | (0.2) | | $ | — | | $ | (52.1) |
| | | | | | | | | | | |
Equity securities outside closed block | | | | | | | | | | | |
Unrealized losses over 20% of cost | $ | (0.4) | | $ | — | | $ | (0.1) | | $ | (0.3) |
Number of securities (1) | | 4 | | | — | | | 3 | | | 1 |
__________ | | | | | | | | | | | |
(1)
Certain securities are held in both the open and closed blocks.
71
| | | | | | | | | | | |
Duration of Gross Unrealized Losses on | As of December 31, 2012 |
Securities Inside Closed Block: | | | 0 – 6 | | 6 – 12 | | Over 12 |
($ in millions) | Total | | Months | | Months | | Months |
| | | | | | | | | | | |
Debt securities inside closed block | | | | | | | | | | | |
Total fair value | $ | 479.3 | | $ | 128.1 | | $ | 20.0 | | $ | 331.2 |
Total amortized cost | | 517.5 | | | 130.3 | | | 21.5 | | | 365.7 |
Unrealized losses | $ | (38.2) | | $ | (2.2) | | $ | (1.5) | | $ | (34.5) |
Number of securities (1) | | 136 | | | 38 | | | 7 | | | 91 |
| | | | | | | | | | | |
Investment grade: | | | | | | | | | | | |
Unrealized losses | $ | (21.1) | | $ | (2.2) | | $ | (0.7) | | $ | (18.2) |
| | | | | | | | | | | |
Below investment grade: | | | | | | | | | | | |
Unrealized losses | $ | (17.1) | | $ | — | | $ | (0.8) | | $ | (16.3) |
| | | | | | | | | | | |
Equity securities inside closed block | | | | | | | | | | | |
Unrealized losses | $ | (1.3) | | $ | (0.9) | | $ | — | | $ | (0.4) |
Number of securities (1) | | 11 | | | 3 | | | 3 | | | 5 |
__________ | | | | | | | | | | | |
(1)
Certain securities are held in both the open and closed blocks.
For debt securities inside the closed block with gross unrealized losses, there were no unrealized losses after offsets at December 31, 2012.
The following table represents those securities whose fair value is less than 80% of amortized cost (significant unrealized loss) that have been at a significant unrealized loss position on a continuous basis.
| | | | | | | | | | | |
Duration of Gross Unrealized Losses on | As of December 31, 2012 |
Securities Inside Closed Block: | | | 0 – 6 | | 6 – 12 | | Over 12 |
($ in millions) | Total | | Months | | Months | | Months |
| | | | | | | | | | | |
Debt securities inside closed block | | | | | | | | | | | |
Unrealized losses over 20% of cost | $ | (10.5) | | $ | — | | $ | — | | $ | (10.5) |
Number of securities (1) | | 12 | | | — | | | 2 | | | 10 |
| | | | | | | | | | | |
Investment grade: | | | | | | | | | | | |
Unrealized losses over 20% of cost | $ | (5.0) | | $ | — | | $ | — | | $ | (5.0) |
| | | | | | | | | | | |
Below investment grade: | | | | | | | | | | | |
Unrealized losses over 20% of cost | $ | (5.5) | | $ | — | | $ | — | | $ | (5.5) |
| | | | | | | | | | | |
Equity securities inside closed block | | | | | | | | | | | |
Unrealized losses over 20% of cost | $ | (0.7) | | $ | (0.3) | | $ | (0.1) | | $ | (0.3) |
Number of securities (1) | | 4 | | | 1 | | | 2 | | | 1 |
___________ | | | | | | | | | | | |
(1)
Certain securities are held in both the open and closed blocks.
Liquidity and Capital Resources
Liquidity refers to the ability of a company to generate sufficient cash flow to meet its cash requirements. Capital refers to the long-term financial resources available to support the operations of our business, fund business growth and provide a cushion to withstand adverse circumstances. Our ability to generate and maintain sufficient liquidity and capital depends on the profitability of our business, general economic conditions and our access to the capital markets and alternate sources of liquidity and capital. We believe that cash flows from the sources of funds available to us are sufficient to satisfy the current liquidity requirements, including under reasonably foreseeable stress scenarios.
The following discussion includes both liquidity and capital resources as these subjects are interrelated.
72
The Phoenix Companies, Inc. (consolidated)
| | | | | | | | |
Summary Consolidated Cash Flows: | Years Ended December 31, |
($ in millions) | 2012 | | 2011 | | 2010 |
| | | As restated and amended | | As restated and amended |
| | |
| | | | | | | | |
Cash used for operating activities | $ | (520.8) | | $ | (437.8) | | $ | (622.6) |
Cash provided by (used for) investing activities | | (203.8) | | | (566.8) | | | 136.2 |
Cash provided by financing activities | | 800.1 | | | 1,077.8 | | | 329.3 |
Change in cash and cash equivalents | $ | 75.5 | | $ | 73.2 | | $ | (157.1) |
2012 vs. 2011
Cash used for operating activities increased by $83.0 million during the year ended December 31, 2012 compared to the year ended December 31, 2011. This was driven by unfavorable mortality in the third and fourth quarters of 2012 on our universal life block of business and lower renewal premiums on our legacy blocks of business due to a declining in force population. Partially offsetting these items was reduced commissions paid related to lower sales of our fixed indexed annuity product and reduced base compensation cost due to the sale of Goodwin during the third quarter of 2011. Further, cash paid for income taxes increased $12.2 million as a result of recent continued taxable income from our insurance entities and the exhaustion of net operating losses that had been utilized in previous years.
Cash flows used for investing activities decreased $363.0 million during the year ended December 31, 2012 compared to the year ended December 31, 2011 as a result of a greater increase in sales and maturities relative to purchases. This is primarily driven by less cash being provided by financing and operating activities, namely due to a reduction in deposits and an increase in withdrawals of fixed index annuities. Purchasing activity was also down due to less cash being generated from our investment portfolio due to a low interest rate environment, while investment sales activity was higher in an effort to produce capital gains to offset previous capital losses.
Cash flows provided by financing activities decreased $277.7 million during the year ended December 31, 2012. This decline was primarily a result of a decrease in policyholder deposits exceeding a decrease in withdrawals and lower sales of fixed indexed annuities when compared to 2011. Further, the Company repurchased $48.3 million par amount of its outstanding 7.15% surplus notes for aggregate consideration of $36.2 million during 2012. See Note 10 to our consolidated financial statements under “Item 8: Financial Statements and Supplementary Data” in this Annual Report on Form 10-K for additional information on financing activities.
2011 vs. 2010
Cash used for operating activities decreased by $184.8 million during the year ended December 31, 2011 compared to the year ended December 31, 2010. This was primarily attributable to a decrease in policyholder benefits consistent with favorable persistency and mortality. While operating cash flows remain negative for the year ended December 31, 2011, this was primarily driven by cash surrenders of deposit-type contracts for which funds were readily available in segregated separate accounts or liquid general account assets.
Cash flows used for investing activities increased $703.0 million during the year ended December 31, 2011 compared to the year ended December 31, 2010. The primary driver of this fluctuation was an increase in purchases of available-for-sale debt securities which was directly attributable to the increase in deposits related to fixed indexed annuities. In addition, sales of available-for-sale debt securities declined as a result of lower withdrawals. See Note 9 to our consolidated financial statements under “Item 8: Financial Statements and Supplementary Data” in this Annual Report on Form 10-K for additional information on investing activities.
Cash flows provided by financing activities increased $748.5 million during the year ended December 31, 2011 compared to the year ended December 31, 2010 primarily as a result of increase in policyholder deposits related to sales of fixed indexed annuities. See Note 10 to our consolidated financial statements under “Item 8: Financial Statements and Supplementary Data” in this Annual Report on Form 10-K for additional information on financing activities.
73
| | | | | |
Summary Consolidated Cash Flows: | Three Months Ended |
($ in millions) | March 31, |
| 2012 | | 2011 |
| As restated and amended | | As restated and amended |
|
| | | | | |
Cash used for operating activities | $ | (152.2) | | $ | (130.8) |
Cash used for investing activities | | (81.1) | | | (120.0) |
Cash provided by financing activities | | 242.0 | | | 226.1 |
Change in cash and cash equivalents | $ | 8.7 | | $ | (24.7) |
Three months ended March 31, 2012 vs. March 31, 2011
Cash used for operating activities increased by $21.4 million during the three months ended March 31, 2012 compared with the three months ended March 31, 2011. This was primarily attributable to lower renewal premiums on our legacy blocks of business due to a declining in force population. Offsetting this is the reduced base compensation cost due to the sale of Goodwin during the third quarter of 2011.
Cash used for investing activities decreased $38.9 million during the three months ended March 31, 2012 compared with the three months ended March 31, 2011. The primary driver of this fluctuation was a decrease in purchases of available-for-sale debt securities attributable to the low interest rate environment.
Cash provided by financing activities increased $15.9 million during the three months ended March 31, 2012 compared with the three months ended March 31, 2011. This inflow is attributable to increased policyholder deposits related to improved sales of fixed indexed annuities as compared with the three months ended March 31, 2011.
| | | | | |
Summary Consolidated Cash Flows: | Six Months Ended |
($ in millions) | June 30, |
| 2012 | | 2011 |
| As restated and amended | | As restated and amended |
|
| | | | | |
Cash used for operating activities | $ | (261.7) | | $ | (248.1) |
Cash used for investing activities | | (120.7) | | | (209.1) |
Cash provided by financing activities | | 425.3 | | | 466.5 |
Change in cash and cash equivalents | $ | 42.9 | | $ | 9.3 |
Six months ended June 30, 2012 compared with six months ended June 30, 2011
Cash used for operating activities increased by $13.6 million during the six months ended June 30, 2012 compared with the six months ended June 30, 2011. This was primarily attributable to lower death benefit payments on variable universal life policies as compared to June 30, 2011 and reduced base compensation cost due to the sale of Goodwin during the third quarter of 2011. Offsetting these impacts were lower renewal premiums on our legacy blocks of business due to a declining in force population.
Cash used for investing activities decreased $88.4 million during the six months ended June 30, 2012 compared with the six months ended June 30, 2011. The primary driver of this fluctuation was decreased purchases of available-for-sale debt securities resulting from comparable fixed index annuity deposits and less cash being generated from our investment portfolio due to low interest rate environment.
Cash provided by financing activities decreased $41.2 million during the six months ended June 30, 2012 compared with the six months ended June 30, 2011. This decrease is attributable to lower fixed indexed annuity deposits resulting from lower sales of fixed indexed annuities as compared the June 30, 2011.
74
| | | | | |
Summary Consolidated Cash Flows: | Nine Months Ended |
($ in millions) | September 30, |
| 2012 | | 2011 |
| | | As restated and amended |
|
| | | | | |
Cash used for operating activities | $ | (403.4) | | $ | (366.5) |
Cash used for investing activities | | (77.8) | | | (361.4) |
Cash provided by financing activities | | 594.4 | | | 761.3 |
Change in cash and cash equivalents | $ | 113.2 | | $ | 33.4 |
Nine months ended September 30, 2012 compared with nine months ended September 30, 2011
Cash flows used for operating activities increased by $36.9 million as a result of reduced commissions paid related to lower sales of our fixed indexed annuity product and the reduced base compensation cost due to the sale of Goodwin during the third quarter of 2011. Offsetting this impact was unfavorable mortality in the third quarter of 2012 on our universal life block of business and lower renewal premiums on our legacy blocks of business due to a declining in force population.
Cash flows used for investing activities decreased by $283.6 million as a result of decreased cash provided by financing and operating activities resulting from sales maturities of available-for-sale debt exceeding purchases of available for sales debt. The fluctuation in purchasing activity was primarily driven by a reduction in deposits from sales of fixed index annuities as compared to September 30, 2011 while sales increased due to an effort to produce capital gains to offset previous capital losses.
Cash flows provided by financing activities decreased by $166.9 million as a result of a decrease in fixed indexed annuity deposits and an increase in fixed indexed annuity withdrawals as compared to September 30, 2011. Further, the Company repurchased and retired $48.3 million par amount of its outstanding 7.15% surplus notes for aggregate consideration of $36.2 million during 2012.
The Phoenix Companies, Inc. Sources and Uses of Cash (parent company only)
In addition to existing cash and securities, our primary source of liquidity consists of dividends from Phoenix Life. Under New York Insurance Law, Phoenix Life is permitted to pay stockholder dividends to the holding company in any calendar year without prior approval from the NYDFS in the amount of the lesser of 10% of Phoenix Life’s surplus to policyholders as of the immediately preceding calendar year or Phoenix Life’s statutory net gain from operations for the immediately preceding calendar year, not including realized capital gains. Based on this calculation, Phoenix Life would be able to pay a dividend of $78.3 million in 2013. During the year ended December 31, 2012, Phoenix Life declared $71.8 million in dividends. In assessing our ability to pay dividends from Phoenix Life, we also consider the level of statutory capital and RBC of that entity. Phoenix Life may have less flexibility to pay dividends to the parent company if we experience declines in either statutory capital or RBC in the future. As of December 31, 2012, we had $922.5 million of statutory capital, surplus and asset valuation reserve (“AVR”). Our estimated RBC ratio was in excess of 250% at Phoenix Life. See Notes 22 and 28 to our consolidated financial statements under “Item 8: Financial Statements and Supplementary Data” in this Annual Report on Form 10-K for more information on Phoenix Life statutory financial information, regulatory matters and dividends to the parent.
In 2012, 2011 and 2010, the Company did not pay any stockholder dividends.
We sponsor post-employment benefit plans through pension and savings plans for employees of Phoenix Life. Funding of the majority of these obligations is provided by Phoenix Life on a 100% cost reimbursement basis through administrative services agreements with the holding company. See Note 17 to our consolidated financial statements under “Item 8: Financial Statements and Supplementary Data” in this Annual Report on Form 10-K for additional information.
Our principal needs at the holding company level are debt service (net of amounts due on bonds repurchased), income taxes and operating expenses. Interest expense on senior unsecured bonds for the years ended December 31, 2012, 2011 and 2010 was $19.2 million, $19.3 million and $19.3 million, respectively. As of December 31, 2012, future minimum annual principal payments on senior unsecured bonds are $252.7 million in 2032.
75
The Phoenix Companies, Inc. Summary Cash Flows (parent company only)
| | | | | | | | |
Summary Cash Flows: | Years Ended December 31, |
($ in millions) | 2012 | | 2011 | | 2010 |
| | | As restated and amended | | As restated and amended |
|
| | | | | | | | |
Cash used for operating activities | $ | (30.3) | | $ | (21.0) | | $ | (16.2) |
Cash provided by investing activities | | 8.4 | | | 72.1 | | | 16.7 |
Cash used for financing activities | | (3.4) | | | (0.7) | | | — |
Change in cash and cash equivalents | $ | (25.3) | | $ | 50.4 | | $ | 0.5 |
2012 vs. 2011
The $9.3 million increase in cash used for operating activities for the year ended December 31, 2012, compared to the year ended December 31, 2011, was primarily attributable to an increase in taxes paid of $15.1 million.
The decrease in cash provided by investing activities increased due mainly to $160.4 million increase in purchases of available-for-sale debt securities offset by an $83.0 million increase in cash inflows from the sales, repayments, and maturities of available-for-sale debt securities and an increase of $7.0 million in dividends from Phoenix Life.
Cash used for financing activities increased due mainly treasury stock repurchased as part of the 1-for-20 reverse stock split of its common stock following market close on August 10, 2012.
2011 vs. 2010
The increase in cash used for operating activities for the year ended December 31, 2011, compared to the year ended December 31, 2010, was primarily attributable to a $3.3 million payment by the parent company to Phoenix Life in December 2011 to cover operating expenses of Goodwin, which was sold in November 2011.
The increase in cash provided by investing activities was due mainly to $25.5 million lower capital contributions to subsidiaries and a $39.8 million increase in dividends from Phoenix Life offset by a $7.3 million reduction in proceeds from the sale of a subsidiary.
During 2011, financing cash activities totaling $0.7 million related to the repurchase of senior unsecured bonds were recorded compared to no financing transactions being recorded for the year ended December 31, 2010.
Life Companies
The Life Companies’ liquidity requirements principally relate to: the liabilities associated with various life insurance and annuity products; the payment of dividends by Phoenix Life to the parent company; operating expenses; contributions to subsidiaries; and payment of principal and interest by Phoenix Life on its outstanding debt obligation. Liabilities arising from life insurance and annuity products include the payment of benefits, as well as cash payments in connection with policy surrenders, withdrawals and loans. The Life Companies also have liabilities arising from the runoff of the remaining discontinued group accident and health reinsurance operations, a block of business discontinued in 1999.
Historically, our Life Companies have used cash flow from operations and investing activities to fund liquidity requirements. Their principal cash inflows from life insurance and annuities come from premiums, annuity deposits and charges on insurance policies and annuity contracts. In the case of Phoenix Life, cash inflows also include dividends, distributions and other payments from subsidiaries. Principal cash inflows from investing activities result from repayments of principal, proceeds from maturities, sales of invested assets and investment income. The principal cash inflows from our discontinued group accident and health reinsurance operations come from our reinsurance, recoveries from other retrocessionaires and investing activities.
76
| | | | | | | | | |
Annuity Actuarial Reserves and Deposit Liabilities | As of December 31, |
Withdrawal Characteristics: | 2012 | | 2011 |
($ in millions) | Amount(1) | | Percent | | Amount(1) | | Percent |
| | | | | | | | | |
Not subject to discretionary withdrawal provision | $ | 355.6 | | 6% | | $ | 340.1 | | 6% |
Subject to discretionary withdrawal without adjustment | | 971.5 | | 18% | | | 978.8 | | 18% |
Subject to discretionary withdrawal with market value adjustment | | 1,766.8 | | 32% | | | 1,226.2 | | 22% |
Subject to discretionary withdrawal at contract value
less surrender charge | | 37.3 | | 1% | | | 43.7 | | 1% |
Subject to discretionary withdrawal at market value | | 2,405.6 | | 43% | | | 2,895.3 | | 53% |
Total annuity contract reserves and deposit fund liability | $ | 5,536.8 | | 100% | | $ | 5,484.1 | | 100% |
———————
(1)
Annuity contract reserves and deposit fund liability amounts are reported on a statutory basis, which more accurately reflects the potential cash outflows and include variable product liabilities. Annuity contract reserves and deposit fund liabilities are monetary amounts that an insurer must have available to provide for future obligations with respect to its annuities and deposit funds. These are liabilities in our financial statements prepared in conformity with statutory accounting practices. These amounts are at least equal to the values available to be withdrawn by policyholders.
Individual life insurance policies are less susceptible to withdrawals than annuity contracts because policyholders may incur surrender charges and be required to undergo a new underwriting process in order to obtain a new insurance policy. As indicated in the table above, most of our annuity contract reserves and deposit fund liabilities are subject to withdrawals at market value.
The cash values of certain individual life insurance policies increase over the lives of the policies. Policyholders have the right to borrow an amount up to a certain percentage of the cash value on those policies. As of December 31, 2012, our Life Companies had approximately $10.7 billion in cash values with respect to which policyholders had rights to take policy loans. For eligible policies, the majority of policy loans are at variable interest rates that are reset annually on the policy anniversary. Policy loans at December 31, 2012 were $2.4 billion.
Aggregate life surrenders in 2012 were 5.8% of related reserves, compared with 6.6% in 2011.Cash, treasuries and agency mortgage-backed securities accounted for 10.6% of fixed income investments at year end 2012, as compared to 8.7% at year end 2011. A strong liquidity profile remains a priority for the Company, but as financial markets and the economy continue to improve the size and composition of this liquid asset portfolio will change to better meet the needs of the Company. These actions, along with resources the Company devotes to monitoring and managing surrender activity, are key components of liquidity management within the Company.
The primary liquidity risks regarding cash inflows from the investing activities of our Life Companies are the risks of default by debtors, interest rate and other market volatility and potential illiquidity of investments. We closely monitor and manage these risks.
We believe that the existing and expected sources of liquidity for our Life Companies are adequate to meet both current and anticipated needs.
In 2004, we issued $175.0 million principal of surplus notes with a scheduled maturity of 30 years for proceeds of $171.6 million, net of discount and issue costs. Interest payments are at an annual rate of 7.15%, require the prior approval of the NYDFS and may be made only out of surplus funds which the NYDFS determines to be available for such payments under New York insurance law. During September 2012, the Company repurchased and retired $48.3 million principal of these surplus notes after receiving prior approval from the NYDFS.
Capital Management Program
The Company effected a 1-for-20 reverse stock split of its common stock following market close on August 10, 2012. No fractional shares were issuable in connection with the reverse stock split. Instead, shareholders were entitled to receive cash in lieu of fractional shares, based on the closing price of the Company’s common stock on August 10, 2012. As a result of the reverse stock split, an aggregate of $2.9 million was payable to shareholders for such fractional shares. See Note 11 to our consolidated financial statements under “Item 8: Financial Statements and Supplementary Data” in this Annual Report on Form 10-K for additional information on the reverse stock split.
77
Following the reverse stock split, the Company offered an odd lot program that provided post-reverse stock split shareholders who held fewer than 100 shares with a voluntary and limited-time means to sell their shares, purchase enough additional shares to increase their holdings to a round lot of 100 shares or make a charitable donation of their shares. The odd lot program terminated as of October 26, 2012.
On September 20, 2012, the Board authorized a program to repurchase up to an aggregate amount of $25,000,000 (not including fees and expenses) of the Company’s outstanding common stock shares. Under the stock repurchase program, purchases may be made from time to time in the open market, in accelerated stock buyback arrangements, in privately negotiated transactions or otherwise, subject to market prices and other conditions. No time limit was placed on the duration of the program, which may be modified, extended or terminated by the Board at any time. The Board also terminated the Company’s previously existing stock repurchase program. No shares were repurchased in 2012.
Ratings
Rating agencies assign Phoenix Life financial strength ratings and assign the holding company debt ratings based in each case on their opinions of the relevant company’s ability to meet its financial obligations. A downgrade or withdrawal of any of our credit ratings could negatively impact our liquidity. For additional information regarding certain risks associated with our credit ratings, please see the risk factors under “Risks Related to the Restatement, Failure to File Timely Periodic Reports with the SEC and our Internal Control Over Financial Reporting.” contained in “Item 1A: Risk Factors” in Part I of this 2012 Form 10-K.
On August 28, 2013, A.M. Best Company, Inc. downgraded our financial strength rating from B+ to B and our senior debt rating from b+ to b. The financial strength rating was removed from under review with negative implications and assigned a stable outlook. The senior debt rating was removed from under review with negative implications and assigned a negative outlook. On April 9, 2013, A.M. Best Company, Inc. maintained under review with negative implications on our financial strength rating of B+ and lowered our senior debt rating from bb- to b+. On December 7, 2012, A.M. Best Company, Inc. placed under review with negative implications our financial strength rating of B+ and our senior debt rating of bb-. On January 13, 2012, A.M. Best Company, Inc. affirmed our financial strength rating of B+ and our senior debt rating of bb-. They changed their outlook on our ratings from stable to positive. On February 8, 2011, A.M. Best Company, Inc. affirmed our financial strength rating of B+ and our senior debt rating of bb-. They changed their outlook on our ratings from negative to stable.
On January 14, 2014, Moody’s Investor Services withdrew all ratings of The Phoenix Companies, Inc. including the Caa1 senior debt rating of Phoenix and the Ba2 financial strength rating of the company's life insurance subsidiaries and the B1 (hyb) debt rating of Phoenix Life's surplus notes. On September 25, 2013, Moody’s Investor Services maintained the review for downgrade for our Ba2 financial strength rating and Caa1 senior debt rating. On June 21, 2013, Moody’s Investor Services maintained the review for downgrade for our Ba2 financial strength rating and Caa1 senior debt rating. On March 20, 2013, Moody’s Investor Services maintained the review for downgrade for our financial strength rating of Ba2 and downgraded our senior debt rating B3 to Caa1. On December 12, 2012, Moody’s Investor Services placed our Ba2 financial strength rating and B3 senior debt rating under review for downgrade. On December 16, 2011, Moody’s Investor Services affirmed our financial strength rating of Ba2 and our senior debt rating of B3. They changed their outlook on our ratings from stable to positive.
On May 22, 2013, Standard & Poor’s affirmed our financial strength rating of BB- and senior debt rating of B-. All ratings were removed from CreditWatch with Negative Implications and placed on negative outlook. On March 8, 2013, Standard & Poor’s placed our financial strength rating of BB- and our senior debt rating of B- on CreditWatch Negative. On January 16, 2013, Standard & Poor’s affirmed our financial strength rating of BB- and our senior debt rating of B-. They also removed the ratings from CreditWatch Negative and returned the outlook to stable. On December 7, 2012, Standard & Poor’s affirmed our financial strength rating of BB- and our senior debt rating of B- and placed the ratings on CreditWatch Negative. On April 5, 2012, Standard & Poor’s affirmed our financial strength rating of BB- and raised our senior debt rating to B- from CCC+. They maintained their stable outlook on our ratings. On March 24, 2011, Standard & Poor’s affirmed our financial strength rating of BB- and our senior debt rating of CCC+. They changed their outlook on our ratings from negative to stable.
78
The financial strength and debt ratings as of March 28, 2014 were as follows:
| | | | | | | | |
| | Financial Strength Rating | | | | Senior Debt Rating | | |
Rating Agency | | of Phoenix Life(1) | | Outlook | | of PNX | | Outlook |
| | | | | | | | |
A.M. Best Company, Inc. | | B | | Stable | | b | | Negative |
Standard & Poor’s | | BB- | | Negative | | B- | | Negative |
———————
(1)
PHLVIC is also rated by A.M. Best Company, Inc. and Standard & Poor’s. Phoenix Life and Annuity Company and American Phoenix Life and Reassurance Company are only rated by A.M. Best Company, Inc. All subsidiaries have the same rating as Phoenix Life.
Reference in this report to any credit rating is intended for the limited purposes of discussing or referring to changes in our credit ratings or aspects of our liquidity or costs of funds. Such reference cannot be relied on for any other purposes, or used to make any inference concerning future performance, future liquidity or any future credit rating.
Consolidated Financial Condition
| | | | | | | | | | |
Consolidated Balance Sheets: | | | Increase (decrease) and percentage change |
($ in millions) | As of December 31, | |
| 2012 | | 2011 | | 2012 vs. 2011 |
| | | As restated and amended | | |
| | | | |
ASSETS | | | | | | | | | | |
Available-for-sale debt securities, at fair value | $ | 12,656.0 | | $ | 11,797.0 | | $ | 859.0 | | 7% |
Available-for-sale equity securities, at fair value | | 34.8 | | | 35.7 | | | (0.9) | | (3%) |
Limited partnerships and other investments | | 577.3 | | | 565.3 | | | 12.0 | | 2% |
Policy loans, at unpaid principal balances | | 2,354.7 | | | 2,379.3 | | | (24.6) | | (1%) |
Derivative instruments | | 157.4 | | | 162.2 | | | (4.8) | | (3%) |
Fair value investments | | 201.5 | | | 184.0 | | | 17.5 | | 10% |
Total investments | | 15,981.7 | | | 15,123.5 | | | 858.2 | | 6% |
Cash and cash equivalents | | 246.4 | | | 168.2 | | | 78.2 | | 46% |
Accrued investment income | | 170.3 | | | 175.6 | | | (5.3) | | (3%) |
Receivables | | 666.5 | | | 648.6 | | | 17.9 | | 3% |
Deferred policy acquisition costs | | 902.2 | | | 1,119.2 | | | (217.0) | | (19%) |
Deferred income taxes, net | | 49.4 | | | 120.6 | | | (71.2) | | (59%) |
Other assets | | 243.1 | | | 230.1 | | | 13.0 | | 6% |
Discontinued operations assets | | 53.7 | | | 85.3 | | | (31.6) | | (37%) |
Separate account assets | | 3,316.5 | | | 3,816.9 | | | (500.4) | | (13%) |
Total assets | $ | 21,629.8 | | $ | 21,488.0 | | $ | 141.8 | | 1% |
| | | | | | | | | | |
LIABILITIES | | | | | | | | | | |
Policy liabilities and accruals | $ | 12,656.7 | | $ | 12,631.4 | | $ | 25.3 | | 0% |
Policyholder deposit funds | | 3,040.7 | | | 2,432.2 | | | 608.5 | | 25% |
Dividend obligations | | 1,003.6 | | | 752.5 | | | 251.1 | | 33% |
Indebtedness | | 378.8 | | | 426.9 | | | (48.1) | | (11%) |
Other liabilities | | 674.6 | | | 658.0 | | | 16.6 | | 3% |
Discontinued operations liabilities | | 48.4 | | | 74.4 | | | (26.0) | | (35%) |
Separate account liabilities | | 3,316.5 | | | 3,816.9 | | | (500.4) | | (13%) |
Total liabilities | | 21,119.3 | | | 20,792.3 | | | 327.0 | | 2% |
| | | | | | | | | | |
STOCKHOLDERS’ EQUITY | | | | | | | | | | |
Common stock | | 0.1 | | | 1.3 | | | (1.2) | | (92%) |
Additional paid in capital | | 2,633.1 | | | 2,630.5 | | | 2.6 | | 0% |
Accumulated other comprehensive loss | | (249.3) | | | (230.7) | | | (18.6) | | (8%) |
Accumulated deficit | | (1,697.2) | | | (1,528.7) | | | (168.5) | | (11%) |
Treasury stock | | (182.9) | | | (179.5) | | | (3.4) | | (2%) |
Total The Phoenix Companies, Inc. stockholders’ equity | | 503.8 | | | 692.9 | | | (189.1) | | (28%) |
Noncontrolling interests | | 6.7 | | | 2.8 | | | 3.9 | | NM |
Total stockholders’ equity | | 510.5 | | | 695.7 | | | (185.2) | | (27%) |
Total liabilities and stockholders’ equity | $ | 21,629.8 | | $ | 21,488.0 | | $ | 141.8 | | 1% |
79
December 31, 2012 compared to December 31, 2011
Assets
The increase in total investments was the result of purchases of securities associated with positive cash flow generated by our annuity business as sales continue to increase. In addition, the value of available-for-sale debt securities improved as a result of favorable impacts on fixed income securities as treasury rates have declined during 2012.
Deferred policy acquisition costs decreased primarily related to universal life and traditional whole life as a result of amortization during the year ended December 31, 2012. The deferred policy acquisition cost balance associated with fixed annuities increased related to the deferral of commissions on sales of our fixed indexed annuities, partially offset by amortization of previously deferred expenses. The table below presents deferred policy acquisition cost by product.
The decrease in the deferred income tax assets recorded is attributable to the current period reduction of unrealized losses on the Company’s available-for-sale debt securities for which a deferred tax asset has been recorded.
| | | | | | | | | | |
Composition of Deferred Policy Acquisition Costs | | | Increase (decrease) and percentage change |
by Product: | As of December 31, | |
($ in millions) | 2012 | | 2011 | | 2012 vs. 2011 |
| | | As restated and amended | | |
| | | | |
| | | | | | | | | | |
Variable universal life | $ | 140.8 | | $ | 155.7 | | $ | (14.9) | | (10%) |
Universal life | | 209.1 | | | 380.7 | | | (171.6) | | (45%) |
Variable annuities | | 91.8 | | | 115.2 | | | (23.4) | | (20%) |
Fixed annuities | | 129.0 | | | 67.4 | | | 61.6 | | 91% |
Traditional life | | 331.5 | | | 400.2 | | | (68.7) | | (17%) |
Total deferred policy acquisition costs | $ | 902.2 | | $ | 1,119.2 | | $ | (217.0) | | (19%) |
———————
Not meaningful (NM)
The majority of the decrease in discontinued assets and liabilities during the year ended December 31, 2012 was a result of the commutation of certain contracts during the second quarter of 2012.
Separate accounts decreased as a result of the transfer of pension assets from a Phoenix separate account to the direct control of the plan’s trustee during the second quarter of 2012. Variable annuity surrenders and lower market performance also contributed to the decline.
Liabilities and Stockholders’ Equity
Policyholder deposit funds increased during the 12 months ended December 31, 2012 primarily as a result of continued sales growth of fixed indexed annuities as illustrated in the table below entitled “Annuity Funds on Deposit.”
Dividend obligations increased during the 12 months ended December 31, 2012 primarily resulting from an increase in unrealized gains on the closed block assets related to a decline in interest rates.
During 2012, $48.3 million of surplus notes were repurchased and retired from the open market.
The decrease in total stockholders’ equity was primarily a result of the net loss recognized for the 12 months ended December 31, 2012. The net loss was partially offset by a decrease in accumulated other comprehensive loss related to appreciation of investments.
80
| | | | | | | | | | |
Consolidated Balance Sheets: | | | Increase (decrease) and percentage change |
($ in millions) | Mar 31, | | Dec 31, | |
| 2012 | | 2011 | | 2012 vs. 2011 |
| As restated and amended | | As restated and amended | | As restated and amended |
| | |
ASSETS | | | | | | | | | | |
Available-for-sale debt securities, at fair value | $ | 12,062.7 | | $ | 11,797.0 | | $ | 265.7 | | 2% |
Available-for-sale equity securities, at fair value | | 38.4 | | | 35.7 | | | 2.7 | | 8% |
Limited partnerships and other investments | | 572.3 | | | 565.3 | | | 7.0 | | 1% |
Policy loans, at unpaid principal balances | | 2,374.8 | | | 2,379.3 | | | (4.5) | | 0% |
Derivative instruments | | 174.6 | | | 162.2 | | | 12.4 | | 8% |
Fair value investments | | 184.6 | | | 184.0 | | | 0.6 | | 0% |
Total investments | | 15,407.4 | | | 15,123.5 | | | 283.9 | | 2% |
Cash and cash equivalents | | 177.0 | | | 168.2 | | | 8.8 | | 5% |
Accrued investment income | | 182.5 | | | 175.6 | | | 6.9 | | 4% |
Receivables | | 649.5 | | | 648.6 | | | 0.9 | | 0% |
Deferred policy acquisition costs | | 1,062.9 | | | 1,119.2 | | | (56.3) | | (5%) |
Deferred income taxes, net | | 92.1 | | | 120.6 | | | (28.5) | | (24%) |
Other assets | | 227.0 | | | 230.1 | | | (3.1) | | (1%) |
Discontinued operations assets | | 82.7 | | | 85.3 | | | (2.6) | | (3%) |
Separate account assets | | 4,042.6 | | | 3,816.9 | | | 225.7 | | 6% |
Total assets | $ | 21,923.7 | | $ | 21,488.0 | | $ | 435.7 | | 2% |
| | | | | | | | | | |
LIABILITIES | | | | | | | | | | |
Policy liabilities and accruals | $ | 12,595.5 | | $ | 12,631.4 | | $ | (35.9) | | 0% |
Policyholder deposit funds | | 2,604.5 | | | 2,432.2 | | | 172.3 | | 7% |
Dividend obligations | | 802.4 | | | 752.5 | | | 49.9 | | 7% |
Indebtedness | | 426.9 | | | 426.9 | | | — | | 0% |
Other liabilities | | 690.2 | | | 658.0 | | | 32.2 | | 5% |
Discontinued operations liabilities | | 72.3 | | | 74.4 | | | (2.1) | | (3%) |
Separate account liabilities | | 4,042.6 | | | 3,816.9 | | | 225.7 | | 6% |
Total liabilities | | 21,234.4 | | | 20,792.3 | | | 442.1 | | 2% |
| | | | | | | | | | |
STOCKHOLDERS’ EQUITY | | | | | | | | | | |
Common stock | | 1.3 | | | 1.3 | | | — | | 0% |
Additional paid in capital | | 2,630.8 | | | 2,630.5 | | | 0.3 | | 0% |
Accumulated other comprehensive loss | | (223.9) | | | (230.7) | | | 6.8 | | 3% |
Accumulated deficit | | (1,542.2) | | | (1,528.7) | | | (13.5) | | (1%) |
Treasury stock | | (179.5) | | | (179.5) | | | — | | 0% |
Total The Phoenix Companies, Inc. stockholders’ equity | | 686.5 | | | 692.9 | | | (6.4) | | (1%) |
Noncontrolling interests | | 2.8 | | | 2.8 | | | — | | 0% |
Total stockholders’ equity | | 689.3 | | | 695.7 | | | (6.4) | | (1%) |
Total liabilities and stockholders’ equity | $ | 21,923.7 | | $ | 21,488.0 | | $ | 435.7 | | 2% |
March 31, 2012 compared with December 31, 2011
Assets
The increase in total investments was the result of purchases of securities associated with positive cash flow generated by our annuity business as sales continue to increase. In addition, limited partnerships and other investments increased primarily as a result of mezzanine funds.
Deferred policy acquisition costs decreased primarily related to universal life as a result of amortization during the quarter ended March 31, 2012. The deferred policy acquisition cost balance associated with the fixed annuities increased related to the deferral of commissions on sales of our fixed indexed annuities, partially offset by amortization. The table below presents deferred policy acquisition cost by product.
The decrease in deferred tax assets recorded is attributable to the current period reduction of unrealized losses on the Company’s available-for-sale debt securities for which a deferred tax asset has been recorded.
81
| | | | | | | | | | |
Composition of Deferred Policy Acquisition Costs | | | | | Increase (decrease) and percentage change |
by Product: | Mar 31, | | Dec 31, | |
($ in millions) | 2012 | | 2011 | | 2012 vs. 2011 |
| As restated and amended | | As restated and amended | | As restated and amended |
| | |
| | | | | | | | | | |
Variable universal life | $ | 152.4 | | $ | 155.7 | | $ | (3.3) | | (2%) |
Universal life | | 326.1 | | | 380.7 | | | (54.6) | | (14%) |
Variable annuities | | 115.8 | | | 115.2 | | | 0.6 | | 1% |
Fixed annuities | | 76.2 | | | 67.4 | | | 8.8 | | 13% |
Traditional life | | 392.4 | | | 400.2 | | | (7.8) | | (2%) |
Total deferred policy acquisition costs | $ | 1,062.9 | | $ | 1,119.2 | | $ | (56.3) | | (5%) |
The decline in other assets at March 31, 2012 as compared with December 31, 2011 was primarily a result of a decrease in investment receivables attributable to a lower volume of unsettled investment sales, a decrease in the current tax receivable and a decrease in premises and equipment related to amortization.
Separate accounts increased as a result of favorable market performance during the quarter and positive variable universal life net flows, partially offset by variable annuity surrenders.
Liabilities and Stockholders’ Equity
Policyholder deposit funds increased primarily as a result of continued sales growth of fixed indexed annuities.
Dividend obligations increased during the three months ended March 31, 2012 primarily resulting from an increase in unrealized gains on the closed block assets related to a decline in interest rates in the first three months of 2012.
The decrease in total stockholders’ equity was primarily a result of a decrease in accumulated other comprehensive loss related to appreciation of investments, which were partially offset by the net loss recognized for the quarter.
82
| | | | | | | | | | |
Consolidated Balance Sheets: | | | | | Increase (decrease) and percentage change |
($ in millions) | June 30, | | Dec 31, | |
| 2012 | | 2011 | | 2012 vs. 2011 |
| As restated and amended | | As restated and amended | | As restated and amended |
| | |
ASSETS | | | | | | | | | | |
Available-for-sale debt securities, at fair value | $ | 12,224.0 | | $ | 11,797.0 | | $ | 427.0 | | 4% |
Available-for-sale equity securities, at fair value | | 37.5 | | | 35.7 | | | 1.8 | | 5% |
Limited partnerships and other investments | | 561.5 | | | 565.3 | | | (3.8) | | (1%) |
Policy loans, at unpaid principal balances | | 2,362.4 | | | 2,379.3 | | | (16.9) | | (1%) |
Derivative instruments | | 177.6 | | | 162.2 | | | 15.4 | | 9% |
Fair value investments | | 198.0 | | | 184.0 | | | 14.0 | | 8% |
Total investments | | 15,561.0 | | | 15,123.5 | | | 437.5 | | 3% |
Cash and cash equivalents | | 213.0 | | | 168.2 | | | 44.8 | | 27% |
Accrued investment income | | 186.6 | | | 175.6 | | | 11.0 | | 6% |
Receivables | | 669.2 | | | 648.6 | | | 20.6 | | 3% |
Deferred policy acquisition costs | | 1,013.3 | | | 1,119.2 | | | (105.9) | | (9%) |
Deferred income taxes, net | | 89.6 | | | 120.6 | | | (31.0) | | (26%) |
Other assets | | 226.4 | | | 230.1 | | | (3.7) | | (2%) |
Discontinued operations assets | | 58.2 | | | 85.3 | | | (27.1) | | (32%) |
Separate account assets | | 3,336.8 | | | 3,816.9 | | | (480.1) | | (13%) |
Total assets | $ | 21,354.1 | | $ | 21,488.0 | | $ | (133.9) | | (1%) |
| | | | | | | | | | |
LIABILITIES | | | | | | | | | | |
Policy liabilities and accruals | $ | 12,603.6 | | $ | 12,631.4 | | $ | (27.8) | | 0% |
Policyholder deposit funds | | 2,767.1 | | | 2,432.2 | | | 334.9 | | 14% |
Dividend obligations | | 875.5 | | | 752.5 | | | 123.0 | | 16% |
Indebtedness | | 426.9 | | | 426.9 | | | — | | 0% |
Other liabilities | | 642.7 | | | 658.0 | | | (15.3) | | (2%) |
Discontinued operations liabilities | | 49.2 | | | 74.4 | | | (25.2) | | (34%) |
Separate account liabilities | | 3,336.8 | | | 3,816.9 | | | (480.1) | | (13%) |
Total liabilities | | 20,701.8 | | | 20,792.3 | | | (90.5) | | 0% |
| | | | | | | | | | |
STOCKHOLDERS’ EQUITY | | | | | | | | | | |
Common stock | | 1.3 | | | 1.3 | | | — | | 0% |
Additional paid in capital | | 2,631.0 | | | 2,630.5 | | | 0.5 | | 0% |
Accumulated other comprehensive loss | | (227.3) | | | (230.7) | | | 3.4 | | 1% |
Accumulated deficit | | (1,577.6) | | | (1,528.7) | | | (48.9) | | (3%) |
Treasury stock | | (180.0) | | | (179.5) | | | (0.5) | | 0% |
Total The Phoenix Companies, Inc. stockholders’ equity | | 647.4 | | | 692.9 | | | (45.5) | | (7%) |
Noncontrolling interests | | 4.9 | | | 2.8 | | | 2.1 | | 75% |
Total stockholders’ equity | | 652.3 | | | 695.7 | | | (43.4) | | (6%) |
Total liabilities and stockholders’ equity | $ | 21,354.1 | | $ | 21,488.0 | | $ | (133.9) | | (1%) |
June 30, 2012 compared with December 31, 2011
Assets
The increase in total investments was the result of purchases of securities associated with positive cash flow generated by our annuity business as sales continue to increase. In addition, the value of available-for-sale debt securities improved as a result of favorable impacts on fixed income securities as treasury rates have declined during the first half of 2012.
The increase in receivables is a result of additional ceded reserves due to the increase in policy liabilities during the second quarter of 2012.
Deferred policy acquisition costs decreased primarily related to universal life as a result of amortization during the six months ended June 30, 2012. The table below presents deferred policy acquisition cost by product.
The decrease in deferred tax assets recorded is attributable to the current period reduction of unrealized losses on the Company’s available-for-sale debt securities for which a deferred tax asset has been recorded.
83
| | | | | | | | | | |
Composition of Deferred Policy Acquisition Costs | | | | | Increase (decrease) and percentage change |
by Product: | June 30, | | Dec 31, | |
($ in millions) | 2012 | | 2011 | | 2012 vs. 2011 |
| As restated and amended | | As restated and amended | | As restated and amended |
| | |
| | | | | | | | | | |
Variable universal life | $ | 148.1 | | $ | 155.7 | | $ | (7.6) | | (5%) |
Universal life | | 288.3 | | | 380.7 | | | (92.4) | | (24%) |
Variable annuities | | 112.8 | | | 115.2 | | | (2.4) | | (2%) |
Fixed annuities | | 73.8 | | | 67.4 | | | 6.4 | | 9% |
Traditional life | | 390.3 | | | 400.2 | | | (9.9) | | (2%) |
Total deferred policy acquisition costs | $ | 1,013.3 | | $ | 1,119.2 | | $ | (105.9) | | (9%) |
Discontinued assets and liabilities declined as a result of the commutation of certain contracts during the second quarter of 2012.
Separate accounts decreased as a result of the transfer of pension assets from a Phoenix separate account to the direct control of the plan’s trustee. Variable annuity surrenders and lower market performance also contributed to the decline.
Liabilities and Stockholders’ Equity
Policyholder deposit funds increased during the six months ended June 30, 2012 primarily as a result of continued sales growth of fixed indexed annuities.
Dividend obligations increased during the six months ended June 30, 2012 primarily resulting from an increase in unrealized gains on the closed block assets related to a decline in interest rates in the first six months of 2012.
The decrease in total stockholders’ equity was primarily a result of the net loss recognized for the quarter. The net loss was partially offset by a decrease in accumulated other comprehensive loss related to appreciation of investments.
84
| | | | | | | | | | |
Consolidated Balance Sheets: | | | | | Increase (decrease) and percentage change |
($ in millions) | Sept 30, | | Dec 31, | |
| 2012 | | 2011 | | 2012 vs. 2011 |
| | | As restated and amended | | |
| | | | |
ASSETS | | | | | | | | | | |
Available-for-sale debt securities, at fair value | $ | 12,436.7 | | $ | 11,797.0 | | $ | 639.7 | | 5% |
Available-for-sale equity securities, at fair value | | 30.9 | | | 35.7 | | | (4.8) | | (13%) |
Limited partnerships and other investments | | 559.2 | | | 565.3 | | | (6.1) | | (1%) |
Policy loans, at unpaid principal balances | | 2,338.4 | | | 2,379.3 | | | (40.9) | | (2%) |
Derivative instruments | | 195.1 | | | 162.2 | | | 32.9 | | 20% |
Fair value investments | | 213.8 | | | 184.0 | | | 29.8 | | 16% |
Total investments | | 15,774.1 | | | 15,123.5 | | | 650.6 | | 4% |
Cash and cash equivalents | | 283.8 | | | 168.2 | | | 115.6 | | 69% |
Accrued investment income | | 207.8 | | | 175.6 | | | 32.2 | | 18% |
Receivables | | 663.1 | | | 648.6 | | | 14.5 | | 2% |
Deferred policy acquisition costs | | 944.4 | | | 1,119.2 | | | (174.8) | | (16%) |
Deferred income taxes, net | | 61.1 | | | 120.6 | | | (59.5) | | (49%) |
Other assets | | 279.3 | | | 230.1 | | | 49.1 | | 21% |
Discontinued operations assets | | 53.9 | | | 85.3 | | | (31.4) | | (37%) |
Separate account assets | | 3,395.4 | | | 3,816.9 | | | (421.5) | | (11%) |
Total assets | $ | 21,662.9 | | $ | 21,488.0 | | $ | 174.9 | | 1% |
| | | | | | | | | | |
LIABILITIES | | | | | | | | | | |
Policy liabilities and accruals | $ | 12,657.0 | | $ | 12,631.4 | | $ | 25.6 | | 0% |
Policyholder deposit funds | | 2,914.6 | | | 2,432.2 | | | 482.4 | | 20% |
Dividend obligations | | 991.0 | | | 752.5 | | | 238.5 | | 32% |
Indebtedness | | 378.8 | | | 426.9 | | | (48.1) | | (11%) |
Other liabilities | | 730.5 | | | 658.0 | | | 72.5 | | 11% |
Discontinued operations liabilities | | 48.8 | | | 74.4 | | | (25.6) | | (34%) |
Separate account liabilities | | 3,395.4 | | | 3,816.9 | | | (421.5) | | (11%) |
Total liabilities | | 21,116.1 | | | 20,792.3 | | | 323.8 | | 2% |
| | | | | | | | | | |
STOCKHOLDERS’ EQUITY | | | | | | | | | | |
Common stock | | 0.1 | | | 1.3 | | | (1.2) | | (92%) |
Additional paid in capital | | 2,632.7 | | | 2,630.5 | | | 2.2 | | 0% |
Accumulated other comprehensive loss | | (231.9) | | | (230.7) | | | (1.2) | | (1%) |
Accumulated deficit | | (1,676.4) | | | (1,528.7) | | | (147.7) | | (10%) |
Treasury stock | | (182.9) | | | (179.5) | | | (3.4) | | (2%) |
Total The Phoenix Companies, Inc. stockholders’ equity | | 541.6 | | | 692.9 | | | (151.3) | | (22%) |
Noncontrolling interests | | 5.2 | | | 2.8 | | | 2.4 | | 86% |
Total stockholders’ equity | | 546.8 | | | 695.7 | | | (148.9) | | (21%) |
Total liabilities and stockholders’ equity | $ | 21,662.9 | | $ | 21,488.0 | | $ | 174.9 | | 1% |
September 30, 2012 compared with December 31, 2011
Assets
The increase in total investments was the result of purchases of securities associated with positive cash flow generated by our annuity business as sales continue to increase. In addition, the value of available-for-sale debt securities improved as a result of favorable impacts on fixed income securities as treasury rates declined during the first three quarters of 2012. Partially offsetting these increases was a decline in policy loans outstanding.
The increase in accrued investment income was attributable to the higher amount of available for sale debt securities and higher policyholder loan accrued interest.
The increase in receivables was attributable to a higher amount of claims to reinsurers as a result of negative mortality experience in the third quarter of 2012, resulting in higher outstanding reinsurance recoverables.
85
Deferred policy acquisition costs decreased primarily related to universal life as a result of amortization during the nine months ended September 30, 2012. The deferred policy acquisition cost balance associated with fixed annuities increased related to the deferral of commissions on sales of our fixed indexed annuities, partially offset by amortization of previously deferred expenses. The table below presents deferred policy acquisition cost by product.
The decrease in deferred tax assets recorded is attributable to the current period reduction of unrealized losses on the Company’s available-for-sale debt securities for which a deferred tax asset has been recorded.
| | | | | | | | | | |
Composition of Deferred Policy Acquisition Costs | | | | | Increase (decrease) and percentage change |
by Product: | Sept 30, | | Dec 31, | |
($ in millions) | 2012 | | 2011 | | 2012 vs. 2011 |
| | | As restated and amended | | |
| | | | |
| | | | | | | | | | |
Variable universal life | $ | 143.7 | | $ | 155.7 | | $ | (12.0) | | (8%) |
Universal life | | 241.3 | | | 380.7 | | | (139.4) | | (37%) |
Variable annuities | | 100.0 | | | 115.2 | | | (15.2) | | (13%) |
Fixed annuities | | 116.3 | | | 67.4 | | | 48.9 | | NM |
Traditional life | | 343.1 | | | 400.2 | | | (57.1) | | (14%) |
Total deferred policy acquisition costs | $ | 944.4 | | $ | 1,119.2 | | $ | (174.8) | | (16%) |
———————
Not meaningful (NM)
Discontinued assets and liabilities declined as a result of the commutation of certain contracts during the second quarter of 2012.
Separate accounts decreased primarily as a result of the transfer of pension assets from a Phoenix separate account to the direct control of the plan’s trustee during the second quarter of 2012.
Liabilities and Stockholders’ Equity
Policyholder deposit funds increased during the nine months ended September 30, 2012 primarily as a result of continued sales growth of fixed indexed annuities.
Dividend obligations increased during the nine months ended September 30, 2012 primarily resulting from an increase in unrealized gains on the closed block assets related to a decline in interest rates in the first nine months of 2012.
During the third quarter of 2012, $48.3 million of surplus notes were repurchased from the open market.
The decrease in total stockholders’ equity was primarily a result of the net loss recognized for quarter. The net loss was partially offset by a decrease in accumulated other comprehensive loss related to appreciation of investments.
Funds on Deposit
| | | | | | | | |
Annuity Funds on Deposit: | Years Ended December 31, |
($ in millions) | 2012 | | 2011 | | 2010 |
| | | | | | | | |
Deposits | $ | 824.2 | | $ | 951.5 | | $ | 220.8 |
Performance and interest credited | | 386.4 | | | 63.5 | | | 452.1 |
Fees | | (60.7) | | | (55.1) | | | (56.2) |
Benefits and surrenders | | (603.2) | | | (547.8) | | | (537.3) |
Change in funds on deposit | | 546.7 | | | 412.1 | | | 79.4 |
Funds on deposit, beginning of period | | 4,495.4 | | | 4,083.3 | | | 4,003.9 |
Annuity funds on deposit, end of period | $ | 5,042.1 | | $ | 4,495.4 | | $ | 4,083.3 |
2012 vs. 2011
Annuity funds on deposit increased $546.7 million during the year ended December 31, 2012 compared to an increase of $412.1 million during the year ended December 31, 2011. The increase in 2012 was driven by stronger market performance partially offset by lower fixed indexed annuity product sales and higher surrenders.
86
2011 vs. 2010
Annuity funds on deposit increased $412.1 million during the year ended December 31, 2011 compared to an increase of $79.4 million during the year ended December 31, 2010. The higher increase in 2011 was driven by deposits related to the growth in sales of the fixed indexed annuity product partially offset by lower fund performance and larger surrenders related to variable annuity products.
| | | | | | | | |
Variable Universal Life Funds on Deposit: | Years Ended December 31, |
($ in millions) | 2012 | | 2011 | | 2010 |
| | | | | | | | |
Deposits | $ | 82.6 | | $ | 98.3 | | $ | 108.5 |
Performance and interest credited | | 120.2 | | | (6.7) | | | 143.6 |
Fees and COI | | (79.0) | | | (83.1) | | | (89.1) |
Benefits and surrenders | | (128.6) | | | (141.0) | | | (179.9) |
Change in funds on deposit | | (4.8) | | | (132.5) | | | (16.9) |
Funds on deposit, beginning of period | | 1,019.1 | | | 1,151.6 | | | 1,168.5 |
Variable universal life funds on deposit, end of period | $ | 1,014.3 | | $ | 1,019.1 | | $ | 1,151.6 |
2012 vs. 2011
Variable universal life funds on deposit decreased $4.8 million during the year ended December 31, 2012compared to a decrease of $132.5 million during the year ended December 31, 2011. The smaller decline in 2012 was primarily driven by stronger market performance and lower surrenders partially offset by lower deposits.
2011 vs. 2010
Variable universal life funds on deposit decreased $132.5 million during the year ended December 31, 2011 compared to a decrease of $16.9 million during the year ended December 31, 2010. The larger decline in 2011 was primarily driven by lower market performance partially offset by lower surrenders.
| | | | | | | | |
Universal Life Funds on Deposit: | Years Ended December 31, |
($ in millions) | 2012 | | 2011 | | 2010 |
| | | | | | | | |
Deposits | $ | 384.0 | | $ | 384.5 | | $ | 336.2 |
Interest credited | | 75.1 | | | 79.2 | | | 85.7 |
Fees and COI | | (367.2) | | | (404.5) | | | (420.1) |
Benefits and surrenders | | (106.8) | | | (125.3) | | | (163.6) |
Change in funds on deposit | | (14.9) | | | (66.1) | | | (161.8) |
Funds on deposit, beginning of period | | 1,852.8 | | | 1,918.9 | | | 2,080.7 |
Universal life funds on deposit, end of period | $ | 1,837.9 | | $ | 1,852.8 | | $ | 1,918.9 |
2012 vs. 2011
Universal life funds on deposit decreased $14.9 million and $66.1 million during the years ended December 31, 2012 and 2011, respectively. The smaller decline in 2012 as compared to 2011 was primarily driven by a decrease in surrenders.
2011 vs. 2010
Universal life funds on deposit decreased $66.1 million and $161.8 million during the years ended December 31, 2011 and 2010, respectively. The declines were lower in 2011 as compared to 2010 as a result of the increase in deposits as well as a decrease in surrenders.
87
Contractual Obligations and Commercial Commitments
| | | | | | | | | | | | | | |
Contractual Obligations and Commercial Commitments: |
($ in millions) | As of December 31, 2012 |
| Total | | 2013 | | 2014 – 2015 | | 2016 – 2017 | | Thereafter |
Contractual Obligations Due | | | | | | | | | | | | | | |
Indebtedness, including interest payments | $ | 941.2 | | $ | 27.9 | | $ | 55.8 | | $ | 55.8 | | $ | 801.7 |
Operating lease obligations (1) | | 16.4 | | | 1.4 | | | 2.6 | | | 2.7 | | | 9.7 |
Other purchase liabilities (2) | | 100.0 | | | 38.2 | | | 51.0 | | | 7.5 | | | 3.3 |
Policyholder contractual obligation (3) | | 39,525.5 | | | 2,111.5 | | | 3,949.4 | | | 3,813.4 | | | 29,651.2 |
Total contractual obligations (4) | $ | 40,583.1 | | $ | 2,179.0 | | $ | 4,058.8 | | $ | 3,879.4 | | $ | 30,465.9 |
| | | | | | | | | | | | | | |
Commercial Commitment Expirations | | | | | | | | | | | | | | |
Other commercial commitments (5) | $ | 270.7 | | $ | 126.9 | | $ | 82.7 | | $ | 51.7 | | $ | 9.4 |
Total commercial commitments | $ | 270.7 | | $ | 126.9 | | $ | 82.7 | | $ | 51.7 | | $ | 9.4 |
———————
(1)
All future obligations for leased property of our discontinued operations were assumed by the buyer upon completion of the sale on June 23, 2010. See Note 21 to our consolidated financial statements under “Item 8: Financial Statements and Supplementary Data” in this Annual Report on Form 10-K for additional information.
(2)
Other purchase liabilities relate to open purchase orders and other contractual obligations. This amount does not include our expected pension contribution of approximately $11.4 million in 2013. See Note 17 to our consolidated financial statements under “Item 8: Financial Statements and Supplementary Data” in this Annual Report on Form 10-K for additional information on pension and other postretirement benefits.
(3)
Policyholder contractual obligations represent estimated benefits from life insurance and annuity contracts issued by our life insurance subsidiaries. Policyholder contractual obligations also include separate account liabilities, which are contractual obligations of the separate account assets established under applicable state insurance laws and are legally insulated from our general account assets.
Future obligations are based on our estimate of future investment earnings, mortality, surrenders and applicable policyholder dividends. Included in the amounts above are policyholder dividends generated by estimated favorable future investment and mortality, in excess of guaranteed amounts for our closed block. Actual obligations in any single year, or ultimate total obligations, may vary materially from these estimates as actual experience emerges. As described in Note 3 to our consolidated financial statements under “Item 8: Financial Statements and Supplementary Data” in this Annual Report on Form 10-K, policy liabilities and accruals are recorded on the consolidated balance sheets in amounts adequate to meet the estimated future obligations of the policies in force. The policyholder obligations reflected in the table above exceed the policy liabilities, Policyholder deposit fund liabilities and separate account liabilities reported on our December 31, 2012 consolidated balance sheets because the above amounts do not reflect future investment earnings and future premiums and deposits on those policies. Separate account obligations will be funded by the cash flows from separate account assets, while the remaining obligations will be funded by cash flows from investment earnings on general account assets and premiums and deposits on contracts in force.
(4)
We do not anticipate any increases to unrecognized tax benefits that would have a significant impact on the financial position of the Company. Therefore, no unrecognized tax benefits have been excluded from this table. See Note 15 to our consolidated financial statements under “Item 8: Financial Statements and Supplementary Data” in this Annual Report on Form 10-K for additional information on unrecognized tax benefits.
(5)
Other commercial commitments relate to agreements to fund limited partnerships. These commitments can be drawn down by private equity funds as necessary to fund their portfolio investments through the end of the funding period as stated in each agreement.
Commitments Related to Recent Business Combinations
Goodwin Capital Advisers, Inc.
On September 14, 2011, we entered into a definitive agreement to sell Goodwin Capital Advisers, Inc. (“Goodwin”) to Conning Holdings. Also, on September 14, 2011, we entered into multi-year investment management agreements with Conning under which Conning will manage the Company’s publicly traded fixed income assets. Because of the ongoing cash flows associated with the investment management agreements, results of these operations have been reflected within continuing operations. The transaction closed on November 18, 2011.
Private placement and limited partnership portfolios previously managed under Goodwin continue to be managed by Phoenix under its subsidiary, Phoenix Life.
PFG Holdings, Inc.
On January 4, 2010, we signed a definitive agreement to sell PFG and its subsidiaries, including AGL Life Assurance Company, to Tiptree. Because of the divestiture, these operations are reflected as discontinued operations. On June 23, 2010, we completed the divestiture of PFG and closed the transaction.
88
The definitive agreement contains a provision requiring us to indemnify Tiptree for any losses due to actions resulting from certain specified acts or omissions associated with the divested business prior to closing. There has been litigation filed that falls within this provision of the agreement but does not name the Company as a party to the litigation. We intend to defend these matters vigorously based on our indemnity commitment.
Phoenix Life and Reassurance Company of New York
Included within the January 4, 2010 agreement with Tiptree was a provision for the purchase of PLARNY pending regulatory approval. On September 24, 2010, approval was obtained from the NYDFS for Tiptree and PFG Holdings Acquisition Corporation to acquire PLARNY. The transaction closed on October 6, 2010. Because of the divestiture, these operations are reflected as discontinued operations.
Obligations Related to Pension and Postretirement Employee Benefit Plans
We provide our employees with post-employment benefits that include retirement benefits, through pension and savings plans, and other benefits, including health care and life insurance. Employee benefit expense related to these plans totaled $15.5 million, $16.5 million and $22.4 million for 2012, 2011 and 2010, respectively.
We have three defined benefit pension plans covering our employees. The employee pension plan provides benefits up to the amount allowed under the Internal Revenue Code. The two supplemental plans provide benefits to certain executives in excess of the primary plan. Retirement benefits under the plans are a function of years of service and compensation. Effective March 31, 2010, all benefit accruals under all of our funded and unfunded defined benefit plans were frozen. This change was announced in 2009 and a curtailment was recognized at that time for the reduction in the expected years of future service.
Employee Pension Plan
The employee pension plan is a qualified plan that is funded with assets held in a trust. It is the Company’s practice to make contributions to the qualified pension plan at least sufficient to avoid benefit restrictions under funding requirements of the Pension Protection Act of 2006. This generally requires the Company to maintain assets that are at least 80% of the plan’s liabilities as calculated under the applicable regulations at the end of the prior year. Under these regulations, the qualified pension plan is currently funded above 80% of the funding target liabilities as of December 31, 2012.
The funded status of the qualified pension plan based on the projected benefit obligations for the years ended December 31, 2012 and 2011 are summarized in the following table:
| | | | | |
Qualified Employee Pension Plan Funded Status: | As of December 31, |
($ in millions) | 2012 | | 2011 |
| | | As restated |
| | | and amended |
| | | | | |
Plan assets, end of year | $ | 475.8 | | $ | 437.6 |
Projected benefit obligation, end of year | | (694.8) | | | (646.3) |
Plan assets less than projected benefit obligations, end of year | $ | (219.0) | | $ | (208.7) |
To meet the above funding objectives, we made contributions to the pension plan totaling $18.2 million and $17.4 million during 2012 and 2011, respectively. Over the next 12 months, we expect to make contributions of approximately $11.4 million from the Company’s operating cash flow. On July 6, 2012, the Surface Transportation Extension Act of 2012, Part II, was enacted into law and is effective immediately. The law includes certain pension funding stabilization provisions, which the Company has taken advantage of in 2012.
The changes in the projected benefit obligations of the employee plan at December 31, 2012 as compared to December 31, 2011 were principally the result of accrued interest cost and actuarial losses due to assumption changes.
89
Supplemental Plans
The Company also has two supplemental plans that provide benefits to certain executives in excess of the primary plan. These plans are unfunded and represent general obligations of the Company. We fund periodic benefit payments to retirees as they become due under these plans from cash-flow from operations. The projected benefit obligations for the years ended December 31, 2012 and 2011 were $150.9 million and $141.9 million, respectively.
The changes in the projected benefit obligations of the supplemental plans at December 31, 2012 as compared to December 31, 2011 were principally the result of accrued interest cost and actuarial losses due to assumption changes.
We also have a postretirement benefit plan, which is unfunded and had projected benefit obligations of $40.6 million and $59.6 million as of December 31, 2012 and 2011, respectively. We fund periodic benefit payments under this plan from cash flows from operations as they become due.
We have entered into agreements with certain key executives of the Company that will, in certain circumstances, provide separation benefits upon the termination of the executive’s employment by the Company for reasons other than death, disability, cause or retirement, or by the executive for “good reason,” as defined in the agreements. The agreements provide this protection only if the termination occurs following (or is effectively connected with) the occurrence of a change of control, as defined in the agreements. As soon as reasonably possible upon a change in control, as so defined, we are required to make an irrevocable contribution to a trust in an amount sufficient to pay benefits due under these agreements. See Note 17 to our consolidated financial statements under “Item 8: Financial Statements and Supplementary Data” in this Annual Report on Form 10-K for more information on our pension and other post-employment benefits.
We have agreements with certain of our employees that provide for additional retirement benefits. In the year ended December 31, 2012, the estimated liability for these benefits was $18.4 million.
Off-Balance Sheet Arrangements
We do not have any off-balance sheet arrangements that are reasonably likely to have a material effect on the financial condition, results of operations, liquidity, or capital resources of the Company. The Company does have unfunded commitments to purchase investments in limited partnerships and private placements and a commitment for infrastructure services which are disclosed in Note 25 to our consolidated financial statements under “Item 8: Financial Statements and Supplementary Data” in this Annual Report on Form 10-K.
Reinsurance
We use reinsurance agreements to limit potential losses, reduce exposure to larger risks and provide capital relief with regard to certain reserves. We remain liable to the extent that reinsuring companies may not be able to meet their obligations under reinsurance agreements in effect. Failure of the reinsurers to honor their obligations could result in losses to the Company. Since we bear the risk of nonpayment, on a quarterly basis we evaluate the financial condition of our reinsurers and monitor concentrations of credit risk. Based on our review of their financial statements, reputation in the reinsurance marketplace and other relevant information, we believe that we have no material exposure to uncollectible life reinsurance. At December 31, 2012, five major reinsurance companies account for approximately 64% of the reinsurance recoverable.
Effective October 1, 2011, Phoenix Life entered into an agreement that provides modified coinsurance for approximately one-third of the closed block policies. This contract did not meet the requirements of risk transfer in accordance with U.S. GAAP, and therefore, deposit accounting is applied.
Statutory Capital and Surplus and Risk-Based Capital
Phoenix Life’s statutory basis capital and surplus (including AVR) increased from $845.7 million at December 31, 2011 to $922.5 million at December 31, 2012. The principal factors resulting in this increase were net income of $208.7 million offset by dividends paid to PNX of $71.8 million and the $48.3 million surplus note redemption.
90
Section 1322 of New York Insurance Law requires that New York life insurers report their RBC. RBC is based on a formula calculated by applying factors to various asset, premium and statutory reserve items. The formula takes into account the risk characteristics of the insurer, including asset risk, insurance risk, interest rate risk and business risk. Section 1322 gives the NYDFS explicit regulatory authority to require various actions by, or take various actions against, insurers whose Total Adjusted Capital (capital and surplus plus AVR plus one-half the policyholder dividend liability) does not exceed certain RBC levels. Each of our other life insurance subsidiaries is also subject to these same RBC requirements.
The levels of regulatory action, the trigger point and the corrective actions required are summarized below:
Company Action Level – results when Total Adjusted Capital falls below 100% of Company Action Level at which point the Company must file a comprehensive plan to the state insurance regulators;
Regulatory Action Level – results when Total Adjusted Capital falls below 75% of Company Action Level where in addition to the above, insurance regulators are required to perform an examination or analysis deemed necessary and issue a corrective order specifying corrective actions;
Authorized Control Level –results when Total Adjusted Capital falls below 50% of Company Action Level RBC as defined by the NAIC where in addition to the above, the insurance regulators are permitted but not required to place the Company under regulatory control; and
Mandatory Control Level –results when Total Adjusted Capital falls below 35% of Company Action Level where insurance regulators are required to place the Company under regulatory control.
The RBC of Phoenix Life as of December 31, 2012 was in excess of 250% of the Company Action Level.
See Note 22 to our consolidated financial statements under “Item 8: Financial Statements and Supplementary Data” in this Annual Report on Form 10-K regarding the Life Companies’ statutory financial information and regulatory matters.
Item 7A.
Quantitative and Qualitative Disclosures About Market Risk
For information about our management of market risk, see “Item 7: Management’s Discussion and Analysis of Financial Condition and Results of Operations” in this Annual Report on Form 10-K under the heading “Enterprise Risk Management.”
Item 8.
Financial Statements and Supplementary Data
The Financial Statements and Supplementary Data required by this item are presented beginning on page F-1.
Item 9.
Changes in and Disagreements with Accountants on Accounting and Financial Disclosure
None.
Item 9A.
Controls and Procedures
Evaluation of Disclosure Controls and Procedures
The Company maintains disclosure controls and procedures that are designed to ensure that information required to be disclosed, in the reports the Company files or submits under the Securities Exchange Act of 1934, as amended (the “Exchange Act”), is recorded, processed, summarized and reported within the time periods specified in the SEC’s rules and forms and that such information is accumulated and communicated to the Company's management, including its Chief Executive Officer and Chief Financial Officer, as appropriate, to allow timely decisions regarding required disclosure.
91
In connection with the preparation of this Annual Report on Form 10-K, the Company carried out an evaluation under the supervision of and with the participation of the Company’s management, including the Chief Executive Officer and Chief Financial Officer, as of December 31, 2012, of the effectiveness of the design and operation of the Company’s disclosure controls and procedures, as such term is defined in Rules 13a-15(e) and 15d-15(e) under the Exchange Act. Based upon this evaluation, the Chief Executive Officer and Chief Financial Officer concluded that as of December 31, 2012 the Company’s disclosure controls and procedures were not effective because of the material weaknesses described below under “Management’s Annual Report on Internal Control Over Financial Reporting.”
To address the material weaknesses described below, the Company performed additional analyses and other procedures (as further described below under the subheading “Management’s Remediation Initiatives”) to ensure that the Company’s consolidated financial statements were prepared in accordance with U.S. GAAP. Accordingly, the Company’s management believes that the consolidated financial statements included in this Annual Report on Form 10-K fairly present, in all material respects, the Company’s financial condition, results of operations and cash flows for the periods presented and that this Annual Report on Form 10-K does not contain any untrue statement of a material fact or omit to state a material fact necessary to make the statements made, in light of the circumstances under which such statements were made, not misleading with respect to the periods covered by this report.
Management’s Annual Report on Internal Control Over Financial Reporting
Management is responsible for establishing and maintaining adequate internal control over financial reporting for the Company, as such term is defined in Rules 13a-15(f) and 15d-15(f) under the Exchange Act. The Company’s system of internal control over financial reporting is a process designed to provide reasonable assurance regarding the reliability of financial reporting and the preparation of consolidated financial statements for external reporting purposes in accordance with U.S. GAAP. Internal control over financial reporting includes those policies and procedures that pertain to the maintenance of records that, in reasonable detail, accurately and fairly reflect the transactions and dispositions of the assets of the Company to provide reasonable assurance that transactions are recorded as necessary to permit preparation of financial statements in accordance with U.S. GAAP, and that receipts and expenditures of the Company are being made only in accordance with authorizations of management and directors of the Company, and to provide reasonable assurance regarding prevention or timely detection of unauthorized acquisition, use or disposition of the Company’s assets that could have a material effect on the consolidated financial statements.
Because of its inherent limitations, internal control over financial reporting may not prevent or detect every misstatement. Also, projections of any evaluation of effectiveness to future periods are subject to the risk that controls may become inadequate because of changes in conditions, or that the degree of compliance with the policies or procedures may decrease over time.
Management, including the Chief Executive Officer and Chief Financial Officer, has conducted an assessment, including testing, of the effectiveness of the Company’s internal control over financial reporting as of December 31, 2012, based on the criteria inInternal Control — Integrated Framework (1992 ) issued by the Committee of Sponsoring Organizations of the Treadway Commission (“COSO”).
A material weakness is a deficiency or combination of deficiencies in internal control over financial reporting, such that there is a reasonable possibility that a material misstatement of the annual or interim consolidated financial statements will not be prevented or detected on a timely basis. The material weaknesses described below resulted in adjustments during the preparation of the Company’s 2012 consolidated financial statements and restatement of the Company’s consolidated financial statements as of and for the years ended 2011 and 2010, as outlined in Note 2 to our consolidated financial statements under “Item 8: Financial Statements and Supplementary Data” in this Annual Report on Form 10-K, and, in the aggregate, affected substantially all of the financial statement line items and disclosures. Management has concluded that as of December 31, 2012, the material weaknesses in internal control over financial reporting described below were present.
The material weaknesses included deficiencies in the period-end financial reporting process including the processing of journal entries and the preparation and review of account reconciliations, insufficient complement of personnel with a level of accounting knowledge commensurate with the Company’s financial reporting requirements and ineffective monitoring and review activities.
92
The above material weaknesses also contributed to the following material weaknesses in internal control over financial reporting which have been identified and included in management’s assessment as of December 31, 2012:
1.
Actuarial Finance and Valuation – The Company did not maintain effective controls over the actuarial process. Specifically:
·
The Company did not maintain effective controls to review and approve assumptions and methodologies used in the determination of actuarially derived insurance policy liability estimates.
·
The Company did not maintain effective systems and controls to appropriately measure actuarially derived balances for its fixed indexed annuity products.
·
The Company did not maintain effective controls over key actuarial spreadsheets and certain key reports to ensure the reliability of data, assumptions and valuation calculations.
·
The Company did not maintain effective controls over the application of U.S. GAAP to universal life reserves.
2.
Investments – The Company did not maintain effective controls over certain investment processes. Specifically:
·
The Company did not maintain effective controls over the recognition and measurement of impaired investments.
·
The Company did not maintain effective controls over the recognition and measurement of certain elements of net investment income as well as identifying embedded derivatives related to structured securities.
·
The Company did not maintain effective controls over internally priced securities, including private placement debt and equity securities.
·
The Company did not maintain effective controls over classification in the fair value hierarchy disclosure.
·
The Company did not maintain effective controls to properly recognize and measure counterparty non-performance risk on non-collateralized derivatives.
·
The Company did not maintain effective controls over determining the appropriate accounting method for limited partnerships or for determining the appropriate accounting for investee transactions.
3.
Reinsurance Accounting– The Company did not maintain effective controls for complex reinsurance treaties. Specifically, the Company did not maintain effective controls to analyze, document and review the U.S. GAAP accounting for such transactions at inception.
4.
Pensions– The Company did not maintain effective controls over the valuation of pension assets and liabilities. Specifically, the Company did not maintain effective controls over the management and oversight of third party vendors and maintain effective controls to ensure complete and accurate census data.
5.
Limited Partnerships and Other Investments Taxable Income Reporting – The Company did not maintain effective controls over the completeness and accuracy of taxable income reporting for limited partnership and other investments. Specifically, the Company did not maintain effective controls to ensure complete and accurate taxable information was utilized in the Company’s measurement of income taxes related to limited partnerships and other investments.
6.
Cash flows and changes in classifications– The Company did not maintain effective controls over the presentation of cash and cash flows. Specifically, the Company did not maintain effective controls over the preparation and review of appropriate detail to support the classification of activity in the consolidated statements of cash flows. In addition, there were not effective controls for assessing the classification of cash and related balances for presentation in the consolidated balance sheets.
7.
Access to applications and data – The Company did not maintain effective information technology general controls related to restricted access. Specifically, the Company did not maintain effective controls for granting, removing and reviewing access to ensure appropriate segregation of duties and restricted access to programs and data.
Each of these control deficiencies contributed to misstatements of the previously mentioned financial statements. Additionally, these control deficiencies could result in a material misstatement to the annual or interim consolidated financial statements that would not be prevented or detected. Accordingly, management has concluded that these control deficiencies constitute material weaknesses.
93
As a result of the material weaknesses in internal control over financial reporting described above, management has concluded that, as of December 31, 2012, the Company’s internal control over financial reporting was not effective based on the criteria established inInternal Control — Integrated Framework (1992) issued by COSO.
The effectiveness of Phoenix’s internal control over financial reporting as of December 31, 2012 has been audited by PricewaterhouseCoopers LLP (“PwC”), an independent registered public accounting firm, as stated in their report, which appears herein.
Management Changes
The Company has made a number of management changes in the finance organization with a focus on increasing U.S. GAAP knowledge and improving financial reporting processes in the organization. These changes include the appointment of a Chief Financial Officer, Chief Accounting Officer and head of actuarial finance. The Company has also hired additional certified public accountants and actuaries with U.S. GAAP expertise to supplement the staff charged with compiling and filing its U.S. GAAP results.
Management’s Remediation Initiatives
Management plans to strengthen its finance skills, capabilities and control environment, by enhancing the Company’s financial control governance structure, aligning and enhancing the Company’s skills and financial roles and responsibilities for each functional group within the organization as well as implementing additional policies and procedures to improve the overall system of internal control over financial reporting. To remediate the material weaknesses described in “Management's Annual Report on Internal Control Over Financial Reporting” above, the Company has implemented or plans to implement the measures described below and will continue to evaluate the remediation and may in the future implement additional measures.
1.
Actuarial Finance and Valuation –Upon identification of the material weakness, management performed the following procedures to gain assurance related to the accuracy of the Company’s financial reporting process:
·
Performed additional procedures on the affected actuarial balances to ensure the reasonableness of the amounts being reported. The Company:
–
Performed a detailed attribution analysis for host contract reserve changes for fixed indexed annuities
–
Performed a detailed analysis at the cohort level for variable annuity deferred policy acquisition cost and unearned revenue reserve calculations
–
Validated premium deficiency reserves for the term insurance block
–
Validated effects of excess reinsurance on variable universal life and universal life estimated gross profits
–
Reconciled actual gross profit to the general ledger for all product lines
·
Engaged an external actuarial advisor to provide staff augmentation and assist with the following activities:
–
Review and enhancement of current U.S. GAAP valuation analytics
–
Review actuarial related out of period adjustments
–
Identification and correction of actuarial related errors
–
Review updates to the methods, process and assumptions associated with the U.S. GAAP unlocking process
–
Review and document U.S. GAAP valuation methods and assumptions
–
Project management of work streams
–
Create an interim fixed indexed annuity reserve model
94
The Company’s implemented and planned remediation measures are intended to address material weaknesses related to Actuarial Finance. The Company’s remediation measures include the following:
Implemented
·
Hired a new head of actuarial finance with U.S. GAAP actuarial experience
·
Aligned and added actuarial resources to ensure the number and level of financial actuarial experts was appropriate
·
Held third party workshops and training resulting in the development of an enhanced analytics process
Planned
·
Design and implement detailed actuarial remediation plan including the following activities:
o
People and Skills
–
Align staff responsibilities by product
–
Assign dedicated staff to new business initiatives
–
Upgrade staff including hiring experienced U.S. GAAP actuaries
o
Control and Governance
–
Enhance the process of assumption setting by establishing an assumption governance committee
–
Formalize documentation standards to address inconsistent documentation of assumptions and methods across product lines
–
Establish a formal peer review process
–
Partner with pricing actuaries to improve the process and testing for new product models and assumptions
o
Technology
–
Consolidate life valuation systems and enhance fixed indexed annuity valuation system
o
Process
–
Simplify and streamline manual processes and the close process
2.
Investments – Upon identification of the material weakness, management performed the following procedures to gain assurance related to the accuracy of the Company’s financial reporting process:
·
Performed the following additional procedures on the affected investment balances to ensure the reasonableness of the amounts being reported:
Impaired investments process
–
All impairments identified during the restatement have been reviewed and approved by the Chief Investment Officer and Chief Accounting Officer
Amortization and accretion for structured securities
–
Reevaluated its accounting models and amortization methods and assumptions for its structured securities portfolio
–
Assessed a sample of the structured securities portfolio using the appropriate accounting models to access the accuracy of third party service provider calculations
Investment related reconciliations
–
Implemented an enhanced reconciliation process and re-performed key investment accounting reconciliations
95
Private placement debt and equity securities
–
Validated each bond’s cash flows and all other critical inputs to run new and revised valuation models
–
Engaged an external advisor to provide assistance in reevaluating investment and fair value disclosures as well as significant accounting policy disclosures for compliance with U.S. GAAP
–
Replaced the existing valuation model for sinking fund bonds with a new interim discounted cash flow model that was developed and validated by an external advisor
–
Performed validation of all debt and equity securities valued based on external third-party information
Derivative valuation
–
Designed a new process and controls for measuring the non-performance risk related to non-collateralized derivative assets
Other invested assets
–
Engaged an external advisor to perform a review of all significant accounting and valuation policies to ensure proper application of U.S. GAAP including the implementation of ASC 810
–
Performed a review of all partnership and limited liability company investments to ensure that they were properly classified and accounted for in accordance with U.S. GAAP
The Company’s implemented and planned remediation measures are intended to address material weaknesses related to Investments. The Company’s remediation measures include the following:
Implemented
·
Hired a new head of Investment Accounting with U.S. GAAP investment experience
·
Aligned and added investment accounting resources to ensure the number and level of qualified accountants was appropriate
Planned
·
Design and implement a detailed investment remediation plan including the following activities:
o
People and Skills
–
Evaluate the current staffing model for Investment Accounting and Corporate Portfolio Management to ensure sufficient personnel with knowledge, experience and training
o
Controls and Governance
–
Conduct a detailed assessment of internal controls and related supporting documentation for controls and processes related to Investment Accounting and Corporate Portfolio Management and disclosure policy in an effort to enhance controls across these areas
o
Technology
–
Develop a plan to replace the interim accounting systems and valuation models with a more robust, sustainable and controlled accounting and valuation system
o
Process
–
Simplify and streamline manual processes and the close process
–
Evaluate current organizational structure of Investment Accounting and Corporate Portfolio Management to ensure appropriate support and oversight of investment accounting and valuation activities.
–
Design new processes and controls for Investment Accounting and Corporate Portfolio Management, specifically the assessment of impaired investments, amortization and accretion processes, investment related reconciliations, valuation and leveling of private placement debt, valuation of certain derivative instruments and accounting for Other Invested Assets.
96
3.
Reinsurance Accounting –Upon identification of the material weakness, management performed the following procedures to gain assurance related to the accuracy of the Company’s financial reporting process:
·
Reviewed all complex reinsurance contracts to ensure appropriate accounting in accordance with U.S. GAAP
·
Engaged an external advisor to assist with technical research relating to U.S. GAAP reinsurance accounting
The Company’s implemented and planned remediation measures are intended to address material weaknesses related to Reinsurance Accounting. The Company’s remediation measures include the following:
Implemented
·
Strengthened the accounting policy documentation standards for certain transactions, including complex reinsurance treaties and the implementation of new U.S. GAAP standards
Planned
·
Review and enhance all processes and controls and related documentation for reinsurance accounting
·
Evaluate the current governance and staffing model for reinsurance accounting
4.
Pensions– Upon identification of the material weakness, management performed the following procedures to gain assurance related to the accuracy of the Company’s financial reporting process:
·
Re-evaluated the Company’s pension related processes, methods and assumptions
·
Performed an analysis of the third party vendor information and data related to pensions and postretirement benefit services
·
Revalued pension and other benefit liabilities for all restatement periods
·
Re-evaluated and changed third-party vendor relationship for pension and postretirement benefit services
The Company’s planned remediation measures are intended to address material weaknesses related to the valuation of pension benefit plans. The Company’s remediation measures include the following:
Planned
·
Conduct a detailed assessment of internal controls and related supporting documentation for processes related to pensions and post-retirement benefit services in an effort to implement new and/or enhance existing controls
5.
Limited Partnerships and Other Investments Taxable Income Reporting – Upon identification of the material weakness, management performed the following procedures to gain assurance related to the accuracy of the Company’s financial reporting process:
·
Engaged a tax advisor to provide assistance in evaluating its process for aggregating reportable taxable income from investments in limited liability companies and limited partnerships
·
Performed a review of all domestic limited liability company and limited partnership investments that reported taxable income on Form K-1 to ensure that the income was properly aggregated and reported in tax returns and provisions
·
Evaluated all limited partnerships and other investments held that do not report taxable income on Form K-1 to ensure taxable income is properly accrued for inclusion in tax returns and provisions. Additionally, each foreign investment was reviewed for proper tax designation as a passive foreign investment company
·
Prepared a reconciliation of the entire population of limited partnerships and other investments positions to the inventory of Form K-1’s received for the periods from 2008 through 2012
97
The Company’s planned remediation measures are intended to address material weaknesses related to limited partnerships and other investments taxable income reporting. The Company’s remediation measures include the following:
Planned
·
Conduct a detailed assessment of internal controls and related supporting documentation for processes related to partnership, limited liability company and other limited partnerships and other investments transaction accounting in an effort to implement new and/or enhance existing controls across all such areas, including tax reporting
·
Evaluate the current operating and staffing model for the Tax Department as well as responsibilities in Investment Accounting and Corporate Portfolio Management to ensure that the Company will have sufficient personnel with knowledge, experience and training
·
Evaluate technology solutions and services that will aid in the tracking, aggregation and warehousing of investment tax reporting data
6.
Cash flows and changes in classifications – Upon identification of the material weakness, management performed the following procedures to gain assurance related to the accuracy of the Company’s financial reporting process:
·
Evaluated U.S. GAAP guidance for certain cash flow reporting disclosures
·
Evaluated reclassification of control disbursement balances to ensure appropriate netting and reclassifications were performed
·
Reviewed all cash accounts to ensure cash collateral accounts were reclassified and reported as restricted cash within the balance sheet
·
Performed additional procedures on the statement of cash flows to ensure the reasonableness of the amounts being reported. The Company:
–
Reevaluated the processes and data files supporting deposit and withdrawal activities for certain life products
–
Performed a detailed analysis of interest credited for all products including the interest for all policy loans
–
Performed a detail analysis of all investing activities; and
–
Documented interim processes and data sources for assembling cash flow data for all transaction types
The Company’s planned remediation measures are intended to address material weaknesses related to cash flow and cash balance reporting. The Company’s remediation measures include the following:
Planned
·
Review, enhance and document accounting policies and procedures regarding the preparation of the consolidated statements of cash flows, cash balance reporting and related disclosures
·
Provide all members of Corporate Finance, and those providing data into the cash flow and cash balance reporting process, training on the enhanced process and controls
·
Enhance cash flow reporting and disclosure package by reviewing all source materials used in the preparation of the cash flow statement and assembling a prototype reporting package that includes policy matters as well as a detailed reconciliation of cash flows by type and classification
7.
Access to Applications and Data –Upon identification of the material weakness, management performed the following procedures to gain assurance related to the accuracy of the Company’s financial reporting process:
·
Performed an assessment of segregation of duties; management identified relevant business risks related to all key financial and administrative applications, including all business risks arising from excessive user access. Management identified the relevant mitigating controls which were determined to be effective.
·
Evaluated the results of the testing performed around the Company’s change management procedures.
·
Performed a review of the Company’s entity level controls related to fraud monitoring and confirmed that these functions were found to be effective.
The Company’s implemented and planned remediation measures are intended to address the material weakness related to Access to Applications and Data. The Company’s remediation measures include the following:
98
Implemented
·
Redesigned the user access entitlement process to include the following procedures:
o
Enhanced user access request and approval process by requiring more detailed role- based provisioning requests
o
Implemented a quality control review following the provisioning of access rights for all new hires.
Planned
·
Design and implement detailed user access review remediation plan
Control deficiencies not constituting material weaknesses
In addition to the material weaknesses described in “Management's Report on Internal Control Over Financial Reporting,” management has identified other deficiencies in internal control over financial reporting that did not constitute material weaknesses as of December 31, 2012. The Company has implemented and/or plans to substantially implement during 2014 various measures to remediate these control deficiencies and has undertaken other interim measures to address these control deficiencies.
Management's Conclusions
Management has developed a plan for the implementation of the foregoing remediation efforts and will monitor the implementation. In addition, under the direction of the Audit and Finance Committee of the Board, management will continue to review and make necessary changes to the overall design of the Company’s internal control environment, as well as to policies and procedures to improve the overall effectiveness of internal control over financial reporting. Management believes the efforts discussed above will remediate the material weaknesses. As the Company continues to evaluate and work to improve its internal control over financial reporting, management may determine to take additional measures to address control deficiencies or determine to modify the remediation plan described above.
Further, no system of controls, no matter how well designed and operated, can provide absolute assurance that the objectives of the system of controls will be met, and no evaluation of controls can provide absolute assurance that all control deficiencies or material weaknesses have been or will be detected. Given the breadth of the control deficiencies and material weaknesses described above, there is no assurance that the company’s remediation efforts have been or will be fully effective. As described in Item 1A (Risk Factors) above, these material weaknesses have not been fully remediated as of the filing date of this 2012 Form 10-K and if the company’s remediation efforts do not prove effective and control deficiencies and material weaknesses persist or occur in the future, the accuracy and timing of our financial reporting may be adversely affected.
Changes in Internal Control Over Financial Reporting
There were no changes to the Company’s internal control over financial reporting during the fourth quarter of 2012 that materially affected, or are reasonably likely to materially affect, the Company’s internal control over financial reporting.
Item 9B.
Other Information
None.
99
PART III
Item 10.
Directors, Executive Officers and Corporate Governance
Board of Directors of the Registrant
The following individuals serve as the current directors of the Company. All ages are as of January 3, 2014.
MARTIN N. BAILY
Age: 68
Director since: 2005
Committees: Finance Committee; Governance Committee
Experience: Mr. Baily has been a Senior Fellow at The Brookings Institution since 2007. He also has been a Senior Advisor to McKinsey & Company since 2002. He was a Senior Fellow at the Peterson Institute for International Economics from 2001 to 2007, Chairman and a Cabinet Member of the President’s Council of Economic Advisors from 1999 to 2001, and a Principal of McKinsey & Company from 1996 to 1999.
Qualifications: Mr. Baily holds a Ph.D. in economics from Massachusetts Institute of Technology and has expertise in the field of finance through work in the private sector and government.
ARTHUR P. BYRNE
Age: 68
Director since: 2000 (for Phoenix Life since 1997)
Committees: Audit Committee; Compensation Committee
Experience: Mr. Byrne has been an operating partner of J.W. Childs Associates, L.P., a private equity fund based in Boston, Massachusetts, since 2002. He also has served as Chairman of The Esselte Corporation since 2002 and Chairman of W/S Packaging Inc. since 2006. He was President, Chief Executive Officer and Chairman of The Wiremold Company from 1991 to 2002.
Qualifications: Mr. Byrne has many years of prior experience as a chief executive officer and significant experience in the areas of finance, acquisitions and strategic planning.
SANFORD CLOUD, JR., ESQ.
Age: 69
Director since: 2001
Committees: Compensation Committee (Chair); Executive Committee; Governance Committee
Experience: Mr. Cloud has been Chairman of the Board of Directors of the UConn Health Center since 2011 and a member of the Board of Trustees of the University of Connecticut also since 2011. He also has served as Chairman and Chief Executive Officer of The Cloud Company, LLC since 2005, Chairman of The Connecticut Health Foundation since 2010, a Trustee of Northeast Utilities since 2000, and as non-executive Chairman of Ironwood Mezzanine Fund L.P. Previously, Mr. Cloud served as President and Chief Executive Officer of The National Conference for Community and Justice from 1994 through 2004, a partner at the law firm of Robinson & Cole LLP from 1993 to 1994, a Vice President at Aetna, Inc. from 1986 to 1992, and a Connecticut State Senator from 1977 to 1980.
Qualifications: Mr. Cloud is an attorney who has worked in private practice, as in-house counsel, served in the state legislature, and served as a senior officer of a major insurance company and as a chief executive officer of a large not-for-profit organization.
GORDON J. DAVIS, ESQ.
Age: 72
Director since: 2000 (for Phoenix Life since 1986)
Committees: Finance Committee; Governance Committee
Experience: Mr. Davis has been a partner at the law firm of Venable LLP since May 2012. Previously, he was a partner at the law firm of Dewey & LeBoeuf LLP (formerly LeBoeuf, Lamb, Greene & MacRae LLP) from 1994 to 2012, except during much of 2001, when he served as President of Lincoln Center for the Performing Arts. Mr. Davis has served as a director of Consolidated Edison, Inc. since 1997 and Consolidated Edison Company of New York, Inc. since 1989. He also serves as a director of approximately 35 registered investment companies within the Dreyfus family of funds.
Qualifications: Mr. Davis is an attorney who currently serves as a director of a number of funds, has served as chief executive officer of a large not-for-profit organization. Over the course of his career, he has worked in and with city and state government.
100
JOHN H. FORSGREN
Age: 67
Director since: 2005
Committees: Audit Committee; Executive Committee (Chair); Finance Committee (Chair)
Experience: Mr. Forsgren has served as Chairman of the Board of the Company since July 2013; a director of Trident Resources Corp. since 2007, Port Townsend Paper Co. since 2008, and Duke Energy Corporation since August 2009. Mr. Forsgren also serves on the board of several privately held companies. Previously, he served as a director of NEON Communications Group, Inc. from 1998 to 2007 and CuraGen Corporation from 2002 to 2009, serving as Executive Chairman during 2009. Mr. Forsgren held the positions of Vice Chairman, Executive Vice President and Chief Financial Officer of Northeast Utilities from 2001 through 2004, and Executive Vice President and Chief Financial Officer from 1996 to 2001. He was Managing Director of Chase Manhattan Bank from 1995 to 1996, Executive Vice President of Sun International Investments, Ltd. from 1994 to 1995, Senior Vice President and Chief Financial Officer of Euro Disney (a subsidiary of The Walt Disney Company) from 1990 to 1994, and Vice President and Treasurer of The Walt Disney Company from 1986 to 1990.
Qualifications: Mr. Forsgren served as chief financial officer of a public company, served in financial functions in a variety of different businesses and has experience in accounting, finance and investments.
ANN MAYNARD GRAY
Age: 68
Director since: 2002
Committees: Compensation Committee; Executive Committee; Governance Committee (Chair)
Experience: Ms. Gray has served as a director of Duke Energy Corporation since 1994 and as Chairman since 2014. She was President of the Diversified Publishing Group of Capital Cities/ABC, Inc. from 1991 to 1998.
Qualifications: Ms. Gray has many years of experience in finance and marketing functions, as well as the experience of having presided over a major division of a public company.
AUGUSTUS K. OLIVER, II
Age: 64
Director since: 2008
Committees: Audit Committee; Finance Committee
Experience: Mr. Oliver has served as a Managing Member of Oliver Press Partners, LLC since 2005 and Managing Member of Oliver Press Investors, LLC since 2005. He has served as a director of Scholastic Corporation since 1995, and served as a director of Verint, Inc. from 2012 to 2013 and Comverse Technology, Inc. from 2007 to 2012. Mr. Oliver also served as a Managing Member of WaterView Advisors, LLC from 1999 to 2005.
Qualifications: Mr. Oliver has experience in investment matters.
JAMES D. WEHR
Age: 56
Director since: 2009
Committees: Executive Committee
Experience: Mr. Wehr has served as President and Chief Executive Officer of The Phoenix Companies, Inc. since 2009. He was Senior Executive Vice President and Chief Investment Officer from 2007 to 2009, Executive Vice President and Chief Investment Officer from 2005 to 2007, Senior Vice President and Chief Investment Officer of the Company and Phoenix Life from 2004 to 2005, and Senior Managing Director and Portfolio Manager at Phoenix Investment Partners (now Virtus Investment Partners, Inc.) from 1995 through 2003. Mr. Wehr joined Phoenix in 1981 and held a series of increasingly senior investment positions, including credit research, trading and portfolio management prior to 1995. Mr. Wehr has served as a Director of the Back9Network since 2011.
Qualifications: Mr. Wehr has investment management expertise and served in several executive roles prior to becoming CEO.
101
ARTHUR F. WEINBACH
Age: 70
Director since: 2008
Committees: Audit Committee (Chair); Compensation Committee; Executive Committee
Experience: Mr. Weinbach has served as a Director of CA Technologies since 2008 and as Chairman since 2010. He was Chairman of Broadridge Financial Solutions, Inc. from 2010 until he retired in 2011 and was executive Chairman from 2007 to 2010. He also was associated with Automatic Data Processing, Inc. (ADP) from 1980-2007, serving as Chairman and Chief Executive Officer, retiring as Chief Executive Officer in 2006 and retiring as Chairman in 2007.
Qualifications: Mr. Weinbach has a long career as a certified public accountant and experience in many executive roles, including chief executive officer.
Executive Officers of the Registrant
Set forth below is a description of the business positions held during at least the past five years by the current executive officers of Phoenix. All ages are as of January 3, 2014.
JAMES D. WEHR, age 56, has been President and Chief Executive Officer since April 2009. Previously, Mr. Wehr served as Senior Executive Vice President and Chief Investment Officer of the Company since February 2007, Executive Vice President and Chief Investment Officer of the Company since February 2005 and as Senior Vice President and Chief Investment Officer of the Company and Phoenix Life since January 1, 2004. Prior to that, Mr. Wehr was Senior Managing Director and Portfolio Manager of Virtus from 1995 through 2003. Mr. Wehr joined the Company in 1981 and held a series of increasingly senior investment positions prior to 1995.
THOMAS M. BUCKINGHAM, age 36, has served as Executive Vice President since November 2012. Mr. Buckingham is responsible for all product- and service-related functions including product development, product implementation and operations. Mr. Buckingham joined Phoenix as an actuarial assistant in 1999 and served in increasingly senior corporate, product development and operational positions. He also has worked in Strategic Development and as Chief of Staff to the CEO. He served as Senior Vice President, Product Implementation and Operations, prior to being promoted to his current role.
EDWARD W. CASSIDY, age 53, has been Executive Vice President, Distribution since May 2007, and the Managing Principal of Saybrus Partners, Inc., a Phoenix subsidiary since 2009. Prior to joining the Company in 2006, Mr. Cassidy had been Senior Vice President of Principal Financial Group with responsibility for the oversight of the individual life insurance business, including product development, marketing, underwriting and risk management. Prior to that, Mr. Cassidy spent 15 years at Travelers Life and Annuity Company, where he held a variety of senior distribution positions and, ultimately, as president of Travelers Life Division.
PETER A. HOFMANN, age 55, has been Executive Vice President, Strategy and Business Development since November 2012. Previously, Mr. Hofmann served as Senior Executive Vice President and Chief Financial Officer of the Company since November 2007. Prior to that, Mr. Hofmann served as Executive Vice President, head of the Office of the Chairman and Strategic Relations and Chief Strategic Officer of the Company since February 2007, and as Senior Vice President and Chief Strategic Officer of the Company since January 2004. Mr. Hofmann joined the Company in 2001 to establish the investor relations function and to prepare the Company for its demutualization and initial public offering. Prior to joining the Company, Mr. Hofmann was Vice President, Investor Relations, at JP Morgan Chase & Co., Inc.
BONNIE J. MALLEY, age 52, has been Executive Vice President and Chief Financial Officer since November 2012. Previously, Ms. Malley served as Executive Vice President and Chief Administrative Officer of the Company since 2008. Prior to that, Ms. Malley served as the head of Human Resources since August 2002 and, in the ensuing years, added other administrative functions. Ms. Malley served as Senior Vice President and Chief Accounting Officer in 2001 and Vice President, Corporate Finance in 1998. Ms. Malley joined the Company in 1985 as a staff auditor within the securities accounting and investment accounting functions.
JOHN T. MULRAIN, age 64, has been Executive Vice President, General Counsel and Secretary since February 2011. Previously, Mr. Mulrain served as Senior Vice President, General Counsel and Secretary of the Company since July 2009 with responsibility for all legal functions, including corporate compliance, and corporate secretary duties. Prior to that Mr. Mulrain served as Vice President and Counsel, focusing primarily on legal issues relating to investments and portfolio management.
102
CHRISTOPHER M. WILKOS, age 55, has been Executive Vice President and Chief Investment Officer since April 2009. Previously, Mr. Wilkos served as Senior Vice President of Corporate Portfolio Management since March 2001 and Vice President of Corporate Portfolio Management since January 1998. Prior to that, he was Director of Corporate Portfolio Management since March 1997. Prior to joining the Company, Mr. Wilkos was Vice President, Portfolio Strategy, at Connecticut Mutual Life.
DOUGLAS C. MILLER, age 48, has served as Senior Vice President and Chief Accounting Officer since June 2012. Mr. Miller is responsible for a number of functions within the Company’s Corporate Finance area including Accounting Operations, GAAP Accounting and Expense Management, Statutory Accounting, Investment and Reinsurance Accounting, and Corporate Tax. Prior to joining Phoenix, he served as Vice President and Controller for Sun Life Financial (U.S.) and as an audit partner for Deloitte & Touche LLP.
Section 16(A) Beneficial Ownership Reporting Compliance
Section 16(a) of the Securities Exchange Act of 1934 requires our directors and executive officers, and persons who own more than 10 percent of a registered class of our equity securities, to file with the SEC reports of ownership and changes in ownership of our Common Stock. Based on our records and on information provided by our directors and our executive officers, we believe that during the fiscal year ending December 31, 2012, all of our directors and executive officers timely met such filing requirement, except for the following Form 3 filing, which has been filed with the SEC:
| | | | | | | | |
Executive Officer | | Number of Late Reports | | Number of Transactions Not Reported on a Timely Basis | | Failure to File Required Form | | Date of Filing |
Thomas M. Buckingham | | 1 | | 1 (inadvertent omission of a transaction) | | N/A | | November 5, 2012 |
Code of Ethics
We have a code of ethics (the “Code of Conduct”) that is applicable to all of our Company directors and employees, including our principal executive officer, principal financial officer and principal accounting officer. A copy of the Code of Conduct may be reviewed on our web site at www.phoenixwm.com, in the Investor Relations section. The latest amendments to the Code of Conduct will be reflected, together with a description of the nature of any amendments, other than ones that are technical, administrative or non-substantive, on the above web site. In the event we ever waive compliance with the Code of Conduct by our principal executive officer, our principal financial officer, or our principal accounting officer, we will disclose the waiver on that web site. Copies of our Code of Conduct may also be obtained without charge by sending a request either by mail to: Corporate Secretary, The Phoenix Companies, Inc., One American Row, P.O. Box 5056, Hartford, Connecticut 06102-5056, or by e-mail to:corporate.secretary@phoenixwm.com.
Corporate Governance – Audit Committee
The Company has a separately designated Audit Committee established in accordance with the Exchange Act. The Audit Committee is comprised of Arthur F. Weinbach (Chair), Arthur P. Byrne, John H. Forsgren and Augustus K. Oliver, II.
The Board has determined that Mr. Arthur P. Byrne has qualified as an “audit committee financial expert” within the meaning of the SEC’s regulations.
103
Item 11.
Executive Compensation
COMPENSATION DISCUSSION AND ANALYSIS
This Compensation Discussion & Analysis (“CD&A”) provides an overview of our executive compensation programs, describes the material factors underlying our 2012 compensation provided to our named executive officers (“NEOs”), and explains the information presented in the tables that follow this CD&A.
This CD&A is incorporated into this Annual Report on Form 10-K because the Company was unable to file a Proxy Statement in 2013 due to the Restatement. SeeExplanatory Note.
Business and Organizational Background
When Mr. Wehr became Chief Executive Officer (“CEO”) in April 2009, Phoenix embarked on a turnaround strategy based on four strategic pillars:
·
Balance sheet strength;
·
Policyholder service;
·
Operational efficiency; and
·
Profitable growth.
Each is an essential part of building and maintaining financial strength and flexibility and, ultimately, growing profitably. We view these pillars as the foundation for the success of our business and delivery of long-term value creation for our shareholders.
Leadership Change
In 2012, Mr. Wehr made organizational changes to sharpen the focus on strategic business development, better support core priorities and improve our ability to execute. As a consequence, several NEOs have transitioned to new positions or broadened their responsibilities. These include: Mr. Hofmann, formerly Chief Financial Officer (“CFO”), who is now responsible for strategic planning, business development and capital management in a newly created role of Executive Vice President, Strategy & Business Development; Ms. Malley, formerly Chief Administrative Officer, who was promoted to Executive Vice President and CFO; and Mr. Cassidy, Executive Vice President, Distribution and Managing Principal at Saybrus Partners, Inc., who is now responsible for developing and executing all of Phoenix’s distribution strategy.
Executive Summary of Compensation Programs
Historical Compensation Decisions (2009-2011)
As the strategic direction and business model for the Company have evolved, the Company has adjusted compensation practices to reflect the revised strategy, business model and smaller company size. We have summarized a number of key changes to our compensation practices, which we believe provide important context and background for understanding our 2012 compensation programs and decisions:
·
Lowered compensation levels for new incumbents in senior roles:When changes in leadership have occurred, the Company has established a practice of setting target compensation levels for new incumbents, including the CEO, lower than that of their predecessors. For example, Mr. Wehr’s target compensation upon his promotion to CEO in 2009 was set at a level approximately 50% lower than that of his predecessor, and Ms. Malley’s target compensation upon her promotion to CFO in 2012 was set approximately 12% lower than that of her predecessor. NEO compensation levels will change over time based on the Company’s annual review of executive compensation, which considers such factors as performance, market comparisons and current compensation relative to internal peers.
·
Established new market peers: Market references used in assessing pay levels were moved downward to reflect our smaller size.
·
Reduced long-term incentive (“LTI”) targets in recognition of share constraints and company size: In 2010, LTI award targets were programmatically reduced between 30% and 51% from 2009 levels and have not been increased since such time, except in the case of Ms. Malley when she was promoted to the position of CFO in 2012.
104
·
Froze retirement benefits: Benefit accruals in our broad-based pension plan and supplemental executive retirement plans (“SERPs”) were frozen in 2010.
·
Removed tax gross-ups and limited perquisites: We limited our perquisites and eliminated excise tax and other gross-ups in both our Change-in-Control agreements and most perquisites.
2012 Say On Pay Results and Response
At our 2012 Annual Meeting, approximately 54% of the votes cast were against our advisory vote on executive officer compensation, commonly referred to as “Say on Pay.”
In response to this, the Compensation Committee embarked on the following two-pronged process:
| | |
External Conversations with Stakeholders | 
| Comprehensive Review of Executive Compensation Practices |
The Compensation Committee and management engaged in a multi-faceted effort to gather feedback from key external stakeholders regarding our executive compensation program. This included in-person and telephonic discussions with our largest shareholders, as well as with proxy advisory services and corporate governance research firms. | |
The Compensation Committee also directed its compensation consultant to conduct extensive analyses of the Company’s programs and market practices.
|
As a result of the Company’s ongoing discussions with shareholders and this outreach and analysis, the Compensation Committee adopted several changes in compensation practices for our NEOs. While no problematic pay practices were identified, the Compensation Committee and the Board of Directors are committed to continuing to refine compensation programs to be as responsive to shareholders and market demands as possible.
| | |
Shareholder Feedback | 
| Changes to Executive Compensation Practices |
Select a more appropriate peer group and provide more detailed explanation of peer group selection and assessment methodology.
|
Adopted a new approach to compensation market assessments and providing a more detailed explanation of assessment process in CD&A. Beginning in 2012, market assessments primarily referenced compensation data from a 14-company peer group comprised of similarly sized public life insurance and financial services companies that compete with us for business and executive talent. We continue to use survey data as a supplemental reference point. SeeChange for 2012-2013. |
105
| | |
Shareholder Feedback | 
| Changes to Executive Compensation Practices |
Increase weight of incentive metrics that drive profitable growth
| Increased emphasis on profitability measures in the Phoenix Performance Incentive Plan (“PIP”).The weights assigned to profitability measures were increased from 50% to 80% beginning in 2013 to reflect an intensified focus on delivering profitable growth. |
Differentiate incentive metrics between the annual incentive plan and long-term incentive plan (“LTIP”)
|
| Added new profitability measures to the PIP. We included two new measures related to new business profitability to our 2012 PIP: contribution dollars from current year annuity business and Saybrus EBITDA. |
Increase performance period in LTIP
| |
Extended the performance period of the LTIP to two years. The 2012-2014 LTIP performance cycle design increased the performance measurement period from one year to two years, coupled with a three-year stock price modifier component. We had planned to incorporate a three-year performance measurement period into the 2013-2015 LTIP cycle. However, we did not implement this LTIP cycle because of the Restatement. We will reevaluate the appropriate performance measurement period for the LTIP after all Restatement-related activities are complete. |
Consider including relative return measures in LTIP
| |
Assessing relative Total Shareholder Return (“TSR”) component for the LTIP. In addition to measuring performance on financial and operating measures and absolute stock price performance, for future plans, we will assess the use of a component that would measure stock price performance relative to an appropriate index. |
Additional Compensation Practice Change
The Company adopted a broader clawback policy to become effective in 2013. The new policy extends beyond the CEO and CFO to include the entire executive team, individuals who provide certifications to the CEO and CFO for regulatory filings, LTIP participants and individuals in other key roles as determined by the Board of Directors. Additionally, the policy provides the Compensation Committee with the ability to claw back compensation under a wide range of circumstances, including fraud, misconduct, financial restatements and the restatement of performance results.
106
Actions that Affected 2012 Compensation
The Compensation Committee (and in the case of the CEO, the full Board) made the following key decisions that affected 2012 compensation. As a result of these actions, average actual total direct compensation (base salary, annual incentive and long term incentive) for NEOs was 33% lower in 2012 than in 2011 for the four individuals who were active NEOs at the end of each year.
·
No increases to NEO 2012 target compensation levels, other than for Ms. Malley, who was promoted to the position of CFO, and no special awards were granted to any of the NEOs in 2012.
| | |
Name | Changes | Rationale |
Bonnie J. Malley | Salary increased from $360,000 to $385,000 Annual incentive target increased from $306,000 to $335,000 LTI target increased from $250,000 to $330,000 | In recognition of her promotion to CFO, salary change effective November 2012 and incentive target changes effective 2013 |
·
The result of the PIP for NEOs was 63% of target in 2012, compared to 143% in 2011.This outcome was based on formulaic results adjusted following a comprehensive review of the nature and impact of the different Restatement elements on the Company’s open incentive plans conducted in 2014. See theElements of Compensation – Project to Assess the Treatment of Open Incentive Plans Given the Restatement section.
-
The annual incentive payments for Mr. Wehr and Mr. Hofmann differed from this percentage due to the Board and Compensation Committee exercising discretion in reducing their awards. See theImpact on 2012 Corporate Annual Incentive Plan and the Exercise of Discretion section.
-
The annual incentive payments for Mr. Cassidy and Mr. Wilkos differed from this percentage due to their participation in other incentive plans, as disclosed in theElements of Compensation – Annual Incentives section.
2013 Compensation Adjustments
As a result of management changes made in 2012, the Compensation Committee approved changes to NEO compensation, effective in 2013, as follows:
| | |
Name | Changes | Rationale |
James D. Wehr | No change | N/A |
Bonnie J. Malley | No change | N/A |
Peter A. Hofmann | Annual incentive target reduced from $425,000 to $350,000 LTI target reduced from $340,000 to $275,000 | In conjunction with his new role as Executive Vice President, Strategy and Business Development, and to better align his compensation with other NEOs |
Edward W. Cassidy | Annual incentive target increased from $631,330 to $704,845 | In conjunction with his assumption of additional responsibilities and Saybrus business growth |
Christopher M. Wilkos | Salary increased from $370,000 to $385,000 Annual incentive target increased from $333,000 to $335,000 | In recognition of his sustained strong performance as Chief Investment Officer |
John T. Mulrain | No change | N/A |
Other Compensation Practices
In addition to the actions and practices discussed above, the other elements of the Company’s programs continue to reflect responsible practices, including:
·
Perquisites and other personal benefits are de minimis.
·
Stock ownership guidelines are in place specifying ownership and retention levels for NEOs and directors, and the guidelines for directors were enhanced in 2012 from 5,000 shares to three times their annual retainer. The share level reflects the 1-for-20 reverse stock split, which was effective August 10, 2012.
·
An anti-hedging policy is in place for all directors and employees.
·
Annual risk assessments are conducted for all compensation programs.
·
None of the NEOs has an employment agreement.
107
Objectives of Executive Compensation Program
The design and objectives of our executive compensation program are based on a pay for performance philosophy in which variable, performance-based incentives directly aligned with our strategic goals represent a significant component of an executive’s compensation opportunity.
·
Link compensation to performance results. The program is weighted in favor of incentive pay, in the form of annual and long-term performance incentives, to motivate and reward the creation of shareholder value.
·
Attract, motivate, and retain high caliber leadership by providing competitive compensation opportunities. The program assesses total compensation opportunities against peer companies to attract and retain executives with the experience and talent required to achieve our strategic objectives.
·
Align the interests of our NEOs and shareholders. The program rewards our NEOs when their performance produces profitable growth and improved returns. The business goals used for determining annual and long-term incentive awards are based on financial and operational measures directly aligned with the business strategy. These measures of success create a close alignment between our NEOs and shareholder interests. Further, the long-term incentive awards are adjusted based on the Company stock price performance.
Pay Mix
The compensation for NEOs who bear the most responsibility for our performance is heavily weighted toward at-risk variable compensation (annual and long-term incentives) in which actual amounts earned may differ from targeted amounts based upon multiple performance measures closely aligned with our business objectives. As the following charts show, 75% of our CEO’s target pay and, on average, 63% of the pay for our other NEOs is performance based and subject to the achievement of pre-defined performance targets.
2012 COMPENSATION PAY MIX AT TARGET
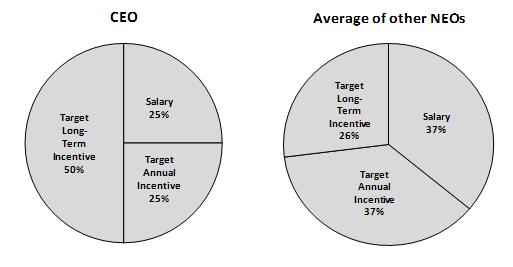
Process for Determining NEO Compensation
Board of Directors and Compensation Committee
The Board of Directors is responsible for reviewing the performance of and approving compensation awarded to the CEO. This process is conducted annually, or whenever CEO changes occur, based upon recommendations from the Compensation Committee. The Compensation Committee is responsible for reviewing the performance of and approving compensation awarded to all other NEOs. This assessment is done annually, or whenever changes in NEO leadership occur, based upon recommendations from the CEO.
108
Compensation Consultant
The Compensation Committee has retained an independent compensation consultant, Semler Brossy Consulting Group, LLC (“Semler Brossy”), for advice on executive and director compensation matters. The chair of the Compensation Committee oversees all of the consultant’s work. Management does not retain its own consultant for executive compensation matters and did not use any consulting services from Semler Brossy in 2012. The Compensation Committee has conducted an assessment of its relationship with Semler Brossy pursuant to SEC and NYSE rules regarding advisor independence, and has not identified any issues with independence or conflicts of interest at this time.
During 2012, Semler Brossy advised the Compensation Committee on emerging best compensation practices and assisted the Compensation Committee in its review and analysis of executive and director compensation, including its assessment of NEO compensation levels, its analysis of comparative market data, and the structure of the Company’s annual and long-term incentive programs, as well as other pay practices and provisions.
While our policy requires Semler Brossy to address the Compensation Committee in executive session at least once each calendar year, in 2012 Semler Brossy addressed the Compensation Committee in executive session at most of its sessions.
Role of Management
The Company’s Human Resources department supports the Compensation Committee in the execution of its responsibilities. The Company’s head of Human Resources supervises the development of materials for each Compensation Committee meeting. No member of the management team, including the CEO, has a role in determining his or her own compensation.
Compensation Determinations
On an annual basis, or when changes in NEO leadership occur, the CEO recommends, and the Compensation Committee reviews and approves, NEO target pay opportunities, except for the CEO. The Compensation Committee takes a multi-faceted approach to determining compensation for NEOs. Without prescribing particular weighting to any one factor, the Compensation Committee takes into account the following factors:
·
Relative strategic value of role.
·
Individual performance.
·
Change in responsibilities, if applicable.
·
Newness to role, if applicable.
·
Current compensation relative to competitive market references.
·
Current compensation relative to internal peers.
The Compensation Committee takes a similar approach to evaluating the CEO’s compensation in making its recommendation to the Board.
Assessing Competitiveness of Compensation
As noted in theObjectives of Executive Compensation Program section, the Compensation Committee seeks to provide competitive pay opportunities in order to attract, motivate and retain high caliber leadership. In assessing the appropriateness of each NEO’s compensation, the Compensation Committee considers total compensation relative to market as one of many inputs.
There are few public companies of both comparable size and business to the Company. To ensure sufficiently robust data, proxy data is supplemented with data from surveys. In its annual competitive review of the 2012 executive compensation program, the Compensation Committee assessed NEO pay as compared to executives with similar roles using proxy peer group data and survey data. For the CEO, the Committee used proxy peer group data as a primary source, supplemented with survey data. For the other NEOs, the Committee used only survey data. The Committee adopted a new approach to compensation market assessments based on shareholder outreach beginning in 2013.
109
·
Proxy data: For the CEO, the Compensation Committee referenced pay data at 10 public life and health insurance companies. When the peer group was determined, assets for the peers ranged between one-third and three times the Company’s approximately $22 billion in assets. The following companies comprised the peer group used to assess the competitiveness of CEO pay:
| |
American Equity | Protective Life |
CNO Financial | StanCorp Financial |
Delphi Financial(1) | Symetra Financial |
FBL Financial | Torchmark |
Primerica | Unum Group |
(1)
Delphi Financial was acquired by Tokio Marine Holdings, Inc. in 2012.
·
Survey data: For all NEOs, the Compensation Committee referenced pay data at insurance companies in industry-specific surveys from Mercer and Towers Watson, as well as general industry data from Mercer:
-
2012 US Mercer Benchmark Database-Executive(“Mercer”): Provided general industry data on executive positions based on input from over 2,000 organizations, with median assets of about $4 billion. When available, the subset of 40 non-healthcare insurance companies (median assets $12 billion) was referenced. Because the Company was larger than the median, we referenced the 50th to 75th percentile of the compensation reported by the companies in this survey.
-
2012 Towers Watson Diversified Insurance Study of Executive Compensation (“Towers Watson DIS”): Provided data on input from 27 insurance companies. Where sufficient information was available for the applicable position, the Company utilized data from the smaller half of the survey, representing 12 companies with assets under $125 billion, and median assets of about $55 billion. Because the Company was smaller than the median, we referenced the 25th percentile and below of the compensation reported by the companies in this survey.
Change for 2012-2013
The proxy data peer group described above was first used in 2011 when the Compensation Committee reviewed change in control and severance practices. These companies were selected as peers based on comparability of business and asset size as primary factors. The Company believes screening peers based on assets identifies companies with comparable organizational complexity better than revenue or market cap.
The Compensation Committee reviewed its methodology for assessing compensation relative to market during 2012. As a result of this review, the Compensation Committee decided to continue referencing data from both proxy and survey data and to expand the use of proxy peer data beyond the CEO, when sufficient data is available. At this time, the peer group was also expanded to include five additional companies.
The resulting peer group consists of 14 similarly sized publicly traded life insurance and financial services companies that compete with the Company for business and executive talent. The median assets of this new peer group are approximately $22 billion, similar to the Company, and 12 of the 14 companies have assets between one-third and three times of the Company. For determining 2013 target compensation levels (including pay changes related to Ms. Malley’s promotion to CFO in November 2012), the Company used proxy data from the new peer group as a primary source for competitive data and supplemented with the 2013 edition of each of the surveys referenced above as an additional source of competitive data.
The following companies comprise the new proxy data peer group:
| |
American Financial Group(1) | National Western Life(1) |
American National Insurance(1) | Primerica |
American Equity | Protective Life |
CNO Financial | StanCorp Financial |
FBL Financial | Symetra Financial |
Independence Holding(1) | Torchmark |
Kansas City Life(1) | Unum Group |
(1)
Added to the peer group based on similarity in size to the Company.
110
The following tables describe the methodology for assessing compensation relative to market during 2012.
| | | | |
CEO, CFO, and Other Executives Where Sufficient Compensation Data Exists From Our Proxy Peer Group |
Source Priority | Reference | Description |
Median Size | Compensation Reference Range (Percentile) |
Primary | Proxy Peer Group | Disclosed data from 14 publicly traded life insurance and financial services companies that compete with Phoenix for business and executive talent | $22 billion in assets | 25th- 50th |
Secondary | Towers Watson DIS | Survey data from 29 insurance companies with assets ranging from $22 billion to $840 billion(1) | $168 billion in assets | 10th- 25th |
| | | | |
Executives Who Do Not Have Sufficient Compensation Reference Points in Our Proxy Peer Group |
Source Priority | Reference | Description | Median Size | Compensation Reference Range (Percentile) |
Primary | Mercer | Survey data from over 3,000 organizations, including insurance and financial services companies(2) | $1 billion in revenues | 50th- 75th |
Secondary | Towers Watson DIS | Survey data from 29 insurance companies with assets ranging from $22 billion to $840 billion(1) | $168 billion in assets | 10th- 25th |
(1)
When available, the subset of 11 companies with assets under $125 billion (median $54 billion) is referenced at the 25th- 50th percentile range.
(2)
When available, the subset of 40 non-healthcare insurance companies (median assets $12 billion) is referenced at the 50th- 75th percentile range.
Project to Assess the Treatment of Open Incentive Plans Given the Restatement
The Assessment
As discussed in theExplanatory Note, the Company announced on November 8, 2012 that it would restate historical annual and interim GAAP financial statements. In January 2014, as results from the Restatement were being finalized, the Compensation Committee engaged its independent compensation consultant to conduct a full review of the implications of the Restatement on the Company’s “open” incentive plans (defined to include all unpaid incentive plans impacted by the Restatement).
| |
Plan(1) | Detail |
2012 PIP | - Corporate annual incentive plan covering performance during fiscal year 2012 |
2013 PIP | - Corporate annual incentive plan covering performance during fiscal year 2013 |
2011-2013 LTIP | - Long-term incentive grant made in February 2011(2) covering Company and stock price performance from 2011 through year-end 2013. |
2012-2014 LTIP | - Long-term incentive grant made in February 2012(3) covering Company and stock price performance from 2012 through early March 2015. |
(1)
The Committee’s assessment of open corporate incentive plans excluded the 2013-2015 LTIP, because it was not implemented, and the open Investment Incentive Plans and Saybrus Partners, Inc. Profit Sharing Plans, because the Restatement had a de minimis impact on the performance measures in those plans.
(2)
The CEO’s long-term incentive grant was made in March 2011 after full Board approval.
(3)
The CEO’s long-term incentive grant was made in March 2012 after full Board approval.
The review covered these open incentive plans to ensure they aligned with the core business performance during the covered periods and reflected any negative implications of the Restatement for shareholders and other key stakeholders.
The assessment was organized into three phases:
1.
Established Appropriate Context and Background
The Committee performed a detailed assessment of the considerations and implications associated with the Restatement for all the Company’s key stakeholders, including shareholders. Additionally, the Committee requested and reviewed a detailed competitive analysis of how other companies in similar situations addressed compensation, with a primary focus on companies that underwent prolonged financial restatements. The Committee assessed more than 100 companies with revenues between $200 million and $20 billion that disclosed a restatement from 2010-2014. These companies’ restatements shared some characteristics with Phoenix’s, including the length of time and materiality.
111
2.
Defined Guiding Principles
The Committee established a number of guiding principles for open incentive plan outcomes:
·
Align with shareholder outcomes and experience over the period.
·
Be fair and equitable for employees.
·
Be appropriate in the context of the broader business performance in the periods covered.
·
Preserve the original intent of each open incentive plan and apply a consistent approach across the portfolio of open incentive plans.
·
Reflect balanced outcomes across the portfolio of open incentive plans.
3.
Established Objective Framework
Using the information from the stakeholder and competitive analyses referenced above, the Compensation Committee developed an objective framework for determining the appropriate treatment of the open incentive plans. The framework is based on three factors commonly used by companies in the competitive analysis to assess the characteristics of restatement items. The Committee then grouped the impact of the Restatement into three categories and assessed them against the factors to determine whether to include or exclude their impact from the open incentive plan outcomes.
| | |
Key Factors | |
Key Financial Impacts |
· Nature of the event · Accountability · Materiality |
· UL reserve accounting error · Other Restatement items · Costs associated with the Restatement |
Treatment of Open Incentive Plans
Based on this review, the Compensation Committee approved the following actions with respect to the four open incentive plans:
·
The impact of the UL reserve accounting error is excluded from the calculations for open incentive plans. As part of the Restatement, the Company is recording additional UL reserves over the Restatement period to cover expected losses that otherwise would have been recorded in future periods. The Committee determined that it was appropriate to exclude the impact of this error from the incentive plan calculations for three primary reasons:
-
Current expectations and experience indicate the affected block of business is expected to generate cumulative net profits on a U.S. GAAP basis.
-
Although the impact on previously reported U.S. GAAP results (net income and shareholders’ equity) was material, the error did not impact previously reported statutory results of the Company’s life insurance subsidiaries.
-
Excluding the impact of the UL reserve accounting error was consistent with items typically excluded by the companies covered in the competitive analysis.
·
The impact of all other Restatement items and the costs associated with the Restatement is included in the calculations for open incentive plans.The Compensation Committee determined it was appropriate not to make any adjustments to offset the adverse impact of any other changes resulting from the Restatement, including costs associated with the Restatement1. This approach was consistent with the companies covered in the competitive analysis.
———————
1
When the 2013 PIP was established in third quarter of 2013, costs associated with the Restatement were excluded from the “circuit breaker,” which provides that no amounts will be paid under the PIP regardless of performance against all other metrics unless a specified level of pre-tax operating income is achieved. Costs associated with the Restatement were included in the pre-tax operating income performance measure, which comprises 55% of the 2013 PIP.
112
Impact on 2012 Corporate Annual Incentive Plan and the Exercise of Discretion
As a result of these decisions, the 2012 PIP funded at 63% of target. See2012 Annual Incentive Plan Results for a breakdown of performance by measure and in aggregate.
The Committee believes that the outcomes for individual NEOs and broader employee participants align with the operational and financial performance, as well as the impact of the Restatement, during 2012. The Company achieved solid results on five of the six performance metrics for the 2012 PIP, ranging from 67% to 123% of targets. These include Adjusted NAIC Risk-Based Capital Ratio, a key metric for state insurance regulators, and Business Conservation, a critical determinant of future revenue and earnings. See the2012 Performance Incentive Plan Results table.
The Compensation Committee and the Board have the authority to exercise discretion to reduce annual incentive plan awards. In light of the Restatement, the 2012 annual incentive awards were reduced for Mr. Hofmann, who was CFO during the fiscal periods subject to the Restatement, and Mr. Wehr. Mr. Hofmann’s payout was reduced by 80%, from 63% to 13% of target. Mr. Wehr’s payout was reduced by 40%, from 63% to 38% of target.
Impact on Other Open Incentive Plans
For the other three open incentive plans, the Committee intends to apply the approach described inTreatment of Open Incentive Plans. A full explanation of the payouts under the 2013 PIP, 2011-2013 LTIP and 2012-2014 LTIP will be disclosed in future CD&As once the results are finalized.
Elements of Compensation
Salary
Salaries are reviewed annually as a component of total direct compensation targets. Adjustments, if any, are based upon an evaluation of market data, change in responsibilities, and current compensation relative to internal peers, as well as each NEO’s level of responsibility, experience and expertise.
Annual Incentives
All Company employees, including the NEOs, have the opportunity to earn cash incentive awards for achievement of predetermined performance objectives approved by the Compensation Committee and for our CEO, the Board. Our NEOs participate in one or a combination of two annual incentive plans, based on their roles. Messrs. Wehr, Hofmann and Mulrain
and Ms. Malley participate only in the PIP. Mr. Cassidy participates only in the Saybrus Partners, Inc. Profit Sharing Plan and additional incentives, in lieu of the PIP. Mr. Wilkos participates in the PIP (50%) and the Investment Incentive Plan (50%). In each case, the Compensation Committee (and, in the case of the CEO, the Board) has the authority to exercise discretion to reduce an NEO’s award based on circumstances related to the Company or the NEO.
Performance Incentive Plan
The majority of employees, and five of our six active NEOs, participate in the PIP, which is based on overall Phoenix performance. Each year, the Company funds an aggregate award pool for all participants based upon the performance against pre-established metrics for certain financial and operating measures, described for 2012 in the footnotes to the2012 Performance Incentive Plan Results table. The performance metrics for each measure, as well as the relative weights of each measure, are set based upon the Company’s strategic and financial plans that are reviewed by the Board at the beginning of the year. As performance has strengthened, goals have been set at higher levels for most measures, requiring meaningful improvement over the prior year to achieve target payout. While performance metrics are consistent for all participants, depending upon the nature of the role, performance measures could be assigned different weights within the PIP. For example, in 2012, individuals within the organization, including our NEOs, with greater responsibility for driving new business had a higher weight for measures associated with new business.
Incentive awards can range from 0% to 200% of an individual’s incentive target. For 2012, in order to receive any payment under this plan, the Pre-tax Operating Income performance measure had to achieve an actual 2012 result of at least $10 million. Pre-tax Operating Income serves as both a performance measure and a “circuit breaker” for the plan overall because it is a key measure of interest to investors, analysts and other stakeholders.
113
| | | | | | |
2012 Performance Incentive Plan Results |
Performance Measures(1) $ in millions | Weight(8) | 2012 Incentive Goals | Actual Results | Percentage of Target Earned(9) |
Threshold (50% payout) | Target (100% payout) | Maximum (200% payout) |
Adjusted NAIC Risk-Based Capital (“RBC”) Ratio (2) | 20% | 340% | 400% | 460% | 414% | 123% |
Cash-Based Expenses (3) | 15% | $178 | $169 | $160 | $175 | 67% |
Business Conservation(4) | 15% | 7.4% | 6.7% | 5.8% | 6.7% | 100% |
Pre-Tax Operating Income(5) | 35% | $25 | $52 | $100 | $20 | 0% |
Contribution Dollars from Current Year Business (6) | 10% | $6 | $22 | $38 | $16 | 81% |
Saybrus EBITDA (7) | 5% | $2.4 | $3.2 | $4.8 | $3.2 | 100% |
Total(1) | 100% | | 63% |
(1)
To achieve any payment under this Plan, the pre-tax operating income performance measure had to achieve an actual result of at least $10 million.
(2)
Adjusted NAIC RBC Ratio is total adjusted capital divided by two times the risk-based required capital for Phoenix Life, adjusted by the excess holding company capital above $50 million.
(3)
Cash-based Expenses exclude Saybrus direct expenses, retirement-related expenses and restructuring charges.
(4)
Business Conservation is persistency of the in-force block of business (surrender ratio) - statutory surrender benefits and withdrawals divided by average assets.
(5)
Pre-tax operating income differs from net income reported in accordance with U.S. GAAP in that it excludes federal income taxes; excludes net realized investment gains and related deferred acquisition cost amortization, tax and other related offsets; includes changes in net income related to fixed indexed annuity options purchased to fund annual index credits; excludes changes in net income related to fixed indexed annuity embedded derivatives; includes amortization of option premium and proceeds received upon options expiring specific to fixed indexed annuities; and excludes the impact of the change in unlocking of assumptions related to deferred policy acquisition costs. Management believes that operating income, as well as components of and financial measures derived from operating income (such as pre-tax operating income), provide investors, analysts and other stakeholders with additional insight into the underlying trends in our operations. The impact of the UL reserve accounting error was excluded. SeeTreatment of Open Incentive Plans.
(6)
Contribution dollars from current year business is equal to the present day valuation of future statutory profits associated with new fixed index annuity sales.
(7)
Saybrus EBITDA is 2012 earnings before interest, taxes, depreciation, and amortization for the Saybrus Partners, Inc. subsidiary.
(8)
Numbers reflect weights for all NEOs except Mr. Cassidy and Mr. Polkinghorn. Mr. Cassidy did not participate in the PIP. The weights assigned to Mr. Polkinghorn’s measures were as follows:
-
Adjusted NAIC Risk-Based Capital (“RBC”) Ratio – 20%
-
Cash-Based Expenses – 15%
-
Business Conservation – 15%
-
Pre-Tax Operating Income – 10%
-
Contribution Dollars from Current Year Business – 25%
-
Saybrus EBITDA – 15%
(9)
Goals and results are rounded. For results between threshold and target and between target and maximum, the percentages are interpolated.
Investment Incentive Plan
Mr. Wilkos, our Chief Investment Officer, has an annual incentive target that is equally weighted between the PIP and the Investment Incentive Plan.
| | | | | | |
2012 Investment Incentive Plan |
Performance Measures | Weight | 2012 Incentive Goals | Actual Results | Percentage of Target Earned |
Threshold (50% payout) | Target
(100% payout) | Maximum
(200% payout) |
New Money Spread (1) | 50% | Target Spread | Target + 35bps | Target + 90bps | +90 | 200% |
Phoenix Public Corporate Bond Credit Losses | 15% | 100% of 12-Month Corporate Bond Default Losses | 80% of 12-Month Corporate Bond Default Losses | 50% of 12-Month Corporate Bond Default Losses | 69% | 138% |
Phoenix Private Corporate Bond Credit Losses | 15% | 100% of 12-Month Corporate Bond Default Losses | 80% of 12-Month Corporate Bond Default Losses | 50% of 12-Month Corporate Bond Default Losses | 10% | 200% |
Phoenix Structured Bond Credit Losses | 15% | 100% of 12-Month Structured Bond Default Losses | 80% of 12-Month Structured Bond Default Losses | 50% of 12-Month Structured Bond Default Losses | 82% | 94% |
Phoenix Portfolio CLO/CDO Credit Losses | 5% | 100% of 12-Month CLO/CDO Bond Default Losses | 80% of 12-Month CLO/CDO Bond Default Losses | 50% of 12-Month CLO/CDO Bond Default Losses | (10%)(2) | 200% |
Total | | 175% |
(1)
Actual results denominated such that +/- represents basis points above or below benchmark.Negative credit loss amount denotes net credit gains. Impairment losses were more than offset by credit gains on sale or redemption of impaired securities.
114
Saybrus Annual Incentive Plan
Mr. Cassidy participates in the Saybrus Partners, Inc. Profit Sharing Plan and additional incentives, in lieu of the PIP. The Profit Sharing Plan is funded at 15% of Saybrus EBITDA and pays out to individuals who attain a certain annual performance rating specified under the Company performance management program. Mr. Cassidy and other Saybrus principals are allocated a defined percentage of the pool. Mr. Cassidy's additional incentives are based upon specific sales and profitability measures related to the Saybrus business segment. Incentives related to sales measures are determined based on sales volumes and commission rates that vary by product and distribution channel. Incentives related to profitability measures are based on the contribution margins associated with new annuity sales.
2012 Annual Incentive Plan Results
| | | | | |
Name | Position | Annual Incentive Target | % of Target Earned | Payout Results |
Unadjusted | Adjusted |
James D. Wehr (1) | President and Chief Executive Officer | $ 700,000 | 63% | 38% | $ 264,600 |
Bonnie J. Malley | Executive Vice President, Chief Financial Officer and Treasurer | $ 306,000 | 63% | No Adjustment | $ 192,780 |
Peter A. Hofmann (2) | Executive Vice President, Strategy and Business Development | $ 425,000 | 63% | 13% | $ 53,550 |
Edward W. Cassidy (3) | Executive Vice President, Distribution | $ 631,330 | 94% | No Adjustment | $ 592,600 |
Christopher M. Wilkos (4) | Executive Vice President and Chief Investment Officer | $ 333,000 | 119% | No Adjustment | $ 395,937 |
John T. Mulrain | Executive Vice President, General Counsel and Secretary | $ 200,000 | 63% | No Adjustment | $ 126,000 |
(1)
Mr. Wehr’s 2012 annual incentive payout was reduced from 63% to 38% of target after the exercise of discretion.
(2)
Mr. Hofmann’s 2012 annual incentive payout was reduced from 63% to 13% of target after the exercise of discretion.
(3)
Mr. Cassidy’s incentive is based upon specific sales and profitability measures related to the Saybrus business.
(4)
Mr. Wilkos’ incentive is equally weighted between the 2012 Annual Incentive Plan and the Investment Incentive Plan.
Long-Term Incentive Awards
LTI awards are granted on an annual basis and cover a three-year period or plan cycle (“LTIP cycle”). Typically, target awards are determined at the beginning of the cycle, and awards are paid at the end of the cycle, contingent upon achievement of certain performance criteria and Committee approval of those results.
Prior to each grant year, the plan design is examined and modified as appropriate to reflect the economic environment and the Company’s current long-term strategy. This level of review ensures each year’s LTIP cycle is designed to reflect the Company’s strategic intention to use long-term pay to drive long-term performance.
In 2012, the target awards for our active NEOs for the 2012-2014 LTIP cycle were set as follows:
| |
Name | 2012-2014 LTIP Target |
James D. Wehr | $ 1,400,000 |
Bonnie J. Malley | $ 250,000 |
Peter A. Hofmann | $ 340,000 |
Edward W. Cassidy | $ 280,000 |
Christopher M. Wilkos | $ 330,000 |
John T. Mulrain | $ 200,000 |
115
Award Mechanics
Consistent with recent grants, the payout under the 2012-2014 LTIP cycle will be determined based on a performance component and a stock price modifier, as described below. Because of equity compensation share availability constraints, the 2012-2014 LTIP cycle is denominated in cash. However, the Compensation Committee determined that it was important to align the NEOs’ compensation with the long-term stock price performance, which is why the stock price modifier is included.
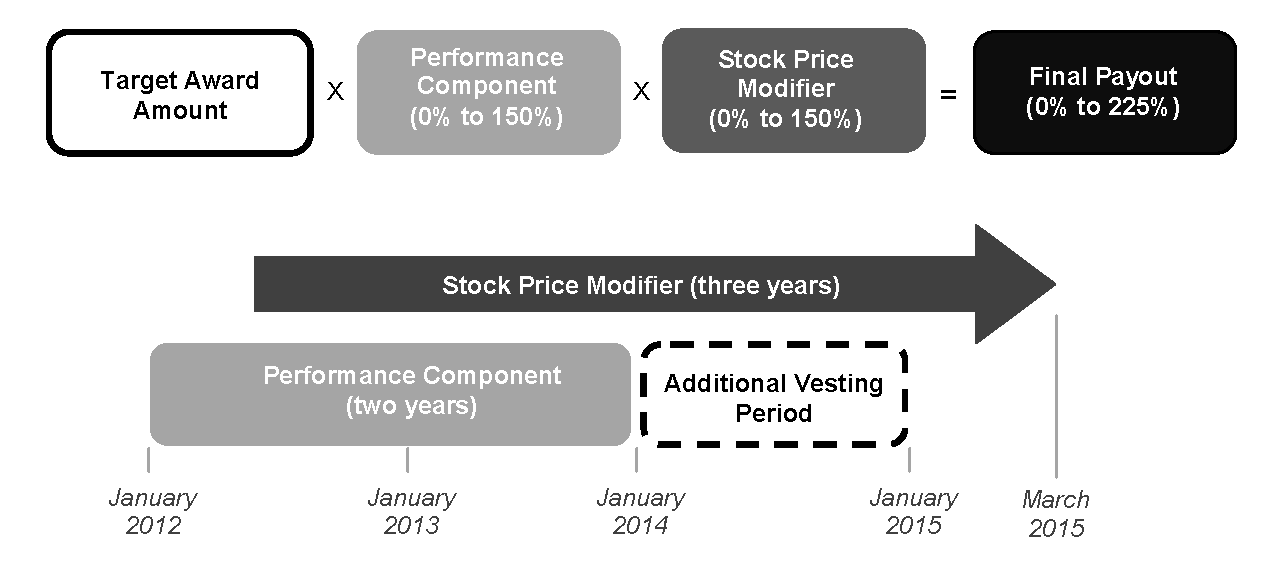
Performance Component
The performance component is determined based on financial and operating performance over the two-year period of 2012 and 2013, consistent with the Company’s two-year strategic and financial planning horizon at the time of the grant. At the end of this two-year period, the value accrued is subject to an additional year of vesting. To emphasize profitable growth, Pre-tax Operating Income carries the highest weighting.
| | | | |
2012-2014 LTIP Cycle |
Performance Measures $ in millions | Weight | Incentive Goals(5) |
Threshold
(50% payout) | Target
(100% payout) | Maximum
(200% payout) |
2012 and 2013 Pre-tax Operating Income (1)(2) | 55% | $ 77 | $ 137 | $ 197 |
2013 Year-end Adjusted NAIC RBC Ratio (3) | 25% | 390% | 440% | 490% |
2013 Cash-Based Expenses (4) | 20% | $ 169 | $ 159 | $ 139 |
Total | 100% | Payout capped at 150% |
(1)
To achieve any payment under this plan, 2012 and 2013 Pre-tax Operating Income performance measure has to achieve an actual result of at least $30 million.
(2)
Pre-tax operating income differs from net income reported in accordance with U.S. GAAP in that it excludes federal income taxes; excludes net realized investment gains and related deferred acquisition cost amortization, tax and other related offsets; includes changes in net income related to fixed indexed annuity options purchased to fund annual index credits; excludes changes in net income related to fixed indexed annuity embedded derivatives; includes amortization of option premium and proceeds received upon options expiring specific to fixed indexed annuities; and excludes the impact of the change in unlocking of assumptions related to deferred policy acquisition costs. Management believes that operating income, as well as components of and financial measures derived from operating income (such as pre-tax operating income), provide investors, analysts and other stakeholders with additional insight into the underlying trends in our operations. The impact of the UL reserve accounting error was excluded. SeeTreatment of Open Incentive Plans.
(3)
Adjusted NAIC RBC Ratio is total adjusted capital divided by two times risk-based required capital for Phoenix Life, adjusted by excess holding company capital above $50 million.
(4)
Cash-Based Expenses exclude Saybrus direct expenses, retirement-related expenses and restructuring charges.
(5)
Goals and results are rounded. Results between threshold and target or between target and maximum are interpolated.
116
Stock Price Modifier
To align the interests of our executives with those of our shareholders, awards are also subject to a stock price modifier. The stock price modifier is determined based on absolute stock price performance for the full three-year period. It is calculated as the 30-day average stock price at end of a three-year period divided by the closing stock price on grant date. The value based on the performance component measured over the initial two-year period of the LTIP cycle is capped at 150% and adjusted upward or downward based on the stock price modifier. The modifier is also capped, so participants do not benefit from any stock price appreciation above the cap as they would with a share-based grant. The stock price modifier cap for the 2012-2014 LTIP is 150%, for a total maximum payout opportunity of 225%.
Other Elements and Policies of NEO Compensation
Non-Qualified Deferred Compensation
We maintain non-qualified deferred compensation plans that allow NEOs and select employees to defer a portion of their salary to allow participants an opportunity to defer tax payments and receive Company matching contributions on their cash compensation in excess of the Internal Revenue Code limits on compensation placed on the 401(k) Plan. For more information about the non-qualified deferred compensation benefits provided to NEOs in 2012, see theNon-Qualified Deferred Compensationtable and accompanying notes, sub-tables and narrative.
Supplemental Retirement Benefits
The SERPs are non-qualified defined benefit pension plans that provide supplemental retirement income to our NEOs and select employees. The SERPs provide the same benefits as those provided under the broad-based Employee Pension Plan, except that the benefit limitations imposed by the Internal Revenue Code, and the exclusion of annual incentive compensation in the definition of earnings under the Employee Pension Plan formula prior to July 1, 2007 are not taken into account. Accordingly, when in effect, the SERPs permitted us to provide participants with retirement benefits on the same basis as other similarly situated employees without reduction due to the limits of the Internal Revenue Code and the exclusion of their annual incentive awards. Benefit accruals under the Company’s SERPs and participation were frozen at the end of business on March 31, 2010. For more detailed information about the SERPs’ benefit, please refer to the narrative to thePension Benefitstable.
Change-In-Control Agreements
During change-in-control events, the Board considers maintaining a sound management team that exercises judgment without bias due to personal circumstances to be essential to protecting and enhancing the best interests of the Company and our shareholders. To that end, we afford certain change-in-control benefits to certain executives, including our NEOs, because they hold critical positions within the Company and would be integral to effectuating a corporate transaction. In 2011, the Compensation Committee reviewed the change-in-control agreements that were effective in 2012 and 2013.
We believe our change-in-control agreements are generally consistent with market practices and aligned with current best practices:
·
Both cash and equity payments are “double trigger,” meaning that the additional benefits set forth in the agreements will not be paid upon a change-in-control unless the NEO’s employment is terminated involuntarily (other than for cause) or for good reason within a specified period following the transaction.
·
Benefits are capped at 2.99 times average annual compensation and no 280G gross-ups are provided.
·
There are no retirement enhancements.
·
In order to receive payments, certain NEOs must comply with non-compete restrictions.
The change-in-control and post-termination arrangements are described inChange-in-Control Agreements and Severance.
117
Severance
Severance benefits are provided to the NEOs in circumstances outside of a change-in-control through The Phoenix Companies, Inc. Executive Severance Allowance Plan or the Saybrus Partners, Inc. Executive Severance Allowance Plan (the “Executive Severance Allowance Plans”) if the NEO is terminated without cause. The Executive Severance Allowance Plans apply to all NEOs and to any other employee that the CEO determines to be integral to the formulation or execution of our business strategy.
Five of our six active NEOs are covered under the Phoenix Executive Severance Allowance Plan and are eligible for, subject to certain conditions, severance equal to monthly salary and the average of the last two annual incentive awards already paid as of the termination date for a specified number of months based on years of service. The benefits are tiered based on years of service and the minimum payment is nine months of severance and the maximum is 18 months of severance. In addition, the NEOs are paid a prorated portion of their annual and long-term incentive based on actual plan results for the year they are terminated under the Executive Severance Allowance Plan.
Mr. Cassidy is covered under the Saybrus Executive Severance Allowance Plan which provides for benefits to certain executives of Saybrus Partners, Inc. and its affiliates (“Saybrus”) who meet the eligibility requirements when their employment is involuntarily terminated by Saybrus. The Severance Amount equals (a) the executive’s salary for the one-year period prior to the executive’s separation date plus (b) the two-year average of the executive’s Saybrus annual variable compensation amount and profit sharing plan amount for the immediate two years prior to the executive’s separation date.
An employee who is covered by a change-in-control agreement and an Executive Severance Allowance Plan can receive only the benefits of one of the coverages in the event of a termination.
Perquisites
We provide perquisites to our NEOs as an incremental benefit to recognize their position within the Company. Perquisites are not a material part of our executive compensation. Available perquisites include:
·
Annual preventative medical care reimbursement of up to $500
·
Annual reimbursement for financial planning and tax services of up to $3,000
·
Travel expense reimbursement for expenses associated with spousal business travel when such attendance is expected
·
Relocation assistance
For information about perquisites provided to NEOs in 2012, see Note 6 of theSummary Compensation Table.
Equity Grant Procedures
When utilized, stock options and RSUs are granted to both executive and non-executive employees pursuant to our equity grant policy. Under this policy:
·
Equity awards made as part of a recurring compensation program, such as LTI awards to NEOs, will be approved and granted at a meeting of the Compensation Committee or, for the CEO, the Board, that occurs within 20 days after the Company’s earnings release for the prior fiscal year.
·
All other stock options and RSUs are generally granted on four scheduled grant dates each year, which occur on the fifth calendar day after the filing deadline for our Form 10-K or Form 10-Q, as applicable.
·
Neither the CEO, the Board nor the Compensation Committee may take any action with respect to any stock option that would be treated as a “repricing” of such stock option.
·
The Compensation Committee may, in its discretion, approve and grant equity awards at other times, if it determines that such action is in the best interests of shareholders.
We do not consider material inside information in determining award amounts or grant dates, and our policy reinforces this practice by intentionally selecting grant dates when decision makers are the least likely to be in possession of material inside information.
118
Share Ownership and Retention Guidelines; Restrictions on Trading
To facilitate stock ownership by our NEOs, we adopted the following ownership and retention guidelines. For NEOs, the guidelines call for each executive to accumulate ownership of our Common Stock (including, for these purposes, RSUs) at a specified multiple of salary. The CEO has a target ownership of five times salary, and target ownership for other executive ranges from one to three times salary.
Instead of a fixed timeframe for attaining these levels of ownership, executives must retain a portion of the equity received from stock-based benefit and compensation plans. When the specific ownership thresholds are met, as measured using the current fair market value of our Common Stock, the retention ratios for future grants are reduced. The initial retention ratio is 75% for the CEO and 25% to 40% for other executives. As of December 31, 2013, none of our active NEOs had met target ownership levels.
The Company’s policy on insider trading permits executives to engage in transactions involving the Company’s equity securities only (1) during “trading windows” of limited duration following the issuance of periodic earnings releases and (2) following a determination by the Company that the executive is not in possession of material non-public information. In addition, the Company has the ability under its insider trading policy to suspend trading by executives in its equity securities.
Anti-Hedging Policy
The Compensation Committee has adopted an Anti-Hedging Policy for all directors and employees of the Company as part of its Code of Conduct. The policy provides that all employees and directors are prohibited from engaging in any hedging transactions against the Company’s securities and any derivative securities of the Company. Such transactions include, but are not limited to, short selling, trading input and call options, and forward sale contracts.
Clawback Policy
The Company enhanced its clawback policy in 2013 to go beyond the Sarbanes-Oxley requirements. The definition of covered employee has been expanded beyond the CEO and CFO and includes the entire executive team, individuals who provide certifications to the CEO and CFO for regulatory filings, LTIP participants and individuals in other key roles as determined by the Board of Directors. The policy allows the Board of Directors greater discretion in the use of clawbacks, such that the Compensation Committee determines when to apply the clawback, how to apply it, and to whom. The policy provides the Compensation Committee with the ability to claw back compensation under a wide range of circumstances, including fraud, misconduct, financial restatements, and the restatement of performance results. We believe this better aligns with shareholder interests by allowing the recovery of compensation overpayments that were based upon results that are later found to have been inaccurate. We also believe the new policy protects the Company in the event of a restatement while maintaining the integrity of the compensation program by being fair to those executives not directly involved in any misstatement.
The Dodd-Frank Wall Street Reform and Consumer Protection Act (“Dodd-Frank”) may require us to adopt a broader, less discretionary policy.
When the SEC and NYSE provide mandatory guidance to implement the Dodd-Frank clawback requirement, the Board will consider the guidance and make revisions to our policy as necessary.
Tax and Accounting Considerations
Internal Revenue Code section 162(m) disallows a tax deduction to public corporations for compensation over $1 million paid to certain NEOs. However, performance-based compensation is exempt from the deduction limit if certain requirements are met. The Compensation Committee intends to structure certain compensation to take advantage of this exemption under Internal Revenue Code section 162(m), as appropriate, in light of its compensation objectives. However, the Compensation Committee may elect to provide compensation outside those requirements when necessary to achieve its compensation objectives. Our 2012 annual and long-term incentive plans were designed in a manner to allow the Compensation Committee to award compensation intended to qualify as performance-based compensation under Internal Revenue Code section 162(m).
119
Internal Revenue Code section 409A imposes certain requirements on deferred compensation. If these requirements are not met, employees may be subject to an additional income tax and interest penalties. It is our intent that our non-qualified deferred compensation plans and other compensation covered by Internal Revenue Code section 409A be operated and administered to meet these requirements.
Accounting considerations also play a role in designing the compensation programs made available to our NEOs. Principal among these is Financial Accounting Standards Board Statement of Financial Accounting Standards Codification Topic No. 718,Compensation — Stock Compensation (“ASC 718”), which addresses the accounting treatment of certain equity-based compensation. The Compensation Committee regularly considers the accounting implications of our long-term incentive awards, including the variable accounting treatment of the current program.
REPORT OF THE COMPENSATION COMMITTEE
The Compensation Committee has submitted the following report for inclusion in this Annual Report on Form 10-K:
Our Compensation Committee has reviewed and discussed theCompensation Discussion and Analysis contained in this Annual Report on Form 10-K with management. Based on our review and discussion with management, we have recommended to the Board thatCompensation Discussion and Analysis be included in this Annual Report on Form 10-K for the fiscal year ended December 31, 2012 for filing with the SEC.
The report is submitted as of March 20, 2014 by the following directors, who constitute the Compensation Committee:
Sanford Cloud, Jr., Esq., Chair
Arthur P. Byrne
Ann Maynard Gray
Arthur F. Weinbach
COMPENSATION COMMITTEE INTERLOCKS AND INSIDER PARTICIPATION
None of the members of the Compensation Committee during 2012 or as of the date of this Annual Report on Form 10-K is or has been an officer or employee of the Company and no executive officer of the Company served on the compensation committee or board of any company that employed any member of the Compensation Committee or Board.
RISK ASSESSMENT
On an annual basis, we conduct a risk assessment of our compensation policies and practices in response to current public and regulatory concern about the link between incentive compensation and excessive risk taking by corporations. Based upon the assessment conducted in 2012 and early 2013, we have concluded that our compensation program does not motivate imprudent risk taking and that any risks involved in compensation are not reasonably likely to have a material adverse effect on the Company. Included in the analysis were such factors as the behaviors being induced by our fixed and variable pay
components, the balance of annual and long-term performance goals in our incentive compensation system, the established limits on permissible incentive award levels, the oversight of the Compensation Committee in the operation of our incentive plans and the high level of Board involvement in approving material transactions and providing governance over the Company’s affairs. Management presented the results of this assessment to the Compensation Committee for its review in early 2013 as part of its obligation to oversee our compensation risk assessment process.
120
EXECUTIVE COMPENSATION
Summary Compensation Table
This table summarizes the total compensation paid or earned by the NEOs for the fiscal years ended December 31, 2010, 2011, and 2012. The table reflects total compensation paid or earned beginning in the later of the fiscal year ended December 31, 2010 or the year an individual first became an NEO.
| | | | | | | | | |
Name and Principal Position (a) |
Year (b) |
Salary(1) (c) |
Bonus (d) |
Stock Awards(2) (e) |
Option Awards(3) (f) |
Non-Equity Incentive Plan Compensation(4) (g) | Change in Pension Value and Non-Qualified Deferred Compensation Earnings(5) (h) |
All Other Compensation(6) (i) |
Total (j) |
James D. Wehr President and Chief Executive Officer | 2012 | $ 700,000 | $ - | $1,400,000(7) | $ - | $ 264,600(16) | $ 478,886 | $ 88,208 | $ 2,931,694 |
2011 | 691,667 | - | 2,000,000(8) | - | 1,001,000 | 993,974 | 81,063 | 4,767,704 |
2010 | 650,000 | - | 1,202,500(9) | 97,500 | 604,500 | 895,365 | 59,500 | 3,509,365 |
Bonnie J. Malley Executive Vice President, Chief Financial Officer and Treasurer (10) | 2012 | 363,125 | - | 250,000(7) | - | 192,780 | 304,167 | 45,290 | 1,155,362 |
Peter A. Hofmann Executive Vice President, Strategy and Business Development (10) | 2012 | 425,000 | - | 340,000(7) | - | 53,550(16) | 109,384 | 46,750 | 974,684 |
2011 | 425,000 | - | 340,000(8) | - | 607,750 | 397,123 | 36,806 | 1,806,679 |
2010 | 425,000 | - | 275,188(9) | 22,313 | 395,250 | 112,466 | 25,500 | 1,255,716 |
Edward W. Cassidy Executive Vice President, Distribution | 2012 | 410,000 | - | 280,000(12) | - | 592,600(13) | 28,803 | 24,600 | 1,336,003 |
2011 | 410,000 | - | 280,000(12) | - | 249,764(13) | 30,220 | 20,130 | 990,114 |
2010 | 410,000 | 510,000(11) | 436,000(9)(12) | 21,000 | 225,000(13) | 35,651 | 18,450 | 1,656,101 |
Christopher M. Wilkos Executive Vice President and Chief Investment Officer | 2012 | 370,000 | - | 333,000(7) | - | 395,937(14) | 140,338 | 40,813 | 1,280,088 |
2011 | 367,500 | - | 330,000(8) | - | 502,830 | 186,043 | 36,751 | 1,423,124 |
2010 | 350,000 | - | 291,375(9) | 23,625 | 433,125 | 170,219 | 26,250 | 1,294,594 |
John T. Mulrain Executive Vice President, General Counsel and Secretary | 2012 | 360,000 | - | 200,000(7) | - | 126,000 | 50,738 | 45,097 | 781,835 |
| | | | | | | | |
Philip K. Polkinghorn Former Senior Executive Vice President, Business Development (15) | 2012 | 395,833 | - | 325,000(7) | - | 384,271 | 93,715 | 939,949 | 2,138,768 |
2011 | 475,000 | - | 250,000(8) | - | 883,025 | 99,837 | 40,969 | 1,748,831 |
2010 | 475,000 | - | 279,882(9) | 22,693 | 574,275 | 82,601 | 31,500 | 1,465,951 |
(1)
Figures are shown for the year earned, and have not been reduced for deferrals. For 2012, each of the NEOs elected to defer a portion of their salary until following termination of employment or, in certain circumstances, such earlier specified date elected by the NEO: Mr. Wehr deferred $100,000, Ms. Malley deferred $36,087, Mr. Hofmann deferred $43,000, Mr. Cassidy deferred $26,600, Mr. Wilkos deferred $32,200, Mr. Mulrain deferred $29,100, and Mr. Polkinghorn deferred $39,032.
(2)
Represents the grant date fair market value for respective years for all stock-based awards granted to NEOs (excluding stock options which are reflected in column (f)) as calculated pursuant to ASC 718, excluding the effect of estimated forfeitures. The assumptions used for determining this value are stated in Note 18 of the Company’s financial statements included in this Annual Report for 2012 and the Annual Report on Form 10-K for 2011 and 2010.
121
(3)
Represents the grant date fair market value for the respective years for all stock option awards granted to NEOs as calculated pursuant to ASC 718, excluding the effect of estimated forfeitures. The assumptions used for determining this value are stated in Note 18 of the Company’s financial statements included in this 2012 Form 10-K and the Forms 10-K for 2011 and 2010.
(4)
Represents the cash-based incentive earned under The Phoenix Companies, Inc. Annual Incentive Plan for Executive Officers for the applicable performance year, paid in March of the following year except for the 2012 annual incentive which is scheduled to be paid in April 2014, as described underAnnual Incentives.
(5)
Represents the increase in the actuarial value of accumulated pension benefits accrued during the year. For 2012, 2011 and 2010, this represents the change in value between December 31, 2011 and December 31, 2012, December 31, 2010 and December 31, 2011, and December 31, 2009 and December 31, 2010, respectively, determined using where applicable, the discount rates disclosed in the Annual Report on Form 10-K for those years and based on the other actuarial assumptions described in Note 2 to the Pension Benefits table for each applicable year. These benefit accruals pertain solely to benefits accrued under the Company’s pension plans and exclude all account-based plans that NEOs may participate in, such as The Phoenix Companies, Inc. Savings and Investment Plan and The Phoenix Companies, Inc. Non-Qualified Excess Investment Plan. Since the pension plans were frozen on March 31, 2010, the primary driver of the 2012 change in value was the decrease in interest rates used to value the pension benefit.
(6)
All Other Compensation sub-table:
| | | | | | |
Name | Year | Company Contributions to 401(k) Plan and Excess Investment Plan | Reimbursement for Financial Planning and Tax Services | Anniversary Award | Severance | Total |
James D. Wehr | 2012 | $ 87,208 | $ 1,000 | $ - | $ - | $ 88,208 |
2011 | 79,313 | 1,000 | 750 | - | 81,063 |
2010 | 58,500 | 1,000 | - | - | 59,500 |
Bonnie J. Malley | 2012 | 45,290 | - | - | - | 45,290 |
Peter A. Hofmann | 2012 | 46,750 | - | - | - | 46,750 |
2011 | 36,656 | - | 150 | - | 36,806 |
2010 | 25,500 | - | - | - | 25,500 |
Edward W. Cassidy | 2012 | 24,600 | - | - | - | 24,600 |
2011 | 20,030 | - | 100 | - | 20,130 |
2010 | 18,450 | - | - | - | 18,450 |
Christopher M. Wilkos | 2012 | 40,613 | - | 200 | - | 40,813 |
2011 | 36,751 | - | - | - | 36,751 |
2010 | 26,250 | - | - | - | 26,250 |
John T. Mulrain | 2012 | 44,847 | - | 250 | - | 45,097 |
Philip K. Polkinghorn | 2012 | 37,211 | - | - | 902,738 | 939,949 |
2011 | 40,969 | - | - | - | 40,969 |
2010 | 28,500 | 3,000 | - | - | 31,500 |
(7)
Represents cash-based awards at target subject to a stock price modifier associated with the 2012-2014 LTIP cycle. The awards were subject to achievement of performance measures and vesting. Mr. Polkinghorn left the Company on October 31, 2012. As a result, his Potential Award at Target shown below has been adjusted to reflect his service proration, and his Potential Award at maximum reflects the actual stock price modifier that will be used for his award under the plan rules. Grant date fair value awards at target and maximum are as follows:
| | | |
Name | Award Payout Type | Potential Awards at Target | Potential Awards at Maximum |
James D. Wehr | Cash | $ 1,400,000 | $ 3,150,000 |
Bonnie J. Malley | Cash | 250,000 | 562,500 |
Peter A. Hofmann | Cash | 340,000 | 765,000 |
Edward W. Cassidy | Cash | 280,000 | 630,000 |
Christopher M. Wilkos | Cash | 333,000 | 749,250 |
John T. Mulrain | Cash | 200,000 | 450,000 |
Philip K. Polkinghorn | Cash | 90,278 | 98,782 |
(8)
Represents cash-based awards at target subject to a stock price modifier associated with the 2011-2013 LTIP cycle. The stock price modifier beginning date for the measurement period is different for Mr. Wehr versus all other NEOs. Mr. Wehr’s beginning date is March 2, 2011, whereas the beginning date for all other NEOs is February 11, 2011.The awards were subject to achievement of performance measures and vesting. Mr. Wehr’s award also included a one-time RSU portion, which is not subject to the stock price modifier.
122
(9)
Awards associated with the RSU portion of the 2010-2012 LTIP cycle were subject to achievement of performance measures and vesting. Grant date fair value awards for the RSU portion of the 2010-2012 LTIP cycle reported in the above table are based on target performance. Mr. Polkinghorn left the Company on October 31, 2012. As a result, his Potential Award at Target shown below has been adjusted to reflect his service proration. Potential values at target and actual value earned are as follows:
| | |
Name | Potential Awards at Target | Actual Awards Earned |
James D. Wehr | $ 1,202,500 | $ 530,419 |
Peter A. Hofmann | 275,188 | 121,384 |
Edward W. Cassidy | 259,000 | 114,245 |
Christopher M. Wilkos | 291,375 | 128,524 |
Philip K. Polkinghorn | 264,333 | 116,596 |
The 2010-2012 LTIP cycle also included stock option awards included in column (f).
(10)
Ms. Malley was promoted to Executive Vice President and Chief Financial Officer of the Company, effective November 15, 2012. Pursuant to instruction (4) to Item 402(a)(3), Ms. Malley’s information is only being reflected for 2012, even though she was an NEO in 2011. Ms. Malley was not the CFO in 2011. Mr. Hofmann became Executive Vice President, Strategy and Business Development, effective November 15, 2012.
(11)
Represents the second $150,000 installment of a retention bonus which was paid on February 12, 2010, and $360,000 in guaranteed payments under the Saybrus Partners, Inc. Profit Sharing Plan.
(12)
Includes shares of restricted stock of Saybrus Partners, Inc., a majority owned subsidiary of the Company, granted under the Saybrus Partners, Inc. 2010 Equity Incentive Plan. In 2012, Mr. Cassidy received shares valued at $0; in 2011, Mr. Cassidy received shares valued at $0; and in 2010, Mr. Cassidy received shares valued at $177,000.
(13)
Mr. Cassidy participates in the Saybrus Partners, Inc. Profit Sharing Plan and additional incentive measures based on specific sales and profitability measures related to the Saybrus business segment. The Saybrus 2012 Sales Incentive payment was $335,979, which was paid in 2012 and 2013 in the normal course. Mr. Cassidy will receive $121,000 in 2014, an incentive based on the Phoenix 2012 annuity contribution profitability ratio. The Saybrus Profit Sharing Plan made a preliminary payout for 2012 of $68,640 in 2013, and will make an additional payout for this plan of $66,981 in 2014.
(14)
Mr. Wilkos received $228,521 as a preliminary payout for the 2012 Investment Incentive Plan in 2013, and will receive an additional payout for this plan of $62,521 in 2014. He received a payout of $104,895 in 2014 for the 2012 Annual Incentive Plan.
(15)
Mr. Polkinghorn left the Company effective October 31, 2012. As a result, he received severance, and 4,328 RSUs (his pro-rata portion) from the 2010-2012 LTIP cycle, which converted to shares of Company Common Stock on March 8, 2013. Mr. Polkinghorn will also receive a pro-rata 2012 annual incentive totaling $384,271, a pro-rata portion of the 2011-2013 LTIP cycle award payable in cash totaling $123,555 and a pro-rata portion of the 2012-2014 LTIP cycle award payable in cash when the performance period (2012 and 2013) results are known. His unvested stock options were forfeited.
(16)
Mr. Wehr’s 2012 annual incentive payout was reduced from 63% to 38% of target and Mr. Hofmann’s 2012 annual incentive payout was reduced from 63% to 13%.
Salary and Incentives as a Percentage of Total Compensation
In 2012, the proportion of salary and incentives reflected in columns (c) through (g) of theSummary Compensation Table to total compensation as reflected in column (j) of that table ranged from 52% to 96%. For 2011, it ranged from 69% to 92%. For 2010, it ranged from 73% to 92%.
123
Grants of Plan-Based Awards
The following table supplements the information provided in theSummary Compensation Tableconcerning 2012 awards granted to NEOs, including the range of compensation opportunities under our 2012 annual incentive plans and 2012-2014 LTIP cycle if specified pre-determined performance goals are met.
| | | | | | | | | | | | |
| | | Estimated Future Payouts
Under Non-Equity Incentive Plan Awards(1) | Estimated Future Payouts Under Equity Incentive Plan Awards | All Other Stock Awards: Number of Shares of Stock or Units (i) | All Other Option Awards: Number of Securities Underlying Options (j) | Exercise or Base Price of Option Awards ($/Sh) (k) | Grant Date Fair Value of Stock and Option Awards(3) (l) |
Name (a) | Grant Date (b) | Approval Date | Threshold (c) | Target (d) | Maximum (e) | Threshold (# of shares) (f) | Target (# of shares)(2) (g) | Maximum (# of shares) (h) |
James D. Wehr | 3/8/2012 | 3/8/2012 | $350,000 | $700,000 | $1,400,000 | 28,306 | 56,611 | 127,376 | - | - | $ - | $1,400,000 |
Bonnie J. Malley | 2/29/2012 | 2/29/2012 | 153,000 | 306,000 | 612,000 | 5,055 | 10,109 | 22,746 | - | - | - | 250,000 |
Peter A. Hofmann | 2/29/2012 | 2/29/2012 | 212,500 | 425,000 | 850,000 | 6,874 | 13,748 | 30,934 | - | - | - | 340,000 |
Edward W. Cassidy | 2/29/2012 | 2/29/2012 | -(4) | 631,330(4) | -(4) | 5,661 |
11,322 | 25,475 | - | - | - | 280,000 |
Christopher M. Wilkos | 2/29/2012 | 2/29/2012 | 166,500 | 333,000(5) | 666,000 | 6,672 | 13,344 | 30,024 | - | - | - | 330,000 |
John T. Mulrain | 2/29/2012 | 2/29/2012 | 100,000 | 200,000 | 400,000 | 4,044 | 8,087 | 18,197 | - | - | - | 200,000 |
Philip K. Polkinghorn(6) | 2/29/2012 | 2/29/2012 | 226,042 | 452,083 | 904,166 | 1,826 | 3,651 | 3,998 | - | - | - | 90,278 |
(1)
Except as otherwise noted below, the first line for each NEO represents the incentives under the Annual Incentive Plan for Executive Officers for the 2012 performance period, as described inPerformance Incentive Plan. Awards under this plan are funded when the Company meets established performance thresholds as described in the notes to the 2012 annual incentive plan design table. Actual amounts payable in respect of these awards are included in column (g) of theSummary Compensation Table.
(2)
Represents cash-based awards under the 2012-2014 LTIP cycle, as described inLong-Term Incentive Awards. While subject to a stock price modifier at the end of the three-year cycle, these awards are paid out in cash, but shown above in stock equivalents, based on the December 31, 2012 closing price of $24.73. Mr. Wehr’s award was approved and granted on March 8, 2012. The awards for all other NEOs were approved and granted on February 29, 2012. The stock price modifier for Mr. Wehr and the other NEOs is based upon the original grant measurement date as approved by the Board/Compensation Committee. The stock price modifier measurement period for Mr. Wehr ends on March 8, 2015 and for all other NEOs, March 1, 2015.
(3)
Represents the grant date fair value at target of the performance cash awards described in Note 2 above, pursuant to ASC 718, excluding the effect of estimated forfeitures.
(4)
Represents Mr. Cassidy’s participation in the Saybrus Partners, Inc. Profit Sharing Plan and additional incentive measures. These awards are commission-based, and have no threshold or maximum assigned.
(5)
As described in the Investment Incentive Plan section, 50% of Mr. Wilkos’ annual incentive award for 2012 was determined under the 2012 Investment Incentive Plan and the remaining 50% was determined under the PIP.
(6)
Mr. Polkinghorn left the Company on October 31, 2012. As a result, his Threshold, Target and Maximum amounts shown above have been adjusted for his service proration, and in the case of his Equity Incentive Plan Award, for his stock price modifier as well.
Estimated Future Payouts Under Non-Equity Incentive Plan Awards
The annual incentive awards for NEOs are provided under The Phoenix Companies, Inc. Annual Incentive Plan for Executive Officers. The Annual Incentive Plan for Executive Officers is designed to accomplish the objectives described underAnnual Incentives, and allows us to structure awards in a manner intended to maximize our tax deductions on performance-based pay, if desirable, as described underTax and Accounting Considerations. To accomplish each of these objectives, maximum awards for each NEO must be first determined formulaically as provided in the plan, and then may be reduced to any amount, including zero, based on any factor(s) deemed appropriate by the Compensation Committee. In 2012, the maximum payout opportunity was 200% of target.
See the 2012 annual incentive financial goals and results underPerformance Incentive Plan in the CD&A.
124
Stock Option Plan
In 2001, the Compensation Committee adopted The Phoenix Companies, Inc. Stock Incentive Plan to align the interests of our NEOs and other employees with those of shareholders. This plan allows the Compensation Committee to grant incentive stock options (“ISOs”), which qualify for certain tax advantages as provided under Internal Revenue Code section 422, and non-statutory stock options for the purchase of Common Stock to our employees. Depending on the Company’s incentive design for a given year, stock options may be used as part of the Company’s long-term incentive program. We also use stock option awards to recognize promotions, to reward significant individual contributions or extraordinary efforts that may not be reflected in other incentive plan awards and as part of employment offers for certain positions.
All option awards are granted at the grant date fair market value of our Common Stock on the date the award is approved, or, if later, effective. Generally, all awards are subject to a three-year graded vesting schedule, and recipients have a maximum of 10 years to exercise the option. Upon termination of employment, stock options generally must be exercised within 30 days following termination of employment. In cases of termination due to death, disability or retirement under the Employee Pension Plan, as described in the notes and narrative to thePension Benefitstable, options must be exercised at the earlier of five years from the date of termination of employment or the option’s expiration date. For termination of employment in connection with a qualifying business disposal or divestiture, the Compensation Committee may allow options to be exercised within three years from the date of termination of employment or divestiture. In the case of terminations due to cause, all outstanding options expire immediately. In 2012, the Company did not grant stock option awards as part of its long-term incentive program.
Restricted Stock Unit Plan
In 2003, shareholders approved The Phoenix Companies, Inc. 2003 Restricted Stock, Restricted Stock Unit, and Long-Term Incentive Plan to align the interests of our NEOs and other employees with those of shareholders. The plan allows the Compensation Committee to grant both performance-based incentive awards and service-vested awards. The type of awards granted to NEOs in a given year is determined based on the Company’s compensation philosophy and strategy. In 2012, the Company did not grant restricted stock unit awards as part of its long-term incentive program.
Saybrus Partners, Inc. 2010 Equity Incentive Plan
The Saybrus Partners, Inc. 2010 Equity Incentive Plan is designed to aid Saybrus in attracting and retaining key employees and to more directly align the employees with the success of Saybrus. The plan allows the Saybrus Board to grant both performance-based incentive awards and service-based awards.
Saybrus Partners, Inc. Profit Sharing Plan
The Saybrus Partners, Inc. Profit Sharing Plan, which is a non-qualified plan, is designed to promote the interests of Saybrus by awarding profit sharing performance-based incentive awards and service-based awards. The performance-based awards are currently one-year performance periods and based on the achievement of earnings objectives. The Profit Sharing Plan pays out to individuals who attain a certain annual performance rating specified under the Company performance management program. Mr. Cassidy and other Saybrus principals are allocated a defined percentage of a pool that is funded at 15% of Saybrus EBITDA.
125
Outstanding Equity Awards at Fiscal Year-End
The following table sets forth information concerning stock options and non-vested RSU awards held by the NEOs as of December 31, 2012.
| | | | | | | | | | |
| Option Awards | Stock Awards |
Name (a) | Number of Securities Underlying Unexercised Options Exercisable (b) | Number of Securities Underlying Unexercised Options Unexercisable (c) | Equity Incentive Plan Awards: Number of Securities Underlying Unexercised Unearned Options (d) | Option Exercise Price (e) | Option Grant Date (f) | Option Expiration Date (g) | Number of Shares or Units of Stock That Have Not Vested (1) (10) (h) | Market Value of Shares or Units of Stock That Have Not Vested (2) (i) | Equity Incentive Plan Awards: Number of Unearned Shares, Units or Other Rights That Have Not Vested (j) | Equity Incentive Plan Awards: Market or Payout Value of Unearned Shares, Units or Other Rights That Have Not Vested (2) (k) |
James D. Wehr | 2,288 | 1,145(3) | - | $ 56.80 | 3/8/2010 | 3/8/2020 | 19,689 | $ 486,906 | 17,024(5) | $ 420,998 |
| 2,175 | - | - | 196.80 | 2/13/2008 | 2/13/2018 | | | | |
| 1,741 | - | - | 222.80 | 2/3/2005 | 2/3/2015 | | | | |
| - | 12,500(4) | - | 37.00 | 5/15/2009 | 5/15/2014 | | | | |
| 1,740 | - | - | 211.20 | 1/2/2004 | 1/2/2014 | | | | |
| 580 | - | - | 151.80 | 6/5/2003 | 6/5/2013 | | | | |
Bonnie J. Malley |
378 |
188(3) |
- | $ 56.80 |
3/8/2010 |
3/8/2020 |
3,244 | 80,227 |
- |
- |
| 1,946 | - | - | 196.80 | 2/13/2008 | 2/13/2018 | | | | |
| 1,450 | - | - | 250.80 | 2/8/2007 | 2/8/2017 | | | | |
| 1,160 | - | - | 250.00 | 2/2/2006 | 2/2/2016 | | | | |
| 1,450 | - | - | 211.20 | 1/2/2004 | 1/2/2014 | | | | |
Peter A. Hofmann |
524 |
262(3) |
- |
$ 56.80 |
3/8/2010 |
3/8/2020 | 4,506 | 111,426 |
- |
- |
| 2,702 | - | - | 196.80 | 2/13/2008 | 2/13/2018 | | | | |
| 1,450 | - | - | 250.80 | 2/8/2007 | 2/8/2017 | | | | |
| 2,030 | - | - | 215.60 | 4/29/2004 | 4/29/2014 | | | | |
Edward W. Cassidy |
494 |
246(3) |
- | $ 56.80 |
3/8/2010 |
3/8/2020 |
6,000(6) |
-(9) |
6,000(6) | -(9) |
| 1,450 | - | - | 190.60 | 3/5/2008 | 3/5/2018 | 3,333(7) | -(9) | 2,950(8) | -(9) |
| 2,998 | - | - | 196.80 | 2/13/2008 | 2/13/2018 | 2,950(8) | -(9) | | |
| 870 | - | - | 250.80 | 2/8/2007 | 2/8/2017 | 4,241 | 104,873 | | |
Christopher M. Wilkos | 554 1,374 | 278(3) - | - - | $ 56.80 196.80 | 3/8/2010 2/13/2008 | 3/8/2020 2/13/2018 |
4,771 | 117,981 | -
| -
|
John T. Mulrain |
286 |
144(3) |
- |
$ 56.80 |
3/8/2010 |
3/8/2020 | 2,461 |
60,863 |
- |
- |
Philip K. Polkinghorn |
- |
- |
- |
- |
- |
- | 4,328 | 107,031 |
- |
- |
(1)
Represents the grant of RSUs in connection with the 2010-2012 LTIP cycle, unless otherwise noted. The LTIP cycle is described inLong-Term Incentive.
(2)
Based on the December 31, 2012 closing price of our Common Stock of $24.73.
(3)
Represents the grant of stock options in connection with the Company’s 2010-2012 LTIP cycle awards. One-third of these options vested on March 8, 2011, one-third vested on March 8, 2012, and the remaining options vested on March 8, 2013.
(4)
Represents the grant of performance-based stock options in connection with Mr. Wehr’s appointment to President and CEO in April 2009. These options will vest upon the achievement of the established performance criteria. The exercise price is the closing price of the Company stock on May 15, 2009, adjusted for the reverse stock split. If the performance condition is not met by May 15, 2014, the award will be forfeited.
(5)
Represents a special one-time grant of RSUs subject to the performance criteria of the 2011-2013 LTIP cycle, but not subject to its stock price modifier.
(6)
Represents the grant of Restricted Stock Awards in connection with the Saybrus Partners, Inc. 2012-2014 LTIP cycle, described inLong-Term Incentives. One-third vested on March 15, 2013, one-third will vest on March 15, 2014, and the remaining third will vest on March 15, 2015.
(7)
Represents a one-time grant of Saybrus Restricted Stock Award to Mr. Cassidy awarded March 31, 2011. Half of these Restricted Stock Award vested on March 15, 2013, and the remaining half will vest on March 15, 2014.
(8)
Represents the grant of Saybrus Restricted Stock Award in connection with the Saybrus Partners, Inc. 2010-2012 LTIP cycle described in Long-Term Incentives. These vested on March 15, 2013.
(9)
Based on the December 31, 2012 price of $0.00 for each share of Saybrus Partners, Inc. Restricted Stock.
126
(10)
These figures, which are rounded to the nearest whole number, represent the number of RSUs earned at actual performance relative to the performance target established for each award. Each RSU is convertible into one share of our Common Stock. Under the terms of the Company’s share ownership and retention guidelines, participants are required to retain a fixed percentage of Common Stock underlying these RSUs. In the case of Saybrus Restricted Stock Awards, payouts are currently in cash instead of shares.
Option Exercises and Stock Vested
None of the NEOs exercised any stock options or had any stock awards vest in 2012.
127
Pension Benefits
The following table sets forth information concerning NEO pension benefits. The table reflects the present value of the accumulated pension benefits that each NEO earned between his or her respective hire date and December 31, 2012. Although these figures illustrate the value of these benefits as if they were to be paid in the form of a lump sum payment, actual benefits will be paid in the form of an annuity or, effective January 1, 2009 for SERP benefits, the present value in three annual installments at the applicable commencement date following termination of employment. However, NEOs may elect to receive the portion of the pension benefit payable under the pension equity formula in a lump sum. Additional information concerning these benefits may be found in the narrative that accompanies this table. Benefit accruals were frozen in the Employee Pension Plan and SERPs as of March 31, 2010.
| | | | |
Name | Plan Name (b) | Number of Years Credited Service (1) (c) | Present Value of Accumulated Benefit (2) (d) | Payments During Last Fiscal Year (e) |
James D. Wehr | Employee Pension Plan | | | |
| Pension Equity Formula | 2.75 | $ 89,705 | |
| Formula Prior to July 1, 2007 | 22.83 | 1,274,695 | |
| Total Employee Pension Plan Benefit | 25.58 | $ 1,364,400 | - |
| SERP | | | |
| Pension Equity Formula | 2.75 | $ 314,301 | |
| Formula Prior to July 1, 2007 | 25.83(3) | 7,097,495 | |
| Total SERP Benefit | 28.58 | $ 7,411,796 | - |
Bonnie J. Malley
| Employee Pension Plan | | | |
Pension Equity Formula | 2.75 | $ 89,705 | |
Formula Prior to July 1, 2007 | 22.42 | 1,144,463 | |
Total Employee Pension Plan Benefit | 25.17 | $ 1,234,168 | - |
SERP | | | |
Pension Equity Formula | 2.75 | $ 116,663 | |
Formula Prior to July 1, 2007 | 22.42 | 2,030,308 | |
Total SERP Benefit | 25.17 | $ 2,146,972 | - |
Peter A. Hofmann | Employee Pension Plan | | | |
| Pension Equity Formula | 2.75 | $ 25,630 | |
| Formula Prior to July 1, 2007 | 6.42 | 351,323 | |
| Total Employee Pension Plan Benefit | 9.17 | $ 376,953 | - |
| SERP | | | |
| Pension Equity Formula | 2.75 | $ 32,822 | |
| Formula Prior to July 1, 2007 | 6.42 | 724,131 | |
| Total SERP Benefit | 9.17 | $ 756,953 | - |
Edward W. Cassidy | Employee Pension Plan | | | |
| Pension Equity Formula | 2.75 | $ 12,749 | |
| Formula Prior to July 1, 2007 | 1.25 | 45,631 | |
| Total Employee Pension Plan Benefit | 4.00 | $ 58,380 | - |
| SERP | | | |
| Pension Equity Formula | 2.75 | $ 31,201 | |
| Formula Prior to July 1, 2007 | 1.25 | 139,311 | |
| Total SERP Benefit | 4.00 | $ 170,512 | - |
Christopher M. Wilkos | Employee Pension Plan | | | |
| Pension Equity Formula | 2.75 | $ 36,115 | |
| Formula Prior to July 1, 2007 | 10.33 | 584,838 | |
| Total Employee Pension Plan Benefit | 13.08 | $ 620,953 | - |
| SERP | | | |
Pension Equity Formula | 2.75 | $ 53,158 | |
Formula Prior to July 1, 2007 | 10.33 | 960,196 | |
Total SERP Benefit | 13.08 | $ 1,013,355 | - |
John T. Mulrain | Employee Pension Plan | | | |
| Pension Equity Formula | 0.00(4) | $ - | |
| Formula Prior to July 1, 2007 | 17.75 | 1,158,031 | |
| Total Employee Pension Plan Benefit | 17.75 | $ 1,158,031 | - |
| SERP | | | |
| Pension Equity Formula | 0.00(4) | $ - | |
| Formula Prior to July 1, 2007 | 17.75 | $ 589,120 | |
| Total SERP Benefit | 17.75 | $ 589,120 | - |
128
| | | | |
Name | Plan Name (b) | Number of Years Credited Service(1) (c ) | Present Value of Accumulated Benefit(2) (d) | Payments During Last Fiscal Year (e) |
Philip K. Polkinghorn | Employee Pension Plan | | | |
| Pension Equity Formula | 2.75 | $ 13,980 | |
| Formula Prior to July 1, 2007 | 3.33 | 137,997 | |
| Total Employee Pension Plan Benefit | 6.08 | $ 151,977 | |
| SERP | | | |
| Pension Equity Formula | 2.75 | $ 38,719 | |
| Formula Prior to July 1, 2007 | 3.33 | 527,332 | |
| Total SERP Benefit | 6.08 | $ 566,051 | - |
(1)
In connection with the redesign of our retirement program, the years of credited service were frozen on June 30, 2007 for purposes of determining benefits under the formula in effect prior to July 1, 2007, although final average earnings continued to change through March 31, 2010. The restructuring of the retirement program and the grandfathering provisions are in Retirement Plans. Years of credited service under the pension equity formula of both the Employee Pension Plan and the SERP are determined for eligible participants from July 1, 2007, when such formula went into effect for these participants through March 31, 2010, when the plan was frozen. The annual credit percentage used to calculate these benefits is determined based on total years of service under the plans, including years of service prior to July 1, 2007, as described in Pension Equity Formula.
(2)
With respect to the benefits from the formula in effect prior to July 1, 2007, the Present Value of Accumulated Benefit determined as of December 31, 2012 (March 31, 2010 frozen accrued benefit) is the greater of the present value of the accrued benefit deferred to normal retirement age and the present value of the accrued benefit deferred to early retirement age using the following assumptions for all NEOs: discount rate (without cost of living adjustment, or “COLA”) of 3.98% and 3.81% for the Employee Pension Plan and SERP, respectively; mortality table is the 2012 IRS Static Table; postretirement COLA of 1.00%; if the years of vesting service is equal to or greater than 10 as of December 31, 2012, the normal retirement age is 62 and the early retirement age is 55, but if the years of vesting service is less than 10 as of December 31, 2012, the normal retirement age is 65 and there is no early retirement age.
(3)
Pursuant to the terms of the SERP, Mr. Wehr has been credited with an additional three years of benefit accrual service attributable to the period of January 1, 1997 through December 31, 1999 when he served as an officer of a designated subsidiary that was not an adopting employer to the Employee Pension Plan. These three years are not treated as benefit accrual service under the Employee Pension Plan.
(4)
Pursuant to the grandfathering provisions, Mr. Mulrain declined to participate in the Pension Equity Formula, and his entire benefit through March 31, 2010 is calculated under the Traditional Formula described inRetirement Plans.
Retirement Plans
Effective April 1, 2010, the Employee Pension Plan and SERPs were amended to cease further benefit accruals after March 31, 2010. The discussion that follows reflects how benefits were calculated through March 31, 2010.
Employee Pension Plan
The Employee Pension Plan provided benefits based on its formulas up to the amount allowed under the Internal Revenue Code. The Employee Pension Plan is funded with assets held in a trust. Normal retirement age is 62 with 10 years of vesting service or age 65 with at least five years of participation. As of December 31, 2012, Messrs. Wehr, Wilkos and Mulrain were eligible for early retirement under the plan (age 55 with at least 10 years of vesting service). Unless an optional form of benefit payment is elected, the normal form of benefit is a 50% joint and survivor annuity for married participants and a single life annuity for other participants.
The Employee Pension Plan was redesigned to include pension equity accruals after June 30, 2007, for all participants except grandfathered participants. One of the current NEOs was grandfathered.
129
Pension Equity Formula
The pension equity formula applies to all eligible non-grandfathered employees, grandfathered employees who elected the pension equity formula effective July 1, 2007 and eligible new hires after June 30, 2007 and before April 1, 2010.The pension equity formula expresses an employee’s benefit as a lump sum amount that is equal to the product of the accumulated annual credit percentages (tiered by years of service) times final average earnings (highest five consecutive years of earnings out of the last 10 years). The definition of earnings is based on base salary plus eligible incentives, rather than base salary under the formula prior to July 1, 2007. The tiered annual credit percentages table is as follows:
| |
Years of Service on January 1 | Annual Credit Percentage Earned, Used to Calculate Lump Sum Benefit |
Up to 4 years | 2% |
5 to 9 years | 4% |
10 to 14 years | 6% |
15 to 19 years | 10% |
20 years or more | 14% |
Employees who participate in the pension equity formula have their June 30, 2007 accrued benefit frozen as to years of service, but their final average earnings under the formula prior to July 1, 2007 continued to change until the earlier of March 31, 2010 and the date they either became ineligible under the plan or terminated employment.
Traditional Formula (Formula Prior to July 1, 2007)
The annual normal retirement benefit is generally a function of years of service and compensation, i.e., 2% of final average earnings (average of last three consecutive years of base salary) times years of benefit accrual service up to 25, plus 1% times final average earnings times years of benefit accrual service over 25 (up to 10 years), minus 2% times participant’s projected primary insurance amount (Social Security benefit payable at Social Security retirement age) times years of benefit accrual service (up to 25). No more than 50% of normal retirement benefit is offset by Social Security.
SERPs
The SERPs provide benefits in excess of the Employee Pension Plan, whether due to the benefit limitations imposed by the Internal Revenue Code or the exclusion of compensation other than base salary under the Employee Pension Plan. To comply with the full implementation of Internal Revenue Code section 409A as of January 1, 2009, the SERPs were amended to de-link the choice of the normal and optional forms of distribution from the Employee Pension Plan and all participants are required to delay receipt of benefit payments until at least six months after their separation from service. The Traditional Formula permits distributions in actuarially equivalent annuity payments or short-term installment payments; the Pension Equity Formula permits distributions in actuarially equivalent annuity payments or a lump sum payment.
Pension Equity Formula
Retirement benefits are based on the pension equity formula contained in the Employee Pension Plan, described in the preceding section, and are expressed as a lump sum amount that is equal to the product of the accumulated annual credit percentages (tiered by years of service) times final average earnings (highest five consecutive years of earnings out of the last 10 years), without the Internal Revenue Code limitations/exclusions noted in the preceding paragraph. The definition of earnings is based on base salary plus eligible incentives.
Traditional Formula (Formula Prior to July 1, 2007)
Retirement benefits are based on the final pay formula in effect prior to July 1, 2007 under the Employee Pension Plan, described in the preceding section, and are a function of years of service and final average compensation, without the Internal Revenue Code limitations/exclusions noted in the Employee Pension Plan. The definition of earnings includes amounts payable under designated incentive programs that are excluded from the calculation of benefits under the Employee Pension Plan; and the final average earnings determination for these incentives is based on the average of any three full calendar years within the last seven consecutive full calendar years that produce the highest average.
130
Non-Qualified Deferred Compensation
The following table sets forth information concerning NEO participation in deferred compensation plans, excluding the 401(k) Plan. The table includes 2012 compensation deferrals, Company contributions, earnings, withdrawal activity, total balances as of December 31, 2012 for cash deferrals and the portion of the aggregate balances as of December 31, 2012 that have been reported in prior years’Summary Compensation Tables.
| | | | | | | |
Name (a) | Deferral Type | Executive Contributions in 2012(1) (b) | Company Contributions in 2012(2) (c ) | Aggregate Earnings in 2012(3) (d) | Aggregate Withdrawals/ Distributions (e) | Aggregate Balance as of December 31, 2012 (f) | Portion of Aggregate Balance at December 31, 2012 Reported in Prior SCTs (g) |
James D. Wehr | Excess Investment Plan | $ 67,500 | $ 64,058 | $ 70,837 | $ - | $ 651,462 | $ 477,204 |
Bonnie J. Malley | Excess Investment Plan | 13,587 | 14,215 | 13,216 | - | 125,647 | 27,169 |
Peter A. Hofmann | Excess Investment Plan | 10,500 | 19,425 | 13,049 | - | 178,979 | 105,025 |
Edward W. Cassidy | Excess Investment Plan | 9,600 | 9,600 | 32,775 | - | 243,155 | 34,650 |
| Deferred RSUs | - | - | (5,010) | - | 13,967 | - |
| Deferred Dividend Equivalents | - | - | 84 | - | 5,499 | - |
Christopher M. Wilkos | Excess Investment Plan | 7,200 | 13,288 | 8,096 | - | 76,106 | 44,535 |
John T. Mulrain | Excess Investment Plan | 6,600 | 13,772 | 3,920 | - | 59,139 | - |
Philip K. Polkinghorn | Excess Investment Plan | 16,532 | 17,969 | 86,974 | - | 762,084 | 545,353 |
Total | $ 131,519 | $ 152,327 | $ 223,941 | $ - | $ 2,116,037 | $ 1,233,936 |
(1)
Except as noted otherwise, these figures represent voluntary deferrals of 2012 salary into the Excess Investment Plan as described in the following narrative. The corresponding salary figures in theSummary Compensation Tableinclude these deferral amounts.
(2)
These figures represent the 2012 non-qualified Company matching and annual discretionary contributions made in the Excess Investment Plan and reported in the All Other Compensation column of theSummary Compensation Table.
(3)
Represents the change in account value between December 31, 2011 and December 31, 2012, less any executive or Company contributions, plus any account distributions. With respect to deferred RSUs, these figures reflect the change in account value attributable to appreciation/depreciation in our Common Stock price. With respect to deferred dividend equivalents, these figures reflect the dividend equivalents attributable to deferred RSUs and the value of interest credits paid thereon.
The Phoenix Companies, Inc. Non-Qualified Excess Investment Plan
Certain of our employees, including our NEOs, can elect to defer up to 60% of their base pay. Base pay deferrals commence when year-to-date base pay exceeds the Internal Revenue Code limitation on qualified plan compensation, which was $250,000 in 2012. With respect to base pay deferrals only, we make a corresponding Company match credit using the same formula as provided in our 401(k) Plan. For the NEOs, they are eligible for a Company match contribution in the 401(k) Plan and Excess Investment Plan, based on tiered years of service as described in the following table:
| | |
Years of Service on
January 1 | Company Match Formula for All NEOs | Maximum
Company Match Rate
as a Percentage of
Base Pay |
Up to 4 years | 100% on first 3% of pay saved; 50% on next 3% | 4.5% |
5 to 9 years | 100% on first 6% of pay saved | 6.0% |
10 to 14 years | 100% on first 3% of pay saved; 150% on next 3% | 7.5% |
15 years or more | 150% on first 6% of pay saved | 9.0% |
Based on these schedules, the maximum Company match rate for 2012, as a percentage of base pay for our NEOs, was:
| |
Name | Maximum Company Match Rate |
James D. Wehr | 9.0% |
Bonnie J. Malley | 9.0% |
Peter A. Hofmann | 7.5% |
Edward W. Cassidy | 6.0% |
Christopher M. Wilkos | 7.5% |
John T. Mulrain | 9.0% |
Philip K. Polkinghorn | 6.0% |
All employees, including the NEOs, whose base pay exceeded the Internal Revenue Code limitation on qualified plan compensation, were also eligible to receive an employer discretionary contribution, which, if paid, was deposited into the employees’ accounts. This employer discretionary contribution was eliminated for the 2012 plan year and thereafter.
131
The Excess Investment Plan provides participants with a choice of mutual fund offerings similar to those funds made available to employees under the 401(k) Plan. There are no above-market or guaranteed returns in the Excess Investment Plan. Participants can modify their investment elections at any time under the Excess Investment Plan. Deferrals are credited to the funds selected by the participants and based on the market price for such funds on the date such compensation would otherwise have been paid.
The following table sets forth the list of the mutual fund choices under the Excess Investment Plan and each fund’s total return for 2012.
| | | |
Name of Fund | 2012 Total Return Percentage (1) | Name of Fund | 2012 Total Return Percentage (1) |
Allianz NFJ Small Cap Value Fund Administrative Class | 4.61 | Fidelity Freedom K® 2055 Fund | 15.39 |
Allianz NFJ Small Cap Value Fund Institutional Class (2) | 10.79 | Fidelity Freedom K® Income Fund | 6.36 |
American Beacon Short Term Bond Fund Institutional Class | 3.15 | Fidelity® Contrafund® - Class K | 16.40 |
American Beacon Stephens Small Cap Growth Fund Institutional Class (3) | 16.23 | Fidelity® Growth Company Fund | 20.03 |
American Funds EuroPacific Growth Fund Class R-5 | 9.15 | Fidelity® Growth Company Fund - Class K(6) | 18.69 |
American Funds EuroPacific Growth Fund Class R-6 (4) | 19.64 | Fidelity® Low-Priced Stock Fund - Class K | 18.66 |
American Funds New Perspective Fund Class R-5 | 13.55 | Fidelity® Money Market Trust Retirement Money Market Portfolio | 0.01 |
American Funds New Perspective Fund Class R-6 (5) | 21.19 | Fidelity® U.S. Bond Index Fund | 7.67 |
Artisan Mid Cap Fund Investor Class | 19.52 | MFS Value Fund Class R4(7) | 16.42 |
Eaton Vance Large-Cap Value Fund Class A | 12.45 | Sentinel Small Company Fund Class I | 9.54 |
Fidelity Freedom K® 2000 Fund | 6.44 | Spartan® 500 Index – Institutional Class | 15.96 |
Fidelity Freedom K® 2005 Fund | 8.77 | Spartan® U.S. Bond Index Fund – Investor Class(8) | 0.87 |
Fidelity Freedom K® 2010 Fund | 10.53 | Spartan® U.S. Bond Index Fund – Fidelity Advantage Class(9) | 4.17 |
Fidelity Freedom K® 2015 Fund | 10.81 | Virtus Mid-Cap Value Fund Class A | 8.03 |
Fidelity Freedom K® 2020 Fund | 11.86 | Virtus Multi-Sector Fixed Income Fund Class A | 9.45 |
Fidelity Freedom K® 2025 Fund | 13.26 | Virtus Multi-Sector Short Term Bond Fund Class A | 6.43 |
Fidelity Freedom K® 2030 Fund | 13.65 | Virtus Real Estate Securities Fund Class I | 16.80 |
Fidelity Freedom K® 2035 Fund | 14.60 | Virtus Multi-Sector Short Term Bond Fund Class I(10) | 9.66 |
Fidelity Freedom K® 2040 Fund | 14.61 | Virtus Mid-Cap Value Fund Class I(11) | 13.69 |
Fidelity Freedom K® 2045 Fund | 14.97 | Virtus Multi-Sector Fixed Income Fund Class I(12) | 14.46 |
Fidelity Freedom K® 2050 Fund | 15.23 | | |
(1)
Total return includes change in share value and reinvestment of dividends and capital gains, if any.
(2)
Plan balances from the Allianz NFJ Small Cap Value Fund Administrative Class were merged into this fund on August 7, 2012.
(3)
Plan balances from the Sentinel Small Company Fund Class I were merged into this fund on November 23, 2012.
(4)
Plan balances from the American Funds EuroPacific Growth Fund Class R-5 were merged into this fund on August 7, 2012.
(5)
Plan balances from the American Funds New Perspective Fund Class R-5 were merged into this fund on August 7, 2012.
(6)
Plan balances from the Fidelity ® Growth Company Fund were merged into this fund on April 4, 2012.
(7)
Plan balances from the Eaton Vance Large-Cap Value Fund Class A were merged into this fund on August 7, 2012.
(8)
Fidelity ® U.S. Bond Index Fund changed name to this fund on April 28, 2012.
(9)
Spartan ® U.S. Bond Index Fund – Investor class changed name to this fund on February 12, 2012.
(10)
Plan balances from the Virtus Multi-Sector Short Term Bond Fund Class A were merged into this fund on August 7, 2012.
(11)
Plan balances from the Virtus Mid-Cap Value Fund Class A were merged into this fund on August 7, 2012.
(12)
Plan balances from the Virtus Multi-Sector Fixed Income Fund Class A were merged into this fund on August 7, 2012.
132
Account balances under the Excess Investment Plan, reflecting cumulative appreciation/depreciation and interest credits (depending on the investment fund(s) chosen by the participant), are paid to participants, based on their election made prior to deferral, in lump sum or annual installments following the termination of services with the Company or such earlier specified date elected by the participant. In-service withdrawals may only be taken in the case of severe financial hardship caused by an unforeseeable emergency as permitted under Internal Revenue Code section 409A, and any other applicable laws. Loans are not permitted under this plan. All balances under this plan are unfunded general obligations of the Company, which the Company, at its discretion, may hedge in full or in part by making contributions to a trust subject to the claims of our creditors in certain circumstances. Currently, we hedge 100% of this obligation by making investments in the same funds and in the same amounts as participants have elected.
RSU Deferrals
Certain employees of the Company, including the NEOs, may elect to defer up to 100% of their equity LTIP awards, and other RSU awards until following termination of employment or such earlier specified date elected by the participant, if the deferral opportunity is offered by the Company. Participants do not have any voting rights with respect to deferred RSUs. Voting rights become applicable only when the RSUs convert to Common Stock following termination of employment or in the event the Company chooses to hedge its RSU obligations by holding Common Stock in a Rabbi trust subject to the claims of creditors in certain circumstances. Deferred RSUs were credited with dividend equivalents, which are equal to the cash dividends that the Company may have paid on its Common Stock, multiplied by the number of shares of Common Stock underlying each deferred RSU. Dividend equivalents were credited to a book entry account on behalf of participants. These dividend equivalents accrued interest credits at a rate determined and updated each August 1, based on the mid-term applicable federal rate (as determined under Internal Revenue Code section 1274(d)) as published by the Internal Revenue Service for the immediately preceding month. Accumulated dividend equivalents and the corresponding interest credits are paid at the same time that the underlying RSUs convert to Common Stock. We have stopped crediting dividend equivalents and interest in RSUs. All RSUs, dividend equivalents, and interest credits under this program are unfunded general obligations of the Company, for which the Company, at its discretion, may hedge in full or in part by making contributions to a Rabbi trust subject to the claims of our creditors in certain circumstances.
Change-in-Control Agreements and Severance
We have entered into certain agreements and maintain certain plans that will require us to provide compensation to the NEOs in the event of a termination of employment, including termination of employment in connection with a Change-in-Control. The amounts payable to each NEO are estimated in the tables provided in this section. No incremental benefits are provided under these programs in the event of a voluntary termination by the NEO without good reason or by the Company for cause.
In 2011, the Company conducted a comprehensive review of its Change-in-Control Agreements that were effective in 2012 and 2013 and severance. The results of the review are set forth inChange-in-Control Agreements.
Upon termination of employment, all NEOs will receive their vested benefits under the Employee Pension Plan and 401(k) Plan; benefits and conversion rights under the Consolidated Omnibus Budget and Reconciliation Act (“COBRA”), if applicable; and the non-qualified plans’ benefits pursuant to the terms of the plans. See thePension Benefitstable and theNon-Qualified Deferred Compensationtable.
Change-In-Control Agreements
The new agreements replaced prior agreements and reduced the benefits that have previously been available. The protections provided under the agreements can only be triggered by termination of employment either (i) by the Company for reasons other than death, disability (as defined in the agreements), Cause or retirement, or (ii) by the executive for good reason, provided such termination occurs following, or is effectively connected with, the occurrence of a Change-in-Control. These agreements each have an initial term of two years with provisions for automatic renewals for successive one-year periods, unless either party provides to the other party written notice at least 60 days prior to the end of the initial term or any renewal term that the Company or NEO does not want the term so extended. These agreements do not provide the right of any participant to receive a tax gross-up in respect of any parachute payments.
133
Generally, the change-in-control agreements entered into with our NEOs provide:
·
no gross-up for excise tax purposes in that the aggregate value of Covered Payments, as defined in the agreement, is limited to an amount equal to 2.99 times the NEO’s average annual compensation calculated in accordance with Internal Revenue Code section 280G;
·
non-compete restrictions for executives determined by the Compensation Committee and, in the case of our CEO, the Board for a period of up to 18 months and in consideration provide for a lump sum payment of the salary and target bonus opportunity that would have been paid or made available over a corresponding period of continued employment;
·
in lieu of severance benefits payable under other plans, severance benefits are calculated at a multiple of 1.0 or 2.0 times salary and target annual incentive for NEOs;
·
a protection period running from 90 to 180 days before a change-in-control and two years following a change-in-control;
·
welfare benefits for a period equivalent to the applicable Internal Revenue Code section 409A period following a termination after a change-in-control;
·
that unvested SERP benefits become vested;
·
outplacement services commensurate with the NEO’s position;
·
non-solicitation restrictions;
·
an amount equal to a pro-rata portion of the annual incentive award earned for the year in which termination occurs (or target incentive, if greater) and a pro-rata portion of long-term awards for each then open cycle at target;
·
vesting of benefits under equity compensation plans; and
·
a two-year term with automatic renewals for successive one-year periods unless either party provides prior written notice.
Based on the 2011 review of change-in-control agreements by the Compensation Committee and the Board, the change-in-control agreements entered into with our NEOs effective January 1, 2012 with an expiration date of December 31, 2013 provide:
·
for the elimination of the additional service credit under the Company’s defined benefit pension plans because the pension plans have been frozen since April 1, 2010;
·
that unvested stock options are subject to double trigger vesting provisions wherein both a change in control and an executive’s termination of employment within certain prescribed periods must occur for the stock options to vest;
·
that, with respect to the determination of performance-based long-term incentive awards, where a change in control occurs after the performance period but before the vesting date, the pro rata award payments will be based on the actual results, not the target amount; and
·
that, for those executives who are subject to non-compete covenants, outplacement services will be provided for a period of up to 12 months following the end of the non-compete period, limited pursuant to Internal Revenue Code section 409A requirements.
These agreements terminate automatically upon the NEO’s death, termination due to disability (as defined in the agreements), termination for Cause or voluntary retirement. In such cases, the Company will pay, pursuant to payroll practice and the terms of the applicable plans and programs, the NEO’s base salary through the date of termination; any vested amounts or benefits under applicable employee benefit plans, agreements and programs, as well as any accrued vacation pay not yet paid; and any other benefits payable in such situation under the plans, agreements, policies or programs of the Company.
134
The 2012-2014 agreements expired on December 31, 2013 and have been replaced by new agreements effective January 1, 2014.
Executive Severance Allowance Plans
Effective January 1, 2009, The Phoenix Companies, Inc. Executive Severance Allowance Plan (“Phoenix Executive Severance Allowance Plan”) was amended and restated. The Phoenix Executive Severance Allowance Plan is available to all Company officers at the level of senior vice president or higher (including Messrs. Wehr, Wilkos, Hofmann and Mulrain and Ms. Malley), and for any other employee the CEO determines to be integral to the formulation or execution of our business strategy. Mr. Cassidy is a participant in the Saybrus Partners, Inc. Executive Severance Allowance Plan (“Saybrus Executive Severance Plan”), effective January 1, 2010, which is described below.
In 2012, if an NEO, except for Mr. Cassidy, was involuntarily terminated, subject to certain exceptions, he would have been eligible to receive (i) a payment equal to between 75% and 150%, determined based on years of service, of the NEO’s severance base amount, where the “severance base amount” is defined as the NEO’s base salary and the average of the last two annual incentive awards already paid as of the termination date, paid in the form of a lump sum payment or in installments, in each case commencing as soon as practicable following separation from service; (ii) a pro-rata portion of the annual incentive awards earned for the fiscal year in which he separated from service to be paid no later than March 15 of the calendar year following separation from service; (iii) outplacement services; and (iv) continued active participant rates in the medical and dental plans for 12 months of the COBRA continuation period, if the executive elects coverage under COBRA.
The Saybrus Executive Severance Allowance Plan provides for benefits to certain executives of Saybrus, who meet the eligibility requirements when their employment is involuntarily terminated by Saybrus. The Severance Amount equals (a) the executive’s Base Salary for the one-year period prior to the executive’s separation date plus (b) the two-year average of the executive’s Saybrus annual variable compensation amount and profit sharing plan amount for the immediate two years prior to the executive’s separation date. The plan also provides for outplacement services and continued active participant rates in the medical and dental plans for 12 months of the COBRA continuation period, if the executive elects coverage under COBRA.
Benefits are paid from the Company’s or Saybrus’ general assets, as applicable, and are conditioned on a number of factors, including covenants within the terms of the plans and the signing of an agreement containing certain covenants (described below) and a release of claims against the Company or Saybrus, as applicable. The plans condition receipt of benefits on (i) refraining from interfering with ongoing operations and making disparaging remarks concerning the Company or Saybrus, as applicable, its representatives, agents and employees; (ii) refraining from solicitation of employees, agents, representatives and/or clients of the Company or Saybrus, as applicable; (iii) returning all Company or Saybrus property, as applicable; and (iv) complying with maintaining the confidentiality of confidential and proprietary information. Failure to comply with any of these covenants/conditions will cause immediate cessation of all payments under the plan and the executive must immediately reimburse the Company or Saybrus, as applicable, for all payments previously made.
All severance payments due under the plans are to be paid no later than March 15 of the calendar year following separation from service, except for any payments that are required to be paid at a later date pursuant to Internal Revenue Code section 409A. Also seeChange-in-Control Agreementsand Severance. An employee who is covered by a change-in-control agreement and an Executive Severance Allowance Plan can receive only the benefits of one of the coverages in the event of a termination.
135
Illustrations of Compensation and Benefits upon Termination of Employment for Various Reasons
The following table summarizes the value of the compensation and benefits that the NEOs would have received if their employment had been involuntarily terminated (other than for Cause) as of December 31, 2012 other than following the occurrence of a Change-in-Control.
| | | | | | |
Payments for Involuntary Termination |
| James D. Wehr | Bonnie J. Malley | Peter A. Hofmann | Edward W. Cassidy | Christopher M. Wilkos | John T. Mulrain |
Severance |
Base Salary Component | $ 1,050,000 | $ 577,500 | $ 425,000 | $ 410,000 | $ 493,333 | $ 540,000 |
Annual Incentive Component | 1,204,125 | 541,620 | 501,500 | 237,382 | 623,970 | 327,844 |
Other Compensation |
2012 Annual Incentive (1) | 264,600 | 192,780 | 53,550 | 592,600 | 395,937 | 126,000 |
2012-2014 LTIP Cycle (2) | 267,011 | 46,759 | 63,593 | 52,370 | 61,722 | 37,407 |
2011-2013 LTIP Cycle (3) | 845,714 | 97,879 | 133,116 | 109,625 | 129,201 | 78,303 |
2010-2012 LTIP Cycle (4) | 486,906 | 80,227 | 111,426 | 104,873 | 117,981 | 60,863 |
SUBTOTAL | $ 4,118,357 | $ 1,536,766 | $ 1,288,185 | $ 1,506,850 | $ 1,822,144 | $ 1,170,418 |
Benefits and Perquisites |
Health & Welfare(5) | 12,913 | 12,817 | 12,913 | 12,913 | 12,841 | 8,860 |
Outplacement | 9,895 | 9,895 | 9,895 | 9,895 | 9,895 | 9,895 |
TOTAL | $ 4,141,165 | $ 1,559,478 | $ 1,310,993 | $ 1,529,658 | $ 1,844,880 | $ 1,189,173 |
(1)
Reflects actual payout results for 2012 incentive.
(2)
Represents prorated 2012 portion of 2012-2014 LTIP cycle at target, with stock price modifier calculated as of December 31, 2012. Payout would be adjusted for actual results and paid out as soon as administratively practicable upon final determination of actual results.
(3)
Represents prorated 2011 and 2012 portions of 2011-2013 LTIP cycle at actual performance, with stock price modifier calculated as of December 31, 2012.
(4)
Represents actual results for the RSU portion of 2010-2012 LTIP cycle per the plan provisions, reflecting value as of December 31, 2012. Stock options associated with the 2010-2012 LTIP cycle had no value as of December 31, 2012.
(5)
Reflects estimated Company cost of continuing to subsidize certain health and welfare benefits for the NEOs for one year.
For the value of the compensation and benefits that Mr. Polkinghorn received when he left the Company or will receive after the completion of the restatement, see Note 15 to theSummary Compensation Table.
The following table summarizes the value of the compensation and benefits that the NEOs would have received if their employment had been terminated involuntarily (other than for Cause) or if the NEO had terminated employment for Good Reason in connection with a Change-in-Control as of December 31, 2012.
| | | | | | |
Change-in-Control Payments |
| James D. Wehr | Bonnie J. Malley | Peter A. Hofmann | Edward W. Cassidy | Christopher M. Wilkos | John T. Mulrain |
Severance |
Base Salary Component | $ 700,000(8) | $ 770,000 | $ 425,000(8) | $ 820,000 | $ 740,000 | $ 720,000 |
Annual Incentive Component | 700,000 | 612,000 | 425,000 | 1,262,660 | 666,000 | $ 400,000 |
Other Compensation |
2012 Annual Incentive | $ 700,000 | $ 306,000 | $ 425,000 | $ 631,330 | $ 333,000 | $ 200,000 |
2012-2014 LTIP Cycle (1) (2) | 267,011 | 46,759 | 63,593 | 52,370 | 61,722 | 37,407 |
2011-2013 LTIP Cycle (2) (3) | 845,714 | 97,879 | 133,116 | 109,625 | 129,201 | 78,303 |
2010-2012 LTIP Cycle (2) (4) | 486,906 | 80,227 | 111,426 | 104,873 | 117,981 | 60,863 |
Other Performance-Contingent RSUs (2) | - | - | - | - | - | - |
Other Performance-Contingent Stock Options (2) | - | - | - | - |
- |
- |
Unvested Service-Based RSUs (2) | - | - | - | - |
-
|
- |
Unvested Stock Options (2) | - | - | - | - | - | - |
Provision for Restrictive
Covenants (5) | 2,100,000 | - | 1,275,000 | - |
- |
- |
Incremental Non-Qualified Pension Lump Sum Value (6) | - | - | - | 68,205 |
- |
- |
280G Cut-Back | (922,015) | (324,088) | - | (182,840) | (264,666) | (446,796) |
SUBTOTAL | $ 4,877,616 | $ 1,588,777 | $ 2,858,135 | $ 2,866,223 | $ 1,783,238 | $ 1,049,777 |
Benefits and Perquisites |
Health & Welfare (7) | $ 25,826 | $ 25,634 | $ 25,826 | $ 25,826 | $ 25,682 | $ 17,720 |
Outplacement | 9,895 | 9,895 | 9,895 | 9,895 | 9,895 | 9,895 |
TOTAL | $ 4,913,337 | $ 1,624,306 | $ 2,893,856 | $ 2,901,944 | $ 1,818,815 | $ 1,077,391 |
(1)
Represents prorated 2012 portion of 2012-2014 LTIP cycle at target.
136
(2)
All LTIP and RSU amounts are valued based on the December 31, 2012 closing price of our Common Stock of $24.73 per share. Stock options reflect the spread value between the exercise price and $24.73 for any options vesting upon a Change-in-Control. Stock price modifiers reflect the 30-day average as of December 31, 2012.
(3)
Represents prorated 2011 and 2012 portions of 2011-2013 LTIP cycle at actual performance.
(4)
Represents actual results for the RSU portion of the 2010-2012 LTIP cycle.
(5)
Represents payments related to non-compete restrictions contained in certain NEOs’ Change-in-Control agreements.
(6)
Reflects the incremental value of the additional pension benefits calculated based on each NEO’s Change-in-Control agreement and the corresponding, applicable pension formula.
(7)
Reflects estimated Company cost of continuing to subsidize certain health and welfare benefits for the NEOs for at least two years.
(8)
Mr. Wehr’s and Mr. Hofmann’s Base Salary Component reflects one times annual base salary, whereas all other NEOs reflect two times annual base salary. Mr. Wehr and Mr. Hofmann would also receive financial consideration for restrictive covenants equivalent to three times annual base salary (see Provision for Restrictive Covenants row under Other Compensation).
Definitions
“Cause” is defined as:
(i)
the Executive’s conviction or plea of nolo contendere to a felony (other than with respect to a traffic violation or an incident of vicarious liability);
(ii)
an act of willful misconduct (including, without limitation, a willful material violation of the Company’s Code of Conduct) on the Executive’s part with regard to the Company or its affiliates having a material adverse impact on the Company or its affiliates; or
(iii)
the Executive’s failure in good faith to attempt or refusal to perform legal directives of the Board or executive officers of the Company, as applicable, which directives are consistent with the scope and nature of the Executive’s employment duties and responsibilities and which failure or refusal is not remedied by the Executive within 30 days after notice of such non-performance is given to the Executive. For purposes of clause (ii) of this definition, no act, or failure to act, on the Executive’s part shall be deemed “willful” unless done, or omitted to be done, by the Executive not in good faith and without reasonable belief that the Executive’s act, or failure to act, was in the best interest of the Company and its subsidiaries.
“Change-in-Control” is defined as the first occurrence of:
(i)
any person acquires “beneficial ownership” (within the meaning of Rule 13d-3 under the Securities Exchange Act of 1934, as amended), directly or indirectly, of securities of the Company representing 25% or more of the combined voting power of the Company’s securities;
(ii)
within any 24-month period, the persons who were directors of the Company at the beginning of such period (the “Incumbent Directors”) shall cease to constitute at least a majority of the Board or the board of directors of any successor to the Company; provided that any director elected or nominated for election to the Board by a majority of the Incumbent Directors then still in office shall be deemed to be an Incumbent Director for purposes of this sub clause (ii);
(iii)
the effective date of any merger, consolidation, share exchange, division, sale or other disposition of all or substantially all of the assets of the Company which is consummated (a “Corporate Event”), if immediately following the consummation of such Corporate Event the shareholders of the Company immediately prior to such Corporate Event do not hold, directly or indirectly, a majority of the voting power, in substantially the same proportion as prior to such Corporate Event, of (x) in the case of a merger or consolidation, the surviving or resulting corporation or (y) in the case of a division or a sale or other disposition of assets, each surviving, resulting or acquiring corporation which, immediately following the relevant Corporate Event, holds more than 25% of the consolidated assets of the Company immediately prior to such Corporate Event;
(iv)
the approval by shareholders of the Company of a plan of liquidation with respect to the Company; or
(v)
any other event occurs which the Board declares to be a Change-in-Control.
137
“Good Reason” is defined as the occurrence after the effective date of a Change-in-Control of any of the following, without the express written consent of the executive and which occurrence is not remedied by the Company within 30 days after notice of such occurrence is given to the Company:
(i)
the material reduction in the executive’s title, position, duties or responsibilities from the title, position, duties or responsibilities held or exercised by the executive prior to the effective date of a Change-in-Control;
(ii)
any requirement by the Company that the executive change the location where the executive regularly provides services to the Company to a location that is more than 35 miles from downtown Hartford;
(iii)
a reduction by the Company of the executive’s base salary or total incentive compensation opportunity or a reduction in the employee benefits provided to the executive under the Company’s employee benefit plans (unless the executive is provided with substantially equivalent replacement benefits); or
(iv)
any failure to obtain the assumption and agreement to perform the Change-in-Control Agreement by a successor as contemplated in the Change-in-Control Agreement.
138
DIRECTOR COMPENSATION
Director Compensation Philosophy
The Company’s philosophy with respect to Board compensation is to:
·
provide competitive levels of pay to attract and retain a high quality Board
·
differentiate compensation based on workload
·
align Board members’ compensation with shareholder interests by requiring share ownership for all directors
Elements of Director Compensation
For 2012, Board compensation for our Non-Employee Directors consisted of a flat retainer of $125,000 per year for each Non-Employee Director, an additional retainer for the independent Chairman of $85,000, additional retainers to all committee chairs, except the Chair of the Executive Committee, and a meeting fee in the amount of $1,500 per meeting for attendance at each Board and/or Committee meeting held in excess of the number of meetings anticipated for any calendar year. The schedule of additional annual retainers is as follows:
| |
Committee Position | 2012 Additional
Annual Retainer |
Chairs of the Audit and Compensation Committees | $20,000 |
Chairs of the Finance and Governance Committees | $15,000 |
All retainers were paid quarterly in advance. Both retainers and meeting fees are paid in cash (either current or deferred), but Non-Employee Directors may elect to defer all or a portion of their cash retainers and fees into RSUs under the Company’s Directors Equity Deferral Plan. Non-Employee Directors also have the option to defer receipt of cash compensation into investment options available under the Company’s Directors Cash Deferral Plan. The following is a description of our nonqualified deferred compensation programs for our Non-Employee Directors:
·
Non-Employee Directors may elect to defer all or a portion of their cash compensation into RSUs under The Phoenix Companies, Inc. Directors Equity Deferral Plan. The number of RSUs credited upon deferral, including fractional RSUs, is equal to the cash amount that would otherwise be paid, divided by the closing price of our Common Stock on the date of payment (generally, the first business day of each calendar quarter). The Common Stock underlying each RSU, together with a cash payment equal to the cumulative dividend equivalents and interest, will be paid to directors following his or her termination of services as a director with the Company or, in certain circumstances, such earlier specified date elected by the director. All RSUs, dividend equivalents, and interest credits under this Plan are unfunded general obligations of the Company, for which the Company, at its discretion, may hedge in full or in part by making contributions to a trust.
·
Non-Employee Directors may elect to defer all or a portion of their cash compensation under The Phoenix Companies, Inc. Directors Cash Deferral Plan. This Plan provides directors with the same choice of mutual fund offerings provided to employee participants in The Phoenix Companies, Inc. Non-Qualified Excess Investment Plan. See the fund listing under the Non-Qualified Deferred Compensation table. Directors can modify their investment elections at any time under the Plan. Deferrals are credited to the funds selected by the participants and based on the market price for such funds on the date such compensation would otherwise have been paid (generally, the first business day of each calendar quarter). Account balances under the Plan, reflecting cumulative appreciation/depreciation, dividends and interest credits (depending on the investment fund(s) chosen by the director) are paid to directors, based on the election made at the time of deferral, in lump sum or annual installments following the termination of services with the Company or, in certain circumstances, such earlier specified date elected by the director. All balances credited under this program are unfunded general obligations of the Company, for which the Company, at its discretion, may hedge in full or in part by making contributions to a trust. The Company currently hedges 100% of this obligation by making investments in the same funds and in the same amounts as participants have elected.
The Company also offers $100,000 of life insurance to each director, including our CEO who serves as a member of the Board. The cost to the Company of providing this insurance is nominal. Each director may also participate in a matching charitable gift program to qualified educational and other charitable institutions. Currently, the maximum match for each director is $2,500. Directors can also recommend that the Company make a grant of up to $2,000 annually to an eligible charitable organization chosen by the director.
139
Share Ownership Guidelines and Restrictions on Trading
The Board has established share ownership guidelines for each director to accumulate shares of our Common Stock (including, for these purposes, RSUs) equal to three times the director annual retainer. Each Non-Employee Director must hold such stock until the end of his or her service as a director. The accumulation period to reach the guidelines for those directors who were Board members on July 12, 2012 is December 31, 2015. Future new members of the Board must satisfy the guidelines within five years of joining the Board. These guidelines were revised in 2012 from a share-based minimum to a value-based minimum, resulting in additional shares being needed to meet the guidelines. As of December 31, 2013, seven of our eight Non-Employee Directors had met the target ownership level.
The Company’s policy on insider trading permits directors to engage in transactions involving the Company’s equity securities only (1) during “trading windows” of limited duration following the issuance of periodic earnings releases and following a determination by the Company that the director is not in possession of material non-public information or (2) pursuant to a Company-approved Rule 10b5-1 plan. In addition, the Company has the ability under its insider trading policy to suspend trading by directors in its equity securities.
Director Compensation Review
The Compensation Committee is required by its charter to review Board compensation every two years. Board compensation was reviewed by the Compensation Committee in 2012 based on an analysis conducted by management. This analysis was also reviewed by the Committee’s compensation consultant. Market data utilized in the review is from the National Association of Corporate Directors (“NACD”) Director Compensation Report: 2010-2011. This report reflects practices of 1,400 companies from 24 industries, with revenues of $50 million and up.
Management also referenced data from a set of 13 smaller public insurance companies.
| |
Company Name |
American Equity Investment Life Holding Company | Life Partners Holdings, Inc. |
Citizens, Inc. | National Western Life Insurance Company |
CNO Financial Group, Inc. | Presidential Life Corporation |
Delphi Financial Group, Inc. (1) | Protective Life Corporation |
FBL Financial Group, Inc. | StanCorp Financial Group, Inc. |
Independence Holding Company | Torchmark Corporation |
Kansas City Life Insurance Company | |
(1)
Delphi was acquired by Tokio Marine Holdings, Inc. in 2012.
In its competitive review, the Compensation Committee took into account the following factors:
·
Total compensation per director relative to market
·
Aggregate cost of board compensation
·
Mix of board fees and committee fees
·
Share ownership guidelines
·
Deferred compensation
As a result of this review, the Board approved the current director compensation package with no changes, effective January 1, 2013.
·
a flat retainer of $125,000 per year for each Non-Employee Director
·
an additional retainer for the independent Chairman of $85,000
·
additional retainers to all committee chairs, except the Chair of the Executive Committee:
| |
Committee Position | 2012 Additional Annual Retainer |
Chairs of the Audit and Compensation Committees | $20,000 |
Chairs of the Finance and Governance Committees | $15,000 |
·
a meeting fee in the amount of $1,500 per meeting for attendance at each Board and/or Committee meeting held in excess of the number of meetings anticipated for any calendar year
140
Director Summary Compensation Table
The following table sets forth information concerning the 2012 compensation of our Non-Employee Directors.
| | | |
Name | Fees Earned or Paid in Cash(1) | All Other Compensation(2) | Total |
Martin N. Baily | $ 126,500(3)(9) | $ 2,410 | $ 128,910 |
Arthur P. Byrne | 126,500 (3)(9) | 2,762 | 129,262 |
Sanford Cloud, Jr. | 146,500(3)(4)(9) | 6,169 | 152,669 |
Gordon J. Davis | 126,500(9) | 6,875 | 133,375 |
John H. Forsgren | 141,500(3)(5)(9) | 2,304 | 143,804 |
Ann Maynard Gray | 141,500(3)(6)(9) | 4,136 | 145,636 |
Thomas S. Johnson | 211,500(7)(9) | 6,043 | 217,543 |
Augustus K. Oliver, II | 125,000(3) | 2,013 | 127,013 |
Arthur F. Weinbach | 146,500(3)(8)(9) | 5,234 | 151,734 |
(1)
The following table sets forth information concerning the 2012 RSUs voluntarily elected to be received in lieu of cash (as described in Note 3 below) and the total outstanding RSU awards held by the Non-Employee Directors as of December 31, 2012:
| | |
Name | Number of RSUs Received in 2012 in lieu of Cash(a)(b) | Total Number of RSUs Outstanding(a) |
Martin N. Baily | 1,748 | 6,478 |
Arthur P. Byrne | 3,497 | 12,911 |
Sanford Cloud, Jr. | 2,023 | 7,199 |
Gordon J. Davis | 0 | 3,756 |
John H. Forsgren | 977 | 8,432 |
Ann Maynard Gray | 782 | 5,548 |
Thomas S. Johnson | 0 | 11,189 |
Augustus K. Oliver, II | 3,428 | 11.329 |
Arthur F. Weinbach | 4,045 | 15,478 |
(a)
These figures are rounded to the nearest whole share.
(b)
Reflects the 2012 deferred RSUs described in Note 3 below.
(2)
Represents amounts paid by the Company for life insurance premiums and charitable gifts, as applicable. No tax gross-up is paid on this benefit.
(3)
These directors elected to convert all or a portion of their cash compensation into deferred RSUs (as reflected in Note 1 above), subject to the same terms and conditions as their other RSUs. These RSUs were expensed and accounted for pursuant to ASC 718
(4)
Includes $20,000 in retainer for service as chair of the Compensation Committee.
(5)
Includes $15,000 in retainer for service as chair of the Finance Committee.
(6)
Includes $15,000 in retainer for service as chair of the Governance Committee.
(7)
Includes $85,000 in retainer for service as the independent Chairman.
(8)
Includes $20,000 in retainer for service as chair of the Audit Committee.
(9)
Includes $1,500 in additional meeting fees.
Item 12.
Security Ownership of Certain Beneficial Owners and Management and Related Stockholder Matters
INFORMATION ON STOCK OWNERSHIP
Directors and Executive Officers
The table below shows the beneficial ownership of our Common Stock by each director, and by each Named Executive Officer in theSummary Compensation Table of this Annual Report on Form 10-K for the fiscal year ended December 31, 2012. Unless otherwise indicated in a note, each person listed in the table owns the shares shown directly with sole voting and investment power. Except as noted in Note 1 below, all holdings are stated as of January 3, 2014.
The table also details ownership of restricted stock units (“RSUs”) whose conversion into shares is not contingent upon any performance-based criteria, including RSUs elected to be received in lieu of cash and RSUs elected or required to be deferred until following termination of employment. For information about RSUs, see column (h) of theOutstanding Equity Awards at Fiscal Year-Endtable. Since neither the directors nor the officers have power to vote the shares underlying their RSUs (unless the shares underlying the RSUs are held in a Rabbi trust) or power to sell, transfer or encumber their RSUs (except in
141
some cases, for transfers to immediate family members or to a trust for those members’ benefit), for purposes of this table, no RSU is counted as beneficially owned by such director or officer.
| | | | | | | | | | | |
Name of Beneficial Owner | Shares
Beneficially
Owned(1)(2) | Options
Exercisable
Within 60
Days(1)(3) | Restricted
Stock Units(1)(4) | Total(1)(5) | Percentage ofCommon
Stock(6) |
Martin N. Baily | | 10,820 | — | | — | | | 10,820 | * |
Arthur P. Byrne | | 26,909 | — | | — | | | 26,909 | * |
Sanford Cloud, Jr. | | 12,022 | — | | — | | | 12,022 | * |
Gordon J. Davis | | 5,023 | — | | — | | | 5,023 | * |
John H. Forsgren | | 9,072 | — | | — | | | 9,072 | * |
Ann Maynard Gray | | 7,671 | | | — | | | 7,671 | * |
Augustus K. Oliver, II | | 16,102 | — | | — | | | 16,102 | * |
Arthur F. Weinbach | | 19,938 | — | | — | | | 19,938 | * |
Edward W. Cassidy | | 9,636(7) | 6,058 | | 565 | | | 16,259 | * |
Peter A. Hofmann | | 9,457(8) | 6,968 | | — | | | 16,425 | * |
Bonnie J. Malley | | 11,537(9) | 5,122 | | — | | | 16,659 | * |
John T. Mulrain | | 2,647(10) | 430 | | — | | | 3,077 | * |
James D. Wehr | | 29,256(11) | 19,849 | | 17,024(15) | | | 66,129 | 1.15 |
Christopher M. Wilkos | | 8,954(12) | 2,206 | | — | | | 11,160 | * |
Philip K. Polkinghorn(16) | | 11,683(13) | 10,233 | | — | | | 21,916 | * |
All directors, director nominees and
executive officers as a group (15 people) | | 179,044(14) | 42,633 | | 17,589 | | 239,266 | | 4.17% |
(1)
With the exception of Mr. Polkinghorn, all holdings are stated as of January 3, 2014, and are rounded to the nearest whole number. Mr. Polkinghorn’s holdings are stated as of October 31, 2012, which is the date he left the Company as reflected on the latest Form 4 filed with the SEC on May 8, 2012 and other information available to the Company.
(2)
In the case of the executive officers, the figures include share equivalents held in the 401(k) Plan. In the case of the directors, the figures include vested RSUs with associated shares of common stock held in a Rabbi trust with pass through voting rights.
(3)
Reflects the number of shares that could be acquired under options exercisable within 60 days ofJanuary 3, 2014.
(4)
Reflects those RSUs outstanding whose conversion into shares is not contingent upon any performance-based criteria. Except as noted in Note 2 above, directors and officers do not have the power to vote the shares underlying the RSUs.
(5)
Represents the sum of the total shares beneficially owned, the shares underlying options exercisable within 60 days of January 3, 2014 and the shares into which the RSUs will be converted if the applicable service-based conditions for vesting and issuance are met.
(6)
Reflects, as a percentage of our outstanding Common Stock (5,741,156 shares as of January 3, 2014), the total of the first two columns.
(7)
Includes 4,773 share equivalents held in the 401(k) Plan.
(8)
Includes 2,190 share equivalents held in the 401(k) Plan.
(9)
Includes 3,298 share equivalents held in the 401(k) Plan.
(10)
Includes 593 share equivalents held in the 401(k) Plan.
(11)
Includes 4,438 share equivalents held in the 401(k) Plan.
(12)
Includes 2,367 share equivalents held in the 401(k) Plan.
(13)
Includes 68 share equivalents held in the 401(k) Plan.
(14)
Includes 17,727 share equivalents held in the 401(k) Plan.
(15)
These RSUs were not vested as of January 3, 2014.
(16)
Mr. Polkinghorn’s numbers are not reflected in the total row (last row in the table).
142
Certain Shareholders
The following table lists the beneficial owners known to the Company as of February 14, 2014 of more than five percent of our Common Stock. In furnishing the information below, the Company has relied on information filed with the SEC by the beneficial owners reflecting beneficial ownership as of December 31, 2012.
| | |
Name and Address of Beneficial Owner | Amount and Natureof
BeneficialOwnership | Percentage of
Common Stock |
Dimensional Fund Advisors LP
Palisades West, Building One
6300 Bee Cave Road
Austin, TX 78746 | 360,513(1) | 6.22%(1) |
BlackRock, Inc. 40 East 52nd Street New York, NY 10022 | 350,958(2) | 6.10%(2) |
Toscafund Asset Management LLP
90 Long Acre, 7th Floor
London, England WC2E 9RA | 345,724(3) | 6.02%(3) |
State Farm Mutual Automobile Insurance Company and related entities
One State Farm Plaza
Bloomington, IL 61710 | 296,598(4) | 5.20%(4) |
(1)
Based on a Schedule 13G/A filed with the SEC on February 10, 2014 by Dimensional Fund Advisors LP (“Dimensional”). The filing discloses that as of December 31, 2013, Dimensional had sole investment and voting powers with regard to 350,883 shares of our Common Stock, sole dispositive power with regard to 360,513 shares of our Common Stock and specifies that all of these shares are owned by investment companies to which Dimensional serves as investment advisor and certain other commingled group trusts and separate accounts to which Dimensional serves as investment manager.
(2)
Based on Schedule 13G/A filed with the SEC on January 30, 2014 by BlackRock, Inc. (“BlackRock”). The filing discloses that as of December 31, 2013, BlackRock had sole investment and voting powers with regard to 336,563 shares of our Common Stock and sole dispositive power with respect to 350,958 shares of our Common Stock.
(3)
Based on a Schedule 13F filed with the SEC on February 14, 2014 by Toscafund Asset Management LLP (“Tosca Management”). The filing discloses that as of December 31, 2013, Tosca Management had sole voting power with respect to 345,724 shares of our Common Stock and sole dispositive power with respect to 345,724 shares of our Common Stock.
(4)
Based on a Schedule 13G filed with the SEC on February 13, 2014 by State Farm Mutual Automobile Insurance Company (“State Farm”). The filing discloses that as of December 31, 2013, (i) State Farm had sole voting and dispositive powers with regard to 294,095 shares of our Common Stock; and (ii) State Farm Investment Management Corp. had shared voting and dispositive powers with respect to 2,503 shares of our Common Stock.
Securities Authorized for Issuance Under Equity Compensation Plans
The following table sets forth information as of the end of the Company’s 2012 fiscal year with respect to compensation plans under which equity securities of the Company are authorized for issuance. In connection with the 1-for-20 reverse stock split effective August 10, 2012, outstanding stock option and RSU awards were modified through the reduction of the number of stock options and RSUs by the reverse split factor of 1-for-20 and the adjustment of the stock option exercise prices for existing awards. For each award outstanding, the aggregate intrinsic value of the award immediately after the modification was the same as the aggregate intrinsic value immediately before the modification. The modifications were structured to preserve the value of the awards upon completion of the reverse stock split and, accordingly, resulted in no additional compensation cost. For RSU purposes only, we continued the use of fractional shares and rounded up stock options. As such, unless noted otherwise, the figures listed in the table below and the accompanying footnotes reflect the status of our equity compensation plans after these modifications were made.
143
| | | | | | |
| (A) | (B) | (C) |
| Number of securities to be issued upon exercise of outstanding options, warrants and rights | Weighted-average issue price of outstanding options, warrants and rights(1) | Number of securities remaining available for future issuance under equity compensation plans, excluding securities reflected in Column (A) |
Plan Category |
|
Equity compensation plans
approved by the Company’s
shareholders: | | | | | | |
– 2003 Restricted Stock,
Restricted Stock Unit and
Long-Term Incentive Plan (2) | 89,313 | (3) | N/A | | 50,232 | |
Equity compensation plans not
approved by the Company’s
shareholders: | | | | | | |
– Stock Incentive Plan (4) | 103,689 | (5) | $169.83 | | 115,734 | |
– Directors Stock Plan (6) | — | | N/A | | 24,187 | |
Total plans not approved by
shareholders | 103,689 | | $169.83 | | 139,921 | |
Total | 193,002 | | $169.83 | | 190,153 | |
(1)
Does not take RSUs into account.
(2)
A copy of the 2003 Restricted Stock, Restricted Stock Unit and Long-Term Incentive Plan was filed as Exhibit 10.22 to our first quarter 2008 Form 10-Q filed by the Company with the SEC on May 8, 2008.
(3)
This figure consists of the shares underlying 17,024 RSUs that vest over time, and 72,289 RSUs that are subject to no contingencies (but which are not currently convertible).
(4)
A copy of the Stock Incentive Plan was filed as Exhibit 10.2 to the first quarter 2008 Form 10-Q filed by the Company with the SEC on May 8, 2008. The first amendment to the Stock Incentive Plan was filed as Exhibit 10.2 to our 2008 Annual Report on Form 10-K filed by the Company with the SEC on March 5, 2009. The following summary of the material features of the plan is qualified in its entirety by reference to the full text of the plan, which is hereby incorporated by reference.
Under the Company’s Stock Incentive Plan, the Compensation Committee (or if the committee delegates such authority to the CEO) (the “Committee”) may grant stock options to officers and employees of the Company and its subsidiaries. The maximum number of shares issuable under the plan with respect to officers and employees of the Company other than Phoenix Investment Partners, Ltd. (now Virtus Investment Partners, Inc., which was spun off by the Company on December 31, 2008, and hereinafter “Virtus”),(including those who are also employees, officers or directors of Virtus and those individuals who were officers or employees of the Company on April 17, 2000) is the aggregate of 5% (approximately 5.25 million prior to adjustment for the spin-off of Virtus) of the shares outstanding on June 26, 2001 (approximately 105 million shares) reduced by the shares issuable pursuant to options or other awards granted under the Company’s Directors Stock Plan and, with respect to officers and employees of Virtus (other than those officers, employees or insurance agents described above), 1% (approximately 1.05 million prior to adjustment for the spin-off of Virtus) of the shares outstanding on June 26, 2001. During any five-year period, no participant may be granted options in respect of more than 5% of the shares available for issuance under the plan. The Board may terminate or amend the plan, but such termination or amendment may not adversely affect any outstanding stock options without the consent of the affected participant. The plan will continue in effect until it is terminated by the Board or until no more shares are available for issuance.
The exercise price per share subject to an option will be not less than the fair market value of such share on the option’s grant date. Each option will generally become exercisable in equal installments on each of the first three anniversaries of the grant date, except that no option may be exercised after the tenth anniversary of its grant date. Options may not be transferred by the grantee, except in the event of death or, if the Committee permits, the transfer of non-qualified stock options by gift or domestic relations order to the grantee’s immediate family members. Upon a grantee’s death, any outstanding options previously granted to such grantee will be exercisable by the grantee’s designated beneficiary until the earlier of the expiration of the option or five years following the grantee’s death. If the grantee terminates employment by reason of disability or retirement, any outstanding option will continue to vest as if the grantee’s service had not terminated and the grantee may exercise any vested option until the earlier of five years following termination of employment or the expiration of the option. If the grantee’s employment is terminated for cause, the grantee will forfeit any outstanding options. If the grantee’s employment terminates in connection with a divestiture of a business unit or subsidiary or similar transaction, the Committee may provide that all or some outstanding options will continue to become exercisable and may be exercised at any time prior to the earlier of the expiration of the term of the options and the third anniversary of the grantee’s termination of service. If the grantee terminates employment for any other reason, any vested options held by the grantee at the date of termination will remain exercisable for a period of 30 days and any then unvested options will be forfeited.
Generally, upon a change of control (as defined in the plan), each outstanding option will become fully exercisable. Alternatively, the Committee may: (i) require that each option be canceled in exchange for a payment in an amount equal to the excess, if any, of the price paid in connection with the change of control over the exercise price of the option; or (ii) if the Committee determines in good faith that the option will be honored or assumed by, or an alternative award will be issued by, the acquirer in the change of control, require that each option remain outstanding without acceleration of vesting or exchanged for such alternative award.
(5)
This figure consists of the shares which underlie the options issued under the Stock Incentive Plan (79,895 of which are fully vested, 11,294 of which are subject to vesting with the passage of time and 12,500 of which are subject to performance contingencies).
(6)
A copy of the Directors Stock Plan was filed as Exhibit 10.6 to the 2008 Form 10-Q filed by the Company on May 8, 2008. The following summary of the material features of the plan is qualified in its entirety by reference to the full text of the plan, which is hereby incorporated by reference.
144
(7)
Under the Directors Stock Plan, the Board of Directors may grant options to outside directors, provided that the aggregate number of shares issuable pursuant to options will not exceed 0.5% of the total shares outstanding on June 26, 2001, or 26,242 shares. Each option entitles the holder to acquire one share of our Common Stock at the stated exercise price. The exercise price per share will not be less than the fair market value of a share on the day such option is granted and the option will be exercisable from the day the option is granted until the earlier of the tenth anniversary of such grant date or the third anniversary of the day the outside director ceases to provide services for the Company. Under the Directors Stock Plan, the Board of Directors may require the outside directors to receive up to one-half of their directors fees in shares instead of cash and the outside directors may elect to receive any portion of such fees in shares instead of cash. The aggregate number of shares that may also be issued in lieu of cash fees may not exceed 26,202 shares, bringing the total available under this plan to 52,444 shares.
Item 13.
Certain Relationships and Related Transactions and Director Independence
Director Independence
A majority of the directors of the Board must meet the criteria for independence established by the Board in accordance with the NYSE rules. Under these rules, a director will not qualify as independent unless the Board affirmatively determines that the director has no material relationship with the Company. As permitted by the NYSE rules, the Governance Committee has recommended, and the Board has adopted, a set of categorical standards (the “Categorical Independence Standards”) to assist the Board in making independence determinations. These Categorical Independence Standards may be found on our web site atwww.phoenixwm.com, in the Investor Relations section, under the heading “Corporate Governance.” In March 2013, the Governance Committee and the Board evaluated the independence of each director other than our Chief Executive Officer (“CEO”), who is a Company employee, in accordance with the provisions of the Categorical Independence Standards and the NYSE rules. As a result of this evaluation, the Governance Committee has recommended, and the Board has affirmatively determined, that all members of the Board other than the CEO, including all directors standing for election, are independent under both the Categorical Independence Standards and the NYSE rules.
Certain Relationships and Related Person Transactions
On November 2, 2006, the Board adopted a written Policy Regarding Transactions with Related Persons (the “Related Person Policy”). The Related Person Policy provides that any Related Person (as defined by Item 404(a) of Regulation S-K) must promptly report to the Company’s General Counsel any direct or indirect material interest in any transaction that is reportable by the Company in its Proxy Statement pursuant to Item 404(a) of Regulation S-K (each, a “Related Person Transaction”), that is, any transaction in which the Company was or is to be a participant, the amount involved exceeds $120,000 and any Related Person had or will have a direct or indirect material interest. No Related Person Transaction may be consummated or shall continue without the approval or ratification of the Audit Committee and any director that is a party to a Related Person Transaction shall recuse himself or herself from any such vote.
State Farm Mutual Automobile Insurance Company (“State Farm”) beneficially owns more than five percent of our outstanding Common Stock. In 2012, our subsidiaries incurred total compensation of $2.3 million to entities which were either subsidiaries of State Farm or owned by State Farm employees, for the sale of our insurance and annuity products. During 2012, Phoenix Life Insurance Company (“Phoenix Life”) made payments of $2.3 million to State Farm entities for this compensation.
Director Sanford Cloud, Jr., Esq. is a member of Ironwood Mezzanine Management LLC (“IMM”), which is the general partner of Ironwood Mezzanine Fund LP (“Ironwood”), a mezzanine debt fund, and Ironwood Capital Advisors LLC (“ICA”), which is the investment advisor to Ironwood. For his services as a member of IMM and ICA, Mr. Cloud receives an annual fee of $25,000. He also has equity interests in both IMM and ICA. Phoenix Life is an investor in, and limited partner of, Ironwood. During 2012, Phoenix Life funded $1,031,168 of pre-existing commitments to Ironwood; however, Phoenix Life did receive $2,168,513 as return of capital and $3,280 as return on sums previously invested.
All Related Person Transactions have been approved or ratified by the Audit Committee in compliance with the Related Person Policy. The Board has determined that Mr. Cloud is independent under the Categorical Independence Standards and the NYSE rules.
145
Item 14.
Principal Accounting Fees and Services
The Board has a policy to assure the independence of its independent registered public accounting firm. Prior to each fiscal year, the Audit Committee receives a written report from PwC describing the elements expected to be performed in the course of its audit of the Company’s financial statements for the coming year. The Audit Committee may approve the scope and fees not only for the proposed audit, but also for various recurring audit-related approval of the Company’s Chief Financial Officer or Chief Accounting Officer. The Audit Committee may pre-approve the requested service as long as it is not a prohibited non-audit service and the performance of such service would be consistent with all applicable rules on auditor independence. The Audit Committee may also delegate pre-approval authority to one or more of its members. For services of its independent registered public accounting firm that are neither audit-related nor recurring, a Company vice president may submit in writing a request to the Company’s internal auditor, accompanied by approval of the Company’s Chief Financial Officer or chief accounting officer. The Audit Committee may pre-approve the requested service as long as it is not a prohibited non-audit service and the performance of such service would be consistent with all applicable rules on auditor independence. The Audit Committee may also delegate pre-approval authority to one or more of its members.
All services performed for us by PwC in 2012 and 2011 were pre-approved by the Audit Committee pursuant to the policy described above.
The services performed by PwC in 2012 and 2011 are described below. PwC does not provide any services to us prohibited under applicable laws and regulations. To the extent PwC provides us with consulting services, those services are closely monitored and controlled by both management and the Audit Committee to ensure that their nature and extent do not interfere with PwC’s independence. The independence of PwC is also considered annually by our Board.
Fees in 2012 primarily relate to additional fees associated with the restatement of the Company’s financial statements billed and accrued in 2012, 2013 and 2014. Amounts recorded within the 2012 financial statements were $4,426,433.
| | | | | |
PwC Fees: | 2012 | | 2011 |
| | | | | |
Audit fees (1) | $ | 61,422,825 | | $ | 2,923,162 |
Audit-related fees (2) | | 9,797 | | | 60,500 |
Tax fees | | — | | | — |
All other fees (3) | | 2,672 | | | 2,429 |
Total fees | $ | 61,435,294 | | $ | 2,986,091 |
———————
(1)
Amounts represent fees for the annual audits of our financial statements and internal controls, reviews of our financial statements for interim periods, audits of statutory and other regulatory filings and audits of our internal control over financial reporting. In addition, these amounts include fees for consents and other assistance related to documents filed with the Securities and Exchange Commission.
(2)
Amounts represent fees for employee benefit plan audits, control reviews, and the performance of agreed-upon procedures.
(3)
Amounts represent fees for research and regulatory reporting compliance software.
146
PART IV
Item 15.
Exhibits, Financial Statement Schedules
(a)
Documents filed as part of this Annual Report on Form 10-K include:
1.
Financial Statements. The financial statements listed in Part II of the Table of Contents to this Annual Report on Form 10-K are filed as part of this Annual Report on Form 10-K;
2.
Financial Statement Schedules. All financial statement schedules are omitted as they are not applicable or the information is shown in the consolidated financial statements or notes thereto; and
3.
Exhibits. The exhibits listed under the caption “Exhibit Index” herein are filed as part of this Annual Report on Form 10-K. Exhibit numbers 10.1 through 10.52 are management contracts or compensatory plans or arrangements.
In reliance upon Item 601(b)(4)(iii) of Regulation S-K, we hereby give notice that, in connection with the filing of this Annual Report on Form 10-K, we do not intend to file as exhibits copies of our instruments with respect to long-term debt where the total amount of securities authorized thereunder does not exceed 10% of the total assets of the Company and its subsidiaries on a consolidated basis. We hereby agree to furnish a copy of any such instrument to the SEC upon request.
147
SIGNATURES
Pursuant to the requirements of Section 13 or 15(d) of the Securities Exchange Act of 1934, the Registrant has duly caused this report to be signed on its behalf by the undersigned, thereunto duly authorized.
| | | | |
| | | THE PHOENIX COMPANIES, INC. |
| | | (Registrant) |
| | | |
Dated: | March 31, 2014 | | By: | /s/ James D. Wehr |
| | | James D. Wehr |
| | | President and Chief Executive Officer |
| | | (Principal Executive Officer) |
| | | |
Dated: | March 31, 2014 | | By: | /s/ Bonnie J. Malley |
| | | Bonnie J. Malley |
| | | Executive Vice President and Chief Financial Officer |
| | | (Principal Financial Officer) |
| | | |
Dated: | March 31, 2014 | | By: | /s/ Douglas C. Miller |
| | | Douglas C. Miller |
| | | Senior Vice President and Chief Accounting Officer |
| | | (Principal Accounting Officer) |
Pursuant to the requirements of the Securities Exchange Act of 1934, this report has been signed below, dated March 31, 2014, by the following persons on behalf of the Registrant and in the capacities indicated.
| | | |
* | | | * |
Martin N. Baily, Director | | | Ann Maynard Gray, Director |
| | | |
* | | | * |
Arthur P. Byrne, Director | | | Augustus K. Oliver, II, Director |
| | | |
* | | | * |
Sanford Cloud, Jr., Director | | | Arthur F. Weinbach, Director |
| | | |
* | | | /s/ James D. Wehr |
Gordon J. Davis, Director | | | James D. Wehr, Director |
| | | |
* | | | |
John H. Forsgren, Chairman | | | |
| | | |
*By: /s/ John T. Mulrain | | | |
John T. Mulrain | | | |
Attorney-in-Fact | | | |
148
Report of Independent Registered Public Accounting Firm
To the Board of Directors and Stockholders of
The Phoenix Companies, Inc.
In our opinion, the accompanying consolidated balance sheets and the related consolidated statements of comprehensive income, changes in stockholders’ equity, and cash flows present fairly, in all material respects, the financial position of The Phoenix Companies, Inc. and its subsidiaries at December 31, 2012 and 2011, and the results of their operations and their cash flows for each of the three years in the period ended December 31, 2012 in conformity with accounting principles generally accepted in the United States of America. Also in our opinion, the Company did not maintain, in all material respects, effective internal control over financial reporting as of December 31, 2012, based on criteria established inInternal Control - Integrated Framework(1992) issued by the Committee of Sponsoring Organizations of the Treadway Commission (COSO) because material weaknesses existed at that date. The material weaknesses included deficiencies in the period-end financial reporting process including the processing of journal entries and the preparation and review of account reconciliations, insufficient complement of personnel with a level of accounting knowledge commensurate with the Company’s financial reporting requirements and ineffective monitoring and review activities.
The above material weaknesses also contributed to the following material weaknesses in internal control over financial reporting. The Company did not maintain effective controls over:
(1) actuarial finance and valuation, including (i) controls to review and approve assumptions and methodologies used in the determination of actuarially derived insurance policy liability estimates, (ii) controls to appropriately measure actuarially derived balances for its fixed indexed annuity products, (iii) controls over key actuarial spreadsheets and certain key reports to ensure the reliability of data, assumptions and valuation calculations, and (iv) controls over the application of U.S. GAAP to universal life reserves,
(2) certain investment processes, including (i) controls over the recognition and measurement of impaired investments, (ii) controls over the recognition and measurement of certain elements of net investment income as well as identifying embedded derivatives related to structured securities , (iii) controls over internally priced securities, including private placement debt and equity securities, (iv) controls over classification in the fair value hierarchy disclosure, (v) controls to properly recognize and measure counterparty non-performance risk on non-collateralized derivatives, (vi) controls over determining the appropriate accounting method for limited partnerships or for determining the appropriate accounting for investee transactions,
(3) complex reinsurance treaties, including controls to analyze, document and review the U.S. GAAP accounting for such transactions at inception,
(4) valuation of pension assets and liabilities, including management and oversight of third party vendors and controls to ensure census data was complete and accurate,
(5) completeness and accuracy of taxable income reporting for limited partnerships and other investments, including controls to ensure complete and accurate taxable information is utilized in the Company’s measurements of income taxes related to limited partnership and other investments,
(6) presentation of cash and cash flows, including controls over preparation and review of classification of activity in the statement of cash flows and cash and related balances in the balance sheet, and
(7) information technology general controls related to restricted access, including controls to grant remove and review access to ensure appropriate segregation of duties and restricted access to programs and data.
F-1
A material weakness is a deficiency, or a combination of deficiencies, in internal control over financial reporting, such that there is a reasonable possibility that a material misstatement of the annual or interim financial statements will not be prevented or detected on a timely basis. The material weaknesses referred to above are described in Management's Annual Report on Internal Control over Financial Reporting appearing under Item 9A. We considered these material weaknesses in determining the nature, timing, and extent of audit tests applied in our audit of the 2012 consolidated financial statements and our opinion regarding the effectiveness of the Company’s internal control over financial reporting does not affect our opinion on those consolidated financial statements. The Company's management is responsible for these financial statements, for maintaining effective internal control over financial reporting and for its assessment of the effectiveness of internal control over financial reporting included in management's report referred to above. Our responsibility is to express opinions on these financial statements, and on the Company's internal control over financial reporting based on our integrated audits. We conducted our audits in accordance with the standards of the Public Company Accounting Oversight Board (United States). Those standards require that we plan and perform the audits to obtain reasonable assurance about whether the financial statements are free of material misstatement and whether effective internal control over financial reporting was maintained in all material respects. Our audits of the financial statements included examining, on a test basis, evidence supporting the amounts and disclosures in the financial statements, assessing the accounting principles used and significant estimates made by management, and evaluating the overall financial statement presentation. Our audit of internal control over financial reporting included obtaining an understanding of internal control over financial reporting, assessing the risk that a material weakness exists, and testing and evaluating the design and operating effectiveness of internal control based on the assessed risk. Our audits also included performing such other procedures as we considered necessary in the circumstances. We believe that our audits provide a reasonable basis for our opinions.
As discussed in Note 2 to the consolidated financial statements, the Company has restated its 2011 and 2010 consolidated financial statements to correct errors.
As discussed in Note 2 to the consolidated financial statements, as of January 1, 2012, the Company retrospectively adopted the amended accounting guidance for costs incurred by insurance companies that can be capitalized in connection with acquiring or renewing insurance contracts.
A company’s internal control over financial reporting is a process designed to provide reasonable assurance regarding the reliability of financial reporting and the preparation of financial statements for external purposes in accordance with generally accepted accounting principles. A company’s internal control over financial reporting includes those policies and procedures that (i) pertain to the maintenance of records that, in reasonable detail, accurately and fairly reflect the transactions and dispositions of the assets of the company; (ii) provide reasonable assurance that transactions are recorded as necessary to permit preparation of financial statements in accordance with generally accepted accounting principles, and that receipts and expenditures of the company are being made only in accordance with authorizations of management and directors of the company; and (iii) provide reasonable assurance regarding prevention or timely detection of unauthorized acquisition, use, or disposition of the company’s assets that could have a material effect on the financial statements.
Because of its inherent limitations, internal control over financial reporting may not prevent or detect misstatements. Also, projections of any evaluation of effectiveness to future periods are subject to the risk that controls may become inadequate because of changes in conditions, or that the degree of compliance with the policies or procedures may deteriorate.
/S/ PricewaterhouseCoopers LLP
Boston, Massachusetts
March 31, 2014
F-2
THE PHOENIX COMPANIES, INC.
Consolidated Balance Sheets
($ in millions, except share data)
December 31, 2012 and 2011
| | | | | |
| 2012 | | 2011 |
| | | As restated |
| | | and amended |
ASSETS: | | | | | |
Available-for-sale debt securities, at fair value (amortized cost of $11,718.0 and $11,267.0) | $ | 12,656.0 | | $ | 11,797.0 |
Available-for-sale equity securities, at fair value (cost of $27.5 and $32.6) | | 34.8 | | | 35.7 |
Limited partnerships and other investments | | 577.3 | | | 565.3 |
Policy loans, at unpaid principal balances | | 2,354.7 | | | 2,379.3 |
Derivative instruments | | 157.4 | | | 162.2 |
Fair value investments | | 201.5 | | | 184.0 |
Total investments | | 15,981.7 | | | 15,123.5 |
Cash and cash equivalents | | 246.4 | | | 168.2 |
Accrued investment income | | 170.3 | | | 175.6 |
Receivables | | 666.5 | | | 648.6 |
Deferred policy acquisition costs | | 902.2 | | | 1,119.2 |
Deferred income taxes, net | | 49.4 | | | 120.6 |
Other assets | | 243.1 | | | 230.1 |
Discontinued operations assets | | 53.7 | | | 85.3 |
Separate account assets | | 3,316.5 | | | 3,816.9 |
Total assets | $ | 21,629.8 | | $ | 21,488.0 |
| | | | | |
LIABILITIES: | | | | | |
Policy liabilities and accruals | $ | 12,656.7 | | $ | 12,631.4 |
Policyholder deposit funds | | 3,040.7 | | | 2,432.2 |
Dividend obligations | | 1,003.6 | | | 752.5 |
Indebtedness | | 378.8 | | | 426.9 |
Other liabilities | | 674.6 | | | 658.0 |
Discontinued operations liabilities | | 48.4 | | | 74.4 |
Separate account liabilities | | 3,316.5 | | | 3,816.9 |
Total liabilities | | 21,119.3 | | | 20,792.3 |
| | | | | |
COMMITMENTS AND CONTINGENCIES (NOTES 23, 24 & 25) | | | | | |
| | | | | |
STOCKHOLDERS’ EQUITY: | | | | | |
Common stock, $.01 par value: 5.7 million and 5.8 million shares outstanding (1) | | 0.1 | | | 1.3 |
Additional paid-in capital | | 2,633.1 | | | 2,630.5 |
Accumulated other comprehensive loss | | (249.3) | | | (230.7) |
Accumulated deficit | | (1,697.2) | | | (1,528.7) |
Treasury stock, at cost: 0.7 million and 0.6 million shares (1) | | (182.9) | | | (179.5) |
Total The Phoenix Companies, Inc. stockholders’ equity | | 503.8 | | | 692.9 |
Noncontrolling interests | | 6.7 | | | 2.8 |
Total stockholders’ equity | | 510.5 | | | 695.7 |
Total liabilities and stockholders’ equity | $ | 21,629.8 | | $ | 21,488.0 |
———————
(1)
All share amounts for all periods reflect the 1-for-20 reverse stock split, which was effective August 10, 2012. See Note 11 to our consolidated financial statements for additional information on the reverse stock split.
The accompanying notes are an integral part of these financial statements.
F-3
THE PHOENIX COMPANIES, INC.
Consolidated Statements of Comprehensive Income
($ in millions, except per share data)
Years Ended December 31, 2012, 2011 and 2010
| | | | | | | | |
| 2012 | | 2011 | | 2010 |
| | | As restated | | As restated |
| | | and amended | | and amended |
REVENUES: | | | | | | | | |
Premiums | $ | 402.3 | | $ | 448.7 | | $ | 507.5 |
Fee income | | 556.2 | | | 596.8 | | | 633.5 |
Net investment income | | 829.3 | | | 822.9 | | | 840.5 |
Net realized investment gains (losses): | | | | | | | | |
Total other-than-temporary impairment (“OTTI”) losses | | (51.7) | | | (65.3) | | | (107.3) |
Portion of OTTI losses recognized in other comprehensive income (“OCI”) | | 22.9 | | | 38.5 | | | 58.7 |
Net OTTI losses recognized in earnings | | (28.8) | | | (26.8) | | | (48.6) |
Net realized investment gains (losses), excluding OTTI losses | | 18.3 | | | (5.3) | | | 37.4 |
Net realized investment gains (losses) | | (10.5) | | | (32.1) | | | (11.2) |
Gain on debt repurchase | | 11.9 | | | 0.2 | | | — |
Total revenues | | 1,789.2 | | | 1,836.5 | | | 1,970.3 |
| | | | | | | | |
BENEFITS AND EXPENSES: | | | | | | | | |
Policy benefits, excluding policyholder dividends | | 1,166.1 | | | 1,137.0 | | | 1,121.5 |
Policyholder dividends | | 294.8 | | | 259.2 | | | 301.8 |
Policy acquisition cost amortization | | 200.0 | | | 157.9 | | | 268.2 |
Interest expense on indebtedness | | 30.8 | | | 31.8 | | | 31.8 |
Other operating expenses | | 253.5 | | | 247.9 | | | 288.6 |
Total benefits and expenses | | 1,945.2 | | | 1,833.8 | | | 2,011.9 |
Income (loss) from continuing operations before income taxes | | (156.0) | | | 2.7 | | | (41.6) |
Income tax expense (benefit) | | (3.7) | | | 12.3 | | | (10.3) |
Income (loss) from continuing operations | | (152.3) | | | (9.6) | | | (31.3) |
Loss from discontinued operations, net of income taxes | | (15.6) | | | (21.6) | | | (3.6) |
Net loss | | (167.9) | | | (31.2) | | | (34.9) |
Less: Net income (loss) attributable to noncontrolling interests | | 0.6 | | | (0.5) | | | (0.5) |
Net loss attributable to The Phoenix Companies, Inc. | $ | (168.5) | | $ | (30.7) | | $ | (34.4) |
| | | | | | | | |
COMPREHENSIVE INCOME (LOSS): | | | | | | | | |
Net loss attributable to The Phoenix Companies, Inc. | $ | (168.5) | | $ | (30.7) | | $ | (34.4) |
Net income (loss) attributable to noncontrolling interests | | 0.6 | | | (0.5) | | | (0.5) |
Net loss | | (167.9) | | | (31.2) | | | (34.9) |
Other comprehensive income (loss) before income taxes: | | | | | | | | |
Net unrealized investment gains before income taxes | | 56.7 | | | 58.7 | | | 174.1 |
Non-credit portion of OTTI losses recognized in OCI before income taxes | | 37.0 | | | (33.8) | | | (24.9) |
Net pension liability adjustment before income taxes | | (21.4) | | | (99.1) | | | (7.9) |
Net unrealized other gains (losses) before income taxes | | — | | | — | | | — |
Net unrealized derivative instruments gains (losses) before income taxes | | — | | | — | | | — |
Other comprehensive income (loss) before income taxes | | 72.3 | | | (74.2) | | | 141.3 |
Less: Income tax expense (benefit) related to: | | | | | | | | |
Net unrealized investment gains (losses) | | 78.0 | | | 12.1 | | | 94.5 |
Non-credit portion of OTTI losses recognized in OCI | | 12.9 | | | (11.8) | | | (7.5) |
Net pension liability adjustment | | — | | | — | | | — |
Net unrealized other gains (losses) | | — | | | — | | | — |
Net unrealized derivative instruments gains (losses) | | — | | | — | | | — |
Total income tax expense (benefit) | | 90.9 | | | 0.3 | | | 87.0 |
Other comprehensive income (loss), net of income taxes | | (18.6) | | | (74.5) | | | 54.3 |
Comprehensive income (loss) | | (186.5) | | $ | (105.7) | | $ | 19.4 |
Less: Comprehensive income (loss) attributable to noncontrolling interests,
net of income taxes | | 0.6 | | | (0.5) | | | (0.5) |
Comprehensive income (loss) attributable to The Phoenix Companies, Inc. | $ | (187.1) | | $ | (105.2) | | $ | 19.9 |
(Continued on next page)
The accompanying notes are an integral part of these financial statements.
F-4
THE PHOENIX COMPANIES, INC.
Consolidated Statements of Comprehensive Income
($ in millions, except per share data)
Years Ended December 31, 2012, 2011 and 2010
| | | | | | | | | | |
(Continued from previous page) | 2012 | | 2011 | | 2010 |
| | | As restated | | As restated |
| | | and amended | | and amended |
LOSS PER SHARE:(1) | | | | | | | | | | |
Loss from continuing operations – basic | $ | (26.40) | | $ | (1.65) | | | $ | (5.39) | |
Loss from continuing operations – diluted | $ | (26.40) | | $ | (1.65) | | | $ | (5.39) | |
Loss from discontinued operations – basic | $ | (2.70) | | $ | (3.71) | | | $ | (0.62) | |
Loss from discontinued operations – diluted | $ | (2.70) | | $ | (3.71) | | | $ | (0.62) | |
Net loss attributable to The Phoenix Companies, Inc. – basic | $ | (29.20) | | $ | (5.28) | | | $ | (5.93) | |
Net loss attributable to The Phoenix Companies, Inc. – diluted | $ | (29.20) | | $ | (5.28) | | | $ | (5.93) | |
Basic weighted-average common shares outstanding (in thousands) | | 5,770 | | | 5,815 | (2) | | | 5,803 | (2) |
Diluted weighted-average common shares outstanding (in thousands) | | 5,770 | | | 5,815 | (2) | | | 5,803 | (2) |
———————
(1)
All share amounts for all periods reflect the 1-for-20 reverse stock split, which was effective August 10, 2012. See Note 11 to our consolidated financial statements for additional information on the reverse stock split.
(2)
Weighted-average common shares outstanding have been updated to reflect the impact of an error which had no material impact to EPS information, basic or diluted, for any period presented
The accompanying notes are an integral part of these financial statements.
F-5
THE PHOENIX COMPANIES, INC.
Consolidated Statements of Cash Flows
($ in millions)
Years Ended December 31, 2012, 2011 and 2010
| | | | | | | | |
| 2012 | | 2011 | | 2010 |
| | | As restated | | As restated |
| | | and amended | | and amended |
OPERATING ACTIVITIES: | | | | | | | | |
Net loss | $ | (168.5) | | $ | (30.7) | | $ | (34.4) |
Net realized investment (gains) losses | | 17.4 | | | 29.9 | | | 11.4 |
Gain on debt repurchase | | (11.9) | | | (0.2) | | | — |
Policy acquisition costs deferred | | (58.1) | | | (91.2) | | | (12.8) |
Amortization of deferred policy acquisition costs | | 200.0 | | | 157.9 | | | 268.2 |
Amortization and depreciation | | 12.0 | | | 12.8 | | | 11.0 |
Interest credited | | 123.2 | | | 117.5 | | | 123.8 |
Equity in earnings of limited partnerships and other investments | | (60.8) | | | (45.3) | | | (61.1) |
Change in: | | | | | | | | |
Accrued investment income | | (123.2) | | | (141.3) | | | (133.8) |
Deferred income taxes | | (19.8) | | | (2.7) | | | (15.3) |
Receivables | | (24.2) | | | (0.1) | | | 39.0 |
Policy liabilities and accruals | | (426.9) | | | (405.0) | | | (814.4) |
Dividend obligations | | 82.9 | | | 7.3 | | | (13.9) |
Impact of operating activities of consolidated investment entities, net | | (11.8) | | | (4.2) | | | (5.9) |
Other operating activities, net | | (51.1) | | | (42.5) | | | 13.7 |
Cash used for operating activities | | (520.8) | | | (437.8) | | | (624.5) |
| | | | | | | | |
INVESTING ACTIVITIES: | | | | | | | | |
Purchases of: | | | | | | | | |
Available-for-sale debt securities | | (3,610.9) | | | (3,048.2) | | | (2,686.2) |
Available-for-sale equity securities | | (10.9) | | | (6.4) | | | (5.3) |
Derivative instruments | | (50.8) | | | (70.5) | | | (83.2) |
Fair value investments | | (37.4) | | | (47.3) | | | (8.5) |
Other investments | | (1.3) | | | (1.4) | | | (1.3) |
Sales, repayments and maturities of: | | | | | | | | |
Available-for-sale debt securities | | 3,263.6 | | | 2,329.2 | | | 2,701.2 |
Available-for-sale equity securities | | 12.5 | | | 10.2 | | | 0.7 |
Derivative instruments | | 26.7 | | | 87.1 | | | 32.1 |
Fair value investments | | 38.1 | | | 13.4 | | | 14.4 |
Other investments | | 11.2 | | | 22.3 | | | 37.8 |
Contributions to limited partnerships and limited liability corporations | | (101.8) | | | (99.4) | | | (90.2) |
Distributions from limited partnerships and limited liability corporations | | 138.4 | | | 120.5 | | | 132.0 |
Policy loans, net | | 126.5 | | | 128.3 | | | 62.7 |
Impact of investing activities of consolidated investment entities, net | | — | | | — | | | — |
Other investing activities, net | | (7.7) | | | (4.6) | | | 30.0 |
Cash provided by (used for) investing activities | | (203.8) | | | (566.8) | | | 136.2 |
(Continued on next page)
The accompanying notes are an integral part of these financial statements.
F-6
THE PHOENIX COMPANIES, INC.
Consolidated Statements of Cash Flows
($ in millions)
Years Ended December 31, 2012, 2011 and 2010
| | | | | | | | |
(Continued from previous page) | 2012 | | 2011 | | 2010 |
| | | As restated | | As restated |
| | | and amended | | and amended |
FINANCING ACTIVITIES: | | | | | | | | |
Policyholder deposit fund deposits | | 1,597.4 | | | 1,825.4 | | | 1,099.2 |
Policyholder deposit fund withdrawals | | (1,138.8) | | | (1,179.3) | | | (1,225.5) |
Net transfers to/from separate accounts | | 379.8 | | | 435.1 | | | 454.3 |
Impact of financing activities of consolidated investment entities, net | | 1.3 | | | 1.5 | | | 1.0 |
Other financing activities, net | | (39.6) | | | (4.9) | | | 0.3 |
Cash provided by financing activities | | 800.1 | | | 1,077.8 | | | 329.3 |
Change in cash and cash equivalents | | 75.5 | | | 73.2 | | | (159.0) |
Change in cash included in discontinued operations assets | | 2.7 | | | 1.3 | | | (3.1) |
Cash and cash equivalents, beginning of period | | 168.2 | | | 93.7 | | | 255.8 |
Cash and cash equivalents, end of period | $ | 246.4 | | $ | 168.2 | | $ | 93.7 |
| | | | | | | | |
Supplemental Disclosure of Cash Flow Information | | | | | | | | |
Income taxes paid | $ | (18.4) | | $ | (6.2) | | $ | (0.1) |
Interest expense on indebtedness paid | $ | (30.4) | | $ | (31.4) | | $ | (31.4) |
| | | | | | | | |
Non-Cash Transactions During the Year | | | | | | | | |
Investment exchanges | $ | 96.0 | | $ | 97.8 | | $ | 70.5 |
The accompanying notes are an integral part of these financial statements.
F-7
THE PHOENIX COMPANIES, INC.
Consolidated Statements of Changes in Stockholders’ Equity
($ in millions, except share data)
Years Ended December 31, 2012, 2011 and 2010
| | | | | | | | |
| 2012 | | 2011 | | 2010 |
| | | As restated | | As restated |
| | | and amended | | and amended |
COMMON STOCK:(1) | | | | | | | | |
Balance, beginning of period | $ | 1.3 | | $ | 1.3 | | $ | 1.3 |
Adjustment for reverse stock split | | (1.2) | | | — | | | — |
Balance, end of period | $ | 0.1 | | $ | 1.3 | | $ | 1.3 |
| | | | | | | | |
ADDITIONAL PAID-IN CAPITAL: | | | | | | | | |
Balance, beginning of period | $ | 2,630.5 | | $ | 2,631.0 | | $ | 2,627.3 |
Issuance of shares and compensation expense on stock compensation awards | | 1.4 | | | (0.5) | | | 3.7 |
Adjustment for reverse stock split | | 1.2 | | | — | | | — |
Balance, end of period | $ | 2,633.1 | | $ | 2,630.5 | | $ | 2,631.0 |
| | | | | | | | |
ACCUMULATED OTHER COMPREHENSIVE INCOME (LOSS): | | | | | | | | |
Balance, beginning of period | $ | (230.7) | | $ | (156.2) | | $ | (211.6) |
Adjustment for initial application of accounting changes | | — | | | — | | | 1.1 |
Other comprehensive income (loss) | | (18.6) | | | (74.5) | | | 54.3 |
Balance, end of period | $ | (249.3) | | $ | (230.7) | | $ | (156.2) |
| | | | | | | | |
ACCUMULATED DEFICIT: | | | | | | | | |
Balance, beginning of period | $ | (1,528.7) | | $ | (1,498.0) | | $ | (1,456.8) |
Adjustment for initial application of accounting changes | | — | | | — | | | (6.8) |
Net loss | | (168.5) | | | (30.7) | | | (34.4) |
Balance, end of period | $ | (1,697.2) | | $ | (1,528.7) | | $ | (1,498.0) |
| | | | | | | | |
TREASURY STOCK, AT COST:(1) | | | | | | | | |
Balance, beginning of period | $ | (179.5) | | $ | (179.5) | | $ | (179.5) |
Treasury shares purchased | | (3.4) | | | — | | | — |
Balance, end of period | $ | (182.9) | | $ | (179.5) | | $ | (179.5) |
| | | | | | | | |
TOTAL STOCKHOLDERS’ EQUITY ATTRIBUTABLE TO | | | | | | | | |
THE PHOENIX COMPANIES, INC.: | | | | | | | | |
Balance, beginning of period | $ | 692.9 | | $ | 798.6 | | $ | 780.7 |
Adjustment for initial application of accounting changes | | — | | | — | | | (5.7) |
Change in stockholders’ equity attributable to The Phoenix Companies, Inc. | | (189.1) | | | (105.7) | | | 23.6 |
Balance, end of period | $ | 503.8 | | $ | 692.9 | | $ | 798.6 |
| | | | | | | | |
NONCONTROLLING INTERESTS: | | | | | | | | |
Balance, beginning of period | $ | 2.8 | | $ | 1.8 | | $ | 1.7 |
Net income attributable to noncontrolling interests | | 0.6 | | | (0.5) | | | (0.5) |
Contributions to noncontrolling interests | | 4.7 | | | 1.5 | | | — |
Distributions from noncontrolling interests | | (1.4) | | | — | | | — |
Issuance of Saybrus shares to noncontrolling interests | | — | | | — | | | 0.6 |
Balance, end of period | $ | 6.7 | | $ | 2.8 | | $ | 1.8 |
| | | | | | | | |
TOTAL STOCKHOLDERS’ EQUITY: | | | | | | | | |
Balance, beginning of period | $ | 695.7 | | $ | 800.4 | | $ | 782.4 |
Adjustment for initial application of accounting changes | | — | | | — | | | (5.7) |
Change in stockholders’ equity | | (185.2) | | | (104.7) | | | 23.7 |
Stockholders’ equity, end of period | $ | 510.5 | | $ | 695.7 | | $ | 800.4 |
———————
(1)
Reflects the 1-for-20 reverse stock split, which was effective August 10, 2012. See Note 11 to our consolidated financial statements for additional information on the reverse stock split.
The accompanying notes are an integral part of these financial statements.
F-8
THE PHOENIX COMPANIES, INC.
Notes to Consolidated Financial Statements
($ in millions, except per share and per unit data)
Years Ended December 31, 2012, 2011 and 2010
1.
Organization and Description of Business
The Phoenix Companies, Inc. (“we,” “our,” “us,” the “Company,” “PNX” or “Phoenix”) is a holding company and our operations are conducted through subsidiaries, principally Phoenix Life Insurance Company (“Phoenix Life”) and PHL Variable Insurance Company (“PHLVIC”), collectively with Phoenix Life and Phoenix Life and Annuity Company and American Phoenix Life and Reassurance, they are our “Life Companies.” We provide life insurance and annuity products through independent agents and financial advisors. Our policyholder base includes both affluent and middle market consumers, with our more recent business concentrated in the middle market. Most of our life insurance in force is permanent life insurance insuring one or more lives. Our annuity products include fixed and variable annuities with a variety of death benefit and guaranteed living benefit options.
We operate two businesses segments: Life and Annuity and Saybrus. The Life and Annuity segment includes individual life insurance and annuity products, including our closed block. Saybrus provides dedicated life insurance and other consulting services to financial advisors in partner companies, as well as support for sales of Phoenix’s product line through independent distribution organizations.
2.
Restatement and Amendment of Previously Reported Financial Information
During the preparation of the Company’s Form 10-Q for the period ended September 30, 2012, certain errors were identified within the consolidated statement of cash flows for the nine months ended September 30, 2012, as well as for previously reported periods. Following the identification of these cash flow related errors, management initiated a comprehensive internal review of the Company’s historical financial information and identified additional errors. As part of its internal review, the Company evaluated the financial reporting process and the resulting financial statements as well as the appropriateness of prior accounting and reporting decisions in accordance with accounting principles generally accepted in the United States of America (“U.S. GAAP”). As a result, the Company has restated and amended its consolidated financial statements as of and for the years ended December 31, 2011 and 2010 to: (i) adjust for impact of these errors; (ii) record previously identified out-of-period errors that were previously determined not to be material individually, or in the aggregate, in the appropriate period; and (iii) amend the financial statements for the impact of the retrospective adoption of amended accounting guidance discussed more fully in the“Revision for the Retrospective Adoption of Amended Accounting Guidance” section below.
The Company has classified the errors that were affected by the restatement into the following major categories:
1.
Actuarial Finance (which includes various subcategories as noted more fully below)
2.
Investments (which includes various subcategories as noted more fully below)
3.
Reinsurance Accounting
4.
Pensions
5.
Limited Partnerships and Other Investments Taxable Income Reporting
6.
Cash Flows and Changes in Classification
In addition to these six categories, there are certain items labeled “other restatement adjustments” which primarily relate to previously recorded out-of-period errors that were previously identified and determined not to be material individually or in the aggregate. The Company reconsidered each of these errors individually and in the aggregate during the course of the restatement and concluded that certain of these previously identified errors, namely actuarial and pension, would be most appropriately presented within the“Actuarial Finance” and“Pensions” sections below, with the remaining errors most appropriately categorized into “other restatement adjustments” rather than any of the six major categories. In an effort to provide greater transparency into these remaining “other restatement adjustments,” the Company has provided additional details underlying select errors for certain financial statement line items, as deemed appropriate. These details are presented in the financial statement tables detailed more fully within this Note below.
F-9
2.
Restatement and Amendment of Previously Reported Financial Information (continued)
The following table summarizes the effect of the correction of these errors on net income as applicable by category of error.
| | | | | |
Increase (decrease) | For the year ended |
($ in millions) | December 31, |
| 2011 | | 2010 |
| | | | | |
Net income (loss) as previously reported | $ | 8.1 | | $ | (12.6) |
| | | | | |
Restatement adjustments: (1) | | | | | |
Actuarial finance: | | | | | |
- Accounting for certain universal life type products | | (34.0) | | | (46.7) |
- Loss recognition | | 2.7 | | | (3.9) |
- Traditional product revenue recognition | | (0.1) | | | (0.4) |
- Liability for the future cost of a settlement agreement | | (1.8) | | | (2.0) |
- Fixed indexed annuities | | (4.2) | | | — |
- Other actuarial errors | | (11.0) | | | (13.5) |
Investments: | | | | | |
- Limited partnerships and other investments | | (2.6) | | | 2.5 |
- Available-for-sale securities | | 2.6 | | | 2.3 |
- Derivative valuation | | (12.4) | | | (4.2) |
- Structured securities | | (3.6) | | | 0.6 |
Reinsurance accounting | | (3.3) | | | 6.3 |
Pensions | | 7.1 | | | (1.7) |
Other restatement adjustments (2) | | (0.1) | | | 9.0 |
Total restatement adjustments before income taxes | | (60.7) | | | (51.7) |
Limited partnerships and other investments taxable income reporting | | (1.6) | | | 4.9 |
Income tax expense (benefit) of restatement adjustments | | 3.0 | | | (20.4) |
Total income tax expense (benefit) of restatement adjustments | | 1.4 | | | (15.5) |
Total impact to continuing operations | | (62.1) | | | (36.2) |
Retrospective adoption, net of income taxes (3) | | 22.4 | | | 29.5 |
Discontinued operations, net of income taxes (4) | | 0.4 | | | (15.6) |
Impact of restatement adjustments on net income (loss) | | (39.3) | | | (22.3) |
Less: Noncontrolling interests (4) | | (0.5) | | | (0.5) |
Net loss attributable to The Phoenix Companies, Inc., as restated and amended | $ | (30.7) | | $ | (34.4) |
———————
(1)
All restatement adjustments are presented on a before-tax basis with total tax expense (benefit) presented separately.
(2)
Amounts exclude the impacts for income tax expense (benefit), discontinued operations and noncontrolling interests which are reflected separately.
(3)
For additional information, see “Revision for the Retrospective Adoption of Amended Accounting Guidance”described more fully below in this Note.
(4)
For additional information regarding errors related to discontinued operations and noncontrolling interests refer to “other restatement adjustments” detailed within the “Consolidated Summary of Correction of Errors” tables presented within this Note.
Actuarial Finance
The Company determined that there were errors related to the actuarial valuation of insurance liabilities and the amortization of deferred policy acquisition costs. Errors were identified related to data, assumptions and valuation methodologies and separated into the following sub-categories detailed below:
·
Accounting for Certain Universal Life Type Products: Certain of the Company’s universal life products have benefit features that are expected to produce profits in earlier periods followed by losses in later periods. Under U.S. GAAP accounting, the Company is required to establish reserves for the anticipated benefits that exceed the projected contract value and arise from these features. The Company did not properly evaluate certain benefit features and, therefore, did not properly establish the required reserves. The resulting changes in the reserve had a secondary impact on gross profits used to amortize deferred acquisition costs and unearned revenue reserves.
In addition, the Company must periodically assess each of its lines of business for a potential premium deficiency including whether the line of business is expected to produce profits in earlier years followed by losses in later years. The Company did not properly assess the universal life or variable universal life lines of businesses for this profits followed by losses condition. Accordingly, the Company accrued additional reserves over the restatement period to provide for expected losses in the future.
F-10
2.
Restatement and Amendment of Previously Reported Financial Information (continued)
The Company also determined it was using inappropriate approximations of reinsurance that when aggregated did not properly reflect the underlying reinsurance costs accurately within the models it uses to amortize deferred policy acquisition costs and to value policyholder liabilities. The impact of the correction of this reinsurance modeling error indirectly impacted the balances discussed above.
In addition, the impact of this error indirectly impacted the calculation of the“Shadow Accounting” error which is a separately identifiable component of actuarial errors and, accordingly, is described within the“Shadow Accounting” section of“Actuarial Finance” directly below.
The impact of the correction of these errors on the consolidated financial statements is presented in the“Summary of Correction of Actuarial Finance Errors” table within the“Actuarial Finance” section of this Note below.
·
Shadow Accounting: Under U.S. GAAP accounting, assets and liabilities that are backed by a portfolio of assets classified as available-for-sale must be adjusted to reflect the amount of unrealized gains or unrealized losses “as if the amounts were realized” with a corresponding offset to other comprehensive income (loss) in a process commonly referred to as “shadow accounting.” The Company failed to recognize all of the relationships between the available-for-sale assets and the supported assets and liabilities in calculating these adjustments. During the restatement, the shadow accounting policy and valuation process were corrected to ensure all interrelated assets and liabilities were being properly identified and to ensure that the impacts of these unrealized gains or losses were properly recorded. The impact of the correction of these errors on the consolidated financial statements is presented in the “Summary of Correction of Actuarial Finance Errors” table within the “Actuarial Finance” section of this Note below.
·
Loss Recognition: Under U.S. GAAP accounting, the Company must periodically assess the net liability (net of deferred policy acquisition costs) to ensure it is sufficient to provide for the expected policyholder benefits and related expenses. Upon analysis, the Company determined that for certain lines of business the “locked-in” historical estimates used to calculate the policyholder liabilities were insufficient prior to, and also as a result of, entering into a new reinsurance treaty (as discussed within the“Reinsurance Accounting” section below) and in light of the current interest rate environment. Upon identification of loss recognition events, the Company reduced its deferred policy acquisition cost asset and established additional liabilities to rectify the insufficiency in the net liability which was identified for certain lines of business. The impact of the correction of these errors on the consolidated financial statements is presented in the “Summary of Correction of Actuarial Finance Errors” table within the “Actuarial Finance” section of this Note below.
·
Traditional Product Revenue Recognition: The Company did not properly recognize premiums when due under the terms of the contract related to its traditional participating life insurance policies. In conjunction with the correction of this error, the Company also revised the projected income (the “glidepath”) from inception of the closed block in order to properly reflect the revised timing of revenue recognition. The correction of these errors did not have a material impact on annual net income in any given period or the amounts disclosed ‘at inception’ within “Note 5: Demutualization and Closed Block.” The impact of the correction of these errors on the consolidated financial statements is presented in the “Summary of Correction of Actuarial Finance Errors” table within the “Actuarial Finance” section of this Note below.
·
Liability for the Future Cost of a Settlement Agreement: As a result of the settlement of a class action lawsuit reached prior to demutualization and related to the Company’s participating business, the Company was required to record a liability for the future costs associated with reimbursing certain customers for supplemental premium payments. The calculation of this liability involves estimates of future policy lapses and policyholder mortality that are consistent with the assumptions used to estimate other policyholder liabilities. However, the Company did not properly record this incremental liability within the consolidated financial statements. The impact of the correction of these errors on the consolidated financial statements is presented in the “Summary of Correction of Actuarial Finance Errors” table within the “Actuarial Finance” section of this Note below.
F-11
2.
Restatement and Amendment of Previously Reported Financial Information (continued)
·
Fixed Indexed Annuities (“FIA”): During the Company’s analysis of the fixed indexed annuity valuation process, errors associated with the actuarial modeling of certain fixed indexed annuity product features which were modeled beginning in 2011 were identified. These errors related to incomplete or inaccurate data and inappropriate approximations of product features which resulted in the incorrect calculation for the policyholder liabilities including the related embedded derivatives and liabilities associated with certain benefits for the product. The impact of the correction of these errors on the consolidated financial statements is presented in the “Summary of Correction of Actuarial Finance Errors” table within the “Actuarial Finance” section of this Note below.
Other errors related to the FIA products for the 2010 period were previously identified and recorded as out-of-period errors. These errors which resulted in a net loss of $2.3 million are presented, along with all other actuarial out-of-period errors, within the “Other Actuarial Errors” section below.
·
Other Actuarial Errors: Included within these amounts are all actuarial out-of-period errors as well as other individually immaterial errors which were identified during the restatement process in conjunction with management’s comprehensive balance sheet review and relating to the Company’s actuarial assumptions, approximations and valuation methods/models for its life and annuity business. The impact of the correction of these errors on the consolidated financial statements is presented in the “Summary of Correction of Actuarial Finance Errors” table within the “Actuarial Finance” section of this Note below.
F-12
2.
Restatement and Amendment of Previously Reported Financial Information (continued)
| | | | | | | | | | | | | | | | | | | | | | | | |
Increase (decrease) | Summary of Correction of Actuarial Finance Errors – December 31, 2011 Balance Sheet Impacts(1) |
($ in millions) | Actuarial Finance |
| Accounting for UL Type Products | | Shadow Accounting | | Loss Recognition | | Traditional Revenue Recognition | | Future Cost of a Settlement | | FIA | | Other Actuarial | | Total Actuarial Finance Errors(2) |
|
|
|
ASSETS: | | | | | | | | | | | | | | | | | | | | | | | |
Available-for-sale debt securities, at fair value | $ | — | | $ | — | | $ | — | | $ | — | | $ | — | | $ | — | | $ | — | | $ | — |
Available-for-sale equity securities, at fair value | | — | | | — | | | — | | | — | | | — | | | — | | | — | | | — |
Limited partnerships and other investments | | — | | | — | | | — | | | — | | | — | | | — | | | — | | | — |
Policy loans, at unpaid principal balances | | — | | | — | | | — | | | — | | | — | | | — | | | — | | | — |
Derivative investments | | — | | | — | | | — | | | — | | | — | | | — | | | — | | | — |
Fair value investments | | — | | | — | | | — | | | — | | | — | | | — | | | — | | | — |
Total investments | | — | | | — | | | — | | | — | | | — | | | — | | | — | | | — |
Cash and cash equivalents | | — | | | — | | | — | | | — | | | — | | | — | | | — | | | — |
Accrued investment income | | — | | | — | | | — | | | — | | | — | | | — | | | — | | | — |
Receivables | | — | | | — | | | — | | | 16.6 | | | — | | | — | | | 1.0 | | | 17.6 |
Deferred policy acquisition costs | | 57.3 | | | (11.0) | | | (1.8) | | | (0.7) | | | — | | | (3.4) | | | 1.1 | | | 41.5 |
Deferred income taxes, net | | — | | | — | | | — | | | — | | | — | | | — | | | — | | | — |
Other assets | | — | | | — | | | (38.6) | | | — | | | — | | | — | | | 4.8 | | | (33.8) |
Discontinued operations assets | | — | | | — | | | — | | | — | | | — | | | — | | | — | | | — |
Separate account assets | | — | | | — | | | — | | | — | | | — | | | — | | | — | | | — |
Total assets | $ | 57.3 | | $ | (11.0) | | $ | (40.4) | | $ | 15.9 | | $ | — | | $ | (3.4) | | $ | 6.9 | | $ | 25.3 |
| | | | | | | | | | | | | | | | | | | | | | | |
LIABILITIES: | | | | | | | | | | | | | | | | | | | | | | | |
Policy liabilities and accruals | $ | 179.4 | | $ | 9.2 | | $ | 11.0 | | $ | 12.1 | | $ | 7.7 | | $ | — | | $ | 21.3 | | $ | 240.7 |
Policyholder deposit funds | | — | | | — | | | — | | | — | | | — | | | 0.8 | | | 2.1 | | | 2.9 |
Dividend obligations | | — | | | — | | | — | | | 9.4 | | | — | | | — | | | (8.4) | | | 1.0 |
Indebtedness | | — | | | — | | | — | | | — | | | — | | | — | | | — | | | — |
Other liabilities | | — | | | — | | | — | | | — | | | — | | | — | | | 0.2 | | | 0.2 |
Discontinued operations liabilities | | — | | | — | | | — | | | — | | | — | | | — | | | — | | | — |
Separate account liabilities | | — | | | — | | | — | | | — | | | — | | | — | | | — | | | — |
Total liabilities | | 179.4 | | | 9.2 | | | 11.0 | | | 21.5 | | | 7.7 | | | 0.8 | | | 15.2 | | | 244.8 |
| | | | | | | | | | | | | | | | | | | | | | | |
STOCKHOLDERS’ EQUITY: | | | | | | | | | | | | | | | | | | | | | | | |
Common stock | | — | | | — | | | — | | | — | | | — | | | — | | | — | | | — |
Additional paid-in capital | | — | | | — | | | — | | | — | | | — | | | — | | | — | | | — |
Accumulated other comprehensive loss | | — | | | (14.2) | | | — | | | — | | | — | | | — | | | — | | | (14.2) |
Accumulated deficit | | (80.7) | | | — | | | (1.2) | | | (0.5) | | | (3.8) | | | (4.2) | | | (24.5) | | | (114.9) |
Treasury stock | | — | | | — | | | — | | | — | | | — | | | — | | | — | | | — |
Noncontrolling interests | | — | | | — | | | — | | | — | | | — | | | — | | | — | | | — |
Total stockholders’ equity –periods presented (3) | | (80.7) | | | (14.2) | | | (1.2) | | | (0.5) | | | (3.8) | | | (4.2) | | | (24.5) | | | (129.1) |
Total stockholders’ equity – cumulative impact (4) | | (41.4) | | | (6.0) | | | (50.2) | | | (5.1) | | | (3.9) | | | — | | | 16.2 | | | (90.4) |
Total stockholders’ equity – impact | | (122.1) | | | (20.2) | | | (51.4) | | | (5.6) | | | (7.7) | | | (4.2) | | | (8.3) | | | (219.5) |
Total liabilities and stockholders’ equity | $ | 57.3 | | $ | (11.0) | | $ | (40.4) | | $ | 15.9 | | $ | — | | $ | (3.4) | | $ | 6.9 | | $ | 25.3 |
———————
(1)
All amounts are shown before income taxes, unless otherwise noted.
(2)
Amounts represent the total “Summary of Correction of Actuarial Finance Errors” which is further aggregated into the “Consolidated Summary of Correction of Errors” in the following pages.
(3)
Amounts represent restatement changes made to the 2011 and 2010 periods as presented.
(4)
Amounts represent cumulative impact of restatement changes to periods prior to 2010.
F-13
2.
Restatement and Amendment of Previously Reported Financial Information (continued)
| | | | | | | | | | | | | | | | | | | | | | | |
Increase (decrease) | Summary of Correction of Actuarial Finance Errors – December 31, 2011 Income Statement Impacts(1) |
($ in millions) | Actuarial Finance |
| Accounting for UL Type Products | | Shadow Accounting | | Loss Recognition | | Traditional Revenue Recognition | | Future Cost of a Settlement | | FIA | | Other Actuarial | | Total Actuarial Finance Errors(2) |
|
|
|
REVENUES | | | | | | | | | | | | | | | | | | | | | | | |
Premiums | $ | — | | $ | — | | $ | — | | $ | (10.9) | | $ | — | | $ | — | | $ | 0.5 | | $ | (10.4) |
Fee income | | (1.1) | | | — | | | — | | | — | | | — | | | — | | | 0.8 | | | (0.3) |
Net investment income | | — | | | — | | | — | | | — | | | — | | | — | | | — | | | — |
Net realized investment gains (losses): | | | | | | | | | | | | | | | | | | | | | | | |
Total OTTI losses | | — | | | — | | | — | | | — | | | — | | | — | | | — | | | — |
Portion of OTTI losses recognized in OCI | | — | | | — | | | — | | | — | | | — | | | — | | | — | | | — |
Net OTTI losses recognized in earnings | | — | | | — | | | — | | | — | | | — | | | — | | | — | | | — |
Net realized investment gains (losses), excluding OTTI losses | | — | | | — | | | — | | | — | | | — | | | (0.4) | | | (0.7) | | | (1.1) |
Net realized investment gains (losses) | | — | | | — | | | — | | | — | | | — | | | (0.4) | | | (0.7) | | | (1.1) |
Gain on debt repurchase | | — | | | — | | | — | | | — | | | — | | | — | | | — | | | — |
Total revenues | | (1.1) | | | — | | | — | | | (10.9) | | | — | | | (0.4) | | | 0.6 | | | (11.8) |
| | | | | | | | | | | | | | | | | | | | | | | |
BENEFITS AND EXPENSES | | | | | | | | | | | | | | | | | | | | | | | |
Policy benefits, excluding policyholder dividends | | 47.1 | | | — | | | (4.5) | | | (10.0) | | | — | | | 0.4 | | | 12.8 | | | 45.8 |
Policyholder dividends | | — | | | — | | | — | | | (0.6) | | | — | | | — | | | (0.7) | | | (1.3) |
Policy acquisition cost amortization | | (14.2) | | | — | | | 1.8 | | | (0.2) | | | — | | | 3.4 | | | (5.3) | | | (14.5) |
Interest expense on indebtedness | | — | | | — | | | — | | | — | | | — | | | — | | | — | | | — |
Other operating expenses | | — | | | — | | | — | | | — | | | 1.8 | | | — | | | 4.8 | | | 6.6 |
Total benefits and expenses | | 32.9 | | | — | | | (2.7) | | | (10.8) | | | 1.8 | | | 3.8 | | | 11.6 | | | 36.6 |
Income (loss) from continuing operations before income taxes | | (34.0) | | | — | | | 2.7 | | | (0.1) | | | (1.8) | | | (4.2) | | | (11.0) | | | (48.4) |
Income tax expense (benefit) | | — | | | — | | | — | | | — | | | — | | | — | | | — | | | — |
Income (loss) from continuing operations | | (34.0) | | | — | | | 2.7 | | | (0.1) | | | (1.8) | | | (4.2) | | | (11.0) | | | (48.4) |
Noncontrolling interests | | — | | | — | | | — | | | — | | | — | | | — | | | — | | | — |
Income (loss) from discontinued operations, net of income taxes | | — | | | — | | | — | | | — | | | — | | | — | | | — | | | — |
Net income (loss) attributable to The Phoenix Companies, Inc. | $ | (34.0) | | $ | — | | $ | 2.7 | | $ | (0.1) | | $ | (1.8) | | $ | (4.2) | | $ | (11.0) | | $ | (48.4) |
———————
(1)
All amounts are shown before income taxes, unless otherwise noted.
(2)
Amounts represent the total “Summary of Correction of Actuarial Finance Errors” which is further aggregated into the “Consolidated Summary of Correction of Errors” in the following pages.
(Continued on next page)
F-14
2.
Restatement and Amendment of Previously Reported Financial Information (continued)
| | | | | | | | | | | | | | | | | | | | | | | |
(Continued from previous page) | Summary of Correction of Actuarial Finance Errors – December 31, 2011 Income Statement Impacts(1) |
Increase (decrease) | Actuarial Finance |
($ in millions) | Accounting for UL Type Products | | Shadow Accounting | | Loss Recognition | | Traditional Revenue Recognition | | Future Cost of a Settlement | | FIA | | Other Actuarial | | Total Actuarial Finance Errors(2) |
|
|
|
COMPREHENSIVE INCOME (LOSS): | | | | | | | | | | | | | | | | | | | | | | | |
Net income (loss) attributable to The Phoenix Companies, Inc. | $ | (34.0) | | $ | — | | $ | 2.7 | | $ | (0.1) | | $ | (1.8) | | $ | (4.2) | | $ | (11.0) | | $ | (48.4) |
Other comprehensive income (loss) before income taxes: | | | | | | | | | | | | | | | | | | | | | | | |
Net unrealized investment gains before income taxes | | — | | | (35.9) | | | — | | | — | | | — | | | — | | | — | | | (35.9) |
Non-credit portion of OTTI losses recognized in
OCI before income taxes | | — | | | — | | | — | | | — | | | — | | | — | | | — | | | — |
Net pension liability adjustment before income taxes | | — | | | — | | | — | | | — | | | — | | | — | | | — | | | — |
Net unrealized other gains (losses) before income taxes | | — | | | — | | | — | | | — | | | — | | | — | | | — | | | — |
Net unrealized derivative instruments gains (losses)
before income taxes | | — | | | — | | | — | | | — | | | — | | | — | | | — | | | — |
Other comprehensive income (loss) before income taxes | | — | | | (35.9) | | | — | | | — | | | — | | | — | | | — | | | (35.9) |
Less: Income tax expense (benefit) related to: | | | | | | | | | | | | | | | | | | | | | | | |
Net unrealized investment gains (losses) | | — | | | — | | | — | | | — | | | — | | | — | | | — | | | — |
Non-credit portion of OTTI losses recognized in OCI | | — | | | — | | | — | | | — | | | — | | | — | | | — | | | — |
Net pension liability adjustment | | — | | | — | | | — | | | — | | | — | | | — | | | — | | | — |
Net unrealized other gains (losses) | | — | | | — | | | — | | | — | | | — | | | — | | | — | | | — |
Net unrealized derivative instruments gains (losses) | | — | | | — | | | — | | | — | | | — | | | — | | | — | | | — |
Total income tax expense (benefit) | | — | | | — | | | — | | | — | | | — | | | — | | | — | | | — |
Other comprehensive income (loss), net of income taxes | | — | | | (35.9) | | | — | | | — | | | — | | | — | | | — | | | (35.9) |
Comprehensive income (loss) attributable to The Phoenix Companies, Inc. | | (34.0) | | | (35.9) | | | 2.7 | | | (0.1) | | | (1.8) | | | (4.2) | | | (11.0) | | | (84.3) |
Add: Comprehensive income attributable to noncontrolling interests | | — | | | — | | | — | | | — | | | — | | | — | | | — | | | — |
Comprehensive income (loss) | $ | (34.0) | | $ | (35.9) | | $ | 2.7 | | $ | (0.1) | | $ | (1.8) | | $ | (4.2) | | $ | (11.0) | | $ | (84.3) |
———————
(1)
All amounts are shown before income taxes, unless otherwise noted.
(2)
Amounts represent the total “Summary of Correction of Actuarial Finance Errors” which is further aggregated into the “Consolidated Summary of Correction of Errors” in the following pages.
F-15
2.
Restatement and Amendment of Previously Reported Financial Information (continued)
| | | | | | | | | | | | | | | | | | | | | | | |
Increase (decrease) | Summary of Correction of Actuarial Finance Errors – December 31, 2010 Income Statement Impacts(1) |
($ in millions) | Actuarial Finance |
| Accounting for UL Type Products | | Shadow Accounting | | Loss Recognition | | Traditional Revenue Recognition | | Future Cost of a Settlement | | FIA | | Other Actuarial | | Total Actuarial Finance Errors(2) |
|
|
|
REVENUES | | | | | | | | | | | | | | | | | | | | | | | |
Premiums | $ | — | | $ | — | | $ | — | | $ | (13.9) | | $ | — | | $ | — | | $ | — | | $ | (13.9) |
Fee income | | 1.7 | | | — | | | — | | | — | | | — | | | — | | | 1.7 | | | 3.4 |
Net investment income | | — | | | — | | | — | | | — | | | — | | | — | | | — | | | — |
Net realized investment gains (losses): | | | | | | | | | | | | | | | | | | | | | | | |
Total OTTI losses | | — | | | — | | | — | | | — | | | — | | | — | | | — | | | — |
Portion of OTTI losses recognized in OCI | | — | | | — | | | — | | | — | | | — | | | — | | | — | | | — |
Net OTTI losses recognized in earnings | | — | | | — | | | — | | | — | | | — | | | — | | | — | | | — |
Net realized investment gains (losses), excluding OTTI losses | | — | | | — | | | — | | | — | | | — | | | — | | | (4.9) | | | (4.9) |
Net realized investment gains (losses) | | — | | | — | | | — | | | — | | | — | | | — | | | (4.9) | | | (4.9) |
Gain on debt repurchase | | — | | | — | | | — | | | — | | | — | | | — | | | — | | | — |
Total revenues | | 1.7 | | | — | | | — | | | (13.9) | | | — | | | — | | | (3.2) | | | (15.4) |
| | | | | | | | | | | | | | | | | | | | | | | |
BENEFITS AND EXPENSES | | | | | | | | | | | | | | | | | | | | | | | |
Policy benefits, excluding policyholder dividends | | 29.3 | | | — | | | 3.9 | | | (13.5) | | | — | | | — | | | 6.2 | | | 25.9 |
Policyholder dividends | | — | | | — | | | — | | | (0.1) | | | — | | | — | | | (0.4) | | | (0.5) |
Policy acquisition cost amortization | | 19.1 | | | — | | | — | | | 0.1 | | | — | | | — | | | 6.8 | | | 26.0 |
Interest expense on indebtedness | | — | | | — | | | — | | | — | | | — | | | — | | | — | | | — |
Other operating expenses | | — | | | — | | | — | | | — | | | 2.0 | | | — | | | (2.3) | | | (0.3) |
Total benefits and expenses | | 48.4 | | | — | | | 3.9 | | | (13.5) | | | 2.0 | | | — | | | 10.3 | | | 51.1 |
Income (loss) from continuing operations before income taxes | | (46.7) | | | — | | | (3.9) | | | (0.4) | | | (2.0) | | | — | | | (13.5) | | | (66.5) |
Income tax expense (benefit) | | — | | | — | | | — | | | — | | | — | | | — | | | — | | | — |
Income (loss) from continuing operations | | (46.7) | | | — | | | (3.9) | | | (0.4) | | | (2.0) | | | — | | | (13.5) | | | (66.5) |
Noncontrolling interests | | — | | | — | | | — | | | — | | | — | | | — | | | — | | | — |
Income (loss) from discontinued operations, net of income taxes | | — | | | — | | | — | | | — | | | — | | | — | | | — | | | — |
Net income (loss) attributable to The Phoenix Companies, Inc. | $ | (46.7) | | $ | — | | $ | (3.9) | | $ | (0.4) | | $ | (2.0) | | $ | — | | $ | (13.5) | | $ | (66.5) |
———————
(1)
All amounts are shown before income taxes, unless otherwise noted.
(2)
Amounts represent the total “Summary of Correction of Actuarial Finance Errors” which is further aggregated into the “Consolidated Summary of Correction of Errors” in the following pages.
(Continued on next page)
F-16
2.
Restatement and Amendment of Previously Reported Financial Information (continued)
| | | | | | | | | | | | | | | | | | | | | | | |
(Continued from previous page) | Summary of Correction of Actuarial Finance Errors – December 31, 2010 Income Statement Impacts(1) |
Increase (decrease) | Actuarial Finance |
($ in millions) | Accounting for UL Type Products | | Shadow Accounting | | Loss Recognition | | Traditional Revenue Recognition | | Future Cost of a Settlement | | FIA | | Other Actuarial | | Total Actuarial Finance Errors(2) |
|
|
|
COMPREHENSIVE INCOME (LOSS): | | | | | | | | | | | | | | | | | | | | | | | |
Net income (loss) attributable to The Phoenix Companies, Inc. | $ | (46.7) | | $ | — | | $ | (3.9) | | $ | (0.4) | | $ | (2.0) | | $ | — | | $ | (13.5) | | $ | (66.5) |
Other comprehensive income (loss) before income taxes: | | | | | | | | | | | | | | | | | | | | | | | |
Net unrealized investment gains before income taxes | | — | | | 21.7 | | | — | | | — | | | — | | | — | | | — | | | 21.7 |
Non-credit portion of OTTI losses recognized in OCI
before income taxes | | — | | | — | | | — | | | — | | | — | | | — | | | — | | | — |
Net pension liability adjustment before income taxes | | — | | | — | | | — | | | — | | | — | | | — | | | — | | | — |
Net unrealized other gains (losses) before income taxes | | — | | | — | | | — | | | — | | | — | | | — | | | — | | | — |
Net unrealized derivative instruments gains (losses) before income taxes | | — | | | — | | | — | | | — | | | — | | | — | | | — | | | — |
Other comprehensive income (loss) before income taxes | | — | | | 21.7 | | | — | | | — | | | — | | | — | | | — | | | 21.7 |
Less: Income tax expense (benefit) related to: | | | | | | | | | | | | | | | | | | | | | | | |
Net unrealized investment gains (losses) | | — | | | — | | | — | | | — | | | — | | | — | | | — | | | — |
Non-credit portion of OTTI losses recognized in OCI | | — | | | — | | | — | | | — | | | — | | | — | | | — | | | — |
Net pension liability adjustment | | — | | | — | | | — | | | — | | | — | | | — | | | — | | | — |
Net unrealized other gains (losses) | | — | | | — | | | — | | | — | | | — | | | — | | | — | | | — |
Net unrealized derivative instruments gains (losses) | | — | | | — | | | — | | | — | | | — | | | — | | | — | | | — |
Total income tax expense (benefit) | | — | | | — | | | — | | | — | | | — | | | — | | | — | | | — |
Other comprehensive income (loss), net of income taxes | | — | | | 21.7 | | | — | | | — | | | — | | | — | | | — | | | 21.7 |
Comprehensive income (loss) attributable to The Phoenix Companies, Inc. | | (46.7) | | | 21.7 | | | (3.9) | | | (0.4) | | | (2.0) | | | — | | | (13.5) | | | (44.8) |
Add: Comprehensive income attributable to noncontrolling interests | | — | | | — | | | — | | | — | | | — | | | — | | | — | | | — |
Comprehensive income (loss) | $ | (46.7) | | $ | 21.7 | | $ | (3.9) | | $ | (0.4) | | $ | (2.0) | | $ | — | | $ | (13.5) | | $ | (44.8) |
———————
(1)
All amounts are shown before income taxes, unless otherwise noted.
(2)
Amounts represent the total “Summary of Correction of Actuarial Finance Errors” which is further aggregated into the “Consolidated Summary of Correction of Errors” in the following pages.
F-17
2.
Restatement and Amendment of Previously Reported Financial Information (continued)
Investments
The Company determined that there were errors related to investment valuation and the accounting treatment for these investments which are specifically identified errors in the following sub-categories as detailed below:
·
Limited Partnerships and Other Investments (“OIA”) –The Company did not have an adequate process to properly determine the appropriate accounting method for OIA at acquisition or for determining the appropriate accounting for investee transactions resulting in errors associated with the application of equity or fair value methods of accounting, and conclusions reached regarding consolidation.Additionally, the Company did not perform the proper evaluation necessary for determining impairments of certain OIA assets which led to additional adjustments. The impact of the correction of these errors on the consolidated financial statements is presented in the “Summary of Correction of Investments Errors” table within the “Investments” section of this Note below.
·
Available-for-Sale Securities –The Company did not have an adequate process over: (1) the valuation and recording of private placement debt, private equity securities, and certain publicly traded securities; and (2) utilizing an appropriate model for identifying impairments related to these securities. The errors identified were related to: (i) inaccurate inputs used in the valuation models; (ii) and inappropriate valuation methodologies used to value certain instruments; and (iii) ineffective review of internally developed (matrix or manual) prices. The Company also failed to maintain an adequate process over the leveling and disclosure of fair value measurements. In the course of correcting these valuation errors, the Company also reassessed the presentation of the fair value hierarchy as disclosed within “Note 14: Fair Value of Financial Instruments.” This resulted in the determination in the leveling classification of $5,885.8 million of securities to Level 3 in the fair value hierarchy. The classification in Level 3 had no impact on the fair value of these securities.
In addition to these valuation errors, the Company did not receive the proceeds from a zero coupon private placement bond which had been called in 2011 and subsequently determined that the original notice for the bond had not been received or recorded.
The impact of the correction of these errors on the consolidated financial statements is presented in the “Summary of Correction of Investments Errors” table within the “Investments” section of this Note below.
·
Derivative Valuation –The Company did not appropriately apply U.S. GAAP accounting standards regarding the valuation of certain derivative instruments. Specifically, the Company did not properly recognize and measure counterparty non-performance risk on non-collateralized derivative assets. The impact of the correction of these errors on the consolidated financial statements is presented in the “Summary of Correction of Investments Errors” table within the “Investments” section of this Note below.
·
Structured Securities –The Company did not appropriately maintain a process over the assessment of accounting methodologies used to determine the appropriate interest income models. This resulted in improper income recognition and impairments for certain structured securities. In addition, the Company did not properly assess securitized financial assets for potential embedded derivatives which, when properly assessed, resulted in the reclassification of assets to fair value investments. The reclassification of these assets results in the recognition of the change in fair value of these assets in net investment income. The impact of the correction of these errors on the consolidated statements of comprehensive income is presented in the “Summary of Correction of Investments Errors” table within the “Investments” section of this Note below.
F-18
2.
Restatement and Amendment of Previously Reported Financial Information (continued)
| | | | | | | | | | | | | | | | | |
Increase (decrease) | Summary of Correction of Investments Errors – December 31, 2011 Balance Sheet Impacts(1) |
($ in millions) | Investments |
| OIA | | Available-for-Sale Securities | | Derivative Valuation | | Structured Securities | | Total Investments Errors(2) |
|
| Valuation | | Bond Call |
ASSETS: | | | | | | | | | | | | | | | | | |
Available-for-sale debt securities, at fair value | $ | — | | $ | (10.0) | | $ | (25.3) | | $ | — | | $ | (55.7) | | $ | (91.0) |
Available-for-sale equity securities, at fair value | | — | | | — | | | — | | | — | | | — | | | — |
Limited partnerships and other investments | | (35.9) | | | — | | | — | | | — | | | — | | | (35.9) |
Policy loans, at unpaid principal balances | | — | | | — | | | — | | | — | | | — | | | — |
Derivative investments | | — | | | — | | | — | | | (12.6) | | | — | | | (12.6) |
Fair value investments | | 44.0 | | | (2.2) | | | — | | | — | | | 55.7 | | | 97.5 |
Total investments | | 8.1 | | | (12.2) | | | (25.3) | | | (12.6) | | | — | | | (42.0) |
Cash and cash equivalents | | 2.0 | | | — | | | — | | | — | | | — | | | 2.0 |
Accrued investment income | | — | | | — | | | — | | | — | | | — | | | — |
Receivables | | — | | | — | | | — | | | — | | | — | | | — |
Deferred policy acquisition costs | | — | | | — | | | — | | | (13.1) | | | — | | | (13.1) |
Deferred income taxes, net | | — | | | — | | | — | | | — | | | — | | | — |
Other assets | | (4.4) | | | — | | | 23.2 | | | (6.7) | | | — | | | 12.1 |
Discontinued operations assets | | — | | | — | | | — | | | — | | | — | | | — |
Separate account assets | | — | | | — | | | — | | | — | | | — | | | — |
Total assets | $ | 5.7 | | $ | (12.2) | | $ | (2.1) | | $ | (32.4) | | $ | — | | $ | (41.0) |
| | | | | | | | | | | | | | | | | |
LIABILITIES: | | | | | | | | | | | | | | | | | |
Policy liabilities and accruals | $ | — | | $ | — | | $ | — | | $ | — | | $ | — | | $ | — |
Policyholder deposit funds | | — | | | — | | | — | | | — | | | — | | | — |
Dividend obligations | | 4.1 | | | (9.6) | | | (2.1) | | | — | | | — | | | (7.6) |
Indebtedness | | — | | | — | | | — | | | — | | | — | | | — |
Other liabilities | | 5.4 | | | 7.1 | | | — | | | — | | | — | | | 12.5 |
Discontinued operations liabilities | | — | | | — | | | — | | | — | | | — | | | — |
Separate account liabilities | | — | | | — | | | — | | | — | | | — | | | — |
Total liabilities | | 9.5 | | | (2.5) | | | (2.1) | | | — | | | — | | | 4.9 |
| | | | | | | | | | | | | | | | | |
STOCKHOLDERS’ EQUITY: | | | | | | | | | | | | | | | | | |
Common stock | | — | | | — | | | — | | | — | | | — | | | — |
Additional paid-in capital | | — | | | — | | | — | | | — | | | — | | | — |
Accumulated other comprehensive loss | | (15.7) | | | 24.3 | | | — | | | — | | | 3.0 | | | 11.6 |
Accumulated deficit | | 0.9 | | | 4.9 | | | — | | | (16.6) | | | (3.0) | | | (13.8) |
Treasury stock | | — | | | — | | | — | | | — | | | — | | | — |
Noncontrolling interests | | (1.0) | | | — | | | — | | | — | | | — | | | (1.0) |
Total stockholders’ equity –periods presented (3) | | (15.8) | | | 29.2 | | | — | | | (16.6) | | | — | | | (3.2) |
Total stockholders’ equity – cumulative impact (4) | | 12.0 | | | (38.9) | | | — | | | (15.8) | | | — | | | (42.7) |
Total stockholders’ equity – impact | | (3.8) | | | (9.7) | | | — | | | (32.4) | | | — | | | (45.9) |
Total liabilities and stockholders’ equity | $ | 5.7 | | $ | (12.2) | | $ | (2.1) | | $ | (32.4) | | $ | — | | $ | (41.0) |
———————
(1)
All amounts are shown before income taxes, unless otherwise noted.
(2)
Amounts represent the total “Summary of Correction of Investments Errors” which is further aggregated into the “Consolidated Summary of Correction of Errors” in the following pages.
(3)
Amounts represent restatement changes made to the 2011 and 2010 periods as presented.
(4)
Amounts represent cumulative impact of restatement changes made to periods prior to 2010.
F-19
2.
Restatement and Amendment of Previously Reported Financial Information (continued)
| | | | | | | | | | | | | | | | | |
Increase (decrease) | Summary of Correction of Investments Errors – December 31, 2011 Income Statement Impacts(1) |
($ in millions) | Investments |
| OIA | | Available-for-Sale Securities | | Derivative Valuation | | Structured Securities | | Total Investments Errors(2) |
|
| Valuation | | Bond Call |
REVENUES | | | | | | | | | | | | | | | | | |
Premiums | $ | — | | $ | — | | $ | — | | $ | — | | $ | — | | $ | — |
Fee income | | — | | | — | | | — | | | — | | | — | | | — |
Net investment income | | 12.6 | | | 2.6 | | | (0.1) | | | — | | | (2.2) | | | 12.9 |
Net realized investment gains (losses): | | | | | | | | | | | | | | | | | |
Total OTTI losses | | — | | | — | | | — | | | — | | | 4.5 | | | 4.5 |
Portion of OTTI losses recognized in OCI | | — | | | — | | | — | | | — | | | (3.5) | | | (3.5) |
Net OTTI losses recognized in earnings | | — | | | — | | | — | | | — | | | 1.0 | | | 1.0 |
Net realized investment gains (losses), excluding OTTI losses | | (2.2) | | | (0.9) | | | — | | | (13.0) | | | (1.3) | | | (17.4) |
Net realized investment gains (losses) | | (2.2) | | | (0.9) | | | — | | | (13.0) | | | (0.3) | | | (16.4) |
Gain on debt repurchase | | — | | | — | | | — | | | — | | | — | | | — |
Total revenues | | 10.4 | | | 1.7 | | | (0.1) | | | (13.0) | | | (2.5) | | | (3.5) |
| | | | | | | | | | | | | | | | | |
BENEFITS AND EXPENSES | | | | | | | | | | | | | | | | | |
Policy benefits, excluding policyholder dividends | | — | | | — | | | — | | | — | | | — | | | — |
Policyholder dividends | | 11.8 | | | (0.9) | | | (0.1) | | | — | | | 1.1 | | | 11.9 |
Policy acquisition cost amortization | | — | | | — | | | — | | | (0.6) | | | — | | | (0.6) |
Interest expense on indebtedness | | — | | | — | | | — | | | — | | | — | | | — |
Other operating expenses | | 1.2 | | | — | | | — | | | — | | | — | | | 1.2 |
Total benefits and expenses | | 13.0 | | | (0.9) | | | (0.1) | | | (0.6) | | | 1.1 | | | 12.5 |
Income (loss) from continuing operations before income taxes | | (2.6) | | | 2.6 | | | — | | | (12.4) | | | (3.6) | | | (16.0) |
Income tax expense (benefit) | | — | | | — | | | — | | | — | | | — | | | — |
Income (loss) from continuing operations | | (2.6) | | | 2.6 | | | — | | | (12.4) | | | (3.6) | | | (16.0) |
Noncontrolling interests | | (0.5) | | | — | | | — | | | — | | | — | | | (0.5) |
Income (loss) from discontinued operations, net of income taxes | | — | | | — | | | — | | | — | | | — | | | — |
Net income (loss) attributable to The Phoenix Companies, Inc. | $ | (2.1) | | $ | 2.6 | | $ | — | | $ | (12.4) | | $ | (3.6) | | $ | (15.5) |
———————
(1)
All amounts are shown before income taxes, unless otherwise noted.
(2)
Amounts represent the total “Summary of Correction of Investments Errors” which is further aggregated into the “Consolidated Summary of Correction of Errors” in the following pages.
(Continued on next page)
F-20
2.
Restatement and Amendment of Previously Reported Financial Information (continued)
| | | | | | | | | | | | | | | | | |
(Continued from previous page) | Summary of Correction of Investments Errors – December 31, 2011 |
Increase (decrease) | Income Statement Impacts(1) |
($ in millions) | Investments |
| OIA | | Available-for-Sale Securities | | Derivative Valuation | | Structured Securities | | Total Investments Errors(2) |
|
| Valuation | | Bond Call |
COMPREHENSIVE INCOME (LOSS): | | | | | | | | | | | | | | | | | |
Net income (loss) attributable to The Phoenix Companies, Inc. | $ | (2.1) | | $ | 2.6 | | $ | — | | $ | (12.4) | | $ | (3.6) | | $ | (15.5) |
Other comprehensive income (loss) before income taxes: | | | | | | | | | | | | | | | | | |
Net unrealized investment gains before income taxes | | (5.8) | | | 13.8 | | | — | | | — | | | 3.6 | | | 11.6 |
Non-credit portion of OTTI losses recognized in OCI before income taxes | | — | | | — | | | — | | | — | | | — | | | — |
Net pension liability adjustment before income taxes | | — | | | — | | | — | | | — | | | — | | | — |
Net unrealized other gains (losses) before income taxes | | — | | | — | | | — | | | — | | | — | | | — |
Net unrealized derivative instruments gains (losses) before income taxes | | — | | | — | | | — | | | — | | | — | | | — |
Other comprehensive income (loss) before income taxes | | (5.8) | | | 13.8 | | | — | | | — | | | 3.6 | | | 11.6 |
Less: Income tax expense (benefit) related to: | | | | | | | | | | | | | | | | | |
Net unrealized investment gains (losses) | | — | | | — | | | — | | | — | | | — | | | — |
Non-credit portion of OTTI losses recognized in OCI | | — | | | — | | | — | | | — | | | — | | | — |
Net pension liability adjustment | | — | | | — | | | — | | | — | | | — | | | — |
Net unrealized other gains (losses) | | — | | | — | | | — | | | — | | | — | | | — |
Net unrealized derivative instruments gains (losses) | | — | | | — | | | — | | | — | | | — | | | — |
Total income tax expense (benefit) | | — | | | — | | | — | | | — | | | — | | | — |
Other comprehensive income (loss), net of income taxes | | (5.8) | | | 13.8 | | | — | | | — | | | 3.6 | | | 11.6 |
Comprehensive income (loss) attributable to The Phoenix Companies, Inc. | | (7.9) | | | 16.4 | | | — | | | (12.4) | | | — | | | (3.9) |
Add: Comprehensive income attributable to noncontrolling interests | | — | | | — | | | — | | | — | | | — | | | — |
Comprehensive income (loss) | $ | (7.9) | | $ | 16.4 | | $ | — | | $ | (12.4) | | $ | — | | $ | (3.9) |
———————
(1)
All amounts are shown before income taxes, unless otherwise noted.
(2)
Amounts represent the total “Summary of Correction of Investments Errors” which is further aggregated into the “Consolidated Summary of Correction of Errors” in the following pages.
F-21
2.
Restatement and Amendment of Previously Reported Financial Information (continued)
| | | | | | | | | | | | | | | | | |
Increase (decrease) | Summary of Correction of Investments Errors – December 31, 2010 Income Statement Impacts(1) |
($ in millions) | Investments |
| OIA | | Available-for-Sale Securities | | Derivative Valuation | | Structured Securities | | Total Investments Errors(2) |
|
| Valuation | | Bond Call |
REVENUES | | | | | | | | | | | | | | | | | |
Premiums | $ | — | | $ | — | | $ | — | | $ | — | | $ | — | | $ | — |
Fee income | | — | | | — | | | — | | | — | | | — | | | — |
Net investment income | | (3.7) | | | 1.9 | | | — | | | — | | | (2.9) | | | (4.7) |
Net realized investment gains (losses): | | | | | | | | | | | | | | | | | |
Total OTTI losses | | — | | | — | | | — | | | — | | | (1.0) | | | (1.0) |
Portion of OTTI losses recognized in OCI | | — | | | — | | | — | | | — | | | 3.0 | | | 3.0 |
Net OTTI losses recognized in earnings | | — | | | — | | | — | | | — | | | 2.0 | | | 2.0 |
Net realized investment gains (losses), excluding OTTI losses | | 0.2 | | | 0.7 | | | — | | | (1.3) | | | (1.6) | | | (2.0) |
Net realized investment gains (losses) | | 0.2 | | | 0.7 | | | — | | | (1.3) | | | 0.4 | | | — |
Gain on debt repurchase | | — | | | — | | | — | | | — | | | — | | | — |
Total revenues | | (3.5) | | | 2.6 | | | — | | | (1.3) | | | (2.5) | | | (4.7) |
| | | | | | | | | | | | | | | | | |
BENEFITS AND EXPENSES | | | | | | | | | | | | | | | | | |
Policy benefits, excluding policyholder dividends | | — | | | — | | | — | | | — | | | — | | | – |
Policyholder dividends | | (7.4) | | | 0.3 | | | — | | | — | | | (3.1) | | | (10.2) |
Policy acquisition cost amortization | | — | | | — | | | — | | | 2.9 | | | — | | | 2.9 |
Interest expense on indebtedness | | — | | | — | | | — | | | — | | | — | | | — |
Other operating expenses | | 1.4 | | | — | | | — | | | — | | | — | | | 1.4 |
Total benefits and expenses | | (6.0) | | | 0.3 | | | — | | | 2.9 | | | (3.1) | | | (5.9) |
Income (loss) from continuing operations before income taxes | | 2.5 | | | 2.3 | | | — | | | (4.2) | | | 0.6 | | | 1.2 |
Income tax expense (benefit) | | — | | | — | | | — | | | — | | | — | | | — |
Income (loss) from continuing operations | | 2.5 | | | 2.3 | | | — | | | (4.2) | | | 0.6 | | | 1.2 |
Noncontrolling interests | | (0.5) | | | — | | | — | | | — | | | — | | | (0.5) |
Income (loss) from discontinued operations, net of income taxes | | — | | | — | | | — | | | — | | | — | | | — |
Net income (loss) attributable to The Phoenix Companies, Inc. | $ | 3.0 | | $ | 2.3 | | $ | — | | $ | (4.2) | | $ | 0.6 | | $ | 1.7 |
———————
(1)
All amounts are shown before income taxes, unless otherwise noted.
(2)
Amounts represent the total “Summary of Correction of Investments Errors” which is further aggregated into the “Consolidated Summary of Correction of Errors” in the following pages.
(Continued on next page)
F-22
2.
Restatement and Amendment of Previously Reported Financial Information (continued)
| | | | | | | | | | | | | | | | | |
(Continued from previous page) | Summary of Correction of Errors – December 31, 2010 |
Increase (decrease) | Income Statement Impacts(1) |
($ in millions) | Investments |
| OIA | | Available-for-Sale Securities | | Derivative Valuation | | Structured Securities | | Total Investments Errors(2) |
|
| Valuation | | Bond Call |
COMPREHENSIVE INCOME (LOSS): | | | | | | | | | | | | | | | | | |
Net income (loss) attributable to The Phoenix Companies, Inc. | $ | 3.0 | | $ | 2.3 | | $ | — | | $ | (4.2) | | $ | 0.6 | | $ | 1.7 |
Other comprehensive income (loss) before income taxes: | | | | | | | | | | | | | | | | | |
Net unrealized investment gains before income taxes | | (9.9) | | | 10.5 | | | — | | | — | | | (0.6) | | | — |
Non-credit portion of OTTI losses recognized in OCI before income taxes | | — | | | — | | | — | | | — | | | — | | | — |
Net pension liability adjustment before income taxes | | — | | | — | | | — | | | — | | | — | | | — |
Net unrealized other gains (losses) before income taxes | | — | | | — | | | — | | | — | | | — | | | — |
Net unrealized derivative instruments gains (losses) before income taxes | | — | | | — | | | — | | | — | | | — | | | — |
Other comprehensive income (loss) before income taxes | | (9.9) | | | 10.5 | | | — | | | — | | | (0.6) | | | — |
Less: Income tax expense (benefit) related to: | | | | | | | | | | | | | | | | | |
Net unrealized investment gains (losses) | | — | | | — | | | — | | | — | | | — | | | — |
Non-credit portion of OTTI losses recognized in OCI | | — | | | — | | | — | | | — | | | — | | | — |
Net pension liability adjustment | | — | | | — | | | — | | | — | | | — | | | — |
Net unrealized other gains (losses) | | — | | | — | | | — | | | — | | | — | | | — |
Net unrealized derivative instruments gains (losses) | | — | | | — | | | — | | | — | | | — | | | — |
Total income tax expense (benefit) | | — | | | — | | | — | | | — | | | — | | | — |
Other comprehensive income (loss), net of income taxes | | (9.9) | | | 10.5 | | | — | | | — | | | (0.6) | | | — |
Comprehensive income (loss) attributable to The Phoenix Companies, Inc. | | (6.9) | | | 12.8 | | | — | | | (4.2) | | | — | | | 1.7 |
Add: Comprehensive income attributable to noncontrolling interests | | — | | | — | | | — | | | — | | | — | | | — |
Comprehensive income (loss) | $ | (6.9) | | $ | 12.8 | | $ | — | | $ | (4.2) | | $ | — | | $ | 1.7 |
———————
(1)
All amounts are shown before income taxes, unless otherwise noted.
(2)
Amounts represent the total “Summary of Correction of Investments Errors” which are further aggregated into the “Consolidated Summary of Correction of Errors” in the following pages.
F-23
2.
Restatement and Amendment of Previously Reported Financial Information (continued)
Reinsurance Accounting
In 2008 and in 2009, the Company entered into complex reinsurance agreements with one of its reinsurers which resulted in net costs incurred to the Company. Rather than appropriately deferring and amortizing these costs over the life of the underlying business, the Company had previously recognized these costs immediately in net income. The impact of the correction of these errors on the consolidated financial statements is presented in the“Consolidated Summary of Correction of Errors” table within this Note below.
The Company also determined that loss recognition was appropriate for a portion of the underlying block of business both, prior to and subsequent to, entering into the reinsurance agreement. The impact of the loss recognition prior to the reinsurance then indirectly impacted the amount of costs deferred at day one. The impact of the loss recognition error on those costs deferred resulted in a reduction of approximately $39.6 million and is reflected within the“Summary of Correction of Actuarial Finance Errors” table above. The impact of the reinsurance component of this error on the consolidated financial statements is presented in the“Consolidated Summary of Correction of Errors” table within this Note below.
In addition, certain errors were identified related to the Company’s net presentation of direct and ceded reinsurance liabilities on the consolidated balance sheets. As a result, ceded policy liabilities were reclassified from policy liabilities and accruals to receivables within the consolidated balance sheets to correct the error and reflect the proper gross presentation required under U.S. GAAP. See“Changes in Classifications” section below for additional information.
Pensions
Pension adjustments summarized below primarily relate to the valuation of our defined benefit plans and post retirement liabilities as a result of census data errors and incorrect application of the Company’s benefit plan features in the calculation of the liabilities. The impact of the correction of these errors on the consolidated financial statements is presented in the“Consolidated Summary of Correction of Errors” table within this Note below.
Limited Partnerships and Other Investments Taxable Income Reporting
An error related to the completeness and accuracy of taxable income related to our OIA portfolio was identified resulting in the inappropriate exclusion of taxable income reported from partnerships during the period from 2008 through 2011. The impact of the correction of these errors on the consolidated financial statements is presented in the“Consolidated Summary of Correction of Errors” table within this Note below.
Cash Flows and Changes in Classifications
·
Consolidated Statement of Cash Flows –The Company identified errors within its previously issued consolidated statement of cash flows which primarily consisted of: (i) the incorrect classification of deposits and withdrawals of universal life products as cash flows used for operating activities; (ii) the incorrect classification of capitalized interest on policy loans as an investing activity; (iii) certain other classification errors within cash flows from investing activities primarily related to investment purchases and sales; and (iv) the net impact of all other errors previously and separately described within this Note. The impact of the correction of these errors to each individual financial statement line item within the consolidated statement of cash flows is summarized below and included in detail within the restated and amended consolidated statement of cash flows within this Note.
| | | | | |
Increase (decrease) | For the year ended |
($ in millions) | December 31, |
| 2011 | | 2010 |
Consolidated Statement of Cash Flows | | | | | |
Cash provided by (used for) operating activities | $ | (299.4) | | $ | (364.6) |
Cash provided by (used for) investing activities | | 138.6 | | | 180.5 |
Cash provided by (used for) financing activities | | 161.6 | | | 161.8 |
F-24
2.
Restatement and Amendment of Previously Reported Financial Information (continued)
In addition to these errors noted above, the Company made certain changes in presentation to enhance disclosure of certain cash activity within the consolidated statement of cash flows. Most significantly: (i) interest credited to policyholder accounts has been separately disclosed within cash flows used for operating activities; and (ii) deposits into and withdrawals from separate accounts have been presented gross, rather than net, within cash flows provided by financing activities which are also reflected in the correction of errors above and within the restated and amended consolidated statement of cash flows within this Note. These changes in presentation did not have any impact on total cash flows provided by (used for) continuing operations, investing activities or financing activities.
·
Changes in Classifications –The Company made certain corrections to: (i) present outstanding checks and cash held as collateral by a third party related to our derivative transactions in order to appropriately reflect the legal right of offset and to properly reclassify certain suspense accounts; (ii) reflect direct and ceded reinsurance liabilities gross in the consolidated balance sheets as described above in “Reinsurance Accounting” section; and (iii) reclassify sales inducements assets from deferred policy acquisition costs to other assets as well as separately present dividend obligations as its own financial statement line within the consolidated balance sheets. These corrections had no impact to net income or total stockholders’ equity. The impact of the changes in classification are reflected in the correction of errors column in the“Consolidated Summary of Correction of Errors” table within this Note.
Revision for the Retrospective Adoption of Amended Accounting Guidance
In October 2010, the Financial Accounting Standards Board (the “FASB”) issued amended guidance to ASC 944,Financial Services – Insurance, to address the diversity in practice for accounting for costs associated with acquiring or renewing insurance contracts. The amendment clarifies the definition of acquisition costs (i.e., costs which qualify for deferral) to include only incremental direct costs that result directly from, and are essential to, a contract and would not have been incurred by the insurance entity had the contract transaction not occurred. Therefore, only costs related to successful efforts of acquiring a new, or renewal, contract should be deferred. This guidance was retrospectively adopted on January 1, 2012 and such retrospective adoption results in amendments to previously reported balances as shown in the table below as if the guidance was applied at the inception of all policies in force. The cumulative effect of retrospective adoption reduced deferred policy acquisition costs and beginning stockholders’ equity by $166.5 million as of January 1, 2012. In any period, the adoption resulted in a decrease in amortization of policy acquisition costs due to the reduced deferred policy acquisition cost asset. Adjustments for the retrospective adoption reflect the impact of the adoption after consideration of correcting the errors associated with the restatement as noted more fully in the tables reflecting the impact of the retrospective adoption on consolidated financial statements presented within this Note below.
F-25
2.
Restatement and Amendment of Previously Reported Financial Information (continued)
| | | | | | | | | | | | | | | | | | | | | | | | | | | | | |
Increase (decrease) | Consolidated Summary of Correction of Errors – December 31, 2011 Balance Sheet Impacts(1) |
($ in millions) | Total Actuarial Finance(2) | | Total Investments(3) | | Reinsurance Accounting | | Pensions | | OIA Taxable Income | | Changes in Classification | | | | |
| | Cash and Suspense | | Reinsurance | | Reclassify & Separately Present | Other Restatement Adjustments | Total Correction of Errors(4) |
|
|
ASSETS: | | | | | | | | | | | | | | | | | | | | | | | | | | | | | |
Available-for-sale
debt securities, at fair value | $ | — | | $ | (91.0) | | $ | — | | $ | — | | $ | — | | $ | — | | $ | — | | $ | — | | $ | (2.0) | | $ | (93.0) |
Available-for-sale
equity securities, at fair value | | — | | | — | | | — | | | — | | | — | | | — | | | — | | | — | | | — | | | — |
Limited partnerships and
other investments | | — | | | (35.9) | | | — | | | — | | | — | | | — | | | — | | | — | | | (0.1) | | | (36.0) |
Policy loans,
at unpaid principal balances | | — | | | — | | | — | | | — | | | — | | | — | | | — | | | — | | | — | | | — |
Derivative investments | | — | | | (12.6) | | | — | | | — | | | — | | | — | | | — | | | — | | | — | | | (12.6) |
Fair value investments | | — | | | 97.5 | | | — | | | — | | | — | | | — | | | — | | | — | | | (0.1) | | | 97.4 |
Total investments | | — | | | (42.0) | | | — | | | — | | | — | | | — | | | — | | | — | | | (2.2) | | | (44.2) |
Cash and cash equivalents | | — | | | 2.0 | | | — | | | — | | | — | | | (28.4) | | | — | | | — | | | 0.3 | | | (26.1) |
Accrued investment income | | — | | | — | | | — | | | — | | | — | | | — | | | — | | | — | | | — | | | — |
Receivables | | 17.6 | | | — | | | — | | | — | | | — | | | 16.4 | | | 196.6 | | | — | | | 2.9 | | | 233.5 |
Deferred policy acquisition costs | | 41.5 | | | (13.1) | | | — | | | — | | | — | | | — | | | — | | | (42.2) | | | 0.1 | | | (13.7) |
Deferred income taxes, net | | — | | | — | | | — | | | — | | | — | | | — | | | — | | | — | | | 2.4 | | | 2.4 |
Other assets | | (33.8) | | | 12.1 | | | 39.6 | | | — | | | — | | | 8.8 | | | — | | | 42.2 | | | (2.4) | | | 66.5 |
Discontinued operations assets | | — | | | — | | | — | | | — | | | — | | | — | | | 14.1 | | | — | | | 2.0 | | | 16.1 |
Separate account assets | | — | | | — | | | — | | | (0.7) | | | — | | | — | | | — | | | — | | | — | | | (0.7) |
Total assets | $ | 25.3 | | $ | (41.0) | | $ | 39.6 | | $ | (0.7) | | $ | — | | $ | (3.2) | | $ | 210.7 | | $ | — | | $ | 3.1 | | $ | 233.8 |
———————
(1)
All amounts are shown before income taxes, unless otherwise noted.
(2)
Represents “Summary of Correction of Actuarial Finance Errors” from the previous pages of this Note.
(3)
Represents “Summary of Correction of Investments Errors from the previous pages of this Note.
(4)
Amounts represent total correction of errors which is also presented in the“Consolidated Statement of Comprehensive Income”reflected in the tables on the following pages.
(Continued on next page)
F-26
2.
Restatement and Amendment of Previously Reported Financial Information (continued)
| | | | | | | | | | | | | | | | | | | | | | | | | | | | | |
(Continued from previous page) | Consolidated Summary of Correction of Errors – December 31, 2011 Balance Sheet Impacts(1) |
Increase (decrease) | Total Actuarial Finance(2) | | Total Investments(3) | | Reinsurance Accounting | | Pensions | | OIA Taxable Income | | Changes in Classification | | | | |
($ in millions) | Cash and Suspense | | Reinsurance | | Reclassify & Separately Present | | Other Restatement Adjustments | | Total Correction of Errors(4) |
|
|
LIABILITIES: | | | | | | | | | | | | | | | | | | | | | | | | | | | | | |
Policy liabilities and accruals | $ | 240.7 | | $ | — | | $ | — | | $ | — | | $ | — | | $ | — | | $ | 196.6 | | $ | (759.8) | | $ | 5.3 | | $ | (317.2) |
Policyholder deposit funds | | 2.9 | | | — | | | — | | | — | | | — | | | — | | | — | | | — | | | (0.1) | | | 2.8 |
Dividend obligation | | 1.0 | | | (7.6) | | | — | | | — | | | — | | | — | | | — | | | 759.8 | | | (0.7) | | | 752.5 |
Indebtedness | | — | | | — | | | — | | | — | | | — | | | — | | | — | | | — | | | — | | | — |
Other liabilities | | 0.2 | | | 12.5 | | | — | | | 22.9 | | | 6.9 | | | (3.2) | | | — | | | — | | | 5.0 | | | 44.3 |
Discontinued operations
liabilities | | — | | | — | | | — | | | — | | | — | | | — | | | 14.1 | | | — | | | 2.0 | | | 16.1 |
Separate account liabilities | | — | | | — | | | — | | | (0.7) | | | — | | | — | | | — | | | — | | | — | | | (0.7) |
Total liabilities | | 244.8 | | | 4.9 | | | — | | | 22.2 | | | 6.9 | | | (3.2) | | | 210.7 | | | — | | | 11.5 | | | 497.8 |
| | | | | | | | | | | | | | | | | | | | | | | | | | | | | |
| | | | | | | | | | | | | | | | | | | | | | | | | | | | | |
STOCKHOLDERS’ EQUITY: | | | | | | | | | | | | | | | | | | | | | | | | | | | | | |
Common stock | | — | | | — | | | — | | | — | | | — | | | — | | | — | | | — | | | — | | | — |
Additional paid-in capital | | — | | | — | | | — | | | — | | | — | | | — | | | — | | | — | | | — | | | — |
Accumulated other
comprehensive loss | | (14.2) | | | 11.6 | | | — | | | (13.4) | | | — | | | — | | | — | | | — | | | (49.7) | | | (65.7) |
Accumulated deficit | | (114.9) | | | (13.8) | | | 3.0 | | | 5.3 | | | (3.3) | | | — | | | — | | | — | | | 11.1 | | | (112.6) |
Treasury stock | | — | | | — | | | — | | | — | | | — | | | — | | | — | | | — | | | — | | | — |
Noncontrolling interests | | — | | | (1.0) | | | — | | | — | | | — | | | — | | | — | | | — | | | — | | | (1.0) |
Total stockholders’ equity –
periods presented (5) | | (129.1) | | | (3.2) | | | 3.0 | | | (8.1) | | | (3.3) | | | — | | | — | | | — | | | (38.6) | | | (179.3) |
Total stockholders’ equity –
cumulative impact (6) | | (90.4) | | | (42.7) | | | 36.6 | | | (14.8) | | | (3.6) | | | — | | | — | | | — | | | 30.2 | | | (84.7) |
Total stockholders’ equity –impact | | (219.5) | | | (45.9) | | | 39.6 | | | (22.9) | | | (6.9) | | | — | | | — | | | — | | | (8.4) | | | (264.0) |
Total liabilities and
stockholders’ equity | $ | 25.3 | | $ | (41.0) | | $ | 39.6 | | $ | (0.7) | | $ | — | | $ | (3.2) | | $ | 210.7 | | $ | — | | $ | 3.1 | | $ | 233.8 |
———————
(1)
All amounts are shown before income taxes, unless otherwise noted.
(2)
Represents “Summary of Correction of Actuarial Finance Errors” from the previous pages of this Note.
(3)
Represents “Summary of Correction of Investments Errors from the previous pages of this Note.
(4)
Amounts represent total correction of errors which is also presented in the“Consolidated Statement of Comprehensive Income”reflected in the tables on the following pages.
(5)
Amounts represent restatement changes made to the 2011 and 2010 periods as presented.
(6)
Amounts represent cumulative impact of restatement changes made to periods prior to 2010.
F-27
2.
Restatement and Amendment of Previously Reported Financial Information (continued)
| | | | | | | | | | | | | | | | | | | | |
Increase (decrease) | Summary of Correction of Errors – December 31, 2011 Income Statement Impacts(1) |
($ in millions) | | | | | | | Consolidated | | | | | | |
| Total Actuarial Finance(2) | | Total Investments(3) | | Reinsurance Accounting | | Pensions | | OIA Taxable Income | | Other Restatement Adjustments | | Total Correction of Errors(4) |
REVENUES | | | | | | | | | | | | | | | | | | | | |
Premiums | $ | (10.4) | | $ | — | | $ | — | | $ | — | | $ | — | | $ | — | | $ | (10.4) |
Fee income | | (0.3) | | | — | | | — | | | — | | | — | | | — | | | (0.3) |
Net investment income | | — | | | 12.9 | | | — | | | — | | | — | | | 0.1 | | | 13.0 |
Net realized investment gains (losses): | | | | | | | | | | | | | | | | | | | | |
Total OTTI losses | | — | | | 4.5 | | | — | | | — | | | — | | | (5.2) | | | (0.7) |
Portion of OTTI losses recognized in OCI | | — | | | (3.5) | | | — | | | — | | | — | | | 3.1 | | | (0.4) |
Net OTTI losses recognized in earnings | | — | | | 1.0 | | | — | | | — | | | — | | | (2.1) | | | (1.1) |
Net realized investment gains (losses), excluding OTTI losses | | (1.1) | | | (17.4) | | | — | | | — | | | — | | | 3.9 | | | (14.6) |
Net realized investment gains (losses) | | (1.1) | | | (16.4) | | | — | | | — | | | — | | | 1.8 | | | (15.7) |
Gain on debt repurchase | | — | | | — | | | — | | | — | | | — | | | 0.2 | | | 0.2 |
Total revenues | | (11.8) | | | (3.5) | | | — | | | — | | | — | | | 2.1 | | | (13.2) |
| | | | | | | | | | | | | | | | | | | | |
BENEFITS AND EXPENSES | | | | | | | | | | | | | | | | | | | | |
Policy benefits, excluding policyholder dividends | | 45.8 | | | — | | | 3.3 | | | — | | | — | | | (0.1) | | | 49.0 |
Policyholder dividends | | (1.3) | | | 11.9 | | | — | | | — | | | — | | | 1.7 | | | 12.3 |
Policy acquisition cost amortization | | (14.5) | | | (0.6) | | | — | | | — | | | — | | | (0.2) | | | (15.3) |
Interest expense on indebtedness | | — | | | — | | | — | | | — | | | — | | | — | | | — |
Other operating expenses | | 6.6 | | | 1.2 | | | — | | | (7.1) | | | — | | | 0.7 | | | 1.4 |
Total benefits and expenses | | 36.6 | | | 12.5 | | | 3.3 | | | (7.1) | | | — | | | 2.1 | | | 47.4 |
Income (loss) from continuing operations before income taxes | | (48.4) | | | (16.0) | | | (3.3) | | | 7.1 | | | — | | | — | | | (60.6) |
Income tax expense (benefit) | | — | | | — | | | — | | | — | | | (1.6) | | | 3.0 | | | 1.4 |
Income (loss) from continuing operations | | (48.4) | | | (16.0) | | | (3.3) | | | 7.1 | | | 1.6 | | | (3.0) | | | (62.0) |
Noncontrolling interests | | — | | | (0.5) | | | — | | | — | | | — | | | — | | | (0.5) |
Income (loss) from discontinued operations, net of income taxes | | — | | | — | | | — | | | — | | | — | | | 0.4 | | | 0.4 |
Net income (loss) attributable to The Phoenix Companies, Inc. | $ | (48.4) | | $ | (15.5) | | $ | (3.3) | | $ | 7.1 | | $ | 1.6 | | $ | (2.6) | | $ | (61.1) |
———————
(1)
All amounts are shown before income taxes, unless otherwise noted.
(2)
Represents “Summary of Correction of Actuarial Finance Errors” from the previous pages of this Note.
(3)
Represents “Summary of Correction of Investments Errors from the previous pages of this Note.
(4)
Amounts represent total correction of errors which is also presented in the“Consolidated Statement of Comprehensive Income”reflected in the tables on the following pages.
(Continued on next page)
F-28
2.
Restatement and Amendment of Previously Reported Financial Information (continued)
| | | | | | | | | | | | | | | | | | | | |
(Continued from previous page) | Summary of Correction of Errors – December 31, 2011 Income Statement Impacts(1) |
Increase (decrease) | | | | | | | Consolidated | | | | | | |
($ in millions) | Total Actuarial Finance(2) | | Total Investments(3) | | Reinsurance Accounting | | Pensions | | OIA Taxable Income | | Other Restatement Adjustments | | Total Correction of Errors(4) |
|
|
COMPREHENSIVE INCOME (LOSS): | | | | | | | | | | | | | | | | | | | | |
Net income (loss) attributable to The Phoenix Companies, Inc. | $ | (48.4) | | $ | (15.5) | | $ | (3.3) | | $ | 7.1 | | $ | 1.6 | | $ | (2.6) | | $ | (61.1) |
Other comprehensive income (loss) before income taxes: | | | | | | | | | | | | | | | | | | | | |
Net unrealized investment gains before income taxes (5) | | (35.9) | | | 11.6 | | | — | | | — | | | — | | | (0.8) | | | (25.1) |
Non-credit portion of OTTI losses recognized in OCI
before income taxes (5) | | — | | | — | | | — | | | — | | | — | | | (1.3) | | | (1.3) |
Net pension liability adjustment before income taxes | | — | | | — | | | — | | | (14.9) | | | — | | | — | | | (14.9) |
Net unrealized other gains (losses) before income taxes | | | | | — | | | — | | | — | | | — | | | — | | | — |
Net unrealized derivative instruments gains (losses)
before income taxes (5) | | — | | | — | | | — | | | — | | | — | | | (0.3) | | | (0.3) |
Other comprehensive income (loss) before income taxes | | (35.9) | | | 11.6 | | | — | | | (14.9) | | | — | | | (2.4) | | | (41.6) |
Less: Income tax expense (benefit) related to: | | | | | | | | | | | | | | | | | | | | |
Net unrealized investment gains (losses)(5) | | — | | | — | | | — | | | — | | | — | | | 11.6 | | | 11.6 |
Non-credit portion of OTTI losses recognized in OCI (5) | | — | | | — | | | — | | | — | | | — | | | (0.5) | | | (0.5) |
Net pension liability adjustment | | — | | | — | | | — | | | — | | | — | | | — | | | — |
Net unrealized other gains (losses) | | — | | | — | | | — | | | — | | | — | | | — | | | — |
Net unrealized derivative instruments gains (losses) | | — | | | — | | | — | | | — | | | — | | | — | | | — |
Total income tax expense (benefit) | | | | | — | | | — | | | — | | | | | | 11.1 | | | 11.1 |
Other comprehensive income (loss), net of income taxes | | (35.9) | | | 11.6 | | | — | | | (14.9) | | | — | | | (13.5) | | | (52.7) |
Comprehensive income (loss) attributable to The Phoenix Companies, Inc. | | (84.3) | | | (3.9) | | | (3.3) | | | (7.8) | | | 1.6 | | | (16.1) | | | (113.8) |
Add: Comprehensive income attributable to noncontrolling interests | | — | | | — | | | — | | | — | | | — | | | (0.5) | | | (0.5) |
Comprehensive income (loss) | $ | (84.3) | | $ | (3.9) | | $ | (3.3) | | $ | (7.8) | | $ | 1.6 | | $ | (16.6) | | $ | (114.3) |
———————
(1)
All amounts are shown before income taxes, unless otherwise noted.
(2)
Represents “Summary of Correction of Actuarial Finance Errors” from the previous pages of this Note.
(3)
Represents “Summary of Correction of Investments Errors from the previous pages of this Note.
(4)
Amounts represent total correction of errors which is also presented in the“Consolidated Statement of Comprehensive Income”reflected in the tables on the following pages.
(5)
In addition to adjustments described within this footnote the correction of errors column contains reclassifications related to changes in presentation of components of other comprehensive income.
F-29
(6)
2.
Restatement and Amendment of Previously Reported Financial Information (continued)
| | | | | | | | | | | | | | | | | | | | |
Increase (decrease) | Summary of Correction of Errors – December 31, 2010 Income Statement Impacts(1) |
($ in millions) | | | | | | | Consolidated | | | | | | |
| Total Actuarial Finance(2) | | Total Investments(3) | | Reinsurance Accounting | | Pensions | | OIA Taxable Income | | Other Restatement Adjustments | | Total Correction of Errors(4) |
REVENUES | | | | | | | | | | | | | | | | | | | | |
Premiums | $ | (13.9) | | $ | — | | $ | — | | $ | — | | $ | — | | $ | — | | $ | (13.9) |
Fee income | | 3.4 | | | — | | | — | | | — | | | — | | | (0.1) | | | 3.3 |
Net investment income | | — | | | (4.7) | | | — | | | — | | | — | | | 0.6 | | | (4.1) |
Net realized investment gains (losses): | | | | | | | | | | | | | | | | | | | | |
Total OTTI losses | | — | | | (1.0) | | | — | | | — | | | — | | | (1.1) | | | (2.1) |
Portion of OTTI losses recognized in OCI | | — | | | 3.0 | | | — | | | — | | | — | | | 0.1 | | | 3.1 |
Net OTTI losses recognized in earnings | | — | | | 2.0 | | | — | | | — | | | — | | | (1.0) | | | 1.0 |
Net realized investment gains (losses), excluding OTTI losses | | (4.9) | | | (2.0) | | | — | | | — | | | — | | | 4.6 | | | (2.3) |
Net realized investment gains (losses) | | (4.9) | | | — | | | — | | | — | | | — | | | 3.6 | | | (1.3) |
Gain on debt repurchase | | — | | | — | | | — | | | — | | | — | | | — | | | — |
Total revenues | | (15.4) | | | (4.7) | | | — | | | — | | | — | | | 4.1 | | | (16.0) |
| | | | | | | | | | | | | | | | | | | | |
BENEFITS AND EXPENSES | | | | | | | | | | | | | | | | | | | | |
Policy benefits, excluding policyholder dividends | | 25.9 | | | — | | | (6.3) | | | — | | | — | | | — | | | 19.6 |
Policyholder dividends | | (0.5) | | | (10.2) | | | — | | | — | | | — | | | 2.7 | | | (8.0) |
Policy acquisition cost amortization | | 26.0 | | | 2.9 | | | — | | | — | | | — | | | — | | | 28.9 |
Interest expense on indebtedness | | — | | | — | | | — | | | — | | | — | | | — | | | — |
Other operating expenses | | (0.3) | | | 1.4 | | | — | | | 1.7 | | | — | | | (7.6) | | | (4.8) |
Total benefits and expenses | | 51.1 | | | (5.9) | | | (6.3) | | | 1.7 | | | — | | | (4.9) | | | 35.7 |
Income (loss) from continuing operations before income taxes | | (66.5) | | | 1.2 | | | 6.3 | | | (1.7) | | | — | | | 9.0 | | | (51.7) |
Income tax expense (benefit) | | — | | | — | | | — | | | — | | | 4.9 | | | (20.3) | | | (15.4) |
Income (loss) from continuing operations | | (66.5) | | | 1.2 | | | 6.3 | | | (1.7) | | | (4.9) | | | 29.3 | | | (36.3) |
Noncontrolling interests | | — | | | (0.5) | | | — | | | — | | | — | | | — | | | (0.5) |
Income (loss) from discontinued operations, net of income taxes | | — | | | — | | | — | | | — | | | — | | | (15.6) | (5) | | (15.6) |
Net income (loss) attributable to The Phoenix Companies, Inc. | $ | (66.5) | | $ | 1.7 | | $ | 6.3 | | $ | (1.7) | | $ | (4.9) | | $ | 13.7 | | $ | (51.4) |
———————
(1)
All amounts are shown before income taxes, unless otherwise noted.
(2)
Represents “Summary of Correction of Actuarial Finance Errors” from the previous pages of this Note.
(3)
Represents “Summary of Correction of Investments Errors from the previous pages of this Note.
(4)
Amounts represent total correction of errors which is also presented in the“Consolidated Statement of Comprehensive Income”reflected in the tables on the following pages.
(5)
Amount represents the correction of an error of $15.6 million which decreased the estimated loss on the sale of PFG initially recorded in 2009.
(Continued on next page)
F-30
2.
Restatement and Amendment of Previously Reported Financial Information (continued)
| | | | | | | | | | | | | | | | | | | | |
(Continued from previous page) | Summary of Correction of Errors – December 31, 2010 Income Statement Impacts(1) |
Increase (decrease) | | | | | | | Consolidated | | | | | | |
($ in millions) | Total Actuarial Finance(2) | | Total Investments(3) | | Reinsurance Accounting | | Pensions | | OIA Taxable Income | | Other Restatement Adjustments | | Total Correction of Errors(4) |
|
|
COMPREHENSIVE INCOME (LOSS): | | | | | | | | | | | | | | | | | | | | |
Net income (loss) attributable to The Phoenix Companies, Inc. | $ | (66.5) | | $ | 1.7 | | $ | 6.3 | | $ | (1.7) | | $ | (4.9) | | $ | 13.7 | | $ | (51.4) |
Other comprehensive income (loss) before income taxes: | | | | | | | | | | | | | | | | | | | | |
Net unrealized investment gains before income taxes (5) | | 21.7 | | | — | | | — | | | — | | | — | | | 14.6 | | | 36.3 |
Non-credit portion of OTTI losses recognized in OCI before income taxes (5) | | — | | | — | | | — | | | — | | | — | | | 10.5 | | | 10.5 |
Net pension liability adjustment before income taxes | | — | | | — | | | — | | | 1.4 | | | — | | | — | | | 1.4 |
Net unrealized other gains (losses) before income taxes | | — | | | — | | | — | | | — | | | — | | | — | | | — |
Net unrealized derivative instruments gains (losses) before income taxes (5) | | — | | | — | | | — | | | — | | | — | | | (28.3) | | | (28.3) |
Other comprehensive income (loss) before income taxes | | 21.7 | | | — | | | — | | | 1.4 | | | — | | | (3.2) | | | 19.9 |
Less: Income tax expense (benefit) related to: | | | | | | | | | | | | | | | | | | | | |
Net unrealized investment gains (losses)(5) | | — | | | — | | | — | | | — | | | — | | | 28.1 | | | 28.1 |
Non-credit portion of OTTI losses recognized in OCI (5) | | — | | | — | | | — | | | — | | | — | | | 4.9 | | | 4.9 |
Net pension liability adjustment | | — | | | — | | | — | | | — | | | — | | | — | | | — |
Net unrealized other gains (losses) | | — | | | — | | | — | | | — | | | — | | | — | | | — |
Net unrealized derivative instruments gains (losses) | | — | | | — | | | — | | | — | | | — | | | — | | | — |
Total income tax expense (benefit) | | — | | | — | | | — | | | — | | | — | | | 33.0 | | | 33.0 |
Other comprehensive income (loss), net of income taxes | | 21.7 | | | — | | | — | | | 1.4 | | | — | | | (36.2) | | | (13.1) |
Comprehensive income (loss) attributable to The Phoenix Companies, Inc. | | (44.8) | | | 1.7 | | | 6.3 | | | (0.3) | | | (4.9) | | | (22.5) | | | (64.5) |
Add: Comprehensive income attributable to noncontrolling interests | | — | | | — | | | — | | | — | | | — | | | (0.5) | | | (0.5) |
Comprehensive income (loss) | $ | (44.8) | | $ | 1.7 | | $ | 6.3 | | $ | (0.3) | | $ | (4.9) | | $ | (23.0) | | $ | (65.0) |
———————
(1)
All amounts are shown before income taxes, unless otherwise noted.
(2)
Represents “Summary of Correction of Actuarial Finance Errors” from the previous pages of this Note.
(3)
Represents “Summary of Correction of Investments Errors from the previous pages of this Note.
(4)
Amounts represent total correction of errors which is also presented in the“Consolidated Statement of Comprehensive Income”reflected in the tables on the following pages.
(5)
In addition to adjustments described within this footnote the correction of errors column contains reclassifications related to changes in presentation of components of other comprehensive income.
F-31
2.
Restatement and Amendment of Previously Reported Financial Information (continued)
| | | | | | | | | | | | | | | | | | |
| Consolidated Balance Sheet |
($ in millions, except share data) | As of and for the year ended December 31, 2011 |
| As previously reported | | Correction of errors(1) | | Adjusted prior to the retrospective adoption | | Retrospective Adoption(2) | | As restated and amended |
ASSETS: | | | | | | | | | | | | | | |
Available-for-sale debt securities, at fair value | $ | 11,890.0 | | $ | (93.0) | | $ | 11,797.0 | | $ | — | | $ | 11,797.0 |
Available-for-sale equity securities, at fair value | | 35.7 | | | — | | | 35.7 | | | — | | | 35.7 |
Limited partnerships and other investments | | 601.3 | | | (36.0) | | | 565.3 | | | — | | | 565.3 |
Policy loans, at unpaid principal balances | | 2,379.3 | | | — | | | 2,379.3 | | | — | | | 2,379.3 |
Derivative investments | | 174.8 | | | (12.6) | | | 162.2 | | | — | | | 162.2 |
Fair value investments | | 86.6 | | | 97.4 | | | 184.0 | | | — | | | 184.0 |
Total investments | | 15,167.7 | | | (44.2) | | | 15,123.5 | | | — | | | 15,123.5 |
Cash and cash equivalents | | 194.3 | | | (26.1) | | | 168.2 | | | — | | | 168.2 |
Accrued investment income | | 175.6 | | | — | | | 175.6 | | | — | | | 175.6 |
Receivables | | 415.1 | | | 233.5 | | | 648.6 | | | — | | | 648.6 |
Deferred policy acquisition costs | | 1,317.6 | | | (13.7) | | | 1,303.9 | | | (184.7) | | | 1,119.2 |
Deferred income taxes, net | | 118.2 | | | 2.4 | | | 120.6 | | | — | | | 120.6 |
Other assets | | 164.6 | | | 66.5 | | | 231.1 | | | (1.0) | | | 230.1 |
Discontinued operations assets | | 69.2 | | | 16.1 | | | 85.3 | | | — | | | 85.3 |
Separate account assets | | 3,817.6 | | | (0.7) | | | 3,816.9 | | | — | | | 3,816.9 |
Total assets | $ | 21,439.9 | | $ | 233.8 | | $ | 21,673.7 | | $ | (185.7) | | $ | 21,488.0 |
| | | | | | | | | | | | | | |
LIABILITIES: | | | | | | | | | | | | | | |
Policy liabilities and accruals (3) | $ | 12,967.8 | | $ | (317.2) | | $ | 12,650.6 | | $ | (19.2) | | $ | 12,631.4 |
Policyholder deposit funds | | 2,429.4 | | | 2.8 | | | 2,432.2 | | | — | | | 2,432.2 |
Dividend obligations (4) | | — | | | 752.5 | | | 752.5 | | | | | | 752.5 |
Indebtedness | | 426.9 | | | — | | | 426.9 | | | — | | | 426.9 |
Other liabilities | | 613.7 | | | 44.3 | | | 658.0 | | | — | | | 658.0 |
Discontinued operations liabilities | | 58.3 | | | 16.1 | | | 74.4 | | | — | | | 74.4 |
Separate account liabilities | | 3,817.6 | | | (0.7) | | | 3,816.9 | | | — | | | 3,816.9 |
Total liabilities | | 20,313.7 | | | 497.8 | | | 20,811.5 | | | (19.2) | | | 20,792.3 |
| | | | | | | | | | | | | | |
COMMITMENTS AND CONTINGENT LIABILITIES (Notes 23, 24, & 25) | | | | | | | | | | | | | | |
| | | | | | | | | | | | | | |
STOCKHOLDERS’ EQUITY: | | | | | | | | | | | | | | |
Common stock, $.01 par value: 5.8 million
shares outstanding (5) | | 1.3 | | | — | | | 1.3 | | | — | | | 1.3 |
Additional paid-in capital | | 2,630.5 | | | — | | | 2,630.5 | | | — | | | 2,630.5 |
Accumulated other comprehensive income (loss) | | (170.7) | | | (103.5) | | | (274.2) | | | 43.5 | | | (230.7) |
Accumulated deficit | | (1,155.4) | | | (163.3) | | | (1,318.7) | | | (210.0) | | | (1,528.7) |
Treasury stock, at cost: 0.6 million shares (5) | | (179.5) | | | — | | | (179.5) | | | — | | | (179.5) |
Total The Phoenix Companies, Inc.
stockholders’ equity | | 1,126.2 | | | (266.8) | | | 859.4 | | | (166.5) | | | 692.9 |
Noncontrolling interests | | — | | | 2.8 | | | 2.8 | | | — | | | 2.8 |
Total stockholders’ equity | | 1,126.2 | | | (264.0) | | | 862.2 | | | (166.5) | | | 695.7 |
Total liabilities and stockholders’ equity | $ | 21,439.9 | | $ | 233.8 | | $ | 21,673.7 | | $ | (185.7) | | $ | 21,488.0 |
———————
(1)
Adjustments related to the correction of errors reflect amounts prior to the retrospective adoption of amended guidance to ASC 944,Financial Services – Insurance (ASU 2010-26). See footnote 2 below for additional information regarding these amounts and the retrospective adoption.
(2)
Adjustments related to the retrospective adoption of amended guidance to ASC 944,Financial Services – Insurance (ASU 2010-26), have been updated from those originally disclosed in the First Quarter 2012 Quarterly Report on Form 10-Q filing to reflect the correction of errors identified related to the adoption of the amended guidance as well as indirect impact of the correction of errors associated with the restatement.
(3)
Included within policyholder liabilities and accruals is the post-ASU gross profits followed by losses reserve of $211.8 million. The corresponding net post-ASU amount of $200.5 million reported within the consolidated financial statements includes $(11.2) million of shadow profits followed by losses, both of which are discussed further within the “Actuarial Finance” section of this Note.
(4)
Dividend obligations were previously included in policy liabilities and accruals.
(5)
All share amounts for all periods reflect the 1-for-20 reverse stock split, which was effective August 10, 2012. See Note 11 to these consolidated financial statements for additional information on the reverse stock split.
F-32
2.
Restatement and Amendment of Previously Reported Financial Information (continued)
| | | | | | | | | | | | | | |
| Consolidated Statement of Comprehensive Income |
($ in millions, except share data) | As of and for the year ended December 31, 2011 |
| As previously reported | | Correction of errors(1) | | Adjusted prior to the retrospective adoption | | Retrospective Adoption(2) | | As restated and amended |
REVENUES: | | | | | | | | | | | | | | |
Premiums | $ | 459.1 | | $ | (10.4) | | $ | 448.7 | | $ | — | | $ | 448.7 |
Fee income | | 597.1 | | | (0.3) | | | 596.8 | | | — | | | 596.8 |
Net investment income | | 809.9 | | | 13.0 | | | 822.9 | | | — | | | 822.9 |
Net realized investment gains (losses): | | | | | | | | | | | | | | |
Total OTTI losses | | (64.6) | | | (0.7) | | | (65.3) | | | — | | | (65.3) |
Portion of OTTI losses recognized in OCI | | 38.9 | | | (0.4) | | | 38.5 | | | — | | | 38.5 |
Net OTTI losses recognized in earnings | | (25.7) | | | (1.1) | | | (26.8) | | | — | | | (26.8) |
Net realized investment gains (losses),
excluding OTTI losses | | 9.3 | | | (14.6) | | | (5.3) | | | — | | | (5.3) |
Net realized investment losses | | (16.4) | | | (15.7) | | | (32.1) | | | — | | | (32.1) |
Gain on debt repurchase | | — | | | 0.2 | | | 0.2 | | | — | | | 0.2 |
Total revenues | | 1,849.7 | | | (13.2) | | | 1,836.5 | | | — | | | 1,836.5 |
| | | | | | | | | | | | | | |
BENEFITS AND EXPENSES: | | | | | | | | | | | | | | |
Policy benefits, excluding policyholder dividends | | 1,083.2 | | | 49.0 | | | 1,132.2 | | | 4.8 | | | 1,137.0 |
Policyholder dividends | | 246.9 | | | 12.3 | | | 259.2 | | | — | | | 259.2 |
Policy acquisition cost amortization | | 210.6 | | | (15.2) | | | 195.4 | | | (37.5) | | | 157.9 |
Interest expense on indebtedness | | 31.8 | | | — | | | 31.8 | | | — | | | 31.8 |
Other operating expenses | | 245.2 | | | 1.4 | | | 246.6 | | | 1.3 | | | 247.9 |
Total benefits and expenses | | 1,817.7 | | | 47.5 | | | 1,865.2 | | | (31.4) | | | 1,833.8 |
Income (loss) from continuing operations
before income taxes | | 32.0 | | | (60.7) | | | (28.7) | | | 31.4 | | | 2.7 |
Income tax benefit | | 1.9 | | | 1.4 | | | 3.3 | | | 9.0 | | | 12.3 |
Income (loss) from continuing operations | | 30.1 | | | (62.1) | | | (32.0) | | | 22.4 | | | (9.6) |
Income (loss) from discontinued operations,
net of income taxes | | (22.0) | | | 0.4 | | | (21.6) | | | — | | | (21.6) |
Net income (loss) | | 8.1 | | | (61.7) | | | (53.6) | | | 22.4 | | | (31.2) |
Less: Net income (loss) attributable to
noncontrolling interests | | — | | | (0.5) | | | (0.5) | | | — | | | (0.5) |
Net income (loss) attributable to
The Phoenix Companies, Inc. | $ | 8.1 | | $ | (61.2) | | $ | (53.1) | | $ | 22.4 | | $ | (30.7) |
(Continued on next page)
F-33
2.
Restatement and Amendment of Previously Reported Financial Information (continued)
| | | | | | | | | | | | | | |
(Continued from previous page) | Consolidated Statement of Comprehensive Income |
($ in millions, except share data) | As of and for the year ended December 31, 2011 |
| As previously reported | | Correction of errors(1) | | Adjusted prior to the retrospective adoption | | Retrospective Adoption(2) | | As restated and amended |
COMPREHENSIVE INCOME (LOSS): | | | | | | | | | | | | | | |
Net income (loss) attributable to
The Phoenix Companies, Inc. | $ | 8.1 | | $ | (61.2) | | $ | (53.1) | | $ | 22.4 | | $ | (30.7) |
Less: Net income (loss) attributable to
noncontrolling interests | | — | | | (0.5) | | | (0.5) | | | — | | | (0.5) |
Net income (loss) | | 8.1 | | | (61.7) | | | (53.6) | | | 22.4 | | | (31.2) |
Other comprehensive income (loss)
before income taxes: | | | | | | | | | | | | | | |
Net unrealized investment gains
before income taxes (5) | | 77.5 | | | (25.1) | | | 52.4 | | | 6.3 | | | 58.7 |
Non-credit portion of OTTI losses
recognized in OCI before income taxes (5) | | (32.5) | | | (1.3) | | | (33.8) | | | — | | | (33.8) |
Net pension liability adjustment
before income taxes | | (84.2) | | | (14.9) | | | (99.1) | | | — | | | (99.1) |
Net unrealized other gains (losses)
before income taxes | | — | | | — | | | — | | | — | | | — |
Net unrealized derivative instruments gains (losses)
before income taxes (5) | | 0.3 | | | (0.3) | | | — | | | — | | | — |
Other comprehensive income (loss)
before income taxes | | (38.9) | | | (41.6) | | | (80.5) | | | 6.3 | | | (74.2) |
Less: Income tax expense (benefit) related to: | | | | | | | | | | | | | | |
Net unrealized investment gains (losses) | | 9.4 | | | 11.6 | | | 21.0 | | | (8.9) | | | 12.1 |
Non-credit portion of OTTI losses
recognized in OCI (5) | | (11.4) | | | (0.4) | | | (11.8) | | | — | | | (11.8) |
Net pension liability adjustment (5) | | — | | | — | | | — | | | — | | | — |
Net unrealized other gains (losses) | | — | | | — | | | — | | | | | | — |
Net unrealized derivative instruments
gains (losses) | | — | | | — | | | — | | | — | | | — |
Total income tax benefit | | (2.0) | | | 11.2 | | | 9.2 | | | (8.9) | | | 0.3 |
Other comprehensive income (loss),
net of income taxes | | (36.9) | | | (52.8) | | | (89.7) | | | 15.2 | | | (74.5) |
Comprehensive income (loss) | | (28.8) | | $ | (114.5) | | $ | (143.3) | | $ | 37.6 | | $ | (105.7) |
Less: Comprehensive income (loss) attributable to
noncontrolling interests, net of income taxes | | — | | | (0.5) | | | (0.5) | | | — | | | (0.5) |
Comprehensive income (loss) attributable to
The Phoenix Companies, Inc. | $ | (28.8) | | $ | (114.0) | | $ | (142.8) | | $ | 37.6 | | $ | (105.2) |
(Continued on next page)
F-34
2.
Restatement and Amendment of Previously Reported Financial Information (continued)
| | | | | | | | | | | | | | |
(Continued from previous page) | Consolidated Statement of Comprehensive Income |
($ in millions, except share data) | As of and for the year ended December 31, 2011 |
| As previously reported | | Correction of errors(1) | | Adjusted prior to the retrospective adoption | | Retrospective Adoption(2) | | As restated and amended |
EARNINGS (LOSS) PER SHARE:(3) | | | | | | | | | | | | | | |
Earnings (loss) from continuing operations – basic | $ | 5.17 | | $ | (10.68) | | | NM | | $ | 3.85 | | $ | (1.65) |
Earnings (loss) from continuing operations – diluted | $ | 5.10 | | $ | (10.68) | | | NM | | $ | 3.85 | | $ | (1.65) |
Earnings (loss) from discontinued operations – basic | $ | (3.78) | | $ | 0.07 | | | NM | | $ | — | | $ | (3.71) |
Earnings (loss) from discontinued operations – diluted | $ | (3.78) | | $ | 0.07 | | | NM | | $ | — | | $ | (3.71) |
Net earnings (loss) attributable to
The Phoenix Companies, Inc. – basic | $ | 1.39 | | $ | (10.52) | | | NM | | $ | 3.85 | | $ | (5.28) |
Net earnings (loss) attributable to
The Phoenix Companies, Inc. – diluted | $ | 1.37 | | $ | (10.52) | | | NM | | $ | 3.85 | | $ | (5.28) |
Basic weighted-average common shares outstanding
(in thousands) | | 5,826 | | | 5,815 | (4) | | NM | | | 5,815 | | | 5,815 |
Diluted weighted-average common shares
outstanding (in thousands) | | 5,898 | | | 5,815 | (4) | | NM | | | 5,815 | | | 5,815 |
———————
(1)
Adjustments related to the correction of errors reflect amounts prior to the retrospective adoption of amended guidance to ASC 944,Financial Services – Insurance (ASU 2010-26). See footnote 2 below for additional information regarding these amounts and the retrospective adoption.
(2)
Adjustments related to the retrospective adoption of amended guidance to ASC 944,Financial Services – Insurance (ASU 2010-26), have been updated from those originally disclosed in the First Quarter 2012 Quarterly Report on Form 10-Q filing to reflect the correction of errors identified related to the adoption of the amended guidance as well as indirect impact of the correction of errors associated with the restatement.
(3)
All share amounts for all periods reflect the 1-for-20 reverse stock split, which was effective August 10, 2012. See Note 11 to these consolidated financial statements for additional information on the reverse stock split.
(4)
Weighted-average common shares outstanding have been updated to reflect the impact of an error which had no material impact to EPS information, basic or diluted, for any period presented.
(5)
In addition to adjustments described within this footnote the correction of errors column contains reclassifications related to changes in presentation of components of other comprehensive income.
F-35
2.
Restatement and Amendment of Previously Reported Financial Information (continued)
| | | | | | | | | | | | | | |
| Consolidated Statement of Comprehensive Income |
($ in millions, except share data) | As of and for the year ended December 31, 2010 |
| As previously reported | | Correction of errors(1) | | Adjusted prior to the retrospective adoption | | Retrospective Adoption(2) | | As restated and amended |
REVENUES: | | | | | | | | | | | | | | |
Premiums | $ | 521.4 | | $ | (13.9) | | $ | 507.5 | | $ | — | | $ | 507.5 |
Fee income | | 630.2 | | | 3.3 | | | 633.5 | | | — | | | 633.5 |
Net investment income | | 844.6 | | | (4.1) | | | 840.5 | | | — | | | 840.5 |
Net realized investment gains (losses): | | | | | | | | | | | | | | |
Total OTTI losses | | (105.2) | | | (2.1) | | | (107.3) | | | — | | | (107.3) |
Portion of OTTI losses recognized in OCI | | 55.6 | | | 3.1 | | | 58.7 | | | — | | | 58.7 |
Net OTTI losses recognized in earnings | | (49.6) | | | 1.0 | | | (48.6) | | | — | | | (48.6) |
Net realized investment gains (losses),
excluding OTTI losses | | 39.7 | | | (2.3) | | | 37.4 | | | — | | | 37.4 |
Net realized investment losses | | (9.9) | | | (1.3) | | | (11.2) | | | — | | | (11.2) |
Gain on debt repurchase | | — | | | — | | | — | | | — | | | — |
Total revenues | | 1,986.3 | | | (16.0) | | | 1,970.3 | | | — | | | 1,970.3 |
| | | | | | | | | | | | | | |
BENEFITS AND EXPENSES: | | | | | | | | | | | | | | |
Policy benefits, excluding policyholder dividends | | 1,090.0 | | | 19.6 | | | 1,109.6 | | | 11.9 | | | 1,121.5 |
Policyholder dividends | | 309.8 | | | (8.0) | | | 301.8 | | | — | | | 301.8 |
Policy acquisition cost amortization | | 298.2 | | | 28.9 | | | 327.1 | | | (58.9) | | | 268.2 |
Interest expense on indebtedness | | 31.8 | | | — | | | 31.8 | | | — | | | 31.8 |
Other operating expenses | | 291.2 | | | (4.8) | | | 286.4 | | | 2.2 | | | 288.6 |
Total benefits and expenses | | 2,021.0 | | | 35.7 | | | 2,056.7 | | | (44.8) | | | 2,011.9 |
Income (loss) from continuing operations
before income taxes | | (34.7) | | | (51.7) | | | (86.4) | | | 44.8 | | | (41.6) |
Income tax expense (benefit) | | (10.1) | | | (15.5) | | | (25.6) | | | 15.3 | | | (10.3) |
Income (loss) from continuing operations | | (24.6) | | | (36.2) | | | (60.8) | | | 29.5 | | | (31.3) |
Income (loss) from discontinued operations,
net of income taxes | | 12.0 | | | (15.6) | | | (3.6) | | | — | | | (3.6) |
Net income (loss) | | (12.6) | | | (51.8) | | | (64.4) | | | 29.5 | | | (34.9) |
Less: Net income (loss) attributable to
noncontrolling interests | | — | | | (0.5) | | | (0.5) | | | — | | | (0.5) |
Net income (loss) attributable to
The Phoenix Companies, Inc. | $ | (12.6) | | $ | (51.3) | | $ | (63.9) | | $ | 29.5 | | $ | (34.4) |
(Continued on next page)
F-36
2.
Restatement and Amendment of Previously Reported Financial Information (continued)
| | | | | | | | | | | | | | |
(Continued from previous page) | Consolidated Statement of Comprehensive Income |
($ in millions, except share data) | As of and for the year ended December 31, 2010 |
| As previously reported | | Correction of errors(1) | | Adjusted prior to the retrospective adoption | | Retrospective Adoption(2) | | As restated and amended |
COMPREHENSIVE INCOME (LOSS): | | | | | | | | | | | | | | |
Net income (loss) attributable to
The Phoenix Companies, Inc. | $ | (12.6) | | $ | (51.3) | | $ | (63.9) | | $ | 29.5 | | $ | (34.4) |
Net income (loss) attributable to
noncontrolling interests | | — | | | (0.5) | | | (0.5) | | | — | | | (0.5) |
Net income (loss) | | (12.6) | | | (51.8) | | | (64.4) | | | 29.5 | | | (34.9) |
Other comprehensive income (loss)
before income taxes: | | | | | | | | | | | | | | |
Net unrealized investment gains
before income taxes (5) | | 112.5 | | | 36.3 | | | 148.8 | | | 25.3 | | | 174.1 |
Non-credit portion of OTTI losses
recognized in OCI before income taxes (5) | | (35.4) | | | 10.5 | | | (24.9) | | | — | | | (24.9) |
Net pension liability adjustment
before income taxes | | (9.3) | | | 1.4 | | | (7.9) | | | — | | | (7.9) |
Net unrealized other gains (losses)
before income taxes | | — | | | — | | | — | | | — | | | — |
Net unrealized derivative instruments gains (losses)
before income taxes (5) | | 28.3 | | | (28.3) | | | — | | | — | | | — |
Other comprehensive income (loss)
before income taxes | | 96.1 | | | 19.9 | | | 116.0 | | | 25.3 | | | 141.3 |
Less: Income tax expense (benefit) related to: | | | | | | | | | | | | | | |
Net unrealized investment gains (losses (5) | | 72.7 | | | 28.1 | | | 100.8 | | | (6.3) | | | 94.5 |
Non-credit portion of OTTI losses
recognized in OCI (5) | | (12.4) | | | 4.9 | | | (7.5) | | | — | | | (7.5) |
Net pension liability adjustment | | — | | | — | | | — | | | — | | | — |
Net unrealized other gains (losses) | | — | | | — | | | — | | | — | | | — |
Net unrealized derivative instruments gains (losses) | | — | | | — | | | — | | | — | | | — |
Total income tax expense (benefit) | | 60.3 | | | 33.0 | | | 93.3 | | | (6.3) | | | 87.0 |
Other comprehensive income
net of income taxes | | 35.8 | | | (13.1) | | | 22.7 | | | 31.6 | | | 54.3 |
Comprehensive income (loss) | | 23.2 | | | (64.9) | | | (41.7) | | | 61.1 | | | 19.4 |
Less: Comprehensive income attributable to
noncontrolling interests, net of income taxes | | — | | | (0.5) | | | (0.5) | | | — | | | (0.5) |
Comprehensive income (loss) attributable to
The Phoenix Companies, Inc. | $ | 23.2 | | $ | (64.4) | | $ | (41.2) | | $ | 61.1 | | $ | 19.9 |
(Continued on next page)
F-37
2.
Restatement and Amendment of Previously Reported Financial Information (continued)
| | | | | | | | | | | | | | |
(Continued from previous page) | Consolidated Statement of Comprehensive Income |
($ in millions, except share data) | As of and for the year ended December 31, 2010 |
| As previously reported | | Correction of errors(1) | | Adjusted prior to the retrospective adoption | | Retrospective Adoption(2) | | As restated and amended |
|
EARNINGS (LOSS) PER SHARE:(3) | | | | | | | | | | | | | | |
Earnings (loss) from continuing operations – basic | $ | (4.23) | | $ | (6.24) | | | NM | | $ | 5.08 | | $ | (5.39) |
Earnings (loss) from continuing operations – diluted | $ | (4.23) | | $ | (6.24) | | | NM | | $ | 5.08 | | $ | (5.39) |
Earnings (loss) from discontinued operations – basic | $ | 2.06 | | $ | (2.69) | | | NM | | $ | — | | $ | (0.62) |
Earnings (loss) from discontinued operations – diluted | $ | 2.06 | | $ | (2.69) | | | NM | | $ | — | | $ | (0.62) |
Net earnings (loss) attributable to
The Phoenix Companies, Inc. – basic | $ | (2.17) | | $ | (8.84) | | | NM | | $ | 5.08 | | $ | (5.93) |
Net earnings (loss) attributable to
The Phoenix Companies, Inc. – diluted | $ | (2.17) | | $ | (8.84) | | | NM | | $ | 5.08 | | $ | (5.93) |
Basic weighted-average common shares outstanding
(in thousands) | | 5,817 | | | 5,803 | (4) | | NM | | | 5,803 | | | 5,803 |
Diluted weighted-average common shares
outstanding (in thousands) | | 5,817 | | | 5,803 | (4) | | NM | | | 5,803 | | | 5,803 |
———————
(1)
Adjustments related to the correction of errors reflect amounts prior to the retrospective adoption of amended guidance to ASC 944,Financial Services – Insurance (ASU 2010-26). See footnote 2 below for additional information regarding these amounts and the retrospective adoption.
(2)
Adjustments related to the retrospective adoption of amended guidance to ASC 944,Financial Services – Insurance (ASU 2010-26), have been updated from those originally disclosed in the First Quarter 2012 Quarterly Report on Form 10-Q filing to reflect the correction of errors identified related to the adoption of the amended guidance as well as indirect impact of the correction of errors associated with the restatement.
(3)
All share amounts for all periods reflect the 1-for-20 reverse stock split, which was effective August 10, 2012. See Note 11 to these consolidated financial statements for additional information on the reverse stock split.
(4)
Weighted-average common shares outstanding have been updated to reflect the impact of an error which had no material impact to EPS information, basic or diluted, for any period presented.
(5)
In addition to adjustments described within this footnote the correction of errors column contains reclassifications related to changes in presentation of components of other comprehensive income.
F-38
2.
Restatement and Amendment of Previously Reported Financial Information (continued)
| | | | | | | | | | | | | | |
| Consolidated Statement of Cash Flows |
($ in millions) | As of and for the year ended December 31, 2011 |
| As previously reported | | Correction of errors(1) | | Adjusted prior to the retrospective adoption | | Retrospective Adoption(2) | | As restated and amended |
OPERATING ACTIVITIES: | | | | | | | | | | | | | | |
Net income (loss) | $ | 8.1 | | $ | (61.2) | | $ | (53.1) | | $ | 22.4 | | $ | (30.7) |
Net realized investment gains | | 16.4 | | | 13.5 | | | 29.9 | | | — | | | 29.9 |
Gain on debt repurchase | | — | | | (0.2) | | | (0.2) | | | — | | | (0.2) |
Policy acquisition costs deferred | | (141.1) | | | 48.5 | | | (92.6) | | | 1.4 | | | (91.2) |
Amortization of deferred policy acquisition costs | | 210.6 | | | (15.2) | | | 195.4 | | | (37.5) | | | 157.9 |
Amortization and depreciation | | 12.8 | | | — | | | 12.8 | | | — | | | 12.8 |
Interest credited | | — | | | 117.5 | | | 117.5 | | | — | | | 117.5 |
Equity in earnings of
limited partnerships and other investments | | — | | | (45.3) | | | (45.3) | | | — | | | (45.3) |
Change in: | | | | | | | | | | | | | | |
Accrued investment income | | (50.8) | | | (90.5) | | | (141.3) | | | — | | | (141.3) |
Deferred income taxes | | 1.0 | | | (12.8) | | | (11.8) | | | 9.1 | | | (2.7) |
Receivables | | (7.3) | | | 7.2 | | | (0.1) | | | — | | | (0.1) |
Policy liabilities and accruals | | (203.3) | | | (206.3) | | | (409.6) | | | 4.6 | | | (405.0) |
Dividend obligations | | — | | | 7.3 | | | 7.3 | | | — | | | 7.3 |
Impact of operating activities of
consolidated investment entities, net | | — | | | (4.2) | | | (4.2) | | | — | | | (4.2) |
Other operating activities, net | | (3.4) | | | (39.1) | | | (42.5) | | | — | | | (42.5) |
Cash from (for) continuing operations | | (157.0) | | | (280.8) | | | (437.8) | | | — | | | (437.8) |
Discontinued operations, net | | 18.6 | | | (18.6) | | | — | | | — | | | — |
Cash used for operating activities | | (138.4) | | | (299.4) | | | (437.8) | | | — | | | (437.8) |
| | | | | | | | | | | | | | |
INVESTING ACTIVITIES: | | | | | | | | | | | | | | |
Purchases of: | | | | | | | | | | | | | | |
Available-for-sale debt securities | | (3,189.0) | | | 140.8 | | | (3,048.2) | | | — | | | (3,048.2) |
Available-for-sale equity securities | | (6.4) | | | — | | | (6.4) | | | — | | | (6.4) |
Derivative instruments | | (53.9) | | | (16.6) | | | (70.5) | | | — | | | (70.5) |
Fair value investments | | — | | | (47.3) | | | (47.3) | | | — | | | (47.3) |
Other investments | | (106.5) | | | 105.1 | | | (1.4) | | | | | | (1.4) |
Sales, repayments and maturities of: | | | | | | | | | | | | | | |
Available-for-sale debt securities | | 2,444.6 | | | (115.4) | | | 2,329.2 | | | — | | | 2,329.2 |
Available-for-sale equity securities | | 10.2 | | | — | | | 10.2 | | | — | | | 10.2 |
Derivative instruments | | 57.2 | | | 29.9 | | | 87.1 | | | — | | | 87.1 |
Fair value investments | | 8.6 | | | 4.8 | | | 13.4 | | | — | | | 13.4 |
Other investments | | 144.6 | | | (122.3) | | | 22.3 | | | — | | | 22.3 |
Contributions to limited partnerships
and limited liability corporations | | — | | | (99.4) | | | (99.4) | | | — | | | (99.4) |
Distributions from limited partnerships
and limited liability corporations | | — | | | 120.5 | | | 120.5 | | | — | | | 120.5 |
Policy loans, net | | 7.2 | | | 121.1 | | | 128.3 | | | — | | | 128.3 |
Impact of investing activities of
consolidated investment entities, net | | — | | | — | | | — | | | — | | | — |
Other investing activities, net | | — | | | (4.6) | | | (4.6) | | | — | | | (4.6) |
Proceeds from sale of subsidiary | | 1.0 | | | (1.0) | | | — | | | — | | | — |
Premises and equipment additions | | (4.4) | | | 4.4 | | | — | | | — | | | — |
Discontinued operations, net | | (18.6) | | | 18.6 | | | — | | | — | | | — |
Cash provided by (used for) investing activities | | (705.4) | | | 138.6 | | | (566.8) | | | — | | | (566.8) |
(Continued on next page)
F-39
2.
Restatement and Amendment of Previously Reported Financial Information (continued)
| | | | | | | | | | | | | | |
(Continued from previous page) | Consolidated Statement of Cash Flows |
($ in millions) | As of and for the year ended December 31, 2011 |
| As previously reported | | Correction of errors(1) | | Adjusted prior to the retrospective adoption | | Retrospective Adoption(2) | | As restated and amended |
FINANCING ACTIVITIES: | | | | | | | | | | | | | | |
Policyholder deposit fund deposits | | 1,725.5 | | | 99.9 | | | 1,825.4 | | | — | | | 1,825.4 |
Policyholder deposit fund withdrawals | | (808.5) | | | (370.8) | | | (1,179.3) | | | — | | | (1,179.3) |
Net transfers to/from separate accounts | | — | | | 435.1 | | | 435.1 | | | — | | | 435.1 |
Impact of financing activities of
consolidated investment entities, net | | — | | | 1.5 | | | 1.5 | | | — | | | 1.5 |
Other financing activities, net | | (0.8) | | | (4.1) | | | (4.9) | | | — | | | (4.9) |
Cash provided by financing activities | | 916.2 | | | 161.6 | | | 1,077.8 | | | — | | | 1,077.8 |
Change in cash and cash equivalents | | 72.4 | | | 0.8 | | | 73.2 | | | — | | | 73.2 |
Change in cash included in
discontinued operations assets | | — | | | 1.3 | | | 1.3 | | | — | | | 1.3 |
Cash and cash equivalents, beginning of period | | 121.9 | | | (28.2) | | | 93.7 | | | — | | | 93.7 |
Cash and cash equivalents, end of period | $ | 194.3 | | $ | (26.1) | | $ | 168.2 | | $ | — | | $ | 168.2 |
| | | | | | | | | | | | | | |
Supplemental Disclosure of Cash Flow Information | | | | | | | | | | | | | | |
Income taxes paid | $ | (6.2) | | $ | — | | $ | (6.2) | | $ | — | | $ | (6.2) |
Interest expense on indebtedness paid | $ | (34.9) | | $ | 3.5 | | $ | (31.4) | | $ | — | | $ | (31.4) |
| | | | | | | | | | | | | | |
Non-Cash Transactions During the Year | | | | | | | | | | | | | | |
Investment exchanges | $ | — | | $ | 97.8 | | $ | 97.8 | | $ | — | | $ | 97.8 |
———————
(1)
Adjustments related to the correction of errors reflect amounts prior to the retrospective adoption of amended guidance to ASC 944,Financial Services – Insurance (ASU 2010-26). See footnote 2 below for additional information regarding these amounts and the retrospective adoption.
(2)
Adjustments related to the retrospective adoption of amended guidance to ASC 944,Financial Services – Insurance (ASU 2010-26), have been updated from those originally disclosed in the First Quarter 2012 Quarterly Report on Form 10-Q filing to reflect the correction of errors identified related to the adoption of the amended guidance as well as indirect impact of the correction of errors associated with the restatement.
F-40
2.
Restatement and Amendment of Previously Reported Financial Information (continued)
| | | | | | | | | | | | | | |
| Consolidated Statement of Cash Flows |
($ in millions) | As of and for the year ended December 31, 2010 |
| As previously reported | | Correction of errors(1) | | Adjusted prior to the retrospective adoption | | Retrospective Adoption(2) | | As restated and amended |
OPERATING ACTIVITIES: | | | | | | | | | | | | | | |
Net income (loss) | $ | (12.6) | | $ | (51.3) | | $ | (63.9) | | $ | 29.5 | | $ | (34.4) |
Net realized investment gains | | 9.9 | | | 1.5 | | | 11.4 | | | — | | | 11.4 |
Gain on debt repurchase | | — | | | — | | | — | | | — | | | — |
Policy acquisition costs deferred | | (27.0) | | | 12.0 | | | (15.0) | | | 2.2 | | | (12.8) |
Amortization of deferred policy acquisition costs | | 298.2 | | | 28.9 | | | 327.1 | | | (58.9) | | | 268.2 |
Amortization and depreciation | | 11.3 | | | (0.3) | | | 11.0 | | | — | | | 11.0 |
Interest credited | | — | | | 123.8 | | | 123.8 | | | — | | | 123.8 |
Equity in earnings of
limited partnerships and other investments | | — | | | (61.1) | | | (61.1) | | | — | | | (61.1) |
Change in: | | | | | | | | | | | | | | |
Accrued investment income | | (16.4) | | | (117.4) | | | (133.8) | | | — | | | (133.8) |
Deferred income taxes | | (12.8) | | | (17.9) | | | (30.7) | | | 15.4 | | | (15.3) |
Receivables | | (49.1) | | | 88.1 | | | 39.0 | | | — | | | 39.0 |
Policy liabilities and accruals | | (447.3) | | | (378.9) | | | (826.2) | | | 11.8 | | | (814.4) |
Dividend obligations | | — | | | (13.9) | | | (13.9) | | | — | | | (13.9) |
Impact of operating activities of
consolidated investment entities, net | | — | | | (5.9) | | | (5.9) | | | — | | | (5.9) |
Other operating activities, net | | 9.8 | | | 3.9 | | | 13.7 | | | — | | | 13.7 |
Cash from (for) continuing operations | | (236.0) | | | (388.5) | | | (624.5) | | | — | | | (624.5) |
Discontinued operations, net | | (22.0) | | | 22.0 | | | — | | | — | | | — |
Cash used for operating activities | | (258.0) | | | (366.5) | | | (624.5) | | | — | | | (624.5) |
| | | | | | | | | | | | | | |
INVESTING ACTIVITIES: | | | | | | | | | | | | | | |
Purchases of: | | | | | | | | | | | | | | |
Available-for-sale debt securities | | (2,758.4) | | | 72.2 | | | (2,686.2) | | | — | | | (2,686.2) |
Available-for-sale equity securities | | (7.2) | | | 1.9 | | | (5.3) | | | — | | | (5.3) |
Derivative instruments | | (84.1) | | | 0.9 | | | (83.2) | | | — | | | (83.2) |
Fair value investments | | — | | | (8.5) | | | (8.5) | | | — | | | (8.5) |
Other investments | | (126.3) | | | 125.0 | | | (1.3) | | | — | | | (1.3) |
Sales, repayments and maturities of: | | | | | | | | | | | | | | |
Available-for-sale debt securities | | 2,762.8 | | | (61.6) | | | 2,701.2 | | | — | | | 2,701.2 |
Available-for-sale equity securities | | 0.6 | | | 0.1 | | | 0.7 | | | — | | | 0.7 |
Derivative instruments | | 47.1 | | | (15.0) | | | 32.1 | | | — | | | 32.1 |
Fair value investments | | 0.1 | | | 14.3 | | | 14.4 | | | — | | | 14.4 |
Other investments | | 143.1 | | | (105.3) | | | 37.8 | | | — | | | 37.8 |
Contributions to limited partnerships
and limited liability corporations | | — | | | (90.2) | | | (90.2) | | | — | | | (90.2) |
Distributions from limited partnerships
and limited liability corporations | | — | | | 132.0 | | | 132.0 | | | — | | | 132.0 |
Policy loans, net | | (62.1) | | | 124.8 | | | 62.7 | | | — | | | 62.7 |
Impact of investing activities of
consolidated investment entities, net | | — | | | — | | | — | | | — | | | — |
Other investing activities, net | | — | | | 30.0 | | | 30.0 | | | — | | | 30.0 |
Proceeds from sale of subsidiary | | 32.9 | | | (32.9) | | | — | | | — | | | — |
Premises and equipment additions | | (5.9) | | | 5.9 | | | — | | | — | | | — |
Discontinued operations, net | | 13.1 | | | (13.1) | | | — | | | — | | | — |
Cash provided by (used for) investing activities | | (44.3) | | | 180.5 | | | 136.2 | | | — | | | 136.2 |
(Continued on next page)
F-41
2.
Restatement and Amendment of Previously Reported Financial Information (continued)
| | | | | | | | | | | | | | |
(Continued from previous page) | Consolidated Statement of Cash Flows |
($ in millions) | As of and for the year ended December 31, 2010 |
| As previously reported | | Correction of errors(1) | | Adjusted prior to the retrospective adoption | | Retrospective Adoption(2) | | As restated and amended |
FINANCING ACTIVITIES: | | | | | | | | | | | | | | |
Policyholder deposit fund deposits | | 732.2 | | | 367.0 | | | 1,099.2 | | | — | | | 1,099.2 |
Policyholder deposit fund withdrawals | | (565.0) | | | (660.5) | | | (1,225.5) | | | — | | | (1,225.5) |
Net transfers to/from separate accounts | | — | | | 454.3 | | | 454.3 | | | — | | | 454.3 |
Impact of financing activities of
consolidated investment entities, net | | — | | | 1.0 | | | 1.0 | | | — | | | 1.0 |
Other financing activities, net | | — | | | 0.3 | | | 0.3 | | | — | | | 0.3 |
Indebtedness repayments | | (0.2) | | | 0.2 | | | — | | | — | | | — |
Noncontrolling interests | | 0.5 | | | (0.5) | | | — | | | — | | | — |
Discontinued operations, net | | — | | | — | | | — | | | — | | | — |
Cash provided by financing activities | | 167.5 | | | 161.8 | | | 329.3 | | | — | | | 329.3 |
Change in cash and cash equivalents | | (134.8) | | | (24.2) | | | (159.0) | | | — | | | (159.0) |
Change in cash included in
discontinued operations assets | | — | | | (3.1) | | | (3.1) | | | — | | | (3.1) |
Cash and cash equivalents, beginning of period | | 256.7 | | | (0.9) | | | 255.8 | | | — | | | 255.8 |
Cash and cash equivalents, end of period | $ | 121.9 | | $ | (28.2) | | $ | 93.7 | | $ | — | | $ | 93.7 |
| | | | | | | | | | | | | | |
Supplemental Disclosure of Cash Flow Information | | | | | | | | | | | | | | |
Income taxes paid | $ | (0.1) | | $ | — | | $ | (0.1) | | $ | — | | $ | (0.1) |
Interest expense on indebtedness paid | $ | (34.9) | | $ | 3.5 | | $ | (31.4) | | $ | — | | $ | (31.4) |
| | | | | | | | | | | | | | |
Non-Cash Transactions During the Year | | | | | | | | | | | | | | |
Investment exchanges | $ | — | | $ | 70.5 | | $ | 70.5 | | $ | — | | $ | 70.5 |
———————
(1)
Adjustments related to the correction of errors reflect amounts prior to the retrospective adoption of amended guidance to ASC 944,Financial Services – Insurance (ASU 2010-26). See footnote 2 below for additional information regarding these amounts and the retrospective adoption.
(2)
Adjustments related to the retrospective adoption of amended guidance to ASC 944,Financial Services – Insurance (ASU 2010-26), have been updated from those originally disclosed in the First Quarter 2012 Quarterly Report on Form 10-Q filing to reflect the correction of errors identified related to the adoption of the amended guidance as well as indirect impact of the correction of errors associated with the restatement.
F-42
2.
Restatement and Amendment of Previously Reported Financial Information (continued)
| | | | | | | | | | | | | | |
| Consolidated Statement of Changes in Stockholders’ Equity |
($ in millions, except share data) | As of and for the year ended December 31, 2011 |
| As previously reported | | Correction of errors(1) | | Adjusted prior to the retrospective adoption | | Retrospective Adoption(2) | | As restated and amended |
COMMON STOCK:(3) | | | | | | | | | | | | | | |
Balance, beginning of period | $ | 1.3 | | $ | — | | $ | 1.3 | | $ | — | | $ | 1.3 |
Adjustment for reverse stock split | | — | | | — | | | — | | | — | | | — |
Balance, end of period | $ | 1.3 | | $ | — | | $ | 1.3 | | $ | — | | $ | 1.3 |
| | | | | | | | | | | | | | |
ADDITIONAL PAID-IN CAPITAL: | | | | | | | | | | | | | | |
Balance, beginning of period | $ | 2,631.0 | | $ | — | | $ | 2,631.0 | | $ | — | | $ | 2,631.0 |
Issuance of shares and compensation expense
on stock compensation awards | | (0.5) | | | — | | | (0.5) | | | — | | | (0.5) |
Adjustment for reverse stock split | | — | | | — | | | — | | | — | | | — |
Balance, end of period | $ | 2,630.5 | | $ | — | | $ | 2,630.5 | | $ | — | | $ | 2,630.5 |
| | | | | | | | | | | | | | |
ACCUMULATED OTHER COMPREHENSIVE
LOSS: | | | | | | | | | | | | | | |
Balance, beginning of period | $ | (133.8) | | $ | (50.7) | | $ | (184.5) | | $ | 28.3 | | $ | (156.2) |
Adjustment for initial application of
accounting changes | | — | | | — | | | — | | | — | | | — |
Other comprehensive income (loss) | | (36.9) | | | (52.8) | | | (89.7) | | | 15.2 | | | (74.5) |
Balance, end of period | $ | (170.7) | | $ | (103.5) | | $ | (274.2) | | $ | 43.5 | | $ | (230.7) |
| | | | | | | | | | | | | | |
ACCUMULATED DEFICIT: | | | | | | | | | | | | | | |
Balance, beginning of period | $ | (1,163.5) | | $ | (102.1) | | $ | (1,265.6) | | $ | (232.4) | | $ | (1,498.0) |
Adjustment for initial application of
accounting changes | | — | | | — | | | — | | | — | | | — |
Net income (loss) | | 8.1 | | | (61.2) | | | (53.1) | | | 22.4 | | | (30.7) |
Balance, end of period | $ | (1,155.4) | | $ | (163.3) | | $ | (1,318.7) | | $ | (210.0) | | $ | (1,528.7) |
| | | | | | | | | | | | | | |
TREASURY STOCK, AT COST:(3) | | | | | | | | | | | | | | |
Balance, beginning of period | $ | (179.5) | | $ | — | | $ | (179.5) | | $ | — | | $ | (179.5) |
Treasury shares purchased | | — | | | — | | | — | | | — | | | — |
Balance, end of period | $ | (179.5) | | $ | — | | $ | (179.5) | | $ | — | | $ | (179.5) |
| | | | | | | | | | | | | | |
TOTAL STOCKHOLDERS’ EQUITY
ATTRIBUTABLE TO
THE PHOENIX COMPANIES, INC.: | | | | | | | | | | | | | | |
Balance, beginning of period | $ | 1,155.5 | | $ | (152.8) | | $ | 1,002.7 | | $ | (204.1) | | $ | 798.6 |
Adjustment for initial application of
accounting changes | | —— | | | —— | | | — | | | — | | | —— |
Change in stockholders’ equity attributable to
The Phoenix Companies, Inc. | | (29.3) | | | (114.0) | | | (143.3) | | | 37.6 | | | (105.7) |
Stockholders’ equity, end of period | $ | 1,126.2 | | $ | (266.8) | | $ | 859.4 | | $ | (166.5) | | $ | 692.9 |
| | | | | | | | | | | | | | |
NONCONTROLLING INTERESTS: | | | | | | | | | | | | | | |
Balance, beginning of period | $ | — | | $ | 1.8 | | $ | 1.8 | | | — | | $ | 1.8 |
Net income attributable to
noncontrolling interests | | — | | | (0.5) | | | (0.5) | | | — | | | (0.5) |
Contributions to noncontrolling interests | | — | | | 1.5 | | | 1.5 | | | — | | | 1.5 |
Distributions from noncontrolling interests | | — | | | — | | | — | | | — | | | — |
Issuance of Saybrus shares to
noncontrolling interests | | — | | | — | | | — | | | — | | | — |
Balance, end of period | $ | — | | $ | 2.8 | | $ | 2.8 | | $ | — | | $ | 2.8 |
(Continued on next page)
F-43
2.
Restatement and Amendment of Previously Reported Financial Information (continued)
| | | | | | | | | | | | | | |
(Continued from previous page) | Consolidated Statement of Changes in Stockholders’ Equity |
($ in millions, except share data) | As of and for the year ended December 31, 2011 |
| As previously reported | | Correction of errors(1) | | Adjusted prior to the retrospective adoption | | Retrospective Adoption(2) | | As restated and amended |
TOTAL STOCKHOLDERS’ EQUITY: | | | | | | | | | | | | | | |
Balance, beginning of period | $ | 1,155.5 | | $ | (151.0) | | $ | 1,004.5 | | $ | (204.1) | | $ | 800.4 |
Adjustment for initial application of
accounting changes | | —— | | | —— | | | — | | | — | | | —— |
Change in stockholders’ equity | | (29.3) | | | (113.0) | | | (142.3) | | | 37.6 | | | (104.7) |
Stockholders’ equity, end of period | $ | 1,126.2 | | $ | (264.0) | | $ | 862.2 | | $ | (166.5) | | $ | 695.7 |
———————
(1)
Adjustments related to the correction of errors reflect amounts prior to the retrospective adoption of amended guidance to ASC 944,Financial Services – Insurance (ASU 2010-26). See footnote 2 below for additional information regarding these amounts and the retrospective adoption.
(2)
Adjustments related to the retrospective adoption of amended guidance to ASC 944,Financial Services – Insurance (ASU 2010-26), have been updated from those originally disclosed in the First Quarter 2012 Quarterly Report on Form 10-Q filing to reflect the correction of errors identified related to the adoption of the amended guidance as well as indirect impact of the correction of errors associated with the restatement.
(3)
Reflects the 1-for-20 reverse stock split, which was effective August 10, 2012. See Note 11 to these consolidated financial statements for additional information on the reverse stock split.
F-44
2.
Restatement and Amendment of Previously Reported Financial Information (continued)
| | | | | | | | | | | | | | |
| Consolidated Statement of Changes in Stockholders’ Equity |
($ in millions, except share data) | As of and for the year ended December 31, 2010 |
| As previously reported | | Correction of errors(1) | | Adjusted prior to the retrospective adoption | | Retrospective Adoption(2) | | As restated and amended |
|
|
|
COMMON STOCK:(3) | | | | | | | | | | | | | | |
Balance, beginning of period | $ | 1.3 | | $ | — | | $ | 1.3 | | $ | — | | $ | 1.3 |
Adjustment for reverse stock split | | — | | | — | | | — | | | — | | | — |
Balance, end of period | $ | 1.3 | | $ | — | | $ | 1.3 | | $ | — | | $ | 1.3 |
| | | | | | | | | | | | | | |
ADDITIONAL PAID-IN CAPITAL: | | | | | | | | | | | | | | |
Balance, beginning of period | $ | 2,627.3 | | $ | — | | $ | 2,627.3 | | $ | — | | $ | 2,627.3 |
Issuance of shares and compensation expense
on stock compensation awards | | 3.7 | | | — | | | 3.7 | | | — | | | 3.7 |
Adjustment for reverse stock split | | — | | | — | | | — | | | — | | | — |
Balance, end of period | $ | 2,631.0 | | $ | — | | $ | 2,631.0 | | $ | — | | $ | 2,631.0 |
| | | | | | | | | | | | | | |
ACCUMULATED OTHER COMPREHENSIVE
INCOME (LOSS): | | | | | | | | | | | | | | |
Balance, beginning of period | $ | (171.3) | | $ | (37.0) | | $ | (208.3) | | $ | (3.3) | | $ | (211.6) |
Adjustment for initial application of
accounting changes | | 1.7 | | | (0.6) | | | 1.1 | | | — | | | 1.1 |
Other comprehensive income (loss) | | 35.8 | | | (13.1) | | | 22.7 | | | 31.6 | | | 54.3 |
Balance, end of period | $ | (133.8) | | $ | (50.7) | | $ | (184.5) | | $ | 28.3 | | $ | (156.2) |
| | | | | | | | | | | | | | |
ACCUMULATED DEFICIT: | | | | | | | | | | | | | | |
Balance, beginning of period | $ | (1,146.7) | | $ | (48.2) | | $ | (1,194.9) | | $ | (261.9) | | $ | (1,456.8) |
Adjustment for initial application of
accounting changes | | (4.2) | | | (2.6) | | | (6.8) | | | — | | | (6.8) |
Net loss | | (12.6) | | | (51.3) | | | (63.9) | | | 29.5 | | | (34.4) |
Balance, end of period | $ | (1,163.5) | | $ | (102.1) | | $ | (1,265.6) | | $ | (232.4) | | $ | (1,498.0) |
| | | | | | | | | | | | | | |
TREASURY STOCK, AT COST:(3) | | | | | | | | | | | | | | |
Balance, beginning of period | $ | (179.5) | | $ | — | | $ | (179.5) | | $ | — | | $ | (179.5) |
Treasury shares purchased | | — | | | — | | | — | | | — | | | — |
Balance, end of period | $ | (179.5) | | $ | — | | $ | (179.5) | | $ | — | | $ | (179.5) |
| | | | | | | | | | | | | | |
TOTAL STOCKHOLDERS’ EQUITY
ATTRIBUTABLE TO
THE PHOENIX COMPANIES, INC.: | | | | | | | | | | | | | | |
Balance, beginning of period | $ | 1,131.1 | | $ | (85.2) | | $ | 1,045.9 | | $ | (265.2) | | $ | 780.7 |
Adjustment for initial application of
accounting changes | | ((2.5) | | | —(3.2) | | | ((5.7) | | | —— | | | ((5.7) |
Change in stockholders’ equity attributable to
The Phoenix Companies, Inc. | | 26.9 | | | (64.4) | | | (37.5) | | | 61.1 | | | 23.6 |
Stockholders’ equity, end of period | $ | 1,155.5 | | $ | (152.8) | | $ | 1,002.7 | | $ | (204.1) | | $ | 798.6 |
| | | | | | | | | | | | | | |
NONCONTROLLING INTERESTS: | | | | | | | | | | | | | | |
Balance, beginning of period | $ | — | | $ | 1.7 | | $ | 1.7 | | | — | | $ | 1.7 |
Net income attributable to
noncontrolling interests | | — | | | (0.5) | | | (0.5) | | | — | | | (0.5) |
Contributions to noncontrolling interests | | — | | | — | | | — | | | — | | | — |
Distributions from noncontrolling interests | | — | | | — | | | — | | | — | | | — |
Issuance of Saybrus shares to
noncontrolling interests | | — | | | 0.6 | | | 0.6 | | | — | | | 0.6 |
Balance, end of period | $ | — | | $ | 1.8 | | $ | 1.8 | | $ | — | | $ | 1.8 |
(Continued on next page)
F-45
2.
Restatement and Amendment of Previously Reported Financial Information (continued)
| | | | | | | | | | | | | | |
(Continued from previous page) | Consolidated Statement of Changes in Stockholders’ Equity |
($ in millions, except share data) | As of and for the year ended December 31, 2010 |
| As previously reported | | Correction of errors(1) | | Adjusted prior to the retrospective adoption | | Retrospective Adoption(2) | | As restated and amended |
|
|
|
TOTAL STOCKHOLDERS’ EQUITY: | | | | | | | | | | | | | | |
Balance, beginning of period | $ | 1,131.1 | | $ | (83.5) | | $ | 1,047.6 | | $ | (265.2) | | $ | 782.4 |
Adjustment for initial application of
accounting changes | | ((2.5) | | | —(3.2) | | | ((5.7) | | | —— | | | (5.7) |
Change in stockholders’ equity | | 26.9 | | | (64.3) | | | (37.4) | | | 61.1 | | | 23.7 |
Stockholders’ equity, end of period | $ | 1,155.5 | | $ | (151.0) | | $ | 1,004.5 | | $ | (204.1) | | $ | 800.4 |
———————
(1)
Adjustments related to the correction of errors reflect amounts prior to the retrospective adoption of amended guidance to ASC 944,Financial Services – Insurance (ASU 2010-26). See footnote 2 below for additional information regarding these amounts and the retrospective adoption.
(2)
Adjustments related to the retrospective adoption of amended guidance to ASC 944,Financial Services – Insurance (ASU 2010-26), have been updated from those originally disclosed in the First Quarter 2012 Quarterly Report on Form 10-Q filing to reflect the correction of errors identified related to the adoption of the amended guidance as well as indirect impact of the correction of errors associated with the restatement.
(3)
Reflects the 1-for-20 reverse stock split, which was effective August 10, 2012. See Note 11 to these consolidated financial statements for additional information on the reverse stock split.
3.
Basis of Presentation and Significant Accounting Policies
We have prepared these financial statements in accordance with U.S. GAAP which differ materially from the accounting practices prescribed by various insurance regulatory authorities. Our consolidated financial statements include the accounts of the Company and its various subsidiaries. Intercompany balances and transactions have been eliminated in consolidating these financial statements. As of December 31, 2011, the Company changed from the direct to the indirect method of reporting its consolidated cash flow statement. Certain prior year amounts have been reclassified to conform to the current year presentation, primarily as a result of (i) the adoption of new accounting standards as described more fully below and (ii) the 1-for-20 reverse stock split described more fully in Note 11.
Use of estimates
In preparing these financial statements in conformity with U.S. GAAP, we are required to make estimates and assumptions that affect the reported amounts of assets and liabilities at the date of the consolidated financial statements and the reported amounts of revenues and expenses during the reporting periods. Significant estimates and assumptions are made in the determination of EGPs and estimated gross margins (“EGMs”) used in the valuation and amortization of assets and liabilities associated with universal life and annuity contracts; policyholder liabilities and accruals; valuation of investments in debt and equity securities; limited partnerships and other investments; valuation of deferred tax assets; pension and other post-employment benefits liabilities; and accruals for contingent liabilities. Actual results could differ from these estimates.
Adoption of new accounting standards
Amendments to the Presentation of Comprehensive Income
In June 2011, the Financial Accounting Standards Board (the “FASB”) issued amended guidance to ASC 220,Comprehensive Income, with respect to the presentation of comprehensive income as part of the effort to establish common requirements between U.S. GAAP and International Financial Reporting Standards (“IFRS”). This amended guidance requires entities to present all non-owner changes in stockholders’ equity either in a single continuous statement of comprehensive income or in two separate but consecutive statements. The amendments do not affect which components of comprehensive income are recognized in net income or comprehensive income, or when an item of other comprehensive income must be classified to net income. The computation and presentation of earnings per share also does not change. This guidance was adopted in the first quarter of 2012. Other than the required changes in presentation and the additional disclosures, adoption of this guidance did not have a material effect on our consolidated financial statements.
F-46
3.
Basis of Presentation and Significant Accounting Policies (continued)
Amendments to Fair Value Measurement and Disclosure Requirements
In May 2011, the FASB issued amended guidance to ASC 820,Fair Value Measurement, with respect to measuring fair value and related disclosures as part of the effort to establish common requirements in accordance with U.S. GAAP and IFRS. The amended guidance clarifies that the concept of highest and best use should only be used in the valuation of non-financial assets, specifies how to apply fair value measurements to instruments classified in stockholders’ equity and requires that premiums or discounts be applied consistent with what market participants would use absent Level 1 inputs. The amendment also explicitly requires additional disclosures related to the valuation of assets categorized as Level 3 within the fair value hierarchy. Additional disclosures include quantitative information about unobservable inputs, the sensitivity of fair value measurement to changes in unobservable outputs and information on the valuation process used. This guidance was adopted in the first quarter of 2012. Disclosures in Note 14 reflect the prospective adoption of this guidance. Other than additional disclosures, adoption of this guidance did not have a material effect on our consolidated financial statements.
Revision for the Retrospective Adoption of Amended Accounting Guidance
In October 2010, the FASB issued amended guidance to ASC 944,Financial Services – Insurance, to address the diversity in practice for accounting for costs associated with acquiring or renewing insurance contracts. The amendment clarifies the definition of acquisition costs (i.e., costs which qualify for deferral) to include only incremental direct costs that result directly from, and are essential to, a contract and would not have been incurred by the insurance entity had the contract transaction not occurred. Therefore, only costs related to successful efforts of acquiring a new, or renewal, contract should be deferred. This guidance was retrospectively adopted on January 1, 2012 and such retrospective adoption results in amendments to previously reported balances as shown in Note 2 as if the guidance was applied at the inception of all policies in force. The cumulative effect of retrospective adoption reduced deferred policy acquisition costs and beginning stockholders’ equity by $166.5 million as of January 1, 2012. In any period, the adoption resulted in a decrease in amortization of policy acquisition costs due to the reduced deferred policy acquisition cost asset.
Accounting standards not yet adopted
Reporting Amounts Reclassified Out of Accumulated Other Comprehensive Income
In February 2013, the FASB issued updated guidance regarding the presentation of comprehensive income (ASU 2013-02). Under the guidance, an entity would separately present information about significant items reclassified out of accumulated other comprehensive income by component as well as changes in accumulated other comprehensive income balances by component in either the financial statements or the notes to the financial statements. The guidance does not change the items that are reported in other comprehensive income. The guidance does not change when an item of other comprehensive income must be reclassified to net income and does not amend any existing requirements for reporting net income or other comprehensive income. The guidance is effective for the first interim or annual reporting period beginning after December 15, 2012 and should be applied prospectively. This guidance is not expected to impact the Company’s consolidated statements of financial position or cash flows. The Company is currently assessing the impact of this guidance on the Company’s consolidated statements of operations and equity and the notes to consolidated financial statements.
Disclosures about Offsetting Assets and Liabilities
In December 2011, the FASB issued amended guidance to ASC 210,Balance Sheet, with respect to disclosure of offsetting assets and liabilities as part of the effort to establish common requirements in accordance with U.S. GAAP and IFRS. This amended guidance requires the disclosure of both gross information and net information about both financial instruments and derivative instruments eligible for offset in our consolidated balance sheets and instruments and transactions subject to an agreement similar to a master netting arrangement. This guidance is effective for periods beginning on or after January 1, 2013, with respective disclosures required retrospectively for all comparative periods presented. The adoption of this guidance effective January 1, 2013 is not expected to have a material effect on our consolidated financial statements.
F-47
3.
Basis of Presentation and Significant Accounting Policies (continued)
Significant accounting policies
Investments
Debt and Equity Securities
Our debt and equity securities classified as available-for-sale are reported on our consolidated balance sheets at fair value. Fair value is based on quoted market price, where available. When quoted market prices are not available, we estimate fair value by discounting debt security cash flows to reflect interest rates currently being offered on similar terms to borrowers of similar credit quality (private placement debt securities), by quoted market prices of comparable instruments (untraded public debt securities) and by independent pricing sources or internally developed pricing models. We recognize unrealized gains and losses on investments in debt and equity securities that we classify as available-for-sale. We report these unrealized investment gains and losses as a component of OCI, net of the relevant policyholder obligations, applicable deferred policy acquisition costs and applicable deferred income taxes. Realized investment gains and losses are recognized on a first in first out basis.
Limited Partnerships and Other Investments
Limited partnerships, infrastructure funds, hedge funds and joint venture interests in which we do not have voting control or power to direct activities are recorded using the equity method of accounting. These investments include private equity, mezzanine funds, infrastructure funds, hedge funds of funds and direct equity investments. The equity method of accounting requires that the investment be initially recorded at cost and the carrying amount of the investment subsequently adjusted to recognize our share of the earnings or losses. We record our equity in the earnings in net investment income using the most recent financial information received from the partnerships. Recognition of net investment income is generally on a three-month delay due to the timing of the related financial statements. The contributions to and distributions from limited partnerships are classified as investing activities within the statement of cash flows.
Other investments also include leveraged lease investments which represent the net amount of the estimated residual value of the lease assets, rental receivables and unearned and deferred income to be allocated over the lease term. It further includes investments in life settlement contracts accounted for under the investment method under which the Company recognizes its initial investment in life settlement contracts at the transaction price plus all initial direct external costs. Continuing costs to keep the policy in force comprising mainly life insurance premiums, increase the carrying value of the investment while income on individual life settlement contracts are recognized when the insured dies, at an amount equal to the excess of the contract proceeds over the carrying amount of the contract at that time. Contracts are reviewed each quarter for indications that the expected future proceeds from the contract would not be sufficient to recover estimated future carrying amount of the contract (current carrying amount for the contract plus anticipated undiscounted future premiums and other capitalizable future costs.) Any such contracts identified are written down to estimated fair value.
The Company routinely evaluates these investments for impairments. For equity method investees, the Company considers financial and other information provided by the investee, other known information and inherent risks in the underlying investments, as well as future capital commitments, in determining whether an impairment has occurred. The Company considers its cost method investments for other-than-temporary impairments (“OTTI”) when the carrying value of such investments exceeds the net asset value (“NAV”). The Company takes into consideration the severity and duration of this excess when determining whether the cost method investment is other-than-temporarily impaired. When an OTTI has occurred, the impairment loss is recorded within net investment gains (losses).
F-48
3.
Basis of Presentation and Significant Accounting Policies (continued)
Loans are occasionally restructured in a troubled debt restructuring. These restructurings generally include one or more of the following: full or partial payoffs outside of the original contract terms; changes to interest rates; extensions of maturity; or additions or modifications to covenants. When restructurings occur, they are evaluated individually to determine whether the restructuring or modification constitutes a “troubled debt restructuring” as defined by authoritative accounting guidance. In a troubled debt restructuring where the Company receives assets in full or partial satisfaction of the debt, any specific valuation allowance is reversed and a direct write down of the loan is recorded for the amount of the allowance and any additional loss, net of recoveries, or any gain is recorded for the difference between the fair value of the assets received and the recorded investment in the loan. Any remaining loan is evaluated prospectively for impairment based on the credit review process noted above. When a loan is restructured in a troubled debt restructuring, the impairment of the loan is remeasured using the modified terms and the loan’s original effective yield and the allowance for loss is adjusted accordingly. Subsequent to the modification, income is recognized prospectively based on the modified terms of the loans in accordance with the income recognition policy noted above.
The consolidated financial statements include investments in limited partnerships qualifying as variable interest entities (“VIEs”) which the Company is required to consolidate. For certain VIE interests the entity is considered the primary beneficiary, since the Company has both the power to direct the activities of a VIE that most significantly impact the entity’s economic performance and the obligation to absorb losses, or right to receive benefits, that could potentially be significant to the VIE. These VIEs are consolidated.
See Note 9 to these financial statements for additional information regarding VIEs.
Policy Loans
Policy loans are carried at their unpaid principal balances and are collateralized by the cash values of the related policies. The majority of cash values eligible for policy loans are at variable interest rates that are reset annually on the policy anniversary.
Fair Value Instruments
Debt securities held at fair value include fixed-maturity securities held for which changes in fair values are recorded in earnings. The securities held at fair value are designated astradingsecurities, as well as those debt securities for which we have elected the fair value option (“FVO”) and certain available-for-sale structured securities held at fair value. The changes in fair value and any interest income of these securities are reflected in earnings as part of “net investment income.” Refer to “Note 14: Fair Value of Financial Instruments” to these consolidated financial statements for additional disclosures related to these securities.
Derivative Instruments
We recognize derivative instruments on the consolidated balance sheets at fair value.The derivative contracts are reported as assets in derivative instruments or liabilities in other liabilities on the consolidated balance sheets, excluding embedded derivatives. Embedded derivatives, as discussed below, are recorded on the consolidated balance sheets bifurcated from the associated host contract.
The Company economically hedges variability of cash flows to be received or paid related to certain recognized assets and/or liabilities. All changes in the fair value of derivatives, including net receipts and payments, are included in net realized investment gains and losses without consideration of changes in the fair value of the economically associated assets or liabilities. We do not designate the purchased derivatives related to living benefits or index credits as hedges for accounting purposes.
F-49
3.
Basis of Presentation and Significant Accounting Policies (continued)
For derivatives that do not qualify for hedge accounting, all changes in its fair value, including net receipts and payments, are included in net realized investment gains and losses without consideration of changes in the fair value of the economically associated assets or liabilities. Our derivatives do not qualify for hedge accounting.
Net investment income
For asset-backed and fixed maturity debt securities, we recognize interest income using a constant effective yield based on estimated cash flow timing and economic lives of the securities. For high credit quality asset-backed securities, effective yields are recalculated based on actual payments received and updated prepayment expectations, and the amortized cost is adjusted to the amount that would have existed had the new effective yield been applied since acquisition with a corresponding charge or credit to net investment income. For asset-backed securities that are not high credit quality, effective yields are recalculated and adjusted prospectively based on changes in expected undiscounted future cash flows. For certain credit impaired asset-backed securities, effective yields are recalculated and adjusted prospectively to reflect significant increases in undiscounted expected future cash flows and changes in the contractual benchmark interest rate on variable rate securities. Any prepayment fees on fixed maturities and mortgage loans are recorded when earned in net investment income. We record the net income from investments in partnerships and joint ventures in net investment income.
Other-than-temporary impairments on available-for-sale securities
We recognize realized investment losses when declines in fair value of debt and equity securities are considered to be an OTTI.
For debt securities, the other-than-temporarily impaired amount is separated into the amount related to a credit loss and is reported as net realized investment losses included in earnings and any amounts related to other factors are recognized in OCI. The credit loss component represents the difference between the amortized cost of the security and the net present value of its projected future cash flows discounted at the effective interest rate implicit in the debt security prior to impairment. Any remaining difference between the fair value and amortized cost is recognized in AOCI. Subsequent to the recognition of an OTTI, the impaired security is accounted for as if it had been purchased on the date of impairment at an amortized cost basis equal to the previous amortized cost basis less the OTTI recognized in earnings. We will continue to estimate the present value of future expected cash flows and, if significantly greater than the new cost basis, we will accrete the difference as investment income on a prospective basis once the Company has determined that the interest income is likely to be collected.
In evaluating whether a decline in value is other-than-temporary, we consider several factors including, but not limited to, the following:
·
the extent and the duration of the decline;
·
the reasons for the decline in value (credit event, interest related or market fluctuations);
·
our intent to sell the security, or whether it is more likely than not that we will be required to sell it before recovery; and
·
the financial condition and near term prospects of the issuer.
A debt security impairment is deemed other-than-temporary if:
·
we either intend to sell the security, or it is more likely than not that we will be required to sell the security before recovery; or
·
it is probable we will be unable to collect cash flows sufficient to recover the amortized cost basis of the security.
F-50
3.
Basis of Presentation and Significant Accounting Policies (continued)
An equity security impairment is deemed other-than-temporary if:
·
the security has traded at a significant discount to cost for an extended period of time; or
·
we determined we may not realize the full recovery on our investment.
Equity securities are determined to be other-than-temporarily impaired based on management judgment and the consideration of the issuer’s financial condition along with other relevant facts and circumstances. Those securities which have been in a continuous decline for over a twelve month periods are generally considered impaired. Additionally, declines in value that are severe and rapid are considered for reasonability of whether the impairment would be temporary.
Impairments due to deterioration in credit that result in a conclusion that the present value of cash flows expected to be collected will not be sufficient to recover the amortized cost basis of the security are considered other-than-temporary. Other declines in fair value (for example, due to interest rate changes, sector credit rating changes or company-specific rating changes) that result in a conclusion that the present value of cash flows expected to be collected will not be sufficient to recover the amortized cost basis of the security may also result in a conclusion that an OTTI has occurred.
On a quarterly basis, we evaluate securities in an unrealized loss position for potential recognition of an OTTI. In addition, we maintain a watch list of securities in default, near default or otherwise considered by our investment professionals as being distressed, potentially distressed or requiring a heightened level of scrutiny. We also identify securities whose fair value has been below amortized cost on a continuous basis for zero to six months, six months to 12 months and greater than 12 months.
We employ a comprehensive process to determine whether or not a security in an unrealized loss position is other-than-temporarily impaired. This assessment is done on a security-by-security basis and involves significant management judgment. The assessment of whether impairments have occurred is based on management’s evaluation of the underlying reasons for the decline in estimated fair value. The Company’s review of its fixed maturity and equity securities for impairments includes an analysis of the total gross unrealized losses by severity and/or age of the gross unrealized loss. An extended and severe unrealized loss position on a fixed maturity security may not have any impact on the ability of the issuer to service all scheduled interest and principal payments and the Company’s evaluation of recoverability of all contractual cash flows or the ability to recover an amount at least equal to its amortized cost based on the present value of the expected future cash flows to be collected. In contrast, for certain equity securities, greater weight and consideration are given by the Company to a decline in market value and the likelihood such market value decline will recover.
Specifically for structured securities, to determine whether a collateralized security is impaired, we obtain underlying data from the security’s trustee and analyze it for performance trends. A security-specific stress analysis is performed using the most recent trustee information. This analysis forms the basis for our determination of whether the security will pay in accordance with the contractual cash flows.
The closed block policyholder dividend obligation, applicable deferred policy acquisition costs and applicable income taxes, which offset realized investment gains and losses and OTTIs, are each reported separately as components of net income.
Cash and cash equivalents
Cash and cash equivalents include cash on hand, amounts due from banks, money market instruments and other debt instruments with original maturities of three months or less. Negative cash balances are reclassified to other liabilities.
Deferred policy acquisition costs
We defer incremental direct costs related to the successful sale of new or renewal contracts. Incremental direct costs are those costs that result directly from and are essential to the sale of a contract. These costs include principally commissions, underwriting and policy issue expenses, all of which vary with and are primarily related to production of new business.
F-51
3.
Basis of Presentation and Significant Accounting Policies (continued)
We amortize deferred policy acquisition costs based on the related policy’s classification. For individual participating life insurance policies, deferred policy acquisition costs are amortized in proportion to EGMs arising principally from investment results, mortality, dividends to policyholders and expense margins. For universal life, variable universal life and deferred annuities, deferred policy acquisition costs are amortized in proportion to EGPs as discussed more fully below. EGPs are also used to amortize other assets and liabilities in the Company’s consolidated balance sheets, such as sales inducement assets (“SIA”) and unearned revenue reserves (“URR”). Components of EGPs are used to determine reserves for universal life and fixed, indexed and variable annuity contracts with death and other insurance benefits such as guaranteed minimum death and guaranteed minimum income benefits. Both EGMs and EGPs are based on historical and anticipated future experience which is updated periodically.
Certain of our policies may be surrendered for value or exchanged for a different one of our products (internal replacement). The deferred policy acquisition costs balance associated with the replaced or surrendered policies is adjusted to reflect these surrenders.
In addition, deferred policy acquisition costs are adjusted through OCI each period as a result of unrealized gains or losses on securities classified as available-for-sale in a process commonly referred to as shadow accounting. This adjustment is required in order to reflect the impact of these unrealized amounts on interest margins as if these unrealized amounts had been realized.
The projection of EGPs and EGMs requires the extensive use of actuarial assumptions, estimates and judgments about the future. Future EGPs and EGMs are generally projected for the estimated lives of the contracts. Assumptions are set separately for each product and are reviewed at least annually based on our current best estimates of future events. The following table summarizes the most significant assumptions used in the categories set forth below:
| | | | |
Significant Assumption | | Product | | Explanation and Derivation |
| | | | |
Separate account investment return | | Variable Annuities (8.0% long-term return assumption) Variable Universal Life (8.0% long-term return assumption) | | Separate account return assumptions are derived from the long-term returns observed in the asset classes in which the separate accounts are invested. Short-term deviations from the long-term expectations are expected to revert to the long-term assumption over five years. |
Interest rates and default rates | | Fixed and Indexed Annuities Universal Life Participating Life | | Investment returns are based on the current yields and maturities of our fixed income portfolio combined with expected reinvestment rates given current market interest rates. Reinvestment rates are assumed to revert to long-term rates implied by the forward yield curve and long-term default rates. Contractually permitted future changes in credited rates are assumed to help support investment margins. |
Mortality / longevity | | Universal Life Variable Universal Life Fixed and Indexed Annuities Participating Life | | Mortality assumptions are based on Company experience over a rolling five-year period plus supplemental data from industry sources and trends. These assumptions vary by issue age, gender, underwriting class and policy duration.
|
F-52
3.
Basis of Presentation and Significant Accounting Policies (continued)
| | | | |
Significant Assumption | | Product | | Explanation and Derivation |
| | | | |
Policyholder behavior – policy persistency | | Universal Life Variable Universal Life Variable Annuities Fixed and Indexed Annuities Participating Life | | Policy persistency assumptions vary by product and policy year and are updated based on recently observed experience. Policyholders are generally assumed to behave rationally; hence rates are typically lower when surrender penalties are in effect or when policy benefits are more valuable. |
Policyholder behavior – premium persistency | | Universal Life Variable Universal Life | | Future premiums and related fees are projected based on contractual terms, product illustrations at the time of sale and expected policy lapses without value. Assumptions are updated based on recently observed experience and include anticipated changes in behavior based on changes in policy charges if the Company has a high degree of confidence that such changes will be implemented (e.g., change in cost of insurance (“COI”) charges). |
Expenses | | All products | | Projected maintenance expenses to administer policies in force are based on annually updated studies of expenses incurred. |
Reinsurance costs / recoveries | | Universal Life Variable Universal Life Variable Annuities Participating Life | | Projected reinsurance costs are based on treaty terms currently in force. Recoveries are based on the Company’s assumed mortality and treaty terms. Treaty recaptures are based on contract provisions and management’s intentions. |
During the third quarter of every year, we complete a comprehensive assumption review where management makes a determination of best estimate assumptions based on a comprehensive review of recent experience and industry trends. Assumption changes resulting from this review change our estimate of EGPs in the deferred policy acquisition cost and unearned revenue amortization models, as well as projections within the death benefit and other insurance benefit reserving models. The deferred policy acquisition cost asset, the unearned revenue reserves and death benefit and other insurance benefit reserves are then adjusted with an offsetting benefit or charge to income to reflect such changes in the period of the revision. Throughout the year, we may also update the assumptions and adjust the deferred policy acquisition cost, SIA, URR and certain guaranteed minimum income and death benefit balances if emerging data indicate a change is warranted. Our process to assess the reasonableness of the EGPs used for this purpose uses internally developed models together with consideration of applicable recent experience, analysis of market and industry trends and other events. Actual gross profits that vary from management’s estimates in a given reporting period may also result in increases or decreases in the rate of amortization recorded in the period.
All assumption changes, whether resulting from the annual comprehensive review or from other periodic assessments, are considered an unlock in the period of revision. An unlock adjusts the deferred policy acquisition cost, SIA and URR balances as well as additional death benefit reserves and cost of reinsurance balances in the consolidated balance sheets. An unlock that results in an after-tax benefit generally occurs as a result of actual experience or future expectations of product profitability being favorable compared to previous estimates. An unlock that results in an after-tax charge generally occurs as a result of actual experience or future expectations of product profitability being unfavorable compared to previous estimates.
An analysis is performed annually to assess if there are sufficient gross profits to recover the deferred policy acquisition costs associated with business written during the year. If the estimates of gross profits cannot support the recovery of deferred
policy acquisition costs, the amount deferred is reduced to the recoverable amount.
Premises and equipment
Premises and equipment, consisting primarily of our main office building, are stated at cost less accumulated depreciation and amortization and are included in other assets. We depreciate the building on the straight-line method over 39 years and equipment on the straight-line method over three to seven years. We amortize leasehold improvements over the terms of the related leases or the useful life of the improvement, whichever is shorter.
F-53
3.
Basis of Presentation and Significant Accounting Policies (continued)
Separate account assets and liabilities
Separate account assets related to policyholder funds are carried at fair value with an equivalent amount recorded as separate account liabilities. Deposits, net investment income and realized investment gains and losses for these accounts are excluded from revenues and the related liability increases are excluded from benefits and expenses. Fees assessed to the contract owners for management services are included in revenues when services are rendered.
Policy liabilities and accruals
Policy liabilities and accruals include future benefit liabilities for certain life and annuity products. We establish liabilities in amounts adequate to meet the estimated future obligations of policies in force. Future benefit liabilities for traditional life insurance are computed using the net level premium method on the basis of actuarial assumptions as to mortality rates guaranteed in calculating the cash surrender values described in such contracts, contractual guaranteed rates of interest which range from 2.3% to 6.0% and morbidity. Participating insurance represented 20.4% and 20.0% of direct individual life insurance in force at December 31, 2012 and 2011, respectively.
Generally, future policy benefits are payable over an extended period of time and related liabilities are calculated recognizing future expected benefits, expenses and premiums. Such liabilities are established based on methods and underlying assumptions in accordance with U.S. GAAP and applicable actuarial standards. Principal assumptions used in the establishment of liabilities for future policy benefits are mortality, morbidity, policyholder behavior, investment returns, inflation, expenses and other contingent events as appropriate. These assumptions are intended to estimate the experience for the period the policy benefits are payable. Utilizing these assumptions, liabilities are established on a cohort basis, as appropriate. If experience is less favorable than assumed, additional liabilities may be established, resulting in a charge to policyholder benefits and claims.
Additional policyholder liabilities for guaranteed benefits on variable annuity and on fixed index annuity contracts are based on estimates of the expected value of benefits in excess of the projected account balance, recognizing the excess over the accumulation period based on total expected assessments. Because these estimates are sensitive to capital market movements, amounts are calculated using multiple future economic scenarios.
Additional policyholder liabilities are established for certain contract features that could generate significant reductions to future gross profits (e.g., death benefits when a contract has zero account value and a no-lapse guarantee). The liabilities are accrued over the lifetime of the block based on assessments. The assumptions used in estimating these liabilities are consistent with those used for amortizing deferred policy acquisition costs and are, thus, subject to the same variability and risk. The assumptions of investment performance and volatility for variable and equity index products are consistent with historical experience of the appropriate underlying equity indices.
The universal life block of business has experience which produces profits in earlier periods followed by losses in later periods for which a liability is required to be held in addition to the policy liabilities recorded for the block. These liabilities are accrued ratably over the profitable periods to offset the future anticipated losses. The assumptions used in estimating these liabilities are consistent with those used for amortizing deferred policy acquisition costs and are subject to the same variability and risk.
The liability for universal life-type contracts primarily includes the balance that accrues to the benefit of the policyholders as of the financial statement date, including interest credited at rates which range from 3.0% to 4.5%, amounts that have been assessed to compensate us for services to be performed over future periods, accumulated account deposits, withdrawals and any amounts previously assessed against the policyholder that are refundable. There may also be a liability recorded for contracts that include additional death or other insurance benefit features as discussed above.
The Company periodically reviews its estimates of actuarial liabilities for policyholder benefits and compares them with its actual experience. Differences between actual experience and the assumptions used in pricing these policies and guarantees, as well as in the establishment of the related liabilities, result in variances in profit and could result in losses.
F-54
3.
Basis of Presentation and Significant Accounting Policies (continued)
Policy liabilities and accruals also include liabilities for outstanding claims, losses and loss adjustment expenses based on individual case estimates for reported losses and estimates of unreported losses based on past experience. The Company does not establish claim liabilities until a loss has occurred. However, unreported losses and loss adjustment expenses includes estimates of claims that the Company believes have been incurred but have not yet been reported as of the balance sheet date.
Embedded derivatives
Certain contracts contain guarantees that are accounted for as embedded derivative instruments. These guarantees are assessed to determine if a separate instrument with the same terms would qualify as a derivative and if they are not clearly and closely related to the economic characteristics of the host contract. Contract guarantees that meet these criteria are reported separately from the host contract and reported at fair value.
The guaranteed minimum withdrawal benefit (“GMWB”), guaranteed minimum accumulation benefit (“GMAB”) and combination rider (“COMBO”) represent embedded derivative liabilities in the variable annuity contracts. These liabilities are accounted for at fair value within policyholder deposit funds on the consolidated balance sheets with changes in the fair value of embedded derivatives recorded in realized investment gains on the consolidated statements of comprehensive income. The fair value of the GMWB, GMAB and COMBO obligation is calculated based on actuarial and capital market assumptions related to the projected cash flows, including benefits and related contract charges, over the lives of the contracts, incorporating expectations concerning policyholder behavior. As markets change, contracts mature and actual policyholder behavior emerges, these assumptions are continually evaluated and may from time to time be adjusted.
Fixed indexed annuities offer a variety of index options: policy credits that are calculated based on the performance of an outside equity market or other index over a specified term. The index options represent embedded derivative liabilities accounted for at fair value within policyholder deposit funds on the consolidated balance sheets with changes in fair value recorded in realized investment gains and losses in the consolidated statements of comprehensive income. The fair value of these index options is calculated based on the impact of projected interest rates on the discounted liabilities. Several additional inputs reflect our internally developed assumptions related to lapse rates and policyholder behavior.
See Note 12 to these financial statements for additional information regarding embedded derivatives.
Policyholder deposit funds
Amounts received as payment for certain deferred annuities and other contracts without life contingencies are reported as deposits to policyholder deposit funds. The liability for deferred annuities and other contracts without life contingencies is equal to the balance that accrues to the benefit of the contract owner as of the financial statement date which includes the accumulation of deposits plus interest credited, less withdrawals and amounts assessed through the financial statement date as well as accumulated policyholder dividends and the liability representing the fair value of embedded derivatives associated with those contracts.
Contingent liabilities
Management evaluates each contingent matter separately and in aggregate as may be required. Amounts related to contingent liabilities are accrued if it is probable that a liability has been incurred and an amount is reasonably estimable.
Demutualization and closed block
The closed block assets, including future assets from cash flows generated by the assets and premiums and other revenues from the policies in the closed block, will benefit only holders of the policies in the closed block. The principal cash flow items that affect the amount of closed block assets and liabilities are premiums, net investment income, investment purchases and sales, policyholder benefits, policyholder dividends, premium taxes and income taxes. The principal income and expense items excluded from the closed block are management and maintenance expenses, commissions, investment income and realized investment gains and losses on investments held outside the closed block that support the closed block business. All of these excluded income and expense items enter into the determination of EGMs of closed block policies for the purpose of amortization of deferred policy acquisition costs.
F-55
3.
Basis of Presentation and Significant Accounting Policies (continued)
In our financial statements, we present closed block assets, liabilities, revenues and expenses together with all other assets, liabilities, revenues and expenses. Within closed block liabilities, we have established a policyholder dividend obligation to record an additional liability to closed block policyholders for cumulative closed block earnings in excess of expected amounts calculated at the date of demutualization. These closed block earnings will not inure to shareholders, but will result in additional future dividends to closed block policyholders unless otherwise offset by future performance of the closed block that is less favorable than expected.
Revenue recognition
We recognize premiums for participating life insurance products and other life insurance products as revenue when due from policyholders. We match benefits, losses and related expenses with premiums over the related contract periods.
Amounts received as payment for universal life, variable universal life and other investment-type contracts are considered deposits and are not included in premiums. Revenues from these products consist primarily of fees assessed during the period against the policyholders’ account balances for mortality charges, policy administration charges and surrender charges. Fees assessed that represent compensation for services to be provided in the future are deferred and amortized into revenue over the life of the related contracts in proportion to EGPs.
Certain variable annuity contracts and fixed index annuity contract riders provide the holder a guarantee that the benefit received upon death or annuitization will be no less than a minimum prescribed amount. These benefits are accounted for as insurance benefits. Certain variable annuity contracts features and fixed index annuity index options are considered embedded derivatives. These features are discussed in further detail in Note 12 to these financial statements.
Reinsurance
Premiums, policy benefits and operating expenses related to our traditional life and term insurance policies are stated net of reinsurance ceded to other companies, except for amounts associated with certain modified coinsurance contracts which are reflected in the Company’s financial statements based on the application of the deposit method of accounting. Estimated reinsurance recoverables and the net estimated cost of reinsurance are recognized over the life of the reinsured treaty using assumptions consistent with those used to account for the policies subject to the reinsurance.
For universal life and variable universal life contracts, reinsurance premiums and ceded benefits are reflected net within policy benefits. Reinsurance recoverables are recognized in the same period as the related reinsured claim. The net cost or benefit of reinsurance (the present value of all expected ceded premium payments and expected future benefit payments) is recognized over the life of the reinsured treaty using assumptions consistent with those used to account for the policies subject to the reinsurance.
Income taxes
Income tax expense or benefit is recognized based upon amounts reported in the financial statements and the provisions of currently enacted tax laws. Deferred tax assets and/or liabilities are determined by multiplying the differences between the financial reporting and tax reporting bases for assets and liabilities by the enacted tax rates expected to be in effect when such differences are recovered or settled. Valuation allowances on deferred tax assets are recorded to the extent that management concludes that it is more likely than not that an asset will not be realized.
We recognize current income tax assets and liabilities for estimated income taxes refundable or payable based on the income tax returns. We recognize deferred income tax assets and liabilities for the estimated future income tax effects of temporary differences and carryovers. Temporary differences are the differences between the financial statement carrying amounts of assets and liabilities and their tax bases, as well as the timing of income or expense recognized for financial reporting and tax purposes of items not related to assets or liabilities. If necessary, we establish valuation allowances to reduce the carrying amount of deferred income tax assets to amounts that are more likely than not to be realized. We periodically review the adequacy of these valuation allowances and record any increase or reduction in allowances in accordance with intraperiod allocation rules. We assess all significant tax positions to determine if a liability for an uncertain tax position is necessary and, if so, the impact on the current or deferred income tax balances. Also, if indicated, we recognize interest or penalties related to income taxes as a component of the income tax provision.
F-56
3.
Basis of Presentation and Significant Accounting Policies (continued)
Pension and other post-employment benefits
We recognize pension and other postretirement benefit costs and obligations over the employees’ expected service periods by discounting an estimate of aggregate benefits. We estimate aggregate benefits by using assumptions for rates of return on pension plan assets and future health care costs. We recognize an expense for differences between actual experience and estimates exceeding a corridor over the average future lifetime of participants. We recognize an expense for our contributions to employee and agent savings plans at the time employees and agents make contributions to the plans. We also recognize the costs and obligations of severance, disability and related life insurance and health care benefits to be paid to inactive or former employees after employment but before retirement.
Audit fees and other professional services associated with the Restatement
Professional fees associated with the restatement are being recognized and expensed as incurred and totaled $4.0 million in 2012.
4.
Business Combinations and Dispositions
Goodwin Capital Advisers, Inc.
On September 14, 2011, we entered into a definitive agreement to sell Goodwin Capital Advisers, Inc. (“Goodwin”) to Conning Holdings Corp. (“Conning Holdings”). Also, on September 14, 2011, we entered into multi-year investment management agreements with Conning, Inc. (“Conning”) under which Conning will manage the Company’s publicly traded fixed income assets. Because of the ongoing cash flows associated with the investment management agreements, results of these operations have been reflected within continuing operations. The transaction closed on November 18, 2011.
Private placement and limited partnership portfolios previously managed under Goodwin continue to be managed by Phoenix under its subsidiary, Phoenix Life.
PFG Holdings, Inc.
On January 4, 2010, we signed a definitive agreement to sell PFG and its subsidiaries, including AGL Life Assurance Company, to Tiptree Financial Partners, LP (“Tiptree”). Because of the divestiture, these operations are reflected as discontinued operations. On June 23, 2010, we completed the divestiture of PFG and closed the transaction.
The definitive agreement contains a provision requiring us to indemnify Tiptree for any losses due to actions resulting from certain specified acts or omissions associated with the divested business prior to closing. There has been litigation filed that falls within this provision of the agreement but does not name the Company as a party to the litigation. We intend to defend these matters vigorously based on our indemnity commitment.
Phoenix Life and Reassurance Company of New York
Included within the January 4, 2010 agreement with Tiptree was a provision for the purchase of Phoenix Life and Reassurance Company of New York (“PLARNY”) pending regulatory approval. On September 24, 2010, approval was obtained from the New York Department of Financial Services (“NYDFS”) (formerly known as the State of New York Insurance Department) for Tiptree and PFG Holdings Acquisition Corporation to acquire PLARNY. The transaction closed on October 6, 2010. Because of the divestiture, these operations are reflected as discontinued operations.
F-57
5.
Demutualization and Closed Block
In 1999, we began the process of reorganizing and demutualizing our then principal operating company, Phoenix Home Life. We completed the process in June 2001, when all policyholder membership interests in this mutual company were extinguished and eligible policyholders of the mutual company received shares of common stock of The Phoenix Companies, Inc., together with cash and policy credits, as compensation. To protect the future dividends of these policyholders, we also established a closed block for their existing policies.
Because closed block liabilities exceed closed block assets, we have a net closed block liability at December 31, 2012 and 2011, respectively. This net liability represents the maximum future earnings contribution to be recognized from the closed block and the change in this net liability each period is in the earnings contribution recognized from the closed block for the period. To the extent that actual cash flows differ from amounts anticipated, we may adjust policyholder dividends. If the closed block has excess funds, those funds will be available only to the closed block policyholders. However, if the closed block has insufficient funds to make policy benefit payments that are guaranteed, the payments will be made from assets outside of the closed block.
| | | | | | | | |
Closed Block Assets and Liabilities: | As of December 31, | | |
($ in millions) | 2012 | | 2011 | | Inception |
| | | As restated | | |
| | | and amended | | |
| | | | | | | | |
Debt securities | $ | 6,396.4 | | $ | 6,323.5 | | $ | 4,773.1 |
Equity securities | | 11.4 | | | 12.6 | | | — |
Limited partnerships and other investments | | 353.1 | | | 338.0 | | | 399.0 |
Policy loans | | 1,233.5 | | | 1,280.4 | | | 1,380.0 |
Fair value investments | | 30.8 | | | 27.8 | | | — |
Total closed block investments | | 8,025.2 | | | 7,982.3 | | | 6,552.1 |
Cash and cash equivalents | | 32.7 | | | 15.1 | | | — |
Accrued investment income | | 85.3 | | | 94.2 | | | 106.8 |
Receivables | | 60.6 | | | 68.8 | | | 35.2 |
Deferred income taxes, net | | 217.6 | | | 226.8 | | | 389.4 |
Other closed block assets | | 31.7 | | | 39.2 | | | 6.2 |
Total closed block assets | | 8,453.1 | | | 8,426.4 | | | 7,089.7 |
Policy liabilities and accruals | | 8,421.7 | | | 8,680.4 | | | 8,301.7 |
Policyholder dividends payable | | 223.8 | | | 241.0 | | | 325.1 |
Policy dividend obligation | | 779.8 | | | 511.5 | | | — |
Other closed block liabilities | | 47.5 | | | 41.0 | | | 12.3 |
Total closed block liabilities | | 9,472.8 | | | 9,473.9 | | | 8,639.1 |
Excess of closed block liabilities over closed block assets(1) | $ | 1,019.7 | | $ | 1,047.5 | | $ | 1,549.4 |
———————
(1)
The maximum future earnings summary to inure to the benefit of the stockholders is represented by the excess of closed block liabilities over closed block assets. All unrealized investment gains (losses), net of income tax, have been allocated to the policyholder dividend obligation.
F-58
5.
Demutualization and Closed Block (continued)
| | | | | | | | |
Closed Block Revenues and Expenses and Changes in | Years Ended December 31, |
Policyholder Dividend Obligations: | 2012 | | 2011 | | 2010 |
| | | As restated | | As restated |
($ in millions) | | | and amended | | and amended |
Closed block revenues | | | | | | | | |
Premiums | $ | 369.5 | | $ | 413.7 | | $ | 478.0 |
Net investment income | | 452.9 | | | 465.5 | | | 494.3 |
Net realized investment gains (losses) | | 9.2 | | | (4.1) | | | 4.6 |
Total revenues | | 831.6 | | | 875.1 | | | 976.9 |
Policy benefits, excluding dividends | | 490.8 | | | 564.9 | | | 612.6 |
Other operating expenses | | 3.0 | | | 3.7 | | | 8.3 |
Total benefits and expenses, excluding policyholder dividends | | 493.8 | | | 568.6 | | | 620.9 |
Closed block contribution to income before dividends and income taxes | | 337.8 | | | 306.5 | | | 356.0 |
Policyholder dividends | | (294.5) | | | (258.7) | | | (301.3) |
Closed block contribution to income before income taxes | | 43.3 | | | 47.8 | | | 54.7 |
Applicable income tax expense | | 15.2 | | | 16.7 | | | 19.1 |
Noncontrolling interests | | 0.5 | | | (0.1) | | | — |
Closed block contribution to income | $ | 27.6 | | $ | 31.2 | | $ | 35.6 |
| | | | | | | | |
Policyholder dividend obligation | | | | | | | | |
Policyholder dividends provided through earnings | $ | 294.5 | | $ | 258.7 | | $ | 301.3 |
Policyholder dividends provided through OCI | | 168.0 | | | 158.6 | | | 287.2 |
Additions to policyholder dividend liabilities | | 462.5 | | | 417.3 | | | 588.5 |
Policyholder dividends paid | | (211.4) | | | (251.3) | | | (303.5) |
Increase in policyholder dividend liabilities | | 251.1 | | | 166.0 | | | 285.0 |
Policyholder dividend liabilities, beginning of period | | 752.5 | | | 586.5 | | | 301.5 |
Policyholder dividend liabilities, end of period | | 1,003.6 | | | 752.5 | | | 586.5 |
Policyholder dividends payable, end of period | | (223.8) | | | (241.0) | | | (264.4) |
Policyholder dividend obligation, end of period | $ | 779.8 | | $ | 511.5 | | $ | 322.1 |
The policyholder dividend obligation includes approximately $172.6 million and $72.4 million, respectively, for cumulative closed block earnings in excess of expected amounts calculated at the date of demutualization as of December 31, 2012 and 2011, respectively. These closed block earnings will not inure to stockholders, but will result in additional future dividends to closed block policyholders unless otherwise offset by future performance of the closed block that is less favorable than expected. If actual cumulative performance is less favorable than expected, only actual earnings will be recognized in net income. As of December 31, 2012 and 2011, the policyholder dividend obligation also includes $607.2 million and $439.1 million, respectively, of net unrealized gains on investments supporting the closed block liabilities.
6.
Reinsurance
We use reinsurance agreements to limit potential losses, reduce exposure to larger risks and provide capital relief with regard to certain reserves.
The amount of risk ceded depends on our evaluation of the specific risk and applicable retention limits. For business sold prior to December 31, 2010, our retention limit on any one life is $10 million for single life and joint first-to-die policies and $12 million for joint last-to-die policies. Beginning January 1, 2011, our retention limit on new business is $5 million for single life and joint first-to-die policies and $6 million for second-to-die policies. We also assume reinsurance from other insurers.
Our reinsurance program cedes various types of risks to other reinsurers primarily under yearly renewable term and coinsurance agreements. Yearly renewable term and coinsurance agreements result in passing all or a portion of the risk to the reinsurer. Under coinsurance agreements on our traditional and term insurance policies, the reinsurer receives a proportionate amount of the premiums less an allowance for commissions and expenses and is liable for a corresponding proportionate amount of all benefit payments. Under our yearly renewable term agreements, the ceded premium represents a charge for the death benefit coverage.
Effective October 1, 2009, PHLVIC and Phoenix Life and Annuity Company coinsured all the benefit risks, net of existing reinsurance, on their term insurance business in force.
F-59
6.
Reinsurance (continued)
Trust agreements and irrevocable letters of credit aggregating $49.6 million at December 31, 2012 have been arranged with commercial banks in our favor to collateralize the ceded reserves. This includes $2.6 million of irrevocable letters of credit related to our discontinued group accident and health reinsurance operations.
We assume and cede business related to our discontinued group accident and health reinsurance operations. While we are not writing any new contracts, we are contractually obligated to continue to assume and cede premiums related to existing contracts. See Note 24 to these financial statements for more information.
Reinsurance recoverable includes balances due from reinsurers for paid and unpaid losses and is presented net of an allowance for uncollectable reinsurance. The reinsurance recoverable balance is $583.6 million and $564.3 million as of December 31, 2012 and 2011, respectively, and is recorded within receivables in the consolidated balance sheets. Other reinsurance activity is shown below.
| | | | | | | | |
Direct Business and Reinsurance in Continuing Operations: | Years Ended December 31, |
($ in millions) | 2012 | | 2011 | | 2010 |
| | | As restated | | As restated |
| | | and amended | | and amended |
| | | | | | | | |
Direct premiums | $ | 565.3 | | $ | 617.8 | | $ | 703.4 |
Premiums assumed from reinsureds | | 11.8 | | | 13.6 | | | 13.6 |
Premiums ceded to reinsurers (1) | | (174.8) | | | (182.7) | | | (209.5) |
Premiums | $ | 402.3 | | $ | 448.7 | | $ | 507.5 |
Percentage of amount assumed to net premiums | | 2.9% | | | 3.0% | | | 2.7% |
| | | | | | | | |
Direct policy benefits incurred | $ | 812.9 | | $ | 763.1 | | $ | 832.9 |
Policy benefits assumed from reinsureds | | 68.7 | | | 9.6 | | | 21.7 |
Policy benefits ceded to reinsurers | | (270.3) | | | (255.2) | | | (347.9) |
Premiums paid to reinsurers (2) | | 97.4 | | | 95.9 | | | 85.9 |
Policy benefits(3) | $ | 708.7 | | $ | 613.4 | | $ | 592.6 |
| | | | | | | | |
Direct life insurance in force | $ | 115,298.6 | | $ | 122,981.9 | | $ | 133,612.1 |
Life insurance in force assumed from reinsureds | | 369.2 | | | 1,753.7 | | | 1,694.2 |
Life insurance in force ceded to reinsurers | | (74,609.4) | | | (81,259.2) | | | (85,873.3) |
Life insurance in force | $ | 41,058.4 | | $ | 43,476.4 | | $ | 49,433.0 |
Percentage of amount assumed to net insurance in force | | 0.9% | | | 4.0% | | | 3.4% |
———————
(1)
Primarily represents premiums ceded to reinsurers related to traditional life and term insurance policies.
(2)
For universal life and variable universal life contracts, premiums paid to reinsurers are reflected within policy benefits. See Note 3 to these financial statements for additional information regarding significant accounting policies.
(3)
Policy benefit amounts above exclude changes in reserves, interest credited to policyholders, and other items, which total $457.4 million, $523.6 million and $528.9 million, net of reinsurance, for the years ended December 31, 2012, 2011 and 2010, respectively.
We remain liable to the extent that reinsuring companies may not be able to meet their obligations under reinsurance agreements in effect. Failure of the reinsurers to honor their obligations could result in losses to the Company. Since we bear the risk of nonpayment, on a quarterly basis we evaluate the financial condition of our reinsurers and monitor concentrations of credit risk. Based on our review of their financial statements, reputation in the reinsurance marketplace and other relevant information, we believe that we have no material exposure to uncollectible life reinsurance. At December 31, 2012, five major reinsurance companies account for approximately 64% of the reinsurance recoverable.
F-60
7.
Deferred Policy Acquisition Costs
Deferred policy acquisition costs
On January 1, 2012, the Company adopted amendments to ASC 944,Financial Services – Insurance (ASU 2010-26) as further discussed in Note 2 to these financial statements. Also refer to Note 3 for discussion of accounting policy related to deferral and amortization of acquisition costs.
The balances of and changes in deferred policy acquisition costs as of and for the years ended December 31, are as follows:
| | | | | | | | |
Deferred Policy Acquisition Costs: | Years Ended December 31, |
($ in millions) | 2012 | | 2011 | | 2010 |
| | | As restated | | As restated |
| | | and amended | | and amended |
| | | | | | | | |
Policy acquisition costs deferred | $ | 58.1 | | $ | 91.2 | | $ | 12.8 |
Costs amortized to expenses: | | | | | | | | |
Recurring costs | | (143.8) | | | (160.8) | | | (212.3) |
Assumption unlocking | | (55.2) | | | 2.8 | | | (58.1) |
Realized investment gains (losses) | | (1.0) | | | 0.1 | | | 2.2 |
Offsets to net unrealized investment gains or losses included in AOCI (1) | | (75.1) | | | (52.8) | | | (136.2) |
Adoption of new accounting guidance (2) | | — | | | — | | | (2.2) |
Change in deferred policy acquisition costs | | (217.0) | | | (119.5) | | | (393.8) |
Deferred policy acquisition costs, beginning of period | | 1,119.2 | | | 1,238.7 | | | 1,632.5 |
Deferred policy acquisition costs, end of period | $ | 902.2 | | $ | 1,119.2 | | $ | 1,238.7 |
———————
(1)
An offset to deferred policy acquisition costs and AOCI is recorded each period to the extent that, had unrealized holding gains or losses from securities classified as available-for-sale actually been realized, an adjustment to deferred policy acquisition costs amortized using gross profits or gross margins would result.
(2)
Adjustment relates to the impact of adoption in 2010 of Accounting Standards Update 2010-11,Derivatives and Hedging (Topic 815), Scope Exception Related to Embedded Credit Derivatives.
During the years ended December 31, 2012, 2011 and 2010, deferred expenses primarily consisted of third-party commissions related to fixed indexed annuity sales.
8.
Sales Inducements
Sales inducements
The Company currently offers bonus payments to contract owners on certain of its individual life and annuity products. Expenses incurred related to bonus payments are deferred and amortized over the life of the related contracts in a pattern consistent with the amortization of deferred policy acquisition costs. The Company unlocks the assumption used in the amortization of the deferred sales inducement asset consistent with the unlock of assumptions used in determining EGPs. Deferred sales inducements are included in other assets on the consolidated balance sheets and amortization of deferred sales inducements is included in other operating expense on the consolidated statements of comprehensive income.
| | | | | | | | |
Changes in Deferred Sales Inducement Activity: | Years Ended December 31, |
($ in millions) | 2012 | | 2011 | | 2010 |
| | | As restated and amended | | As restated |
| | | | and amended |
| | | | | | | | |
Deferred asset, beginning of period | $ | 50.2 | | $ | 20.9 | | $ | 8.1 |
Sales inducements deferred | | 15.4 | | | 48.3 | | | 15.4 |
Amortization charged to income | | (6.7) | | | (4.9) | | | (2.6) |
Offsets to net unrealized investment gains or losses included in AOCI | | 2.5 | | | (14.1) | | | — |
Deferred asset, end of period | $ | 61.4 | | $ | 50.2 | | $ | 20.9 |
F-61
9.
Investing Activities
Debt and equity securities
The following tables present the fixed maturity and equity securities available-for-sale by sector held at December 31, 2012 and 2011, respectively. The unrealized loss amounts presented below include the non-credit loss component of OTTI losses. We classify these investments into various sectors in line with industry conventions.
| | | | | | | | | | | | | | |
Fair Value and Cost of Securities: | December 31, 2012 |
($ in millions) | Amortized Cost | | Gross Unrealized Gains(1) | | Gross Unrealized Losses(1) | | Fair Value | | OTTI Recognized in AOCI(2) |
|
|
| | | | | | | | | | | | | | |
U.S. government and agency | $ | 1,055.5 | | $ | 58.5 | | $ | (2.5) | | $ | 1,111.5 | | $ | — |
State and political subdivision | | 321.5 | | | 37.8 | | | (2.1) | | | 357.2 | | | (1.4) |
Foreign government | | 167.5 | | | 36.8 | | | — | | | 204.3 | | | — |
Corporate | | 6,996.4 | | | 745.7 | | | (72.1) | | | 7,670.0 | | | (8.9) |
Commercial mortgage-backed (“CMBS”) | | 817.2 | | | 72.9 | | | (7.9) | | | 882.2 | | | (21.8) |
Residential mortgage-backed (“RMBS”) | | 1,698.2 | | | 94.3 | | | (20.8) | | | 1,771.7 | | | (64.0) |
CDO/CLO | | 240.5 | | | 6.4 | | | (23.2) | | | 223.7 | | | (33.4) |
Other asset-backed | | 421.2 | | | 26.6 | | | (12.4) | | | 435.4 | | | 5.9 |
Available-for-sale debt securities | $ | 11,718.0 | | $ | 1,079.0 | | $ | (141.0) | | $ | 12,656.0 | | $ | (123.6) |
| | | | | | | | | | | | | | |
Amounts applicable to the closed block | $ | 5,789.7 | | $ | 644.9 | | $ | (38.2) | | $ | 6,396.4 | | $ | (43.5) |
| | | | | | | | | | | | | | |
Available-for-sale equity securities | $ | 27.5 | | $ | 9.7 | | $ | (2.4) | | $ | 34.8 | | $ | — |
| | | | | | | | | | | | | | |
Amounts applicable to the closed block | $ | 10.9 | | $ | 1.8 | | $ | (1.3) | | $ | 11.4 | | $ | — |
———————
(1)
Net unrealized investment gains and losses on securities classified as available-for-sale and certain other assets are included in our consolidated balance sheets as a component of AOCI. The table above presents the special category of AOCI for debt securities that are other-than-temporarily impaired when the impairment loss has been split between the credit loss component (in earnings) and the non-credit component (separate category of AOCI).
(2)
Represents the amount of non-credit OTTI losses recognized in AOCI excluding net unrealized gains or losses subsequent to the date of impairment.
| | | | | | | | | | | | | | |
Fair Value and Cost of Securities: | December 31, 2011 |
($ in millions) | As restated and amended |
| Amortized Cost | | Gross Unrealized Gains(1) | | Gross Unrealized Losses(1) | | Fair Value | | OTTI Recognized in AOCI(2) |
|
|
| | | | | | | | | | | | | | |
U.S. government and agency | $ | 678.0 | | $ | 71.6 | | $ | (7.8) | | $ | 741.8 | | $ | — |
State and political subdivision | | 259.3 | | | 25.4 | | | (2.9) | | | 281.8 | | | — |
Foreign government | | 185.7 | | | 21.2 | | | (1.7) | | | 205.2 | | | — |
Corporate | | 6,127.9 | | | 601.7 | | | (171.4) | | | 6,558.2 | | | (5.8) |
Commercial mortgage-backed (“CMBS”) | | 1,098.9 | | | 50.4 | | | (20.0) | | | 1,129.3 | | | (29.2) |
Residential mortgage-backed (“RMBS”) | | 2,094.7 | | | 82.9 | | | (70.6) | | | 2,107.0 | | �� | (92.2) |
CDO/CLO | | 283.8 | | | 2.5 | | | (53.9) | | | 232.4 | | | (36.2) |
Other asset-backed | | 538.7 | | | 18.9 | | | (16.3) | | | 541.3 | | | 2.8 |
Available-for-sale debt securities | $ | 11,267.0 | | $ | 874.6 | | $ | (344.6) | | $ | 11,797.0 | | $ | (160.6) |
| | | | | | | | | | | | | | |
Amounts applicable to the closed block | $ | 5,884.0 | | $ | 565.7 | | $ | (126.2) | | $ | 6,323.5 | | $ | (53.1) |
| | | | | | | | | | | | | | |
Available-for-sale equity securities | $ | 32.6 | | $ | 10.9 | | $ | (7.8) | | $ | 35.7 | | $ | — |
| | | | | | | | | | | | | | |
Amounts applicable to the closed block | $ | 13.4 | | $ | 3.2 | | $ | (4.0) | | $ | 12.6 | | $ | — |
———————
(1)
Net unrealized investment gains and losses on securities classified as available-for-sale and certain other assets are included in our consolidated balance sheets as a component of AOCI. The table above presents the special category of AOCI for debt securities that are other-than-temporarily impaired when the impairment loss has been split between the credit loss component (in earnings) and the non-credit component (separate category of AOCI).
(2)
Represents the amount of non-credit OTTI losses recognized in AOCI excluding net unrealized gains or losses subsequent to the date of impairment.
F-62
9.
Investing Activities (continued)
| | | | | | |
Maturities of Debt Securities: | December 31, 2012 |
($ in millions) | Amortized Cost | | Fair Value |
|
| | | | | |
Due in one year or less | $ | 1,128.7 | | $ | 1,140.7 |
Due after one year through five years | | 2,046.7 | | | 2,219.1 |
Due after five years through ten years | | 2,824.4 | | | 3,131.3 |
Due after ten years | | 2,541.2 | | | 2,852.0 |
CMBS/RMBS/ABS/CDO/CLO(1) | | 3,177.0 | | | 3,312.9 |
Total | $ | 11,718.0 | | $ | 12,656.0 |
———————
(1)
CMBS, RMBS, ABS, CDO and CLO are not listed separately in the table as each security does not have a single fixed maturity.
The maturities of debt securities, as of December 31, 2012, are summarized in the table above by contractual maturity. Actual maturities may differ from contractual maturities as certain borrowers have the right to call or prepay obligations with or without call or prepayment penalties, and we have the right to put or sell certain obligations back to the issuers.
The following table depicts the sources of available-for-sale investment proceeds and related investment gains (losses).
| | | | | | | | |
Sales of Available-for-Sale Securities: | As of December 31, |
($ in millions) | 2012 | | 2011 | | 2010 |
| | | As restated | | As restated |
| | | and amended | | and amended |
Fixed maturities, available-for-sale | | | | | | | | |
Proceeds from sales | $ | 1,541.6 | | $ | 1,087.2 | | $ | 1,446.9 |
Proceeds from maturities/repayments | | 1,757.0 | | | 1,264.0 | | | 1,246.4 |
Gross investment gains from sales, prepayments and maturities | | 52.3 | | �� | 13.6 | | | 57.9 |
Gross investment losses from sales and maturities | | (11.1) | | | (6.0) | | | (16.0) |
| | | | | | | | |
Equity securities, available-for-sale | | | | | | | | |
Proceeds from sales | $ | 12.6 | | $ | 9.4 | | $ | 1.5 |
Gross investment gains from sales | | 8.5 | | | 3.8 | | | — |
Gross investment losses from sales | | (0.4) | | | (0.1) | | | — |
F-63
9.
Investing Activities (continued)
| | | | | | | | | | | | | | | | | | |
Aging of Temporarily Impaired Securities: | As of December 31, 2012 |
($ in millions) | Less than 12 months | | Greater than 12 months | | Total |
| Fair | | Unrealized | | Fair | | Unrealized | | Fair | | Unrealized |
| Value | | Losses | | Value | | Losses | | Value | | Losses |
Debt Securities | | | | | | | | | | | | | | | | | |
U.S. government and agency | $ | 9.0 | | $ | (0.1) | | $ | 28.4 | | $ | (2.4) | | $ | 37.4 | | $ | (2.5) |
State and political subdivision | | 13.5 | | | (0.8) | | | 7.1 | | | (1.3) | | | 20.6 | | | (2.1) |
Foreign government | | — | | | — | | | — | | | — | | | — | | | — |
Corporate | | 300.9 | | | (6.2) | | | 318.2 | | | (65.9) | | | 619.1 | | | (72.1) |
CMBS | | 8.4 | | | (1.0) | | | 30.7 | | | (6.9) | | | 39.1 | | | (7.9) |
RMBS | | 64.7 | | | (0.4) | | | 212.6 | | | (20.4) | | | 277.3 | | | (20.8) |
CDO/CLO | | 26.2 | | | (2.0) | | | 132.7 | | | (21.2) | | | 158.9 | | | (23.2) |
Other asset-backed | | 10.1 | | | (0.7) | | | 43.3 | | | (11.7) | | | 53.4 | | | (12.4) |
Debt securities | | 432.8 | | | (11.2) | | | 773.0 | | | (129.8) | | | 1,205.8 | | | (141.0) |
Equity securities | | 4.4 | | | (1.6) | | | 2.4 | | | (0.8) | | | 6.8 | | | (2.4) |
Total temporarily impaired securities | $ | 437.2 | | $ | (12.8) | | $ | 775.4 | | $ | (130.6) | | $ | 1,212.6 | | $ | (143.4) |
| | | | | | | | | | | | | | | | | |
Amounts inside the closed block | $ | 150.7 | | $ | (4.6) | | $ | 332.4 | | $ | (34.9) | | $ | 483.1 | | $ | (39.5) |
| | | | | | | | | | | | | | | | | |
Amounts outside the closed block | $ | 286.5 | | $ | (8.2) | | $ | 443.0 | | $ | (95.7) | | $ | 729.5 | | $ | (103.9) |
| | | | | | | | | | | | | | | | | |
Amounts outside the closed block
that are below investment grade | $ | 29.8 | | $ | (2.0) | | $ | 177.5 | | $ | (63.4) | | $ | 207.3 | | $ | (65.4) |
| | | | | | | | | | | | | | | | | |
Number of securities | | | | | 108 | | | | | | 196 | | | | | | 304 |
Unrealized losses on below-investment-grade debt securities outside the closed block with a fair value depressed by more than 20% of amortized cost totaled $52.3 million at December 31, 2012, of which $52.1 million was depressed by more than 20% of amortized cost for more than 12 months.
Unrealized losses on below-investment-grade debt securities held in the closed block with a fair value depressed by more than 20% of amortized cost totaled $5.5 million at December 31, 2012, of which $5.5 million was depressed by more than 20% of amortized cost for more than 12 months.
As of December 31, 2012, available-for-sale securities in an unrealized loss position for over 12 months consisted of 192 debt securities and four equity securities. The debt securities primarily relate to municipal securities, asset backed securities, and corporate securities, which have depressed values due primarily to an increase in interest rates since the purchase of these securities. Unrealized losses were not recognized in earnings on these fixed maturity securities since the Company neither intends to sell the securities nor do we believe that it is more likely than not that it will be required to sell these securities before recovery of their amortized cost basis. Additionally, based on a security-by-security analysis, we expect to recover the entire amortized cost basis of these securities. In our evaluation of each security, management considers the actual recovery periods for these securities in previous periods of broad market declines. For securities with significant declines, individual security level analysis is performed, which considers any credit enhancements, expectations of defaults on underlying collateral and other available market data, including industry analyst reports and forecasts. Similarly, for equity securities in an unrealized loss position for more than 12 months, management performs an analysis on a security by security basis. Although there may be sustained losses for the prior four quarters on these securities, additional information is obtained related to company performance in the fourth quarter of 2012 which would not indicate that the additional losses are other-than-temporary.
F-64
9.
Investing Activities (continued)
| | | | | | | | | | | | | | | | | | |
Aging of Temporarily Impaired Securities: | As of December 31, 2011 |
($ in millions) | As restated and amended |
| Less than 12 months | | Greater than 12 months | | Total |
| Fair | | Unrealized | | Fair | | Unrealized | | Fair | | Unrealized |
| Value | | Losses | | Value | | Losses | | Value | | Losses |
Debt Securities | | | | | | | | | | | | | | | | | |
U.S. government and agency | $ | — | | $ | (2.4) | | $ | 41.2 | | $ | (5.4) | | $ | 41.2 | | $ | (7.8) |
State and political subdivision | | 26.1 | | | (0.1) | | | 6.2 | | | (2.8) | | | 32.3 | | | (2.9) |
Foreign government | | 25.6 | | | (1.7) | | | — | | | — | | | 25.6 | | | (1.7) |
Corporate | | 367.0 | | | (29.4) | | | 501.2 | | | (142.0) | | | 868.2 | | | (171.4) |
CMBS | | 132.4 | | | (4.1) | | | 52.1 | | | (15.9) | | | 184.5 | | | (20.0) |
RMBS | | 178.1 | | | (7.8) | | | 392.4 | | | (62.8) | | | 570.5 | | | (70.6) |
CDO/CLO | | 15.4 | | | (0.8) | | | 167.6 | | | (53.1) | | | 183.0 | | | (53.9) |
Other asset-backed | | 101.3 | | | (2.1) | | | 57.8 | | | (14.2) | | | 159.1 | | | (16.3) |
Debt securities | | 845.9 | | | (48.4) | | | 1,218.5 | | | (296.2) | | | 2,064.4 | | | (344.6) |
Equity securities | | 12.1 | | | (7.0) | | | 0.4 | | | (0.8) | | | 12.5 | | | (7.8) |
Total temporarily impaired securities | $ | 858.0 | | $ | (55.4) | | $ | 1,218.9 | | $ | (297.0) | | $ | 2,076.9 | | $ | (352.4) |
| | | | | | | | | | | | | | | | | |
Amounts inside the closed block | $ | 308.5 | | $ | (23.6) | | $ | 552.7 | | $ | (106.6) | | $ | 861.2 | | $ | (130.2) |
| | | | | | | | | | | | | | | | | |
Amounts outside the closed block | $ | 549.5 | | $ | (31.8) | | $ | 666.2 | | $ | (190.4) | | $ | 1,215.7 | | $ | (222.2) |
| | | | | | | | | | | | | | | | | |
Amounts outside the closed block
that are below investment grade | $ | 68.8 | | $ | (13.9) | | $ | 248.5 | | $ | (125.2) | | $ | 317.3 | | $ | (139.1) |
| | | | | | | | | | | | | | | | | |
Number of securities | | | | | 255 | | | | | | 304 | | | | | | 559 |
Unrealized losses on below-investment-grade debt securities outside the closed block with a fair value depressed by more than 20% of amortized cost totaled $120.3 million at December 31, 2011, of which $93.5 million was depressed by more than 20% of amortized cost for more than 12 months.
Unrealized losses on below-investment-grade debt securities held in the closed block with a fair value depressed by more than 20% of amortized cost totaled $39.9 million at December 31, 2011, of which $17.3 million was depressed by more than 20% of amortized cost for more than 12 months.
As of December 31, 2011, available-for-sale securities in an unrealized loss position for over 12 months consisted of 302 debt securities and two equity securities. The debt securities primarily relate to municipal securities, asset backed securities, and corporate securities, which have depressed values due primarily to an increase in interest rates since the purchase of these securities. Unrealized losses were not recognized in earnings on these fixed maturity securities since the Company neither intends to sell the securities nor do we believe that it is more likely than not that it will be required to sell these securities before recovery of their amortized cost basis. Additionally, based on a security-by-security analysis, we expect to recover the entire amortized cost basis of these securities. In our evaluation of each security, management considers the actual recovery periods for these securities in previous periods of broad market declines. For securities with significant declines, individual security level analysis is performed, which considers any credit enhancements, expectations of defaults on underlying collateral and other available market data, including industry analyst reports and forecasts. Similarly, for equity securities in an unrealized loss position for more than 12 months, management performs an analysis on a security by security basis. Although there may be sustained losses for the prior four quarters on these securities, additional information is obtained related to company performance in the fourth quarter of 2011 which would not indicate that the losses are other-than-temporary.
F-65
9.
Investing Activities (continued)
Evaluating temporarily impaired available-for-sale securities
In management’s evaluation of temporarily impaired securities, many factors about individual issuers of securities as well as our best judgment in determining the cause of a decline in the estimated fair value are considered in the assessment of potential near-term recovery in the security’s value. Some of those considerations include, but are not limited to: (i) duration of time and extent to which the estimated fair value has been below cost or amortized cost; (ii) for fixed maturity securities, if the Company has the intent to sell or will more likely than not be required to sell a particular security before the decline in estimated fair value below amortized cost recovers; (iii) whether the issuer is experiencing significant financial difficulties and the potential for impairments of that issuer’s securities; (iv) pervasive issues across an entire industry sector/sub-sector; and (v) for structured securities, assessing any changes in the forecasted cash flows, the quality of underlying collateral, expectations of prepayment speeds, loss severity and payment priority of tranches held.
Other-than-temporary impairments
Management assessed all securities in an unrealized loss position in determining whether impairments were temporary or other-than-temporary. In reaching its conclusions, management exercised significant judgment and used a number of issuer-specific quantitative indicators and qualitative judgments to assess the probability of receiving a given security’s contractual cash flows. This included the issue’s implied yield to maturity, cumulative default rate based on rating, comparisons of issue-specific spreads to industry or sector spreads, specific trading activity in the issue and other market data such as recent debt tenders and upcoming refinancing requirements. Management also reviewed fundamentals such as issuer credit and liquidity metrics, business outlook and industry conditions. Management maintains a watch list of securities that is reviewed for impairments. Each security on the watch list was evaluated, analyzed and discussed, with the positive and negative factors weighed in the ultimate determination of whether or not the security was other-than-temporarily impaired. For securities for which no OTTI was ultimately indicated at December 31, 2012, management does not have the intention to sell, nor does it expect to be required to sell, these securities prior to their recovery.
Fixed income OTTIs recorded in 2012 were primarily concentrated in structured securities. These impairments were driven primarily by increased collateral default rates. In our judgment, these credit events and other adverse conditions of the collateral have caused, or will most likely lead to, a deficiency in the contractual cash flows related to the investment. Therefore, based upon these credit events, we have determined that OTTIs exist. Total debt impairments recognized through earnings related to such credit-related circumstances were $22.8 million in 2012, $26.0 million in 2011 and $48.3 million in 2010. There were equity security OTTIs of $5.7 million in 2012, $0.8 in 2011 and $0.2 million in 2010. There were limited partnerships and other investment OTTIs of $0.3 million in 2012, $0.0 in 2011 and $0.1 million in 2010.
In addition to these credit-related impairments recognized through earnings, we impaired securities to fair value through other comprehensive loss for any impairments related to non-credit related factors. These types of impairments were driven primarily by market or sector credit spread widening or by a lack of liquidity in the securities. The amount of impairments recognized as an adjustment to other comprehensive loss due to these factors was $22.9 million in 2012, $38.5 million in 2011 and $58.7 million in 2010.
F-66
9.
Investing Activities (continued)
The following table presents a roll-forward of pre-tax credit losses recognized in earnings related to debt securities for which a portion of the OTTI was recognized in OCI.
| | | | | | | | |
Credit Losses Recognized in Earnings on Debt Securities for | As of December 31, |
which a Portion of the OTTI Loss was Recognized in OCI: | 2012 | | 2011 | | 2010 |
($ in millions) | | | As restated | | As restated |
| | | and amended | | and amended |
| | | | | | | | |
Balance, beginning of period | $ | (79.1) | | $ | (65.8) | | $ | (50.6) |
Add: Credit losses on securities not previously impaired (1) | | (6.7) | | | (11.8) | | | (14.9) |
Add: Credit losses on securities previously impaired (1) | | (13.3) | | | (8.6) | | | (22.4) |
Less: Credit losses on securities impaired due to intent to sell | | — | | | — | | | — |
Less: Credit losses on securities sold | | 26.5 | | | 7.1 | | | 11.4 |
Less: Credit losses upon adoption of new accounting guidance (2) | | — | | | — | | | 10.7 |
Less: Increases in cash flows expected on previously impaired securities | | — | | | — | | | — |
Balance, end of period | $ | (72.6) | | $ | (79.1) | | $ | (65.8) |
———————
(1)
Additional credit losses on securities for which a portion of the OTTI loss was recognized in AOCI are included within net OTTI losses recognized in earnings on the statements of comprehensive income.
(2)
Adjustment relates to the impact of adoption in 2010 of Accounting Standards Update 2010-11, Derivatives and Hedging (Topic 815), Scope Exception Related to Embedded Credit Derivatives.
Limited partnerships and other investments
| | | | | |
Limited Partnerships and Other Investments: | As of December 31, |
($ in millions) | 2012 | | 2011 |
| | | As restated |
| | | and amended |
Limited partnerships | | | | | |
Private equity funds | $ | 241.7 | | $ | 233.0 |
Mezzanine funds | | 202.1 | | | 191.9 |
Infrastructure funds | | 42.5 | | | 35.4 |
Hedge funds | | 14.3 | | | 14.9 |
Mortgage and real estate funds | | 5.4 | | | 12.4 |
Leveraged leases | | 17.9 | | | 24.1 |
Direct equity investments | | 29.2 | | | 28.5 |
Life settlements | | 21.0 | | | 21.1 |
Other alternative assets | | 3.2 | | | 4.0 |
Limited partnerships and other investments | $ | 577.3 | | $ | 565.3 |
| | | | | |
Amounts applicable to the closed block | $ | 353.1 | | $ | 338.0 |
Equity method investees
The Company uses equity method accounting when it has more than a minor interest or influence of the partnership’s or limited liability company’s (“LLCs”) operations but does not have a controlling interest. Equity method income is recognized as earned by the investee. Management views the information reported from the underlying funds as the best information available to record its investments. Further, management is in direct communication with the fund managers to ensure accuracy of ending capital balances.
F-67
9.
Investing Activities (continued)
The following tables present the aggregated summarized financial information of certain equity method investees in limited partnerships and LLCs. For all three periods, the equity in earnings that we record through net investment income of these equity method investees in aggregate exceeds 10% of PNX income from continuing operations before income taxes.
| | | | | |
Aggregated Summarized Balance Sheet Information of Equity Method Investees: | As of December 31, |
($ in millions) | 2012 | | 2011 |
| | | As restated |
| | | and amended |
| | | | | |
Total assets | $ | 60,921.3 | | $ | 59,960.0 |
| | | | | |
Total liabilities | $ | 2,298.4 | | $ | 2,581.0 |
| | | | | | | | |
Aggregated Net Investment Income: | Years Ended December 31, |
($ in millions) | 2012 | | 2011 | | 2010 |
| | | As restated | | As restated |
| | | and amended | | and amended |
| | | | | | | | |
Total investment revenues | $ | 2,389.6 | | $ | 3,093.6 | | $ | 3,083.7 |
Net income | $ | 8,315.2 | | $ | 5,489.5 | | $ | 8,375.4 |
Summarized financial information for these equity method investees is reported on a three-month delay due to the timing of financial statements as of the current reporting period.
Leveraged leases
The Company records its investment in a leveraged lease net of the nonrecourse debt. The Company recognizes income on the leveraged leases by applying the estimated rate of return to the net investment in the lease. The Company regularly reviews the estimated residual values and impairs them to expected values.
Investment in leveraged leases, included in limited partnerships and other investments, consisted of the following:
| | | | | |
Investment in Leveraged Leases: | 2012 | | 2011 |
($ in millions) | | | As restated |
| | | and amended |
| | | | | |
Rental receivables, net | $ | 11.4 | | $ | 13.5 |
Estimated residual values | | 7.3 | | | 12.8 |
Unearned income | | (0.8) | | | (2.2) |
Investment in leveraged leases | $ | 17.9 | | $ | 24.1 |
Rental receivables are generally due in periodic installments. The payments are made semi-annually and range from three to five years. For rental receivables, the primary credit quality indicator is whether the rental receivable is performing or non-performing, which is assessed at least annually. The Company defines non-performing rental receivables as those that are 90 days or more past due. At December 31, 2012 and 2011, all rental receivables were performing. The deferred income tax liability related to leveraged leases was $11.6 million and $16.3 million at December 31, 2012 and 2011, respectively. The components of income from investment in leveraged leases, excluding net investment gains (losses) were as follows:
F-68
9.
Investing Activities (continued)
| | | | | | | | |
Investment Income after Income Tax from | As of December 31, |
Investment in Leveraged Leases: | 2012 | | 2011 | | 2010 |
($ in millions) | | | As restated | | As restated |
| | | and amended | | and amended |
| | | | | | | | |
Income from investment in leveraged leases | $ | 0.2 | | $ | 0.2 | | $ | 0.3 |
Less: Income tax expense on leveraged leases | | (0.1) | | | (0.1) | | | (0.1) |
Investment income after income tax from investment in leveraged leases | $ | 0.1 | | $ | 0.1 | | $ | 0.2 |
Direct equity investments
Direct equity investments are equity interests in LLCs entered into on a co-investment basis with sponsors of private equity funds for strategic and capital appreciation purposes and are accounted for under the equity method. The Company records its share of earnings on a three-month delay when timely financial information is not available and the delivery of investee’s financial reporting occurs after the end of the current reporting period. Further, management has open communication with each fund manager and, to the extent financial information is available, receives quarterly statements from the underlying funds. Management also performed an analysis on the funds’ financial statements to assess reasonableness of information provided by third parties. Income received from our other direct equity investments was $(0.2) million, $(0.3) million and $4.7 million for the years ended December 31, 2012, 2011 and 2010, respectively.
In some situations for these direct equity investments, we hold both the power to direct the most significant activities of the entity and an economic interest in the entity. For those which were determined to be VIEs, we are considered to be the primary beneficiary of the entity and consolidate the VIE. The undistributed earnings of direct equity investments not consolidated were $(3.1) million, $(0.1) million and $4.6 million at December 31, 2012, 2011 and 2010, respectively. Any future investment in these structures is discretionary.
The following table presents the carrying value and change in investment balance of non-consolidated direct equity investments:
| | |
Carrying Value and Change in Investment Balance of | |
Non-Consolidated Direct Equity Investments: | |
($ in millions) | |
| | |
Year ended December 31, 2010 | $ | 18.4 |
Net contributions (distributions) | | 9.8 |
Net income (loss) | | 0.3 |
Year ended December 31, 2011 | | 28.5 |
Net contributions (distributions) | | 0.8 |
Net income (loss) | | (0.1) |
Year ended December 31, 2012 | $ | 29.2 |
Life settlements
During 2012, 2011 and 2010, income (losses) recognized on life settlement contracts was $0.9 million, $0.0 and $0.2 million, respectively, and is included in net investment income in the consolidated statements of comprehensive income. Our life settlement contracts reported above are monitored for impairment on a contract-by-contract basis quarterly. An investment in a life settlement contract is considered impaired if the undiscounted cash flows from the expected proceeds from the insurance policy are less than the carrying amount of the investment plus the expected costs to keep the policy in force. If an impairment loss is recognized, the investment is written down to fair value. Anticipated policy cash flows are based on the Company’s current mortality assumption including the relative impairment of individual insured at the time the policy was purchased. Impairment charges on life settlement contracts included in net realized capital gains (losses) totaled $0.3 million in 2012 with no previous impairments recorded.
F-69
9.
Investing Activities (continued)
| | | | | | | | |
Remaining Life Expectancy of Insured: | | | | | Face Value |
($ in millions) | Number of | | Carrying | | (Death |
| Contracts | | Value | | Benefits) |
| | | | | | | | |
0-4 years | — | | | $ | — | | $ | — |
4-5 years | 6 | | | | 12.6 | | | 23.0 |
Thereafter | 8 | | | | 8.4 | | | 37.1 |
Total | 14 | | | $ | 21.0 | | $ | 60.1 |
At December 31, 2012, the anticipated life insurance premiums required to keep the life settlement contracts in force, payable in the next 12 months ending December 31, 2013 and the four succeeding years ending December 31, 2017 are $1.2 million, $1.0 million, $0.7 million, $0.7 million and $0.8 million, respectively.
Statutory deposits
Pursuant to certain statutory requirements, as of December 31, 2012 and 2011, our Life Companies had on deposit securities with a fair value of $33.0 million and $50.5 million, respectively, in insurance department special deposit accounts. Our Life Companies are not permitted to remove the securities from these accounts without approval of the regulatory authority.
Net investment income
Net investment income is comprised primarily of interest income, including amortization of premiums and accretion of discounts on structured securities, based on yields which are changed due to expectations in projected principal and interest cash flows, dividend income from common and preferred stock, gains and losses on securities measured at fair value and earnings from investments accounted for under the equity method of accounting.
| | | | | | | | |
Sources of Net Investment Income: | Years Ended December 31, |
($ in millions) | 2012 | | 2011 | | 2010 |
| | | As restated | | As restated |
| | | and amended | | and amended |
| | | | | | | | |
Debt securities | $ | 606.6 | | $ | 607.9 | | $ | 597.9 |
Equity securities | | 3.0 | | | 1.1 | | | 2.4 |
Limited partnerships and other investments | | 64.7 | | | 48.9 | | | 69.2 |
Policy loans | | 161.5 | | | 171.8 | | | 171.7 |
Fair value investments | | 9.4 | | | 3.5 | | | 12.5 |
Total investment income | | 845.2 | | | 833.2 | | | 853.7 |
Less: Discontinued operations | | 2.1 | | | 2.1 | | | 5.0 |
Less: Investment expenses | | 13.8 | | | 8.2 | | | 8.2 |
Net investment income | $ | 829.3 | | $ | 822.9 | | $ | 840.5 |
| | | | | | | | |
Amounts applicable to closed block | $ | 452.9 | | $ | 465.5 | | $ | 494.3 |
F-70
9.
Investing Activities (continued)
Net realized investment gains (losses)
| | | | | | | | |
Sources and Types of Net Realized Investment Gains (Losses): | Years Ended December 31, |
($ in millions) | 2012 | | 2011 | | 2010 |
| | | As restated | | As restated |
| | | and amended | | and amended |
| | | | | | | | |
Total other-than-temporary debt impairments | $ | (45.7) | | $ | (64.5) | | $ | (107.0) |
Portion of loss recognized in OCI | | 22.9 | | | 38.5 | | | 58.7 |
Net debt impairments recognized in earnings | $ | (22.8) | | $ | (26.0) | | $ | (48.3) |
| | | | | | | | |
Debt security impairments: | | | | | | | | |
U.S. government and agency | $ | — | | $ | — | | $ | — |
State and political subdivision | | (0.6) | | | — | | | — |
Foreign government | | — | | | — | | | — |
Corporate | | (3.0) | | | (9.0) | | | (7.3) |
CMBS | | (4.1) | | | (3.6) | | | (6.6) |
RMBS | | (10.3) | | | (10.1) | | | (15.9) |
CDO/CLO | | (3.8) | | | (2.1) | | | (15.0) |
Other asset-backed | | (1.0) | | | (1.2) | | | (3.5) |
Net debt security impairments | | (22.8) | | | (26.0) | | | (48.3) |
Equity security impairments | | (5.7) | | | (0.8) | | | (0.2) |
Limited partnerships and other investment impairments | | (0.3) | | | — | | | (0.1) |
Impairment losses | | (28.8) | | | (26.8) | | | (48.6) |
Debt security transaction gains | | 52.3 | | | 13.6 | | | 57.9 |
Debt security transaction losses | | (11.1) | | | (6.0) | | | (16.0) |
Equity security transaction gains | | 8.5 | | | 3.8 | | | — |
Equity security transaction losses | | (0.4) | | | (0.1) | | | — |
Limited partnerships and other investment gains | | 7.7 | | | 4.8 | | | 13.8 |
Limited partnerships and other investment losses | | (2.5) | | | (4.8) | | | (6.9) |
Sale of Goodwin | | — | | | 4.0 | | | — |
Net transaction gains | | 54.5 | | | 15.3 | | | 48.8 |
Derivative instruments | | (50.4) | | | 14.4 | | | (26.6) |
Embedded derivatives(1) | | 12.1 | | | (34.4) | | | 12.3 |
Assets valued at fair value | | 2.1 | | | (0.6) | | | 2.9 |
Net realized investment gains (losses), excluding impairment losses | | 18.3 | | | (5.3) | | | 37.4 |
Net realized investment gains (losses), including impairment losses | $ | (10.5) | | $ | (32.1) | | $ | (11.2) |
———————
(1)
Includes the change in fair value of embedded derivatives associated with variable annuity GMWB, GMAB and COMBO riders. See Note 12 to these financial statements for additional disclosures.
F-71
9.
Investing Activities (continued)
Unrealized investment gains (losses)
| | | | | | | | |
Sources of Changes in Net Unrealized Investment Gains: | Years Ended December 31, |
($ in millions) | 2012 | | 2011 | | 2010(1) |
| | | As restated | | As restated |
| | | and amended | | and amended |
| | | | | | | | |
Debt securities | $ | 408.0 | | $ | 281.1 | | $ | 590.0 |
Equity securities | | 4.2 | | | (7.4) | | | 6.4 |
Other investments | | (0.2) | | | (0.2) | | | 0.5 |
Net unrealized investment gains | $ | 412.0 | | $ | 273.5 | | $ | 596.9 |
| | | | | | | | |
Net unrealized investment gains | $ | 412.0 | | $ | 273.5 | | $ | 596.9 |
Applicable closed block policyholder dividend obligation | | 168.0 | | | 158.6 | | | 287.2 |
Applicable deferred policy acquisition cost | | 75.1 | | | 52.8 | | | 136.2 |
Applicable other actuarial offsets | | 75.2 | | | 37.2 | | | 24.3 |
Applicable deferred income tax expense (benefit) | | 90.9 | | | 0.3 | | | 87.0 |
Offsets to net unrealized investment gains | | 409.2 | | | 248.9 | | | 534.7 |
Net unrealized investment gains included in OCI | $ | 2.8 | | $ | 24.6 | | $ | 62.2 |
———————
(1)
Balances for 2010 include the impact of adoption in 2010 of Accounting Standards Update 2010-11,Derivatives and Hedging (Topic 815), Scope Exception Related to Embedded Credit Derivatives.
Consolidated variable interest entities
Effective January 1, 2010, the Company adopted guidance related to consolidation of VIEs. The revised consolidation guidance amended the definition as well as the method of determining whether an entity is the primary beneficiary of a VIE to a qualitative model. Under the new model, an entity that has both the ability to direct the significant activities of the VIE and the obligation to receive the benefits or absorb the losses that is significant to the VIE is considered the primary beneficiary. This update requires ongoing assessment and enhanced disclosures including the effect of the Company’s involvement with VIEs on its financial statements.
The Company regularly invests in private equity type fund structures which are VIEs. Entities which do not have sufficient equity at risk to allow the entity to finance its activities without additional financial support or in which the equity investors, as a group, do not have the characteristic of a controlling financial interest are referred to as VIEs. We hold investments in certain entities that are VIEs. In some situations, we hold both the power to direct the most significant activities of the entity and an economic interest in the entity. We perform ongoing assessments of our investments in VIEs to determine whether we have the power to direct the activities in the VIE and, therefore, would be considered to be the primary beneficiary of the entity. An entity would be considered a primary beneficiary and be required to consolidate a VIE when the entity has both the power to direct the activities of a VIE that most significantly impact the entity’s economic performance and the obligation to absorb losses, or right to receive benefits, that could potentially be significant to the VIE. As such, we are considered to be the primary beneficiary of the entity and consolidate the VIE. The consolidated entities are all investment company-like structures which follow specialized investment company accounting and record underlying investments at fair value. The nature of the VIEs’ operations and purpose are private equity limited partnerships, single asset LLCs and a fund of fund investment structure and have investments in homogenous types of assets presented below.
F-72
9.
Investing Activities (continued)
The following table presents the total assets and total liabilities relating to consolidated VIEs at December 31, 2012 and 2011.
| | | | | | | | | | | | | | | | | | |
Carrying Value of Assets and Liabilities for | December 31, 2012 | | December 31, 2011 |
Consolidated Variable Interest Entities: | | | As restated and amended |
($ in millions) | Assets | | Liabilities | | Maximum Exposure to Loss(1) | | Assets | | Liabilities | | Maximum Exposure to Loss(1) |
|
|
| | | | | | | | | | | | | | | | | |
Debt securities, at fair value(2) | $ | 3.6 | | $ | — | | $ | 3.4 | | $ | 0.3 | | $ | — | | $ | 0.2 |
Equity securities, at fair value(2) | | 23.4 | | | — | | | 19.2 | | | 27.8 | | | — | | | 26.5 |
Cash and cash equivalents | | 10.2 | | | — | | | 10.2 | | | 3.5 | | | — | | | 3.3 |
Investment in partnership interests(2) | | 11.0 | | | — | | | 11.0 | | | 14.6 | | | — | | | 14.6 |
Investment in single asset LLCs(2) | | 6.8 | | | — | | | 5.4 | | | 1.7 | | | — | | | 1.0 |
Other assets | | 5.5 | | | | | | 5.5 | | | 0.1 | | | | | | — |
Total assets of consolidated VIEs | $ | 60.5 | | $ | — | | $ | 54.7 | | $ | 48.0 | | $ | — | | $ | 45.6 |
Total liabilities of consolidated VIEs | $ | — | | $ | 5.1 | | $ | 5.1 | | $ | — | | $ | 0.1 | | $ | 0.1 |
———————
(1)
Creditors or beneficial interest holders of the consolidated VIEs have no recourse to our general credit. Our obligation to the VIEs is limited to the amount of our committed investment. We have not provided material financial or other support that was not contractually required to these VIEs. The maximum exposure to loss above for December 31, 2012 and 2011 excludes unfunded commitments of $4.1 million and $3.6 million, respectively.
(2)
Included in fair value investments on the consolidated balance sheets.
Non-consolidated variable interest entities
We hold limited partnership interests with various VIEs primarily as a passive investor in private equity limited partnerships and through direct investments, in which the general partners are not related parties. As the Company is not the general partner in any VIE structures, consolidation is based on evaluation of the primary beneficiary. This analysis includes a review of the VIE’s capital structure, nature of the VIE’s operations and purpose and the Company’s involvement with the entity. When determining the need to consolidate a VIE, the design of the VIE is evaluated as well as any exposed risks of the Company’s investment. As we do not have both: (i) the power to direct the activities of the VIE that most significantly impact the economic performance of the entity; and (ii) the obligation to absorb losses of the entity that could be potentially significant to the VIE or the right to receive benefits from the entity that could be potentially significant, we do not consolidate these VIEs. These investments are accounted for under the equity method of accounting and are included in limited partnerships and other investments on our consolidated balance sheets. We reassess our VIE determination with respect to an entity on an ongoing basis. The following table presents the carrying value of assets and liabilities and the maximum exposure to loss relating to significant VIEs for which we are not the primary beneficiary.
The carrying value of our investments in non-consolidated VIEs (based upon sponsor values and financial statements of the individual entities) for which we are not the primary beneficiary was $139.7 million and $141.7 million as of December 31, 2012 and 2011, respectively. The maximum exposure to loss is equal to the carrying amounts plus any unfunded commitments of the Company. Such a maximum loss would be expected to occur only upon bankruptcy of the issuer or investee. The Company has not provided nor intends to provide financial support to these entities unless contractually required. We do not have the contractual option to redeem these limited partnership interests but receive distributions based on the liquidation of the underlying assets. The Company must generally request general partner consent to transfer or sell its fund interests. The Company performs ongoing qualitative analyses of its involvement with VIEs to determine if consolidation is required.
F-73
9.
Investing Activities (continued)
| | | | | | | | | | | | | | | | | | |
Carrying Value of Assets and Liabilities | December 31, 2012 | | December 31, 2011 |
and Maximum Exposure Loss Relating | | | As restated and amended |
to Variable Interest Entities: | Assets | | Liabilities | | Maximum Exposure to Loss(1) | | Assets | | Liabilities | | Maximum Exposure to Loss(1) |
($ in millions) |
|
| | | | | | | | | | | | | | | | | |
Limited partnerships | $ | 136.5 | | $ | — | | $ | 202.1 | | $ | 133.2 | | $ | — | | $ | 201.6 |
LLCs | | 3.2 | | | — | | | 3.2 | | | 8.5 | | | — | | | 8.5 |
Total | $ | 139.7 | | $ | — | | $ | 205.3 | | $ | 141.7 | | $ | — | | $ | 210.1 |
———————
(1)
Creditors or beneficial interest holders of the VIEs have no recourse to our general credit. Our obligation to the VIEs is limited to the amount of our committed investment. We have not provided material financial or other support that was not contractually required to these VIEs.
Issuer and counterparty credit exposure
Credit exposure related to issuers and derivatives counterparties is inherent in investments and derivative contracts with positive fair value or asset balances. We manage credit risk through the analysis of the underlying obligors, issuers and transaction structures. We review our debt security portfolio regularly to monitor the performance of obligors and assess the stability of their credit ratings. We also manage credit risk through industry and issuer diversification and asset allocation. Maximum exposure to an issuer or derivative counterparty is defined by quality ratings, with higher quality issuers having larger exposure limits. As of December 31, 2012, we were exposed to the credit concentration risk of one single issuer, Deutsche Bank AG, representing 11.1% of stockholders’ equity other than U.S. government and government agencies backed by the faith and credit of the U.S. government. We monitor credit exposures by actively monitoring dollar limits on transactions with specific counterparties. We have an overall limit on below-investment-grade rated issuer exposure. Additionally, the creditworthiness of counterparties is reviewed periodically. We generally use ISDA Master Agreements which include Credit Support Annexes which include collateral provisions to reduce counterparty credit exposures. Included in fixed maturities are below-investment-grade assets totaling $1,039.6 million and $949.6 million at December 31, 2012 and 2011, respectively. To further mitigate the risk of loss on derivatives, we only enter into contracts in which the counterparty is a financial institution with a rating of A or higher from at least one Nationally Recognized Statistical Rating Organization.
As of December 31, 2012, we held derivative assets, net of liabilities, with a fair value of $108.9 million. Derivative credit exposure was diversified with eleven different counterparties. We also had debt securities of these issuers with a fair value of $203.1 million as of December 31, 2012. Our maximum amount of loss due to credit risk with these issuers was $312.0 million as of December 31, 2012. See Note 13 to these financial statements for more information regarding derivatives.
10.
Financing Activities
Indebtedness
| | | | | |
Indebtedness at Carrying Value: | As of December 31, |
($ in millions) | 2012 | | 2011 |
| | | | | |
7.15% surplus notes | $ | 126.1 | | $ | 174.2 |
7.45% senior unsecured bonds | | 252.7 | | | 252.7 |
Total indebtedness | $ | 378.8 | | $ | 426.9 |
Our 7.15% surplus notes are an obligation of Phoenix Life and are due December 15, 2034. The carrying value of the 2034 notes is net of $0.6 million of unamortized original issue discount. Interest payments are at an annual rate of 7.15%, require the prior approval of the NYDFS and may be made only out of surplus funds which the NYDFS determines to be available for such payments under New York Insurance Law. The notes may be redeemed at the option of Phoenix Life at any time at the “make-whole” redemption price set forth in the offering circular. New York Insurance Law provides that the notes are not part of the legal liabilities of Phoenix Life. On September 21, 2012, Phoenix Life repurchased $48.3 million par amount of its outstanding 7.15% surplus notes, including $0.2 million in original issue discount, for aggregate consideration of $36.2 million.
F-74
10.
Financing Activities (continued)
The Phoenix Companies, Inc. senior unsecured bonds were issued in December 2001 for gross proceeds of $300.0 million (net proceeds of $290.6 million) and mature in January 2032. We pay interest at an annual rate of 7.45%. We may redeem any or all of the bonds at a redemption price equal to 100% of principal plus accrued and unpaid interest to the redemption date. We have repurchased a cumulative amount of $47.3 million of par value of these bonds as of December 31, 2012. During 2012, no repurchases were made. During 2011, we repurchased $0.8 million of par value of these bonds for $0.6 million, resulting in a gain of $0.2 million.
The indenture governing our senior unsecured bonds requires us to file with U.S. Bank, National Association, as trustee, within 15 days after we are required to file with the SEC, copies of the annual reports and of the information, documents and other reports that we are required to file with the SEC pursuant to Section 13 or Section 15(d) of the Exchange Act. In connection with our previously announced restatement of financial statements for the years ended December 31, 2011, 2010 and 2009, the quarters of fiscal year 2011, the first and second quarters of 2012 and the delay in filing our Third Quarter 2012 Form 10-Q, we were unable to file our Third Quarter 2012 Form 10-Q with the SEC and meet the requirement to timely deliver a copy of such report to the trustee. This resulted in a default under the indenture governing the bonds. On November 30, 2012, the trustee issued a notice of default, which stated that the failure of the Company to deliver the Third Quarter 2012 Form 10-Q constituted non-compliance with the reporting covenant in the indenture and that delivery of such notice initiated a 60-day cure period.
On December 12, 2012, we commenced a solicitation of bondholders holding our outstanding bonds as of 5:00 p.m., New York City time on December 11, 2012, seeking a one-time consent to amend the indenture governing the bonds and provide a related waiver. The consent solicitation sought the approval of the amendments and a related waiver from holders representing a majority of the aggregate outstanding principal amount of the bonds, allowing us to extend the date to deliver our Third Quarter 2012 Form 10-Q to the trustee to March 31, 2013 and would waive any and all defaults and events of default related to the delayed filing of our Third Quarter 2012 Form 10-Q that occurred prior to the effectiveness of the amendments. On January 16, 2013, we announced that holders of approximately $166.3 million in aggregate principal amount of the bonds, representing approximately 65% of the approximately $252.7 million in outstanding principal amount of the bonds as of the December 11, 2012 record date, consented to the amendments to the indenture and the related waiver.
See Note 28 to these financial statements for additional information regarding solicitation of bondholders subsequent to year end December 31, 2012.
We have recorded indebtedness at unpaid principal balances of each instrument net of issue discount. The Company or its subsidiaries may, from time to time, purchase its debt securities in the open market subject to considerations including, but not limited to, market conditions, relative valuations, capital allocation and the determination that it is in the best interest of the Company and its stakeholders.
Future minimum annual principal payments on indebtedness as of December 31, 2012 are $252.7 million in 2032 and $126.7 million in 2034. There are no debt maturities in 2013 through 2018.
| | | | | | | | |
Interest Expense on Indebtedness, including Amortization of Debt Issuance Costs: | Years Ended December 31, |
($ in millions) | 2012 | | 2011 | | 2010 |
| | | | | | | | |
Surplus notes | $ | 11.6 | | $ | 12.5 | | $ | 12.5 |
Senior unsecured bonds | | 19.2 | | | 19.3 | | | 19.3 |
Interest expense on indebtedness | $ | 30.8 | | $ | 31.8 | | $ | 31.8 |
11.
Common Stock and Stock Repurchase Program
We have authorization for the issuance of 50 million shares of our common stock. The Company effected a 1-for-20 reverse stock split of its common stock following market close on August 10, 2012 which resulted in a decrease in the common stock balance with a corresponding increase in the additional paid in capital balance. As part of the reverse stock split, the par value remained at $0.01 per share. No fractional shares were issuable in connection with the reverse stock split. Instead, shareholders were entitled to receive cash in lieu of fractional shares, based on the closing price of the Company’s common stock on August 10, 2012. As a result of the reverse stock split, an aggregate of $2.9 million was payable to shareholders for such fractional shares.
F-75
11.
Common Stock and Stock Repurchase Program (continued)
Following the reverse stock split, the Company offered an odd lot program that provided post-reverse stock split shareholders who held fewer than 100 shares with a voluntary limited time means to sell their shares, purchase enough additional shares to increase their holding to a round lot of 100 shares or make a charitable donation of their shares. The odd lot program terminated as of October 26, 2012.
On September 20, 2012, the Board of Directors (the “Board”) of the Company authorized a program to repurchase up to an aggregate amount of $25,000,000 (not including fees and expenses) of the Company’s outstanding common stock shares. Under the stock repurchase program, purchases may be made from time to time in the open market, in accelerated stock buyback arrangements, in privately negotiated transactions or otherwise, subject to market prices and other conditions. No time limit was placed on the duration of the program, which may be modified, extended or terminated by the Board at any time. The Board also terminated, effective September 20, 2012, the Company’s existing stock repurchase program, which was announced on August 5, 2002. There were no repurchases in 2012.
Through December 31, 2012, we have issued 6.4 million common shares (2.8 million shares to our policyholders in exchange for their interests in the mutual company and 3.6 million shares in sales to the public and to settle share-based compensation awards). As of December 31, 2012, we had 5.7 million shares outstanding, net of 0.7 million common shares of treasury stock. Shares issued and outstanding include 0.1 million shares held in a Rabbi Trust to fund equity awards on which recipients are allowed to vote their shares. As of December 31, 2012, we also had 0.5 million common shares reserved for issuance under our stock option plans (0.3 million shares) and our restricted stock unit (“RSU”) plans (0.2 million shares). Please note that these share and RSU amounts for all periods reflect the 1-for-20 reverse stock split, which became effective on August 10, 2012.
In 2012, 2011 and 2010, we did not pay any stockholder dividends.
State Farm Mutual Automobile Insurance Company (“State Farm”) currently owns of record 5.2% of our outstanding common stock. In 2012, 2011 and 2010, we incurred $2.3 million, $2.4 million and $4.4 million, respectively, as compensation costs for the sale of our insurance and annuity products by entities that were either subsidiaries of State Farm or owned by State Farm agents.
12.
Separate Accounts, Death Benefits and Other Insurance Benefit Features and Embedded Product Derivatives
Separate accounts
Separate account products are those for which a separate investment and liability account is maintained on behalf of the policyholder. Investment objectives for these separate accounts vary by fund account type, as outlined in the applicable fund prospectus or separate account plan of operations. Our separate account products include variable annuities and variable life insurance contracts. The assets supporting these contracts are carried at fair value and are reported as separate account assets with an equivalent amount reported as separate account liabilities. Amounts assessed against the policyholder for mortality, administration and other services are included within revenue in fee income. In 2012 and 2011, there were no gains or losses on transfers of assets from the general account to a separate account.
Assets with fair value and carrying value of $1.8 billion supporting fixed indexed annuities are maintained in accounts that are legally segregated from the other assets of the company, but policyholders do not direct the investment of those assets and the investment performance does not pass through to the policyholders. These assets supporting fixed indexed annuity contracts are reported within the respective investment line items on the consolidated balance sheets.
On May 21, 2012, the employee pension plan surrendered its variable annuity contract with PHLVIC. All assets held within the employee pension plan separate account were subsequently transferred to the direct control of the plan’s trustee. This resulted in a decrease in separate account assets and liabilities of $464.2 million during the year ended December 31, 2012.
F-76
12.
Separate Accounts, Death Benefits and Other Insurance Benefit Features and Embedded Product Derivatives
(continued)
| | | | | |
Separate Account Investments of Account Balances of Variable Annuity Contracts with Insurance Guarantees: | As of December 31, |
($ in millions) | 2012 | | 2011 |
| | | | | |
Debt securities | $ | 484.6 | | $ | 515.4 |
Equity funds | | 1,862.2 | | | 1,883.3 |
Other | | 69.6 | | | 81.7 |
Total | $ | 2,416.4 | | $ | 2,480.4 |
Death benefits and other insurance benefit features
Variable annuity guaranteed benefits
We establish policy benefit liabilities for minimum death and income benefit guarantees relating to certain annuity policies as follows:
·
Liabilities associated with the guaranteed minimum death benefit (“GMDB”) are determined by estimating the expected value of death benefits in excess of the projected account balance and recognizing the excess ratably over the expected life of the contract based on total expected assessments. The assumptions used for calculating the liabilities are consistent with those used for amortizing deferred policy acquisition costs.
·
Liabilities associated with the guaranteed minimum income benefit (“GMIB”) are determined by estimating the expected value of the income benefits in excess of the projected account balance at the date of annuitization and recognizing the excess ratably over the accumulation period based on total expected assessments. The assumptions used for calculating such guaranteed income benefit liabilities are generally consistent with those used for amortizing deferred policy acquisition costs.
For variable annuities with GMDB and GMIB, reserves for these guarantees are calculated and recorded in policy liabilities and accruals on our consolidated balance sheets. Changes in the liability are recorded in policy benefits, excluding policyholder dividends, on our consolidated statements of comprehensive income. We regularly evaluate estimates used and adjust the additional liability balances, with a related charge or credit to benefit expense if actual experience or other evidence suggests that earlier assumptions should be revised.
| | | | | |
Changes in Guaranteed Insurance Benefit Liability Balances: | Year Ended |
($ in millions) | December 31, 2012 |
| Annuity | | Annuity |
| GMDB | | GMIB |
| | | | | |
Liability balance as of January 1, 2012 | $ | 16.4 | | $ | 17.8 |
Incurred | | 0.6 | | | 4.0 |
Paid | | (1.1) | | | — |
Assumption unlocking | | — | | | (0.2) |
Liability balance as of December 31, 2012 | $ | 15.9 | | $ | 21.6 |
| | | | | |
Changes in Guaranteed Insurance Benefit Liability Balances: | Year Ended |
($ in millions) | December 31, 2011 |
| As restated and amended |
| Annuity | | Annuity |
| GMDB | | GMIB |
| | | | | |
Liability balance as of January 1, 2011 | $ | 17.7 | | $ | 18.1 |
Incurred | | 0.8 | | | (0.7) |
Paid | | (2.1) | | | — |
Assumption unlocking | | — | | | 0.4 |
Liability balance as of December 31, 2011 | $ | 16.4 | | $ | 17.8 |
F-77
12.
Separate Accounts, Death Benefits and Other Insurance Benefit Features and Embedded Product Derivatives
(continued)
| | | | | |
Changes in Guaranteed Insurance Benefit Liability Balances: | Year Ended |
($ in millions) | December 31, 2010 |
| As restated and amended |
| Annuity GMDB | | Annuity GMIB |
|
| | | | | |
Liability balance as of January 1, 2010 | $ | 19.1 | | $ | 16.3 |
Incurred | | 3.7 | | | 2.4 |
Paid | | (5.1) | | | — |
Assumption unlocking | | — | | | (0.6) |
Liability balance as of December 31, 2010 | $ | 17.7 | | $ | 18.1 |
For those guarantees of benefits that are payable in the event of death, the net amount at risk (“NAR”) is generally defined as the benefit payable in excess of the current account balance at our balance sheet date. We have entered into reinsurance agreements to reduce the net amount of risk on certain death benefits. Following are the major types of death benefits currently in force:
| | | | | | | | |
GMDB and GMIB Benefits by Type: | Account
Value | | NAR
After
Reinsurance | | Average
Attained Age
of Annuitant |
($ in millions) |
|
2012 | | | | | | | | |
GMDB return of premium | $ | 799.2 | | $ | 6.4 | | | 62 |
GMDB step up | | 1,957.2 | | | 25.6 | | | 63 |
GMDB earnings enhancement benefit (“EEB”) | | 37.5 | | | 0.1 | | | 63 |
GMDB greater of annual step up and roll up | | 26.7 | | | 7.4 | | | 67 |
Total GMDB at December 31, 2012 | | 2,820.6 | | $ | 39.5 | | | |
Less: General account value with GMDB | | 420.6 | | | | | | |
Subtotal separate account liabilities with GMDB | | 2,400.0 | | | | | | |
Separate account liabilities without GMDB | | 916.5 | | | | | | |
Total separate account liabilities | $ | 3,316.5 | | | | | | |
GMIB (1) at December 31, 2012 | $ | 416.8 | | | | | | 64 |
| | | | | | | | |
2011 as restated and amended | | | | | | | | |
GMDB return of premium | $ | 839.6 | | $ | 22.5 | | | 61 |
GMDB step up | | 1,999.5 | | | 99.1 | | | 62 |
GMDB earnings enhancement benefit (“EEB”) | | 39.8 | | | 0.4 | | | 62 |
GMDB greater of annual step up and roll up | | 27.1 | | | 8.8 | | | 66 |
Total GMDB at December 31, 2011 | | 2,906.0 | | $ | 130.8 | | | |
Less: General account value with GMDB | | 444.1 | | | | | | |
Subtotal separate account liabilities with GMDB | | 2,461.9 | | | | | | |
Separate account liabilities without GMDB | | 1,355.0 | | | | | | |
Total separate account liabilities | $ | 3,816.9 | | | | | | |
GMIB (1) at December 31, 2011 | $ | 442.1 | | | | | | 63 |
———————
(1)
Policies with a GMIB also have a GMDB. The NAR for each benefit is shown in the table above, however these benefits are not additive. When a policy terminates due to death, any NAR related or GMIB is released. Similarly, when a policy goes into benefit status on a GMIB, its GMDB NAR is released.
Return of Premium: The death benefit is the greater of current account value or premiums paid (less any adjusted partial withdrawals).
Step Up: The death benefit is the greater of current account value, premiums paid (less any adjusted partial withdrawals) or the annual step up amount prior to the oldest original owner attaining a certain age. On and after the oldest original owner attains that age, the death benefit is the greater of current account value or the death benefit at the end of the contract year prior to the oldest original owner’s attaining that age plus premium payments (less any adjusted partial withdrawals) made since that date.
F-78
12.
Separate Accounts, Death Benefits and Other Insurance Benefit Features and Embedded Product Derivatives
(continued)
Earnings Enhancement Benefit: The death benefit is the greater of the premiums paid (less any adjusted partial withdrawals) or the current account value plus the EEB. The EEB is an additional amount designed to reduce the impact of taxes associated with distributing contract gains upon death.
Greater of Annual Step Up and Annual Roll Up: The death benefit is the greatest of premium payments (less any adjusted partial withdrawals), the annual step up amount, the annual roll up amount or the current account value prior to the oldest original owner attaining age 81. On and after the oldest original owner attained age 81, the death benefit is the greater of current account value or the death benefit at the end of the contract year prior to the oldest original owner’s attained age of 81 plus premium payments (less any adjusted partial withdrawals) made since that date.
GMIB: The benefit is a series of monthly fixed annuity payments paid upon election of the rider. The monthly benefit is based on the greater of the sum of premiums (less any adjusted partial withdrawals) accumulated at an effective annual rate on the exercise date or 200% of the premiums paid (less any adjusted partial withdrawals) and a set of annuity payment rates that vary by benefit type and election age.
Fixed indexed annuity guaranteed benefits
Many of our fixed indexed annuities contain guaranteed minimum withdrawal and death benefits.
Liabilities associated with the GMWB for the fixed indexed annuities differ from those contained on variable annuities in that the GMWB feature and the underlying contract, exclusive of the equity indexed crediting option, are fixed income instruments. These liabilities are determined by estimating the expected value of the withdrawal benefits in excess of the projected account balance at the date of election and recognizing the excess ratably over the accumulation period based on total expected assessments. The assumptions used for calculating such guaranteed withdrawal benefit liabilities are consistent with those used for amortizing deferred policy acquisition costs. Some of these riders also contain a GMDB or chronic care benefit in addition to the withdrawal benefits.
The GMWB, GMDB and chronic care guarantees are recorded in policy liabilities and accruals on our consolidated balance sheets. Changes in the liability are recorded in policy benefits, excluding policyholder dividends, on our consolidated statements of comprehensive income. We regularly evaluate estimates used and adjust the additional liability balances, with a related charge or credit to benefit expense if actual experience or other evidence suggests that earlier assumptions should be revised.
| | | | | | | | |
Changes in Guaranteed Liability Balances: | Fixed Indexed Annuity |
($ in millions) | GMWB & GMDB |
| Year Ended December 31, |
| 2012 | | 2011 | | 2010 |
| | | As restated and amended | | As restated and amended |
| | | |
| | | | | | | | |
Liability balance, beginning of period | $ | 5.6 | | $ | 0.5 | | $ | — |
Incurred | | 40.1 | | | 5.1 | | | 0.5 |
Paid | | — | | | — | | | — |
Liability balance, end of period | $ | 45.7 | | $ | 5.6 | | $ | 0.5 |
Universal life
Liabilities for universal life contracts, some of which contain secondary guarantees, are generally determined by estimating the expected value of benefits and expenses when claims are triggered and recognizing those benefits and expenses over the accumulation period based on total expected assessments. The assumptions used in estimating these liabilities are consistent with those used for amortizing deferred policy acquisition costs. The universal life block of business has experience which produces profits in earlier periods followed by losses in later periods for which a liability is required to be held in addition to the policy liabilities recorded. These additional liabilities as of December 31, 2012 and 2011 are $308.4 million and $200.5 million, respectively. Associated expenses recognized in earnings are $91.2 million, $89.0 million, and $35.1 million for the years ended December 31, 2012, 2011, and 2010, respectively.
F-79
12.
Separate Accounts, Death Benefits and Other Insurance Benefit Features and Embedded Product Derivatives
(continued)
| | | | | | | | |
Changes in Guaranteed Liability Balances: | Universal Life |
($ in millions) | Year Ended December 31, |
| 2012 | | 2011 | | 2010 |
| | | As restated and amended | | As restated and amended |
| | | |
| | | | | | | | |
Liability balance, beginning of period | $ | 115.9 | | $ | 104.5 | | $ | 77.4 |
Incurred | | 30.8 | | | 34.6 | | | 39.4 |
Paid | | (9.5) | | | (6.2) | | | (20.2) |
Assumption unlocking | | (4.5) | | | (17.0) | | | 7.9 |
Liability balance, end of period | $ | 132.7 | | $ | 115.9 | | $ | 104.5 |
Embedded derivatives
Variable annuity embedded derivatives
Certain separate account variable products contain a GMWB, GMAB and/or COMBO rider. These features are accounted for as embedded derivatives as described below.
| | | | |
Non-Insurance Guaranteed Product Features: | | | Average |
($ in millions) | | | Attained |
| Account | | Age of |
| Value | | Annuitant |
2012 | | | | |
GMWB | $ | 578.4 | | 63 |
GMAB | | 390.6 | | 58 |
COMBO | | 8.5 | | 62 |
Total at December 31, 2012 | $ | 977.5 | | |
| | | | |
2011 as amended and restated | | | | |
GMWB | $ | 572.5 | | 62 |
GMAB | | 385.6 | | 57 |
COMBO | | 10.1 | | 61 |
Total at December 31, 2011 | $ | 968.2 | | |
The GMWB rider guarantees the contract owner a minimum amount of withdrawals and benefit payments over time, regardless of the investment performance of the contract, subject to an annual limit. Optional resets are available. In addition, these contracts have a feature that allows the contract owner to receive the guaranteed annual withdrawal amount for as long as they are alive.
The GMAB rider provides the contract owner with a minimum accumulation of the contract owner’s purchase payments deposited within a specific time period, adjusted for withdrawals, after a specified amount of time determined at the time of issuance of the variable annuity contract.
The COMBO rider includes the GMAB and GMWB riders as well as the GMDB rider at the contract owner’s option.
The GMWB, GMAB and COMBO represent embedded derivative liabilities in the variable annuity contracts that are required to be reported separately from the host variable annuity contract. These liabilities are recorded at fair value within policyholder deposit funds on the consolidated balance sheets with changes in fair value recorded in realized investment gains on the consolidated statements of comprehensive income. The fair value of the GMWB, GMAB and COMBO obligation is calculated based on actuarial and capital market assumptions related to the projected cash flows, including benefits and related contract charges, over the lives of the contracts, incorporating expectations concerning policyholder behavior. As markets change, contracts mature and actual policyholder behavior emerges, these assumptions are continually evaluated and may from time to time be adjusted. Embedded derivative liabilities for GMWB, GMAB and COMBO are shown in the table below.
F-80
12.
Separate Accounts, Death Benefits and Other Insurance Benefit Features and Embedded Product Derivatives
(continued)
| | | | | |
Variable Annuity Embedded Derivative Liabilities: | As of December 31, |
($ in millions) | 2012 | | 2011 |
| | | As restated |
| | | and amended |
| | | | | |
GMWB | $ | 15.3 | | $ | 23.6 |
GMAB | | 14.6 | | | 25.3 |
COMBO | | (0.3) | | | (0.3) |
Total variable annuity embedded derivative liabilities | $ | 29.6 | | $ | 48.6 |
There were no benefit payments made for the GMWB and GMAB during 2012 and 2011. We have established a risk management strategy under which we hedge our GMAB, GMWB and COMBO exposure using equity index options, equity index futures, equity index variance swaps, interest rate swaps and swaptions.
Fixed indexed annuity embedded derivatives
Fixed indexed annuities may also contain a variety of index-crediting options: policy credits that are calculated based on the performance of an outside equity market or other index over a specified term. The index options represent embedded derivative liabilities that are required to be reported separately from the host contract. These index options are accounted for at fair value within policyholder deposits within the consolidated balance sheets with changes in fair value recorded in realized investment gains, in the consolidated statements of comprehensive income. The fair value of these index options is calculated using the budget method as described in Note 14 to these financial statements. Several additional inputs reflect our internally developed assumptions related to lapse rates and policyholder behavior. The fair value of these embedded derivatives was $51.2 million and $35.9 million as of December 31, 2012 and 2011, respectively. In order to manage the risk associated with these equity indexed-crediting features, we hedge using equity index options as described in Note 13 to these financial statements.
Embedded derivatives realized gains and losses
Changes in the fair value of embedded derivatives associated with variable annuity and fixed indexed annuity contracts are recorded as realized investment gains and losses within the consolidated statements of comprehensive income. Embedded derivatives gains and (losses) recognized in earnings are $12.1 million, $(34.4) million and $12.3 million for the years ended December 31, 2012, 2011 and 2010, respectively.
13.
Derivative Instruments
Derivative instruments
We use derivative financial instruments, including options, futures and swaps as a means of hedging exposure to interest rate, equity price change, equity volatility and foreign currency risk. This includes our surplus hedge which utilizes futures and options to hedge against declines in equity markets and the resulting statutory capital and surplus impact. We also use derivative instruments to economically hedge our exposure on living benefits offered on certain of our variable annuity products as well as index credits on our fixed indexed annuity products.
The Company seeks to enter into over-the-counter (“OTC”) derivative transactions pursuant to master agreements that provide for a netting of payments and receipts by counterparty. As of December 31, 2012 and 2011, $9.2 million and $8.0 million, respectively, of cash and cash equivalents were held as collateral by a third party related to our derivative transactions.
Our derivatives do not qualify for hedge accounting. We do not designate the purchased derivatives related to variable annuity living benefits or fixed indexed annuity index credits as hedges for accounting purposes.
F-81
13.
Derivative Instruments (continued)
| | | | | | | | | | |
Derivative Instruments: | | | | | Fair Value as of |
($ in millions) | | | | | December 31, 2012 |
| Maturity | | Notional Amount | | Assets | | Liabilities(1) |
|
| | | | | | | | | | |
Interest rate swaps | 2016-2027 | | $ | 180.0 | | $ | 15.5 | | $ | 7.7 |
Variance swaps | 2015-2017 | | | 0.9 | | | — | | | 4.4 |
Swaptions | 2024 | | | 25.0 | | | — | | | — |
Put options | 2015-2022 | | | 406.0 | | | 72.7 | | | — |
Call options (2) | 2013-2017 | | | 1,328.4 | | | 53.3 | | | 33.6 |
Cross currency swaps | 2016 | | | 10.0 | | | — | | | 0.1 |
Equity futures | 2013 | | | 184.7 | | | 15.9 | | | — |
Total derivative instruments | | | $ | 2,135.0 | | $ | 157.4 | | $ | 45.8 |
———————
(1)
Derivative liabilities are included in other liabilities on the consolidated balance sheets.
(2)
Includes a contingent receivable of $2.7 million.
| | | | | | | | | | |
Derivative Instruments: | Maturity | | Notional Amount | | Fair Value as of |
($ in millions) | December 31, 2011 |
| As restated and amended |
| Assets | | Liabilities(1) |
|
| | | | | | | | | | |
Interest rate swaps | 2017-2026 | | $ | 131.0 | | $ | 13.7 | | $ | 5.2 |
Variance swaps | 2015-2017 | | | 0.9 | | | 2.8 | | | — |
Swaptions | 2024 | | | 25.0 | | | 0.2 | | | — |
Put options | 2015-2022 | | | 406.0 | | | 95.4 | | | — |
Call options (2) | 2012-2016 | | | 700.4 | | | 31.4 | | | 19.0 |
Cross currency swaps | 2012-2016 | | | 15.0 | | | 0.2 | | | — |
Equity futures | 2012 | | | 70.0 | | | 18.5 | | | — |
Total derivative instruments | | | $ | 1,348.3 | | $ | 162.2 | | $ | 24.2 |
———————
(1)
Derivative liabilities are included in other liabilities on the consolidated balance sheets.
(2)
Includes a contingent receivable of $3.4 million.
| | | | | | | | |
Derivative Instrument Gains (Losses) Recognized in | Years Ended December 31, |
Realized Investment Gains (Losses): | 2012 | | 2011 | | 2010 |
($ in millions) | | | As restated | | As restated |
| | | and amended | | and amended |
Derivative instruments by type | | | | | | | | |
Interest rate swaps | $ | (0.9) | | $ | 10.3 | | $ | — |
Variance swaps | | (7.9) | | | 3.5 | | | (0.6) |
Swaptions | | (0.2) | | | (1.3) | | | 1.7 |
Put options | | (22.0) | | | 19.8 | | | (4.1) |
Call options | | 0.1 | | | (11.9) | | | 11.2 |
Equity futures | | (19.4) | | | (6.2) | | | (35.9) |
Cross currency swaps | | (0.1) | | | 0.2 | | | 1.1 |
Embedded derivatives | | 12.1 | | | (34.4) | | | 12.3 |
Total derivative instrument losses recognized in realized investment gains (losses) | $ | (38.3) | | $ | (20.0) | | $ | (14.3) |
Interest Rate Swaps
We maintain an overall interest rate risk management strategy that primarily incorporates the use of interest rate swaps as hedges of our exposure to changes in interest rates. Our exposure to changes in interest rates primarily results from our commitments to fund interest-sensitive insurance liabilities, as well as from our significant holdings of fixed rate financial instruments. We use interest rate swaps that effectively convert variable rate cash flows to fixed cash flows in order to hedge the interest rate risks associated with guaranteed minimum living benefit (GMAB/GMWB) rider liabilities.
F-82
13.
Derivative Instruments (continued)
Interest Rate Options
We use interest rate options, such as swaptions, to hedge against market risks to assets or liabilities from substantial changes in interest rates. An interest rate swaption gives us the right but not the obligation to enter into an underlying swap. Swaptions are options on interest rate swaps. All of our swaption contracts are receiver swaptions, which give us the right to enter into a swap where we will receive the agreed-upon fixed rate and pay the floating rate. If the market conditions are favorable and the swap is needed to continue hedging our in force liability business, we will exercise the swaption and enter into a fixed rate swap. If a swaption contract is not exercised by its option maturity date, it expires with no value.
Exchange Traded Future Contracts
We use equity index futures to hedge the market risks from changes in the value of equity indices, such as S&P 500, associated with guaranteed minimum living benefit (GMAB/GMWB) rider liabilities. Positions are short-dated, exchange-traded futures with maturities of three months.
Equity Index Options
We use equity indexed options to hedge against market risks from changes in equity markets, volatility and interest rates.
An equity index option affords us the right to make or receive payments based on a specified future level of an equity market index. We may use exchange-trade or OTC options.
Generally, we have used a combination of equity index futures, interest rate swaps, variance swaps and long-dated put options to hedge our GMAB and GMWB liabilities and equity index call options to hedge our indexed annuity option liabilities.
Cross Currency Swaps
We use cross currency swaps to hedge against market risks from changes in foreign currency exchange rates. Currency swaps are used to swap bond asset cash flows denominated in a foreign currency back to U.S. dollars. Under foreign currency swaps, we agree with another party (referred to as the counterparty) to exchange principal and periodic interest payments denominated in foreign currency for payments in U.S. dollars.
Contingent features
Derivative counterparty agreements may contain certain provisions that require our insurance companies’ financial strength rating to be above a certain threshold. If our financial strength ratings were to fall below a specified rating threshold, certain derivative counterparties could request immediate payment or demand immediate and ongoing full collateralization on derivative instruments in net liability positions, or trigger a termination of existing derivatives and/or future derivative transactions.
In certain derivative counterparty agreements, our financial strength ratings are below the specified threshold levels. However, the Company held no derivative instruments as of December 31, 2012 in a net aggregate liability position payable to any counterparty (i.e., such derivative instruments have fair values in a net asset position payable to the Company if such holdings were liquidated).
14.
Fair Value of Financial Instruments
ASC 820-10 defines and establishes the framework for measuring fair value. The framework is based on inputs that are used in the valuation and a fair value hierarchy based on the quality of those inputs. Fair value is defined as the price that would be received to sell an asset or paid to transfer a liability in an orderly transaction between market participants at the measurement date.
F-83
14.
Fair Value of Financial Instruments (continued)
A financial instrument’s categorization within the valuation hierarchy is based upon the lowest level of input that is significant to the fair value measurement. The valuation hierarchy is based upon the transparency of inputs to the valuation of an asset or liability as of the measurement date. The input levels are defined as follows:
·
Level 1 – inputs to the valuation methodology are quoted prices (unadjusted) for identical assets or liabilities in active markets. Level 1 securities include highly liquid government bonds and exchange-traded equities.
·
Level 2 – inputs to the valuation methodology include quoted prices for similar assets and liabilities in active markets and inputs that are observable for the asset or liability, either directly or indirectly, for substantially the full term of the financial instrument. Examples of such instruments include government-backed mortgage products, certain collateralized mortgage and debt obligations and certain high-yield debt securities.
·
Level 3 – inputs to the valuation methodology are unobservable and significant to the fair value measurement. Unobservable inputs reflect management’s own assumptions about inputs in which market participants would use in pricing these types of assets or liabilities. Level 3 financial instruments include values which are determined using pricing models and third-party evaluation. Additionally, the determination of some fair value estimates utilizes significant management judgments or best estimates.
Investments for which fair value is based upon unadjusted quoted market prices are reported as Level 1. The number of quotes the issuer obtains per instrument will vary depending on the security type and availability of pricing data from pricing vendors. The Company has defined a pricing hierarchy among pricing vendors to determine ultimate value used and also reviews significant discrepancies among pricing vendors to determine final value used. Prices from pricing services are not adjusted, but the Company may obtain a broker quote or use an internal model to price a security if it believes vendor prices do not reflect fair value. We receive quoted market prices from independent third party, nationally recognized pricing vendors (“pricing vendors”). When quoted prices are not available, we use these pricing vendors to give an estimated fair value. If quoted prices, or an estimated price from our pricing vendors are not available or we determine that the price is based on disorderly transactions or in inactive markets, fair value is based upon internally developed models or obtained from an independent third-party broker. We primarily use market-based or independently sourced market parameters, including interest rate yield curves, option volatilities and currency rates. Valuation adjustments may be made to ensure that financial instruments are recorded at fair value. These adjustments include amounts to reflect counterparty credit quality, our own creditworthiness, liquidity and unobservable parameters that are applied consistently over time.
Management is responsible for the fair value of investments and the methodologies and assumptions used to estimate fair value. The fair value process is evaluated quarterly by the Pricing Committee, which is comprised of the Chief Investment Officer, Chief Accounting Officer and the Head of Investment Accounting. The purpose of the committee is to ensure the Company follows objective and reliable valuation practices, as well as approving changes to valuation methodologies and pricing sources. Fair value is based upon quoted market prices, where available. If listed prices or quotes are not available, fair value is based upon internally developed models that use primarily market-based or independently sourced market parameters, including interest rate yield curves, option volatilities and currency rates. Valuation adjustments may be made to ensure that financial instruments are recorded at fair value. These adjustments include amounts to reflect counterparty credit quality, our own creditworthiness, liquidity and unobservable parameters that are applied consistently over time. Using professional judgment and experience, we evaluate and weigh the relevance and significance of all readily available market information to determine the best estimate of fair value.
The fair values of Level 2 investments are determined by management after considering prices from our pricing vendors. Fair values for fixed maturity debt securities are primarily based on yield curve analysis along with ratings and spread data. Other inputs may be considered for fair value calculations including published indexed data, sector specific performance, comparable price sources and similar traded securities. Management reviews all Level 2 and Level 3 market prices on a quarterly basis.
The following is a description of our valuation methodologies for assets and liabilities measured at fair value. Such valuation methodologies were applied to all of the assets and liabilities carried at fair value in each respective classification.
F-84
14.
Fair Value of Financial Instruments (continued)
Available-for-sale debt securities
We use pricing vendors to estimate fair value for the majority of our public available-for-sale debt securities. The pricing vendors’ estimates are based on market data and use pricing models that vary by asset class and incorporate available trade, bid and other market information. The methodologies used by these vendors are reviewed and understood by management through discussion with and information provided by these vendors. The Company assesses the reasonableness of individual security values received from valuation service providers through various analytical techniques. Management also assesses whether the assumptions used appear reasonable and consistent with the objective of determining fair value. When our pricing vendors are unable to obtain evaluations based on market data, fair value is determined by obtaining a direct broker quote. Management reviews these broker quotes and valuation techniques to determine whether they are appropriate and consistently applied. Broker quotes are evaluated based on the Company’s assessment of the broker’s knowledge of, and history in trading, the security and the Company’s understanding of inputs used to derive the broker quote. Management also assesses reasonableness of individual security values similar the vendor pricing review noted above.
For our private placement investments, we estimated fair value using internal models. Private placement securities are generally valued using a matrix pricing approach which categorizes these securities into groupings using remaining average life and credit rating as the two criteria to determine a grouping. The Company obtains current credit spread information from private placement dealers based on the criteria described and adds that spread information to treasury rates corresponding to the life of each security to determine a discount rate for pricing. A small number of private placement securities are internally valued using models or analyst judgment. Fair values determined internally are also subject to management review to ensure that valuation models and inputs appear reasonable.
U.S. Government and Agency Securities
We value public U.S. government and agency debt by obtaining fair value estimates from our pricing vendors. For our private placement government and agency debt, our fair value is based on internal models using a either a discounted cash flow or spread matrix which incorporates treasury yields, market spreads and average life calculations. For short-term assets we equate fair value to amortized cost due to their relatively short duration and limited exposure to credit risk.
State & Political Subdivisions
Public state & political subdivision debt is valued by obtaining fair value estimates from our pricing vendors. For our private placement debt securities, our fair value is based on internal models using a either a discounted cash flow or spread matrix which incorporates treasury yields, market spreads and average life calculations.
Foreign Government
We obtain fair value estimates from our pricing vendor to value foreign government debt.
Corporate Bonds
For the majority of our public corporate debt, we obtain fair value estimates from our pricing vendors. For public corporate debt in which we cannot obtain fair value estimates from our pricing vendors, we receive a direct quote from a broker. In most cases, we will obtain a direct broker quote from the broker that facilitated the deal. For our private placement debt securities, our fair value is based on internal models using either a discounted cash flow or spread matrix which incorporates treasury yields, market spreads and average life calculations. For private fixed maturities, fair value is determined using a discounted cash flow model, which utilizes a discount rate based upon the average of spread surveys collected from private market intermediaries who are active in both primary and secondary transactions and takes into account, among other factors, the credit quality and industry sector of the issuer and the reduced liquidity associated with private placements. In determining the fair value of certain fixed maturity securities, the discounted cash flow model may also use unobservable inputs, which reflect the Company’s own assumptions about the inputs market participants would use in pricing the security.
F-85
14.
Fair Value of Financial Instruments (continued)
RMBS, CMBS, CDO/CLO and Other Asset-Backed Securities
For structured securities, the majority of the fair value estimates are provided by our pricing vendors. When a fair value estimate is not available from the pricing vendors, we estimate fair value using direct broker quotes or internal models which use a discounted cash flow technique. These models consider the best estimate of cash flows until maturity to determine our ability to collect principal and interest and compare this to the anticipated cash flows when the security was purchased. In addition, management judgment is used to assess the probability of collecting all amounts contractually due to us. After consideration is given to the available estimates relevant to assessing the collectibility, including historical events, current conditions and reasonable forecasts, an estimate of future cash flows is determined. This includes evaluating the remaining payment terms, prepayment speeds, the underlying collateral, expected defaults using current default data and the financial condition of the issuer. Other factors considered are composite credit ratings, industry forecast, analyst reports and other relevant market data, similar to those the Company believes market participants would use.
Available-for-sale equity securities
Private Equity Investments
The fair value of non-public private equity is estimated using the valuation of the lead investor (“sponsor value”), typically a general partner of an investment in a limited partnership in which we invest. The Sponsors, or lead investors/underwriters of these investments, account for them on an equity basis. The Company will then obtain securities fair value from these sponsors to infer the appropriate fair value for its holdings in the same or similar investment. If we cannot determine a price using the sponsor value, we would estimate the fair value using management’s professional judgment. Management evaluates many inputs including, but not limited to; current operating performance, future expectations of the investment, industry valuations of comparable public companies and changes in market outlook and third-party financing environment over time. Financial information for these investments is reported on a three-month delay due to the timing of financial statements as of the current reporting period.
Public Equity
Our publicly held equity securities are generally obtained through the initial public offering of privately-held equity investments and are reported at the estimated fair value determined based on quoted prices in active markets. To the extent these securities have readily determinable exchange based prices, the securities are categorized as Level 1 of our hierarchy. If management determines there are liquidity concerns or exchange based information for the specific securities in our portfolio is not available, the securities are categorized as Level 2. In addition, management will consistently monitor these holdings and prices will be modified for any pertinent and/or significant events that would result in a valuation adjustment, including an analysis for potential credit-related events or impairments.
Limited partnerships and other investments
Our limited partnerships are accounted for using equity method. We carry these investments on the consolidated balance sheets at the capital value we obtain from the financial statement we received from the general partner. Typically, our carrying value is based on a financial statement one quarter in arrears due to timing of receipt of financial statements. These financial statements are generally audited annually. Generally the information received is deemed an appropriate approximation of the fair value of these fund investments and no adjustments are made to the financial statements received. Management also has open communication with each fund manager and generally views the information reported from the underlying funds as the best information available to record its investments.
For the limited partnerships in which we consolidate the entity, we hold private debt and equity securities. All consolidated investments are valued using current period financial statements we receive from the general partner.
F-86
14.
Fair Value of Financial Instruments (continued)
Included in the other investments balance is the net investment value of life settlement contracts which is determined on a discounted cash flow basis, which utilizes current life expectancy assumptions, as well as leveraged lease investments which represent the net investment in leveraged aircraft leases. The leveraged lease aircraft investments are accounted for using equity method. The investments are carried at the capital value obtained from financial statements we received from a third party servicer.
Separate account assets
Our separate account assets consist of mutual funds that are frequently traded. Since 2003, investments owned by the Phoenix Companies, Inc. Employee Pension Plan (the “Plan”) Trust were sold to PHLVIC and the investments converted to ownership by the Trust to the Employee Pension Separate Account (“EPP SA”). The Plan’s Trust purchased a group flexible premium variable accumulation deferred annuity contract. As of May 21, 2012, the Plan surrendered the EPP SA contract for full value and the Plan’s underlying investments are no longer held in the separate account. Certain investments related to fixed income, equities, and foreign securities were transferred to Mercer Trust Company for investment management purposes in a group trust investment arrangement. The remaining investments continued with their respective investment managers. These securities are valued using the market approach in which unadjusted market quotes are used. We include these securities in Level 1of our hierarchy.
Derivatives
Exchange-traded derivatives are valued using quoted prices and are classified within Level 1 of the valuation hierarchy. However, few classes of derivative contracts are listed on an exchange. Therefore, the majority of our derivative positions are OTC derivative financial instruments, valued using third-party vendor derivative valuation systems that use as their basis readily observable market parameters, such as swap rates and volatility assumptions. These positions are classified within Level 2 of the valuation hierarchy. Such OTC derivatives include vanilla interest rate swaps, equity index options, swaptions, variance swaps and cross currency swaps. Nevertheless, we review and validate the resulting fair values against those provided to us monthly by the derivative counterparties for reasonableness.
Fair values for OTC derivative financial instruments, mostly options and swaps, represent the present value of amounts estimated to be received from or paid to a marketplace participant in exchange of these instruments (i.e., the amount we would expect to receive in a derivative asset assignment or would expect to pay to have a derivative liability assumed). These derivatives are valued using third-party derivative valuation models which take into account the net present value of estimated future cash flows and capital market assumptions which are derived from directly observable prices from other OTC trades and exchange-traded derivatives. Such assumptions include swap rates and swaption volatility obtained from Bloomberg, as well as equity index volatility and dividend yields provided by OTC derivative dealers.
The fair value of OTC derivative financial instruments is also adjusted for the credit risk of the counterparty in cases in which there are no collateral offsets. To estimate the impact on fair value of a market participant’s view of counterparty non-performance risk we use a credit default swap (“CDS”)-based approach in measuring this counterparty non-performance risk by looking at the cost of obtaining credit protection in the CDS market for the aggregate fair value exposure amount over the remaining life of derivative contracts, given the counterparty’s rating. The resulting upfront CDS premium, calculated using Bloomberg analytics, serves as a reasonable estimate of the default provision for the non-performance risk or counterparty valuation adjustment to the fair valuation of non-collateralized OTC derivative financial instruments.
Certain new and/or complex instruments may have immature or limited markets or require more sophistication in derivative valuation methodology. As a result, the pricing models used for valuation of these instruments often incorporate significant estimates and assumptions that market participants would use in pricing the instrument, which may impact the results of operations reported in the consolidated financial statements. Hence, instead of valuing these instruments using third-party vendor valuation systems, we rely on the fair market valuations reported to us monthly by the derivative counterparties. Fair values for OTC derivatives are verified using observed estimates about the costs of hedging the risk and other trades in the market. As the markets for these products develop, we continually refine our pricing models to correlate more closely to the market risk of these instruments.
F-87
14.
Fair Value of Financial Instruments (continued)
Valuation of embedded derivatives
We make guarantees on certain variable annuity contracts, including GMAB, GMWB and COMBO as well as provide credits based on the performance of certain indices (“index credits”) on our fixed indexed annuity contracts that meet the definition of an embedded derivative. The GMAB, GMWB and COMBO embedded derivative liabilities associated with our variable annuity contracts are accounted for at fair value using a risk neutral stochastic valuation methodology with changes in fair value recorded in realized investment gains. The inputs to our fair value methodology include estimates derived from the asset derivatives market, including the equity volatility and the swap curve. Several additional inputs are not obtained from independent sources, but instead reflect our internally developed assumptions related to mortality rates, lapse rates and policyholder behavior. The fair value of the embedded derivative liabilities associated with the index credits on our fixed indexed annuity contracts is calculated using the budget method with changes in fair value recorded in realized investment gains. Under the budget method, the value of the initial index option is based on the fair value of the option purchased to hedge the index. The value of the index credits in future years is estimated to be the budgeted amount. Budgeted amounts are estimated based on available investment income using assumed investment returns and projected liability values. Several additional inputs reflect our internally developed assumptions related to lapse rates and policyholder behavior. As there are significant unobservable inputs included in our fair value methodology for these embedded derivative liabilities, we consider the above-described methodology as a whole to be Level 3 within the fair value hierarchy.
Our fair value calculation of embedded derivative liabilities includes a credit standing adjustment (the “CSA”). The CSA represents the adjustment that market participants would make to reflect the risk that guaranteed benefit obligations may not be fulfilled (“non-performance risk”). We estimate our CSA using the credit spread (based on publicly available credit spread indices) for financial services companies similar to the Company’s life insurance subsidiaries. The CSA is updated every quarter and, therefore, the fair value will change with the passage of time even in the absence of any other changes that would affect the valuation.
The following tables present the financial instruments carried at fair value on a recurring basis by ASC 820-10 valuation hierarchy (as described above). There were no financial instruments carried at fair value on a non-recurring basis as of December 31, 2012 and 2011, respectively.
| | | | | | | | | | | |
Fair Values of Financial Instruments by Level: | As of December 31, 2012 |
($ in millions) | Level 1 | | Level 2 | | Level 3 | | Total |
Assets | | | | | | | | | | | |
Available-for-sale debt securities | | | | | | | | | | | |
U.S. government and agency | $ | 699.6 | | $ | 115.2 | | $ | 296.7 | (1) | $ | 1,111.5 |
State and political subdivision | | — | | | 144.8 | | | 212.4 | | | 357.2 |
Foreign government | | — | | | 158.5 | | | 45.8 | | | 204.3 |
Corporate | | — | | | 3,857.7 | | | 3,812.3 | | | 7,670.0 |
CMBS | | — | | | 792.5 | | | 89.7 | | | 882.2 |
RMBS | | — | | | 1,062.4 | | | 709.3 | | | 1,771.7 |
CDO/CLO | | — | | | — | | | 223.7 | | | 223.7 |
Other asset-backed | | — | | | 125.5 | | | 309.9 | | | 435.4 |
Available-for-sale equity securities | | 2.1 | | | — | | | 32.7 | | | 34.8 |
Derivative assets | | 15.9 | | | 141.5 | | | — | | | 157.4 |
Fair value investments (2) | | 30.6 | | | 17.6 | | | 153.3 | | | 201.5 |
Separate account assets | | 3,316.5 | | | — | | | — | | | 3,316.5 |
Total assets | $ | 4,064.7 | | $ | 6,415.7 | | $ | 5,885.8 | | $ | 16,366.2 |
Liabilities | | | | | | | | | | | |
Derivative liabilities | $ | — | | $ | 45.8 | | $ | — | | $ | 45.8 |
Embedded derivatives | | | | | — | | | 80.8 | | | 80.8 |
Total liabilities | $ | — | | $ | 45.8 | | $ | 80.8 | | $ | 126.6 |
———————
(1)
Includes securities whose underlying collateral is an obligation of a U.S. government entity.
(2)
Fair value investments at December 31, 2012 include $126.1 million of debt securities recorded at fair value. In addition, we have also elected the fair value option for equity securities backing our deferred compensation liabilities at $21.9 million as of December 31, 2012. Changes in the fair value of these assets are recorded through net investment income. Additionally, $53.5 million of assets relate to investment holdings of consolidated VIEs held at fair value, $8.7 million of which are Level 1 securities.
There were no transfers of assets between Level 1 and Level 2 during the year ended December 31, 2012.
F-88
14.
Fair Value of Financial Instruments (continued)
| | | | | | | | | | | |
Fair Values of Financial Instruments by Level: | As of December 31, 2011 |
($ in millions) | As restated and amended |
| Level 1 | | Level 2 | | Level 3 | | Total |
Assets | | | | | | | | | | | |
Available-for-sale debt securities | | | | | | | | | | | |
U.S. government and agency | $ | 268.2 | | $ | 137.4 | | $ | 336.2 | (1) | $ | 741.8 |
State and political subdivision | | — | | | 165.2 | | | 116.6 | | | 281.8 |
Foreign government | | — | | | 153.4 | | | 51.8 | | | 205.2 |
Corporate | | — | | | 3,056.7 | | | 3,501.5 | | | 6,558.2 |
CMBS | | — | | | 1,028.7 | | | 100.6 | | | 1,129.3 |
RMBS | | — | | | 1,162.8 | | | 944.2 | | | 2,107.0 |
CDO/CLO | | — | | | – | | | 232.4 | | | 232.4 |
Other asset-backed | | — | | | 205.8 | | | 335.5 | | | 541.3 |
Available-for-sale equity securities | | 1.5 | | | 4.8 | | | 29.4 | | | 35.7 |
Derivative assets | | 18.9 | | | 143.3 | | | — | | | 162.2 |
Fair value investments (2) | | 23.7 | | | 15.5 | | | 144.8 | | | 184.0 |
Separate account assets | | 3,738.6 | | | 78.3 | | | — | | | 3,816.9 |
Total assets | $ | 4,050.9 | | $ | 6,151.9 | | $ | 5,793.0 | | $ | 15,995.8 |
Liabilities | | | | | | | | | | | |
Derivative liabilities | $ | — | | $ | 24.2 | | $ | — | | $ | 24.2 |
Embedded derivatives | | — | | | — | | | 84.5 | | | 84.5 |
Total liabilities | $ | — | | $ | 24.2 | | $ | 84.5 | | $ | 108.7 |
———————
(1)
Includes securities whose underlying collateral is an obligation of a U.S. government entity.
(2)
Fair value investments at December 31, 2011 include $117.9 million of debt securities recorded at fair value. In addition, we have also elected the fair value option for equity securities backing our deferred compensation liabilities at $22.1 million as of December 31, 2011. Changes in the fair value of these assets are recorded through net investment income. Additionally, $44.0 million of assets relate to investment holdings of consolidated VIEs held at fair value, $1.6 million of which are Level 1 securities.
There were no transfers of assets between Level 1 and Level 2 during the year ended December 31, 2011.
Available-for-sale debt securities as of December 31, 2012 and 2011 are reported net of $34.5 million and $62.0 million of Level 2 investments included in discontinued assets on the consolidated balance sheets related to discontinued reinsurance operations.
The following tables present corporates carried at fair value on a recurring basis by sector.
| | | | | | | | | | | |
Fair Values of Corporates by Level and Sector: | As of December 31, 2012 |
($ in millions) | Level 1 | | Level 2 | | Level 3 | | Total |
Corporates | | | | | | | | | | | |
Consumer | $ | — | | $ | 1,160.3 | | $ | 1,860.8 | | $ | 3,021.1 |
Energy | | — | | | 277.8 | | | 142.7 | | | 420.5 |
Financial services | | — | | | 1,456.5 | | | 762.7 | | | 2,219.2 |
Technical/communications | | — | | | 154.7 | | | 44.6 | | | 199.3 |
Transportation | | — | | | 72.6 | | | 156.0 | | | 228.6 |
Utilities | | — | | | 506.5 | | | 631.8 | | | 1,138.3 |
Other | | — | | | 229.3 | | | 213.7 | | | 443.0 |
Total corporates | $ | — | | $ | 3,857.7 | | $ | 3,812.3 | | $ | 7,670.0 |
| | | | | | | | | | | |
Fair Values of Corporates by Level and Sector: | As of December 31, 2011 |
($ in millions) | As restated and amended |
| Level 1 | | Level 2 | | Level 3 | | Total |
Corporates | | | | | | | | | | | |
Consumer | $ | — | | $ | 898.4 | | $ | 1,662.4 | | $ | 2,560.8 |
Energy | | — | | | 171.7 | | | 131.4 | | | 303.1 |
Financial services | | — | | | 1,221.3 | | | 721.9 | | | 1,943.2 |
Technical/communications | | — | | | 130.9 | | | 23.8 | | | 154.7 |
Transportation | | — | | | 60.2 | | | 187.4 | | | 247.6 |
Utilities | | — | | | 467.4 | | | 619.2 | | | 1,086.6 |
Other | | — | | | 106.8 | | | 155.4 | | | 262.2 |
Total corporates | $ | — | | $ | 3,056.7 | | $ | 3,501.5 | | $ | 6,558.2 |
F-89
14.
Fair Value of Financial Instruments (continued)
Level 3 financial assets and liabilities
The following tables set forth a summary of changes in the fair value of our Level 3 financial assets and liabilities. Financial assets and liabilities are classified in their entirety based on the lowest level of input that is significant to the fair value measurement. The securities which were transferred as of the end of each reporting period into Level 3 were due to decreased market observability of similar assets and/or significant inputs and transfers out of Level 3 were due to increased market activity on comparable assets or observability of inputs.
| | | | | | | | | | | | | | | | | | | | | | | |
Level 3 Financial Assets: | As of December 31, 2012 |
($ in millions) | Balance, beginning of period | | Purchases | | Sales | | Transfers into Level 3 | | Transfers out of Level 3 | | Realized & unrealized gains (losses) included in income(1) | | Unrealized gains (losses) included in OCI | | Total |
|
|
|
|
|
Assets | | | | | | | | | | | | | | | | | | | | | | | |
Available-for-sale debt securities | | | | | | | | | | | | | | | | | | | | | | | |
U.S. government and agency (2) | $ | 336.2 | | $ | 5.4 | | $ | (31.5) | | $ | — | | $ | — | | $ | 0.4 | | $ | (13.8) | | $ | 296.7 |
State and political subdivision | | 116.6 | | | 53.5 | | | (3.1) | | | 22.1 | | | (11.4) | | | — | | | 34.7 | | | 212.4 |
Foreign government | | 51.8 | | | 5.0 | | | — | | | — | | | — | | | — | | | (11.0) | | | 45.8 |
Corporate | | 3,501.5 | | | 610.2 | | | (89.1) | | | 64.2 | | | (119.2) | | | 0.4 | | | (155.7) | | | 3,812.3 |
CMBS | | 100.6 | | | — | | | (12.1) | | | 32.4 | | | (30.4) | | | (4.1) | | | 3.3 | | | 89.7 |
RMBS | | 944.2 | | | 3.5 | | | (127.2) | | | — | | | — | | | (9.6) | | | (101.6) | | | 709.3 |
CDO/CLO | | 232.4 | | | 25.4 | | | (24.8) | | | — | | | — | | | 0.5 | | | (9.8) | | | 223.7 |
Other asset-backed | | 335.5 | | | 17.2 | | | (30.7) | | | 0.1 | | | (11.4) | | | (2.1) | | | 1.3 | | | 309.9 |
Available-for-sale equity securities | | 29.4 | | | 11.5 | | | (16.1) | | | 0.2 | | | — | | | 6.8 | | | 0.9 | | | 32.7 |
Fair value investments | | 144.8 | | | 36.0 | | | (37.1) | | | — | | | — | | | 9.6 | | | — | | | 153.3 |
Total assets | $ | 5,793.0 | | $ | 767.7 | | $ | (371.7) | | $ | 119.0 | | $ | (172.4) | | $ | 1.9 | | $ | (251.7) | | $ | 5,885.8 |
———————
(1)
Reflected in realized investment gains and losses for all assets except limited partnerships and other investments which are included in net investment income.
(2)
Includes securities whose underlying collateral is an obligation of a U.S. government entity.
| | | | | | | | | | | | | | | | | | | | | | | |
Level 3 Financial Assets: | As of December 31, 2011 |
| As restated and amended |
($ in millions) | Balance, beginning of period | | Purchases | | Sales | | Transfers into Level 3 | | Transfers out of Level 3 | | Realized & unrealized gains (losses) included in income(1) | | Unrealized gains (losses) included in OCI | | Total |
|
|
|
|
|
Assets | | | | | | | | | | | | | | | | | | | | | | | |
Available-for-sale debt securities | | | | | | | | | | | | | | | | | | | | | | | |
U.S. government and agency (2) | $ | 341.4 | | $ | 20.9 | | $ | (10.6) | | $ | 6.9 | | $ | — | | $ | — | | $ | (22.4) | | $ | 336.2 |
State and political subdivision | | 67.1 | | | 44.5 | | | (1.8) | | | — | | | — | | | — | | | 6.8 | | | 116.6 |
Foreign government | | 47.1 | | | 6.6 | | | — | | | 6.8 | | | (3.5) | | | — | | | (5.2) | | | 51.8 |
Corporate | | 3,278.3 | | | 438.4 | | | (86.1) | | | 125.7 | | | (88.9) | | | (7.6) | | | (158.3) | | | 3,501.5 |
CMBS | | 91.7 | | | 32.0 | | | (5.0) | | | 17.6 | | | (36.7) | | | (3.6) | | | 4.6 | | | 100.6 |
RMBS | | 919.1 | | | 185.0 | | | (156.5) | | | — | | | — | | | (9.7) | | | 6.3 | | | 944.2 |
CDO/CLO | | 238.0 | | | 18.7 | | | (14.2) | | | — | | | — | | | (1.8) | | | (8.3) | | | 232.4 |
Other asset-backed | | 252.8 | | | 100.9 | | | (38.6) | | | 3.4 | | | (7.7) | | | (3.9) | | | 28.6 | | | 335.5 |
Available-for-sale equity securities | | 36.2 | | | 4.4 | | | (8.6) | | | 0.6 | | | — | | | 3.6 | | | (6.8) | | | 29.4 |
Fair value investments | | 126.0 | | | 37.2 | | | (17.9) | | | 37.3 | | | — | | | (37.8) | | | — | | | 144.8 |
Total assets | $ | 5,397.7 | | $ | 888.6 | | $ | (339.3) | | $ | 198.3 | | $ | (136.8) | | $ | (60.8) | | $ | (154.7) | | $ | 5,793.0 |
———————
(1)
Reflected in realized investment gains and losses for all assets except limited partnerships and other investments which are included in net investment income.
(2)
Includes securities whose underlying collateral is an obligation of a U.S. government entity.
F-90
14.
Fair Value of Financial Instruments (continued)
| | | | | |
Level 3 Financial Liabilities: | Embedded Derivatives |
| Years Ended December 31, |
($ in millions) | 2012 | | 2011 |
| | | As restated |
| | | and amended |
| | | | | |
Balance, beginning of period | $ | 84.5 | | $ | 30.4 |
Net purchases/(sales) | | 8.4 | | | 19.7 |
Transfers into Level 3 | | — | | | — |
Transfers out of Level 3 | | — | | | — |
Realized (gains) losses (1) | | (12.1) | | | 34.4 |
Balance, end of period | $ | 80.8 | | $ | 84.5 |
———————
(1)
Realized gains and losses are included in net realized investment gains on the consolidated statements of comprehensive income.
Significant unobservable inputs used in the fair value measurement of Level 3 assets are yield, prepayment rate, default rate, recovery rate, and reinvestment spread. Keeping other inputs unchanged, an increase in yield or default rate would decrease the fair value of the asset while an increase in prepayment rate, recovery rate, or reinvestment spread would result in an increase to the fair value of the asset. Yields are a function of the underlying treasury rates and asset spreads, and changes in default and recovery rates are dependent on overall market conditions.
F-91
14.
Fair Value of Financial Instruments (continued)
The following table presents quantitative estimates about unobservable inputs used in the fair value measurement of significant categories of internally priced assets.
| | | | | | | | | | |
Level 3 Assets:(1) | | As of December 31, 2012 |
($ in millions) | | | | | | | | |
| | Fair | | Valuation | | Unobservable | | |
| | Value | | Technique(s) | | Input | | Range (Weighted Average) |
| | | | | | | | | |
U.S. government and
agency | | $ | 286.1 | | Spread matrix | | Yield | | 1.46% - 5.19% (3.20%) |
| | | | | | | | | |
| | | | | | | | | |
State and political
subdivision | | $ | 107.4 | | Spread matrix | | Yield | | 1.94% - 3.53% (2.93%) |
| | | | | | | | | |
| | | | | Discounted cash flow | | Yield | | 3.28% |
| | | | | | | | | |
| | | | | | | | | |
Corporate | | $ | 2,888.9 | | Spread matrix | | Yield | | 1.36% - 7.82% (3.21%) |
| | | | | | | | | |
| | | | | Discounted cash flow | | Yield | | 1.47% - 6.33% (2.80%) |
| | | | | | | | | |
| | | | | | | | | |
CDO/CLO | | $ | 15.5 | | Discounted cash flow | | Prepayment rate | | 20% (CLOs) |
| | | | | | | Default rate | | 2.55% (CLOs) |
| | | | | | | Recovery rate | | 65% (Loans), 35% (High yield bonds),
45% (Investment grade bonds) |
| | | | | | | Reinvestment spread | | 3 mo LIBOR + 400bps (CLOs) |
| | | | | | | | | |
| | | | | | | | | |
Other asset-backed | | $ | 43.5 | | Discounted cash flow | | Yield | | 0.5% - 9.5% (3.41%) |
| | | | | | | | | |
| | | | | Discounted cash flow | | Prepayment rate | | 2% |
| | | | | | | Default rate | | 2.53% for 48 mos then .33% thereafter |
| | | | | | | Recovery rate | | 10% (TRUPS) |
| | | | | | | | | |
| | | | | | | | | |
| | | | | | | | | |
Fair value
investments | | $ | 5.0 | | Discounted cash flow | | Default rate | | 0.24% |
| | | | | | | Recovery rate | | 45% |
| | | | | | | | | |
———————
(1)
Excludes Level 3 assets which are valued based upon non-binding independent third-party valuations or third-party price information for which unobservable inputs are not reasonably available to us.
Significant unobservable inputs used in the fair value measurement of variable annuity GMAB and GMWB liabilities are equity volatility, swap curve, mortality and lapse rates and an adjustment for non-performance risk. Keeping other inputs unchanged, an increase in the equity volatility would increase the fair value of the liability while an increase in the swap curve or CSA would result in a decrease to the fair value of the liability. The impact of changes in mortality and lapse rates are dependent on overall market conditions. The fair value of fixed indexed annuity and indexed universal life embedded derivative related to index credits is calculated using the swap curve, mortality and lapse rates, as well as an adjustment for non-performance risk. Keeping other inputs unchanged, an increase in any of these significant unobservable inputs would result in a decrease of the fixed indexed annuity embedded derivative liability.
F-92
14.
Fair Value of Financial Instruments (continued)
The following table presents quantitative estimates about unobservable inputs used in the fair value measurement of internally priced liabilities.
| | | | | | | | | |
Level 3 Liabilities: | | As of December 31, 2012 |
($ in millions) | | Fair Value | | Valuation Technique(s) | | Unobservable Input | | Range |
| | | | | | | | | |
Embedded derivatives | | $ | 51.2 | | Budget method | | Swap curve | | 0.21% - 2.50% |
(EIA / VED) | | | | | | | Mortality rate | | 75% of A2000 basic table |
| | | | | | | Lapse rate | | 1.00% - 35.00% |
| | | | | | | CSA | | 4.47% |
| | | | | | | | | |
| | | | | | | | | |
Embedded derivatives
(GMAB / GMWB) | | $ | 29.6 | | Risk neutral stochastic
valuation methodology | | Volatility surface | | 11.67% - 50.83% |
| | | | | | | Swap curve | | 0.36% - 3.17% |
| | | | | | | Mortality rate | | 75% of A2000 basic table |
| | | | | | | Lapse rate | | 0.00% - 60.00% |
| | | | | | | CSA | | 4.47% |
| | | | | | | | | |
| | | | | | | | | |
Total Level 3 liabilities | | $ | 80.8 | | | | | | |
| | | | | | | | | |
| | | | | | | | |
Level 3 Assets and Liabilities by Pricing Source: | As of December 31, 2012 |
($ in millions) | Internal(1) | | External(2) | | Total |
Assets | | | | | | | | |
Available-for-sale debt securities | | | | | | | | |
U.S. government and agency (3) | $ | 286.1 | | $ | 10.6 | | $ | 296.7 |
State and political subdivision | | 107.4 | | | 105.0 | | | 212.4 |
Foreign government | | — | | | 45.8 | | | 45.8 |
Corporate | | 2,888.9 | | | 923.4 | | | 3,812.3 |
CMBS | | — | | | 89.7 | | | 89.7 |
RMBS | | — | | | 709.3 | | | 709.3 |
CDO/CLO | | 15.5 | | | 208.2 | | | 223.7 |
Other asset-backed | | 43.5 | | | 266.4 | | | 309.9 |
Available-for-sale equity securities | | — | | | 32.7 | | | 32.7 |
Fair value investments | | 5.0 | | | 148.3 | | | 153.3 |
Total assets | $ | 3,346.4 | | $ | 2,539.4 | | $ | 5,885.8 |
Liabilities | | | | | | | | |
Embedded derivatives | $ | 80.8 | | $ | — | | $ | 80.8 |
Total liabilities | $ | 80.8 | | $ | — | | $ | 80.8 |
———————
(1)
Represents valuations reflecting both internally-derived and market inputs, as well as third-party information or quotes.
(2)
Represents unadjusted prices from independent pricing services, third-party financial statements and independent indicative broker quotes where pricing inputs are not readily available.
(3)
Includes securities whose underlying collateral is an obligation of a U.S. government entity.
F-93
14.
Fair Value of Financial Instruments (continued)
| | | | | | | | |
Level 3 Assets and Liabilities by Pricing Source: | As of December 31, 2011 |
($ in millions) | As restated and amended |
| Internal(1) | | External(2) | | Total |
Assets | | | | | | | | |
Available-for-sale debt securities | | | | | | | | |
U.S. government and agency (3) | $ | 315.4 | | $ | 20.8 | | $ | 336.2 |
State and political subdivision | | 30.9 | | | 85.7 | | | 116.6 |
Foreign government | | 10.4 | | | 41.4 | | | 51.8 |
Corporate | | 2,662.8 | | | 838.7 | | | 3,501.5 |
CMBS | | — | | | 100.6 | | | 100.6 |
RMBS | | — | | | 944.2 | | | 944.2 |
CDO/CLO | | 199.3 | | | 33.1 | | | 232.4 |
Other asset-backed | | 59.1 | | | 276.4 | | | 335.5 |
Available-for-sale equity securities | | — | | | 29.4 | | | 29.4 |
Fair value investments | | 37.9 | | | 106.9 | | | 144.8 |
Total assets | $ | 3,315.8 | | $ | 2,477.2 | | $ | 5,793.0 |
Liabilities | | | | | | | | |
Embedded derivatives | $ | 84.5 | | $ | — | | $ | 84.5 |
Total liabilities | $ | 84.5 | | $ | — | | $ | 84.5 |
———————
(1)
Represents valuations reflecting both internally-derived and market inputs, as well as third-party information or quotes.
(2)
Represents unadjusted prices from independent pricing services, third-party financial statements and independent indicative broker quotes where pricing inputs are not readily available.
(3)
Includes securities whose underlying collateral is an obligation of a U.S. government entity.
Financial instruments not carried at fair value
The Company is required by U.S. GAAP to disclose the fair value of certain financial instruments including those that are not carried at fair value. The following table discloses the Company’s financial instruments where the carrying amounts and fair values differ:
| | | | | | | | | | | | | |
Carrying Amounts and Fair Values | | | As of December 31, |
of Financial Instruments: | | | 2012 | | 2011 |
($ in millions) | Fair Value | | | | As restated and amended |
| Hierarchy | | Carrying | | Fair | | Carrying | | Fair |
| Level | | Value | | Value | | Value | | Value |
Financial assets: | | | | | | | | | | | | | |
Policy loans | Level 3 | | $ | 2,354.7 | | $ | 2,342.8 | | $ | 2,379.3 | | $ | 2,367.7 |
Cash and cash equivalents | Level 1 | | | 246.4 | | | 246.4 | | | 168.2 | | | 168.2 |
| | | | | | | | | | | | | |
Financial liabilities: | | | | | | | | | | | | | |
Investment contracts | Level 3 | | $ | 3,040.7 | | $ | 3,045.9 | | $ | 2,432.3 | | $ | 2,443.5 |
Surplus notes | Level 3 | | | 126.1 | | | 95.0 | | | 174.2 | | | 126.9 |
Senior unsecured bonds | Level 2 | | | 252.7 | | | 217.1 | | | 252.7 | | | 195.1 |
Fair value of policy loans
The fair value of fixed rate policy loans is calculated using a discounted cash flow model based upon current U.S. Treasury rates and historical loan repayment patterns. For floating rate policy loans the fair value is the amount due, excluding interest, as of the reporting date.
F-94
14.
Fair Value of Financial Instruments (continued)
Fair value of investment contracts
We determine the fair value of guaranteed interest contracts by using a discount rate based upon the appropriate U.S. Treasury rate to calculate the present value of projected contractual liability payments through final maturity. We determine the fair value of deferred annuities and supplementary contracts without life contingencies with an interest guarantee of one year or less at the amount of the policy reserve. In determining the fair value of deferred annuities and supplementary contracts without life contingencies with interest guarantees greater than one year, we use a discount rate based upon the appropriate U.S. Treasury rate to calculate the present value of the projected account value of the policy at the end of the current guarantee period.
Deposit type funds, including pension deposit administration contracts, dividend accumulations and other funds left on deposit not involving life contingencies, have interest guarantees of less than one year for which interest credited is closely tied to rates earned on owned assets. For these liabilities, we assume fair value to be equal to the stated liability balances.
The fair value of these investment contracts are categorized as Level 3.
Indebtedness
Fair value of our senior unsecured bonds is based upon quoted market prices. The fair value of surplus notes is determined with reference to the fair value of our senior unsecured bonds including consideration of the different features in the two securities.
15.
Income Taxes
Phoenix and its subsidiaries file a consolidated U.S. Federal income tax return. The Company also files combined, unitary and separate income tax returns in various states.
| | | | | | | | |
Significant Components of Income Taxes from Continuing Operations: | Years Ended December 31, |
($ in millions) | 2012 | | 2011 | | 2010 |
| | | As restated | | As restated |
| | | and amended | | and amended |
| | | | | | | | |
Current | | | | | | | | |
U.S. | $ | 15.6 | | $ | 12.3 | | $ | 4.1 |
Foreign | | — | | | — | | | — |
Deferred | | | | | | | | |
U.S. | | (19.3) | | | — | | | (14.4) |
Foreign | | — | | | — | | | |
Total income tax expense (benefit) | $ | (3.7) | | $ | 12.3 | | $ | (10.3) |
F-95
15.
Income Taxes (continued)
| | | | | | | | |
Reconciliation of Effective Income Tax Rate: | Years Ended December 31, |
($ in millions) | 2012 | | 2011 | | 2010 |
| | | As restated | | As restated |
| | | and amended | | and amended |
Income (loss) from continuing operations before income taxes: | | | | | | | | |
U.S. | $ | (156.0) | | $ | 2.7 | | $ | (41.6) |
Foreign | | — | | | — | | | — |
Total | $ | (156.0) | | $ | 2.7 | | $ | (41.6) |
| | | | | | | | |
Income tax expense (benefit) at statutory rate of 35% | $ | (54.6) | | $ | 1.0 | | $ | (14.5) |
Dividend received deduction | | (2.5) | | | (3.6) | | | (0.9) |
Expiration of tax attribute carryovers | | 5.6 | | | — | | | 4.3 |
Low income housing tax credit | | — | | | — | | | (1.0) |
Valuation allowance increase (release) | | 48.4 | | | 14.3 | | | 3.3 |
Realized losses (gains) on available-for-sale securities pledged as collateral | | — | | | — | | | — |
State income taxes (benefit) | | — | | | (2.2) | | | (2.7) |
Other, net | | (0.6) | | | 2.8 | | | 1.2 |
Income tax expense (benefit) applicable to continuing operations | $ | (3.7) | | $ | 12.3 | | $ | (10.3) |
Effective income tax rates | | 2.4% | | | 455.5% | | | 24.8% |
| | | | | | | | |
Allocation of Income Taxes: | Years Ended December 31, |
($ in millions) | 2012 | | 2011 | | 2010 |
| | | As restated | | As restated |
| | | and amended | | and amended |
| | | | | | | | |
Income tax expense (benefit) from continuing operations | $ | (3.7) | | $ | 12.3 | | $ | (10.3) |
Income tax from OCI: | | | | | | | | |
Unrealized | | 90.9 | | | 0.3 | | | 87.0 |
Pension | | — | | | — | | | — |
Policy dividend obligation & deferred policy acquisition cost | | — | | | — | | | — |
Other | | — | | | — | | | — |
Income tax related to cumulative effect of change in accounting | | — | | | — | | | 3.1 |
Income tax expense (benefit) from discontinued operations | | (1.5) | | | (2.4) | | | — |
Total income tax recorded to all components of income | $ | 85.7 | | $ | 10.2 | | $ | 79.8 |
| | | | | |
Deferred Income Tax Balances Attributable to Temporary Differences: | Years Ended December 31, |
($ in millions) | 2012 | | 2011 |
| | | As restated |
| | | and amended |
Deferred income tax assets | | | | | |
Future policyholder benefits | $ | 637.2 | | $ | 505.0 |
Unearned premiums / deferred revenues | | 57.0 | | | 59.5 |
Employee benefits | | 128.0 | | | 122.6 |
Net operating and capital loss carryover benefits | | 244.0 | | | 276.3 |
Foreign tax credits carryover benefits | | 2.2 | | | 2.0 |
Alternative minimum tax credits | | 9.4 | | | 14.6 |
General business tax credits | | 31.5 | | | 35.5 |
Other | | 16.2 | | | 14.3 |
Available-for-sale debt securities | | 49.4 | | | 120.6 |
Subtotal | | 1,174.9 | | | 1,150.4 |
Valuation allowance | | (523.3) | | | (408.4) |
Total deferred income tax assets, net of valuation allowance | | 651.6 | | | 742.0 |
| | | | | |
Deferred tax liabilities | | | | | |
Deferred policy acquisition costs | | 191.8 | | | 254.0 |
Accrued liabilities | | 348.8 | | | 291.8 |
Investments | | 61.6 | | | 75.6 |
Gross deferred income tax liabilities | | 602.2 | | | 621.4 |
Net deferred income tax assets | $ | 49.4 | | $ | 120.6 |
F-96
15.
Income Taxes (continued)
As of December 31, 2012, we performed our assessment of the realization of deferred tax assets. This assessment included consideration of all available evidence – both positive and negative – weighted to the extent the evidence was objectively verifiable. Due primarily to the existence of significant negative evidence as well as the weight given to the objective nature of the cumulative losses in recent years, and after consideration of all available evidence, we concluded that our estimates of future taxable income, timing of the reversal of existing taxable temporary differences and certain tax planning strategies did not provide sufficient positive evidence to assert that it is more likely than not that certain deferred tax assets would be realizable. To the extent the Company can demonstrate the ability to generate sustained profitability in the future, the valuation allowance could potentially be reversed resulting in a benefit to income tax expense.
As of December 31, 2012, we concluded that our estimates of future taxable income, certain tax planning strategies and other sources of income did not constitute sufficient positive evidence to assert that it is more likely than not that certain deferred tax assets would be realizable. Accordingly, a valuation allowance of $523.3 million has been recorded on net deferred tax assets of $572.7 million. The remaining deferred tax asset of $49.4 million attributable to available-for-sale debt securities with gross unrealized losses does not require a valuation allowance due to our ability and intent to hold these securities until recovery of principal value through sale or contractual maturity, thereby avoiding the realization of taxable losses. This conclusion is consistent with prior periods. The impact of the valuation allowance on the allocation of tax to the components of the financial statements included an increase of $48.4 million in continuing operations, an increase of $55.1 million in OCI-related deferred tax balances and an increase of $6.0 million recorded to discontinued operations.
The tax provision reported in continuing operations of $(3.7) million consists primarily of a deferred tax benefit of $24.7 million that results from the application of ASC 740 intraperiod allocation rules. These rules allow for the benefitting of current year losses in continuing operations when an increase to the valuation allowance is avoided due to the existence of current year income elsewhere reported in the financial statements (e.g., discontinued operations, other comprehensive income). Additionally, current tax expense of $15.6 million was recognized related to the accrual of regular taxes, offset by available credits up to the alternative minimum tax liability.
As of December 31, 2012, the Company has $244.0 million of net operating and capital loss carryovers. Of this amount, $130.0 million related to $373.0 million of federal net operating losses that are scheduled to expire between the years 2021 and 2032. An additional $105.0 million related to $301.0 million of federal capital losses that are scheduled to expire between the years 2013 and 2016, with $205.0 million and $58.0 million expiring in 2013 and 2014, respectively. The remaining amount of $9.0 million is attributable to state income tax net operating losses.
As of December 31, 2012, we had deferred income tax assets of $31.5 million related to general business tax credit carryovers, which are expected to expire between the years 2022 and 2031. Additionally, we had deferred income tax assets of $9.4 million related to alternative minimum tax credit carryovers which do not expire.
The Company is no longer subject to U.S. federal income tax examinations by tax authorities for years before 2011. During 2012, the Company resolved examination issues for tax year 2010 which resulted in adjustments to tax attribute carryforwards. No material unanticipated assessments were incurred, and no adjustment to our liability for uncertain tax positions was required.
A reconciliation of the beginning and ending amount of unrecognized tax benefits is as follows:
| | | | | | | | |
Reconciliation of the Beginning and Ending Amount of Unrecognized Tax Benefits: | 2012 | | 2011 | | 2010 |
($ in millions) | | | | | | | | |
Balance, beginning of period | $ | — | | $ | — | | $ | 0.1 |
Reductions for tax positions of prior years | | — | | | — | | | (0.1) |
Settlements with taxing authorities | | — | | | — | | | — |
Balance, end of period | $ | — | | $ | — | | $ | — |
F-97
15.
Income Taxes (continued)
Management believes that adequate provisions have been made in the financial statements for any potential assessments that may result from tax examinations and other tax related matters for all open tax years. Based upon the timing and status of our current examinations by taxing authorities, we do not believe that it is reasonably possible that any changes to the balance of unrecognized tax benefits occurring within the next 12 months will result in a significant change to the results of operations, financial condition or liquidity.
The Company recognizes interest and penalties as income tax expense and accrued interest and penalties in the related income tax liability. As of December 31, 2012 and December 31, 2011, the Company’s liability for interest and penalties was $0. The Company incurred a $1.0 million expense related to interest and penalties during 2012, 2011 and 2010.
16.
Accumulated Other Comprehensive Income
Changes in each component of AOCI attributable to the Company for the years ended December 31 are as follows below (net of tax):
| | | | | | | | | | | |
Accumulated Other Comprehensive Income (Loss): | Net Unrealized Investment Losses | | Non-Credit Portion of OTTI Losses Recognized in OCI | | Net Pension Liability Adjustments | | Total |
($ in millions) |
|
|
|
As restated and amended (1) | | | | | | | | | | | |
Balance, December 31, 2010 | $ | 126.8 | | $ | (82.5) | | $ | (200.5) | | $ | (156.2) |
Change in component during the year | | 46.6 | | | (22.0) | | | (99.1) | | | (74.5) |
Balance, December 31, 2011 | | 173.4 | | | (104.5) | | | (299.6) | | | (230.7) |
Change in component during the year | | (21.3) | | | 24.1 | | | (21.4) | | | (18.6) |
Balance, December 31, 2012 | $ | 152.1 | | $ | (80.4) | | $ | (321.0) | | $ | (249.3) |
———————
(1)
Except for the change in component during 2012 and the balance as of 2012.
17.
Employee Benefit Plans and Employment Agreements
Pension and other post-employment benefits
We provide our employees with post-employment benefits that include retirement benefits, through pension and savings plans, and other benefits, including health care and life insurance.
We have three defined benefit plans covering our employees. The employee pension plan provides benefits up to the amount allowed under the Internal Revenue Code. The two supplemental plans provide benefits in excess of the primary plan. Retirement benefits under the plans are a function of years of service and compensation. Effective March 31, 2010, all benefit accruals under all of our funded and unfunded defined benefit plans were frozen. This change was announced in 2009 and a curtailment was recognized at that time for the reduction in the expected years of future service.
The employee pension plan is funded with assets held in a trust. The assets within the plan include corporate and government debt securities, equity securities, real estate and private equity partnerships. The supplemental plans are unfunded. Upon a change in control (as defined in the plan) of The Phoenix Companies, Inc., we are required to make an irrevocable contribution to a trust to fund the benefits payable under the supplemental plans.
F-98
17.
Employee Benefit Plans and Employment Agreements (continued)
Assumptions Related to Pension and Postretirement Employee Benefit Plans
Pursuant to accounting principles related to the Company’s pension and other postretirement obligations to employees under its various benefit plans, the Company is required to make assumptions in order to calculate the related liabilities and expenses each period. The assumptions used in calculating the benefit obligations and the net amount recognized for the years ended December 31, 2012, 2011 and 2010 are presented in the following tables.
| | | | | |
Principal Rates and Assumptions: | Years Ended December 31, |
| 2012 | | 2011 | | 2010 |
| | | As restated | | As restated |
| | | and amended | | and amended |
Assumptions Used to Determine Benefit Obligations | | | | | |
Projected benefit obligation discount rate – Employee Plan | 3.98% | | 4.53% | | 5.32% |
Projected benefit obligation discount rate – Supplemental Plan | 3.81% | | 4.39% | | 5.10% |
Projected benefit obligation discount rate – Other Post-Employment Benefits | 3.37% | | 4.11% | | 4.79% |
Future compensation increase rate | N/A(1) | | N/A(1) | | N/A(1) |
Deferred investment gain/loss amortization corridor – Employee Plan | 5.00% | | 5.00% | | 5.00% |
Deferred investment gain/loss amortization corridor – Supplemental Plan | 5.00% | | 5.00% | | 5.00% |
Deferred investment gain/loss amortization corridor – Other Post-Employment Benefits | 10.00% | | 10.00% | | 10.00% |
Future health care cost increase rate, age 64 and younger | 6.00% | | N/A | | N/A |
Future health care cost increase rate, age 65 and older | N/A | | N/A | | N/A |
| | | | | |
Assumptions Used to Determine Benefit Expense | | | | | |
Projected benefit obligation discount rate – Employee Plan | 4.53% | | 5.32% | | 5.79% |
Projected benefit obligation discount rate – Supplemental Plan | 4.39% | | 5.10% | | 5.62% |
Projected benefit obligation discount rate – Other Post-Employment Benefits | 4.11%/3.35% | | 4.79% | | 5.32% |
Future compensation increase rate | N/A(1) | | N/A(1) | | N/A(1) |
Pension plan assets long-term rate of return | 8.00% | | 8.00% | | 8.00% |
Deferred investment gain/loss amortization corridor – Employee Plan | 5.00% | | 5.00% | | 5.00% |
Deferred investment gain/loss amortization corridor – Supplemental Plan | 5.00% | | 5.00% | | 5.00% |
Deferred investment gain/loss amortization corridor – Other Post-Employment Plan | 10.00% | | 10.00% | | 10.00% |
Future health care cost increase rate, age 64 and younger | 6.00% | | N/A | | 8.00% |
Future health care cost increase rate, age 65 and older | N/A | | N/A | | N/A |
———————
(1)
Salary scale by age which grades down from 3.5% to N/A prior to the pension plan freeze effective March 31, 2010. For periods subsequent to the plan freeze, salary scale is not applicable.
The discount rate assumption is developed using a yield curve approach based upon future pension and other postretirement obligations and currently available market and industry data. The yield curve utilized is comprised of bonds rated Aa/AA or higher by Moody’s Investor Services, Standard & Poor’s and Fitch Ratings Ltd. with maturities between one and fifteen or more years.
The health care cost trend rate is a significant assumption which may affect the amounts reported. For example, increasing or decreasing the assumed health care cost trend rates by one percentage point in each year would have a material effect to the accumulated postretirement benefit obligation or to the annual service and interest costs.
The following table sets forth amounts of benefits expected to be paid over the next ten years from the Company’s pension and postretirement benefit plans as of December 31, 2012:
| | | | | | | | | | | |
10-Year Benefit Payout Projection: | Employee Plan | | Supplemental Plans | | Other Postretirement(1) | | Total |
($ in millions) |
| | | | | | | | | | | |
2013 | $ | 32.9 | | $ | 8.3 | | $ | 4.0 | | $ | 45.2 |
2014 | | 33.4 | | | 8.4 | | | 3.8 | | | 45.6 |
2015 | | 33.9 | | | 8.5 | | | 3.6 | | | 46.0 |
2016 | | 34.7 | | | 8.6 | | | 3.4 | | | 46.7 |
2017 | | 35.2 | | | 8.6 | | | 3.2 | | | 47.0 |
2018 to 2022 | | 187.2 | | | 43.8 | | | 13.3 | | | 244.3 |
———————
Includes other individual retirement agreements.
F-99
17.
Employee Benefit Plans and Employment Agreements (continued)
Our investment policy and strategy employs a total return approach combining equities, fixed income, real estate and other assets to maximize the long-term return of the plan assets for a prudent level of risk. Risk tolerance is determined based on consideration of plan liabilities and plan-funded status. The investment portfolio contains a diversified blend of equity, fixed income, real estate and alternative investments. The equity investments are diversified across domestic and foreign markets, across market capitalizations (large, mid and small cap), as well as growth, value and blend. Derivative instruments are not typically used for implementing asset allocation decisions and are not used in conjunction with leverage. Investment performance is measured and monitored on an ongoing basis through quarterly investment portfolio reviews, annual liability measurement and periodic presentations by asset managers included in the plan.
| | | | | |
Employee Pension Plan Asset Allocation: | As of December 31, |
| 2012 | | 2011 |
Asset Category | | | | | |
Equity securities | 61% | | | 58% | |
Debt securities | 31% | | | 30% | |
Real estate | 2% | | | 4% | |
Other | 6% | | | 8% | |
Total | 100% | | | 100% | |
We use a building block approach in estimating the long-term rate of return for plan assets. Historical returns are determined by asset class. The historical relationships between equities, fixed income and other asset classes are reviewed. We apply long-term asset return estimates to the plan’s target asset allocation to determine the weighted-average long-term return. The company applied a consistent approach to the determination of the expected rate of return on plan assets in 2013. The expected rate of return for 2013 is 7.75% for the employee pension plan. Our long-term asset allocation was determined through modeling long-term returns and asset return volatilities. The allocation reflects proper diversification and was reviewed against other corporate pension plans for reasonability and appropriateness.
We use a December 31 measurement date for our pension and other post-employment benefits.
Obligations Related to the Employee Pension Plan
The following tables set forth a reconciliation of beginning and ending balances of the fair value of plan assets, benefit obligation as well as the funded status of the Company’s defined benefit pension plans for the years ended December 31, 2012 and 2011.
| | | | | | | | |
Changes in Plan Assets and Benefit Obligations: | Employee Plan |
($ in millions) | Years Ended December 31, |
| 2012 | | 2011 | | 2010 |
| | | As restated | | As restated |
| | | and amended | | and amended |
Plans’ Assets | | | | | | | | |
Plan assets’ actual return | $ | 55.4 | | $ | 18.4 | | $ | 54.8 |
Employer contributions | | 18.2 | | | 17.3 | | | 25.8 |
Plan disbursements | | (35.4) | | | (32.8) | | | (32.8) |
Change in plan assets | | 38.2 | | | 2.9 | | | 47.8 |
Plan assets, beginning of period | | 437.6 | | | 434.7 | | | 386.9 |
Plans’ assets, end of period | $ | 475.8 | | $ | 437.6 | | $ | 434.7 |
| | | | | | | | |
Plans’ Projected Benefit Obligation | | | | | | | | |
Service and interest cost accrual | $ | (29.6) | | $ | (31.1) | | $ | (32.7) |
Actuarial loss | | (54.3) | | | (72.3) | | | (27.6) |
Plan disbursements | | 35.4 | | | 32.9 | | | 32.8 |
Plan amendments | | — | | | — | | | — |
Change in projected benefit obligation | | (48.5) | | | (70.5) | | | (27.5) |
Projected benefit obligation, beginning of period | | (646.3) | | | (575.8) | | | (548.3) |
Projected benefit obligation, end of period | $ | (694.8) | | $ | (646.3) | | $ | (575.8) |
Plan assets less than projected benefit obligations, end of period | $ | (219.0) | | $ | (208.7) | | $ | (141.1) |
| | | | | | | | |
Accumulated benefit obligation | $ | 694.8 | | $ | 646.3 | | $ | 575.8 |
F-100
17.
Employee Benefit Plans and Employment Agreements (continued)
| | | | | |
Amounts Recognized in Consolidated Balance Sheets: | Employee Plan |
($ in millions) | Years Ended December 31, |
| 2012 | | 2011 |
| | | As restated |
| | | and amended |
| | | | | |
Other liabilities | $ | (219.0) | | $ | (208.7) |
| | | | | | | | |
Amounts Recorded in Accumulated Other Comprehensive Loss as of the end of the | Employee Plan |
period and the related changes in these items during the period are as follows: | Years Ended December 31, |
($ in millions) | 2012 | | 2011 | | 2010 |
| | | As restated | | As restated |
| | | and restated | | and restated |
| | | | | | | | |
Balance, beginning of period | $ | 234.8 | | $ | 151.6 | | $ | 152.6 |
Deferrals for the period | | 33.2 | | | 88.0 | | | 3.4 |
Amortization for the period | | (7.9) | | | (4.8) | | | (4.4) |
Total balance, end of period | $ | 260.1 | | $ | 234.8 | | $ | 151.6 |
| | |
Amounts in Accumulated Other Comprehensive Loss that are Expected to be Recognized | Employee |
as Components of Net Periodic Cost (Credit) During the Next Fiscal Year are as follows: | Plan |
($ in millions) | | |
| | |
Prior service (credit) cost | $ | — |
Net actuarial loss | | 8.7 |
Total | $ | 8.7 |
| | | | | | | | |
Components of Pension Benefit Expense: | Years Ended December 31, |
($ in millions) | 2012 | | 2011 | | 2010 |
| | | As restated | | As restated |
| | | and restated | | and restated |
| | | | | | | | |
Service cost | $ | 0.9 | | $ | 0.9 | | $ | 2.2 |
Interest cost | | 28.7 | | | 30.2 | | | 30.5 |
Plan assets expected return | | (34.2) | | | (34.1) | | | (30.7) |
Net loss amortization | | 7.9 | | | 4.9 | | | 4.4 |
Prior service cost amortization | | — | | | — | | | — |
Pension benefit expense | $ | 3.3 | | $ | 1.9 | | $ | 6.4 |
Funding Status of Employee Pension Plan
The employee pension plan is a qualified plan that is funded with assets held in a trust. It is the Company’s practice to make contributions to the qualified pension plan at least sufficient to avoid benefit restrictions under funding requirements of the Pension Protection Act of 2006. This generally requires the Company to maintain assets that are at least 80% of the plan’s liabilities as calculated under the applicable regulations at the end of the prior year. Under these regulations, the qualified pension plan is currently funded above 80% of the funding target liabilities as of December 31, 2012.
The funded status of the qualified pension plan based on the projected benefit obligations for the years ended December 31, 2012 and 2011 are summarized in the following table:
| | | | | |
Qualified Employee Pension Plan Funded Status: | As of December 31, |
($ in millions) | 2012 | | 2011 |
| | | As restated |
| | | and amended |
| | | | | |
Plan assets, end of year | $ | 475.8 | | $ | 437.6 |
Projected benefit obligation, end of year | | (694.8) | | | (646.3) |
Plan assets less than projected benefit obligations, end of year | $ | (219.0) | | $ | (208.7) |
F-101
17.
Employee Benefit Plans and Employment Agreements (continued)
To meet the above funding objectives, we made contributions to the pension plan totaling $18.2 million and $17.3 million during 2012 and 2011, respectively. Over the next 12 months, we expect to make contributions of approximately $11.4 million from the Company’s operating cash flow. On July 6, 2012, the Surface Transportation Extension Act of 2012, Part II, was enacted into law and was effective immediately. The law includes certain pension funding stabilization provisions, which the Company has taken advantage of in 2012.
Fair Value Measurement—Employee Pension Plan Assets
For a discussion of the methods employed by us to measure the fair value of invested assets, see Note 14 to these financial statements. The following discussion of fair value measurements applies exclusively to our employee pension plan assets.
The estimated fair value of U.S. Treasury and equity securities are included in the amount disclosed in Level 1 as the estimates are based on quoted market prices. For fixed income instruments held by the plan for which quoted market prices are not available, we estimate fair value by discounting debt security cash flows to reflect interest rates currently being offered on similar terms to borrowers of similar credit quality or by quoted market prices of comparable instruments. Accordingly, the estimates of fair value for our fixed income and state and municipal securities are included in the amount disclosed in Level 2 of the hierarchy.
The following table presents the level within the fair value hierarchy at which the financial assets of the Company's employee pension plan are measured on a recurring basis at December 31, 2012.
| | | | | | | | | | | | | | | |
Fair Value of Assets by Type and Level: | As of December 31, 2012 |
($ in millions) | Level 1 | | Level 2 | | Level 3 | | Total |
| | | | | | | | | | | |
Mercer Group Trust | $ | — | | $ | 408.1 | | $ | — | | $ | 408.1 |
Duff & Phelps Real Estate Securities Trust | | — | | | 10.6 | | | — | | | 10.6 |
Total assets at fair value(1) | $ | — | | $ | 418.7 | | $ | — | | $ | 418.7 |
———————
(1)
Excludes $50.1 million in limited partnerships and real estate investments accounted for on the equity method as well as $4.3 million in cash and cash equivalents and money market funds.
The following table presents the level within the fair value hierarchy at which the financial assets of the Company's employee pension plan are measured on a recurring basis at December 31, 2011.
| | | | | | | | | | | | | | | |
Fair Value of Assets by Type and Level: | As of December 31, 2011 |
($ in millions) | Level 1 | | Level 2 | | Level 3 | | Total |
| | | | | | | | | | | |
Equity Securities | | | | | | | | | | | |
Common stocks | $ | 284.4 | | $ | — | | $ | — | | $ | 284.4 |
Phoenix common stock | | 0.6 | | | — | | | — | | | 0.6 |
Debt Securities | | | | | | | | | | | |
Fixed maturities: | | | | | | | | | | | |
Asset-backed | | — | | | 1.3 | | | — | | | 1.3 |
CMO/CMBS | | — | | | 9.9 | | | — | | | 9.9 |
Corporate | | — | | | 31.4 | | | — | | | 31.4 |
Mortgage-backed | | — | | | 17.9 | | | — | | | 17.9 |
Other | | — | | | 6.7 | | | — | | | 6.7 |
U.S. government securities | | 21.6 | | | — | | | — | | | 21.6 |
State & municipal securities | | — | | | 11.1 | | | — | | | 11.1 |
Total assets at fair value(1) | $ | 306.6 | | $ | 78.3 | | $ | — | | $ | 384.9 |
———————
(1)
Excludes $40.4 million in limited partnerships and real estate investments accounted for on the equity method as well as $9.0 million in cash and cash equivalents and money market funds.
Supplemental Plans
The Company also has two supplemental plans that provide benefits to certain executives in excess of the primary plan. These plans are unfunded and represent general obligations of the Company. We fund periodic benefit payments to retirees as they become due under these plans from cash flow from operations.
F-102
17.
Employee Benefit Plans and Employment Agreements (continued)
The following tables set forth a reconciliation of beginning and ending balances of the projected benefit obligation of the Company’s supplemental plans for the years ended December 31, 2012 and 2011.
| | | | | | | | |
Changes in Plan Assets and Benefit Obligations: | Supplemental Plan |
($ in millions) | Years Ended December 31, |
| 2012 | | 2011 | | 2010 |
| | | As restated | | As restated |
| | | and amended | | and amended |
Plans’ Projected Benefit Obligation | | | | | | | | |
Service and interest cost accrual | $ | (6.1) | | $ | (6.6) | | $ | (7.7) |
Actuarial gain (loss) | | (12.7) | | | (12.4) | | | (8.7) |
Plan disbursements | | 9.8 | | | 13.9 | | | 13.9 |
Plan amendments | | — | | | — | | | — |
Change in projected benefit obligation | | (9.0) | | | (5.1) | | | (2.5) |
Projected benefit obligation, beginning of period | | (141.9) | | | (136.8) | | | (134.3) |
Projected benefit obligation, end of period | $ | (150.9) | | $ | (141.9) | | $ | (136.8) |
Plan assets less than projected benefit obligations, end of period | $ | (150.9) | | $ | (141.9) | | $ | (136.8) |
| | | | | | | | |
Accumulated benefit obligation | $ | 150.9 | | $ | 141.9 | | $ | 136.8 |
| | | | | |
Amounts Recognized in Consolidated Balance Sheets: | Supplemental Plan |
($ in millions) | Years Ended December 31, |
| 2012 | | 2011 |
| | | As restated |
| | | and amended |
| | | | | |
Other liabilities | $ | (150.9) | | $ | (141.9) |
| | | | | | | | |
Amounts Recorded in Accumulated Other Comprehensive Loss as of the end of the | Supplemental Plan |
period and the related changes in these items during the period are as follows: | Years Ended December 31, |
($ in millions) | 2012 | | 2011 | | 2010 |
| | | As restated | | As restated |
| | | and restated | | and restated |
| | | | | | | | |
Balance, beginning of period | $ | 66.9 | | $ | 56.6 | | $ | 49.5 |
Deferrals for the period | | 12.7 | | | 12.3 | | | 8.7 |
Amortization for the period | | (2.4) | | | (2.0) | | | (1.6) |
Total balance, end of period | $ | 77.2 | | $ | 66.9 | | $ | 56.6 |
| | |
Amounts in accumulated other comprehensive loss that are expected to be recognized | Supplemental |
as components of net periodic cost (credit) during the next fiscal year are as follows: | Plan |
($ in millions) | | |
| | |
Prior service (credit) cost | $ | — |
Net actuarial loss | | 2.9 |
Total | $ | 2.9 |
| | | | | | | | |
Components of Pension Benefit Expense: | Years Ended December 31, |
($ in millions) | 2012 | | 2011 | | 2010 |
| | | As restated | | As restated |
| | | and amended | | and amended |
| | | | | | | | |
Service cost | $ | — | | $ | — | | $ | 0.4 |
Interest cost | | 6.1 | | | 6.6 | | | 7.3 |
Plan assets expected return | | — | | | — | | | — |
Net loss amortization | | 2.5 | | | 2.0 | | | 1.7 |
Prior service cost amortization | | — | | | — | | | — |
Pension benefit expense | $ | 8.6 | | $ | 8.6 | | $ | 9.4 |
F-103
17.
Employee Benefit Plans and Employment Agreements (continued)
Other Post-Employment Benefits
We have historically provided our employees with other post-employment benefits that include health care and life insurance. In December 2009, we announcedthe decision to eliminate retiree medical coverage for active employees whose age plus years of service did not equal at least 65 as of March 31, 2010. Employees who remain eligible must still meet certain other defined criteria to receive benefits.
In addition, the cap on the Company’s contribution of retiree medical costs for retirees under the age of 65 was reduced beginning with the 2011 plan year. In October 2012, we announced that effective January 1, 2013, the Company's contribution for pre-65 retiree medical and for post-65 retiree medical was reduced per covered member. These decisions affected retiree medical contributions for both past service and active employees. Curtailments were recognized as a result of the plan changes.
This decision affected benefits attributed to past service for employees that were not grandfathered into retiree medical coverage as well as the expected years of future service for the reduction in the cap for retiree medical costs. Both a negative plan amendment and curtailment were recognized as a result of the plan changes.
| | | | | | | | |
Components of Postretirement Benefit Expense: | Years Ended December 31, |
($ in millions) | 2012 | | 2011 | | 2010 |
| | | | | | | | |
Service cost | $ | 0.3 | | $ | 0.4 | | $ | 0.4 |
Interest cost | | 1.9 | | | 2.7 | | | 3.0 |
Net gain amortization | | (0.2) | | | — | | | (0.1) |
Prior service cost amortization | | (1.6) | | | (2.1) | | | (2.1) |
Other postretirement benefit expense | $ | 0.4 | | $ | 1.0 | | $ | 1.2 |
| | | | | | | | |
Changes in Plan Accumulated Benefit Obligation: | Years Ended December 31, |
($ in millions) | 2012 | | 2011 | | 2010 |
| | | As restated | | As restated |
| | | and amended | | and amended |
| | | | | | | | |
Service and interest cost accrued | $ | (2.1) | | $ | (3.1) | | $ | (3.4) |
Actuarial gain (loss) | | 3.9 | | | (3.8) | | | 0.3 |
Plan disbursements | | 5.3 | | | 6.2 | | | 6.0 |
Plan amendments | | 11.9 | | | 0.4 | | | — |
Change in projected benefit obligation | | 19.0 | | | (0.3) | | | 2.9 |
Accumulated benefit obligations, beginning of period | | (59.6) | | | (59.3) | | | (62.2) |
Accumulated benefit obligations, end of period | $ | (40.6) | | $ | (59.6) | | $ | (59.3) |
| | | | | |
Amounts Recognized in Consolidated Balance Sheets: | As of December 31, |
($ in millions) | 2012 | | 2011 |
| | | As restated |
| | | and amended |
| | | | | |
Other liabilities | $ | (40.6) | | $ | (59.6) |
F-104
17.
Employee Benefit Plans and Employment Agreements (continued)
| | | | | | | | |
Amounts Recorded in Accumulated Other Comprehensive Loss as of the end of the | Other Post-Employment Benefits |
period and the related changes in these items during the period are as follows: | Years Ended December 31, |
($ in millions) | 2012 | | 2011 | | 2010 |
| | | As restated | | As restated |
| | | and restated | | and restated |
| | | | | | | | |
Balance, beginning of period | $ | (0.4) | | $ | (4.3) | | $ | (4.1) |
Deferrals for the period – net actuarial loss / (gain) | | (4.0) | | | 3.9 | | | (0.3) |
Amortization for the period – net actuarial loss / (gain) | | 0.1 | | | — | | | 0.1 |
Subtotal, end of period | | (4.3) | | | (0.4) | | | (4.3) |
| | | | | | | | |
Balance, beginning of period | | (1.7) | | | (3.4) | | | (5.4) |
Deferrals for prior service cost / (credit) | | (11.9) | | | (0.4) | | | — |
Amortization for prior service cost / (credit) | | 1.6 | | | 2.1 | | | 2.0 |
Subtotal, end of period | | (12.0) | | | (1.7) | | | (3.4) |
Total balance, end of period | $ | (16.3) | | $ | (2.1) | | $ | (7.7) |
The postretirement benefit plan is unfunded and had projected benefit obligations of $40.6 million and $59.6 million as of December 31, 2012 and 2011, respectively. We fund periodic benefit payments under this plan from cash flows from operations as they become due.
Gain amounts in accumulated other comprehensive loss that are expected to be recognized as components of net periodic postretirement credits for the next fiscal year are $1.2 million, all of which relate to prior service cost.
Employment Agreements and Restructuring Expense
We have entered into agreements with certain key executives of the Company that will, in certain circumstances, provide separation benefits upon the termination of the executive’s employment by the Company for reasons other than death, disability, cause or retirement, or by the executive for “good reason,” as defined in the agreements. The agreements provide this protection only if the termination occurs following (or is effectively connected with) the occurrence of a change of control, as defined in the agreements. As soon as reasonably possible upon a change in control, as so defined, we are required to make an irrevocable contribution to a trust in an amount sufficient to pay benefits due under these agreements.
401(k) Plan
The Company’s employees are eligible to participate in a 401(k) plan. Under this plan, employees may contribute up to 60% of eligible base salary, and then the Company matches up to 6% of an employee’s contributions at certain percentage levels. Certain employees can elect to defer a certain percentage of their base pay into the Company’s Non-Qualified Excess Investment Plan and receive a Company match based upon the same formula in our 401(k) plan. All balances under this plan are unfunded general obligations of the Company, which the Company hedges by making contributions to a trust subject to the claims of our creditors in certain circumstances. Expense recognized related to the 401(k) plan was $3.4 million, $5.0 million and $5.1 million in 2012, 2011 and 2010, respectively.
Effective April 1, 2010, employees of the Company (except Saybrus employees) are eligible to receive an annual employer discretionary contribution according to the 401(k) plan terms.
On November 8, 2012, purchases in the Company stock fund were suspended due to the restatement.
Additional Retirement Benefits
We have agreements with certain of our employees that provide for additional retirement benefits. In the year ended December 31, 2012, the estimated liability for these agreements was $18.4 million.
F-105
18.
Share-Based Payments
We provide share-based compensation to certain of our employees and non-employee directors, as further described below. The compensation cost that has been charged against income for these plans is summarized in the following table:
| | | | | | | | |
Share-based Compensation Plans: | Years Ended December 31, |
($ in millions) | 2012 | | 2011 | | 2010 |
| | | As restated | | As restated |
| | | and amended | | and amended |
| | | | | | | | |
Compensation cost charged to income from continuing operations | $ | 2.6 | | $ | 4.4 | | $ | 5.6 |
Income tax benefit before valuation allowance | $ | (0.9) | | $ | (0.9) | | $ | (1.1) |
We did not capitalize any cost of stock-based compensation during the three years ended December 31, 2012.
Stock options
Each option, once vested, entitles the holder to purchase one share of our common stock. The employees’ options vest over a three-year period while the directors’ options vest immediately. Once vested, options become exercisable. For stock options awarded, we recognize expense over the vesting period equal to their fair value at issuance. We calculate the fair value of options using the Black-Scholes option valuation model. The Stock Incentive Plan authorizes the issuance to officers and employees of up to that number of options equal to 5% of the total number of common stock shares outstanding immediately after the initial public offering in June 2001, or approximately 262,500 shares, plus an additional 1%, or approximately 52,500 shares, for officers and employees, less the number of share options issuable under the Directors’ Stock Plan. The Directors’ Stock Plan authorizes the issuance to non-employee directors of up to that number of options equal to 0.5%, or approximately 26,250 shares, of the total number of common stock shares outstanding immediately after the initial public offering in June 2001, plus 25,000 shares, bringing the total to approximately 51,250 shares. There were 2,053 stock options granted during 2012.
| | | | | | | |
Key Assumptions Used in Option Valuation: | Years Ended December 31, |
| 2012 | | 2011 | | 2010 |
| | | | | | | |
Expected term (1) | | 10 years | | N/A | | | 6 years |
Weighted-average expected volatility | | 37.7% | | | | | 31.0% |
Weighted-average interest rate | | 1.9% | | | | | 3.9% |
Weighted-average common share dividend yield | | 0.0% | | | | | 0.0% |
———————
(1)
Insufficient historical share option exercise experience exists. Therefore, a simplified method for estimating a stock option term was used.
A summary of the stock option activity as of and for the year ended December 31, 2012 is as follows:
| | | | | | | | | |
Summary of Stock Option Activity:(1) | Year Ended December 31, 2012 |
($ in millions, except share data) | Common Shares | | Weighted- Average Exercise Price | | Weighted- Average Remaining Contractual Term | | Aggregate Intrinsic Value |
|
|
|
|
| | | | | | | | | |
Outstanding, beginning of period | 177,798 | | $ | 228.36 | | 2.56 | | $ | — |
Granted | 2,053 | | | 34.38 | | — | | | — |
Exercised | (250) | | | 10.60 | | — | | | — |
Forfeited | (88,202) | | | 266.56 | | — | | | — |
Canceled/expired | (210) | | | 56.80 | | — | | | — |
Outstanding, end of period | 91,189 | | $ | 188.04 | | 1.57 | | $ | — |
Vested and exercisable, end of period | 86,089 | | $ | 196.42 | | 1.28 | | $ | — |
———————
(1)
All share amounts for all periods reflect the 1-for-20 reverse stock split, which was effective August 10, 2012. See Note 11 to our consolidated financial statements for additional information on the reverse stock split.
F-106
18.
Share-Based Payments (continued)
| | | | | | | | | | | | | | |
Weighted-Average Fair Value:(1) | Years Ended December 31, |
| 2012 | | 2011 | | 2010 |
| Common | | Grant Date | | Common | | Grant Date | | Common | | Grant Date |
| Shares | | Fair Value | | Shares | | Fair Value | | Shares | | Fair Value |
| | | | | | | | | | | | | | |
Options granted | 2,053 | | $ | 9.03 | | 0 | | $ | — | | 11,020 | | $ | 28.40 |
———————
(1)
All share amounts for all periods reflect the 1-for-20 reverse stock split, which was effective August 10, 2012. See Note 11 to our consolidated financial statements for additional information on the reverse stock split.
There were 250 options exercised for the year ended December 31, 2012. There were no options exercised for the years ended December 31, 2011 and 2010. We issue new shares to satisfy option exercises.
As of December 31, 2012, $0.1 million of total compensation cost related to non-vested stock options was unrecognized. That cost is expected to be recognized over a weighted-average period of 1.4 years.
In addition to the stock option activity above, 12,500 stock options are subject to future issuance based on the achievement of market criteria established under certain of our incentive plans. The market contingencies for these stock options will be resolved no later than June 30, 2014.
Restricted stock units and Restricted stock
We have RSU plans under which we grant RSUs to employees and non-employee directors. RSUs granted to employees are performance-vested, time-vested or a combination thereof. Each RSU, once vested, entitles the holder to one share of our common stock when the restriction expires. We recognize compensation expense over the vesting period of the RSUs, which is generally three years for each award.
A summary of the RSU activity as of and for the year ended December 31, 2012 is as follows:
| | | | | | | | | |
Summary of RSU Activity:(1) | Years Ended December 31, 2012 |
| Time-Vested | | Performance-Contingent |
| | | Weighted- | | | | Weighted- |
| | | Average | | | | Average |
| | | Grant Date | | | | Grant Date |
| Number | | Fair Value | | Number | | Fair Value |
| | | | | | | | | |
Outstanding, beginning of period | 123,377 | | $ | 56.51 | | 22,655 | | $ | 44.04 |
Awarded | 16,497 | | | 26.95 | | — | | | — |
Adjustment for performance results | — | | | — | | 5,119 | | | 50.40 |
Conversion of performance-contingent awards | — | | | — | | — | | | — |
Converted to common shares/applied to taxes | (3,726) | | | 46.27 | | — | | | — |
Forfeited | (1,254) | | | 42.45 | | (10,750) | | | 29.60 |
Outstanding, end of period | 134,894 | | $ | 53.31 | | 17,024 | | $ | 55.07 |
———————
(1)
All share amounts for all periods reflect the 1-for-20 reverse stock split, which was effective August 10, 2012. See Note 11 to our consolidated financial statements for additional information on the reverse stock split.
The shares underlying these awards will be issued upon vesting unless the participant elects to defer receipt. Deferred awards will be issued on each employee’s and each director’s respective termination or retirement. We issue new shares to satisfy RSU conversions.
F-107
18.
Share-Based Payments (continued)
| | | | | | | | | | | | | | |
RSUs Awarded:(1) | Years Ended December 31, |
| 2012 | | 2011 | | 2010 |
| | | Weighted- | | | | Weighted- | | | | Weighted- |
| | | Average | | | | Average | | | | Average |
| | | Grant Date | | | | Grant Date | | | | Grant Date |
| Number | | Fair Value | | Number | | Fair Value | | Number | | Fair Value |
| | | | | | | | | | | | | | |
Time-vested RSUs awarded | 16,497 | | $ | 26.95 | | 21,426 | | $ | 36.20 | | 17,328 | | $ | 46.40 |
Performance-contingent
RSUs awarded | — | | $ | — | | 11,905 | | $ | 50.40 | | 69,475 | | $ | 56.80 |
———————
(1)
All share amounts for all periods reflect the 1-for-20 reverse stock split, which was effective August 10, 2012. See Note 11 to our consolidated financial statements for additional information on the reverse stock split.
| | | | | | | | |
RSU Values: | Years Ended December 31, |
($ in millions) | 2012 | | 2011 | | 2010 |
| | | | | | | | |
Intrinsic value of RSUs converted | $ | 0.1 | | $ | 0.7 | | $ | 1.4 |
Total grant date fair value of RSUs vested converted to common shares | $ | 0.2 | | $ | 2.8 | | $ | 4.4 |
As of December 31, 2012, $1.1 million of total compensation cost related to service-vested RSU awards was unrecognized. That cost is expected to be recognized over a weighted-average period of 1.0 years.
There are no RSUs subject to future issuance based on the achievement of market criteria established under certain of our incentive plans.
Liability Awards
The Company has issued cash-settled awards with payouts linked to the performance of the Company’s stock to certain employees and executive officers. Each recipient is granted a base cash payout that is adjusted according to a formula that integrates the current stock price and the achievement of certain other Company performance criteria. Cash-settled awards are recorded as liabilities and remeasured at the end of each reporting period until final payout is made. Unlike stock-settled awards, which have a fixed grant date fair value, the fair value of the unsettled liability awards are remeasured based upon an updated calculation of the fair value of the award given changes in the criteria noted above.
During the years ended December 31, 2012 and 2011, the Company issued awards that are intended to be settled in cash. As of December 31, 2012 and 2011, a liability of $1.7 million and $3.9 million, respectively was accrued for these awards. No cash payments were made related to these awards for the years ended December 31, 2012 and 2011.
19.
Earnings Per Share
| | | | | |
Shares Used in Calculation of Earnings Per Share:(1) | Years Ended December 31, |
(shares in thousands) | 2012 | | 2011 | | 2010 |
| | | | | |
Weighted-average common shares outstanding | 5,770 | | 5,815 | | 5,803 |
Weighted-average effect of dilutive potential common shares: | | | | | |
Restricted stock units | 75 | | 71 | | 15 |
Employee stock options | 1 | | — | | — |
Potential common shares | 76 | | 71 | | 15 |
Less: Potential common shares excluded from calculation due to net losses | (76) | | (71) | | (15) |
Dilutive potential common shares | — | | — | | — |
Weighted-average common shares outstanding, including
dilutive potential common shares | 5,770 | | 5,815 | | 5,803 |
———————
(1)
All share amounts for all periods reflect the 1-for-20 reverse stock split, which was effective August 10, 2012. See Note 11 to our consolidated financial statements for additional information on the reverse stock split.
F-108
19.
Earnings Per Share (continued)
As a result of the net loss from continuing operations for the years ended December 31, 2012, 2011 and 2010, we are required to use basic weighted average common shares outstanding in the calculation of diluted earnings per share for those periods, since the inclusion of shares of restricted stock units and options would have been anti-dilutive to the earnings per share calculation.
On August 10, 2012, a 1-for-20 reverse stock split became effective and an odd lot program was subsequently instituted following the 1-for-20 reverse stock split. The odd lot program terminated as of October 26, 2012.
The reverse stock split reduced the shares of common stock outstanding from approximately 116.0 million to approximately 5.8 million. All weighted-average common shares outstanding for the years ended December 31, 2012, 2011 and 2010, respectively, have been adjusted to reflect the 1-for-20 reverse stock split. See Note 11 to these financial statements for additional information on the reverse stock split.
20.
Segment Information
In managing our business, we analyze segment performance on the basis of operating income. Operating income, as well as components of and financial measures derived from operating income, are non-U.S. GAAP financial measures.
Management believes that these measures provide additional insight into the underlying trends in our operations and are the internal performance measures we use in the management of our operations, including our compensation plans and planning processes. However, our non-U.S. GAAP financial measures should not be considered as substitutes for net income or measures that are derived from or incorporate net income and may be different from similarly titled measures of other companies. Investors should evaluate both U.S. GAAP and non-U.S. GAAP financial measures when reviewing our performance. Operating income is calculated by excluding realized investment gains (losses) as their amount and timing may be subject to management’s investment decisions.
| | | | | | | | |
Segment Information on Revenues: | Years Ended December 31, |
($ in millions) | 2012 | | 2011 | | 2010 |
| | | As restated | | As restated |
| | | and amended | | and amended |
| | | | | | | | |
Life and Annuity (1) | $ | 1,777.1 | | $ | 1,828.8 | | $ | 1,966.8 |
Saybrus Partners (2) | | 22.9 | | | 18.2 | | | 6.0 |
Less: Intercompany revenues (3) | | 10.8 | | | 10.5 | | | 2.5 |
Total revenues | $ | 1,789.2 | | $ | 1,836.5 | | $ | 1,970.3 |
———————
(1)
Includes intercompany interest revenue of $0.6 million, $0.8 million and $0.2 million for the years ended December 31, 2012, 2011 and 2010.
(2)
Includes intercompany commission revenue of $11.4 million, $11.3 million and $2.7 million for the years ended December 31, 2012, 2011 and 2010.
(3)
All intercompany balances are eliminated in consolidating the financial statements.
Life and Annuity derives revenue from premiums, fee income and COI charges and net investment income. Saybrus derives revenue primarily from fees collected for advisory and distribution services.
| | | | | | | | |
Results of Operations by Segment as Reconciled to Consolidated Net Income (Loss): | Years Ended December 31, |
($ in millions) | 2012 | | 2011 | | 2010 |
| | | As restated | | As restated |
| | | and amended | | and amended |
| | | | | | | | |
Life and Annuity operating income (loss) | $ | (160.0) | | $ | 35.9 | | $ | (11.4) |
Saybrus Partners operating income (loss) | | 2.6 | | | (1.3) | | | (19.0) |
Less: Applicable income tax expense (benefit) | | (3.7) | | | 12.3 | | | (10.3) |
Loss from discontinued operations, net of income taxes | | (15.6) | | | (21.6) | | | (3.6) |
Net realized investment losses | | (10.5) | | | (32.1) | | | (11.2) |
Gain on debt repurchase | | 11.9 | | | 0.2 | | | — |
Less: income (loss) attributable to noncontrolling interests | | 0.6 | | | (0.5) | | | (0.5) |
Net loss | $ | (168.5) | | $ | (30.7) | | $ | (34.4) |
F-109
20.
Segment Information (continued)
We have not provided asset information for the segments. The assets attributable to Saybrus are not significant relative to the assets of our consolidated balance sheets and are not utilized by the chief operating decision maker. All third-party interest revenue and interest expense of the Company reside within the Life and Annuity segment.
21.
Discontinued Operations
PFG Holdings, Inc.
On January 4, 2010, we signed a definitive agreement to sell PFG and its subsidiaries, including AGL Life Assurance Company, to Tiptree. Because of the divestiture, these operations are reflected as discontinued operations. On June 23, 2010, we completed the divestiture of PFG and closed the transaction.
The definitive agreement contains a provision requiring us to indemnify Tiptree for any losses due to actions resulting from certain specified acts or omissions associated with the divested business prior to closing. There has been litigation filed that falls within this provision of the agreement but does not name the Company as a party to the litigation. We intend to defend these matters vigorously based on our indemnity commitment. See Note 24 to these financial statements related to contingencies remaining from the sale.
There were no assets or liabilities on the consolidated balance sheets identified as discontinued operations related to PFG at December 31, 2012 and 2011.
During the years ended December 31, 2012, 2011 and 2010, net losses recognized for discontinued operations were $5.7 million, $3.0 million and $1.4 million, respectively, and primarily related to the indemnification of Tiptree.
See Note 4 to these financial statements for additional information.
Phoenix Life and Reassurance Company of New York
Included in the January 4, 2010 agreement with Tiptree was a provision for the purchase of PLARNY pending regulatory approval. On September 24, 2010, approval was obtained from the NYDFS for Tiptree and PFG Holdings Acquisition Corporation to acquire PLARNY. The transaction closed on October 6, 2010. Because of the divestiture, these operations are reflected as discontinued operations. We have reclassified prior period financial statements to conform to this change.
No net income related to PLARNY was recognized during the years ended December 31, 2012 and 2011. Net income of $1.0 million was recognized during the year ended December 31, 2010. Prior to the closing of the transaction, PLARNY made a dividend distribution in the fourth quarter of 2010 of $10.0 million to its parent company, PM Holdings, Inc., in accordance with the sales agreement. A loss of $0.1 million was recognized during the year ended December 31, 2010 related to this transaction.
Discontinued Reinsurance Operations
In 1999, we discontinued our reinsurance operations through a combination of sale, reinsurance and placement of certain retained group accident and health reinsurance business into run-off. We adopted a formal plan to stop writing new contracts covering these risks and to end the existing contracts as soon as those contracts would permit. However, we remain liable for claims under contracts which have not been commuted.
We have established reserves for claims and related expenses that we expect to pay on our discontinued group accident and health reinsurance business. These reserves are based on currently known facts and estimates about, among other things, the amount of insured losses and expenses that we believe we will pay, the period over which they will be paid, the amount of reinsurance we believe we will collect from our retrocessionaires and the likely legal and administrative costs of winding down the business.Losses of $9.9 million in 2012, $18.6 million in 2011 and $3.2 million in 2010 were recognized primarily related to adverse developments which occurred during these respective years. See Note 24 to these financial statements for additional discussion on remaining liabilities of our discontinued reinsurance operations.
F-110
22.
Phoenix Life Statutory Financial Information and Regulatory Matters
Our insurance subsidiaries are required to file, with state regulatory authorities, annual statements prepared on an accounting basis prescribed or permitted by such authorities.
As of December 31, 2012, statutory surplus differs from equity reported in accordance with U.S. GAAP for life insurance companies primarily as follows:
·
policy acquisition costs are expensed when incurred;
·
impairments on investments are based on different assumptions;
·
surplus notes are included in surplus rather than debt;
·
postretirement benefit expense allocated to Phoenix Life relate only to vested participants and expense is based on different assumptions and reflect a different method of adoption;
·
life insurance reserves are based on different assumptions; and
·
deferred tax assets are limited to amounts reversing in a specified period with an additional limitation based upon 10% or 15% of statutory surplus, dependent on meeting certain risk-based capital (“RBC”) thresholds.
The information below is taken from the Life Companies annual statements filed with state regulatory authorities.
| | | | | | | | |
Statutory Financial Data for Phoenix Life: (1) | As of or for the Years Ended December 31, |
($ in millions) | 2012 | | 2011 | | 2010 |
| | | | | | | | |
Statutory capital, surplus and surplus notes | $ | 793.6 | | $ | 728.8 | | $ | 658.5 |
Asset valuation reserve (“AVR”) | | 128.9 | | | 116.9 | | | 104.7 |
Statutory capital, surplus and AVR(2) | $ | 922.5 | | $ | 845.7 | | $ | 763.2 |
Statutory net gain from operations | $ | 160.5 | | $ | 130.5 | | $ | 147.8 |
Statutory net income | $ | 156.2 | | $ | 95.0 | | $ | 139.8 |
———————
(1)
Prior to adjustments found in the Restatement and statutory and U.S. GAAP audits.
(2)
Includes all life insurance subsidiaries in consolidation.
In its 2013 annual statement filed with state regulatory authorities, Phoenix Life made $29.9 million of net prior period adjustments which decreased surplus during 2013 as a result of errors found in the Restatement and statutory and U.S. GAAP audits. These adjustments included $33.1 million of net negative prior period adjustments recorded in surplus and net prior period adjustments of $3.2 million in the carrying value of insurance company subsidiaries reflected in the change in net unrealized capital gains. Subsequent to the filing of the 2013 annual statement, Phoenix Life identified $11.7 million of additional net negative prior period adjustments for 2012 as a result of errors found in the Restatement and statutory and U.S. GAAP audits. These adjustments include $4.4 million of net negative prior period adjustments which will be recorded in Phoenix Life’s surplus and $0.5 million of net prior period adjustments in the carrying value of insurance company subsidiaries reflected in the change in net unrealized capital gains in the first quarter of 2014.
New York Insurance Law requires that New York life insurers report their RBC. RBC is based on a formula calculated by applying factors to various assets, premium and statutory reserve items. The formula takes into account the risk characteristics of the insurer, including asset risk, insurance risk, interest rate risk and business risk. New York Insurance Law gives the NYDFS explicit regulatory authority to require various actions by, or take various actions against, insurers whose total adjusted capital does not exceed certain RBC levels. Each of the U.S. insurance subsidiaries of Phoenix Life is also subject to these same RBC requirements. Phoenix Life and each of its insurance subsidiaries’ RBC was in excess of 250% of Company Action Level (the level where a life insurance enterprise must submit a comprehensive plan to state insurance regulators) as of December 31, 2012 and 2011.
Our primary sources of liquidity are dividends from Phoenix Life. Under New York Insurance Law, Phoenix Life is permitted to pay stockholder dividends in any calendar year without prior approval from the NYDFS in the amount of the lesser of 10% of Phoenix Life’s surplus to policyholders as of the immediately preceding calendar year or Phoenix Life’s statutory net gain from operations for the immediately preceding calendar year, not including realized capital gains. Phoenix Life declared $71.8 million in dividends in 2012 and under the above formula would be able to pay $78.3 million in dividends in 2013.
F-111
23.
Premises and Equipment
Premises and equipment are included in other assets in our consolidated balance sheets.
| | | | | | | | | | | |
Cost and Carrying Value of Premises and Equipment: | As of December 31, |
($ in millions) | 2012 | | 2011 |
| | | Carrying | | | | Carrying |
| Cost | | Value | | Cost | | Value |
| | | | | | | | | | | |
Real estate | $ | 92.0 | | $ | 27.2 | | $ | 89.9 | | $ | 25.9 |
Equipment | | 86.7 | | | 16.4 | | | 89.5 | | | 22.6 |
Leasehold improvements | | 0.4 | | | 0.3 | | | 1.3 | | | 0.2 |
Premises and equipment cost and carrying value | | 179.1 | | $ | 43.9 | | | 180.7 | | $ | 48.7 |
Accumulated depreciation and amortization | | (135.2) | | | | | | (132.0) | | | |
Premises and equipment | $ | 43.9 | | | | | $ | 48.7 | | | |
Depreciation and amortization expense for premises and equipment for 2012, 2011 and 2010 totaled $12.0 million, $12.8 million and $11.0 million, respectively. A complete inventory of premises and equipment was undertaken in 2010 which resulted in an adjustment to cost and accumulated depreciation related to fully depreciated assets no longer in use.
Rental expenses for operating leases, principally with respect to buildings, amounted to $0.9 million, $1.2 million and $1.6 million in 2012, 2011 and 2010, respectively. Future minimum rental payments under non-cancelable operating leases were $16.4 million as of December 31, 2012, payable as follows: in 2013, $1.4 million; in 2014, $1.3 million; in 2015, $1.3 million; in 2016, $1.3 million; in 2017, $1.4 million and thereafter, $9.7 million. These obligations include amounts for leased property of our discontinued operations of $0.2 million in 2010. All future obligations for leased property of our discontinued operations were assumed by the buyer upon the completion of the sale on June 23, 2010. See Note 21 to these financial statements for additional information.
24.
Contingent Liabilities
Litigation and arbitration
The Company is regularly involved in litigation and arbitration, both as a defendant and as a plaintiff. The litigation and arbitration naming the Company as a defendant ordinarily involves our activities as an insurer, employer, investor, investment advisor or taxpayer.
It is not feasible to predict or determine the ultimate outcome of all legal or arbitration proceedings or to provide reasonable ranges of potential losses. It is believed that the outcome of our litigation and arbitration matters are not likely, either individually or in the aggregate, to have a material adverse effect on the financial condition of the Company. However, given the large or indeterminate amounts sought in certain of these matters and the inherent unpredictability of litigation and arbitration, it is possible that an adverse outcome in certain matters could, from time to time, have a material adverse effect on the results of operations or cash flows in particular quarterly or annual periods.
SEC Cease-and-Desist Order
On February 12, 2014, the Company and PHLVIC submitted an Offer of Settlement with the SEC pursuant to which the Company and PHLVIC consented to the issuance of the form of an Order Instituting Cease-and-Desist Proceedings Pursuant to Section 21C of the Securities Exchange Act of 1934, Making Findings, and Imposing a Cease-and-Desist Order (the “Order”). The Order was approved by the SEC on March 21, 2014. Pursuant to the Order, the Company and PHLVIC have been directed to cease and desist from committing or causing any violations and any future violations of Section 13(a) of the Exchange Act and Rules 13a-1, 13a-13 thereunder and Section 15(d) of the Exchange Act and Rules 15d-1 and 15d-13 thereunder. In addition, the Company and PHLVIC agreed to perform certain undertakings, including for the Company to file its delayed Third Quarter 2012 Form 10-Q by no later than April 15, 2014 and its 2013 Form 10-K by no later than June 4, 2014. Also pursuant to the undertakings, the Company would file its 2013 Forms 10-Q after the filing of its 2013 Form 10-K. The Company intends to become timely with its periodic filings under the Exchange Act with the filing of its Quarterly Report on Form 10-Q for the period ending June 30, 2014. Finally, the Company and PHLVIC paid a civil monetary penalty in the amount of $375,000 to the United States Treasury following the entry of the Order.
F-112
24.
Contingent Liabilities (continued)
Cases Brought by Policy Investors
On July 29, 2013, Wilmington Savings Fund Society, FSB, as successor in interest to Christiana Bank & Trust Company and as trustee of 59 unnamed trusts, filed a second amended complaint against Phoenix Life and PHLVIC in the United States District Court for the District of Delaware (the case was initially brought on June 5, 2012 in its original venue, the Central District of California, and had been transferred to Delaware by order dated March 28, 2013) (C.A. No. 13-499-RGA). On August 2, 2012, Lima LS PLC filed a complaint against the Company, Phoenix Life, PHLVIC, James D. Wehr, Philip K. Polkinghorn, Edward W. Cassidy, Dona D. Young and other unnamed defendants in the United States District Court for the District of Connecticut (Case No. CV12-01122). On July 1, 2013, the defendants’ motion to dismiss the complaint was granted in part and denied in part. Thereafter, on July 31, 2013, the plaintiff served an amended complaint against the same defendants, with the exception that Mr. Cassidy was dropped as a defendant.
In both cases, the plaintiffs allege that Phoenix Life promoted certain policy sales knowing that the policies would ultimately be owned by investors and then challenging the validity of these policies or denying claims submitted on these policies. Plaintiffs are seeking damages, including punitive and treble damages, attorneys' fees and a declaratory judgment. We believe we have meritorious defenses against the lawsuits and we intend to vigorously defend against these claims. The outcome of these litigations and any potential losses are uncertain.
Cost of Insurance Cases
By order dated July 12, 2013, two separate classes were certified in an action pending in the United States District Court for the Southern District of New York (C.A. No. 1:11-cv-08405-CM-JCF (U.S. Dist. Ct; S.D.N.Y.)) brought by Martin Fleisher and another plaintiff (the “Fleisher Litigation”), on behalf of themselves and others similarly situated, against Phoenix Life. The complaint in the Fleisher Litigation, filed on November 8, 2011, challenges two COI rate adjustments implemented by Phoenix Life, which Phoenix Life maintains were based on policy language permitting such adjustments. The complaint seeks damages for breach of contract. The classes certified in the court’s July 12, 2013 order are limited to holders of Phoenix Life policies issued in New York and subject to New York law.
Phoenix Life’s subsidiary, PHLVIC, has been named as a defendant in four actions challenging its COI rate adjustments implemented concurrently with the Phoenix Life adjustments. These four cases, which are not styled as class actions, have been brought against PHLVIC by (1) Tiger Capital LLC (C.A. No. 1:12-cv- 02939-CM-JCF; U.S. Dist. Ct; S.D.N.Y., complaint filed on March 14, 2012; the “Tiger Capital Litigation”) and (2-4) U.S. Bank National Association, as securities intermediary for Lima Acquisition LP ((2: C.A. No. 1:12-cv-06811-CM-JCF; U.S. Dist. Ct; S.D.N.Y., complaint filed on November 16, 2011; 3: C.A. No. 1:13-cv-01580-CM-JCF; U.S. Dist. Ct; S.D.N.Y., complaint filed on March 8, 2013; collectively, the “U.S. Bank N.Y. Litigations”)); and 4: C.A. No. 1:13-cv-00368-GMS; U.S. Dist. Ct; D. Del., complaint filed on March 6, 2013; the “Delaware Litigation”). The Tiger Capital Litigation and the two U.S. Bank N.Y. Litigations have been assigned to the same judge as the Fleisher Litigation, and discovery in these four actions is being coordinated by the court; the Delaware Litigation is proceeding separately. The plaintiffs seek damages and attorneys’ fees for breach of contract and other common law and statutory claims.
Complaints to state insurance departments regarding PHLVIC’s COI rate adjustments have also prompted regulatory inquiries or investigations in several states, with two of such states (California and Wisconsin) issuing letters directing PHLVIC to take remedial action in response to complaints by a single policyholder. PHLVIC disagrees with both states’ positions and, on April 30, 2013, Wisconsin commenced an administrative hearing to obtain a formal ruling on its position, which is pending. (OCI Case No. 13- C35362).
Phoenix Life and PHLVIC believe that they have meritorious defenses against all of these lawsuits and regulatory directives and intend to vigorously defend against them. The outcome of these matters is uncertain and any potential losses cannot be reasonably estimated.
F-113
24.
Contingent Liabilities (continued)
On April 17, 2013, Robert Strougo, et al. filed a complaint against the Company, James D. Wehr and Peter A. Hofmann in the United States District Court for the District of Connecticut (Case No. 13-CV-547-RNC) (the “Strougo Litigation”). On November 1, 2013, the plaintiff filed an amended complaint joining Michael E. Hanrahan as an additional individual defendant. The plaintiff seeks to recover on behalf of himself and a class defined as all persons (other than the defendants) who purchased or otherwise acquired the Company’s securities between May 5, 2009 and August 14, 2013 for claims arising out of the Company’s announced intent to restate previously filed financial statements. The plaintiff alleges that, throughout the class period, the Company made materially false and misleading statements regarding the Company’s business, operational and compliance policies. The plaintiff seeks damages, attorneys’ fees and other litigation costs. We believe we have meritorious defenses against the lawsuit and we intend to vigorously defend against these claims. The outcome of this litigation is uncertain and any potential losses cannot be reasonably estimated.
Tiptree Indemnification
The definitive agreement to sell PFG contains a provision requiring us to indemnify Tiptree for any losses due to actions resulting from certain specified acts or omissions associated with the divested business prior to closing. There has been litigation filed that falls within this provision of the agreement but does not name the Company as a party to the litigation. We intend to defend these matters vigorously based on our indemnity commitment.
In September 2009, Carol Curran, et al. filed a putative class action complaint against certain subsidiaries of the Company, including AGL Life Assurance Company and Phoenix Equity Planning Corporation, as well as an officer of such subsidiaries, and two unrelated parties (Agile Group, LLC and Neal Greenberg), in the District Court (state court), Boulder County, Colorado (Case Number 2009CV907). Plaintiffs asserted claims for relief arising under Colorado statutory and common law and sought to recover damages, including punitive and treble damages, attorneys’ fees and a declaratory judgment. While the case was pending, the Company sold the subsidiaries named in the action and agreed to indemnify such subsidiaries and the officer in the action. This case was settled in the second quarter of 2013 and was resolved without material impact on the consolidated financial results of the Company.
Notice of Claim from Reinsurer
On June 6, 2012, one of the reinsurers of a Company insurance subsidiary provided notice of a claim, seeking relief under two treaties. This matter was settled effective July 1, 2013 and was resolved without material impact on the consolidated financial results of the Company.
Regulatory matters
State regulatory bodies, the Securities and Exchange Commission (the “SEC”), the Financial Industry Regulatory Authority (“FINRA”), the IRS and other regulatory bodies regularly make inquiries of us and, from time to time, conduct examinations or investigations concerning our compliance with laws and regulations related to, among other things, our insurance and broker-dealer subsidiaries, securities offerings and registered products. We endeavor to respond to such inquiries in an appropriate way and to take corrective action if warranted. Further, the Company is providing to the SEC certain information and documentation regarding the Restatement and the staff of the SEC has indicated to the Company that the matter remains subject to further investigation and potential further regulatory action. We cannot predict the outcome of any of such investigations or actions related to these or other matters.
Regulatory actions may be difficult to assess or quantify. The nature and magnitude of their outcomes may remain unknown for substantial periods of time. It is not feasible to predict or determine the ultimate outcome of all pending inquiries, investigations, legal proceedings and other regulatory actions, or to provide reasonable ranges of potential losses. Based on current information, we believe that the outcomes of our regulatory matters are not likely, either individually or in the aggregate, to have a material adverse effect on our consolidated financial condition. However, given the inherent unpredictability of regulatory matters, it is possible that an adverse outcome in certain matters could, from time to time, have a material adverse effect on our consolidated financial statements in particular quarterly or annual periods.
F-114
24.
Contingent Liabilities (continued)
State Insurance Department Examinations
During 2012 and 2013, the New York State Department of Financial Services conducted its routine quinquennial financial and market conduct examination covering the period ended December 31, 2012 of the Company’s subsidiary Phoenix Life and the Connecticut Insurance Department conducted its routine financial examination of the Company’s subsidiary, PHLVIC, and two other Connecticut-domiciled insurance subsidiaries. Reports from both Departments are expected in 2014.
In 2013, the Connecticut Insurance Department commenced a market conduct examination of Phoenix Life, PHLVIC and the Company’s two other Connecticut-domiciled insurance subsidiaries. The report from this examination will also be available in 2014.
Unclaimed Property Inquires
On July 5, 2011, the NYDFS issued a letter (“308 Letter”) requiring life insurers doing business in New York to use data available on the U.S. Social Security Administration’s Death Master File or a similar database to identify instances where death benefits under life insurance policies, annuities and retained asset accounts are payable, to locate and pay beneficiaries under such contracts and to report the results of the use of the data. Additionally, the insurers are required to report on their success in finding and making payments to beneficiaries or escheatment of funds deemed abandoned under state laws. We have substantially completed the work associated with this matter and the remaining amount of claim and interest payments to beneficiaries or state(s) has been recorded in policy liabilities and accruals. In addition, 39 states have indicated their intent to perform an unclaimed property audit of funds deemed abandoned under state laws. These audits have not yet begun.
Discontinued Reinsurance Operations
In 1999, Phoenix Life discontinued reinsurance operations through a combination of sale, reinsurance and placement of certain retained group accident and health reinsurance business into run-off. A formal plan was adopted to stop writing new contracts covering these risks and to end existing contracts as soon as those contracts would permit. However, Phoenix Life remains subject to claims under contracts that have not been commuted. Certain discontinued group accident and health reinsurance business was the subject of disputes concerning the placement of the business with reinsurers and the recovery of reinsurance. These disputes have been substantially resolved or settled.
We have established reserves for claims and related expenses that we expect to pay on our discontinued group accident and health reinsurance business. These reserves are based on currently known facts and estimates about, among other things, the amount of insured losses and expenses that we believe we will pay, the period over which they will be paid, the amount of reinsurance we believe we will collect from our retrocessionaires and the likely legal and administrative costs of winding down the business.
Phoenix Life expects reserves and reinsurance to cover the run-off of the business; however, unfavorable or favorable claims and/or reinsurance recovery experience are reasonably possible and could result in our recognition of additional losses or gains in future years. Management believes, based on current information and after consideration of the provisions made in these financial statements, that any future adverse or favorable development of recorded reserves and/or reinsurance recoverables will not have a material adverse effect on its financial position. Nevertheless, it is possible that future developments could have a material adverse effect on our results of operations.
Our total policy liabilities and accruals were $45.3 million and $75.1 million as of December 31, 2012 and 2011, respectively. Our total amounts recoverable from retrocessionaires related to paid losses were $0.7 million and $2.0 million as of December 31, 2012 and 2011, respectively. Losses of $9.9 million in 2012, $18.6 million in 2011 and $3.2 million in 2010 were recognized. During 2012, the Company completed commutations for a total of $30.1 million, substantially reducing its remaining exposure. During 2011, the Company strengthened reserves to reflect developments in the contracts underlying the block. During 2010, we received and evaluated additional claims information that became available from certain ceding companies.
F-115
25.
Other Commitments
During 2008, we announced an amendment to our agreement with HP Enterprise Services related to the management of our infrastructure services. The amendment covered the years 2009 to 2015. The remaining commitments total $45.1 million: $15.2 million in 2013, $15.0 million in 2014 and $14.9 million in 2015.
As part of its normal investment activities, the Company enters into agreements to fund limited partnerships that make debt and equity investments. As of December 31, 2012, the Company had unfunded commitments of $207.2 million under such agreements, of which $63.3 million is expected to be funded by December 31, 2013. See Note 9 to these financial statements for additional information on VIEs.
In addition, the Company enters into agreements to purchase private placement investments. At December 31, 2012, the Company had open commitments of $63.6 million under such agreements which are expected to be funded by August 1, 2014.
26.
Condensed Financial Information of The Phoenix Companies, Inc., and Other Supplementary Data
A summary of The Phoenix Companies, Inc. (parent company only) financial information is presented below. See Notes 10 and 17 to these financial statements for additional information regarding indebtedness and accrued pension and post-employment benefits, respectively.
| | | | | |
Parent Company Financial Position: | As of December 31, |
($ in millions) | 2012 | | 2011 |
| | | As restated |
| | | and amended |
Assets | | | | | |
Available-for-sale debt securities, at fair value | $ | 116.3 | | $ | 47.2 |
Fair value investments | | 21.9 | | | 22.2 |
Cash and cash equivalents | | 27.2 | | | 52.5 |
Investments in subsidiaries | | 1,029.5 | | | 1,277.5 |
Advances to subsidiaries | | 16.1 | | | 13.5 |
Deferred income taxes, net | | 0.1 | | | 0.3 |
Other assets | | 6.9 | | | 11.9 |
Total assets | $ | 1,218.0 | | $ | 1,425.1 |
Liabilities and Stockholders’ Equity | | | | | |
Indebtedness (Note 10) | $ | 268.6 | | $ | 268.6 |
Accrued pension and post-employment benefits (Note 17) | | 414.7 | | | 414.3 |
Other liabilities | | 30.9 | | | 49.3 |
Total liabilities | | 714.2 | | | 732.2 |
Total stockholders’ equity | | 503.8 | | | 692.9 |
Total liabilities and stockholders’ equity | $ | 1,218.0 | | $ | 1,425.1 |
| | | | | | | | |
Parent Company Results of Operations: | Years Ended December 31, |
($ in millions) | 2012 | | 2011 | | 2010 |
| | | As restated | | As restated |
| | | and amended | | and amended |
Revenues | | | | | | | | |
Equity in undistributed loss of subsidiaries | $ | (153.8) | | $ | (16.1) | | $ | (9.8) |
Investment income | | 1.3 | | | 2.3 | | | 1.9 |
Net realized investment gains | | 2.0 | | | 3.4 | | | 3.3 |
Total revenues | | (150.5) | | | (10.4) | | | (4.6) |
Interest expense | | 20.2 | | | 20.2 | | | 20.3 |
Other operating expenses | | 10.2 | | | 3.2 | | | 7.3 |
Total expenses | | 30.4 | | | 23.4 | | | 27.6 |
Loss before income taxes | | (180.9) | | | (33.8) | | | (32.2) |
Income tax expense (benefit) | | (11.9) | | | (1.5) | | | 1.2 |
Income (loss) from continuing operations | | (169.0) | | | (32.3) | | | (33.4) |
Income (loss) from discontinued operations of subsidiaries | | 0.5 | | | 1.6 | | | (1.0) |
Net loss | $ | (168.5) | | $ | (30.7) | | $ | (34.4) |
F-116
26.
Condensed Financial Information of The Phoenix Companies, Inc., and Other Supplementary Data (continued)
| | | | | | | | |
Parent Company Cash Flows: | Years Ended December 31, |
($ in millions) | 2012 | | 2011 | | 2010 |
| | | As restated | | As restated |
| | | and amended | | and amended |
Operating Activities | | | | | | | | |
Interest income received | $ | 1.2 | | $ | 0.9 | | $ | 1.9 |
Interest paid | | (20.0) | | | (20.1) | | | (20.1) |
Taxes paid | | (15.1) | | | — | | | (0.4) |
Taxes received | | 3.4 | | | 0.6 | | | 1.6 |
Payments to/from subsidiaries | | 0.8 | | | (7.9) | | | 2.1 |
Other operating activities, net | | (0.6) | | | 5.5 | | | (1.3) |
Cash used for operating activities | | (30.3) | | | (21.0) | | | (16.2) |
Purchases of available-for-sale debt securities | | (269.8) | | | (109.5) | | | (72.1) |
Sales, repayments and maturities of available-for-sale debt securities | | 201.4 | | | 118.5 | | | 81.0 |
Loan to subsidiary | | — | | | (2.5) | | | — |
Subsidiary loan payments received | | 4.0 | | | — | | | — |
Proceeds from the sale of subsidiary | | 1.0 | | | 1.0 | | | 8.3 |
Dividends received from subsidiaries | | 71.8 | | | 64.8 | | | 25.0 |
Capital contributions to subsidiaries | | — | | | (0.2) | | | (25.7) |
Capital distributions from subsidiaries | | — | | | — | | | 0.2 |
Cash provided by investing activities | | 8.4 | | | 72.1 | | | 16.7 |
Indebtedness repayments | | — | | | (0.7) | | | — |
Treasury stock acquired | | (3.4) | | | — | | | — |
Cash used for financing activities | | (3.4) | | | (0.7) | | | — |
Change in cash and cash equivalents | | (25.3) | | | 50.4 | | | 0.5 |
Cash and cash equivalents, beginning of period | | 52.5 | | | 2.1 | | | 1.6 |
Cash and cash equivalents, end of period | $ | 27.2 | | $ | 52.5 | | $ | 2.1 |
Other supplementary data related to investments, insurance information, reinsurance, and valuation and qualifying accounts are presented in various locations within the consolidated financial statements and related notes.
·
Investment information including the amortized cost and fair value of investments is provided in Note 9, Investing Activities, and Note 13, Derivative Instruments. The Company’s invested assets did not include related party investments as of December 31, 2012.
·
The Company manages its business by segregating its operations into two reporting segments: Life and Annuity and Saybrus. All insurance information disclosed within the consolidated balance sheets, the consolidated statements of comprehensive income and Note 7, Deferred Policy Acquisition Costs, is applicable to the Life and Annuity segment. Unearned premiums included in policy liabilities and accruals were $102.2 million, $111.2 million and $121.9 million as of December 31, 2012, 2011 and 2010, respectively. Saybrus, the Company’s non-insurance segment, had operating expenses of $20.4 million, $19.5 million and $25.0 million for the years ended December 31, 2012, 2011 and 2010, respectively. Saybrus did not have any insurance information or investment income as of, and for the years ended December 31, 2012, 2011 and 2010.
·
Information related to reinsurance, including gross, ceded, and assumed balances for premiums, policy benefits and life insurance inforce, is provided in Note 6, Reinsurance.
·
Information about the valuation allowance established for certain deferred tax assets is provided in Note 15, Income Taxes.
F-117
27.
Supplemental Unaudited Quarterly Financial Information
The following tables reflect unaudited summarized quarterly financial results during the years ended December 31, 2012 and 2011.
| | | | | | | | | | | |
Summarized Selected Quarterly Financial Data: | Quarter Ended |
($ in millions, except per share amounts) | Mar 31, | | June 30, | | Sept 30, | | Dec 31, |
| 2012 |
| As restated | | As restated | | | | | | |
| and amended | | and amended | | | | | | |
| | | | | | | | | | | |
Revenues | $ | 453.5 | | $ | 418.9 | | $ | 478.1 | | $ | 438.7 |
| | | | | | | | | | | |
Benefits and expenses | $ | 455.3 | | $ | 456.3 | | $ | 575.0 | | $ | 458.6 |
| | | | | | | | | | | |
Income tax expense (benefit) | $ | 11.3 | | $ | (7.4) | | $ | (4.9) | | $ | (2.7) |
| | | | | | | | | | | |
Loss from continuing operations | $ | (13.1) | | $ | (30.0) | | $ | (92.0) | | $ | (17.2) |
| | | | | | | | | | | |
Loss from discontinued operations | $ | (0.5) | | $ | (5.5) | | $ | (6.0) | | $ | (3.6) |
| | | | | | | | | | | |
Net loss | $ | (13.6) | | $ | (35.5) | | $ | (98.0) | | $ | (20.8) |
| | | | | | | | | | | |
Less: Net income (loss) attributable to noncontrolling interests | $ | (0.1) | | $ | (0.1) | | $ | 0.8 | | $ | — |
| | | | | | | | | | | |
Net loss attributable to The Phoenix Companies, Inc. | $ | (13.5) | | $ | (35.4) | | $ | (98.8) | | $ | (20.8) |
| | | | | | | | | | | |
Net loss attributable to The Phoenix Companies, Inc. per share: (1) | | | | | | | | | | | |
Basic | $ | (2.32) | | $ | (6.09) | | $ | (17.19) | | $ | (3.65) |
Diluted | $ | (2.32) | | $ | (6.09) | | $ | (17.19) | | $ | (3.65) |
———————
(1)
All share amounts for all periods reflect the 1-for-20 reverse stock split, which was effective August 10, 2012. See Note 11 to these consolidated financial statements for additional information on the reverse stock split.
| | | | | | | | | | | |
Summarized Selected Quarterly Financial Data: | Quarter Ended |
($ in millions, except per share amounts) | Mar 31, | | June 30, | | Sept 30, | | Dec 31, |
| 2011 |
| As restated and amended |
| | | | | | | | | | | |
Revenues | $ | 466.8 | | $ | 470.9 | | $ | 451.8 | | $ | 447.0 |
| | | | | | | | | | | |
Benefits and expenses | $ | 468.8 | | $ | 469.6 | | $ | 447.0 | | $ | 448.4 |
| | | | | | | | | | | |
Income tax expense (benefit) | $ | 7.7 | | $ | 8.6 | | $ | (6.8) | | $ | 2.8 |
| | | | | | | | | | | |
Income (loss) from continuing operations | $ | (9.7) | | $ | (7.3) | | $ | 11.6 | | $ | (4.2) |
| | | | | | | | | | | |
Loss from discontinued operations | $ | (1.5) | | $ | (0.7) | | $ | (3.9) | | $ | (15.5) |
| | | | | | | | | | | |
Net income (loss) | $ | (11.2) | | $ | (8.0) | | $ | 7.7 | | $ | (19.7) |
| | | | | | | | | | | |
Less: Net income (loss) attributable to noncontrolling interests | $ | (0.1) | | $ | — | | $ | (0.3) | | $ | (0.1) |
| | | | | | | | | | | |
Net income (loss) attributable to The Phoenix Companies, Inc. | $ | (11.1) | | $ | (8.0) | | $ | 8.0 | | $ | (19.6) |
| | | | | | | | | | | |
Net income (loss) attributable to The Phoenix Companies, Inc. per share:(1) | | | | | | | | | | | |
Basic | $ | (1.91) | | $ | (1.38) | | $ | 1.38 | | $ | (3.37) |
Diluted | $ | (1.91) | | $ | (1.38) | | $ | 1.36 | | $ | (3.37) |
———————
(1)
All share amounts for all periods reflect the 1-for-20 reverse stock split, which was effective August 10, 2012. See Note 11 to these consolidated financial statements for additional information on the reverse stock split.
F-118
27.
Supplemental Unaudited Quarterly Financial Information (continued)
Additional Quarterly Financial Data
As a result of the restatement of the Company’s consolidated financial statements as of and for the years ended December 31, 2012 and 2011 as referred to in Note 2,Restatement and Amendment of Previously Reported Financial Information, certain quarterly information is being restated and amended while certain quarterly information is being presented for the first time in connection with this filing. The following tables summarize the quarterly financial information presented in the following pages which includes the effects of the retrospective application of the adoption of such amended accounting standard and the impact of the correction of the errors identified on any of the Company’s previously reported balance sheets, statements of comprehensive income, changes in stockholders’ equity and statements of cash flows as well as quarterly financial information for periods not previously reported as noted more fully below:
F-119
27.
Supplemental Unaudited Quarterly Financial Information (continued)
| |
Quarterly Financial Data | Page |
| |
2012 Consolidated Statement of Comprehensive Income for three months ended: | |
December 31, 2012 | F-121 |
September 30, 2012 | F-122 |
June 30, 2012, as restated and amended | F-123 |
March 31, 2012, as restated and amended | F-125 |
| |
2012 Consolidated Statement of Comprehensive Income for period ended: | |
September 30, 2012 | F-127 |
June 30, 2012, as restated and amended | F-128 |
| |
2012 Consolidated Balance Sheet as of: | |
December 31, 2012 | F-3 |
September 30, 2012 | F-130 |
June 30, 2012, as restated and amended | F-131 |
March 31, 2012, as restated and amended | F-132 |
| |
2012 Consolidated Statement of Changes in Stockholders’ Equity for the period ended: | |
December 31, 2012 | F-8 |
September 30, 2012 | F-133 |
June 30, 2012, as restated and amended | F-134 |
March 31, 2012, as restated and amended | F-135 |
| |
2012 Consolidated Statement of Cash Flows for the period ended: | |
December 31, 2012 | F-6 |
September 30, 2012 | F-136 |
June 30, 2012, as restated and amended | F-137 |
March 31, 2012, as restated and amended | F-139 |
| |
| |
2011 Consolidated Statement of Comprehensive Income for three months ended: | |
December 31, 2011, as restated and amended | F-141 |
September 30, 2011, as restated and amended | F-143 |
June 30, 2011, as restated and amended | F-145 |
March 31, 2011, as restated and amended | F-147 |
| |
2011 Consolidated Statement of Comprehensive Income for period ended: | |
September 30, 2011, as restated and amended | F-149 |
June 30, 2011, as restated and amended | F-151 |
| |
2011 Consolidated Balance Sheet as of: | |
December 31, 2011, as restated and amended | F-3 |
September 30, 2011, as restated and amended | F-153 |
June 30, 2011, as restated and amended | F-154 |
March 31, 2011, as restated and amended | F-155 |
| |
2011 Consolidated Statement of Changes in Stockholders’ Equity for the period ended: | |
December 31, 2011, as restated and amended | F-156 |
September 30, 2011, as restated and amended | F-157 |
June 30, 2011, as restated and amended | F-158 |
March 31, 2011, as restated and amended | F-159 |
| |
2011 Consolidated Statement of Cash Flows for the period ended: | |
December 31, 2011, as restated and amended | F-160 |
September 30, 2011, as restated and amended | F-162 |
June 30, 2011, as restated and amended | F-164 |
March 31, 2011, as restated and amended | F-166 |
The following tables present the effects of the retrospective application of the adoption of such amended accounting standard and the impact of the correction of the errors identified on the Company’s previously reported balance sheets, statements of comprehensive income and statements of cash flows:
F-120
27.
Supplemental Unaudited Quarterly Financial Information (continued)
| | |
Consolidated Statement of Comprehensive Income |
Three months ended December 31, 2012 |
($ in millions, except share data) | |
| |
REVENUES: | | |
Premiums | $ | 111.7 |
Fee income | | 133.1 |
Net investment income | | 206.0 |
Net realized investment gains (losses): | | |
Total OTTI losses | | (21.1) |
Portion of OTTI losses recognized in OCI | | 11.6 |
Net OTTI losses recognized in earnings | | (9.5) |
Net realized investment losses, excluding OTTI losses | | (2.6) |
Net realized investment losses | | (12.1) |
Gain on debt repurchase | | — |
Total revenues | | 438.7 |
| | |
BENEFITS AND EXPENSES: | | |
Policy benefits, excluding policyholder dividends | | 277.2 |
Policyholder dividends | | 72.5 |
Policy acquisition cost amortization | | 35.4 |
Interest expense on indebtedness | | 7.1 |
Other operating expenses | | 66.4 |
Total benefits and expenses | | 458.6 |
Loss from continuing operations before income taxes | | (19.9) |
Income tax benefit | | (2.7) |
Loss from continuing operations | | (17.2) |
Loss from discontinued operations, net of income taxes | | (3.6) |
Net loss | | (20.8) |
Less: Net income (loss) attributable to noncontrolling interests | | — |
Net loss attributable to The Phoenix Companies, Inc. | $ | (20.8) |
| | |
COMPREHENSIVE INCOME (LOSS): | | |
Net loss attributable to The Phoenix Companies, Inc. | $ | (20.8) |
Net income (loss) attributable to noncontrolling interests | | — |
Net loss | $ | (20.8) |
Other comprehensive income (loss) before income taxes: | | |
Net unrealized investment gains (losses) before income taxes | | (13.7) |
Non-credit portion of OTTI losses recognized in OCI before income taxes | | 25.1 |
Net pension liability adjustment before income taxes | | (21.3) |
Net unrealized other gains (losses) before income taxes | | — |
Net unrealized derivative instruments gains (losses) before income taxes | | — |
Other comprehensive income (loss) before income taxes | | (9.9) |
Less: Income tax expense (benefit) related to: | | |
Net unrealized investment gains (losses) | | (1.4) |
Non-credit portion of OTTI losses recognized in OCI | | 8.8 |
Net pension liability adjustment | | — |
Net unrealized other gains (losses) | | — |
Net unrealized derivative instruments gains (losses) | | — |
Total income tax expense (benefit) | | 7.4 |
Other comprehensive income (loss), net of income taxes | | (17.3) |
Comprehensive income (loss) | | (38.1) |
Less: Comprehensive income attributable to noncontrolling interests, net of income taxes | | — |
Comprehensive income (loss) attributable to The Phoenix Companies, Inc. | $ | (38.1) |
| | |
LOSS PER SHARE:(1) | | |
Loss from continuing operations – basic | $ | (3.02) |
Loss from continuing operations – diluted | $ | (3.02) |
Loss from discontinued operations – basic | $ | (0.63) |
Loss from discontinued operations – diluted | $ | (0.63) |
Net loss attributable to The Phoenix Companies, Inc. – basic | $ | (3.65) |
Net loss attributable to The Phoenix Companies, Inc. – diluted | $ | (3.65) |
Basic weighted-average common shares outstanding (in thousands) | | 5,704 |
Diluted weighted-average common shares outstanding (in thousands) | | 5,704 |
———————
(1)
All share amounts for all periods reflect the 1-for-20 reverse stock split, which was effective August 10, 2012. See Note 11 to these consolidated financial statements for additional information on the reverse stock split.
F-121
27.
Supplemental Unaudited Quarterly Financial Information (continued)
| | |
Consolidated Statement of Comprehensive Income |
Three months ended September 30, 2012 |
($ in millions, except share data) | |
| |
REVENUES: | | |
Premiums | $ | 94.8 |
Fee income | | 138.8 |
Net investment income | | 205.1 |
Net realized investment gains (losses): | | |
Total OTTI losses | | (7.2) |
Portion of OTTI losses recognized in OCI | | (0.2) |
Net OTTI losses recognized in earnings | | (7.4) |
Net realized investment gains, excluding OTTI losses | | 34.9 |
Net realized investment gains | | 27.5 |
Gain on debt repurchase | | 11.9 |
Total revenues | | 478.1 |
| | |
BENEFITS AND EXPENSES: | | |
Policy benefits, excluding policyholder dividends | | 352.5 |
Policyholder dividends | | 81.0 |
Policy acquisition cost amortization | | 71.7 |
Interest expense on indebtedness | | 7.9 |
Other operating expenses | | 61.9 |
Total benefits and expenses | | 575.0 |
Loss from continuing operations before income taxes | | (96.9) |
Income tax benefit | | (4.9) |
Loss from continuing operations | | (92.0) |
Loss from discontinued operations, net of income taxes | | (6.0) |
Net loss | | (98.0) |
Less: Net income (loss) attributable to noncontrolling interests | | 0.8 |
Net loss attributable to The Phoenix Companies, Inc. | $ | (98.8) |
| | |
COMPREHENSIVE INCOME (LOSS): | | |
Net loss attributable to The Phoenix Companies, Inc. | $ | (98.8) |
Net income (loss) attributable to noncontrolling interests | | 0.8 |
Net loss | | (98.0) |
Other comprehensive income (loss) before income taxes: | | |
Net unrealized investment gains (losses) before income taxes | | 21.0 |
Non-credit portion of OTTI losses recognized in OCI before income taxes | | 10.6 |
Net pension liability adjustment before income taxes | | 2.4 |
Net unrealized other gains (losses) before income taxes | | — |
Net unrealized derivative instruments gains (losses) before income taxes | | — |
Other comprehensive income (loss) before income taxes | | 34.0 |
Less: Income tax expense (benefit) related to: | | |
Net unrealized investment gains (losses) | | 34.9 |
Non-credit portion of OTTI losses recognized in OCI | | 3.7 |
Net pension liability adjustment | | — |
Net unrealized other gains (losses) | | — |
Net unrealized derivative instruments gains (losses) | | — |
Total income tax expense (benefit) | | 38.6 |
Other comprehensive income (loss), net of income taxes | | (4.6) |
Comprehensive income (loss) | | (102.6) |
Less: Comprehensive income attributable to noncontrolling interests, net of income taxes | | 0.8 |
Comprehensive income (loss) attributable to The Phoenix Companies, Inc. | $ | (103.4) |
| | |
LOSS PER SHARE:(1) | | |
Loss from continuing operations – basic | $ | (16.00) |
Loss from continuing operations – diluted | $ | (16.00) |
Loss from discontinued operations – basic | $ | (1.04) |
Loss from discontinued operations – diluted | $ | (1.04) |
Net loss attributable to The Phoenix Companies, Inc. – basic | $ | (17.19) |
Net loss attributable to The Phoenix Companies, Inc. – diluted | $ | (17.19) |
Basic weighted-average common shares outstanding (in thousands) | | 5,749 |
Diluted weighted-average common shares outstanding (in thousands) | | 5,749 |
———————
(1)
All share amounts for all periods reflect the 1-for-20 reverse stock split, which was effective August 10, 2012. See Note 11 to these consolidated financial statements for additional information on the reverse stock split.
F-122
27.
Supplemental Unaudited Quarterly Financial Information (continued)
| | | | | | | | | | | | | | |
| Consolidated Statement of Comprehensive Income |
($ in millions, except share data) | Three months ended June 30, 2012 |
| As previously reported | | Correction of errors (1) | | Adjusted prior to the retrospective adoption | | Retrospective Adoption(2) | | As restated and amended |
|
|
|
REVENUES: | | | | | | | | | | | | | | |
Premiums | $ | 104.3 | | $ | (6.0) | | $ | 98.3 | | $ | — | | $ | 98.3 |
Fee income | | 137.2 | | | 0.4 | | | 137.6 | | | — | | | 137.6 |
Net investment income | | 218.2 | | | (17.9) | | | 200.3 | | | — | | | 200.3 |
Net realized investment gains (losses): | | | | | | | | | | | | | | |
Total OTTI losses | | (15.0) | | | 2.1 | | | (12.9) | | | — | | | (12.9) |
Portion of OTTI losses recognized in OCI | | 9.9 | | | (2.1) | | | 7.8 | | | — | | | 7.8 |
Net OTTI losses recognized in earnings | | (5.1) | | | — | | | (5.1) | | | — | | | (5.1) |
Net realized investment losses,
excluding OTTI losses | | (3.1) | | | (9.1) | | | (12.2) | | | — | | | (12.2) |
Net realized investment losses | | (8.2) | | | (9.1) | | | (17.3) | | | — | | | (17.3) |
Gain on debt repurchase | | — | | | — | | | — | | | | | | — |
Total revenues | | 451.5 | | | (32.6) | | | 418.9 | | | — | | | 418.9 |
| | | | | | | | | | | | | | |
BENEFITS AND EXPENSES: | | | | | | | | | | | | | | |
Policy benefits, excluding policyholder dividends | | 259.0 | | | 19.4 | | | 278.4 | | | — | | | 278.4 |
Policyholder dividends | | 84.3 | | | (13.6) | | | 70.7 | | | — | | | 70.7 |
Policy acquisition cost amortization | | 41.8 | | | (2.3) | | | 39.5 | | | — | | | 39.5 |
Interest expense on indebtedness | | 7.9 | | | — | | | 7.9 | | | — | | | 7.9 |
Other operating expenses | | 60.8 | | | (1.0) | | | 59.8 | | | — | | | 59.8 |
Total benefits and expenses | | 453.8 | | | 2.5 | | | 456.3 | | | — | | | 456.3 |
Loss from continuing operations
before income taxes | | (2.3) | | | (35.1) | | | (37.4) | | | — | | | (37.4) |
Income tax expense (benefit) | | 4.6 | | | (12.0) | | | (7.4) | | | — | | | (7.4) |
Loss from continuing operations | | (6.9) | | | (23.1) | | | (30.0) | | | — | | | (30.0) |
Income (loss) from discontinued operations,
net of income taxes | | (6.3) | | | 0.8 | | | (5.5) | | | — | | | (5.5) |
Net loss | | (13.2) | | | (22.3) | | | (35.5) | | | — | | | (35.5) |
Less: Net income (loss) attributable to
noncontrolling interests | | — | | | (0.1) | | | (0.1) | | | — | | | (0.1) |
Net loss attributable to
The Phoenix Companies, Inc. | $ | (13.2) | | $ | (22.2) | | $ | (35.4) | | $ | — | | $ | (35.4) |
(Continued on next page)
F-123
27.
Supplemental Unaudited Quarterly Financial Information (continued)
| | | | | | | | | | | | | | |
(Continued from previous page) | Consolidated Statement of Comprehensive Income |
($ in millions, except share data) | Three months ended June 30, 2012 |
| As previously reported | | Correction of errors (1) | | Adjusted prior to the retrospective adoption | | Retrospective Adoption(2) | | As restated and amended |
|
|
|
COMPREHENSIVE INCOME (LOSS): | | | | | | | | | | | | | | |
Net loss attributable to
The Phoenix Companies, Inc. | $ | (13.2) | | $ | (22.2) | | $ | (35.4) | | $ | — | | $ | (35.4) |
Net income (loss) attributable to
noncontrolling interests | | — | | | (0.1) | | | (0.1) | | | — | | | (0.1) |
Net loss | | (13.2) | | | (22.3) | | | (35.5) | | | — | | | (35.5) |
Other comprehensive income (loss)
before income taxes: | | | | | | | | | | | | | | |
Net unrealized investment gains (losses)
before income taxes | | 29.9 | | | (18.5) | | | 11.4 | | | — | | | 11.4 |
Non-credit portion of OTTI losses
recognized in OCI before income taxes | | 4.9 | | | 0.1 | | | 5.0 | | | — | | | 5.0 |
Net pension liability adjustment
before income taxes | | (21.2) | | | 17.0 | | | (4.2) | | | — | | | (4.2) |
Net unrealized other gains (losses)
before income taxes | | — | | | — | | | — | | | — | | | — |
Net unrealized derivative instrument
gains (losses) before income taxes | | 0.6 | | | (0.6) | | | — | | | — | | | — |
Other comprehensive income (loss)
before income taxes | | 14.2 | | | (2.0) | | | 12.2 | | | — | | | 12.2 |
Less: Income tax expense (benefit) related to: | | | | | | | | | | | | | | |
Net unrealized investment gains (losses) | | 0.6 | | | 13.3 | | | 13.9 | | | — | | | 13.9 |
Non-credit portion of OTTI losses
recognized in OCI | | 1.7 | | | — | | | 1.7 | | | — | | | 1.7 |
Net pension liability adjustment | | — | | | — | | | — | | | — | | | — |
Net unrealized other gains (losses) | | — | | | — | | | — | | | — | | | — |
Net unrealized derivative instrument
gains (losses) | | — | | | — | | | — | | | — | | | — |
Total income tax expense (benefit) | | 2.3 | | | 13.3 | | | 15.6 | | | — | | | 15.6 |
Other comprehensive income (loss),
net of income taxes | | 11.9 | | | (15.3) | | | (3.4) | | | — | | | (3.4) |
Comprehensive income (loss) | | (1.3) | | $ | (37.6) | | $ | (38.9) | | $ | — | | $ | (38.9) |
Less: Comprehensive income (loss) attributable
to noncontrolling interests, net of income taxes | | — | | | (0.1) | | | (0.1) | | | — | | | (0.1) |
Comprehensive income (loss) attributable
to The Phoenix Companies, Inc. | $ | (1.3) | | $ | (37.5) | | $ | (38.8) | | $ | — | | $ | (38.8) |
| | | | | | | | | | | | | | |
EARNINGS (LOSS) PER SHARE:(3) | | | | | | | | | | | | | | |
Loss from continuing operations – basic | $ | (1.19) | | $ | (3.97) | | | | | $ | — | | $ | (5.16) |
Loss from continuing operations – diluted | $ | (1.19) | | $ | (3.97) | | | | | $ | — | | $ | (5.16) |
Earnings (loss) from
discontinued operations – basic | $ | (1.08) | | $ | 0.14 | | | | | $ | — | | $ | (0.95) |
Earnings (loss) from
discontinued operations – diluted | $ | (1.08) | | $ | 0.14 | | | | | $ | — | | $ | (0.95) |
Net loss attributable to
The Phoenix Companies, Inc.– basic | $ | (2.27) | | $ | (3.82) | | | | | $ | — | | $ | (6.09) |
Net loss attributable to
The Phoenix Companies, Inc.– diluted | $ | (2.27) | | $ | (3.82) | | | | | $ | — | | $ | (6.09) |
Basic weighted-average common shares
outstanding (in thousands) | | 5,812 | | | 5,815 | (4) | | | | | — | | | 5,815 |
Diluted weighted-average common shares
outstanding (in thousands) | | 5,812 | | | 5,815 | (4) | | | | | — | | | 5,815 |
———————
(1)
Adjustments related to the correction of errors reflect amounts prior to the retrospective adoption of amended guidance to ASC 944,Financial Services – Insurance (ASU 2010-26). See footnote 2 below for additional information regarding these amounts and the retrospective adoption.
(2)
Adjustments related to the retrospective adoption of amended guidance to ASC 944,Financial Services – Insurance (ASU 2010-26), have been updated from those originally disclosed in the First Quarter 2012 Quarterly Report on Form 10-Q filing to reflect the correction of errors identified related to the adoption of the amended guidance as well as indirect impact of the correction of errors associated with the restatement.
(3)
All share amounts for all periods reflect the 1-for-20 reverse stock split, which was effective August 10, 2012. See Note 11 to these consolidated financial statements for additional information on the reverse stock split.
(4)
Weighted-average common shares outstanding have been updated to reflect the impact of an error which had no material impact to EPS information, basic or diluted, for any period presented.
F-124
27.
Supplemental Unaudited Quarterly Financial Information (continued)
| | | | | | | | | | | | | | |
| Consolidated Statement of Comprehensive Income |
($ in millions, except share data) | Three months ended March 31, 2012 |
| As previously reported | | Correction of errors (1) | | Adjusted prior to the retrospective adoption | | Retrospective Adoption(2) | | As restated and amended |
|
|
|
REVENUES: | | | | | | | | | | | | | | |
Premiums | $ | 100.2 | | $ | (2.7) | | $ | 97.5 | | $ | — | | $ | 97.5 |
Fee income | | 146.6 | | | 0.1 | | | 146.7 | | | — | | | 146.7 |
Net investment income | | 207.9 | | | 10.0 | | | 217.9 | | | — | | | 217.9 |
Net realized investment gains (losses): | | | | | | | | | | | | | | |
Total OTTI losses | | (11.7) | | | 1.2 | | | (10.5) | | | — | | | (10.5) |
Portion of OTTI losses recognized in OCI | | 5.5 | | | (1.8) | | | 3.7 | | | — | | | 3.7 |
Net OTTI losses recognized in earnings | | (6.2) | | | (0.6) | | | (6.8) | | | — | | | (6.8) |
Net realized investment gains (losses),
excluding OTTI losses | | (9.4) | | | 7.6 | | | (1.8) | | | — | | | (1.8) |
Net realized investment losses | | (15.6) | | | 7.0 | | | (8.6) | | | — | | | (8.6) |
Gain on debt repurchase | | — | | | — | | | — | | | — | | | — |
Total revenues | | 439.1 | | | 14.4 | | | 453.5 | | | — | | | 453.5 |
| | | | | | | | | | | | | | |
BENEFITS AND EXPENSES: | | | | | | | | | | | | | | |
Policy benefits, excluding policyholder dividends | | 254.1 | | | 3.9 | | | 258.0 | | | — | | | 258.0 |
Policyholder dividends | | 65.1 | | | 5.5 | | | 70.6 | | | — | | | 70.6 |
Policy acquisition cost amortization | | 50.2 | | | 3.2 | | | 53.4 | | | — | | | 53.4 |
Interest expense on indebtedness | | 7.9 | | | — | | | 7.9 | | | — | | | 7.9 |
Other operating expenses | | 60.5 | | | 4.9 | | | 65.4 | | | — | | | 65.4 |
Total benefits and expenses | | 437.8 | | | 17.5 | | | 455.3 | | | — | | | 455.3 |
Income (loss) from continuing operations
before income taxes | | 1.3 | | | (3.1) | | | (1.8) | | | — | | | (1.8) |
Income tax expense | | 8.9 | | | 2.4 | | | 11.3 | | | — | | | 11.3 |
Loss from continuing operations | | (7.6) | | | (5.5) | | | (13.1) | | | — | | | (13.1) |
Loss from discontinued operations,
net of income taxes | | (0.5) | | | — | | | (0.5) | | | — | | | (0.5) |
Net loss | | (8.1) | | | (5.5) | | | (13.6) | | | — | | | (13.6) |
Less: Net income (loss) attributable to
noncontrolling interests | | — | | | (0.1) | | | (0.1) | | | — | | | (0.1) |
Net loss attributable to
The Phoenix Companies, Inc. | $ | (8.1) | | $ | (5.4) | | $ | (13.5) | | $ | — | | $ | (13.5) |
(Continued on next page)
F-125
27.
Supplemental Unaudited Quarterly Financial Information (continued)
| | | | | | | | | | | | | | |
(Continued from previous page) | Consolidated Statement of Comprehensive Income |
($ in millions, except share data) | Three months ended March 31, 2012 |
| As previously reported | | Correction of errors (1) | | Adjusted prior to the retrospective adoption | | Retrospective Adoption(2) | | As restated and amended |
|
|
|
COMPREHENSIVE INCOME (LOSS): | | | | | | | | | | | | | | |
Net loss attributable to
The Phoenix Companies, Inc. | $ | (8.1) | | $ | (5.4) | | $ | (13.5) | | $ | — | | $ | (13.5) |
Net income (loss) attributable to
noncontrolling interests | | — | | | (0.1) | | | (0.1) | | | — | | | (0.1) |
Net loss | $ | (8.1) | | | (5.5) | | | (13.6) | | | — | | | (13.6) |
Other comprehensive income (loss)
before income taxes: | | | | | | | | | | | | | | |
Net unrealized investment gains
before income taxes | | 26.3 | | | 11.8 | | | 38.1 | | | — | | | 38.1 |
Non-credit portion of OTTI losses
recognized in OCI before income taxes | | (5.5) | | | 1.8 | | | (3.7) | | | — | | | (3.7) |
Net pension liability adjustment
before income taxes | | 2.1 | | | (0.4) | | | 1.7 | | | | | | 1.7 |
Net unrealized other gains (losses)
before income taxes | | — | | | — | | | — | | | — | | | — |
Net unrealized derivative instruments
gains (losses) before income taxes | | (0.3) | | | 0.3 | | | — | | | — | | | — |
Other comprehensive income (loss)
before income taxes | | 22.6 | | | 13.5 | | | 36.1 | | | — | | | 36.1 |
Less: Income tax expense (benefit) related to: | | | | | | | | | | | | | | |
Net unrealized investment gains (losses) | | 26.5 | | | 4.1 | | | 30.6 | | | — | | | 30.6 |
Non-credit portion of OTTI losses
recognized in OCI | | (1.9) | | | 0.6 | | | (1.3) | | | — | | | (1.3) |
Net pension liability adjustment | | — | | | — | | | — | | | — | | | — |
Net unrealized other gains (losses) | | — | | | — | | | — | | | — | | | — |
Net unrealized derivative instrument
gains (losses) | | — | | | — | | | — | | | — | | | — |
Total income tax expense (benefit) | | 24.6 | | | 4.7 | | | 29.3 | | | — | | | 29.3 |
Other comprehensive income (loss)
net of income taxes | | (2.0) | | | 8.8 | | | 6.8 | | | — | | | 6.8 |
Comprehensive income (loss) | | (10.1) | | | 3.3 | | | (6.8) | | | — | | | (6.8) |
Less: Comprehensive income (loss) attributable
to noncontrolling interests, net of income taxes | | — | | | (0.1) | | | (0.1) | | | — | | | (0.1) |
Comprehensive income (loss) attributable
to The Phoenix Companies, Inc. | $ | (10.1) | | $ | 3.4 | | $ | (6.7) | | $ | — | | $ | (6.7) |
| | | | | | | | | | | | | | |
LOSS PER SHARE:(3) | | | | | | | | | | | | | | |
Loss from continuing operations – basic | $ | (1.31) | | $ | (0.95) | | | | | $ | — | | $ | (2.25) |
Loss from continuing operations – diluted | $ | (1.31) | | $ | (0.95) | | | | | $ | — | | $ | (2.25) |
Loss from discontinued operations – basic | $ | (0.09) | | $ | — | | | | | $ | — | | $ | (0.09) |
Loss from discontinued operations – diluted | $ | (0.09) | | $ | — | | | | | $ | — | | $ | (0.09) |
Net loss attributable to
The Phoenix Companies, Inc.– basic | $ | (1.39) | | $ | (0.93) | | | | | $ | — | | $ | (2.32) |
Net loss attributable to
The Phoenix Companies, Inc.– diluted | $ | (1.39) | | $ | (0.93) | | | | | $ | — | | $ | (2.32) |
Basic weighted-average common shares
outstanding (in thousands) | | 5,816 | | | 5,816 | (4) | | | | | — | | | 5,816 |
Diluted weighted-average common shares
outstanding (in thousands) | | 5,816 | | | 5,816 | (4) | | | | | — | | | 5,816 |
———————
(1)
Adjustments related to the correction of errors reflect amounts prior to the retrospective adoption of amended guidance to ASC 944,Financial Services – Insurance (ASU 2010-26). See footnote 2 below for additional information regarding these amounts and the retrospective adoption.
(2)
Adjustments related to the retrospective adoption of amended guidance to ASC 944,Financial Services – Insurance (ASU 2010-26), have been updated from those originally disclosed in the First Quarter 2012 Quarterly Report on Form 10-Q filing to reflect the correction of errors identified related to the adoption of the amended guidance as well as indirect impact of the correction of errors associated with the restatement.
(3)
All share amounts for all periods reflect the 1-for-20 reverse stock split, which was effective August 10, 2012. See Note 11 to these consolidated financial statements for additional information on the reverse stock split.
(4)
Weighted-average common shares outstanding have been updated to reflect the impact of an error which had no material impact to EPS information, basic or diluted, for any period presented.
F-126
27.
Supplemental Unaudited Quarterly Financial Information (continued)
| | |
Consolidated Statement of Comprehensive Income |
Nine months ended September 30, 2012 |
($ in millions, except share data) | |
| |
REVENUES: | | |
Premiums | $ | 290.6 |
Fee income | | 423.1 |
Net investment income | | 623.3 |
Net realized investment gains (losses): | | |
Total OTTI losses | | (30.6) |
Portion of OTTI losses recognized in OCI | | 11.3 |
Net OTTI losses recognized in earnings | | (19.3) |
Net realized investment losses, excluding OTTI losses | | 20.9 |
Net realized investment losses | | 1.6 |
Gain on debt repurchase | | 11.9 |
Total revenues | | 1,350.5 |
| | |
BENEFITS AND EXPENSES: | | |
Policy benefits, excluding policyholder dividends | | 888.9 |
Policyholder dividends | | 222.3 |
Policy acquisition cost amortization | | 164.6 |
Interest expense on indebtedness | | 23.7 |
Other operating expenses | | 187.1 |
Total benefits and expenses | | 1,486.6 |
Loss from continuing operations before income taxes | | (136.1) |
Income tax benefit | | (1.0) |
Loss from continuing operations | | (135.1) |
Loss from discontinued operations, net of income taxes | | (12.0) |
Net loss | | (147.1) |
Less: Net income (loss) attributable to noncontrolling interests | | 0.6 |
Net loss attributable to The Phoenix Companies, Inc. | $ | (147.7) |
| | |
COMPREHENSIVE INCOME (LOSS): | | |
Net loss attributable to The Phoenix Companies, Inc. | $ | (147.7) |
Net income (loss) attributable to noncontrolling interests | | 0.6 |
Net loss | $ | (147.1) |
Other comprehensive income (loss) before income taxes: | | |
Net unrealized investment gains (losses) before income taxes | | 70.4 |
Non-credit portion of OTTI losses recognized in OCI before income taxes | | 11.9 |
Net pension liability adjustment before income taxes | | (0.1) |
Net unrealized other gains (losses) before income taxes | | — |
Net unrealized derivative instruments gains (losses) before income taxes | | — |
Other comprehensive income (loss) before income taxes | | 82.2 |
Less: Income tax expense (benefit) related to: | | |
Net unrealized investment gains (losses) | | 79.4 |
Non-credit portion of OTTI losses recognized in OCI | | 4.1 |
Net pension liability adjustment | | — |
Net unrealized other gains (losses) | | — |
Net unrealized derivative instruments gains (losses) | | — |
Total income tax expense (benefit) | | 83.5 |
Other comprehensive income (loss), net of income taxes | | (1.3) |
Comprehensive income (loss) | | (148.4) |
Less: Comprehensive income attributable to noncontrolling interests, net of income taxes | | 0.6 |
Comprehensive income (loss) attributable to The Phoenix Companies, Inc. | $ | (149.0) |
| | |
LOSS PER SHARE:(1) | | |
Loss from continuing operations – basic | $ | (23.33) |
Loss from continuing operations – diluted | $ | (23.33) |
Loss from discontinued operations – basic | $ | (2.07) |
Loss from discontinued operations – diluted | $ | (2.07) |
Net loss attributable to The Phoenix Companies, Inc. – basic | $ | (25.50) |
Net loss attributable to The Phoenix Companies, Inc. – diluted | $ | (25.50) |
Basic weighted-average common shares outstanding (in thousands) | | 5,792 |
Diluted weighted-average common shares outstanding (in thousands) | | 5,792 |
———————
(1)
All share amounts for all periods reflect the 1-for-20 reverse stock split, which was effective August 10, 2012. See Note 11 to these consolidated financial statements for additional information on the reverse stock split.
F-127
27.
Supplemental Unaudited Quarterly Financial Information (continued)
| | | | | | | | | | | | | | |
| Consolidated Statement of Comprehensive Income |
($ in millions, except share data) | Six months ended June 30, 2012 |
| As previously reported | | Correction of errors (1) | | Adjusted prior to the Retrospective adoption | | Retrospective Adoption(2) | | As restated and amended |
|
|
|
REVENUES: | | | | | | | | | | | | | | |
Premiums | $ | 204.5 | | $ | (8.7) | | $ | 195.8 | | $ | — | | $ | 195.8 |
Fee income | | 283.8 | | | 0.5 | | | 284.3 | | | — | | | 284.3 |
Net investment income | | 426.1 | | | (7.9) | | | 418.2 | | | — | | | 418.2 |
Net realized investment gains (losses): | | | | | | | | | | | | | | |
Total OTTI losses | | (26.7) | | | 3.3 | | | (23.4) | | | — | | | (23.4) |
Portion of OTTI losses recognized in OCI | | 15.4 | | | (3.9) | | | 11.5 | | | — | | | 11.5 |
Net OTTI losses recognized in earnings | | (11.3) | | | (0.6) | | | (11.9) | | | — | | | (11.9) |
Net realized investment losses,
excluding OTTI losses | | (12.5) | | | (1.5) | | | (14.0) | | | — | | | (14.0) |
Net realized investment losses | | (23.8) | | | (2.1) | | | (25.9) | | | — | | | (25.9) |
Gain on debt repurchase | | — | | | — | | | — | | | | | | — |
Total revenues | | 890.6 | | | (18.2) | | | 872.4 | | | — | | | 872.4 |
| | | | | | | | | | | | | | |
BENEFITS AND EXPENSES: | | | | | | | | | | | | | | |
Policy benefits, excluding policyholder dividends | | 513.1 | | | 23.3 | | | 536.4 | | | — | | | 536.4 |
Policyholder dividends | | 149.4 | | | (8.1) | | | 141.3 | | | — | | | 141.3 |
Policy acquisition cost amortization | | 92.0 | | | 0.9 | | | 92.9 | | | — | | | 92.9 |
Interest expense on indebtedness | | 15.8 | | | — | | | 15.8 | | | — | | | 15.8 |
Other operating expenses | | 121.3 | | | 3.9 | | | 125.2 | | | — | | | 125.2 |
Total benefits and expenses | | 891.6 | | | 20.0 | | | 911.6 | | | — | | | 911.6 |
Loss from continuing operations
before income taxes | | (1.0) | | | (38.2) | | | (39.2) | | | — | | | (39.2) |
Income tax expense (benefit) | | 13.5 | | | (9.6) | | | 3.9 | | | — | | | 3.9 |
Loss from continuing operations | | (14.5) | | | (28.6) | | | (43.1) | | | — | | | (43.1) |
Income (loss) from discontinued operations,
net of income taxes | | (6.8) | | | 0.8 | | | (6.0) | | | — | | | (6.0) |
Net loss | | (21.3) | | | (27.8) | | | (49.1) | | | — | | | (49.1) |
Less: Net income (loss) attributable to
noncontrolling interests | | — | | | (0.2) | | | (0.2) | | | — | | | (0.2) |
Net loss attributable to
The Phoenix Companies, Inc. | $ | (21.3) | | $ | (27.6) | | $ | (48.9) | | $ | — | | $ | (48.9) |
(Continued on next page)
F-128
27.
Supplemental Unaudited Quarterly Financial Information (continued)
| | | | | | | | | | | | | | |
(Continued from previous page) | Consolidated Statement of Comprehensive Income |
($ in millions, except share data) | Six months ended June 30, 2012 |
| As previously reported | | Correction of errors (1) | | Adjusted prior to the retrospective adoption | | Retrospective Adoption(2) | | As restated and amended |
|
|
|
COMPREHENSIVE INCOME (LOSS): | | | | | | | | | | | | | | |
Net loss attributable to
The Phoenix Companies, Inc. | $ | (21.3) | | $ | (27.6) | | $ | (48.9) | | $ | — | | $ | (48.9) |
Net income (loss) attributable to
noncontrolling interests | | — | | | (0.2) | | | (0.2) | | | — | | | (0.2) |
Net loss | | (21.3) | | | (27.8) | | | (49.1) | | | — | | | (49.1) |
Other comprehensive income (loss)
before income taxes: | | | | | | | | | | | | | | |
Net unrealized investment gains (losses)
before income taxes | | 56.2 | | | (6.8) | | | 49.4 | | | — | | | 49.4 |
Non-credit portion of OTTI losses
recognized in OCI before income taxes | | (0.6) | | | 1.9 | | | 1.3 | | | — | | | 1.3 |
Net pension liability adjustment
before income taxes | | (19.1) | | | 16.6 | | | (2.5) | | | — | | | (2.5) |
Net unrealized other gains (losses)
before income taxes | | — | | | — | | | — | | | — | | | — |
Net unrealized derivative instruments
gains (losses) before income taxes | | 0.3 | | | (0.3) | | | — | | | — | | | — |
Other comprehensive income (loss)
before income taxes | | 36.8 | | | 11.4 | | | 48.2 | | | — | | | 48.2 |
Less: Income tax expense (benefit) related to: | | | | | | | | | | | | | | |
Net unrealized investment gains (losses) | | 27.1 | | | 17.4 | | | 44.5 | | | — | | | 44.5 |
Non-credit portion of OTTI losses
recognized in OCI | | (0.2) | | | 0.6 | | | 0.4 | | | — | | | 0.4 |
Net pension liability adjustment | | — | | | — | | | — | | | — | | | — |
Net unrealized other gains (losses) | | — | | | — | | | — | | | — | | | — |
Net unrealized derivative instrument
gains (losses) | | — | | | — | | | — | | | — | | | — |
Total income tax expense (benefit) | | 26.9 | | | 18.0 | | | 44.9 | | | — | | | 44.9 |
Other comprehensive income (loss),
net of income taxes | | 9.9 | | | (6.6) | | | 3.3 | | | — | | | 3.3 |
Comprehensive income (loss) | | (11.4) | | $ | (34.4) | | $ | (45.8) | | $ | — | | $ | (45.8) |
Less: Comprehensive income (loss) attributable
to noncontrolling interests, net of income taxes | | — | | | (0.2) | | | (0.2) | | | — | | | (0.2) |
Comprehensive income (loss) attributable
to The Phoenix Companies, Inc. | $ | (11.4) | | $ | (34.2) | | $ | (45.6) | | $ | — | | $ | (45.6) |
| | | | | | | | | | | | | | |
EARNINGS (LOSS) PER SHARE:(3) | | | | | | | | | | | | | | |
Loss from continuing operations – basic | $ | (2.49) | | $ | (4.92) | | | | | $ | — | | $ | (7.41) |
Loss from continuing operations – diluted | $ | (2.49) | | $ | (4.92) | | | | | $ | — | | $ | (7.41) |
Earnings (loss) from
discontinued operations – basic | $ | (1.17) | | $ | 0.14 | | | | | $ | — | | $ | (1.03) |
Earnings (loss) from
discontinued operations – diluted | $ | (1.17) | | $ | 0.14 | | | | | $ | — | | $ | (1.03) |
Net loss attributable to
The Phoenix Companies, Inc.– basic | $ | (3.66) | | $ | (4.75) | | | | | $ | — | | $ | (8.41) |
Net loss attributable to
The Phoenix Companies, Inc.– diluted | $ | (3.66) | | $ | (4.75) | | | | | $ | — | | $ | (8.41) |
Basic weighted-average common shares
outstanding (in thousands) | | 5,814 | | | 5,814 | (4) | | | | | — | | | 5,814 |
Diluted weighted-average common shares
outstanding (in thousands) | | 5,814 | | | 5,814 | (4) | | | | | — | | | 5,814 |
———————
(1)
Adjustments related to the correction of errors reflect amounts prior to the retrospective adoption of amended guidance to ASC 944,Financial Services – Insurance (ASU 2010-26). See footnote 2 below for additional information regarding these amounts and the retrospective adoption.
(2)
Adjustments related to the retrospective adoption of amended guidance to ASC 944,Financial Services – Insurance (ASU 2010-26), have been updated from those originally disclosed in the First Quarter 2012 Quarterly Report on Form 10-Q filing to reflect the correction of errors identified related to the adoption of the amended guidance as well as indirect impact of the correction of errors associated with the restatement.
(3)
All share amounts for all periods reflect the 1-for-20 reverse stock split, which was effective August 10, 2012. See Note 11 to these consolidated financial statements for additional information on the reverse stock split.
(4)
Weighted-average common shares outstanding have been updated to reflect the impact of an error which had no material impact to EPS information, basic or diluted, for any period presented.
F-129
27.
Supplemental Unaudited Quarterly Financial Information (continued)
| | | |
Consolidated Balance Sheet |
As of September 30, 2012 |
($ in millions, except share data) | |
| |
ASSETS: | | |
Available-for-sale debt securities, at fair value | $ | 12,436.7 |
Available-for-sale equity securities, at fair value | | 30.9 |
Limited partnerships and other investments | | 559.2 |
Policy loans, at unpaid principal balances | | 2,338.4 |
Derivative investments | | 195.1 |
Fair value investments | | 213.8 |
Total investments | | 15,774.1 |
Cash and cash equivalents | | 283.8 |
Accrued investment income | | 207.8 |
Receivables | | 663.1 |
Deferred policy acquisition costs | | 944.4 |
Deferred income taxes, net | | 61.1 |
Other assets | | 279.3 |
Discontinued operations assets | | 53.9 |
Separate account assets | | 3,395.4 |
Total assets | $ | 21,662.9 |
| | |
LIABILITIES: | | |
Policy liabilities and accruals | $ | 12,657.1 |
Policyholder deposit funds | | 2,914.6 |
Dividend obligations (1) | | 991.0 |
Indebtedness | | 378.8 |
Other liabilities | | 730.5 |
Discontinued operations liabilities | | 48.8 |
Separate account liabilities | | 3,395.4 |
Total liabilities | | 21,116.2 |
| | |
COMMITMENTS AND CONTINGENT LIABILITIES (Notes 23, 24, & 25) | | |
| | |
STOCKHOLDERS’ EQUITY: | | |
Common stock, $.01 par value: 5.7 million shares outstanding (2) | | 0.1 |
Additional paid-in capital | | 2,632.7 |
Accumulated other comprehensive loss | | (232.0) |
Accumulated deficit | | (1,676.4) |
Treasury stock, at cost: 0.6 million shares (2) | | (182.9) |
Total The Phoenix Companies, Inc. stockholders’ equity | | 541.5 |
Noncontrolling interests | | 5.2 |
Total stockholders’ equity | | 546.7 |
Total liabilities and stockholders’ equity | $ | 21,662.9 |
———————
(1)
Dividendobligations were previously included in policy liabilities and accruals.
(2)
All share amounts for all periods reflect the 1-for-20 reverse stock split, which was effective August 10, 2012. See Note 11 to these consolidated financial statements for additional information on the reverse stock split.
F-130
27.
Supplemental Unaudited Quarterly Financial Information (continued)
| | | | | | | | | | | | | | | | | | |
| Consolidated Balance Sheet |
($ in millions, except share data) | As of June 30, 2012 |
| As previously reported | | Correction of errors (1) | | Adjusted prior to the retrospective adoption | | Retrospective Adoption(2) | | As restated and amended |
|
|
|
ASSETS: | | | | | | | | | | | | | | |
Available-for-sale debt securities, at fair value | $ | 12,335.3 | | $ | (111.3) | | $ | 12,224.0 | | $ | — | | $ | 12,224.0 |
Available-for-sale equity securities, at fair value | | 42.1 | | | (4.6) | | | 37.5 | | | — | | | 37.5 |
Limited partnerships and other investments | | 618.5 | | | (57.0) | | | 561.5 | | | — | | | 561.5 |
Policy loans, at unpaid principal balances | | 2,362.4 | | | — | | | 2,362.4 | | | — | | | 2,362.4 |
Derivative investments | | 186.6 | | | (9.0) | | | 177.6 | | | — | | | 177.6 |
Fair value investments | | 87.0 | | | 111.0 | | | 198.0 | | | — | | | 198.0 |
Total investments | | 15,631.9 | | | (70.9) | | | 15,561.0 | | | — | | | 15,561.0 |
Cash and cash equivalents | | 248.9 | | | (35.9) | | | 213.0 | | | — | | | 213.0 |
Accrued investment income | | 186.6 | | | — | | | 186.6 | | | — | | | 186.6 |
Receivables | | 422.5 | | | 246.7 | | | 669.2 | | | — | | | 669.2 |
Deferred policy acquisition costs | | 1,076.0 | | | (62.7) | | | 1,013.3 | | | — | | | 1,013.3 |
Deferred income taxes, net | | 91.7 | | | (2.1) | | | 89.6 | | | — | | | 89.6 |
Other assets | | 156.8 | | | 69.6 | | | 226.4 | | | — | | | 226.4 |
Discontinued operations assets | | 43.6 | | | 14.6 | | | 58.2 | | | — | | | 58.2 |
Separate account assets | | 3,336.8 | | | — | | | 3,336.8 | | | — | | | 3,336.8 |
Total assets | $ | 21,194.8 | | $ | 159.3 | | $ | 21,354.1 | | $ | — | | $ | 21,354.1 |
| | | | | | | | | | | | | | |
LIABILITIES: | | | | | | | | | | | | | | |
Policy liabilities and accruals | $ | 13,040.1 | | $ | (436.5) | | $ | 12,603.6 | | $ | — | | $ | 12,603.6 |
Policyholder deposit funds | | 2,767.1 | | | — | | | 2,767.1 | | | — | | | 2,767.1 |
Dividend obligations (3) | | — | | | 875.5 | | | 875.5 | | | — | | | 875.5 |
Indebtedness | | 426.9 | | | — | | | 426.9 | | | — | | | 426.9 |
Other liabilities | | 642.7 | | | — | | | 642.7 | | | — | | | 642.7 |
Discontinued operations liabilities | | 34.6 | | | 14.6 | | | 49.2 | | | — | | | 49.2 |
Separate account liabilities | | 3,336.8 | | | — | | | 3,336.8 | | | — | | | 3,336.8 |
Total liabilities | | 20,248.2 | | | 453.6 | | | 20,701.8 | | | — | | | 20,701.8 |
| | | | | | | | | | | | | | |
COMMITMENTS AND CONTINGENT LIABILITIES (Notes 23, 24, & 25) | | | | | | | | | | | | | | |
| | | | | | | | | | | | | | |
STOCKHOLDERS’ EQUITY: | | | | | | | | | | | | | | |
Common stock, $.01 par value: 5.7 million
shares outstanding (4) | | 1.3 | | | — | | | 1.3 | | | — | | | 1.3 |
Additional paid-in capital | | 2,631.0 | | | — | | | 2,631.0 | | | — | | | 2,631.0 |
Accumulated other comprehensive loss | | (124.9) | | | (102.4) | | | (227.3) | | | — | | | (227.3) |
Accumulated deficit | | (1,380.8) | | | (196.8) | | | (1,577.6) | | | — | | | (1,577.6) |
Treasury stock, at cost: 0.6 million shares (4) | | (180.0) | | | — | | | (180.0) | | | — | | | (180.0) |
Total The Phoenix Companies, Inc.
stockholders’ equity | | 946.6 | | | (299.2) | | | 647.4 | | | — | | | 647.4 |
Noncontrolling interests | | — | | | 4.9 | | | 4.9 | | | — | | | 4.9 |
Total stockholders’ equity | | 946.6 | | | (294.3) | | | 652.3 | | | — | | | 652.3 |
Total liabilities and stockholders’ equity | $ | 21,194.8 | | $ | 159.3 | | $ | 21,354.1 | | $ | — | | $ | 21,354.1 |
———————
(1)
Adjustments related to the correction of errors reflect amounts prior to the retrospective adoption of amended guidance to ASC 944,Financial Services – Insurance (ASU 2010-26). See footnote 2 below for additional information regarding these amounts and the retrospective adoption.
(2)
Adjustments related to the retrospective adoption of amended guidance to ASC 944,Financial Services – Insurance (ASU 2010-26), have been updated from those originally disclosed in the First Quarter 2012 Quarterly Report on Form 10-Q filing to reflect the correction of errors identified related to the adoption of the amended guidance as well as indirect impact of the correction of errors associated with the restatement.
(3)
Dividend obligations were previously included in policy liabilities and accruals.
(4)
All share amounts for all periods reflect the 1-for-20 reverse stock split, which was effective August 10, 2012. See Note 11 to these consolidated financial statements for additional information on the reverse stock split.
F-131
27.
Supplemental Unaudited Quarterly Financial Information (continued)
| | | | | | | | | | | | | | | | | | |
| Consolidated Balance Sheet |
($ in millions, except share data) | As of March 31, 2012 |
| As previously reported | | Correction of errors (1) | | Adjusted prior to the retrospective adoption | | Retrospective Adoption(2) | | As restated and amended |
|
|
|
ASSETS: | | | | | | | | | | | | | | |
Available-for-sale debt securities, at fair value | $ | 12,132.9 | | $ | (70.2) | | $ | 12,062.7 | | $ | — | | $ | 12,062.7 |
Available-for-sale equity securities, at fair value | | 42.1 | | | (3.7) | | | 38.4 | | | — | | | 38.4 |
Limited partnerships and other investments | | 613.0 | | | (40.7) | | | 572.3 | | | — | | | 572.3 |
Policy loans, at unpaid principal balances | | 2,374.8 | | | — | | | 2,374.8 | | | — | | | 2,374.8 |
Derivative investments | | 180.6 | | | (6.0) | | | 174.6 | | | — | | | 174.6 |
Fair value investments | | 89.2 | | | 95.4 | | | 184.6 | | | — | | | 184.6 |
Total investments | | 15,432.6 | | | (25.2) | | | 15,407.4 | | | — | | | 15,407.4 |
Cash and cash equivalents | | 209.6 | | | (32.6) | | | 177.0 | | | — | | | 177.0 |
Accrued investment income | | 182.5 | | | — | | | 182.5 | | | — | | | 182.5 |
Receivables | | 398.6 | | | 250.9 | | | 649.5 | | | — | | | 649.5 |
Deferred policy acquisition costs | | 1,122.1 | | | (59.2) | | | 1,062.9 | | | — | | | 1,062.9 |
Deferred income taxes, net | | 93.6 | | | (1.5) | | | 92.1 | | | — | | | 92.1 |
Other assets | | 144.5 | | | 82.5 | | | 227.0 | | | — | | | 227.0 |
Discontinued operations assets | | 67.8 | | | 14.9 | | | 82.7 | | | — | | | 82.7 |
Separate account assets | | 4,041.6 | | | 1.0 | | | 4,042.6 | | | — | | | 4,042.6 |
Total assets | $ | 21,692.9 | | $ | 230.8 | | $ | 21,923.7 | | $ | — | | $ | 21,923.7 |
| | | | | | | | | | | | | | |
LIABILITIES: | | | | | | | | | | | | | | |
Policy liabilities and accruals | $ | 12,971.0 | | $ | (375.5) | | $ | 12,595.5 | | $ | — | | $ | 12,595.5 |
Policyholder deposit funds | | 2,602.5 | | | 2.0 | | | 2,604.5 | | | — | | | 2,604.5 |
Dividend obligations (3) | | — | | | 802.4 | | | 802.4 | | | — | | | 802.4 |
Indebtedness | | 426.9 | | | — | | | 426.9 | | | — | | | 426.9 |
Other liabilities | | 645.3 | | | 44.9 | | | 690.2 | | | — | | | 690.2 |
Discontinued operations liabilities | | 57.4 | | | 14.9 | | | 72.3 | | | — | | | 72.3 |
Separate account liabilities | | 4,041.6 | | | 1.0 | | | 4,042.6 | | | — | | | 4,042.6 |
Total liabilities | | 20,744.7 | | | 489.7 | | | 21,234.4 | | | — | | | 21,234.4 |
| | | | | | | | | | | | | | |
COMMITMENTS AND CONTINGENT LIABILITIES (Notes 23, 24, & 25) | | | | | | | | | | | | | | |
| | | | | | | | | | | | | | |
STOCKHOLDERS’ EQUITY: | | | | | | | | | | | | | | |
Common stock, $.01 par value: 5.7 million
shares outstanding (4) | | 1.3 | | | — | | | 1.3 | | | — | | | 1.3 |
Additional paid-in capital | | 2,630.8 | | | — | | | 2,630.8 | | | — | | | 2,630.8 |
Accumulated other comprehensive loss | | (136.8) | | | (87.1) | | | (223.9) | | | — | | | (223.9) |
Accumulated deficit | | (1,367.6) | | | (174.6) | | | (1,542.2) | | | — | | | (1,542.2) |
Treasury stock, at cost: 0.6 million shares (4) | | (179.5) | | | — | | | (179.5) | | | — | | | (179.5) |
Total The Phoenix Companies, Inc.
stockholders’ equity | | 948.2 | | | (261.7) | | | 686.5 | | | — | | | 686.5 |
Noncontrolling interests | | — | | | 2.8 | | | 2.8 | | | — | | | 2.8 |
Total stockholders’ equity | | 948.2 | | | (258.9) | | | 689.3 | | | — | | | 689.3 |
Total liabilities and stockholders’ equity | $ | 21,692.9 | | $ | 230.8 | | $ | 21,923.7 | | $ | — | | $ | 21,923.7 |
———————
(1)
Adjustments related to the correction of errors reflect amounts prior to the retrospective adoption of amended guidance to ASC 944,Financial Services – Insurance (ASU 2010-26). See footnote 2 below for additional information regarding these amounts and the retrospective adoption.
(2)
Adjustments related to the retrospective adoption of amended guidance to ASC 944,Financial Services – Insurance (ASU 2010-26), have been updated from those originally disclosed in the First Quarter 2012 Quarterly Report on Form 10-Q filing to reflect the correction of errors identified related to the adoption of the amended guidance as well as indirect impact of the correction of errors associated with the restatement.
(3)
Dividend obligations were previously included in policy liabilities and accruals.
(4)
All share amounts for all periods reflect the 1-for-20 reverse stock split, which was effective August 10, 2012. See Note 11 to these consolidated financial statements for additional information on the reverse stock split.
F-132
27.
Supplemental Unaudited Quarterly Financial Information (continued)
| | |
Consolidated Statement of Changes in Stockholders’ Equity |
For the period ended September 30, 2012 |
($ in millions, except share data) | |
| |
COMMON STOCK:(1) | | |
Balance, beginning of period | $ | 1.3 |
Adjustment for reverse stock split | | (1.2) |
Balance, end of period | $ | 0.1 |
| | |
ADDITIONAL PAID-IN CAPITAL: | | |
Balance, beginning of period | $ | 2,630.5 |
Issuance of shares and compensation expense on stock compensation awards | | 2.2 |
Adjustment for reverse stock split | | — |
Balance, end of period | $ | 2,632.7 |
| | |
ACCUMULATED OTHER COMPREHENSIVE INCOME (LOSS): | $ | |
Balance, beginning of period | | (230.7) |
Adjustment for initial application of accounting changes | | — |
Other comprehensive income (loss) | | (1.3) |
Balance, end of period | $ | (232.0) |
| | |
ACCUMULATED DEFICIT: | | |
Balance, beginning of period | $ | (1,528.7) |
Adjustment for initial application of accounting changes | | — |
Net income (loss) | | (147.7) |
Balance, end of period | $ | (1,676.4) |
| | |
TREASURY STOCK, AT COST:(1) | | |
Balance, beginning of period | $ | (179.5) |
Treasury shares purchased | | (3.4) |
Balance, end of period | $ | (182.9) |
| | |
TOTAL STOCKHOLDERS’ EQUITY ATTRIBUTABLE TO THE PHOENIX COMPANIES, INC.: | | |
Balance, beginning of period | $ | 692.9 |
Adjustment for initial application of accounting changes | | — |
Change in stockholders’ equity attributable to The Phoenix Companies, Inc. | | (151.4) |
Stockholders’ equity, end of period | $ | 541.5 |
| | |
NONCONTROLLING INTERESTS: | | |
Balance, beginning of period | $ | 2.8 |
Change in noncontrolling interests | | 2.4 |
Balance, end of period | $ | 5.2 |
| | |
TOTAL STOCKHOLDERS’ EQUITY: | | |
Balance, beginning of period | $ | 695.7 |
Adjustment for initial application of accounting changes | | — |
Change in stockholders’ equity | | (149.0) |
Stockholders’ equity, end of period | $ | 546.7 |
———————
(1)
Reflects the 1-for-20 reverse stock split, which was effective August 10, 2012. See Note 11 to these consolidated financial statements for additional information on the reverse stock split.
F-133
27.
Supplemental Unaudited Quarterly Financial Information (continued)
| | | | | | | | | | | | | | |
| Consolidated Statement of Changes in Stockholders’ Equity |
($ in millions, except share data) | For the period ended June 30, 2012 |
| As previously reported | | Correction of errors(1) | | Adjusted prior to the retrospective adoption | | Retrospective Adoption(2) | | As restated and amended |
|
|
|
COMMON STOCK:(3) | | | | | | | | | | | | | | |
Balance, beginning of period | $ | 1.3 | | $ | — | | $ | 1.3 | | $ | — | | $ | 1.3 |
Adjustment for reverse stock split | | — | | | — | | | — | | | — | | | — |
��Balance, end of period | $ | 1.3 | | $ | — | | $ | 1.3 | | $ | — | | $ | 1.3 |
| | | | | | | | | | | | | | |
ADDITIONAL PAID-IN CAPITAL: | | | | | | | | | | | | | | |
Balance, beginning of period | $ | 2,630.5 | | $ | — | | $ | 2,630.5 | | $ | — | | $ | 2,630.5 |
Issuance of shares and compensation expense
on stock compensation awards | | 0.5 | | | — | | | 0.5 | | | — | | | 0.5 |
Adjustment for reverse stock split | | — | | | — | | | — | | | — | | | — |
Balance, end of period | $ | 2,631.0 | | $ | — | | $ | 2,631.0 | | $ | — | | $ | 2,631.0 |
| | | | | | | | | | | | | | |
ACCUMULATED OTHER COMPREHENSIVE
INCOME (LOSS): | $ | | | | | | | | | | | | | |
Balance, beginning of period | | (170.7) | | $ | (103.5) | | $ | (274.2) | | $ | 43.5 | | $ | (230.7) |
Adjustment for initial application of
accounting changes | | — | | | — | | | — | | | — | | | — |
Other comprehensive income (loss) | | 9.9 | | | (6.5) | | | 3.4 | | | — | | | 3.4 |
Balance, end of period | $ | (160.8) | | $ | (110.0) | | $ | (270.8) | | $ | 43.5 | | $ | (227.3) |
| | | | | | | | | | | | | | |
ACCUMULATED DEFICIT: | | | | | | | | | | | | | | |
Balance, beginning of period | $ | (1,155.4) | | $ | (163.3) | | $ | (1,318.7) | | $ | (210.0) | | $ | (1,528.7) |
Adjustment for initial application of
accounting changes | | — | | | — | | | — | | | — | | | — |
Net loss | | (21.3) | | | (27.6) | | | (48.9) | | | — | | | (48.9) |
Balance, end of period | $ | (1,176.7) | | $ | (190.9) | | $ | (1,367.6) | | $ | (210.0) | | $ | (1,577.6) |
| | | | | | | | | | | | | | |
TREASURY STOCK, AT COST:(3) | | | | | | | | | | | | | | |
Balance, beginning of period | $ | (179.5) | | $ | — | | $ | (179.5) | | $ | — | | $ | (179.5) |
Treasury shares purchased | | (0.5) | | | — | | | (0.5) | | | — | | | (0.5) |
Balance, end of period | $ | (180.0) | | $ | — | | $ | (180.0) | | $ | — | | $ | (180.0) |
| | | | | | | | | | | | | | |
TOTAL STOCKHOLDERS’ EQUITY
ATTRIBUTABLE TO
THE PHOENIX COMPANIES INC.: | | | | | | | | | | | | | | |
Balance, beginning of period | $ | 1,126.2 | | $ | (266.8) | | $ | 859.4 | | $ | (166.5) | | $ | 692.9 |
Adjustment for initial application of
accounting changes | | — | | | — | | | — | | | — | | | — |
Change in stockholders’ equity attributable to
The Phoenix Companies, Inc. | | (11.4) | | | (34.1) | | | (45.5) | | | — | | | (45.5) |
Stockholders’ equity, end of period | $ | 1,114.8 | | $ | (300.9) | | $ | 813.9 | | $ | (166.5) | | $ | 647.4 |
| | | | | | | | | | | | | | |
NONCONTROLLING INTERESTS: | | | | | | | | | | | | | | |
Balance, beginning of period | $ | — | | $ | 2.8 | | $ | 2.8 | | | — | | $ | 2.8 |
Change in noncontrolling interests | | — | | | 2.1 | | | 2.1 | | | — | | | 2.1 |
Balance, end of period | $ | — | | $ | 4.9 | | $ | 4.9 | | $ | — | | $ | 4.9 |
| | | | | | | | | | | | | | |
TOTAL STOCKHOLDERS’ EQUITY: | | | | | | | | | | | | | | |
Balance, beginning of period | $ | 1,126.2 | | $ | (264.0) | | $ | 862.2 | | $ | (166.5) | | $ | 695.7 |
Adjustment for initial application of
accounting changes | | — | | | — | | | — | | | — | | | — |
Change in stockholders’ equity | | (11.4) | | | (32.0) | | | (43.4) | | | — | | | (43.4) |
Stockholders’ equity, end of period | $ | 1,114.8 | | $ | (296.0) | | $ | 818.8 | | $ | (166.5) | | $ | 652.3 |
———————
(1)
Adjustments related to the correction of errors reflect amounts prior to the retrospective adoption of amended guidance to ASC 944,Financial Services – Insurance (ASU 2010-26). See footnote 2 below for additional information regarding these amounts and the retrospective adoption.
(2)
Adjustments related to the retrospective adoption of amended guidance to ASC 944,Financial Services – Insurance (ASU 2010-26), have been updated from those originally disclosed in the First Quarter 2012 Quarterly Report on Form 10-Q filing to reflect the correction of errors identified related to the adoption of the amended guidance as well as indirect impact of the correction of errors associated with the restatement.
(3)
Reflects the 1-for-20 reverse stock split, which was effective August 10, 2012. See Note 11 to these consolidated financial statements for additional information on the reverse stock split.
F-134
27.
Supplemental Unaudited Quarterly Financial Information (continued)
| | | | | | | | | | | | | | |
| Consolidated Statement of Changes in Stockholders’ Equity |
($ in millions, except share data) | For the period ended March 31, 2012 |
| As previously reported | | Correction of errors(1) | | Adjusted prior to the retrospective adoption | | Retrospective Adoption(2) | | As restated and amended |
|
|
|
COMMON STOCK:(3) | | | | | | | | | | | | | | |
Balance, beginning of period | $ | 1.3 | | $ | — | | $ | 1.3 | | $ | — | | $ | 1.3 |
Adjustment for reverse stock split | | — | | | — | | | — | | | — | | | — |
Balance, end of period | $ | 1.3 | | $ | — | | $ | 1.3 | | $ | — | | $ | 1.3 |
| | | | | | | | | | | | | | |
ADDITIONAL PAID-IN CAPITAL: | | | | | | | | | | | | | | |
Balance, beginning of period | $ | 2,630.5 | | $ | — | | $ | 2,630.5 | | $ | — | | $ | 2,630.5 |
Issuance of shares and compensation expense
on stock compensation awards | | 0.3 | | | — | | | 0.3 | | | — | | | 0.3 |
Adjustment for reverse stock split | | — | | | — | | | — | | | — | | | — |
Balance, end of period | $ | 2,630.8 | | $ | — | | $ | 2,630.8 | | $ | — | | $ | 2,630.8 |
| | | | | | | | | | | | | | |
ACCUMULATED OTHER COMPREHENSIVE
INCOME (LOSS): | $ | | | | | | | | | | | | | |
Balance, beginning of period | | (170.7) | | $ | (103.5) | | $ | (274.2) | | $ | 43.5 | | $ | (230.7) |
Adjustment for initial application of
accounting changes | | — | | | — | | | — | | | — | | | — |
Other comprehensive income (loss) | | (2.0) | | | 8.8 | | | 6.8 | | | — | | | 6.8 |
Balance, end of period | $ | (172.7) | | $ | (94.7) | | $ | (267.4) | | $ | 43.5 | | $ | (223.9) |
| | | | | | | | | | | | | | |
ACCUMULATED DEFICIT: | | | | | | | | | | | | | | |
Balance, beginning of period | $ | (1,155.4) | | $ | (163.3) | | $ | (1,318.7) | | $ | (210.0) | | $ | (1,528.7) |
Adjustment for initial application of
accounting changes | | — | | | — | | | — | | | — | | | — |
Net loss | | (8.1) | | | (5.4) | | | (13.5) | | | — | | | (13.5) |
Balance, end of period | $ | (1,163.5) | | $ | (168.7) | | $ | (1,332.2) | | $ | (210.0) | | $ | (1,542.2) |
| | | | | | | | | | | | | | |
TREASURY STOCK, AT COST:(3) | | | | | | | | | | | | | | |
Balance, beginning of period | $ | (179.5) | | $ | — | | $ | (179.5) | | $ | — | | $ | (179.5) |
Treasury shares purchased | | — | | | — | | | — | | | — | | | — |
Balance, end of period | $ | (179.5) | | $ | — | | $ | (179.5) | | $ | — | | $ | (179.5) |
| | | | | | | | | | | | | | |
TOTAL STOCKHOLDERS’ EQUITY
ATTRIBUTABLE TO
THE PHOENIX COMPANIES: | | | | | | | | | | | | | | |
Balance, beginning of period | $ | 1,126.2 | | $ | (266.8) | | $ | 859.4 | | $ | (166.5) | | $ | 692.9 |
Adjustment for initial application of
accounting changes | | — | | | — | | | — | | | — | | | — |
Change in stockholders’ equity attributable to
The Phoenix Companies, Inc. | | (9.8) | | | 3.4 | | | (6.4) | | | — | | | (6.4) |
Stockholders’ equity, end of period | $ | 1,116.4 | | $ | (263.4) | | $ | 853.0 | | $ | (166.5) | | $ | 686.5 |
| | | | | | | | | | | | | | |
NONCONTROLLING INTERESTS: | | | | | | | | | | | | | | |
Balance, beginning of period | $ | — | | $ | 2.8 | | $ | 2.8 | | | — | | $ | 2.8 |
Change in noncontrolling interests | | — | | | — | | | — | | | — | | | — |
Balance, end of period | $ | — | | $ | 2.8 | | $ | 2.8 | | $ | — | | $ | 2.8 |
| | | | | | | | | | | | | | |
TOTAL STOCKHOLDERS’ EQUITY: | | | | | | | | | | | | | | |
Balance, beginning of period | $ | 1,126.2 | | $ | (264.0) | | $ | 862.2 | | $ | (166.5) | | $ | 695.7 |
Adjustment for initial application of
accounting changes | | — | | | — | | | — | | | — | | | — |
Change in stockholders’ equity | | (9.8) | | | 3.4 | | | (6.4) | | | — | | | (6.4) |
Stockholders’ equity, end of period | $ | 1,116.4 | | $ | (260.6) | | $ | 855.8 | | $ | (166.5) | | $ | 689.3 |
———————
(1)
Adjustments related to the correction of errors reflect amounts prior to the retrospective adoption of amended guidance to ASC 944,Financial Services – Insurance (ASU 2010-26). See footnote 2 below for additional information regarding these amounts and the retrospective adoption.
(2)
Adjustments related to the retrospective adoption of amended guidance to ASC 944,Financial Services – Insurance (ASU 2010-26), have been updated from those originally disclosed in the First Quarter 2012 Quarterly Report on Form 10-Q filing to reflect the correction of errors identified related to the adoption of the amended guidance as well as indirect impact of the correction of errors associated with the restatement.
(3)
Reflects the 1-for-20 reverse stock split, which was effective August 10, 2012. See Note 11 to these consolidated financial statements for additional information on the reverse stock split.
F-135
27.
Supplemental Unaudited Quarterly Financial Information (continued)
| | |
Consolidated Statement of Cash Flows |
For the period ended September 30, 2012 |
($ in millions) | |
| |
OPERATING ACTIVITIES: | | |
Net loss | $ | (147.7) |
Net realized investment losses | | 4.2 |
Gain on debt repurchase | | (11.9) |
Policy acquisition costs deferred | | (56.2) |
Amortization of deferred policy acquisition costs | | 164.6 |
Amortization and depreciation | | 9.9 |
Interest credited | | 90.1 |
Equity in earnings of limited partnerships and other investments | | (46.0) |
Change in: | | |
Accrued investment income | | (118.1) |
Deferred income taxes | | (24.7) |
Receivables | | (19.8) |
Policy liabilities and accruals | | (312.4) |
Dividend obligations | | 66.9 |
Impact of operating activities of consolidated investment entities, net | | — |
Other operating activities, net | | (2.3) |
Cash used for operating activities | | (403.4) |
| | |
INVESTING ACTIVITIES: | | |
Purchases of: | | |
Available-for-sale debt securities | | (2,367.7) |
Available-for-sale equity securities | | (6.3) |
Derivative instruments | | (46.0) |
Fair value investments | | (27.7) |
Other investments | | (1.0) |
Sales, repayments and maturities of: | | |
Available-for-sale debt securities | | 2,190.1 |
Available-for-sale equity securities | | 7.9 |
Derivative instruments | | 16.2 |
Fair value investments | | 9.3 |
Other investments | | 8.3 |
Contributions to limited partnerships and limited liability corporations | | (63.7) |
Distributions from limited partnerships and limited liability corporations | | 101.9 |
Policy loans, net | | 106.7 |
Impact of investing activities of consolidated investment entities, net | | — |
Other investing activities, net | | (5.8) |
Cash used for investing activities | | (77.8) |
| | |
FINANCING ACTIVITIES: | | |
Policyholder deposit fund deposits | | 1,216.3 |
Policyholder deposit fund withdrawals | | (861.8) |
Net transfers to/from separate accounts | | 279.4 |
Impact of financing activities of consolidated investment entities, net | | 0.1 |
Other financing activities, net | | (39.6) |
Cash provided by financing activities | | 594.4 |
Change in cash and cash equivalents | | 113.2 |
Change in cash included in discontinued operations assets | | 2.4 |
Cash and cash equivalents, beginning of period | | 168.2 |
Cash and cash equivalents, end of period | $ | 283.8 |
| | |
Supplemental Disclosure of Cash Flow Information | | |
Income taxes paid | $ | (3.3) |
Interest expense on indebtedness paid | $ | (20.4) |
| | |
Non-Cash Transactions During the Year | | |
Investment exchanges | $ | 84.4 |
F-136
27.
Supplemental Unaudited Quarterly Financial Information (continued)
| | | | | | | | | | | | | | |
| Consolidated Statement of Cash Flows |
($ in millions) | For the period ended June 30, 2012 |
| As previously reported | | Correction of errors (1) | | Adjusted prior to the retrospective adoption | | Retrospective Adoption(2) | | As restated and amended |
|
|
|
OPERATING ACTIVITIES: | | | | | | | | | | | | | | |
Net loss | $ | (21.3) | | $ | (27.6) | | $ | (48.9) | | $ | — | | $ | (48.9) |
Net realized investment gains (losses) | | 23.8 | | | 2.1 | | | 25.9 | | | — | | | 25.9 |
Gain on debt repurchase | | — | | | — | | | — | | | — | | | — |
Policy acquisition costs deferred | | (47.6) | | | 9.4 | | | (38.2) | | | — | | | (38.2) |
Amortization of deferred policy acquisition costs | | 92.0 | | | 0.9 | | | 92.9 | | | — | | | 92.9 |
Amortization and depreciation | | 6.9 | | | — | | | 6.9 | | | — | | | 6.9 |
Interest credited | | — | | | 58.6 | | | 58.6 | | | — | | | 58.6 |
Equity in earnings of
limited partnerships and other investments | | (41.7) | | | 4.7 | | | (37.0) | | | — | | | (37.0) |
Change in: | | | | | | | | | | | | | | |
Accrued investment income | | (18.0) | | | (49.4) | | | (67.4) | | | — | | | (67.4) |
Deferred income taxes | | (0.4) | | | (13.5) | | | (13.9) | | | — | | | (13.9) |
Receivables | | (8.4) | | | 7.4 | | | (1.0) | | | — | | | (1.0) |
Policy liabilities and accruals | | (46.9) | | | (201.8) | | | (248.7) | | | — | | | (248.7) |
Dividend obligations | | — | | | 36.2 | | | 36.2 | | | — | | | 36.2 |
Impact of operating activities of
consolidated investment entities, net | | — | | | (3.4) | | | (3.4) | | | — | | | (3.4) |
Other operating activities, net | | (7.6) | | | (16.1) | | | (23.7) | | | — | | | (23.7) |
Cash from (for) continuing operations | | (69.2) | | | (192.5) | | | (261.7) | | | — | | | (261.7) |
Discontinued operations, net | | (2.0) | | | 2.0 | | | — | | | — | | | — |
Cash used for operating activities | | (71.2) | | | (190.5) | | | (261.7) | | | — | | | (261.7) |
| | | | | | | | | | | | | | |
INVESTING ACTIVITIES: | | | | | | | | | | | | | | |
Purchases of: | | | | | | | | | | | | | | |
Available-for-sale debt securities | | (1,551.3) | | | 100.9 | | | (1,450.4) | | | — | | | (1,450.4) |
Available-for-sale equity securities | | (6.0) | | | 0.1 | | | (5.9) | | | — | | | (5.9) |
Derivative instruments | | (29.2) | | | — | | | (29.2) | | | — | | | (29.2) |
Fair value investments | | — | | | (16.0) | | | (16.0) | | | — | | | (16.0) |
Other investments | | (45.0) | | | 44.4 | | | (0.6) | | | — | | | (0.6) |
Sales, repayments and maturities of: | | | | | | | | | | | | | | |
Available-for-sale debt securities | | 1,323.5 | | | (66.4) | | | 1,257.1 | | | — | | | 1,257.1 |
Available-for-sale equity securities | | 0.4 | | | — | | | 0.4 | | | — | | | 0.4 |
Derivative instruments | | 12.1 | | | — | | | 12.1 | | | — | | | 12.1 |
Fair value investments | | 0.1 | | | 6.4 | | | 6.5 | | | — | | | 6.5 |
Other investments | | 75.5 | | | (65.4) | | | 10.1 | | | — | | | 10.1 |
Contributions to limited partnerships
and limited liability corporations | | — | | | (40.3) | | | (40.3) | | | — | | | (40.3) |
Distributions from limited partnerships
and limited liability corporations | | — | | | 65.5 | | | 65.5 | | | — | | | 65.5 |
Policy loans, net | | 16.9 | | | 55.1 | | | 72.0 | | | — | | | 72.0 |
Impact of investing activities of
consolidated investment entities, net | | — | | | — | | | — | | | — | | | — |
Other investing activities, net | | — | | | (2.0) | | | (2.0) | | | — | | | (2.0) |
Proceeds from sale of subsidiary | | 1.0 | | | (1.0) | | | — | | | — | | | — |
Premises and equipment additions | | (2.4) | | | 2.4 | | | — | | | — | | | — |
Discontinued operations, net | | 4.0 | | | (4.0) | | | — | | | — | | | — |
Cash provided by (used for) investing activities | | (200.4) | | | 79.7 | | | (120.7) | | | — | | | (120.7) |
(Continued on next page)
F-137
27.
Supplemental Unaudited Quarterly Financial Information (continued)
| | | | | | | | | | | | | | |
(Continued on next page) | Consolidated Statement of Cash Flows |
($ in millions) | For the period ended June 30, 2012 |
| As previously reported | | Correction of errors (1) | | Adjusted prior to the retrospective adoption | | Retrospective Adoption(2) | | As restated and amended |
|
|
|
FINANCING ACTIVITIES: | | | | | | | | | | | | | | |
Policyholder deposit fund deposits | | 650.1 | | | 176.3 | | | 826.4 | | | — | | | 826.4 |
Policyholder deposit fund withdrawals | | (323.4) | | | (281.9) | | | (605.3) | | | — | | | (605.3) |
Net transfers to/from separate accounts | | — | | | 204.2 | | | 204.2 | | | — | | | 204.2 |
Impact of financing activities of
consolidated investment entities, net | | — | | | 0.5 | | | 0.5 | | | — | | | 0.5 |
Other financing activities, net | | — | | | (0.5) | | | (0.5) | | | — | | | (0.5) |
Treasury stock acquired | | (0.5) | | | 0.5 | | | — | | | — | | | — |
Cash provided by financing activities | | 326.2 | | | 99.1 | | | 425.3 | | | — | | | 425.3 |
Change in cash and cash equivalents | | 54.6 | | | (11.7) | | | 42.9 | | | — | | | 42.9 |
Change in cash included in
discontinued operations assets | | — | | | 1.9 | | | 1.9 | | | — | | | 1.9 |
Cash and cash equivalents, beginning of period | | 194.3 | | | (26.1) | | | 168.2 | | | — | | | 168.2 |
Cash and cash equivalents, end of period | $ | 248.9 | | $ | (35.9) | | $ | 213.0 | | $ | — | | $ | 213.0 |
| | | | | | | | | | | | | | |
Supplemental Disclosure of Cash Flow Information | | | | | | | | | | | | | | |
Income taxes paid | $ | (3.3) | | $ | — | | $ | (3.3) | | $ | — | | $ | (3.3) |
Interest expense on indebtedness paid | $ | (15.7) | | $ | — | | $ | (15.7) | | $ | — | | $ | (15.7) |
| | | | | | | | | | | | | | |
Non-Cash Transactions During the Year | | | | | | | | | | | | | | |
Investment exchanges | $ | — | | $ | 59.1 | | $ | 59.1 | | $ | — | | $ | 59.1 |
———————
(1)
Adjustments related to the correction of errors reflect amounts prior to the retrospective adoption of amended guidance to ASC 944,Financial Services – Insurance (ASU 2010-26). See footnote 2 below for additional information regarding these amounts and the retrospective adoption.
(2)
Adjustments related to the retrospective adoption of amended guidance to ASC 944,Financial Services – Insurance (ASU 2010-26), have been updated from those originally disclosed in the First Quarter 2012 Quarterly Report on Form 10-Q filing to reflect the correction of errors identified related to the adoption of the amended guidance as well as indirect impact of the correction of errors associated with the restatement.
F-138
27.
Supplemental Unaudited Quarterly Financial Information (continued)
| | | | | | | | | | | | | | |
| Consolidated Statement of Cash Flows |
($ in millions) | For the period ended March 31, 2012 |
| As previously reported | | Correction of errors (1) | | Adjusted prior to the retrospective adoption | | Retrospective Adoption(2) | | As restated and amended |
|
|
|
OPERATING ACTIVITIES: | | | | | | | | | | | | | | |
Net loss | $ | (8.1) | | $ | (5.4) | | $ | (13.5) | | $ | — | | $ | (13.5) |
Net realized investment gains (losses) | | 15.6 | | | (7.0) | | | 8.6 | | | — | | | 8.6 |
Gain on debt repurchase | | — | | | — | | | — | | | — | | | — |
Policy acquisition costs deferred | | (26.1) | | | 4.9 | | | (21.2) | | | — | | | (21.2) |
Amortization of deferred policy acquisition costs | | 50.2 | | | 3.2 | | | 53.4 | | | — | | | 53.4 |
Amortization and depreciation | | 3.4 | | | — | | | 3.4 | | | — | | | 3.4 |
Interest credited | | — | | | 29.7 | | | 29.7 | | | — | | | 29.7 |
Equity in earnings of
limited partnerships and other investments | | (16.4) | | | (7.6) | | | (24.0) | | | — | | | (24.0) |
Change in: | | | | | | | | | | | | | | |
Accrued investment income | | (13.2) | | | (34.1) | | | (47.3) | | | — | | | (47.3) |
Deferred income taxes | | — | | | (0.7) | | | (0.7) | | | — | | | (0.7) |
Receivables | | 16.5 | | | 5.8 | | | 22.3 | | | — | | | 22.3 |
Policy liabilities and accruals | | (37.3) | | | (114.2) | | | (151.5) | | | — | | | (151.5) |
Dividend obligations | | — | | | 19.9 | | | 19.9 | | | — | | | 19.9 |
Impact of operating activities of
consolidated investment entities, net | | — | | | 0.7 | | | 0.7 | | | — | | | 0.7 |
Other operating activities, net | | (21.0) | | | (11.0) | | | (32.0) | | | — | | | (32.0) |
Cash from (for) continuing operations | | (36.4) | | | (115.8) | | | (152.2) | | | — | | | (152.2) |
Discontinued operations, net | | 2.5 | | | (2.5) | | | — | | | — | | | — |
Cash used for operating activities | | (33.9) | | | (118.3) | | | (152.2) | | | — | | | (152.2) |
| | | | | | | | | | | | | | |
INVESTING ACTIVITIES: | | | | | | | | | | | | | | |
Purchases of: | | | | | | | | | | | | | | |
Available-for-sale debt securities | | (665.3) | | | 40.2 | | | (625.1) | | | — | | | (625.1) |
Available-for-sale equity securities | | (5.0) | | | — | | | (5.0) | | | — | | | (5.0) |
Derivative instruments | | (19.0) | | | — | | | (19.0) | | | — | | | (19.0) |
Other investments | | (22.5) | | | 22.1 | | | (0.4) | | | | | | (0.4) |
Fair value investments | | — | | | — | | | — | | | — | | | — |
Sales, repayments and maturities of: | | | | | | | | | | | | | | |
Available-for-sale debt securities | | 557.6 | | | (40.7) | | | 516.9 | | | — | | | 516.9 |
Available-for-sale equity securities | | 0.3 | | | — | | | 0.3 | | | — | | | 0.3 |
Derivative instruments | | 1.8 | | | — | | | 1.8 | | | — | | | 1.8 |
Fair value investments | | — | | | 2.3 | | | 2.3 | | | — | | | 2.3 |
Other investments | | 30.9 | | | (25.2) | | | 5.7 | | | — | | | 5.7 |
Contributions to limited partnerships
and limited liability corporations | | — | | | (21.7) | | | (21.7) | | | — | | | (21.7) |
Distributions from limited partnerships
and limited liability corporations | | — | | | 25.2 | | | 25.2 | | | — | | | 25.2 |
Policy loans, net | | 4.5 | | | 34.1 | | | 38.6 | | | — | | | 38.6 |
Impact of investing activities of
consolidated investment entities, net | | — | | | — | | | — | | | — | | | — |
Other investing activities, net | | — | | | (0.7) | | | (0.7) | | | — | | | (0.7) |
Proceeds from sale of subsidiary | | — | | | — | | | — | | | — | | | — |
Premises and equipment additions | | (0.7) | | | 0.7 | | | — | | | — | | | — |
Discontinued operations, net | | (1.9) | | | 1.9 | | | — | | | — | | | — |
Cash provided by (used for) investing activities | | (119.3) | | | 38.2 | | | (81.1) | | | — | | | (81.1) |
(Continued on next page)
F-139
27.
Supplemental Unaudited Quarterly Financial Information (continued)
| | | | | | | | | | | | | | |
(Continued on next page) | Consolidated Statement of Cash Flows |
($ in millions) | For the period ended March 31, 2012 |
| As previously reported | | Correction of errors (1) | | Adjusted prior to the retrospective adoption | | Retrospective Adoption(2) | | As restated and amended |
|
|
|
FINANCING ACTIVITIES: | | | | | | | | | | | | | | |
Policyholder deposit fund deposits | | 354.5 | | | 93.3 | | | 447.8 | | | — | | | 447.8 |
Policyholder deposit fund withdrawals | | (186.0) | | | (134.6) | | | (320.6) | | | — | | | (320.6) |
Net transfers to/from separate accounts | | — | | | 114.7 | | | 114.7 | | | — | | | 114.7 |
Impact of financing activities of
consolidated investment entities, net | | — | | | 0.1 | | | 0.1 | | | — | | | 0.1 |
Other financing activities, net | | — | | | — | | | — | | | — | | | — |
Discontinued operations, net | | — | | | — | | | — | | | — | | | — |
Cash provided by financing activities | | 168.5 | | | 73.5 | | | 242.0 | | | — | | | 242.0 |
Change in cash and cash equivalents | | 15.3 | | | (6.6) | | | 8.7 | | | — | | | 8.7 |
Change in cash balances of
discontinued operations assets | | — | | | 0.1 | | | 0.1 | | | — | | | 0.1 |
Cash and cash equivalents, beginning of period | | 194.3 | | | (26.1) | | | 168.2 | | | — | | | 168.2 |
Cash and cash equivalents, end of period | $ | 209.6 | | $ | (32.6) | | $ | 177.0 | | $ | — | | $ | 177.0 |
| | | | | | | | | | | | | | |
Supplemental Disclosure of Cash Flow Information | | | | | | | | | | | | | | |
Income taxes paid | $ | — | | $ | — | | $ | — | | $ | — | | $ | — |
Interest expense on indebtedness paid | $ | (4.7) | | $ | — | | $ | (4.7) | | $ | — | | $ | (4.7) |
| | | | | | | | | | | | | | |
Non-Cash Transactions During the Year | | | | | | | | | | | | | | |
Investment exchanges | $ | — | | $ | 22.4 | | $ | 22.4 | | $ | — | | $ | 22.4 |
———————
(1)
Adjustments related to the correction of errors reflect amounts prior to the retrospective adoption of amended guidance to ASC 944,Financial Services – Insurance (ASU 2010-26). See footnote 2 below for additional information regarding these amounts and the retrospective adoption.
(2)
Adjustments related to the retrospective adoption of amended guidance to ASC 944,Financial Services – Insurance (ASU 2010-26), have been updated from those originally disclosed in the First Quarter 2012 Quarterly Report on Form 10-Q filing to reflect the correction of errors identified related to the adoption of the amended guidance as well as indirect impact of the correction of errors associated with the restatement.
F-140
27.
Supplemental Unaudited Quarterly Financial Information (continued)
| | | | | | | | | | | | | | |
| Consolidated Statement of Comprehensive Income |
($ in millions, except share data) | Three months ended December 31, 2011 |
| As previously reported | | Correction of errors (1) | | Adjusted prior to the retrospective adoption | | Retrospective Adoption(2) | | As restated and amended |
|
|
|
REVENUES: | | | | | | | | | | | | | | |
Premiums | $ | 121.4 | | $ | 3.7 | | $ | 125.1 | | $ | — | | $ | 125.1 |
Fee income | | 141.1 | | | (0.1) | | | 141.0 | | | — | | | 141.0 |
Net investment income | | 197.3 | | | (2.5) | | | 194.8 | | | — | | | 194.8 |
Net realized investment gains (losses): | | | | | | | | | | | | | | |
Total OTTI losses | | (19.6) | | | (1.1) | | | (20.7) | | | — | | | (20.7) |
Portion of OTTI losses recognized in OCI | | 11.0 | | | 1.4 | | | 12.4 | | | — | | | 12.4 |
Net OTTI losses recognized in earnings | | (8.6) | | | 0.3 | | | (8.3) | | | — | | | (8.3) |
Net realized investment losses,
excluding OTTI losses | | (0.8) | | | (5.0) | | | (5.8) | | | — | | | (5.8) |
Net realized investment losses | | (9.4) | | | (4.7) | | | (14.1) | | | — | | | (14.1) |
Gain on debt repurchase | | — | | | 0.2 | | | 0.2 | | | — | | | 0.2 |
Total revenues | | 450.4 | | | (3.4) | | | 447.0 | | | — | | | 447.0 |
| | | | | | | | | | | | | | |
BENEFITS AND EXPENSES: | | | | | | | | | | | | | | |
Policy benefits, excluding policyholder dividends | | 283.2 | | | 3.6 | | | 286.8 | | | 1.6 | | | 288.4 |
Policyholder dividends | | 58.1 | | | 2.1 | | | 60.2 | | | — | | | 60.2 |
Policy acquisition cost amortization | | 38.6 | | | 0.4 | | | 39.0 | | | (8.1) | | | 30.9 |
Interest expense on indebtedness | | 8.1 | | | — | | | 8.1 | | | — | | | 8.1 |
Other operating expenses | | 69.8 | | | (9.2) | | | 60.6 | | | 0.2 | | | 60.8 |
Total benefits and expenses | | 457.8 | | | (3.1) | | | 454.7 | | | (6.3) | | | 448.4 |
Income (loss) from continuing operations
before income taxes | | (7.4) | | | (0.3) | | | (7.7) | | | 6.3 | | | (1.4) |
Income tax expense (benefit) | | (0.5) | | | 1.7 | | | 1.2 | | | 1.6 | | | 2.8 |
Income (loss) from continuing operations | | (6.9) | | | (2.0) | | | (8.9) | | | 4.7 | | | (4.2) |
Loss from discontinued operations,
net of income taxes | | (15.1) | | | (0.4) | | | (15.5) | | | — | | | (15.5) |
Net income (loss) | | (22.0) | | | (2.4) | | | (24.4) | | | 4.7 | | | (19.7) |
Less: Net income (loss) attributable to
noncontrolling interests | | — | | | (0.1) | | | (0.1) | | | — | | | (0.1) |
Net income (loss) attributable to
The Phoenix Companies, Inc. | $ | (22.0) | | $ | (2.3) | | $ | (24.3) | | $ | 4.7 | | $ | (19.6) |
(Continued on next page)
F-141
27.
Supplemental Unaudited Quarterly Financial Information (continued)
| | | | | | | | | | | | | | |
(Continued on next page) | Consolidated Statement of Comprehensive Income |
($ in millions, except share data) | Three months ended December 31, 2011 |
| As previously reported | | Correction of errors (1) | | Adjusted prior to the retrospective adoption | | Retrospective Adoption(2) | | As restated and amended |
|
|
|
COMPREHENSIVE INCOME (LOSS): | | | | | | | | | | | | | | |
Net income (loss) attributable to
The Phoenix Companies, Inc. | $ | (22.0) | | $ | (2.3) | | $ | (24.3) | | $ | 4.7 | | $ | (19.6) |
Net income (loss) attributable to
noncontrolling interests | | — | | | (0.1) | | | (0.1) | | | — | | | (0.1) |
Net income (loss) | | (22.0) | | $ | (2.4) | | $ | (24.4) | | $ | 4.7 | | $ | (19.7) |
Other comprehensive income (loss)
before income taxes: | | | | | | | | | | | | | | |
Net unrealized investment gains
before income taxes | | 57.6 | | | (61.1) | | | (3.5) | | | 1.9 | | | (1.6) |
Non-credit portion of OTTI losses
recognized in OCI before income taxes | | (55.9) | | | 43.6 | | | (12.3) | | | — | | | (12.3) |
Net pension liability adjustment
before income taxes | | (89.4) | | | (7.5) | | | (96.9) | | | — | | | (96.9) |
Net unrealized other gains (losses)
before income taxes | | — | | | — | | | — | | | — | | | — |
Net unrealized derivative instruments
gains (losses) before income taxes | | 0.4 | | | (0.4) | | | — | | | — | | | — |
Other comprehensive income (loss)
before income taxes | | (87.3) | | | (25.4) | | | (112.7) | | | 1.9 | | | (110.8) |
Less: Income tax expense (benefit) related to: | | | | | | | | | | | | | | |
Net unrealized investment gains (losses) | | 22.8 | | | (18.0) | | | 4.8 | | | (1.4) | | | 3.4 |
Non-credit portion of OTTI losses
recognized in OCI | | (19.6) | | | 15.4 | | | (4.2) | | | — | | | (4.2) |
Net pension liability adjustment | | — | | | — | | | — | | | — | | | — |
Net unrealized other gains (losses) | | — | | | — | | | — | | | — | | | — |
Net unrealized derivative instruments
gains (losses) | | — | | | — | | | — | | | — | | | — |
Total income tax expense (benefit) | | 3.2 | | | (2.6) | | | 0.6 | | | (1.4) | | | (0.8) |
Other comprehensive income (loss),
net of income taxes | | (90.5) | | | (22.8) | | | (113.3) | | | 3.3 | | | (110.0) |
Comprehensive income (loss) | | (112.5) | | | (25.2) | | | (137.7) | | | 8.0 | | | (129.7) |
Less: Comprehensive income (loss) attributable
to noncontrolling interests, net of income taxes | | — | | | (0.1) | | | (0.1) | | | — | | | (0.1) |
Comprehensive income (loss) attributable
to The Phoenix Companies, Inc. | $ | (112.5) | | | (25.1) | | | (137.6) | | | 8.0 | | | (129.6) |
| | | | | | | | | | | | | | |
LOSS PER SHARE:(3) | | | | | | | | | | | | | | |
Loss from continuing operations – basic | $ | (1.18) | | $ | (0.34) | | | | | $ | 0.81 | | $ | (0.72) |
Loss from continuing operations – diluted | $ | (1.18) | | $ | (0.34) | | | | | $ | 0.81 | | $ | (0.72) |
Loss from discontinued operations – basic | $ | (2.59) | | $ | (0.07) | | | | | $ | — | | $ | (2.67) |
Loss from discontinued operations – diluted | $ | (2.59) | | $ | (0.07) | | | | | $ | — | | $ | (2.67) |
Net loss attributable to
The Phoenix Companies, Inc.– basic | $ | (3.78) | | $ | (0.40) | | | | | $ | 0.81 | | $ | (3.37) |
Net loss attributable to
The Phoenix Companies, Inc.– diluted | $ | (3.78) | | $ | (0.40) | | | | | $ | 0.81 | | $ | (3.37) |
Basic weighted-average common shares
outstanding (in thousands) | | 5,827 | | | 5,816 | (4) | | | | | 5,816 | | | 5,816 |
Diluted weighted-average common shares
outstanding (in thousands) | | 5,827 | | | 5,816 | (4) | | | | | 5,816 | | | 5,816 |
———————
(1)
Adjustments related to the correction of errors reflect amounts prior to the retrospective adoption of amended guidance to ASC 944,Financial Services – Insurance (ASU 2010-26). See footnote 2 below for additional information regarding these amounts and the retrospective adoption.
(2)
Adjustments related to the retrospective adoption of amended guidance to ASC 944,Financial Services – Insurance, have been updated from those originally disclosed in the First Quarter 2012 Quarterly Report on Form 10-Q filing to reflect the correction of errors identified related to the adoption of the amended guidance as well as indirect impact of the correction of errors associated with the restatement.
(3)
All share amounts for all periods reflect the 1-for-20 reverse stock split, which was effective August 10, 2012. See Note 11 to these consolidated financial statements for additional information on the reverse stock split.
(4)
Weighted-average common shares outstanding have been updated to reflect the impact of an error which had no material impact to EPS information, basic or diluted, for any period presented.
F-142
27.
Supplemental Unaudited Quarterly Financial Information (continued)
| | | | | | | | | | | | | | |
| Consolidated Statement of Comprehensive Income |
($ in millions, except share data) | Three months ended September 30, 2011 |
| As previously reported | | Correction of errors (1) | | Adjusted prior to the retrospective adoption | | Retrospective Adoption(2) | | As restated and amended |
|
|
|
REVENUES: | | | | | | | | | | | | | | |
Premiums | $ | 117.4 | | $ | (5.5) | | $ | 111.9 | | $ | — | | $ | 111.9 |
Fee income | | 147.6 | | | (1.1) | | | 146.5 | | | — | | | 146.5 |
Net investment income | | 201.0 | | | 2.5 | | | 203.5 | | | — | | | 203.5 |
Net realized investment gains (losses): | | | | | | | | | | | | | | |
Total OTTI losses | | (31.0) | | | 0.1 | | | (30.9) | | | — | | | (30.9) |
Portion of OTTI losses recognized in OCI | | 22.6 | | | (1.4) | | | 21.2 | | | — | | | 21.2 |
Net OTTI losses recognized in earnings | | (8.4) | | | (1.3) | | | (9.7) | | | — | | | (9.7) |
Net realized investment gains (losses),
excluding OTTI losses | | 14.5 | | | (14.9) | | | (0.4) | | | — | | | (0.4) |
Net realized investment losses | | 6.1 | | | (16.2) | | | (10.1) | | | — | | | (10.1) |
Gain on debt repurchase | | — | | | — | | | — | | | — | | | — |
Total revenues | | 472.1 | | | (20.3) | | | 451.8 | | | — | | | 451.8 |
| | | | | | | | | | | | | | |
BENEFITS AND EXPENSES: | | | | | | | | | | | | | | |
Policy benefits, excluding policyholder dividends | | 268.2 | | | 25.1 | | | 293.3 | | | (0.2) | | | 293.1 |
Policyholder dividends | | 51.5 | | | 2.0 | | | 53.5 | | | — | | | 53.5 |
Policy acquisition cost amortization | | 57.5 | | | (14.9) | | | 42.6 | | | (7.5) | | | 35.1 |
Interest expense on indebtedness | | 7.9 | | | — | | | 7.9 | | | — | | | 7.9 |
Other operating expenses | | 57.2 | | | (0.2) | | | 57.0 | | | 0.4 | | | 57.4 |
Total benefits and expenses | | 442.3 | | | 12.0 | | | 454.3 | | | (7.3) | | | 447.0 |
Income from continuing operations
before income taxes | | 29.8 | | | (32.3) | | | (2.5) | | | 7.3 | | | 4.8 |
Income tax expense (benefit) | | (6.7) | | | (1.2) | | | (7.9) | | | 1.1 | | | (6.8) |
Income (loss) from continuing operations | | 36.5 | | | (31.1) | | | 5.4 | | | 6.2 | | | 11.6 |
Income(loss) from discontinued operations,
net of income taxes | | (4.7) | | | 0.8 | | | (3.9) | | | — | | | (3.9) |
Net income (loss) | | 31.8 | | | (30.3) | | | 1.5 | | | 6.2 | | | 7.7 |
Less: Net income (loss) attributable to
noncontrolling interests | | — | | | (0.3) | | | (0.3) | | | — | | | (0.3) |
Net income (loss) attributable to
The Phoenix Companies, Inc. | $ | 31.8 | | $ | (30.0) | | $ | 1.8 | | $ | 6.2 | | $ | 8.0 |
(Continued on next page)
F-143
27.
Supplemental Unaudited Quarterly Financial Information (continued)
| | | | | | | | | | | | | | |
(Continued on next page) | Consolidated Statement of Comprehensive Income |
($ in millions, except share data) | Three months ended September 30, 2011 |
| As previously reported | | Correction of errors (1) | | Adjusted prior to the retrospective adoption | | Retrospective Adoption(2) | | As restated and amended |
|
|
|
COMPREHENSIVE INCOME (LOSS): | | | | | | | | | | | | | | |
Net income (loss) attributable to
The Phoenix Companies, Inc. | $ | 31.8 | | $ | (30.0) | | $ | 1.8 | | $ | 6.2 | | $ | 8.0 |
Net income (loss) attributable to
noncontrolling interests | | — | | | (0.3) | | | (0.3) | | | — | | | (0.3) |
Net income (loss) | | 31.8 | | | (30.3) | | | 1.5 | | | 6.2 | | | 7.7 |
Other comprehensive income (loss)
before income taxes: | | | | | | | | | | | | | | |
Net unrealized investment gains
before income taxes | | (13.3) | | | 17.7 | | | 4.4 | | | 1.6 | | | 6.0 |
Non-credit portion of OTTI losses
recognized in OCI before income taxes | | 22.4 | | | (43.6) | | | (21.2) | | | — | | | (21.2) |
Net pension liability adjustment
before income taxes | | 1.1 | | | (9.2) | | | (8.1) | | | — | | | (8.1) |
Net unrealized other gains (losses)
before income taxes | | — | | | — | | | — | | | — | | | — |
Net unrealized derivative instruments
gains (losses) before income taxes | | 1.1 | | | (1.1) | | | — | | | — | | | — |
Other comprehensive income (loss)
before income taxes | | 11.3 | | | (36.2) | | | (24.9) | | | 1.6 | | | (23.3) |
Less: Income tax expense (benefit) related to: | | | | | | | | | | | | | | |
Net unrealized investment gains (losses) | | (42.2) | | | 20.8 | | | (21.4) | | | (1.2) | | | (22.6) |
Non-credit portion of OTTI losses
recognized in OCI | | 7.8 | | | (15.3) | | | (7.5) | | | — | | | (7.5) |
Net pension liability adjustment | | — | | | — | | | — | | | — | | | — |
Net unrealized other gains (losses) | | — | | | — | | | — | | | — | | | — |
Net unrealized derivative instrument
gains (losses) | | — | | | — | | | — | | | — | | | — |
Total income tax expense (benefit) | | (34.4) | | | 5.5 | | | (28.9) | | | (1.2) | | | (30.1) |
Other comprehensive income (loss)
before income taxes | | 45.7 | | | (41.7) | | | 4.0 | | | 2.8 | | | 6.8 |
Comprehensive income (loss) | | 77.5 | | | (72.0) | | | 5.5 | | | 9.0 | | | 14.5 |
Less: Comprehensive income (loss) attributabl
to noncontrolling interests, net of income taxes | | — | | | (0.3) | | | (0.3) | | | — | | | (0.3) |
Comprehensive income (loss) attributable
to The Phoenix Companies, Inc. | $ | 77.5 | | $ | (71.7) | | $ | 5.8 | | $ | 9.0 | | $ | 14.8 |
| | | | | | | | | | | | | | |
EARNINGS (LOSS) PER SHARE:(3) | | | | | | | | | | | | | | |
Earnings from continuing operations – basic | $ | 6.25 | | $ | (5.35) | | | | | $ | 1.07 | | $ | 1.99 |
Earnings from continuing operations – diluted | $ | 6.23 | | $ | (5.28) | | | | | $ | 1.05 | | $ | 1.97 |
Loss from discontinued operations – basic | $ | (0.80) | | $ | 0.14 | | | | | $ | — | | $ | (0.67) |
Loss from discontinued operations – diluted | $ | (0.80) | | $ | 0.14 | | | | | $ | — | | $ | (0.66) |
Net loss attributable to
The Phoenix Companies, Inc.– basic | $ | 5.44 | | $ | (5.16) | | | | | $ | 1.07 | | $ | 1.38 |
Net loss attributable to
The Phoenix Companies, Inc.– diluted | $ | 5.43 | | $ | (5.09) | | | | | $ | 1.05 | | $ | 1.36 |
Basic weighted-average common share
outstanding (in thousands) | | 5,844 | | | 5,816 | (4) | | | | | 5,816 | | | 5,816 |
Diluted weighted-average common shares
outstanding (in thousands) | | 5,856 | | | 5,890 | (4) | | | | | 5,890 | | | 5,890 |
———————
(1)
Adjustments related to the correction of errors reflect amounts prior to the retrospective adoption of amended guidance to ASC 944,Financial Services – Insurance (ASU 2010-26). See footnote 2 below for additional information regarding these amounts and the retrospective adoption.
(2)
Adjustments related to the retrospective adoption of amended guidance to ASC 944,Financial Services – Insurance (ASU 2010-26), have been updated from those originally disclosed in the First Quarter 2012 Quarterly Report on Form 10-Q filing to reflect the correction of errors identified related to the adoption of the amended guidance as well as indirect impact of the correction of errors associated with the restatement.
(3)
All share amounts for all periods reflect the 1-for-20 reverse stock split, which was effective August 10, 2012. See Note 11 to these consolidated financial statements for additional information on the reverse stock split.
(4)
Weighted-average common shares outstanding have been updated to reflect the impact of an error which had no material impact to EPS information, basic or diluted, for any period presented.
F-144
27.
Supplemental Unaudited Quarterly Financial Information (continued)
| | | | | | | | | | | | | | |
| Consolidated Statement of Comprehensive Income |
($ in millions, except share data) | Three months ended June 30, 2011 |
| As previously reported | | Correction of errors (1) | | Adjusted prior to the retrospective adoption | | Retrospective Adoption(2) | | As restated and amended |
|
|
|
REVENUES: | | | | | | | | | | | | | | |
Premiums | $ | 109.3 | | $ | (5.2) | | $ | 104.1 | | $ | — | | $ | 104.1 |
Fee income | | 154.6 | | | — | | | 154.6 | | | — | | | 154.6 |
Net investment income | | 210.8 | | | (0.2) | | | 210.6 | | | — | | | 210.6 |
Net realized investment gains (losses): | | | | | | | | | | | | | | |
Total OTTI losses | | (6.6) | | | 0.8 | | | (5.8) | | | — | | | (5.8) |
Portion of OTTI losses recognized in OCI | | 3.6 | | | (0.5) | | | 3.1 | | | — | | | 3.1 |
Net OTTI losses recognized in earnings | | (3.0) | | | 0.3 | | | (2.7) | | | — | | | (2.7) |
Net realized investment gains (losses),
excluding OTTI losses | | 6.1 | | | (1.8) | | | 4.3 | | | — | | | 4.3 |
Net realized investment losses | | 3.1 | | | (1.5) | | | 1.6 | | | — | | | 1.6 |
Gain on debt repurchase | | — | | | — | | | — | | | — | | | — |
Total revenues | | 477.8 | | | (6.9) | | | 470.9 | | | — | | | 470.9 |
| | | | | | | | | | | | | | |
BENEFITS AND EXPENSES: | | | | | | | | | | | | | | |
Policy benefits, excluding policyholder dividends | | 271.1 | | | 17.2 | | | 288.3 | | | 0.9 | | | 289.2 |
Policyholder dividends | | 73.6 | | | (5.2) | | | 68.4 | | | — | | | 68.4 |
Policy acquisition cost amortization | | 51.8 | | | (2.3) | | | 49.5 | | | (9.4) | | | 40.1 |
Interest expense on indebtedness | | 7.9 | | | — | | | 7.9 | | | — | | | 7.9 |
Other operating expenses | | 58.9 | | | 4.8 | | | 63.7 | | | 0.3 | | | 64.0 |
Total benefits and expenses | | 463.3 | | | 14.5 | | | 477.8 | | | (8.2) | | | 469.6 |
Income (loss) from continuing operations
before income taxes | | 14.5 | | | (21.4) | | | (6.9) | | | 8.2 | | | 1.3 |
Income tax expense (benefit) | | 9.4 | | | (3.7) | | | 5.7 | | | 2.9 | | | 8.6 |
Income (loss) from continuing operations | | 5.1 | | | (17.7) | | | (12.6) | | | 5.3 | | | (7.3) |
Loss from discontinued operations,
net of income taxes | | (0.7) | | | — | | | (0.7) | | | — | | | (0.7) |
Net income (loss) | | 4.4 | | | (17.7) | | | (13.3) | | | 5.3 | | | (8.0) |
Less: Net income (loss) attributable to
noncontrolling interests | | — | | | — | | | — | | | — | | | — |
Net income (loss) attributable to
The Phoenix Companies, Inc. | $ | 4.4 | | $ | (17.7) | | $ | (13.3) | | $ | 5.3 | | $ | (8.0) |
(Continued on next page)
F-145
27.
Supplemental Unaudited Quarterly Financial Information (continued)
| | | | | | | | | | | | | | |
(Continued on next page) | Consolidated Statement of Comprehensive Income |
($ in millions, except share data) | Three months ended June 30, 2011 |
| As previously reported | | Correction of errors (1) | | Adjusted prior to the retrospective adoption | | Retrospective Adoption(2) | | As restated and amended |
|
|
|
COMPREHENSIVE INCOME (LOSS): | | | | | | | | | | | | | | |
Net income (loss) attributable to
The Phoenix Companies, Inc. | $ | 4.4 | | $ | (17.7) | | $ | (13.3) | | $ | 5.3 | | $ | (8.0) |
Net income (loss) attributable to
noncontrolling interests | | — | | | — | | | — | | | — | | | — |
Net income (loss) | | 4.4 | | | (17.7) | | | (13.3) | | | 5.3 | | | (8.0) |
Other comprehensive income (loss)
before income taxes: | | | | | | | | | | | | | | |
Net unrealized investment gains
before income taxes | | 16.3 | | | 3.8 | | | 20.1 | | | 2.1 | | | 22.2 |
Non-credit portion of OTTI losses
recognized in OCI before income taxes | | (2.1) | | | (1.0) | | | (3.1) | | | — | | | (3.1) |
Net pension liability adjustment
before income taxes | | 3.0 | | | 0.9 | | | 3.9 | | | — | | | 3.9 |
Net unrealized other gains (losses)
before income taxes | | — | | | — | | | — | | | — | | | — |
Net unrealized derivative instrument
gains (losses) before income taxes | | (0.4) | | | 0.4 | | | — | | | — | | | — |
Other comprehensive income (loss)
before income taxes | | 16.8 | | | 4.1 | | | 20.9 | | | 2.1 | | | 23.0 |
Less: Income tax expense (benefit) related to: | | | | | | | | | | | | | | |
Net unrealized investment gains (losses) | | 6.0 | | | (0.1) | | | 5.9 | | | (2.9) | | | 3.0 |
Non-credit portion of OTTI losses
recognized in OCI | | (0.7) | | | (0.4) | | | (1.1) | | | — | | | (1.1) |
Net pension liability adjustment | | — | | | — | | | — | | | — | | | — |
Net unrealized other gains (losses) | | — | | | — | | | — | | | — | | | — |
Net unrealized derivative instrument
gains (losses) | | — | | | — | | | — | | | — | | | — |
Total income tax expense (benefit) | | 5.3 | | | (0.5) | | | 4.8 | | | (2.9) | | | 1.9 |
Other comprehensive income (loss)
net of income taxes | | 11.5 | | | 4.6 | | | 16.1 | | | 5.0 | | | 21.1 |
Comprehensive income (loss) | | 15.9 | | $ | (13.1) | | $ | 2.8 | | $ | 10.3 | | $ | 13.1 |
Less: Comprehensive income (loss) attributable
to noncontrolling interests, net of income taxes | | — | | | — | | | — | | | — | | | — |
Comprehensive income (loss) attributable
to The Phoenix Companies, Inc. | $ | 15.9 | | $ | (13.1) | | $ | 2.8 | | $ | 10.3 | | $ | 13.1 |
| | | | | | | | | | | | | | |
EARNINGS (LOSS) PER SHARE:(3) | | | | | | | | | | | | | | |
Earnings (loss) from continuing operations – basic | $ | 0.87 | | $ | (3.04) | | | | | $ | 0.91 | | $ | (1.26) |
Earnings (loss) from continuing operations – diluted | $ | 0.87 | | $ | (3.04) | | | | | $ | 0.91 | | $ | (1.26) |
Loss from discontinued operations – basic | $ | (0.12) | | $ | — | | | | | $ | — | | $ | (0.12) |
Loss from discontinued operations – diluted | $ | (0.12) | | $ | — | | | | | $ | — | | $ | (0.12) |
Net loss attributable to
The Phoenix Companies, Inc.– basic | $ | 0.75 | | $ | (3.04) | | | | | $ | 0.91 | | $ | (1.38) |
Net loss attributable to
The Phoenix Companies, Inc.– diluted | $ | 0.75 | | $ | (3.04) | | | | | $ | 0.91 | | $ | (1.38) |
Basic weighted-average common share
outstanding (in thousands) | | 5,841 | | | 5,816 | (4) | | | | | 5,816 | | | 5,816 |
Diluted weighted-average common shares
outstanding (in thousands) | | 5,853 | | | 5,816 | (4) | | | | | 5,816 | | | 5,816 |
———————
(1)
Adjustments related to the correction of errors reflect amounts prior to the retrospective adoption of amended guidance to ASC 944,Financial Services – Insurance (ASU 2010-26). See footnote 2 below for additional information regarding these amounts and the retrospective adoption.
(2)
Adjustments related to the retrospective adoption of amended guidance to ASC 944,Financial Services – Insurance (ASU 2010-26), have been updated from those originally disclosed in the First Quarter 2012 Quarterly Report on Form 10-Q filing to reflect the correction of errors identified related to the adoption of the amended guidance as well as indirect impact of the correction of errors associated with the restatement.
(3)
All share amounts for all periods reflect the 1-for-20 reverse stock split, which was effective August 10, 2012. See Note 11 to these consolidated financial statements for additional information on the reverse stock split.
(4)
Weighted-average common shares outstanding have been updated to reflect the impact of an error which had no material impact to EPS information, basic or diluted, for any period presented.
F-146
27.
Supplemental Unaudited Quarterly Financial Information (continued)
| | | | | | | | | | | | | | |
| Consolidated Statement of Comprehensive Income |
($ in millions, except share data) | Three months ended March 31, 2011 |
| As previously reported | | Correction of errors (1) | | Adjusted prior to the retrospective adoption | | Retrospective Adoption(2) | | As restated and amended |
|
|
|
REVENUES: | | | | | | | | | | | | | | |
Premiums | $ | 111.0 | | $ | (3.4) | | $ | 107.6 | | $ | — | | $ | 107.6 |
Fee income | | 153.8 | | | 0.9 | | | 154.7 | | | — | | | 154.7 |
Net investment income | | 200.8 | | | 13.2 | | | 214.0 | | | — | | | 214.0 |
Net realized investment gains (losses): | | | | | | | | | | | | | | |
Total OTTI losses | | (7.4) | | | (0.5) | | | (7.9) | | | — | | | (7.9) |
Portion of OTTI losses recognized in OCI | | 1.7 | | | 0.1 | | | 1.8 | | | — | | | 1.8 |
Net OTTI losses recognized in earnings | | (5.7) | | | (0.4) | | | (6.1) | | | — | | | (6.1) |
Net realized investment gains (losses),
excluding OTTI losses | | (10.5) | | | 7.1 | | | (3.4) | | | — | | | (3.4) |
Net realized investment gains (losses) | | (16.2) | | | 6.7 | | | (9.5) | | | — | | | (9.5) |
Gain on debt repurchase | | — | | | — | | | — | | | — | | | — |
Total revenues | | 449.4 | | | 17.4 | | | 466.8 | | | — | | | 466.8 |
| | | | | | | | | | | | | | |
BENEFITS AND EXPENSES: | | | | | | | | | | | | | | |
Policy benefits, excluding policyholder dividends | | 260.7 | | | 3.1 | | | 263.8 | | | 2.5 | | | 266.3 |
Policyholder dividends | | 63.7 | | | 13.4 | | | 77.1 | | | — | | | 77.1 |
Policy acquisition cost amortization | | 62.7 | | | 1.6 | | | 64.3 | | | (12.5) | | | 51.8 |
Interest expense on indebtedness | | 7.9 | | | — | | | 7.9 | | | — | | | 7.9 |
Other operating expenses | | 59.3 | | | 6.0 | | | 65.3 | | | 0.4 | | | 65.7 |
Total benefits and expenses | | 454.3 | | | 24.1 | | | 478.4 | | | (9.6) | | | 468.8 |
Income (loss) from continuing operations
before income taxes | | (4.9) | | | (6.7) | | | (11.6) | | | 9.6 | | | (2.0) |
Income tax expense (benefit) | | (0.3) | | | 4.6 | | | 4.3 | | | 3.4 | | | 7.7 |
Income (loss) from continuing operations | | (4.6) | | | (11.3) | | | (15.9) | | | 6.2 | | | (9.7) |
Loss from discontinued operations,
net of income taxes | | (1.5) | | | — | | | (1.5) | | | — | | | (1.5) |
Net income (loss) | | (6.1) | | | (11.3) | | | (17.4) | | | 6.2 | | | (11.2) |
Less: Net income (loss) attributable to
noncontrolling interests | | — | | | (0.1) | | | (0.1) | | | — | | | (0.1) |
Net income (loss) attributable to
The Phoenix Companies, Inc. | $ | (6.1) | | $ | (11.2) | | $ | (17.3) | | $ | 6.2 | | $ | (11.1) |
(Continued on next page)
F-147
27.
Supplemental Unaudited Quarterly Financial Information (continued)
| | | | | | | | | | | | | | |
(Continued on next page) | Consolidated Statement of Comprehensive Income |
($ in millions, except share data) | Three months ended March 31, 2011 |
| As previously reported | | Correction of errors (1) | | Adjusted prior to the retrospective adoption | | Retrospective Adoption(2) | | As restated and amended |
|
|
|
COMPREHENSIVE INCOME (LOSS): | | | | | | | | | | | | | | |
Net income (loss) attributable to
The Phoenix Companies, Inc. | $ | (6.1) | | $ | (11.2) | | $ | (17.3) | | $ | 6.2 | | $ | (11.1) |
Net income (loss) attributable to
noncontrolling interests | | — | | | (0.1) | | | (0.1) | | | — | | | (0.1) |
Net income (loss) | | (6.1) | | | (11.3) | | | (17.4) | | | 6.2 | | | (11.2) |
Other comprehensive income (loss)
before income taxes: | | | | | | | | | | | | | | |
Net unrealized investment gains
before income taxes | | 16.9 | | | 14.5 | | | 31.4 | | | 0.7 | | | 32.1 |
Non-credit portion of OTTI losses
recognized in OCI before income taxes | | 3.1 | | | (0.3) | | | 2.8 | | | — | | | 2.8 |
Net pension liability adjustment
before income taxes | | 1.1 | | | 0.9 | | | 2.0 | | | — | | | 2.0 |
Net unrealized other gains (losses)
before income taxes | | — | | | — | | | — | | | — | | | — |
Net unrealized derivative instruments
gains (losses) before income taxes | | (0.8) | | | 0.8 | | | — | | | — | | | — |
Other comprehensive income (loss)
before income taxes | | 20.3 | | | 15.9 | | | 36.2 | | | 0.7 | | | 36.9 |
Less: Income tax expense (benefit) related to: | | | | | | | | | | | | | | |
Net unrealized investment gains (losses) | | 22.8 | | | 8.9 | | | 31.7 | | | (3.4) | | | 28.3 |
Non-credit portion of OTTI losses
recognized in OCI | | 1.1 | | | (0.1) | | | 1.0 | | | — | | | 1.0 |
Net pension liability adjustment | | — | | | — | | | — | | | — | | | — |
Net unrealized other gains (losses) | | — | | | — | | | — | | | — | | | — |
Net unrealized derivative instrument
gains (losses) | | — | | | — | | | — | | | — | | | — |
Total income tax expense (benefit) | | 23.9 | | | 8.8 | | | 32.7 | | | (3.4) | | | 29.3 |
Other comprehensive income (loss) | | (3.6) | | | 7.1 | | | 3.5 | | | 4.1 | | | 7.6 |
Comprehensive income (loss) | | (9.7) | | | (4.2) | | | (13.9) | | | 10.3 | | | (3.6) |
Less: Comprehensive income (loss) attributable
to noncontrolling interests, net of income taxes | | — | | | (0.1) | | | (0.1) | | | — | | | (0.1) |
Comprehensive income (loss) attributable
to The Phoenix Companies, Inc. | $ | (9.7) | | $ | (4.1) | | | (13.8) | | | 10.3 | | | (3.5) |
| | | | | | | | | | | | | | |
LOSS PER SHARE:(3) | | | | | | | | | | | | | | |
Loss from continuing operations – basic | $ | (0.79) | | $ | (1.94) | | | | | $ | 1.07 | | $ | (1.67) |
Loss from continuing operations – diluted | $ | (0.79) | | $ | (1.94) | | | | | $ | 1.07 | | $ | (1.67) |
Loss from discontinued operations – basic | $ | (0.26) | | $ | — | | | | | $ | — | | $ | (0.26) |
Loss from discontinued operations –diluted | $ | (0.26) | | $ | — | | | | | $ | — | | $ | (0.26) |
Net loss attributable to
The Phoenix Companies, Inc.– basic | $ | (1.05) | | $ | (1.93) | | | | | $ | 1.07 | | $ | (1.91) |
Net loss attributable to
The Phoenix Companies, Inc.– diluted | $ | (1.05) | | $ | (1.93) | | | | | $ | 1.07 | | $ | (1.91) |
Basic weighted-average common shares
outstanding (in thousands) | | 5,810 | | | 5,811 | (4) | | | | | 5,811 | | | 5,811 |
Diluted weighted-average common shares
outstanding (in thousands) | | 5,810 | | | 5,811 | (4) | | | | | 5,811 | | | 5,811 |
———————
(1)
Adjustments related to the correction of errors reflect amounts prior to the retrospective adoption of amended guidance to ASC 944,Financial Services – Insurance (ASU 2010-26). See footnote 2 below for additional information regarding these amounts and the retrospective adoption.
(2)
Adjustments related to the retrospective adoption of amended guidance to ASC 944,Financial Services – Insurance (ASU 2010-26), have been updated from those originally disclosed in the First Quarter 2012 Quarterly Report on Form 10-Q filing to reflect the correction of errors identified related to the adoption of the amended guidance as well as indirect impact of the correction of errors associated with the restatement.
(3)
All share amounts for all periods reflect the 1-for-20 reverse stock split, which was effective August 10, 2012. See Note 11 to these consolidated financial statements for additional information on the reverse stock split.
(4)
Weighted-average common shares outstanding have been updated to reflect the impact of an error which had no material impact to EPS information, basic or diluted, for any period presented.
F-148
27.
Supplemental Unaudited Quarterly Financial Information (continued)
| | | | | | | | | | | | | | |
| Consolidated Statement of Comprehensive Income |
($ in millions, except share data) | Nine months ended September 30, 2011 |
| As previously reported | | Correction of errors (1) | | Adjusted prior to the Retrospective adoption | | Retrospective Adoption(2) | | As restated and amended |
|
|
|
REVENUES: | | | | | | | | | | | | | | |
Premiums | $ | 337.7 | | $ | (14.1) | | $ | 323.6 | | $ | — | | $ | 323.6 |
Fee income | | 456.0 | | | (0.2) | | | 455.8 | | | — | | | 455.8 |
Net investment income | | 612.6 | | | 15.5 | | | 628.1 | | | — | | | 628.1 |
Net realized investment gains (losses): | | | | | | | | | | | | | | |
Total OTTI losses | | (45.0) | | | 0.4 | | | (44.6) | | | — | | | (44.6) |
Portion of OTTI losses recognized in OCI | | 27.9 | | | (1.8) | | | 26.1 | | | — | | | 26.1 |
Net OTTI losses recognized in earnings | | (17.1) | | | (1.4) | | | (18.5) | | | — | | | (18.5) |
Net realized investment gains (losses),
excluding OTTI losses | | 10.1 | | | (9.6) | | | 0.5 | | | — | | | 0.5 |
Net realized investment losses | | (7.0) | | | (11.0) | | | (18.0) | | | — | | | (18.0) |
Gain on debt repurchase | | — | | | — | | | — | | | — | | | — |
Total revenues | | 1,399.3 | | | (9.8) | | | 1,389.5 | | | — | | | 1,389.5 |
| | | | | | | | | | | | | | |
BENEFITS AND EXPENSES: | | | | | | | | | | | | | | |
Policy benefits, excluding policyholder dividends | | 800.0 | | | 45.4 | | | 845.4 | | | 3.2 | | | 848.6 |
Policyholder dividends | | 188.8 | | | 10.2 | | | 199.0 | | | — | | | 199.0 |
Policy acquisition cost amortization | | 172.0 | | | (15.6) | | | 156.4 | | | (29.4) | | | 127.0 |
Interest expense on indebtedness | | 23.7 | | | — | | | 23.7 | | | — | | | 23.7 |
Other operating expenses | | 175.4 | | | 10.6 | | | 186.0 | | | 1.1 | | | 187.1 |
Total benefits and expenses | | 1,359.9 | | | 50.6 | | | 1,410.5 | | | (25.1) | | | 1,385.4 |
Income (loss) from continuing operations
before income taxes | | 39.4 | | | (60.4) | | | (21.0) | | | 25.1 | | | 4.1 |
Income tax expense (benefit) | | 2.4 | | | (0.3) | | | 2.1 | | | 7.4 | | | 9.5 |
Income (loss) from continuing operations | | 37.0 | | | (60.1) | | | (23.1) | | | 17.7 | | | (5.4) |
Loss from discontinued operations,
net of income taxes | | (6.9) | | | 0.8 | | | (6.1) | | | — | | | (6.1) |
Net income (loss) | | 30.1 | | | (59.3) | | | (29.2) | | | 17.7 | | | (11.5) |
Less: Net income (loss) attributable to
noncontrolling interests | | — | | | (0.4) | | | (0.4) | | | — | | | (0.4) |
Net income (loss) attributable to
The Phoenix Companies, Inc. | $ | 30.1 | | $ | (58.9) | | $ | (28.8) | | $ | 17.7 | | $ | (11.1) |
(Continued on next page)
F-149
27.
Supplemental Unaudited Quarterly Financial Information (continued)
| | | | | | | | | | | | | | |
(Continued on next page) | Consolidated Statement of Comprehensive Income |
($ in millions, except share data) | Nine months ended September 30, 2011 |
| As previously reported | | Correction of errors (1) | | Adjusted prior to the retrospective adoption | | Retrospective Adoption(2) | | As restated and amended |
|
|
|
COMPREHENSIVE INCOME (LOSS): | | | | | | | | | | | | | | |
Net income (loss) attributable to
The Phoenix Companies, Inc. | $ | 30.1 | | $ | (58.9) | | $ | (28.8) | | $ | 17.7 | | $ | (11.1) |
Net income (loss) attributable to
noncontrolling interests | | — | | | (0.4) | | | (0.4) | | | — | | | (0.4) |
Net income (loss) | | 30.1 | | $ | (59.3) | | $ | (29.2) | | $ | 17.7 | | $ | (11.5) |
Other comprehensive income (loss)
before income taxes: | | | | | | | | | | | | | | |
Net unrealized investment gains
before income taxes | | 19.9 | | | 36.0 | | | 55.9 | | | 4.4 | | | 60.3 |
Non-credit portion of OTTI losses
recognized in OCI before income taxes | | 23.4 | | | (44.9) | | | (21.5) | | | — | | | (21.5) |
Net pension liability adjustment
before income taxes | | 5.2 | | | (7.4) | | | (2.2) | | | — | | | (2.2) |
Net unrealized other gains (losses)
before income taxes | | — | | | — | | | — | | | — | | | — |
Net unrealized derivative instrument
gains (losses) before income taxes | | (0.1) | | | 0.1 | | | — | | | — | | | — |
Other comprehensive income (loss)
before income taxes | | 48.4 | | | (16.2) | | | 32.2 | | | 4.4 | | | 36.6 |
Less: Income tax expense (benefit) related to: | | | | | | | | | | | | | | |
Net unrealized investment gains (losses) | | (13.4) | | | 29.6 | | | 16.2 | | | (7.5) | | | 8.7 |
Non-credit portion of OTTI losses
recognized in OCI | | 8.2 | | | (15.8) | | | (7.6) | | | — | | | (7.6) |
Net pension liability adjustment | | — | | | — | | | — | | | — | | | — |
Net unrealized other gains (losses) | | — | | | — | | | — | | | — | | | — |
Net unrealized derivative instrument
gains (losses) | | | | | — | | | — | | | — | | | — |
Total income tax expense (benefit) | | (5.2) | | | 13.8 | | | 8.6 | | | (7.5) | | | 1.1 |
Other comprehensive income (loss)
net of income taxes | | 53.6 | | | (30.0) | | | 23.6 | | | 11.9 | | | 35.5 |
Comprehensive income (loss) | | 83.7 | | $ | (89.3) | | $ | (5.6) | | $ | 29.6 | | $ | 24.0 |
Less: Comprehensive income (loss) attributable
to noncontrolling interests, net of income taxes | | — | | | (0.4) | | | (0.4) | | | — | | | (0.4) |
Comprehensive income (loss) attributable
to The Phoenix Companies, Inc. | $ | 83.7 | | $ | (88.9) | | $ | (5.2) | | $ | 29.6 | | $ | 24.4 |
| | | | | | | | | | | | | | |
EARNINGS (LOSS) PER SHARE:(3) | | | | | | | | | | | | | | |
Earnings (loss) from continuing operations – basic | $ | 6.34 | | $ | (10.34) | | | | | $ | 3.04 | | $ | (0.93) |
Earnings (loss) from continuing operations – diluted | $ | 6.33 | | $ | (10.34) | | | | | $ | 3.04 | | $ | (0.93) |
Loss from discontinued operations – basic | $ | (1.18) | | $ | 0.14 | | | | | $ | — | | $ | (1.05) |
Loss from discontinued operations – diluted | $ | (1.18) | | $ | 0.14 | | | | | $ | — | | $ | (1.05) |
Net loss attributable to
The Phoenix Companies, Inc.– basic | $ | 5.15 | | $ | (10.13) | | | | | $ | 3.04 | | $ | (1.91) |
Net loss attributable to
The Phoenix Companies, Inc.– diluted | $ | 5.15 | | $ | (10.13) | | | | | $ | 3.04 | | $ | (1.91) |
Basic weighted-average common shares
outstanding (in thousands) | | 5,840 | | | 5,814 | (4) | | | | | 5,814 | | | 5,814 |
Diluted weighted-average common shares
outstanding (in thousands) | | 5,849 | | | 5,814 | (4) | | | | | 5,814 | | | 5,814 |
———————
(1)
Adjustments related to the correction of errors reflect amounts prior to the retrospective adoption of amended guidance to ASC 944,Financial Services – Insurance (ASU 2010-26). See footnote 2 below for additional information regarding these amounts and the retrospective adoption.
(2)
Adjustments related to the retrospective adoption of amended guidance to ASC 944,Financial Services – Insurance (ASU 2010-26), have been updated from those originally disclosed in the First Quarter 2012 Quarterly Report on Form 10-Q filing to reflect the correction of errors identified related to the adoption of the amended guidance as well as indirect impact of the correction of errors associated with the restatement.
(3)
All share amounts for all periods reflect the 1-for-20 reverse stock split, which was effective August 10, 2012. See Note 11 to these consolidated financial statements for additional information on the reverse stock split.
(4)
Weighted-average common shares outstanding have been updated to reflect the impact of an error which had no material impact to EPS information, basic or diluted, for any period presented.
F-150
27.
Supplemental Unaudited Quarterly Financial Information (continued)
| | | | | | | | | | | | | | |
| Consolidated Statement of Comprehensive Income |
($ in millions, except share data) | Six months ended June 30, 2011 |
| As previously reported | | Correction of errors (1) | | Adjusted prior to the retrospective adoption | | Retrospective Adoption(2) | | As restated and amended |
|
|
|
REVENUES: | | | | | | | | | | | | | | |
Premiums | $ | 220.3 | | $ | (8.6) | | $ | 211.7 | | $ | — | | $ | 211.7 |
Fee income | | 308.4 | | | 0.9 | | | 309.3 | | | — | | | 309.3 |
Net investment income | | 411.6 | | | 13.0 | | | 424.6 | | | — | | | 424.6 |
Net realized investment gains (losses): | | | | | | | | | | | | | | |
Total OTTI losses | | (14.0) | | | 0.3 | | | (13.7) | | | — | | | (13.7) |
Portion of OTTI losses recognized in OCI | | 5.3 | | | (0.4) | | | 4.9 | | | — | | | 4.9 |
Net OTTI losses recognized in earnings | | (8.7) | | | (0.1) | | | (8.8) | | | — | | | (8.8) |
Net realized investment gains (losses),
excluding OTTI losses | | (4.4) | | | 5.3 | | | 0.9 | | | — | | | 0.9 |
Net realized investment gains (losses) | | (13.1) | | | 5.2 | | | (7.9) | | | — | | | (7.9) |
Gain on debt repurchase | | — | | | — | | | — | | | — | | | — |
Total revenues | | 927.2 | | | 10.5 | | | 937.7 | | | — | | | 937.7 |
| | | | | | | | | | | | | | |
BENEFITS AND EXPENSES: | | | | | | | | | | | | | | |
Policy benefits, excluding policyholder dividends | | 531.8 | | | 20.3 | | | 552.1 | | | 3.4 | | | 555.5 |
Policyholder dividends | | 137.3 | | | 8.2 | | | 145.5 | | | — | | | 145.5 |
Policy acquisition cost amortization | | 114.5 | | | (0.7) | | | 113.8 | | | (21.9) | | | 91.9 |
Interest expense on indebtedness | | 15.8 | | | — | | | 15.8 | | | — | | | 15.8 |
Other operating expenses | | 118.2 | | | 10.8 | | | 129.0 | | | 0.7 | | | 129.7 |
Total benefits and expenses | | 917.6 | | | 38.6 | | | 956.2 | | | (17.8) | | | 938.4 |
Income (loss) from continuing operations
before income taxes | | 9.6 | | | (28.1) | | | (18.5) | | | 17.8 | | | (0.7) |
Income tax expense (benefit) | | 9.1 | | | 0.9 | | | 10.0 | | | 6.3 | | | 16.3 |
Income (loss) from continuing operations | | 0.5 | | | (29.0) | | | (28.5) | | | 11.5 | | | (17.0) |
Loss from discontinued operations,
net of income taxes | | (2.2) | | | — | | | (2.2) | | | — | | | (2.2) |
Net income (loss) | | (1.7) | | | (29.0) | | | (30.7) | | | 11.5 | | | (19.2) |
Less: Net income (loss) attributable to
noncontrolling interests | | — | | | (0.1) | | | (0.1) | | | — | | | (0.1) |
Net income (loss) attributable to
The Phoenix Companies, Inc. | $ | (1.7) | | $ | (28.9) | | $ | (30.6) | | $ | 11.5 | | $ | (19.1) |
(Continued on next page)
F-151
27.
Supplemental Unaudited Quarterly Financial Information (continued)
| | | | | | | | | | | | | | |
(Continued on next page) | Consolidated Statement of Comprehensive Income |
($ in millions, except share data) | Six months ended June 30, 2011 |
| As previously reported | | Correction of errors (1) | | Adjusted prior to the Retrospective adoption | | Retrospective Adoption(2) | | As restated and amended |
|
|
|
COMPREHENSIVE INCOME (LOSS): | | | | | | | | | | | | | | |
Net income (loss) attributable to
The Phoenix Companies, Inc. | $ | (1.7) | | $ | (28.9) | | $ | (30.6) | | $ | 11.5 | | $ | (19.1) |
Net income (loss) attributable to
noncontrolling interests | | — | | | (0.1) | | | (0.1) | | | — | | | (0.1) |
Net income (loss) | | (1.7) | | $ | (29.0) | | $ | (30.7) | | $ | 11.5 | | $ | (19.2) |
Other comprehensive income (loss)
before income taxes: | | | | | | | | | | | | | | |
Net unrealized investment gains
before income taxes | | 33.2 | | | 18.3 | | | 51.5 | | | 2.8 | | | 54.3 |
Non-credit portion of OTTI losses
recognized in OCI before income taxes | | 1.0 | | | (1.3) | | | (0.3) | | | — | | | (0.3) |
Net pension liability adjustment
before income taxes | | 4.1 | | | 1.8 | | | 5.9 | | | — | | | 5.9 |
Net unrealized other gains (losses)
before income taxes | | — | | | — | | | — | | | — | | | — |
Net unrealized derivative instruments
gains (losses) before income taxes | | (1.2) | | | 1.2 | | | — | | | — | | | — |
Other comprehensive income (loss)
before income taxes | | 37.1 | | | 20.0 | | | 57.1 | | | 2.8 | | | 59.9 |
Less: Income tax expense (benefit) related to: | | | | | | | | | | | | | | |
Net unrealized investment gains (losses) | | 28.8 | | | 8.8 | | | 37.6 | | | (6.3) | | | 31.3 |
Non-credit portion of OTTI losses
recognized in OCI | | 0.4 | | | (0.5) | | | (0.1) | | | — | | | (0.1) |
Net pension liability adjustment | | — | | | — | | | — | | | — | | | — |
Net unrealized other gains (losses) | | — | | | — | | | — | | | — | | | — |
Net unrealized derivative instrument
gains (losses) | | — | | | — | | | — | | | — | | | — |
Total income tax expense (benefit) | | 29.2 | | | 8.3 | | | 37.5 | | | (6.3) | | | 31.2 |
Other comprehensive income (loss) | | 7.9 | | | 11.7 | | | 19.6 | | | 9.1 | | | 28.7 |
Comprehensive income (loss) | | 6.2 | | | (17.3) | | | (11.1) | | | 20.6 | | | 9.5 |
Less: Comprehensive income (loss) attributable
to noncontrolling interests, net of income taxes | | — | | | (0.1) | | | (0.1) | | | — | | | (0.1) |
Comprehensive income (loss) attributable
to The Phoenix Companies, Inc. | $ | 6.2 | | $ | (17.2) | | $ | (11.0) | | $ | 20.6 | | $ | 9.6 |
| | | | | | | | | | | | | | |
LOSS PER SHARE:(3) | | | | | | | | | | | | | | |
Loss from continuing operations – basic | $ | 0.09 | | $ | (4.99) | | | | | $ | 1.98 | | $ | (2.92) |
Loss from continuing operations – diluted | $ | 0.08 | | $ | (4.99) | | | | | $ | 1.98 | | $ | (2.92) |
Loss from discontinued operations – basic | $ | (0.38) | | $ | — | | | | | $ | — | | $ | (0.38) |
Loss from discontinued operations –diluted | $ | (0.37) | | $ | — | | | | | $ | — | | $ | (0.38) |
Net loss attributable to
The Phoenix Companies, Inc.– basic | $ | (0.29) | | $ | (4.97) | | | | | $ | 1.98 | | $ | (3.29) |
Net loss attributable to
The Phoenix Companies, Inc.– diluted | $ | (0.29) | | $ | (4.97) | | | | | $ | 1.98 | | $ | (3.29) |
Basic weighted-average common shares
outstanding (in thousands) | | 5,814 | | | 5,814 | (4) | | | | $ | 5,814 | | | 5,814 |
Diluted weighted-average common shares
outstanding (in thousands) | | 5,889 | | | 5,814 | (4) | | | | $ | 5,814 | | | 5,814 |
———————
(1)
Adjustments related to the correction of errors reflect amounts prior to the retrospective adoption of amended guidance to ASC 944,Financial Services – Insurance (ASU 2010-26). See footnote 2 below for additional information regarding these amounts and the retrospective adoption.
(2)
Adjustments related to the retrospective adoption of amended guidance to ASC 944,Financial Services – Insurance (ASU 2010-26), have been updated from those originally disclosed in the First Quarter 2012 Quarterly Report on Form 10-Q filing to reflect the correction of errors identified related to the adoption of the amended guidance as well as indirect impact of the correction of errors associated with the restatement.
(3)
All share amounts for all periods reflect the 1-for-20 reverse stock split, which was effective August 10, 2012. See Note 11 to these consolidated financial statements for additional information on the reverse stock split.
(4)
Weighted-average common shares outstanding have been updated to reflect the impact of an error which had no material impact to EPS information, basic or diluted, for any period presented.
F-152
27.
Supplemental Unaudited Quarterly Financial Information (continued)
| | | | | | | | | | | | | | | | | | |
| Consolidated Balance Sheet |
($ in millions, except share data) | As of September 30, 2011 |
| As previously reported | | Correction of errors (1) | | Adjusted prior to the retrospective adoption | | Retrospective Adoption(2) | | As restated and amended |
|
|
|
ASSETS: | | | | | | | | | | | | | | |
Available-for-sale debt securities, at fair value | $ | 11,676.3 | | $ | (63.5) | | $ | 11,612.8 | | $ | — | | $ | 11,612.8 |
Available-for-sale equity securities, at fair value | | 47.8 | | | (8.9) | | | 38.9 | | | — | | | 38.9 |
Limited partnerships and other investments | | 610.2 | | | (39.1) | | | 571.1 | | | — | | | 571.1 |
Policy loans, at unpaid principal balances | | 2,352.4 | | | — | | | 2,352.4 | | | — | | | 2,352.4 |
Derivative investments | | 171.3 | | | (13.8) | | | 157.5 | | | — | | | 157.5 |
Fair value investments | | 88.2 | | | 85.2 | | | 173.4 | | | — | | | 173.4 |
Total investments | | 14,946.2 | | | (40.1) | | | 14,906.1 | | | — | | | 14,906.1 |
Cash and cash equivalents | | 148.8 | | | (20.5) | | | 128.3 | | | — | | | 128.3 |
Accrued investment income | | 203.8 | | | (0.1) | | | 203.7 | | | — | | | 203.7 |
Receivables | | 413.2 | | | 237.9 | | | 651.1 | | | — | | | 651.1 |
Deferred policy acquisition costs | | 1,330.3 | | | (4.4) | | | 1,325.9 | | | (193.1) | | | 1,132.8 |
Deferred income taxes, net | | 121.0 | | | (1.1) | | | 119.9 | | | — | | | 119.9 |
Other assets | | 150.6 | | | 49.7 | | | 200.3 | | | (1.0) | | | 199.3 |
Discontinued operations assets | | 54.9 | | | 14.1 | | | 69.0 | | | — | | | 69.0 |
Separate account assets | | 3,666.9 | | | (1.0) | | | 3,665.9 | | | — | | | 3,665.9 |
Total assets | $ | 21,035.7 | | $ | 234.5 | | $ | 21,270.2 | | $ | (194.1) | | $ | 21,076.1�� |
| | | | | | | | | | | | | | |
LIABILITIES: | | | | | | | | | | | | | | |
Policy liabilities and accruals | $ | 12,978.8 | | $ | (338.2) | | $ | 12,640.6 | | $ | (19.6) | | $ | 12,621.0 |
Policyholder deposit funds | | 2,156.5 | | | 6.2 | | | 2,162.7 | | | — | | | 2,162.7 |
Dividend obligations(3) | | — | | | 758.3 | | | 758.3 | | | — | | | 758.3 |
Indebtedness | | 427.7 | | | — | | | 427.7 | | | — | | | 427.7 |
Other liabilities | | 517.7 | | | 34.2 | | | 551.9 | | | — | | | 551.9 |
Discontinued operations liabilities | | 47.1 | | | 14.1 | | | 61.2 | | | — | | | 61.2 |
Separate account liabilities | | 3,666.9 | | | (1.0) | | | 3,665.9 | | | — | | | 3,665.9 |
Total liabilities | | 19,794.7 | | | 473.6 | | | 20,268.3 | | | (19.6) | | | 20,248.7 |
| | | | | | | | | | | | | | |
COMMITMENTS AND CONTINGENT LIABILITIES (Notes 23, 24, & 25) | | | | | | | | | | | | | | |
| | | | | | | | | | | | | | |
STOCKHOLDERS’ EQUITY: | | | | | | | | | | | | | | |
Common stock, $.01 par value: 5.7 million
shares outstanding(4) | | 1.3 | | | — | | | 1.3 | | | — | | | 1.3 |
Additional paid-in capital | | 2,632.8 | | | — | | | 2,632.8 | | | — | | | 2,632.8 |
Accumulated other comprehensive income (loss) | | (80.2) | | | (80.7) | | | (160.9) | | | 40.2 | | | (120.7) |
Accumulated deficit | | (1,133.4) | | | (161.0) | | | (1,294.4) | | | (214.7) | | | (1,509.1) |
Treasury stock, at cost: 0.6 million shares(4) | | (179.5) | | | — | | | (179.5) | | | — | | | (179.5) |
Total The Phoenix Companies ,Inc.
stockholders’ equity | | 1,241.0 | | | (241.7) | | | 999.3 | | | (174.5) | | | 824.8 |
Noncontrolling interests | | — | | | 2.6 | | | 2.6 | | | — | | | 2.6 |
Total stockholders’ equity | | 1,241.0 | | | (239.1) | | | 1,001.9 | | | (174.5) | | | 827.4 |
Total liabilities and stockholders’ equity | $ | 21,035.7 | | $ | 234.5 | | $ | 21,270.2 | | $ | (194.1) | | $ | 21,076.1 |
———————
(1)
Adjustments related to the correction of errors reflect amounts prior to the retrospective adoption of amended guidance to ASC 944,Financial Services – Insurance (ASU 2010-26). See footnote 2 below for additional information regarding these amounts and the retrospective adoption.
(2)
Adjustments related to the retrospective adoption of amended guidance to ASC 944,Financial Services – Insurance (ASU 2010-26), have been updated from those originally disclosed in the First Quarter 2012 Quarterly Report on Form 10-Q filing to reflect the correction of errors identified related to the adoption of the amended guidance as well as indirect impact of the correction of errors associated with the restatement.
(3)
Dividend obligations were previously included in policy liabilities and accruals.
(4)
All share amounts for all periods reflect the 1-for-20 reverse stock split, which was effective August 10, 2012. See Note 11 to these consolidated financial statements for additional information on the reverse stock split.
F-153
27.
Supplemental Unaudited Quarterly Financial Information (continued)
| | | | | | | | | | | | | | | | | | |
| Consolidated Balance Sheet |
($ in millions, except share data) | As of June 30, 2011 |
| As previously reported | | Correction of errors (1) | | Adjusted prior to the retrospective adoption | | Retrospective Adoption(2) | | As restated and amended |
|
|
|
ASSETS: | | | | | | | | | | | | | | |
Available-for-sale debt securities, at fair value | $ | 11,401.9 | | $ | (54.6) | | $ | 11,347.3 | | $ | — | | $ | 11,347.3 |
Available-for-sale equity securities, at fair value | | 48.5 | | | (5.3) | | | 43.2 | | | — | | | 43.2 |
Limited partnerships and other investments | | 610.5 | | | (47.8) | | | 562.7 | | | — | | | 562.7 |
Policy loans, at unpaid principal balances | | 2,365.0 | | | —— | | | 2,365.0 | | | — | | | 2,365.0 |
Derivative investments | | 118.2 | | | (1.9) | | | 116.3 | | | — | | | 116.3 |
Fair value investments | | 93.3 | | | 86.5 | | | 179.8 | | | — | | | 179.8 |
Total investments | | 14,637.4 | | | (23.1) | | | 14,614.3 | | | — | | | 14,614.3 |
Cash and cash equivalents | | 135.1 | | | (31.2) | | | 103.9 | | | — | | | 103.9 |
Accrued investment income | | 180.7 | | | 0.1 | | | 180.8 | | | — | | | 180.8 |
Receivables | | 432.5 | | | 247.7 | | | 680.2 | | | — | | | 680.2 |
Deferred policy acquisition costs | | 1,358.9 | | | (2.5) | | | 1,356.4 | | | (200.3) | | | 1,156.1 |
Deferred income taxes, net | | 88.7 | | | 0.6 | | | 89.3 | | | — | | | 89.3 |
Other assets | | 154.3 | | | 50.0 | | | 204.3 | | | (1.0) | | | 203.3 |
Discontinued operations assets | | 53.4 | | | 14.5 | | | 67.9 | | | — | | | 67.9 |
Separate account assets | | 4,336.3 | | | 0.3 | | | 4,336.6 | | | — | | | 4,336.6 |
Total assets | $ | 21,377.3 | | $ | 256.4 | | $ | 21,633.7 | | $ | (201.3) | | $ | 21,432.4 |
| | | | | | | | | | | | | | |
LIABILITIES: | | | | | | | | | | | | | | |
Policy liabilities and accruals | $ | 12,975.0 | | $ | (295.6) | | $ | 12,679.4 | | $ | (17.8) | | $ | 12,661.6 |
Policyholder deposit funds | | 1,860.6 | | | 0.9 | | | 1,861.5 | | | — | | | 1,861.5 |
Dividend obligations(3) | | — | | | 690.8 | | | 690.8 | | | — | | | 690.8 |
Indebtedness | | 427.7 | | | — | | | 427.7 | | | — | | | 427.7 |
Other liabilities | | 569.0 | | | 12.5 | | | 581.5 | | | — | | | 581.5 |
Discontinued operations liabilities | | 45.6 | | | 14.5 | | | 60.1 | | | — | | | 60.1 |
Separate account liabilities | | 4,336.3 | | | 0.3 | | | 4,336.6 | | | — | | | 4,336.6 |
Total liabilities | | 20,214.2 | | | 423.4 | | | 20,637.6 | | | (17.8) | | | 20,619.8 |
| | | | | | | | | | | | | | |
COMMITMENTS AND CONTINGENT LIABILITIES (Notes 23, 24, & 25) | | | | | | | | | | | | | | |
| | | | | | | | | | | | | | |
STOCKHOLDERS’ EQUITY: | | | | | | | | | | | | | | |
Common stock, $.01 par value: 5.7 million
shares outstanding(4) | | 1.3 | | | — | | | 1.3 | | | — | | | 1.3 |
Additional paid-in capital | | 2,632.4 | | | — | | | 2,632.4 | | | — | | | 2,632.4 |
Accumulated other comprehensive income (loss) | | (125.9) | | | (39.0) | | | (164.9) | | | 37.4 | | | (127.5) |
Accumulated deficit | | (1,165.2) | | | (131.0) | | | (1,296.2) | | | (220.9) | | | (1,517.1) |
Treasury stock, at cost: 0.6 million shares(4) | | (179.5) | | | — | | | (179.5) | | | — | | | (179.5) |
Total The Phoenix Companies, Inc.
stockholders’ equity | | 1,163.1 | | | (170.0) | | | 993.1 | | | (183.5) | | | 809.6 |
Noncontrolling interests | | — | | | 3.0 | | | 3.0 | | | — | | | 3.0 |
Total stockholders’ equity | | 1,163.1 | | | (167.0) | | | 996.1 | | | (183.5) | | | 812.6 |
Total liabilities and stockholders’ equity | $ | 21,377.3 | | $ | 256.4 | | $ | 21,633.7 | | $ | (201.3) | | $ | 21,432.4 |
———————
(1)
Adjustments related to the correction of errors reflect amounts prior to the retrospective adoption of amended guidance to ASC 944,Financial Services – Insurance (ASU 2010-26). See footnote 2 below for additional information regarding these amounts and the retrospective adoption.
(2)
Adjustments related to the retrospective adoption of amended guidance to ASC 944,Financial Services – Insurance (ASU 2010-26), have been updated from those originally disclosed in the First Quarter 2012 Quarterly Report on Form 10-Q filing to reflect the correction of errors identified related to the adoption of the amended guidance as well as indirect impact of the correction of errors associated with the restatement.
(3)
Dividend obligations were previously included in policy liabilities and accruals.
(4)
All share amounts for all periods reflect the 1-for-20 reverse stock split, which was effective August 10, 2012. See Note 11 to these consolidated financial statements for additional information on the reverse stock split.
F-154
27.
Supplemental Unaudited Quarterly Financial Information (continued)
| | | | | | | | | | | | | | | | | | |
| Consolidated Balance Sheet |
($ in millions, except share data) | As of March 31, 2011 |
| As previously reported | | Correction of errors (1) | | Adjusted prior to the retrospective adoption | | Retrospective Adoption(2) | | As restated and amended |
|
|
|
ASSETS: | | | | | | | | | | | | | | |
Available-for-sale debt securities, at fair value | $ | 11,159.5 | | $ | (40.7) | | $ | 11,118.8 | | $ | — | | $ | 11,118.8 |
Available-for-sale equity securities, at fair value | | 52.2 | | | (9.8) | | | 42.4 | | | — | | | 42.4 |
Limited partnerships and other investments | | 593.7 | | | (46.8) | | | 546.9 | | | — | | | 546.9 |
Policy loans, at unpaid principal balances | | 2,373.8 | | | — | | | 2,373.8 | | | — | | | 2,373.8 |
Derivative investments | | 121.5 | | | (0.9) | | | 120.6 | | | — | | | 120.6 |
Fair value investments | | 92.5 | | | 75.6 | | | 168.1 | | | — | | | 168.1 |
Total investments | | 14,393.2 | | | (22.6) | | | 14,370.6 | | | — | | | 14,370.6 |
Cash and cash equivalents | | 107.3 | | | (37.5) | | | 69.8 | | | — | | | 69.8 |
Accrued investment income | | 173.5 | | | 0.2 | | | 173.7 | | | — | | | 173.7 |
Receivables | | 432.0 | | | 268.3 | | | 700.3 | | | — | | | 700.3 |
Deferred policy acquisition costs | | 1,403.3 | | | 4.0 | | | 1,407.3 | | | (212.2) | | | 1,195.1 |
Deferred income taxes, net | | 93.5 | | | (1.9) | | | 91.6 | | | — | | | 91.6 |
Other assets | | 165.5 | | | 34.4 | | | 199.9 | | | (1.0) | | | 198.9 |
Discontinued operations assets | | 54.9 | | | 17.0 | | | 71.9 | | | — | | | 71.9 |
Separate account assets | | 4,448.9 | | | (1.6) | | | 4,447.3 | | | — | | | 4,447.3 |
Total assets | $ | 21,272.1 | | $ | 260.3 | | $ | 21,532.4 | | $ | (213.2) | | $ | 21,319.2 |
| | | | | | | | | | | | | | |
LIABILITIES: | | | | | | | | | | | | | | |
Policy liabilities and accruals | $ | 12,960.6 | | $ | (220.0) | | $ | 12,740.6 | | $ | (19.4) | | $ | 12,721.2 |
Policyholder deposit funds | | 1,667.2 | | | 0.2 | | | 1,667.4 | | | — | | | 1,667.4 |
Dividend obligations(3) | | — | | | 618.1 | | | 618.1 | | | — | | | 618.1 |
Indebtedness | | 427.7 | | | — | | | 427.7 | | | — | | | 427.7 |
Other liabilities | | 575.7 | | | 1.6 | | | 577.3 | | | — | | | 577.3 |
Discontinued operations liabilities | | 45.5 | | | 17.0 | | | 62.5 | | | — | | | 62.5 |
Separate account liabilities | | 4,448.9 | | | (1.6) | | | 4,447.3 | | | — | | | 4,447.3 |
Total liabilities | | 20,125.6 | | | 415.3 | | | 20,540.9 | | | (19.4) | | | 20,521.5 |
| | | | | | | | | | | | | | |
COMMITMENTS AND CONTINGENT LIABILITIES (Notes 23, 24, & 25) | | | | | | | | | | | | | | |
| | | | | | | | | | | | | | |
STOCKHOLDERS’ EQUITY: | | | | | | | | | | | | | | |
Common stock, $.01 par value: 5.7 million
shares outstanding(4) | | 1.3 | | | — | | | 1.3 | | | — | | | 1.3 |
Additional paid-in capital | | 2,631.7 | | | — | | | 2,631.7 | | | — | | | 2,631.7 |
Accumulated other comprehensive income (loss) | | (137.4) | | | (43.6) | | | (181.0) | | | 32.4 | | | (148.6) |
Accumulated deficit | | (1,169.6) | | | (113.3) | | | (1,282.9) | | | (226.2) | | | (1,509.1) |
Treasury stock, at cost: 0.6 million shares(4) | | (179.5) | | | — | | | (179.5) | | | — | | | (179.5) |
Total The Phoenix Companies, Inc.
stockholders’ equity | | 1,146.5 | | | (156.9) | | | 989.6 | | | (193.8) | | | 795.8 |
Noncontrolling interests | | — | | | 1.9 | | | 1.9 | | | — | | | 1.9 |
Total stockholders’ equity | | 1,146.5 | | | (155.0) | | | 991.5 | | | (193.8) | | | 797.7 |
Total liabilities and stockholders’ equity | $ | 21,272.1 | | $ | 260.3 | | $ | 21,532.4 | | $ | (213.2) | | $ | 21,319.2 |
———————
(1)
Adjustments related to the correction of errors reflect amounts prior to the retrospective adoption of amended guidance to ASC 944,Financial Services – Insurance (ASU 2010-26). See footnote 2 below for additional information regarding these amounts and the retrospective adoption.
(2)
Adjustments related to the retrospective adoption of amended guidance to ASC 944,Financial Services – Insurance (ASU 2010-26), have been updated from those originally disclosed in the First Quarter 2012 Quarterly Report on Form 10-Q filing to reflect the correction of errors identified related to the adoption of the amended guidance as well as indirect impact of the correction of errors associated with the restatement.
(3)
Dividend obligations were previously included in policy liabilities and accruals.
(4)
All share amounts for all periods reflect the 1-for-20 reverse stock split, which was effective August 10, 2012. See Note 11 to these consolidated financial statements for additional information on the reverse stock split.
F-155
27.
Supplemental Unaudited Quarterly Financial Information (continued)
| | | | | | | | | | | | | | |
| Consolidated Statement of Changes in Stockholders’ Equity |
($ in millions, except share data) | For the period ended December 31, 2011 |
| As previously Reported | | Correction of errors(1) | | Adjusted prior to the retrospective adoption | | Retrospective Adoption(2) | | As restated and amended |
|
|
|
COMMON STOCK:(3) | | | | | | | | | | | | | | |
Balance, beginning of period | $ | 1.3 | | $ | — | | $ | 1.3 | | $ | — | | $ | 1.3 |
Adjustment for reverse stock split | | — | | | — | | | — | | | — | | | — |
Balance, end of period | $ | 1.3 | | $ | — | | $ | 1.3 | | $ | — | | $ | 1.3 |
| | | | | | | | | | | | | | |
ADDITIONAL PAID-IN CAPITAL: | | | | | | | | | | | | | | |
Balance, beginning of period | $ | 2,631.0 | | $ | — | | $ | 2,631.0 | | $ | — | | $ | 2,631.0 |
Issuance of shares and compensation expense
on stock compensation awards | | (0.5) | | | — | | | (0.5) | | | — | | | (0.5) |
Adjustment for reverse stock split | | — | | | — | | | — | | | — | | | — |
Balance, end of period | $ | 2,630.5 | | $ | — | | $ | 2,630.5 | | $ | — | | $ | 2,630.5 |
| | | | | | | | | | | | | | |
ACCUMULATED OTHER COMPREHENSIVE
INCOME (LOSS): | | | | | | | | | | | | | | |
Balance, beginning of period | $ | (133.8) | | $ | (50.7) | | $ | (184.5) | | $ | 28.3 | | $ | (156.2) |
Adjustment for initial application of
accounting changes | | — | | | — | | | — | | | — | | | — |
Other comprehensive income (loss) | | (36.9) | | | (52.8) | | | (89.7) | | | 15.2 | | | (74.5) |
Balance, end of period | $ | (170.7) | | $ | (103.5) | | $ | (274.2) | | $ | 43.5 | | $ | (230.7) |
| | | | | | | | | | | | | | |
ACCUMULATED DEFICIT: | | | | | | | | | | | | | | |
Balance, beginning of period | $ | (1,163.5) | | $ | (102.1) | | $ | (1,265.6) | | $ | (232.4) | | $ | (1,498.0) |
Adjustment for initial application of
accounting changes | | — | | | — | | | — | | | — | | | — |
Net income (loss) | | 8.1 | | | (61.2) | | | (53.1) | | | 22.4 | | | (30.7) |
Balance, end of period | $ | (1,155.4) | | $ | (163.3) | | $ | (1,318.7) | | $ | (210.0) | | $ | (1,528.7) |
| | | | | | | | | | | | | | |
TREASURY STOCK, AT COST:(3) | | | | | | | | | | | | | | |
Balance, beginning of period | $ | (179.5) | | $ | — | | $ | (179.5) | | $ | — | | $ | (179.5) |
Treasury shares purchased | | — | | | — | | | — | | | — | | | — |
Balance, end of period | $ | (179.5) | | $ | — | | $ | (179.5) | | $ | — | | $ | (179.5) |
| | | | | | | | | | | | | | |
TOTAL STOCKHOLDERS’ EQUITY
ATTRIBUTABLE TO
THE PHOENIX COMPANIES, INC.: | | | | | | | | | | | | | | |
Balance, beginning of period | $ | 1,155.5 | | $ | (152.8) | | $ | 1,002.7 | | $ | (204.1) | | $ | 798.6 |
Adjustment for initial application of
accounting changes | | —— | | | —— | | | — | | | — | | | —— |
Change in stockholders’ equity attributable to
The Phoenix Companies, Inc. | | (29.3) | | | (114.0) | | | (143.3) | | | 37.6 | | | (105.7) |
Stockholders’ equity, end of period | $ | 1,126.2 | | $ | (266.8) | | $ | 859.4 | | $ | (166.5) | | $ | 692.9 |
| | | | | | | | | | | | | | |
NONCONTROLLING INTERESTS: | | | | | | | | | | | | | | |
Balance, beginning of period | $ | — | | $ | 1.8 | | $ | 1.8 | | | — | | $ | 1.8 |
Change in noncontrolling interests | | — | | | 1.0 | | | 1.0 | | | — | | | 1.0 |
Balance, end of period | $ | — | | $ | 2.8 | | $ | 2.8 | | $ | — | | $ | 2.8 |
| | | | | | | | | | | | | | |
TOTAL STOCKHOLDERS’ EQUITY: | | | | | | | | | | | | | | |
Balance, beginning of period | $ | 1,155.5 | | $ | (151.0) | | $ | 1,004.5 | | $ | (204.1) | | $ | 800.4 |
Adjustment for initial application of
accounting changes | | —— | | | —— | | | — | | | — | | | —— |
Change in stockholders’ equity | | (29.3) | | | (113.0) | | | (142.3) | | | 37.6 | | | (104.7) |
Stockholders’ equity, end of period | $ | 1,126.2 | | $ | (264.0) | | $ | 862.2 | | $ | (166.5) | | $ | 695.7 |
———————
(1)
Adjustments related to the correction of errors reflect amounts prior to the retrospective adoption of amended guidance to ASC 944,Financial Services – Insurance (ASU 2010-26). See footnote 2 below for additional information regarding these amounts and the retrospective adoption.
(2)
Adjustments related to the retrospective adoption of amended guidance to ASC 944,Financial Services – Insurance (ASU 2010-26), have been updated from those originally disclosed in the First Quarter 2012 Quarterly Report on Form 10-Q filing to reflect the correction of errors identified related to the adoption of the amended guidance as well as indirect impact of the correction of errors associated with the restatement.
(3)
Reflects the 1-for-20 reverse stock split, which was effective August 10, 2012. See Note 11 to these consolidated financial statements for additional information on the reverse stock split.
F-156
27.
Supplemental Unaudited Quarterly Financial Information (continued)
| | | | | | | | | | | | | | |
| Consolidated Statement of Changes in Stockholders’ Equity |
($ in millions, except share data) | For the period ended September 30, 2011 |
| As previously reported | | Correction of errors(1) | | Adjusted prior to the retrospective adoption | | Retrospective Adoption(2) | | As restated and amended |
|
|
|
COMMON STOCK:(3) | | | | | | | | | | | | | | |
Balance, beginning of period | $ | 1.3 | | $ | — | | $ | 1.3 | | $ | — | | $ | 1.3 |
Adjustment for reverse stock split | | — | | | — | | | — | | | — | | | — |
Balance, end of period | $ | 1.3 | | $ | — | | $ | 1.3 | | $ | — | | $ | 1.3 |
| | | | | | | | | | | | | | |
ADDITIONAL PAID-IN CAPITAL: | | | | | | | | | | | | | | |
Balance, beginning of period | $ | 2,631.0 | | $ | — | | $ | 2,631.0 | | $ | — | | $ | 2,631.0 |
Issuance of shares and compensation expense
on stock compensation awards | | 1.8 | | | — | | | 1.8 | | | — | | | 1.8 |
Adjustment for reverse stock split | | — | | | — | | | — | | | — | | | — |
Balance, end of period | $ | 2,632.8 | | $ | — | | $ | 2,632.8 | | $ | — | | $ | 2,632.8 |
| | | | | | | | | | | | | | |
ACCUMULATED OTHER COMPREHENSIVE
INCOME (LOSS): | | | | | | | | | | | | | | |
Balance, beginning of period | $ | (133.8) | | $ | (50.7) | | $ | (184.5) | | $ | 28.3 | | $ | (156.2) |
Adjustment for initial application of
accounting changes | | — | | | — | | | — | | | — | | | — |
Other comprehensive income (loss) | | 53.6 | | | (30.0) | | | 23.6 | | | 11.9 | | | 35.5 |
Balance, end of period | $ | (80.2) | | $ | (80.7) | | $ | (160.9) | | $ | 40.2 | | $ | (120.7) |
| | | | | | | | | | | | | | |
ACCUMULATED DEFICIT: | | | | | | | | | | | | | | |
Balance, beginning of period | $ | (1,163.5) | | $ | (102.1) | | $ | (1,265.6) | | $ | (232.4) | | $ | (1,498.0) |
Adjustment for initial application of
accounting changes | | — | | | — | | | — | | | — | | | — |
Net income (loss) | | 30.1 | | | (58.9) | | | (28.8) | | | 17.7 | | | (11.1) |
Balance, end of period | $ | (1,133.4) | | $ | (161.0) | | $ | (1,294.4) | | $ | (214.7) | | $ | (1,509.1) |
| | | | | | | | | | | | | | |
TREASURY STOCK, AT COST:(3) | | | | | | | | | | | | | | |
Balance, beginning of period | $ | (179.5) | | $ | — | | $ | (179.5) | | $ | — | | $ | (179.5) |
Change in treasury stock | | — | | | — | | | — | | | — | | | — |
Balance, end of period | $ | (179.5) | | $ | — | | $ | (179.5) | | $ | — | | $ | (179.5) |
| | | | | | | | | | | | | | |
TOTAL STOCKHOLDERS’ EQUITY
ATTRIBUTABLE TO
THE PHOENIX COMPANIES, INC.: | | | | | | | | | | | | | | |
Balance, beginning of period | $ | 1,155.5 | | $ | (152.8) | | $ | 1,002.7 | | $ | (204.1) | | $ | 798.6 |
Adjustment for initial application of
accounting changes | | — | | | — | | | — | | | — | | | — |
Change in stockholders’ equity attributable to
The Phoenix Companies, Inc. | | 85.5 | | | (88.9) | | | (3.4) | | | 29.6 | | | 26.2 |
Stockholders’ equity, end of period | $ | 1,241.0 | | $ | (241.7) | | $ | 999.3 | | $ | (174.5) | | $ | 824.8 |
| | | | | | | | | | | | | | |
NONCONTROLLING INTERESTS: | | | | | | | | | | | | | | |
Balance, beginning of period | $ | — | | $ | 1.8 | | $ | 1.8 | | | — | | $ | 1.8 |
Change in noncontrolling interests | | — | | | 0.8 | | | 0.8 | | | — | | | 0.8 |
Balance, end of period | $ | — | | $ | 2.6 | | $ | 2.6 | | $ | — | | $ | 2.6 |
| | | | | | | | | | | | | | |
TOTAL STOCKHOLDERS’ EQUITY: | | | | | | | | | | | | | | |
Balance, beginning of period | $ | 1,155.5 | | $ | (151.0) | | $ | 1,004.5 | | $ | (204.1) | | $ | 800.4 |
Adjustment for initial application of
accounting changes | | — | | | — | | | — | | | — | | | — |
Change in stockholders’ equity | | 85.5 | | | (88.1) | | | (2.6) | | | 29.6 | | | 27.0 |
Stockholders’ equity, end of period | $ | 1,241.0 | | $ | (239.1) | | $ | 1,001.9 | | $ | (174.5) | | $ | 827.4 |
———————
(1)
Adjustments related to the correction of errors reflect amounts prior to the retrospective adoption of amended guidance to ASC 944,Financial Services – Insurance (ASU 2010-26). See footnote 2 below for additional information regarding these amounts and the retrospective adoption.
(2)
Adjustments related to the retrospective adoption of amended guidance to ASC 944,Financial Services – Insurance (ASU 2010-26), have been updated from those originally disclosed in the First Quarter 2012 Quarterly Report on Form 10-Q filing to reflect the correction of errors identified related to the adoption of the amended guidance as well as indirect impact of the correction of errors associated with the restatement.
(3)
Reflects the 1-for-20 reverse stock split, which was effective August 10, 2012. See Note 11 to these consolidated financial statements for additional information on the reverse stock split.
F-157
27.
Supplemental Unaudited Quarterly Financial Information (continued)
| | | | | | | | | | | | | | |
| Consolidated Statement of Changes in Stockholders’ Equity |
($ in millions, except share data) | For the period ended June 30, 2011 |
| As previously reported | | Correction of errors(1) | | Adjusted prior to the retrospective adoption | | Retrospective Adoption(2) | | As restated and amended |
|
|
|
COMMON STOCK:(3) | | | | | | | | | | | | | | |
Balance, beginning of period | $ | 1.3 | | $ | — | | $ | 1.3 | | $ | — | | $ | 1.3 |
Adjustment for reverse stock split | | — | | | — | | | — | | | — | | | — |
Balance, end of period | $ | 1.3 | | $ | — | | $ | 1.3 | | $ | — | | $ | 1.3 |
| | | | | | | | | | | | | | |
ADDITIONAL PAID-IN CAPITAL: | | | | | | | | | | | | | | |
Balance, beginning of period | $ | 2,631.0 | | $ | — | | $ | 2,631.0 | | $ | — | | $ | 2,631.0 |
Issuance of shares and compensation expense
on stock compensation awards | | 1.4 | | | — | | | 1.4 | | | — | | | 1.4 |
Adjustment for reverse stock split | | — | | | — | | | — | | | — | | | — |
Balance, end of period | $ | 2,632.4 | | $ | — | | $ | 2,632.4 | | $ | — | | $ | 2,632.4 |
| | | | | | | | | | | | | | |
ACCUMULATED OTHER COMPREHENSIVE
INCOME (LOSS): | | | | | | | | | | | | | | |
Balance, beginning of period | | (133.8) | | $ | (50.7) | | $ | (184.5) | | $ | 28.3 | | $ | (156.2) |
Adjustment for initial application of
accounting changes | | — | | | — | | | — | | | — | | | — |
Other comprehensive income (loss) | | 7.9 | | | 11.7 | | | 19.6 | | | 9.1 | | | 28.7 |
Balance, end of period | $ | (125.9) | | $ | (39.0) | | $ | (164.9) | | $ | 37.4 | | $ | (127.5) |
| | | | | | | | | | | | | | |
ACCUMULATED DEFICIT: | | | | | | | | | | | | | | |
Balance, beginning of period | $ | (1,163.5) | | $ | (102.1) | | $ | (1,265.6) | | $ | (232.4) | | $ | (1,498.0) |
Adjustment for initial application of
accounting changes | | — | | | — | | | — | | | — | | | — |
Net income (loss) | | (1.7) | | | (28.9) | | | (30.6) | | | 11.5 | | | (19.1) |
Balance, end of period | $ | (1,165.2) | | $ | (131.0) | | $ | (1,296.2) | | $ | (220.9) | | $ | (1,517.1) |
| | | | | | | | | | | | | | |
TREASURY STOCK, AT COST:(3) | | | | | | | | | | | | | | |
Balance, beginning of period | $ | (179.5) | | $ | — | | $ | (179.5) | | $ | — | | $ | (179.5) |
Treasury shares purchased | | — | | | — | | | — | | | — | | | — |
Balance, end of period | $ | (179.5) | | $ | — | | $ | (179.5) | | $ | — | | $ | (179.5) |
| | | | | | | | | | | | | | |
TOTAL STOCKHOLDERS’ EQUITY
ATTRIBUTABLE TO
THE PHOENIX COMPANIES, INC.: | | | | | | | | | | | | | | |
Balance, beginning of period | $ | 1,155.5 | | $ | (152.8) | | $ | 1,002.7 | | $ | (204.1) | | $ | 798.6 |
Adjustment for initial application of
accounting changes | | — | | | — | | | — | | | — | | | — |
Change in stockholders’ equity attributable to
The Phoenix Companies, Inc. | | 7.6 | | | (17.2) | | | (9.6) | | | 20.6 | | | 11.0 |
Stockholders’ equity, end of period | $ | 1,163.1 | | $ | (170.0) | | $ | 993.1 | | $ | (183.5) | | $ | 809.6 |
| | | | | | | | | | | | | | |
NONCONTROLLING INTERESTS: | | | | | | | | | | | | | | |
Balance, beginning of period | $ | — | | $ | 1.8 | | $ | 1.8 | | | — | | $ | 1.8 |
Change in noncontrolling interests | | — | | | 1.2 | | | 1.2 | | | — | | | 1.2 |
Balance, end of period | $ | — | | $ | 3.0 | | $ | 3.0 | | $ | — | | $ | 3.0 |
| | | | | | | | | | | | | | |
TOTAL STOCKHOLDERS’ EQUITY: | | | | | | | | | | | | | | |
Balance, beginning of period | $ | 1,155.5 | | $ | (151.0) | | $ | 1,004.5 | | $ | (204.1) | | $ | 800.4 |
Adjustment for initial application of
accounting changes | | — | | | — | | | — | | | — | | | — |
Change in stockholders’ equity | | 7.6 | | | (16.0) | | | (8.4) | | | 20.6 | | | 12.2 |
Stockholders’ equity, end of period | $ | 1,163.1 | | $ | (167.0) | | $ | 996.1 | | $ | (183.5) | | $ | 812.6 |
———————
(1)
Adjustments related to the correction of errors reflect amounts prior to the retrospective adoption of amended guidance to ASC 944,Financial Services – Insurance (ASU 2010-26). See footnote 2 below for additional information regarding these amounts and the retrospective adoption.
(2)
Adjustments related to the retrospective adoption of amended guidance to ASC 944,Financial Services – Insurance (ASU 2010-26), have been updated from those originally disclosed in the First Quarter 2012 Quarterly Report on Form 10-Q filing to reflect the correction of errors identified related to the adoption of the amended guidance as well as indirect impact of the correction of errors associated with the restatement.
(3)
Reflects the 1-for-20 reverse stock split, which was effective August 10, 2012. See Note 11 to these consolidated financial statements for additional information on the reverse stock split.
F-158
27.
Supplemental Unaudited Quarterly Financial Information (continued)
| | | | | | | | | | | | | | |
| Consolidated Statement of Changes in Stockholders’ Equity |
($ in millions, except share data) | For the period ended March 31, 2011 |
| As previously reported | | Correction of errors(1) | | Adjusted prior to the retrospective adoption | | Retrospective Adoption(2) | | As restated and amended |
|
|
|
COMMON STOCK:(3) | | | | | | | | | | | | | | |
Balance, beginning of period | $ | 1.3 | | $ | — | | $ | 1.3 | | $ | — | | $ | 1.3 |
Adjustment for reverse stock split | | — | | | — | | | — | | | — | | | — |
Balance, end of period | $ | 1.3 | | $ | — | | $ | 1.3 | | $ | — | | $ | 1.3 |
| | | | | | | | | | | | | | |
ADDITIONAL PAID-IN CAPITAL: | | | | | | | | | | | | | | |
Balance, beginning of period | $ | 2,631.0 | | $ | — | | $ | 2,631.0 | | $ | — | | $ | 2,631.0 |
Issuance of shares and compensation expense
on stock compensation awards | | 0.7 | | | — | | | 0.7 | | | — | | | 0.7 |
Adjustment for reverse stock split | | — | | | — | | | — | | | — | | | — |
Balance, end of period | $ | 2,631.7 | | $ | — | | $ | 2,631.7 | | $ | — | | $ | 2,631.7 |
| | | | | | | | | | | | | | |
ACCUMULATED OTHER COMPREHENSIVE
INCOME (LOSS): | | | | | | | | | | | | | | |
Balance, beginning of period | | (133.8) | | $ | (50.7) | | $ | (184.5) | | $ | 28.3 | | $ | (156.2) |
Adjustment for initial application of
accounting changes | | — | | | — | | | — | | | — | | | — |
Other comprehensive income (loss) | | (3.6) | | | 7.1 | | | 3.5 | | | 4.1 | | | 7.6 |
Balance, end of period | $ | (137.4) | | $ | (43.6) | | $ | (181.0) | | $ | 32.4 | | $ | (148.6) |
| | | | | | | | | | | | | | |
ACCUMULATED DEFICIT: | | | | | | | | | | | | | | |
Balance, beginning of period | $ | (1,163.5) | | $ | (102.1) | | $ | (1,265.6) | | $ | (232.4) | | $ | (1,498.0) |
Adjustment for initial application of
accounting changes | | — | | | — | | | — | | | — | | | — |
Net income (loss) | | (6.1) | | | (11.2) | | | (17.3) | | | 6.2 | | | (11.1) |
Balance, end of period | $ | (1,169.6) | | $ | (113.3) | | $ | (1,282.9) | | $ | (226.2) | | $ | (1,509.1) |
| | | | | | | | | | | | | | |
TREASURY STOCK, AT COST:(3) | | | | | | | | | | | | | | |
Balance, beginning of period | $ | (179.5) | | $ | — | | $ | (179.5) | | $ | — | | $ | (179.5) |
Treasury shares purchased | | — | | | — | | | — | | | — | | | — |
Balance, end of period | $ | (179.5) | | $ | — | | $ | (179.5) | | $ | — | | $ | (179.5) |
| | | | | | | | | | | | | | |
TOTAL STOCKHOLDERS’ EQUITY
ATTRIBUTABLE TO
THE PHOENIX COMPANIES, INC.: | | | | | | | | | | | | | | |
Balance, beginning of period | $ | 1,155.5 | | $ | (152.8) | | $ | 1,002.7 | | $ | (204.1) | | $ | 798.6 |
Adjustment for initial application of
accounting changes | | — | | | — | | | — | | | — | | | — |
Change in stockholders’ equity attributable to
The Phoenix Companies, Inc. | | (9.0) | | | (4.1) | | | (13.1) | | | 10.3 | | | (2.8) |
Stockholders’ equity, end of period | $ | 1,146.5 | | $ | (156.9) | | $ | 989.6 | | $ | (193.8) | | $ | 795.8 |
| | | | | | | | | | | | | | |
NONCONTROLLING INTERESTS: | | | | | | | | | | | | | | |
Balance, beginning of period | $ | — | | $ | 1.8 | | $ | 1.8 | | | — | | $ | 1.8 |
Change in noncontrolling interests | | — | | | 0.1 | | | 0.1 | | | — | | | 0.1 |
Balance, end of period | $ | — | | $ | 1.9 | | $ | 1.9 | | $ | — | | $ | 1.9 |
| | | | | | | | | | | | | | |
TOTAL STOCKHOLDERS’ EQUITY: | | | | | | | | | | | | | | |
Balance, beginning of period | $ | 1,155.5 | | $ | (151.0) | | $ | 1,004.5 | | $ | (204.1) | | $ | 800.4 |
Adjustment for initial application of
accounting changes | | — | | | — | | | — | | | — | | | — |
Change in stockholders’ equity | | (9.0) | | | (4.0) | | | (13.0) | | | 10.3 | | | (2.7) |
Stockholders’ equity, end of period | $ | 1,146.5 | | $ | (155.0) | | $ | 991.5 | | $ | (193.8) | | $ | 797.7 |
———————
(1)
Adjustments related to the correction of errors reflect amounts prior to the retrospective adoption of amended guidance to ASC 944,Financial Services – Insurance (ASU 2010-26). See footnote 2 below for additional information regarding these amounts and the retrospective adoption.
(2)
Adjustments related to the retrospective adoption of amended guidance to ASC 944,Financial Services – Insurance (ASU 2010-26), have been updated from those originally disclosed in the First Quarter 2012 Quarterly Report on Form 10-Q filing to reflect the correction of errors identified related to the adoption of the amended guidance as well as indirect impact of the correction of errors associated with the restatement.
(3)
Reflects the 1-for-20 reverse stock split, which was effective August 10, 2012. See Note 11 to these consolidated financial statements for additional information on the reverse stock split.
F-159
27.
Supplemental Unaudited Quarterly Financial Information (continued)
| | | | | | | | | | | | | | |
| Consolidated Statement of Cash Flows |
($ in millions) | As of and for the year ended December 31, 2011 |
| As previously reported | | Correction of errors(1) | | Adjusted prior to the retrospective adoption | | Retrospective Adoption(2) | | As restated and amended |
|
|
|
OPERATING ACTIVITIES: | | | | | | | | | | | | | | |
Net income (loss) | $ | 8.1 | | $ | (61.2) | | $ | (53.1) | | $ | 22.4 | | $ | (30.7) |
Net realized investment gains | | 16.4 | | | 13.5 | | | 29.9 | | | — | | | 29.9 |
Gain on debt repurchase | | — | | | (0.2) | | | (0.2) | | | — | | | (0.2) |
Policy acquisition costs deferred | | (141.1) | | | 48.5 | | | (92.6) | | | 1.4 | | | (91.2) |
Amortization of deferred policy acquisition costs | | 210.6 | | | (15.2) | | | 195.4 | | | (37.5) | | | 157.9 |
Amortization and depreciation | | 12.8 | | | — | | | 12.8 | | | — | | | 12.8 |
Interest credited | | — | | | 117.5 | | | 117.5 | | | — | | | 117.5 |
Equity in earnings of
limited partnerships and other investments | | — | | | (45.3) | | | (45.3) | | | — | | | (45.3) |
Change in: | | | | | | | | | | | | | | |
Accrued investment income | | (50.8) | | | (90.5) | | | (141.3) | | | — | | | (141.3) |
Deferred income taxes | | 1.0 | | | (12.8) | | | (11.8) | | | 9.1 | | | (2.7) |
Receivables | | (7.3) | | | 7.2 | | | (0.1) | | | — | | | (0.1) |
Policy liabilities and accruals | | (203.3) | | | (206.3) | | | (409.6) | | | 4.6 | | | (405.0) |
Dividend obligations | | — | | | 7.3 | | | 7.3 | | | — | | | 7.3 |
Impact of operating activities of
consolidated investment entities, net | | — | | | (4.2) | | | (4.2) | | | — | | | (4.2) |
Other operating activities, net | | (3.4) | | | (39.1) | | | (42.5) | | | — | | | (42.5) |
Cash from (for) continuing operations | | (157.0) | | | (280.8) | | | (437.8) | | | — | | | (437.8) |
Discontinued operations, net | | 18.6 | | | (18.6) | | | — | | | — | | | — |
Cash used for operating activities | | (138.4) | | | (299.4) | | | (437.8) | | | — | | | (437.8) |
| | | | | | | | | | | | | | |
INVESTING ACTIVITIES: | | | | | | | | | | | | | | |
Purchases of: | | | | | | | | | | | | | | |
Available-for-sale debt securities | | (3,189.0) | | | 140.8 | | | (3,048.2) | | | — | | | (3,048.2) |
Available-for-sale equity securities | | (6.4) | | | — | | | (6.4) | | | — | | | (6.4) |
Derivative instruments | | (53.9) | | | (16.6) | | | (70.5) | | | — | | | (70.5) |
Fair value investments | | — | | | (47.3) | | | (47.3) | | | — | | | (47.3) |
Other investments | | (106.5) | | | 105.1 | | | (1.4) | | | — | | | (1.4) |
Sales, repayments and maturities of: | | | | | | | | | | | | | | |
Available-for-sale debt securities | | 2,444.6 | | | (115.4) | | | 2,329.2 | | | — | | | 2,329.2 |
Available-for-sale equity securities | | 10.2 | | | — | | | 10.2 | | | — | | | 10.2 |
Derivative instruments | | 57.2 | | | 29.9 | | | 87.1 | | | — | | | 87.1 |
Fair value investments | | 8.6 | | | 4.8 | | | 13.4 | | | — | | | 13.4 |
Other investments | | 144.6 | | | (122.3) | | | 22.3 | | | — | | | 22.3 |
Contributions to limited partnerships
and limited liability corporations | | — | | | (99.4) | | | (99.4) | | | — | | | (99.4) |
Distributions from limited partnerships
and limited liability corporations | | — | | | 120.5 | | | 120.5 | | | — | | | 120.5 |
Policy loans, net | | 7.2 | | | 121.1 | | | 128.3 | | | — | | | 128.3 |
Impact of investing activities of
consolidated investment entities, net | | — | | | — | | | — | | | — | | | — |
Other investing activities, net | | — | | | (4.6) | | | (4.6) | | | — | | | (4.6) |
Proceeds from sale of subsidiary | | 1.0 | | | (1.0) | | | — | | | — | | | — |
Premises and equipment additions | | (4.4) | | | 4.4 | | | — | | | — | | | — |
Discontinued operations, net | | (18.6) | | | 18.6 | | | — | | | — | | | — |
Cash provided by (used for) investing activities | | (705.4) | | | 138.6 | | | (566.8) | | | — | | | (566.8) |
(Continued on next page)
F-160
27.
Supplemental Unaudited Quarterly Financial Information (continued)
| | | | | | | | | | | | | | |
(Continued from previous page) | Consolidated Statement of Cash Flows |
($ in millions) | As of and for the year ended December 31, 2011 |
| As previously reported | | Correction of errors(1) | | Adjusted prior to the retrospective adoption | | Retrospective Adoption(2) | | As restated and amended |
|
|
|
FINANCING ACTIVITIES: | | | | | | | | | | | | | | |
Policyholder deposit fund deposits | | 1,725.5 | | | 99.9 | | | 1,825.4 | | | — | | | 1,825.4 |
Policyholder deposit fund withdrawals | | (808.5) | | | (370.8) | | | (1,179.3) | | | — | | | (1,179.3) |
Net transfers to/from separate accounts | | — | | | 435.1 | | | 435.1 | | | — | | | 435.1 |
Impact of financing activities of
consolidated investment entities, net | | — | | | 1.5 | | | 1.5 | | | — | | | 1.5 |
Other financing activities, net | | (0.8) | | | (4.1) | | | (4.9) | | | — | | | (4.9) |
Cash provided by (used for) financing activities | | 916.2 | | | 161.6 | | | 1,077.8 | | | — | | | 1,077.8 |
Change in cash and cash equivalents | | 72.4 | | | 0.8 | | | 73.2 | | | — | | | 73.2 |
Change in cash included in
discontinued operations assets | | — | | | 1.3 | | | 1.3 | | | — | | | 1.3 |
Cash and cash equivalents, beginning of period | | 121.9 | | | (28.2) | | | 93.7 | | | — | | | 93.7 |
Cash and cash equivalents, end of period | $ | 194.3 | | $ | (26.1) | | $ | 168.2 | | $ | — | | $ | 168.2 |
| | | | | | | | | | | | | | |
Supplemental Disclosure of Cash Flow Information | | | | | | | | | | | | | | |
Income taxes paid | $ | (6.2) | | $ | — | | $ | (6.2) | | $ | — | | $ | (6.2) |
Interest expense on indebtedness paid | $ | (34.9) | | $ | 3.5 | | $ | (31.4) | | $ | — | | $ | (31.4) |
| | | | | | | | | | | | | | |
Non-Cash Transactions During the Year | | | | | | | | | | | | | | |
Investment exchanges | $ | — | | $ | 97.8 | | $ | 97.8 | | $ | — | | $ | 97.8 |
———————
(1)
Adjustments related to the correction of errors reflect amounts prior to the retrospective adoption of amended guidance to ASC 944,Financial Services – Insurance (ASU 2010-26). See footnote 2 below for additional information regarding these amounts and the retrospective adoption.
(2)
Adjustments related to the retrospective adoption of amended guidance to ASC 944,Financial Services – Insurance (ASU 2010-26), have been updated from those originally disclosed in the First Quarter 2012 10-Q filing to reflect the correction of errors identified related to the adoption of the amended guidance as well as indirect impact of the correction of errors associated with the restatement.
F-161
27.
Supplemental Unaudited Quarterly Financial Information (continued)
| | | | | | | | | | | | | | |
| Consolidated Statement of Cash Flows |
($ in millions) | For the period ended September 30, 2011 |
| As previously Reported(1) | | Correction of errors (2) | | Adjusted prior to the retrospective adoption | | Retrospective Adoption(3) | | As restated and amended |
|
|
|
OPERATING ACTIVITIES: | | | | | | | | | | | | | | |
Net income (loss) | $ | 30.1 | | $ | (58.9) | | $ | (28.8) | | $ | 17.7 | | $ | (11.1) |
Net realized investment gains | | 7.0 | | | 11.0 | | | 18.0 | | | — | | | 18.0 |
Gain on debt repurchase | | — | | | — | | | — | | | — | | | — |
Policy acquisition costs deferred | | (104.3) | | | 38.6 | | | (65.7) | | | 1.1 | | | (64.6) |
Amortization of deferred policy acquisition costs | | 172.0 | | | (15.6) | | | 156.4 | | | (29.4) | | | 127.0 |
Amortization and depreciation | | 9.1 | | | — | | | 9.1 | | | — | | | 9.1 |
Interest credited | | — | | | 89.4 | | | 89.4 | | | — | | | 89.4 |
Equity in earnings of
limited partnerships and other investments | | — | | | (48.2) | | | (48.2) | | | — | | | (48.2) |
Change in: | | | | | | | | | | | | | | |
Accrued investment income | | (66.9) | | | (42.9) | | | (109.8) | | | — | | | (109.8) |
Deferred income taxes | | 1.3 | | | (11.4) | | | (10.1) | | | 7.4 | | | (2.7) |
Receivables | | (7.6) | | | 18.2 | | | 10.6 | | | — | | | 10.6 |
Policy liabilities and accruals | | (175.9) | | | (190.8) | | | (366.7) | | | 3.2 | | | (363.5) |
Dividend obligations | | — | | | 16.2 | | | 16.2 | | | — | | | 16.2 |
Impact of operating activities of
consolidated investment entities, net | | — | | | (2.7) | | | (2.7) | | | — | | | (2.7) |
Other operating activities, net | | (10.4) | | | (23.8) | | | (34.2) | | | — | | | (34.2) |
Cash from (for) continuing operations | | (145.6) | | | (220.9) | | | (366.5) | | | — | | | (366.5) |
Discontinued operations, net | | 6.2 | | | (6.2) | | | — | | | — | | | — |
Cash used for operating activities | | (139.4) | | | (227.1) | | | (366.5) | | | — | | | (366.5) |
| | | | | | | | | | | | | | |
INVESTING ACTIVITIES: | | | | | | | | | | | | | | |
Purchases of: | | | | | | | | | | | | | | |
Available-for-sale debt securities | | (5,017.7) | | | 2,763.8 | | | (2,253.9) | | | — | | | (2,253.9) |
Available-for-sale equity securities | | — | | | (5.7) | | | (5.7) | | | — | | | (5.7) |
Derivative instruments | | — | | | (32.9) | | | (32.9) | | | — | | | (32.9) |
Fair value investments | | — | | | (35.0) | | | (35.0) | | | — | | | (35.0) |
Other investments | | — | | | (1.1) | | | (1.1) | | | — | | | (1.1) |
Sales, repayments and maturities of: | | | | | | | | | | | | | | |
Available-for-sale debt securities | | 4,540.3 | | | (2,778.1) | | | 1,762.2 | | | — | | | 1,762.2 |
Available-for-sale equity securities | | — | | | 1.9 | | | 1.9 | | | — | | | 1.9 |
Derivative instruments | | — | | | 61.4 | | | 61.4 | | | — | | | 61.4 |
Fair value investments | | — | | | 10.9 | | | 10.9 | | | — | | | 10.9 |
Other investments | | — | | | 22.0 | | | 22.0 | | | — | | | 22.0 |
Contributions to limited partnerships
and limited liability corporations | | — | | | (67.1) | | | (67.1) | | | — | | | (67.1) |
Distributions from limited partnerships
and limited liability corporations | | — | | | 78.7 | | | 78.7 | | | — | | | 78.7 |
Policy loans, net | | 34.1 | | | 67.7 | | | 101.8 | | | — | | | 101.8 |
Impact of investing activities of
consolidated investment entities, net | | — | | | — | | | — | | | — | | | — |
Other investing activities, net | | — | | | (4.6) | | | (4.6) | | | — | | | (4.6) |
Premises and equipment additions | | (3.4) | | | 3.4 | | | — | | | — | | | — |
Discontinued operations, net | | (4.9) | | | 4.9 | | | — | | | — | | | — |
Cash provided by (used for) investing activities | | (451.6) | | | 90.2 | | | (361.4) | | | — | | | (361.4) |
(Continued on next page)
F-162
27.
Supplemental Unaudited Quarterly Financial Information (continued)
| | | | | | | | | | | | | | |
(Continued from previous page) | Consolidated Statement of Cash Flows |
($ in millions) | For the period ended September 30, 2011 |
| As previously reported | | Correction of errors (1) | | Adjusted prior to the retrospective adoption | | Retrospective Adoption(2) | | As restated and amended |
|
|
|
FINANCING ACTIVITIES: | | | | | | | | | | | | | | |
Policyholder deposit fund deposits | | 1,068.6 | | | 267.7 | | | 1,336.3 | | | — | | | 1,336.3 |
Policyholder deposit fund withdrawals | | (450.7) | | | (469.7) | | | (920.4) | | | — | | | (920.4) |
Net transfers to/from separate accounts | | — | | | 344.1 | | | 344.1 | | | — | | | 344.1 |
Impact of financing activities of
consolidated investment entities, net | | — | | | 1.3 | | | 1.3 | | | — | | | 1.3 |
Cash provided by financing activities | | 617.9 | | | 143.4 | | | 761.3 | | | — | | | 761.3 |
Change in cash and cash equivalents | | 26.9 | | | 6.5 | | | 33.4 | | | — | | | 33.4 |
Change in cash included in
discontinued operations assets | | — | | | 1.2 | | | 1.2 | | | — | | | 1.2 |
Cash and cash equivalents, beginning of period | | 121.9 | | | (28.2) | | | 93.7 | | | — | | | 93.7 |
Cash and cash equivalents, end of period | $ | 148.8 | | $ | (20.5) | | $ | 128.3 | | $ | — | | $ | 128.3 |
| | | | | | | | | | | | | | |
Supplemental Disclosure of Cash Flow Information | | | | | | | | | | | | | | |
Income taxes paid | $ | (6.2) | | $ | — | | $ | (6.2) | | $ | — | | $ | (6.2) |
Interest expense on indebtedness paid | $ | (23.0) | | $ | 2.6 | | $ | (20.4) | | $ | — | | $ | (20.4) |
| | | | | | | | | | | | | | |
Non-Cash Transactions During the Year | | | | | | | | | | | | | | |
Investment exchanges | $ | — | | $ | 54.5 | | $ | 54.5 | | $ | — | | $ | 54.5 |
———————
(1)
Operating activities of the consolidated statement of cash flows for the period ended September 30, 2011 was previously reported using the direct method. Reported numbers herein reflect adjustment to indirect method currently presented.
(2)
Adjustments related to the correction of errors reflect amounts prior to the retrospective adoption of amended guidance to ASC 944,Financial Services – Insurance (ASU 2010-26). See footnote 2 below for additional information regarding these amounts and the retrospective adoption.
(3)
Adjustments related to the retrospective adoption of amended guidance to ASC 944,Financial Services – Insurance (ASU 2010-26), have been updated from those originally disclosed in the First Quarter 2012 10-Q filing to reflect the correction of errors identified related to the adoption of the amended guidance as well as indirect impact of the correction of errors associated with the restatement.
F-163
27.
Supplemental Unaudited Quarterly Financial Information (continued)
| | | | | | | | | | | | | | |
| Consolidated Statement of Cash Flows |
($ in millions) | For the period ended June 30, 2011 |
| As previously reported | | Correction of errors (1) | | Adjusted prior to the retrospective adoption | | Retrospective Adoption(2) | | As restated and amended |
|
|
|
OPERATING ACTIVITIES: | | | | | | | | | | | | | | |
Net income (loss) | $ | (1.7) | | $ | (28.9) | | $ | (30.6) | | $ | 11.5 | | $ | (19.1) |
Net realized investment gains (losses) | | 13.1 | | | (5.2) | | | 7.9 | | | — | | | 7.9 |
Gain on debt repurchase | | — | | | — | | | — | | | — | | | — |
Policy acquisition costs deferred | | (63.9) | | | 26.7 | | | (37.2) | | | 0.7 | | | (36.5) |
Amortization of deferred policy acquisition costs | | 114.5 | | | (0.7) | | | 113.8 | | | (21.9) | | | 91.9 |
Amortization and depreciation | | 5.1 | | | — | | | 5.1 | | | — | | | 5.1 |
Interest credited | | — | | | 59.6 | | | 59.6 | | | — | | | 59.6 |
Equity in earnings of
limited partnerships and other investments | | (23.3) | | | (12.0) | | | (35.3) | | | — | | | (35.3) |
Change in: | | | | | | | | | | | | | | |
Accrued investment income | | (18.1) | | | (55.0) | | | (73.1) | | | — | | | (73.1) |
Deferred income taxes | | — | | | (8.6) | | | (8.6) | | | 6.3 | | | (2.3) |
Receivables | | (26.7) | | | 17.6 | | | (9.1) | | | — | | | (9.1) |
Policy liabilities and accruals | | (78.0) | | | (176.3) | | | (254.3) | | | 3.4 | | | (250.9) |
Dividend obligations | | — | | | 22.1 | | | 22.1 | | | — | | | 22.1 |
Impact of operating activities of
consolidated investment entities, net | | — | | | (3.8) | | | (3.8) | | | — | | | (3.8) |
Other operating activities, net | | 13.2 | | | (17.8) | | | (4.6) | | | — | | | (4.6) |
Cash from (for) continuing operations | | (65.8) | | | (182.3) | | | (248.1) | | | — | | | (248.1) |
Discontinued operations, net | | 4.9 | | | (4.9) | | | — | | | — | | | — |
Cash used for operating activities | | (60.9) | | | (187.2) | | | (248.1) | | | — | | | (248.1) |
| | | | | | | | | | | | | | |
INVESTING ACTIVITIES: | | | | | | | | | | | | | | |
Purchases of: | | | | | | | | | | | | | | |
Available-for-sale debt securities | | (1,701.1) | | | 96.7 | | | (1,604.4) | | | — | | | (1,604.4) |
Available-for-sale equity securities | | (5.7) | | | — | | | (5.7) | | | — | | | (5.7) |
Derivative instruments | | (21.5) | | | (6.6) | | | (28.1) | | | — | | | (28.1) |
Fair value investments | | — | | | (28.7) | | | (28.7) | | | — | | | (28.7) |
Other investments | | (47.9) | | | 47.0 | | | (0.9) | | | — | | | (0.9) |
Sales, repayments and maturities of: | | | | | | | | | | | | | | |
Available-for-sale debt securities | | 1,367.0 | | | (66.5) | | | 1,300.5 | | | — | | | 1,300.5 |
Available-for-sale equity securities | | 1.7 | | | — | | | 1.7 | | | — | | | 1.7 |
Derivative instruments | | 28.1 | | | 20.8 | | | 48.9 | | | — | | | 48.9 |
Fair value investments | | 8.6 | | | 0.6 | | | 9.2 | | | — | | | 9.2 |
Other investments | | 72.3 | | | (51.8) | | | 20.5 | | | — | | | 20.5 |
Contributions to limited partnerships
and limited liability corporations | | — | | | (43.6) | | | (43.6) | | | — | | | (43.6) |
Distributions from limited partnerships
and limited liability corporations | | — | | | 50.4 | | | 50.4 | | | — | | | 50.4 |
Policy loans, net | | 21.5 | | | 53.0 | | | 74.5 | | | — | | | 74.5 |
Impact of investing activities of
consolidated investment entities, net | | — | | | — | | | — | | | — | | | — |
Other investing activities, net | | — | | | (3.4) | | | (3.4) | | | — | | | (3.4) |
Proceeds from sale of subsidiary | | — | | | — | | | — | | | — | | | — |
Premises and equipment additions | | (2.2) | | | 2.2 | | | — | | | — | | | — |
Discontinued operations, net | | (0.3) | | | 0.3 | | | — | | | — | | | — |
Cash provided by (used for) investing activities | | (279.5) | | | 70.4 | | | (209.1) | | | — | | | (209.1) |
(Continued on next page)
F-164
27.
Supplemental Unaudited Quarterly Financial Information (continued)
| | | | | | | | | | | | | | |
(Continued from previous page) | Consolidated Statement of Cash Flows |
($ in millions) | For the period ended June 30, 2011 |
| As previously reported | | Correction of errors (1) | | Adjusted prior to the retrospective adoption | | Retrospective Adoption(2) | | As restated and amended |
|
|
|
FINANCING ACTIVITIES: | | | | | | | | | | | | | | |
Policyholder deposit fund deposits | | 959.5 | | | (102.9) | | | 856.6 | | | — | | | 856.6 |
Policyholder deposit fund withdrawals | | (605.9) | | | (31.5) | | | (637.4) | | | — | | | (637.4) |
Net transfers to/from separate accounts | | — | | | 246.0 | | | 246.0 | | | — | | | 246.0 |
Impact of financing activities of
consolidated investment entities, net | | — | | | 1.3 | | | 1.3 | | | — | | | 1.3 |
Cash provided by financing activities | | 353.6 | | | 112.9 | | | 466.5 | | | — | | | 466.5 |
Change in cash and cash equivalents | | 13.2 | | | (3.9) | | | 9.3 | | | — | | | 9.3 |
Change in cash included in
discontinued operations assets | | — | | | 0.9 | | | 0.9 | | | — | | | 0.9 |
Cash and cash equivalents, beginning of period | | 121.9 | | | (28.2) | | | 93.7 | | | — | | | 93.7 |
Cash and cash equivalents, end of period | $ | 135.1 | | $ | (31.2) | | $ | 103.9 | | $ | — | | $ | 103.9 |
| | | | | | | | | | | | | | |
Supplemental Disclosure of Cash Flow Information | | | | | | | | | | | | | | |
Income taxes paid | $ | (6.9) | | $ | — | | $ | (6.9) | | $ | — | | $ | (6.9) |
Interest expense on indebtedness paid | $ | (17.4) | | $ | 1.7 | | $ | (15.7) | | $ | — | | $ | (15.7) |
| | | | | | | | | | | | | | |
Non-Cash Transactions During the Year | | | | | | | | | | | | | | |
Investment exchanges | $ | — | | $ | 49.9 | | $ | 49.9 | | $ | — | | $ | 49.9 |
———————
(1)
Adjustments related to the correction of errors reflect amounts prior to the retrospective adoption of amended guidance to ASC 944,Financial Services – Insurance (ASU 2010-26). See footnote 2 below for additional information regarding these amounts and the retrospective adoption.
(2)
Adjustments related to the retrospective adoption of amended guidance to ASC 944,Financial Services – Insurance (ASU 2010-26), have been updated from those originally disclosed in the First Quarter 2012 10-Q filing to reflect the correction of errors identified related to the adoption of the amended guidance as well as indirect impact of the correction of errors associated with the restatement.
F-165
27.
Supplemental Unaudited Quarterly Financial Information (continued)
| | | | | | | | | | | | | | |
| Consolidated Statement of Cash Flows |
($ in millions) | For the period ended March 31, 2011 |
| As previously reported | | Correction of errors (1) | | Adjusted prior to the retrospective adoption | | Retrospective Adoption(2) | | As restated and amended |
|
|
|
OPERATING ACTIVITIES: | | | | | | | | | | | | | | |
Net income (loss) | $ | (6.1) | | $ | (11.2) | | $ | (17.3) | | $ | 6.2 | | $ | (11.1) |
Net realized investment gains (losses) | | 16.2 | | | (6.7) | | | 9.5 | | | — | | | 9.5 |
Gain on debt repurchase | | — | | | — | | | — | | | — | | | — |
Policy acquisition costs deferred | | (34.4) | | | 14.6 | | | (19.8) | | | 0.4 | | | (19.4) |
Amortization of deferred policy acquisition costs | | 62.7 | | | 1.6 | | | 64.3 | | | (12.5) | | | 51.8 |
Amortization and depreciation | | 2.6 | | | — | | | 2.6 | | | — | | | 2.6 |
Interest credited | | — | | | 28.5 | | | 28.5 | | | — | | | 28.5 |
Equity in earnings of
limited partnerships and other investments | | (9.9) | | | (9.3) | | | (19.2) | | | — | | | (19.2) |
Change in: | | | | | | | | | | | | | | |
Accrued investment income | | (6.9) | | | (27.2) | | | (34.1) | | | — | | | (34.1) |
Deferred income taxes | | (2.1) | | | (3.9) | | | (6.0) | | | 3.4 | | | (2.6) |
Receivables | | (26.2) | | | 18.9 | | | (7.3) | | | — | | | (7.3) |
Policy liabilities and accruals | | (41.7) | | | (88.5) | | | (130.2) | | | 2.5 | | | (127.7) |
Dividend obligations | | — | | | 16.2 | | | 16.2 | | | — | | | 16.2 |
Impact of operating activities of
consolidated investment entities, net | | — | | | (2.4) | | | (2.4) | | | — | | | (2.4) |
Other operating activities, net | | 12.0 | | | (27.6) | | | (15.6) | | | — | | | (15.6) |
Cash from (for) continuing operations | | (33.8) | | | (97.0) | | | (130.8) | | | — | | | (130.8) |
Discontinued operations, net | | 1.3 | | | (1.3) | | | — | | | — | | | — |
Cash used for operating activities | | (32.5) | | | (98.3) | | | (130.8) | | | — | | | (130.8) |
| | | | | | | | | | | | | | |
INVESTING ACTIVITIES: | | | | | | | | | | | | | | |
Purchases of: | | | | | | | | | | | | | | |
Available-for-sale debt securities | | (785.4) | | | 62.3 | | | (723.1) | | | — | | | (723.1) |
Available-for-sale equity securities | | (5.2) | | | — | | | (5.2) | | | — | | | (5.2) |
Derivative instruments | | (25.2) | | | 4.6 | | | (20.6) | | | — | | | (20.6) |
Fair value investments | | — | | | (21.9) | | | (21.9) | | | — | | | (21.9) |
Other investments | | (19.1) | | | 18.6 | | | (0.5) | | | — | | | (0.5) |
Sales, repayments and maturities of: | | | | | | | | | | | | | | |
Available-for-sale debt securities | | 589.4 | | | (40.9) | | | 548.5 | | | — | | | 548.5 |
Available-for-sale equity securities | | 1.2 | | | — | | | 1.2 | | | — | | | 1.2 |
Derivative instruments | | 25.2 | | | 5.1 | | | 30.3 | | | — | | | 30.3 |
Fair value investments | | 8.6 | | | 0.2 | | | 8.8 | | | — | | | 8.8 |
Other investments | | 45.6 | | | (26.2) | | | 19.4 | | | — | | | 19.4 |
Contributions to limited partnerships
and limited liability corporations | | — | | | (17.2) | | | (17.2) | | | — | | | (17.2) |
Distributions from limited partnerships
and limited liability corporations | | — | | | 26.0 | | | 26.0 | | | — | | | 26.0 |
Policy loans, net | | 12.6 | | | 23.9 | | | 36.5 | | | — | | | 36.5 |
Impact of investing activities of
consolidated investment entities, net | | — | | | — | | | — | | | — | | | — |
Other investing activities, net | | — | | | (2.2) | | | (2.2) | | | — | | | (2.2) |
Premises and equipment additions | | (1.0) | | | 1.0 | | | — | | | — | | | — |
Discontinued operations, net | | 1.7 | | | (1.7) | | | — | | | — | | | — |
Cash provided by (used for) investing activities | | (151.6) | | | 31.6 | | | (120.0) | | | — | | | (120.0) |
(Continued on next page)
F-166
27.
Supplemental Unaudited Quarterly Financial Information (continued)
| | | | | | | | | | | | | | |
(Continued from previous page) | Consolidated Statement of Cash Flows |
($ in millions) | For the period ended March 31, 2011 |
| As previously reported | | Correction of errors (1) | | Adjusted prior to the retrospective adoption | | Retrospective Adoption(2) | | As restated and amended |
|
|
|
FINANCING ACTIVITIES: | | | | | | | | | | | | | | |
Policyholder deposit fund deposits | | 334.6 | | | 88.9 | | | 423.5 | | | — | | | 423.5 |
Policyholder deposit fund withdrawals | | (165.1) | | | (165.4) | | | (330.5) | | | — | | | (330.5) |
Net transfers to/from separate accounts | | — | | | 133.0 | | | 133.0 | | | — | | | 133.0 |
Impact of financing activities of
consolidated investment entities, net | | — | | | 0.1 | | | 0.1 | | | — | | | 0.1 |
Other financing activities, net | | — | | | — | | | — | | | — | | | — |
Discontinued operations, net | | — | | | — | | | — | | | — | | | — |
Cash provided by financing activities | | 169.5 | | | 56.6 | | | 226.1 | | | — | | | 226.1 |
Change in cash and cash equivalents | | (14.6) | | | (10.1) | | | (24.7) | | | — | | | (24.7) |
Change in cash included in
discontinued operations assets | | — | | | 0.8 | | | 0.8 | | | — | | | 0.8 |
Cash and cash equivalents, beginning of period | | 121.9 | | | (28.2) | | | 93.7 | | | — | | | 93.7 |
Cash and cash equivalents, end of period | $ | 107.3 | | $ | (37.5) | | $ | 69.8 | | $ | — | | $ | 69.8 |
| | | | | | | | | | | | | | |
Supplemental Disclosure of Cash Flow Information | | | | | | | | | | | | | | |
Income taxes paid | $ | (0.2) | | $ | — | | $ | (0.2) | | $ | — | | $ | (0.2) |
Interest expense on indebtedness paid | $ | (5.6) | | $ | 0.9 | | $ | (4.7) | | $ | — | | $ | (4.7) |
| | | | | | | | | | | | | | |
Non-Cash Transactions During the Year | | | | | | | | | | | | | | |
Investment exchanges | $ | — | | $ | 24.5 | | $ | 24.5 | | $ | — | | $ | 24.5 |
———————
(1)
Adjustments related to the correction of errors reflect amounts prior to the retrospective adoption of amended guidance to ASC 944,Financial Services – Insurance (ASU 2010-26). See footnote 2 below for additional information regarding these amounts and the retrospective adoption.
(2)
Adjustments related to the retrospective adoption of amended guidance to ASC 944,Financial Services – Insurance (ASU 2010-26), have been updated from those originally disclosed in the First Quarter 2012 10-Q filing to reflect the correction of errors identified related to the adoption of the amended guidance as well as indirect impact of the correction of errors associated with the restatement.
28.
Subsequent Events
Bond Consent Solicitations
On December 12, 2012, we commenced a solicitation (“Consent Solicitation”) of bondholders (“Holders”) holding our 7.45% Quarterly Interest Bonds due 2032 (CUSIP 71902E 20 8) (NYSE: PFX) (“Bonds”) seeking a consent to amend the indenture governing the bonds (“Indenture”) and to provide a related waiver to extend the date for providing our Third Quarter 2012 Quarterly Report on Form 10-Q (“Third Quarter 2012 Form 10-Q”) to the bond trustee (“Trustee”) to March 31, 2013.
On January 16, 2013, we announced the success of our Consent Solicitation to extend the date for providing our Third Quarter 2012 Form 10-Q to the Trustee to March 31, 2013. The consents received represented approximately 65% of the outstanding principal amount.
On January 18, 2013, the Company and the Trustee executed a first supplemental indenture (“First Supplemental Indenture”) amending the Indenture effective as of such date. The amendments provided that until 5:30 p.m., New York City time on March 31, 2013, any failure by us to comply with the sections of the Indenture relating to the filing of the Third Quarter 2012 Form 10-Q will not constitute a default under the Indenture and that our filing of such report on a delayed basis on or prior to such time and date will satisfy our obligations under the reporting covenant in the Indenture. Pursuant to the waiver, any and all defaults and events of default occurring under the Indenture prior to the effectiveness of the First Supplemental Indenture are waived.
F-167
28.
Subsequent Events (continued)
On April 24, 2013, we commenced a second solicitation (“Second Consent Solicitation”) of Holders of Bonds to further amend the Indenture and provide a related waiver to extend the date for providing the Trustee with the Third Quarter 2012 Form 10-Q, our 2012 Annual Report on Form 10-K (the “2012 Form 10-K”) and our Quarterly Reports on Form 10-Q for the first, second and third quarters of 2013 (the “2013 Forms 10-Q”) to December 31, 2013.
On May 22, 2013, we announced the success of our Second Consent Solicitation. The consents received represented approximately 60% of the outstanding principal amount.
On May 23, 2013, the Company and the Trustee executed a second supplemental indenture (“Second Supplemental Indenture”) amending the Indenture effective as of such date. The amendments provided that until 5:30 p.m., New York City time on December 31, 2013, any failure by us to comply with the sections of the Indenture relating to the filing of the Third Quarter 2012 Form 10-Q, the 2012 Form 10-K and the 2013 Forms 10-Q will not constitute defaults under the Indenture and that our filing of such reports on a delayed basis on or prior to such time and date will satisfy our obligations under the reporting covenant in the Indenture. Pursuant to the waiver, any and all defaults and events of default occurring under the Indenture prior to the effectiveness of the Second Supplemental Indenture are waived.
On January 23, 2014, we commenced a third solicitation (“Third Consent Solicitation”) of Holders of Bonds to further amend the Indenture and provide a related waiver to extend the date for providing the Trustee with the 2012 Quarterly Report on Form 10-Q, the 2012 Form 10-K, the 2013 Forms 10-Q, our 2013 Annual Report on Form 10-K (the “2013 Form 10-K”) and our Quarterly Reports on Form 10-Q for the first, second and third quarters of 2014 (the “2014 Forms 10-Q”) to March 16, 2015.
On February 20, 2014, we announced the success of our Third Consent Solicitation. The consents received represented approximately 72% of the outstanding principal amount.
On February 21, 2014, the Company and the Trustee executed a third supplemental indenture (the “Third Supplemental Indenture”) amending the Indenture effective as of such date. The amendments provided that until 5:30 p.m., New York City time on March 16, 2015, any failure by us to comply with the sections of the Indenture relating to the filing of the Third Quarter 2012 Form 10-Q, the 2012 Form 10-K, the 2013 Forms 10-Q, the 2013 Form 10-K and the 2014 Forms 10-Q will not constitute defaults under the Indenture and that our filing of such reports on a delayed basis on or prior to such time and date will satisfy our obligations under the reporting covenant in the Indenture. Pursuant to the waiver, any and all defaults and events of default occurring under the Indenture prior to the effectiveness of the Third Supplemental Indenture are waived.
Dividends
On March 11, 2013, Phoenix Life paid a $20 million dividend to Phoenix.
On July 24, 2013, Phoenix Life paid a $29.2 million dividend to Phoenix.
On December 20, 2013, Phoenix Life paid a $25.0 million dividend to Phoenix.
On March 20, 2014, Phoenix Life paid a $14.6 million dividend to Phoenix.
Late Filings
On May 10, 2013, we filed a Notification of Late Filing on Form 12b-25 with the SEC disclosing that we would be unable to timely file our First Quarter 2013 Quarterly Report on Form 10-Q with the SEC.
On May 31, 2013, we filed a Current Report on Form 8-K with the SEC disclosing that Phoenix Life had received from the New York Department of Financial Services, its domiciliary insurance regulator, a 60-day extension for submission of its audited financial statements prepared in accordance with Statements of Statutory Accounting Principles (“Statutory”) for the year ended December 31, 2012 and the subsequent filing of management’s report on internal control over financial reporting for Phoenix Life. This May 31, 2013 Form 8-K disclosed that Phoenix Life intends to seek further extensions if required.
F-168
28.
Subsequent Events (continued)
On June 28, 2013, we filed a Current Report on Form 8-K with the SEC disclosing that we determined that the completion of the Phoenix Life 2012 audited Statutory financial statements is dependent on substantial completion of both the Company’s Restatement and the Phoenix Life U.S. GAAP restatement, the evaluation of internal control over financial reporting and the related audit processes, none of which was expected to be completed by the date upon which Phoenix Life’s then-current extension for filing the audited Statutory financial statements with Phoenix Life’s domiciliary state insurance regulator was due to expire.
On August 9, 2013, we filed a Notification of Late Filing on Form 12b-25 with the SEC disclosing that we would be unable to timely file our second quarter 2013 Quarterly Report on Form 10-Q with the SEC.
On November 8, 2013, we filed a Notification of Late Filing on Form 12b-25 with the SEC disclosing that we would be unable to timely file our Third Quarter 2013 Quarterly Report on Form 10-Q with the SEC.
On February 28, 2014, we filed a Notification of Late Filing on Form 12b-25 with the SEC disclosing that we would be unable to timely file our 2013 Annual Report on Form 10-K with the SEC.
NYSE Actions
On April 5, 2013, we filed a Current Report on Form 8-K with the SEC announcing that on April 4, 2013 we received from NYSE Regulation, Inc. a notice of failure to satisfy a continued listing rule or standard and related monitoring. The notice informed us that, as a result of our failure to timely file our 2012 Form 10-K, we are subject to the procedures specified in Section 802.01E (SEC Annual Report Timely Filing Criteria) of the NYSE Listed Company Manual. Under the Section 802.01E procedures, the NYSE will monitor the status of the filing of the 2012 Form 10-K and related public disclosures for up to a six-month period from its due date. If the Company has not filed the 2012 Form 10-K within six months from the filing due date, the NYSE may, in its sole discretion, allow the Company’s common stock to trade for up to an additional six months pending the filing of the 2012 Form 10-K prior to commencing suspension or delisting procedures, depending on the Company’s specific circumstances.
On September 27, 2013, we filed a Current Report on Form 8-K with the SEC disclosing that we had recently made a request to the NYSE that our shares be permitted to continue to trade on the NYSE while we completed our restatement of financial statements. On September 27, 2013 via letter dated September 26, 2013, we received an extension for continued listing and trading of the Company’s common stock on the NYSE. The extension, subject to ongoing reassessment by the NYSE, provides the Company with an additional trading period until January 31, 2014, during which we can file our 2012 Form 10-K with the SEC. If the 2012 Form 10-K is not filed by January 31, 2014, the NYSE may grant an additional extension until April 3, 2014. During the extension period, trading of the Company’s shares on the NYSE remains unaffected.
On January 17, 2014 we filed a Current Report on Form 8-K with the SEC disclosing that we made an additional extension request to the NYSE that our shares be permitted to continue to trade until April 3, 2014.
On January 28, 2014, we filed a Current Report on Form 8-K with the SEC disclosing that we received an extension for continued listing and trading of the Company’s common stock on the NYSE. The extension, subject to reassessment on an ongoing basis by the NYSE, provides the Company with an additional trading period until April 3, 2014. The letter further provided that in the event that the Company does not file its 2012 Form 10-K by April 3, 2014, the NYSE will move forward with the initiation of suspension and delisting procedures.
Rating Agency Actions
On January 16, 2013, Standard & Poor’s Ratings Services affirmed our “B-” long-term counterparty credit rating. They also affirmed our “BB-” financial strength ratings for Phoenix Life and PHLVIC. They also removed all ratings from CreditWatch Negative and changed their outlook to stable.
On March 8, 2013, Standard & Poor’s Rating Services placed our “B-” long-term counterparty credit rating and our “BB-” financial strength ratings for Phoenix Life and PHLVIC on CreditWatch with negative implications.
F-169
28.
Subsequent Events (continued)
On March 20, 2013, Moody’s Investors Service downgraded our senior debt rating to “Caa1” from “B3” and kept the rating under review for downgrade. They also maintained their review for downgrade for our “Ba2” financial strength ratings for Phoenix Life and PHLVIC and the “B1” debt rating of Phoenix Life’s surplus notes.
On April 9, 2013, A.M. Best Co. (“A.M. Best”) downgraded our issuer credit rating (“ICR”) to “b+” from “bb-” and debt rating to “b+” from “bb-” on our outstanding $253 million 7.45% senior unsecured notes. The ratings for our life insurance subsidiaries were maintained and all ratings were kept under review with negative implications.
On May 22, 2013, Standard & Poor’s Rating Services affirmed our “B-” long-term counterparty credit rating. At the same time, they affirmed our “BB-” financial strength ratings for Phoenix Life and PHLVIC. They removed all the ratings from CreditWatch with negative implications and assigned negative outlooks to all ratings.
On August 28, 2013, A.M. Best downgraded our financial strength ratings (“A.M. Best FSRs”) to “B” (Fair) from “B+” (Good) and ICRs to “bb+” from “bbb-” of our subsidiaries. Concurrently, A.M. Best has downgraded our ICR and senior debt rating to “b” from “b+”. Additionally, A.M. Best has downgraded our debt rating to “bb-” from “bb” of our existing surplus notes of Phoenix Life. The A.M. Best FSRs were removed from under review with negative implications and assigned a stable outlook, and the ICRs were removed from under review with negative implications and assigned a negative outlook.
On January 14, 2014, Moody’s Investor Services withdrew all ratings of The Phoenix Companies, Inc. including the Caa1 senior debt rating of Phoenix and the Ba2 financial strength rating of the company’s life insurance subsidiaries and the B1 (hyb) debt rating of Phoenix Life’s surplus notes.
Statutory Results
Our insurance subsidiaries are required to file, with state regulatory authorities, annual statements prepared on an accounting basis prescribed or permitted by such authorities. These annual statements for the year ended December 31, 2013 were filed on a timely basis on February 28, 2014.
SEC Cease-and-Desist Order
On February 12, 2014, the Company and PHLVIC submitted an Offer of Settlement with the SEC pursuant to which the Company and PHLVIC consented to the issuance of the form of an Order Instituting Cease-and-Desist Proceedings Pursuant to Section 21C of the Securities Exchange Act of 1934, Making Findings, and Imposing a Cease-and-Desist Order (the “Order”). The Order was approved by the SEC on March 21, 2014. Pursuant to the Order, the Company and PHLVIC have been directed to cease and desist from committing or causing any violations and any future violations of Section 13(a) of the Exchange Act and Rules 13a-1, 13a-13 thereunder and Section 15(d) of the Exchange Act and Rules 15d-1 and 15d-13 thereunder. In addition, the Company and PHLVIC agreed to perform certain undertakings, including for the Company to file its delayed Third Quarter 2012 Form 10-Q by no later than April 15, 2014 and its 2013 Form 10-K by no later than June 4, 2014. Also pursuant to the undertakings, the Company would file its 2013 Forms 10-Q after the filing of its 2013 Form 10-K. The Company intends to become timely with its periodic filings under the Exchange Act with the filing of its Quarterly Report on Form 10-Q for the period ending June 30, 2014. Finally, the Company and PHLVIC paid a civil monetary penalty in the amount of $375,000 to the United States Treasury following the entry of the Order.
Other
On July 12, 2013, we announced the retirement of Thomas S. Johnson, Chairman, from the Board. At the same time, we announced the election of John H. Forsgren, as chairman of the Board.
F-170
EXHIBIT INDEX
| | |
Exhibit | | |
| | |
2.1 | | Plan of Reorganization (incorporated herein by reference to Exhibit 2.1 to The Phoenix Companies, Inc. Registration Statement on Form S-1 (Registration No. 333-55268), filed February 9, 2001, as amended) |
| | |
3.1(a) | | Amended and Restated Certificate of Incorporation of The Phoenix Companies, Inc., as amended August 10, 2012* |
| | |
3.1(b) | | Certificate of Amendment to the Amended and Restated Certificate of Incorporation of The Phoenix Companies, Inc. (incorporated herein by reference to Exhibit 3.1 to The Phoenix Companies, Inc. Current Report on Form 8-K filed August 13, 2012) |
| | |
3.2(a) | | By-Laws of The Phoenix Companies, Inc., as amended May 15, 2012 (incorporated herein by reference to Exhibit 3.2 to The Phoenix Companies, Inc. Quarterly Report on Form 10-Q filed August 9, 2012) |
| | |
3.2(b) | | Amendment to the By-laws of The Phoenix Companies, Inc. (incorporated herein by reference to Exhibit 3.1 to The Phoenix Companies, Inc. Current Report on Form 8-K filed May 18, 2012) |
| | |
4.1 | | Indenture dated as of December 27 2001, between The Phoenix Companies, Inc. and SunTrust Bank, as Trustee (incorporated herein by reference to Exhibit 4.1 to The Phoenix Companies, Inc. Annual Report on Form 10-K filed March 27, 2002) |
| | |
4.2 | | Specimen of Global Bond dated as of December 27, 2001, issued by The Phoenix Companies, Inc. (incorporated herein by reference to Exhibit 4.2 to The Phoenix Companies, Inc. Annual Report on Form 10-K filed March 27, 2002) |
| | |
4.3 | | First Supplemental Indenture dated as of January 18, 2013, to the Indenture incorporated by reference as Exhibit 4.1 hereto, between the Company and U.S. Bank National Association, as successor trustee to SunTrust Bank, as Trustee (incorporated herein by reference to Exhibit 4.1 to The Phoenix Companies, Inc. Current Report on Form 8-K filed January 18, 2013) |
| | |
4.4 | | Second Supplemental Indenture dated as of May 23, 2013, to the Indenture incorporated by reference as Exhibit 4.1 hereto, between the Company and U.S. Bank National Association, as successor trustee to SunTrust Bank, as Trustee (incorporated herein by reference to Exhibit 4.1 to The Phoenix Companies, Inc. Current Report on Form 8-K filed May 24, 2013) |
| | |
4.5 | | Third Supplemental Indenture dated as of February 21, 2014, to the Indenture incorporated by reference as Exhibit 4.1 hereto, between the Company and U.S. Bank National Association, as successor trustee to SunTrust Bank, as Trustee (incorporated herein by reference to Exhibit 4.1 to The Phoenix Companies, Inc. Current Report on Form 8-K filed February 21, 2014) |
| | |
10.1 | | The Phoenix Companies, Inc. Stock Incentive Plan, as amended and restated (incorporated herein by reference to Exhibit 10.2 to The Phoenix Companies, Inc. Quarterly Report on Form 10-Q filed May 8, 2008; SEC File Number 001-16517) |
| | |
10.2 | | First Amendment to The Phoenix Companies, Inc. Stock Incentive Plan, as amended and restated (incorporated herein by reference to Exhibit 10.2 to The Phoenix Companies, Inc. Annual Report on Form 10-K filed March 5, 2009) |
| | |
10.3 | | Second Amendment to The Phoenix Companies, Inc. Stock Incentive Plan, as amended and restated (incorporated herein by reference to Exhibit 10.2 to The Phoenix Companies, Inc. Quarterly Report on Form 10-Q filed May 7, 2012) |
| | |
E-1
| | |
10.4 | | Third Amendment to The Phoenix Companies, Inc. Stock Incentive Plan, as amended and restated* |
| | |
10.5 | | Form of Incentive Stock Option Agreement under The Phoenix Companies, Inc. Stock Incentive Plan (incorporated herein by reference to Exhibit 10.3 to The Phoenix Companies, Inc. Annual Report on Form 10-K filed March 11, 2005; SEC File Number 001-16517) |
| | |
10.6 | | Form of Non-Qualified Stock Option Agreement under The Phoenix Companies, Inc. Stock Incentive Plan (incorporated herein by reference to Exhibit 10.4 to The Phoenix Companies, Inc. Annual Report on Form 10-K filed March 11, 2005; SEC File Number 001-16517) |
| | |
10.7 | | Form of Non-Qualified Stock Option Agreement (Performance and Service-Vesting Awards) (incorporated herein by reference to Exhibit 10.2 to The Phoenix Companies, Inc. Current Report on Form 8-K filed May 4, 2009) |
| | |
10.8 | | The Phoenix Companies, Inc. Directors Stock Plan, as amended and restated (incorporated herein by reference to Exhibit 10.6 to The Phoenix Companies, Inc. Quarterly Report on Form 10-Q filed May 8, 2008; SEC File Number 001-16517) |
| | |
10.9 | | The Phoenix Companies, Inc. Excess Benefit Plan, as amended and restated (incorporated herein by reference to Exhibit 10.9 to The Phoenix Companies, Inc. Quarterly Report on Form 10-Q filed May 8, 2008; SEC File Number 001-16517) |
| | |
10.10 | | First Amendment to The Phoenix Companies, Inc. Excess Benefit Plan, as amended and restated (incorporated herein by reference to Exhibit 10.8 to The Phoenix Companies, Inc. Quarterly Report on Form 10-Q filed May 10, 2010) |
| | |
10.11 | | The Phoenix Companies, Inc. Non-Qualified Deferred Compensation Plan (incorporated herein by reference to Exhibit 10.13 to The Phoenix Companies, Inc. Quarterly Report on Form 10-Q filed May 8, 2008) (merged into The Phoenix Companies, Inc. Non-Qualified Excess Investment Plan, effective September 1, 2009) |
| | |
10.12 | | First Amendment to The Phoenix Companies, Inc. Non-Qualified Deferred Compensation Plan (incorporated herein by reference to Exhibit 10.8 to The Phoenix Companies, Inc. Quarterly Report on Form 10-Q filed November 6, 2009) (merged into The Phoenix Companies, Inc. Non-Qualified Excess Investment Plan, effective September 1, 2009) |
| | |
10.13 | | The Phoenix Companies, Inc. Non-Qualified Excess Investment Plan amended and restated as of September 1, 2009 (incorporated herein by reference to Exhibit 10.10 to The Phoenix Companies, Inc. Quarterly Report on Form 10-Q filed November 6, 2009) |
| | |
10.14 | | First Amendment to The Phoenix Companies, Inc. Non-Qualified Excess Investment Plan amended and restated as of September 1, 2009 (incorporated herein by reference to Exhibit 10.14 to The Phoenix Companies, Inc. Quarterly Report on Form 10-Q filed May 10, 2010) |
| | |
10.15 | | Second Amendment to The Phoenix Companies, Inc. Non-Qualified Excess Investment Plan amended and restated as of September 1, 2009* |
| | |
10.16 | | Third Amendment to The Phoenix Companies, Inc. Non-Qualified Excess Investment Plan amended and restated as of September 1, 2009 (incorporated herein by reference to Exhibit 10.1 to The Phoenix Companies, Inc. Current Report on Form 8-K filed March 12, 2012) |
| | |
10.17 | | Fourth Amendment to The Phoenix Companies, Inc. Non-Qualified Excess Investment Plan amended and restated as of September 1, 2009* |
| | |
10.18 | | The Phoenix Companies, Inc. Nonqualified Supplemental Executive Retirement Plan, as amended and restated (incorporated herein by reference to Exhibit 10.9 to The Phoenix Companies, Inc. Annual Report on Form 10-K filed March 5, 2009) |
E-2
| | |
| | |
10.19 | | First Amendment to The Phoenix Companies, Inc. Nonqualified Supplemental Executive Retirement Plan, as amended and restated (incorporated herein by reference to Exhibit 10.17 to The Phoenix Companies, Inc. Quarterly Report on Form 10-Q filed May 10, 2010) |
| | |
10.20 | | Second Amendment to The Phoenix Companies, Inc. Nonqualified Supplemental Executive Retirement Plan, as amended and restated* |
| | |
10.21 | | The Phoenix Companies, Inc. Nonqualified Supplemental Executive Retirement Plan B, as amended and restated (incorporated herein by reference to Exhibit 10.10 to The Phoenix Companies, Inc. Annual Report on Form 10-K filed March 5, 2009) |
| | |
10.22 | | First Amendment to The Phoenix Companies, Inc. Nonqualified Supplemental Executive Retirement Plan B, as amended and restated (incorporated herein by reference to Exhibit 10.20 to The Phoenix Companies, Inc. Quarterly Report on Form 10-Q filed May 10, 2010) |
| | |
10.23 | | Second Amendment to The Phoenix Companies, Inc. Nonqualified Supplemental Executive Retirement Plan B, as amended and restated* |
| | |
10.24 | | The Phoenix Companies, Inc. 2003 Restricted Stock, Restricted Stock Unit and Long-Term Incentive Plan, as amended and restated (incorporated herein by reference to Exhibit 10.22 to The Phoenix Companies, Inc. Quarterly Report on Form 10-Q filed May 8, 2008; SEC File Number 001-16517) |
| | |
10.25 | | First Amendment to The Phoenix Companies, Inc. 2003 Restricted Stock, Restricted Stock Unit and Long-Term Incentive Plan, as amended and restated* |
| | |
10.26 | | Form of Award Letter under The Phoenix Companies, Inc. 2003 Restricted Stock, Restricted Stock Unit and Long-Term Incentive Plan (incorporated herein by reference to Exhibit 10.1 to The Phoenix Companies, Inc. Current Report on Form 8-K filed February 8, 2006; SEC File Number 001-16517) |
| | |
10.27 | | Form of Description of Long-Term Incentive Cycle under The Phoenix Companies, Inc. 2003 Restricted Stock, Restricted Stock Unit and Long-Term Incentive Plan (incorporated herein by reference to Exhibit 10.2 to The Phoenix Companies, Inc. Current Report on Form 8-K filed February 8, 2006; SEC File Number 001-16517) |
| | |
10.28 | | Form of Restricted Stock Units Agreement of The Phoenix Companies, Inc. (incorporated herein by reference to Exhibit 10.27 to The Phoenix Companies, Inc. Quarterly Report on Form 10-Q filed May 10, 2006; SEC File Number 001-16517) |
| | |
10.29 | | Form of Restricted Stock Units Agreement for Individual Performance-Based Incentive Grants (incorporated herein by reference to Exhibit 10.1 to The Phoenix Companies, Inc. Current Report on Form 8-K filed February 28, 2007; SEC File Number 001-16517) |
| | |
10.30 | | Form of Restricted Stock Units Agreement for Cliff Vested Grants (incorporated herein by reference to Exhibit 10.21 to The Phoenix Companies, Inc. Annual Report on Form 10-K filed March 1, 2007; SEC File Number 001-16517) |
| | |
10.31 | | Form of Restricted Stock Units Agreement for Performance-Based Grants Tied to Business Line Metrics (incorporated herein by reference to Exhibit 10.22 to The Phoenix Companies, Inc. Quarterly Report on Form 10-Q filed May 9, 2007; SEC File Number 001-16517) |
| | |
10.32 | | Form of Restricted Stock Units Agreement for 3-Year Performance-Based Long-Term Incentive Cycles (incorporated herein by reference to Exhibit 10.23 to The Phoenix Companies, Inc. Quarterly Report on Form 10-Q filed May 9, 2007; SEC File Number 001-16517) |
| | |
10.33 | | Form of Restricted Stock Units Agreement (Performance and Service-Vesting Awards) (incorporated herein by reference to Exhibit 10.1 to The Phoenix Companies, Inc. Current Report on Form 8-K filed May 4, 2009) |
E-3
| | |
| | |
10.34 | | Form of Cash Agreement for Long-Term Incentive Cycle Performance-Based Grants with Post-Performance Service-Vesting Criteria (incorporated herein by reference to Exhibit 10.1 to The Phoenix Companies, Inc. Current Report on Form 8-K filed April 24, 2009) |
| | |
10.35 | | The Phoenix Companies, Inc. Executive Severance Allowance Plan, as amended and restated (incorporated herein by reference to Exhibit 10.33 to The Phoenix Companies, Inc. Quarterly Report on Form 10-Q filed May 8, 2008; SEC File Number 001-16517) |
| | |
10.36 | | First Amendment to The Phoenix Companies, Inc. Executive Severance Allowance Plan, as amended and restated* |
| | |
10.37 | | The Phoenix Companies, Inc. Annual Incentive Plan for Executive Officers, as amended and restated (incorporated herein by reference to Exhibit 10.35 to The Phoenix Companies, Inc. Quarterly Report on Form 10-Q filed May 8, 2008; SEC File Number 001-16517) |
| | |
10.38 | | First Amendment to The Phoenix Companies, Inc. Annual Incentive Plan for Executive Officers, as amended and restated* |
| | |
10.39 | | The Phoenix Companies, Inc. Equity Deferral Plan (incorporated herein by reference to Exhibit 10.36 to The Phoenix Companies, Inc. Quarterly Report on Form 10-Q filed May 8, 2008; SEC File Number 001-16517) |
| | |
10.40 | | First Amendment to The Phoenix Companies, Inc. Equity Deferral Plan* |
| | |
10.41 | | The Phoenix Companies, Inc. Directors Equity Deferral Plan (incorporated herein by reference to Exhibit 10.37 to The Phoenix Companies, Inc. Quarterly Report on Form 10-Q filed May 8, 2008; SEC File Number 001-16517) |
| | |
10.42 | | The Phoenix Companies, Inc. Directors Cash Deferral Plan (incorporated herein by reference to Exhibit 10.38 to The Phoenix Companies, Inc. Quarterly Report on Form 10-Q filed May 8, 2008; SEC File Number 001-16517) |
| | |
10.42 | | Form of Change in Control Agreement (incorporated herein by reference to Exhibit 10.1 to The Phoenix Companies, Inc. Current Report on Form 8-K filed December 13, 2013) |
| | |
10.43 | | Offer Letter dated February 9, 2004 by The Phoenix Companies, Inc. to Philip K. Polkinghorn (incorporated herein by reference to Exhibit 10.50 to The Phoenix Companies, Inc. Annual Report on Form 10-K filed March 22, 2004; SEC File Number 001-16517) |
| | |
10.44 | | Discussion of compensation of James D. Wehr (incorporated herein by reference to The Phoenix Companies, Inc. Current Report on Form 8-K filed May 4, 2009) |
| | |
10.45 | | Fiscal Agency Agreement dated as of December 15, 2004 between Phoenix Life Insurance Company and The Bank of New York (incorporated herein by reference to Exhibit 10.38 to The Phoenix Companies, Inc. Annual Report on Form 10-K filed March 11, 2005; SEC File Number 001-16517) |
| | |
10.46 | | Investment and Contribution Agreement, dated as of October 30, 2008, by and among The Phoenix Companies, Inc., Phoenix Investment Management Company, Virtus Holdings, Inc. and Harris Bankcorp, Inc. (incorporated herein by reference to Exhibit 10.1 to The Phoenix Companies, Inc. Current Report on Form 8-K filed November 5, 2008; SEC File Number 001-16517) |
| | |
10.47 | | Separation Agreement, Plan of Reorganization and Distribution by and between The Phoenix Companies, Inc. and Virtus Investment Partners, Inc. dated as of December 18, 2008 (incorporated herein by reference to Exhibit 10.1 to The Phoenix Companies, Inc. Current Report on Form 8-K filed December 23, 2008; SEC File Number 001-16517) |
E-4
| | |
| | |
10.48 | | Transition Services Agreement by and between The Phoenix Companies, Inc. and Virtus Investment Partners, Inc. dated as of December 18, 2008 (incorporated herein by reference to Exhibit 10.2 to The Phoenix Companies, Inc. Current Report on Form 8-K filed December 23, 2008; SEC File Number 001-16517) |
| | |
10.49 | | Tax Separation Agreement by and between The Phoenix Companies, Inc. and Virtus Investment Partners, Inc. dated as of December 18, 2008 (incorporated herein by reference to Exhibit 10.3 to The Phoenix Companies, Inc. Current Report on Form 8-K filed December 23, 2008; SEC File Number 001-16517) |
| | |
10.50 | | Amendment to Tax Separation Agreement by and between The Phoenix Companies, Inc. and Virtus Investment Partners, Inc. dated as of April 8, 2009 (incorporated herein by reference to Exhibit 10.39 to The Phoenix Companies, Inc. Quarterly Report on Form 10-Q filed May 8, 2009) |
| | |
10.51 | | Employee Matters Agreement by and between The Phoenix Companies, Inc. and Virtus Investment Partners, Inc. dated as of December 18, 2008 (incorporated herein by reference to Exhibit 10.4 to The Phoenix Companies, Inc. Current Report on Form 8-K filed December 23, 2008; SEC File Number 001-16517) |
| | |
10.52 | | Amended and Restated Technology Services Agreement by and among Phoenix Life Insurance Company and Electronic Data Systems, LLC dated January 1, 2009 (incorporated herein by reference to Exhibit 10.1 to The Phoenix Companies, Inc. Current Report on Form 8-K filed January 6, 2009; SEC File Number 001-16517) |
| | |
| | Ratio of Earnings to Fixed Charges* |
| | |
21 | | Subsidiaries of The Phoenix Companies, Inc.* |
| | |
24 | | Power of Attorney* |
| | |
31.1 | | Certification of James D. Wehr, Chief Executive Officer, pursuant to Section 302 of the Sarbanes-Oxley Act of 2002* |
| | |
31.2 | | Certification of Bonnie J. Malley, Chief Financial Officer, pursuant to Section 302 of the Sarbanes-Oxley Act of 2002* |
| | |
32 | | Certification by James D. Wehr, Chief Executive Officer and Bonnie J. Malley, Chief Financial Officer, pursuant to Section 906 of the Sarbanes-Oxley Act of 2002* |
| | |
99.1 | | Financial Statement Schedules** |
| | |
101.INS | | XBRL Instance Document* |
| | |
101.SCH | | XBRL Taxonomy Extension Schema Document* |
| | |
101.CAL | | XBRL Taxonomy Extension Calculation Linkbase Document* |
| | |
101.LAB | | XBRL Taxonomy Extension Label Linkbase Document* |
| | |
101.PRE | | XBRL Taxonomy Extension Presentation Linkbase Document* |
| | |
101.DEF | | XBRL Taxonomy Extension Definition Linkbase Document* |
| | |
* | | Filed herewith |
** | | To be filed by amendment |
We will furnish any exhibit upon the payment of a reasonable fee, which fee shall be limited to our reasonable expenses in furnishing such exhibit. Requests for copies should be directed to: Corporate Secretary, The Phoenix Companies, Inc., One American Row, P.O. Box 5056, Hartford, Connecticut 06102-5056.
E-5