UNITED STATES
SECURITIES AND EXCHANGE COMMISSION
WASHINGTON, D.C. 20549
FORM N-CSR
CERTIFIED SHAREHOLDER REPORT OF REGISTERED
MANAGEMENT INVESTMENT COMPANIES
Investment Company Act file number: 811-10221
AB TRUST
(Exact name of registrant as specified in charter)
66 Hudson Boulevard East
New York, New York 10005
(Address of principal executive offices) (Zip code)
Stephen M. Woetzel
AllianceBernstein L.P.
66 Hudson Boulevard East
New York, New York 10005
(Name and address of agent for service)
Registrant’s telephone number, including area code: (800) 221-5672
Date of fiscal year end: November 30, 2024
Date of reporting period: November 30, 2024
ITEM 1. REPORTS TO STOCKHOLDERS.
Please scan QR code for
Fund Information
Annual Shareholder Report
This annual shareholder report contains important information about the AB Large Cap Value Fund (the “Fund”) for the period of December 1, 2023 to November 30, 2024. You can find additional information about the Fund at https://www.abfunds.com/link/AB/ABVYX-A. You can also request this information by contacting us at (800) 227 4618.
What were the Fund costs for the last year?
(Based on a hypothetical $10,000 investment)
| Class Name | Cost of a $10,000 investment | Costs paid as a percentage of a $10,000 investment |
|---|
| Advisor Class | $79 | 0.68% |
|---|
How did the Fund perform last year? What affected the Fund’s performance?
During the 12-month period ended November 30, 2024, all share classes of the Fund outperformed the Russell 1000 Value Index (the “benchmark”), before sales charges. Overall security selection was positive, while sector allocation was negative. Security selection within financials and consumer staples added to gains, while selection within utilities and real estate detracted. In terms of sector allocation, an underweight to financials and an overweight to healthcare detracted and offset gains from overweights to communication services and materials.
Top contributors to performance:
Top detractors from performance:
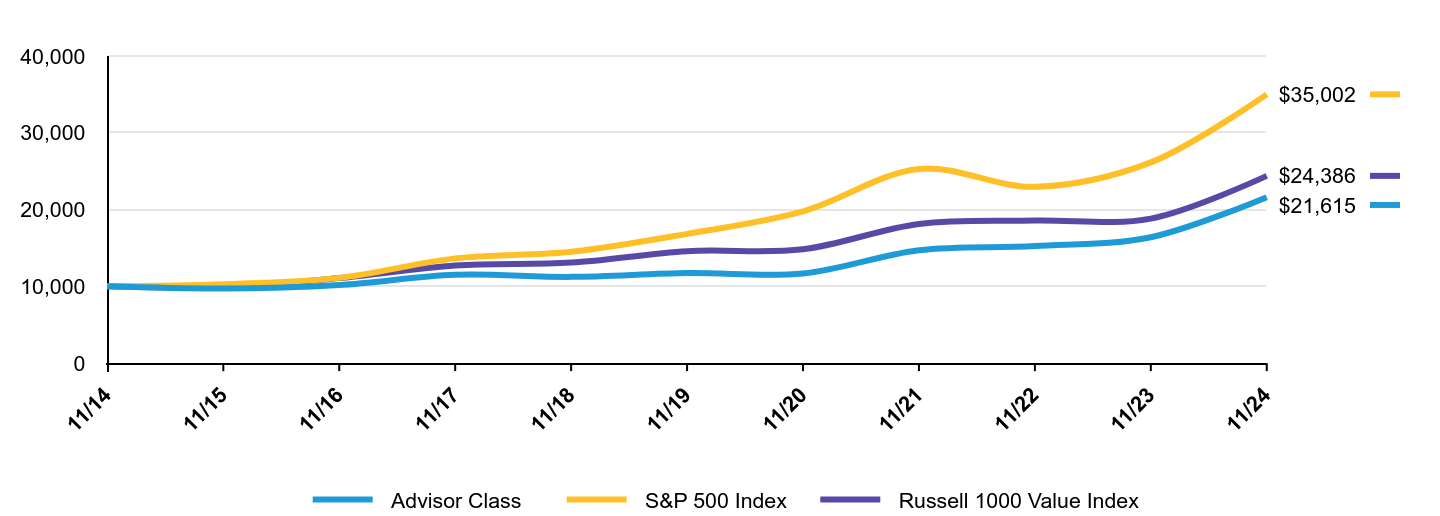
The following graph shows the performance of hypothetical $10,000 investments in the Fund, a broad-based securities market index and an additional index that corresponds to the Fund's investment strategies, over the most recently completed 10 fiscal years of the Fund, or since inception, if shorter. The Fund's performance reflects applicable sales charges and assumes the reinvestment of dividends.
| Advisor Class | S&P 500 Index | Russell 1000 Value Index |
|---|
| 11/14 | $10,000 | $10,000 | $10,000 |
|---|
| 11/15 | $9,716 | $10,275 | $9,889 |
|---|
| 11/16 | $10,174 | $11,103 | $11,077 |
|---|
| 11/17 | $11,498 | $13,642 | $12,720 |
|---|
| 11/18 | $11,233 | $14,498 | $13,096 |
|---|
| 11/19 | $11,730 | $16,834 | $14,580 |
|---|
| 11/20 | $11,675 | $19,773 | $14,831 |
|---|
| 11/21 | $14,707 | $25,294 | $18,131 |
|---|
| 11/22 | $15,246 | $22,964 | $18,570 |
|---|
| 11/23 | $16,400 | $26,142 | $18,822 |
|---|
| 11/24 | $21,615 | $35,002 | $24,386 |
|---|
Average Annual Total Returns
| AATR | 1 Year | 5 Years | 10 Years |
|---|
| Advisor Class | 31.80% | 13.00% | 8.01% |
|---|
| S&P 500 Index | 33.89% | 15.77% | 13.35% |
|---|
| Russell 1000 Value Index | 29.56% | 10.84% | 9.32% |
|---|
The addition of the S&P 500 Index broad-based benchmark provides a comparison of the Fund's performance against the broader market as regulatorily required.
The Fund’s past performance is not a good predictor of the Fund’s future performance.
The graph and table do not reflect the deduction of taxes that a shareholder would pay on Fund distributions or the redemption or sale of Fund shares.
Visit https://www.abfunds.com/link/AB/ABVYX-A for the most recent performance information.
| Net Assets | $480,224,588 |
|---|
| # of Portfolio Holdings | 58 |
|---|
| Portfolio Turnover Rate | 53% |
|---|
| Total Advisory Fees Paid | $2,218,719 |
|---|
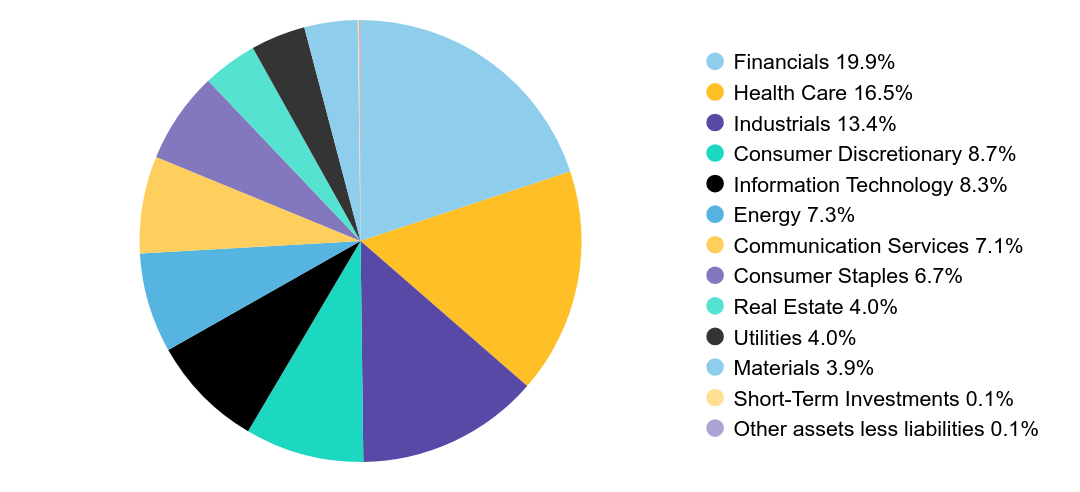
Graphical Representation of Holdings
| Company | U.S. $ Value | % of Net Assets |
|---|
| Walmart, Inc. | $19,674,102 | 4.1% |
| Wells Fargo & Co. | $19,564,188 | 4.1% |
| UnitedHealth Group, Inc. | $19,235,945 | 4.0% |
| Charles Schwab Corp. (The) | $15,676,647 | 3.3% |
| Walt Disney Co. (The) | $14,103,331 | 2.9% |
| Baker Hughes Co. | $13,076,312 | 2.7% |
| Lowe's Cos., Inc. | $12,927,621 | 2.7% |
| Labcorp Holdings, Inc. | $12,509,210 | 2.6% |
| Fiserv, Inc. | $12,346,582 | 2.6% |
| Oracle Corp. | $11,431,060 | 2.4% |
| Total | $150,544,998 | 31.4% |
| Value | Value |
|---|
| Financials | 19.9% |
| Health Care | 16.5% |
| Industrials | 13.4% |
| Consumer Discretionary | 8.7% |
| Information Technology | 8.3% |
| Energy | 7.3% |
| Communication Services | 7.1% |
| Consumer Staples | 6.7% |
| Real Estate | 4.0% |
| Utilities | 4.0% |
| Materials | 3.9% |
| Short-Term Investments | 0.1% |
| Other assets less liabilities | 0.1% |
Availability of Additional Information
You can find additional information on the Fund’s website at https://www.abfunds.com/link/AB/ABVYX-A, including the Fund's:
• Prospectus
• Financial information
• Fund holdings
• Proxy voting information
You can also request this information by contacting us at (800) 227 4618.
Shareholders who have consented to receive a single annual or semi-annual shareholder report at a shared address may revoke this consent by contacting us at (800) 227 4618.
Information Regarding the Review and Approval of the Fund’s Advisory Agreement
Information regarding the Fund’s Board of Directors’/Trustees’ review of the advisory agreement is available on the Fund’s website https://www.abfunds.com/link/AB/ABVYX-A. You can request this information, free of charge, by contacting us at (800) 227 4618 or by scanning the QR code below.
The [A/B] logo and AllianceBernstein® are registered trademarks used by permission of the owner, AllianceBernstein L.P.
Please scan QR code for
Fund Information
Please scan QR code for
Fund Information
Annual Shareholder Report
This annual shareholder report contains important information about the AB Large Cap Value Fund (the “Fund”) for the period of December 1, 2023 to November 30, 2024. You can find additional information about the Fund at https://www.abfunds.com/link/AB/ABVAX-A. You can also request this information by contacting us at (800) 227 4618.
What were the Fund costs for the last year?
(Based on a hypothetical $10,000 investment)
| Class Name | Cost of a $10,000 investment | Costs paid as a percentage of a $10,000 investment |
|---|
| Class A | $108 | 0.93% |
|---|
How did the Fund perform last year? What affected the Fund’s performance?
During the 12-month period ended November 30, 2024, all share classes of the Fund outperformed the Russell 1000 Value Index (the “benchmark”), before sales charges. Overall security selection was positive, while sector allocation was negative. Security selection within financials and consumer staples added to gains, while selection within utilities and real estate detracted. In terms of sector allocation, an underweight to financials and an overweight to healthcare detracted and offset gains from overweights to communication services and materials.
Top contributors to performance:
Top detractors from performance:
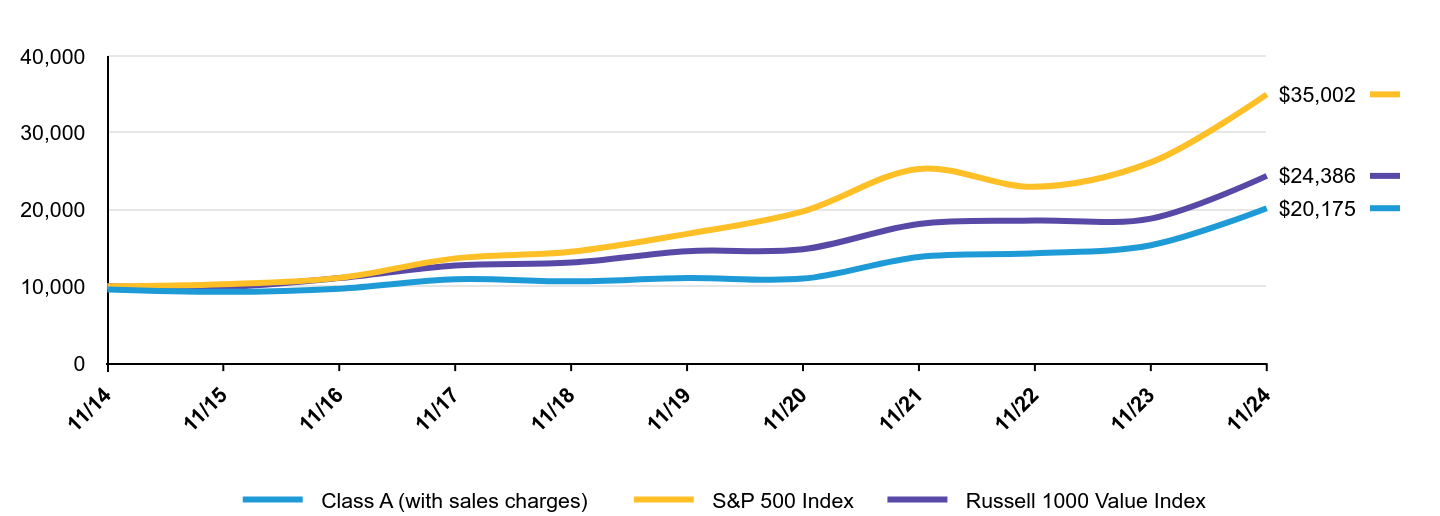
The following graph shows the performance of hypothetical $10,000 investments in the Fund, a broad-based securities market index and an additional index that corresponds to the Fund's investment strategies, over the most recently completed 10 fiscal years of the Fund, or since inception, if shorter. The Fund's performance reflects applicable sales charges and assumes the reinvestment of dividends.
| Class A (with sales charges) | S&P 500 Index | Russell 1000 Value Index |
|---|
| 11/14 | $9,578 | $10,000 | $10,000 |
|---|
| 11/15 | $9,283 | $10,275 | $9,889 |
|---|
| 11/16 | $9,696 | $11,103 | $11,077 |
|---|
| 11/17 | $10,925 | $13,642 | $12,720 |
|---|
| 11/18 | $10,650 | $14,498 | $13,096 |
|---|
| 11/19 | $11,090 | $16,834 | $14,580 |
|---|
| 11/20 | $11,006 | $19,773 | $14,831 |
|---|
| 11/21 | $13,832 | $25,294 | $18,131 |
|---|
| 11/22 | $14,301 | $22,964 | $18,570 |
|---|
| 11/23 | $15,352 | $26,142 | $18,822 |
|---|
| 11/24 | $20,175 | $35,002 | $24,386 |
|---|
Average Annual Total Returns
| AATR | 1 Year | 5 Years | 10 Years |
|---|
| Class A (without sales charges) | 31.41% | 12.71% | 7.73% |
|---|
| Class A (with sales charges) | 25.82% | 11.74% | 7.27% |
|---|
| S&P 500 Index | 33.89% | 15.77% | 13.35% |
|---|
| Russell 1000 Value Index | 29.56% | 10.84% | 9.32% |
|---|
The addition of the S&P 500 Index broad-based benchmark provides a comparison of the Fund's performance against the broader market as regulatorily required.
The Fund’s past performance is not a good predictor of the Fund’s future performance.
The graph and table do not reflect the deduction of taxes that a shareholder would pay on Fund distributions or the redemption or sale of Fund shares.
Visit https://www.abfunds.com/link/AB/ABVAX-A for the most recent performance information.
| Net Assets | $480,224,588 |
|---|
| # of Portfolio Holdings | 58 |
|---|
| Portfolio Turnover Rate | 53% |
|---|
| Total Advisory Fees Paid | $2,218,719 |
|---|
Graphical Representation of Holdings
| Company | U.S. $ Value | % of Net Assets |
|---|
| Walmart, Inc. | $19,674,102 | 4.1% |
| Wells Fargo & Co. | $19,564,188 | 4.1% |
| UnitedHealth Group, Inc. | $19,235,945 | 4.0% |
| Charles Schwab Corp. (The) | $15,676,647 | 3.3% |
| Walt Disney Co. (The) | $14,103,331 | 2.9% |
| Baker Hughes Co. | $13,076,312 | 2.7% |
| Lowe's Cos., Inc. | $12,927,621 | 2.7% |
| Labcorp Holdings, Inc. | $12,509,210 | 2.6% |
| Fiserv, Inc. | $12,346,582 | 2.6% |
| Oracle Corp. | $11,431,060 | 2.4% |
| Total | $150,544,998 | 31.4% |
| Value | Value |
|---|
| Financials | 19.9% |
| Health Care | 16.5% |
| Industrials | 13.4% |
| Consumer Discretionary | 8.7% |
| Information Technology | 8.3% |
| Energy | 7.3% |
| Communication Services | 7.1% |
| Consumer Staples | 6.7% |
| Real Estate | 4.0% |
| Utilities | 4.0% |
| Materials | 3.9% |
| Short-Term Investments | 0.1% |
| Other assets less liabilities | 0.1% |
Availability of Additional Information
You can find additional information on the Fund’s website at https://www.abfunds.com/link/AB/ABVAX-A, including the Fund's:
• Prospectus
• Financial information
• Fund holdings
• Proxy voting information
You can also request this information by contacting us at (800) 227 4618.
Shareholders who have consented to receive a single annual or semi-annual shareholder report at a shared address may revoke this consent by contacting us at (800) 227 4618.
Information Regarding the Review and Approval of the Fund’s Advisory Agreement
Information regarding the Fund’s Board of Directors’/Trustees’ review of the advisory agreement is available on the Fund’s website https://www.abfunds.com/link/AB/ABVAX-A. You can request this information, free of charge, by contacting us at (800) 227 4618 or by scanning the QR code below.
The [A/B] logo and AllianceBernstein® are registered trademarks used by permission of the owner, AllianceBernstein L.P.
Please scan QR code for
Fund Information
Please scan QR code for
Fund Information
Annual Shareholder Report
This annual shareholder report contains important information about the AB Large Cap Value Fund (the “Fund”) for the period of December 1, 2023 to November 30, 2024. You can find additional information about the Fund at https://www.abfunds.com/link/AB/ABVCX-A. You can also request this information by contacting us at (800) 227 4618.
What were the Fund costs for the last year?
(Based on a hypothetical $10,000 investment)
| Class Name | Cost of a $10,000 investment | Costs paid as a percentage of a $10,000 investment |
|---|
| Class C | $195 | 1.69% |
|---|
How did the Fund perform last year? What affected the Fund’s performance?
During the 12-month period ended November 30, 2024, all share classes of the Fund outperformed the Russell 1000 Value Index (the “benchmark”), before sales charges. Overall security selection was positive, while sector allocation was negative. Security selection within financials and consumer staples added to gains, while selection within utilities and real estate detracted. In terms of sector allocation, an underweight to financials and an overweight to healthcare detracted and offset gains from overweights to communication services and materials.
Top contributors to performance:
Top detractors from performance:
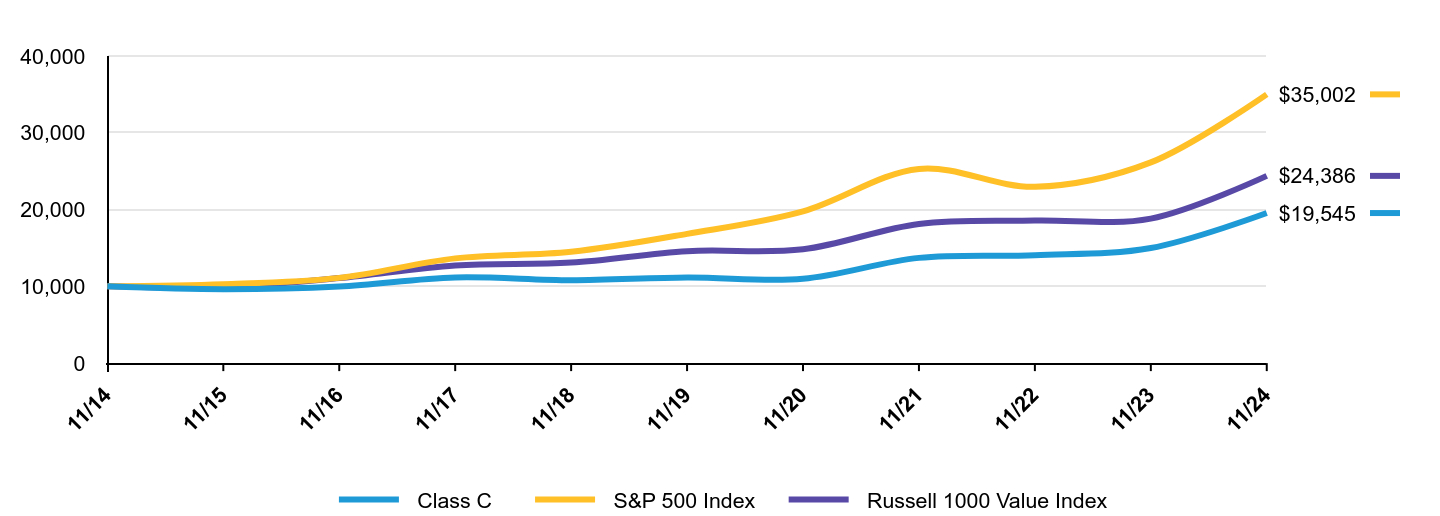
The following graph shows the performance of hypothetical $10,000 investments in the Fund, a broad-based securities market index and an additional index that corresponds to the Fund's investment strategies, over the most recently completed 10 fiscal years of the Fund, or since inception, if shorter. The Fund's performance reflects applicable sales charges and assumes the reinvestment of dividends.
| Class C | S&P 500 Index | Russell 1000 Value Index |
|---|
| 11/14 | $10,000 | $10,000 | $10,000 |
|---|
| 11/15 | $9,624 | $10,275 | $9,889 |
|---|
| 11/16 | $9,974 | $11,103 | $11,077 |
|---|
| 11/17 | $11,155 | $13,642 | $12,720 |
|---|
| 11/18 | $10,795 | $14,498 | $13,096 |
|---|
| 11/19 | $11,157 | $16,834 | $14,580 |
|---|
| 11/20 | $10,986 | $19,773 | $14,831 |
|---|
| 11/21 | $13,705 | $25,294 | $18,131 |
|---|
| 11/22 | $14,064 | $22,964 | $18,570 |
|---|
| 11/23 | $14,984 | $26,142 | $18,822 |
|---|
| 11/24 | $19,545 | $35,002 | $24,386 |
|---|
Average Annual Total Returns
| AATR | 1 Year | 5 Years | 10 Years |
|---|
| Class C (without sales charges) | 30.44% | 11.87% | 6.93% |
|---|
| Class C (with sales charges) | 29.44% | 11.87% | 6.93% |
|---|
| S&P 500 Index | 33.89% | 15.77% | 13.35% |
|---|
| Russell 1000 Value Index | 29.56% | 10.84% | 9.32% |
|---|
The addition of the S&P 500 Index broad-based benchmark provides a comparison of the Fund's performance against the broader market as regulatorily required.
The Fund’s past performance is not a good predictor of the Fund’s future performance.
The graph and table do not reflect the deduction of taxes that a shareholder would pay on Fund distributions or the redemption or sale of Fund shares.
Visit https://www.abfunds.com/link/AB/ABVCX-A for the most recent performance information.
| Net Assets | $480,224,588 |
|---|
| # of Portfolio Holdings | 58 |
|---|
| Portfolio Turnover Rate | 53% |
|---|
| Total Advisory Fees Paid | $2,218,719 |
|---|
Graphical Representation of Holdings
| Company | U.S. $ Value | % of Net Assets |
|---|
| Walmart, Inc. | $19,674,102 | 4.1% |
| Wells Fargo & Co. | $19,564,188 | 4.1% |
| UnitedHealth Group, Inc. | $19,235,945 | 4.0% |
| Charles Schwab Corp. (The) | $15,676,647 | 3.3% |
| Walt Disney Co. (The) | $14,103,331 | 2.9% |
| Baker Hughes Co. | $13,076,312 | 2.7% |
| Lowe's Cos., Inc. | $12,927,621 | 2.7% |
| Labcorp Holdings, Inc. | $12,509,210 | 2.6% |
| Fiserv, Inc. | $12,346,582 | 2.6% |
| Oracle Corp. | $11,431,060 | 2.4% |
| Total | $150,544,998 | 31.4% |
| Value | Value |
|---|
| Financials | 19.9% |
| Health Care | 16.5% |
| Industrials | 13.4% |
| Consumer Discretionary | 8.7% |
| Information Technology | 8.3% |
| Energy | 7.3% |
| Communication Services | 7.1% |
| Consumer Staples | 6.7% |
| Real Estate | 4.0% |
| Utilities | 4.0% |
| Materials | 3.9% |
| Short-Term Investments | 0.1% |
| Other assets less liabilities | 0.1% |
Availability of Additional Information
You can find additional information on the Fund’s website at https://www.abfunds.com/link/AB/ABVCX-A, including the Fund's:
• Prospectus
• Financial information
• Fund holdings
• Proxy voting information
You can also request this information by contacting us at (800) 227 4618.
Shareholders who have consented to receive a single annual or semi-annual shareholder report at a shared address may revoke this consent by contacting us at (800) 227 4618.
Information Regarding the Review and Approval of the Fund’s Advisory Agreement
Information regarding the Fund’s Board of Directors’/Trustees’ review of the advisory agreement is available on the Fund’s website https://www.abfunds.com/link/AB/ABVCX-A. You can request this information, free of charge, by contacting us at (800) 227 4618 or by scanning the QR code below.
The [A/B] logo and AllianceBernstein® are registered trademarks used by permission of the owner, AllianceBernstein L.P.
Please scan QR code for
Fund Information
Please scan QR code for
Fund Information
Annual Shareholder Report
This annual shareholder report contains important information about the AB Large Cap Value Fund (the “Fund”) for the period of December 1, 2023 to November 30, 2024. You can find additional information about the Fund at https://www.abfunds.com/link/AB/ABVIX-A. You can also request this information by contacting us at (800) 227 4618.
What were the Fund costs for the last year?
(Based on a hypothetical $10,000 investment)
| Class Name | Cost of a $10,000 investment | Costs paid as a percentage of a $10,000 investment |
|---|
| Class I | $81 | 0.70% |
|---|
How did the Fund perform last year? What affected the Fund’s performance?
During the 12-month period ended November 30, 2024, all share classes of the Fund outperformed the Russell 1000 Value Index (the “benchmark”), before sales charges. Overall security selection was positive, while sector allocation was negative. Security selection within financials and consumer staples added to gains, while selection within utilities and real estate detracted. In terms of sector allocation, an underweight to financials and an overweight to healthcare detracted and offset gains from overweights to communication services and materials.
Top contributors to performance:
Top detractors from performance:
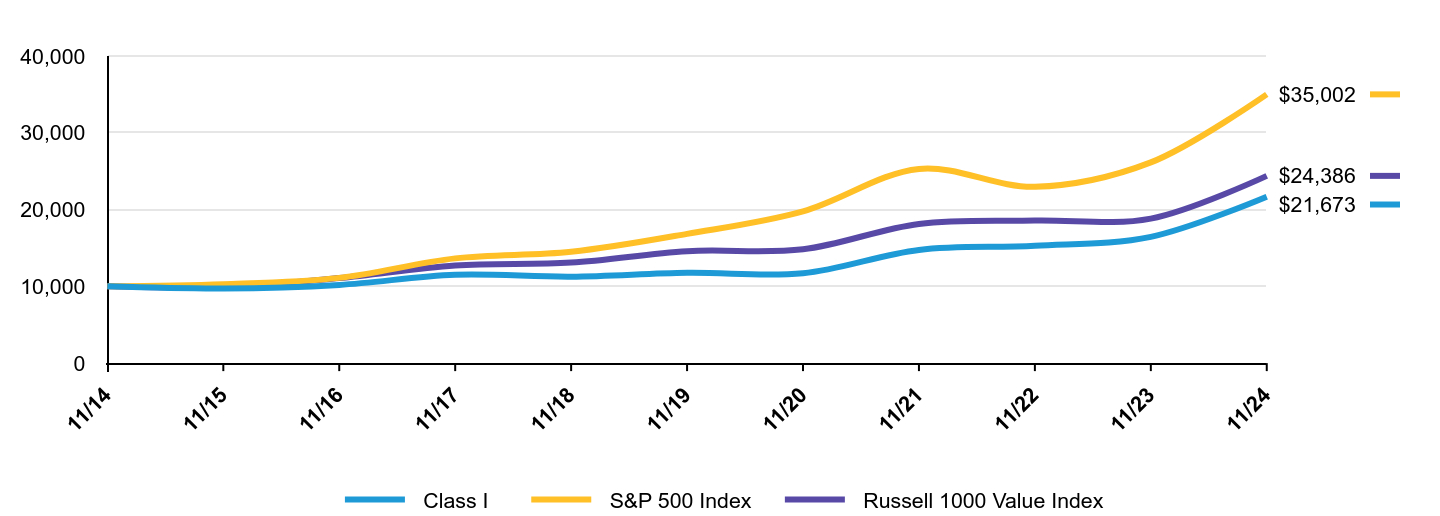
The following graph shows the performance of hypothetical $10,000 investments in the Fund, a broad-based securities market index and an additional index that corresponds to the Fund's investment strategies, over the most recently completed 10 fiscal years of the Fund, or since inception, if shorter. The Fund's performance reflects applicable sales charges and assumes the reinvestment of dividends.
| Class I | S&P 500 Index | Russell 1000 Value Index |
|---|
| 11/14 | $10,000 | $10,000 | $10,000 |
|---|
| 11/15 | $9,719 | $10,275 | $9,889 |
|---|
| 11/16 | $10,186 | $11,103 | $11,077 |
|---|
| 11/17 | $11,506 | $13,642 | $12,720 |
|---|
| 11/18 | $11,257 | $14,498 | $13,096 |
|---|
| 11/19 | $11,755 | $16,834 | $14,580 |
|---|
| 11/20 | $11,704 | $19,773 | $14,831 |
|---|
| 11/21 | $14,743 | $25,294 | $18,131 |
|---|
| 11/22 | $15,283 | $22,964 | $18,570 |
|---|
| 11/23 | $16,448 | $26,142 | $18,822 |
|---|
| 11/24 | $21,673 | $35,002 | $24,386 |
|---|
Average Annual Total Returns
| AATR | 1 Year | 5 Years | 10 Years |
|---|
| Class I | 31.77% | 13.02% | 8.04% |
|---|
| S&P 500 Index | 33.89% | 15.77% | 13.35% |
|---|
| Russell 1000 Value Index | 29.56% | 10.84% | 9.32% |
|---|
The addition of the S&P 500 Index broad-based benchmark provides a comparison of the Fund's performance against the broader market as regulatorily required.
The Fund’s past performance is not a good predictor of the Fund’s future performance.
The graph and table do not reflect the deduction of taxes that a shareholder would pay on Fund distributions or the redemption or sale of Fund shares.
Visit https://www.abfunds.com/link/AB/ABVIX-A for the most recent performance information.
| Net Assets | $480,224,588 |
|---|
| # of Portfolio Holdings | 58 |
|---|
| Portfolio Turnover Rate | 53% |
|---|
| Total Advisory Fees Paid | $2,218,719 |
|---|
Graphical Representation of Holdings
| Company | U.S. $ Value | % of Net Assets |
|---|
| Walmart, Inc. | $19,674,102 | 4.1% |
| Wells Fargo & Co. | $19,564,188 | 4.1% |
| UnitedHealth Group, Inc. | $19,235,945 | 4.0% |
| Charles Schwab Corp. (The) | $15,676,647 | 3.3% |
| Walt Disney Co. (The) | $14,103,331 | 2.9% |
| Baker Hughes Co. | $13,076,312 | 2.7% |
| Lowe's Cos., Inc. | $12,927,621 | 2.7% |
| Labcorp Holdings, Inc. | $12,509,210 | 2.6% |
| Fiserv, Inc. | $12,346,582 | 2.6% |
| Oracle Corp. | $11,431,060 | 2.4% |
| Total | $150,544,998 | 31.4% |
| Value | Value |
|---|
| Financials | 19.9% |
| Health Care | 16.5% |
| Industrials | 13.4% |
| Consumer Discretionary | 8.7% |
| Information Technology | 8.3% |
| Energy | 7.3% |
| Communication Services | 7.1% |
| Consumer Staples | 6.7% |
| Real Estate | 4.0% |
| Utilities | 4.0% |
| Materials | 3.9% |
| Short-Term Investments | 0.1% |
| Other assets less liabilities | 0.1% |
Availability of Additional Information
You can find additional information on the Fund’s website at https://www.abfunds.com/link/AB/ABVIX-A, including the Fund's:
• Prospectus
• Financial information
• Fund holdings
• Proxy voting information
You can also request this information by contacting us at (800) 227 4618.
Shareholders who have consented to receive a single annual or semi-annual shareholder report at a shared address may revoke this consent by contacting us at (800) 227 4618.
Information Regarding the Review and Approval of the Fund’s Advisory Agreement
Information regarding the Fund’s Board of Directors’/Trustees’ review of the advisory agreement is available on the Fund’s website https://www.abfunds.com/link/AB/ABVIX-A. You can request this information, free of charge, by contacting us at (800) 227 4618 or by scanning the QR code below.
The [A/B] logo and AllianceBernstein® are registered trademarks used by permission of the owner, AllianceBernstein L.P.
Please scan QR code for
Fund Information
Please scan QR code for
Fund Information
Annual Shareholder Report
This annual shareholder report contains important information about the AB Large Cap Value Fund (the “Fund”) for the period of October 1, 2024 to November 30, 2024. You can find additional information about the Fund at https://www.abfunds.com/link/AB/ABVZX-A. You can also request this information by contacting us at (800) 227 4618.
What were the Fund costs for the last year?
(Based on a hypothetical $10,000 investment)
| Class Name | Cost of a $10,000 investment | Costs paid as a percentage of a $10,000 investment |
|---|
| Class Z | $2 | 0.12% |
|---|
How did the Fund perform last year? What affected the Fund’s performance?
During the period since inception, all share classes of the Fund outperformed the Russell 1000 Value Index (the “benchmark”), before sales charges. Overall security selection was positive, while sector allocation was negative. Security selection within financials and consumer staples added to gains, while selection within utilities and real estate detracted. In terms of sector allocation, an underweight to financials and an overweight to healthcare detracted and offset gains from overweights to communication services and materials.
Top contributors to performance:
Top detractors from performance:
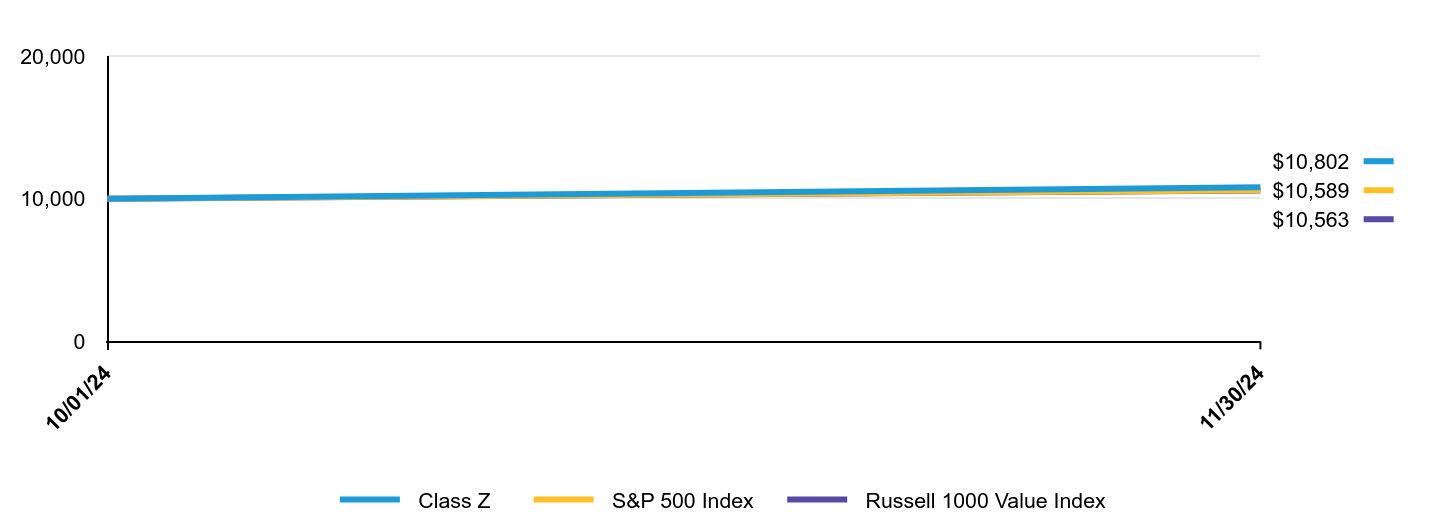
The following graph shows the performance of hypothetical $10,000 investments in the Fund, a broad-based securities market index and an additional index that corresponds to the Fund's investment strategies, over the most recently completed 10 fiscal years of the Fund, or since inception, if shorter. The Fund's performance reflects applicable sales charges and assumes the reinvestment of dividends.
| Class Z | S&P 500 Index | Russell 1000 Value Index |
|---|
| 10/01/24 | $10,000 | $10,000 | $10,000 |
|---|
| 11/30/24 | $10,802 | $10,589 | $10,563 |
|---|
Average Annual Total Returns
| AATR | Since Inception 10/01/24 |
|---|
| Class Z | 8.02% |
|---|
| S&P 500 Index | 5.89% |
|---|
| Russell 1000 Value Index | 5.63% |
|---|
The addition of the S&P 500 Index broad-based benchmark provides a comparison of the Fund's performance against the broader market as regulatorily required.
The Fund’s past performance is not a good predictor of the Fund’s future performance.
The graph and table do not reflect the deduction of taxes that a shareholder would pay on Fund distributions or the redemption or sale of Fund shares.
Visit https://www.abfunds.com/link/AB/ABVZX-A for the most recent performance information.
| Net Assets | $480,224,588 |
|---|
| # of Portfolio Holdings | 58 |
|---|
| Portfolio Turnover Rate | 53% |
|---|
| Total Advisory Fees Paid | $2,218,719 |
|---|
Graphical Representation of Holdings
| Company | U.S. $ Value | % of Net Assets |
|---|
| Walmart, Inc. | $19,674,102 | 4.1% |
| Wells Fargo & Co. | $19,564,188 | 4.1% |
| UnitedHealth Group, Inc. | $19,235,945 | 4.0% |
| Charles Schwab Corp. (The) | $15,676,647 | 3.3% |
| Walt Disney Co. (The) | $14,103,331 | 2.9% |
| Baker Hughes Co. | $13,076,312 | 2.7% |
| Lowe's Cos., Inc. | $12,927,621 | 2.7% |
| Labcorp Holdings, Inc. | $12,509,210 | 2.6% |
| Fiserv, Inc. | $12,346,582 | 2.6% |
| Oracle Corp. | $11,431,060 | 2.4% |
| Total | $150,544,998 | 31.4% |
| Value | Value |
|---|
| Financials | 19.9% |
| Health Care | 16.5% |
| Industrials | 13.4% |
| Consumer Discretionary | 8.7% |
| Information Technology | 8.3% |
| Energy | 7.3% |
| Communication Services | 7.1% |
| Consumer Staples | 6.7% |
| Real Estate | 4.0% |
| Utilities | 4.0% |
| Materials | 3.9% |
| Short-Term Investments | 0.1% |
| Other assets less liabilities | 0.1% |
Availability of Additional Information
You can find additional information on the Fund’s website at https://www.abfunds.com/link/AB/ABVZX-A, including the Fund's:
• Prospectus
• Financial information
• Fund holdings
• Proxy voting information
You can also request this information by contacting us at (800) 227 4618.
Shareholders who have consented to receive a single annual or semi-annual shareholder report at a shared address may revoke this consent by contacting us at (800) 227 4618.
Information Regarding the Review and Approval of the Fund’s Advisory Agreement
Information regarding the Fund’s Board of Directors’/Trustees’ review of the advisory agreement is available on the Fund’s website https://www.abfunds.com/link/AB/ABVZX-A. You can request this information, free of charge, by contacting us at (800) 227 4618 or by scanning the QR code below.
The [A/B] logo and AllianceBernstein® are registered trademarks used by permission of the owner, AllianceBernstein L.P.
Please scan QR code for
Fund Information
Please scan QR code for
Fund Information
Annual Shareholder Report
This annual shareholder report contains important information about the AB Discovery Value Fund (the “Fund”) for the period of December 1, 2023 to November 30, 2024. You can find additional information about the Fund at https://www.abfunds.com/link/AB/ABYSX-A. You can also request this information by contacting us at (800) 227 4618.
What were the Fund costs for the last year?
(Based on a hypothetical $10,000 investment)
| Class Name | Cost of a $10,000 investment | Costs paid as a percentage of a $10,000 investment |
|---|
| Advisor Class | $97 | 0.84% |
|---|
How did the Fund perform last year? What affected the Fund’s performance?
During the 12-month period ended November 30, 2024, all share classes of the Fund underperformed the Russell 2500 Value Index (the “benchmark“), before sales charges. Overall security selection detracted from returns, while sector allocation contributed. Security selection within health care and consumer staples detracted the most, while selection within energy and industrials contributed. In terms of sector allocation, losses from an underweight to utilities and an overweight to consumer discretionary were partially offset by contributions from an underweight to materials and an overweight to industrials.
Top contributors to performance:
Top detractors from performance:
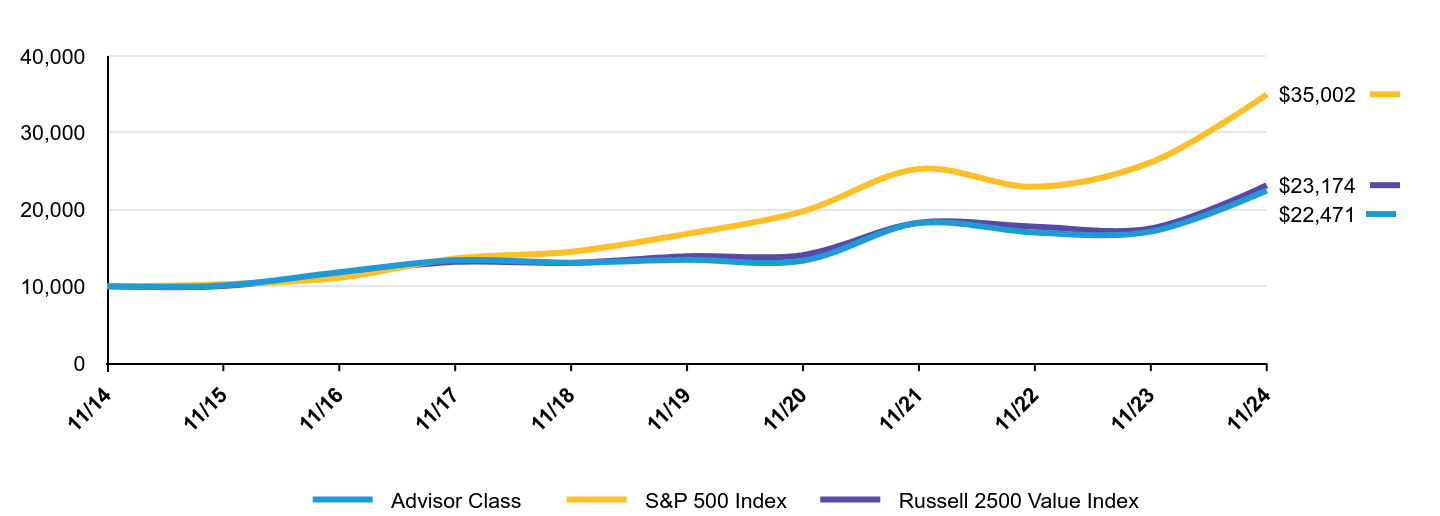
The following graph shows the performance of hypothetical $10,000 investments in the Fund, a broad-based securities market index and an additional index that corresponds to the Fund's investment strategies, over the most recently completed 10 fiscal years of the Fund, or since inception, if shorter. The Fund's performance reflects applicable sales charges and assumes the reinvestment of dividends.
| Advisor Class | S&P 500 Index | Russell 2500 Value Index |
|---|
| 11/14 | $10,000 | $10,000 | $10,000 |
|---|
| 11/15 | $10,121 | $10,275 | $10,048 |
|---|
| 11/16 | $11,825 | $11,103 | $11,672 |
|---|
| 11/17 | $13,392 | $13,642 | $13,196 |
|---|
| 11/18 | $13,078 | $14,498 | $13,054 |
|---|
| 11/19 | $13,448 | $16,834 | $13,927 |
|---|
| 11/20 | $13,338 | $19,773 | $14,068 |
|---|
| 11/21 | $18,240 | $25,294 | $18,276 |
|---|
| 11/22 | $17,004 | $22,964 | $17,767 |
|---|
| 11/23 | $17,128 | $26,142 | $17,541 |
|---|
| 11/24 | $22,471 | $35,002 | $23,174 |
|---|
Average Annual Total Returns
| AATR | 1 Year | 5 Years | 10 Years |
|---|
| Advisor Class | 31.19% | 10.81% | 8.43% |
|---|
| S&P 500 Index | 33.89% | 15.77% | 13.35% |
|---|
| Russell 2500 Value Index | 32.11% | 10.72% | 8.77% |
|---|
The addition of the S&P 500 Index broad-based benchmark provides a comparison of the Fund's performance against the broader market as regulatorily required.
The Fund’s past performance is not a good predictor of the Fund’s future performance.
The graph and table do not reflect the deduction of taxes that a shareholder would pay on Fund distributions or the redemption or sale of Fund shares.
Visit https://www.abfunds.com/link/AB/ABYSX-A for the most recent performance information.
| Net Assets | $2,642,293,051 |
|---|
| # of Portfolio Holdings | 93 |
|---|
| Portfolio Turnover Rate | 53% |
|---|
| Total Advisory Fees Paid | $18,842,618 |
|---|
Graphical Representation of Holdings
| Company | U.S. $ Value | % of Net Assets |
|---|
| Tapestry, Inc. | $45,883,295 | 1.7% |
| Jones Lang LaSalle, Inc. | $41,896,386 | 1.6% |
| Pentair PLC | $41,822,733 | 1.6% |
| Cameco Corp. (New York) | $41,293,851 | 1.6% |
| Encompass Health Corp. | $40,993,899 | 1.6% |
| F5, Inc. | $40,561,707 | 1.5% |
| CH Robinson Worldwide, Inc. | $40,114,065 | 1.5% |
| Wintrust Financial Corp. | $39,779,312 | 1.5% |
| First Citizens BancShares, Inc./NC - Class A | $38,684,520 | 1.5% |
| Bath & Body Works, Inc. | $36,983,862 | 1.4% |
| Total | $408,013,630 | 15.5% |
| Value | Value |
|---|
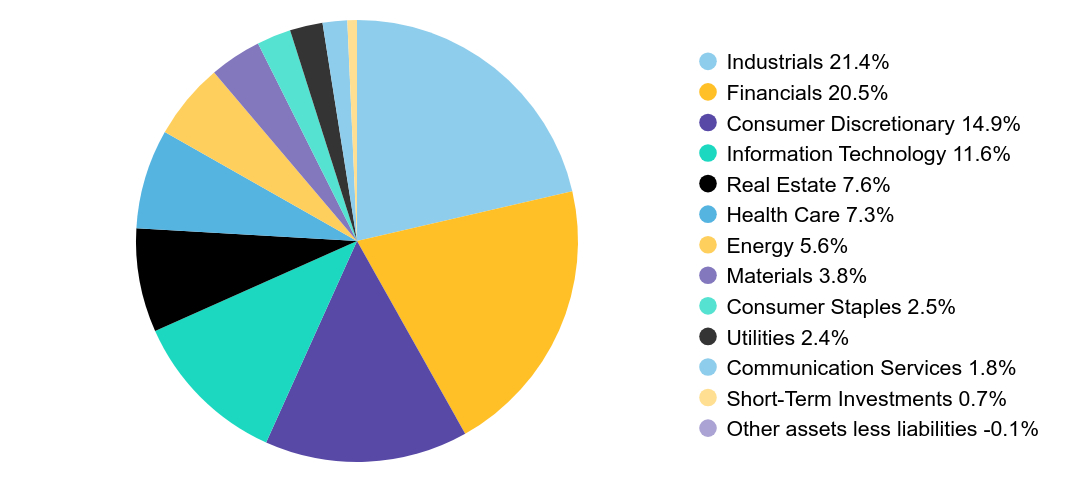
| Industrials | 21.4% |
| Financials | 20.5% |
| Consumer Discretionary | 14.9% |
| Information Technology | 11.6% |
| Real Estate | 7.6% |
| Health Care | 7.3% |
| Energy | 5.6% |
| Materials | 3.8% |
| Consumer Staples | 2.5% |
| Utilities | 2.4% |
| Communication Services | 1.8% |
| Short-Term Investments | 0.7% |
| Other assets less liabilities | -0.1% |
Availability of Additional Information
You can find additional information on the Fund’s website at https://www.abfunds.com/link/AB/ABYSX-A, including the Fund's:
• Prospectus
• Financial information
• Fund holdings
• Proxy voting information
You can also request this information by contacting us at (800) 227 4618.
Shareholders who have consented to receive a single annual or semi-annual shareholder report at a shared address may revoke this consent by contacting us at (800) 227 4618.
Information Regarding the Review and Approval of the Fund’s Advisory Agreement
Information regarding the Fund’s Board of Directors’/Trustees’ review of the advisory agreement is available on the Fund’s website https://www.abfunds.com/link/AB/ABYSX-A. You can request this information, free of charge, by contacting us at (800) 227 4618 or by scanning the QR code below.
The [A/B] logo and AllianceBernstein® are registered trademarks used by permission of the owner, AllianceBernstein L.P.
Please scan QR code for
Fund Information
Please scan QR code for
Fund Information
Annual Shareholder Report
This annual shareholder report contains important information about the AB Discovery Value Fund (the “Fund”) for the period of December 1, 2023 to November 30, 2024. You can find additional information about the Fund at https://www.abfunds.com/link/AB/ABASX-A. You can also request this information by contacting us at (800) 227 4618.
What were the Fund costs for the last year?
(Based on a hypothetical $10,000 investment)
| Class Name | Cost of a $10,000 investment | Costs paid as a percentage of a $10,000 investment |
|---|
| Class A | $126 | 1.09% |
|---|
How did the Fund perform last year? What affected the Fund’s performance?
During the 12-month period ended November 30, 2024, all share classes of the Fund underperformed the Russell 2500 Value Index (the “benchmark“), before sales charges. Overall security selection detracted from returns, while sector allocation contributed. Security selection within health care and consumer staples detracted the most, while selection within energy and industrials contributed. In terms of sector allocation, losses from an underweight to utilities and an overweight to consumer discretionary were partially offset by contributions from an underweight to materials and an overweight to industrials.
Top contributors to performance:
Top detractors from performance:
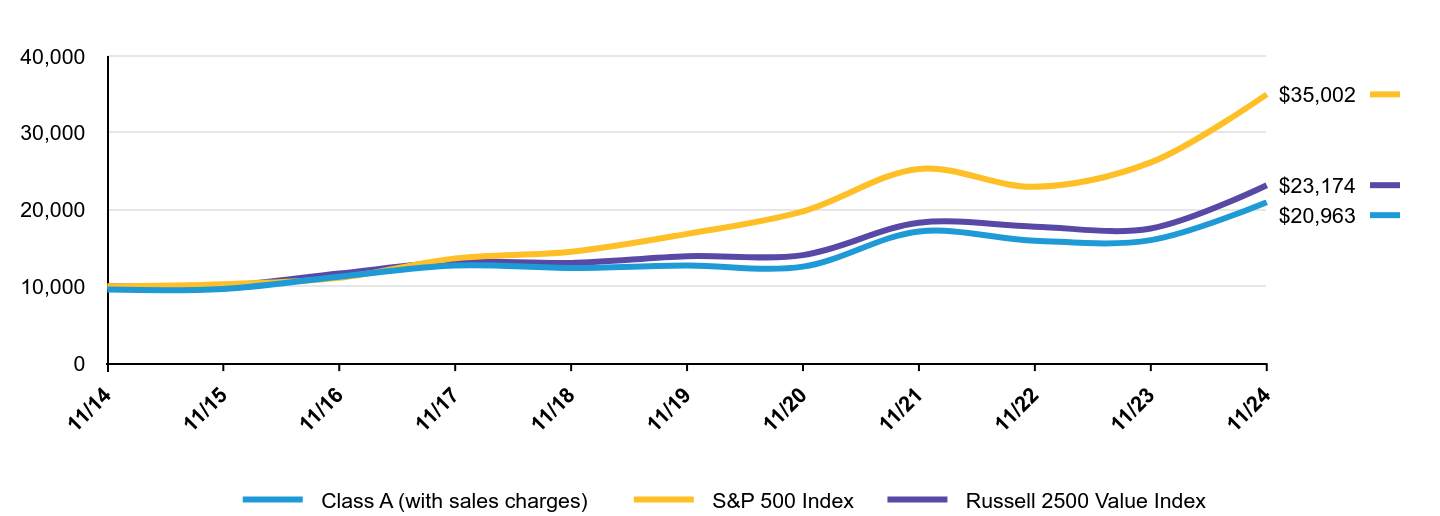
The following graph shows the performance of hypothetical $10,000 investments in the Fund, a broad-based securities market index and an additional index that corresponds to the Fund's investment strategies, over the most recently completed 10 fiscal years of the Fund, or since inception, if shorter. The Fund's performance reflects applicable sales charges and assumes the reinvestment of dividends.
| Class A (with sales charges) | S&P 500 Index | Russell 2500 Value Index |
|---|
| 11/14 | $9,574 | $10,000 | $10,000 |
|---|
| 11/15 | $9,657 | $10,275 | $10,048 |
|---|
| 11/16 | $11,256 | $11,103 | $11,672 |
|---|
| 11/17 | $12,712 | $13,642 | $13,196 |
|---|
| 11/18 | $12,386 | $14,498 | $13,054 |
|---|
| 11/19 | $12,705 | $16,834 | $13,927 |
|---|
| 11/20 | $12,567 | $19,773 | $14,068 |
|---|
| 11/21 | $17,145 | $25,294 | $18,276 |
|---|
| 11/22 | $15,948 | $22,964 | $17,767 |
|---|
| 11/23 | $16,018 | $26,142 | $17,541 |
|---|
| 11/24 | $20,963 | $35,002 | $23,174 |
|---|
Average Annual Total Returns
| AATR | 1 Year | 5 Years | 10 Years |
|---|
| Class A (without sales charges) | 30.87% | 10.53% | 8.15% |
|---|
| Class A (with sales charges) | 25.31% | 9.58% | 7.68% |
|---|
| S&P 500 Index | 33.89% | 15.77% | 13.35% |
|---|
| Russell 2500 Value Index | 32.11% | 10.72% | 8.77% |
|---|
The addition of the S&P 500 Index broad-based benchmark provides a comparison of the Fund's performance against the broader market as regulatorily required.
The Fund’s past performance is not a good predictor of the Fund’s future performance.
The graph and table do not reflect the deduction of taxes that a shareholder would pay on Fund distributions or the redemption or sale of Fund shares.
Visit https://www.abfunds.com/link/AB/ABASX-A for the most recent performance information.
| Net Assets | $2,642,293,051 |
|---|
| # of Portfolio Holdings | 93 |
|---|
| Portfolio Turnover Rate | 53% |
|---|
| Total Advisory Fees Paid | $18,842,618 |
|---|
Graphical Representation of Holdings
| Company | U.S. $ Value | % of Net Assets |
|---|
| Tapestry, Inc. | $45,883,295 | 1.7% |
| Jones Lang LaSalle, Inc. | $41,896,386 | 1.6% |
| Pentair PLC | $41,822,733 | 1.6% |
| Cameco Corp. (New York) | $41,293,851 | 1.6% |
| Encompass Health Corp. | $40,993,899 | 1.6% |
| F5, Inc. | $40,561,707 | 1.5% |
| CH Robinson Worldwide, Inc. | $40,114,065 | 1.5% |
| Wintrust Financial Corp. | $39,779,312 | 1.5% |
| First Citizens BancShares, Inc./NC - Class A | $38,684,520 | 1.5% |
| Bath & Body Works, Inc. | $36,983,862 | 1.4% |
| Total | $408,013,630 | 15.5% |
| Value | Value |
|---|
| Industrials | 21.4% |
| Financials | 20.5% |
| Consumer Discretionary | 14.9% |
| Information Technology | 11.6% |
| Real Estate | 7.6% |
| Health Care | 7.3% |
| Energy | 5.6% |
| Materials | 3.8% |
| Consumer Staples | 2.5% |
| Utilities | 2.4% |
| Communication Services | 1.8% |
| Short-Term Investments | 0.7% |
| Other assets less liabilities | -0.1% |
Availability of Additional Information
You can find additional information on the Fund’s website at https://www.abfunds.com/link/AB/ABASX-A, including the Fund's:
• Prospectus
• Financial information
• Fund holdings
• Proxy voting information
You can also request this information by contacting us at (800) 227 4618.
Shareholders who have consented to receive a single annual or semi-annual shareholder report at a shared address may revoke this consent by contacting us at (800) 227 4618.
Information Regarding the Review and Approval of the Fund’s Advisory Agreement
Information regarding the Fund’s Board of Directors’/Trustees’ review of the advisory agreement is available on the Fund’s website https://www.abfunds.com/link/AB/ABASX-A. You can request this information, free of charge, by contacting us at (800) 227 4618 or by scanning the QR code below.
The [A/B] logo and AllianceBernstein® are registered trademarks used by permission of the owner, AllianceBernstein L.P.
Please scan QR code for
Fund Information
Please scan QR code for
Fund Information
Annual Shareholder Report
This annual shareholder report contains important information about the AB Discovery Value Fund (the “Fund”) for the period of December 1, 2023 to November 30, 2024. You can find additional information about the Fund at https://www.abfunds.com/link/AB/ABCSX-A. You can also request this information by contacting us at (800) 227 4618.
What were the Fund costs for the last year?
(Based on a hypothetical $10,000 investment)
| Class Name | Cost of a $10,000 investment | Costs paid as a percentage of a $10,000 investment |
|---|
| Class C | $212 | 1.84% |
|---|
How did the Fund perform last year? What affected the Fund’s performance?
During the 12-month period ended November 30, 2024, all share classes of the Fund underperformed the Russell 2500 Value Index (the “benchmark“), before sales charges. Overall security selection detracted from returns, while sector allocation contributed. Security selection within health care and consumer staples detracted the most, while selection within energy and industrials contributed. In terms of sector allocation, losses from an underweight to utilities and an overweight to consumer discretionary were partially offset by contributions from an underweight to materials and an overweight to industrials.
Top contributors to performance:
Top detractors from performance:
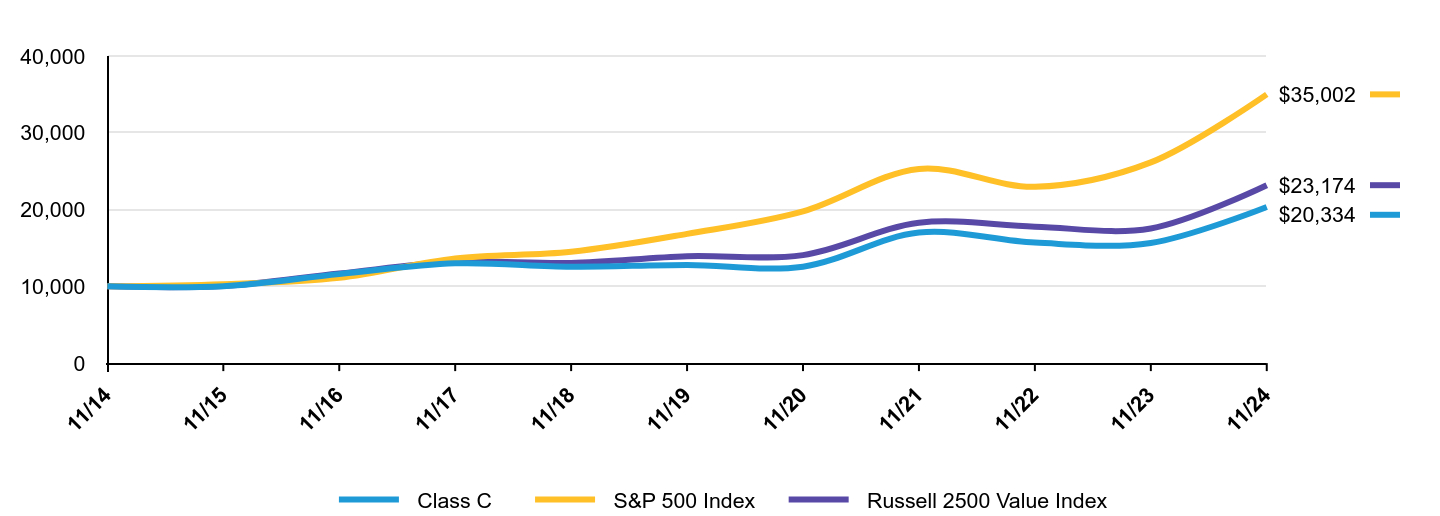
The following graph shows the performance of hypothetical $10,000 investments in the Fund, a broad-based securities market index and an additional index that corresponds to the Fund's investment strategies, over the most recently completed 10 fiscal years of the Fund, or since inception, if shorter. The Fund's performance reflects applicable sales charges and assumes the reinvestment of dividends.
| Class C | S&P 500 Index | Russell 2500 Value Index |
|---|
| 11/14 | $10,000 | $10,000 | $10,000 |
|---|
| 11/15 | $10,019 | $10,275 | $10,048 |
|---|
| 11/16 | $11,591 | $11,103 | $11,672 |
|---|
| 11/17 | $12,995 | $13,642 | $13,196 |
|---|
| 11/18 | $12,565 | $14,498 | $13,054 |
|---|
| 11/19 | $12,795 | $16,834 | $13,927 |
|---|
| 11/20 | $12,559 | $19,773 | $14,068 |
|---|
| 11/21 | $17,005 | $25,294 | $18,276 |
|---|
| 11/22 | $15,695 | $22,964 | $17,767 |
|---|
| 11/23 | $15,651 | $26,142 | $17,541 |
|---|
| 11/24 | $20,334 | $35,002 | $23,174 |
|---|
Average Annual Total Returns
| AATR | 1 Year | 5 Years | 10 Years |
|---|
| Class C (without sales charges) | 29.92% | 9.71% | 7.35% |
|---|
| Class C (with sales charges) | 28.92% | 9.71% | 7.35% |
|---|
| S&P 500 Index | 33.89% | 15.77% | 13.35% |
|---|
| Russell 2500 Value Index | 32.11% | 10.72% | 8.77% |
|---|
The addition of the S&P 500 Index broad-based benchmark provides a comparison of the Fund's performance against the broader market as regulatorily required.
The Fund’s past performance is not a good predictor of the Fund’s future performance.
The graph and table do not reflect the deduction of taxes that a shareholder would pay on Fund distributions or the redemption or sale of Fund shares.
Visit https://www.abfunds.com/link/AB/ABCSX-A for the most recent performance information.
| Net Assets | $2,642,293,051 |
|---|
| # of Portfolio Holdings | 93 |
|---|
| Portfolio Turnover Rate | 53% |
|---|
| Total Advisory Fees Paid | $18,842,618 |
|---|
Graphical Representation of Holdings
| Company | U.S. $ Value | % of Net Assets |
|---|
| Tapestry, Inc. | $45,883,295 | 1.7% |
| Jones Lang LaSalle, Inc. | $41,896,386 | 1.6% |
| Pentair PLC | $41,822,733 | 1.6% |
| Cameco Corp. (New York) | $41,293,851 | 1.6% |
| Encompass Health Corp. | $40,993,899 | 1.6% |
| F5, Inc. | $40,561,707 | 1.5% |
| CH Robinson Worldwide, Inc. | $40,114,065 | 1.5% |
| Wintrust Financial Corp. | $39,779,312 | 1.5% |
| First Citizens BancShares, Inc./NC - Class A | $38,684,520 | 1.5% |
| Bath & Body Works, Inc. | $36,983,862 | 1.4% |
| Total | $408,013,630 | 15.5% |
| Value | Value |
|---|
| Industrials | 21.4% |
| Financials | 20.5% |
| Consumer Discretionary | 14.9% |
| Information Technology | 11.6% |
| Real Estate | 7.6% |
| Health Care | 7.3% |
| Energy | 5.6% |
| Materials | 3.8% |
| Consumer Staples | 2.5% |
| Utilities | 2.4% |
| Communication Services | 1.8% |
| Short-Term Investments | 0.7% |
| Other assets less liabilities | -0.1% |
Availability of Additional Information
You can find additional information on the Fund’s website at https://www.abfunds.com/link/AB/ABCSX-A, including the Fund's:
• Prospectus
• Financial information
• Fund holdings
• Proxy voting information
You can also request this information by contacting us at (800) 227 4618.
Shareholders who have consented to receive a single annual or semi-annual shareholder report at a shared address may revoke this consent by contacting us at (800) 227 4618.
Information Regarding the Review and Approval of the Fund’s Advisory Agreement
Information regarding the Fund’s Board of Directors’/Trustees’ review of the advisory agreement is available on the Fund’s website https://www.abfunds.com/link/AB/ABCSX-A. You can request this information, free of charge, by contacting us at (800) 227 4618 or by scanning the QR code below.
The [A/B] logo and AllianceBernstein® are registered trademarks used by permission of the owner, AllianceBernstein L.P.
Please scan QR code for
Fund Information
Please scan QR code for
Fund Information
Annual Shareholder Report
This annual shareholder report contains important information about the AB Discovery Value Fund (the “Fund”) for the period of December 1, 2023 to November 30, 2024. You can find additional information about the Fund at https://www.abfunds.com/link/AB/ABSIX-A. You can also request this information by contacting us at (800) 227 4618.
What were the Fund costs for the last year?
(Based on a hypothetical $10,000 investment)
| Class Name | Cost of a $10,000 investment | Costs paid as a percentage of a $10,000 investment |
|---|
| Class I | $105 | 0.91% |
|---|
How did the Fund perform last year? What affected the Fund’s performance?
During the 12-month period ended November 30, 2024, all share classes of the Fund underperformed the Russell 2500 Value Index (the “benchmark“), before sales charges. Overall security selection detracted from returns, while sector allocation contributed. Security selection within health care and consumer staples detracted the most, while selection within energy and industrials contributed. In terms of sector allocation, losses from an underweight to utilities and an overweight to consumer discretionary were partially offset by contributions from an underweight to materials and an overweight to industrials.
Top contributors to performance:
Top detractors from performance:
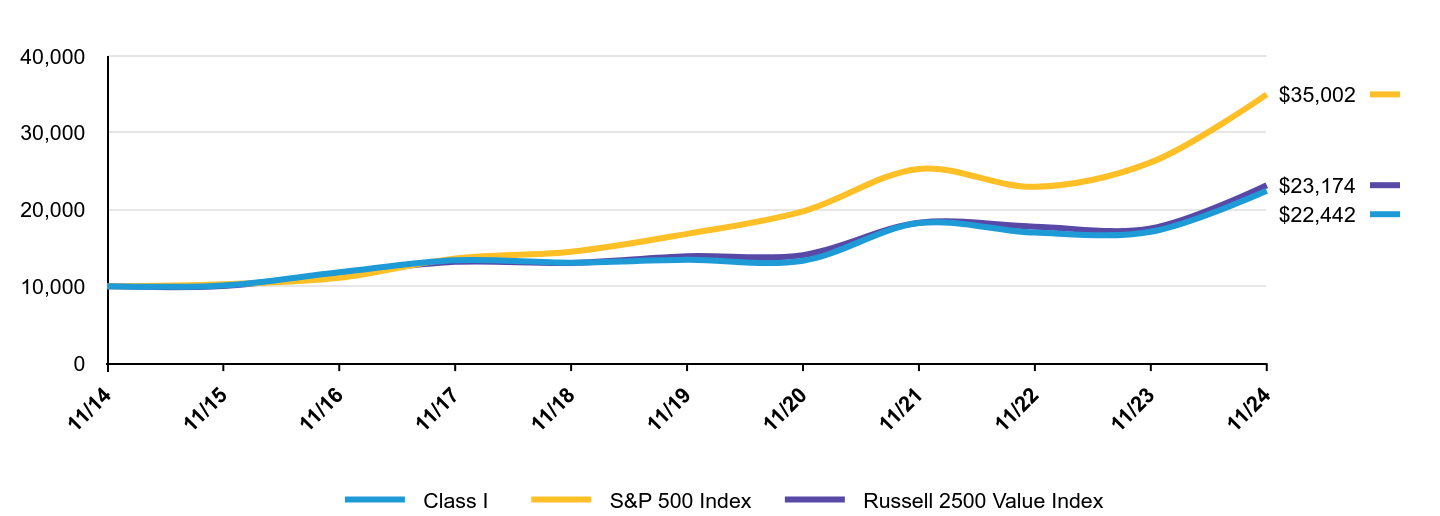
The following graph shows the performance of hypothetical $10,000 investments in the Fund, a broad-based securities market index and an additional index that corresponds to the Fund's investment strategies, over the most recently completed 10 fiscal years of the Fund, or since inception, if shorter. The Fund's performance reflects applicable sales charges and assumes the reinvestment of dividends.
| Class I | S&P 500 Index | Russell 2500 Value Index |
|---|
| 11/14 | $10,000 | $10,000 | $10,000 |
|---|
| 11/15 | $10,121 | $10,275 | $10,048 |
|---|
| 11/16 | $11,827 | $11,103 | $11,672 |
|---|
| 11/17 | $13,396 | $13,642 | $13,196 |
|---|
| 11/18 | $13,081 | $14,498 | $13,054 |
|---|
| 11/19 | $13,449 | $16,834 | $13,927 |
|---|
| 11/20 | $13,342 | $19,773 | $14,068 |
|---|
| 11/21 | $18,241 | $25,294 | $18,276 |
|---|
| 11/22 | $16,998 | $22,964 | $17,767 |
|---|
| 11/23 | $17,113 | $26,142 | $17,541 |
|---|
| 11/24 | $22,442 | $35,002 | $23,174 |
|---|
Average Annual Total Returns
| AATR | 1 Year | 5 Years | 10 Years |
|---|
| Class I | 31.14% | 10.78% | 8.42% |
|---|
| S&P 500 Index | 33.89% | 15.77% | 13.35% |
|---|
| Russell 2500 Value Index | 32.11% | 10.72% | 8.77% |
|---|
The addition of the S&P 500 Index broad-based benchmark provides a comparison of the Fund's performance against the broader market as regulatorily required.
The Fund’s past performance is not a good predictor of the Fund’s future performance.
The graph and table do not reflect the deduction of taxes that a shareholder would pay on Fund distributions or the redemption or sale of Fund shares.
Visit https://www.abfunds.com/link/AB/ABSIX-A for the most recent performance information.
| Net Assets | $2,642,293,051 |
|---|
| # of Portfolio Holdings | 93 |
|---|
| Portfolio Turnover Rate | 53% |
|---|
| Total Advisory Fees Paid | $18,842,618 |
|---|
Graphical Representation of Holdings
| Company | U.S. $ Value | % of Net Assets |
|---|
| Tapestry, Inc. | $45,883,295 | 1.7% |
| Jones Lang LaSalle, Inc. | $41,896,386 | 1.6% |
| Pentair PLC | $41,822,733 | 1.6% |
| Cameco Corp. (New York) | $41,293,851 | 1.6% |
| Encompass Health Corp. | $40,993,899 | 1.6% |
| F5, Inc. | $40,561,707 | 1.5% |
| CH Robinson Worldwide, Inc. | $40,114,065 | 1.5% |
| Wintrust Financial Corp. | $39,779,312 | 1.5% |
| First Citizens BancShares, Inc./NC - Class A | $38,684,520 | 1.5% |
| Bath & Body Works, Inc. | $36,983,862 | 1.4% |
| Total | $408,013,630 | 15.5% |
| Value | Value |
|---|
| Industrials | 21.4% |
| Financials | 20.5% |
| Consumer Discretionary | 14.9% |
| Information Technology | 11.6% |
| Real Estate | 7.6% |
| Health Care | 7.3% |
| Energy | 5.6% |
| Materials | 3.8% |
| Consumer Staples | 2.5% |
| Utilities | 2.4% |
| Communication Services | 1.8% |
| Short-Term Investments | 0.7% |
| Other assets less liabilities | -0.1% |
Availability of Additional Information
You can find additional information on the Fund’s website at https://www.abfunds.com/link/AB/ABSIX-A, including the Fund's:
• Prospectus
• Financial information
• Fund holdings
• Proxy voting information
You can also request this information by contacting us at (800) 227 4618.
Shareholders who have consented to receive a single annual or semi-annual shareholder report at a shared address may revoke this consent by contacting us at (800) 227 4618.
Information Regarding the Review and Approval of the Fund’s Advisory Agreement
Information regarding the Fund’s Board of Directors’/Trustees’ review of the advisory agreement is available on the Fund’s website https://www.abfunds.com/link/AB/ABSIX-A. You can request this information, free of charge, by contacting us at (800) 227 4618 or by scanning the QR code below.
The [A/B] logo and AllianceBernstein® are registered trademarks used by permission of the owner, AllianceBernstein L.P.
Please scan QR code for
Fund Information
Please scan QR code for
Fund Information
Annual Shareholder Report
This annual shareholder report contains important information about the AB Discovery Value Fund (the “Fund”) for the period of December 1, 2023 to November 30, 2024. You can find additional information about the Fund at https://www.abfunds.com/link/AB/ABSZX-A. You can also request this information by contacting us at (800) 227 4618.
What were the Fund costs for the last year?
(Based on a hypothetical $10,000 investment)
| Class Name | Cost of a $10,000 investment | Costs paid as a percentage of a $10,000 investment |
|---|
| Class Z | $94 | 0.81% |
|---|
How did the Fund perform last year? What affected the Fund’s performance?
During the 12-month period ended November 30, 2024, all share classes of the Fund underperformed the Russell 2500 Value Index (the “benchmark“), before sales charges. Overall security selection detracted from returns, while sector allocation contributed. Security selection within health care and consumer staples detracted the most, while selection within energy and industrials contributed. In terms of sector allocation, losses from an underweight to utilities and an overweight to consumer discretionary were partially offset by contributions from an underweight to materials and an overweight to industrials.
Top contributors to performance:
Top detractors from performance:
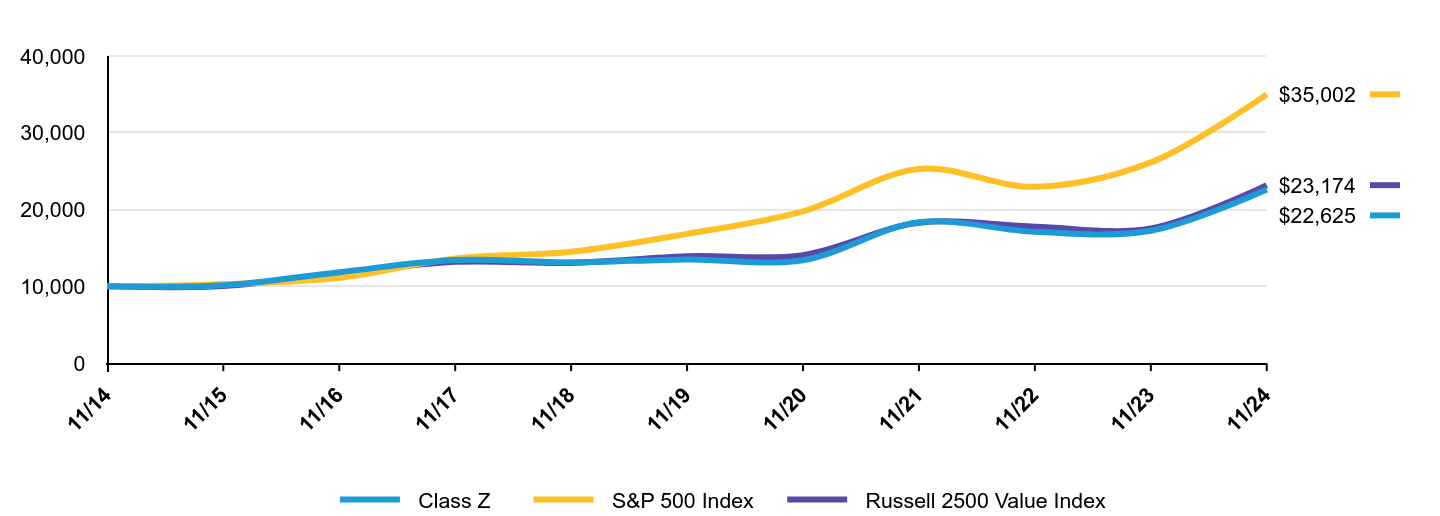
The following graph shows the performance of hypothetical $10,000 investments in the Fund, a broad-based securities market index and an additional index that corresponds to the Fund's investment strategies, over the most recently completed 10 fiscal years of the Fund, or since inception, if shorter. The Fund's performance reflects applicable sales charges and assumes the reinvestment of dividends.
| Class Z | S&P 500 Index | Russell 2500 Value Index |
|---|
| 11/14 | $10,000 | $10,000 | $10,000 |
|---|
| 11/15 | $10,131 | $10,275 | $10,048 |
|---|
| 11/16 | $11,845 | $11,103 | $11,672 |
|---|
| 11/17 | $13,428 | $13,642 | $13,196 |
|---|
| 11/18 | $13,126 | $14,498 | $13,054 |
|---|
| 11/19 | $13,506 | $16,834 | $13,927 |
|---|
| 11/20 | $13,409 | $19,773 | $14,068 |
|---|
| 11/21 | $18,339 | $25,294 | $18,276 |
|---|
| 11/22 | $17,108 | $22,964 | $17,767 |
|---|
| 11/23 | $17,239 | $26,142 | $17,541 |
|---|
| 11/24 | $22,625 | $35,002 | $23,174 |
|---|
Average Annual Total Returns
| AATR | 1 Year | 5 Years | 10 Years |
|---|
| Class Z | 31.24% | 10.87% | 8.51% |
|---|
| S&P 500 Index | 33.89% | 15.77% | 13.35% |
|---|
| Russell 2500 Value Index | 32.11% | 10.72% | 8.77% |
|---|
The addition of the S&P 500 Index broad-based benchmark provides a comparison of the Fund's performance against the broader market as regulatorily required.
The Fund’s past performance is not a good predictor of the Fund’s future performance.
The graph and table do not reflect the deduction of taxes that a shareholder would pay on Fund distributions or the redemption or sale of Fund shares.
Visit https://www.abfunds.com/link/AB/ABSZX-A for the most recent performance information.
| Net Assets | $2,642,293,051 |
|---|
| # of Portfolio Holdings | 93 |
|---|
| Portfolio Turnover Rate | 53% |
|---|
| Total Advisory Fees Paid | $18,842,618 |
|---|
Graphical Representation of Holdings
| Company | U.S. $ Value | % of Net Assets |
|---|
| Tapestry, Inc. | $45,883,295 | 1.7% |
| Jones Lang LaSalle, Inc. | $41,896,386 | 1.6% |
| Pentair PLC | $41,822,733 | 1.6% |
| Cameco Corp. (New York) | $41,293,851 | 1.6% |
| Encompass Health Corp. | $40,993,899 | 1.6% |
| F5, Inc. | $40,561,707 | 1.5% |
| CH Robinson Worldwide, Inc. | $40,114,065 | 1.5% |
| Wintrust Financial Corp. | $39,779,312 | 1.5% |
| First Citizens BancShares, Inc./NC - Class A | $38,684,520 | 1.5% |
| Bath & Body Works, Inc. | $36,983,862 | 1.4% |
| Total | $408,013,630 | 15.5% |
| Value | Value |
|---|
| Industrials | 21.4% |
| Financials | 20.5% |
| Consumer Discretionary | 14.9% |
| Information Technology | 11.6% |
| Real Estate | 7.6% |
| Health Care | 7.3% |
| Energy | 5.6% |
| Materials | 3.8% |
| Consumer Staples | 2.5% |
| Utilities | 2.4% |
| Communication Services | 1.8% |
| Short-Term Investments | 0.7% |
| Other assets less liabilities | -0.1% |
Availability of Additional Information
You can find additional information on the Fund’s website at https://www.abfunds.com/link/AB/ABSZX-A, including the Fund's:
• Prospectus
• Financial information
• Fund holdings
• Proxy voting information
You can also request this information by contacting us at (800) 227 4618.
Shareholders who have consented to receive a single annual or semi-annual shareholder report at a shared address may revoke this consent by contacting us at (800) 227 4618.
Information Regarding the Review and Approval of the Fund’s Advisory Agreement
Information regarding the Fund’s Board of Directors’/Trustees’ review of the advisory agreement is available on the Fund’s website https://www.abfunds.com/link/AB/ABSZX-A. You can request this information, free of charge, by contacting us at (800) 227 4618 or by scanning the QR code below.
The [A/B] logo and AllianceBernstein® are registered trademarks used by permission of the owner, AllianceBernstein L.P.
Please scan QR code for
Fund Information
Please scan QR code for
Fund Information
AB International Value Fund
Annual Shareholder Report
This annual shareholder report contains important information about the AB International Value Fund (the “Fund”) for the period of December 1, 2023 to November 30, 2024. You can find additional information about the Fund at https://www.abfunds.com/link/AB/ABIYX-A. You can also request this information by contacting us at (800) 227 4618.
What were the Fund costs for the last year?
(Based on a hypothetical $10,000 investment)
| Class Name | Cost of a $10,000 investment | Costs paid as a percentage of a $10,000 investment |
|---|
| Advisor Class | $104 | 0.98% |
|---|
How did the Fund perform last year? What affected the Fund’s performance?
During the 12-month period ended November 30, 2024, all share classes of the Fund, except Class C, outperformed the Morgan Stanley Capital International Europe, Australasia and the Far East (“MSCI EAFE”) Index (net) (the “benchmark”), before sales charges. Overall security selection contributed to returns, while sector allocation detracted. Security selection within industrials and energy contributed the most, offsetting losses from selection within consumer discretionary and utilities. In terms of sector allocation, an underweight to financials and an overweight to energy detracted and offset gains from an overweight to communication services and underweight to health care. Overall country selection (a result of bottom-up security analysis combined with fundamental research) detracted, as losses from an overweight to Portugal and an underweight to Australia offset gains from overweights to Taiwan and the US.
During the 12-month period, the Fund used derivatives in the form of currency forwards for hedging purposes, which detracted from absolute returns.
Top contributors to performance:
Top detractors from performance:
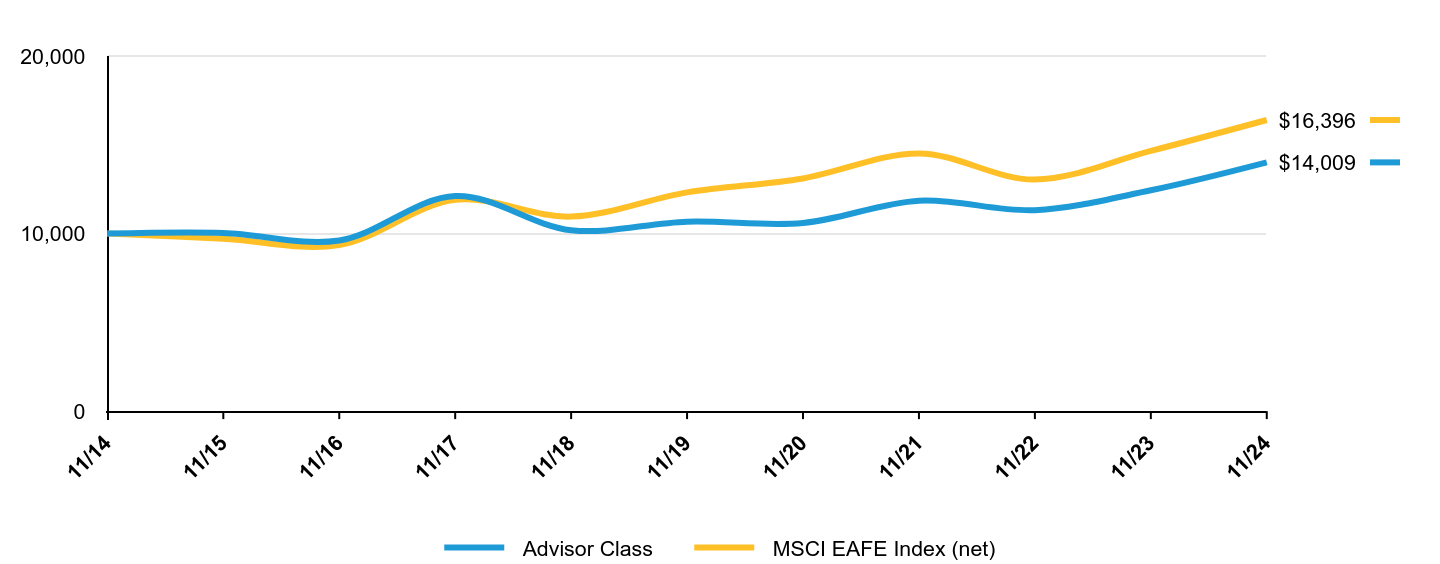
The following graph shows the performance of hypothetical $10,000 investments in the Fund and a broad-based securities market index over the most recently completed 10 fiscal years of the Fund, or since inception, if shorter. The Fund's performance reflects applicable sales charges and assumes the reinvestment of dividends.
| Advisor Class | MSCI EAFE Index (net) |
|---|
| 11/14 | $10,000 | $10,000 |
|---|
| 11/15 | $10,038 | $9,706 |
|---|
| 11/16 | $9,611 | $9,351 |
|---|
| 11/17 | $12,117 | $11,901 |
|---|
| 11/18 | $10,189 | $10,956 |
|---|
| 11/19 | $10,669 | $12,319 |
|---|
| 11/20 | $10,597 | $13,104 |
|---|
| 11/21 | $11,850 | $14,515 |
|---|
| 11/22 | $11,318 | $13,042 |
|---|
| 11/23 | $12,436 | $14,655 |
|---|
| 11/24 | $14,009 | $16,396 |
|---|
Average Annual Total Returns
| AATR | 1 Year | 5 Years | 10 Years |
|---|
| Advisor Class | 12.65% | 5.60% | 3.43% |
|---|
| MSCI EAFE Index (net) | 11.88% | 5.89% | 5.07% |
|---|
The Fund’s past performance is not a good predictor of the Fund’s future performance.
The graph and table do not reflect the deduction of taxes that a shareholder would pay on Fund distributions or the redemption or sale of Fund shares.
Visit https://www.abfunds.com/link/AB/ABIYX-A for the most recent performance information.
| Net Assets | $97,727,304 |
|---|
| # of Portfolio Holdings | 59 |
|---|
| Portfolio Turnover Rate | 46% |
|---|
| Total Advisory Fees Paid | $254,684 |
|---|
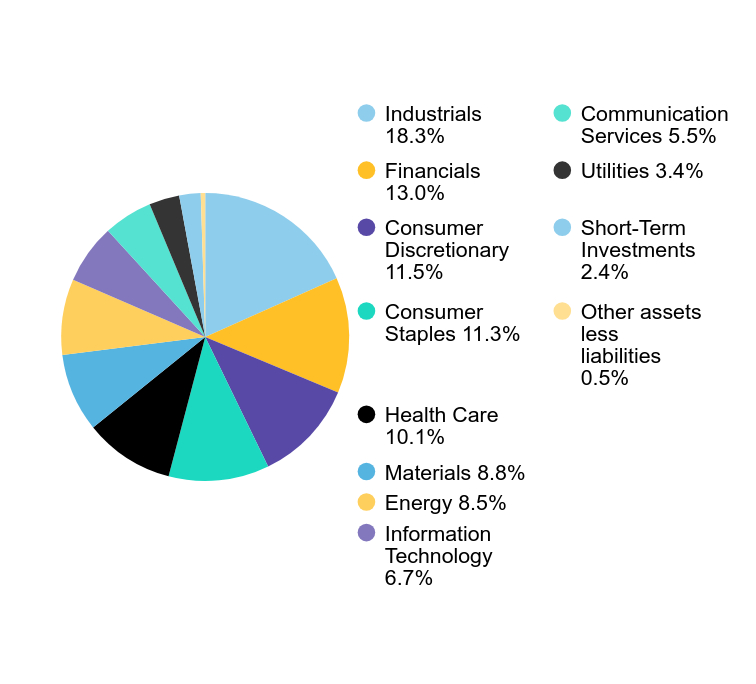
Graphical Representation of Holdings
| Company | U.S. $ Value | % of Net Assets |
|---|
| Roche Holding AG | $3,450,290 | 3.5% |
| Shell PLC | $3,345,851 | 3.4% |
| NatWest Group PLC | $2,823,063 | 2.9% |
| Resona Holdings, Inc. | $2,731,538 | 2.8% |
| Sony Group Corp. | $2,537,647 | 2.6% |
| Melrose Industries PLC | $2,510,879 | 2.6% |
| Deutsche Telekom AG (Reg) | $2,506,776 | 2.6% |
| Koninklijke Ahold Delhaize NV | $2,446,495 | 2.5% |
| Airbus SE | $2,314,575 | 2.4% |
| ResMed, Inc. | $2,278,548 | 2.3% |
| Total | $26,945,662 | 27.6% |
| Value | Value |
|---|
| Industrials | 18.3% |
| Financials | 13.0% |
| Consumer Discretionary | 11.5% |
| Consumer Staples | 11.3% |
| Health Care | 10.1% |
| Materials | 8.8% |
| Energy | 8.5% |
| Information Technology | 6.7% |
| Communication Services | 5.5% |
| Utilities | 3.4% |
| Short-Term Investments | 2.4% |
| Other assets less liabilities | 0.5% |
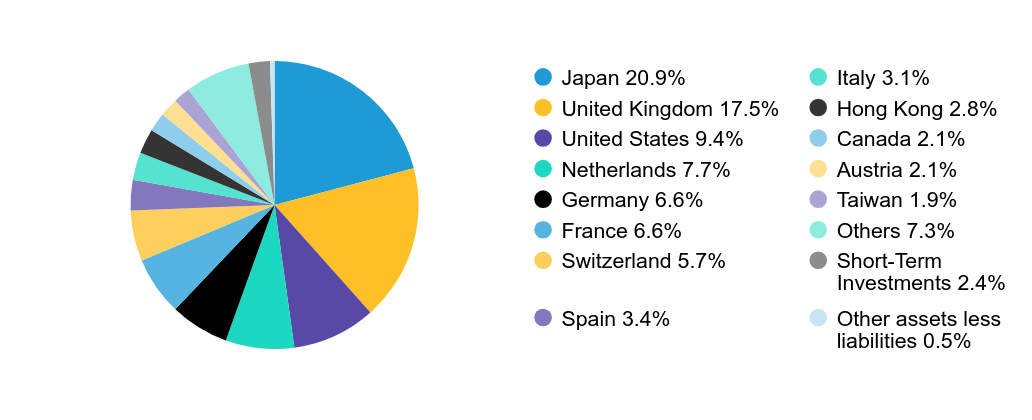
| Value | Value |
|---|
| Japan | 20.9% |
| United Kingdom | 17.5% |
| United States | 9.4% |
| Netherlands | 7.7% |
| Germany | 6.6% |
| France | 6.6% |
| Switzerland | 5.7% |
| Spain | 3.4% |
| Italy | 3.1% |
| Hong Kong | 2.8% |
| Canada | 2.1% |
| Austria | 2.1% |
| Taiwan | 1.9% |
| Others | 7.3% |
| Short-Term Investments | 2.4% |
| Other assets less liabilities | 0.5% |
Availability of Additional Information
You can find additional information on the Fund’s website at https://www.abfunds.com/link/AB/ABIYX-A, including the Fund's:
• Prospectus
• Financial information
• Fund holdings
• Proxy voting information
You can also request this information by contacting us at (800) 227 4618.
Shareholders who have consented to receive a single annual or semi-annual shareholder report at a shared address may revoke this consent by contacting us at (800) 227 4618.
Information Regarding the Review and Approval of the Fund’s Advisory Agreement
Information regarding the Fund’s Board of Directors’/Trustees’ review of the advisory agreement is available on the Fund’s website https://www.abfunds.com/link/AB/ABIYX-A. You can request this information, free of charge, by contacting us at (800) 227 4618 or by scanning the QR code below.
The [A/B] logo and AllianceBernstein® are registered trademarks used by permission of the owner, AllianceBernstein L.P.
Please scan QR code for
Fund Information
Please scan QR code for
Fund Information
AB International Value Fund
Annual Shareholder Report
This annual shareholder report contains important information about the AB International Value Fund (the “Fund”) for the period of December 1, 2023 to November 30, 2024. You can find additional information about the Fund at https://www.abfunds.com/link/AB/ABIAX-A. You can also request this information by contacting us at (800) 227 4618.
What were the Fund costs for the last year?
(Based on a hypothetical $10,000 investment)
| Class Name | Cost of a $10,000 investment | Costs paid as a percentage of a $10,000 investment |
|---|
| Class A | $131 | 1.23% |
|---|
How did the Fund perform last year? What affected the Fund’s performance?
During the 12-month period ended November 30, 2024, all share classes of the Fund, except Class C, outperformed the Morgan Stanley Capital International Europe, Australasia and the Far East (“MSCI EAFE”) Index (net) (the “benchmark”), before sales charges. Overall security selection contributed to returns, while sector allocation detracted. Security selection within industrials and energy contributed the most, offsetting losses from selection within consumer discretionary and utilities. In terms of sector allocation, an underweight to financials and an overweight to energy detracted and offset gains from an overweight to communication services and underweight to health care. Overall country selection (a result of bottom-up security analysis combined with fundamental research) detracted, as losses from an overweight to Portugal and an underweight to Australia offset gains from overweights to Taiwan and the US.
During the 12-month period, the Fund used derivatives in the form of currency forwards for hedging purposes, which detracted from absolute returns.
Top contributors to performance:
Top detractors from performance:
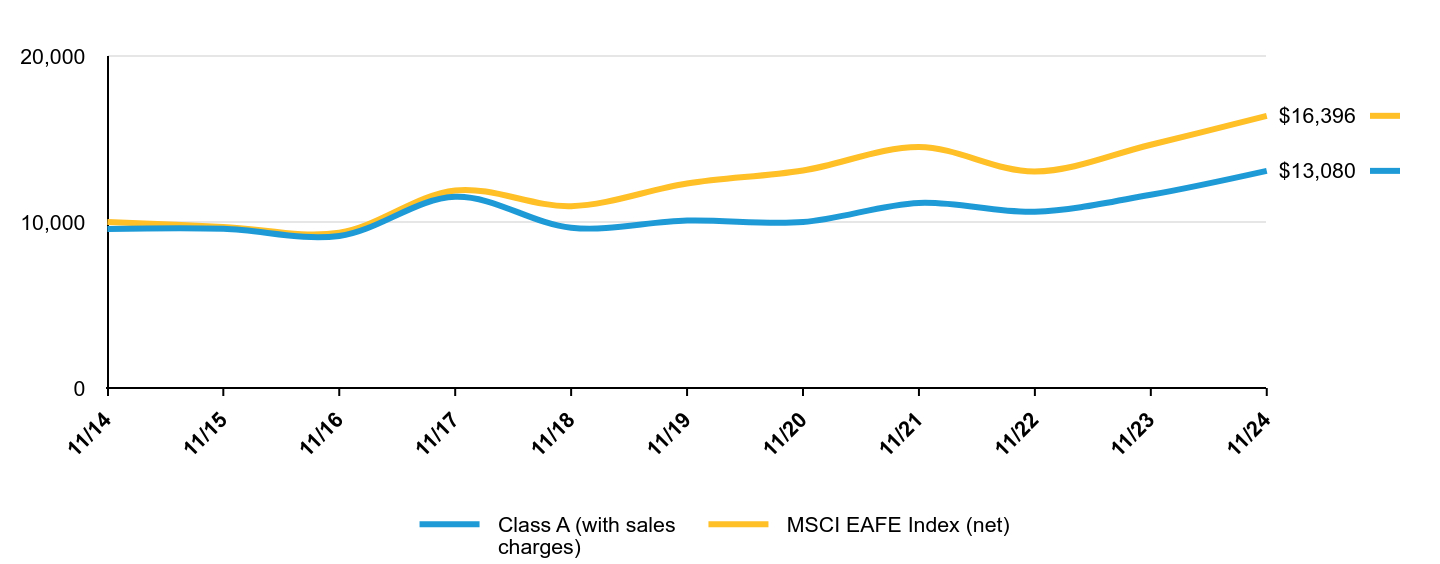
The following graph shows the performance of hypothetical $10,000 investments in the Fund and a broad-based securities market index over the most recently completed 10 fiscal years of the Fund, or since inception, if shorter. The Fund's performance reflects applicable sales charges and assumes the reinvestment of dividends.
| Class A (with sales charges) | MSCI EAFE Index (net) |
|---|
| 11/14 | $9,575 | $10,000 |
|---|
| 11/15 | $9,588 | $9,706 |
|---|
| 11/16 | $9,158 | $9,351 |
|---|
| 11/17 | $11,518 | $11,901 |
|---|
| 11/18 | $9,653 | $10,956 |
|---|
| 11/19 | $10,084 | $12,319 |
|---|
| 11/20 | $9,998 | $13,104 |
|---|
| 11/21 | $11,149 | $14,515 |
|---|
| 11/22 | $10,616 | $13,042 |
|---|
| 11/23 | $11,639 | $14,655 |
|---|
| 11/24 | $13,080 | $16,396 |
|---|
Average Annual Total Returns
| AATR | 1 Year | 5 Years | 10 Years |
|---|
| Class A (without sales charges) | 12.38% | 5.34% | 3.17% |
|---|
| Class A (with sales charges) | 7.62% | 4.43% | 2.72% |
|---|
| MSCI EAFE Index (net) | 11.88% | 5.89% | 5.07% |
|---|
The Fund’s past performance is not a good predictor of the Fund’s future performance.
The graph and table do not reflect the deduction of taxes that a shareholder would pay on Fund distributions or the redemption or sale of Fund shares.
Visit https://www.abfunds.com/link/AB/ABIAX-A for the most recent performance information.
| Net Assets | $97,727,304 |
|---|
| # of Portfolio Holdings | 59 |
|---|
| Portfolio Turnover Rate | 46% |
|---|
| Total Advisory Fees Paid | $254,684 |
|---|
Graphical Representation of Holdings
| Company | U.S. $ Value | % of Net Assets |
|---|
| Roche Holding AG | $3,450,290 | 3.5% |
| Shell PLC | $3,345,851 | 3.4% |
| NatWest Group PLC | $2,823,063 | 2.9% |
| Resona Holdings, Inc. | $2,731,538 | 2.8% |
| Sony Group Corp. | $2,537,647 | 2.6% |
| Melrose Industries PLC | $2,510,879 | 2.6% |
| Deutsche Telekom AG (Reg) | $2,506,776 | 2.6% |
| Koninklijke Ahold Delhaize NV | $2,446,495 | 2.5% |
| Airbus SE | $2,314,575 | 2.4% |
| ResMed, Inc. | $2,278,548 | 2.3% |
| Total | $26,945,662 | 27.6% |
| Value | Value |
|---|
| Industrials | 18.3% |
| Financials | 13.0% |
| Consumer Discretionary | 11.5% |
| Consumer Staples | 11.3% |
| Health Care | 10.1% |
| Materials | 8.8% |
| Energy | 8.5% |
| Information Technology | 6.7% |
| Communication Services | 5.5% |
| Utilities | 3.4% |
| Short-Term Investments | 2.4% |
| Other assets less liabilities | 0.5% |
| Value | Value |
|---|
| Japan | 20.9% |
| United Kingdom | 17.5% |
| United States | 9.4% |
| Netherlands | 7.7% |
| Germany | 6.6% |
| France | 6.6% |
| Switzerland | 5.7% |
| Spain | 3.4% |
| Italy | 3.1% |
| Hong Kong | 2.8% |
| Canada | 2.1% |
| Austria | 2.1% |
| Taiwan | 1.9% |
| Others | 7.3% |
| Short-Term Investments | 2.4% |
| Other assets less liabilities | 0.5% |
Availability of Additional Information
You can find additional information on the Fund’s website at https://www.abfunds.com/link/AB/ABIAX-A, including the Fund's:
• Prospectus
• Financial information
• Fund holdings
• Proxy voting information
You can also request this information by contacting us at (800) 227 4618.
Shareholders who have consented to receive a single annual or semi-annual shareholder report at a shared address may revoke this consent by contacting us at (800) 227 4618.
Information Regarding the Review and Approval of the Fund’s Advisory Agreement
Information regarding the Fund’s Board of Directors’/Trustees’ review of the advisory agreement is available on the Fund’s website https://www.abfunds.com/link/AB/ABIAX-A. You can request this information, free of charge, by contacting us at (800) 227 4618 or by scanning the QR code below.
The [A/B] logo and AllianceBernstein® are registered trademarks used by permission of the owner, AllianceBernstein L.P.
Please scan QR code for
Fund Information
Please scan QR code for
Fund Information
AB International Value Fund
Annual Shareholder Report
This annual shareholder report contains important information about the AB International Value Fund (the “Fund”) for the period of December 1, 2023 to November 30, 2024. You can find additional information about the Fund at https://www.abfunds.com/link/AB/ABICX-A. You can also request this information by contacting us at (800) 227 4618.
What were the Fund costs for the last year?
(Based on a hypothetical $10,000 investment)
| Class Name | Cost of a $10,000 investment | Costs paid as a percentage of a $10,000 investment |
|---|
| Class C | $209 | 1.98% |
|---|
How did the Fund perform last year? What affected the Fund’s performance?
During the 12-month period ended November 30, 2024, all share classes of the Fund, except Class C, outperformed the Morgan Stanley Capital International Europe, Australasia and the Far East (“MSCI EAFE”) Index (net) (the “benchmark”), before sales charges. Overall security selection contributed to returns, while sector allocation detracted. Security selection within industrials and energy contributed the most, offsetting losses from selection within consumer discretionary and utilities. In terms of sector allocation, an underweight to financials and an overweight to energy detracted and offset gains from an overweight to communication services and underweight to health care. Overall country selection (a result of bottom-up security analysis combined with fundamental research) detracted, as losses from an overweight to Portugal and an underweight to Australia offset gains from overweights to Taiwan and the US.
During the 12-month period, the Fund used derivatives in the form of currency forwards for hedging purposes, which detracted from absolute returns.
Top contributors to performance:
Top detractors from performance:
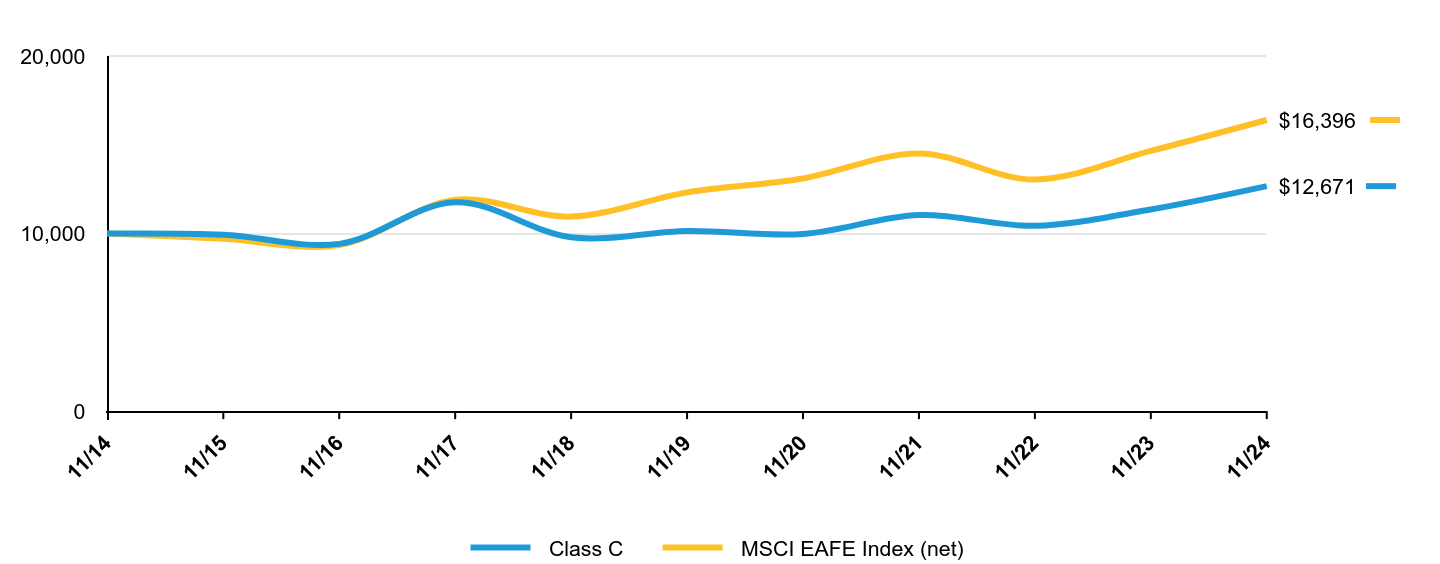
The following graph shows the performance of hypothetical $10,000 investments in the Fund and a broad-based securities market index over the most recently completed 10 fiscal years of the Fund, or since inception, if shorter. The Fund's performance reflects applicable sales charges and assumes the reinvestment of dividends.
| Class C | MSCI EAFE Index (net) |
|---|
| 11/14 | $10,000 | $10,000 |
|---|
| 11/15 | $9,937 | $9,706 |
|---|
| 11/16 | $9,419 | $9,351 |
|---|
| 11/17 | $11,763 | $11,901 |
|---|
| 11/18 | $9,791 | $10,956 |
|---|
| 11/19 | $10,149 | $12,319 |
|---|
| 11/20 | $9,979 | $13,104 |
|---|
| 11/21 | $11,046 | $14,515 |
|---|
| 11/22 | $10,438 | $13,042 |
|---|
| 11/23 | $11,358 | $14,655 |
|---|
| 11/24 | $12,671 | $16,396 |
|---|
Average Annual Total Returns
| AATR | 1 Year | 5 Years | 10 Years |
|---|
| Class C (without sales charges) | 11.55% | 4.54% | 2.40% |
|---|
| Class C (with sales charges) | 10.55% | 4.54% | 2.40% |
|---|
| MSCI EAFE Index (net) | 11.88% | 5.89% | 5.07% |
|---|
The Fund’s past performance is not a good predictor of the Fund’s future performance.
The graph and table do not reflect the deduction of taxes that a shareholder would pay on Fund distributions or the redemption or sale of Fund shares.
Visit https://www.abfunds.com/link/AB/ABICX-A for the most recent performance information.
| Net Assets | $97,727,304 |
|---|
| # of Portfolio Holdings | 59 |
|---|
| Portfolio Turnover Rate | 46% |
|---|
| Total Advisory Fees Paid | $254,684 |
|---|
Graphical Representation of Holdings
| Company | U.S. $ Value | % of Net Assets |
|---|
| Roche Holding AG | $3,450,290 | 3.5% |
| Shell PLC | $3,345,851 | 3.4% |
| NatWest Group PLC | $2,823,063 | 2.9% |
| Resona Holdings, Inc. | $2,731,538 | 2.8% |
| Sony Group Corp. | $2,537,647 | 2.6% |
| Melrose Industries PLC | $2,510,879 | 2.6% |
| Deutsche Telekom AG (Reg) | $2,506,776 | 2.6% |
| Koninklijke Ahold Delhaize NV | $2,446,495 | 2.5% |
| Airbus SE | $2,314,575 | 2.4% |
| ResMed, Inc. | $2,278,548 | 2.3% |
| Total | $26,945,662 | 27.6% |
| Value | Value |
|---|
| Industrials | 18.3% |
| Financials | 13.0% |
| Consumer Discretionary | 11.5% |
| Consumer Staples | 11.3% |
| Health Care | 10.1% |
| Materials | 8.8% |
| Energy | 8.5% |
| Information Technology | 6.7% |
| Communication Services | 5.5% |
| Utilities | 3.4% |
| Short-Term Investments | 2.4% |
| Other assets less liabilities | 0.5% |
| Value | Value |
|---|
| Japan | 20.9% |
| United Kingdom | 17.5% |
| United States | 9.4% |
| Netherlands | 7.7% |
| Germany | 6.6% |
| France | 6.6% |
| Switzerland | 5.7% |
| Spain | 3.4% |
| Italy | 3.1% |
| Hong Kong | 2.8% |
| Canada | 2.1% |
| Austria | 2.1% |
| Taiwan | 1.9% |
| Others | 7.3% |
| Short-Term Investments | 2.4% |
| Other assets less liabilities | 0.5% |
Availability of Additional Information
You can find additional information on the Fund’s website at https://www.abfunds.com/link/AB/ABICX-A, including the Fund's:
• Prospectus
• Financial information
• Fund holdings
• Proxy voting information
You can also request this information by contacting us at (800) 227 4618.
Shareholders who have consented to receive a single annual or semi-annual shareholder report at a shared address may revoke this consent by contacting us at (800) 227 4618.
Information Regarding the Review and Approval of the Fund’s Advisory Agreement
Information regarding the Fund’s Board of Directors’/Trustees’ review of the advisory agreement is available on the Fund’s website https://www.abfunds.com/link/AB/ABICX-A. You can request this information, free of charge, by contacting us at (800) 227 4618 or by scanning the QR code below.
The [A/B] logo and AllianceBernstein® are registered trademarks used by permission of the owner, AllianceBernstein L.P.
Please scan QR code for
Fund Information
Please scan QR code for
Fund Information
AB International Value Fund
Annual Shareholder Report
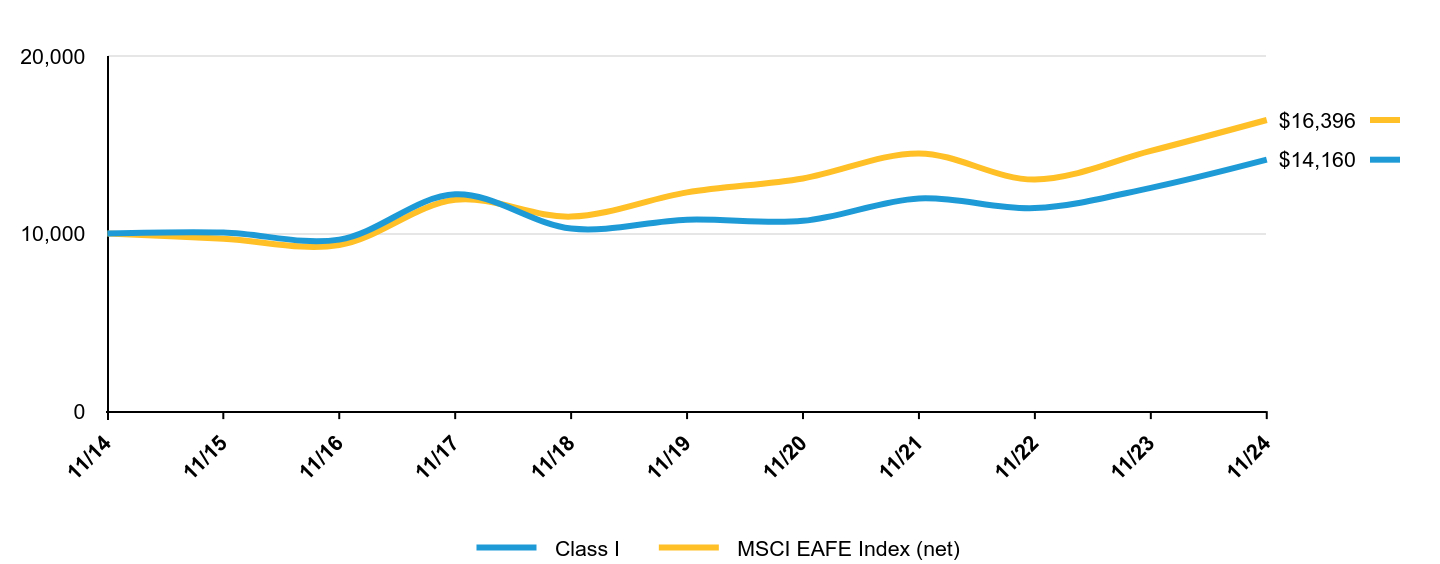
This annual shareholder report contains important information about the AB International Value Fund (the “Fund”) for the period of December 1, 2023 to November 30, 2024. You can find additional information about the Fund at https://www.abfunds.com/link/AB/AIVIX-A. You can also request this information by contacting us at (800) 227 4618.
What were the Fund costs for the last year?
(Based on a hypothetical $10,000 investment)
| Class Name | Cost of a $10,000 investment | Costs paid as a percentage of a $10,000 investment |
|---|
| Class I | $105 | 0.99% |
|---|
How did the Fund perform last year? What affected the Fund’s performance?
During the 12-month period ended November 30, 2024, all share classes of the Fund, except Class C, outperformed the Morgan Stanley Capital International Europe, Australasia and the Far East (“MSCI EAFE”) Index (net) (the “benchmark”), before sales charges. Overall security selection contributed to returns, while sector allocation detracted. Security selection within industrials and energy contributed the most, offsetting losses from selection within consumer discretionary and utilities. In terms of sector allocation, an underweight to financials and an overweight to energy detracted and offset gains from an overweight to communication services and underweight to health care. Overall country selection (a result of bottom-up security analysis combined with fundamental research) detracted, as losses from an overweight to Portugal and an underweight to Australia offset gains from overweights to Taiwan and the US.
During the 12-month period, the Fund used derivatives in the form of currency forwards for hedging purposes, which detracted from absolute returns.
Top contributors to performance:
Top detractors from performance:
The following graph shows the performance of hypothetical $10,000 investments in the Fund and a broad-based securities market index over the most recently completed 10 fiscal years of the Fund, or since inception, if shorter. The Fund's performance reflects applicable sales charges and assumes the reinvestment of dividends.
| Class I | MSCI EAFE Index (net) |
|---|
| 11/14 | $10,000 | $10,000 |
|---|
| 11/15 | $10,057 | $9,706 |
|---|
| 11/16 | $9,657 | $9,351 |
|---|
| 11/17 | $12,208 | $11,901 |
|---|
| 11/18 | $10,282 | $10,956 |
|---|
| 11/19 | $10,784 | $12,319 |
|---|
| 11/20 | $10,715 | $13,104 |
|---|
| 11/21 | $11,977 | $14,515 |
|---|
| 11/22 | $11,434 | $13,042 |
|---|
| 11/23 | $12,574 | $14,655 |
|---|
| 11/24 | $14,160 | $16,396 |
|---|
Average Annual Total Returns
| AATR | 1 Year | 5 Years | 10 Years |
|---|
| Class I | 12.62% | 5.60% | 3.54% |
|---|
| MSCI EAFE Index (net) | 11.88% | 5.89% | 5.07% |
|---|
The Fund’s past performance is not a good predictor of the Fund’s future performance.
The graph and table do not reflect the deduction of taxes that a shareholder would pay on Fund distributions or the redemption or sale of Fund shares.
Visit https://www.abfunds.com/link/AB/AIVIX-A for the most recent performance information.
| Net Assets | $97,727,304 |
|---|
| # of Portfolio Holdings | 59 |
|---|
| Portfolio Turnover Rate | 46% |
|---|
| Total Advisory Fees Paid | $254,684 |
|---|
Graphical Representation of Holdings
| Company | U.S. $ Value | % of Net Assets |
|---|
| Roche Holding AG | $3,450,290 | 3.5% |
| Shell PLC | $3,345,851 | 3.4% |
| NatWest Group PLC | $2,823,063 | 2.9% |
| Resona Holdings, Inc. | $2,731,538 | 2.8% |
| Sony Group Corp. | $2,537,647 | 2.6% |
| Melrose Industries PLC | $2,510,879 | 2.6% |
| Deutsche Telekom AG (Reg) | $2,506,776 | 2.6% |
| Koninklijke Ahold Delhaize NV | $2,446,495 | 2.5% |
| Airbus SE | $2,314,575 | 2.4% |
| ResMed, Inc. | $2,278,548 | 2.3% |
| Total | $26,945,662 | 27.6% |
| Value | Value |
|---|
| Industrials | 18.3% |
| Financials | 13.0% |
| Consumer Discretionary | 11.5% |
| Consumer Staples | 11.3% |
| Health Care | 10.1% |
| Materials | 8.8% |
| Energy | 8.5% |
| Information Technology | 6.7% |
| Communication Services | 5.5% |
| Utilities | 3.4% |
| Short-Term Investments | 2.4% |
| Other assets less liabilities | 0.5% |
| Value | Value |
|---|
| Japan | 20.9% |
| United Kingdom | 17.5% |
| United States | 9.4% |
| Netherlands | 7.7% |
| Germany | 6.6% |
| France | 6.6% |
| Switzerland | 5.7% |
| Spain | 3.4% |
| Italy | 3.1% |
| Hong Kong | 2.8% |
| Canada | 2.1% |
| Austria | 2.1% |
| Taiwan | 1.9% |
| Others | 7.3% |
| Short-Term Investments | 2.4% |
| Other assets less liabilities | 0.5% |
Availability of Additional Information
You can find additional information on the Fund’s website at https://www.abfunds.com/link/AB/AIVIX-A, including the Fund's:
• Prospectus
• Financial information
• Fund holdings
• Proxy voting information
You can also request this information by contacting us at (800) 227 4618.
Shareholders who have consented to receive a single annual or semi-annual shareholder report at a shared address may revoke this consent by contacting us at (800) 227 4618.
Information Regarding the Review and Approval of the Fund’s Advisory Agreement
Information regarding the Fund’s Board of Directors’/Trustees’ review of the advisory agreement is available on the Fund’s website https://www.abfunds.com/link/AB/AIVIX-A. You can request this information, free of charge, by contacting us at (800) 227 4618 or by scanning the QR code below.
The [A/B] logo and AllianceBernstein® are registered trademarks used by permission of the owner, AllianceBernstein L.P.
Please scan QR code for
Fund Information
ITEM 2. CODE OF ETHICS.
(a) The registrant has adopted a code of ethics that applies to its principal executive officer, principal financial officer and principal accounting officer. A copy of the registrant’s code of ethics is filed herewith as Exhibit 19(a)(1).
(b) During the period covered by this report, no material amendments were made to the provisions of the code of ethics adopted in 2(a) above.
(c) During the period covered by this report, no implicit or explicit waivers to the provisions of the code of ethics adopted in 2(a) above were granted.
ITEM 3. AUDIT COMMITTEE FINANCIAL EXPERT.
The registrant’s Board of Directors has determined that independent directors Garry L. Moody, Marshall C. Turner, Jr., Jorge A. Bermudez and Carol C. McMullen qualify as audit committee financial experts.
ITEM 4. PRINCIPAL ACCOUNTANT FEES AND SERVICES.
(a) - (c) The following table sets forth the aggregate fees billed by the independent registered public accounting firm Ernst & Young LLP, for the Fund’s last two fiscal years, for professional services rendered for: (i) the audit of the Fund’s annual financial statements included in the Fund’s annual report to stockholders; (ii) assurance and related services that are reasonably related to the performance of the audit of the Fund’s financial statements and are not reported under (i), which include advice and education related to accounting and auditing issues, quarterly press release review (for those Funds that issue quarterly press releases), and preferred stock maintenance testing (for those Funds that issue preferred stock); and (iii) tax compliance, tax advice and tax return preparation.
| | | | | | | | | | | | | | | | |
| | | | | | Audit Fees | | | Audit-Related
Fees | | | Tax Fees | |
AB International Value Fund | | | 2023 | | | $ | 45,552 | | | $ | — | | | $ | 44,851 | |
| | | 2024 | | | $ | 45,552 | | | $ | — | | | $ | 24,282 | |
AB Discovery Value Fund | | | 2023 | | | $ | 40,453 | | | $ | — | | | $ | 21,088 | |
| | | 2024 | | | $ | 40,453 | | | $ | — | | | $ | 22,480 | |
AB Large Cap Value Fund | | | 2023 | | | $ | 35,524 | | | $ | — | | | $ | 19,935 | |
| | | 2024 | | | $ | 35,524 | | | $ | — | | | $ | 19,943 | |
(d) Not applicable.
(e) (1) Beginning with audit and non-audit service contracts entered into on or after May 6, 2003, the Fund’s Audit Committee policies and procedures require the pre-approval of all audit and non-audit services provided to the Fund by the Fund’s independent registered public accounting firm. The Fund’s Audit Committee policies and procedures also require pre-approval of all audit and non-audit services provided to the Adviser and Service Affiliates to the extent that these services are directly related to the operations or financial reporting of the Fund.
(e) (2) No percentage of services addressed by (b) and (c) of this Item 4 were approved pursuant to the waiver provision of paragraph (c)(7)(i)(C) of Rule 2-01 of Regulation S-X. No amounts are reported for Item 4 (d).
(f) Not applicable.
(g) The following table sets forth the aggregate non-audit services provided to the Fund, the Fund’s Adviser and entities that control, are controlled by or under common control with the Adviser that provide ongoing services to the Fund: (“Service Affiliates”):
| | | | | | | | | | | | |
| | | | | | All Fees for
Non-Audit Services
Provided to the
Portfolio, the Adviser
and Service Affiliates | | | Total Amount of
Foregoing Column Pre-
approved by the Audit
Committee
(Portion Comprised of
Audit Related Fees)
(Portion Comprised of
Tax Fees) | |
AB International Value Fund | | | 2023 | | | $ | 2,156,314 | | | $ | 44,851 | |
| | | | | | | | | | $ | — | |
| | | | | | | | | | $ | (44,851 | ) |
| | | 2024 | | | $ | 1,740,740 | | | $ | 24,282 | |
| | | | | | | | | | $ | — | |
| | | | | | | | | | $ | (24,282 | ) |
AB Discovery Value Fund | | | 2023 | | | $ | 2,132,551 | | | $ | 21,088 | |
| | | | | | | | | | $ | — | |
| | | | | | | | | | $ | (21,088 | ) |
| | | 2024 | | | $ | 1,738,938 | | | $ | 22,480 | |
| | | | | | | | | | $ | — | |
| | | | | | | | | | $ | (22,480 | ) |
AB Large Cap Value Fund | | | 2023 | | | $ | 2,131,398 | | | $ | 19,935 | |
| | | | | | | | | | $ | — | |
| | | | | | | | | | $ | (19,935 | ) |
| | | 2024 | | | $ | 1,736,401 | | | $ | 19,943 | |
| | | | | | | | | | $ | — | |
| | | | | | | | | | $ | (19,943 | ) |
(h) The Audit Committee of the Fund has considered whether the provision of any non-audit services not pre-approved by the Audit Committee provided by the Fund’s independent registered public accounting firm to the Adviser and Service Affiliates is compatible with maintaining the auditor’s independence.
(i) Not applicable.
(j) Not applicable.
ITEM 5. AUDIT COMMITTEE OF LISTED REGISTRANTS.
Not applicable to the registrant.
ITEM 6. INVESTMENTS.
Please see Schedule of Investments contained in the Report to Shareholders included under Item 1 of this Form N-CSR.
ITEM 7. FINANCIAL STATEMENTS AND FINANCIAL HIGHLIGHTS FOR OPEN-END MANAGEMENT INVESTMENT COMPANIES.
Not applicable to the registrant.
NOV 11.30.24

ANNUAL FINANCIAL STATEMENTS AND ADDITIONAL INFORMATION
AB DISCOVERY VALUE FUND

| | |
| |
| Investment Products Offered | | • Are Not FDIC Insured • May Lose Value • Are Not Bank Guaranteed |
Investors should consider the investment objectives, risks, charges and expenses of the Fund carefully before investing. For copies of our prospectus or summary prospectus, which contain this and other information, visit us online at www.abfunds.com or contact your AB representative. Please read the prospectus and/or summary prospectus carefully before investing.
This shareholder report must be preceded or accompanied by the Fund’s prospectus for individuals who are not current shareholders of the Fund.
You may obtain a description of the Fund’s proxy voting policies and procedures, and information regarding how the Fund voted proxies relating to portfolio securities during the most recent 12-month period ended June 30, without charge. Simply visit AB’s website at www.abfunds.com, or go to the Securities and Exchange Commission’s (the “Commission”) website at www.sec.gov, or call AB at (800) 227 4618.
The Fund files its complete schedule of portfolio holdings with the Commission for the first and third quarters of each fiscal year as an exhibit to its reports on Form N-PORT. The Fund’s Form N-PORT reports are available on the Commission’s website at www.sec.gov. AB publishes full portfolio holdings for the Fund monthly at www.abfunds.com.
AllianceBernstein Investments, Inc. (ABI) is the distributor of the AB family of mutual funds. ABI is a member of FINRA and is an affiliate of AllianceBernstein L.P., the Adviser of the funds.
The [A/B] logo and AllianceBernstein® are registered trademarks used by permission of the owner, AllianceBernstein L.P.
PORTFOLIO OF INVESTMENTS
November 30, 2024
| | | | | | | | |
| Company | | Shares | | | U.S. $ Value | |
| |
COMMON STOCKS – 99.4% | | | | | | | | |
Industrials – 21.4% | | | | | | | | |
Air Freight & Logistics – 1.5% | | | | | | | | |
CH Robinson Worldwide, Inc. | | | 379,940 | | | $ | 40,114,065 | |
| | | | | | | | |
| | |
Building Products – 0.8% | | | | | | | | |
Builders FirstSource, Inc.(a) | | | 107,061 | | | | 19,963,665 | |
| | | | | | | | |
| | |
Commercial Services & Supplies – 2.2% | | | | | | | | |
ABM Industries, Inc. | | | 540,452 | | | | 30,897,641 | |
MillerKnoll, Inc.(b) | | | 1,130,287 | | | | 28,415,415 | |
| | | | | | | | |
| | | | | | | 59,313,056 | |
| | | | | | | | |
Construction & Engineering – 3.9% | | | | | | | | |
Fluor Corp.(a) | | | 605,488 | | | | 33,986,042 | |
MasTec, Inc.(a) | | | 250,051 | | | | 36,022,347 | |
WillScot Holdings Corp.(a) | | | 846,260 | | | | 32,360,982 | |
| | | | | | | | |
| | | | | | | 102,369,371 | |
| | | | | | | | |
Electrical Equipment – 1.3% | | | | | | | | |
Regal Rexnord Corp.(b) | | | 192,093 | | | | 33,176,382 | |
| | | | | | | | |
| | |
Ground Transportation – 1.3% | | | | | | | | |
ArcBest Corp. | | | 304,035 | | | | 35,049,155 | |
| | | | | | | | |
| | |
Machinery – 6.7% | | | | | | | | |
Gates Industrial Corp. PLC(a)(b) | | | 1,483,320 | | | | 32,870,371 | |
John Bean Technologies Corp.(b) | | | 256,952 | | | | 32,381,091 | |
Middleby Corp. (The)(a)(b) | | | 255,059 | | | | 36,572,910 | |
Oshkosh Corp. | | | 288,556 | | | | 32,782,847 | |
Pentair PLC | | | 383,730 | | | | 41,822,733 | |
| | | | | | | | |
| | | | | | | 176,429,952 | |
| | | | | | | | |
Professional Services – 2.0% | | | | | | | | |
Robert Half, Inc. | | | 446,723 | | | | 33,330,003 | |
WNS Holdings Ltd.(a) | | | 384,325 | | | | 20,841,945 | |
| | | | | | | | |
| | | | | | | 54,171,948 | |
| | | | | | | | |
Trading Companies & Distributors – 1.7% | | | | | | | | |
Core & Main, Inc. – Class A(a) | | | 560,070 | | | | 27,191,398 | |
Herc Holdings, Inc. | | | 78,240 | | | | 18,151,680 | |
| | | | | | | | |
| | | | | | | 45,343,078 | |
| | | | | | | | |
| | | | | | | 565,930,672 | |
| | | | | | | | |
Financials – 20.5% | | | | | | | | |
Banks – 11.3% | | | | | | | | |
BankUnited, Inc. | | | 691,417 | | | | 29,087,913 | |
Comerica, Inc. | | | 493,299 | | | | 35,640,853 | |
First BanCorp./Puerto Rico | | | 1,339,777 | | | | 27,706,588 | |
First Citizens BancShares, Inc./NC – Class A | | | 16,856 | | | | 38,684,520 | |
| | |
| |
| abfunds.com | | AB DISCOVERY VALUE FUND | 1 |
PORTFOLIO OF INVESTMENTS (continued)
| | | | | | | | |
| Company | | Shares | | | U.S. $ Value | |
| |
First Hawaiian, Inc.(b) | | | 1,247,919 | | | $ | 34,455,044 | |
Texas Capital Bancshares, Inc.(a) | | | 315,617 | | | | 27,916,324 | |
Webster Financial Corp. | | | 515,651 | | | | 31,856,919 | |
Wintrust Financial Corp. | | | 288,235 | | | | 39,779,312 | |
Zions Bancorp NA | | | 548,737 | | | | 33,209,563 | |
| | | | | | | | |
| | | | | | | 298,337,036 | |
| | | | | | | | |
Capital Markets – 3.7% | | | | | | | | |
Cboe Global Markets, Inc. | | | 137,926 | | | | 29,771,327 | |
Invesco Ltd. | | | 1,878,642 | | | | 33,984,634 | |
Stifel Financial Corp. | | | 292,441 | | | | 33,864,668 | |
| | | | | | | | |
| | | | | | | 97,620,629 | |
| | | | | | | | |
Financial Services – 2.4% | | | | | | | | |
NCR Atleos Corp.(a) | | | 1,082,579 | | | | 35,519,417 | |
Walker & Dunlop, Inc. | | | 249,773 | | | | 27,519,989 | |
| | | | | | | | |
| | | | | | | 63,039,406 | |
| | | | | | | | |
Insurance – 3.1% | | | | | | | | |
American Financial Group, Inc./OH | | | 249,600 | | | | 36,656,256 | |
Hanover Insurance Group, Inc. (The) | | | 184,839 | | | | 30,500,283 | |
Kemper Corp. | | | 213,573 | | | | 15,268,334 | |
| | | | | | | | |
| | | | | | | 82,424,873 | |
| | | | | | | | |
| | | | | | | 541,421,944 | |
| | | | | | | | |
Consumer Discretionary – 14.9% | | | | | | | | |
Automobile Components – 2.4% | | | | | | | | |
Adient PLC(a) | | | 1,321,215 | | | | 25,406,964 | |
BorgWarner, Inc. | | | 1,075,655 | | | | 36,916,480 | |
| | | | | | | | |
| | | | | | | 62,323,444 | |
| | | | | | | | |
Diversified Consumer Services – 1.2% | | | | | | | | |
ADT, Inc. | | | 4,145,387 | | | | 31,587,849 | |
| | | | | | | | |
| | |
Hotels, Restaurants & Leisure – 1.4% | | | | | | | | |
Dine Brands Global, Inc. | | | 366,543 | | | | 13,166,224 | |
Viking Holdings Ltd.(a) | | | 531,258 | | | | 24,676,934 | |
| | | | | | | | |
| | | | | | | 37,843,158 | |
| | | | | | | | |
Household Durables – 1.1% | | | | | | | | |
Taylor Morrison Home Corp.(a) | | | 391,290 | | | | 28,904,592 | |
| | | | | | | | |
| | |
Leisure Products – 1.1% | | | | | | | | |
Brunswick Corp./DE(b) | | | 379,368 | | | | 30,542,918 | |
| | | | | | | | |
| | |
Specialty Retail – 4.1% | | | | | | | | |
AutoNation, Inc.(a) | | | 193,070 | | | | 34,538,292 | |
Bath & Body Works, Inc. | | | 1,020,526 | | | | 36,983,862 | |
Group 1 Automotive, Inc. | | | 84,318 | | | | 35,902,605 | |
| | | | | | | | |
| | | | | | | 107,424,759 | |
| | | | | | | | |
Textiles, Apparel & Luxury Goods – 3.6% | | | | | | | | |
Crocs, Inc.(a) | | | 226,976 | | | | 23,968,666 | |
| | |
| |
2 | AB DISCOVERY VALUE FUND | | abfunds.com |
PORTFOLIO OF INVESTMENTS (continued)
| | | | | | | | |
| Company | | Shares | | | U.S. $ Value | |
| |
PVH Corp.(b) | | | 230,803 | | | $ | 25,012,121 | |
Tapestry, Inc.(b) | | | 736,726 | | | | 45,883,295 | |
| | | | | | | | |
| | | | | | | 94,864,082 | |
| | | | | | | | |
| | | | | | | 393,490,802 | |
| | | | | | | | |
Information Technology – 11.6% | | | | | | | | |
Communications Equipment – 3.5% | | | | | | | | |
Calix, Inc.(a) | | | 539,604 | | | | 17,553,318 | |
F5, Inc.(a) | | | 162,020 | | | | 40,561,707 | |
Lumentum Holdings, Inc.(a) | | | 385,548 | | | | 33,531,110 | |
| | | | | | | | |
| | | | | | | 91,646,135 | |
| | | | | | | | |
Electronic Equipment, Instruments & Components – 3.1% | | | | | | | | |
Avnet, Inc. | | | 471,900 | | | | 25,817,649 | |
Belden, Inc. | | | 183,528 | | | | 22,463,827 | |
TD SYNNEX Corp. | | | 294,199 | | | | 35,006,739 | |
| | | | | | | | |
| | | | | | | 83,288,215 | |
| | | | | | | | |
Semiconductors & Semiconductor Equipment – 2.6% | | | | | | | | |
Amkor Technology, Inc. | | | 979,244 | | | | 25,891,211 | |
FormFactor, Inc.(a) | | | 639,146 | | | | 25,604,189 | |
Synaptics, Inc.(a) | | | 208,742 | | | | 16,749,458 | |
| | | | | | | | |
| | | | | | | 68,244,858 | |
| | | | | | | | |
Software – 2.4% | | | | | | | | |
ACI Worldwide, Inc.(a) | | | 419,049 | | | | 23,810,364 | |
CommVault Systems, Inc.(a) | | | 91,411 | | | | 15,685,214 | |
Gen Digital, Inc. | | | 746,834 | | | | 23,039,829 | |
| | | | | | | | |
| | | | | | | 62,535,407 | |
| | | | | | | | |
| | | | | | | 305,714,615 | |
| | | | | | | | |
Real Estate – 7.6% | | | | | | | | |
Diversified REITs – 0.6% | | | | | | | | |
Broadstone Net Lease, Inc. – Class A | | | 866,356 | | | | 15,169,894 | |
| | | | | | | | |
| | |
Hotel & Resort REITs – 0.9% | | | | | | | | |
Ryman Hospitality Properties, Inc. | | | 211,507 | | | | 24,797,081 | |
| | | | | | | | |
| | |
Industrial REITs – 1.8% | | | | | | | | |
First Industrial Realty Trust, Inc. | | | 374,609 | | | | 20,022,851 | |
STAG Industrial, Inc. | | | 732,166 | | | | 26,936,387 | |
| | | | | | | | |
| | | | | | | 46,959,238 | |
| | | | | | | | |
Office REITs – 0.8% | | | | | | | | |
COPT Defense Properties | | | 632,476 | | | | 20,840,084 | |
| | | | | | | | |
| | |
Real Estate Management & Development – 1.6% | | | | | | | | |
Jones Lang LaSalle, Inc.(a) | | | 149,310 | | | | 41,896,386 | |
| | | | | | | | |
| | |
| |
| abfunds.com | | AB DISCOVERY VALUE FUND | 3 |
PORTFOLIO OF INVESTMENTS (continued)
| | | | | | | | |
| Company | | Shares | | | U.S. $ Value | |
| |
Residential REITs – 1.2% | | | | | | | | |
Independence Realty Trust, Inc.(b) | | | 1,442,180 | | | $ | 31,497,211 | |
| | | | | | | | |
| | |
Specialized REITs – 0.7% | | | | | | | | |
CubeSmart | | | 387,213 | | | | 19,190,276 | |
| | | | | | | | |
| | | | | | | 200,350,170 | |
| | | | | | | | |
Health Care – 7.3% | | | | | | | | |
Health Care Equipment & Supplies – 2.5% | | | | | | | | |
Avantor, Inc.(a)(b) | | | 1,123,852 | | | | 23,668,323 | |
Integra LifeSciences Holdings Corp.(a)(b) | | | 658,131 | | | | 16,176,860 | |
Teleflex, Inc. | | | 142,750 | | | | 27,529,338 | |
| | | | | | | | |
| | | | | | | 67,374,521 | |
| | | | | | | | |
Health Care Providers & Services – 2.7% | | | | | | | | |
AMN Healthcare Services, Inc.(a) | | | 325,565 | | | | 8,474,457 | |
Encompass Health Corp. | | | 398,231 | | | | 40,993,899 | |
Pediatrix Medical Group, Inc.(a) | | | 1,413,320 | | | | 21,143,267 | |
| | | | | | | | |
| | | | | | | 70,611,623 | |
| | | | | | | | |
Life Sciences Tools & Services – 2.1% | | | | | | | | |
ICON PLC(a) | | | 148,230 | | | | 31,165,357 | |
Revvity, Inc.(b) | | | 210,270 | | | | 24,420,758 | |
| | | | | | | | |
| | | | | | | 55,586,115 | |
| | | | | | | | |
| | | | | | | 193,572,259 | |
| | | | | | | | |
Energy – 5.6% | | | | | | | | |
Oil, Gas & Consumable Fuels – 5.6% | | | | | | | | |
Cameco Corp. (New York)(b) | | | 694,598 | | | | 41,293,851 | |
HF Sinclair Corp. | | | 247,741 | | | | 10,140,039 | |
Magnolia Oil & Gas Corp. – Class A(b) | | | 1,170,179 | | | | 32,460,766 | |
Matador Resources Co. | | | 524,820 | | | | 31,494,448 | |
Northern Oil and Gas, Inc.(b) | | | 741,733 | | | | 32,257,968 | |
| | | | | | | | |
| | | | | | | 147,647,072 | |
| | | | | | | | |
Materials – 3.8% | | | | | | | | |
Chemicals – 2.0% | | | | | | | | |
Avient Corp. | | | 629,138 | | | | 32,243,322 | |
Element Solutions, Inc. | | | 729,835 | | | | 20,931,668 | |
| | | | | | | | |
| | | | | | | 53,174,990 | |
| | | | | | | | |
Containers & Packaging – 1.8% | | | | | | | | |
Berry Global Group, Inc. | | | 155,098 | | | | 11,215,137 | |
Graphic Packaging Holding Co.(b) | | | 1,188,980 | | | | 35,776,408 | |
| | | | | | | | |
| | | | | | | 46,991,545 | |
| | | | | | | | |
| | | | | | | 100,166,535 | |
| | | | | | | | |
Consumer Staples – 2.5% | | | | | | | | |
Consumer Staples Distribution & Retail – 1.3% | | | | | | | | |
BJ’s Wholesale Club Holdings, Inc.(a)(b) | | | 359,440 | | | | 34,614,072 | |
| | | | | | | | |
| | |
| |
4 | AB DISCOVERY VALUE FUND | | abfunds.com |
PORTFOLIO OF INVESTMENTS (continued)
| | | | | | | | |
| Company | | Shares | | | U.S. $ Value | |
| |
Food Products – 1.2% | | | | | | | | |
Nomad Foods Ltd. | | | 1,708,531 | | | $ | 31,283,203 | |
| | | | | | | | |
| | | | | | | 65,897,275 | |
| | | | | | | | |
Utilities – 2.4% | | | | | | | | |
Electric Utilities – 2.4% | | | | | | | | |
IDACORP, Inc. | | | 310,575 | | | | 36,793,820 | |
Portland General Electric Co. | | | 559,489 | | | | 26,810,713 | |
| | | | | | | | |
| | | | | | | 63,604,533 | |
| | | | | | | | |
Communication Services – 1.8% | | | | | | | | |
Media – 1.8% | | | | | | | | |
Criteo SA (Sponsored ADR)(a) | | | 596,406 | | | | 24,321,437 | |
Nexstar Media Group, Inc.(b) | | | 145,128 | | | | 24,757,385 | |
| | | | | | | | |
| | | | | | | 49,078,822 | |
| | | | | | | | |
Total Common Stocks
(cost $2,104,285,993) | | | | | | | 2,626,874,699 | |
| | | | | | | | |
| | | | | | | | |
SHORT-TERM INVESTMENTS – 0.7% | | | | | | | | |
Investment Companies – 0.7% | | | | | | | | |
AB Fixed Income Shares, Inc. – Government Money Market Portfolio – Class AB, 4.54%(c)(d)(e)
(cost $17,152,905) | | | 17,152,905 | | | | 17,152,905 | |
| | | | | | | | |
Total Investments Before Security Lending Collateral for Securities Loaned – 100.1%
(cost $2,121,438,898) | | | | | | | 2,644,027,604 | |
| | | | | | | | |
INVESTMENTS OF CASH COLLATERAL FOR SECURITIES LOANED – 0.0% | | | | | | | | |
Investment Companies – 0.0% | | | | | | | | |
AB Fixed Income Shares, Inc. – Government Money Market Portfolio – Class AB, 4.54%(c)(d)(e)
(cost $227,799) | | | 227,799 | | | | 227,799 | |
| | | | | | | | |
| | |
Total Investments – 100.1%
(cost $2,121,666,697) | | | | | | | 2,644,255,403 | |
Other assets less liabilities – (0.1)% | | | | | | | (1,962,352 | ) |
| | | | | | | | |
| | |
Net Assets – 100.0% | | | | | | $ | 2,642,293,051 | |
| | | | | | | | |
| (a) | Non-income producing security. |
| (b) | Represents entire or partial securities out on loan. See Note E for securities lending information. |
| (c) | Affiliated investments. |
| (d) | The rate shown represents the 7-day yield as of period end. |
| (e) | To obtain a copy of the fund’s shareholder report, please go to the Securities and Exchange Commission’s website at www.sec.gov, or call AB at (800) 227-4618. |
| | |
| |
| abfunds.com | | AB DISCOVERY VALUE FUND | 5 |
PORTFOLIO OF INVESTMENTS (continued)
Glossary:
ADR – American Depositary Receipt
REIT – Real Estate Investment Trust
See notes to financial statements.
| | |
| |
6 | AB DISCOVERY VALUE FUND | | abfunds.com |
STATEMENT OF ASSETS & LIABILITIES
November 30, 2024
| | | | |
| Assets | | | | |
Investments in securities, at value | | | | |
Unaffiliated issuers (cost $2,104,285,993) | | $ | 2,626,874,699 | (a) |
Affiliated issuers (cost $17,380,704—including investment of cash collateral for securities loaned of $227,799) | | | 17,380,704 | |
Unaffiliated dividends and interest receivable | | | 2,740,943 | |
Receivable for investment securities sold | | | 1,882,173 | |
Receivable for shares of beneficial interest sold | | | 195,079 | |
Affiliated dividends receivable | | | 66,680 | |
Receivable due from Adviser | | | 2,820 | |
| | | | |
Total assets | | | 2,649,143,098 | |
| | | | |
| Liabilities | | | | |
Due to custodian | | | 8,988 | |
Payable for shares of beneficial interest redeemed | | | 2,569,638 | |
Payable for investment securities purchased | | | 1,888,266 | |
Advisory fee payable | | | 1,570,838 | |
Payable for collateral received on securities loaned | | | 227,799 | |
Transfer Agent fee payable | | | 83,735 | |
Distribution fee payable | | | 54,772 | |
Administrative fee payable | | | 46,305 | |
Trustees’ fees payable | | | 2,108 | |
Accrued expenses | | | 397,598 | |
| | | | |
Total liabilities | | | 6,850,047 | |
| | | | |
Net Assets | | $ | 2,642,293,051 | |
| | | | |
| Composition of Net Assets | | | | |
Paid-in capital | | $ | 1,840,586,693 | |
Distributable earnings | | | 801,706,358 | |
| | | | |
Net Assets | | $ | 2,642,293,051 | |
| | | | |
Net Asset Value Per Share—unlimited shares authorized, without par value
| | | | | | | | | | | | |
| Class | | Net Assets | | | Shares
Outstanding | | | Net Asset
Value | |
| |
| A | | $ | 251,694,214 | | | | 9,888,879 | | | $ | 25.45 | * |
| |
| C | | $ | 5,922,216 | | | | 284,454 | | | $ | 20.82 | |
| |
| Advisor | | $ | 1,689,588,045 | | | | 64,097,302 | | | $ | 26.36 | |
| |
| I | | $ | 152,312,637 | | | | 6,046,793 | | | $ | 25.19 | |
| |
| Z | | $ | 542,775,939 | | | | 21,582,555 | | | $ | 25.15 | |
| |
| (a) | Includes securities on loan with a value of $341,004,535 (see Note E). |
| * | The maximum offering price per share for Class A shares was $26.58 which reflects a sales charge of 4.25%. |
See notes to financial statements.
| | |
| |
| abfunds.com | | AB DISCOVERY VALUE FUND | 7 |
STATEMENT OF OPERATIONS
Year Ended November 30, 2024
| | | | | | | | |
| Investment Income | | | | | | | | |
Dividends | | | | | | | | |
Unaffiliated issuers (net of foreign taxes withheld of $114,177) | | $ | 40,864,413 | | | | | |
Affiliated issuers | | | 857,955 | | | | | |
Interest | | | 3,155 | | | | | |
Securities lending income | | | 226,512 | | | $ | 41,952,035 | |
| | | | | | | | |
| Expenses | | | | | | | | |
Advisory fee (see Note B) | | | 18,868,313 | | | | | |
Distribution fee—Class A | | | 594,986 | | | | | |
Distribution fee—Class C | | | 59,017 | | | | | |
Distribution fee—Class R | | | 64,196 | | | | | |
Distribution fee—Class K | | | 14,560 | | | | | |
Transfer agency—Class A | | | 131,381 | | | | | |
Transfer agency—Class C | �� | | 3,431 | | | | | |
Transfer agency—Advisor Class | | | 838,654 | | | | | |
Transfer agency—Class R | | | 32,198 | | | | | |
Transfer agency—Class K | | | 11,648 | | | | | |
Transfer agency—Class I | | | 168,800 | | | | | |
Transfer agency—Class Z | | | 153,926 | | | | | |
Printing | | | 207,887 | | | | | |
Custody and accounting | | | 151,167 | | | | | |
Registration fees | | | 116,347 | | | | | |
Administrative | | | 106,959 | | | | | |
Audit and tax | | | 64,011 | | | | | |
Legal | | | 58,290 | | | | | |
Trustees’ fees | | | 54,106 | | | | | |
Miscellaneous | | | 150,425 | | | | | |
| | | | | | | | |
Total expenses | | | 21,850,302 | | | | | |
Less: expenses waived and reimbursed by the Adviser (see Notes B & E) | | | (25,695 | ) | | | | |
| | | | | | | | |
Net expenses | | | | | | | 21,824,607 | |
| | | | | | | | |
Net investment income | | | | | | | 20,127,428 | |
| | | | | | | | |
| Realized and Unrealized Gain on Investment and Foreign Currency Transactions | | | | | | | | |
Net realized gain on: | | | | | | | | |
Investment transactions(a) | | | | | | | 314,109,988 | |
Foreign currency transactions | | | | | | | 1,005 | |
Net change in unrealized appreciation (depreciation) of: | | | | | | | | |
Investments | | | | | | | 356,983,269 | |
Foreign currency denominated assets and liabilities | | | | | | | 31 | |
| | | | | | | | |
Net gain on investment and foreign currency transactions | | | | | | | 671,094,293 | |
| | | | | | | | |
Net Increase in Net Assets from Operations | | | | | | $ | 691,221,721 | |
| | | | | | | | |
| (a) | On April 10, 2024, the Fund had a redemption-in-kind with total proceeds in the amount of $128,469,786. The realized gain of $8,048,031, resulting from redemption-in-kind, will not be recognized for tax purposes. |
See notes to financial statements.
| | |
| |
8 | AB DISCOVERY VALUE FUND | | abfunds.com |
STATEMENT OF CHANGES IN NET ASSETS
| | | | | | | | |
| | | Year Ended
November 30,
2024 | | | Year Ended
November 30,
2023 | |
| Increase (Decrease) in Net Assets from Operations | | | | | | | | |
Net investment income | | $ | 20,127,428 | | | $ | 20,789,897 | |
Net realized gain on investment transactions | | | 314,110,993 | | | | 157,769,190 | |
Net change in unrealized appreciation (depreciation) of investments and foreign currency denominated assets and liabilities | | | 356,983,300 | | | | (163,654,421 | ) |
| | | | | | | | |
Net increase in net assets from operations | | | 691,221,721 | | | | 14,904,666 | |
Distributions to Shareholders | | | | | | | | |
Class A | | | (14,653,544 | ) | | | (17,358,541 | ) |
Class C | | | (430,035 | ) | | | (672,390 | ) |
Advisor Class | | | (89,029,031 | ) | | | (99,824,843 | ) |
Class R | | | (1,670,906 | ) | | | (2,216,296 | ) |
Class K | | | (785,359 | ) | | | (1,163,963 | ) |
Class I | | | (8,557,743 | ) | | | (9,286,407 | ) |
Class Z | | | (47,557,563 | ) | | | (63,934,035 | ) |
| Transactions in Shares of Beneficial Interest | | | | | | | | |
Net decrease | | | (363,200,133 | ) | | | (187,904,442 | ) |
| | | | | | | | |
Total increase (decrease) | | | 165,337,407 | | | | (367,456,251 | ) |
| Net Assets | | | | | | | | |
Beginning of period | | | 2,476,955,644 | | | | 2,844,411,895 | |
| | | | | | | | |
End of period | | $ | 2,642,293,051 | | | $ | 2,476,955,644 | |
| | | | | | | | |
See notes to financial statements.
| | |
| |
| abfunds.com | | AB DISCOVERY VALUE FUND | 9 |
NOTES TO FINANCIAL STATEMENTS
November 30, 2024
NOTE A
Significant Accounting Policies
AB Trust (the “Trust”) is organized as a Massachusetts business trust and is registered under the Investment Company Act of 1940 (the “1940 Act”) as a diversified, open-end management investment company. The Trust operates as a series company currently comprised of three funds. Each fund is considered to be a separate entity for financial reporting and tax purposes. This report relates only to the AB Discovery Value Fund (the “Fund”), a diversified fund. The Fund offers Class A, Class C, Advisor Class, Class I and Class Z shares. Class B, Class R and Class K shares have been authorized but currently are not offered. Effective May 20, 2024, Class R and Class K were liquidated. Class A shares are sold with a front-end sales charge of up to 4.25% for purchases not exceeding $1,000,000. With respect to purchases of $1,000,000 or more, Class A shares redeemed within one year of purchase may be subject to a contingent deferred sales charge of 1%. Class C shares are subject to a contingent deferred sales charge of 1% on redemptions made within the first year after purchase, and 0% after the first year of purchase. Class C shares automatically convert to Class A shares eight years after the end of the calendar month of purchase. Advisor Class, Class I and Class Z shares are sold without an initial or contingent deferred sales charge and are not subject to ongoing distribution expenses. All eight classes of shares have identical voting, dividend, liquidation and other rights, except that the classes bear different distribution and transfer agency expenses. Each class has exclusive voting rights with respect to its distribution plan. The financial statements have been prepared in conformity with U.S. generally accepted accounting principles (“U.S. GAAP”), which require management to make certain estimates and assumptions that affect the reported amounts of assets and liabilities in the financial statements and amounts of income and expenses during the reporting period. Actual results could differ from those estimates. The Fund is an investment company under U.S. GAAP and follows the accounting and reporting guidance applicable to investment companies. The following is a summary of significant accounting policies followed by the Fund.
1. Security Valuation
Portfolio securities are valued at market value determined on the basis of market quotations or, if market quotations are not readily available or are unreliable, at “fair value” as determined in accordance with procedures approved by and under the oversight of the Trust’s Board of Trustees (the “Board”). Pursuant to these procedures, AllianceBernstein L.P. (the “Adviser”) serves as the Fund’s valuation designee pursuant to Rule 2a-5 of the 1940 Act. In this capacity, the Adviser is responsible, among other things, for making all fair value determinations relating to the Fund’s portfolio investments, subject to the Board’s oversight.
| | |
| |
10 | AB DISCOVERY VALUE FUND | | abfunds.com |
NOTES TO FINANCIAL STATEMENTS (continued)
In general, the market values of securities which are readily available and deemed reliable are determined as follows: securities listed on a national securities exchange (other than securities listed on the NASDAQ Stock Market, Inc. (“NASDAQ”)) or on a foreign securities exchange are valued at the last sale price at the close of the exchange or foreign securities exchange. If there has been no sale on such day, the securities are valued at the last traded price from the previous day. Securities listed on more than one exchange are valued by reference to the principal exchange on which the securities are traded; securities listed only on NASDAQ are valued in accordance with the NASDAQ Official Closing Price; listed or over the counter (“OTC”) market put or call options are valued at the mid level between the current bid and ask prices. If either a current bid or current ask price is unavailable, the Adviser will have discretion to determine the best valuation (e.g., last trade price in the case of listed options); open futures are valued using the closing settlement price or, in the absence of such a price, the most recent quoted bid price. If there are no quotations available for the day of valuation, the last available closing settlement price is used; U.S. Government securities and any other debt instruments having 60 days or less remaining until maturity are generally valued at market by an independent pricing vendor, if a market price is available. If a market price is not available, the securities are valued at amortized cost. This methodology is commonly used for short term securities that have an original maturity of 60 days or less, as well as short term securities that had an original term to maturity that exceeded 60 days. In instances when amortized cost is utilized, the Valuation Committee (the “Committee”) must reasonably conclude that the utilization of amortized cost is approximately the same as the fair value of the security. Factors the Committee will consider include, but are not limited to, an impairment of the creditworthiness of the issuer or material changes in interest rates. Fixed-income securities, including mortgage-backed and asset-backed securities, may be valued on the basis of prices provided by a pricing service or at a price obtained from one or more of the major broker-dealers. In cases where broker-dealer quotes are obtained, the Adviser may establish procedures whereby changes in market yields or spreads are used to adjust, on a daily basis, a recently obtained quoted price on a security. Swaps and other derivatives are valued daily, primarily using independent pricing services, independent pricing models using market inputs, as well as third party broker-dealers or counterparties. Open-end mutual funds are valued at the closing net asset value per share, while exchange-traded funds are valued at the closing market price per share.
Securities for which market quotations are not readily available (including restricted securities) or are deemed unreliable are valued at fair value as deemed appropriate by the Adviser. Factors considered in making this determination may include, but are not limited to, information obtained by
| | |
| |
| abfunds.com | | AB DISCOVERY VALUE FUND | 11 |
NOTES TO FINANCIAL STATEMENTS (continued)
contacting the issuer, analysts, analysis of the issuer’s financial statements or other available documents. In addition, the Fund may use fair value pricing for securities primarily traded in non-U.S. markets because most foreign markets close well before the Fund values its securities at 4:00 p.m., Eastern Time. The earlier close of these foreign markets gives rise to the possibility that significant events, including broad market moves, may have occurred in the interim and may materially affect the value of those securities. To account for this, the Fund generally values many of its foreign equity securities using fair value prices based on third party vendor modeling tools to the extent available.
2. Fair Value Measurements
In accordance with U.S. GAAP regarding fair value measurements, fair value is defined as the price that the Fund would receive to sell an asset or pay to transfer a liability in an orderly transaction between market participants at the measurement date. U.S. GAAP establishes a framework for measuring fair value, and a three-level hierarchy for fair value measurements based upon the transparency of inputs to the valuation of an asset or liability (including those valued based on their market values as described in Note A.1 above). Inputs may be observable or unobservable and refer broadly to the assumptions that market participants would use in pricing the asset or liability. Observable inputs reflect the assumptions market participants would use in pricing the asset or liability based on market data obtained from sources independent of the Fund. Unobservable inputs reflect the Fund’s own assumptions about the assumptions that market participants would use in pricing the asset or liability based on the best information available in the circumstances. Each investment is assigned a level based upon the observability of the inputs which are significant to the overall valuation. The three-tier hierarchy of inputs is summarized below.
| | • | | Level 1—quoted prices in active markets for identical investments |
| | • | | Level 2—other significant observable inputs (including quoted prices for similar investments, interest rates, prepayment speeds, credit risk, etc.) |
| | • | | Level 3—significant unobservable inputs (including the Fund’s own assumptions in determining the fair value of investments) |
Where readily available market prices or relevant bid prices are not available for certain equity investments, such investments may be valued based on similar publicly traded investments, movements in relevant indices since last available prices or based upon underlying company fundamentals and comparable company data (such as multiples to earnings or other multiples to equity). Where an investment is valued using an observable input, such as another publicly traded security, the investment will be classified
| | |
| |
12 | AB DISCOVERY VALUE FUND | | abfunds.com |
NOTES TO FINANCIAL STATEMENTS (continued)
as Level 2. If management determines that an adjustment is appropriate based on restrictions on resale, illiquidity or uncertainty, and such adjustment is a significant component of the valuation, the investment will be classified as Level 3. An investment will also be classified as Level 3 where management uses company fundamentals and other significant inputs to determine the valuation.
The following table summarizes the valuation of the Fund’s investments by the above fair value hierarchy levels as of November 30, 2024:
| | | | | | | | | | | | | | | | |
Investments in
Securities: | | Level 1 | | | Level 2 | | | Level 3 | | | Total | |
Assets: | | | | | | | | | | | | | | | | |
Common Stocks(a) | | $ | 2,626,874,699 | | | $ | – 0 | – | | $ | – 0 | – | | $ | 2,626,874,699 | |
Short-Term Investments | | | 17,152,905 | | | | – 0 | – | | | – 0 | – | | | 17,152,905 | |
Investments of Cash Collateral for Securities Loaned in Affiliated Money Market Fund | | | 227,799 | | | | – 0 | – | | | – 0 | – | | | 227,799 | |
| | | | | | | | | | | | | | | | |
Total Investments in Securities | | | 2,644,255,403 | | | | – 0 | – | | | – 0 | – | | | 2,644,255,403 | |
| | | | | | | | | | | | | | | | |
Other Financial Instruments(b) | | | – 0 | – | | | – 0 | – | | | – 0 | – | | | – 0 | – |
| | | | | | | | | | | | | | | | |
Total | | $ | 2,644,255,403 | | | $ | – 0 | – | | $ | – 0 | – | | $ | 2,644,255,403 | |
| | | | | | | | | | | | | | | | |
| (a) | See Portfolio of Investments for sector classifications. |
| (b) | Other financial instruments include derivative instruments, such as futures, forwards and swaps. Derivative instruments are valued at the unrealized appreciation (depreciation) on the instrument. Other financial instruments may also include swaps with upfront premiums, written options and written swaptions which are valued at market value. |
3. Currency Translation
Assets and liabilities denominated in foreign currencies and commitments under forward currency exchange contracts are translated into U.S. dollars at the mean of the quoted bid and ask prices of such currencies against the U.S. dollar. Purchases and sales of portfolio securities are translated into U.S. dollars at the rates of exchange prevailing when such securities were acquired or sold. Income and expenses are translated into U.S. dollars at rates of exchange prevailing when accrued.
Net realized gain or loss on foreign currency transactions represents foreign exchange gains and losses from sales and maturities of foreign fixed income investments, holding of foreign currencies, currency gains or losses realized between the trade and settlement dates on foreign investment transactions, and the difference between the amounts of dividends, interest and foreign withholding taxes recorded on the Fund’s books and
| | |
| |
| abfunds.com | | AB DISCOVERY VALUE FUND | 13 |
NOTES TO FINANCIAL STATEMENTS (continued)
the U.S. dollar equivalent amounts actually received or paid. Net unrealized currency gains and losses from valuing foreign currency denominated assets and liabilities at period end exchange rates are reflected as a component of net unrealized appreciation or depreciation of foreign currency denominated assets and liabilities.
4. Taxes
It is the Fund’s policy to meet the requirements of the Internal Revenue Code applicable to regulated investment companies and to distribute all of its investment company taxable income and net realized gains, if any, to shareholders. Therefore, no provisions for federal income or excise taxes are required. The Fund may be subject to taxes imposed by countries in which it invests. Such taxes are generally based on income and/or capital gains earned or repatriated. Taxes are accrued and applied to net investment income, net realized gains and net unrealized appreciation/depreciation as such income and/or gains are earned.
In accordance with U.S. GAAP requirements regarding accounting for uncertainties in income taxes, management has analyzed the Fund’s tax positions taken or expected to be taken on federal and state income tax returns for all open tax years (the current and the prior three tax years) and has concluded that no provision for income tax is required in the Fund’s financial statements.
5. Investment Income and Investment Transactions
Dividend income is recorded on the ex-dividend date or as soon as the Fund is informed of the dividend. Interest income is accrued daily. Investment transactions are accounted for on the date the securities are purchased or sold. Investment gains or losses are determined on the identified cost basis. Non-cash dividends, if any, are recorded on the ex-dividend date at the fair value of the securities received. The Fund amortizes premiums and accretes discounts as adjustments to interest income. The Fund accounts for distributions received from real estate investment trust (“REIT”) investments or from regulated investment companies as dividend income, realized gain, or return of capital based on information provided by the REIT or the investment company.
6. Class Allocations
All income earned and expenses incurred by the Fund are borne on a pro-rata basis by each outstanding class of shares, based on the proportionate interest in the Fund represented by the net assets of such class, except for class specific expenses which are allocated to the respective class. Expenses of the Trust are charged proportionately to each fund or based on other appropriate methods. Realized and unrealized gains and losses are allocated among the various share classes based on respective net assets.
| | |
| |
14 | AB DISCOVERY VALUE FUND | | abfunds.com |
NOTES TO FINANCIAL STATEMENTS (continued)
7. Dividends and Distributions
Dividends and distributions to shareholders, if any, are recorded on the ex-dividend date. Income dividends and capital gains distributions are determined in accordance with federal tax regulations and may differ from those determined in accordance with U.S. GAAP. To the extent these differences are permanent, such amounts are reclassified within the capital accounts based on their federal tax basis treatment; temporary differences do not require such reclassification.
8. Cash and Short-Term Investments
Cash and short-term investments include cash on hand and short-term investments with maturities of less than one year when purchased.
NOTE B
Advisory Fee and Other Transactions with Affiliates
Under the terms of the investment advisory agreement, the Fund pays the Adviser an advisory fee at an annual rate of .75% of the first $2.5 billion, .65% of the next $2.5 billion and .60% in excess of $5 billion of the Fund’s average daily net assets. The fee is accrued daily and paid monthly.
Pursuant to the investment advisory agreement, the Fund may reimburse the Adviser for certain legal and accounting services provided to the Fund by the Adviser. For the year ended November 30, 2024, the reimbursement for such services amounted to $106,959.
The Fund compensates AllianceBernstein Investor Services, Inc. (“ABIS”), a wholly-owned subsidiary of the Adviser, under a Transfer Agency Agreement for providing personnel and facilities to perform transfer agency services for the Fund. ABIS may make payments to intermediaries that provide omnibus account services, sub-accounting services and/or networking services. Such compensation retained by ABIS amounted to $597,545 for the year ended November 30, 2024.
AllianceBernstein Investments, Inc. (the “Distributor”), a wholly-owned subsidiary of the Adviser, serves as the distributor of the Fund’s shares. The Distributor has advised the Fund that it has retained front-end sales charges of $2,408 from the sale of Class A shares and received $557 and $145 in contingent deferred sales charges imposed upon redemptions by shareholders of Class A and Class C shares, respectively, for the year ended November 30, 2024.
The Fund may invest in AB Government Money Market Portfolio (the “Government Money Market Portfolio”) which has a contractual annual advisory fee rate of .20% of the portfolio’s average daily net assets and bears its own expenses. The Adviser had contractually agreed to waive .10% of the advisory fee of Government Money Market Portfolio (resulting in
| | |
| |
| abfunds.com | | AB DISCOVERY VALUE FUND | 15 |
NOTES TO FINANCIAL STATEMENTS (continued)
a net advisory fee of .10%) until August 31, 2023. Effective September 1, 2023, the Adviser has contractually agreed to waive .05% of the advisory fee of Government Money Market Portfolio (resulting in a net advisory fee of .15%) until August 31, 2024. In connection with the investment by the Fund in Government Money Market Portfolio, the Adviser has contractually agreed to waive its advisory fee from the Fund in an amount equal to the Fund’s pro rata share of the effective advisory fee of Government Money Market Portfolio, as borne indirectly by the Fund as an acquired fund fee and expense. For the year ended November 30, 2024, such waiver amounted to $24,742.
A summary of the Fund’s transactions in AB mutual funds for the year ended November 30, 2024 is as follows:
| | | | | | | | | | | | | | | | | | | | |
Fund | | Market Value
11/30/23
(000) | | | Purchases
at Cost
(000) | | | Sales
Proceeds
(000) | | | Market Value
11/30/24
(000) | | | Dividend
Income
(000) | |
Government Money Market Portfolio | | $ | – 0 | – | | $ | 694,021 | | | $ | 676,868 | | | $ | 17,153 | | | $ | 858 | |
Government Money Market Portfolio* | | | – 0 | – | | | 142,254 | | | | 142,026 | | | | 228 | | | | 12 | |
| | | | | | | | | | | | | | | | | | | | |
Total | | | | | | | | | | | | | | $ | 17,381 | | | $ | 870 | |
| | | | | | | | | | | | | | | | | | | | |
| * | Investments of cash collateral for securities lending transactions (see Note E). |
NOTE C
Distribution Services Agreement
The Fund has adopted a Distribution Services Agreement (the “Agreement”) pursuant to Rule 12b-1 under the 1940 Act. Under the Agreement, the Fund pays distribution and servicing fees to the Distributor at an annual rate of up to .30% of the Fund’s average daily net assets attributable to Class A shares, 1% of the Fund’s average daily net assets attributable to Class C shares, .50% of the Fund’s average daily net assets attributable to Class R shares and .25% of the Fund’s average daily net assets attributable to Class K shares. There are no distribution and servicing fees on the Advisor Class, Class I and Class Z shares. Payments under the Agreement in respect of Class A shares are limited to an annual rate of .25% of Class A shares’ average daily net assets. The fees are accrued daily and paid monthly. The Agreement provides that the Distributor will use such payments in their entirety for distribution assistance and promotional activities. Since the commencement of the Fund’s operations, the Distributor has incurred expenses in excess of the distribution costs reimbursed by the Fund in the amounts of $3,680,875, $2,847,253 and $921,634 for Class C, Class R and Class K shares, respectively. While such costs may be recovered from the Fund in future periods so long as
| | |
| |
16 | AB DISCOVERY VALUE FUND | | abfunds.com |
NOTES TO FINANCIAL STATEMENTS (continued)
the Agreement is in effect, and the share class is active, the rate of the distribution and servicing fees payable under the Agreement may not be increased without a shareholder vote. In accordance with the Agreement, there is no provision for recovery of unreimbursed distribution costs incurred by the Distributor beyond the current fiscal year for Class A shares. The Agreement also provides that the Adviser may use its own resources to finance the distribution of the Fund’s shares.
NOTE D
Investment Transactions
Purchases and sales of investment securities (excluding short-term investments) for the year ended November 30, 2024 were as follows:
| | | | | | | | |
| | | Purchases | | | Sales | |
Investment securities (excluding U.S. government securities) | | $ | 1,338,826,030 | | | $ | 1,718,973,352 | |
U.S. government securities | | | – 0 | – | | | – 0 | – |
The cost of investments for federal income tax purposes, gross unrealized appreciation and unrealized depreciation are as follows:
| | | | |
Cost | | $ | 2,148,312,295 | |
| | | | |
Gross unrealized appreciation | | $ | 629,578,335 | |
Gross unrealized depreciation | | | (133,635,227 | ) |
| | | | |
Net unrealized appreciation | | $ | 495,943,108 | |
| | | | |
1. Derivative Financial Instruments
The Fund may use derivatives in an effort to earn income and enhance returns, to replace more traditional direct investments, to obtain exposure to otherwise inaccessible markets (collectively, “investment purposes”), or to hedge or adjust the risk profile of its portfolio.
The Fund did not engage in derivatives transactions for the year ended November 30, 2024.
2. Currency Transactions
The Fund may invest in non-U.S. Dollar-denominated securities on a currency hedged or unhedged basis. The Fund may seek investment opportunities by taking long or short positions in currencies through the use of currency-related derivatives, including forward currency exchange contracts, futures and options on futures, swaps, and other options. The Fund may enter into transactions for investment opportunities when it anticipates that a foreign currency will appreciate or depreciate in value but securities denominated in that currency are not held by the Fund and do not present attractive investment opportunities. Such transactions may also be used when the Adviser believes that it may be more efficient than a direct investment in a
| | |
| |
| abfunds.com | | AB DISCOVERY VALUE FUND | 17 |
NOTES TO FINANCIAL STATEMENTS (continued)
foreign currency-denominated security. The Fund may also conduct currency exchange contracts on a spot basis (i.e., for cash at the spot rate prevailing in the currency exchange market for buying or selling currencies).
NOTE E
Securities Lending
The Fund may enter into securities lending transactions. Under the Fund’s securities lending program, all loans of securities will be collateralized continually by cash collateral and/or non-cash collateral. Non-cash collateral will include only securities issued or guaranteed by the U.S. government or its agencies or instrumentalities. If the Fund cannot sell or repledge any non-cash collateral, such collateral will not be reflected in the portfolio of investments. If a loan is collateralized by cash, the Fund will be compensated for the loan from a portion of the net return from the income earned on cash collateral after a rebate is paid to the borrower (in some cases, this rebate may be a “negative rebate” or fee paid by the borrower to the Fund in connection with the loan), and payments are made for fees of the securities lending agent and for certain other administrative expenses. If the Fund receives non-cash collateral, the Fund will receive a fee from the borrower generally equal to a negotiated percentage of the market value of the loaned securities. The Fund will have the right to call a loan and obtain the securities loaned at any time on notice to the borrower within the normal and customary settlement time for the securities. While the securities are on loan, the borrower is obligated to pay the Fund amounts equal to any dividend income or other distributions from the securities; however, these distributions will not be afforded the same preferential tax treatment as qualified dividends. The Fund will not be able to exercise voting rights with respect to any securities during the existence of a loan, but will have the right to regain ownership of loaned securities in order to exercise voting or other ownership rights. Collateral received and securities loaned are marked to market daily to ensure that the securities loaned are secured by collateral. The lending agent currently invests the cash collateral received in Government Money Market Portfolio, an eligible money market vehicle, in accordance with the investment restrictions of the Fund, and as approved by the Board. The collateral received on securities loaned is recorded as an asset as well as a corresponding liability in the statement of assets and liabilities. The collateral will be adjusted the next business day to maintain the required collateral amount. The amounts of securities lending income from the borrowers and Government Money Market Portfolio are reflected in the statement of operations. When the Fund earns net securities lending income from Government Money Market Portfolio, the income is inclusive of a rebate expense paid to the borrower. In connection with the cash collateral investment by the Fund in Government Money Market Portfolio, the Adviser has agreed to waive a portion of the Fund’s share of the advisory fees of Government Money Market Portfolio,
| | |
| |
18 | AB DISCOVERY VALUE FUND | | abfunds.com |
NOTES TO FINANCIAL STATEMENTS (continued)
as borne indirectly by the Fund as an acquired fund fee and expense. When the Fund lends securities, its investment performance will continue to reflect changes in the value of the securities loaned. A principal risk of lending portfolio securities is that the borrower may fail to return the loaned securities upon termination of the loan and that the collateral will not be sufficient to replace the loaned securities. The lending agent has agreed to indemnify the Fund in the case of default of any securities borrower.
A summary of the Fund’s transactions surrounding securities lending for the year ended November 30, 2024 is as follows:
| | | | | | | | | | | | | | | | | | | | | | |
| | | | | | | | | | | | | Government Money
Market Portfolio | |
Market
Value of
Securities
on Loan* | | | Cash
Collateral* | | | Market
Value of
Non-Cash
Collateral* | | | Income from
Borrowers | | | Income
Earned | | | Advisory Fee
Waived | |
| $ | 341,004,535 | | | $ | 227,799 | | | $ | 346,762,975 | | | $ | 214,497 | | | $ | 12,015 | | | $ | 953 | |
| * | As of November 30, 2024. |
NOTE F
Shares of Beneficial Interest
Transactions in shares of beneficial interest for each class were as follows:
| | | | | | | | | | | | | | | | | | | | | | | | |
| | | | | | | | | | | | | | | | | | | | | | | | |
| | | Shares | | | | | | Amount | | | | |
| | | Year Ended
November 30,
2024 | | | Year Ended
November 30,
2023 | | | | | | Year Ended
November 30,
2024 | | | Year Ended
November 30,
2023 | | | | |
| | | | | | | | |
| Class A | | | | | |
Shares sold | | | 525,004 | | | | 957,997 | | | | | | | $ | 11,646,419 | | | $ | 19,531,630 | | | | | |
| | | | | |
Shares issued in reinvestment of dividends and distributions | | | 658,911 | | | | 776,559 | | | | | | | | 13,145,264 | | | | 15,507,875 | | | | | |
| | | | | |
Shares converted from Class C | | | 33,461 | | | | 73,227 | | | | | | | | 750,737 | | | | 1,510,468 | | | | | |
| | | | | |
Shares redeemed | | | (2,307,189 | ) | | | (2,560,223 | ) | | | | | | | (51,405,424 | ) | | | (51,598,871 | ) | | | | |
| | | | | |
Net decrease | | | (1,089,813 | ) | | | (752,440 | ) | | | | | | $ | (25,863,004 | ) | | $ | (15,048,898 | ) | | | | |
| | | | | |
| | | | | | | | | | | | | | | | | | | | | | | | |
| Class C | | | | | | | | | | | | | | | | | | | | | | | | |
Shares sold | | | 17,751 | | | | 33,620 | | | | | | | $ | 340,351 | | | $ | 566,444 | | | | | |
| | | | | |
Shares issued in reinvestment of dividends and distributions | | | 24,817 | | | | 38,072 | | | | | | | | 407,988 | | | | 636,186 | | | | | |
| | | | | |
Shares converted to Class A | | | (40,772 | ) | | | (87,788 | ) | | | | | | | (750,737 | ) | | | (1,510,468 | ) | | | | |
| | | | | |
Shares redeemed | | | (66,415 | ) | | | (146,254 | ) | | | | | | | (1,205,145 | ) | | | (2,472,319 | ) | | | | |
| | | | | |
Net decrease | | | (64,619 | ) | | | (162,350 | ) | | | | | | $ | (1,207,543 | ) | | $ | (2,780,157 | ) | | | | |
| | | | | |
| | |
| |
| abfunds.com | | AB DISCOVERY VALUE FUND | 19 |
NOTES TO FINANCIAL STATEMENTS (continued)
| | | | | | | | | | | | | | | | | | | | | | | | |
| | | | | | | | | | | | | | | | | | | | | | | | |
| | | Shares | | | | | | Amount | | | | |
| | | Year Ended
November 30,
2024 | | | Year Ended
November 30,
2023 | | | | | | Year Ended
November 30,
2024 | | | Year Ended
November 30,
2023 | | | | |
| | | | | | | | |
| Advisor Class | | | | | | | | | | | | | | | | | | | | | | | | |
Shares sold | | | 7,802,113 | | | | 9,883,963 | | | | | | | $ | 179,577,312 | | | $ | 206,602,701 | | | | | |
| | | | | |
Shares issued in reinvestment of dividends and distributions | | | 3,891,957 | | | | 4,150,578 | | | | | | | | 80,213,235 | | | | 85,460,405 | | | | | |
| | | | | |
Shares redeemed | | | (11,791,437 | ) | | | (14,722,362 | ) | | | | | | | (271,697,639 | ) | | | (310,769,654 | ) | | | | |
| | | | | |
Net decrease | | | (97,367 | ) | | | (687,821 | ) | | | | | | $ | (11,907,092 | ) | | $ | (18,706,548 | ) | | | | |
| | | | | |
| | | | | | | | | | | | | | | | | | | | | | | | |
| Class R | | | | | |
Shares sold | | | 69,530 | | | | 147,660 | | | | | | | $ | 1,438,845 | | | $ | 2,885,444 | | | | | |
| | | | | |
Shares issued in reinvestment of dividends and distributions | | | 87,390 | | | | 115,492 | | | | | | | | 1,670,906 | | | | 2,216,296 | | | | | |
| | | | | |
Shares redeemed | | | (1,511,904 | ) | | | (507,313 | ) | | | | | | | (32,420,490 | ) | | | (9,975,749 | ) | | | | |
| | | | | |
Net decrease | | | (1,354,984 | ) | | | (244,161 | ) | | | | | | $ | (29,310,739 | ) | | $ | (4,874,009 | ) | | | | |
| | | | | |
| | | | | | | | | | | | | | | | | | | | | | | | |
| Class K | | | | | |
Shares sold | | | 44,741 | | | | 123,631 | | | | | | | $ | 937,944 | | | $ | 2,498,608 | | | | | |
| | | | | |
Shares issued in reinvestment of dividends and distributions | | | 40,028 | | | | 59,386 | | | | | | | | 785,355 | | | | 1,163,959 | | | | | |
| | | | | |
Shares redeemed | | | (723,473 | ) | | | (353,532 | ) | | | | | | | (15,752,618 | ) | | | (7,050,174 | ) | | | | |
| | | | | |
Net decrease | | | (638,704 | ) | | | (170,515 | ) | | | | | | $ | (14,029,319 | ) | | $ | (3,387,607 | ) | | | | |
| | | | | |
| | | | | | | | | | | | | | | | | | | | | | | | |
| Class I | | | | | |
Shares sold | | | 1,302,831 | | | | 1,459,737 | | | | | | | $ | 28,609,319 | | | $ | 29,084,307 | | | | | |
| | | | | |
Shares issued in reinvestment of dividends and distributions | | | 431,277 | | | | 467,059 | | | | | | | | 8,500,478 | | | | 9,224,416 | | | | | |
| | | | | |
Shares redeemed | | | (1,877,587 | ) | | | (1,740,336 | ) | | | | | | | (41,834,795 | ) | | | (34,776,023 | ) | | | | |
| | | | | |
Net increase (decrease) | | | (143,479 | ) | | | 186,460 | | | | | | | $ | (4,724,998 | ) | | $ | 3,532,700 | | | | | |
| | | | | |
| | | | | | | | | | | | | | | | | | | | | | | | |
| Class Z | | | | | |
Shares sold | | | 3,408,981 | | | | 4,523,928 | | | | | | | $ | 75,118,538 | | | $ | 90,137,986 | | | | | |
| | | | | |
Shares issued in reinvestment of dividends and distributions | | | 2,387,457 | | | | 3,231,226 | | | | | | | | 46,937,399 | | | | 63,655,144 | | | | | |
| | | | | |
Shares redeemed | | | (18,261,939 | ) | | | (14,886,883 | ) | | | | | | | (398,213,375 | ) | | | (300,433,053 | ) | | | | |
| | | | | |
Net decrease | | | (12,465,501 | ) | | | (7,131,729 | ) | | | | | | $ | (276,157,438 | ) | | $ | (146,639,923 | ) | | | | |
| | | | | |
| | |
| |
20 | AB DISCOVERY VALUE FUND | | abfunds.com |
NOTES TO FINANCIAL STATEMENTS (continued)
NOTE G
Risks Involved in Investing in the Fund
Market Risk—The value of the Fund’s assets will fluctuate as the market or markets in which the Fund invests fluctuate. The value of the Fund’s investments may decline, sometimes rapidly and unpredictably, simply because of economic changes or other events, including public health crises (including the occurrence of a contagious disease or illness) and regional and global conflicts, that affect large portions of the market. It includes the risk that a particular style of investing may be underperforming the market generally.
Capitalization Risk—Investments in small- and mid-capitalization companies may be more volatile than investments in large-capitalization companies. Investments in small-capitalization companies may have additional risks because these companies have limited product lines, markets or financial resources.
Foreign (Non-U.S.) Risk—Investments in securities of non-U.S. issuers may involve more risk than those of U.S. issuers. These securities may fluctuate more widely in price and may be more difficult to trade due to adverse market, economic, political, regulatory or other factors.
Currency Risk—Fluctuations in currency exchange rates may negatively affect the value of the Fund’s investments or reduce its returns.
Derivatives Risk—Derivatives may be difficult to price or unwind and leveraged so that small changes may produce disproportionate losses for the Fund. A short position in a derivative instrument involves the risk of a theoretically unlimited increase in the value of the underlying asset, reference rate or index, which could cause the Fund to suffer a potentially unlimited loss. Derivatives, especially over-the-counter derivatives, are also subject to counterparty risk, which is the risk that the counterparty (the party on the other side of the transaction) on a derivative transaction will be unable or unwilling to honor its contractual obligations to the Fund.
Indemnification Risk—In the ordinary course of business, the Fund enters into contracts that contain a variety of indemnifications. The Fund’s maximum exposure under these arrangements is unknown. However, the Fund has not had prior claims or losses pursuant to these indemnification provisions and expects the risk of loss thereunder to be remote. Therefore, the Fund has not accrued any liability in connection with these indemnification provisions.
Management Risk—The Fund is subject to management risk because it is an actively-managed investment fund. The Adviser will apply its investment techniques and risk analyses in making investment decisions, but
| | |
| |
| abfunds.com | | AB DISCOVERY VALUE FUND | 21 |
NOTES TO FINANCIAL STATEMENTS (continued)
there is no guarantee that its techniques will produce the intended results. Some of these techniques may incorporate, or rely upon, quantitative models, but there is no guarantee that these models will generate accurate forecasts, reduce risk or otherwise perform as expected.
NOTE H
Joint Credit Facility
A number of open-end mutual funds managed by the Adviser, including the Fund, participate in a $325 million revolving credit facility (the “Facility”) intended to provide short-term financing related to redemptions and other short term liquidity requirements, subject to certain restrictions. Commitment fees related to the Facility are paid by the participating funds and are included in miscellaneous expenses in the statement of operations. The Fund did not utilize the Facility during the year ended November 30, 2024.
NOTE I
Distributions to Shareholders
The tax character of distributions paid during the fiscal years ended November 30, 2024 and November 30, 2023 were as follows:
| | | | | | | | |
| | | 2024 | | | 2023 | |
Distributions paid from: | | | | | | | | |
Ordinary income | | $ | 25,198,883 | | | $ | 30,628,777 | |
Net long-term capital gains | | | 137,485,298 | | | | 163,827,698 | |
| | | | | | | | |
Total taxable distributions | | $ | 162,684,181 | | | $ | 194,456,475 | |
| | | | | | | | |
As of November 30, 2024, the components of accumulated earnings (deficit) on a tax basis were as follows:
| | | | |
Undistributed ordinary income | | $ | 63,064,294 | |
Undistributed capital gains | | | 242,698,831 | |
Unrealized appreciation (depreciation) | | | 495,943,233 | (a) |
| | | | |
Total accumulated earnings (deficit) | | $ | 801,706,358 | |
| | | | |
| (a) | The difference between book-basis and tax-basis unrealized appreciation (depreciation) is attributable primarily to the tax deferral of losses on wash sales. |
For tax purposes, net realized capital losses may be carried over to offset future capital gains, if any. Funds are permitted to carry forward capital losses for an indefinite period, and such losses will retain their character as either short-term or long-term capital losses. As of November 30, 2024, the Fund did not have any capital loss carryforwards.
During the current fiscal year, permanent differences primarily due to the utilization of earnings and profits distributed to shareholders on redemption of shares, and the tax treatment of gains from a redemption-in-kind,
| | |
| |
22 | AB DISCOVERY VALUE FUND | | abfunds.com |
NOTES TO FINANCIAL STATEMENTS (continued)
resulted in a net decrease in distributable earnings and a net increase in additional paid-in capital. These reclassifications had no effect on net assets.
NOTE J
Recent Accounting Pronouncements
In December 2022, the Financial Accounting Standards Board issued an Accounting Standards Update, ASU 2022-06, “Reference Rate Reform (Topic 848) – Deferral of the Sunset Date of Topic 848”. ASU 2022-06 is an amendment to ASU 2020-04, which provided optional guidance to ease the potential accounting burden due to the discontinuation of the LIBOR and other interbank-offered based reference rates and which was effective as of March 12, 2020 through December 31, 2022. ASU 2022-06 extends the effective period through December 31, 2024. Management is currently evaluating the impact, if any, of applying ASU 2022-06.
In November 2023, the Financial Accounting Standards Board issued Accounting Standards Update, ASU 2023-07, “Segment Reporting (Topic 280)”. ASU 2023-07 requires public entities to provide disclosure of significant segment expenses that are regularly provided to the chief operating decision maker (“CODM”). ASU 2023-07, among other things, (i) requires a single segment public entity to provide all necessary disclosures required by Topic 280 it, (ii) requires a public entity to disclose the title and position of the CODM and an explanation of how the CODM uses the reported measure(s) of segment profit and loss in assessing segment performance and deciding how to allocate resources and (iii) provides the ability for a public entity to elect more than one performance measure. ASU 2023-07 is effective for fiscal years beginning after December 15, 2023, and interim periods within fiscal years beginning after December 15, 2024. Early adoption of ASU 2023-07 is permitted. Management is currently evaluating the impact, if any, of applying ASU 2023-07.
NOTE K
Subsequent Events
Management has evaluated subsequent events for possible recognition or disclosure in the financial statements through the date the financial statements are issued. Management has determined that there are no material events that would require disclosure in the Fund’s financial statements through this date.
| | |
| |
| abfunds.com | | AB DISCOVERY VALUE FUND | 23 |
FINANCIAL HIGHLIGHTS
Selected Data For A Share Of Beneficial Interest Outstanding Throughout Each Period
| | | | | | | | | | | | | | | | | | | | |
| | | Class A | |
| | | Year Ended November 30, | |
| | | 2024 | | | 2023 | | | 2022 | | | 2021 | | | 2020 | |
| | | | |
| | | | | | | | | | | | | | | | | | | | |
Net asset value, beginning of period | | | $ 20.75 | | | | $ 22.19 | | | | $ 26.15 | | | | $ 19.27 | | | | $ 20.27 | |
| | | | |
Income From Investment Operations | | | | | | | | | | | | | | | | | | | | |
| | | | | |
Net investment income(a)(b) | | | .13 | | | | .12 | | | | .17 | | | | .20 | | | | .14 | |
| | | | | |
Net realized and unrealized gain (loss) on investment transactions | | | 5.91 | | | | (.08 | ) | | | (1.73 | ) | | | 6.79 | | | | (.34 | ) |
| | | | | |
Contributions from Affiliates | | | – 0 | – | | | – 0 | – | | | .00 | (c) | | | – 0 | – | | | – 0 | – |
| | | | |
Net increase (decrease) in net asset value from operations | | | 6.04 | | | | .04 | | | | (1.56 | ) | | | 6.99 | | | | (.20 | ) |
| | | | |
Less: Dividends and Distributions | | | | | | | | | | | | | | | | | | | | |
| | | | | |
Dividends from net investment income | | | (.10 | ) | | | (.19 | ) | | | (.22 | ) | | | (.11 | ) | | | (.16 | ) |
| | | | | |
Distributions from net realized gain on investment transactions | | | (1.24 | ) | | | (1.29 | ) | | | (2.18 | ) | | | – 0 | – | | | (.64 | ) |
| | | | |
Total dividends and distributions | | | (1.34 | ) | | | (1.48 | ) | | | (2.40 | ) | | | (.11 | ) | | | (.80 | ) |
| | | | |
Net asset value, end of period | | | $ 25.45 | | | | $ 20.75 | | | | $ 22.19 | | | | $ 26.15 | | | | $ 19.27 | |
| | | | |
| | | | | |
Total Return | | | | | | | | | | | | | | | | | | | | |
| | | | | |
Total investment return based on net asset value(d) | | | 30.87 | % | | | .44 | % | | | (6.98 | )% | | | 36.43 | % | | | (1.09 | )% |
| | | | | |
Ratios/Supplemental Data | | | | | | | | | | | | | | | | | | | | |
| | | | | |
Net assets, end of period (000’s omitted) | | | $251,694 | | | | $227,835 | | | | $260,309 | | | | $327,794 | | | | $258,777 | |
| | | | | |
Ratio to average net assets of: | | | | | | | | | | | | | | | | | | | | |
| | | | | |
Expenses, net of waivers/reimbursements | | | 1.09 | % | | | 1.10 | % | | | 1.08 | % | | | 1.08 | % | | | 1.15 | % |
| | | | | |
Expenses, before waivers/reimbursements | | | 1.09 | % | | | 1.10 | % | | | 1.08 | % | | | 1.08 | % | | | 1.15 | % |
| | | | | |
Net investment income(b) | | | .57 | % | | | .57 | % | | | .75 | % | | | .82 | % | | | .87 | % |
| | | | | |
Portfolio turnover rate | | | 53 | % | | | 52 | % | | | 50 | % | | | 53 | % | | | 52 | % |
See footnote summary on page 29.
| | |
| |
24 | AB DISCOVERY VALUE FUND | | abfunds.com |
FINANCIAL HIGHLIGHTS (continued)
Selected Data For A Share Of Beneficial Interest Outstanding Throughout Each Period
| | | | | | | | | | | | | | | | | | | | |
| | | Class C | |
| | | Year Ended November 30, | |
| | | 2024 | | | 2023 | | | 2022 | | | 2021 | | | 2020 | |
| | | | |
| | | | | | | | | | | | | | | | | | | | |
Net asset value, beginning of period | | | $ 17.23 | | | | $ 18.66 | | | | $ 22.30 | | | | $ 16.47 | | | | $ 17.42 | |
| | | | |
Income From Investment Operations | | | | | | | | | | | | | | | | | | | | |
| | | | | |
Net investment income (loss)(a)(b) | | | (.03 | ) | | | (.03 | ) | | | 0 | (c) | | | .01 | | | | .02 | |
| | | | | |
Net realized and unrealized gain (loss) on investment transactions | | | 4.86 | | | | (.07 | ) | | | (1.45 | ) | | | 5.82 | | | | (.32 | ) |
| | | | | |
Contributions from Affiliates | | | – 0 | – | | | – 0 | – | | | .00 | (c) | | | – 0 | – | | | – 0 | – |
| | | | |
Net increase (decrease) in net asset value from operations | | | 4.83 | | | | (.10 | ) | | | (1.45 | ) | | | 5.83 | | | | (.30 | ) |
| | | | |
Less: Dividends and Distributions | | | | | | | | | | | | | | | | | | | | |
| | | | | |
Dividends from net investment income | | | – 0 | – | | | (.04 | ) | | | (.01 | ) | | | – 0 | – | | | (.01 | ) |
| | | | | |
Distributions from net realized gain on investment transactions | | | (1.24 | ) | | | (1.29 | ) | | | (2.18 | ) | | | – 0 | – | | | (.64 | ) |
| | | | |
Total dividends and distributions | | | (1.24 | ) | | | (1.33 | ) | | | (2.19 | ) | | | – 0 | – | | | (.65 | ) |
| | | | |
Net asset value, end of period | | | $ 20.82 | | | | $ 17.23 | | | | $ 18.66 | | | | $ 22.30 | | | | $ 16.47 | |
| | | | |
| | | | | |
Total Return | | | | | | | | | | | | | | | | | | | | |
| | | | | |
Total investment return based on net asset value(d) | | | 29.92 | % | | | (.28 | )% | | | (7.70 | )% | | | 35.40 | % | | | (1.85 | )% |
| | | | | |
Ratios/Supplemental Data | | | | | | | | | | | | | | | | | | | | |
| | | | | |
Net assets, end of period (000’s omitted) | | | $5,922 | | | | $6,016 | | | | $9,541 | | | | $13,548 | | | | $15,006 | |
| | | | | |
Ratio to average net assets of: | | | | | | | | | | | | | | | | | | | | |
| | | | | |
Expenses, net of waivers/reimbursements | | | 1.84 | % | | | 1.85 | % | | | 1.83 | % | | | 1.83 | % | | | 1.90 | % |
| | | | | |
Expenses, before waivers/reimbursements | | | 1.84 | % | | | 1.85 | % | | | 1.83 | % | | | 1.83 | % | | | 1.90 | % |
| | | | | |
Net investment income (loss)(b) | | | (.18 | )% | | | (.20 | )% | | | (.02 | )% | | | .03 | % | | | .12 | % |
| | | | | |
Portfolio turnover rate | | | 53 | % | | | 52 | % | | | 50 | % | | | 53 | % | | | 52 | % |
See footnote summary on page 29.
| | |
| |
| abfunds.com | | AB DISCOVERY VALUE FUND | 25 |
FINANCIAL HIGHLIGHTS (continued)
Selected Data For A Share Of Beneficial Interest Outstanding Throughout Each Period
| | | | | | | | | | | | | | | | | | | | |
| | | Advisor Class | |
| | | Year Ended November 30, | |
| | | 2024 | | | 2023 | | | 2022 | | | 2021 | | | 2020 | |
| | | | |
| | | | | | | | | | | | | | | | | | | | |
Net asset value, beginning of period | | | $ 21.45 | | | | $ 22.89 | | | | $ 26.90 | | | | $ 19.83 | | | | $ 20.83 | |
| | | | |
Income From Investment Operations | | | | | | | | | | | | | | | | | | | | |
| | | | | |
Net investment income(a)(b) | | | .19 | | | | .17 | | | | .23 | | | | .27 | | | | .19 | |
| | | | | |
Net realized and unrealized gain (loss) on investment transactions | | | 6.11 | | | | (.06 | ) | | | (1.78 | ) | | | 6.96 | | | | (.34 | ) |
| | | | | |
Contributions from Affiliates | | | – 0 | – | | | – 0 | – | | | .00 | (c) | | | – 0 | – | | | – 0 | – |
| | | | |
Net increase (decrease) in net asset value from operations | | | 6.30 | | | | .11 | | | | (1.55 | ) | | | 7.23 | | | | (.15 | ) |
| | | | |
Less: Dividends and Distributions | | | | | | | | | | | | | | | | | | | | |
| | | | | |
Dividends from net investment income | | | (.15 | ) | | | (.26 | ) | | | (.28 | ) | | | (.16 | ) | | | (.21 | ) |
| | | | | |
Distributions from net realized gain on investment transactions | | | (1.24 | ) | | | (1.29 | ) | | | (2.18 | ) | | | – 0 | – | | | (.64 | ) |
| | | | |
Total dividends and distributions | | | (1.39 | ) | | | (1.55 | ) | | | (2.46 | ) | | | (.16 | ) | | | (.85 | ) |
| | | | |
Net asset value, end of period | | | $ 26.36 | | | | $ 21.45 | | | | $ 22.89 | | | | $ 26.90 | | | | $ 19.83 | |
| | | | |
| | | | | |
Total Return | | | | | | | | | | | | | | | | | | | | |
| | | | | |
Total investment return based on net asset value(d) | | | 31.19 | % | | | .73 | % | | | (6.78 | )% | | | 36.76 | % | | | (.82 | )% |
| | | | | |
Ratios/Supplemental Data | | | | | | | | | | | | | | | | | | | | |
| | | | | |
Net assets, end of period (000’s omitted) | | | $1,689,588 | | | | $1,376,938 | | | | $1,485,483 | | | | $1,738,004 | | | | $1,225,735 | |
| | | | | |
Ratio to average net assets of: | | | | | | | | | | | | | | | | | | | | |
| | | | | |
Expenses, net of waivers/reimbursements | | | .84 | % | | | .85 | % | | | .83 | % | | | .83 | % | | | .90 | % |
| | | | | |
Expenses, before waivers/reimbursements | | | .84 | % | | | .85 | % | | | .83 | % | | | .83 | % | | | .90 | % |
| | | | | |
Net investment income(b) | | | .82 | % | | | .82 | % | | | 1.00 | % | | | 1.07 | % | | | 1.10 | % |
| | | | | |
Portfolio turnover rate | | | 53 | % | | | 52 | % | | | 50 | % | | | 53 | % | | | 52 | % |
See footnote summary on page 29.
| | |
| |
26 | AB DISCOVERY VALUE FUND | | abfunds.com |
FINANCIAL HIGHLIGHTS (continued)
Selected Data For A Share Of Beneficial Interest Outstanding Throughout Each Period
| | | | | | | | | | | | | | | | | | | | |
| | | Class I | |
| | | Year Ended November 30, | |
| | | 2024 | | | 2023 | | | 2022 | | | 2021 | | | 2020 | |
| | | | |
| | | | | | | | | | | | | | | | | | | | |
Net asset value, beginning of period | | | $ 20.56 | | | | $ 22.01 | | | | $ 25.96 | | | | $ 19.14 | | | | $ 20.13 | |
| | | | |
Income From Investment Operations | | | | | | | | | | | | | | | | | | | | |
| | | | | |
Net investment income(a)(b) | | | .17 | | | | .16 | | | | .22 | | | | .25 | | | | .18 | |
| | | | | |
Net realized and unrealized gain (loss) on investment transactions | | | 5.85 | | | | (.07 | ) | | | (1.72 | ) | | | 6.73 | | | | (.32 | ) |
| | | | | |
Contributions from Affiliates | | | – 0 | – | | | – 0 | – | | | .00 | (c) | | | – 0 | – | | | – 0 | – |
| | | | |
Net increase (decrease) in net asset value from operations | | | 6.02 | | | | .09 | | | | (1.50 | ) | | | 6.98 | | | | (.14 | ) |
| | | | |
Less: Dividends and Distributions | | | | | | | | | | | | | | | | | | | | |
| | | | | |
Dividends from net investment income | | | (.15 | ) | | | (.25 | ) | | | (.27 | ) | | | (.16 | ) | | | (.21 | ) |
| | | | | |
Distributions from net realized gain on investment transactions | | | (1.24 | ) | | | (1.29 | ) | | | (2.18 | ) | | | – 0 | – | | | (.64 | ) |
| | | | |
Total dividends and distributions | | | (1.39 | ) | | | (1.54 | ) | | | (2.45 | ) | | | (.16 | ) | | | (.85 | ) |
| | | | |
Net asset value, end of period | | | $ 25.19 | | | | $ 20.56 | | | | $ 22.01 | | | | $ 25.96 | | | | $ 19.14 | |
| | | | |
| | | | | |
Total Return | | | | | | | | | | | | | | | | | | | | |
| | | | | |
Total investment return based on net asset value(d) | | | 31.14 | % | | | .68 | % | | | (6.81 | )% | | | 36.71 | % | | | (.79 | )% |
| | | | | |
Ratios/Supplemental Data | | | | | | | | | | | | | | | | | | | | |
| | | | | |
Net assets, end of period (000’s omitted) | | | $152,313 | | | | $127,295 | | | | $132,169 | | | | $152,215 | | | | $178,761 | |
| | | | | |
Ratio to average net assets of: | | | | | | | | | | | | | | | | | | | | |
| | | | | |
Expenses, net of waivers/reimbursements | | | .91 | % | | | .88 | % | | | .86 | % | | | .86 | % | | | .90 | % |
| | | | | |
Expenses, before waivers/reimbursements | | | .91 | % | | | .88 | % | | | .86 | % | | | .86 | % | | | .90 | % |
| | | | | |
Net investment income(b) | | | .76 | % | | | .79 | % | | | .97 | % | | | 1.03 | % | | | 1.11 | % |
| | | | | |
Portfolio turnover rate | | | 53 | % | | | 52 | % | | | 50 | % | | | 53 | % | | | 52 | % |
See footnote summary on page 29.
| | |
| |
| abfunds.com | | AB DISCOVERY VALUE FUND | 27 |
FINANCIAL HIGHLIGHTS (continued)
Selected Data For A Share Of Beneficial Interest Outstanding Throughout Each Period
| | | | | | | | | | | | | | | | | | | | |
| | | Class Z | |
| | | Year Ended November 30, | |
| | | 2024 | | | 2023 | | | 2022 | | | 2021 | | | 2020 | |
| | | | |
| | | | | | | | | | | | | | | | | | | | |
Net asset value, beginning of period | | | $ 20.53 | | | | $ 21.98 | | | | $ 25.93 | | | | $ 19.12 | | | | $ 20.11 | |
| | | | |
Income From Investment Operations | | | | | | | | | | | | | | | | | | | | |
| | | | | |
Net investment income(a)(b) | | | .19 | | | | .17 | | | | .24 | | | | .27 | | | | .20 | |
| | | | | |
Net realized and unrealized gain (loss) on investment transactions | | | 5.83 | | | | (.06 | ) | | | (1.72 | ) | | | 6.72 | | | | (.33 | ) |
| | | | | |
Contributions from Affiliates | | | – 0 | – | | | – 0 | – | | | .00 | (c) | | | – 0 | – | | | – 0 | – |
| | | | |
Net increase (decrease) in net asset value from operations | | | 6.02 | | | | .11 | | | | (1.48 | ) | | | 6.99 | | | | (.13 | ) |
| | | | |
Less: Dividends and Distributions | | | | | | | | | | | | | | | | | | | | |
| | | | | |
Dividends from net investment income | | | (.16 | ) | | | (.27 | ) | | | (.29 | ) | | | (.18 | ) | | | (.22 | ) |
| | | | | |
Distributions from net realized gain on investment transactions | | | (1.24 | ) | | | (1.29 | ) | | | (2.18 | ) | | | – 0 | – | | | (.64 | ) |
| | | | |
Total dividends and distributions | | | (1.40 | ) | | | (1.56 | ) | | | (2.47 | ) | | | (.18 | ) | | | (.86 | ) |
| | | | |
Net asset value, end of period | | | $ 25.15 | | | | $ 20.53 | | | | $ 21.98 | | | | $ 25.93 | | | | $ 19.12 | |
| | | | |
| | | | | |
Total Return | | | | | | | | | | | | | | | | | | | | |
| | | | | |
Total investment return based on net asset value(d) | | | 31.24 | % | | | .77 | % | | | (6.71 | )% | | | 36.76 | % | | | (.71 | )% |
| | | | | |
Ratios/Supplemental Data | | | | | | | | | | | | | | | | | | | | |
| | | | | |
Net assets, end of period (000’s omitted) | | | $542,776 | | | | $698,987 | | | | $905,260 | | | | $972,914 | | | | $897,818 | |
| | | | | |
Ratio to average net assets of: | | | | | | | | | | | | | | | | | | | | |
| | | | | |
Expenses, net of waivers/reimbursements | | | .81 | % | | | .80 | % | | | .79 | % | | | .78 | % | | | .81 | % |
| | | | | |
Expenses, before waivers/reimbursements | | | .81 | % | | | .80 | % | | | .79 | % | | | .78 | % | | | .81 | % |
| | | | | |
Net investment income(b) | | | .87 | % | | | .86 | % | | | 1.05 | % | | | 1.11 | % | | | 1.19 | % |
| | | | | |
Portfolio turnover rate. | | | 53 | % | | | 52 | % | | | 50 | % | | | 53 | % | | | 52 | % |
See footnote summary on page 29.
| | |
| |
28 | AB DISCOVERY VALUE FUND | | abfunds.com |
FINANCIAL HIGHLIGHTS (continued)
Selected Data For A Share Of Beneficial Interest Outstanding Throughout Each Period
| (a) | Based on average shares outstanding. |
| (b) | Net of expenses waived/reimbursed by the Adviser. |
| (c) | Amount is less than $.005. |
| (d) | Total investment return is calculated assuming an initial investment made at the net asset value at the beginning of the period, reinvestment of all dividends and distributions at net asset value during the period, and redemption on the last day of the period. Initial sales charges or contingent deferred sales charges are not reflected in the calculation of total investment return. Total return does not reflect the deduction of taxes that a shareholder would pay on fund distributions or the redemption of fund shares. Total investment return calculated for a period of less than one year is not annualized. |
See notes to financial statements.
| | |
| |
| abfunds.com | | AB DISCOVERY VALUE FUND | 29 |
REPORT OF INDEPENDENT REGISTERED
PUBLIC ACCOUNTING FIRM
To the Shareholders and the Board of Trustees of
AB Discovery Value Fund
Opinion on the Financial Statements
We have audited the accompanying statement of assets and liabilities of AB Discovery Value Fund (the “Fund”) (one of the funds constituting AB Trust (the “Trust”)), including the portfolio of investments, as of November 30, 2024, and the related statement of operations for the year then ended, the statements of changes in net assets for each of the two years in the period then ended, the financial highlights for each of the five years in the period then ended and the related notes (collectively referred to as the “financial statements”). In our opinion, the financial statements present fairly, in all material respects, the financial position of the Fund (one of the funds constituting AB Trust) at November 30, 2024, the results of its operations for the year then ended, the changes in its net assets for each of the two years in the period then ended and its financial highlights for each of the five years in the period then ended, in conformity with U.S. generally accepted accounting principles.
Basis for Opinion
These financial statements are the responsibility of the Trust’s management. Our responsibility is to express an opinion on the Fund’s financial statements based on our audits. We are a public accounting firm registered with the Public Company Accounting Oversight Board (United States) (“PCAOB”) and are required to be independent with respect to the Trust in accordance with the U.S. federal securities laws and the applicable rules and regulations of the Securities and Exchange Commission and the PCAOB.
We conducted our audits in accordance with the standards of the PCAOB. Those standards require that we plan and perform the audit to obtain reasonable assurance about whether the financial statements are free of material misstatement, whether due to error or fraud. The Trust is not required to have, nor were we engaged to perform, an audit of the Trust’s internal control over financial reporting. As part of our audits, we are required to obtain an understanding of internal control over financial reporting but not for the purpose of expressing an opinion on the effectiveness of the Trust’s internal control over financial reporting. Accordingly, we express no such opinion.
Our audits included performing procedures to assess the risks of material misstatement of the financial statements, whether due to error or fraud, and performing procedures that respond to those risks. Such procedures included examining, on a test basis, evidence regarding the amounts and
| | |
| |
30 | AB DISCOVERY VALUE FUND | | abfunds.com |
REPORT OF INDEPENDENT REGISTERED
PUBLIC ACCOUNTING FIRM (continued)
disclosures in the financial statements. Our procedures included confirmation of securities owned as of November 30, 2024, by correspondence with the custodian, brokers and others; when replies were not received from brokers or others, we performed other auditing procedures. Our audits also included evaluating the accounting principles used and significant estimates made by management, as well as evaluating the overall presentation of the financial statements. We believe that our audits provide a reasonable basis for our opinion.

We have served as the auditor of one or more of the AB investment companies since 1968.
New York, New York
January 24, 2025
| | |
| |
| abfunds.com | | AB DISCOVERY VALUE FUND | 31 |
2024 FEDERAL TAX INFORMATION
(unaudited)
For Federal income tax purposes, the following information is furnished with respect to the distributions paid by the Fund during the taxable year ended November 30, 2024. For individual shareholders, the Fund designates 91.02% of dividends paid as qualified dividend income. For corporate shareholders, 90.92% of dividends paid qualify for the dividends received deduction. The Fund designates $137,485,298 of dividends paid as long-term capital gain dividends.
Shareholders should not use the above information to prepare their income tax returns. The information necessary to complete your income tax returns will be included with your Form 1099-DIV which will be sent to you separately in January 2025.
| | |
| |
32 | AB DISCOVERY VALUE FUND | | abfunds.com |
Information Regarding the Review and Approval of the Fund’s Advisory Agreement
The disinterested trustees (the “directors”) of AB Trust (the “Company”) unanimously approved the continuance of the Company’s Advisory Agreement with the Adviser in respect of AB Discovery Value Fund (the “Fund”) at a meeting held by video conference on May 7-9, 2024 (the “Meeting”).
Prior to approval of the continuance of the Advisory Agreement, the directors had requested from the Adviser, and received and evaluated, extensive materials. They reviewed the proposed continuance of the Advisory Agreement with the Adviser and with experienced counsel who are independent of the Adviser, who advised on the relevant legal standards. The directors also reviewed additional materials, including comparative analytical data prepared by the Senior Vice President of the Fund. The directors also discussed the proposed continuance in private sessions with counsel.
The directors considered their knowledge of the nature and quality of the services provided by the Adviser to the Fund gained from their experience as directors or trustees of most of the registered investment companies advised by the Adviser, their overall confidence in the Adviser’s integrity and competence they have gained from that experience, the Adviser’s initiative in identifying and raising potential issues with the directors and its responsiveness, frankness and attention to concerns raised by the directors in the past, including the Adviser’s willingness to consider and implement organizational and operational changes designed to improve investment results and the services provided to the AB Funds. The directors noted that they have four regular meetings each year, at each of which they review extensive materials and information from the Adviser, including information on the investment performance of the Fund and the money market fund advised by the Adviser in which the Fund invests a portion of its assets.
The directors also considered all factors they believed relevant, including the specific matters discussed below. During the course of their deliberations, the directors evaluated, among other things, the reasonableness of the advisory fee. The directors did not identify any particular information that was all-important or controlling, and different directors may have attributed different weights to the various factors. The directors determined that the selection of the Adviser to manage the Fund and the overall arrangements between the Fund and the Adviser, as provided in the Advisory Agreement, including the advisory fee, were fair and reasonable in light of the services performed, expenses incurred and such other matters as the directors considered relevant in the exercise of their business
| | |
| |
| abfunds.com | | AB DISCOVERY VALUE FUND | 33 |
judgment. The material factors and conclusions that formed the basis for the directors’ determinations included the following:
Nature, Extent and Quality of Services Provided
The directors considered the scope and quality of services provided by the Adviser under the Advisory Agreement, including the quality of the investment research capabilities of the Adviser and the other resources it has dedicated to performing services for the Fund. The directors noted that the Adviser from time to time reviews the Fund’s investment strategies and from time to time proposes changes intended to improve the Fund’s relative or absolute performance for the directors’ consideration. They also noted the professional experience and qualifications of the Fund’s portfolio management team and other senior personnel of the Adviser. The directors also considered that the Advisory Agreement provides that the Fund will reimburse the Adviser for the cost to it of providing certain clerical, accounting, administrative and other services to the Fund by employees of the Adviser or its affiliates. Requests for these reimbursements are made on a quarterly basis and subject to approval by the directors. Reimbursements, to the extent requested and paid, result in a higher rate of total compensation from the Fund to the Adviser than the fee rate stated in the Advisory Agreement. The directors noted that the methodology used to determine the reimbursement amounts had been reviewed by an independent consultant retained at the request of the directors. The quality of administrative and other services, including the Adviser’s role in coordinating the activities of the Fund’s other service providers, also was considered. The directors concluded that, overall, they were satisfied with the nature, extent and quality of services provided to the Fund under the Advisory Agreement.
Costs of Services Provided and Profitability
The directors reviewed a schedule of the revenues and expenses and related notes indicating the profitability of the Fund to the Adviser for calendar years 2022 and 2023 that had been prepared with an expense allocation methodology arrived at in consultation with an independent consultant at the request of the directors. The directors noted the assumptions and methods of allocation used by the Adviser in preparing fund-specific profitability data and understood that there are a number of potentially acceptable allocation methodologies for information of this type. The directors noted that the profitability information reflected all revenues and expenses of the Adviser’s relationship with the Fund, including those relating to its subsidiaries that provide transfer agency, distribution and brokerage services to the Fund. The directors recognized that it is difficult to make comparisons of the profitability of the Advisory Agreement with the profitability of fund advisory contracts for unaffiliated funds because comparative information is not generally publicly available and is affected by numerous factors. The directors focused on the profitability of the Adviser’s relationship with the Fund before taxes and distribution
| | |
| |
34 | AB DISCOVERY VALUE FUND | | abfunds.com |
expenses. The directors concluded that the Adviser’s level of profitability from its relationship with the Fund was not unreasonable.
Fall-Out Benefits
The directors considered the other benefits to the Adviser and its affiliates from their relationships with the Fund and the money market fund advised by the Adviser in which the Fund invests, including, but not limited to, benefits relating to soft dollar arrangements (whereby investment advisers receive brokerage and research services from brokers that execute agency transactions for their clients); 12b-1 fees and sales charges received by the Fund’s principal underwriter (which is a wholly owned subsidiary of the Adviser) in respect of certain classes of the Fund’s shares; brokerage commissions paid by the Fund to brokers affiliated with the Adviser; and transfer agency fees paid by the Fund to a wholly owned subsidiary of the Adviser. The directors recognized that the Adviser’s profitability would be somewhat lower without these benefits. The directors understood that the Adviser also might derive reputational and other benefits from its association with the Fund.
Investment Results
In addition to the information reviewed by the directors in connection with the Meeting, the directors receive detailed performance information for the Fund at each regular Board meeting during the year.
At the Meeting, the directors reviewed performance information prepared by an independent service provider (the “15(c) service provider”), showing the performance of the Advisor Class shares of the Fund against a group of similar funds (“peer group”) and a larger group of similar funds (“peer universe”), each selected by the 15(c) service provider, and information prepared by the Adviser showing performance of the Advisor Class shares against a broad-based securities market index, in each case for the 1-, 3-, 5- and 10-year periods ended February 29, 2024 and (in the case of comparisons with the broad-based securities market index) for the period from inception. Based on their review, the directors concluded that the Fund’s investment performance was acceptable.
Advisory Fees and Other Expenses
The directors considered the advisory fee rate payable by the Fund to the Adviser and information prepared by the 15(c) service provider concerning advisory fee rates payable by other funds in the same category as the Fund. The directors recognized that it is difficult to make comparisons of advisory fees because there are variations in the services that are included in the fees paid by other funds. The directors compared the Fund’s contractual effective advisory fee rate with a peer group median and noted that it was lower than the median. They also noted that the Adviser’s total rate of compensation, taking into account the impact of the administrative expense reimbursement paid to the Adviser in the latest fiscal year, was the same as the median.
| | |
| |
| abfunds.com | | AB DISCOVERY VALUE FUND | 35 |
The directors also considered the Adviser’s fee schedule for other clients utilizing investment strategies similar to those of the Fund. For this purpose, they reviewed the relevant advisory fee information from the Adviser’s Form ADV and in a report from the Fund’s Senior Vice President and noted the differences between the Fund’s fee schedule, on the one hand, and the Adviser’s institutional fee schedule and the schedule of fees charged by the Adviser to any offshore funds and for services to any sub-advised funds utilizing investment strategies similar to those of the Fund, on the other. The directors noted that the Adviser may, in some cases, agree to fee rates with large institutional clients that are lower than those reviewed by the directors and that they had previously discussed with the Adviser its policies in respect of such arrangements. The directors also compared the advisory fee rate for the Fund with that for another fund advised by the Adviser utilizing similar investment strategies.
The Adviser reviewed with the directors the significantly greater scope of the services it provides to the Fund relative to institutional, offshore fund and sub-advised fund clients. In this regard, the Adviser noted, among other things, that, compared to institutional and offshore or sub-advisory accounts, the Fund (i) demands considerably more portfolio management, research and trading resources due to significantly higher daily cash flows; (ii) has more tax and regulatory restrictions and compliance obligations; (iii) must prepare and file or distribute regulatory and other communications about fund operations; and (iv) must provide shareholder servicing to retail investors. The Adviser also reviewed the greater legal risks presented by the large and changing population of Fund shareholders who may assert claims against the Adviser in individual or class actions, and the greater entrepreneurial risk in offering new fund products, which require substantial investment to launch, may not succeed, and generally must be priced to compete with larger, more established funds resulting in lack of profitability to the Adviser until a new fund achieves scale. In light of the substantial differences in services rendered by the Adviser to institutional, offshore fund and sub-advised fund clients as compared to the Fund, and the different risk profile, the directors considered these fee comparisons inapt and did not place significant weight on them in their deliberations.
In connection with their review of the Fund’s advisory fee, the directors also considered the total expense ratio of the Advisor Class shares of the Fund in comparison to the medians for a peer group and a peer universe selected by the 15(c) service provider. The Advisor Class expense ratio of the Fund was based on the Fund’s latest fiscal year. The directors noted that it was likely that the expense ratios of some of the other funds in the Fund’s category were lowered by waivers or reimbursements by those funds’ investment advisers, which in some cases might be voluntary or temporary. The directors view expense ratio information as relevant to their evaluation of the Adviser’s services because the Adviser is responsible for coordinating services provided to the Fund by others. The directors noted
| | |
| |
36 | AB DISCOVERY VALUE FUND | | abfunds.com |
that the Fund’s expense ratio was lower than the medians. Based on their review, the directors concluded that the Fund’s expense ratio was acceptable.
Economies of Scale
The directors noted that the advisory fee schedule for the Fund contains breakpoints and that the Fund’s net assets were higher than a breakpoint level. Accordingly, the Fund’s current effective advisory fee rate reflected a reduction due to the breakpoint and would be further reduced to the extent the net assets of the Fund increase. The directors took into consideration prior presentations by an independent consultant on economies of scale in the mutual fund industry and for the AB Funds, and presentations from time to time by the Adviser concerning certain of its views on economies of scale. The directors also had requested and received from the Adviser certain updates on economies of scale in advance of the Meeting. The directors believe that economies of scale may be realized (if at all) by the Adviser across a variety of products and services, and not only in respect of a single fund. The directors noted that there is no established methodology for setting breakpoints that give effect to the fund-specific services provided by a fund’s adviser and to the economies of scale that an adviser may realize in its overall mutual fund business or those components of it which directly or indirectly affect a fund’s operations. The directors observed that in the mutual fund industry as a whole, as well as among funds similar to the Fund, there is no uniformity or pattern in the fees and asset levels at which breakpoints (if any) apply. The directors also noted that the advisory agreements for many funds do not have breakpoints at all. Having taken these factors into account, the directors concluded that the Fund’s breakpoint arrangements were acceptable and provide a means for sharing any economies of scale.
| | |
| |
| abfunds.com | | AB DISCOVERY VALUE FUND | 37 |
NOTES
| | |
| |
38 | AB DISCOVERY VALUE FUND | | abfunds.com |
NOTES
| | |
| |
| abfunds.com | | AB DISCOVERY VALUE FUND | 39 |
NOTES
| | |
| |
40 | AB DISCOVERY VALUE FUND | | abfunds.com |
AB DISCOVERY VALUE FUND
66 Hudson Boulevard East
New York, NY 10001
800 221 5672
DV-0151-1124 
NOV 11.30.24

ANNUAL FINANCIAL STATEMENTS AND ADDITIONAL INFORMATION
AB INTERNATIONAL VALUE FUND

| | |
| |
| Investment Products Offered | | • Are Not FDIC Insured • May Lose Value • Are Not Bank Guaranteed |
Investors should consider the investment objectives, risks, charges and expenses of the Fund carefully before investing. For copies of our prospectus or summary prospectus, which contain this and other information, visit us online at www.abfunds.com or contact your AB representative. Please read the prospectus and/or summary prospectus carefully before investing.
This shareholder report must be preceded or accompanied by the Fund’s prospectus for individuals who are not current shareholders of the Fund.
You may obtain a description of the Fund’s proxy voting policies and procedures, and information regarding how the Fund voted proxies relating to portfolio securities during the most recent 12-month period ended June 30, without charge. Simply visit AB’s website at www.abfunds.com, or go to the Securities and Exchange Commission’s (the “Commission”) website at www.sec.gov, or call AB at (800) 227 4618.
The Fund files its complete schedule of portfolio holdings with the Commission for the first and third quarters of each fiscal year as an exhibit to its reports on Form N-PORT. The Fund’s Form N-PORT reports are available on the Commission’s website at www.sec.gov. AB publishes full portfolio holdings for the Fund monthly at www.abfunds.com.
AllianceBernstein Investments, Inc. (ABI) is the distributor of the AB family of mutual funds. ABI is a member of FINRA and is an affiliate of AllianceBernstein L.P., the Adviser of the funds.
The [A/B] logo and AllianceBernstein® are registered trademarks used by permission of the owner, AllianceBernstein L.P.
PORTFOLIO OF INVESTMENTS
November 30, 2024
| | | | | | | | |
| Company | | Shares | | | U.S. $ Value | |
| |
COMMON STOCKS – 97.1% | | | | | | | | |
Industrials – 18.3% | | | | | | | | |
Aerospace & Defense – 7.5% | | | | | | | | |
Airbus SE | | | 14,808 | | | $ | 2,314,575 | |
BAE Systems PLC | | | 92,240 | | | | 1,441,700 | |
Melrose Industries PLC | | | 343,143 | | | | 2,510,879 | |
MTU Aero Engines AG | | | 2,976 | | | | 1,014,573 | |
| | | | | | | | |
| | | | 7,281,727 | |
| | | | | |
Air Freight & Logistics – 0.9% | |
SG Holdings Co., Ltd. | | | 93,800 | | | | 923,111 | |
| | | | | | | | |
|
Construction & Engineering – 1.7% | |
Shimizu Corp.(a) | | | 207,400 | | | | 1,649,080 | |
| | | | | | | | |
|
Electrical Equipment – 0.9% | |
Fuji Electric Co., Ltd. | | | 14,700 | | | | 830,639 | |
| | | | | | | | |
|
Machinery – 5.8% | |
Amada Co., Ltd. | | | 86,100 | | | | 830,596 | |
IHI Corp. | | | 20,500 | | | | 1,062,409 | |
Kawasaki Heavy Industries Ltd. | | | 25,600 | | | | 950,721 | |
Techtronic Industries Co., Ltd. | | | 104,500 | | | | 1,487,360 | |
Toyota Industries Corp. | | | 18,500 | | | | 1,382,881 | |
| | | | | | | | |
| | | | 5,713,967 | |
| | | | | |
Passenger Airlines – 1.5% | |
Ryanair Holdings PLC (Sponsored ADR)(a) | | | 32,752 | | | | 1,442,398 | |
| | | | | | | | |
| | | | | | | 17,840,922 | |
| | | | | | | | |
Financials – 13.0% | |
Banks – 10.4% | |
ABN AMRO Bank NV | | | 70,640 | | | | 1,095,146 | |
Danske Bank A/S | | | 48,986 | | | | 1,409,434 | |
Erste Group Bank AG | | | 37,152 | | | | 2,039,290 | |
NatWest Group PLC | | | 550,375 | | | | 2,823,063 | |
Resona Holdings, Inc. | | | 326,600 | | | | 2,731,538 | |
| | | | | | | | |
| | | | | | | 10,098,471 | |
| | | | | | | | |
Insurance – 2.6% | |
ASR Nederland NV | | | 28,176 | | | | 1,346,625 | |
Prudential PLC(a) | | | 148,609 | | | | 1,217,954 | |
| | | | | | | | |
| | | | | | | 2,564,579 | |
| | | | | | | | |
| | | | | | | 12,663,050 | |
| | | | | | | | |
Consumer Discretionary – 11.5% | |
Automobiles – 2.5% | |
Honda Motor Co., Ltd. | | | 144,700 | | | | 1,248,470 | |
Subaru Corp. | | | 77,300 | | | | 1,240,403 | |
| | | | | | | | |
| | | | | | | 2,488,873 | |
| | | | | | | | |
| | |
| |
| abfunds.com | | AB INTERNATIONAL VALUE FUND | 1 |
PORTFOLIO OF INVESTMENTS (continued)
| | | | | | | | |
| Company | | Shares | | | U.S. $ Value | |
| |
Hotels, Restaurants & Leisure – 0.8% | |
Entain PLC(a) | | | 75,410 | | | $ | 773,428 | |
| | | | | | | | |
|
Household Durables – 3.4% | |
Persimmon PLC | | | 50,550 | | | | 809,787 | |
Sony Group Corp. | | | 126,400 | | | | 2,537,647 | |
| | | | | | | | |
| | | | | | | 3,347,434 | |
| | | | | | | | |
Specialty Retail – 3.1% | |
Industria de Diseno Textil SA(a) | | | 33,766 | | | | 1,863,316 | |
JD Sports Fashion PLC | | | 884,562 | | | | 1,148,488 | |
| | | | | | | | |
| | | | | | | 3,011,804 | |
| | | | | | | | |
Textiles, Apparel & Luxury Goods – 1.7% | |
Burberry Group PLC(a) | | | 145,550 | | | | 1,665,958 | |
| | | | | | | | |
| | | | | | | 11,287,497 | |
| | | | | | | | |
Consumer Staples – 11.3% | |
Beverages – 3.0% | |
Coca-Cola Europacific Partners PLC | | | 22,114 | | | | 1,715,604 | |
Heineken NV(a) | | | 16,303 | | | | 1,206,750 | |
| | | | | | | | |
| | | | | | | 2,922,354 | |
| | | | | | | | |
Consumer Staples Distribution & Retail – 3.9% | |
Carrefour SA | | | 90,233 | | | | 1,374,152 | |
Koninklijke Ahold Delhaize NV | | | 70,907 | | | | 2,446,495 | |
| | | | | | | | |
| | | | | | | 3,820,647 | |
| | | | | | | | |
Food Products – 2.2% | |
Nestle SA (REG) | | | 24,420 | | | | 2,120,625 | |
| | | | | | | | |
|
Personal Care Products – 2.2% | |
Haleon PLC | | | 457,079 | | | | 2,180,320 | |
| | | | | | | | |
| | | | | | | 11,043,946 | |
| | | | | | | | |
Health Care – 10.1% | |
Health Care Equipment & Supplies – 2.3% | |
ResMed, Inc. | | | 90,830 | | | | 2,278,548 | |
| | | | | | | | |
|
Health Care Providers & Services – 1.7% | |
Fresenius SE & Co. KGaA(b) | | | 47,977 | | | | 1,688,831 | |
| | | | | | | | |
|
Pharmaceuticals – 6.1% | |
GSK PLC | | | 70,475 | | | | 1,197,251 | |
Merck KGaA | | | 8,516 | | | | 1,276,412 | |
Roche Holding AG (Genusschein) | | | 11,875 | | | | 3,450,290 | |
| | | | | | | | |
| | | | | | | 5,923,953 | |
| | | | | | | | |
| | | | | | | 9,891,332 | |
| | | | | | | | |
Materials – 8.8% | |
Chemicals – 4.3% | |
Arkema SA | | | 16,342 | | | | 1,296,679 | |
Kuraray Co., Ltd. | | | 109,300 | | | | 1,489,338 | |
| | |
| |
2 | AB INTERNATIONAL VALUE FUND | | abfunds.com |
PORTFOLIO OF INVESTMENTS (continued)
| | | | | | | | |
| Company | | Shares | | | U.S. $ Value | |
| |
Tosoh Corp. | | | 101,500 | | | $ | 1,400,865 | |
| | | | | | | | |
| | | | | | | 4,186,882 | |
| | | | | | | | |
Construction Materials – 2.3% | |
CRH PLC | | | 22,143 | | | | 2,264,565 | |
| | | | | | | | |
|
Metals & Mining – 2.2% | |
Endeavour Mining PLC(a) | | | 45,346 | | | | 890,698 | |
Lundin Mining Corp.(a) | | | 125,832 | | | | 1,234,907 | |
| | | | | | | | |
| | | | | | | 2,125,605 | |
| | | | | | | | |
| | | | | | | 8,577,052 | |
| | | | | | | | |
Energy – 8.5% | |
Energy Equipment & Services – 4.9% | | | | | | | | |
Shell PLC | | | 103,141 | | | | 3,345,851 | |
Vallourec SACA(b) | | | 84,273 | | | | 1,480,264 | |
| | | | | | | | |
| | | | | | | 4,826,115 | |
| | | | | | | | |
Oil, Gas & Consumable Fuels – 3.6% | |
Cameco Corp. (Toronto)(a) | | | 34,950 | | | | 2,093,181 | |
Repsol SA | | | 113,857 | | | | 1,425,126 | |
| | | | | | | | |
| | | | | | | 3,518,307 | |
| | | | | | | | |
| | | | | | | 8,344,422 | |
| | | | | | | | |
Information Technology – 6.7% | |
Semiconductors & Semiconductor
Equipment – 5.4% | | | | | | | | |
NXP Semiconductors NV | | | 5,550 | | | | 1,273,003 | |
Taiwan Semiconductor Manufacturing Co., Ltd. | | | 60,000 | | | | 1,869,633 | |
Tokyo Electron Ltd. | | | 13,600 | | | | 2,132,236 | |
| | | | | | | | |
| | | | | | | 5,274,872 | |
| | | | | | | | |
Technology Hardware, Storage &
Peripherals – 1.3% | |
Samsung Electronics Co., Ltd. | | | 31,710 | | | | 1,246,939 | |
| | | | | | | | |
| | | | | | | 6,521,811 | |
| | | | | | | | |
Communication Services – 5.5% | |
Diversified Telecommunication Services – 5.5% | |
Deutsche Telekom AG (REG) | | | 78,359 | | | | 2,506,776 | |
Koninklijke KPN NV | | | 366,711 | | | | 1,422,592 | |
Telstra Group Ltd.(a) | | | 563,997 | | | | 1,452,413 | |
| | | | | | | | |
| | | | | | | 5,381,781 | |
| | | | | | | | |
Utilities – 3.4% | |
Electric Utilities – 3.4% | |
EDP SA | | | 482,595 | | | | 1,746,057 | |
Enel SpA | | | 224,170 | | | | 1,614,358 | |
| | | | | | | | |
| | | | | | | 3,360,415 | |
| | | | | | | | |
Total Common Stocks
(cost $81,747,761) | | | | | | | 94,912,228 | |
| | | | | | | | |
| | |
| |
| abfunds.com | | AB INTERNATIONAL VALUE FUND | 3 |
PORTFOLIO OF INVESTMENTS (continued)
| | | | | | | | |
| Company | | Shares | | | U.S. $ Value | |
| |
SHORT-TERM INVESTMENTS – 2.2% | | | | | | | | |
Investment Companies – 2.2% | |
AB Fixed Income Shares, Inc. – Government Money Market Portfolio – Class AB,
4.54%(c)(d)(e)
(cost $2,137,358) | | | 2,137,358 | | | $ | 2,137,358 | |
| | | | | | | | |
Total Investments Before Security Lending Collateral for Securities Loaned – 99.3%
(cost $83,885,119) | | | | | | | 97,049,586 | |
| | | | | |
INVESTMENTS OF CASH COLLATERAL FOR SECURITIES LOANED – 0.2% | | | | | | | | |
Investment Companies – 0.2% | |
AB Fixed Income Shares, Inc. – Government Money Market Portfolio – Class AB,
4.54%(c)(d)(e)
(cost $195,388) | | | 195,388 | | | | 195,388 | |
| | | | | | | | |
| | |
Total Investments – 99.5%
(cost $84,080,507) | | | | | | | 97,244,974 | |
Other assets less liabilities – 0.5% | | | | | | | 482,330 | |
| | | | | | | | |
| | |
Net Assets – 100.0% | | | | | | $ | 97,727,304 | |
| | | | | | | | |
FORWARD CURRENCY EXCHANGE CONTRACTS (see Note D)
| | | | | | | | | | | | | | | | |
| Counterparty | | Contracts to
Deliver
(000) | | | In Exchange
For
(000) | | | Settlement
Date | | | Unrealized
Appreciation
(Depreciation) | |
Bank of America, NA | | USD | 4,636 | | | CHF | 3,995 | | | | 12/20/2024 | | | $ | (91,765 | ) |
Bank of America, NA | | GBP | 2,073 | | | USD | 2,669 | | | | 01/16/2025 | | | | 31,706 | |
Bank of America, NA | | USD | 6,387 | | | AUD | 9,828 | | | | 02/05/2025 | | | | 25,901 | |
Bank of America, NA | | TWD | 52,591 | | | USD | 1,629 | | | | 02/27/2025 | | | | (3,775 | ) |
Citibank, NA | | USD | 574 | | | JPY | 85,111 | | | | 12/19/2024 | | | | (3,945 | ) |
Citibank, NA | | KRW | 1,629,168 | | | USD | 1,217 | | | | 01/17/2025 | | | | 46,664 | |
Citibank, NA | | CAD | 4,127 | | | USD | 2,986 | | | | 02/05/2025 | | | | 31,312 | |
Goldman Sachs Bank USA | | JPY | 76,835 | | | USD | 508 | | | | 12/19/2024 | | | | (6,204 | ) |
HSBC BANK USA | | USD | 110 | | | KRW | 153,334 | | | | 01/17/2025 | | | | 20 | |
Morgan Stanley Capital Services, Inc. | | USD | 1,197 | | | SGD | 1,566 | | | | 12/17/2024 | | | | (26,764 | ) |
Morgan Stanley Capital Services, Inc. | | USD | 2,059 | | | JPY | 305,212 | | | | 12/19/2024 | | | | (14,560 | ) |
Morgan Stanley Capital Services, Inc. | | KRW | 380,319 | | | USD | 277 | | | | 01/17/2025 | | | | 3,691 | |
Morgan Stanley Capital Services, Inc. | | KRW | 228,282 | | | USD | 163 | | | | 01/17/2025 | | | | (627 | ) |
Morgan Stanley Capital Services, Inc. | | USD | 3,269 | | | SEK | 35,958 | | | | 02/05/2025 | | | | 43,561 | |
State Street Bank & Trust Co. | | USD | 664 | | | ILS | 2,484 | | | | 12/11/2024 | | | | 20,224 | |
State Street Bank & Trust Co. | | USD | 191 | | | TRY | 6,782 | | | | 12/18/2024 | | | | 1,196 | |
State Street Bank & Trust Co. | | HKD | 9,262 | | | USD | 1,194 | | | | 12/19/2024 | | | | 2,913 | |
State Street Bank & Trust Co. | | JPY | 434,010 | | | USD | 2,838 | | | | 12/19/2024 | | | | (69,249 | ) |
State Street Bank & Trust Co. | | USD | 2,588 | | | JPY | 394,930 | | | | 12/19/2024 | | | | 57,383 | |
State Street Bank & Trust Co. | | CHF | 826 | | | USD | 956 | | | | 12/20/2024 | | | | 16,916 | |
State Street Bank & Trust Co. | | CHF | 227 | | | USD | 257 | | | | 12/20/2024 | | | | (859 | ) |
State Street Bank & Trust Co. | | EUR | 1,537 | | | USD | 1,669 | | | | 12/20/2024 | | | | 43,771 | |
State Street Bank & Trust Co. | | EUR | 510 | | | USD | 537 | | | | 12/20/2024 | | | | (2,261 | ) |
State Street Bank & Trust Co. | | USD | 189 | | | CHF | 162 | | | | 12/20/2024 | | | | (4,336 | ) |
| | |
| |
4 | AB INTERNATIONAL VALUE FUND | | abfunds.com |
PORTFOLIO OF INVESTMENTS (continued)
| | | | | | | | | | | | | | | | |
| Counterparty | | Contracts to
Deliver
(000) | | | In Exchange
For
(000) | | | Settlement
Date | | | Unrealized
Appreciation
(Depreciation) | |
State Street Bank & Trust Co. | | USD | 771 | | | EUR | 730 | | | | 12/20/2024 | | | $ | 741 | |
State Street Bank & Trust Co. | | USD | 2,014 | | | EUR | 1,871 | | | | 12/20/2024 | | | | (36,330 | ) |
State Street Bank & Trust Co. | | GBP | 250 | | | USD | 322 | | | | 01/16/2025 | | | | 3,523 | |
State Street Bank & Trust Co. | | GBP | 460 | | | USD | 580 | | | | 01/16/2025 | | | | (5,501 | ) |
State Street Bank & Trust Co. | | USD | 317 | | | GBP | 250 | | | | 01/16/2025 | | | | 1,496 | |
State Street Bank & Trust Co. | | USD | 382 | | | GBP | 299 | | | | 01/16/2025 | | | | (1,266 | ) |
State Street Bank & Trust Co. | | CAD | 356 | | | USD | 256 | | | | 02/05/2025 | | | | 731 | |
State Street Bank & Trust Co. | | SEK | 2,714 | | | USD | 247 | | | | 02/05/2025 | | | | (2,841 | ) |
State Street Bank & Trust Co. | | USD | 163 | | | AUD | 251 | | | | 02/05/2025 | | | | 598 | |
State Street Bank & Trust Co. | | USD | 813 | | | NOK | 8,993 | | | | 02/05/2025 | | | | 1,771 | |
UBS AG | | EUR | 5,167 | | | USD | 5,580 | | | | 12/20/2024 | | | | 115,846 | |
UBS AG | | USD | 275 | | | KRW | 377,182 | | | | 01/17/2025 | | | | (3,816 | ) |
| | | | | | | | | | | | | | | | |
| | | $ | 175,865 | |
| | | | | | | | | | | | | | | | |
| (a) | Represents entire or partial securities out on loan. See Note E for securities lending information. |
| (b) | Non-income producing security. |
| (c) | Affiliated investments. |
| (d) | The rate shown represents the 7-day yield as of period end. |
| (e) | To obtain a copy of the fund’s shareholder report, please go to the Securities and Exchange Commission’s website at www.sec.gov, or call AB at (800) 227-4618. |
Currency Abbreviations:
AUD – Australian Dollar
CAD – Canadian Dollar
CHF – Swiss Franc
EUR – Euro
GBP – Great British Pound
HKD – Hong Kong Dollar
ILS – Israeli Shekel
JPY – Japanese Yen
KRW – South Korean Won
NOK – Norwegian Krone
SEK – Swedish Krona
SGD – Singapore Dollar
TRY – Turkish Lira
TWD – New Taiwan Dollar
USD – United States Dollar
Glossary:
ADR – American Depositary Receipt
REG – Registered Shares
See notes to financial statements.
| | |
| |
| abfunds.com | | AB INTERNATIONAL VALUE FUND | 5 |
STATEMENT OF ASSETS & LIABILITIES
November 30, 2024
| | | | |
| Assets | |
Investments in securities, at value | |
Unaffiliated issuers (cost $81,747,761) | | $ | 94,912,228 | (a) |
Affiliated issuers (cost $2,332,746—including investment of cash collateral for securities loaned of $195,388) | | | 2,332,746 | |
Cash | | | 14 | |
Foreign currencies, at value (cost $110,917) | | | 110,995 | |
Unaffiliated dividends receivable | | | 642,645 | |
Unrealized appreciation on forward currency exchange contracts | | | 449,964 | |
Receivable due from Adviser | | | 78,421 | |
Receivable for shares of beneficial interest sold | | | 64,064 | |
Affiliated dividends receivable | | | 8,610 | |
| | | | |
Total assets | | | 98,599,687 | |
| | | | |
| Liabilities | |
Unrealized depreciation on forward currency exchange contracts | | | 274,099 | |
Payable for collateral received on securities loaned | | | 195,388 | |
Payable for shares of beneficial interest redeemed | | | 96,241 | |
Custody and accounting fees payable | | | 66,571 | |
Advisory fee payable | | | 59,762 | |
Audit and tax fee payable | | | 50,667 | |
Administrative fee payable | | | 43,103 | |
Transfer Agent fee payable | | | 15,952 | |
Distribution fee payable | | | 14,985 | |
Trustees’ fees payable | | | 731 | |
Payable for investment securities purchased and foreign currency transactions | | | 33 | |
Accrued expenses | | | 54,851 | |
| | | | |
Total liabilities | | | 872,383 | |
| | | | |
Net Assets | | $ | 97,727,304 | |
| | | | |
| Composition of Net Assets | |
Paid-in capital | | $ | 199,229,729 | |
Accumulated loss | | | (101,502,425 | ) |
| | | | |
Net Assets | | $ | 97,727,304 | |
| | | | |
Net Asset Value Per Share—unlimited shares authorized, without par value
| | | | | | | | | | | | |
| Class | | Net Assets | | | Shares
Outstanding | | | Net Asset
Value | |
| |
| A | | $ | 69,281,270 | | | | 4,774,801 | | | $ | 14.51 | * |
| |
| C | | $ | 1,071,234 | | | | 74,766 | | | $ | 14.33 | |
| |
| Advisor | | $ | 26,556,267 | | | | 1,784,641 | | | $ | 14.88 | |
| |
| I | | $ | 818,533 | | | | 57,166 | | | $ | 14.32 | |
| |
| (a) | Includes securities on loan with a value of $7,338,909 (see Note E). |
| * | The maximum offering price per share for Class A shares was $15.15 which reflects a sales charge of 4.25%. |
See notes to financial statements.
| | |
| |
6 | AB INTERNATIONAL VALUE FUND | | abfunds.com |
STATEMENT OF OPERATIONS
Year Ended November 30, 2024
| | | | | | | | |
| Investment Income | |
Dividends | |
Unaffiliated issuers (net of foreign taxes withheld of $348,589) | | $ | 3,259,706 | | | | | |
Affiliated issuers | | | 113,703 | | | | | |
Interest | | | 843 | | | | | |
Securities lending income | | | 8,727 | | | $ | 3,382,979 | |
| | | | | | | | |
| Expenses | | | | | | | | |
Advisory fee (see Note B) | | | 790,094 | | | | | |
Distribution fee—Class A | | | 175,490 | | | | | |
Distribution fee—Class C | | | 11,170 | | | | | |
Distribution fee—Class R | | | 10,730 | | | | | |
Distribution fee—Class K | | | 9,558 | | | | | |
Transfer agency—Class A | | | 174,986 | | | | | |
Transfer agency—Class C | | | 3,055 | | | | | |
Transfer agency—Advisor Class | | | 67,825 | | | | | |
Transfer agency—Class R | | | 5,411 | | | | | |
Transfer agency—Class K | | | 7,647 | | | | | |
Transfer agency—Class I | | | 969 | | | | | |
Administrative | | | 110,088 | | | | | |
Registration fees | | | 83,035 | | | | | |
Audit and tax | | | 76,144 | | | | | |
Custody and accounting | | | 78,103 | | | | | |
Printing | | | 63,668 | | | | | |
Legal | | | 57,092 | | | | | |
Trustees’ fees | | | 21,945 | | | | | |
Miscellaneous | | | 30,650 | | | | | |
| | | | | | | | |
Total expenses | | | 1,777,660 | | | | | |
Less: expenses waived and reimbursed by the Adviser (see Notes B & E) | | | (535,410 | ) | | | | |
| | | | | | | | |
Net expenses | | | | | | | 1,242,250 | |
| | | | | |
Net investment income | | | | | | | 2,140,729 | |
| | | | | |
| Realized and Unrealized Gain (Loss) on Investment and Foreign Currency Transactions | | | | | | | | |
Net realized gain (loss) on: | | | | | | | | |
Investment transactions | | | | | | | 5,445,147 | |
Forward currency exchange contracts | | | | | | | (419,319 | ) |
Foreign currency transactions | | | | | | | (53,382 | ) |
Net change in unrealized appreciation (depreciation) of: | | | | | | | | |
Investments | | | | | | | 5,688,162 | |
Forward currency exchange contracts | | | | | | | 226,139 | |
Foreign currency denominated assets and liabilities | | | | | | | (17,932 | ) |
| | | | | | | | |
Net gain on investment and foreign currency transactions | | | | | | | 10,868,815 | |
| | | | | | | | |
Net Increase in Net Assets from Operations | | | | | | $ | 13,009,544 | |
| | | | | |
See notes to financial statements.
| | |
| |
| abfunds.com | | AB INTERNATIONAL VALUE FUND | 7 |
STATEMENT OF CHANGES IN NET ASSETS
| | | | | | | | |
| | | Year Ended
November 30,
2024 | | | Year Ended
November 30,
2023 | |
| Increase (Decrease) in Net Assets from Operations | | | | | | | | |
Net investment income | | $ | 2,140,729 | | | $ | 2,101,417 | |
Net realized gain (loss) on investment and foreign currency transactions | | | 4,972,446 | | | | (869,158 | ) |
Net change in unrealized appreciation (depreciation) of investments and foreign currency denominated assets and liabilities | | | 5,896,369 | | | | 9,320,084 | |
| | | | | | | | |
Net increase in net assets from operations | | | 13,009,544 | | | | 10,552,343 | |
| Distributions to Shareholders | | | | | | | | |
Class A | | | (5,407,956 | ) | | | (798,838 | ) |
Class C | | | (67,055 | ) | | | (3,034 | ) |
Advisor Class | | | (2,160,450 | ) | | | (368,472 | ) |
Class R | | | (45,450 | ) | | | (39,228 | ) |
Class K | | | (101,968 | ) | | | (50,584 | ) |
Class I | | | (66,567 | ) | | | (19,343 | ) |
| Transactions in Shares of Beneficial Interest | | | | | | | | |
Net decrease | | | (17,097,709 | ) | | | (6,452,259 | ) |
| | | | | | | | |
Total increase (decrease) | | | (11,937,611 | ) | | | 2,820,585 | |
| Net Assets | |
Beginning of period | | | 109,664,915 | | | | 106,844,330 | |
| | | | | | | | |
End of period | | $ | 97,727,304 | | | $ | 109,664,915 | |
| | | | | | | | |
See notes to financial statements.
| | |
| |
8 | AB INTERNATIONAL VALUE FUND | | abfunds.com |
NOTES TO FINANCIAL STATEMENTS
November 30, 2024
NOTE A
Significant Accounting Policies
AB Trust (the “Trust”) is organized as a Massachusetts business trust and is registered under the Investment Company Act of 1940 (the “1940 Act”) as a diversified, open-end management investment company. The Trust operates as a series company currently comprised of three funds. Each fund is considered to be a separate entity for financial reporting and tax purposes. This report relates only to the AB International Value Fund (the “Fund”), a diversified fund. The Fund offers Class A, Class C, Advisor Class, and Class I shares. Class B, Class R and Class K shares have been authorized but currently are not offered. Effective May 20, 2024, Class R and Class K were liquidated. Class A shares are sold with a front-end sales charge of up to 4.25% for purchases not exceeding $1,000,000. With respect to purchases of $1,000,000 or more, Class A shares redeemed within one year of purchase may be subject to a contingent deferred sales charge of 1%. Class C shares are subject to a contingent deferred sales charge of 1% on redemptions made within the first year after purchase, and 0% after the first year of purchase. Class C shares automatically convert to Class A shares eight years after the end of the calendar month of purchase. Advisor Class and Class I shares are sold without an initial or contingent deferred sales charge and are not subject to ongoing distribution expenses. All seven classes of shares have identical voting, dividend, liquidation and other rights, except that the classes bear different distribution and transfer agency expenses. Each class has exclusive voting rights with respect to its distribution plan. The financial statements have been prepared in conformity with U.S. generally accepted accounting principles (“U.S. GAAP”), which require management to make certain estimates and assumptions that affect the reported amounts of assets and liabilities in the financial statements and amounts of income and expenses during the reporting period. Actual results could differ from those estimates. The Fund is an investment company under U.S. GAAP and follows the accounting and reporting guidance applicable to investment companies. The following is a summary of significant accounting policies followed by the Fund.
1. Security Valuation
Portfolio securities are valued at market value determined on the basis of market quotations or, if market quotations are not readily available or are unreliable, at “fair value” as determined in accordance with procedures approved by and under the oversight of the Trust’s Board of Trustees (the “Board”). Pursuant to these procedures, AllianceBernstein L.P. (the “Adviser”) serves as the Fund’s valuation designee pursuant to Rule 2a-5 of the 1940 Act. In this capacity, the Adviser is responsible, among other things, for making all fair value determinations relating to the Fund’s portfolio investments, subject to the Board’s oversight.
| | |
| |
| abfunds.com | | AB INTERNATIONAL VALUE FUND | 9 |
NOTES TO FINANCIAL STATEMENTS (continued)
In general, the market values of securities which are readily available and deemed reliable are determined as follows: securities listed on a national securities exchange (other than securities listed on the NASDAQ Stock Market, Inc. (“NASDAQ”)) or on a foreign securities exchange are valued at the last sale price at the close of the exchange or foreign securities exchange. If there has been no sale on such day, the securities are valued at the last traded price from the previous day. Securities listed on more than one exchange are valued by reference to the principal exchange on which the securities are traded; securities listed only on NASDAQ are valued in accordance with the NASDAQ Official Closing Price; listed or over the counter (“OTC”) market put or call options are valued at the mid level between the current bid and ask prices. If either a current bid or current ask price is unavailable, the Adviser will have discretion to determine the best valuation (e.g., last trade price in the case of listed options); open futures are valued using the closing settlement price or, in the absence of such a price, the most recent quoted bid price. If there are no quotations available for the day of valuation, the last available closing settlement price is used; U.S. Government securities and any other debt instruments having 60 days or less remaining until maturity are generally valued at fair value by an independent pricing service. If an independent fair value price is not available, the securities are valued at amortized cost. This methodology is commonly used for short term securities that have an original maturity of 60 days or less, as well as short term securities that had an original term to maturity that exceeded 60 days. In instances when amortized cost is utilized, the Valuation Committee (the “Committee”) must reasonably conclude that the utilization of amortized cost is approximately the same as the fair value of the security. Factors the Committee will consider include, but are not limited to, an impairment of the creditworthiness of the issuer or material changes in interest rates. Fixed-income securities, including mortgage-backed and asset-backed securities, may be valued on the basis of prices provided by a pricing service or at a price obtained from one or more of the major broker-dealers. In cases where broker-dealer quotes are obtained, the Adviser may establish procedures whereby changes in market yields or spreads are used to adjust, on a daily basis, a recently obtained quoted price on a security. Swaps and other derivatives are valued daily, primarily using independent pricing services, independent pricing models using market inputs, as well as third party broker-dealers or counterparties. Open-end mutual funds are valued at the closing net asset value per share, while exchange-traded funds are valued at the closing market price per share.
Securities for which market quotations are not readily available (including restricted securities) or are deemed unreliable are valued at fair value as deemed appropriate by the Adviser. Factors considered in making this determination may include, but are not limited to, information obtained by
| | |
| |
10 | AB INTERNATIONAL VALUE FUND | | abfunds.com |
NOTES TO FINANCIAL STATEMENTS (continued)
contacting the issuer, analysts, analysis of the issuer’s financial statements or other available documents. In addition, the Fund may use fair value pricing for securities primarily traded in non-U.S. markets because most foreign markets close well before the Fund values its securities at 4:00 p.m., Eastern Time. The earlier close of these foreign markets gives rise to the possibility that significant events, including broad market moves, may have occurred in the interim and may materially affect the value of those securities. To account for this, the Fund generally values many of its foreign equity securities using fair value prices based on third party vendor modeling tools to the extent available.
2. Fair Value Measurements
In accordance with U.S. GAAP regarding fair value measurements, fair value is defined as the price that the Fund would receive to sell an asset or pay to transfer a liability in an orderly transaction between market participants at the measurement date. U.S. GAAP establishes a framework for measuring fair value, and a three-level hierarchy for fair value measurements based upon the transparency of inputs to the valuation of an asset or liability (including those valued based on their market values as described in Note A.1 above). Inputs may be observable or unobservable and refer broadly to the assumptions that market participants would use in pricing the asset or liability. Observable inputs reflect the assumptions market participants would use in pricing the asset or liability based on market data obtained from sources independent of the Fund. Unobservable inputs reflect the Fund’s own assumptions about the assumptions that market participants would use in pricing the asset or liability based on the best information available in the circumstances. Each investment is assigned a level based upon the observability of the inputs which are significant to the overall valuation. The three-tier hierarchy of inputs is summarized below.
| | • | | Level 1—quoted prices in active markets for identical investments |
| | • | | Level 2—other significant observable inputs (including quoted prices for similar investments, interest rates, prepayment speeds, credit risk, etc.) |
| | • | | Level 3—significant unobservable inputs (including the Fund’s own assumptions in determining the fair value of investments) |
The fair value of debt instruments, such as bonds, and over-the-counter derivatives is generally based on market price quotations, recently executed market transactions (where observable) or industry recognized modeling techniques and are generally classified as Level 2. Pricing vendor inputs to Level 2 valuations may include quoted prices for similar investments in active markets, interest rates, coupon rates, yield curves, option adjusted spreads, default rates, credit spreads and other unique security features in order to estimate the relevant cash flows which is then
| | |
| |
| abfunds.com | | AB INTERNATIONAL VALUE FUND | 11 |
NOTES TO FINANCIAL STATEMENTS (continued)
discounted to calculate fair values. If these inputs are unobservable and significant to the fair value, these investments will be classified as Level 3.
Where readily available market prices or relevant bid prices are not available for certain equity investments, such investments may be valued based on similar publicly traded investments, movements in relevant indices since last available prices or based upon underlying company fundamentals and comparable company data (such as multiples to earnings or other multiples to equity). Where an investment is valued using an observable input, such as another publicly traded security, the investment will be classified as Level 2. If management determines that an adjustment is appropriate based on restrictions on resale, illiquidity or uncertainty, and such adjustment is a significant component of the valuation, the investment will be classified as Level 3. An investment will also be classified as Level 3 where management uses company fundamentals and other significant inputs to determine the valuation.
The following table summarizes the valuation of the Fund’s investments by the above fair value hierarchy levels as of November 30, 2024:
| | | | | | | | | | | | | | | | |
Investments in Securities: | | Level 1 | | | Level 2 | | | Level 3 | | | Total | |
Assets: | | | | | | | | | | | | | | | | |
Common Stocks: | | | | | | | | | | | | | | | | |
Industrials | | $ | 1,442,398 | | | $ | 16,398,524 | | | $ | – 0 | – | | $ | 17,840,922 | |
Financials | | | – 0 | – | | | 12,663,050 | | | | – 0 | – | | | 12,663,050 | |
Consumer Discretionary | | | – 0 | – | | | 11,287,497 | | | | – 0 | – | | | 11,287,497 | |
Consumer Staples | | | 4,162,099 | | | | 6,881,847 | | | | – 0 | – | | | 11,043,946 | |
Health Care | | | – 0 | – | | | 9,891,332 | | | | – 0 | – | | | 9,891,332 | |
Materials | | | 3,499,472 | | | | 5,077,580 | | | | – 0 | – | | | 8,577,052 | |
Energy | | | 2,093,181 | | | | 6,251,241 | | | | – 0 | – | | | 8,344,422 | |
Information Technology | | | 1,273,003 | | | | 5,248,808 | | | | – 0 | – | | | 6,521,811 | |
Communication Services | | | 1,422,592 | | | | 3,959,189 | | | | – 0 | – | | | 5,381,781 | |
Utilities | | | – 0 | – | | | 3,360,415 | | | | – 0 | – | | | 3,360,415 | |
Short-Term Investments | | | 2,137,358 | | | | – 0 | – | | | – 0 | – | | | 2,137,358 | |
Investments of Cash Collateral for Securities Loaned in Affiliated Money Market Fund | | | 195,388 | | | | – 0 | – | | | – 0 | – | | | 195,388 | |
| | | | | | | | | | | | | | | | |
Total Investments in Securities | | | 16,225,491 | | | | 81,019,483 | (a) | | | – 0 | – | | | 97,244,974 | |
Other Financial Instruments(b): | | | | | | | | | | | | | | | | |
Assets: | | | | | | | | | | | | | | | | |
Forward Currency Exchange Contracts | | | – 0 | – | | | 449,964 | | | | – 0 | – | | | 449,964 | |
Liabilities: | | | | | | | | | | | | | | | | |
Forward Currency Exchange Contracts | | | – 0 | – | | | (274,099 | ) | | | – 0 | – | | | (274,099 | ) |
| | | | | | | | | | | | | | | | |
Total | | $ | 16,225,491 | | | $ | 81,195,348 | | | $ | – 0 | – | | $ | 97,420,839 | |
| | | | | | | | | | | | | | | | |
| (a) | A significant portion of the Fund’s foreign equity investments are categorized as Level 2 investments since they are valued using fair value prices based on third party vendor modeling tools to the extent available, see Note A.1. |
| | |
| |
12 | AB INTERNATIONAL VALUE FUND | | abfunds.com |
NOTES TO FINANCIAL STATEMENTS (continued)
| (b) | Other financial instruments include derivative instruments, such as futures, forwards and swaps. Derivative instruments are valued at the unrealized appreciation (depreciation) on the instrument. Other financial instruments may also include swaps with upfront premiums, written options and written swaptions which are valued at market value. |
3. Currency Translation
Assets and liabilities denominated in foreign currencies and commitments under forward currency exchange contracts are translated into U.S. dollars at the mean of the quoted bid and ask prices of such currencies against the U.S. dollar. Purchases and sales of portfolio securities are translated into U.S. dollars at the rates of exchange prevailing when such securities were acquired or sold. Income and expenses are translated into U.S. dollars at rates of exchange prevailing when accrued.
Net realized gain or loss on foreign currency transactions represents foreign exchange gains and losses from sales and maturities of foreign fixed income investments, holding of foreign currencies, currency gains or losses realized between the trade and settlement dates on foreign investment transactions, and the difference between the amounts of dividends, interest and foreign withholding taxes recorded on the Fund’s books and the U.S. dollar equivalent amounts actually received or paid. Net unrealized currency gains and losses from valuing foreign currency denominated assets and liabilities at period end exchange rates are reflected as a component of net unrealized appreciation or depreciation of foreign currency denominated assets and liabilities.
4. Taxes
It is the Fund’s policy to meet the requirements of the Internal Revenue Code applicable to regulated investment companies and to distribute all of its investment company taxable income and net realized gains, if any, to shareholders. Therefore, no provisions for federal income or excise taxes are required. The Fund may be subject to taxes imposed by countries in which it invests. Such taxes are generally based on income and/or capital gains earned or repatriated. Taxes are accrued and applied to net investment income, net realized gains and net unrealized appreciation/depreciation as such income and/or gains are earned. The Fund files withholding tax reclaims in certain jurisdictions to recover a portion of amounts previously withheld. The Fund may record a reclaim receivable based on, among other things, a jurisdiction’s legal obligation to pay reclaims as well as payment history and market convention.
In accordance with U.S. GAAP requirements regarding accounting for uncertainties in income taxes, management has analyzed the Fund’s tax positions taken or expected to be taken on federal and state income tax returns for all open tax years (the current and the prior three tax years) and has concluded that no provision for income tax is required in the Fund’s financial statements.
| | |
| |
| abfunds.com | | AB INTERNATIONAL VALUE FUND | 13 |
NOTES TO FINANCIAL STATEMENTS (continued)
5. Investment Income and Investment Transactions
Dividend income is recorded on the ex-dividend date or as soon as the Fund is informed of the dividend. Interest income is accrued daily. Investment transactions are accounted for on the date the securities are purchased or sold. Investment gains or losses are determined on the identified cost basis. Non-cash dividends, if any, are recorded on the ex-dividend date at the fair value of the securities received. The Fund amortizes premiums and accretes discounts as adjustments to interest income. The Fund accounts for distributions received from real estate investment trust (“REIT”) investments or from regulated investment companies as dividend income, realized gain, or return of capital based on information provided by the REIT or the investment company.
6. Class Allocations
All income earned and expenses incurred by the Fund are borne on a pro-rata basis by each outstanding class of shares, based on the proportionate interest in the Fund represented by the net assets of such class, except for class specific expenses which are allocated to the respective class. Expenses of the Trust are charged proportionately to each fund or based on other appropriate methods. Realized and unrealized gains and losses are allocated among the various share classes based on respective net assets.
7. Dividends and Distributions
Dividends and distributions to shareholders, if any, are recorded on the ex-dividend date. Income dividends and capital gains distributions are determined in accordance with federal tax regulations and may differ from those determined in accordance with U.S. GAAP. To the extent these differences are permanent, such amounts are reclassified within the capital accounts based on their federal tax basis treatment; temporary differences do not require such reclassification.
8. Cash and Short-Term Investments
Cash and short-term investments include cash on hand and short-term investments with maturities of less than one year when purchased.
NOTE B
Advisory Fee and Other Transactions with Affiliates
Under the terms of the investment advisory agreement, the Fund pays the Adviser an advisory fee at an annual rate of .75% of the first $2.5 billion, .65% of the next $2.5 billion and .60% in excess of $5 billion of the Fund’s average daily net assets. The fee is accrued daily and paid monthly. The Adviser has agreed to waive its fees and bear certain expenses to the extent necessary to limit total operating expenses (excluding expenses associated with acquired fund fees and expenses other than the advisory
| | |
| |
14 | AB INTERNATIONAL VALUE FUND | | abfunds.com |
NOTES TO FINANCIAL STATEMENTS (continued)
fees of any AB mutual funds in which the Fund may invest, interest expense, taxes, extraordinary expenses, and brokerage commissions and other transaction costs) on an annual basis (the “Expense Caps”) to 1.25%, 2.00%, 1.00%, and 1.00% of daily average net assets for Class A, Class C, Advisor Class, and Class I shares, respectively. Effective June 1, 2024, the Adviser has voluntarily agreed to waive its fees and bear certain expenses to the extent necessary to limit total operating expenses on an annual basis to 1.21%, 1.96%, .96% and .96% of the daily average net assets for the Class A, Class C, Advisor Class and Class I shares, respectively. For the year ended November 30, 2024, such reimbursements/waivers amounted to $530,131.
Pursuant to the investment advisory agreement, the Fund may reimburse the Adviser for certain legal and accounting services provided to the Fund by the Adviser. For the year ended November 30, 2024, the reimbursement for such services amounted to $110,088.
The Fund compensates AllianceBernstein Investor Services, Inc. (“ABIS”), a wholly-owned subsidiary of the Adviser, under a Transfer Agency Agreement for providing personnel and facilities to perform transfer agency services for the Fund. ABIS may make payments to intermediaries that provide omnibus account services, sub-accounting services and/or networking services. Such compensation retained by ABIS amounted to $90,137 for the year ended November 30, 2024.
AllianceBernstein Investments, Inc. (the “Distributor”), a wholly-owned subsidiary of the Adviser, serves as the distributor of the Fund’s shares. The Distributor has advised the Fund that it has retained front-end sales charges of $588 from the sale of Class A shares and received $155 and $6 in contingent deferred sales charges imposed upon redemptions by shareholders of Class A and Class C shares, respectively, for the year ended November 30, 2024.
The Fund may invest in AB Government Money Market Portfolio (the “Government Money Market Portfolio”) which has a contractual annual advisory fee rate of .20% of the portfolio’s average daily net assets and bears its own expenses. The Adviser had contractually agreed to waive .10% of the advisory fee of Government Money Market Portfolio (resulting in a net advisory fee of .10%) until August 31, 2023. Effective September 1, 2023, the Adviser has contractually agreed to waive .05% of the advisory fee of Government Money Market Portfolio (resulting in a net advisory fee of .15%) until August 31, 2024. In connection with the investment by the Fund in Government Money Market Portfolio, the Adviser has contractually agreed to waive its advisory fee from the Fund in an amount equal to the Fund’s pro rata share of the effective advisory fee
| | |
| |
| abfunds.com | | AB INTERNATIONAL VALUE FUND | 15 |
NOTES TO FINANCIAL STATEMENTS (continued)
of Government Money Market Portfolio, as borne indirectly by the Fund as an acquired fund fee and expense. For the year ended November 30, 2024, such waiver amounted to $3,417.
A summary of the Fund’s transactions in AB mutual funds for the year ended November 30, 2024 is as follows:
| | | | | | | | | | | | | | | | | | | | |
Fund | | Market Value
11/30/23
(000) | | | Purchases
at Cost
(000) | | | Sales
Proceeds
(000) | | | Market Value
11/30/24
(000) | | | Dividend
Income
(000) | |
Government Money Market Portfolio | | $ | 145 | | | $ | 33,476 | | | $ | 31,483 | | | $ | 2,138 | | | $ | 114 | |
Government Money Market Portfolio* | | | 800 | | | | 38,956 | | | | 39,561 | | | | 195 | | | | 3 | |
| | | | | | | | | | | | | | | | | | | | |
Total | | | | | | | | | | | | | | $ | 2,333 | | | $ | 117 | |
| | | | | | | | | | | | | | | | | | | | |
| * | Investments of cash collateral for securities lending transactions (see Note E). |
NOTE C
Distribution Services Agreement
The Fund has adopted a Distribution Services Agreement (the “Agreement”) pursuant to Rule 12b-1 under the 1940 Act. Under the Agreement, the Fund pays distribution and servicing fees to the Distributor at an annual rate of up to .30% of the Fund’s average daily net assets attributable to Class A shares, 1% of the Fund’s average daily net assets attributable to Class C shares, .50% of the Fund’s average daily net assets attributable to Class R shares and .25% of the Fund’s average daily net assets attributable to Class K shares. There are no distribution and servicing fees on the Advisor Class and Class I shares. Payments under the Agreement in respect of Class A shares are currently limited to an annual rate of .25% of Class A shares’ average daily net assets. The fees are accrued daily and paid monthly. The Agreement provides that the Distributor will use such payments in their entirety for distribution assistance and promotional activities. Since the commencement of the Fund’s operations, the Distributor has incurred expenses in excess of the distribution costs reimbursed by the Fund in the amounts of $6,496,886, $2,389,738 and $2,443,823 for Class C, Class R and Class K shares, respectively. While such costs may be recovered from the Fund in future periods so long as the Agreement is in effect, and the share class is active, the rate of the distribution and servicing fees payable under the Agreement may not be increased without a shareholder vote. In accordance with the Agreement, there is no provision for recovery of unreimbursed distribution costs incurred by the Distributor beyond the current fiscal year for Class A
| | |
| |
16 | AB INTERNATIONAL VALUE FUND | | abfunds.com |
NOTES TO FINANCIAL STATEMENTS (continued)
shares. The Agreement also provides that the Adviser may use its own resources to finance the distribution of the Fund’s shares.
NOTE D
Investment Transactions
Purchases and sales of investment securities (excluding short-term investments) for the year ended November 30, 2024 were as follows:
| | | | | | | | |
| | | Purchases | | | Sales | |
Investment securities (excluding | | | | | | | | |
U.S. government securities) | | $ | 47,232,783 | | | $ | 72,644,253 | |
U.S. government securities | | | – 0 | – | | | – 0 | – |
The cost of investments for federal income tax purposes, gross unrealized appreciation and unrealized depreciation are as follows:
| | | | |
Cost | | $ | 84,621,070 | |
| | | | |
Gross unrealized appreciation | | $ | 17,729,542 | |
Gross unrealized depreciation | | | (5,133,263 | ) |
| | | | |
Net unrealized appreciation | | $ | 12,596,279 | |
| | | | |
1. Derivative Financial Instruments
The Fund may use derivatives in an effort to earn income and enhance returns, to replace more traditional direct investments, to obtain exposure to otherwise inaccessible markets (collectively, “investment purposes”), or to hedge or adjust the risk profile of its portfolio.
The principal type of derivative utilized by the Fund, as well as the methods in which they may be used are:
| | • | | Forward Currency Exchange Contracts |
The Fund may enter into forward currency exchange contracts in order to hedge its exposure to changes in foreign currency exchange rates on its foreign portfolio holdings, to hedge certain firm purchase and sale commitments denominated in foreign currencies and for non-hedging purposes as a means of making direct investments in foreign currencies, as described below under “Currency Transactions”.
A forward currency exchange contract is a commitment to purchase or sell a foreign currency at a future date at a negotiated forward rate. The gain or loss arising from the difference between the original contract and the closing of such contract would be included in net realized gain or loss on forward currency exchange contracts. Fluctuations in the value of open forward currency exchange contracts are recorded for financial reporting purposes as unrealized appreciation and/or depreciation by the Fund. Risks may arise from the potential inability of a counterparty to meet the terms of a contract
| | |
| |
| abfunds.com | | AB INTERNATIONAL VALUE FUND | 17 |
NOTES TO FINANCIAL STATEMENTS (continued)
and from unanticipated movements in the value of a foreign currency relative to the U.S. dollar.
During the year ended November 30, 2024, the Fund held forward currency exchange contracts for hedging purposes.
The Fund typically enters into International Swaps and Derivatives Association, Inc. Master Agreements (“ISDA Master Agreement”) with its OTC derivative contract counterparties in order to, among other things, reduce its credit risk to OTC counterparties. ISDA Master Agreements include provisions for general obligations, representations, collateral and events of default or termination. Under an ISDA Master Agreement, the Fund typically may offset with the OTC counterparty certain derivative financial instruments’ payables and/or receivables with collateral held and/or posted and create one single net payment (close-out netting) in the event of default or termination. In the event of a default by an OTC counterparty, the return of collateral with market value in excess of the Fund’s net liability, held by the defaulting party, may be delayed or denied.
The Fund’s ISDA Master Agreements may contain provisions for early termination of OTC derivative transactions in the event the net assets of the Fund decline below specific levels (“net asset contingent features”). If these levels are triggered, the Fund’s OTC counterparty has the right to terminate such transaction and require the Fund to pay or receive a settlement amount in connection with the terminated transaction. If OTC derivatives were held at period end, please refer to netting arrangements by the OTC counterparty table below for additional details.
During the year ended November 30, 2024, the Fund had entered into the following derivatives:
| | | | | | | | | | | | |
| | | Asset Derivatives | | | Liability Derivatives | |
Derivative Type | | Statement of
Assets and
Liabilities
Location | | Fair Value | | | Statement of
Assets and
Liabilities
Location | | Fair Value | |
Foreign currency contracts | | Unrealized appreciation on forward currency exchange contracts | | $ | 449,964 | | | Unrealized depreciation on forward currency exchange contracts | | $ | 274,099 | |
| | | | | | | | | | | | |
Total | | | | $ | 449,964 | | | | | $ | 274,099 | |
| | | | | | | | | | | | |
| | |
| |
18 | AB INTERNATIONAL VALUE FUND | | abfunds.com |
NOTES TO FINANCIAL STATEMENTS (continued)
| | | | | | | | | | |
Derivative Type | | Location of
Gain or (Loss) on Derivatives
Within Statement
of Operations | | Realized Gain
or (Loss) on
Derivatives | | | Change in
Unrealized
Appreciation or
(Depreciation) | |
Foreign currency contracts | | Net realized gain (loss) on forward currency exchange contracts; Net change in unrealized appreciation (depreciation) of forward currency exchange contracts | | $ | (419,319 | ) | | $ | 226,139 | |
| | | | | | | | | | |
Total | | | | $ | (419,319 | ) | | $ | 226,139 | |
| | | | | | | | | | |
The following table represents the average monthly volume of the Fund’s derivative transactions during the year ended November 30, 2024:
| | | | |
Forward Currency Exchange Contracts: | | | | |
Average principal amount of buy contracts | | $ | 32,056,740 | |
Average principal amount of sale contracts | | $ | 27,895,000 | |
For financial reporting purposes, the Fund does not offset derivative assets and derivative liabilities that are subject to netting arrangements in the statement of assets and liabilities.
All OTC derivatives held at period end were subject to netting arrangements. The following table presents the Fund’s derivative assets and liabilities by OTC counterparty net of amounts available for offset under ISDA Master Agreements (“MA”) and net of the related collateral received/pledged by the Fund as of November 30, 2024. Exchange-traded derivatives and centrally cleared swaps are not subject to netting arrangements and as such are excluded from the table.
| | | | | | | | | | | | | | | | | | | | |
Counterparty | | Derivative
Assets
Subject to a
MA | | | Derivatives
Available
for Offset | | | Cash
Collateral
Received* | | | Security
Collateral
Received* | | | Net Amount
of Derivative
Assets | |
Bank of America, NA | | $ | 57,607 | | | $ | (57,607 | ) | | $ | – 0 | – | | $ | – 0 | – | | $ | – 0 | – |
Citibank, NA | | | 77,976 | | | | (3,945 | ) | | | – 0 | – | | | – 0 | – | | | 74,031 | |
HSBC Bank USA | | | 20 | | | | – 0 | – | | | – 0 | – | | | – 0 | – | | | 20 | |
Morgan Stanley Capital Services, Inc. | | | 47,252 | | | | (41,951 | ) | | | – 0 | – | | | – 0 | – | | | 5,301 | |
State Street Bank & Trust Co. | | | 151,263 | | | | (122,643 | ) | | | – 0 | – | | | – 0 | – | | | 28,620 | |
UBS AG | | | 115,846 | | | | (3,816 | ) | | | – 0 | – | | | – 0 | – | | | 112,030 | |
| | | | | | | | | | | | | | | | | | | | |
Total | | $ | 449,964 | | | $ | (229,962 | ) | | $ | – 0 | – | | $ | – 0 | – | | $ | 220,002 | ^ |
| | | | | | | | | | | | | | | | | | | | |
| | |
| |
| abfunds.com | | AB INTERNATIONAL VALUE FUND | 19 |
NOTES TO FINANCIAL STATEMENTS (continued)
| | | | | | | | | | | | | | | | | | | | |
Counterparty | | Derivative
Liabilities
Subject to a
MA | | | Derivatives
Available
for Offset | | | Cash
Collateral
Pledged* | | | Security
Collateral
Pledged* | | | Net Amount
of Derivative
Liabilities | |
Bank of America, NA | | $ | 95,540 | | | $ | (57,607 | ) | | $ | – 0 | – | | $ | – 0 | – | | $ | 37,933 | |
Citibank, NA | | | 3,945 | | | | (3,945 | ) | | | – 0 | – | | | – 0 | – | | | – 0 | – |
Goldman Sachs Bank USA | | | 6,204 | | | | – 0 | – | | | – 0 | – | | | – 0 | – | | | 6,204 | |
Morgan Stanley Capital Services, Inc. | | | 41,951 | | | | (41,951 | ) | | | – 0 | – | | | – 0 | – | | | – 0 | – |
State Street Bank & Trust Co. | | | 122,643 | | | | (122,643 | ) | | | – 0 | – | | | – 0 | – | | | – 0 | – |
UBS AG | | | 3,816 | | | | (3,816 | ) | | | – 0 | – | | | – 0 | – | | | – 0 | – |
| | | | | | | | | | | | | | | | | | | | |
Total | | $ | 274,099 | | | $ | (229,962 | ) | | $ | – 0 | – | | $ | – 0 | – | | $ | 44,137 | ^ |
| | | | | | | | | | | | | | | | | | | | |
| * | The actual collateral received/pledged may be more than the amount reported due to over-collateralization. |
| ^ | Net amount represents the net receivable/payable that would be due from/to the counterparty in the event of default or termination. The net amount from OTC financial derivative instruments can only be netted across transactions governed under the same master agreement with the same counterparty. |
2. Currency Transactions
The Fund may invest in non-U.S. Dollar-denominated securities on a currency hedged or unhedged basis. The Fund may seek investment opportunities by taking long or short positions in currencies through the use of currency-related derivatives, including forward currency exchange contracts, futures and options on futures, swaps, and other options. The Fund may enter into transactions for investment opportunities when it anticipates that a foreign currency will appreciate or depreciate in value but securities denominated in that currency are not held by the Fund and do not present attractive investment opportunities. Such transactions may also be used when the Adviser believes that it may be more efficient than a direct investment in a foreign currency-denominated security. The Fund may also conduct currency exchange contracts on a spot basis (i.e., for cash at the spot rate prevailing in the currency exchange market for buying or selling currencies).
NOTE E
Securities Lending
The Fund may enter into securities lending transactions. Under the Fund’s securities lending program, all loans of securities will be collateralized continually by cash collateral and/or non-cash collateral. Non-cash collateral will include only securities issued or guaranteed by the U.S. government or its agencies or instrumentalities. If the Fund cannot sell or repledge any non-cash collateral, such collateral will not be reflected in the portfolio of investments. If a loan is collateralized by cash, the Fund will be compensated for the loan from a portion of the net return from the income earned on cash collateral after a rebate is paid to the borrower (in some cases, this rebate may be a “negative rebate” or fee paid by the borrower to the
| | |
| |
20 | AB INTERNATIONAL VALUE FUND | | abfunds.com |
NOTES TO FINANCIAL STATEMENTS (continued)
Fund in connection with the loan), and payments are made for fees of the securities lending agent and for certain other administrative expenses. If the Fund receives non-cash collateral, the Fund will receive a fee from the borrower generally equal to a negotiated percentage of the market value of the loaned securities. The Fund will have the right to call a loan and obtain the securities loaned at any time on notice to the borrower within the normal and customary settlement time for the securities. While the securities are on loan, the borrower is obligated to pay the Fund amounts equal to any dividend income or other distributions from the securities; however, these distributions will not be afforded the same preferential tax treatment as qualified dividends. The Fund will not be able to exercise voting rights with respect to any securities during the existence of a loan, but will have the right to regain ownership of loaned securities in order to exercise voting or other ownership rights. Collateral received and securities loaned are marked to market daily to ensure that the securities loaned are secured by collateral. The lending agent currently invests the cash collateral received in Government Money Market Portfolio, an eligible money market vehicle, in accordance with the investment restrictions of the Fund, and as approved by the Board. The collateral received on securities loaned is recorded as an asset as well as a corresponding liability in the statement of assets and liabilities. The collateral will be adjusted the next business day to maintain the required collateral amount. The amounts of securities lending income from the borrowers and Government Money Market Portfolio are reflected in the statement of operations. When the Fund earns net securities lending income from Government Money Market Portfolio, the income is inclusive of a rebate expense paid to the borrower. In connection with the cash collateral investment by the Fund in Government Money Market Portfolio, the Adviser has agreed to waive a portion of the Fund’s share of the advisory fees of Government Money Market Portfolio, as borne indirectly by the Fund as an acquired fund fee and expense. When the Fund lends securities, its investment performance will continue to reflect changes in the value of the securities loaned. A principal risk of lending portfolio securities is that the borrower may fail to return the loaned securities upon termination of the loan and that the collateral will not be sufficient to replace the loaned securities. The lending agent has agreed to indemnify the Fund in the case of default of any securities borrower.
| | |
| |
| abfunds.com | | AB INTERNATIONAL VALUE FUND | 21 |
NOTES TO FINANCIAL STATEMENTS (continued)
A summary of the Fund’s transactions surrounding securities lending for the year ended November 30, 2024 is as follows:
| | | | | | | | | | | | | | | | | | | | | | |
| | | | | | | | | | | | | Government Money
Market Portfolio | |
Market
Value of
Securities
on Loan* | | | Cash
Collateral* | | | Market
Value of
Non-Cash
Collateral* | | | Income from
Borrowers | | | Income
Earned | | | Advisory Fee
Waived | |
| $ | 7,338,909 | | | $ | 195,388 | | | $ | 7,458,235 | | | $ | 5,421 | | | $ | 3,306 | | | $ | 1,862 | |
| * | As of November 30, 2024. |
NOTE F
Shares of Beneficial Interest
Transactions in shares of beneficial interest for each class were as follows:
| | | | | | | | | | | | | | | | | | | | | | | | |
| | | | | | | | | | | | | | | | | | | |
| | | Shares | | | | | | Amount | | | | |
| | | Year Ended
November 30,
2024 | | | Year Ended
November 30,
2023 | | | | | | Year Ended
November 30,
2024 | | | Year Ended
November 30,
2023 | | | | |
| | | | | | | |
Class A | | | | | |
Shares sold | | | 343,129 | | | | 492,927 | | | | | | | $ | 5,097,772 | | | $ | 6,826,875 | | | | | |
| | | | | |
Shares issued in reinvestment of dividends | | | 342,720 | | | | 57,109 | | | | | | | | 4,828,554 | | | | 719,566 | | | | | |
| | | | | |
Shares converted from Class C | | | 2,442 | | | | 13,666 | | | | | | | | 35,761 | | | | 189,467 | | | | | |
| | | | | |
Shares redeemed | | | (792,933 | ) | | | (1,020,695 | ) | | | | | | | (11,835,012 | ) | | | (14,088,258 | ) | | | | |
| | | | | |
Net decrease | | | (104,642 | ) | | | (456,993 | ) | | | | | | $ | (1,872,925 | ) | | $ | (6,352,350 | ) | | | | |
| | | | | |
| | | | | | | | | | | | | | | | | | | | | | | | |
Class C | | | | | |
Shares sold | | | 2,316 | | | | 26,490 | | | | | | | $ | 34,294 | | | $ | 338,461 | | | | | |
| | | | | |
Shares issued in reinvestment of dividends | | | 4,589 | | | | 224 | | | | | | | | 63,940 | | | | 2,788 | | | | | |
| | | | | |
Shares converted to Class A | | | (2,482 | ) | | | (13,908 | ) | | | | | | | (35,761 | ) | | | (189,467 | ) | | | | |
| | | | | |
Shares redeemed | | | (8,739 | ) | | | (8,129 | ) | | | | | | | (133,531 | ) | | | (108,491 | ) | | | | |
| | | | | |
Net increase (decrease) | | | (4,316 | ) | | | 4,677 | | | | | | | $ | (71,058 | ) | | $ | 43,291 | | | | | |
| | | | | |
| | | | | | | | | | | | | | | | | | | | | | | | |
Advisor Class | | | | | |
Shares sold | | | 54,192 | | | | 88,843 | | | | | | | $ | 825,606 | | | $ | 1,257,008 | | | | | |
| | | | | |
Shares issued in reinvestment of dividends | | | 120,893 | | | | 23,124 | | | | | | | | 1,745,303 | | | | 298,306 | | | | | |
| | | | | |
Shares redeemed | | | (214,895 | ) | | | (352,392 | ) | | | | | | | (3,312,401 | ) | | | (4,928,412 | ) | | | | |
| | | | | |
Net decrease | | | (39,810 | ) | | | (240,425 | ) | | | | | | $ | (741,492 | ) | | $ | (3,373,098 | ) | | | | |
| | | | | |
| | |
| |
22 | AB INTERNATIONAL VALUE FUND | | abfunds.com |
NOTES TO FINANCIAL STATEMENTS (continued)
| | | | | | | | | | | | | | | | | | | | | | | | |
| | | | | | | | | | | | | | | | | | | |
| | | Shares | | | | | | Amount | | | | |
| | | Year Ended
November 30,
2024 | | | Year Ended
November 30,
2023 | | | | | | Year Ended
November 30,
2024 | | | Year Ended
November 30,
2023 | | | | |
| | | | | | | |
Class R | | | | | |
Shares sold | | | 18,952 | | | | 63,064 | | | | | | | $ | 269,678 | | | $ | 865,087 | | | | | |
| | | | | |
Shares issued in reinvestment of dividends | | | 3,301 | | | | 3,133 | | | | | | | | 45,416 | | | | 39,199 | | | | | |
| | | | | |
Shares redeemed | | | (363,161 | ) | | | (60,910 | ) | | | | | | | (5,533,534 | ) | | | (829,739 | ) | | | | |
| | | | | |
Net increase (decrease) | | | (340,908 | ) | | | 5,287 | | | | | | | $ | (5,218,440 | ) | | $ | 74,547 | | | | | |
| | | | | |
| | | | | | | | | | | | | | | | | | | | | | | | |
Class K | | | | | |
Shares sold | | | 43,662 | | | | 371,101 | | | | | | | $ | 635,600 | | | $ | 5,078,128 | | | | | |
| | | | | |
Shares issued in reinvestment of dividends | | | 7,394 | | | | 4,034 | | | | | | | | 101,968 | | | | 50,583 | | | | | |
| | | | | |
Shares redeemed | | | (658,531 | ) | | | (109,138 | ) | | | | | | | (10,015,486 | ) | | | (1,491,267 | ) | | | | |
| | | | | |
Net increase (decrease) | | | (607,475 | ) | | | 265,997 | | | | | | | $ | (9,277,918 | ) | | $ | 3,637,444 | | | | | |
| | | | | |
| | | | | | | | | | | | | | | | | | | | | | | | |
Class I | | | | | |
Shares sold | | | 17,608 | | | | 13,061 | | | | | | | $ | 262,601 | | | $ | 175,700 | | | | | |
| | | | | |
Shares issued in reinvestment of dividends | | | 4,693 | | | | 1,215 | | | | | | | | 65,229 | | | | 15,124 | | | | | |
| | | | | |
Shares redeemed | | | (16,373 | ) | | | (51,181 | ) | | | | | | | (243,706 | ) | | | (672,917 | ) | | | | |
| | | | | |
Net increase (decrease) | | | 5,928 | | | | (36,905 | ) | | | | | | $ | 84,124 | | | $ | (482,093 | ) | | | | |
| | | | | |
NOTE G
Risks Involved in Investing in the Fund
Market Risk—The value of the Fund’s assets will fluctuate as the market or markets in which the Fund invests fluctuate. The value of the Fund’s investments may decline, sometimes rapidly and unpredictably, simply because of economic changes or other events, including public health crises (including the occurrence of a contagious disease or illness) and regional and global conflicts, that affect large portions of the market. It includes the risk that a particular style of investing may be underperforming the market generally.
Foreign (Non-U.S.) Risk—Investments in securities of non-U.S. issuers may involve more risk than those of U.S. issuers. These securities may fluctuate more widely in price and may be more difficult to trade due to adverse market, economic, political, regulatory or other factors.
| | |
| |
| abfunds.com | | AB INTERNATIONAL VALUE FUND | 23 |
NOTES TO FINANCIAL STATEMENTS (continued)
Emerging-Market Risk—Investments in emerging-market countries may have more risk because the markets are less developed and less liquid as well as being subject to increased economic, political, regulatory or other uncertainties.
Currency Risk—Fluctuations in currency exchange rates may negatively affect the value of the Fund’s investments or reduce its returns.
Derivatives Risk—Derivatives may be difficult to price or unwind and leveraged so that small changes may produce disproportionate losses for the Fund. A short position in a derivative instrument involves the risk of a theoretically unlimited increase in the value of the underlying asset, reference rate or index, which could cause the Fund to suffer a potentially unlimited loss. Derivatives, especially over-the-counter derivatives, are also subject to counterparty risk, which is the risk that the counterparty (the party on the other side of the transaction) on a derivative transaction will be unable or unwilling to honor its contractual obligations to the Fund.
Leverage Risk—When the Fund borrows money or otherwise leverages its investments, its performance may be volatile because leverage tends to exaggerate the effect of any increase or decrease in the value of the Fund’s investments. The Fund may create leverage through the use of reverse repurchase agreements, forward currency exchange contracts, forward commitments, dollar rolls or futures or by borrowing money. The use of other types of derivative instruments by the Fund, such as options and swaps, may also result in a form of leverage. Leverage may result in higher returns to the Fund than if the Fund were not leveraged, but may also adversely affect returns, particularly if the market is declining.
Indemnification Risk—In the ordinary course of business, the Fund enters into contracts that contain a variety of indemnifications. The Fund’s maximum exposure under these arrangements is unknown. However, the Fund has not had prior claims or losses pursuant to these indemnification provisions and expects the risk of loss thereunder to be remote. Therefore, the Fund has not accrued any liability in connection with these indemnification provisions.
Management Risk—The Fund is subject to management risk because it is an actively-managed investment fund. The Adviser will apply its investment techniques and risk analyses in making investment decisions, but there is no guarantee that its techniques will produce the intended results. Some of these techniques may incorporate, or rely upon, quantitative models, but there is no guarantee that these models will generate accurate forecasts, reduce risk or otherwise perform as expected.
| | |
| |
24 | AB INTERNATIONAL VALUE FUND | | abfunds.com |
NOTES TO FINANCIAL STATEMENTS (continued)
NOTE H
Joint Credit Facility
A number of open-end mutual funds managed by the Adviser, including the Fund, participate in a $325 million revolving credit facility (the “Facility”) intended to provide short-term financing related to redemptions and other short term liquidity requirements, subject to certain restrictions. Commitment fees related to the Facility are paid by the participating funds and are included in miscellaneous expenses in the statement of operations. The Fund did not utilize the Facility during the year ended November 30, 2024.
NOTE I
Distributions to Shareholders
The tax character of distributions paid during the fiscal years ended November 30, 2024 and November 30, 2023 were as follows:
| | | | | | | | |
| | | 2024 | | | 2023 | |
Distributions paid from: | | | | | | | | |
Ordinary income | | $ | 7,849,446 | | | $ | 1,279,499 | |
| | | | | | | | |
Total taxable distributions | | $ | 7,849,446 | | | $ | 1,279,499 | |
| | | | | | | | |
As of November 30, 2024, the components of accumulated earnings (deficit) on a tax basis were as follows:
| | | | |
Undistributed ordinary income | | $ | $2,137,178 | |
Accumulated capital and other losses | | | (116,218,213 | )(a) |
Unrealized appreciation (depreciation) | | | 12,578,610 | (b) |
| | | | |
Total accumulated earnings (deficit) | | $ | (101,502,425 | ) |
| | | | |
| (a) | As of November 30, 2024, the Fund had a net capital loss carryforward of $116,218,213. During the fiscal year, the Fund utilized $4,206,839 of capital loss carry forwards to offset current year net realized gains. |
| (b) | The differences between book-basis and tax-basis unrealized appreciation (depreciation) are attributable primarily to the recognition for tax purposes of unrealized gains (losses) on certain derivative instruments, the tax treatment of passive foreign investment companies (PFICs), and the tax deferral of losses on wash sales. |
For tax purposes, net realized capital losses may be carried over to offset future capital gains, if any. Funds are permitted to carry forward capital losses for an indefinite period, and such losses will retain their character as either short-term or long-term capital losses. As of November 30, 2024, the Fund had a net short-term capital loss carryforward of $38,627,655 and a net long-term capital loss carryforward of $77,590,558, which may be carried forward for an indefinite period.
During the current fiscal year, there were no permanent differences that resulted in adjustments to accumulated loss or additional paid-in capital.
| | |
| |
| abfunds.com | | AB INTERNATIONAL VALUE FUND | 25 |
NOTES TO FINANCIAL STATEMENTS (continued)
NOTE J
Recent Accounting Pronouncements
In December 2022, the Financial Accounting Standards Board issued an Accounting Standards Update, ASU 2022-06, “Reference Rate Reform (Topic 848) – Deferral of the Sunset Date of Topic 848”. ASU 2022-06 is an amendment to ASU 2020-04, which provided optional guidance to ease the potential accounting burden due to the discontinuation of the LIBOR and other interbank-offered based reference rates and which was effective as of March 12, 2020 through December 31, 2022. ASU 2022-06 extends the effective period through December 31, 2024. Management is currently evaluating the impact, if any, of applying ASU 2022-06.
In November 2023, the Financial Accounting Standards Board issued Accounting Standards Update, ASU 2023-07, “Segment Reporting (Topic 280)”. ASU 2023-07 requires public entities to provide disclosure of significant segment expenses that are regularly provided to the chief operating decision maker (“CODM”). ASU 2023-07, among other things, (i) requires a single segment public entity to provide all necessary disclosures required by Topic 280 it, (ii) requires a public entity to disclose the title and position of the CODM and an explanation of how the CODM uses the reported measure(s) of segment profit and loss in assessing segment performance and deciding how to allocate resources and (iii) provides the ability for a public entity to elect more than one performance measure. ASU 2023-07 is effective for fiscal years beginning after December 15, 2023, and interim periods within fiscal years beginning after December 15, 2024. Early adoption of ASU 2023-07 is permitted. Management is currently evaluating the impact, if any, of applying ASU 2023-07.
NOTE K
Subsequent Events
Management has evaluated subsequent events for possible recognition or disclosure in the financial statements through the date the financial statements are issued. Management has determined that there are no material events that would require disclosure in the Fund’s financial statements through this date.
| | |
| |
26 | AB INTERNATIONAL VALUE FUND | | abfunds.com |
FINANCIAL HIGHLIGHTS
Selected Data For A Share Of Beneficial Interest Outstanding Throughout Each Period
| | | | | | | | | | | | | | | | | | | | |
| | | Class A | |
| | | Year Ended November 30, | |
| | | 2024 | | | 2023 | | | 2022 | | | 2021 | | | 2020 | |
| | | | | | | | | | | | | | | | | | | | |
| | | | | | | | | | | | | | | | | | | | |
Net asset value, beginning of period | | | $ 14.02 | | | | $ 12.89 | | | | $ 13.94 | | | | $ 12.58 | | | | $ 12.84 | |
| | | | |
Income From Investment Operations | | | | | | | | | | | | | | | | | | | | |
| | | | | |
Net investment income(a)(b) | | | .29 | | | | .25 | | | | .74 | | | | .30 | | | | .11 | |
| | | | | |
Net realized and unrealized gain (loss) on investment and foreign currency transactions | | | 1.39 | | | | 1.03 | | | | (1.42 | ) | | | 1.15 | | | | (.23 | ) |
| | | | |
Net increase (decrease) in net asset value from operations | | | 1.68 | | | | 1.28 | | | | (.68 | ) | | | 1.45 | | | | (.12 | ) |
| | | | |
Less: Dividends | | | | | | | | | | | | | | | | | | | | |
| | | | | |
Dividends from net investment income | | | (1.19 | ) | | | (.15 | ) | | | (.37 | ) | | | (.09 | ) | | | (.14 | ) |
| | | | |
Net asset value, end of period | | | $ 14.51 | | | | $ 14.02 | | | | $ 12.89 | | | | $ 13.94 | | | | $ 12.58 | |
| | | | |
| | | | | |
Total Return | | | | | | | | | | | | | | | | | | | | |
| | | | | |
Total investment return based on net asset value(c)* | | | 12.38 | % | | | 9.64 | % | | | (5.08 | )%+ | | | 11.51 | % | | | (.85 | )% |
| | | | | |
Ratios/Supplemental Data | | | | | | | | | | | | | | | | | | | | |
| | | | | |
Net assets, end of period (000,000’s omitted) | | | $69 | | | | $68 | | | | $69 | | | | $79 | | | | $80 | |
| | | | | |
Ratio to average net assets of: | | | | | | | | | | | | | | | | | | | | |
| | | | | |
Expenses, net of waivers/reimbursements | | | 1.23 | % | | | 1.25 | % | | | 1.25 | % | | | 1.25 | % | | | 1.25 | % |
| | | | | |
Expenses, before waivers/reimbursements | | | 1.75 | % | | | 1.74 | % | | | 1.76 | % | | | 1.61 | % | | | 1.65 | % |
| | | | | |
Net investment income(b) | | | 1.96 | % | | | 1.84 | % | | | 5.92 | % | | | 2.10 | % | | | 1.00 | % |
| | | | | |
Portfolio turnover rate | | | 46 | % | | | 39 | % | | | 42 | % | | | 45 | % | | | 48 | % |
See footnote summary on page 30.
| | |
| |
| abfunds.com | | AB INTERNATIONAL VALUE FUND | 27 |
FINANCIAL HIGHLIGHTS (continued)
Selected Data For A Share Of Beneficial Interest Outstanding Throughout Each Period
| | | | | | | | | | | | | | | | | | | | |
| | | Class C | |
| | | Year Ended November 30, | |
| | | 2024 | | | 2023 | | | 2022 | | | 2021 | | | 2020 | |
| | | | | | | | | | | | | | | | | | | | |
| | | | | | | | | | | | | | | | | | | | |
Net asset value, beginning of period | | | $ 13.73 | | | | $ 12.61 | | | | $ 13.56 | | | | $ 12.25 | | | | $ 12.46 | |
| | | | |
Income From Investment Operations | | | | | | | | | | | | | | | | | | | | |
| | | | | |
Net investment income(a)(b) | | | .18 | | | | .15 | | | | .61 | | | | .20 | | | | .03 | |
| | | | | |
Net realized and unrealized gain (loss) on investment and foreign currency transactions | | | 1.37 | | | | 1.01 | | | | (1.38 | ) | | | 1.11 | | | | (.24 | ) |
| | | | |
Net increase (decrease) in net asset value from operations | | | 1.55 | | | | 1.16 | | | | (.77 | ) | | | 1.31 | | | | (.21 | ) |
| | | | |
Less: Dividends | | | | | | | | | | | | | | | | | | | | |
| | | | | |
Dividends from net investment income | | | (.95 | ) | | | (.04 | ) | | | (.18 | ) | | | – 0 | – | | | (.00 | )(d) |
| | | | |
Net asset value, end of period | | | $ 14.33 | | | | $ 13.73 | | | | $ 12.61 | | | | $ 13.56 | | | | $ 12.25 | |
| | | | |
| | | | | |
Total Return | | | | | | | | | | | | | | | | | | | | |
| | | | | |
Total investment return based on net asset value(c)* | | | 11.55 | % | | | 8.81 | % | | | (5.80 | )%+ | | | 10.69 | % | | | (1.67 | )% |
| | | | | |
Ratios/Supplemental Data | | | | | | | | | | | | | | | | | | | | |
| | | | | |
Net assets, end of period (000’s omitted) | | | $1,071 | | | | $1,086 | | | | $938 | | | | $1,233 | | | | $2,178 | |
| | | | | |
Ratio to average net assets of: | | | | | | | | | | | | | | | | | | | | |
| | | | | |
Expenses, net of waivers/reimbursements | | | 1.98 | % | | | 2.00 | % | | | 2.00 | % | | | 2.00 | % | | | 2.00 | % |
| | | | | |
Expenses, before waivers/reimbursements | | | 2.52 | % | | | 2.52 | % | | | 2.54 | % | | | 2.38 | % | | | 2.43 | % |
| | | | | |
Net investment income(b) | | | 1.23 | % | | | 1.12 | % | | | 4.97 | % | | | 1.44 | % | | | .26 | % |
| | | | | |
Portfolio turnover rate | | | 46 | % | | | 39 | % | | | 42 | % | | | 45 | % | | | 48 | % |
See footnote summary on page 30.
| | |
| |
28 | AB INTERNATIONAL VALUE FUND | | abfunds.com |
FINANCIAL HIGHLIGHTS (continued)
Selected Data For A Share Of Beneficial Interest Outstanding Throughout Each Period
| | | | | | | | | | | | | | | | | | | | |
| | | Advisor Class | |
| | | Year Ended November 30, | |
| | | 2024 | | | 2023 | | | 2022 | | | 2021 | | | 2020 | |
| | | | | | | | | | | | | | | | | | | | |
| | | | | | | | | | | | | | | | | | | | |
Net asset value, beginning of period | | | $ 14.39 | | | | $ 13.23 | | | | $ 14.29 | | | | $ 12.90 | | | | $ 13.16 | |
| | | | |
Income From Investment Operations | | | | | | | | | | | | | | | | | | | | |
| | | | | |
Net investment income(a)(b) | | | .34 | | | | .29 | | | | .77 | | | | .35 | | | | .15 | |
| | | | | |
Net realized and unrealized gain (loss) on investment and foreign currency transactions | | | 1.41 | | | | 1.05 | | | | (1.42 | ) | | | 1.17 | | | | (.23 | ) |
| | | | |
Net increase (decrease) in net asset value from operations | | | 1.75 | | | | 1.34 | | | | (.65 | ) | | | 1.52 | | | | (.08 | ) |
| | | | |
Less: Dividends | | | | | | | | | | | | | | | | | | | | |
| | | | | |
Dividends from net investment income | | | (1.26 | ) | | | (.18 | ) | | | (.41 | ) | | | (.13 | ) | | | (.18 | ) |
| | | | |
Net asset value, end of period | | | $ 14.88 | | | | $ 14.39 | | | | $ 13.23 | | | | $ 14.29 | | | | $ 12.90 | |
| | | | |
| | | | | |
Total Return | | | | | | | | | | | | | | | | | | | | |
| | | | | |
Total investment return based on net asset value(c)* | | | 12.65 | % | | | 9.87 | % | | | (4.77 | )%+ | | | 11.82 | % | | | (.68 | )% |
| | | | | |
Ratios/Supplemental Data | | | | | | | | | | | | | | | | | | | | |
| | | | | |
Net assets, end of period (000,000’s omitted) | | | $27 | | | | $26 | | | | $27 | | | | $33 | | | | $32 | |
| | | | | |
Ratio to average net assets of: | | | | | | | | | | | | | | | | | | | | |
| | | | | |
Expenses, net of waivers/reimbursements | | | .98 | % | | | 1.00 | % | | | 1.00 | % | | | 1.00 | % | | | 1.00 | % |
| | | | | |
Expenses, before waivers/reimbursements | | | 1.50 | % | | | 1.49 | % | | | 1.51 | % | | | 1.36 | % | | | 1.40 | % |
| | | | | |
Net investment income(b) | | | 2.22 | % | | | 2.07 | % | | | 6.01 | % | | | 2.36 | % | | | 1.25 | % |
| | | | | |
Portfolio turnover rate | | | 46 | % | | | 39 | % | | | 42 | % | | | 45 | % | | | 48 | % |
See footnote summary on page 30.
| | |
| |
| abfunds.com | | AB INTERNATIONAL VALUE FUND | 29 |
FINANCIAL HIGHLIGHTS (continued)
Selected Data For A Share Of Beneficial Interest Outstanding Throughout Each Period
| | | | | | | | | | | | | | | | | | | | |
| | | Class I | |
| | | Year Ended November 30, | |
| | | 2024 | | | 2023 | | | 2022 | | | 2021 | | | 2020 | |
| | | | | | | | | | | | | | | | | | | | |
| | | | | | | | | | | | | | | | | | | | |
Net asset value, beginning of period | | | $ 13.88 | | | | $ 12.80 | | | | $ 13.88 | | | | $ 12.57 | | | | $ 12.86 | |
| | | | |
Income From Investment Operations | | | | | | | | | | | | | | | | | | | | |
| | | | | |
Net investment income(a)(b) | | | .33 | | | | .25 | | | | .78 | | | | .32 | | | | .15 | |
| | | | | |
Net realized and unrealized gain (loss) on investment and foreign currency transactions | | | 1.37 | | | | 1.05 | | | | (1.42 | ) | | | 1.15 | | | | (.23 | ) |
| | | | |
Net increase (decrease) in net asset value from operations | | | 1.70 | | | | 1.30 | | | | (.64 | ) | | | 1.47 | | | | (.08 | ) |
| | | | |
Less: Dividends | | | | | | | | | | | | | | | | | | | | |
| | | | | |
Dividends from net investment income | | | (1.26 | ) | | | (.22 | ) | | | (.44 | ) | | | (.16 | ) | | | (.21 | ) |
| | | | |
Net asset value, end of period | | | $ 14.32 | | | | $ 13.88 | | | | $ 12.80 | | | | $ 13.88 | | | | $ 12.57 | |
| | | | |
| | | | | |
Total Return | | | | | | | | | | | | | | | | | | | | |
| | | | | |
Total investment return based on net asset value(c)* | | | 12.62 | % | | | 9.97 | % | | | (4.83 | )%+ | | | 11.78 | % | | | (.64 | )% |
| | | | | |
Ratios/Supplemental Data | | | | | | | | | | | | | | | | | | | | |
| | | | | |
Net assets, end of period (000’s omitted) | | | $819 | | | | $711 | | | | $1,129 | | | | $1,400 | | | | $1,829 | |
| | | | | |
Ratio to average net assets of: | | | | | | | | | | | | | | | | | | | | |
| | | | | |
Expenses, net of waivers/reimbursements | | | .99 | % | | | 1.00 | % | | | 1.00 | % | | | 1.00 | % | | | 1.00 | % |
| | | | | |
Expenses, before waivers/reimbursements | | | 1.37 | % | | | 1.27 | % | | | 1.26 | % | | | 1.12 | % | | | 1.14 | % |
| | | | | |
Net investment income(b) | | | 2.23 | % | | | 1.82 | % | | | 6.26 | % | | | 2.28 | % | | | 1.30 | % |
| | | | | |
Portfolio turnover rate | | | 46 | % | | | 39 | % | | | 42 | % | | | 45 | % | | | 48 | % |
| (a) | Based on average shares outstanding. |
| (b) | Net of expenses waived/reimbursed by the Adviser. |
| (c) | Total investment return is calculated assuming an initial investment made at the net asset value at the beginning of the period, reinvestment of all dividends and distributions at net asset value during the period, and redemption on the last day of the period. Initial sales charges or contingent deferred sales charges are not reflected in the calculation of total investment return. Total investment return does not reflect the deduction of taxes that a shareholder would pay on fund distributions or the redemption of fund shares. Total investment return calculated for a period of less than one year is not annualized. |
| (d) | Amount is less than $.005. |
| * | Includes the impact of proceeds received and credited to the Fund resulting from class action settlements, which enhanced the Fund’s performance for the years ended November 30, 2024, November 30, 2023, November 30, 2022 and November 30, 2020 by .06%, .02%, .01%, and .04%, respectively. |
| + | The net asset value and total return include adjustments in accordance with accounting principles generally accepted in the United States of America for financial reporting purposes. As such, the net asset value and total return for shareholder transactions may differ from financial statements. |
See notes to financial statements.
| | |
| |
30 | AB INTERNATIONAL VALUE FUND | | abfunds.com |
REPORT OF INDEPENDENT REGISTERED
PUBLIC ACCOUNTING FIRM
To the Shareholders and the Board of Trustees of AB International Value Fund
Opinion on the Financial Statements
We have audited the accompanying statement of assets and liabilities of AB International Value Fund (the “Fund”) (one of the funds constituting AB Trust (the “Trust”)), including the portfolio of investments, as of November 30, 2024, and the related statement of operations for the year then ended, the statements of changes in net assets for each of the two years in the period then ended, the financial highlights for each of the five years in the period then ended and the related notes (collectively referred to as the “financial statements”). In our opinion, the financial statements present fairly, in all material respects, the financial position of the Fund (one of the funds constituting AB Trust) at November 30, 2024, the results of its operations for the year then ended, the changes in its net assets for each of the two years in the period then ended and its financial highlights for each of the five years in the period then ended, in conformity with U.S. generally accepted accounting principles.
Basis for Opinion
These financial statements are the responsibility of the Trust’s management. Our responsibility is to express an opinion on the Fund’s financial statements based on our audits. We are a public accounting firm registered with the Public Company Accounting Oversight Board (United States) (“PCAOB”) and are required to be independent with respect to the Trust in accordance with the U.S. federal securities laws and the applicable rules and regulations of the Securities and Exchange Commission and the PCAOB.
We conducted our audits in accordance with the standards of the PCAOB. Those standards require that we plan and perform the audit to obtain reasonable assurance about whether the financial statements are free of material misstatement, whether due to error or fraud. The Trust is not required to have, nor were we engaged to perform, an audit of the Trust’s internal control over financial reporting. As part of our audits, we are required to obtain an understanding of internal control over financial reporting but not for the purpose of expressing an opinion on the effectiveness of the Trust’s internal control over financial reporting. Accordingly, we express no such opinion.
Our audits included performing procedures to assess the risks of material misstatement of the financial statements, whether due to error or fraud, and performing procedures that respond to those risks. Such procedures included examining, on a test basis, evidence regarding the amounts and
| | |
| |
| abfunds.com | | AB INTERNATIONAL VALUE FUND | 31 |
REPORT OF INDEPENDENT REGISTERED
PUBLIC ACCOUNTING FIRM (continued)
disclosures in the financial statements. Our procedures included confirmation of securities owned as of November 30, 2024, by correspondence with the custodian, brokers and others; when replies were not received from brokers or others, we performed other auditing procedures. Our audits also included evaluating the accounting principles used and significant estimates made by management, as well as evaluating the overall presentation of the financial statements. We believe that our audits provide a reasonable basis for our opinion.

We have served as the auditor of one or more of the AB investment companies since 1968.
New York, New York
January 24, 2025
| | |
| |
32 | AB INTERNATIONAL VALUE FUND | | abfunds.com |
2024 FEDERAL TAX INFORMATION
(unaudited)
For Federal income tax purposes, the following information is furnished with respect to the earnings of the Fund for the taxable year ended November 30, 2024.
For the taxable year ended November 30, 2024, the Fund designates 45.94% as the maximum amount that may be considered qualified dividend income for individual shareholders.
The Fund intends to make an election to pass through foreign taxes to its shareholders. For the taxable year ended November 30, 2024, $291,263 of foreign taxes may be passed through and the associated foreign source income for information reporting purposes is $3,586,627.
Shareholders should not use the above information to prepare their income tax returns. The information necessary to complete your income tax returns will be included with your Form 1099-DIV which will be sent to you separately in January 2025.
| | |
| |
| abfunds.com | | AB INTERNATIONAL VALUE FUND | 33 |
Information Regarding the Review and Approval of the Fund’s Advisory Agreement
The disinterested trustees (the “directors”) of AB Trust (the “Company”) unanimously approved the continuance of the Company’s Advisory Agreement with the Adviser in respect of AB International Value Fund (the “Fund”) at a meeting held by video conference on May 7-9, 2024 (the “Meeting”).
Prior to approval of the continuance of the Advisory Agreement, the directors had requested from the Adviser, and received and evaluated, extensive materials. They reviewed the proposed continuance of the Advisory Agreement with the Adviser and with experienced counsel who are independent of the Adviser, who advised on the relevant legal standards. The directors also reviewed additional materials, including comparative analytical data prepared by the Senior Vice President of the Fund. The directors also discussed the proposed continuance in private sessions with counsel.
The directors considered their knowledge of the nature and quality of the services provided by the Adviser to the Fund gained from their experience as directors or trustees of most of the registered investment companies advised by the Adviser, their overall confidence in the Adviser’s integrity and competence they have gained from that experience, the Adviser’s initiative in identifying and raising potential issues with the directors and its responsiveness, frankness and attention to concerns raised by the directors in the past, including the Adviser’s willingness to consider and implement organizational and operational changes designed to improve investment results and the services provided to the AB Funds. The directors noted that they have four regular meetings each year, at each of which they review extensive materials and information from the Adviser, including information on the investment performance of the Fund and the money market fund advised by the Adviser in which the Fund invests a portion of its assets.
The directors also considered all factors they believed relevant, including the specific matters discussed below. During the course of their deliberations, the directors evaluated, among other things, the reasonableness of the advisory fee. The directors did not identify any particular information that was all-important or controlling, and different directors may have attributed different weights to the various factors. The directors determined that the selection of the Adviser to manage the Fund and the overall arrangements between the Fund and the Adviser, as provided in the Advisory Agreement, including the advisory fee, were fair and reasonable in light of the services performed, expenses incurred and such other matters as the directors considered relevant in the exercise of their business
| | |
| |
34 | AB INTERNATIONAL VALUE FUND | | abfunds.com |
judgment. The material factors and conclusions that formed the basis for the directors’ determinations included the following:
Nature, Extent and Quality of Services Provided
The directors considered the scope and quality of services provided by the Adviser under the Advisory Agreement, including the quality of the investment research capabilities of the Adviser and the other resources it has dedicated to performing services for the Fund. The directors noted that the Adviser from time to time reviews the Fund’s investment strategies and from time to time proposes changes intended to improve the Fund’s relative or absolute performance for the directors’ consideration. They also noted the professional experience and qualifications of the Fund’s portfolio management team and other senior personnel of the Adviser. The directors also considered that the Advisory Agreement provides that the Fund will reimburse the Adviser for the cost to it of providing certain clerical, accounting, administrative and other services to the Fund by employees of the Adviser or its affiliates. Requests for these reimbursements are made on a quarterly basis and subject to approval by the directors. Reimbursements, to the extent requested and paid, result in a higher rate of total compensation from the Fund to the Adviser than the fee rate stated in the Advisory Agreement. The directors noted that the methodology used to determine the reimbursement amounts had been reviewed by an independent consultant at the request of the directors. The quality of administrative and other services, including the Adviser’s role in coordinating the activities of the Fund’s other service providers, also was considered. The directors concluded that, overall, they were satisfied with the nature, extent and quality of services provided to the Fund under the Advisory Agreement.
Costs of Services Provided and Profitability
The directors reviewed a schedule of the revenues and expenses and related notes indicating the profitability of the Fund to the Adviser for calendar years 2022 and 2023 that had been prepared with an expense allocation methodology arrived at in consultation with an independent consultant at the request of the directors. The directors noted the assumptions and methods of allocation used by the Adviser in preparing fund-specific profitability data and understood that there are a number of potentially acceptable allocation methodologies for information of this type. The directors noted that the profitability information reflected all revenues and expenses of the Adviser’s relationship with the Fund, including those relating to its subsidiaries that provide transfer agency, distribution and brokerage services to the Fund. The directors recognized that it is difficult to make comparisons of the profitability of the Advisory Agreement with the profitability of fund advisory contracts for unaffiliated funds because comparative information is not generally publicly available and is affected by numerous factors. The directors focused on the profitability of the Adviser’s relationship with the Fund before taxes and distribution
| | |
| |
| abfunds.com | | AB INTERNATIONAL VALUE FUND | 35 |
expenses. The directors concluded that the Adviser’s level of profitability from its relationship with the Fund in 2022 was not unreasonable. The directors noted that the Fund was not profitable to the Adviser in 2023.
Fall-Out Benefits
The directors considered the other benefits to the Adviser and its affiliates from their relationships with the Fund and the money market fund advised by the Adviser in which the Fund invests, including, but not limited to, benefits relating to soft dollar arrangements (whereby investment advisers receive brokerage and research services from brokers that execute agency transactions for their clients); 12b-1 fees and sales charges received by the Fund’s principal underwriter (which is a wholly owned subsidiary of the Adviser) in respect of certain classes of the Fund’s shares; brokerage commissions paid by the Fund to brokers affiliated with the Adviser; and transfer agency fees paid by the Fund to a wholly owned subsidiary of the Adviser. The directors recognized that the Fund’s recent unprofitability to the Adviser would be exacerbated without these benefits. The directors understood that the Adviser also might derive reputational and other benefits from its association with the Fund.
Investment Results
In addition to the information reviewed by the directors in connection with the Meeting, the directors receive detailed performance information for the Fund at each regular Board meeting during the year.
At the Meeting, the directors reviewed performance information prepared by an independent service provider (the “15(c) service provider”), showing the performance of the Advisor Class shares of the Fund against a group of similar funds (“peer group”) and a larger group of similar funds (“peer universe”), each selected by the 15(c) service provider, and information prepared by the Adviser showing performance of the Advisor Class shares against a broad-based securities market index, in each case for the 1-, 3-, 5- and 10-year periods ended February 29, 2024 and (in the case of comparisons with the broad-based securities market index) for the period from inception. Based on their review and their discussion with the Adviser of the reasons for the Fund’s underperformance in the periods reviewed, the directors concluded that the Fund’s investment performance was acceptable.
Advisory Fees and Other Expenses
The directors considered the advisory fee rate payable by the Fund to the Adviser and information prepared by the 15(c) service provider concerning advisory fee rates payable by other funds in the same category as the Fund. The directors recognized that it is difficult to make comparisons of advisory fees because there are variations in the services that are included in the fees paid by other funds. The directors compared the Fund’s contractual effective advisory fee rate with a peer group median and noted it
| | |
| |
36 | AB INTERNATIONAL VALUE FUND | | abfunds.com |
was lower than the median. They also noted that the Adviser’s total rate of compensation, taking into account the impact of the administrative expense reimbursement paid to the Adviser in the latest fiscal year, was above the median and discussed with the Adviser the reasons it was above the median.
The directors also considered the Adviser’s fee schedule for other clients utilizing investment strategies similar to those of the Fund. For this purpose, they reviewed the relevant advisory fee information from the Adviser’s Form ADV and in a report from the Fund’s Senior Vice President and noted the differences between the Fund’s fee schedule, on the one hand, and the Adviser’s institutional fee schedule, on the other. The directors noted that the Adviser may, in some cases, agree to fee rates with large institutional clients that are lower than those reviewed by the directors and that they had previously discussed with the Adviser its policies in respect of such arrangements. The directors also compared the advisory fee rate for the Fund with that for another fund advised by the Adviser utilizing similar investment strategies.
The Adviser reviewed with the directors the significantly greater scope of the services it provides to the Fund relative to institutional clients. In this regard, the Adviser noted, among other things, that, compared to institutional accounts, the Fund (i) demands considerably more portfolio management, research and trading resources due to significantly higher daily cash flows; (ii) has more tax and regulatory restrictions and compliance obligations; (iii) must prepare and file or distribute regulatory and other communications about fund operations; and (iv) must provide shareholder servicing to retail investors. The Adviser also reviewed the greater legal risks presented by the large and changing population of Fund shareholders who may assert claims against the Adviser in individual or class actions, and the greater entrepreneurial risk in offering new fund products, which require substantial investment to launch, may not succeed, and generally must be priced to compete with larger, more established funds resulting in lack of profitability to the Adviser until a new fund achieves scale. In light of the substantial differences in services rendered by the Adviser to institutional clients as compared to the Fund, and the different risk profile, the directors considered these fee comparisons inapt and did not place significant weight on them in their deliberations.
In connection with their review of the Fund’s advisory fee, the directors also considered the total expense ratio of the Advisor Class shares of the Fund in comparison to the medians for a peer group and a peer universe selected by the 15(c) service provider. The Advisor Class expense ratio of the Fund was based on the Fund’s latest fiscal year and reflected the impact of the Adviser’s expense cap for the Fund. The directors noted that it was likely that the expense ratios of some of the other funds in the Fund’s category were lowered by waivers or reimbursements by those funds’ investment advisers, which in some cases might be voluntary or
| | |
| |
| abfunds.com | | AB INTERNATIONAL VALUE FUND | 37 |
temporary. The directors view expense ratio information as relevant to their evaluation of the Adviser’s services because the Adviser is responsible for coordinating services provided to the Fund by others. The directors noted that the Fund’s expense ratio was above the medians. After reviewing and discussing the Adviser’s explanations of the reasons for this, the directors requested that the Adviser implement, effective June 1, 2024, a voluntary expense limitation agreement capping total expenses at 0.96% for Advisor Class shares of the Fund, with corresponding expense limitations for the other share classes, and the Adviser agreed to do so.
Economies of Scale
The directors noted that the advisory fee schedule for the Fund contains breakpoints that reduce the fee rates on assets above specified levels. The directors took into consideration prior presentations by an independent consultant on economies of scale in the mutual fund industry and for the AB Funds, and presentations from time to time by the Adviser concerning certain of its views on economies of scale. The directors also had requested and received from the Adviser certain updates on economies of scale in advance of the Meeting. The directors believe that economies of scale may be realized (if at all) by the Adviser across a variety of products and services, and not only in respect of a single fund. The directors noted that there is no established methodology for setting breakpoints that give effect to the fund-specific services provided by a fund’s adviser and to the economies of scale that an adviser may realize in its overall mutual fund business or those components of it which directly or indirectly affect a fund’s operations. The directors observed that in the mutual fund industry as a whole, as well as among funds similar to the Fund, there is no uniformity or pattern in the fees and asset levels at which breakpoints (if any) apply. The directors also noted that the advisory agreements for many funds do not have breakpoints at all. Having taken these factors into account, the directors concluded that the Fund’s shareholders would benefit from a sharing of economies of scale in the event the Fund’s net assets exceed a breakpoint in the future.
| | |
| |
38 | AB INTERNATIONAL VALUE FUND | | abfunds.com |
NOTES
| | |
| |
| abfunds.com | | AB INTERNATIONAL VALUE FUND | 39 |
NOTES
| | |
| |
40 | AB INTERNATIONAL VALUE FUND | | abfunds.com |
AB INTERNATIONAL VALUE FUND
66 Hudson Boulevard East
New York, NY 10001
800 221 5672
IV-0151-1124 
NOV 11.30.24

ANNUAL FINANCIAL STATEMENTS AND ADDITIONAL INFORMATION
AB LARGE CAP VALUE FUND

| | |
| |
| Investment Products Offered | | • Are Not FDIC Insured • May Lose Value • Are Not Bank Guaranteed |
Investors should consider the investment objectives, risks, charges and expenses of the Fund carefully before investing. For copies of our prospectus or summary prospectus, which contain this and other information, visit us online at www.abfunds.com or contact your AB representative. Please read the prospectus and/or summary prospectus carefully before investing.
This shareholder report must be preceded or accompanied by the Fund’s prospectus for individuals who are not current shareholders of the Fund.
You may obtain a description of the Fund’s proxy voting policies and procedures, and information regarding how the Fund voted proxies relating to portfolio securities during the most recent 12-month period ended June 30, without charge. Simply visit AB’s website at www.abfunds.com, or go to the Securities and Exchange Commission’s (the “Commission”) website at www.sec.gov, or call AB at (800) 227 4618.
The Fund files its complete schedule of portfolio holdings with the Commission for the first and third quarters of each fiscal year as an exhibit to its reports on Form N-PORT. The Fund’s Form N-PORT reports are available on the Commission’s website at www.sec.gov. AB publishes full portfolio holdings for the Fund monthly at www.abfunds.com.
AllianceBernstein Investments, Inc. (ABI) is the distributor of the AB family of mutual funds. ABI is a member of FINRA and is an affiliate of AllianceBernstein L.P., the Adviser of the funds.
The [A/B] logo and AllianceBernstein® are registered trademarks used by permission of the owner, AllianceBernstein L.P.
PORTFOLIO OF INVESTMENTS
November 30, 2024
| | | | | | | | |
| Company | | Shares | | | U.S. $ Value | |
| |
COMMON STOCKS – 99.8% | | | | | | | | |
Financials – 19.9% | | | | | | | | |
Banks – 8.1% | | | | | | | | |
Bank of America Corp. | | | 213,196 | | | $ | 10,128,942 | |
First Citizens BancShares, Inc./NC – Class A | | | 2,039 | | | | 4,679,505 | |
M&T Bank Corp. | | | 21,526 | | | | 4,735,505 | |
Wells Fargo & Co. | | | 256,849 | | | | 19,564,188 | |
| | | | | | | | |
| | | | 39,108,140 | |
| | | | | |
Capital Markets – 5.4% | | | | | | | | |
Charles Schwab Corp. (The) | | | 189,423 | | | | 15,676,647 | |
Morgan Stanley | | | 79,275 | | | | 10,433,383 | |
| | | | | | | | |
| | | | 26,110,030 | |
| | | | | |
Financial Services – 4.3% | | | | | | | | |
Corebridge Financial, Inc. | | | 255,937 | | | | 8,284,681 | |
Fiserv, Inc.(a) | | | 55,877 | | | | 12,346,582 | |
| | | | | | | | |
| | | | 20,631,263 | |
| | | | | |
Insurance – 2.1% | | | | | | | | |
Progressive Corp. (The) | | | 36,944 | | | | 9,933,503 | |
| | | | | | | | |
| | | | | | | 95,782,936 | |
| | | | | | | | |
Health Care – 16.5% | | | | | | | | |
Biotechnology – 1.5% | | | | | | | | |
AbbVie, Inc. | | | 38,942 | | | | 7,123,660 | |
| | | | | | | | |
| | |
Health Care Equipment & Supplies – 1.3% | | | | | | | | |
Medtronic PLC | | | 75,047 | | | | 6,494,567 | |
| | | | | | | | |
| | |
Health Care Providers & Services – 8.4% | | | | | | | | |
Encompass Health Corp. | | | 83,843 | | | | 8,630,799 | |
Labcorp Holdings, Inc. | | | 51,871 | | | | 12,509,210 | |
UnitedHealth Group, Inc. | | | 31,524 | | | | 19,235,945 | |
| | | | | | | | |
| | | | | | | 40,375,954 | |
| | | | | | | | |
Life Sciences Tools & Services – 3.0% | | | | | | | | |
ICON PLC(a) | | | 20,553 | | | | 4,321,268 | |
Thermo Fisher Scientific, Inc. | | | 19,346 | | | | 10,246,222 | |
| | | | | | | | |
| | | | | | | 14,567,490 | |
| | | | | | | | |
Pharmaceuticals – 2.3% | | | | | | | | |
Bristol-Myers Squibb Co. | | | 85,971 | | | | 5,091,203 | |
Merck & Co., Inc. | | | 56,435 | | | | 5,736,053 | |
| | | | | | | | |
| | | | 10,827,256 | |
| | | | | |
| | | | 79,388,927 | |
| | | | | |
Industrials – 13.4% | | | | | | | | |
Air Freight & Logistics – 1.4% | | | | | | | | |
CH Robinson Worldwide, Inc. | | | 61,839 | | | | 6,528,962 | |
| | | | | | | | |
| | |
Building Products – 1.5% | | | | | | | | |
Builders FirstSource, Inc.(a) | | | 38,011 | | | | 7,087,911 | |
| | | | | | | | |
| | |
| |
| abfunds.com | | AB LARGE CAP VALUE FUND | 1 |
PORTFOLIO OF INVESTMENTS (continued)
| | | | | | | | |
| Company | | Shares | | | U.S. $ Value | |
| |
Electrical Equipment – 2.5% | | | | | | | | |
Eaton Corp. PLC | | | 21,790 | | | $ | 8,180,402 | |
Sensata Technologies Holding PLC | | | 126,499 | | | | 4,065,678 | |
| | | | | | | | |
| | | | 12,246,080 | |
| | | | | |
Ground Transportation – 0.7% | | | | | | | | |
ArcBest Corp. | | | 28,551 | | | | 3,291,359 | |
| | | | | | | | |
| | |
Machinery – 5.9% | | | | | | | | |
Deere & Co. | | | 19,302 | | | | 8,992,802 | |
PACCAR, Inc. | | | 62,078 | | | | 7,263,126 | |
Pentair PLC | | | 80,073 | | | | 8,727,156 | |
Stanley Black & Decker, Inc. | | | 39,561 | | | | 3,538,731 | |
| | | | | | | | |
| | | | 28,521,815 | |
| | | | | |
Professional Services – 1.4% | | | | | | | | |
Robert Half, Inc. | | | 88,484 | | | | 6,601,791 | |
| | | | | | | | |
| | | | | | | 64,277,918 | |
| | | | | | | | |
Consumer Discretionary – 8.7% | | | | | | | | |
Hotels, Restaurants & Leisure – 2.3% | | | | | | | | |
McDonald’s Corp. | | | 37,263 | | | | 11,030,221 | |
| | | | | | | | |
| | |
Household Durables – 0.8% | | | | | | | | |
PulteGroup, Inc. | | | 29,012 | | | | 3,924,453 | |
| | | | | | | | |
| | |
Specialty Retail – 4.2% | | | | | | | | |
AutoZone, Inc.(a) | | | 1,404 | | | | 4,450,034 | |
Bath & Body Works, Inc. | | | 67,009 | | | | 2,428,406 | |
Lowe’s Cos., Inc. | | | 47,453 | | | | 12,927,621 | |
| | | | | | | | |
| | | | 19,806,061 | |
| | | | | | | | |
Textiles, Apparel & Luxury Goods – 1.4% | | | | | | | | |
Tapestry, Inc. | | | 108,808 | | | | 6,776,562 | |
| | | | | | | | |
| | | | | | | 41,537,297 | |
| | | | | | | | |
Information Technology – 8.3% | | | | | | | | |
Semiconductors & Semiconductor Equipment – 2.6% | | | | | | | | |
Lam Research Corp. | | | 61,413 | | | | 4,537,193 | |
NXP Semiconductors NV | | | 34,484 | | | | 7,909,595 | |
| | | | | | | | |
| | | | | | | 12,446,788 | |
| | | | | | | | |
Software – 4.0% | | | | | | | | |
Gen Digital, Inc. | | | 257,246 | | | | 7,936,039 | |
Oracle Corp. | | | 61,843 | | | | 11,431,060 | |
| | | | | | | | |
| | | | | | | 19,367,099 | |
| | | | | | | | |
Technology Hardware, Storage & Peripherals – 1.7% | | | | | | | | |
Western Digital Corp.(a) | | | 110,961 | | | | 8,099,043 | |
| | | | | | | | |
| | | | | | | 39,912,930 | |
| | | | | | | | |
| | |
| |
2 | AB LARGE CAP VALUE FUND | | abfunds.com |
PORTFOLIO OF INVESTMENTS (continued)
| | | | | | | | |
| Company | | Shares | | | U.S. $ Value | |
| |
Energy – 7.3% | | | | | | | | |
Energy Equipment & Services – 2.7% | | | | | | | | |
Baker Hughes Co. | | | 297,527 | | | $ | 13,076,312 | |
| | | | | | | | |
| | |
Oil, Gas & Consumable Fuels – 4.6% | | | | | | | | |
Cameco Corp. (New York)(b) | | | 83,190 | | | | 4,945,645 | |
EOG Resources, Inc. | | | 69,674 | | | | 9,284,757 | |
Exxon Mobil Corp. | | | 65,862 | | | | 7,769,082 | |
| | | | | | | | |
| | | | 21,999,484 | |
| | | | | |
| | | | 35,075,796 | |
| | | | | |
Communication Services – 7.1% | | | | | | | | |
Diversified Telecommunication Services – 2.2% | | | | | | | | |
Comcast Corp. – Class A | | | 246,226 | | | | 10,634,501 | |
| | | | | | | | |
| | |
Entertainment – 3.0% | | | | | | | | |
Walt Disney Co. (The) | | | 120,059 | | | | 14,103,331 | |
| | | | | | | | |
| | |
Wireless Telecommunication Services – 1.9% | | | | | | | | |
T-Mobile US, Inc. | | | 36,963 | | | | 9,127,643 | |
| | | | | | | | |
| | | | | | | 33,865,475 | |
| | | | | | | | |
Consumer Staples – 6.7% | | | | | | | | |
Beverages – 1.1% | | | | | | | | |
Coca-Cola Co. (The) | | | 81,674 | | | | 5,233,670 | |
| | | | | | | | |
| | |
Consumer Staples Distribution & Retail – 4.1% | | | | | | | | |
Walmart, Inc. | | | 212,693 | | | | 19,674,102 | |
| | | | | | | | |
| | |
Household Products – 1.5% | | | | | | | | |
Procter & Gamble Co. (The) | | | 39,741 | | | | 7,123,972 | |
| | | | | | | | |
| | | | | | | 32,031,744 | |
| | | | | | | | |
Real Estate – 4.0% | | | | | | | | |
Hotel & Resort REITs – 1.0% | | | | | | | | |
Ryman Hospitality Properties, Inc. | | | 42,443 | | | | 4,976,017 | |
| | | | | | | | |
| | |
Industrial REITs – 1.1% | | | | | | | | |
Prologis, Inc. | | | 45,932 | | | | 5,363,939 | |
| | | | | | | | |
| | |
Office REITs – 0.8% | | | | | | | | |
COPT Defense Properties | | | 109,945 | | | | 3,622,688 | |
| | | | | | | | |
| | |
Specialized REITs – 1.1% | | | | | | | | |
Equinix, Inc. | | | 5,571 | | | | 5,467,825 | |
| | | | | | | | |
| | | | | | | 19,430,469 | |
| | | | | | | | |
Utilities – 4.0% | | | | | | | | |
Electric Utilities – 2.2% | | | | | | | | |
American Electric Power Co., Inc. | | | 108,305 | | | | 10,815,337 | |
| | | | | | | | |
| | |
| |
| abfunds.com | | AB LARGE CAP VALUE FUND | 3 |
PORTFOLIO OF INVESTMENTS (continued)
| | | | | | | | |
| Company | | Shares | | | U.S. $ Value | |
| |
Multi-Utilities – 1.8% | | | | | | | | |
Ameren Corp. | | | 91,150 | | | $ | 8,603,649 | |
| | | | | | | | |
| | | | | | | 19,418,986 | |
| | | | | | | | |
Materials – 3.9% | | | | | | | | |
Chemicals – 3.9% | | | | | | | | |
Corteva, Inc. | | | 129,845 | | | | 8,081,553 | |
LyondellBasell Industries NV – Class A | | | 124,853 | | | | 10,405,249 | |
| | | | | | | | |
| | | | | | | 18,486,802 | |
| | | | | | | | |
Total Common Stocks
(cost $342,069,950) | | | | | | | 479,209,280 | |
| | | | | | | | |
| | | | | | | | |
SHORT-TERM INVESTMENTS – 0.1% | | | | | | | | |
Investment Companies – 0.1% | | | | | | | | |
AB Fixed Income Shares, Inc. – Government Money Market Portfolio – Class AB,
4.54%(c)(d)(e)
(cost $686,391) | | | 686,391 | | | | 686,391 | |
| | | | | | | | |
| | |
Total Investments – 99.9%
(cost $342,756,341) | | | | | | | 479,895,671 | |
Other assets less liabilities – 0.1% | | | | | | | 328,917 | |
| | | | | | | | |
| | |
Net Assets – 100.0% | | | | | | $ | 480,224,588 | |
| | | | | | | | |
| (a) | Non-income producing security. |
| (b) | Represents entire or partial securities out on loan. See Note E for securities lending information. |
| (c) | Affiliated investments. |
| (d) | The rate shown represents the 7-day yield as of period end. |
| (e) | To obtain a copy of the fund’s shareholder report, please go to the Securities and Exchange Commission’s website at www.sec.gov, or call AB at (800) 227-4618. |
Glossary:
REIT – Real Estate Investment Trust
See notes to financial statements.
| | |
| |
4 | AB LARGE CAP VALUE FUND | | abfunds.com |
STATEMENT OF ASSETS & LIABILITIES
November 30, 2024
| | | | |
| Assets | |
Investments in securities, at value | |
Unaffiliated issuers (cost $342,069,950) | | $ | 479,209,280 | (a) |
Affiliated issuers (cost $686,391) | | | 686,391 | |
Unaffiliated dividends receivable | | | 669,520 | |
Receivable for shares of beneficial interest sold | | | 63,628 | |
Receivable due from Adviser | | | 44,636 | |
Affiliated dividends receivable | | | 2,227 | |
| | | | |
Total assets | | | 480,675,682 | |
| | | | |
| Liabilities | |
Advisory fee payable | | | 191,305 | |
Payable for shares of beneficial interest redeemed | | | 58,691 | |
Custody and accounting fees payable | | | 56,204 | |
Administrative fee payable | | | 40,098 | |
Audit and tax fee payable | | | 38,834 | |
Distribution fee payable | | | 11,304 | |
Transfer Agent fee payable | | | 7,641 | |
Trustees’ fees payable | | | 880 | |
Accrued expenses | | | 46,137 | |
| | | | |
Total liabilities | | | 451,094 | |
| | | | |
Net Assets | | $ | 480,224,588 | |
| | | | |
| Composition of Net Assets | | | | |
Paid-in capital | | $ | 294,515,303 | |
Distributable earnings | | | 185,709,285 | |
| | | | |
Net Assets | | $ | 480,224,588 | |
| | | | |
Net Asset Value Per Share—unlimited shares authorized, without par value
| | | | | | | | | | | | |
| Class | | Net Assets | | | Shares
Outstanding | | | Net Asset
Value | |
| |
| A | | $ | 53,835,117 | | | | 2,615,635 | | | $ | 20.58 | * |
| |
| C | | $ | 796,906 | | | | 38,392 | | | $ | 20.76 | |
| |
| Advisor | | $ | 423,767,358 | | | | 20,532,993 | | | $ | 20.64 | |
| |
| I | | $ | 1,814,364 | | | | 89,022 | | | $ | 20.38 | |
| |
| Z | | $ | 10,843 | | | | 526 | | | $ | 20.61 | |
| |
| (a) | Includes securities on loan with a value of $4,896,183 (see Note E). |
| * | The maximum offering price per share for Class A shares was $21.49 which reflects a sales charge of 4.25%. |
See notes to financial statements.
| | |
| |
| abfunds.com | | AB LARGE CAP VALUE FUND | 5 |
STATEMENT OF OPERATIONS
Year Ended November 30, 2024
| | | | | | | | |
| Investment Income | |
Dividends | |
Unaffiliated issuers (net of foreign taxes withheld of $42,276) | | $ | 8,870,435 | | | | | |
Affiliated issuers | | | 88,319 | | | | | |
Interest | | | 160 | | | | | |
Securities lending income | | | 11,230 | | | $ | 8,970,144 | |
| | | | | | | | |
| Expenses | |
Advisory fee (see Note B) | | | 2,298,429 | | | | | |
Distribution fee—Class A | | | 127,244 | | | | | |
Distribution fee—Class C | | | 8,200 | | | | | |
Distribution fee—Class R | | | 867 | | | | | |
Distribution fee—Class K | | | 6,116 | | | | | |
Transfer agency—Class A | | | 20,384 | | | | | |
Transfer agency—Class C | | | 433 | | | | | |
Transfer agency—Advisor Class | | | 150,407 | | | | | |
Transfer agency—Class R | | | 395 | | | | | |
Transfer agency—Class K | | | 4,787 | | | | | |
Transfer agency—Class I | | | 2,072 | | | | | |
Registration fees | | | 112,358 | | | | | |
Legal | | | 111,595 | | | | | |
Administrative | | | 93,818 | | | | | |
Custody and accounting | | | 69,899 | | | | | |
Audit and tax | | | 56,544 | | | | | |
Printing | | | 40,891 | | | | | |
Trustees’ fees | | | 26,421 | | | | | |
Miscellaneous | | | 27,285 | | | | | |
| | | | | | | | |
Total expenses | | | 3,158,145 | | | | | |
Less: expenses waived and reimbursed by the Adviser (see Notes B & E) | | | (79,710 | ) | | | | |
| | | | | | | | |
Net expenses | | | | | | | 3,078,435 | |
| | | | | | | | |
Net investment income | | | | | | | 5,891,709 | |
| | | | | | | | |
| Realized and Unrealized Gain on Investment and Foreign Currency Transactions | | | | | | | | |
Net realized gain on: | | | | | | | | |
Investment transactions | | | | | | | 46,201,288 | |
Foreign currency transactions | | | | | | | 155 | |
Net change in unrealized appreciation (depreciation) of investments | | | | | | | 67,694,046 | |
| | | | | | | | |
Net gain on investment and foreign currency transactions | | | | | | | 113,895,489 | |
| | | | | | | | |
Net Increase in Net Assets from Operations | | | | | | $ | 119,787,198 | |
| | | | | | | | |
See notes to financial statements.
| | |
| |
6 | AB LARGE CAP VALUE FUND | | abfunds.com |
STATEMENT OF CHANGES IN NET ASSETS
| | | | | | | | |
| | | Year Ended
November 30,
2024 | | | Year Ended
November 30,
2023 | |
| Increase in Net Assets from Operations | | | | | | | | |
Net investment income | | $ | 5,891,709 | | | $ | 5,845,465 | |
Net realized gain on investment transactions | | | 46,201,443 | | | | 14,647,025 | |
Net change in unrealized appreciation (depreciation) of investments and foreign currency denominated assets and liabilities | | | 67,694,046 | | | | 7,407,862 | |
| | | | | | | | |
Net increase in net assets from operations | | | 119,787,198 | | | | 27,900,352 | |
Distributions to Shareholders | |
Class A | | | (2,252,713 | ) | | | (5,442,295 | ) |
Class C | | | (31,966 | ) | | | (152,368 | ) |
Advisor Class | | | (16,452,685 | ) | | | (38,917,044 | ) |
Class R | | | (15,001 | ) | | | (35,422 | ) |
Class K | | | (261,446 | ) | | | (742,979 | ) |
Class I | | | (84,771 | ) | | | (189,306 | ) |
| Transactions in Shares of Beneficial Interest | | | | | | | | |
Net increase (decrease) | | | (11,949,859 | ) | | | 8,451,820 | |
| | | | | | | | |
Total increase (decrease) | | | 88,738,757 | | | | (9,127,242 | ) |
| Net Assets | | | | | | | | |
Beginning of period | | | 391,485,831 | | | | 400,613,073 | |
| | | | | | | | |
End of period | | $ | 480,224,588 | | | $ | 391,485,831 | |
| | | | | | | | |
See notes to financial statements.
| | |
| |
| abfunds.com | | AB LARGE CAP VALUE FUND | 7 |
NOTES TO FINANCIAL STATEMENTS
November 30, 2024
NOTE A
Significant Accounting Policies
AB Trust (the “Trust”) is organized as a Massachusetts business trust and is registered under the Investment Company Act of 1940 (the “1940 Act”) as a diversified, open-end management investment company. The Trust operates as a series company currently comprised of three funds. Each fund is considered to be a separate entity for financial reporting and tax purposes. This report relates only to the AB Large Cap Value Fund (the “Fund”) (formerly known as AB Value Fund), a diversified fund. The Fund offers Class A, Class C, Advisor Class, Class I and Class Z shares. Effective October 1, 2024, the Fund commenced offering Class Z shares. Class B, Class R and Class K, shares have been authorized but currently are not offered. Effective May 20, 2024, Class R and Class K were liquidated. Class A shares are sold with a front-end sales charge of up to 4.25% for purchases not exceeding $1,000,000. With respect to purchases of $1,000,000 or more, Class A shares redeemed within one year of purchase may be subject to a contingent deferred sales charge of 1%. Class C shares are subject to a contingent deferred sales charge of 1% on redemptions made within the first year after purchase, and 0% after the first year of purchase. Class C shares automatically convert to Class A shares eight years after the end of the calendar month of purchase. Advisor Class, Class I and Class Z shares are sold without an initial or contingent deferred sales charge and are not subject to ongoing distribution expenses. All eight classes of shares have identical voting, dividend, liquidation and other rights, except that the classes bear different distribution and transfer agency expenses. Each class has exclusive voting rights with respect to its distribution plan. The financial statements have been prepared in conformity with U.S. generally accepted accounting principles (“U.S. GAAP”), which require management to make certain estimates and assumptions that affect the reported amounts of assets and liabilities in the financial statements and amounts of income and expenses during the reporting period. Actual results could differ from those estimates. The Fund is an investment company under U.S. GAAP and follows the accounting and reporting guidance applicable to investment companies. The following is a summary of significant accounting policies followed by the Fund.
1. Security Valuation
Portfolio securities are valued at market value determined on the basis of market quotations or, if market quotations are not readily available or are unreliable, at “fair value” as determined in accordance with procedures approved by and under the oversight of the Trust’s Board of Trustees (the “Board”). Pursuant to these procedures, AllianceBernstein L.P. (the “Adviser”) serves as the Fund’s valuation designee pursuant to Rule 2a-5
| | |
| |
8 | AB LARGE CAP VALUE FUND | | abfunds.com |
NOTES TO FINANCIAL STATEMENTS (continued)
of the 1940 Act. In this capacity, the Adviser is responsible, among other things, for making all fair value determinations relating to the Fund’s portfolio investments, subject to the Board’s oversight.
In general, the market values of securities which are readily available and deemed reliable are determined as follows: securities listed on a national securities exchange (other than securities listed on the NASDAQ Stock Market, Inc. (“NASDAQ”)) or on a foreign securities exchange are valued at the last sale price at the close of the exchange or foreign securities exchange. If there has been no sale on such day, the securities are valued at the last traded price from the previous day. Securities listed on more than one exchange are valued by reference to the principal exchange on which the securities are traded; securities listed only on NASDAQ are valued in accordance with the NASDAQ Official Closing Price; listed or over the counter (“OTC”) market put or call options are valued at the mid level between the current bid and ask prices. If either a current bid or current ask price is unavailable, the Adviser will have discretion to determine the best valuation (e.g., last trade price in the case of listed options); open futures are valued using the closing settlement price or, in the absence of such a price, the most recent quoted bid price. If there are no quotations available for the day of valuation, the last available closing settlement price is used; U.S. Government securities and any other debt instruments having 60 days or less remaining until maturity are generally valued at market by an independent pricing vendor, if a market price is available. If a market price is not available, the securities are valued at amortized cost. This methodology is commonly used for short term securities that have an original maturity of 60 days or less, as well as short term securities that had an original term to maturity that exceeded 60 days. In instances when amortized cost is utilized, the Valuation Committee (the “Committee”) must reasonably conclude that the utilization of amortized cost is approximately the same as the fair value of the security. Factors the Committee will consider include, but are not limited to, an impairment of the creditworthiness of the issuer or material changes in interest rates. Fixed-income securities, including mortgage-backed and asset-backed securities, may be valued on the basis of prices provided by a pricing service or at a price obtained from one or more of the major broker-dealers. In cases where broker-dealer quotes are obtained, the Adviser may establish procedures whereby changes in market yields or spreads are used to adjust, on a daily basis, a recently obtained quoted price on a security. Swaps and other derivatives are valued daily, primarily using independent pricing services, independent pricing models using market inputs, as well as third party broker-dealers or counterparties. Open-end mutual funds are valued at the closing net asset value per share, while exchange-traded funds are valued at the closing market price per share.
| | |
| |
| abfunds.com | | AB LARGE CAP VALUE FUND | 9 |
NOTES TO FINANCIAL STATEMENTS (continued)
Securities for which market quotations are not readily available (including restricted securities) or are deemed unreliable are valued at fair value as deemed appropriate by the Adviser. Factors considered in making this determination may include, but are not limited to, information obtained by contacting the issuer, analysts, analysis of the issuer’s financial statements or other available documents. In addition, the Fund may use fair value pricing for securities primarily traded in non-U.S. markets because most foreign markets close well before the Fund values its securities at 4:00 p.m., Eastern Time. The earlier close of these foreign markets gives rise to the possibility that significant events, including broad market moves, may have occurred in the interim and may materially affect the value of those securities. To account for this, the Fund generally values many of its foreign equity securities using fair value prices based on third party vendor modeling tools to the extent available.
2. Fair Value Measurements
In accordance with U.S. GAAP regarding fair value measurements, fair value is defined as the price that the Fund would receive to sell an asset or pay to transfer a liability in an orderly transaction between market participants at the measurement date. U.S. GAAP establishes a framework for measuring fair value, and a three-level hierarchy for fair value measurements based upon the transparency of inputs to the valuation of an asset or liability (including those valued based on their market values as described in Note A.1 above). Inputs may be observable or unobservable and refer broadly to the assumptions that market participants would use in pricing the asset or liability. Observable inputs reflect the assumptions market participants would use in pricing the asset or liability based on market data obtained from sources independent of the Fund. Unobservable inputs reflect the Fund’s own assumptions about the assumptions that market participants would use in pricing the asset or liability based on the best information available in the circumstances. Each investment is assigned a level based upon the observability of the inputs which are significant to the overall valuation. The three-tier hierarchy of inputs is summarized below.
| | • | | Level 1—quoted prices in active markets for identical investments |
| | • | | Level 2—other significant observable inputs (including quoted prices for similar investments, interest rates, prepayment speeds, credit risk, etc.) |
| | • | | Level 3—significant unobservable inputs (including the Fund’s own assumptions in determining the fair value of investments) |
Where readily available market prices or relevant bid prices are not available for certain equity investments, such investments may be valued based on similar publicly traded investments, movements in relevant indices since
| | |
| |
10 | AB LARGE CAP VALUE FUND | | abfunds.com |
NOTES TO FINANCIAL STATEMENTS (continued)
last available prices or based upon underlying company fundamentals and comparable company data (such as multiples to earnings or other multiples to equity). Where an investment is valued using an observable input, such as another publicly traded security, the investment will be classified as Level 2. If management determines that an adjustment is appropriate based on restrictions on resale, illiquidity or uncertainty, and such adjustment is a significant component of the valuation, the investment will be classified as Level 3. An investment will also be classified as Level 3 where management uses company fundamentals and other significant inputs to determine the valuation.
The following table summarizes the valuation of the Fund’s investments by the above fair value hierarchy levels as of November 30, 2024:
| | | | | | | | | | | | | | | | |
Investments in
Securities: | | Level 1 | | | Level 2 | | | Level 3 | | | Total | |
Assets: | |
Common Stocks(a) | | $ | 479,209,280 | | | $ | – 0 | – | | $ | – 0 | – | | $ | 479,209,280 | |
Short-Term Investments | | | 686,391 | | | | – 0 | – | | | – 0 | – | | | 686,391 | |
| | | | | | | | | | | | | | | | |
Total Investments in Securities | | | 479,895,671 | | | | – 0 | – | | | – 0 | – | | | 479,895,671 | |
Other Financial Instruments(b) | | | – 0 | – | | | – 0 | – | | | – 0 | – | | | – 0 | – |
| | | | | | | | | | | | | | | | |
Total | | $ | 479,895,671 | | | $ | – 0 | – | | $ | – 0 | – | | $ | 479,895,671 | |
| | | | | | | | | | | | | | | | |
| (a) | See Portfolio of Investments for sector classifications. |
| (b) | Other financial instruments include derivative instruments, such as futures, forwards and swaps. Derivative instruments are valued at the unrealized appreciation (depreciation) on the instrument. Other financial instruments may also include swaps with upfront premiums, written options and written swaptions which are valued at market value. |
3. Currency Translation
Assets and liabilities denominated in foreign currencies and commitments under forward currency exchange contracts are translated into U.S. dollars at the mean of the quoted bid and ask prices of such currencies against the U.S. dollar. Purchases and sales of portfolio securities are translated into U.S. dollars at the rates of exchange prevailing when such securities were acquired or sold. Income and expenses are translated into U.S. dollars at rates of exchange prevailing when accrued.
Net realized gain or loss on foreign currency transactions represents foreign exchange gains and losses from sales and maturities of foreign fixed income investments, holding of foreign currencies, currency gains or losses realized between the trade and settlement dates on foreign investment transactions, and the difference between the amounts of dividends, interest and foreign withholding taxes recorded on the Fund’s books and the U.S. dollar equivalent amounts actually received or paid. Net unrealized currency gains and losses from valuing foreign currency denominated
| | |
| |
| abfunds.com | | AB LARGE CAP VALUE FUND | 11 |
NOTES TO FINANCIAL STATEMENTS (continued)
assets and liabilities at period end exchange rates are reflected as a component of net unrealized appreciation or depreciation of foreign currency denominated assets and liabilities.
4. Taxes
It is the Fund’s policy to meet the requirements of the Internal Revenue Code applicable to regulated investment companies and to distribute all of its investment company taxable income and net realized gains, if any, to shareholders. Therefore, no provisions for federal income or excise taxes are required. The Fund may be subject to taxes imposed by countries in which it invests. Such taxes are generally based on income and/or capital gains earned or repatriated. Taxes are accrued and applied to net investment income, net realized gains and net unrealized appreciation/depreciation as such income and/or gains are earned.
In accordance with U.S. GAAP requirements regarding accounting for uncertainties in income taxes, management has analyzed the Fund’s tax positions taken or expected to be taken on federal and state income tax returns for all open tax years (the current and the prior three tax years) and has concluded that no provision for income tax is required in the Fund’s financial statements.
5. Investment Income and Investment Transactions
Dividend income is recorded on the ex-dividend date or as soon as the Fund is informed of the dividend. Interest income is accrued daily. Investment transactions are accounted for on the date the securities are purchased or sold. Investment gains or losses are determined on the identified cost basis. Non-cash dividends, if any, are recorded on the ex-dividend date at the fair value of the securities received. The Fund amortizes premiums and accretes discounts as adjustments to interest income. The Fund accounts for distributions received from real estate investment trust (“REIT”) investments or from regulated investment companies as dividend income, realized gain, or return of capital based on information provided by the REIT or the investment company.
6. Class Allocations
All income earned and expenses incurred by the Fund are borne on a pro-rata basis by each outstanding class of shares, based on the proportionate interest in the Fund represented by the net assets of such class, except for class specific expenses which are allocated to the respective class. Expenses of the Trust are charged proportionately to each fund or based on other appropriate methods. Realized and unrealized gains and losses are allocated among the various share classes based on respective net assets.
| | |
| |
12 | AB LARGE CAP VALUE FUND | | abfunds.com |
NOTES TO FINANCIAL STATEMENTS (continued)
7. Dividends and Distributions
Dividends and distributions to shareholders, if any, are recorded on the ex-dividend date. Income dividends and capital gains distributions are determined in accordance with federal tax regulations and may differ from those determined in accordance with U.S. GAAP. To the extent these differences are permanent, such amounts are reclassified within the capital accounts based on their federal tax basis treatment; temporary differences do not require such reclassification.
8. Cash and Short-Term Investments
Cash and short-term investments include cash on hand and short-term investments with maturities of less than one year when purchased.
NOTE B
Advisory Fee and Other Transactions with Affiliates
Under the terms of the investment advisory agreement, the Fund pays the Adviser an advisory fee at an annual rate of .50% of the first $2.5 billion, .45% of the next $2.5 billion and .40% in excess of $5 billion, of the Fund’s average daily net assets. Prior to August 1, 2024, the Fund paid the Adviser an advisory fee at an annual rate of .55% of the first $2.5 billion, .45% of the next $2.5 billion and .40% in excess of $5 billion, of the Fund’s average daily net assets. The fee is accrued daily and paid monthly. Effective August 1, 2024, the Advisor has contractually agreed to waive 0.025% of the advisory fee. The advisory fee waiver cannot be terminated until February 28, 2026. The Adviser has contractually agreed to waive its advisory fees and/or bear certain expenses of the Fund to the extent necessary to prevent total Fund operating expenses (excluding acquired fund fees and expenses other than the advisory fees of any AB mutual funds in which the Fund may invest, interest expense and extraordinary expenses), on an annualized basis, from exceeding .90%, 1.65%, .65%, .65% and .65% of average daily net assets for the Class A, Class C, Advisor Class, Class I and Class Z shares. For the year ended November 30, 2024, such waiver amounted to $76,189.
Pursuant to the investment advisory agreement, the Fund may reimburse the Adviser for certain legal and accounting services provided to the Fund by the Adviser. For the year ended November 30, 2024, the reimbursement for such services amounted to $93,818.
The Fund compensates AllianceBernstein Investor Services, Inc. (“ABIS”), a wholly-owned subsidiary of the Adviser, under a Transfer Agency Agreement for providing personnel and facilities to perform transfer agency services for the Fund. ABIS may make payments to intermediaries that provide omnibus account services, sub-accounting services and/or networking services. Such compensation retained by ABIS amounted to $93,208 for the year ended November 30, 2024.
| | |
| |
| abfunds.com | | AB LARGE CAP VALUE FUND | 13 |
NOTES TO FINANCIAL STATEMENTS (continued)
AllianceBernstein Investments, Inc. (the “Distributor”), a wholly-owned subsidiary of the Adviser, serves as the distributor of the Fund’s shares. The Distributor has advised the Fund that it has retained front-end sales charges of $1,825 from the sale of Class A shares and received $58 and $97 in contingent deferred sales charges imposed upon redemptions by shareholders of Class A and Class C shares, respectively, for the year ended November 30, 2024.
The Fund may invest in AB Government Money Market Portfolio (the “Government Money Market Portfolio”) which has a contractual annual advisory fee rate of .20% of the portfolio’s average daily net assets and bears its own expenses. The Adviser had contractually agreed to waive .10% of the advisory fee of Government Money Market Portfolio (resulting in a net advisory fee of .10%) until August 31, 2023. Effective September 1, 2023, the Adviser has contractually agreed to waive .05% of the advisory fee of Government Money Market Portfolio (resulting in a net advisory fee of .15%) until August 31, 2024. In connection with the investment by the Fund in Government Money Market Portfolio, the Adviser has contractually agreed to waive its advisory fee from the Fund in an amount equal to the Fund’s pro rata share of the effective advisory fee of Government Money Market Portfolio, as borne indirectly by the Fund as an acquired fund fee and expense. For the year ended November 30, 2024, such waiver amounted to $3,114.
A summary of the Fund’s transactions in AB mutual funds for the year ended November 30, 2024 is as follows:
| | | | | | | | | | | | | | | | | | | | |
Fund | | Market Value
11/30/23
(000) | | | Purchases
at Cost
(000) | | | Sales
Proceeds
(000) | | | Market Value
11/30/24
(000) | | | Dividend
Income
(000) | |
Government Money Market Portfolio | | $ | – 0 | – | | $ | 164,587 | | | $ | 163,901 | | | $ | 686 | | | $ | 88 | |
Government Money Market Portfolio* | | | 5,071 | | | | 11,712 | | | | 16,783 | | | | – 0 | – | | | 1 | |
| | | | | | | | | | | | | | | | | | | | |
Total | | | | | | | | | | | | | | $ | 686 | | | $ | 89 | |
| | | | | | | | | | | | | | | | | | | | |
| * | Investments of cash collateral for securities lending transactions (see Note E) |
NOTE C
Distribution Services Agreement
The Fund has adopted a Distribution Services Agreement (the “Agreement”) pursuant to Rule 12b-1 under the 1940 Act. Under the Agreement, the Fund pays distribution and servicing fees to the Distributor
| | |
| |
14 | AB LARGE CAP VALUE FUND | | abfunds.com |
NOTES TO FINANCIAL STATEMENTS (continued)
at an annual rate of up to .30% of the Fund’s average daily net assets attributable to Class A shares, 1% of the Fund’s average daily net assets attributable to Class C shares, .50% of the Fund’s average daily net assets attributable to Class R shares and .25% of the Fund’s average daily net assets attributable to Class K shares. There are no distribution and servicing fees on the Advisor Class, Class I and Class Z shares. Payments under the Agreement in respect of Class A shares are currently limited to an annual rate of .25% of Class A shares’ average daily net assets. The fees are accrued daily and paid monthly. The Agreement provides that the Distributor will use such payments in their entirety for distribution assistance and promotional activities. Since the commencement of the Fund’s operations, the Distributor has incurred expenses in excess of the distribution costs reimbursed by the Fund in the amounts of $979,585, $148,701 and $85,389 for Class C, Class R and Class K shares, respectively. While such costs may be recovered from the Fund in future periods so long as the Agreement is in effect, and the share class is active, the rate of the distribution and servicing fees payable under the Agreement may not be increased without a shareholder vote. In accordance with the Agreement, there is no provision for recovery of unreimbursed distribution costs incurred by the Distributor beyond the current fiscal year for Class A shares. The Agreement also provides that the Adviser may use its own resources to finance the distribution of the Fund’s shares.
NOTE D
Investment Transactions
Purchases and sales of investment securities (excluding short-term investments) for the year ended November 30, 2024 were as follows:
| | | | | | | | |
| | | Purchases | | | Sales | |
Investment securities (excluding U.S. government securities) | | $ | 228,932,488 | | | $ | 250,204,779 | |
U.S. government securities | | | – 0 | – | | | – 0 | – |
The cost of investments for federal income tax purposes, gross unrealized appreciation and unrealized depreciation are as follows:
| | | | |
Cost | | $ | 343,297,897 | |
| | | | |
Gross unrealized appreciation | | $ | 139,335,634 | |
Gross unrealized depreciation | | | (2,737,860 | ) |
| | | | |
Net unrealized appreciation | | $ | 136,597,774 | |
| | | | |
1. Derivative Financial Instruments
The Fund may use derivatives in an effort to earn income and enhance returns, to replace more traditional direct investments, to obtain exposure to otherwise inaccessible markets (collectively, “investment purposes”), or to hedge or adjust the risk profile of its portfolio.
| | |
| |
| abfunds.com | | AB LARGE CAP VALUE FUND | 15 |
NOTES TO FINANCIAL STATEMENTS (continued)
The Fund did not engage in derivatives transactions for the year ended November 30, 2024.
2. Currency Transactions
The Fund may invest in non-U.S. Dollar-denominated securities on a currency hedged or unhedged basis. The Fund may seek investment opportunities by taking long or short positions in currencies through the use of currency-related derivatives, including forward currency exchange contracts, futures and options on futures, swaps, and other options. The Fund may enter into transactions for investment opportunities when it anticipates that a foreign currency will appreciate or depreciate in value but securities denominated in that currency are not held by the Fund and do not present attractive investment opportunities. Such transactions may also be used when the Adviser believes that it may be more efficient than a direct investment in a foreign currency-denominated security. The Fund may also conduct currency exchange contracts on a spot basis (i.e., for cash at the spot rate prevailing in the currency exchange market for buying or selling currencies).
NOTE E
Securities Lending
The Fund may enter into securities lending transactions. Under the Fund’s securities lending program, all loans of securities will be collateralized continually by cash collateral and/or non-cash collateral. Non-cash collateral will include only securities issued or guaranteed by the U.S. government or its agencies or instrumentalities. If the Fund cannot sell or repledge any non-cash collateral, such collateral will not be reflected in the portfolio of investments. If a loan is collateralized by cash, the Fund will be compensated for the loan from a portion of the net return from the income earned on cash collateral after a rebate is paid to the borrower (in some cases, this rebate may be a “negative rebate” or fee paid by the borrower to the Fund in connection with the loan), and payments are made for fees of the securities lending agent and for certain other administrative expenses. If the Fund receives non-cash collateral, the Fund will receive a fee from the borrower generally equal to a negotiated percentage of the market value of the loaned securities. The Fund will have the right to call a loan and obtain the securities loaned at any time on notice to the borrower within the normal and customary settlement time for the securities. While the securities are on loan, the borrower is obligated to pay the Fund amounts equal to any dividend income or other distributions from the securities; however, these distributions will not be afforded the same preferential tax treatment as qualified dividends. The Fund will not be able to exercise voting rights with respect to any securities during the existence of a loan, but will have the right to regain ownership of loaned securities in order to exercise voting or other ownership rights. Collateral received and securities loaned are
| | |
| |
16 | AB LARGE CAP VALUE FUND | | abfunds.com |
NOTES TO FINANCIAL STATEMENTS (continued)
marked to market daily to ensure that the securities loaned are secured by collateral. The lending agent currently invests the cash collateral received in Government Money Market Portfolio, an eligible money market vehicle, in accordance with the investment restrictions of the Fund, and as approved by the Board. The collateral received on securities loaned is recorded as an asset as well as a corresponding liability in the statement of assets and liabilities. The collateral will be adjusted the next business day to maintain the required collateral amount. The amounts of securities lending income from the borrowers and Government Money Market Portfolio are reflected in the statement of operations. When the Fund earns net securities lending income from Government Money Market Portfolio, the income is inclusive of a rebate expense paid to the borrower. In connection with the cash collateral investment by the Fund in Government Money Market Portfolio, the Adviser has agreed to waive a portion of the Fund’s share of the advisory fees of Government Money Market Portfolio, as borne indirectly by the Fund as an acquired fund fee and expense. When the Fund lends securities, its investment performance will continue to reflect changes in the value of the securities loaned. A principal risk of lending portfolio securities is that the borrower may fail to return the loaned securities upon termination of the loan and that the collateral will not be sufficient to replace the loaned securities. The lending agent has agreed to indemnify the Fund in the case of default of any securities borrower.
A summary of the Fund’s transactions surrounding securities lending for the year ended November 30, 2024 is as follows:
| | | | | | | | | | | | | | | | | | | | | | |
| | | | | | | | | | | | | Government Money
Market Portfolio | |
Market
Value of
Securities on Loan* | | | Cash
Collateral* | | | Market
Value of
Non-Cash
Collateral* | | | Income from
Borrowers | | | Income
Earned | | | Advisory Fee
Waived | |
| $ | 4,896,183 | | | $ | – 0 | – | | $ | 4,878,705 | | | $ | 10,487 | | | $ | 743 | | | $ | 407 | |
| * | As of November 30, 2024. |
| | |
| |
| abfunds.com | | AB LARGE CAP VALUE FUND | 17 |
NOTES TO FINANCIAL STATEMENTS (continued)
NOTE F
Shares of Beneficial Interest
Transactions in shares of beneficial interest for each class were as follows:
| | | | | | | | | | | | | | | | | | | | | | | | |
| | | | | | | | | | | | | | | | | | | | | | | | |
| | | Shares | | | | | | Amount | | | | |
| | | Year Ended
November 30,
2024 | | | Year Ended
November 30,
2023 | | | | | | Year Ended
November 30,
2024 | | | Year Ended
November 30,
2023 | | | | |
| | | | | | | | |
| Class A | | | | | |
Shares sold | | | 68,550 | | | | 158,204 | | | | | | | $ | 1,233,081 | | | $ | 2,467,936 | | | | | |
| | | | | |
Shares issued in reinvestment of dividends and distributions | | | 129,001 | | | | 324,714 | | | | | | | | 2,025,312 | | | | 4,802,517 | | | | | |
| | | | | |
Shares converted from Class C | | | 15,696 | | | | 13,523 | | | | | | | | 272,361 | | | | 210,744 | | | | | |
| | | | | |
Shares redeemed | | | (521,796 | ) | | | (383,705 | ) | | | | | | | (9,419,438 | ) | | | (6,046,430 | ) | | | | |
| | | | | |
Net increase (decrease) | | | (308,549 | ) | | | 112,736 | | | | | | | $ | (5,888,684 | ) | | $ | 1,434,767 | | | | | |
| | | | | |
| | | | | | | | | | | | | | | | | | | | | | | | |
| Class C | | | | | |
Shares sold | | | 9,206 | | | | 10,745 | | | | | | | $ | 159,823 | | | $ | 172,083 | | | | | |
| | | | | |
Shares issued in reinvestment of dividends and distributions | | | 1,270 | | | | 7,834 | | | | | | | | 20,277 | | | | 117,353 | | | | | |
| | | | | |
Shares converted to Class A | | | (15,492 | ) | | | (13,406 | ) | | | | | | | (272,361 | ) | | | (210,744 | ) | | | | |
| | | | | |
Shares redeemed | | | (10,717 | ) | | | (35,919 | ) | | | | | | | (191,643 | ) | | | (540,316 | ) | | | | |
| | | | | |
Net decrease | | | (15,733 | ) | | | (30,746 | ) | | | | | | $ | (283,904 | ) | | $ | (461,624 | ) | | | | |
| | | | | |
| | | | | | | | | | | | | | | | | | | | | | | | |
| Advisor Class | | | | | |
Shares sold | | | 2,789,172 | | | | 2,004,317 | | | | | | | $ | 49,407,079 | | | $ | 31,096,667 | | | | | |
| | | | | |
Shares issued in reinvestment of dividends and distributions | | | 795,830 | | | | 2,033,938 | | | | | | | | 12,502,484 | | | | 30,102,288 | | | | | |
| | | | | |
Shares redeemed | | | (3,377,036 | ) | | | (3,410,909 | ) | | | | | | | (60,892,794 | ) | | | (53,306,634 | ) | | | | |
| | | | | |
Net increase | | | 207,966 | | | | 627,346 | | | | | | | $ | 1,016,769 | | | $ | 7,892,321 | | | | | |
| | | | | |
| | | | | | | | | | | | | | | | | | | | | | | | |
| Class R | | | | | |
Shares sold | | | 934 | | | | 9,996 | | | | | | | $ | 16,055 | | | $ | 153,643 | | | | | |
| | | | | |
Shares issued in reinvestment of dividends and distributions | | | 958 | | | | 2,403 | | | | | | | | 15,001 | | | | 35,421 | | | | | |
| | | | | |
Shares redeemed | | | (23,365 | ) | | | (10,006 | ) | | | | | | | (418,784 | ) | | | (157,151 | ) | | | | |
| | | | | |
Net increase (decrease) | | | (21,473 | ) | | | 2,393 | | | | | | | $ | (387,728 | ) | | $ | 31,913 | | | | | |
| | | | | |
| | |
| |
18 | AB LARGE CAP VALUE FUND | | abfunds.com |
NOTES TO FINANCIAL STATEMENTS (continued)
| | | | | | | | | | | | | | | | | | | | | | | | |
| | | | | | | | | | | | | | | | | | | | | | | | |
| | | Shares | | | | | | Amount | | | | |
| | | Year Ended
November 30,
2024 | | | Year Ended
November 30,
2023 | | | | | | Year Ended
November 30,
2024 | | | Year Ended
November 30,
2023 | | | | |
| | | | | | | | |
| Class K | | | | | |
Shares sold | | | 14,024 | | | | 62,255 | | | | | | | $ | 230,099 | | | $ | 929,154 | | | | | |
| | | | | |
Shares issued in reinvestment of dividends and distributions | | | 17,043 | | | | 51,381 | | | | | | | | 261,444 | | | | 742,971 | | | | | |
| | | | | |
Shares redeemed | | | (386,876 | ) | | | (146,473 | ) | | | | | | | (6,636,108 | ) | | | (2,241,644 | ) | | | | |
| | | | | |
Net decrease | | | (355,809 | ) | | | (32,837 | ) | | | | | | $ | (6,144,565 | ) | | $ | (569,519 | ) | | | | |
| | | | | |
| | | | | | | | | | | | | | | | | | | | | | | | |
| Class I | | | | | |
Shares sold | | | 2,628 | | | | 13,079 | | | | | | | $ | 46,295 | | | $ | 196,302 | | | | | |
| | | | | |
Shares issued in reinvestment of dividends and distributions | | | 2,099 | | | | 3,433 | | | | | | | | 32,551 | | | | 50,194 | | | | | |
| | | | | |
Shares redeemed | | | (19,647 | ) | | | (7,908 | ) | | | | | | | (350,633 | ) | | | (122,534 | ) | | | | |
| | | | | |
Net increase (decrease) | | | (14,920 | ) | | | 8,604 | | | | | | | $ | (271,787 | ) | | $ | 123,962 | | | | | |
| | | | | |
| | | | | | | | | | | | | | | | | | | | | | | | |
| Class Z(a) | | | | | |
Shares sold | | | 526 | | | | – 0 | – | | | | | | $ | 10,040 | | | $ | – 0 | – | | | | |
| | | | | |
Net increase | | | 526 | | | | – 0 | – | | | | | | $ | 10,040 | | | $ | – 0 | – | | | | |
| | | | | |
| (a) | Commencement of operations October 1, 2024. |
NOTE G
Risks Involved in Investing in the Fund
Market Risk—The value of the Fund’s assets will fluctuate as the market or markets in which the Fund invests fluctuate. The value of the Fund’s investments may decline, sometimes rapidly and unpredictably, simply because of economic changes or other events, including public health crises (including the occurrence of a contagious disease or illness) and regional and global conflicts, that affect large portions of the market. It includes the risk that a particular style of investing may be underperforming the market generally.
Foreign (Non-U.S.) Risk—Investments in securities of non-U.S. issuers may involve more risk than those of U.S. issuers. These securities may fluctuate more widely in price and may be more difficult to trade due to adverse market, economic, political, regulatory or other factors.
Currency Risk—Fluctuations in currency exchange rates may negatively affect the value of the Fund’s investments or reduce its returns.
| | |
| |
| abfunds.com | | AB LARGE CAP VALUE FUND | 19 |
NOTES TO FINANCIAL STATEMENTS (continued)
Derivatives Risk—Derivatives may be difficult to price or unwind and leveraged so that small changes may produce disproportionate losses for the Fund. A short position in a derivative instrument involves the risk of a theoretically unlimited increase in the value of the underlying asset, reference rate or index, which could cause the Fund to suffer a potentially unlimited loss. Derivatives, especially over-the-counter derivatives, are also subject to counterparty risk, which is the risk that the counterparty (the party on the other side of the transaction) on a derivative transaction will be unable or unwilling to honor its contractual obligations to the Fund.
Indemnification Risk—In the ordinary course of business, the Fund enters into contracts that contain a variety of indemnifications. The Fund’s maximum exposure under these arrangements is unknown. However, the Fund has not had prior claims or losses pursuant to these indemnification provisions and expects the risk of loss thereunder to be remote. Therefore, the Fund has not accrued any liability in connection with these indemnification provisions.
Management Risk—The Fund is subject to management risk because it is an actively-managed investment fund. The Adviser will apply its investment techniques and risk analyses in making investment decisions, but there is no guarantee that its techniques will produce the intended results. Some of these techniques may incorporate, or rely upon, quantitative models, but there is no guarantee that these models will generate accurate forecasts, reduce risk or otherwise perform as expected.
NOTE H
Joint Credit Facility
A number of open-end mutual funds managed by the Adviser, including the Fund, participate in a $325 million revolving credit facility (the “Facility”) intended to provide short-term financing related to redemptions and other short term liquidity requirements, subject to certain restrictions. Commitment fees related to the Facility are paid by the participating funds and are included in miscellaneous expenses in the statement of operations. The Fund did not utilize the Facility during the year ended November 30, 2024.
NOTE I
Distributions to Shareholders
The tax character of distributions paid during the fiscal years ended November 30, 2024 and November 30, 2023 were as follows:
| | | | | | | | |
| | | 2024 | | | 2023 | |
Distributions paid from: | | | | | | | | |
Ordinary income | | $ | 5,400,938 | | | $ | 5,972,242 | |
Net long-term capital gains | | | 13,697,644 | | | | 39,507,172 | |
| | | | | | | | |
Total taxable distributions paid | | $ | 19,098,582 | | | $ | 45,479,414 | |
| | | | | | | | |
| | |
| |
20 | AB LARGE CAP VALUE FUND | | abfunds.com |
NOTES TO FINANCIAL STATEMENTS (continued)
As of November 30, 2024, the components of accumulated earnings (deficit) on a tax basis were as follows:
| | | | |
Undistributed ordinary income | | $ | 5,917,936 | |
Undistributed capital gains | | | 43,193,559 | |
Unrealized appreciation (depreciation) | | | 136,597,790 | (a) |
| | | | |
Total accumulated earnings (deficit) | | $ | 185,709,285 | |
| | | | |
| (a) | The difference between book-basis and tax-basis unrealized appreciation (depreciation) is attributable primarily to the tax deferral of losses on wash sales. |
For tax purposes, net realized capital losses may be carried over to offset future capital gains, if any. Funds are permitted to carry forward capital losses for an indefinite period, and such losses will retain their character as either short-term or long-term capital losses. As of November 30, 2024, the Fund did not have any capital loss carryforwards.
During the current fiscal year, permanent differences primarily due to the utilization of earnings and profits distributed to shareholders on redemption of shares resulted in a net decrease in distributable earnings and a net increase in additional paid-in capital. These reclassifications had no effect on net assets.
NOTE J
Recent Accounting Pronouncements
In December 2022, the Financial Accounting Standards Board issued an Accounting Standards Update, ASU 2022-06, “Reference Rate Reform (Topic 848) – Deferral of the Sunset Date of Topic 848”. ASU 2022-06 is an amendment to ASU 2020-04, which provided optional guidance to ease the potential accounting burden due to the discontinuation of the LIBOR and other interbank-offered based reference rates and which was effective as of March 12, 2020 through December 31, 2022. ASU 2022-06 extends the effective period through December 31, 2024. Management is currently evaluating the impact, if any, of applying ASU 2022-06.
In November 2023, the Financial Accounting Standards Board issued Accounting Standards Update, ASU 2023-07, “Segment Reporting (Topic 280)”. ASU 2023-07 requires public entities to provide disclosure of significant segment expenses that are regularly provided to the chief operating decision maker (“CODM”). ASU 2023-07, among other things, (i) requires a single segment public entity to provide all necessary disclosures required by Topic 280 it, (ii) requires a public entity to disclose the title and position of the CODM and an explanation of how the CODM uses the reported measure(s) of segment profit and loss in assessing segment performance and deciding how to allocate resources and (iii) provides the ability for a public entity to elect more than one performance measure. ASU 2023-07 is effective for fiscal years beginning after December 15,
| | |
| |
| abfunds.com | | AB LARGE CAP VALUE FUND | 21 |
NOTES TO FINANCIAL STATEMENTS (continued)
2023, and interim periods within fiscal years beginning after December 15, 2024. Early adoption of ASU 2023-07 is permitted. Management is currently evaluating the impact, if any, of applying ASU 2023-07.
NOTE K
Subsequent Events
Management has evaluated subsequent events for possible recognition or disclosure in the financial statements through the date the financial statements are issued. Management has determined that there are no material events that would require disclosure in the Fund’s financial statements through this date.
| | |
| |
22 | AB LARGE CAP VALUE FUND | | abfunds.com |
FINANCIAL HIGHLIGHTS
Selected Data For A Share Of Beneficial Interest Outstanding Throughout Each Period
| | | | | | | | | | | | | | | | | | | | |
| | | Class A | |
| | | Year Ended November 30, | |
| | | 2024 | | | 2023 | | | 2022 | | | 2021 | | | 2020 | |
| | | | |
| | | | | | | | | | | | | | | | | | | | |
Net asset value, beginning of period | | | $ 16.43 | | | | $ 17.31 | | | | $ 18.45 | | | | $ 14.86 | | | | $ 15.30 | |
| | | | |
Income From Investment Operations | | | | | | | | | | | | | | | | | | | | |
| | | | | |
Net investment income(a)(b) | | | .21 | | | | .20 | | | | .19 | | | | .16 | | | | .19 | |
| | | | | |
Net realized and unrealized gain (loss) on investment transactions | | | 4.71 | | | | .86 | | | | .44 | | | | 3.61 | | | | (.30 | ) |
| | | | | |
Contributions from Affiliates | | | – 0 | – | | | – 0 | – | | | .00 | (c) | | | – 0 | – | | | – 0 | – |
| | | | |
Net increase (decrease) in net asset value from operations | | | 4.92 | | | | 1.06 | | | | .63 | | | | 3.77 | | | | (.11 | ) |
| | | | |
Less: Dividends and Distributions | | | | | | | | | | | | | | | | | | | | |
| | | | | |
Dividends from net investment income | | | (.19 | ) | | | (.23 | ) | | | (.18 | ) | | | (.18 | ) | | | (.22 | ) |
| | | | | |
Distributions from net realized gain on investment transactions | | | (.58 | ) | | | (1.71 | ) | | | (1.59 | ) | | | – 0 | – | | | (.11 | ) |
| | | | |
Total dividends and distributions | | | (.77 | ) | | | (1.94 | ) | | | (1.77 | ) | | | (.18 | ) | | | (.33 | ) |
| | | | |
Net asset value, end of period | | | $ 20.58 | | | | $ 16.43 | | | | $ 17.31 | | | | $ 18.45 | | | | $ 14.86 | |
| | | | |
| | | | | |
Total Return | | | | | | | | | | | | | | | | | | | | |
| | | | | |
Total investment return based on net asset value(d) | | | 31.41 | % | | | 7.35 | % | | | 3.39 | % | | | 25.68 | % | | | (.76 | )% |
| | | | | |
Ratios/Supplemental Data | | | | | | | | | | | | | | | | | | | | |
| | | | | |
Net assets, end of period (000’s omitted) | | | $53,836 | | | | $48,039 | | | | $48,671 | | | | $50,255 | | | | $43,203 | |
| | | | | |
Ratio to average net assets of: | | | | | | | | | | | | | | | | | | | | |
| | | | | |
Expenses, net of waivers/reimbursements | | | .93 | % | | | .96 | % | | | .95 | % | | | .95 | % | | | .99 | % |
| | | | | |
Expenses, before waivers/reimbursements | | | .95 | % | | | .97 | % | | | .95 | % | | | .95 | % | | | .99 | % |
| | | | | |
Net investment income(b) | | | 1.16 | % | | | 1.31 | % | | | 1.12 | % | | | .90 | % | | | 1.44 | % |
| | | | | |
Portfolio turnover rate | | | 53 | % | | | 45 | % | | | 46 | % | | | 42 | % | | | 61 | % |
See footnote summary on page 27.
| | |
| |
| abfunds.com | | AB LARGE CAP VALUE FUND | 23 |
FINANCIAL HIGHLIGHTS (continued)
Selected Data For A Share Of Beneficial Interest Outstanding Throughout Each Period
| | | | | | | | | | | | | | | | | | | | |
| | | Class C | |
| | | Year Ended November 30, | |
| | | 2024 | | | 2023 | | | 2022 | | | 2021 | | | 2020 | |
| | | | |
| | | | | | | | | | | | | | | | | | | | |
Net asset value, beginning of period | | | $ 16.52 | | | | $ 17.37 | | | | $ 18.50 | | | | $ 14.85 | | | | $ 15.28 | |
| | | | |
Income From Investment Operations | | | | | | | | | | | | | | | | | | | | |
| | | | | |
Net investment income(a)(b) | | | .07 | | | | .09 | | | | .06 | | | | .03 | | | | .09 | |
| | | | | |
Net realized and unrealized gain (loss) on investment transactions | | | 4.78 | | | | .86 | | | | .44 | | | | 3.63 | | | | (.32 | ) |
| | | | | |
Contributions from Affiliates | | | – 0 | – | | | – 0 | – | | | .00 | (c) | | | – 0 | – | | | – 0 | – |
| | | | |
Net increase (decrease) in net asset value from operations | | | 4.85 | | | | .95 | | | | .50 | | | | 3.66 | | | | (.23 | ) |
| | | | |
Less: Dividends and Distributions | | | | | | | | | | | | | | | | | | | | |
| | | | | |
Dividends from net investment income | | | (.03 | ) | | | (.09 | ) | | | (.04 | ) | | | (.01 | ) | | | (.09 | ) |
| | | | | |
Distributions from net realized gain on investment transactions | | | (.58 | ) | | | (1.71 | ) | | | (1.59 | ) | | | – 0 | – | | | (.11 | ) |
| | | | |
Total dividends and distributions | | | (.61 | ) | | | (1.80 | ) | | | (1.63 | ) | | | (.01 | ) | | | (.20 | ) |
| | | | |
Net asset value, end of period | | | $ 20.76 | | | | $ 16.52 | | | | $ 17.37 | | | | $ 18.50 | | | | $ 14.85 | |
| | | | |
| | | | | |
Total Return | | | | | | | | | | | | | | | | | | | | |
| | | | | |
Total investment return based on net asset value(d) | | | 30.44 | % | | | 6.54 | % | | | 2.62 | % | | | 24.75 | % | | | (1.54 | )% |
| | | | | |
Ratios/Supplemental Data | | | | | | | | | | | | | | | | | | | | |
| | | | | |
Net assets, end of period (000’s omitted) | | | $797 | | | | $894 | | | | $1,474 | | | | $1,419 | | | | $1,046 | |
| | | | | |
Ratio to average net assets of: | | | | | | | | | | | | | | | | | | | | |
| | | | | |
Expenses, net of waivers/reimbursements | | | 1.69 | % | | | 1.72 | % | | | 1.71 | % | | | 1.71 | % | | | 1.75 | % |
| | | | | |
Expenses, before waivers/reimbursements | | | 1.71 | % | | | 1.72 | % | | | 1.71 | % | | | 1.71 | % | | | 1.75 | % |
| | | | | |
Net investment income(b) | | | .41 | % | | | .60 | % | | | .38 | % | | | .15 | % | | | .69 | % |
| | | | | |
Portfolio turnover rate | | | 53 | % | | | 45 | % | | | 46 | % | | | 42 | % | | | 61 | % |
See footnote summary on page 27.
| | |
| |
24 | AB LARGE CAP VALUE FUND | | abfunds.com |
FINANCIAL HIGHLIGHTS (continued)
Selected Data For A Share Of Beneficial Interest Outstanding Throughout Each Period
| | | | | | | | | | | | | | | | | | | | |
| | | Advisor Class | |
| | | Year Ended November 30, | |
| | | 2024 | | | 2023 | | | 2022 | | | 2021 | | | 2020 | |
| | | | |
| | | | | | | | | | | | | | | | | | | | |
Net asset value, beginning of period | | | $ 16.47 | | | | $ 17.36 | | | | $ 18.50 | | | | $ 14.90 | | | | $ 15.33 | |
| | | | |
Income From Investment Operations | | | | | | | | | | | | | | | | | | | | |
| | | | | |
Net investment income(a)(b) | | | .25 | | | | .24 | | | | .23 | | | | .21 | | | | .23 | |
| | | | | |
Net realized and unrealized gain (loss) on investment transactions | | | 4.73 | | | | .85 | | | | .44 | | | | 3.60 | | | | (.30 | ) |
| | | | | |
Contributions from Affiliates | | | – 0 | – | | | – 0 | – | | | .00 | (c) | | | .00 | | | | – 0 | – |
| | | | |
Net increase (decrease) in net asset value from operations | | | 4.98 | | | | 1.09 | | | | .67 | | | | 3.81 | | | | (.07 | ) |
| | | | |
Less: Dividends and Distributions | | | | | | | | | | | | | | | | | | | | |
| | | | | |
Dividends from net investment income | | | (.23 | ) | | | (.27 | ) | | | (.22 | ) | | | (.21 | ) | | | (.25 | ) |
| | | | | |
Distributions from net realized gain on investment transactions | | | (.58 | ) | | | (1.71 | ) | | | (1.59 | ) | | | – 0 | – | | | (.11 | ) |
| | | | |
Total dividends and distributions | | | (.81 | ) | | | (1.98 | ) | | | (1.81 | ) | | | (.21 | ) | | | (.36 | ) |
| | | | |
Net asset value, end of period | | | $ 20.64 | | | | $ 16.47 | | | | $ 17.36 | | | | $ 18.50 | | | | $ 14.90 | |
| | | | |
| | | | | |
Total Return | | | | | | | | | | | | | | | | | | | | |
| | | | | |
Total investment return based on net asset value(d) | | | 31.80 | % | | | 7.57 | % | | | 3.66 | % | | | 25.97 | % | | | (.47 | )% |
| | | | | |
Ratios/Supplemental Data | | | | | | | | | | | | | | | | | | | | |
| | | | | |
Net assets, end of period (000’s omitted) | | | $423,767 | | | | $334,806 | | | | $341,919 | | | | $364,323 | | | | $314,298 | |
| | | | | |
Ratio to average net assets of: | | | | | | | | | | | | | | | | | | | | |
| | | | | |
Expenses, net of waivers/reimbursements | | | .68 | % | | | .71 | % | | | .70 | % | | | .70 | % | | | .74 | % |
| | | | | |
Expenses, before waivers/reimbursements | | | .70 | % | | | .71 | % | | | .70 | % | | | .70 | % | | | .74 | % |
| | | | | |
Net investment income(b) | | | 1.40 | % | | | 1.56 | % | | | 1.37 | % | | | 1.15 | % | | | 1.68 | % |
| | | | | |
Portfolio turnover rate | | | 53 | % | | | 45 | % | | | 46 | % | | | 42 | % | | | 61 | % |
See footnote summary on page 27.
| | |
| |
| abfunds.com | | AB LARGE CAP VALUE FUND | 25 |
FINANCIAL HIGHLIGHTS (continued)
Selected Data For A Share Of Beneficial Interest Outstanding Throughout Each Period
| | | | | | | | | | | | | | | | | | | | |
| | | Class I | |
| | | Year Ended November 30, | |
| | | 2024 | | | 2023 | | | 2022 | | | 2021 | | | 2020 | |
| | | | |
| | | | | | | | | | | | | | | | | | | | |
Net asset value, beginning of period | | | $ 16.28 | | | | $ 17.19 | | | | $ 18.34 | | | | $ 14.77 | | | | $ 15.20 | |
| | | | |
Income From Investment Operations | | | | | | | | | | | | | | | | | | | | |
| | | | | |
Net investment income(a)(b) | | | .24 | | | | .24 | | | | .23 | | | | .21 | | | | .23 | |
| | | | | |
Net realized and unrealized gain (loss) on investment transactions | | | 4.68 | | | | .83 | | | | .44 | | | | 3.58 | | | | (.29 | ) |
| | | | | |
Contributions from Affiliates | | | – 0 | – | | | – 0 | – | | | .00 | (c) | | | – 0 | – | | | – 0 | – |
| | | | |
Net increase (decrease) in net asset value from operations | | | 4.92 | | | | 1.07 | | | | .67 | | | | 3.79 | | | | (.06 | ) |
| | | | |
Less: Dividends and Distributions | | | | | | | | | | | | | | | | | | | | |
| | | | | |
Dividends from net investment income | | | (.24 | ) | | | (.27 | ) | | | (.23 | ) | | | (.22 | ) | | | (.26 | ) |
| | | | | |
Distributions from net realized gain on investment transactions | | | (.58 | ) | | | (1.71 | ) | | | (1.59 | ) | | | – 0 | – | | | (.11 | ) |
| | | | |
Total dividends and distributions | | | (.82 | ) | | | (1.98 | ) | | | (1.82 | ) | | | (.22 | ) | | | (.37 | ) |
| | | | |
Net asset value, end of period | | | $ 20.38 | | | | $ 16.28 | | | | $ 17.19 | | | | $ 18.34 | | | | $ 14.77 | |
| | | | |
| | | | | |
Total Return | | | | | | | | | | | | | | | | | | | | |
| | | | | |
Total investment return based on net asset value(d) | | | 31.77 | % | | | 7.63 | % | | | 3.66 | % | | | 25.97 | % | | | (.44 | )% |
| | | | | |
Ratios/Supplemental Data | | | | | | | | | | | | | | | | | | | | |
| | | | | |
Net assets, end of period (000’s omitted) | | | $1,814 | | | | $1,693 | | | | $1,638 | | | | $1,785 | | | | $1,527 | |
| | | | | |
Ratio to average net assets of: | | | | | | | | | | | | | | | | | | | | |
| | | | | |
Expenses, net of waivers/reimbursements | | | .70 | % | | | .70 | % | | | .68 | % | | | .68 | % | | | .71 | % |
| | | | | |
Expenses, before waivers/reimbursements | | | .78 | % | | | .70 | % | | | .68 | % | | | .68 | % | | | .71 | % |
| | | | | |
Net investment income(b) | | | 1.39 | % | | | 1.56 | % | | | 1.40 | % | | | 1.17 | % | | | 1.72 | % |
| | | | | |
Portfolio turnover rate | | | 53 | % | | | 45 | % | | | 46 | % | | | 42 | % | | | 61 | % |
See footnote summary on page 27.
| | |
| |
26 | AB LARGE CAP VALUE FUND | | abfunds.com |
FINANCIAL HIGHLIGHTS (continued)
Selected Data For A Share Of Beneficial Interest Outstanding Throughout Each Period
| | | | |
| | | Class Z | |
| | | October 1,
2024(e) to November 30,
2024 | |
| | | | |
Net asset value, beginning of period | | | $ 19.08 | |
| | | | |
Income From Investment Operations | | | | |
| |
Net investment income(a)(b) | | | .05 | |
| |
Net realized and unrealized gain on investment transactions | | | 1.48 | |
| | | | |
Net increase in net asset value from operations | | | 1.53 | |
| | | | |
Less: Dividends and Distributions | | | | |
| |
Net asset value, end of period | | | $ 20.61 | |
| | | | |
| |
Total Return | | | | |
| |
Total investment return based on net asset value(d) | | | 8.02 | % |
| |
Ratios/Supplemental Data | | | | |
| |
Net assets, end of period (000’s omitted) | | | $11 | |
| |
Ratio to average net assets of: | | | | |
| |
Expenses, net of waivers/reimbursements | | | .12 | %^ |
| |
Expenses, before waivers/reimbursements | | | .71 | %^ |
| |
Net investment income(b) | | | 1.48 | %^ |
| |
Portfolio turnover rate | | | 53 | % |
| (a) | Based on average shares outstanding. |
| (b) | Net of expenses waived/reimbursed by the Adviser. |
| (c) | Amount is less than $.005. |
| (d) | Total investment return is calculated assuming an initial investment made at the net asset value at the beginning of the period, reinvestment of all dividends and distributions at net asset value during the period, and redemption on the last day of the period. Initial sales charges or contingent deferred sales charges are not reflected in the calculation of total investment return. Total investment return does not reflect the deduction of taxes that a shareholder would pay on fund distributions or the redemption of fund shares. Total investment return calculated for a period of less than one year is not annualized. |
| (e) | Commencement of operations. |
See notes to financial statements.
| | |
| |
| abfunds.com | | AB LARGE CAP VALUE FUND | 27 |
REPORT OF INDEPENDENT REGISTERED
PUBLIC ACCOUNTING FIRM
To the Shareholders and the Board of Trustees of
AB Large Cap Value Fund
Opinion on the Financial Statements
We have audited the accompanying statement of assets and liabilities of AB Large Cap Value Fund (the “Fund”) (formerly known as AB Value Fund) (one of the funds constituting AB Trust (the “Trust”)), including the portfolio of investments, as of November 30, 2024, and the related statement of operations for the year then ended, the statements of changes in net assets for each of the two years in the period then ended, the financial highlights for each of the five years in the period then ended and the related notes (collectively referred to as the “financial statements”). In our opinion, the financial statements present fairly, in all material respects, the financial position of the Fund (one of the funds constituting AB Trust) at November 30, 2024, the results of its operations for the year then ended, the changes in its net assets for each of the two years in the period then ended and its financial highlights for each of the five years in the period then ended, in conformity with U.S. generally accepted accounting principles.
Basis for Opinion
These financial statements are the responsibility of the Trust’s management. Our responsibility is to express an opinion on the Fund’s financial statements based on our audits. We are a public accounting firm registered with the Public Company Accounting Oversight Board (United States) (“PCAOB”) and are required to be independent with respect to the Trust in accordance with the U.S. federal securities laws and the applicable rules and regulations of the Securities and Exchange Commission and the PCAOB.
We conducted our audits in accordance with the standards of the PCAOB. Those standards require that we plan and perform the audit to obtain reasonable assurance about whether the financial statements are free of material misstatement, whether due to error or fraud. The Trust is not required to have, nor were we engaged to perform, an audit of the Trust’s internal control over financial reporting. As part of our audits, we are required to obtain an understanding of internal control over financial reporting but not for the purpose of expressing an opinion on the effectiveness of the Trust’s internal control over financial reporting. Accordingly, we express no such opinion.
Our audits included performing procedures to assess the risks of material misstatement of the financial statements, whether due to error or fraud, and performing procedures that respond to those risks. Such procedures included examining, on a test basis, evidence regarding the amounts and
| | |
| |
28 | AB LARGE CAP VALUE FUND | | abfunds.com |
REPORT OF INDEPENDENT REGISTERED
PUBLIC ACCOUNTING FIRM (continued)
disclosures in the financial statements. Our procedures included confirmation of securities owned as of November 30, 2024, by correspondence with the custodian, brokers and others; when replies were not received from brokers or others, we performed other auditing procedures. Our audits also included evaluating the accounting principles used and significant estimates made by management, as well as evaluating the overall presentation of the financial statements. We believe that our audits provide a reasonable basis for our opinion.

We have served as the auditor of one or more of the AB investment companies since 1968.
New York, New York
January 24, 2025
| | |
| |
| abfunds.com | | AB LARGE CAP VALUE FUND | 29 |
2024 FEDERAL TAX INFORMATION
(unaudited)
For Federal income tax purposes, the following information is furnished with respect to the distributions paid by the Fund during the taxable year ended November 30, 2024. For corporate shareholders, 99.68% of dividends paid qualify for the dividends received deduction. For individual shareholders, the Fund designates 100% of dividends paid as qualified dividend income. The Fund designates $13,697,644 of dividends paid as long-term capital gain dividends.
Shareholders should not use the above information to prepare their income tax returns. The information necessary to complete your income tax returns will be included with your Form 1099-DIV which will be sent to you separately in January 2025.
| | |
| |
30 | AB LARGE CAP VALUE FUND | | abfunds.com |
Information Regarding the Review and Approval of Amendment to the Fund’s Advisory Agreement
At a meeting of the Board of Directors of AB Trust (the “Company”) held in-person on July 30-31, 2024, the Adviser recommended an amendment to the Company’s then-current Advisory Agreement with the Adviser (the “Amended Advisory Agreement”) to effect a reduction in the advisory fee paid by AB Value Fund (the “Fund”). The amendment would reduce the advisory fee on the first $2.5 billion in assets from 0.55% to 0.50%, effective August 1, 2024. The Adviser also recommended, effective August 1, 2024 (i) implementation of a contractual waiver of a portion of the advisory fee paid by the Fund; (ii) implementation of expense caps on Fund operating expenses; and (iii) effective on or about October 1, 2024 a change of the Fund’s name to “AB Large Cap Value Fund” and changes to the Fund’s investment policy.
After their review of updated comparative fee and expense information, and discussion with experienced counsel who are independent of the Adviser, who advised on the relevant legal standards, the disinterested directors (the “directors”) unanimously approved the Amended Agreement. The directors also approved the Adviser’s other proposals for the Fund.
The directors last approved the continuance of the Fund’s then-current Advisory Agreement at a meeting held by video conference on May 7-9, 2024 (the “May 2024 Meeting” or the “Meeting”) and a discussion regarding the basis for the Board’s approval is set forth below. In determining to approve the Amended Agreement the directors took into account their review at the May 2024 Meeting and noted that the proposed lowering of the advisory fee would benefit the Fund and its shareholders. The directors noted that the Adviser was reducing fees for business reasons, and had assured them that there would be no diminution in the nature or quality of services to the Fund.
Board’s Approval at the May 2024 Meeting
The disinterested directors unanimously approved the continuance of the Fund’s then-current Advisory Agreement at the May 2024 Meeting.
Prior to approval of the continuance of the then-current Advisory Agreement, the directors had requested from the Adviser, and received and evaluated, extensive materials. They reviewed the proposed continuance of the then-current Advisory Agreement with the Adviser and with experienced counsel who are independent of the Adviser, who advised on the relevant legal standards. The directors also reviewed additional materials, including comparative analytical data prepared by the Senior Vice President of the Fund. The directors also discussed the proposed continuance in private sessions with counsel.
The directors considered their knowledge of the nature and quality of the services provided by the Adviser to the Fund gained from their experience
| | |
| |
| abfunds.com | | AB LARGE CAP VALUE FUND | 31 |
as directors or trustees of most of the registered investment companies advised by the Adviser, their overall confidence in the Adviser’s integrity and competence they have gained from that experience, the Adviser’s initiative in identifying and raising potential issues with the directors and its responsiveness, frankness and attention to concerns raised by the directors in the past, including the Adviser’s willingness to consider and implement organizational and operational changes designed to improve investment results and the services provided to the AB Funds. The directors noted that they have four regular meetings each year, at each of which they review extensive materials and information from the Adviser, including information on the investment performance of the Fund and the money market fund advised by the Adviser in which the Fund invests a portion of its assets.
The directors also considered all factors they believed relevant, including the specific matters discussed below. During the course of their deliberations, the directors evaluated, among other things, the reasonableness of the then-current advisory fee. The directors did not identify any particular information that was all-important or controlling, and different directors may have attributed different weights to the various factors. The directors determined that the selection of the Adviser to manage the Fund and the overall arrangements between the Fund and the Adviser, as provided in the then-current Advisory Agreement, including the then-current advisory fee, were fair and reasonable in light of the services performed, expenses incurred and such other matters as the directors considered relevant in the exercise of their business judgment. The material factors and conclusions that formed the basis for the directors’ determinations included the following:
Nature, Extent and Quality of Services Provided
The directors considered the scope and quality of services provided by the Adviser under the then-current Advisory Agreement, including the quality of the investment research capabilities of the Adviser and the other resources it has dedicated to performing services for the Fund. The directors noted that the Adviser from time to time reviews the Fund’s investment strategies and from time to time proposes changes intended to improve the Fund’s relative or absolute performance for the directors’ consideration. They also noted the professional experience and qualifications of the Fund’s portfolio management team and other senior personnel of the Adviser. The directors also considered that the then-current Advisory Agreement provides that the Fund will reimburse the Adviser for the cost to it of providing certain clerical, accounting, administrative and other services to the Fund by employees of the Adviser or its affiliates. Requests for these reimbursements are made on a quarterly basis and subject to approval by the directors. Reimbursements, to the extent requested and paid, result in a higher rate of total compensation from the Fund to the Adviser than the fee rate stated in the then-current Advisory Agreement. The directors noted that the methodology used to determine
| | |
| |
32 | AB LARGE CAP VALUE FUND | | abfunds.com |
the reimbursement amounts had been reviewed by an independent consultant at the request of the directors. The quality of administrative and other services, including the Adviser’s role in coordinating the activities of the Fund’s other service providers, also was considered. The directors concluded that, overall, they were satisfied with the nature, extent and quality of services provided to the Fund under the then-current Advisory Agreement.
Costs of Services Provided and Profitability
The directors reviewed a schedule of the revenues and expenses and related notes indicating the profitability of the Fund to the Adviser for calendar years 2022 and 2023 that had been prepared with an expense allocation methodology arrived at in consultation with an independent consultant at the request of the directors. The directors noted the assumptions and methods of allocation used by the Adviser in preparing fund-specific profitability data and understood that there are a number of potentially acceptable allocation methodologies for information of this type. The directors noted that the profitability information reflected all revenues and expenses of the Adviser’s relationship with the Fund, including those relating to its subsidiaries that provide transfer agency, distribution and brokerage services to the Fund. The directors recognized that it is difficult to make comparisons of the profitability of the then-current Advisory Agreement with the profitability of fund advisory contracts for unaffiliated funds because comparative information is not generally publicly available and is affected by numerous factors. The directors focused on the profitability of the Adviser’s relationship with the Fund before taxes and distribution expenses. The directors concluded that the Adviser’s level of profitability from its relationship with the Fund was not unreasonable.
Fall-Out Benefits
The directors considered the other benefits to the Adviser and its affiliates from their relationships with the Fund and the money market fund advised by the Adviser in which the Fund invests, including, but not limited to, benefits relating to soft dollar arrangements (whereby investment advisers receive brokerage and research services from brokers that execute agency transactions for their clients); 12b-1 fees and sales charges received by the Fund’s principal underwriter (which is a wholly owned subsidiary of the Adviser) in respect of certain classes of the Fund’s shares; brokerage commissions paid by the Fund to brokers affiliated with the Adviser; and transfer agency fees paid by the Fund to a wholly owned subsidiary of the Adviser. The directors recognized that the Adviser’s profitability would be somewhat lower without these benefits. The directors understood that the Adviser also might derive reputational and other benefits from its association with the Fund.
| | |
| |
| abfunds.com | | AB LARGE CAP VALUE FUND | 33 |
Investment Results
In addition to the information reviewed by the directors in connection with the Meeting, the directors receive detailed performance information for the Fund at each regular Board meeting during the year.
At the Meeting, the directors reviewed performance information prepared by an independent service provider (the “15(c) service provider”), showing the performance of the Advisor Class shares of the Fund against a group of similar funds (“peer group”) and a larger group of similar funds (“peer universe”), each selected by the 15(c) service provider, and information prepared by the Adviser showing performance of the Advisor Class shares against a broad-based securities market index, in each case for the 1-, 3-, 5- and 10-year periods ended February 29, 2024 and (in the case of comparisons with the broad-based securities market index) for the period from inception. Based on their review, the directors concluded that the Fund’s investment performance was acceptable.
Advisory Fees and Other Expenses
The directors considered the then-current advisory fee rate payable by the Fund to the Adviser and information prepared by the 15(c) service provider concerning advisory fee rates payable by other funds in the same category as the Fund. The directors recognized that it is difficult to make comparisons of advisory fees because there are variations in the services that are included in the fees paid by other funds. The directors compared the Fund’s then-current contractual effective advisory fee rate with a peer group median and noted that it was lower than the median. They also noted that the Adviser’s then-current total rate of compensation, taking into account the impact of the administrative expense reimbursement paid to the Adviser in the latest fiscal year, was lower than the median.
The directors also considered the Adviser’s then-current fee schedule for other clients utilizing investment strategies similar to those of the Fund. For this purpose, they reviewed the relevant advisory fee information from the Adviser’s Form ADV and in a report from the Fund’s Senior Vice President and noted the differences between the Fund’s then-current fee schedule, on the one hand, and the Adviser’s institutional fee schedule and the schedule of fees charged by the Adviser to any offshore funds and for services to any sub-advised funds utilizing investment strategies similar to those of the Fund, on the other. The directors noted that the Adviser may, in some cases, agree to fee rates with large institutional clients that are lower than those reviewed by the directors and that they had previously discussed with the Adviser its policies in respect of such arrangements.
The Adviser reviewed with the directors the significantly greater scope of the services it provides to the Fund relative to institutional, offshore fund and sub-advised fund clients. In this regard, the Adviser noted, among other things, that, compared to institutional and offshore or sub-advisory
| | |
| |
34 | AB LARGE CAP VALUE FUND | | abfunds.com |
accounts, the Fund (i) demands considerably more portfolio management, research and trading resources due to significantly higher daily cash flows; (ii) has more tax and regulatory restrictions and compliance obligations; (iii) must prepare and file or distribute regulatory and other communications about fund operations; and (iv) must provide shareholder servicing to retail investors. The Adviser also reviewed the greater legal risks presented by the large and changing population of Fund shareholders who may assert claims against the Adviser in individual or class actions, and the greater entrepreneurial risk in offering new fund products, which require substantial investment to launch, may not succeed, and generally must be priced to compete with larger, more established funds resulting in lack of profitability to the Adviser until a new fund achieves scale. In light of the substantial differences in services rendered by the Adviser to institutional, offshore fund and sub-advised fund clients as compared to the Fund, and the different risk profile, the directors considered these fee comparisons inapt and did not place significant weight on them in their deliberations.
In connection with their review of the Fund’s then-current advisory fee, the directors also considered the total expense ratio of the Advisor Class shares of the Fund in comparison to the medians of a peer group and a peer universe selected by the 15(c) service provider. The Advisor Class expense ratio of the Fund was based on the Fund’s latest fiscal year. The directors noted that it was likely that the expense ratios of some of the other funds in the Fund’s category were lowered by waivers or reimbursements by those funds’ investment advisers, which in some cases might be voluntary or temporary. The directors view expense ratio information as relevant to their evaluation of the Adviser’s services because the Adviser is responsible for coordinating services provided to the Fund by others. The directors noted that the Fund’s then-current expense ratio was lower than the medians. Based on their review, the directors concluded that the Fund’s then-current expense ratio was acceptable.
Economies of Scale
The directors noted that the then-current advisory fee schedule for the Fund contains breakpoints that reduce the fee rates on assets above specified levels. The directors took into consideration prior presentations by an independent consultant on economies of scale in the mutual fund industry and for the AB Funds, and presentations from time to time by the Adviser concerning certain of its views on economies of scale. The directors also had requested and received from the Adviser certain updates on economies of scale in advance of the Meeting. The directors believe that economies of scale may be realized (if at all) by the Adviser across a variety of products and services, and not only in respect of a single fund. The directors noted that there is no established methodology for setting breakpoints that give effect to the fund-specific services provided by a fund’s adviser and to the economies of scale that an adviser may realize in its overall mutual fund business or those components of it which directly or
| | |
| |
| abfunds.com | | AB LARGE CAP VALUE FUND | 35 |
indirectly affect a fund’s operations. The directors observed that in the mutual fund industry as a whole, as well as among funds similar to the Fund, there is no uniformity or pattern in the fees and asset levels at which breakpoints (if any) apply. The directors also noted that the advisory agreements for many funds do not have breakpoints at all. Having taken these factors into account, the directors concluded that the Fund’s shareholders would benefit from a sharing of economies of scale in the event the Fund’s net assets exceed a breakpoint in the future.
| | |
| |
36 | AB LARGE CAP VALUE FUND | | abfunds.com |
AB LARGE CAP VALUE FUND
66 Hudson Boulevard East
New York, NY 10001
800 221 5672
LCV-Z-0151-1124 
ITEM 8. CHANGES IN AND DISAGREEMENTS WITH ACCOUNTANTS FOR OPEN-END MANAGEMENT INVESTMENT COMPANIES.
There were no disagreements with accountants during the reporting period.
ITEM 9. PROXY DISCLOSURES FOR OPEN-END MANAGEMENT INVESTMENT COMPANIES
ABT - DV
At a Special Meeting held on July 18, 2024, shareholders of AB Discovery Value Fund (the “Trust”), a series of AB Trust, elected Trustees in connection with the establishment of a single, unitary board (“Unitary Board”) responsible for overseeing mutual funds, exchange-traded funds and certain closed-end investment companies sponsored and advised by the Adviser. In connection with the establishment of the Unitary Board, Ms. Jacklin and Messrs. Downey and Turner will retire as Trustees effective December 31, 2024, and Mr. Erzan will resign as a Trustee effective December 31, 2024, but will continue to serve as President and Chief Executive Officer of the AB Funds. Shareholders of the Trust elected four individuals to serve as Trustees effective January 1, 2025 (the “Trustees-Elect”), who will serve on the Unitary Board with current Trustees Mses. Loeb and McMullen and Messrs. Bermudez and Moody. The number of votes cast for and withheld, as well as the number of abstentions and broker non-votes with respect to the election of each nominee for office is included below.
| | | | | | | | | | | | | | |
Trustee: | | Voted For | | | Withheld
Authority | | | Abstained | | | Broker
Non-Votes |
Jorge A. Bermudez | | | 57,073,037.622 | | | | 1,155,301.839 | | | | N/A | | | N/A |
Alexander Chaloff | | | 57,119,158.863 | | | | 1,109,180.598 | | | | 21,685.940 | | | N/A |
R. Jay Gerken | | | 57,086,039.485 | | | | 1,142,299.976 | | | | N/A | | | N/A |
Jeffrey R. Holland | | | 57,126,106.730 | | | | 1,102,232.731 | | | | N/A | | | N/A |
Jeanette W. Loeb | | | 55,952,398.297 | | | | 2,275,941.164 | | | | N/A | | | N/A |
Carol C. McMullen | | | 57,088,828.224 | | | | 1,139,511.237 | | | | 21,685.940 | | | N/A |
Garry L. Moody | | | 56,999,108.300 | | | | 1,229,231.161 | | | | 21,685.940 | | | N/A |
Emilie D. Wrapp | | | 57,146,271.902 | | | | 1,082,067.559 | | | | N/A | | | N/A |
ABT - IV
At a Special Meeting held on July 18, 2024, shareholders of AB International Value Fund (the “Trust”), a series of AB Trust, elected Trustees in connection with the establishment of a single, unitary board (“Unitary Board”) responsible for overseeing mutual funds, exchange-traded funds and certain closed-end investment companies sponsored and advised by the Adviser. In connection with the establishment of the Unitary Board, Ms. Jacklin and Messrs. Downey and Turner will retire as Trustees effective December 31, 2024, and Mr. Erzan will resign as a Trustee effective December 31, 2024, but will continue to serve as President and Chief Executive Officer of the AB Funds. Shareholders of the Trust elected four individuals to serve as Trustees effective January 1, 2025 (the “Trustees-Elect”), who will serve on the Unitary Board with current Trustees Mses. Loeb and McMullen and Messrs. Bermudez and Moody. The number of votes cast for and withheld, as well as the number of abstentions and broker non-votes with respect to the election of each nominee for office is included below.
| | | | | | | | | | | | | | |
Trustee: | | Voted For | | | Withheld
Authority | | | Abstained | | | Broker
Non-Votes |
Jorge A. Bermudez | | | 57,073,037.622 | | | | 1,155,301.839 | | | | N/A | | | N/A |
Alexander Chaloff | | | 57,119,158.863 | | | | 1,109,180.598 | | | | 21,685.940 | | | N/A |
R. Jay Gerken | | | 57,086,039.485 | | | | 1,142,299.976 | | | | N/A | | | N/A |
Jeffrey R. Holland | | | 57,126,106.730 | | | | 1,102,232.731 | | | | N/A | | | N/A |
Jeanette W. Loeb | | | 55,952,398.297 | | | | 2,275,941.164 | | | | N/A | | | N/A |
Carol C. McMullen | | | 57,088,828.224 | | | | 1,139,511.237 | | | | 21,685.940 | | | N/A |
Garry L. Moody | | | 56,999,108.300 | | | | 1,229,231.161 | | | | 21,685.940 | | | N/A |
Emilie D. Wrapp | | | 57,146,271.902 | | | | 1,082,067.559 | | | | N/A | | | N/A |
ABT - LGCV
At a Special Meeting held on July 18, 2024, shareholders of AB Large Cap Value Fund (the “Trust”), a series of AB Trust, elected Trustees in connection with the establishment of a single, unitary board (“Unitary Board”) responsible for overseeing mutual funds, exchange-traded funds and certain closed-end investment companies sponsored and advised by the Adviser. In connection with the establishment of the Unitary Board, Ms. Jacklin and Messrs. Downey and Turner will retire as Trustees effective December 31, 2024, and Mr. Erzan will resign as a Trustee effective December 31, 2024, but will continue to serve as President and Chief Executive Officer of the AB Funds. Shareholders of the Trust elected four individuals to serve as Trustees effective January 1, 2025 (the “Trustees-Elect”), who will serve on the Unitary Board with current Trustees Mses. Loeb and McMullen and Messrs. Bermudez and Moody. The number of votes cast for and withheld, as well as the number of abstentions and broker non-votes with respect to the election of each nominee for office is included below.
| | | | | | | | | | | | | | |
Trustee: | | Voted For | | | Withheld
Authority | | | Abstained | | | Broker
Non-Votes |
Jorge A. Bermudez | | | 57,073,037.622 | | | | 1,155,301.839 | | | | N/A | | | N/A |
Alexander Chaloff | | | 57,119,158.863 | | | | 1,109,180.598 | | | | 21,685.940 | | | N/A |
R. Jay Gerken | | | 57,086,039.485 | | | | 1,142,299.976 | | | | N/A | | | N/A |
Jeffrey R. Holland | | | 57,126,106.730 | | | | 1,102,232.731 | | | | N/A | | | N/A |
Jeanette W. Loeb | | | 55,952,398.297 | | | | 2,275,941.164 | | | | N/A | | | N/A |
Carol C. McMullen | | | 57,088,828.224 | | | | 1,139,511.237 | | | | 21,685.940 | | | N/A |
Garry L. Moody | | | 56,999,108.300 | | | | 1,229,231.161 | | | | 21,685.940 | | | N/A |
Emilie D. Wrapp | | | 57,146,271.902 | | | | 1,082,067.559 | | | | N/A | | | N/A |
ITEM 10. REMUNERATION PAID TO DIRECTORS, OFFICERS, AND OTHERS OF OPEN-END MANAGEMENT INVESTMENT COMPANIES.
Aggregate remuneration paid to all Directors and advisory board members are included within the Financial Statements under Item 1 of this Form N-CSR.
ITEM 11. STATEMENT REGARDING BASIS FOR APPROVAL OF INVESTMENT ADVISORY CONTRACT.
Statement regarding basis for Approval of Investment Advisory Contract included within the Financial Statements under Item 1 of this Form N-CSR.
ITEM 12. DISCLOSURE OF PROXY VOTING POLICIES AND PROCEDURES FOR CLOSED-END MANAGEMENT INVESTMENT COMPANIES.
Not applicable to the registrant.
ITEM 13. PORTFOLIO MANAGERS OF CLOSED END MANAGEMENT INVESTMENT COMPANIES.
Not applicable to the registrant.
ITEM 14. PURCHASES OF EQUITY SECURITIES BY CLOSED-END MANAGEMENT INVESTMENT COMPANY OF AND AFFILIDATED PURCHASERS.
Not applicable to the registrant.
ITEM 15. SUBMISSION OF MATTERS TO A VOTE OF SECURITY HOLDERS.
There have been no material changes to the procedures by which shareholders may recommend nominees to the Fund’s Board of Directors since the Fund last provided disclosure in response to this item.
ITEM 16. CONTROLS AND PROCEDURES.
(a) The registrant’s principal executive officer and principal financial officer have concluded that the registrant’s disclosure controls and procedures (as defined in Rule 30a-2(c) under the Investment Company Act of 1940, as amended) are effective at the reasonable assurance level based on their evaluation of these controls and procedures as of a date within 90 days of the filing date of this document.
(b) There were no changes in the registrant’s internal controls over financial reporting that occurred during the period covered by this report that has materially affected, or is reasonably likely to materially affect, the registrant’s internal control over financial reporting.
ITEM 17. DISCLOSURE OF SECURITIES LENDING ACTIVITIES FOR CLOSED-END MANAGEMENT INVESTMENT COMPANIES.
Not applicable to the registrant.
ITEM 18. RECOVERY OF ERRONEOUSLY AWARDED COMPENSATION.
Not applicable to the registrant
ITEM 19. EXHIBITS.
The following exhibits are attached to this Form N-CSR:
SIGNATURES
Pursuant to the requirements of the Securities Exchange Act of 1934 and the Investment Company Act of 1940, the registrant has duly caused this report to be signed on its behalf by the undersigned, thereunto duly authorized.
| | |
| (Registrant): AB Trust |
| |
| By: | | /s/ Onur Erzan |
| | Onur Erzan |
| | President |
|
| Date: January 29, 2025 |
Pursuant to the requirements of the Securities Exchange Act of 1934 and the Investment Company Act of 1940, this report has been signed below by the following persons on behalf of the registrant and in the capacities and on the dates indicated.
| | |
| By: | | /s/ Onur Erzan |
| | Onur Erzan |
| | President |
|
| Date: January 29, 2025 |
| |
| By: | | /s/ Stephen M. Woetzel |
| | Stephen M. Woetzel |
| | Treasurer and Chief Financial Officer |
|
| Date: January 29, 2025 |