Schedule A
Presentation to the Independent Committee of the Board of Directors of

Wednesday, December 10, 2003
Strictly Private and Confidential
Table of Contents
| | | |
| I. | | Introduction |
| II. | | The Proposed Arrangement |
| III. | | Overview of Boardwalk Equities |
| IV | | Preliminary Fairness Analysis |
| Appendices |
| A. | | Canadian REIT Comparables |
| B. | | Canadian Multi-Family Residential REITs |
| C. | | Draft RBC Fairness Opinion |
1
I. Introduction
2
Introduction
| n | | On November 6, 2003, Boardwalk Equities Inc. (“Boardwalk” or the “Company”) announced a proposed plan of arrangement (the “Arrangement”) involving the reorganization of Boardwalk into a real estate investment trust (“Boardwalk REIT”) |
| | — | | the Arrangement is being completed on a tax-deferred basis for Boardwalk using the trust-on-trust-on-LP structure as has been used previously in income trust transactions (e.g., Bell Nordiq) |
| | • | | taxable to Boardwalk shareholders who receive units of Boardwalk REIT (“REIT Units”) |
| | — | | all of Boardwalk’s properties are being transferred to a limited partnership (“Boardwalk LP”) |
| | — | | public shareholders will receive one REIT Unit for each Boardwalk common share (“Share”) held |
| | — | | Messrs. Sam and Van Kolias, Boardwalk’s founders, will receive one REIT Unit for each Share held in respect of approximately 2/3 of their Shares (approximately 20% of Shares outstanding) and an LP unit with the same participation and voting rights as the REIT Units for each of the approximate 1/3 of their Shares remaining (approximately 8% of Shares outstanding) |
| | • | | capital gains tax deferred on Shares exchanged for LP units |
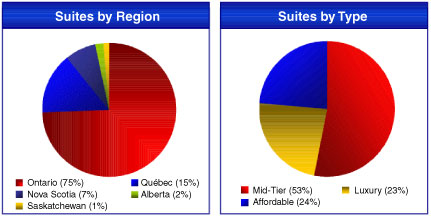
| n | | Boardwalk is Canada’s largest owner and operator of multi-family rental communities |
| | — | | over 250 properties totaling 31,239 rental suites |
| | — | | properties are located approximately 56% in Alberta (35% in Edmonton), 15% in each of Saskatchewan and Quebec, and 13% in Ontario |
| | — | | market capitalization of approximately $900 million |
3
Introduction
| n | | Messrs. Sam and Van Kolias currently hold, indirectly, approximately 15.2 million Shares or approximately 28.4% of the Shares outstanding on a fully diluted basis |
| | — | | Messrs. Sam and Van Kolias intend to divest approximately 2/3 of their Shares for portfolio diversification, tax and structural considerations, either prior to or following Boardwalk’s conversion to a REIT, likely by way of secondary offering |
| n | | The Arrangement is effectively a pro rata distribution of REIT Units (or LP units exchangeable for REIT Units) to all holders of Shares, including indirectly Messrs. Sam and Van Kolias, with none of Boardwalk’s assets being left behind |
| n | | The board of directors of Boardwalk (the “Board”) has formed a committee of independent directors (the “Independent Committee”) to consider the Arrangement and to make recommendations thereon to the Board |
| n | | The Independent Committee has retained RBC Capital Markets (“RBC”) as financial advisor to prepare and deliver to the Independent Committee RBC’s opinion (the “Fairness Opinion”) as to the fairness of the consideration under the Arrangement, from a financial point of view, to the holders (“Public Shareholders”) of Shares other than Messrs. Sam and Van Kolias |
| n | | The Independent Committee has not requested a formal valuation of the Shares or the non-cash consideration (the REIT Units) |
| | — | | expect to rely on section 5.6(5) of OSC Rule 61-501 which provides an exemption from formal valuation and minority approval requirements for pro rata distributions |
4
II. The Proposed Arrangement
5
The Proposed Arrangement
| n | | Through a series of transactions |
| | — | | all of Boardwalk’s properties will become owned by Boardwalk LP |
| | — | | all of the Shares will be exchanged on a one-for-one basis for either REIT Units or for class B units of Boardwalk LP (“LP B Units”) that will be exchangeable for and have the same participation and voting rights as REIT Units |
| | — | | Boardwalk REIT will indirectly hold one class A unit of Boardwalk LP (“LP A Unit”) for each REIT Unit outstanding |
| n | | Messrs. Sam and Van Kolias will hold, indirectly, a number of LP B Units equal to approximately 1/3 of the Shares currently held indirectly by them |
| | — | | the LP A Units (held indirectly by Boardwalk REIT) and the LP B Units (held indirectly by Messrs. Sam and Van Kolias) will have identical entitlements with respect to distributions, allocation of taxable income, and upon liquidation or winding up |
| | — | | the LP B Units will have no tax basis |
| | — | | each LP B Unit will be economically equivalent to and exchangeable for one REIT Unit |
| | — | | the LP B Units will have voting rights at the Boardwalk REIT level but not at Boardwalk LP |
6
The Proposed Arrangement
| n | | Boardwalk’s tax basis in its properties is less than the amount of the mortgage debt outstanding |
| | — | | if all the mortgage debt was assumed by Boardwalk LP, then Boardwalk would realize a capital gain for the excess of the assumed debt over basis resulting in an immediate tax liability |
| | • | | it is estimated that this liability would be approximately $75 million or $1.41 per Share on a fully diluted basis |
| | — | | sufficient mortgage debt will remain in Boardwalk (the “Retained Debt”) such that the excess of the assumed debt over the tax basis will equal two times Boardwalk’s tax loss carry forwards |
| | • | | results in no immediate tax liability for Boardwalk (capital gain is sheltered by tax losses) |
| | • | | the amount of Retained Debt is currently estimated at approximately $434 million |
| | • | | Boardwalk will become indirectly, wholly-owned by Messrs. Sam and Van Kolias, as a result of the Arrangement |
| n | | Boardwalk will hold class C units of Boardwalk LP (“LP C Units”) with a notional value equal to the Retained Debt |
| | — | | legal title to the properties securing the Retained Debt will remain in Boardwalk although beneficial ownership will be transferred to Boardwalk LP |
| | — | | the Retained Debt will continue to be secured by the related properties and will be subject to an indemnity by Boardwalk LP |
| | — | | the LP C Units held by Boardwalk will carry a priority entitlement to distributions from Boardwalk LP equal to the principal and interest payments in respect of the Retained Debt as well as large corporations tax and any capital tax or capital gains tax related to the Retained Debt or the LP C Units |
7
The Proposed Arrangement
| n | | The following illustration of the pro forma ownership structure assumes that Messrs. Sam and Van Kolias divest approximately 2/3 of their Shares in conjunction with the Arrangement |
| | — | | alternatively, they may exchange these Shares on a one-for-one basis for REIT Units and would divest the REIT Units in due course as market conditions permit |
8
The Proposed Arrangement
| n | | Subsequent to the Arrangement, it is anticipated that the basis acquired in the taxable transaction with the Public Shareholders (and with Messrs. Sam and Van Kolias in respect of approximately 2/3 of their Shares) will be pushed down to the LP C Units, such that there will be no capital gains tax on future repayments of principal on the Retained Debt (i.e., return of capital on the LP C Units) |
| | — | | based on our discussions with Boardwalk’s tax advisors and legal counsel there is a high degree of confidence (over 90%) that this “bump” will be available |
| | — | | if this “bump” is not available, the LP C Units will have no tax basis and distributions in respect of Retained Debt principal repayments will be grossed up for the capital gains tax payable, resulting in a pro rata reduction to the distributions to the holders of LP B Units (indirectly, Messrs. Sam and Van Kolias) and LP A Units (indirectly, holders of REIT Units including the Public Shareholders) |
| | — | | the average annual impact on Boardwalk REIT’s recurring distributable income (“RDI”) in this circumstance would be approximately $0.06 per REIT Unit |
| n | | The other area of tax risk in the transaction relates to the possibility that CCRA may deem the LP C Units to be debt rather than equity |
| | — | | in this circumstance, an approximate $75 million tax liability would be crystallized immediately as opposed to being deferred over the amortization period of the Retained Debt |
| | — | | based on our discussions with Boardwalk’s tax advisors and legal counsel the LP C Units have been designed to be characterized as equity and the likelihood that CCRA would prevail in the event this was challenged is estimated at less than 10% |
| | — | | if the tax liability was payable immediately and Boardwalk REIT funded the liability 100% with equity, the impact on Boardwalk REIT’s RDI would be approximately $0.12 per REIT Unit, which reflects assumed issue costs and the elimination of capital tax associated with the Retained Debt |
9
The Proposed Arrangement
| n | | As a result of the foregoing |
| | — | | the Arrangement will be a taxable transaction (exchange of Shares for REIT Units on a one-for- one basis) for the Public Shareholders and for Messrs. Sam and Van Kolias in respect of approximately 2/3 of their Shares |
| | • | | since Boardwalk’s announcement (the “Announcement”) of the Arrangement on November 6, 2003, over 9.9 million Shares (approximately 29% of the public float) have traded, at prices ranging from $17.50 to $18.00 per Share |
| | — | | Messrs. Sam and Van Kolias will defer capital gains tax in respect of approximately 1/3 of their Shares in connection with the Arrangement (Shares that are represented by LP B Units rather than exchanged for REIT Units) |
| | — | | Boardwalk is not expected to incur any tax at the corporate level in connection with the Arrangement unless the LP C Units are deemed to be debt, as described earlier |
10
The Proposed Arrangement
| n | | Messrs. Sam and Van Kolias intend to divest approximately 2/3 of their Shares in conjunction with the Arrangement |
| | — | | however, it is possible that this disposition could be by way of a sale of REIT Units following completion of the Arrangement |
| | — | | the Arrangement is not conditional upon the sale of Shares by Messrs. Sam and Van Kolias |
| n | | The preferred alternative from Boardwalk’s perspective is for Messrs. Sam and Van Kolias to sell Shares as part of the completion of the Arrangement, which we understand is the intention subject to market conditions |
| | — | | under Canadian GAAP, if there is a “change of control” (i.e., at least 20% identifiable change in ownership) in conjunction with the Arrangement, then purchase accounting would apply and Boardwalk REIT’s financial statements would reflect the fair market value of its assets and liabilities at the time of the Arrangement |
| | • | | otherwise, Boardwalk REIT would inherit Boardwalk’s historical carrying values and have substantially higher balance sheet leverage ratios than its peers |
| | • | | based on our discussions with Boardwalk’s auditors it is expected that the sale by Messrs. Sam and Van Kolias of approximately 2/3 of their Shares prior to completion of the Arrangement will qualify Boardwalk for the fair market value adjustment |
11
III. Overview of Boardwalk Equities
12
Overview of Boardwalk Equities
Trading Analysis
| n | | In the one year prior to the Announcement the Shares traded in the range of $14.20 to $15.86 on the TSX |
| n | | Since the Announcement, over 9.9 million Shares (approximately 29% of the public float) have traded, at prices ranging from $17.50 to $18.00 per Share |
13
Overview of Boardwalk Equities
Trading Analysis (cont’d)
| n | | Over the past year, prior to the Announcement, the Shares had significantly underperformed the Company’s residential REIT peers on a total return basis |
14
Overview of Boardwalk Equities
Trading Analysis (cont’d)
| n | | However, over the past two years, the Shares have outperformed the units of CAP REIT and ResREIT on a total return basis |
15
Overview of Boardwalk Equities
Summary Financials
(in C$ millions, except per share amounts and where otherwise stated)
| | | | | | | | | | | | | |
| | | Year Ended | | |
| | |
| | |
| Selected Income Statement Items | | 31-Dec-01 | | 31-Dec-02 | | LTM 9/03 |
| |
| |
| |
|
Revenue | | | | | | | | | | | | |
| Rental income | | | 205,281 | | | | 241,896 | | | | 265,264 | |
| Sales (properties held for resale) | | | 21,988 | | | | 7,498 | | | | — | |
| | | |
| | | |
| | | |
| |
| | | | 227,269 | | | | 249,394 | | | | 265,264 | |
Expenses from revenue producing properties | | | | | | | | | | | | |
| Operating expenses | | | 21,969 | | | | 26,229 | | | | 32,598 | |
| Utilities | | | 31,549 | | | | 32,547 | | | | 35,348 | |
| Utility rebate | | | (4,967 | ) | | | (3,705 | ) | | | (403 | ) |
| Property taxes | | | 19,743 | | | | 23,686 | | | | 26,040 | |
| | | |
| | | |
| | | |
| |
| | | | 68,294 | | | | 78,757 | | | | 93,583 | |
Other Expenses | | | | | | | | | | | | |
| Cost of sales (properties held for resale) | | | 13,939 | | | | 6,531 | | | | — | |
| Administration | | | 16,482 | | | | 19,931 | | | | 23,102 | |
| Financing costs | | | 65,567 | | | | 74,284 | | | | 76,578 | |
| Amortization | | | 55,384 | | | | 49,987 | | | | 53,682 | |
| | | |
| | | |
| | | |
| |
| | | | 151,372 | | | | 150,733 | | | | 153,362 | |
Income before the undernoted | | | 7,603 | | | | 19,904 | | | | 18,319 | |
| Gain on debt settlement | | | — | | | | (692 | ) | | | (692 | ) |
| Provision for loss on technology investment | | | 29,837 | | | | — | | | | — | |
| | | |
| | | |
| | | |
| |
Income before taxes | | | (22,234 | ) | | | 20,596 | | | | 19,011 | |
| Current income taxes | | | 3,246 | | | | 3,600 | | | | 3,921 | |
| Future income taxes | | | (12,678 | ) | | | 5,420 | | | | 4,386 | |
| | | |
| | | |
| | | |
| |
Net Income | | | (12,802 | ) | | | 11,576 | | | | 10,704 | |
| | | |
| | | |
| | | |
| |
Funds from operations (FFO) | | | 57,941 | | | | 63,052 | | | | 65,852 | |
FFO per basic share | | $ | 1.16 | | | $ | 1.27 | | | $ | 1.31 | |
| | | | | | | | | | | | | |
| | | Year Ended | | |
| | |
| | |
| Segmented NOI Summary | | 31-Dec-01 | | 31-Dec-02 | | LTM 9/03 |
| |
| |
| |
|
Revenue | | | | | | | | | | | | |
| Alberta | | | 141,609 | | | | 151,397 | | | | 152,250 | |
| Saskatchewan | | | 31,858 | | | | 32,893 | | | | 33,869 | |
| Ontario | | | 29,645 | | | | 33,327 | | | | 34,395 | |
| Québec | | | — | | | | 21,962 | | | | 44,334 | |
| Unallocated revenue | | | 24,157 | | | | 9,815 | | | | 416 | |
| | | |
| | | |
| | | |
| |
| | | | 227,269 | | | | 249,394 | | | | 265,264 | |
Net operating income | | | | | | | | | | | | |
| Alberta | | | 100,578 | | | | 106,878 | | | | 102,227 | |
| Saskatchewan | | | 19,315 | | | | 19,973 | | | | 20,897 | |
| Ontario | | | 15,758 | | | | 18,416 | | | | 18,568 | |
| Québec | | | — | | | | 15,835 | | | | 29,995 | |
| | | |
| | | |
| | | |
| |
| | | | 135,651 | | | | 161,102 | | | | 171,687 | |
| | | | | | | | | | | | | |
| | | As at |
| | |
|
| Selected Balance Sheet Items | | 31-Dec-01 | | 31-Dec-02 | | 30-Sep-03 |
| |
| |
| |
|
Assets | | | | | | | | | | | | |
| Revenue producing properties | | | 1,381,541 | | | | 1,604,277 | | | | 1,714,227 | |
| Properties held for resale or development | | | 6,630 | | | | 7,038 | | | | 7,386 | |
| Accounts receivable and other assets | | | 75,448 | | | | 73,541 | | | | 68,211 | |
| Cash and equivalents | | | 25,672 | | | | 23,631 | | | | 32 | |
| | | |
| | | |
| | | |
| |
| | | | 1,489,291 | | | | 1,708,487 | | | | 1,789,856 | |
Liabilities | | | | | | | | | | | | |
| Mortgages payable | | | 1,108,406 | | | | 1,307,177 | | | | 1,382,602 | |
| Capital lease obligations | | | 7,203 | | | | 4,598 | | | | 3,795 | |
| Accounts payable and other liabilities | | | 88,698 | | | | 94,970 | | | | 94,305 | |
| | | |
| | | |
| | | |
| |
| | | | 1,204,307 | | | | 1,406,745 | | | | 1,480,702 | |
| Shareholders’ equity | | | 284,984 | | | | 301,745 | | | | 309,154 | |
| | | |
| | | |
| | | |
| |
Liabilities and shareholders’ equity | | | 1,489,291 | | | | 1,708,490 | | | | 1,789,856 | |
| | | |
| | | |
| | | |
| |
16
Overview of Boardwalk Equities
Shareholder Summary
| | | | | | | | | | |
| | | | Shares | | % of Total |
| | | |
| |
|
Executives and Insiders(1) | | | | | | | | |
| | Boardwalk Properties Company Limited(2) | | | 15,150,000 | | | | 30.0 | % |
| | Other Executives and Insiders | | | 542,880 | | | | 1.1 | % |
| | | |
| | | |
| |
| Total Executives and Insiders | | | 15,692,880 | | | | 31.1 | % |
| | | | | | | | | |
Institutional Shareholders(3) | | | | | | | | |
| | Fidelity | | | 7,002,300 | | | | 13.9 | % |
| | ABN Amro Asset Management | | | 3,821,575 | | | | 7.6 | % |
| | IG Investment Management | | | 2,614,000 | | | | 5.2 | % |
| | Franklin | | | 2,355,093 | | | | 4.7 | % |
| | Deutsche Bank AG | | | 2,012,000 | | | | 4.0 | % |
| | CI Mutual Funds | | | 1,934,500 | | | | 3.8 | % |
| | AGF Funds Inc. | | | 1,298,000 | | | | 2.6 | % |
| | CIBC | | | 921,050 | | | | 1.8 | % |
| | Perigee | | | 737,450 | | | | 1.5 | % |
| | Schneider Capital | | | 587,750 | | | | 1.2 | % |
| | Advantus Capital | | | 517,940 | | | | 1.0 | % |
| | Other Identified Institutional Shareholders (41) | | | 5,001,403 | | | | 9.9 | % |
| | | |
| | | |
| |
| Total Identified Institutional Shareholders | | | 28,803,061 | | | | 57.1 | % |
| | | | | | | | | |
| Retail and Unidentified Shareholders | | | 5,985,106 | | | | 11.9 | % |
| | | |
| | | |
| |
| Total Shares Outstanding | | | 50,481,047 | | | | 100.0 | % |
| | | |
| | | |
| |
Notes:
(1) From Management Information Circular dated May 13, 2003, press release dated November 7, 2003, Company information and Bloomberg as at December 8, 2003.
(2) Boardwalk Properties Company Limited is a real estate holding company. It is owned 50% by Boardwalk Investment Limited (owned by Sam Kolias) and 50% by Park Place Holdings Ltd. (owned by Van Kolias).
(3) Source: Bloomberg as at December 8, 2003. |
17
Overview of Boardwalk Equities
NAV Summary
| n | | Based on the closing price of the Shares of $15.59 on November 5, 2003, the last trading day prior to the Announcement, Boardwalk in its corporate structure was trading at a discount of approximately 13% to the average net asset value (“NAV”) estimate of equity research analysts of $17.94 per Share |
| | | | | | | | | | | |
| (in C$ per share) | | | | | | | | |
| | | | | | | | | 2004E |
| Firm | | Date | | NAV Estimate | | FFO / share |
| |
| |
| |
|
| Desjardins Securities | | December 1, 2003 | | $ | 19.04 | | | $ | 1.47 | |
| AG Edwards | | November 25, 2003 | | $ | 18.50 | | | $ | 1.50 | |
| Scotia Capital | | November 18, 2003 | | na | | | $ | 1.49 | |
| National Bank Financial | | November 17, 2003 | | $ | 16.80 | | | $ | 1.45 | |
| Raymond James & Associates | | November 12, 2003 | | $ | 19.30 | | | $ | 1.47 | |
RBC Capital Markets (1) | | November 6, 2003 | | $ | 16.50 | | | $ | 1.51 | |
| CIBC World Markets | | September 2, 2003 | | $ | 17.50 | | | $ | 1.50 | |
| |
|
Mean | | | | $ | 17.94 | | | $ | 1.48 | |
Median | | | | $ | 18.00 | | | $ | 1.49 | |
|
(1) NAV estimate from research valuation dated November 3, 2003 regarding a possible REIT conversion. |
18
IV. Preliminary Fairness Analysis
19
Preliminary Fairness Analysis
Scope of Review
| n | | In completing our fairness analysis, RBC has reviewed and relied upon or carried out, among other things, the following |
| | — | | audited financial statements of the Company for the three years ended December 31, 2002 |
| | — | | unaudited property cash flows for the Company for the year ended December 31, 2002 |
| | — | | supplemental financial and operating information for the quarter ended September 30, 2003 |
| | — | | unaudited internal management budget for the Company for the year ending December 31, 2004 |
| | — | | unaudited projected income and cash flow statements of the Company for the 5 years ending December 31, 2008 |
| | — | | unaudited projected property cash flows for the Company, prepared by management of the Company, for the two years ending December 31, 2004 |
| | — | | unaudited projected income statement and distributions for Boardwalk REIT, prepared by management of the Company, for the year ending December 31, 2004 |
| | — | | unaudited pro forma consolidated balance sheet and income statement of Boardwalk REIT as at and for the nine months ended September 30, 2003 |
| | — | | the most recent draft, dated December 5, 2003, of the Management Information Circular |
| | — | | the most recent drafts, dated December 6, 2003, of the Declarations of Trust of Boardwalk REIT and Boardwalk Operating Trust |
| | — | | the most recent draft, dated December 4, 2003, of the Arrangement and Acquisition Agreement |
20
Preliminary Fairness Analysis
Scope of Review (cont’d)
| | — | | the most recent draft, dated December 6, 2003, of the limited partnership agreement creating Boardwalk LP |
| | — | | discussions with senior management and auditors of Boardwalk |
| | — | | discussions with the Company’s tax advisors and legal counsel and with McCarthy Tétrault LLP, counsel to the Independent Committee |
| | — | | public disclosure documents of the Company and other selected public real estate entities |
21
Preliminary Fairness Analysis
Approach to Fairness
| n | | In considering the fairness of the consideration under the Arrangement, from a financial point of view, to the Public Shareholders, RBC considered |
| | — | | the potential pro forma trading value of the REIT Units as compared to the Shares prior to the Announcement (adjusted for share price movements of Boardwalk’s peers since the Announcement) |
| | — | | certain financial attributes of Boardwalk REIT compared to the Company |
| | — | | any incremental costs required to achieve, or resulting from, the Arrangement |
| | — | | the attributes of the REIT Units to be received by the Public Shareholders compared to the LP B Units to be held indirectly by Messrs. Sam and Van Kolias in respect of approximately 1/3 of their Shares |
| | — | | the characteristics of the other assets and liabilities to be held indirectly by Messrs. Sam and Van Kolias, including the LP C Units, the Retained Debt and the historical liabilities of Boardwalk |
22
Preliminary Fairness Analysis
Fairness Analysis — Potential Trading Value of REIT Units vs. Shares
| n | | In assessing the potential trading value of the Boardwalk REIT Units, RBC reviewed other Canadian multi-family residential REITs and considered their |
| | — | | trading multiples of funds from operations (“FFO”) and RDI |
| | — | | current and expected yields based on RDI |
| | — | | tax deferred component of distributions |
| | — | | leverage (debt to total capitalization) |
| | — | | management organization (internal vs. external asset and property management functions) |
23
Preliminary Fairness Analysis
Fairness Analysis — Potential Trading Value of REIT Units vs. Shares (cont’d)
| n | | The following table summarizes the current capital structure of Canadian multi-family residential REITs |
| | — | | further details regarding Canadian multi-family residential REITs are provided in Appendix B |
| n | | Boardwalk REIT is shown at three prices, the closing price of the Shares prior to the Announcement, the pre-Announcement price adjusted to reflect the weighted average increase in the market value of Boardwalk’s peers since the Announcement, and the current price of the Shares |
| | — | | adjusted pre-Announcement price is a proxy for the benchmark to which the current expected trading price of Boardwalk REIT should be compared in determining whether the REIT Units are likely to trade at levels at or above the Shares |
| | | | | | | | | | | | | | | | | | | | | |
| | | Unit / Share | | Market | | Debt / | | 2003E Tax | | Price Change |
| Company | | Price(1) | | Cap | | Total Cap.(2) | | Deferral | | Since Ann. |
| |
| |
| |
| |
| |
|
| | | | | | | (C$ millions) | | (market) | | | | | | | | |
Residential REITS | | | | | | | | | | | | | | | | | | | | |
| CAP REIT | | $ | 15.67 | | | $ | 451.9 | | | | 54.0 | % | | | 70.0 | % | | | 0.3 | % |
| ResREIT | | $ | 16.01 | | | $ | 433.7 | | | | 50.7 | % | | | 65.0 | % | | | 0.4 | % |
|
Mean | | | | | | | | | | | 52.3 | % | | | 67.5 | % | | | 0.3 | % |
|
| Boardwalk REIT (pre-Announcement Share price) | | $ | 15.59 | | | $ | 831.4 | | | | 62.5 | % | | | 78.0 | % | | na
|
| Boardwalk REIT (adjusted pre-Announcement Share price) | | $ | 15.64 | | | $ | 834.4 | | | | 62.4 | % | | | 78.0 | % | | | 0.3 | % |
| Boardwalk REIT (current Share price) | | $ | 17.75 | | | $ | 946.6 | | | | 59.4 | % | | | 78.0 | % | | | 13.9 | % |
(1) Unit prices as at December 9, 2003, forward estimates except Boardwalk REIT are from RBC research as at November 25, 2003. Boardwalk REIT forward estimates are company forecasts.
(2) Total capitalization equals total debt plus market capitalization.
24
Preliminary Fairness Analysis
Fairness Analysis — Potential Trading Value of REIT Units vs. Shares (cont’d)
| n | | The following table summarizes the current trading multiples and yields of Canadian multi-family residential REITs |
| | — | | as before, Boardwalk REIT is shown at $15.59, $15.64 and $17.75 |
| | — | | we have also shown Boardwalk REIT’s multiples and yields under scenarios where the tax “bump” of the LP C Units is unsuccessful and where the tax deferral is unsuccessful (i.e., tax liability of $75 million is payable immediately) assuming funding is 100% with equity |
| | | | | | | | | | | | | | | | | | | | | | | | | | | | | | | | | | | | | | | | | | | | | | | | | |
| | | | | | | | | | | | | | | | | | | | | | | Yield at Payout | | | | | | Current |
| | | | | | | | | | | | | | | | | | | | | | | | | | | | |
|
| | | Unit / Share | | 2004E | | FFO | | 2004E | | RDI | | Ratio of RDI | | | | | | | | | | Payout % of RDI |
| | | | | | | | | | | | |
| | | | | | | | | |
|
| Company | | Price (1) | | FFO (1) | | Multiple | | RDI (1) | | Multiple | | 80% | | 85% | | 90% | | Payout | | Yield | | 2003E | | 2004E |
| |
| |
| |
| |
| |
| |
| |
| |
| |
| |
| |
| |
|
Residential REITS | | | | | | | | | | | | | | | | | | | | | | | | | | | | | | | | | | | | | | | | | | | | | | | | |
| CAP REIT | | $ | 15.67 | | | $ | 1.31 | | | | 12.0x | | | $ | 1.31 | | | | 12.0x | | | | 6.7 | % | | | 7.1 | % | | | 7.5 | % | | $ | 1.08 | | | | 6.9 | % | | | 86 | % | | | 82 | % |
| ResREIT | | $ | 16.01 | | | $ | 1.34 | | | | 11.9x | | | $ | 1.34 | | | | 11.9x | | | | 6.7 | % | | | 7.1 | % | | | 7.5 | % | | $ | 1.08 | | | | 6.7 | % | | | 86 | % | | | 81 | % |
|
Mean | | | | | | $ | 1.33 | | | | 12.0x | | | $ | 1.33 | | | | 12.0x | | | | 6.7 | % | | | 7.1 | % | | | 7.5 | % | | $ | 1.08 | | | | 6.8 | % | | | 86 | % | | | 82 | % |
|
Scenario 1: Tax Deferral and LP C Bump are Successful | | | | | | | | | | | | | | | | | | | | | | | | | | | | | | | | | | | | | | | | | | | | | | | | |
| Boardwalk REIT (pre-Announcement Share price) | | $ | 15.59 | | | $ | 1.44 | | | | 10.8x | | | $ | 1.49 | | | | 10.5x | | | | 7.6 | % | | | 8.1 | % | | | 8.6 | % | | $ | 1.23 | | | | 7.9 | % | | na
| | | 83 | % |
| Boardwalk REIT (adjusted pre-Announcement Share price) | | $ | 15.64 | | | $ | 1.44 | | | | 10.9x | | | $ | 1.49 | | | | 10.5x | | | | 7.6 | % | | | 8.1 | % | | | 8.6 | % | | $ | 1.23 | | | | 7.9 | % | | na
| | | 83 | % |
| Boardwalk REIT (current Share price) | | $ | 17.75 | | | $ | 1.44 | | | | 12.3x | | | $ | 1.49 | | | | 11.9x | | | | 6.7 | % | | | 7.1 | % | | | 7.6 | % | | $ | 1.23 | | | | 6.9 | % | | na
| | | 83 | % |
Scenario 2: Tax Deferral is Successful and LP C Bump is Unsuccessful (2) | | | | | | | | | | | | | | | | | | | | | | | | | | | | | | | | | | | | | | | | | | | | | | | | |
| Boardwalk REIT (pre-Announcement Share price) | | $ | 15.59 | | | $ | 1.38 | | | | 11.3x | | | $ | 1.43 | | | | 10.9x | | | | 7.3 | % | | | 7.8 | % | | | 8.2 | % | | $ | 1.18 | | | | 7.6 | % | | na
| | | 83 | % |
| Boardwalk REIT (adjusted pre-Announcement Share price) | | $ | 15.64 | | | $ | 1.38 | | | | 11.4x | | | $ | 1.43 | | | | 11.0x | | | | 7.3 | % | | | 7.7 | % | | | 8.2 | % | | $ | 1.18 | | | | 7.5 | % | | na
| | | 83 | % |
| Boardwalk REIT (current Share price) | | $ | 17.75 | | | $ | 1.38 | | | | 12.9x | | | $ | 1.43 | | | | 12.4x | | | | 6.4 | % | | | 6.8 | % | | | 7.2 | % | | $ | 1.18 | | | | 6.6 | % | | na
| | | 83 | % |
Scenario 3: Tax Deferral is Unsuccessful (2)(3) | | | | | | | | | | | | | | | | | | | | | | | | | | | | | | | | | | | | | | | | | | | | | | | | |
| Boardwalk REIT (pre-Announcement Share price) | | $ | 15.59 | | | $ | 1.32 | | | | 11.8x | | | $ | 1.37 | | | | 11.4x | | | | 7.0 | % | | | 7.5 | % | | | 7.9 | % | | $ | 1.13 | | | | 7.3 | % | | na | | | 83 | % |
| Boardwalk REIT (adjusted pre-Announcement Share price) | | $ | 15.64 | | | $ | 1.32 | | | | 11.9x | | | $ | 1.37 | | | | 11.4x | | | | 7.0 | % | | | 7.4 | % | | | 7.9 | % | | $ | 1.13 | | | | 7.2 | % | | na | | | 83 | % |
| Boardwalk REIT (current Share price) | | $ | 17.75 | | | $ | 1.32 | | | | 13.4x | | | $ | 1.37 | | | | 13.0x | | | | 6.2 | % | | | 6.6 | % | | | 6.9 | % | | $ | 1.13 | | | | 6.4 | % | | na | | | 83 | % |
(1) Unit prices as at December 9, 2003, forward estimates except Boardwalk REIT are from RBC research as at November 25, 2003. Boardwalk REIT forward estimates are company forecasts.
(2) Based on Retained Debt of $434 million, a tax rate of 34.6% and amortization period of the Retained Debt of 22 years.
(3) Assuming that the tax liability is financed with 100% equity priced at $15.64 with 6.5% issue costs assumed. Also reflects the elimination of an estimated $600,000 of capital tax associated with the Retained Debt.
25
Preliminary Fairness Analysis
Fairness Analysis — Potential Trading Value of REIT Units vs. Shares (cont’d)
| n | | In considering the potential trading value of the REIT Units, we make the following observations about Boardwalk REIT and other Canadian multi-family residential REITs |
| | — | | Boardwalk REIT will be the largest multi-family residential REIT in Canada with a market capitalization approximately double that of ResREIT and CAP REIT |
| | — | | Boardwalk’s assets are predominantly located in Alberta, an unregulated rental market |
| | — | | ResREIT and CAP REIT each have a much larger presence in Ontario and the GTA |
| | — | | compared to ResREIT and CAP REIT, a higher percentage of Boardwalk’s properties are of wood frame rather than concrete construction |
| | — | | Boardwalk REIT will be internally managed (asset and property management) |
| | • | | ResREIT has external property management, CAP REIT is fully internalized |
| | — | | Boardwalk REIT’s distributions are expected to be tax deferred as to approximately 78%, a higher level than its peers |
| | — | | Boardwalk REIT’s overall leverage ratio based on the fair market value of its debt and properties is expected to be above its peers |
| | • | | if the accounting treatment of the Arrangement does not permit Boardwalk REIT to make a fair value adjustment to Boardwalk’s properties, Boardwalk REIT’s leverage on a book basis will be significantly higher than its peers |
26
Preliminary Fairness Analysis
Fairness Analysis — Potential Trading Value of REIT Units vs. Shares (cont’d)
| | — | | Messrs. Sam and Van Kolias will have the right to appoint 1 trustee so long as they own at least a 5% equity interest in Boardwalk REIT (fully diluted assuming exchange of LP B Units) |
| | • | | CAP REIT does not have any related parties with management and governance influence |
| | • | | Greenwin was entitled to appoint one out of nine trustees of ResREIT for five years following the initial public offering, so long as it owned at least 10% of the outstanding units |
| | • | | Messrs. Sam and Van Kolias also intend to continue in their current management roles following completion of the Arrangement |
| n | | For the REIT Units to trade at or above the adjusted pre-Announcement price of $15.64 they would need to trade at 10.5x 2004E RDI and a 7.9% yield |
| | — | | this would be a significant discount to the trading levels of Boardwalk REIT’s multi-family residential REIT peers (ResREIT and CAP REIT) which trade at approximately 12x 2004E RDI and yields of approximately 7% |
| | — | | based on the foregoing we have no reason to believe the REIT Units would attract such a discount |
27
Preliminary Fairness Analysis
Fairness Analysis — Potential Trading Value of REIT Units vs. Shares (cont’d)
| n | | If the tax “bump” of the LP C Units described previously is unsuccessful, the distributions on the LP C Units in respect of Retained Debt principal repayments will be grossed up for the capital gains tax payable |
| | — | | the impact on Boardwalk REIT’s RDI in this circumstance is estimated to be approximately $0.06 per REIT Unit annually |
| | • | | it is expected that the impact on 2004E RDI would be less than this amount as there are no large principal repayments on the Retained Debt scheduled in 2004 |
| | — | | in the event the tax “bump” was unsuccessful, in order for the REIT Units to trade at or above the adjusted pre-Announcement price of $15.64 they would need to trade at 11.0x RDI and a 7.5% yield, which would still represent a meaningful discount to Boardwalk REIT’s peers |
| n | | As described previously, if the LP C Units are deemed by CCRA to be debt rather than equity the tax deferral would be unsuccessful and the $75 million tax liability would be payable immediately |
| | — | | if the liability was funded 100% with equity, the impact on Boardwalk REIT’s RDI would be approximately $0.12 per REIT Unit, which reflects assumed issue costs and the elimination of capital tax associated with the Retained Debt |
| | — | | in the event the tax deferral was unsuccessful, in order for the REIT Units to trade at or above the adjusted pre-Announcement price of $15.64 they would need to trade at 11.4x RDI and a 7.2% yield, which would still represent a discount to Boardwalk REIT’s peers |
28
Preliminary Fairness Analysis
Fairness Analysis — Potential Trading Value of REIT Units vs. Shares (cont’d)
| n | | As noted above, equity research analysts’ average NAV estimate for Boardwalk is $17.94 per Share |
| n | | In order for the REIT Units to trade at or above the adjusted pre-Announcement price of $15.64 they would need to trade at no more than an 12.8% discount to the consensus NAV estimate |
| | — | | as illustrated below, most Canadian REITs including both CAP REIT and ResREIT trade at a premium to their NAV |
| | | | | | | | | | | | | | |
| | | | December 8, 2003 |
| | | | |
| | | | | | | | | | | | Premium |
| | | Price | | NAV | | (Discount) |
Apartments | | | | | | | | | | | | |
| | CAP REIT | | $ | 15.45 | | | $ | 13.85 | | | | 12 | % |
| | ResREIT | | $ | 16.07 | | | $ | 14.55 | | | | 10 | % |
Commercial | | | | | | | | | | | | |
| | Alexis Nihon REIT | | $ | 12.25 | | | $ | 9.76 | | | | 26 | % |
| | Calloway REIT | | $ | 13.35 | | | $ | 9.65 | | | | 38 | % |
| | Cominar REIT | | $ | 14.32 | | | $ | 11.75 | | | | 22 | % |
| | CREIT | | $ | 16.01 | | | $ | 11.90 | | | | 35 | % |
| | H&R REIT | | $ | 15.47 | | | $ | 13.00 | | | | 19 | % |
| | IPC US REIT ($US) | | $ | 8.05 | | | $ | 6.65 | | | | 21 | % |
| | Morguard REIT | | $ | 8.98 | | | $ | 7.60 | | | | 18 | % |
| | Northern Property REIT | | $ | 15.85 | | | $ | 10.70 | | | | 48 | % |
| | O&Y REIT | | $ | 11.30 | | | $ | 10.20 | | | | 11 | % |
| | RioCan REIT | | $ | 14.91 | | | $ | 11.20 | | | | 33 | % |
| | Summit REIT | | $ | 17.22 | | | $ | 13.50 | | | | 28 | % |
| | TGS N.A. REIT ($US) | | $ | 7.38 | | | $ | 6.25 | | | | 18 | % |
Hotels | | | | | | | | | | | | |
| | CHIP REIT | | $ | 9.74 | | | $ | 8.50 | | | | 15 | % |
| | InnVest REIT | | $ | 10.85 | | | $ | 9.50 | | | | 14 | % |
| | Legacy Hotels REIT | | $ | 7.10 | | | $ | 6.70 | | | | 6 | % |
| | Royal Host REIT | | $ | 4.45 | | | $ | 4.50 | | | | (1 | %) |
Long Term Care Facilities | | | | | | | | | | | | |
| | Retirement Residences REIT | | $ | 12.25 | | | $ | 8.95 | | | | 37 | % |
| | | | | | | | | | | |
| |
Average: | | | | | | | | | | | 21.5 | % |
| | | | | | | | | | | | | |
| | | | | | | | | | | | | |
| Source: RBC research | | | | | | | | | | | | |
29
Preliminary Fairness Analysis
Fairness Analysis — Potential Trading Value of REIT Units vs. Shares (cont’d)
| n | | As a check, RBC performed its own high level NAV analysis of Boardwalk ascribing a separate value for each category of asset and liability and utilizing the methodology most appropriate in each case |
| n | | While RBC’s preliminary NAV range is slightly lower than that of equity research analysts, even at our midpoint of $16.76 the REIT Units would need to trade at no more than a 6.7% discount to NAV to exceed the adjusted pre-Announcement price of the Shares, which is a significant discount to its peers |
| | | | | | | | | | | | | | | | | | | | | |
| $000s | | | | | | High | | Low |
| | | | | | |
| |
|
| | | Book | | Mark-to- | | FMV | | Mark-to- | | FMV |
| | | 30-Sep-03 | | Market | | 31-Dec-02 | | Market | | 31-Dec-02 |
Assets | | | | | | | | | | | | | | | | | | | | |
| Revenue producing properties | | $ | 1,714,227 | | | $ | 615,229 | | | $ | 2,329,456 | | | $ | 464,941 | | | $ | 2,179,168 | |
| Properties held for development | | | 7,386 | | | | 0 | | | | 7,386 | | | | 0 | | | | 7,386 | |
| Mortgages and accounts receivable | | | 10,975 | | | | 0 | | | | 10,975 | | | | 0 | | | | 10,975 | |
| Other assets | | | 13,036 | | | | 0 | | | | 13,036 | | | | 0 | | | | 13,036 | |
| Deferred financing costs | | | 37,161 | | | | (7,432 | ) | | | 29,729 | | | | (7,432 | ) | | | 29,729 | |
| Segregated tenants’ security deposits | | | 7,039 | | | | 0 | | | | 7,039 | | | | 0 | | | | 7,039 | |
| Other assets | | | 32 | | | | 0 | | | | 32 | | | | 0 | | | | 32 | |
| | | |
| | | |
| | | |
| | | |
| | | |
| |
| | | | 1,789,856 | | | | 607,796 | | | | 2,397,652 | | | | 457,509 | | | | 2,247,365 | |
Liabilities | | | | | | | | | | | | | | | | | | | | |
| Mortgages payable | | | 1,382,602 | | | | 50,434 | | | | 1,433,036 | | | | 50,434 | | | | 1,433,036 | |
| Accounts payable and accrued liabilities | | | 16,119 | | | | 0 | | | | 16,119 | | | | 0 | | | | 16,119 | |
| Refundable tenants’ security deposits and other | | | 10,013 | | | | 0 | | | | 10,013 | | | | 0 | | | | 10,013 | |
| Capital lease obligations | | | 3,795 | | | | 0 | | | | 3,795 | | | | 0 | | | | 3,795 | |
| | | |
| | | |
| | | |
| | | |
| | | |
| |
| | | | 1,412,529 | | | | 50,434 | | | | 1,462,963 | | | | 50,434 | | | | 1,462,963 | |
| | | |
| | | |
| | | |
| | | |
| | | |
| |
| Net assets before taxes | | | 377,327 | | | | 557,362 | | | | 934,689 | | | | 407,075 | | | | 784,402 | |
| Future Income taxes | | | 68,173 | | | | (11,261 | ) | | | 56,912 | | | | (24,708 | ) | | | 43,465 | |
| | | |
| | | |
| | | |
| | | |
| | | |
| |
| Net assets after taxes | | $ | 309,154 | | | $ | 568,623 | | | $ | 877,777 | | | $ | 431,783 | | | $ | 740,937 | |
| | | |
| | | |
| | | |
| | | |
| | | |
| |
| Basic shares o/s | | | 50,481 | | | | | | | | 50,481 | | | | | | | | 50,481 | |
| Fully diluted shares o/s | | | 53,332 | | | | | | | | 53,332 | | | | | | | | 53,332 | |
|
Basic NAV pre-tax | | $ | 7.47 | | | | | | | $ | 18.52 | | | | | | | $ | 15.54 | |
Basic NAV after-tax | | $ | 6.12 | | | | | | | $ | 17.39 | | | | | | | $ | 14.68 | |
|
Diluted NAV pre-tax | | | | | | | | | | $ | 18.17 | | | | | | | $ | 15.36 | |
Diluted NAV after-tax | | | | | | | | | | $ | 17.08 | | | | | | | $ | 14.51 | |
30
Preliminary Fairness Analysis
Fairness Analysis — Financial Attributes of Boardwalk REIT vs. the Company
| n | | RBC considered certain financial attributes of Boardwalk REIT compared to the Company and, in particular, the impact of the Arrangement on the Company’s |
| | — | | ability to raise equity and debt financing on competitive terms |
| | • | | REITs have been the primary form of capital raised in Canadian public equity markets over the past three years |
| | • | | Boardwalk REIT is expected to be able to access the equity capital markets on terms at least as favourable as Boardwalk today |
| | • | | mortgage financing is expected to be available to Boardwalk REIT on competitive terms |
| | 4 | | CMHC is reviewing the structure of the Arrangement, including the Retained Debt and LP C Units, and is expected to deliver a letter to Boardwalk to the effect that Boardwalk REIT’s mortgages will continue to be CMHC insured |
| | • | | the public float of the Shares currently turns over in approximately 1.4 years |
| | • | | the Canadian REITs that are most comparable in market capitalization to Boardwalk REIT are H&R REIT, CREIT, Summit, whose floats turn over in approximately 2.2, 4.9 and 1.8 years, respectively |
| | 4 | | given that the natural buyers of REITs are yield-oriented investors who generally follow a “buy-and-hold” strategy, REIT units tend to be less actively traded than shares of real estate operating companies |
| | • | | to the extent Messrs. Sam and Van Kolias reduce their indirect holdings in connection with the Arrangement, this should add to the liquidity for the REIT Units |
31
Preliminary Fairness Analysis
Fairness Analysis — Financial Attributes of Boardwalk REIT vs. the Company (cont’d)
| | • | | certain non-resident and other holders of the Shares may not be natural holders of REIT Units and this may result in short-term redistribution |
| | • | | we note that approximately 29% of Boardwalk’s public float has traded since the Announcement, in part reflecting redistribution of the Shares into the hands of investors that are more likely to be natural holders of REIT Units following completion of the Arrangement |
| | • | | the redistribution effect is typically short-term in nature and is not expected to have any long-term impact on the trading value of the REIT Units |
| | — | | REIT structure enables income to be distributed more efficiently by eliminating taxation at the entity level |
| | — | | Boardwalk LP will inherit the Company’s historic tax basis in the properties, resulting in lower CCA deductions in future years |
| | • | | results in lower tax deferral on distributions than if Boardwalk REIT had acquired the properties with full basis |
32
Preliminary Fairness Analysis
Fairness Analysis — Incremental Costs
| n | | RBC considered whether the Arrangement is expected to result in any |
| | — | | tax being incurred by the Company initially |
| | — | | tax inefficiency for Boardwalk REIT going forward |
| | — | | incremental G&A or other costs |
| n | | The Company is not expected to incur any tax in connection with the Arrangement |
| | — | | tax deferred roll-over of properties to Boardwalk LP |
| | — | | Retained Debt, equal to amount of mortgages in excess of Boardwalk’s tax basis and available shelter from tax loss carry forwards, is left in Boardwalk and matched by the LP C Units |
| | — | | Boardwalk’s tax advisors and legal counsel are over 90% confident that each of the tax “bump” of the LP C Units and the tax deferral will be effective |
| | — | | in the “worst case” scenario that the tax deferral is unsuccessful and the $75 million tax liability is payable immediately, Boardwalk REIT’s RDI would be reduced by as much as $0.12 per REIT Unit (assuming 100% equity funding), which reflects assumed issue costs and the elimination of capital tax associated with the Retained Debt |
| | • | | in this case the REIT Units would still have to trade at a discount to Boardwalk REIT’s peers in order for them to trade at levels below the adjusted pre-Announcement price of the Shares |
33
Preliminary Fairness Analysis
Fairness Analysis – Incremental Costs (cont’d)
| n | | Boardwalk REIT will not incur federal large corporations tax or provincial capital tax at the entity level, except with respect to the Retained Debt |
| | — | | the distributions on LP C Units will include amounts sufficient to compensate Boardwalk, then indirectly wholly-owned by Messrs. Sam and Van Kolias, for these costs |
| n | | The trust expenses of Boardwalk REIT are not expected to exceed the actual G&A expenses of Boardwalk in corporate form |
| | — | | the management organization of Boardwalk REIT is expected to be substantially the same as for Boardwalk today |
| | — | | external audit, trustees fees and insurance, public reporting and investor relations expenses for Boardwalk REIT are expected to be comparable to what the Company incurs today |
34
Preliminary Fairness Analysis
Fairness Analysis – REIT Units vs. LP B Units
| n | | RBC also considered the characteristics of the REIT Units to be received by the Public Shareholders and the LP B Units to be received by Messrs. Sam and Van Kolias in respect of approximately 1/3 of their Shares |
| n | | Each LP B Unit held indirectly by Messrs. Sam and Van Kolias is intended to be equivalent to one REIT Unit |
| | — | | will be exchangeable for one REIT Unit |
| | — | | will have voting rights at the Boardwalk REIT level but not at Boardwalk LP |
| | — | | will have identical entitlements with respect to distributions, allocation of taxable income, and entitlements upon liquidation or wind-up |
| n | | The LP B Units will have no tax basis compared to full basis for the REIT Units to be held by the Public Shareholders |
| | — | | however, the Arrangement will be a taxable event for the Public Shareholders whereas Messrs. Sam and Van Kolias will defer their tax on approximately 1/3 of their Shares which will be represented by LP B Units |
35
Preliminary Fairness Analysis
Fairness Analysis – Other Assets and Liabilities
| n | | RBC also considered the other assets and liabilities that will be held indirectly by Messrs. Sam and Van Kolias |
| | • | | entitled to distributions sufficient to pay all costs associated with the Retained Debt, including interest, principal repayments, and any capital tax |
| | • | | as described above, Boardwalk’s tax advisors and legal counsel are highly confident that a “bump” is available on the LP C Units so that there will be no capital gains tax on future repayments of principal on the Retained Debt (i.e., return of capital on the LP C Units) |
| | • | | if this “bump” is not available, the tax liability is effectively shared by all Boardwalk shareholders as the distributions on the LP C Units will be grossed up for the capital gains tax payable as principal repayments are made on the Retained Debt, resulting in a pro rata reduction to the distributions to the holders of LP B Units (indirectly, Messrs. Sam and Van Kolias) and LP A Units (indirectly, the Public Shareholders) |
| | • | | all of the costs associated with the Retained Debt are satisfied by the distributions on the LP C Units |
| | — | | Boardwalk’s historic liabilities (tax, litigation, environmental and other contingencies) |
| | • | | Boardwalk LP will indemnify Boardwalk in respect of Boardwalk’s historic liabilities such that any realized contingencies are effectively shared pro rata between the LP A Units and LP B Units, therefore effectively all holders of Shares |
36
Preliminary Fairness Analysis
| | | Fairness Analysis – Preliminary Conclusions |
| n | | Subject to the structure of the Arrangement not changing materially from our current understanding, RBC’s preliminary conclusion is that the consideration under the Arrangement is fair from a financial point of view to the Public Shareholders |
| | — | | the REIT Units are expected to trade at levels at or above where the Shares traded prior to the Announcement (adjusted for share price movements of Boardwalk’s peers since the Announcement) |
| | — | | all holders of Shares receive, on a one-for-one basis, either REIT Units or LP B Units that are economically equivalent to and exchangeable for REIT Units |
| | • | | effectively a pro rata distribution to all Boardwalk shareholders of direct or indirect interests in the partnership that will own all of the Company’s properties (nothing left behind) |
| | — | | Boardwalk is not expected to incur any corporate level tax in connection with the Arrangement unless the tax “bump” of the LP C Units or the tax deferral is not achieved |
| | — | | REIT structure is favoured by the capital markets, eliminates income taxation at the entity level and is not expected to result in any material additional costs |
| | — | | Messrs. Sam and Van Kolias will defer capital gains tax in respect of approximately 1/3 of their Shares (those represented by LP B Units rather than REIT Units) but they do not receive any other benefit such as additional tax basis |
| | — | | Messrs. Sam and Van Kolias will have the right to appoint 1 trustee so long as they own at least a 5% equity interest in Boardwalk REIT (fully diluted assuming exchange of LP B Units) |
37
Preliminary Fairness Analysis
Fairness Analysis – Preliminary Conclusions (cont’d)
| n | | Material outstanding items to be confirmed include |
| | — | | confirmation that mortgages on Boardwalk LP’s properties and those that comprise the Retained Debt will continue to be CMHC insured |
| | — | | legal and tax opinions regarding the availability of the tax “bump” on the LP C Units and the tax deferral |
| | — | | process and timing for Messrs. Sam and Van Kolias to divest approximately 2/3 of their Shares and confirmation that this will qualify as a “change of control” for accounting purposes that will permit Boardwalk REIT to write up its assets to fair market value |
| n | | Other outstanding information request items include |
| | — | | details on allocation of the Retained Debt |
| | — | | rental information by property, including in-place rents, market rents and legal rents |
| | — | | information regarding Boardwalk’s current shareholder base (e.g., CDS participants list) |
38
A. Canadian REIT Comparables
39
Canadian REIT Comparables
| | | | | | | | | | | | | | | | | | | | | | | | | | | | | | | | | | | | | | | | | |
| | | | | | | | | | | | | | | | | | | | | | | 2004E Payout Ratio (1) | | | | | | |
| | | Unit | | Market | | FFO Multiple | | Current | | Yield @ | |
| | 2003E Tax | | Debt / | | Debt / |
| Company | | Price(1) | | Cap.(2) | | 2004E(1) | | Yield | | 85% of RDI | | RDI | | AFFO | | Deferral | | Adj. Assets | | Total Cap.(3) |
| |
| |
| |
| |
| |
| |
| |
| |
| |
| |
|
| | | | | | | (C$ millions) | | | | | | | | | | | | | | | | | | | | | | | | | | | | | | | | |
Commercial and Diversified REITS | | | | | | | | | | | | | | | | | | | | | | | | | | | | | | | | | | | | | | | | |
| RioCan | | $ | 14.91 | | | $ | 2,646.3 | | | | 10.8x | | | | 7.6 | % | | | 7.5 | % | | | 86.4 | % | | | 91.2 | % | | | 40 | % | | | 53.1 | % | | | 42.6 | % |
H&R (4) | | $ | 15.47 | | | $ | 1,315.7 | | | | 10.3x | | | | 7.9 | % | | | 8.0 | % | | | 84.4 | % | | | 89.3 | % | | | 50 | % | | | 62.3 | % | | | 53.7 | % |
| Summit | | $ | 17.22 | | | $ | 895.0 | | | | 9.5x | | | | 8.9 | % | | | 8.2 | % | | | 91.6 | % | | | 96.8 | % | | | 60 | % | | | 54.8 | % | | | 49.9 | % |
| CREIT | | $ | 16.01 | | | $ | 833.3 | | | | 10.5x | | | | 7.7 | % | | | 7.5 | % | | | 87.2 | % | | | 89.1 | % | | | 50 | % | | | 51.4 | % | | | 44.4 | % |
| O&Y REIT | | $ | 11.30 | | | $ | 480.7 | | | | 9.3x | | | | 9.7 | % | | | 9.0 | % | | | 91.7 | % | | | 101.9 | % | | | 55 | % | | | 45.1 | % | | | 44.3 | % |
| Dundee | | $ | 23.24 | | | $ | 443.0 | | | na | | | 9.4 | % | | na | | na | | na | | na | | | 55.8 | % | | | 53.3 | % |
| Morguard | | $ | 8.98 | | | $ | 398.6 | | | | 9.0x | | | | 10.0 | % | | | 8.6 | % | | | 98.9 | % | | | 107.1 | % | | | 65 | % | | | 53.1 | % | | | 63.9 | % |
| Cominar | | $ | 14.32 | | | $ | 379.7 | | | | 9.8x | | | | 8.0 | % | | | 7.8 | % | | | 86.4 | % | | | 91.9 | % | | | 50 | % | | | 52.9 | % | | | 43.9 | % |
| IPC US REIT | | $ | 10.49 | | | $ | 339.5 | | | | 8.1x | | | | 8.7 | % | | | 10.3 | % | | | 71.3 | % | | | 79.4 | % | | | 75 | % | | | 60.2 | % | | | 54.6 | % |
| Borealis Retail | | $ | 11.32 | | | $ | 281.9 | | | na | | | 9.1 | % | | na | | na | | na | | | 62 | % | | | 47.1 | % | | | 42.7 | % |
| Northern Properties REIT | | $ | 15.85 | | | $ | 230.7 | | | | 10.8x | | | | 7.3 | % | | | 7.9 | % | | | 78.2 | % | | | 83.9 | % | | | 50 | % | | | 58.7 | % | | | 40.8 | % |
| Alexis Nihon | | $ | 12.25 | | | $ | 207.8 | | | | 10.3x | | | | 9.0 | % | | | 8.0 | % | | | 94.9 | % | | | 107.9 | % | | | 30 | % | | | 49.4 | % | | | 49.5 | % |
| TGS REIT | | $ | 9.60 | | | $ | 161.4 | | | | 7.6x | | | | 10.3 | % | | | 8.1 | % | | | 108.4 | % | | | 96.1 | % | | | 80 | % | | | 53.3 | % | | | 48.1 | % |
| Calloway | | $ | 13.35 | | | $ | 150.9 | | | | 10.0x | | | | 8.6 | % | | | 8.3 | % | | | 88.5 | % | | | 93.6 | % | | | 73 | % | | | 52.2 | % | | | 29.3 | % |
| Allied | | $ | 12.10 | | | $ | 75.1 | | | | 9.2x | | | | 9.1 | % | | | 9.1 | % | | | 84.6 | % | | | 93.2 | % | | | 45 | % | | | 52.4 | % | | | 47.4 | % |
| |
|
Mean | | | | | | | | | | | 9.6x | | | | 8.8 | % | | | 8.3 | % | | | 88.7 | % | | | 94.0 | % | | | 56 | % | | | 53.5 | % | | | 47.2 | % |
Weighted Average | | | | | | | | | | | 9.3x | | | | 8.3 | % | | | 7.4 | % | | | 80.3 | % | | | 85.0 | % | | | 48 | % | | | 54.3 | % | | | 47.3 | % |
|
| |
Residential REITS | | | | | | | | | | | | | | | | | | | | | | | | | | | | | | | | | | | | | | | | |
| Canadian Apartment Properties REIT | | $ | 15.45 | | | $ | 445.5 | | | | 11.8x | | | | 7.0 | % | | | 7.2 | % | | | 82.4 | % | | | 89.3 | % | | | 70 | % | | | 62.1 | % | | | 54.4 | % |
| Residential Equities REIT | | $ | 16.07 | | | $ | 435.3 | | | | 12.0x | | | | 6.7 | % | | | 7.1 | % | | | 80.6 | % | | | 86.4 | % | | | 65 | % | | | 61.7 | % | | | 50.6 | % |
| |
|
Mean | | | | | | | | | | | 11.9x | | | | 6.9 | % | | | 7.1 | % | | | 81.5 | % | | | 87.8 | % | | | 68 | % | | | 61.9 | % | | | 52.5 | % |
|
(1) Unit prices as at December 8, 2003, forward estimates are RBC as at November 25, 2003.
(2) Market capitalization is based on basic units outstanding.
(3) Total capitalization equals market capitalization plus total debt.
(4) Units outstanding are pro forma the 7.1 million unit offering expected to close on or about December 9, 2003, and do not include a 1.065 million unit overallotment option.
40
B. Canadian Multi-Family Residential REITs
41
Canadian Apartment Properties REIT
| n | | Canadian Apartment Properties REIT (“CAP REIT”) is an unincorporated closed-end real estate investment trust |
| n | | CAP REIT is a fully internalized growth-oriented investment trust owning freehold interests in multi-unit residential properties |
| | — | | including apartment buildings and townhouses located in major urban centers across Canada |
| | — | | current average portfolio occupancy at 97.7% |
| n | | CAP REIT has ownership interests in a portfolio that includes 13,234 residential suites across diversified geographic locations |
| n | | Since its IPO in May 1997, CAP REIT has more than tripled its property portfolio and grown monthly distributions by 51% |
| n | | CAP REIT was the first publicly traded multi-family residential REIT in Canada |
| |
| Trading Statistics and Valuation Metrics |
| | | | | | | | | |
(in C$ millions except per unit amounts) | | | | |
Unit Price(1) | | $ | 15.45 | |
| Basic Units Outstanding (millions) | | | 28.8 | |
| Market Capitalization (millions) | | $ | 446 | |
| Enterprise Value (EV in millions) | | $ | 977 | |
| | | | |
| Price to Book | | | 1.6x | |
| Current Yield | | | 7.0 | % |
Implied Capitalization Rate(2) | | | 7.7 | % |
| EV / Suite (thousands) | | $ | 73 | |
Estimated NAV(3) | | $ | 13.85 | |
| Premium (Discount) to NAV | | | 12 | % |
| | | | | |
| | | | 2003E | (3) | | | 2004E | (3) |
| | | |
| | | |
| |
| FFO Multiple | | | 12.3x | | | | 11.8x | |
| RDI Multiple | | | 12.3x | | | | 11.8x | |
| AFFO Multiple | | | 13.3x | | | | 12.8x | |
| Tax Deferral | | | 70.0 | % | | na |
(1) Unit price as at December 8, 2003.
(2) Last quarter annualized NOI divided by EV less non-NOI producing assets.
(3) RBC research.
| | | | | | | | | | | | | | | | | |
| (in C$ millions except per unit amounts) | | 2000A | | 2001A | | 2002A | | LTM 9/03 |
| | |
| |
| |
| |
|
| Revenues | | $ | 78.0 | | | $ | 99.1 | | | $ | 116.0 | | | $ | 129.4 | |
| Net Operating Income (NOI) | | | 42.2 | | | | 53.3 | | | | 63.3 | | | | 69.7 | |
NOI Margin | | | 54.1 | % | | | 53.7 | % | | | 54.5 | % | | | 53.9 | % |
| Net Income | | | 17.9 | | | | 23.1 | | | | 27.6 | | | | 27.3 | |
| Funds from Operations (FFO) | | | 22.3 | | | | 28.9 | | | | 34.9 | | | | 36.5 | |
| Distributable Income (DI) | | | 22.1 | | | | 28.6 | | | | 34.4 | | | | 36.0 | |
| | | | | | | | | | | | | | | | | |
| DI / Unit | | $ | 1.13 | | | $ | 1.18 | | | $ | 1.24 | | | $ | 1.26 | |
| FFO / Unit | | $ | 1.14 | | | $ | 1.20 | | | $ | 1.25 | | | $ | 1.28 | |
| Net Income / Unit | | $ | 0.92 | | | $ | 0.96 | | | $ | 0.99 | | | $ | 0.96 | |
| | | | | | | | | | | | | | | | | |
| Income properties, net | | $ | 522.3 | | | $ | 593.7 | | | $ | 769.9 | | | $ | 807.7 | |
| Cash and equivalents | | | 0.0 | | | | 18.6 | | | | — | | | | 0.0 | |
| Other Assets | | $ | 6.0 | | | $ | 8.9 | | | $ | 13.3 | | | | 18.0 | |
| | | |
| | | |
| | | |
| | | |
| |
| Assets | | $ | 528.3 | | | $ | 621.3 | | | $ | 783.2 | | | $ | 825.7 | |
| | | |
| | | |
| | | |
| | | |
| |
| Mortgages | | $ | 296.5 | | | $ | 351.3 | | | $ | 453.3 | | | $ | 495.3 | |
| Bank debt | | | 12.8 | | | | — | | | | 45.0 | | | | 35.7 | |
| Other Liabilities | | | 14.9 | | | | 16.8 | | | | 21.2 | | | | 24.0 | |
| Unitholders’ Equity | | | 204.1 | | | | 253.2 | | | | 263.7 | | | | 270.7 | |
| | | |
| | | |
| | | |
| | | |
| |
| Total Liabilities and Unitholders’ Equity | | $ | 528.3 | | | $ | 621.3 | | | $ | 783.2 | | | $ | 825.7 | |
| | | |
| | | |
| | | |
| | | |
| |
42
Residential Equities REIT
| n | | Residential Equities REIT (“ResREIT”) is a real estate investment trust specializing in the distribution of tax deferred income from a nationwide portfolio of apartment buildings |
| | — | | owns multi-family rental properties in major urban areas across Canada |
| | — | | larger scale units in desirable, central locations |
| | — | | 64 apartment and townhouse properties containing 10,890 rental suites |
| | — | | current occupancy is 96.1% |
| n | | ResREIT internalized its asset management in 2001, and retains Greenwin Property Management under a property management agreement |
| Trading Statistics and Valuation Metrics |
| | | | | |
(in C$ millions except per unit amounts) | | | | |
Unit Price(1) | | $ | 16.07 | |
| Basic Units Outstanding (millions) | | | 27.1 | |
| Market Capitalization (millions) | | $ | 435 | |
| Enterprise Value (EV in millions) | | $ | 881 | |
| Price to Book | | | 2.2x | |
| Current Yield | | | 6.7 | % |
Implied Capitalization Rate(2) | | | 7.8 | % |
| EV / Suite (thousands) | | $ | 81 | |
Estimated NAV(3) | | $ | 14.55 | |
| Premium (Discount) to NAV | | | 10 | % |
| | | | | | | | | |
| | | 2003E(3) | | 2004E(3) |
| | |
| |
|
| FFO Multiple | | | 12.9x | | | | 12.0x | |
| RDI Multiple | | | 12.9x | | | | 12.0x | |
| AFFO Multiple | | | 13.9x | | | | 12.9x | |
| Tax Deferral | | | 65.0 | % | | na
|
(1) Unit price as at December 8, 2003.
(2) Last quarter annualized NOI divided by EV less non-NOI producing assets.
(3) RBC research.
| | | | | | | | | | | | | | | | | |
| (in C$ millions except per unit amounts) | | 2000A | | 2001A | | 2002A | | LTM 9/03 |
| | |
| |
| |
| |
|
| Revenues | | $ | 96.0 | | | $ | 106.4 | | | $ | 113.3 | | | $ | 122.2 | |
| Net Operating Income (NOI) | | | 48.9 | | | | 53.3 | | | | 58.2 | | | | 61.1 | |
NOI Margin | | | 51.0 | % | | | 50.1 | % | | | 51.4 | % | | | 50.0 | % |
| Net Income | | | 14.9 | | | | 17.0 | | | | 19.6 | | | | 18.4 | |
| Funds from Operations (FFO) | | na
| | | 27.1 | | | | 31.7 | | | | 33.5 | |
| Distributable Income (DI) | | | 24.3 | | | | 27.8 | | | | 32.4 | | | | 33.0 | |
| DI / Unit | | $ | 1.11 | | | $ | 1.17 | | | $ | 1.22 | | | $ | 1.23 | |
| FFO / Unit | | na
| | $ | 1.14 | | | $ | 1.20 | | | $ | 1.25 | |
| Net Income / Unit | | $ | 0.68 | | | $ | 0.71 | | | $ | 0.74 | | | $ | 0.69 | |
| Income properties, net | | $ | 366.6 | | | $ | 401.8 | | | $ | 407.0 | | | $ | 469.4 | |
| Cash and equivalents | | | 1.7 | | | | — | | | | 0.4 | | | | — | |
| Other Assets | | $ | 165.9 | | | $ | 167.0 | | | $ | 199.6 | | | | 195.8 | |
| | | |
| | | |
| | | |
| | | |
| |
| Assets | | $ | 534.1 | | | $ | 568.9 | | | $ | 607.0 | | | $ | 665.2 | |
| | | |
| | | |
| | | |
| | | |
| |
| Mortgages | | $ | 308.0 | | | $ | 339.6 | | | $ | 376.6 | | | $ | 402.3 | |
| Bank debt | | | 22.7 | | | | 8.7 | | | | 6.5 | | | | 43.1 | |
| Other Liabilities | | | 15.1 | | | | 15.0 | | | | 16.4 | | | | 18.3 | |
| Unitholders’ Equity | | | 188.3 | | | | 205.5 | | | | 207.4 | | | | 201.4 | |
| | | |
| | | |
| | | |
| | | |
| |
| Total Liabilities and Unitholders’ Equity | | $ | 534.1 | | | $ | 568.9 | | | $ | 607.0 | | | $ | 665.2 | |
| | | |
| | | |
| | | |
| | | |
| |
43
Potential Trading Value of REIT Units vs. Shares
| | | | | | | | | | | | | | | | | | | | | | | | | | | | | | | | | | | | | | | | | | | | | | | | | |
| | | | | | | | | | | | | | | | | | | | | | | Yield at Payout | | Current |
| | | | | | | | | | | | | | | | | | | | | | | | |
|
| | | Unit / Share | | 2004E | | FFO | | 2004E | | RDI | | Ratio of RDI | | | | | | | | | | Payout % of RDI |
| | | | | | | | | | | | |
| | | | | | | | | |
|
| Company | | Price(1) | | FFO(1) | | Multiple | | RDI(1) | | Multiple | | 80% | | 85% | | 90% | | Payout | | Yield | | 2003E | | 2004E |
| |
| |
| |
| |
| |
| |
| |
| |
| |
| |
| |
| |
|
Residential REITS | | | | | | | | | | | | | | | | | | | | | | | | | | | | | | | | | | | | | | | | | | | | | | | | |
| CAP REIT | | $ | 15.35 | | | $ | 1.31 | | | | 11.7x | | | $ | 1.31 | | | | 11.7x | | | | 6.8 | % | | | 7.3 | % | | | 7.7 | % | | $ | 1.08 | | | | 7.0 | % | | | 86 | % | | | 82 | % |
| ResREIT | | $ | 14.95 | | | $ | 1.34 | | | | 11.2x | | | $ | 1.34 | | | | 11.2x | | | | 7.2 | % | | | 7.6 | % | | | 8.1 | % | | $ | 1.08 | | | | 7.2 | % | | | 86 | % | | | 81 | % |
|
Mean | | | | | | $ | 1.33 | | | | 11.4x | | | $ | 1.33 | | | | 11.4x | | | | 7.0 | % | | | 7.4 | % | | | 7.9 | % | | $ | 1.08 | | | | 7.1 | % | | | 86 | % | | | 82 | % |
|
Scenario 1: Tax Deferral and LP C Bump are Successful | | | | | | | | | | | | | | | | | | | | | | | | | | | | | | | | | | | | | | | | | | | | | | | | |
| Boardwalk REIT (pre-Announcement Share price) | | $ | 15.59 | | | $ | 1.44 | | | | 10.8x | | | $ | 1.49 | | | | 10.5x | | | | 7.6 | % | | | 8.1 | % | | | 8.6 | % | | $ | 1.23 | | | | 7.9 | % | | na
| | | 83 | % |
| Boardwalk REIT (adjusted pre-Announcement Share price) | | $ | 15.06 | | | $ | 1.44 | | | | 10.5x | | | $ | 1.49 | | | | 10.1x | | | | 7.9 | % | | | 8.4 | % | | | 8.9 | % | | $ | 1.23 | | | | 8.2 | % | | na
| | | 83 | % |
| Boardwalk REIT (current Share price) | | $ | 17.69 | | | $ | 1.44 | | | | 12.3x | | | $ | 1.49 | | | | 11.9x | | | | 6.7 | % | | | 7.2 | % | | | 7.6 | % | | $ | 1.23 | | | | 7.0 | % | | na
| | | 83 | % |
Scenario 2: Tax Deferral is Successful and LP C Bump is Unsuccessful(2) | | | | | | | | | | | | | | | | | | | | | | | | | | | | | | | | | | | | | | | | | | | | | | | | |
| Boardwalk REIT (pre-Announcement Share price) | | $ | 15.59 | | | $ | 1.38 | | | | 11.3x | | | $ | 1.43 | | | | 10.9x | | | | 7.3 | % | | | 7.8 | % | | | 8.2 | % | | $ | 1.18 | | | | 7.6 | % | | na
| | | 83 | % |
| Boardwalk REIT (adjusted pre-Announcement Share price) | | $ | 15.06 | | | $ | 1.38 | | | | 10.9x | | | $ | 1.43 | | | | 10.6x | | | | 7.6 | % | | | 8.1 | % | | | 8.5 | % | | $ | 1.18 | | | | 7.8 | % | | na
| | | 83 | % |
| Boardwalk REIT (current Share price) | | $ | 17.69 | | | $ | 1.38 | | | | 12.9x | | | $ | 1.43 | | | | 12.4x | | | | 6.4 | % | | | 6.9 | % | | | 7.3 | % | | $ | 1.18 | | | | 6.7 | % | | na
| | | 83 | % |
Scenario 3: Tax Deferral is Unsuccessful(2)(3) | | | | | | | | | | | | | | | | | | | | | | | | | | | | | | | | | | | | | | | | | | | | | | | | |
| Boardwalk REIT (pre-Annoucement Share price) | | $ | 15.59 | | | $ | 1.32 | | | | 11.9x | | | $ | 1.37 | | | | 11.4x | | | | 7.0 | % | | | 7.4 | % | | | 7.9 | % | | $ | 1.13 | | | | 7.2 | % | | na
| | | 83 | % |
| Boardwalk REIT (adjusted pre-Announcement Share price) | | $ | 15.06 | | | $ | 1.32 | | | | 11.4x | | | $ | 1.37 | | | | 11.0x | | | | 7.3 | % | | | 7.7 | % | | | 8.2 | % | | $ | 1.13 | | | | 7.5 | % | | na
| | | 83 | % |
| Boardwalk REIT (current Share price) | | $ | 17.69 | | | $ | 1.32 | | | | 13.4x | | | $ | 1.37 | | | | 13.0x | | | | 6.2 | % | | | 6.6 | % | | | 6.9 | % | | $ | 1.13 | | | | 6.4 | % | | na
| | | 83 | % |
(1) Unit prices as at January 7, 2004, forward estimates except Boardwalk REIT are from RBC research. Boardwalk REIT forward estimates are company forecasts.
(2) Based on Retained Debt of $434 million, a tax rate of 34.6% and amortization period of the Retained Debt of 22 years.
(3) Assuming that the tax liability is financed with 100% equity priced at $15.06 with 6.5% issue costs assumed. Also reflects the elimination of an estimated $600,000 of capital tax associated with the Retained Debt.