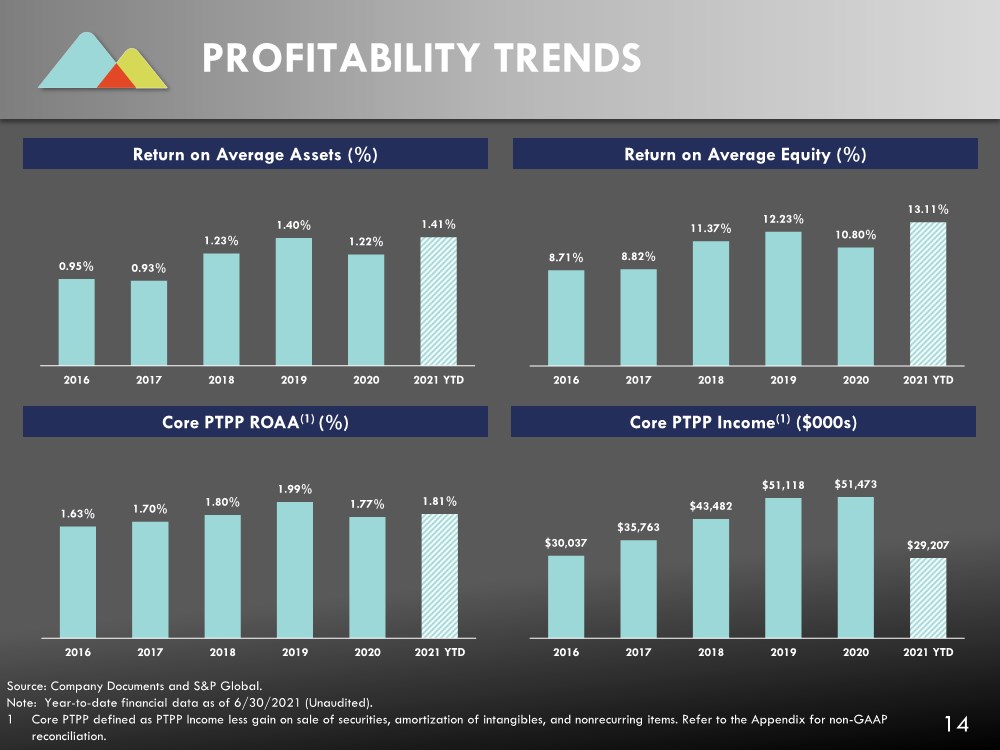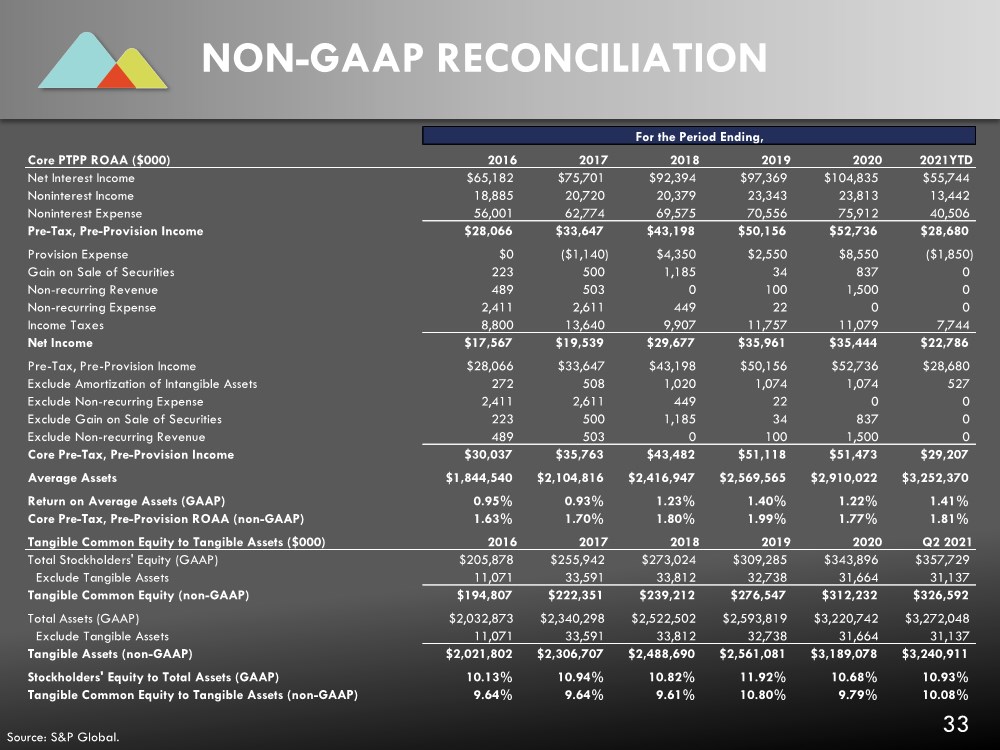
| 33 NON-GAAP RECONCILIATION For the Period Ending, Core PTPP ROAA ($000) 2016 2017 2018 2019 2020 2021YTD Net Interest Income $65,182 $75,701 $92,394 $97,369 $104,835 $55,744 Noninterest Income 18,885 20,720 20,379 23,343 23,813 13,442 Noninterest Expense 56,001 62,774 69,575 70,556 75,912 40,506 Pre-Tax, Pre-Provision Income $28,066 $33,647 $43,198 $50,156 $52,736 $28,680 Provision Expense $0 ($1,140) $4,350 $2,550 $8,550 ($1,850) Gain on Sale of Securities 223 500 1,185 34 837 0 Non-recurring Revenue 489 503 0 100 1,500 0 Non-recurring Expense 2,411 2,611 449 22 0 0 Income Taxes 8,800 13,640 9,907 11,757 11,079 7,744 Net Income $17,567 $19,539 $29,677 $35,961 $35,444 $22,786 Pre-Tax, Pre-Provision Income $28,066 $33,647 $43,198 $50,156 $52,736 $28,680 Exclude Amortization of Intangible Assets 272 508 1,020 1,074 1,074 527 Exclude Non-recurring Expense 2,411 2,611 449 22 0 0 Exclude Gain on Sale of Securities 223 500 1,185 34 837 0 Exclude Non-recurring Revenue 489 503 0 100 1,500 0 Core Pre-Tax, Pre-Provision Income $30,037 $35,763 $43,482 $51,118 $51,473 $29,207 Average Assets $1,844,540 $2,104,816 $2,416,947 $2,569,565 $2,910,022 $3,252,370 Return on Average Assets (GAAP) 0.95% 0.93% 1.23% 1.40% 1.22% 1.41% Core Pre-Tax, Pre-Provision ROAA (non-GAAP) 1.63% 1.70% 1.80% 1.99% 1.77% 1.81% Tangible Common Equity to Tangible Assets ($000) 2016 2017 2018 2019 2020 Q2 2021 Total Stockholders' Equity (GAAP) $205,878 $255,942 $273,024 $309,285 $343,896 $357,729 Exclude Tangible Assets 11,071 33,591 33,812 32,738 31,664 31,137 Tangible Common Equity (non-GAAP) $194,807 $222,351 $239,212 $276,547 $312,232 $326,592 Total Assets (GAAP) $2,032,873 $2,340,298 $2,522,502 $2,593,819 $3,220,742 $3,272,048 Exclude Tangible Assets 11,071 33,591 33,812 32,738 31,664 31,137 Tangible Assets (non-GAAP) $2,021,802 $2,306,707 $2,488,690 $2,561,081 $3,189,078 $3,240,911 Stockholders' Equity to Total Assets (GAAP) 10.13% 10.94% 10.82% 11.92% 10.68% 10.93% Tangible Common Equity to Tangible Assets (non-GAAP) 9.64% 9.64% 9.61% 10.80% 9.79% 10.08% Source: S&P Global. |