 The Benefits of a Diversified Electric & Natural Gas Portfolio NYSE: CNP CenterPointEnergy.com Full Year 2013 Earnings Supplemental Materials February 26, 2014 Exhibit 99.1 |
 February 26, 2014 2 Year End 2013 Supplemental Materials Cautionary Statement Regarding Forward-Looking Information We have based our forward-looking statements on our management's beliefs and assumptions based on information currently available to our management at the time the statements are made. We caution you that assumptions, beliefs, expectations, intentions, and projections about future events may and often do vary materially from actual results. Therefore, we cannot assure you that actual results will not differ materially from those expressed or implied by our forward-looking statements. Some of the factors that could cause actual results to differ from those expressed or implied by our forward-looking statements include the timing and impact of future regulatory, legislative and IRS decisions, financial market conditions, future market conditions, and other factors described in CenterPoint Energy, Inc.’s Form 10-K for the period ended December 31, 2013, under “Risk Factors” and “Management’s Discussion and Analysis of Financial Condition and Results of Operations - Certain Factors Affecting Future Earnings”, and in other filings with the SEC by CenterPoint Energy. You should not place undue reliance on forward-looking statements. Each forward-looking statement speaks only as of the date of this presentation, and we undertake no obligation to publicly update or revise any forward-looking statements except as required by law. This presentation contains statements concerning our expectations, beliefs, plans, objectives, goals, strategies, future events or performance and underlying assumptions and other statements that are not historical facts. These statements are “forward-looking statements” within the meaning of the Private Securities Litigation Reform Act of 1995. Actual results may differ materially from those expressed or implied by these statements. You can generally identify our forward-looking statements by the words “anticipate,” “believe,” “continue,” “could,” “estimate,” “expect,” “forecast,” “goal,” “intend,” “may,” “objective,” “plan,” “potential,” “predict,” “projection,” “should,” “will,” or other similar words. |
 February 26, 2014 3 Year End 2013 Supplemental Materials • Scott M. Prochazka named President and CEO • Total shareholder return of 24.7% compared to S&P 500 Utility Index of 13.2% • Strong financial and operational performances from our utility businesses Sustained strong economic activity with the addition of approximately 45,000 customers and continued 3 rd party interest in access to our transmission rights-of-way for our electric utility Rate changes and cost management efforts led to one of the strongest overall performances for our natural gas utilities Invested nearly $1.2 billion in our utility operations, up 22 percent from 2012, to address increasing demands associated with system safety, reliability, growth and ongoing maintenance • Formed Enable Midstream Partners with contribution of Interstate Pipelines and Field Services businesses On-going ownership interest in Enable Midstream is expected to provide attractive investment returns and cash flows • Consolidated external debt reduction of approximately $1 billion resulting in savings of approximately $71 million of annualized interest expense, excluding securitization bonds • Increased dividend 14.5% in January 2014, resulting in 9 consecutive years of dividend growth 2013 Year Highlights |
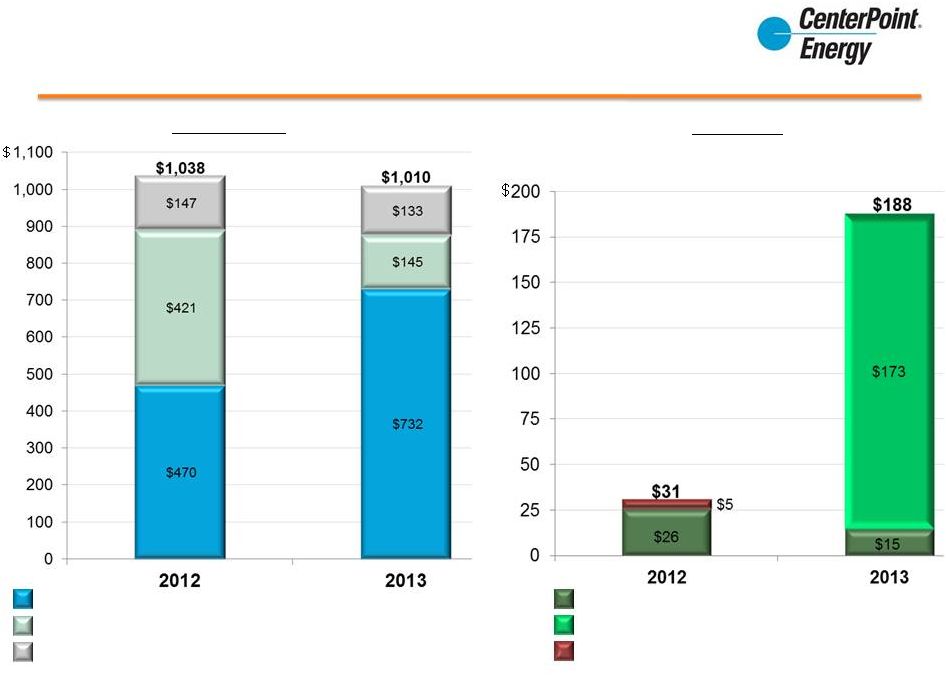 2013 Financial Results Midstream Operating Income moved to Equity Income on May 1, 2013 2012 CEHE, Gas Operations, CES and Other Op Income Field Services, Interstate Pipelines Op Income ($, millions) Transition & Restoration Bond Company Op Income Includes $252 CES Goodwill Impairment As reported, 12 months ended December 31 Waskom Gas Processing Company South East Supply Header, LLC Enable Midstream Partners, LLC Operating Income Equity Income • For the full year 2012, CenterPoint Energy held a 50% interest in the Southeast Supply Header, LLC (SESH) • On July 31, 2012 CenterPoint Energy Field Services acquired the remaining 50% interest in Waskom Gas Processing; earnings were reported as operating income effective August 1, 2012 • On May 1, 2013, CenterPoint Energy formed Enable Midstream Partners, which includes CenterPoint Energy’s former Interstate Pipelines and Field Services segments and a 24.95% interest in SESH • Effective May 1, 2013 midstream operations are reported as Equity Income as part of CenterPoint Energy’s midstream investment segment • For the four months ended April 30, 2013, CenterPoint Energy maintained 50% ownership interest in SESH and its results are reported as Equity Income • For the eight months May 1 to December 31, 2013, CenterPoint Energy retained 25.05% ownership interest in SESH and its results are reported as Equity Income $ February 26, 2014 4 Year End 2013 Supplemental Materials |
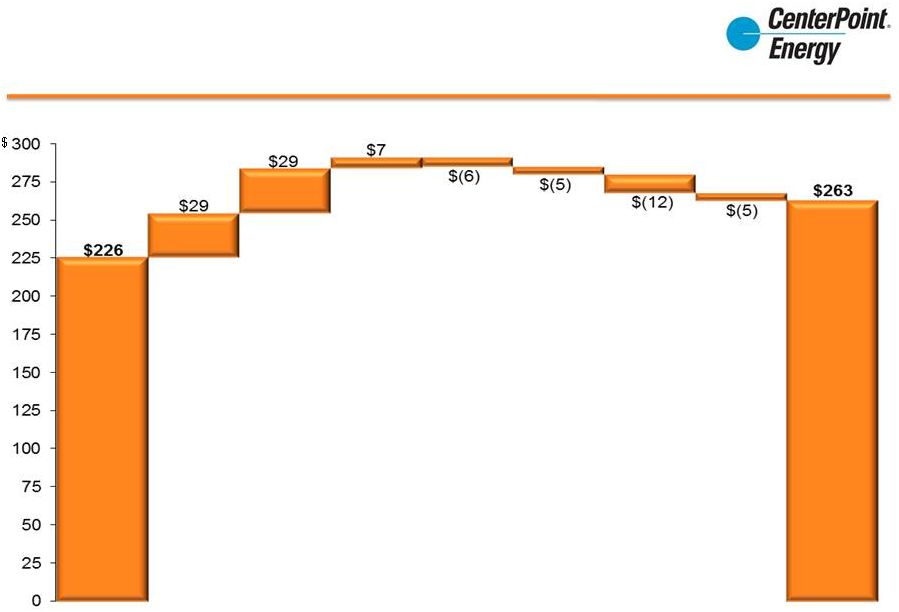
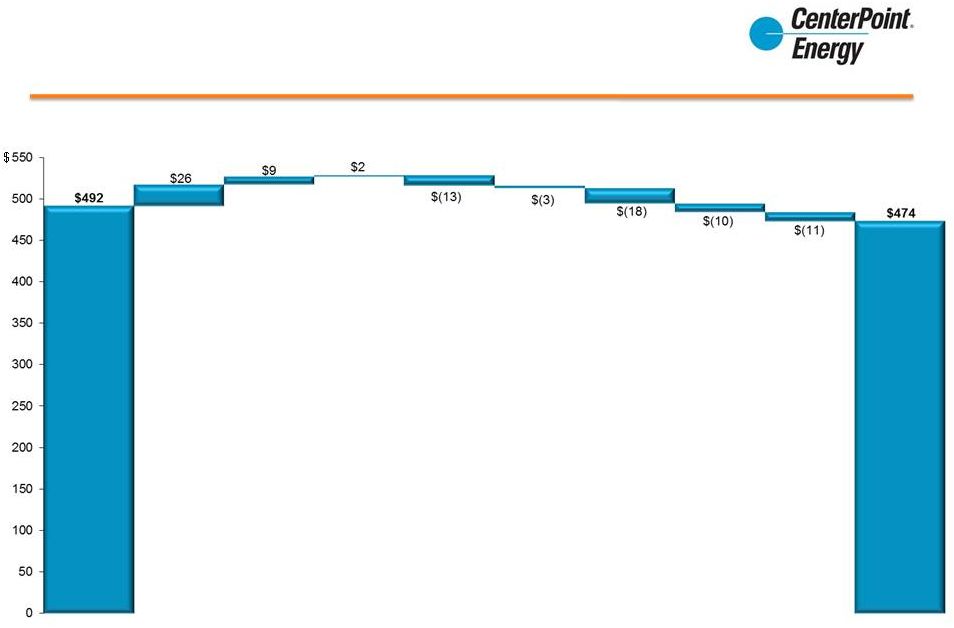 February 26, 2014 5 Year End 2013 Supplemental Materials Electric Transmission & Distribution Utility 2013 Operating Income Drivers 43% ($, millions) Higher transmission related revenues, net of costs billed by other transmission providers Growth Higher right-of-way revenue Lower usage primarily due to weather, net of winter weather hedge Lower True-up related equity return Higher O&M, including employee, contractor and insurance related expenses Higher Depreciation Higher Taxes, mostly property * Excludes operating income from transition and system restoration bonds of $147 million in 2012 and $133 million in 2013 2013 2012 $ |
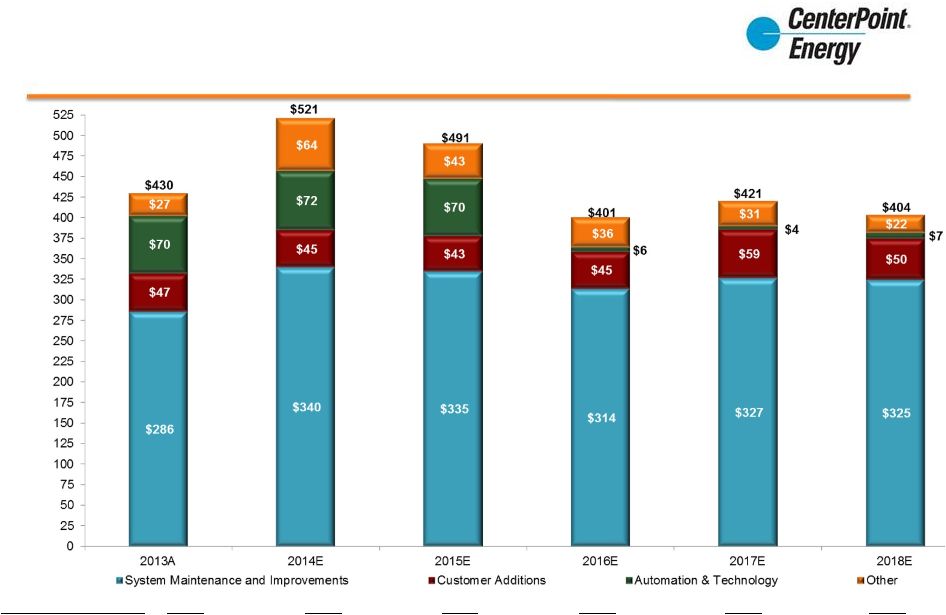
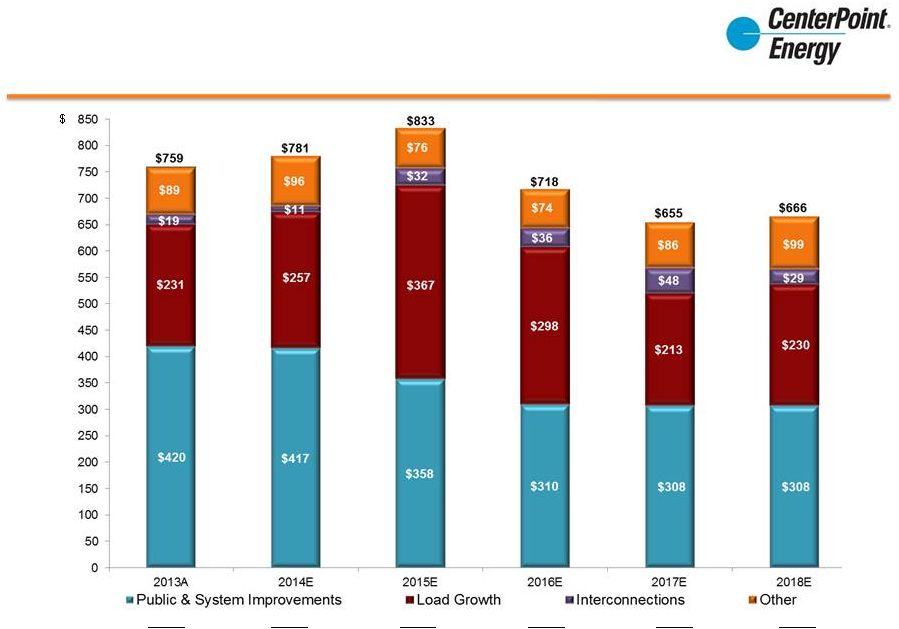 February 26, 2014 6 Year End 2013 Supplemental Materials Electric Transmission & Distribution Utility Capital Expenditures Expectations ($, millions) 2013A 2014E 2015E 2016E 2017E 2018E Transmission 45% 34% 42% 37% 29% 28% Distribution 49% 61% 55% 60% 66% 67% |
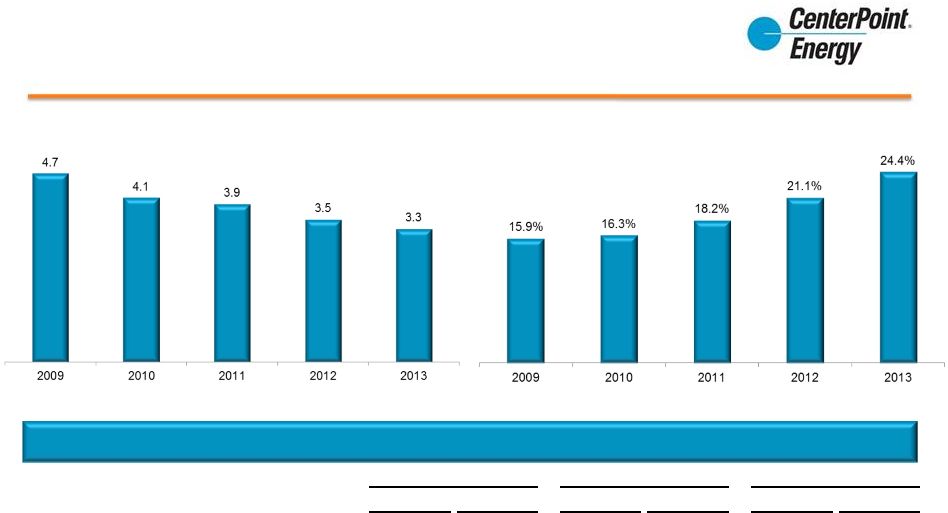
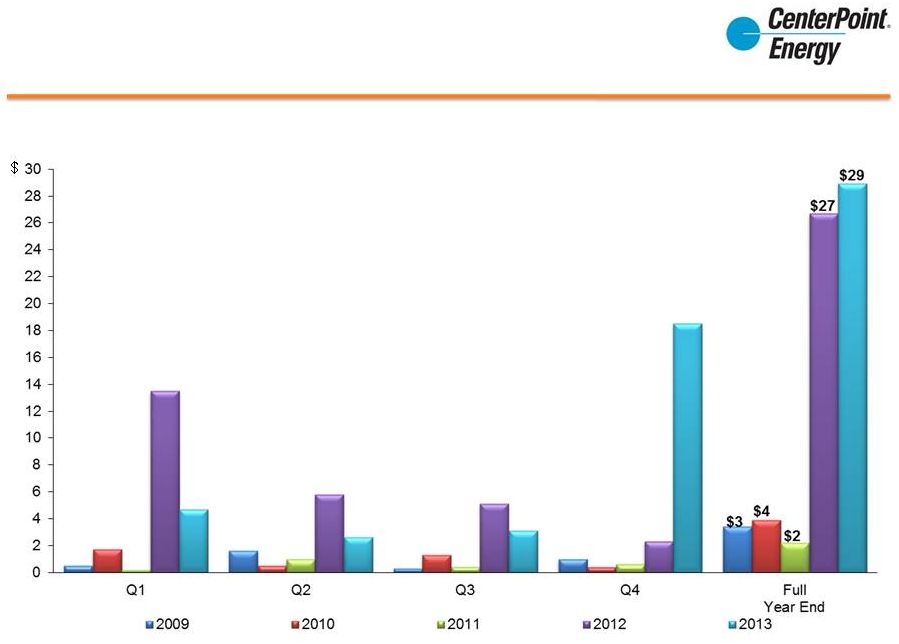 February 26, 2014 7 Year End 2013 Supplemental Materials Electric Transmission & Distribution Utility Rights-of-Way Revenue $ ($, millions) |
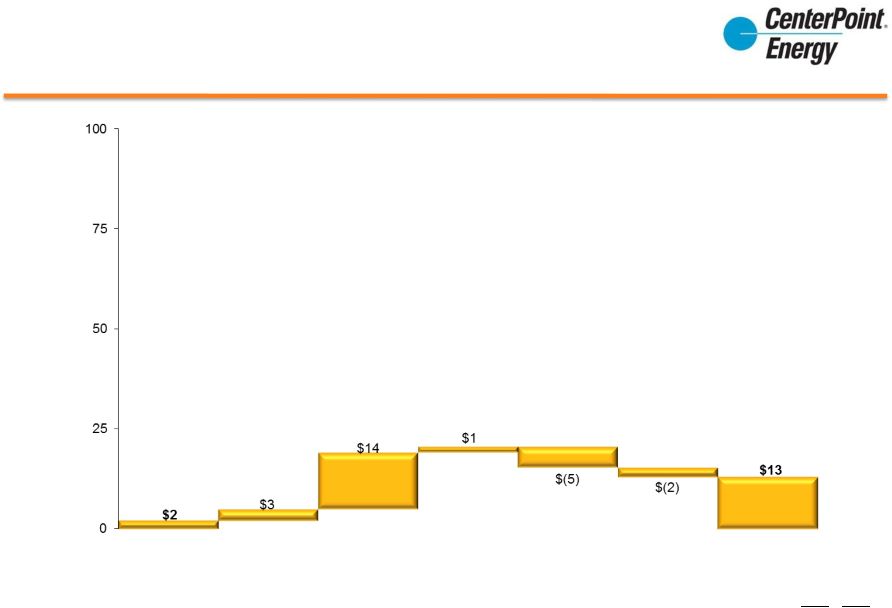
 February 26, 2014 8 Year End 2013 Supplemental Materials Natural Gas Utilities 2013 Operating Income Drivers ($, millions) Increased revenues, due to a return to more normal weather in 2013 vs. 2012, net of weather hedge and WNA Higher O&M, Employee & Contractor related expenses Higher O&M, Bad Debt Higher Depreciation Higher Taxes, mostly property Rate Increases 2012 2013 Growth $ |
 February 26, 2014 9 Year End 2013 Supplemental Materials Natural Gas Utilities Capital Expenditures Expectations ($, millions) $ Note: Annual mechanisms reduce the recovery lag time versus traditional rate cases. Capital Recovery Method 2013A 2014E 2015E 2016E 2017E 2018E Annual Mechanisms 48% 45% 50% 32% 51% 53% Rate Cases 52% 55% 50% 68% 49% 47% |
 CenterPoint Energy Services 2013 Operating Income Drivers ($, millions) * Excludes 2012’s $252 Goodwill Impairment Charge 2013 2012 Mark-to-Market Accounting $(2) $(16) Goodwill Impairment Charge $0 $252 2012 $ Higher base margin 2012 divestiture of non- strategic business Positive impact of mark-to- market accounting Lower O&M 2013 2013 exit non-strategic assets 10 February 26, 2014 Year End 2013 Supplemental Materials |
 February 26, 2014 Year End 2013 Supplemental Materials Debt and Capitalization Ratio Excluding transition and system restoration bonds * The transition and system restoration bonds are non-recourse to CenterPoint Energy and CenterPoint Energy Houston Electric and are serviced through collections of separate charges which are held in trust. ** The debt component reflected on the financial statements was $138 million as of December 31, 2012, and $143 million as of December 31, 2013. The principal amount on which 2% interest is paid was $840 million as of December 31, 2012, and $828 million as of December 31, 2013. The contingent principal amount was $784 million as of December 31, 2012, and $763 million as of December 31, 2013. ($, millions) 11 December 31, December 31, 2013 2012 Short-term Debt: Short-term borrowings 43 $ 38 $ Current portion of transition and system restoration bonds* 354 447 Indexed debt (ZENS)** 143 138 Current portion of other long-term debt - 815 Long-term Debt: Transition and system restoration bonds* 3,046 3,400 Other 4,771 4,957 Total Debt 8,357 $ 9,795 $ Less: Transition and system restoration bonds (including current portion)* 3,400 3,847 Total Debt, excluding transition and system restoration bonds 4,957 $ 5,948 $ Total Shareholders' Equity 4,329 $ 4,301 $ Total Capitalization, excluding transition and system restoration bonds 9,286 $ 10,249 $ Total Debt/Total Capitalization, excluding transition and system restoration bonds 53.4% 58.0% |
 Credit Metrics and Ratings (1) General mortgage bonds and first mortgage bonds. (a) Moody's rating outlook is an opinion regarding the likely direction of a rating over the medium term. (b) S&P rating outlook assesses the potential direction of a long-term credit rating over the intermediate to longer term. Total Debt / EBITDA* FFO / Total Debt* Rating Outlook a Rating Outlook b Rating Outlook c CenterPoint Energy (Senior Unsecured) Baa1 Stable BBB+ Stable BBB Stable CEHE (Senior Secured) (1) A1 Stable A Stable A Stable CERC (Senior Unsecured) Baa2 Stable A- Stable BBB Stable Moody’s S&P Fitch Credit Ratings February 26, 2014 12 Year End 2013 Supplemental Materials (c) Fitch rating outlook encompasses a one- to two-year horizon as to the likely ratings direction. * Calculated per the company’s interpretation of S&P’s revised methodology. In 2013, S&P revised their methodology. S&P’s calculations may vary. |
 February 26, 2014 13 Year End 2013 Supplemental Materials Liquidity Available Liquidity ($MM) Amount Utilized Amount Unutilized at 2/14/2014 at 2/14/2014 CenterPoint Energy Revolver 1,200 $ 6 $ 1,194 $ CEHE Revolver 300 $ 4 $ 296 $ CERC Revolver 600 $ - $ 600 $ Total Facilities 2,100 $ 10 $ 2,090 $ 104 $ 2,194 $ Total Available Liquidity Bank Facilities Type Size Temporary Investments Investments in Money Market Funds |
 Estimated Amortization for Pre-Tax Equity Earnings Associated with the Recovery of Certain Qualified Cost and Storm Restoration Costs the pre-tax equity return recognized by CenterPoint Energy, Inc. (CenterPoint Energy) during each of the years 2005 through 2013 related to CenterPoint Energy Houston Electric, LLC’s (CEHE) recovery of certain qualified costs or storm restoration costs, as applicable, pursuant to the past issuance of transition bonds by CenterPoint Energy Transition Bond Company II, LLC (Transition BondCo II) and CenterPoint Energy Transition Bond Company III, LLC (Transition BondCo III) or CenterPoint Energy Transition Bond Company IV, LLC (Transition BondCo IV) or system restoration bonds by CenterPoint Energy Restoration Bond Company, LLC (System Restoration BondCo), as applicable and the estimated pre-tax equity return currently expected to be recognized in each of the years 2014 through 2024 related to CEHE’s recovery of certain qualified costs or storm restoration costs, as applicable, pursuant to the past issuance of transition bonds by Transition BondCo II, Transition BondCo III or Transition BondCo IV or system restoration bonds by System Restoration BondCo, as applicable. The amounts reflected for 2014 through 2024 are based on CenterPoint Energy’s estimates as of December 31, 2013. However, the equity returns to be recognized in future periods with respect to each series of transition or system restoration bonds, as applicable, will be periodically subject to adjustment based on tariff adjustments for any overcollections or undercollections of transition charges or system restoration charges, as applicable. The equity return amounts reflected in the table are reported in the financial statements of CenterPoint Energy and CenterPoint Energy Houston Electric as revenues from electric transmission and distribution utility. The return associated with the equity earnings was predetermined at the time of the recovery authorization. Thus, it is not a measure of the business’s operating performance. As of December 31, 2013 February 26, 2014 14 Year End 2013 Supplemental Materials TBC II TBC III TBC IV SRBC Total 2005 213,804 $ - $ - $ - $ 213,804 $ 2006 6,644,004 - - - 6,644,004 2007 7,140,194 - - - 7,140,194 2008 6,673,765 4,743,048 - - 11,416,813 2009 7,279,677 6,074,697 - 95,841 13,450,215 2010 9,071,326 5,745,580 - 2,657,384 17,474,290 2011 9,902,590 6,994,650 - 2,840,737 19,737,977 2012 9,717,059 6,837,290 27,873,514 2,473,992 46,901,855 2013 10,383,183 7,251,470 24,082,419 2,235,567 43,952,639 2014 10,181,329 8,086,631 29,318,866 2,651,149 50,237,975 2015 11,664,668 8,347,851 28,800,136 2,689,677 51,502,332 2016 12,552,207 8,915,234 29,613,821 2,823,299 53,904,562 2017 13,492,992 9,551,669 30,264,175 2,972,822 56,281,657 2018 14,500,296 10,257,427 31,182,774 3,143,769 59,084,265 2019 8,232,954 10,607,493 32,235,549 3,339,656 54,415,652 2020 - 922,924 33,302,867 3,534,938 37,760,730 2021 - - 34,551,734 3,733,470 38,285,204 2022 - - 35,917,932 2,262,251 38,180,183 2023 - - 37,343,525 - 37,343,525 2024 - - 30,297,799 - 30,297,799 137,650,048 $ 94,335,964 $ 404,785,110 $ 37,454,553 $ 674,225,675 $ The table provides 1) 2) |