 • Strong utility performance despite milder weather • Midstream Investments delivers earnings contributions in-line with expectations • Company reaffirms full year guidance of $1.12 to $1.20 1 Quarter 2016 Earnings Call May 10, 2016 Exhibit 99.2 st |
 investors.centerpointenergy.com investors.centerpointenergy.com 2 Cautionary Statement This presentation and the oral statements made in connection herewith contain statements concerning our expectations, beliefs, plans, objectives, goals, strategies, future operations, events, financial position, earnings, growth, costs, prospects capital investments or performance or underlying assumptions (including future regulatory filings and recovery, liquidity, capital resources, balance sheet, cash flow, capital investments and management, financing costs, and rate base or customer growth) and other statements that are not historical facts. These statements are “forward-looking statements” within the meaning of the Private Securities Litigation Reform Act of 1995. You should not place undue reliance on forward-looking statements. Actual results may differ materially from those expressed or implied by these statements. You can generally identify our forward-looking statements by the words “anticipate,” “believe,” “continue,” “could,” “estimate,” “expect,” “forecast,” “goal,” “intend,” “may,” “objective,” “plan,” “potential,” “predict,” “projection,” “should,” “will,” or other similar words. The absence of these words, however, does not mean that the statements are not forward-looking. Examples of forward-looking statements in this presentation include statements about our Continuum acquisition, including statements about future financial performance, margin and operating income and growth, guidance , including earnings and dividend growth, future financing plans and expectation for liquidity and capital resources, tax rates and interest rates, among other statements. We have based our forward-looking statements on our management's beliefs and assumptions based on information currently available to our management at the time the statements are made. We caution you that assumptions, beliefs, expectations, intentions, and projections about future events may and often do vary materially from actual results. Therefore, we cannot assure you that actual results will not differ materially from those expressed or implied by our forward-looking statements. Some of the factors that could cause actual results to differ from those expressed or implied by our forward-looking statements include but are not limited to the timing and impact of future regulatory, legislative and IRS decisions, financial market conditions, future market conditions, economic and employment conditions, customer growth, Enable Midstream’s performance and ability to pay distributions, and other factors described in CenterPoint Energy, Inc.’s Form 10-Q for the period ended March 31, 2016 under “Risk Factors” and “Management’s Discussion and Analysis of Financial Condition and Results of Operations - Certain Factors Affecting Future Earnings” and in other filings with the SEC by CenterPoint Energy, which can be found at www.centerpointenergy.com on the Investor Relations page or on the SEC’s website at www.sec.gov. This presentation contains time sensitive information that is accurate as of the date hereof. Some of the information in this presentation is unaudited and may be subject to change. We undertake no obligation to update the information presented herein except as required by law. Investors and others should note that we may announce material information using SEC filings, press releases, public conference calls, webcasts and the Investors page of our website. In the future, we will continue to use these channels to distribute material information about the Company and to communicate important information about the Company, key personnel, corporate initiatives, regulatory updates and other matters. Information that we post on our website could be deemed material; therefore, we encourage investors, the media, our customers, business partners and others interested in our Company to review the information we post on our website. Use of Non-GAAP Financial Measures In addition to presenting its financial results in accordance with generally accepted accounting principles (“GAAP”), CenterPoint Energy also provides guidance based on adjusted diluted earnings per share, which is a non-GAAP financial measure. Generally, a non-GAAP financial measure is a numerical measure of a company’s historical or future financial performance that excludes or includes amounts that are not normally excluded or included in the most directly comparable GAAP financial measure. A full reconciliation of net income and diluted earnings per share to the basis used in providing guidance is provided in this presentation on slide 21. These non-GAAP financial measures should be considered as a supplement and complement to, and not as a substitute for, or superior to, the most directly comparable GAAP financial measure and may be different than non-GAAP financial measures used by other companies. Management evaluates financial performance in part based on adjusted diluted earnings per share and believes that presenting this non-GAAP financial measure enhances an investor’s understanding of CenterPoint Energy’s overall financial performance by providing them with an additional meaningful and relevant comparison of current and anticipated future results across periods by excluding items that Management does not believe most accurately reflect its fundamental business performance, which include items reflected in the reconciliation table on slide 21 of this presentation. This non-GAAP financial measure should be considered as a supplement and complement to, and not as a substitute for, or superior to, the most directly comparable GAAP financial measure and may be different than non-GAAP financial measures used by other companies. |
 investors.centerpointenergy.com 3 Earnings Call Highlights First Quarter Performance Highlights Full-Year Outlook Enable Midstream Highlights Scott Prochazka – President and CEO |
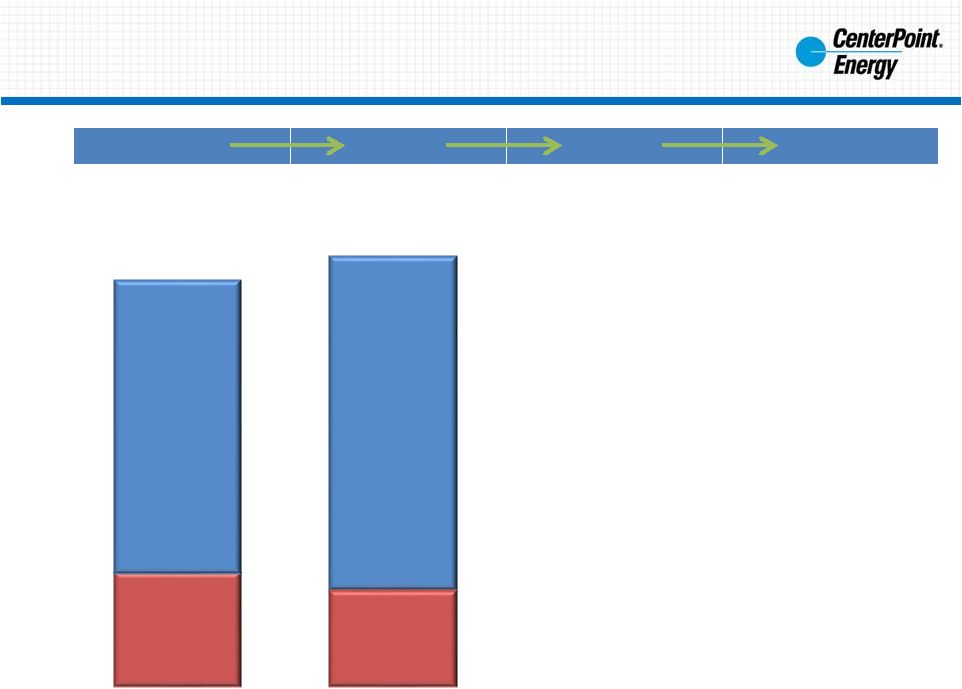
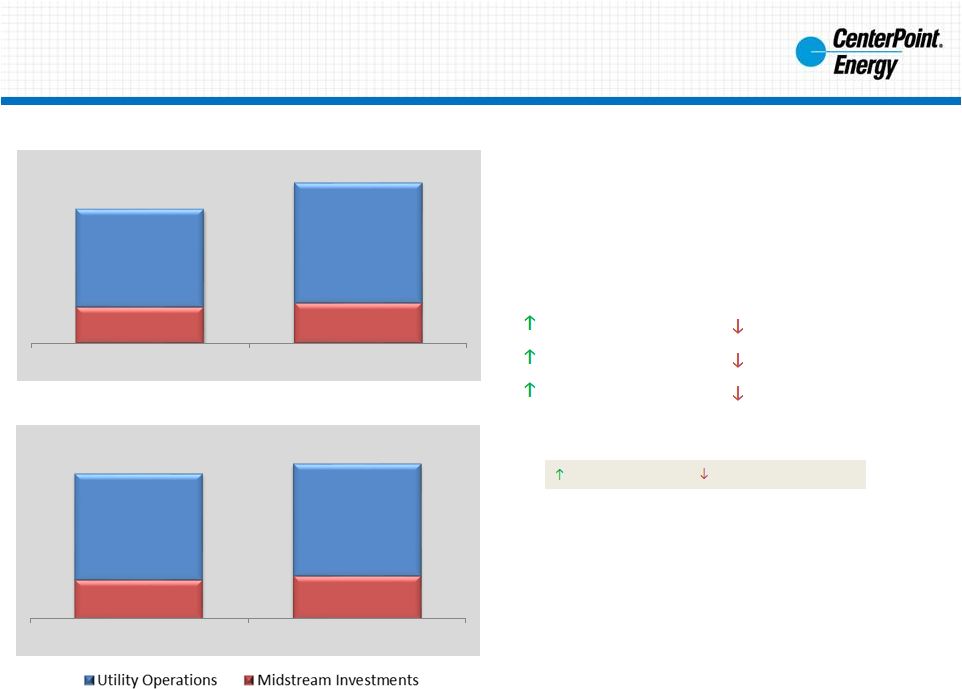 investors.centerpointenergy.com 4 First Quarter 2016 Performance Highlights Note: Refer to slide 21 for reconciliation to GAAP measures and slide 2 for information on non-GAAP measures Q1 2016 vs Q1 2015 Drivers (EPS on a Guidance Basis) Favorable Variance Unfavorable Variance Rate Relief Customer Growth Midstream Investments Depreciation O&M Expenses Weather Related Usage Q1 GAAP EPS Q1 EPS on a Guidance Basis $0.08 $0.09 $0.22 $0.27 2015 2016 $0.30 $0.36 $0.08 $0.09 $0.22 $0.23 2015 2016 $0.30 $0.32 |
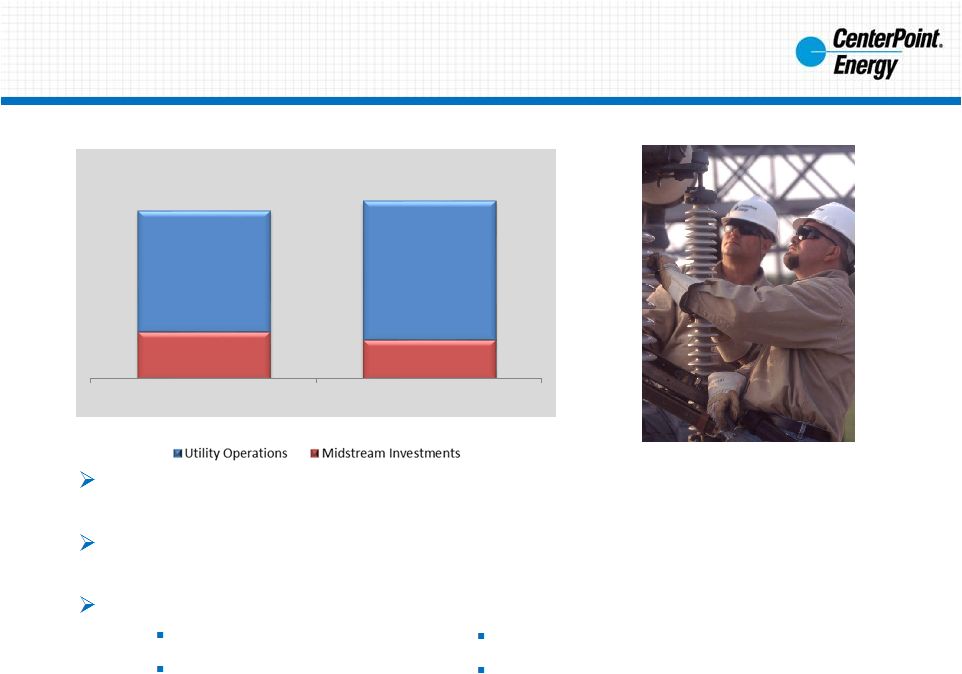 investors.centerpointenergy.com $0.31 $0.24 - $0.28 $0.79 $0.88 - $0.92 2015 2016 5 Full-Year Outlook Our focus remains to invest in our current utility service territories to address ongoing growth, maintenance, reliability, safety and customer service Earnings from Utility Operations are expected to represent 75% - 80% of overall earnings in 2016 We anticipate 2016 Utility Operations earnings growth will be driven by: Note: Refer to slide 2 for information on non-GAAP measures 2016 Guidance Range vs. 2015 EPS on a Guidance Basis $1.12 - $1.20 $1.10 Effective capital management Optimization of financing costs Customer and sales growth Efficient rate recovery |
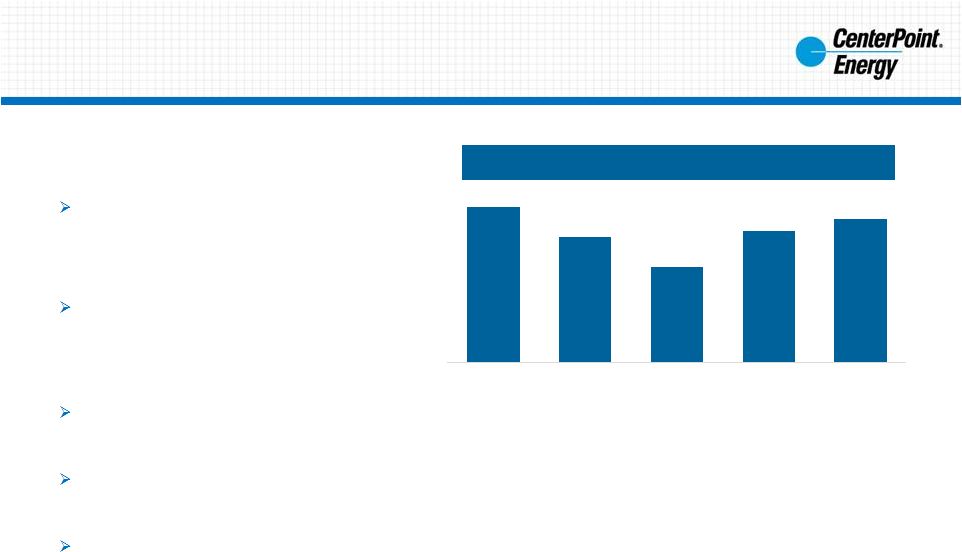 investors.centerpointenergy.com 6 Enable Midstream Highlights Source: Enable Midstream Partners, May 4, 2016, Press Release and Q1 Earnings Call. Please refer to these materials for an overview of Enable’s Q1 Performance. (1) As of the end of each quarter; as of April 12, 2016 there were 22 active rigs contractually dedicated to Enable’s gathering and processing system in the SCOOP and STACK plays (2) Available liquidity calculated as Revolving Credit Facility of $1.75B less principal advances of $715MM, less $3MM in letters of credit Active Rigs Connected to Enable in SCOOP/STACK (1) 26 21 16 22 24 1Q 2015 2Q 2015 3Q 2015 4Q 2015 1Q 2016 Enable Q1 2016 Performance Announced a first quarter 2016 cash distribution of $0.318 per common and subordinated unit Increased first quarter 2016 per-day natural gas processed volumes by 6% compared to first quarter 2015 Increased first quarter 2016 crude oil gathered volumes by 22.1 MBbl/d compared to first quarter 2015 and by 5.8 MBbl/d compared to fourth quarter 2015 Enable has $1.03 billion of available liquidity (2) and achieved a first quarter 2016 distribution coverage ratio greater than 1.0x Enable continues to monitor customer activity levels and is focused on deploying capital efficiently |
 investors.centerpointenergy.com 7 Earnings Call Highlights Houston Electric Results Houston Electric Growth A Houston Electric lineman working on lines damaged by storms the week of April 17 th Tracy Bridge – EVP & President, Electric Division |
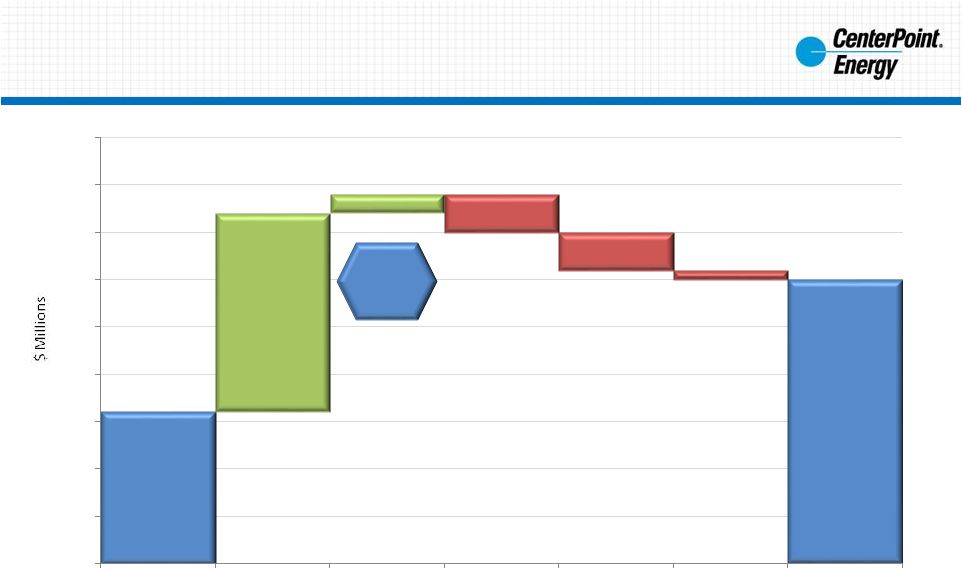
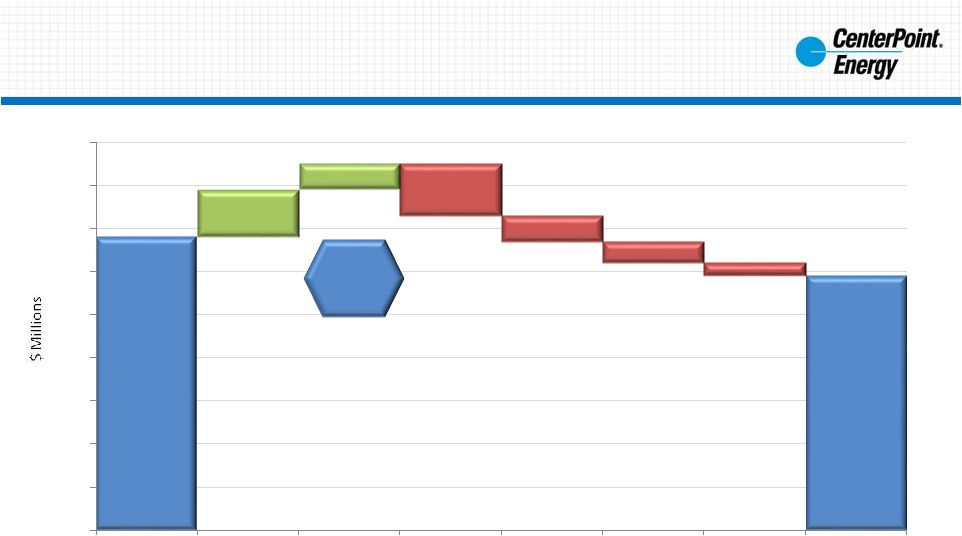 investors.centerpointenergy.com $68 $59 $11 $6 ($12) ($6) ($5) ($3) $- $10 $20 $30 $40 $50 $60 $70 $80 $90 Q1 2015 TDU Core Operating Income Rate relief Customer growth Depreciation Right of way revenue O&M expense Other Q1 2016 TDU Core Operating Income (1) Houston Electric’s customer count increased from 2,310,706 as of March 31, 2015, to 2,364,784 as of March 31, 2016 (2) 2015 TDU core operating income represents total segment operating income of $96 million, excluding operating income from transition and system restoration bonds of $28 million (3) Net transmission related revenue (4) Primarily due to weather-related usage (5) 2016 TDU core operating income represents total segment operating income of $83 million, excluding operating income from transition and system restoration bonds of $24 million 2% YoY Customer Growth (1) (2) (3) (5) Electric Transmission and Distribution Operating Income Drivers: Q1 2015 vs Q1 2016 8 (4) |
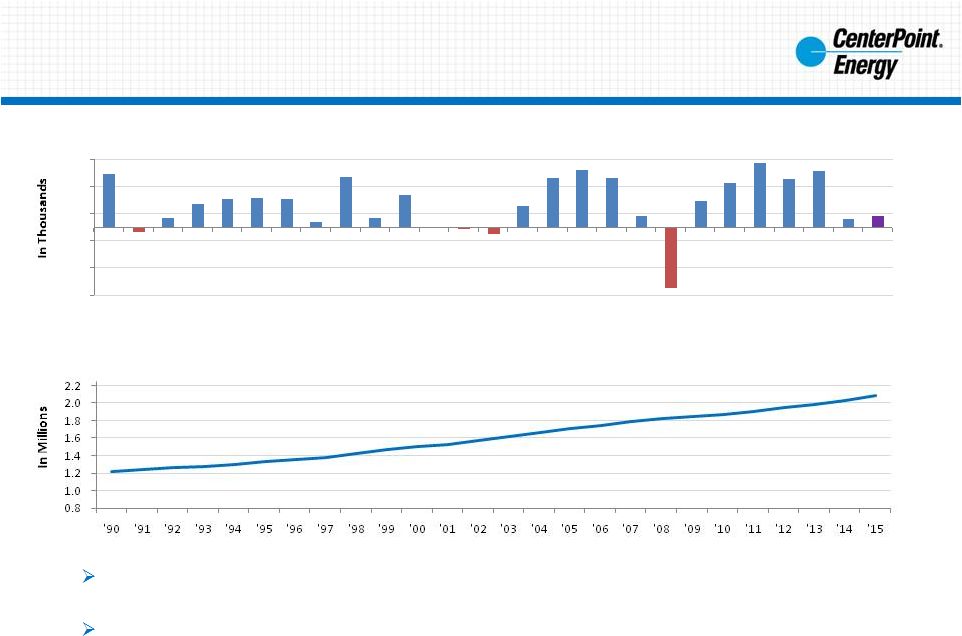 investors.centerpointenergy.com Houston Electric Residential Meter Count (3) 9 Houston Electric Growth -125 -75 -25 25 75 125 '90 '91 '92 '93 '94 '95 '96 '97 '98 '99 '00 '01 '02 '03 '04 '05 '06 '07 '08 '09 '10 '11 '12 '13 '14 '15 '16 December to December Houston Job Growth (1,2) (1) Job growth data from the Texas Workforce Commission (2) 2016 job growth forecast from the Greater Houston Partnership (3) Meter count data from CenterPoint Energy (4) Houston population growth from the U.S. Census Bureau In 2015, metro Houston led the nation in population growth, adding 159,000 residents (more than Dallas or Atlanta) (4) CenterPoint had in excess of 2% meter growth year-over-year, as of the 1 st quarter of 2016 |
 investors.centerpointenergy.com 10 2015 Minnesota Beltline Replacement Project in downtown Minneapolis Earnings Call Highlights Gas Utilities Results Energy Services Results o Acquisition of Continuum Retail Energy Services Joe McGoldrick – EVP & President, Gas Division |
 investors.centerpointenergy.com $146 $160 $21 $2 ($4) ($4) ($1) $130 $135 $140 $145 $150 $155 $160 $165 $170 $175 Q1 2015 Gas Utility Operating Income Rate relief Customer growth Usage, primarily weather Depreciation Other Q1 2016 Gas Utility Operating Income 11 1% YoY Customer Growth (1) (1) Natural Gas Utilities’ customer count increased from 3,389,148 on March 31, 2015, to 3,417,875 on March 31, 2016 (2) Primarily due to higher labor and benefits expenses (2) Natural Gas Utilities Operating Income Drivers: Q1 2015 vs Q1 2016 |
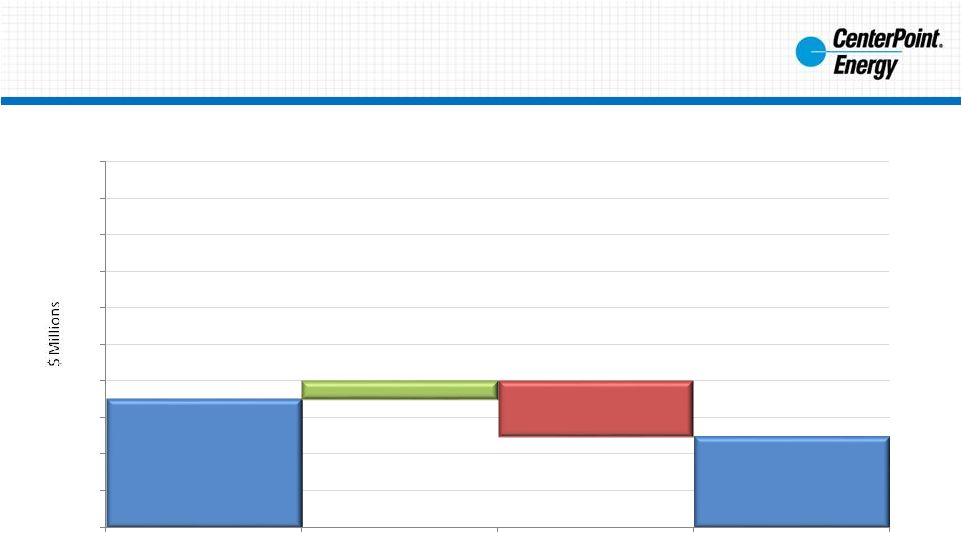 investors.centerpointenergy.com $17 $15 $1 ($3) $10 $12 $14 $16 $18 $20 $22 $24 $26 $28 $30 Q1 2015 Energy Services Operating Income Other Margin Q1 2016 Energy Services Operating Income 12 (1) (3,4) (1) Operating income as reported in Q1 2015 was $13 million. Chart excludes mark-to-market loss of $4 million. (2) Primarily due to lower O&M expenses (3) Excludes energy services business acquired from Continuum; acquisition closed on April 1, 2016 (4) Operating income as reported in Q1 2016 was $6 million. Chart excludes mark-to-market loss of $9 million. Energy Services Operating Income Drivers: Q1 2015 vs Q1 2016 (2) |
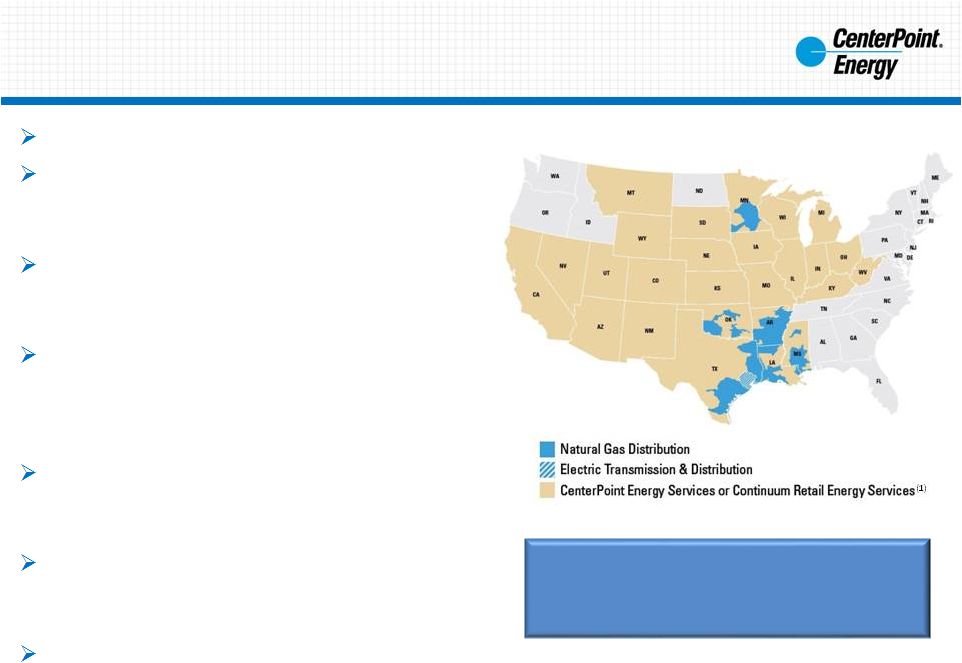 investors.centerpointenergy.com CenterPoint Energy Services Acquires Continuum’s Retail Energy Services Business Acquisition closed on April 1, 2016 Acquisition includes Continuum’s retail business, Choice customers, and origination & logistics assets Aggregate purchase price of $77.5 million plus working capital and customary post-closing purchase price adjustments Acquisition complements overall natural gas strategy and increases Energy Services’ commercial and industrial customer base by over 30% Expanded operational footprint positions Energy Services to access more markets, grow efficiently, and achieve economies of scale Combined energy services business will continue to operate with a low Value-at-Risk business model Expected to increase annual gross margin of Energy Services by approximately 40% Combined energy services business projected to contribute $40 - $50 million in annual operating income in 2017 13 (1) Includes Continuum’s energy services customers and operational footprint |
 investors.centerpointenergy.com 14 Bill Rogers – EVP & CFO Earnings Call Highlights First Quarter Earnings Guidance Parameters Financing, Interest Expense & Tax |
 investors.centerpointenergy.com 15 Note: Refer to slide 2 for information on non-GAAP measures EPS: Q1 2016 vs Q1 2015 EPS EPS Consolidated as reported 0.36 $ 0.30 $ Midstream Investments (0.09) (0.08) Utility Operations (1) 0.27 0.22 Timing effects impacting CES (2) : Mark-to-market (gains) losses 0.01 0.01 ZENS-related mark-to-market (gains) losses: Marketable securities (3) (0.13) 0.03 Indexed debt securities 0.08 (0.04) Utility operations earnings on an adjusted guidance basis 0.23 $ 0.22 $ Per the basis used in providing earnings guidance: Utility Operations on a guidance basis 0.23 $ 0.22 $ Midstream Investments 0.09 0.08 Consolidated on a guidance basis 0.32 $ 0.30 $ (1) CenterPoint earnings excluding Midstream Investments (2) Energy Services segment March 31, 2016 March 31, 2015 Quarter Ended (3) 2016 and 2015 results include Time Warner Inc., Time Warner Cable Inc., and Time Inc.. 2015 results also include AOL Inc. prior to the merger with Verizon. |
 investors.centerpointenergy.com investors.centerpointenergy.com 16 2016 Earnings Guidance Midstream Investments $0.31 2015 Consolidated EPS: $1.10 Utility Operations 2016 Consolidated EPS: $1.12 -$1.20 2015 2016 2017 2018 $0.79 $0.88 to $0.92 $0.24 to $0.28 4-6% YoY EPS Growth Earnings from Utility Operations were ~70% of overall earnings in 2015 and are expected to represent 75% - 80% in 2016 Utility Operations are expected to produce 75-80% of cash flow in 2016 2016 Utility Operations EPS growth expected to include: Enable preferred investment Interest expense benefit Utility operating income growth Note: Refer to slide 2 for information on non-GAAP measures 4-6% YoY EPS Growth 4-6% YoY EPS Growth |
 investors.centerpointenergy.com Liquidity and Capital Resources Anticipate strong balance sheet and cash flow Project total capital investment of ~$1.4 billion for 2016 No external sources or cash from operations needed to finance $363 million investment in Enable’s perpetual preferred securities Net incremental borrowings of ~$150 million for 2016, inclusive of funding of the acquisition of Continuum’s marketing business Expect to refinance $600 million debt at Houston Electric in 2016 $325 million with a 6.15% coupon matured at CERC on May 1, 2016 Equity issuance not anticipated in 2016 or 2017 No anticipated incremental financing needs for 2017; dependent on factors including bonus depreciation, capital investment plans, and working capital Tax Rates Continue to anticipate 36% effective tax rate for 2016 Interest Rates Full-year 2016 interest expense projected to be lower than 2015 Near term maturities and refinancing suggest interest expense savings 17 Financing, Interest Expense and Tax (1) Excludes transition and system restoration bonds (2) Total debt includes revolver and commercial paper borrowings; excludes money pool borrowing Equity/Total Capital (2) (as of March 31, 2016) CenterPoint Energy Inc. Consolidated 37.1% CenterPoint Energy Houston Electric, LLC 42.5% CenterPoint Energy Resources Corp 58.6% $0 $200 $400 $600 $800 2017 2018 Long Term Debt Maturities ($MM) (1) CNP CERC |
 investors.centerpointenergy.com 18 Appendix |
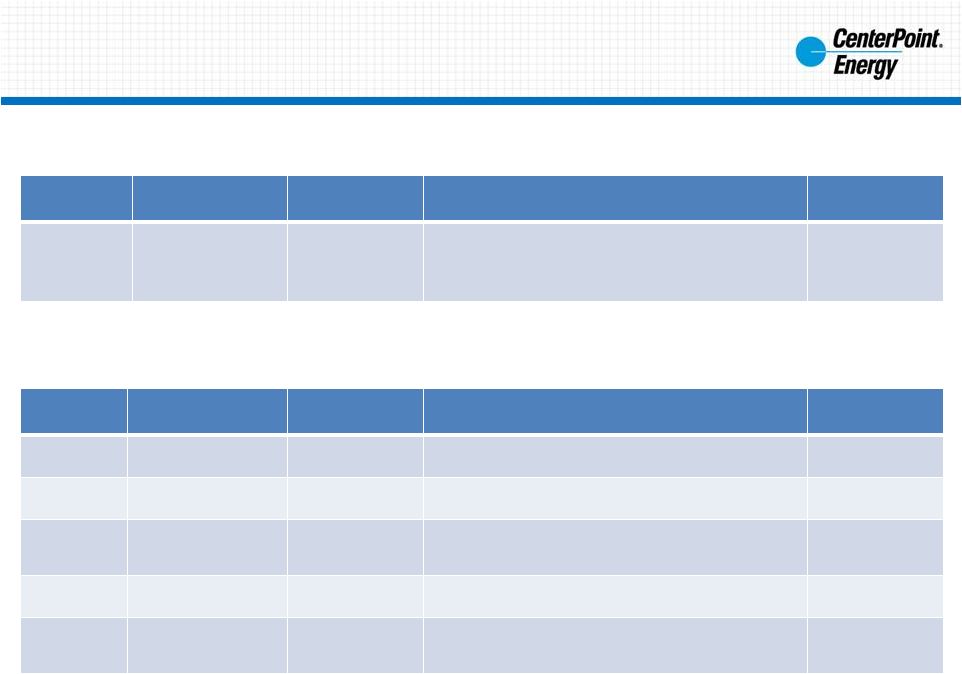 investors.centerpointenergy.com DCRF – Distribution Cost Recovery Factor; GRIP – Gas Reliability Infrastructure Program; PBRC – Performance Based Rate Change Mechanism Expected Effective Date Annual Increase ($MM) Comments Docket # DCRF 3Q 2016 $36.4 Filed on April 4, 2016; request of $49.4 million, representing a $36.4 million increase from 2015 DCRF filing; approval expected during 3Q 2016 45747 Requested annualized rate relief from pending 2016 filings: $36.4 million Jurisdiction Expected Effective Date Annual Increase ($MM) Comments Docket # Houston 3Q 2016 $7.7 GRIP filed in March 2016; pending approval 10508 South Texas 3Q 2016 $2.1 GRIP filed in March 2016; pending approval 10509 Beaumont/ East Texas 3Q 2016 $4.2 GRIP filed in March 2016; pending approval 10510 Texas Coast 3Q 2016 $4.2 GRIP filed in March 2016; pending approval 10511 Oklahoma - $0.5 PBRC filed in March 2016; hearing scheduled for June 7, 2016; pending approval PUD201600094 Requested annualized rate relief from pending 2016 filings: $18.7 million Q1 2016 Regulatory Update 19 Electric Transmission and Distribution: 2016 Regulatory Update Natural Gas Utilities: 2016 Regulatory Update |
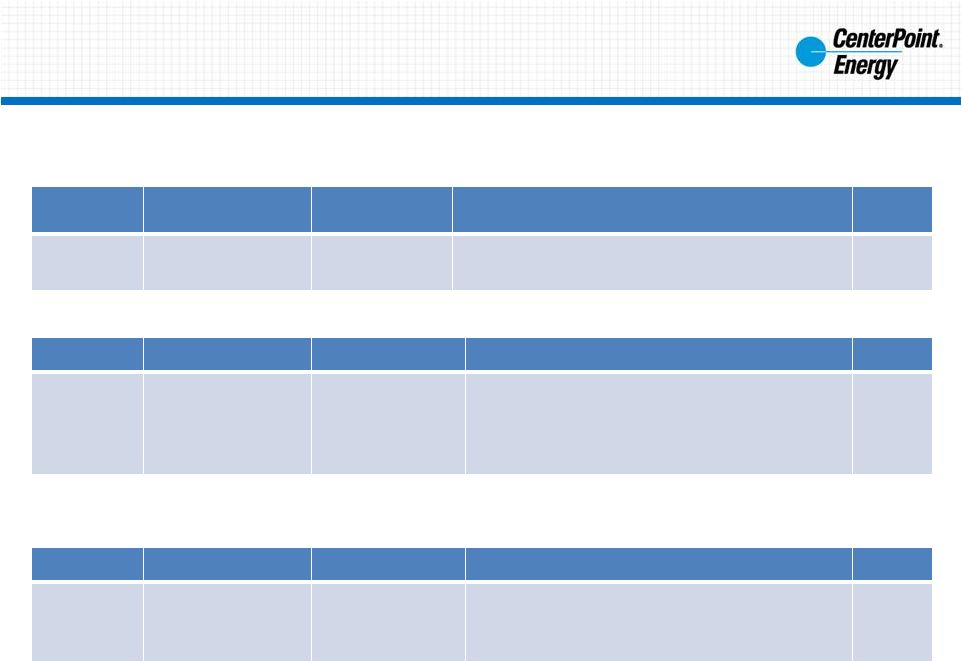 investors.centerpointenergy.com Jurisdiction Effective Date Rate Relief ($MM) Comments Docket # Minnesota October 2015 Interim rates effective in October 2015 Rate case requesting an annual increase of $54.1MM filed in August 2015; interim increase of $47.8MM effective in October 2015; final decision from the MPUC expected in mid-2016 15-424 MPUC – Minnesota Public Utilities Commission; BDA – Billing Determinant Rate Adjustment (1) Interim rates begin the recognition of revenue, subject to refund (pending issuance of final order) Jurisdiction Date Recognized Rate Relief ($MM) Comments Docket # Arkansas December 2015 $5.5 BDA filed in March 2016; revenue recognized in fourth quarter 2015; interim rates effective in June 2016; pending approval 06-161-U Rate relief from 2016 filings recognized in 2015 (includes interim rates (1) ): $5.5 million Q1 2016 Regulatory Update 20 Jurisdiction Expected Effective Date Annual Increase ($MM) Comments Docket # Arkansas 3Q 2016 $35.6 Rate case filed on November 10, 2015; pending approval 15-098-U Requested annualized rate relief from pending 2015 filings: $35.6 million Additional pending 2015 filings Natural Gas Utilities: 2016 Regulatory Update (Continued) |
 investors.centerpointenergy.com 21 Note: Refer to slide 2 for information on non-GAAP measures Reconciliation: Net Income and diluted EPS to the Basis Used in Providing Annual Earnings Guidance Net Income (in millions) EPS Net Income (in millions) EPS Consolidated as reported 154 $ 0.36 $ 131 $ 0.30 $ Midstream Investments (37) (0.09) (33) (0.08) Utility Operations (1) 117 0.27 98 0.22 Timing effects impacting CES (2) : Mark-to-market (gains) losses 6 0.01 3 0.01 ZENS-related mark-to-market (gains) losses: Marketable securities (3) (58) (0.13) 11 0.03 Indexed debt securities 36 0.08 (16) (0.04) Utility operations earnings on an adjusted guidance basis 101 $ 0.23 $ 96 $ 0.22 $ Per the basis used in providing earnings guidance: Utility Operations on a guidance basis 101 $ 0.23 $ 96 $ 0.22 $ Midstream Investments 37 0.09 33 0.08 Consolidated on a guidance basis 138 $ 0.32 $ 129 $ 0.30 $ (1) CenterPoint earnings excluding Midstream Investments (2) Energy Services segment (3) 2016 and 2015 results include Time Warner Inc., Time Warner Cable Inc., and Time Inc.. 2015 results also include AOL Inc. prior to the merger with Verizon. March 31, 2016 March 31, 2015 Quarter Ended |