1st quarter 2019 earnings call May 9, 2019 Exhibit 99.2
Cautionary statement This presentation and the oral statements made in connection herewith contain “forward-looking statements” within the meaning of Section 27A of the Securities Act of 1933 and Section 21E of the Securities Exchange Act of 1934. All statements other than statements of historical fact included in this presentation and the oral statements made in connection herewith are forward-looking statements made in good faith by CenterPoint Energy, Inc. (“CenterPoint Energy” or the “Company”) and are intended to qualify for the safe harbor from liability established by the Private Securities Litigation Reform Act of 1995, including statements concerning CenterPoint Energy’s expectations, beliefs, plans, objectives, goals, strategies, future operations, events, financial position, earnings, growth, costs, prospects, capital investments or performance or underlying assumptions (including future regulatory filings and recovery, liquidity, capital resources, balance sheet, cash flow, capital investments and management, financing costs and rate base or customer growth) and other statements that are not historical facts. You should not place undue reliance on forward-looking statements. Actual results may differ materially from those expressed or implied by these statements. You can generally identify our forward-looking statements by the words “anticipate,” “believe,” “continue,” “could,” “estimate,” “expect,” “forecast,” “goal,” “intend,” “may,” “objective,” “plan,” “potential,” “predict,” “projection,” “should,” “target,” “will,” or other similar words. The absence of these words, however, does not mean that the statements are not forward-looking. Examples of forward-looking statements in this presentation include statements about the acquisition of Vectren Corporation (the “merger”), our growth and guidance (including earnings; customer, utility and rate base growth expectations; anticipated merger cost savings; and non-utility business performance), capital resources and expenditures, our regulatory filings and projections (including the pending Houston Electric rate case, Bailey to Jones Creek project in Texas and the Integrated Resources Plan and generation transition plan in Indiana), Enable’s estimated completion of the Gulf Run Pipeline project, among other statements. We have based our forward-looking statements on our management’s beliefs and assumptions based on information currently available to our management at the time the statements are made. We caution you that assumptions, beliefs, expectations, intentions, and projections about future events may and often do vary materially from actual results. Therefore, we cannot assure you that actual results will not differ materially from those expressed or implied by our forward-looking statements. Some of the factors that could cause actual results to differ from those expressed or implied by our forward-looking statements include but are not limited to the timing and impact of future regulatory, legislative and IRS decisions, financial market conditions, future market conditions, economic and employment conditions, customer growth, Enable Midstream Partners, LP’s (“Enable”) performance and ability to pay distributions and other factors described in CenterPoint Energy’s Form 10-K for the year ended December 31, 2018 under “Risk Factors” and “Management’s Discussion and Analysis of Financial Condition and Results of Operations—Certain Factors Affecting Future Earnings” and in other filings with the SEC by the Company, which can be found at www.centerpointenergy.com on the Investor Relations page or on the Securities and Exchange Commission’s (“SEC”) website at www.sec.gov. A portion of slide 10 is derived from Enable’s investor presentation as presented during its Q1 2019 earnings presentation dated May 1, 2019. The information in this slide is included for informational purposes only. The content has not been verified by us, and we assume no liability for the same. You should consider Enable’s investor materials in the context of its SEC filings and its entire investor presentation, which is available at http://investors.enablemidstream.com. This presentation contains time sensitive information that is accurate as of the date hereof (unless otherwise specified as accurate as of another date). Some of the information in this presentation is unaudited and may be subject to change. We undertake no obligation to update the information presented herein except as required by law. Investors and others should note that we may announce material information using SEC filings, press releases, public conference calls, webcasts and the Investor Relations page of our website. In the future, we will continue to use these channels to distribute material information about the Company and to communicate important information about the Company, key personnel, corporate initiatives, regulatory updates and other matters. Information that we post on our website could be deemed material; therefore, we encourage investors, the media, our customers, business partners and others interested in our Company to review the information we post on our website.
Additional information Use of Non-GAAP Financial Measures In addition to presenting its financial results in accordance with generally accepted accounting principles (“GAAP”), including presentation of income available to common shareholders and diluted earnings per share, the Company also provides guidance based on adjusted income and adjusted diluted earnings per share, which are non-GAAP financial measures. Additional non-GAAP financial measures used by the Company include core operating income. Generally, a non-GAAP financial measure is a numerical measure of a company’s historical or future financial performance that excludes or includes amounts that are not normally excluded or included in the most directly comparable GAAP financial measure. The Company’s adjusted income and adjusted diluted earnings per share used in providing earnings guidance calculation excludes from income available to common shareholders and diluted earnings per share, respectively, the impact of ZENS and related securities and mark-to-market gains or losses resulting from the Company’s Energy Services business. The Company’s guidance for 2019 does not reflect certain merger impacts, which are integration and transaction-related fees and expenses, including severance and other costs to achieve anticipated cost savings as a result of the merger and merger financing impacts in January, before the completion of the merger due to the issuance of debt and equity securities to fund the merger that resulted in higher net interest expense and higher common stock share count. The core operating income calculation for the Company’s Houston Electric – T&D reportable segment excludes the transition and system restoration bonds. A reconciliation of income available to common shareholders and diluted earnings per share to the basis used in providing guidance is provided in this presentation on slides 21–22. The Company is unable to present a quantitative reconciliation of forward-looking adjusted income and adjusted diluted earnings per share used in providing earnings guidance because changes in the value of ZENS and related securities and mark-to-market gains or losses resulting from the Company’s Energy Services business are not estimable as they are highly variable and difficult to predict due to various factors outside of management’s control. These excluded items, along with the excluded impacts associated with the merger, could have a material impact on GAAP-reported results for the applicable guidance period. Management evaluates the Company’s financial performance in part based on adjusted income, adjusted diluted earnings per share and core operating income. We believe that presenting these non-GAAP financial measures enhances an investor’s understanding of the Company’s overall financial performance by providing them with an additional meaningful and relevant comparison of current and anticipated future results across periods. The adjustments made in these non-GAAP financial measures exclude items that Management believes does not most accurately reflect the Company’s fundamental business performance. These excluded items are reflected in the reconciliation tables on slides 21–22. The Company’s adjusted income, adjusted diluted earnings per share and core operating income non-GAAP financial measures should be considered as a supplement to, and not as a substitute for, or superior to, income available to common shareholders, diluted earnings per share and operating income, which respectively are the most directly comparable GAAP financial measures. These non-GAAP financial measures also may be different than non-GAAP financial measures used by other companies. 2019 and 2020 Earnings Per Share Guidance Assumptions Both CenterPoint Energy’s 2019 and 2020 earnings per share guidance ranges consider operations performance to date and assumptions for certain significant variables that may impact earnings, such as customer growth (approximately 2% for electric operations and 1% for natural gas distribution) and usage including normal weather, throughput, commodity prices, recovery of capital invested through rate cases and other rate filings, effective tax rates, financing activities and related interest rates, and regulatory and judicial proceedings, as well as the volume of work contracted in our infrastructure services business. The ranges also consider anticipated cost savings as a result of the merger. The 2019 guidance range assumes Enable Midstream Partners’ (“Enable”) 2019 guidance range for net income attributable to common units, provided on Enable’s Q1 2019 earnings call on May 1, 2019. The 2020 guidance range utilizes a range of CenterPoint Energy’s scenarios for Enable’s 2020 net income attributable to common units. The 2020 range also considers the estimated cost and timing of technology integration projects. In providing this guidance, CenterPoint Energy uses a non-GAAP measure of adjusted diluted earnings per share that does not consider other potential impacts, such as changes in accounting standards or unusual items, including those from Enable, earnings or losses from the change in the value of the ZENS securities and the related stocks, or the timing effects of mark-to-market accounting in the Company’s Energy Services business, which, along with the certain excluded impacts associated with the merger, could have a material impact on GAAP reported results for the applicable guidance period. Refer to the information above in “Use of Non-GAAP Financial Measures” for reconciliation information.
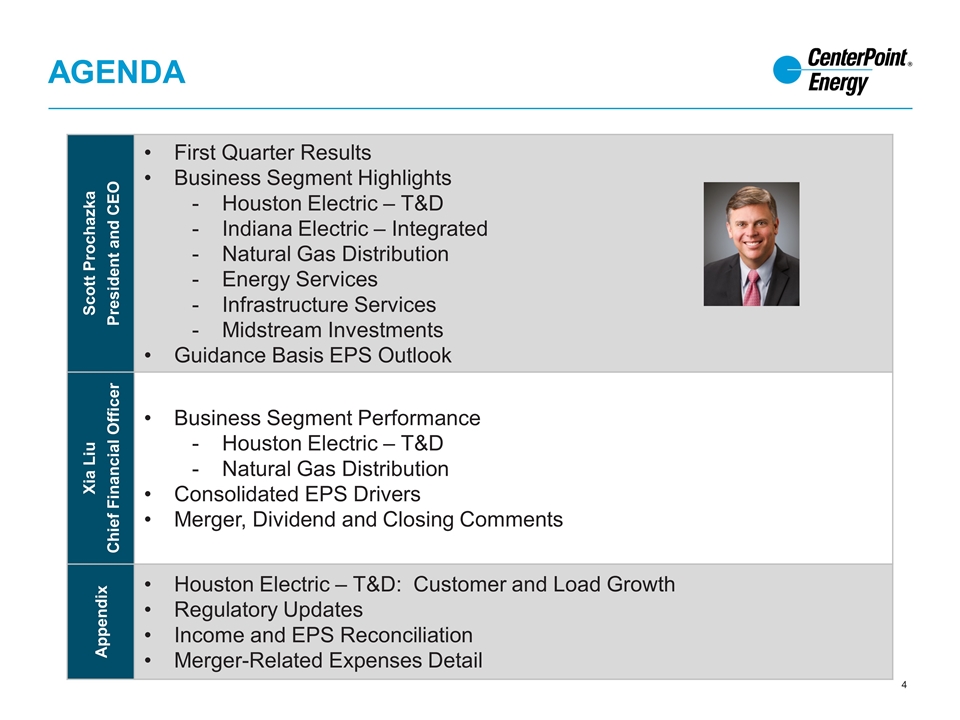
Scott Prochazka President and CEO First Quarter Results Business Segment Highlights Houston Electric – T&D Indiana Electric – Integrated Natural Gas Distribution Energy Services Infrastructure Services Midstream Investments Guidance Basis EPS Outlook Xia Liu Chief Financial Officer Business Segment Performance Houston Electric – T&D Natural Gas Distribution Consolidated EPS Drivers Merger, Dividend and Closing Comments Appendix Houston Electric – T&D: Customer and Load Growth Regulatory Updates Income and EPS Reconciliation Merger-Related Expenses Detail Agenda
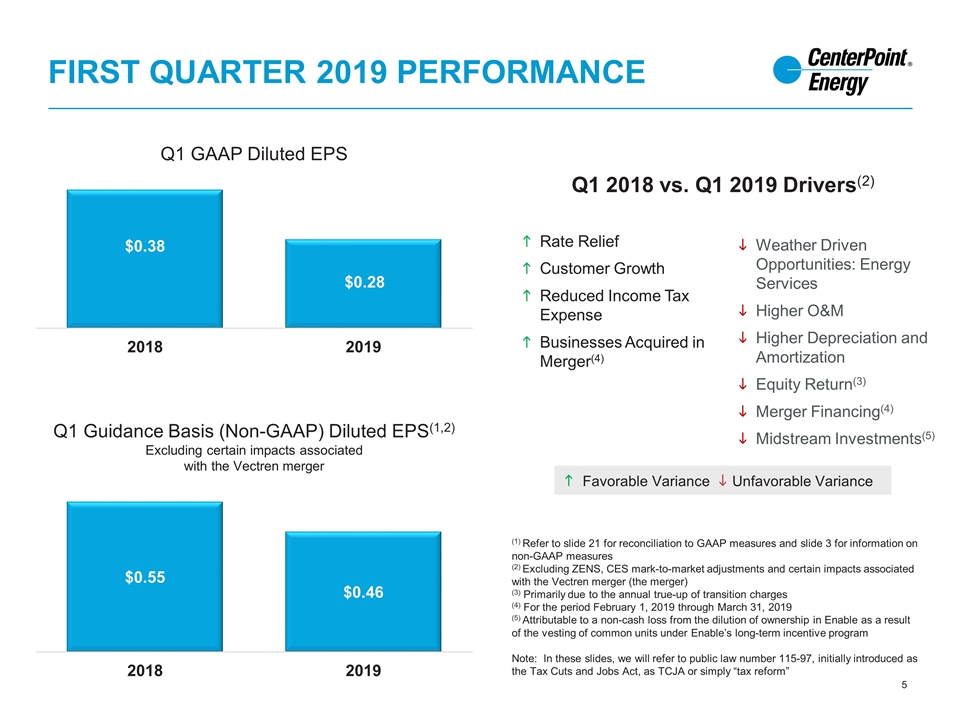
First quarter 2019 performance (1) Refer to slide 21 for reconciliation to GAAP measures and slide 3 for information on non-GAAP measures (2) Excluding ZENS, CES mark-to-market adjustments and certain impacts associated with the Vectren merger (the merger) (3) Primarily due to the annual true-up of transition charges (4) For the period February 1, 2019 through March 31, 2019 (5) Attributable to a non-cash loss from the dilution of ownership in Enable as a result of the vesting of common units under Enable’s long-term incentive program Note: In these slides, we will refer to public law number 115-97, initially introduced as the Tax Cuts and Jobs Act, as TCJA or simply “tax reform” Q1 2018 vs. Q1 2019 Drivers(2) h Favorable Variance i Unfavorable Variance Rate Relief Customer Growth Reduced Income Tax Expense Businesses Acquired in Merger(4) Weather Driven Opportunities: Energy Services Higher O&M Higher Depreciation and Amortization Equity Return(3) Merger Financing(4) Midstream Investments(5) Q1 GAAP Diluted EPS Q1 Guidance Basis (Non-GAAP) Diluted EPS(1,2) Excluding certain impacts associated with the Vectren merger
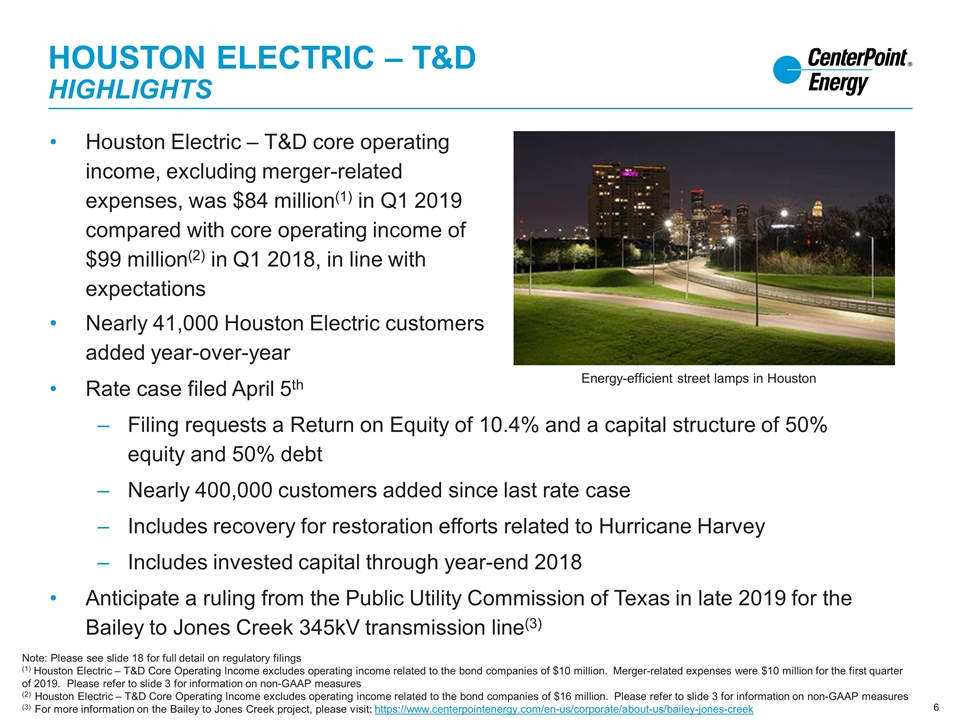
Houston Electric – T&D Highlights Houston Electric – T&D core operating income, excluding merger-related expenses, was $84 million(1) in Q1 2019 compared with core operating income of $99 million(2) in Q1 2018, in line with expectations Nearly 41,000 Houston Electric customers added year-over-year Rate case filed April 5th Filing requests a Return on Equity of 10.4% and a capital structure of 50% equity and 50% debt Nearly 400,000 customers added since last rate case Includes recovery for restoration efforts related to Hurricane Harvey Includes invested capital through year-end 2018 Anticipate a ruling from the Public Utility Commission of Texas in late 2019 for the Bailey to Jones Creek 345kV transmission line(3) Note: Please see slide 18 for full detail on regulatory filings (1) Houston Electric – T&D Core Operating Income excludes operating income related to the bond companies of $10 million. Merger-related expenses were $10 million for the first quarter of 2019. Please refer to slide 3 for information on non-GAAP measures (2) Houston Electric – T&D Core Operating Income excludes operating income related to the bond companies of $16 million. Please refer to slide 3 for information on non-GAAP measures (3) For more information on the Bailey to Jones Creek project, please visit: https://www.centerpointenergy.com/en-us/corporate/about-us/bailey-jones-creek Energy-efficient street lamps in Houston
Indiana Electric – Integrated Highlights and generation transition Plan Operating income of $11 million(1) for Q1 2019, excluding $20 million of merger-related expenses, in line with expectations Recently, the Indiana Utility Regulatory Commission (IURC) approved portions of the 2016 generation transition plan: the construction of a 50 MW universal solar array, a retrofit of Culley Unit 3 and an environmental cost adjustment mechanism The IURC encouraged us to consider smaller scale options rather than build a 700 - 850 MW combined cycle natural gas turbine Approximately $850 million of capital associated with the plant will be re-evaluated and may increase or decrease The majority of capital spending was planned in the 2021 – 2023 period Work on a new Integrated Resource Plan (IRP) has begun and is expected to be finalized by mid-2020 (1) Represents February 1, 2019 through March 31, 2019 results only. Please refer to slide 3 for information on non-GAAP measures
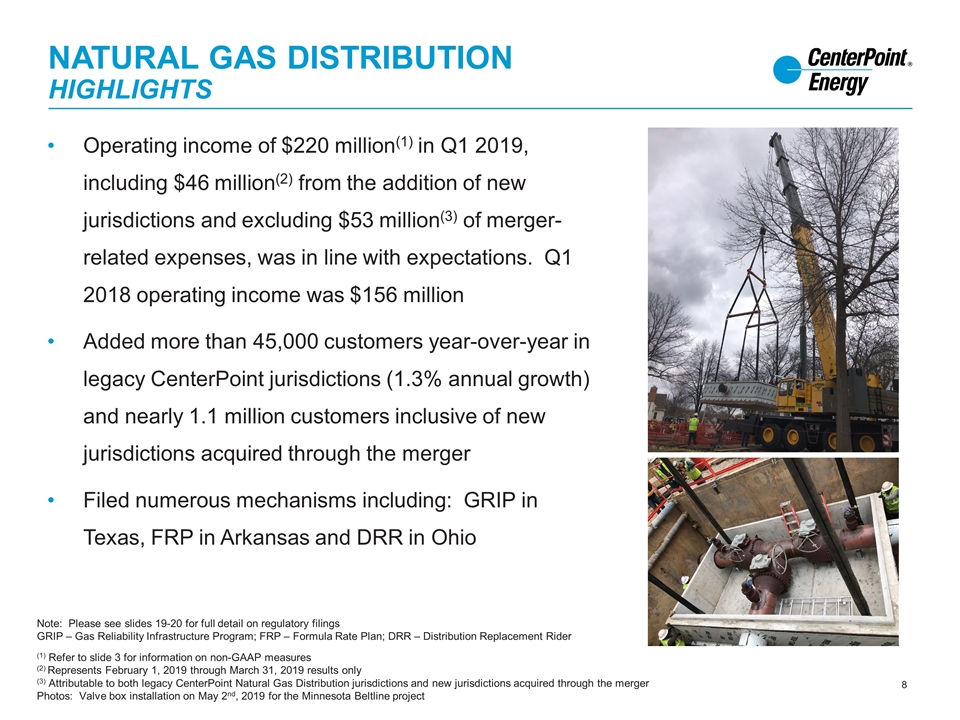
Natural Gas Distribution Highlights Operating income of $220 million(1) in Q1 2019, including $46 million(2) from the addition of new jurisdictions and excluding $53 million(3) of merger-related expenses, was in line with expectations. Q1 2018 operating income was $156 million Added more than 45,000 customers year-over-year in legacy CenterPoint jurisdictions (1.3% annual growth) and nearly 1.1 million customers inclusive of new jurisdictions acquired through the merger Filed numerous mechanisms including: GRIP in Texas, FRP in Arkansas and DRR in Ohio Note: Please see slides 19-20 for full detail on regulatory filings GRIP – Gas Reliability Infrastructure Program; FRP – Formula Rate Plan; DRR – Distribution Replacement Rider (1) Refer to slide 3 for information on non-GAAP measures (2) Represents February 1, 2019 through March 31, 2019 results only (3) Attributable to both legacy CenterPoint Natural Gas Distribution jurisdictions and new jurisdictions acquired through the merger Photos: Valve box installation on May 2nd, 2019 for the Minnesota Beltline project
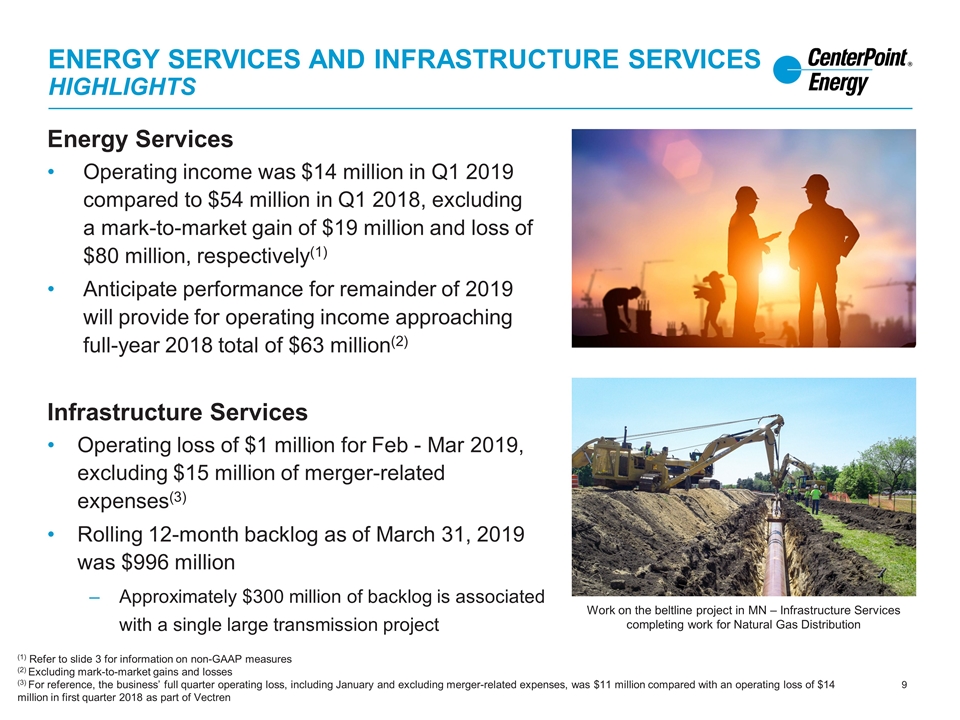
Energy Services and Infrastructure services highlights Energy Services Operating income was $14 million in Q1 2019 compared to $54 million in Q1 2018, excluding a mark-to-market gain of $19 million and loss of $80 million, respectively(1) Anticipate performance for remainder of 2019 will provide for operating income approaching full-year 2018 total of $63 million(2) (1) Refer to slide 3 for information on non-GAAP measures (2) Excluding mark-to-market gains and losses (3) For reference, the business’ full quarter operating loss, including January and excluding merger-related expenses, was $11 million compared with an operating loss of $14 million in first quarter 2018 as part of Vectren Infrastructure Services Operating loss of $1 million for Feb - Mar 2019, excluding $15 million of merger-related expenses(3) Rolling 12-month backlog as of March 31, 2019 was $996 million Approximately $300 million of backlog is associated with a single large transmission project Work on the beltline project in MN – Infrastructure Services completing work for Natural Gas Distribution
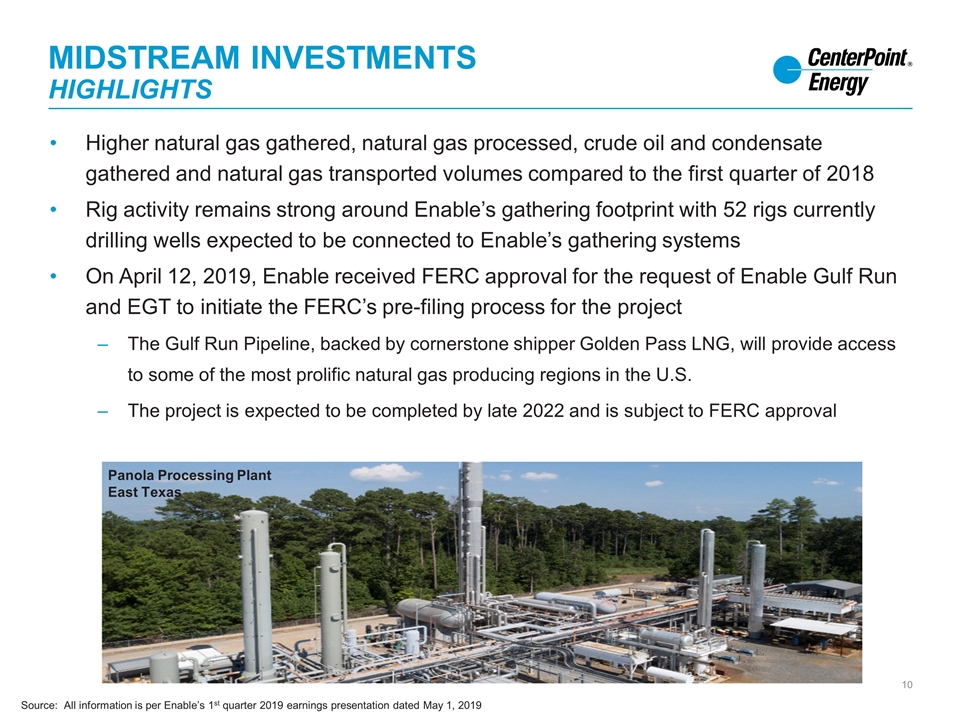
Midstream Investments highlights Higher natural gas gathered, natural gas processed, crude oil and condensate gathered and natural gas transported volumes compared to the first quarter of 2018 Rig activity remains strong around Enable’s gathering footprint with 52 rigs currently drilling wells expected to be connected to Enable’s gathering systems On April 12, 2019, Enable received FERC approval for the request of Enable Gulf Run and EGT to initiate the FERC’s pre-filing process for the project The Gulf Run Pipeline, backed by cornerstone shipper Golden Pass LNG, will provide access to some of the most prolific natural gas producing regions in the U.S. The project is expected to be completed by late 2022 and is subject to FERC approval Panola Processing Plant East Texas Source: All information is per Enable’s 1st quarter 2019 earnings presentation dated May 1, 2019
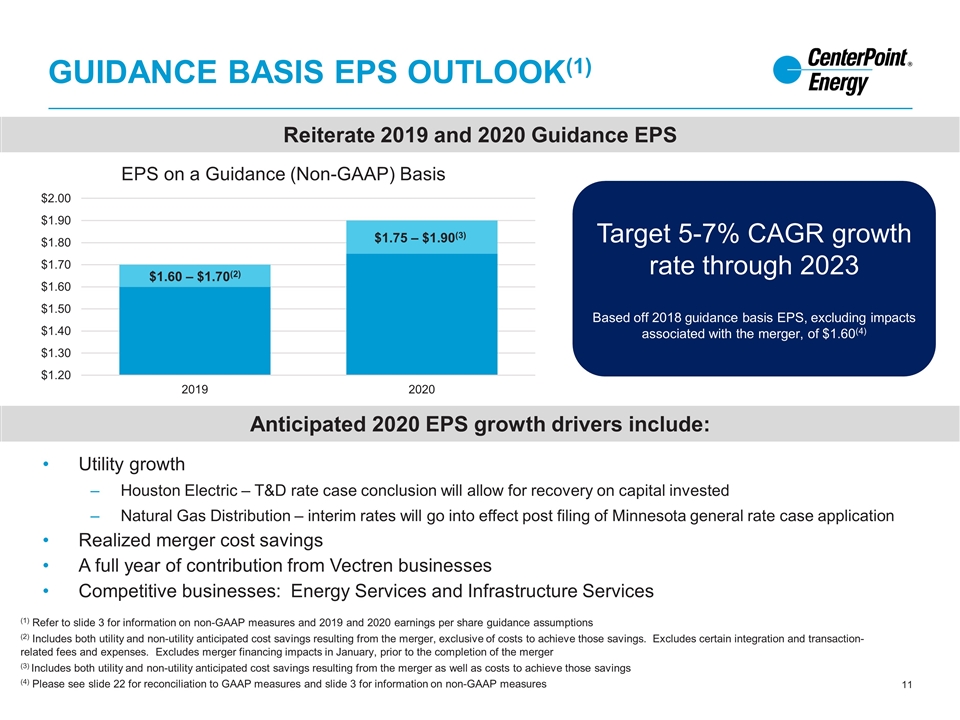
Guidance Basis EPS Outlook(1) Utility growth Houston Electric – T&D rate case conclusion will allow for recovery on capital invested Natural Gas Distribution – interim rates will go into effect post filing of Minnesota general rate case application Realized merger cost savings A full year of contribution from Vectren businesses Competitive businesses: Energy Services and Infrastructure Services Anticipated 2020 EPS growth drivers include: (1) Refer to slide 3 for information on non-GAAP measures and 2019 and 2020 earnings per share guidance assumptions (2) Includes both utility and non-utility anticipated cost savings resulting from the merger, exclusive of costs to achieve those savings. Excludes certain integration and transaction-related fees and expenses. Excludes merger financing impacts in January, prior to the completion of the merger (3) Includes both utility and non-utility anticipated cost savings resulting from the merger as well as costs to achieve those savings (4) Please see slide 22 for reconciliation to GAAP measures and slide 3 for information on non-GAAP measures Reiterate 2019 and 2020 Guidance EPS $1.75 – $1.90(3) EPS on a Guidance (Non-GAAP) Basis $1.60 – $1.70(2) Target 5-7% CAGR growth rate through 2023 Based off 2018 guidance basis EPS, excluding impacts associated with the merger, of $1.60(4)
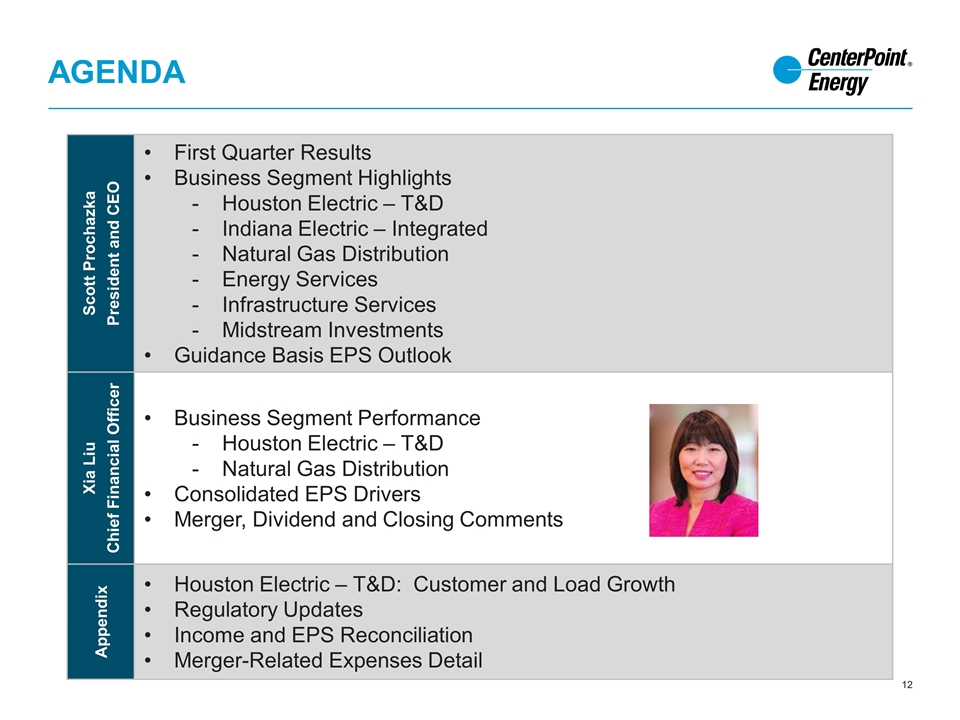
Scott Prochazka President and CEO First Quarter Results Business Segment Highlights Houston Electric – T&D Indiana Electric – Integrated Natural Gas Distribution Energy Services Infrastructure Services Midstream Investments Guidance Basis EPS Outlook Xia Liu Chief Financial Officer Business Segment Performance Houston Electric – T&D Natural Gas Distribution Consolidated EPS Drivers Merger, Dividend and Closing Comments Appendix Houston Electric – T&D: Customer and Load Growth Regulatory Updates Income and EPS Reconciliation Merger-Related Expenses Detail Agenda
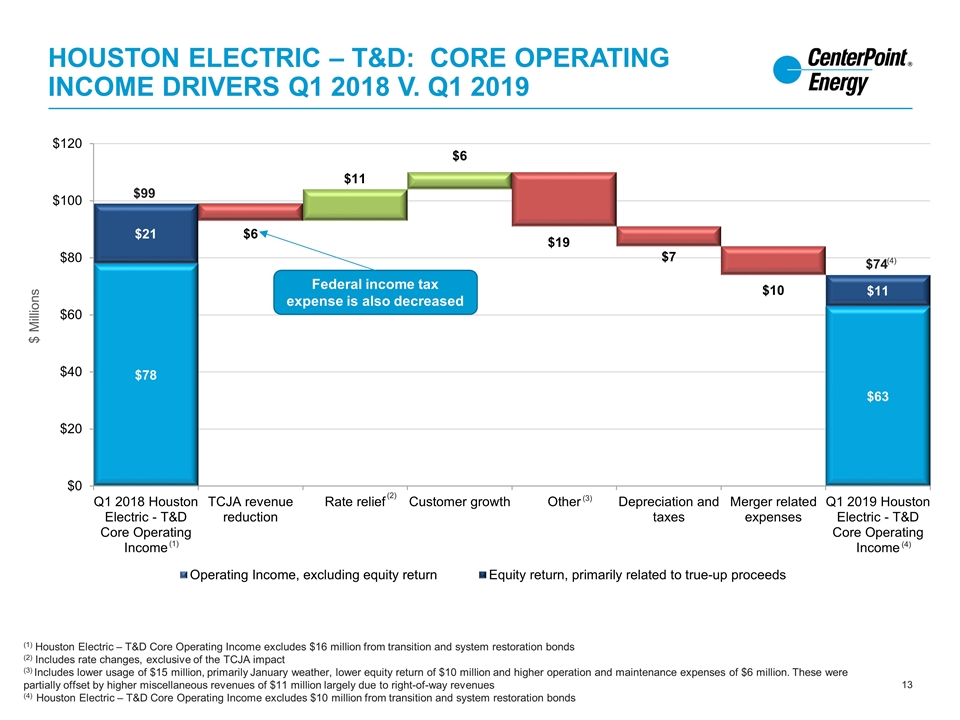
Houston Electric – T&D: Core Operating Income Drivers Q1 2018 v. Q1 2019 (1) Houston Electric – T&D Core Operating Income excludes $16 million from transition and system restoration bonds (2) Includes rate changes, exclusive of the TCJA impact (3) Includes lower usage of $15 million, primarily January weather, lower equity return of $10 million and higher operation and maintenance expenses of $6 million. These were partially offset by higher miscellaneous revenues of $11 million largely due to right-of-way revenues (4) Houston Electric – T&D Core Operating Income excludes $10 million from transition and system restoration bonds (1) (4) (2) (3) $99 $74 Federal income tax expense is also decreased (4)
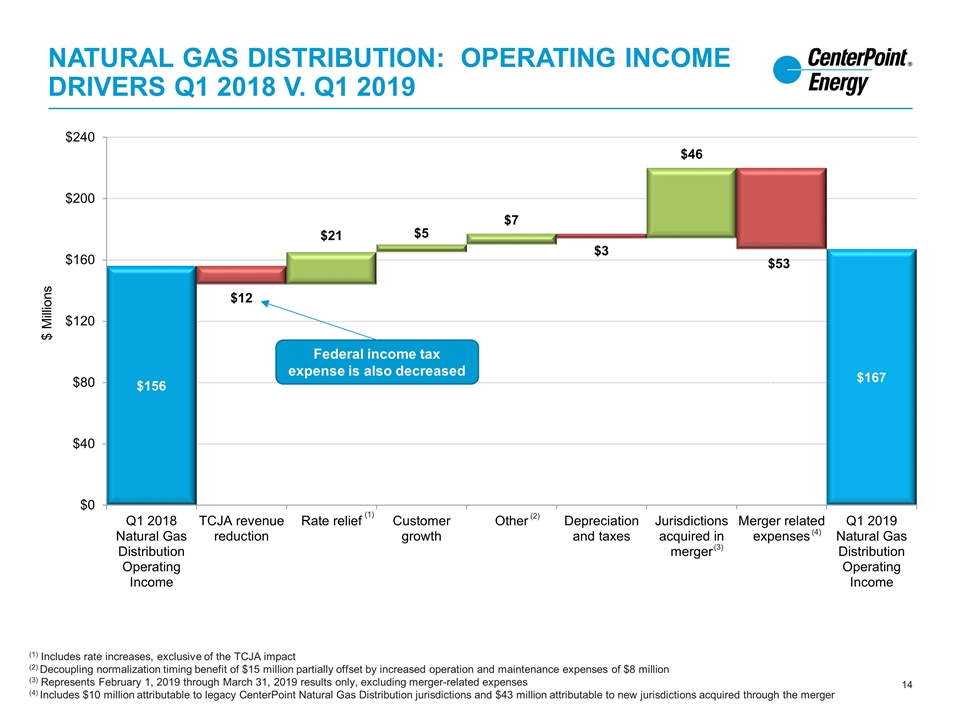
Natural Gas Distribution: Operating Income Drivers Q1 2018 v. q1 2019 (1) Includes rate increases, exclusive of the TCJA impact (2) Decoupling normalization timing benefit of $15 million partially offset by increased operation and maintenance expenses of $8 million (3) Represents February 1, 2019 through March 31, 2019 results only, excluding merger-related expenses (4) Includes $10 million attributable to legacy CenterPoint Natural Gas Distribution jurisdictions and $43 million attributable to new jurisdictions acquired through the merger (1) (2) Federal income tax expense is also decreased (3) (4)
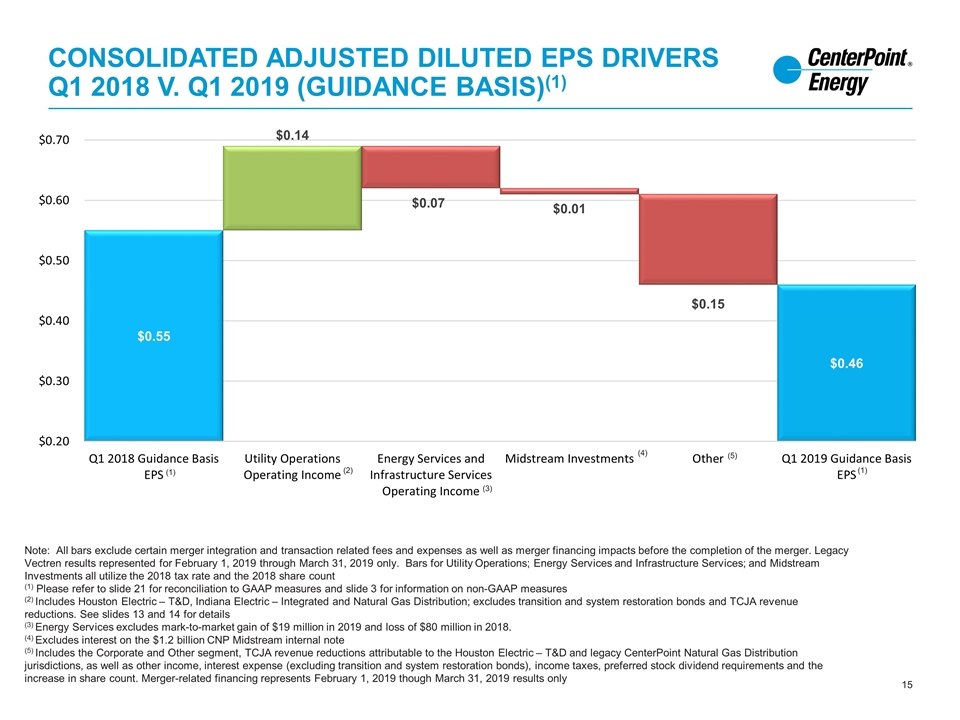
Consolidated adjusted diluted eps drivers q1 2018 v. q1 2019 (Guidance basis)(1) Note: All bars exclude certain merger integration and transaction related fees and expenses as well as merger financing impacts before the completion of the merger. Legacy Vectren results represented for February 1, 2019 through March 31, 2019 only. Bars for Utility Operations; Energy Services and Infrastructure Services; and Midstream Investments all utilize the 2018 tax rate and the 2018 share count (1) Please refer to slide 21 for reconciliation to GAAP measures and slide 3 for information on non-GAAP measures (2) Includes Houston Electric – T&D, Indiana Electric – Integrated and Natural Gas Distribution; excludes transition and system restoration bonds and TCJA revenue reductions. See slides 13 and 14 for details (3) Energy Services excludes mark-to-market gain of $19 million in 2019 and loss of $80 million in 2018. (4) Excludes interest on the $1.2 billion CNP Midstream internal note (5) Includes the Corporate and Other segment, TCJA revenue reductions attributable to the Houston Electric – T&D and legacy CenterPoint Natural Gas Distribution jurisdictions, as well as other income, interest expense (excluding transition and system restoration bonds), income taxes, preferred stock dividend requirements and the increase in share count. Merger-related financing represents February 1, 2019 though March 31, 2019 results only (1) (2) (3) (4) (5) (1)
Agenda Scott Prochazka President and CEO First Quarter Results Business Segment Highlights Houston Electric – T&D Indiana Electric – Integrated Natural Gas Distribution Energy Services Infrastructure Services Midstream Investments Guidance Basis EPS Outlook Xia Liu Chief Financial Officer Business Segment Performance Houston Electric – T&D Natural Gas Distribution Consolidated EPS Drivers Merger, Dividend and Closing Comments Appendix Houston Electric – T&D: Customer and Load Growth Regulatory Updates Income and EPS Reconciliation Merger-Related Expenses Detail
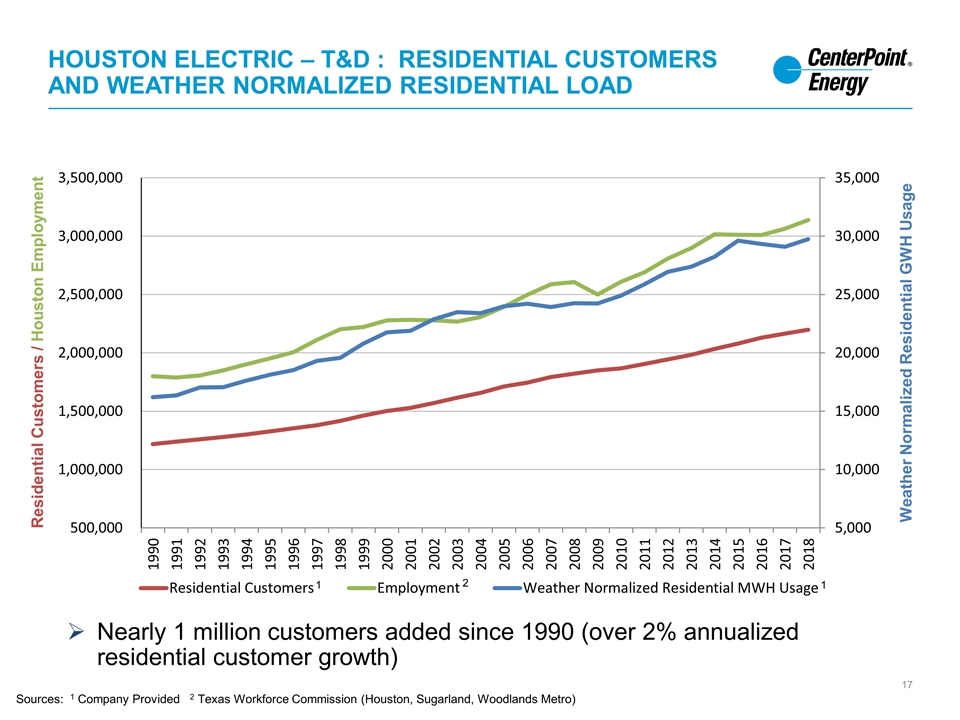
Residential Customers / Houston Employment Weather Normalized Residential GWH Usage Nearly 1 million customers added since 1990 (over 2% annualized residential customer growth) Sources: 1 Company Provided 2 Texas Workforce Commission (Houston, Sugarland, Woodlands Metro) 1 1 2 Houston Electric – T&D : Residential Customers and Weather Normalized Residential Load
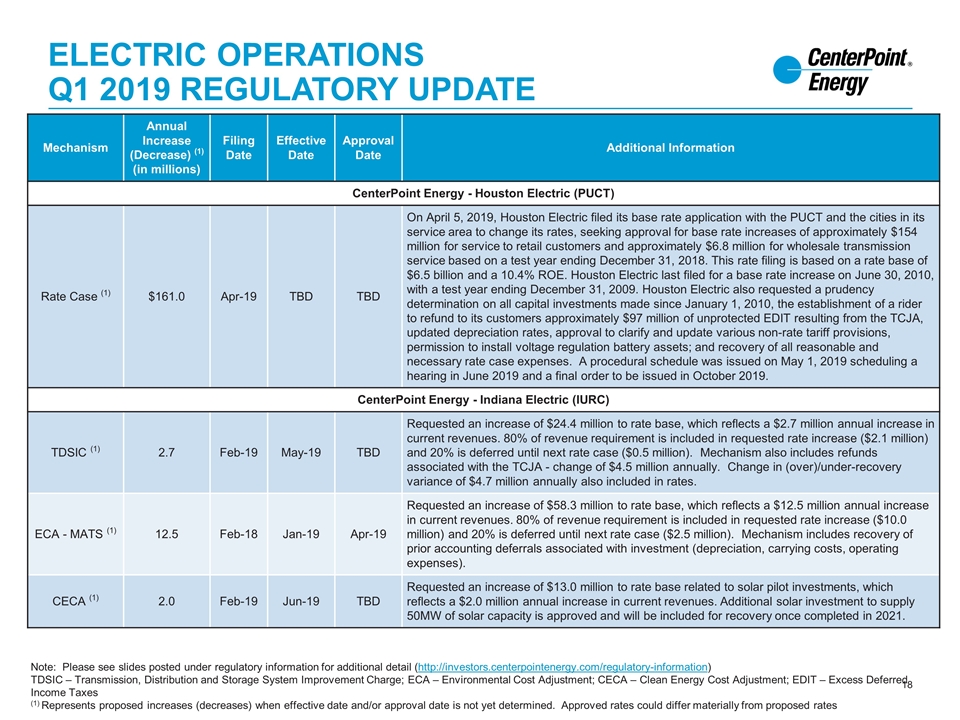
Electric Operations Q1 2019 Regulatory Update Mechanism Annual Increase (Decrease) (1) (in millions) Filing Date Effective Date Approval Date Additional Information CenterPoint Energy - Houston Electric (PUCT) Rate Case (1) $161.0 Apr-19 TBD TBD On April 5, 2019, Houston Electric filed its base rate application with the PUCT and the cities in its service area to change its rates, seeking approval for base rate increases of approximately $154 million for service to retail customers and approximately $6.8 million for wholesale transmission service based on a test year ending December 31, 2018. This rate filing is based on a rate base of $6.5 billion and a 10.4% ROE. Houston Electric last filed for a base rate increase on June 30, 2010, with a test year ending December 31, 2009. Houston Electric also requested a prudency determination on all capital investments made since January 1, 2010, the establishment of a rider to refund to its customers approximately $97 million of unprotected EDIT resulting from the TCJA, updated depreciation rates, approval to clarify and update various non-rate tariff provisions, permission to install voltage regulation battery assets; and recovery of all reasonable and necessary rate case expenses. A procedural schedule was issued on May 1, 2019 scheduling a hearing in June 2019 and a final order to be issued in October 2019. CenterPoint Energy - Indiana Electric (IURC) TDSIC (1) 2.7 Feb-19 May-19 TBD Requested an increase of $24.4 million to rate base, which reflects a $2.7 million annual increase in current revenues. 80% of revenue requirement is included in requested rate increase ($2.1 million) and 20% is deferred until next rate case ($0.5 million). Mechanism also includes refunds associated with the TCJA - change of $4.5 million annually. Change in (over)/under-recovery variance of $4.7 million annually also included in rates. ECA - MATS (1) 12.5 Feb-18 Jan-19 Apr-19 Requested an increase of $58.3 million to rate base, which reflects a $12.5 million annual increase in current revenues. 80% of revenue requirement is included in requested rate increase ($10.0 million) and 20% is deferred until next rate case ($2.5 million). Mechanism includes recovery of prior accounting deferrals associated with investment (depreciation, carrying costs, operating expenses). CECA (1) 2.0 Feb-19 Jun-19 TBD Requested an increase of $13.0 million to rate base related to solar pilot investments, which reflects a $2.0 million annual increase in current revenues. Additional solar investment to supply 50MW of solar capacity is approved and will be included for recovery once completed in 2021. Note: Please see slides posted under regulatory information for additional detail (http://investors.centerpointenergy.com/regulatory-information) TDSIC – Transmission, Distribution and Storage System Improvement Charge; ECA – Environmental Cost Adjustment; CECA – Clean Energy Cost Adjustment; EDIT – Excess Deferred Income Taxes (1) Represents proposed increases (decreases) when effective date and/or approval date is not yet determined. Approved rates could differ materially from proposed rates

Natural Gas Distribution Q1 2019 Regulatory Update Note: Please see slides posted under regulatory information for additional detail (http://investors.centerpointenergy.com/regulatory-information) GRIP – Gas Reliability Infrastructure Program; FRP – Formula Rate Plan; RRA – Rate Regulation Adjustment; PBRC – Performance Based Rate Change; CSIA – Compliance and System Improvement Adjustment (1) Represents proposed increases (decreases) when effective date and/or approval date is not yet determined. Approved rates could differ materially from proposed rates Mechanism Annual Increase (Decrease) (1) (in millions) Filing Date Effective Date Approval Date Additional Information CenterPoint Energy and CERC - Beaumont/East Texas, South Texas, Houston and Texas Coast (Railroad Commission) GRIP (1) 20.2 Mar-19 Jul-19 TBD Based on net change in invested capital of $123.8 million. CenterPoint Energy and CERC - Arkansas (APSC) FRP (1) 13.5 Apr-19 Oct-19 TBD Based on ROE of 9.5% approved in the last rate case. CenterPoint Energy and CERC - Mississippi (MPSC) RRA 2.0 May-19 TBD TBD Based on ROE of 9.26%. CenterPoint Energy and CERC - Oklahoma (OCC) PBRC (1) 2.0 Mar-19 TBD TBD Based on ROE of 10%. CenterPoint Energy - Indiana South-Gas (IURC) CSIA 2.7 Oct-18 Jan-19 Jan-19 Requested an increase of $16.2 million to rate base, which reflects a $2.7 million annual increase in current revenues. 80% of revenue requirement is included in requested rate increase ($2.1 million) and 20% is deferred until next rate case ($0.5 million). Mechanism also includes refunds associated with the TCJA - change of $(2.1) million annually. Change in (over)/under-recovery variance of $(3.6) million annually also included in rates. CSIA (1) 5.2 Apr-18 Jul-19 TBD Requested an increase of $22.2 million to rate base, which reflects a $5.2 million annual increase in current revenues. 80% of revenue requirement is included in requested rate increase ($4.1 million) and 20% is deferred until next rate case ($1.0 million). The mechanism also includes refunds associated with the TCJA - change of $1.1 million annually. Change in (over)/under-recovery variance of $2.9 million annually also included in rates.
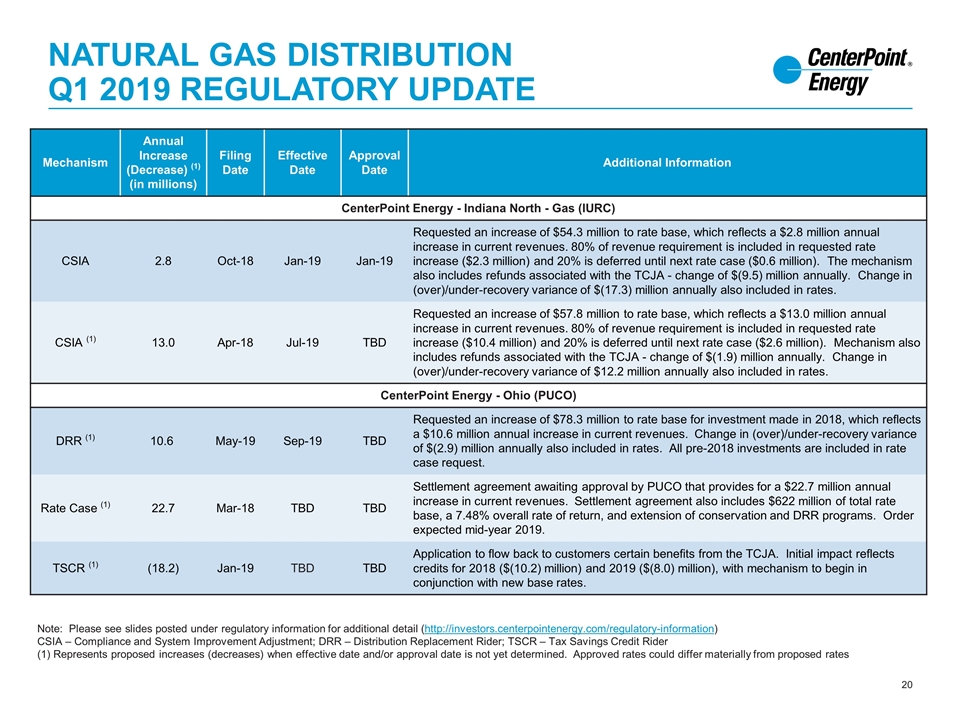
Natural Gas Distribution Q1 2019 Regulatory Update Mechanism Annual Increase (Decrease) (1) (in millions) Filing Date Effective Date Approval Date Additional Information CenterPoint Energy - Indiana North - Gas (IURC) CSIA 2.8 Oct-18 Jan-19 Jan-19 Requested an increase of $54.3 million to rate base, which reflects a $2.8 million annual increase in current revenues. 80% of revenue requirement is included in requested rate increase ($2.3 million) and 20% is deferred until next rate case ($0.6 million). The mechanism also includes refunds associated with the TCJA - change of $(9.5) million annually. Change in (over)/under-recovery variance of $(17.3) million annually also included in rates. CSIA (1) 13.0 Apr-18 Jul-19 TBD Requested an increase of $57.8 million to rate base, which reflects a $13.0 million annual increase in current revenues. 80% of revenue requirement is included in requested rate increase ($10.4 million) and 20% is deferred until next rate case ($2.6 million). Mechanism also includes refunds associated with the TCJA - change of $(1.9) million annually. Change in (over)/under-recovery variance of $12.2 million annually also included in rates. CenterPoint Energy - Ohio (PUCO) DRR (1) 10.6 May-19 Sep-19 TBD Requested an increase of $78.3 million to rate base for investment made in 2018, which reflects a $10.6 million annual increase in current revenues. Change in (over)/under-recovery variance of $(2.9) million annually also included in rates. All pre-2018 investments are included in rate case request. Rate Case (1) 22.7 Mar-18 TBD TBD Settlement agreement awaiting approval by PUCO that provides for a $22.7 million annual increase in current revenues. Settlement agreement also includes $622 million of total rate base, a 7.48% overall rate of return, and extension of conservation and DRR programs. Order expected mid-year 2019. TSCR (1) (18.2) Jan-19 TBD TBD Application to flow back to customers certain benefits from the TCJA. Initial impact reflects credits for 2018 ($(10.2) million) and 2019 ($(8.0) million), with mechanism to begin in conjunction with new base rates. Note: Please see slides posted under regulatory information for additional detail (http://investors.centerpointenergy.com/regulatory-information) CSIA – Compliance and System Improvement Adjustment; DRR – Distribution Replacement Rider; TSCR – Tax Savings Credit Rider (1) Represents proposed increases (decreases) when effective date and/or approval date is not yet determined. Approved rates could differ materially from proposed rates
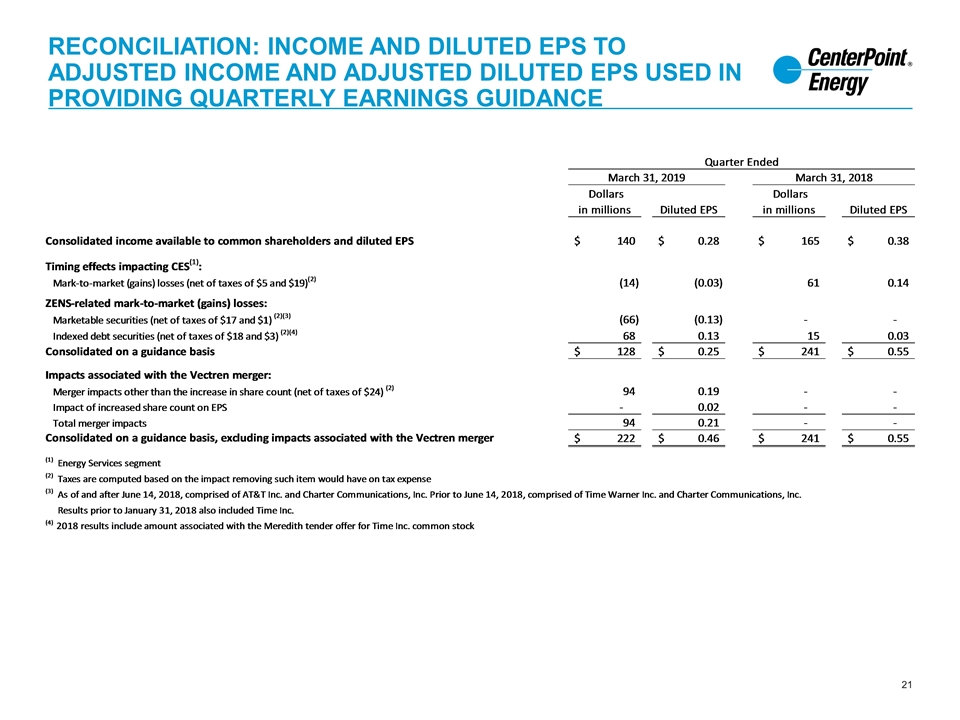
Reconciliation: Income and Diluted EPS to Adjusted Income and Adjusted Diluted EPS Used in Providing quarterly Earnings Guidance
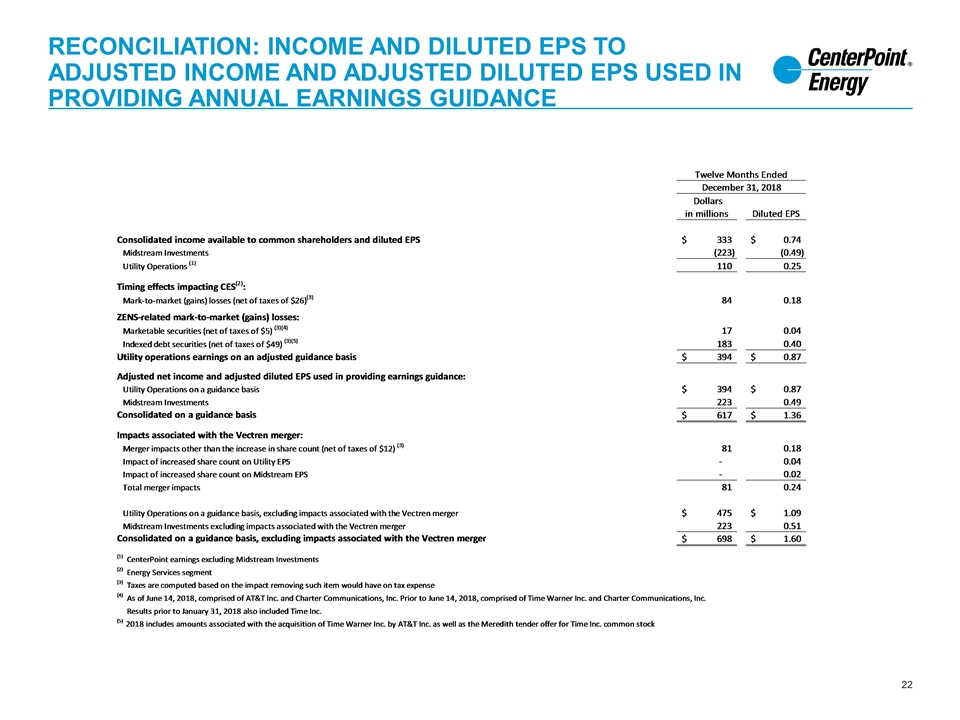
Reconciliation: Income and Diluted EPS to Adjusted Income and Adjusted Diluted EPS Used in Providing annual Earnings Guidance
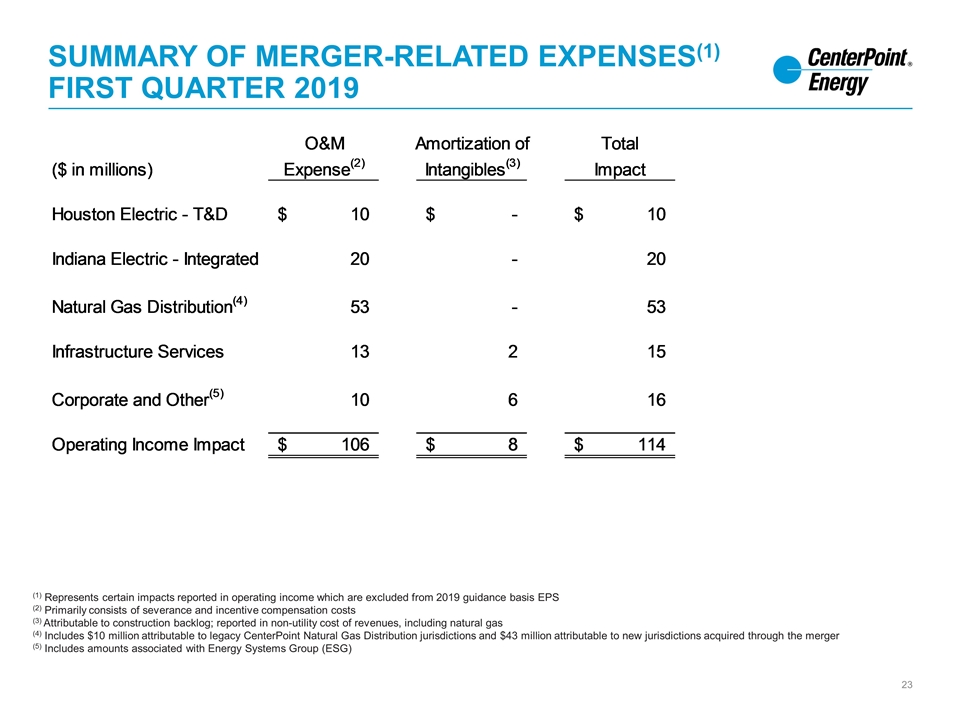
Summary of merger-related expenses(1) first quarter 2019 (1) Represents certain impacts reported in operating income which are excluded from 2019 guidance basis EPS (2) Primarily consists of severance and incentive compensation costs (3) Attributable to construction backlog; reported in non-utility cost of revenues, including natural gas (4) Includes $10 million attributable to legacy CenterPoint Natural Gas Distribution jurisdictions and $43 million attributable to new jurisdictions acquired through the merger (5) Includes amounts associated with Energy Systems Group (ESG)


