 Confidential PROJECT WELLINGTON Minneapolis San Francisco New York London Chicago Palo Alto Shanghai* *Strategic Alliance Presentation to the Special Committee of the Board of Directors July 19, 2006 Exhibit (c)(2) |
 2 Confidential TABLE OF CONTENTS Section I Wellington Overview Section II Overview of the Proposed Transaction Section III Summary of Due Diligence Procedures Section IV Summary of Analyses |
 Confidential SECTION I Wellington Overview |
 4 Confidential WELLINGTON OVERVIEW Company Overview • Wellington was formed on November 6, 2000 for the purpose of effecting a combination of Early Childhood LLC and Smarterkids.com, Inc. The two companies were combined on April 30, 2001 and began trading on the NASDAQ Composite on May 1, 2001 at $5.61 per share • Wellington is a developer, manufacturer and retailer of educational products which are sold to child care programs, elementary schools and consumers. The Company serves early childhood professionals, educators and consumers by providing high quality educational products and programs for children from infancy to 12 years of age • The Company operates in two business segments, Early Childhood and Elementary School: – The Early Childhood Segment develops, markets and sells educational products through multiple distribution channels primarily to early childhood professionals and, to a lesser extent, consumers. Through this segment, the Company also provides information to teachers and other education professionals regarding the development of children from infancy through age eight – The Elementary School Segment sells school supplies and other products specifically targeted for use by children in kindergarten through sixth grade to elementary schools, teachers and other education organizations. Those parties then resell the products either as a fundraising device for the benefit of a particular school, student program or other community organization, or as a service project to the school |
 5 Confidential WELLINGTON OVERVIEW Company Overview (cont’d) • On August 12, 2005, the Company announced a delay in the filing of its Form 10-Q for the three and six months ended June 30, 2005 pending the completion of an internal investigation of allegations by current and former accounting personnel that the Company had failed to record and accrue for certain obligations for the fiscal year ended December 31, 2004 • The staff in the Division of Enforcement in the San Francisco District Office of the SEC informed the Company in October 2005 that it was conducting an informal inquiry into the Company’s restatement and related circumstances. The staff obtained a non-public formal order of investigation from the Commission in January 2006 • After delays in publicly reporting their financial performance and a restatement of the Company’s 2004 10-K, the Company was delisted from NASDAQ on February 3, 2006. The Company’s stock is currently traded on “pink sheets” |
 6 Confidential WELLINGTON OVERVIEW Board’s Rationale for Evaluating Strategic Alternatives • Wellington suffers from a lack of research coverage, thin trading volume, and relatively small institutional investor interest • As a result, the Company enjoys few of the benefits of being a public company: – The public market is currently valuing Wellington’s shares at a low multiple relative to its peers – Low trading volume for the Company’s stock has afforded its shareholders limited liquidity – The Company’s market cap and trading volume make it difficult to effectively access the public equity markets as a financing source • However, Wellington remains subject to the costs associated with being a public company – Legal, accounting and reporting costs – Management time – Meeting short-term expectations of the public market – Sarbanes-Oxley related costs |
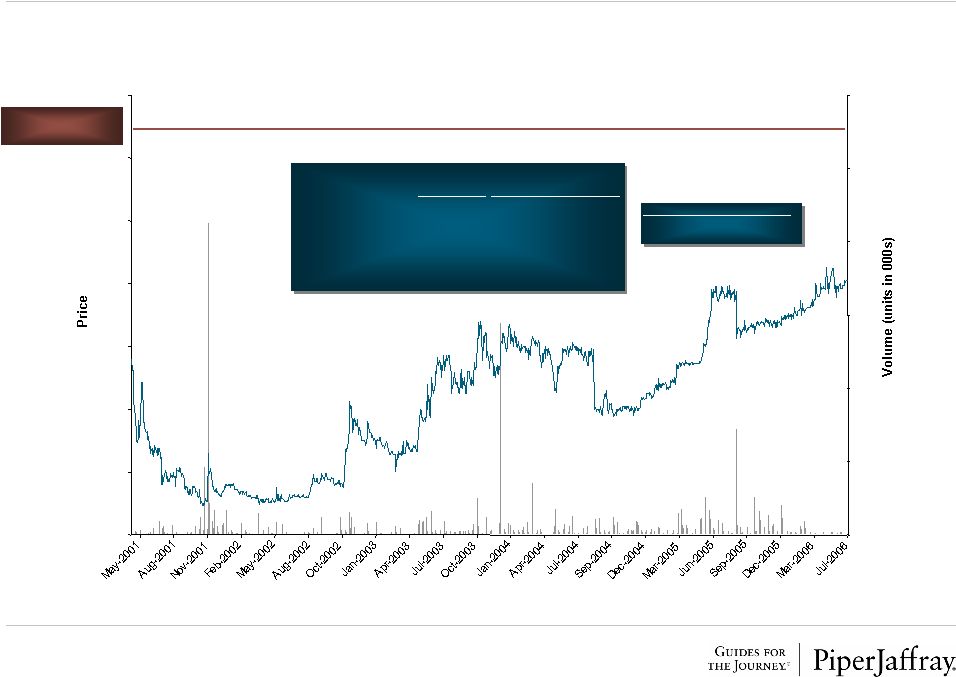 7 Confidential WELLINGTON OVERVIEW Historical Stock Price Performance Source: Capital IQ Data as of 7/18/2006 $13.00 per share Offer Price Premium Represented by Price $13.00 Offer Price Current (as of 7/18/2006) $8.10 60.5% 1-Week Ago $8.05 61.5% 1-Month Ago $7.95 63.5% 1-Year Average $7.31 77.9% 2-Year Average $6.20 109.8% 3-Year Average $6.02 116.0% 52-Week High $9.45 37.6% Volume 3-Month Average (000s) 1.969 1-Year Average (000s) 5.781 0 100 200 300 400 500 600 $0.00 $2.00 $4.00 $6.00 $8.00 $10.00 $12.00 $14.00 |
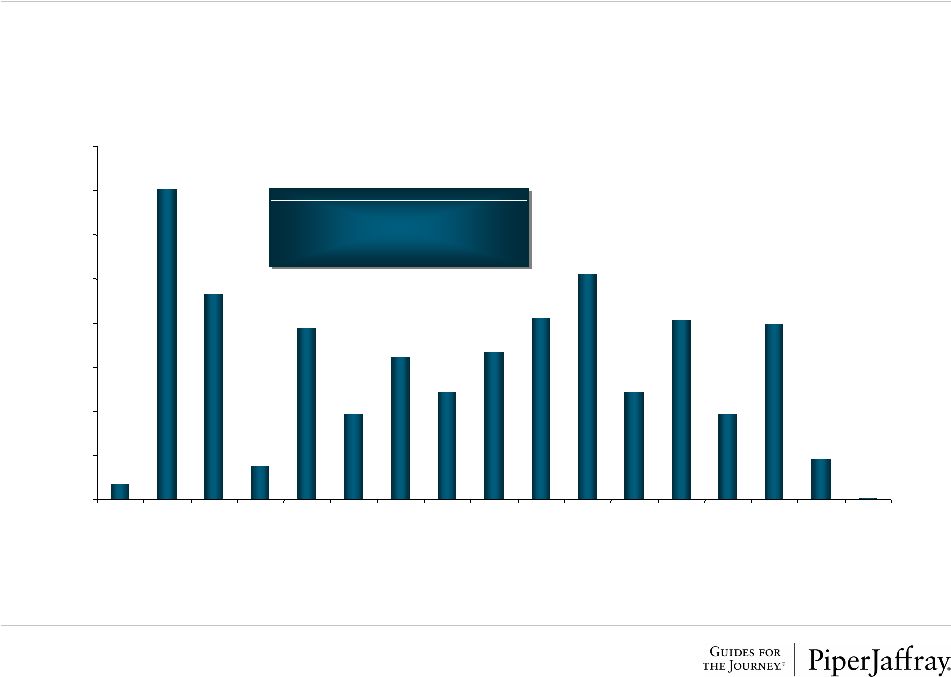 8 Confidential WELLINGTON OVERVIEW Closing Share Price Trading Ranges Since 2001 Merger Source: Capital IQ Data as of 7/18/2006 Trading Statistics Average Closing Price $4.41 Total Volume (000s) 11,349.930 Average Daily Volume (000s): 8.346 Shares Traded Below Offer Price ($13.00) 100% 1% 14% 9% 1% 8% 4% 6% 5% 7% 8% 10% 5% 8% 4% 8% 2% 0% 0% 2% 4% 6% 8% 10% 12% 14% 16% $0.51 - $1.00 $1.01 - $1.50 $1.51 - $2.00 $2.01 - $2.50 $2.51 - $3.00 $3.01 - $3.50 $3.51 - $4.00 $4.01 - $4.50 $4.51 - $5.00 $5.01 - $5.50 $5.51 - $6.00 $6.01 - $6.50 $6.51 - $7.00 $7.01 - $7.50 $7.51 - $8.00 $8.01 - $8.50 $8.51 - $9.00 |
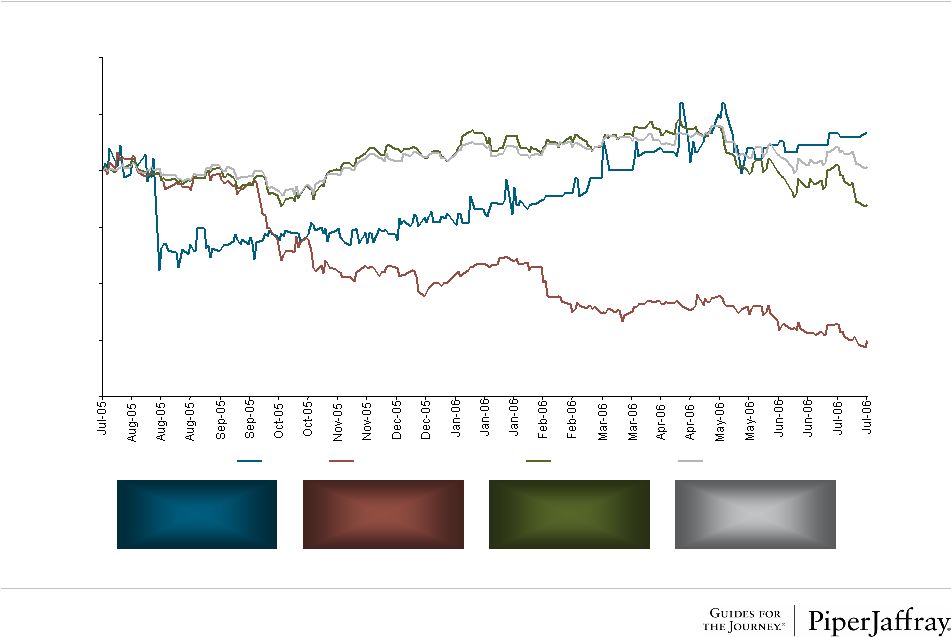 9 Confidential WELLINGTON OVERVIEW Relative Price Performance Wellington’s Return: 6.6% S&P 500’s Return: 0.6% Comparable Company Group’s Return: -30.1% NASDAQ Composite’s Return: -6.0% Source: Capital IQ Note: Comparable Company Group includes Bright Horizons Family Solutions Inc., Educate Inc., Scholastic Corp., and School Specialty Inc.; Group’s performance weighted by market capitalization; Performances reflect adjusted closing prices; Data as of 7/18/2006 60 70 80 90 100 110 120 Wellington Comparable Company Group NASDAQ Composite S&P 500 |
 10 Confidential WELLINGTON OVERVIEW Ownership Profile Institutional Holdings 17% Insider Holdings 22% Private Equity Holdings 15% Other Holdings 46% Institutional Holdings (1) Private Equity Holdings (2) % of Total Diluted % of Total Diluted Institution Shares Shares Outstanding Firm Shares Shares Outstanding Gruber & McBaine Capital Management 546,575 5.590% William E. Simon & Sons Private Equity Partners, L.P. 1,478,700 15.124% Rutabaga Capital Management 495,963 5.073% Total Private Equity Holdings 1,478,700 15.124% Heartland Advisors Inc. 371,700 3.802% Ashford Capital Management 90,800 0.929% Other Holdings First Wilshire Securities Management 75,599 0.773% % of Total Diluted Bard Associates Inc. 56,699 0.580% Description Shares Shares Outstanding Aegon Investment Management 4,660 0.048% Total Other Holdings 4,470,791 45.726% California Public Employees Retirement System 4,600 0.047% Northern Trust Investments 600 0.006% Total Shares Outstanding 9,055,935 92.622% Axa Rosenberg Investment Management 300 0.003% Bear, Stearns & Co. 62 0.001% Total Diluted Shares Outstanding 9,777,324 100.000% Total Institutional Holdings 1,647,558 16.851% Insider Holdings (2) Ownership Breakdown Total Options % of Total Diluted Insider Outstanding Shares Shares Outstanding Ronald Elliott 180,000 1,328,204 15.426% Richard Delaney 40,000 116,000 1.596% Judith McGuinn 97,522 291 1.000% Colin Gallagher 40,000 10,000 0.511% Scott Graves 44,000 2,912 0.480% Dr. Louis Casagrande 44,000 - 0.450% Dean DeBiase 44,000 - 0.450% Vikas Arora 15,000 - 0.153% Robert MacDonald - 1,479 0.015% All Other Outstanding Options 216,867 - 2.218% Total Insider Holdings 721,389 1,458,886 22.299% Note: Data as of 7/18/2006 (1) Estimated ownership based on quarterly institutional filings (13F and 13G) and sum of funds filings (2) Source: Management |
 Confidential SECTION II Overview of the Proposed Transaction |
 12 Confidential OVERVIEW OF THE PROPOSED TRANSACTION Summary Units in Millions, except per share data Capitalization Current at 7/18/2006 Wellington at Offer Stock Price $8.10 $13.00 Common shares outstanding (1) (2) 9.1 9.1 Plus: Existing stock options (1) (2) (3) 0.7 0.7 Less: Shares Repurchased from Options Proceeds (4) (0.2) (0.1) Total diluted shares 9.6 9.6 Diluted Equity Value $77.4 $125.3 Plus: Debt at May 31, 2006 4.0 4.0 Less: Cash at May 31, 2006 (2.3) (2.3) Enterprise Value $79.1 $127.0 Multiple Analysis Metric Multiple Multiple Enterprise Value / LTM Revenue $136.5 0.6x 0.9x Enterprise Value / LTM EBIT $6.1 13.0x 20.8x Enterprise Value / LTM EBITDA $8.1 9.8x 15.7x Enterprise Value / LTM Revenue $136.5 0.6x 0.9x Enterprise Value / LTM Adjusted EBIT (5) $9.3 8.5x 13.6x Enterprise Value / LTM Adjusted EBITDA (5) $11.4 7.0x 11.2x Note: LTM as of 5/31/2006 (1) As of 7/18/2006 (2) Per management (3) "In the money" options (4) Using treasury stock method (5) Adjusted per Wellington Management for non-recurring one-time costs as set forth on page 24 |
 13 Confidential OVERVIEW OF THE PROPOSED TRANSACTION • Cash merger • $13.00 cash per share of Wellington common stock • Wellington shareholder approval • HSR clearance for the transaction • Voting agreements from certain directors and shareholders – Ronald Elliott – William E. Simon & Sons Private Equity Partners, L.P. • Ronald Elliott Key Deal Terms Terms / Structure Price Key Closing Conditions Voting Agreements Rollover Agreements |
 14 Confidential OVERVIEW OF THE PROPOSED TRANSACTION • All options will be accelerated and cashed out • Transaction is not subject to financing contingencies • Thoma Cressey Fund VIII, L.P. has guaranteed prompt and complete payment and performance of Parent’s obligations to the Company up to a liability cap of $15,000,000 (subject to the Guaranty) • Termination fee of $3,600,000 plus up to $1,400,000 in reimbursement of out-of-pocket expenses under certain circumstances • No solicitation or negotiation of alternative transactions except as provided for in merger agreement Financing Key Deal Terms (cont.) Options Termination Fee Non-Solicitation Guaranty |
 15 Confidential OVERVIEW OF THE PROPOSED TRANSACTION Transaction Background • February 22, 2006: Board of Directors engages Piper Jaffray to explore a range of strategic and financial alternatives • March 8, 2006: Organizational and due diligence meeting between the Company’s Management and Piper Jaffray • May 1, 2006: Piper Jaffray presents a range of strategic alternatives to the Board of Directors • May 22, 2006: The Board of Directors receives an unsolicited written offer from Thoma Cressey Equity Partners (“TCEP”) for $11.50 per share • May 23, 2006: The Board of Directors convenes for a scheduled board meeting and presentation of further information regarding specific alternatives from Piper Jaffray. The Board of Directors discusses the TCEP offer and mandates Piper Jaffray to contact other potential buyers (see results of this on following page) • June 6, 2006: TCEP, the Chairman of the Board, and Piper Jaffray meet to discuss TCEP’s offer • June 12, 2006: At the request of the Board of Directors, Piper Jaffray informs TCEP that the Board would consider a deal at $13.00 per share • June 13, 2006: The Board of Directors receives a revised offer from TCEP for $13.00 per share in cash, contemplating a one-step merger and a rollover of stock by Ronald Elliott • June 14, 2006: The Board of Directors meets to discuss the revised TCEP proposal and receives an update from Piper Jaffray on the status of other potential buyers. The Board of Directors voted in favor of investigating a transaction with TCEP on the terms of the revised offer and forms a Special Committee of disinterested directors to direct all aspects of such potential transaction • June 15, 2006: An exclusivity agreement is signed with TCEP, granting TCEP exclusivity through July 19, 2006 to conduct diligence and complete definitive documentation for a transaction |
 16 Confidential OVERVIEW OF THE PROPOSED TRANSACTION Buyers Contacted • At the request of the Board of Directors, Piper Jaffray contacted 15 potential strategic buyers with a description of the Company but not revealing the Company’s name until a confidentiality agreement was executed • Of the 15 potential buyers Respondents – Were not interested in pursuing the acquisition opportunity as described: 7 – Were unresponsive to multiple contacts: 5 – Signed a confidentiality agreement and received additional information: 3 • Of the three that received additional financial information – Declined / unresponsive after reviewing the information: 2 – Provided a verbal expression of interest: 1 • The party that provided a verbal indication of interest – Provided a value range of $110 – $120 million enterprise value |
 Confidential SECTION III Summary of Due Diligence Procedures |
 18 Confidential Overview • We reviewed the following information regarding Wellington and the transaction: – Public filings and press releases of the Company – Project Wellington data site (confidential ftp website) documents that were provided to Thoma Cressey, including: – Historical consolidated financials for fiscal years 2002 to 2005 and 2006 YTD – Historical segment level data and P&Ls for the fiscal years 2002 to 2005 and 2006 YTD – Projected consolidated financials for June 2006, Q3 and Q4 2006E and fiscal years 2007E through 2010E – Drafts of the Merger, Voting and Guaranty Agreements including final drafts – Management’s analysis of estimated net operating loss tax benefits – LTM financial information as adjusted on a proforma basis by Wellington management for the non-recurring one-time costs estimated to have been incurred in connection with the Company’s restatement and SEC investigation and other litigation not in the ordinary course as more fully described on page 24 – Miscellaneous: Analysis of various information sent and presentations made to TCEP • We conducted or participated in due diligence review sessions / conversations as follows: – Met with Wellington management or participated in conference calls on various dates – Met with CEO, Board of Directors and other senior management to discuss historical and projected financials – Review included discussions with CEO, COO, Finance Consultant, Senior Finance Manager and other senior managers regarding current and future strategy; historical and projected financial results and performance; corporate organization; marketing initiatives; customer acquisition and channel review; warehouse and fulfillment operations; product introductions and sourcing (numerous meetings and conference calls) – Participated in due diligence reviews with TCEP (June 19-21, 2006) – Participated in corporate, warehouse and operation facilities tours – Discussions with outside legal counsel for Wellington, Latham & Watkins – Discussion with KPMG, Wellington’s accountants – Discussed transaction history, drafts of the Agreement and Plan of Merger, transaction issues and timing SUMMARY OF DUE DILIGENCE PROCEDURES |
 19 Confidential Management Adjustments for Non-Recurring Costs RESTATEMENT AND SEC INVESTIGATION RELATED COSTS • We reviewed the following information furnished by management or publicly available regarding the SEC investigation and restatements: – Annual, quarterly and monthly costs related to the investigation and the related restatements – The cause of the investigation described in the SEC filings – Restatement amounts shown in the SEC filings – Remediation actions described in the SEC filings – Restatement amounts described in press releases – Restatement invoices – Detail of restatement journal entries – Remediation log file • We conducted or participated in the following review sessions / conversations regarding the SEC investigation and restatements: – Discussed the cause of investigation, restatements, invoices and remediation actions with the management team and finance consultant – Received updates from the management team on the status of the investigation and restatement – Conference calls with Wellington’s legal counsel, Latham & Watkins, regarding the historical and ongoing investigation, and potential future exposure and costs – Discussion with Wellington’s accounting firm, KPMG, regarding the investigation and restatements OTHER • Review and discussion of non-SEC adjustments SUMMARY OF DUE DILIGENCE PROCEDURES |
 Confidential SECTION IV Summary of Analyses |
 21 Confidential SUMMARY OF ANALYSES Summary of Analyses Offer Price $2.50 $5.00 $7.50 $10.00 $12.50 $15.00 $17.50 $20.00 Public Comparables M&A Comparables Premiums DCF Relevant LTM 2006P 2006P LTM Price as of Price as of Price as of Assumptions Wellington Adj. EBITDA (1) Adj. EPS (2) Adj. EBITDA (1) Adj. EBITDA (1) 7/17/06 7/10/06 6/17/06 Discount Metric $11.4 $0.72 $13.8 $11.4 $8.10 $8.05 $7.85 Rates Maximum 12.1x 22.9x 10.6x 14.0x 102.8% 103.5% 120.7% 16.0% - 18.0% Mean 9.4x 19.6x 9.0x 10.3x 25.6% 26.8% 30.8% Median 10.5x 21.2x 8.7x 10.9x 20.5% 22.2% 27.1% Terminal Minimum 4.5x 13.0x 8.0x 7.4x (13.0%) (11.4%) (8.0%) EBITDA Mult. Multiple at 7.0x - 8.0x $13.00 11.2x 18.0x 9.2x 11.2x 60.5% 61.5% 65.6% Note: Thin bars represent minimum and maximum values; Wide bars represent mean and median values (1) Adjusted per Wellington Management for non-recurring one-time costs as set forth on page 24 (2) Adjusted per Wellington Management for non-recurring one-time costs as set forth on pages 23 and 24 |
 22 Confidential SUMMARY OF ANALYSES Historical and Projected Financials Fiscal Year Ending December 31 $ in Thousands HISTORICAL LTM ESTIMATED 2002 2003 2004 2005 5/31/2006 2006 2007 2008 2009 2010 Early Childhood Revenue 70,190 $ 78,490 $ 90,908 $ 102,892 $ 106,784 $ 115,484 $ 135,312 $ 157,242 $ 173,048 $ 190,230 $ Elementary School Revenue 30,570 31,431 30,080 29,852 29,697 30,760 32,440 35,058 37,148 39,005 Revenue 100,760 109,921 120,988 132,744 136,481 146,245 167,752 192,300 210,195 229,235 Cost of Goods Sold 64,478 70,427 80,408 86,727 88,362 93,788 107,361 123,094 134,049 145,573 Gross Profit 36,282 39,494 40,580 46,017 48,119 52,456 60,391 69,206 76,147 83,662 Selling, General, & Administrative Costs 32,891 34,857 38,430 40,032 42,028 42,181 47,347 54,014 58,755 61,893 Add-Back: Adjustments (1) (879) - (874) (2,248) (3,240) (1,323) - - - - Adjusted EBIT 4,270 4,637 3,023 8,233 9,332 11,597 13,044 15,192 17,392 21,768 Depreciation 1,266 1,418 1,538 1,697 1,846 2,057 2,568 2,374 2,482 2,743 Amortization 288 279 173 174 174 113 173 158 61 6 Adjusted EBITDA 5,824 $ 6,334 $ 4,735 $ 10,104 $ 11,352 $ 13,767 $ 15,785 $ 17,724 $ 19,935 $ 24,517 $ Capital Expenditures 1,203 $ 1,183 $ 1,864 $ 1,659 $ - 2,025 $ 2,246 $ 2,267 $ 2,423 $ 2,583 $ Net Working Capital (2) 14,763 18,371 21,734 20,928 33,172 24,428 27,990 32,089 35,005 38,089 (Increase) / Decrease in Working Capital 1,687 (3,608) (3,363) 806 (5,210) (3,500) (3,562) (4,099) (2,916) (3,084) Key Financial Ratios Early Childhood Revenue Growth 11.4% 11.8% 15.8% 13.2% - 12.2% 17.2% 16.2% 10.1% 9.9% Elementary School Revenue Growth 2.4% 2.8% -4.3% -0.8% - 3.0% 5.5% 8.1% 6.0% 5.0% Total Revenue Growth 8.5% 9.1% 10.1% 9.7% - 10.2% 14.7% 14.6% 9.3% 9.1% Gross Profit Margin 36.0% 35.9% 33.5% 34.7% 35.3% 35.9% 36.0% 36.0% 36.2% 36.5% Adjusted EBIT Margin 4.2% 4.2% 2.5% 6.2% 6.8% 7.9% 7.8% 7.9% 8.3% 9.5% Adjusted EBITDA Margin 5.8% 5.8% 3.9% 7.6% 8.3% 9.4% 9.4% 9.2% 9.5% 10.7% Capital Expenditures / Revenue 1.2% 1.1% 1.5% 1.2% - 1.4% 1.3% 1.2% 1.2% 1.1% Net Working Capital / Revenue 14.7% 16.7% 18.0% 15.8% 24.3% 16.7% 16.7% 16.7% 16.7% 16.6% (Increase) / Decrease in Working Capital / Revenue 1.7% -3.3% -2.8% 0.6% -3.8% -2.4% -2.1% -2.1% -1.4% -1.3% Source: Management and public filings (1) See summary of adjustments page for further detail (2) Excludes cash and debt |
 23 Confidential SUMMARY OF ANALYSES Detail of 2006 Estimates Fiscal Year Ending December 31 $ in Thousands Quarter Ending FY Ending 3/31/2006 A 6/30/2006 E 9/30/2006 E 12/31/2006 E 12/31/2006 E Early Childhood Revenue 23,400 $ 26,506 $ 40,607 $ 24,972 $ 115,484 $ Elementary School Revenue 1,560 5,871 20,566 2,763 30,760 Revenue 24,960 32,377 61,173 27,735 146,245 Cost of Goods Sold 15,695 20,341 39,735 18,018 93,788 Gross Profit 9,265 12,036 21,438 9,718 52,456 Selling, General, & Administrative Costs 10,831 9,655 11,882 9,813 42,181 Add-Back: Adjustments (1) (1,234) (88) - - (1,323) Adjusted EBIT (331) 2,469 9,555 (96) 11,597 Interest Expense - 42 65 10 117 Interest (Income) (69) (26) (20) (5) (120) Pre-Tax Income (262) 2,453 9,510 (101) 11,600 Income Taxes (2) (99) 981 3,804 (40) 4,646 Net Income (163) 1,472 5,706 (60) 6,955 Diluted Shares Outstanding (000s) (3) 9,637.101 Earnings per Share 0.72 $ Depreciation 490 516 524 526 2,057 Amortization 43 35 18 18 113 Adjusted EBITDA 202 $ 3,020 $ 10,097 $ 448 $ 13,767 $ Key Financial Ratios Gross Profit Margin 37.1% 37.2% 35.0% 35.0% 35.9% Pre-Tax Income Margin -1.1% 7.6% 15.5% -0.4% 7.9% Net Income Margin -0.7% 4.5% 9.3% -0.2% 4.8% Adjusted EBIT Margin -1.3% 7.6% 15.6% -0.3% 7.9% Adjusted EBITDA Margin 0.8% 9.3% 16.5% 1.6% 9.4% Source: Management and public filings Note: 6/30/2006 figures include two months of actual financial results and one month of estimates (1) See summary of adjustments page for further detail (2) Q1 income taxes assume additional tax expense due to adjustment taxed at 40.0% (3) Diluted shares outstanding calculated using treasury stock method based upon offer price of $13.00 per share |
 24 Confidential SUMMARY OF ANALYSES Summary of Management Adjustments of Non-Recurring Costs Fiscal Year Ending December 31 Adjustments LTM 2002 2003 2004 2005 5/31/2006 2006 RESTATEMENT AND SEC INVESTIGATION RELATED COSTS Accounting - $ - $ - $ 741,907 $ 1,213,201 $ 471,294 $ Consulting - - - 204,901 308,275 103,374 Legal - - - 896,695 1,572,957 676,262 Other - - - 69,157 136,729 67,572 OTHER Legal (1) - - 874,000 330,034 - - Merger Related (2) 879,000 - - - - - NASDAQ - - - 5,000 9,000 4,000 Total 879,000 $ - $ 874,000 $ 2,247,694 $ 3,240,161 $ 1,322,501 $ Source: Management (1) Related to legal fees for the Company pursuing a complaint against a competitor for, among other things, trade secret misappropriation, unfair competition and copyright infringement (2) Related to certain facility closures of the Company |
 25 Confidential SUMMARY OF ANALYSES Comparable Public Companies Analysis • Piper Jaffray has reviewed and compared certain actual and estimated publicly available financial, operating, and stock market information of Wellington and selected publicly-traded companies • Company Standard Industry Classification search criteria: – 5961 - Catalog & Mail-Order Houses – 8200 - Educational Services – 8351 - Child Day Care Services – 3944 - Games, Toys, and Children's Vehicles – 5092 - Toys and Hobby Goods and Supplies – 2731 - Book Publishing – 2741 - Misc. Publishing • Company financial criteria: – Market capitalization between $100 million and $1.2 billion – Trailing revenue greater than $100 million – Profitable on a trailing EBITDA basis • Bright Horizons Family Solutions Inc. • Educate Inc. • Scholastic Corp. • School Specialty Inc. Selection Criteria Overview Selected Companies (n=4) |
 26 Confidential SUMMARY OF ANALYSES Comparable Public Companies Analysis $ in Millions, except per share data LTM Multiples 2006P Multiples Fiscal LTM Price Market Net Enterprise LTM Financial Performance CY 2006P CY 2006P CY 2006P / 2004 EBITDA Enterprise Value / Price / EV / Ticker Company Year End Period 7/18/06 Capitalization Debt Value Revenue EBIT EBITDA EPS (1) EBITDA (1) Revenue CAGR (1) Margin Revenue EBIT EBITDA EPS EBITDA BFAM Bright Horizons Family Solutions Inc. 12/31 3/31/2006 33.82 $ 978.9 $ (22.1) $ 956.8 $ 643.6 $ 63.8 $ 79.1 $ 1.48 $ 90.7 $ 13.1% 12.3% 1.5x 15.0x 12.1x 22.9x 10.6x EEEE Educate Inc. 12/31 3/31/2006 6.91 296.5 159.3 455.9 340.8 38.9 48.1 0.53 56.7 19.5% 14.1% 1.3x 11.7x 9.5x 13.0x 8.0x SCHL Scholastic Corp. 5/31 2/28/2006 27.58 1,170.4 352.8 1,523.2 2,274.9 201.9 339.9 1.26 185.9 1.5% 14.9% 0.7x 7.5x 4.5x 21.9x 8.2x SCHS School Specialty Inc. 4/29 4/29/2006 30.87 709.0 414.8 1,123.8 1,015.7 69.3 97.3 1.50 122.5 3.1% 9.6% 1.1x 16.2x 11.6x 20.6x 9.2x High 19.5% 14.9% 1.5x 16.2x 12.1x 22.9x 10.6x Mean 9.3% 12.7% 1.1x 12.6x 9.4x 19.6x 9.0x Median 8.1% 13.2% 1.2x 13.4x 10.5x 21.2x 8.7x Low 1.5% 9.6% 0.7x 7.5x 4.5x 13.0x 8.0x Wellington at Offer Price (2) 12/31 5/31/2006 13.00 $ 125.3 $ 1.7 $ 127.0 $ 136.5 $ 9.3 $ 11.4 $ 0.72 $ 13.8 $ 9.9% 8.3% 0.9x 13.6x 11.2x 18.0x 9.2x (1) Per Reuters mean majority basisEPS,EBITDAandRevenue estimates;Wellington's 2006P EPS,EBITDAand Revenueper Management estimates; Due tooff-cycle reporting periods, SCHL'scalendaryear-end takenasof 11/31/2006andSCHS'scalendaryear-end takenasof 1/31/2007 (2) Assumes adjusted EBIT and EBITDA |
 27 Confidential Selection Criteria Overview Selected Targets (n=11) SUMMARY OF ANALYSES Comparable M&A Transactions Analysis • Piper Jaffray has reviewed transactions involving target companies believed by Piper Jaffray to be comparable • Company Standard Industry Classification search criteria: – 5961 - Catalog & Mail-Order Houses – 8200 - Educational Services – 8351 - Child Day Care Services – 3944 - Games, Toys, and Children's Vehicles – 5092 - Toys and Hobby Goods and Supplies – 2731 - Book Publishing – 2741 - Misc. Publishing • Transactions that have announced and closed over the past five years • Transactions in which the acquiring company purchased a controlling interest of the target • National Business Furniture OCM Direct, Inc. • Delta Education, LLC Learning Curve International, Inc. • Rose Art Industries, Inc. ABC School Supply • Crosstown Traders, Inc. Dan's Competition Inc. • Cornerstone Brands, Inc. Premier Agendas, Inc. • The Golf Warehouse |
 28 Confidential SUMMARY OF ANALYSES Comparable M&A Transactions Analysis $ in Millions, except per share data Transaction Multiples Announcement Enterprise Target LTM Financial Performance Enterprise Value / Date Target Acquiror Value Revenue EBIT EBITDA Revenue EBIT EBITDA 9/28/2005 National Business Furniture (1) (2) K+K America Corp 82.0 $ 127.5 $ 6.4 $ 7.1 $ 0.6x 12.9x 11.5x 8/19/2005 Delta Education, LLC (1) School Specialty Inc. 272.0 95.6 16.1 21.0 2.8x 16.9x 13.0x 6/15/2005 Rose Art Industries, Inc. (1) Mega Bloks Inc. 400.5 285.0 46.5 50.0 1.4x 8.6x 8.0x 5/19/2005 Crosstown Traders, Inc. (1) Charming Shoppes Inc. 255.8 458.2 27.6 29.5 0.6x 9.3x 8.7x 3/1/2005 Cornerstone Brands, Inc. (1) (2) (3) IAC/InterActiveCorp 720.0 720.0 59.0 66.0 1.0x 12.2x 10.9x 6/29/2004 The Golf Warehouse (1) Sportsman's Guide Inc. 30.3 45.5 2.2 2.6 0.7x 14.0x 11.7x 5/5/2003 OCM Direct, Inc. (1) Alloy Inc 20.6 28.5 0.6 1.8 0.7x NM 11.4x 2/3/2003 Learning Curve International, Inc. (1) RC2 Corp. 114.0 136.9 12.0 15.4 0.8x 9.5x 7.4x 8/14/2002 ABC School Supply (1) (2) School Specialty Inc. 41.6 48.0 - 5.3 0.9x NA 7.8x 9/28/2001 Dan's Competition Inc. (1) Alloy Inc. 36.8 22.6 2.5 2.6 1.6x 14.7x 14.0x 11/13/2001 Premier Agendas, Inc. (1) School Specialty Inc. 155.9 91.3 11.5 17.2 1.7x 13.5x 9.0x High 2.8x 16.9x 14.0x Mean 1.2x 12.4x 10.3x Median 0.9x 12.9x 10.9x Low 0.6x 8.6x 7.4x Wellington at Offer Price (4) 127.0 $ 136.5 $ 9.3 $ 11.4 $ 0.9x 13.6x 11.2x (1) Information from publicly filed documents (2) Information from Wall Street analyst reports (3) Information from press releases (4) Assumes adjusted EBIT and EBITDA |
 29 Confidential Overview Key Assumptions SUMMARY OF ANALYSES Discounted Cash Flows Analysis • The Discounted Cash Flows Analysis is used to calculate a range of theoretical values for Wellington based on the net present value of (i) Wellington’s implied annual cash flows; (ii) a terminal value of Wellington at fiscal year ending December 31, 2010 based upon a multiple of EBITDA; and (iii) net operating loss tax benefits • For the purposes of this analysis, the following range of assumptions were used: – 5-year cash flows discounted back to May 31, 2006 – Discount rates: 16.0% - 18.0% – EBITDA exit multiples of 7.0x to 8.0x – Assumed tax rate of 40% provided by Wellington management – Analyzed discount rates based upon the WACC of comparable company group in addition to other considerations – Analyzed the Company’s existing net operating loss (NOL) carry-forwards • The projected financial data was prepared by management |
 30 Confidential SUMMARY OF ANALYSES Discounted Cash Flows Analysis Fiscal Year Ending December 31 $ in Thousands, except per share data Projected Cash Flows Jun. - Dec. 2006P 2007P 2008P 2009P 2010P Adjusted EBIT 10,502 $ 13,044 $ 15,192 $ 17,392 $ 21,768 $ Less:Taxes @ 40.0% (4,201) (5,217) (6,077) (6,957) (8,707) After-tax Operating Income 6,301 7,826 9,115 10,435 13,061 Plus: Depreciation & Amortization 1,264 2,741 2,532 2,543 2,749 Less:Capital Expenditures (1,044) (2,246) (2,267) (2,423) (2,583) Less:(Inc) / Dec in Working Capital 8,744 (3,562) (4,099) (2,916) (3,084) Free Cash Flows 15,265 4,760 5,282 7,639 10,143 Terminal Cash Flows @ 7.5x 2010P EBITDA - - - - 183,879 Total Free Cash Flows 15,265 $ 4,760 $ 5,282 $ 7,639 $ 194,022 $ NPV Calculation @ 5/31/2006 Company Value - Sensitivity Analysis NPV of Free Cash Flows 31,662 $ Discount Rate NPV of Terminal Cash Flows 89,459 16.0% 17.0% 18.0% NPV of NOL Tax Benefits 5,719 Terminal 7.0x $124,717 $120,876 $117,208 Company Value 126,840 EBITDA 7.5x $130,921 $126,840 $122,944 Plus: Cash / (Net Debt) (1,729) Multiple 8.0x $137,124 $132,804 $128,679 Equity Value 125,111 $ Equity Value Per Share 12.98 Assumptions Equity Value per Share - Sensitivity Analysis LTM 5/31/2006 Adjusted EBITDA 11,352 $ Discount Rate Terminal EBITDA Multiple 7.5x 16.0% 17.0% 18.0% Discount Rate 17.0% Terminal 7.0x $12.76 $12.36 $11.98 Tax Rate 40.0% EBITDA 7.5x $13.41 $12.98 $12.58 Net Debt / (Cash) 1,729 Multiple 8.0x $14.05 $13.60 $13.17 Diluted Shares Outstanding (000s) (1) 9,636.912 Note: Assumes midpoint of free cash flows occurs on September 30th (1) Diluted shares outstanding calculated using treasury stock method of options accounting |
 31 Confidential SUMMARY OF ANALYSES Net Operating Loss Carry-Forwards Fiscal Year Ending December 31 $ in Thousands Net Operating Losses 2006P 2007P 2008P 2009P 2010P 2011P 2012P 2013P 2014P 2015P 2016P 2017P 2018P 2019P 2020P 2021P 2022P 2023P Net Operating Loss Utilized 6,358 $ 1,102 $ 1,102 $ 1,102 $ 1,102 $ 1,102 $ 1,102 $ 1,102 $ 1,102 $ 1,102 $ 1,102 $ 1,102 $ 1,102 $ 1,102 $ 1,102 $ 1,102 $ 7 $ 20 $ Federal Income Tax Benefit @ 35.0% 2,225 386 386 386 386 386 386 386 386 386 386 386 386 386 386 386 2 7 NPV of NOLs (7.0% Discount Rate) 5,719 $ NPV of NOL - Sensitivity Analysis Discount Rate 6.0% 7.0% 8.0% $5,955 $5,719 $5,506 Note: 2006P NOL not discounted; Reflects only federal tax benefits; State NOL tax benefits not deemed material Source: Management |
 32 Confidential Overview Selection Criteria Transactions SUMMARY OF ANALYSES Premiums Paid Analysis • The premiums paid analysis involves a review of purchase prices in public buyout transactions relative to pre-announcement prices • All industries, excluding REIT, financial, biopharmaceutical, high technology and telecommunications • Announced and completed transactions • Going-private transactions 1 and transactions in which public company receives only cash as consideration – Majority of shares purchased (>60%) • Transactions with values between $50 million and $250 million that have announced and closed over the past three years 1 Going private transaction defined as a private acquiror ('private' meaning that none of the acquiror's ultimate parentage is public either) acquiring a public target and upon completion remaining a private company |
 33 Confidential SUMMARY OF ANALYSES Premiums Paid Analysis Transaction Premiums Announcement 1 Day 1 Week 1 Month Date Target Acquiror Prior Prior Prior 5/22/2006 Main Street Restaurant Group Inc. Briad Main Street, Inc. 20.5% 23.1% 29.6% 2/17/2006 Checkers Drive In Restaurants Inc. Wellspring Capital Management, L.L.C. -1.1% 0.1% 1.5% 1/29/2006 Lowrance Electronics Inc. Simrad Yachting AS 48.0% 45.0% 41.4% 11/15/2005 Learning Care Group Inc. ABC Learning Centres Ltd. 36.4% 26.9% 23.4% 10/27/2005 Transport Corp. of America Inc. Goldner Hawn Johnson & Morrison, Inc. 25.0% 22.2% 33.9% 10/18/2005 Lancer Corp. Hoshizaki America, Inc. 10.6% 15.8% 15.8% 8/31/2005 Haggar Corp. Investor Group 27.8% 28.4% 32.9% 8/29/2005 Action Performance Companies, Inc. Motorsports Authentics Inc. 5.9% 16.1% 27.5% 7/11/2005 D&K Healthcare Resources Inc. McKesson Corp. 70.6% 70.8% 75.8% 7/1/2005 Tipperary Corp. Santos Ltd. 18.6% 15.8% 36.0% 6/2/2005 Cruzan International Inc. The Absolut Spirits Company, Inc. 102.8% 103.5% 101.9% 6/1/2005 Saucony Inc. Stride Rite Corp. 14.8% 16.8% 17.5% 4/28/2005 Worldwide Restaurant Concepts Inc. Pacific Equity Partners 46.5% 44.1% 42.2% 3/28/2005 Digital Impact, Inc. Acxiom Corp. 52.84% 80.41% 87.17% 1/4/2005 Total Logistics Inc. SUPERVALU Inc. 7.7% 11.8% 7.5% 12/27/2004 META Group Inc. Gartner Inc. 54.3% 62.9% 85.9% 12/20/2004 Chalone Wine Group Ltd. Diageo plc 1.2% 2.9% 20.9% 12/17/2004 Superior Consultant Holdings Corp. Affiliated Computer Services Inc. 29.2% 35.4% 29.2% 6/7/2004 The First Years Inc. RC2 Corp. 9.3% 12.7% 9.5% 5/23/2004 Wiser Oil Co. Forest Oil Corp. 32.2% 22.5% 20.5% 4/23/2004 Loehmanns Holdings Inc. Crescent Capital Investments, Inc. 5.7% 9.7% 14.1% 4/22/2004 MedSource Technologies Inc. Accellent Corp. 18.5% 18.9% 30.0% 4/8/2004 Isco, Inc. Teledyne Technologies Inc. 32.2% 33.4% 32.0% 3/24/2004 DigitalThink Inc. Convergys Corp. 30.4% 25.0% 23.1% Source: Securities Data Corporation; Capital IQ |
 34 Confidential SUMMARY OF ANALYSES Premiums Paid Analysis (cont’d) Transaction Premiums Announcement 1 Day 1 Week 1 Month Date Target Acquiror Prior Prior Prior 3/17/2004 Golden State Vintners Inc. The Wine Group Inc. -0.7% 5.8% 13.2% 2/27/2004 Landacorp Inc. SHPS Holdings, Inc. 0.7% 1.3% -4.0% 2/20/2004 Trover Solutions Inc. Tailwind Capital Partners 0.0% -0.7% -0.7% 2/15/2004 Butler Manufacturing Co. Bluscope Steel Ltd. 1.8% 0.9% 1.9% 2/4/2004 Rainbow Rentals Inc. Rent-A-Center Inc. 96.1% 96.1% 120.7% 1/30/2004 WorkFlow Management Inc. Investor Group 5.4% 3.6% -8.0% 12/31/2003 Gundle/SLT Environmental Inc. Code Hennessy & Simmons, L.L.C. -13.0% -10.1% -4.2% 12/19/2003 Summit America Television Inc. EW Scripps Co. 19.8% 13.1% 22.7% 11/26/2003 North Coast Energy Inc. EXCO Resources Inc. -10.2% -11.4% -7.8% 11/14/2003 Sylvan Inc. Snyder Associated Companies, Inc. 21.9% 22.0% 23.2% 11/7/2003 barnesandnoble.com Inc. Barnes & Noble Inc. 35.6% 32.6% 27.1% 11/3/2003 Invivo Corp. Intermagnetics General Corp. 34.9% 34.6% 46.5% 10/31/2003 Media Arts Group Inc. Investor Group 68.8% 80.2% 77.8% 9/29/2003 Good Guys Inc. CompUSA Inc. 36.7% 31.4% 45.5% 9/22/2003 United States Exploration Inc. Investor Group 0.7% -1.1% 2.2% 7/31/2003 dELiA*s, Inc. Alloy Inc. 17.7% 24.0% 31.0% 7/29/2003 The Elder-Beerman Stores Corp. Bon-Ton Stores Inc. 32.9% 33.3% 36.3% High 102.8% 103.5% 120.7% Mean 25.6% 26.8% 30.8% Median 20.5% 22.2% 27.1% Low -13.0% -11.4% -8.0% Wellington 60.5% 61.5% 65.6% Source: Securities Data Corporation; Capital IQ |