UNITED STATES
SECURITIES AND EXCHANGE COMMISSION
Washington, D.C. 20549
FORM N-CSR
CERTIFIED SHAREHOLDER REPORT OF REGISTERED
MANAGEMENT INVESTMENT COMPANIES
Investment Company Act file number 811-10267
GPS Funds I
(Exact name of registrant as specified in charter)
1655 Grant Street, 10th Floor
Concord, CA 94520
(Address of principal executive offices) (Zip code)
Patrick R Young
AssetMark, Inc.
1655 Grant Street, 10th Floor
Concord, CA 94520
(Name and address of agent for service)
800-664-5345
Registrant’s telephone number, including area code
Date of fiscal year end: March 31, 2023
Date of reporting period: April 1, 2022 through September 30, 2022
Item 1. Reports to Stockholders.
(a)
GuideMark® Funds
GuidePath® Funds
Investment Advisor
AssetMark, Inc.
September 30, 2022
GUIDEMARK® LARGE CAP CORE FUND
GUIDEMARK® EMERGING MARKETS FUND
GUIDEMARK® SMALL/MID CAP CORE FUND
GUIDEMARK® WORLD EX-US FUND
GUIDEMARK® CORE FIXED INCOME FUND
GUIDEPATH® GROWTH ALLOCATION FUND
GUIDEPATH® CONSERVATIVE ALLOCATION FUND
GUIDEPATH® TACTICAL ALLOCATION FUND
GUIDEPATH® ABSOLUTE RETURN ALLOCATION FUND
GUIDEPATH® MULTI-ASSET INCOME ALLOCATION FUND
GUIDEPATH® FLEXIBLE INCOME ALLOCATION FUND
GUIDEPATH® MANAGED FUTURES STRATEGY FUND
GUIDEPATH® CONSERVATIVE INCOME FUND
GUIDEPATH® INCOME FUND
GUIDEPATH® GROWTH AND INCOME FUND
Dear Shareholder:
Enclosed is the Semi-Annual Report for the GuideMark and GuidePath Funds covering the period from April 1, 2022 to September 30, 2022.
Market Review
For the 6-month reporting period ending September 30, 2022, US equities returned (20.2)%1. Headlines of slowing economic growth leading to an eventual recession and tightening monetary policy intended to tame persistently high inflation have plagued markets over the last 6 months. International developed markets underperformed US equities, returning (22.3)%2 in US dollar terms for the 6-month period ending September 30, 2022. Results were impacted by the war in Ukraine, with significant reliance on Russian commodity exports by Europe driving inflation to record highs in the region. A stronger US dollar also led to lower returns in international developed markets, as losses in local currencies stood at (10.9)%3. Emerging markets also struggled for the 6-month period ending September 30, 2022, declining (21.5)%4 as China’s continued restrictive, zero tolerance COVID policy remained highly disruptive to the region’s economy and markets.
Within US equity sectors, all 11 sectors posted negative returns for the 6-month period ending September 30, 2022. Energy was the best performing among the sectors with losses of 2.9%.5 In addition, defensive sectors such as Utilities and Healthcare rounded the top three as investors sought safety amid rising uncertainty, each returning (10.8)% for the 6-month period ending September 30, 20225. The worst performing sector for the 6-month period was Communication Services, a sector that can be viewed as non-essential and dependent on cashflows in the future, which was down 30.8%6 as of September 30, 2022. For many growth style stocks, investors historically have paid a premium for distant growth in earnings and cashflows. However, in a rising interest rate environment, investors tend to favor companies with near term cashflows such as dividend paying stocks and pull back from long duration stocks.
Within equity styles, across US large-cap stocks, while posting negative absolute returns, value outperformed growth for the 6-month reporting period by 7.4%7. This was a reversal from the last decade where value style underperformed but rising interest rates and lofty valuations put pressure on the growth segments driving underperformance of growth during the most of the reporting period. Across the capitalization spectrum, small-cap stocks outperformed large-cap stocks8.
Looking at broader asset class returns for the 6-month period ending September 30, 2022, commodities fell 9.5%9 as recession concerns weighed on future demand despite supply disruptions resulting from the ongoing war in Ukraine. Gold fell by 14.9%10 hurt by a rising US dollar, despite higher equity market volatility in 2022. Real estate investment trusts (REITs) returned (23.9)%11 over the same period hurt by rising interest rates.
Within fixed income, the US bond market started 2022 with its worst performance on record since the inception of the Bloomberg US Aggregate Bond Index as interest rates rose sharply after the Federal Reserve set out on a more aggressive path of monetary tightening in an effort to tame inflation. US core bonds returned (9.2)% for the 6-month period ending September 30, 202212. Longer-term Treasuries, which have the greatest sensitivity to interest-rate changes, were the hardest hit and fell 20.4%13 for the same time period. High yield bonds (which carry less interest rate sensitivity) fell 10.4%14, surprisingly outperforming investment grade corporate bonds, despite recessionary fears hitting other risk assets. Finally, emerging market bonds struggled with weaker regional ecnomic growth and a stronger US dollar, falling 12.4%15 for the 6-month period ending September 30, 2022.
Fund Review
Looking across the fund family, six of the 15 funds performed in line with or outperformed their benchmarks over the 6-month period.
| 1 | | Source: Zephyr Style Advisor. US equities represented by S&P 500 Index. |
| 2 | | Source: Zephyr Style Advisor. International developed market equities represented by MSCI EAFE Index USD. |
| 3 | | Source: Zephyr Style Advisor. International developed market equities represented by MSCI EAFE Index LCL. |
| 4 | | Source: Zephyr Style Advisor. Emerging market equities represented by MSCI Emerging Markets Index. |
| 5 | | Source: Zephyr Style Advisor. Energy sector represented by S&P 500 Energy Index; Utilities sector represented by S&P 500 Utilities Index; Health care sector represented by S&P 500 Healthcare Index. |
| 6 | | Source: Zephyr Style Advisor. Communication Services sector represented by S&P 500 Communication Services Index. |
| 7 | | Source: Zephyr Style Advisor. Large cap growth stocks represented by S&P 500 Growth Index and large cap value stocks represented by S&P 500 Value Index. |
| 8 | | Source: Zephyr Style Advisor. Large cap stocks represented by S&P 500 Index and small cap stocks represented by S&P 600 Index. |
| 9 | | Source: Zephyr Style Advisor. Commodities represented by Bloomberg Commodity Index. |
| 10 | | Source: Zephyr Style Advisor. Gold represented by Bloomberg Gold Subindex. |
| 11 | | Source: Zephyr Style Advisor. REITs represented by FTSE NAREIT All Equity REITs Index. |
| 12 | | Source Zephyr Style Advisor. US core bonds represented by Bloomberg US Aggregate Bond Index. |
| 13 | | Source: Zephyr Style Advisor. Long Treasuries represented by Bloomberg US Long Treasury Index. |
| 14 | | Source: Zephyr Style Advisor. High yield bonds represented by Bloomberg US Corporate High Yield Bond Index. |
| 15 | | Source: Zephyr Style Advisor. Emerging market bonds represented by Bloomberg Emerging Markets Aggregate Bond Index. |
1
Performance of the GuideMark Funds was mixed during the reporting period. The GuideMark Large Cap Core Fund outperformed its benchmark, benefitting from exposure to the momentum factor in light of trends growing stronger in value stocks in the latter part of the period as investors grew concerned over lofty valuations, rising interest rates, and inflationary pressures. The GuideMark Small/Mid Cap Fund, GuideMark World Ex-US Fund, and GuideMark Emerging Markets Fund lagged their respective benchmarks over the six month period largely due to their exposure to the quality factor. The GuideMark Core Fixed Income Fund underperformed its benchmark due its overweight allocation to corporate credit as well as agency-mortgage exposure which fell under pressure due to rising interest rates during the period.
The GuidePath Growth Allocation Fund, GuidePath Conservative Allocation Fund, GuidePath Absolute Return Allocation Fund and GuidePath Flexible Income Allocation Fund each underperformed its respective benchmark, generally as a result of broad asset class diversification, with exposure to global equities, and in particular growth-oriented equities, along with global REITs and long-term Treasuries and Treasury Inflation Protected Securities within fixed income all weighing on returns for the period. The GuidePath Tactical Allocation Fund outperformed its benchmark due to its overweight allocations to the Energy and Healthcare sectors. However, the Fund’s higher total equity positioning relative to its benchmark detracted during the period. The GuidePath Multi-Asset Income Allocation Fund outperformed its benchmark due to overweight exposures to US dividend equity, the Utilities sector, high yield bonds and mortgage backed securities during the period. The GuidePath Managed Futures Strategy Fund outperformed its benchmark for the 6-month period largely due to its strong performance in the second quarter. In particular, short positions in fixed income and long positioning in the U.S. dollar were primary contributors.
Of the three GuidePath income-focused funds, both the GuidePath Conservative Income Fund and the GuidePath Growth and Income Fund outperformed their respective benchmarks for the reporting period. The GuidePath Conservative Income Fund primarily benefited from a target allocation to cash equivalents that beat the negative returns of short-term Treasuries as the Federal Reserve signaled its willingness to continue raising interest rates. Exposure to master limited partnerships (MLPs) and energy-oriented stocks lifted returns in the GuidePath Growth and Income Fund, as did the Fund’s volatility targeting component especially during the August-September sharp market decline. The GuidePath Income Fund underperformed its benchmark for the period. The Fund’s allocation to investment grade credit within diversified bond exposures was a significant detractor from returns during the period. The Fund’s put-write strategy also detracted from returns, as the collection of the option premiums was offset by increased market volatility.
Looking Ahead
When we are so focused on the near term and current losses seen in portfolios, it’s really difficult to lean into the markets when they are ‘on sale’. Although a balanced and well diversified portfolio can help, we need to remember that market falls are part of a normal functioning market and bear markets always end. Investing into and during bear markets can be additive to investor returns as the strongest market returns historically have tended to occur after market downturns—the average 1-year return following a bear market cycle is 49.6%16. But investing into bear markets needs a long-term focus, patience, a calm-mind and a strong stomach! Remembering that investing is about the future and not the past and that today’s realities provide investment opportunities allows us to make good decisions today that can provide greater benefit to a portfolio in the longer term.
Please contact your financial advisor to discuss any questions about your investment strategy or changes in your financial goals. We thank you for including the funds in your portfolio and appreciate the trust you have placed in us.
Sincerely,

Carrie E. Hansen
Trustee, Chairperson and President of the Funds
Important Information
Past performance is no guarantee of future results and it is not possible to invest directly in any index.
The AssetMark platform provides fee-based investment advisory programs. Investors are advised to refer to the appropriate Disclosure Brochure, which can be obtained from your financial advisor, for a full description of services provided, including all applicable fees.
The prospectus includes additional information about the GuideMark and GuidePath Funds including investment objectives, risk factors, fees and charges as well as other important information that should be carefully read and considered before investing. You may obtain a prospectus by contacting your registered representative.
AssetMark, Inc. is an investment advisor registered with the Securities and Exchange Commission. The Principal Underwriter for the GuideMark and GuidePath Funds is AssetMark Brokerage®, LLC (AssetMark Brokerage), a member of the Financial Industry Regulatory Authority, Inc. AssetMark Brokerage is an affiliate of AssetMark, Inc. and shares its address. ©2022 AssetMark, Inc. All rights reserved.
Investment Terms
Market Capitalization or Market Cap refers to the total value of an issuer’s outstanding shares of stock. It is calculated by multiplying the price of a stock by its total number of outstanding shares.
| 16 | | Source: MFS, “Market Declines: A History of Recoveries.” |
2
Small Cap stocks generally refer to shares of companies with a market cap between $300 million and $2 billion.
Mid Cap stocks generally refer to shares of companies with a market cap between $2 billion and $10 billion.
Large Cap stocks generally refer to shares of companies with a market cap of $10 billion or greater.
Investment Factors:
Value refers to how attractively a stock is priced relative to its “fundamentals,” such as book value and free cash flow.
Momentum refers to whether a company’s share price is trending up or down.
Quality refers to profitability.
Volatility is a statistical measure of the dispersion of returns for a given security, market index or portfolio over a period of time. Low volatility means that the value of a security, market index or portfolio stays relatively stable. High volatility means that the value of a security, market index or portfolio experiences rapid increases and dramatic falls and may move erratically.
Inflation is the measure of average prices of a “basket” of consumer goods over time.
3
GuideMark Large Cap Core Fund
MANAGER’S DISCUSSION OF FUND PERFORMANCE (Unaudited)
TOTAL RETURN BASED ON A $10,000 INVESTMENT
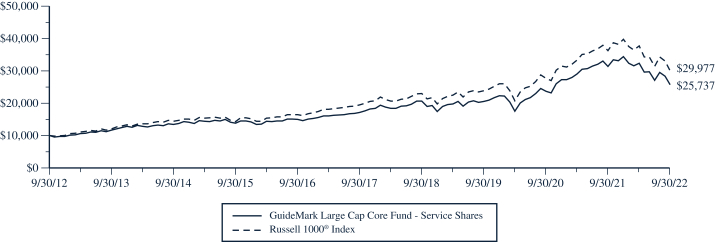
This chart assumes an initial gross investment of $10,000 made on September 30, 2012. Returns shown include the reinvestment of all dividends. Returns shown do not reflect the deduction of taxes that a shareholder would pay on Fund distributions or the redemption of Fund shares. In the absence of fee waivers and reimbursements, when they are necessary to keep expenses at the expense cap, total return would be reduced. Past performance is not predictive of future performance. Investment return and principal value will fluctuate so that your shares, when redeemed, may be worth more or less than the original cost. Index returns do not reflect the effects of fees or expenses. It is not possible to invest directly in an index.
RUSSELL 1000® INDEX – The Russell 1000® Index measures the performance of the large-cap segment of the U.S. equity universe. As of May 6, 2022, the market capitalization of the companies in the Russell 1000® Index ranged from $2.9 billion to $2.5 trillion.
| | | | | | | | | | | | | | | | |
| AVERAGE ANNUAL TOTAL RETURN (for periods ended September 30) | |
| | | One Year
| | | Five Year
| | | Ten Year
| | | Since Inception(1)(2)
| |
GuideMark Large Cap Core Fund(3) | | | | | | | | | | | | | | | | |
Service Shares | | | -18.03 | % | | | 8.42 | % | | | 9.91 | % | | | 5.19 | % |
Institutional Shares | | | -17.88 | % | | | 8.94 | % | | | 10.50 | % | | | 9.44 | % |
Russell 1000® Index | | | -17.22 | % | | | 9.00 | % | | | 11.60 | % | | | 7.40 | % |
| (1) | Inception date is June 29, 2001 for Service Shares and April 29, 2011 for Institutional Shares. |
| (2) | The return shown for the Russell 1000® Index is from the inception date of the Service Shares. The Russell 1000® Index return from the inception date of the Institutional Shares is 10.82%. |
| (3) | The returns reflect the actual performance for each period and do not include the impact of any adjustments made for financial reporting required by Generally Accepted Accounting Principles (GAAP). |
4
GuideMark Large Cap Core Fund
MANAGER’S DISCUSSION OF FUND PERFORMANCE (Continued) (Unaudited)
| • | | For the 6 months ended September 30, 2022, the Fund’s Service Shares returned (20.46)%, outperforming the Russell 1000 Index at (20.51)%. |
| • | | As part of the Fund’s equal weighted three-factor investment approach, the Fund’s dedicated allocation to the momentum factor was the largest contributor. |
| • | | The Fund benefitted from its investment process tilt toward stocks with smaller market capitalizations within its investment universe. |
| • | | The Fund’s allocation to the quality factor combined with security selection within technology was a detractor. |
Components of Portfolio Holdings*
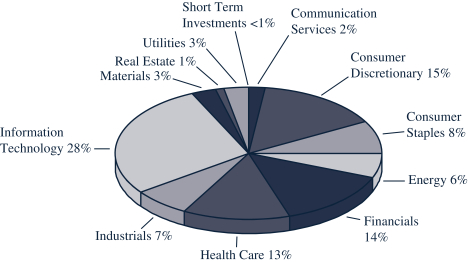
* Pie chart represents percentages of total portfolio, less securities lending collateral.
Top Ten Holdings
| | | | | | | | |
| Rank | | | Security/Holding | | % of Net
Assets | |
| | 1 | | | Apple, Inc. | | | 5.85 | % |
| | 2 | | | Microsoft Corp. | | | 4.67 | % |
| | 3 | | | Vanguard S&P 500 ETF | | | 3.69 | % |
| | 4 | | | Amazon.com, Inc. | | | 2.37 | % |
| | 5 | | | Alphabet, Inc. – Class A | | | 1.44 | % |
| | 6 | | | Telsa, Inc. | | | 1.44 | % |
| �� | 7 | | | Alphabet, Inc. – Class C | | | 1.31 | % |
| | 8 | | | UnitedHealth Group, Inc. | | | 1.29 | % |
| | 9 | | | Johnson & Johnson | | | 1.16 | % |
| | 10 | | | Exxon Mobil Corp. | | | 0.89 | % |
The Global Industry Classification Standard (“GICS®”) was developed by and/or is the exclusive property of MSCI, Inc. (“MSCI”) and Standard & Poor’s Financial Services LLC (“S&P”). GICS is a service mark of MSCI and S&P, and has been licensed for use by U.S. Bancorp Fund Services, LLC.
5
GuideMark Emerging Markets Fund
MANAGER’S DISCUSSION OF FUND PERFORMANCE (Unaudited)
TOTAL RETURN BASED ON A $10,000 INVESTMENT
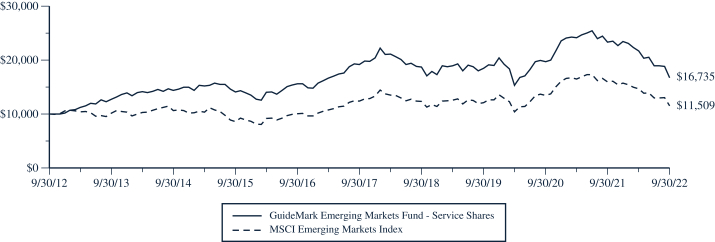
This chart assumes an initial gross investment of $10,000 made on September 30, 2012. Returns shown include the reinvestment of all dividends. Returns shown do not reflect the deduction of taxes that a shareholder would pay on Fund distributions or the redemption of Fund shares. In the absence of fee waivers and reimbursements, when they are necessary to keep expenses at the expense cap, total return would be reduced. Past performance is not predictive of future performance. Investment return and principal value will fluctuate so that your shares, when redeemed, may be worth more or less than the original cost. Index returns do not reflect the effects of fees or expenses. It is not possible to invest directly in an index.
MSCI EMERGING MARKETS INDEX – The MSCI Emerging Markets Index measures the equity market performance of countries considered to represent emerging markets. The emerging market country indices included are: Brazil, Chile, China, Colombia, Czech Republic, Egypt, Greece, Hungary, India, Indonesia, Korea, Kuwait, Malaysia, Mexico, Peru, Philippines, Poland, Qatar, Saudi Arabia, South Africa, Taiwan, Thailand, Turkey and the United Arab Emirates.
| | | | | | | | | | | | | | | | |
| AVERAGE ANNUAL TOTAL RETURN (for periods ended September 30) | |
| | | One Year
| | | Five Year
| | | Ten Year
| | | Since Inception(1)
| |
GuideMark Emerging Markets Fund(2) | | | | | | | | | | | | | | | | |
Service Shares | | | -28.34 | % | | | -2.69 | % | | | 5.28 | % | | | 3.34 | % |
MSCI Emerging Markets Index | | | -27.80 | % | | | -1.44 | % | | | 1.42 | % | | | 7.70 | % |
| (1) | Inception date is June 29, 2001. |
| (2) | The returns reflect the actual performance for each period and do not include the impact of any adjustments made for financial reporting required by Generally Accepted Accounting Principles (GAAP). |
6
GuideMark Emerging Markets Fund
MANAGER’S DISCUSSION OF FUND PERFORMANCE (Continued) (Unaudited)
| • | | For the 6 months ended September 30, 2022, the Fund’s Service Shares returned (22.89)%, underperforming the MSCI Emerging Markets Index at (21.46)%. |
| • | | As part of the Fund’s equal weighted three-factor investment approach, the Fund’s dedicated allocation to the value factor was the largest detractor due to value’s underperformance in the last quarter of the reporting period. |
| • | | Exposure to the quality factor, which underperformed during the reporting period, detracted from the Fund’s returns. |
| • | | Driven by the Fund’s factor investment approach, the Fund’s underweight to the Financials sector and an overweight allocation to Korean equities detracted from performance. |
Components of Portfolio Holdings*
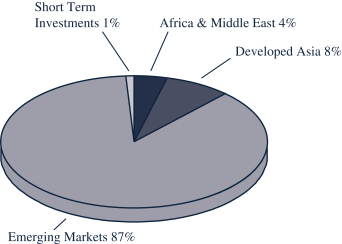
* Pie chart represents percentages of total portfolio, less securities lending collateral.
Top Ten Holdings
| | | | | | | | |
| Rank | | | Security/Holding | | % of Net
Assets | |
| | 1 | | | Taiwan Semiconductor Manufacturing Co., Ltd. | | | 5.49 | % |
| | 2 | | | iShares MSCI Saudi Arabia ETF | | | 4.38 | % |
| | 3 | | | Tencent Holdings, Ltd. | | | 3.25 | % |
| | 4 | | | Samsung Electronics Co., Ltd. | | | 2.99 | % |
| | 5 | | | iShares Core MSCI Emerging Markets ETF | | | 2.57 | % |
| | 6 | | | Alibaba Group Holdings, Ltd. | | | 1.85 | % |
| | 7 | | | Vale SA | | | 1.03 | % |
| | 8 | | | Infosys, Ltd. | | | 1.01 | % |
| | 9 | | | China Construction Bank Corp. – Series H | | | 0.94 | % |
| | 10 | | | Reliance Industries, Ltd. | | | 0.88 | % |
7
GuideMark Small/Mid Cap Core Fund
MANAGER’S DISCUSSION OF FUND PERFORMANCE (Unaudited)
TOTAL RETURN BASED ON A $10,000 INVESTMENT
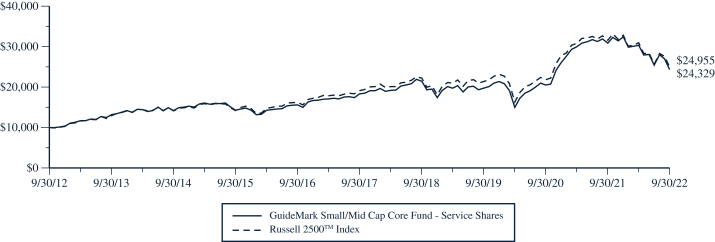
This chart assumes an initial gross investment of $10,000 made on September 30, 2012. Returns shown include the reinvestment of all dividends. Returns shown do not reflect the deduction of taxes that a shareholder would pay on Fund distributions or the redemption of Fund shares. In the absence of fee waivers and reimbursements, when they are necessary to keep expenses at the expense cap, total return would be reduced. Past performance is not predictive of future performance. Investment return and principal value will fluctuate so that your shares, when redeemed, may be worth more or less than the original cost. Index returns do not reflect the effects of fees or expenses. It is not possible to invest directly in an index.
RUSSELL 2500TM INDEX – The Russell 2500TM Index measures the performance of the small- to mid-cap segment of the U.S. equity universe, commonly referred to as “smid” cap. It includes approximately 2,500 of the smallest securities based on a combination of their market cap and current index membership. As of May 6, 2022, the market capitalization of the companies in the Russell 2500TM Index ranged from $240 million to $16.9 billion.
| | | | | | | | | | | | | | | | |
| AVERAGE ANNUAL TOTAL RETURN (for periods ended September 30) | |
| | | One Year
| | | Five Year
| | | Ten Year
| | | Since Inception(1)
| |
GuideMark Small/Mid Cap Core Fund(2) | | | | | | | | | | | | | | | | |
Service Shares | | | -21.15 | % | | | 5.87 | % | | | 9.30 | % | | | 7.05 | % |
Russell 2500TM Index | | | -21.11 | % | | | 5.45 | % | | | 9.58 | % | | | 8.12 | % |
| (1) | Inception date is June 29, 2001. |
| (2) | The returns reflect the actual performance for each period and do not include the impact of any adjustments made for financial reporting required by Generally Accepted Accounting Principles (GAAP). |
8
GuideMark Small/Mid Cap Core Fund
MANAGER’S DISCUSSION OF FUND PERFORMANCE (Continued) (Unaudited)
| • | | For the 6 months ended September 30, 2022, the Fund’s Service Shares returned (19.82)%, underperforming the Russell 2500 Index at (19.32)%. |
| • | | As part of the Fund’s equal weighted three-factor investment approach, the Fund’s dedicated allocation to the quality factor was the largest detractor. |
| • | | During the reporting period, the Fund was hurt by exposure to the value factor as value underperformed relative to growth in last quarter of the reporting period. |
| • | | As a result of the Fund’s factor investment approach, security selection within the Financials sector detracted from the Fund’s performance. |
Components of Portfolio Holdings*
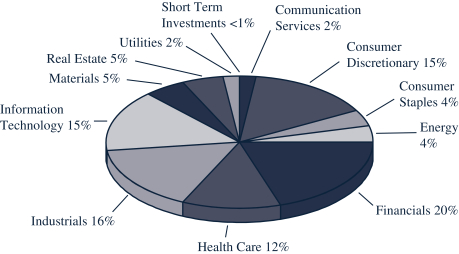
* Pie chart represents percentages of total portfolio, less securities lending collateral.
Top Ten Holdings
| | | | | | | | |
| Rank | | | Security/Holding | | % of Net
Assets | |
| | 1 | | | Vanguard Extended Market ETF | | | 3.29 | % |
| | 2 | | | LPL Financial Holdings, Inc. | | | 0.34 | % |
| | 3 | | | Builders FirstSource, Inc. | | | 0.30 | % |
| | 4 | | | Steel Dynamics, Inc. | | | 0.30 | % |
| | 5 | | | United Therapeutics Corp. | | | 0.28 | % |
| | 6 | | | Reliance Steel & Aluminum Co. | | | 0.26 | % |
| | 7 | | | Quanta Services, Inc. | | | 0.25 | % |
| | 8 | | | BJ’s Wholesale Club Holdings, Inc. | | | 0.25 | % |
| | 9 | | | Dillard’s, Inc. – Class A | | | 0.24 | % |
| | 10 | | | APA Corp. | | | 0.24 | % |
9
GuideMark World ex-US Fund
MANAGER’S DISCUSSION OF FUND PERFORMANCE (Unaudited)
TOTAL RETURN BASED ON A $10,000 INVESTMENT
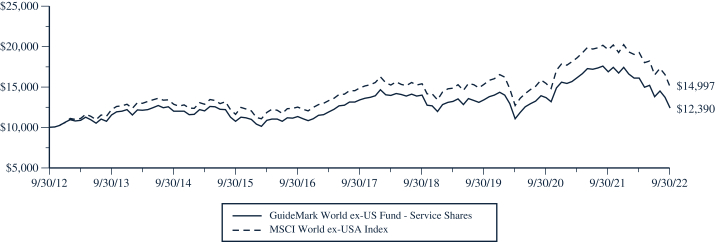
This chart assumes an initial gross investment of $10,000 made on September 30, 2012. Returns shown include the reinvestment of all dividends. Returns shown do not reflect the deduction of taxes that a shareholder would pay on Fund distributions or the redemption of Fund shares. In the absence of fee waivers and reimbursements, when they are necessary to keep expenses at the expense cap, total return would be reduced. Past performance is not predictive of future performance. Investment return and principal value will fluctuate so that your shares, when redeemed, may be worth more or less than the original cost. Index returns do not reflect the effects of fees or expenses. It is not possible to invest directly in an index.
MSCI WORLD EX-USA INDEX – The MSCI World ex-USA Index captures large and mid-cap representation across 22 of 23 developed markets countries excluding the U.S. The developed market country indices included are: Australia, Austria, Belgium, Canada, Denmark, Finland, France, Germany, Hong Kong, Ireland, Israel, Italy, Japan, Netherlands, New Zealand, Norway, Portugal, Singapore, Spain, Sweden, Switzerland and the United Kingdom.
| | | | | | | | | | | | | | | | |
| AVERAGE ANNUAL TOTAL RETURN (for periods ended September 30) | |
| | | One Year
| | | Five Year
| | | Ten Year
| | | Since Inception(1)(2)
| |
GuideMark World ex-US Fund(3) | | | | | | | | | | | | | | | | |
Service Shares | | | -26.71 | % | | | -1.59 | % | | | 2.17 | % | | | 1.84 | % |
Institutional Shares(4) | | | -26.08 | % | | | -0.98 | % | | | 2.87 | % | | | 1.26 | % |
MSCI World ex-USA Index | | | -23.50 | % | | | 0.12 | % | | | 4.14 | % | | | 4.66 | % |
| (1) | Inception date is June 29, 2001 for Service Shares and April 29, 2011 for Institutional Shares. |
| (2) | The return shown for the MSCI World ex-USA Index is from the inception date of the Service Shares. The MSCI World ex-USA Index return from the inception date of the Institutional Shares is 2.54%. |
| (3) | The returns reflect the actual performance for each period and do not include the impact of any adjustments made for financial reporting required by Generally Accepted Accounting Principles (GAAP). |
| (4) | During the period August 3, 2017 through September 5, 2017, there were no Institutional Shares of the Fund outstanding. Performance information provided for the Institutional Shares during that period reflects the last calculated net asset value of the Institutional Shares on August 2, 2017, without any adjustments. Had there been Institutional Shares outstanding during the period August 3, 2017 through September 5, 2017, their annual returns would have been substantially similar to those of the Service Shares of the Fund because they would have been invested in the same portfolio securities, but would have differed to the extent that the classes have different expenses. Because the Service Shares have higher expenses than the Institutional Shares, the returns of the Service Shares would have been lower than the returns of the Institutional Shares during the same period. |
10
GuideMark World ex-US Fund
MANAGER’S DISCUSSION OF FUND PERFORMANCE (Continued) (Unaudited)
| • | | For the 6 months ended September 30, 2022, the Fund’s Service Shares returned (23.08)%, underperforming the MSCI World ex-USA Index at (22.24)%. |
| • | | As part of the Fund’s equal weighted three-factor investment approach, the Fund’s dedicated allocation to the quality factor was the largest detractor. |
| • | | Exposure to developed international equity, led by German equities, detracted from Fund returns for the period. |
| • | | Security selection within the Industrials sector detracted from the Fund’s performance, which was driven by exposure to the quality factor. |
Components of Portfolio Holdings*
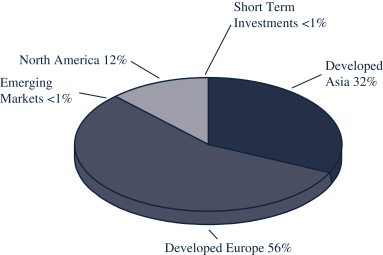
* Pie chart represents percentages of total portfolio, less securities lending collateral.
Top Ten Holdings
| | | | | | | | |
| Rank | | | Security/Holding | | % of Net
Assets | |
| | 1 | | | iShares MSCI EAFE ETF | | | 3.64 | % |
| | 2 | | | Nestle SA | | | 1.60 | % |
| | 3 | | | Roche Holdings AG | | | 1.56 | % |
| | 4 | | | Novo Nordisk AS – Series B | | | 1.33 | % |
| | 5 | | | Shell PLC | | | 1.17 | % |
| | 6 | | | LVMH Moet Hennessy Louis Vuitton SE | | | 1.04 | % |
| | 7 | | | AstraZeneca PLC | | | 1.04 | % |
| | 8 | | | Novartis AG | | | 0.95 | % |
| | 9 | | | Royal Bank of Canada | | | 0.85 | % |
| | 10 | | | Total SA | | | 0.79 | % |
11
GuideMark Core Fixed Income Fund
MANAGER’S DISCUSSION OF FUND PERFORMANCE (Unaudited)
TOTAL RETURN BASED ON A $10,000 INVESTMENT
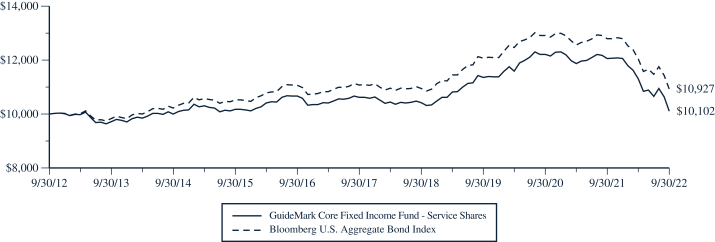
This chart assumes an initial gross investment of $10,000 made on September 30, 2012. Returns shown include the reinvestment of all dividends. Returns shown do not reflect the deduction of taxes that a shareholder would pay on Fund distributions or the redemption of Fund shares. In the absence of fee waivers and reimbursements, when they are necessary to keep expenses at the expense cap, total return would be reduced. Past performance is not predictive of future performance. Investment return and principal value will fluctuate so that your shares, when redeemed, may be worth more or less than the original cost. Index returns do not reflect the effects of fees or expenses. It is not possible to invest directly in an index.
BLOOMBERG U.S. AGGREGATE BOND INDEX – The Bloomberg U.S. Aggregate Bond Index is a broad-based benchmark that measures the investment-grade, U.S. dollar-denominated, fixed-rate taxable bond market, including Treasuries, government-related and corporate debt securities, mortgage- and asset-backed securities. All securities contained in the Bloomberg U.S. Aggregate Bond Index have a minimum term to maturity of one year.
| | | | | | | | | | | | | | | | |
| AVERAGE ANNUAL TOTAL RETURN (for periods ended September 30) | |
| | | One Year
| | | Five Year
| | | Ten Year
| | | Since Inception(1)
| |
GuideMark Core Fixed Income Fund(2) | | | | | | | | | | | | | | | | |
Service Shares | | | -16.25 | % | | | -0.98 | % | | | 0.10 | % | | | 2.73 | % |
Bloomberg U.S. Aggregate Bond Index | | | -14.60 | % | | | -0.27 | % | | | 0.89 | % | | | 3.52 | % |
| (1) | Inception date is June 29, 2001. |
| (2) | The returns reflect the actual performance for each period and do not include the impact of any adjustments made for financial reporting required by Generally Accepted Accounting Principles (GAAP). |
12
GuideMark Core Fixed Income Fund
MANAGER’S DISCUSSION OF FUND PERFORMANCE (Continued) (Unaudited)
| • | | For the 6 months ended September 30, 2022, the Fund’s Service Shares returned (10.57)%, underperforming the Bloomberg US Aggregate Bond Index at (9.22)%. |
| • | | Overweight exposure to investment grade corporate credit detracted from returns as credit spreads widened during the period. |
| • | | Exposure to the securitized credit sector, including residential mortgage-backed securities, tempered returns as the Fed continued to raise rates in an effort to drive down inflation. |
Components of Portfolio Holdings*
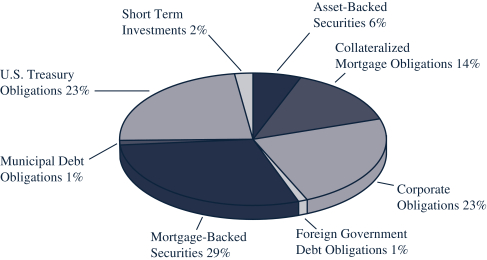
* Pie chart represents percentages of total portfolio, less securities lending collateral.
Percentages expressed exclude derivative instruments, such as futures, options written and swap contracts.
Top Ten Holdings
| | | | | | | | |
| Rank | | | Security/Holding | | % of Net
Assets | |
| | 1 | | | Federal National Mortgage Association, 3.000%, 10/15/2050 | | | 4.16 | % |
| | 2 | | | U.S. Treasury Note, 2.875%, 06/15/2025 | | | 3.15 | % |
| | 3 | | | U.S. Treasury Note, 1.875%, 02/28/2029 | | | 2.60 | % |
| | 4 | | | Government National Mortgage Association, 2.500%, 10/15/2046 | | | 2.56 | % |
| | 5 | | | Federal National Mortgage Association, 2.000%, 01/01/2052 | | | 2.26 | % |
| | 6 | | | U.S. Treasury Note, 2.00%, 11/15/2026 | | | 2.24 | % |
| | 7 | | | Federal National Mortgage Association, 2.500%, 10/15/2046 | | | 1.87 | % |
| | 8 | | | Federal National Mortgage Association, 2.500%, 06/01/2052 | | | 1.81 | % |
| | 9 | | | U.S. Treasury Note, 0.750%, 04/30/2026 | | | 1.74 | % |
| | 10 | | | Federal National Mortgage Association, 1.500%, 10/15/2035 | | | 1.59 | % |
13
GuidePath Growth Allocation Fund
MANAGER’S DISCUSSION OF FUND PERFORMANCE (Unaudited)
TOTAL RETURN BASED ON A $10,000 INVESTMENT
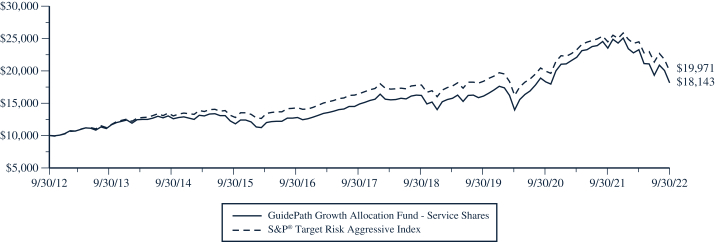
This chart assumes an initial gross investment of $10,000 made on September 30, 2012. Returns shown include the reinvestment of all dividends. Returns shown do not reflect the deduction of taxes that a shareholder would pay on Fund distributions or the redemption of Fund shares. In the absence of fee waivers and reimbursements, when they are necessary to keep expenses at the expense cap, total return would be reduced. Past performance is not predictive of future performance. Investment return and principal value will fluctuate so that your shares, when redeemed, may be worth more or less than the original cost. Index returns do not reflect the effects of fees or expenses. It is not possible to invest directly in an index.
S&P® TARGET RISK AGGRESSIVE INDEX – The S&P® Target Risk Aggressive Index is designed to measure the performance of an investment benchmark strategy which seeks to emphasize exposure to equity securities, maximizing opportunities for long-term capital accumulation, while also allocating a portion of exposure to fixed income to enhance portfolio efficiency.
| | | | | | | | | | | | | | | | |
| AVERAGE ANNUAL TOTAL RETURN (for periods ended September 30) | |
| | | One Year
| | | Five Year
| | | Ten Year
| | | Since Inception(1)(2)
| |
GuidePath Growth Allocation Fund(3) | | | | | | | | | | | | | | | | |
Service Shares | | | -22.80 | % | | | 4.03 | % | | | 6.14 | % | | | 4.96 | % |
Institutional Shares | | | -22.86 | % | | | 4.49 | % | | | 6.69 | % | | | 6.48 | % |
S&P® Target Risk Aggressive Index | | | -18.49 | % | | | 3.87 | % | | | 7.16 | % | | | 6.47 | % |
| (1) | Inception date is April 29, 2011 for Service Shares and September 13, 2012 for Institutional Shares. |
| (2) | The return shown for the S&P® Target Risk Aggressive Index is annualized from the inception date of the Service Shares. The S&P® Target Risk Aggressive Index average annual return from the inception date of the Institutional Shares is 6.95%. |
| (3) | The returns reflect the actual performance for each period and do not include the impact of any adjustments made for financial reporting required by Generally Accepted Accounting Principles (GAAP). |
14
GuidePath Growth Allocation Fund
MANAGER’S DISCUSSION OF FUND PERFORMANCE (Continued) (Unaudited)
| • | | For the 6 months ended September 30, 2022, the Fund’s Service Shares returned (22.00)%, underperforming the S&P® Target Risk Aggressive Index at (18.51)%. |
| • | | Exposure to large cap growth stocks hurt Fund returns for the reporting period, as investors favored stable companies with steady earnings. International equity exposure also detracted from performance. |
| • | | Global REITs exposure hurt returns as central banks raised interest rates in an effort to fight persistently high inflation. |
| • | | Exposure to U.S. small-cap stocks benefitted Fund performance during the period. |
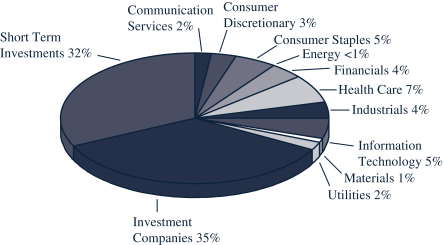
Components of Portfolio Holdings*
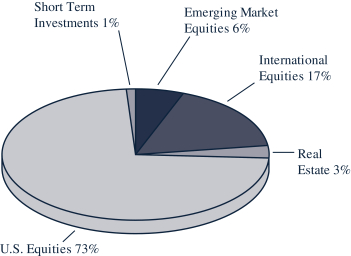
* Pie chart represents percentages of total portfolio, less securities lending collateral.
Top Ten Holdings
| | | | | | | | |
| Rank | | | Security/Holding | | % of Net
Assets | |
| | 1 | | | Vanguard S&P 500 ETF | | | 17.95 | % |
| | 2 | | | Vanguard FTSE Developed Markets ETF | | | 9.77 | % |
| | 3 | | | Schwab U.S. Large-Cap ETF | | | 6.90 | % |
| | 4 | | | iShares Core S&P Small-Cap ETF | | | 6.54 | % |
| | 5 | | | American Funds – The Growth Fund of America – Class F3 | | | 6.36 | % |
| | 6 | | | Schwab U.S. Large-Cap Growth ETF | | | 6.25 | % |
| | 7 | | | iShares Core MSCI Emerging Markets ETF | | | 6.20 | % |
| | 8 | | | AMCAP Fund – Class F3 | | | 5.03 | % |
| | 9 | | | Vanguard Russell 1000 Growth ETF | | | 5.03 | % |
| | 10 | | | American Funds – Fundamental Investors – Class F3 | | | 5.01 | % |
15
GuidePath Conservative Allocation Fund
MANAGER’S DISCUSSION OF FUND PERFORMANCE (Unaudited)
TOTAL RETURN BASED ON A $10,000 INVESTMENT
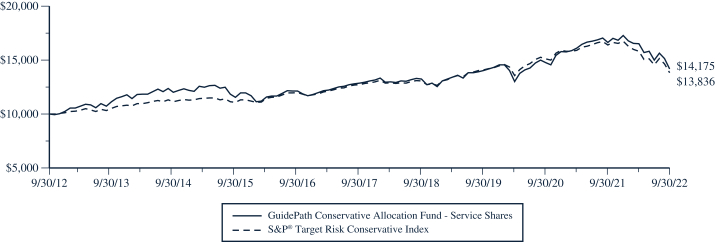
This chart assumes an initial gross investment of $10,000 made on September 30, 2012. Returns shown include the reinvestment of all dividends. Returns shown do not reflect the deduction of taxes that a shareholder would pay on Fund distributions or the redemption of Fund shares. In the absence of fee waivers and reimbursements, when they are necessary to keep expenses at the expense cap, total return would be reduced. Past performance is not predictive of future performance. Investment return and principal value will fluctuate so that your shares, when redeemed, may be worth more or less than the original cost. Index returns do not reflect the effects of fees or expenses. It is not possible to invest directly in an index.
S&P® TARGET RISK CONSERVATIVE INDEX – The S&P® Target Risk Conservative Index seeks to emphasize exposure to fixed income securities in order to produce a current income stream and avoid excessive volatility of returns. Equity securities are included to protect long-term purchasing power.
| | | | | | | | | | | | | | | | |
| AVERAGE ANNUAL TOTAL RETURN (for periods ended September 30) | |
| | | One Year
| | | Five Year
| | | Ten Year
| | | Since Inception(1)(2)
| |
GuidePath Conservative Allocation Fund(3) | | | | | | | | | | | | | | | | |
Service Shares | | | -14.78 | % | | | 1.96 | % | | | 3.55 | % | | | 3.06 | % |
Institutional Shares | | | -14.38 | % | | | 2.51 | % | | | 4.16 | % | | | 4.02 | % |
S&P® Target Risk Conservative Index | | | -15.59 | % | | | 1.68 | % | | | 3.30 | % | | | 3.46 | % |
| (1) | Inception date is April 29, 2011 for Service Shares and September 13, 2012 for Institutional Shares. |
| (2) | The return shown for the S&P® Target Risk Conservative Index is annualized from the inception date of the Service Shares. The S&P® Target Risk Conservative Index average annual return from the inception date of the Institutional Shares is 3.24%. |
| (3) | The returns reflect the actual performance for each period and do not include the impact of any adjustments made for financial reporting required by Generally Accepted Accounting Principles (GAAP). |
16
GuidePath Conservative Allocation Fund
MANAGER’S DISCUSSION OF FUND PERFORMANCE (Continued) (Unaudited)
| • | | For the 6 months ended September 30, 2022, the Fund’s Service Shares returned (14.18)% underperforming the S&P® Target Risk Conservative Index at (12.52)%. |
| • | | International equity exposure detracted from performance. Global REITs exposure hurt returns as central banks raised interest rates in an effort to fight persistently high inflation. |
| • | | Long-term Treasuries dampened returns as the Federal Reserve raised interest rates. Emerging markets bonds and investment grade credit also detracted from returns during the period. |
| • | | Exposures to short-term Treasuries, high yield bonds, and mortgage-backed securities benefitted Fund performance. |
Components of Portfolio Holdings*
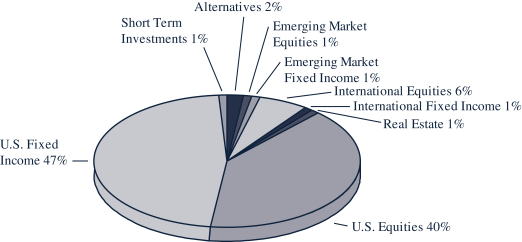
* Pie chart represents percentages of total portfolio, less securities lending collateral.
Top Ten Holdings
| | | | | | | | |
| Rank | | | Security/Holding | | % of Net
Assets | |
| | 1 | | | Vanguard S&P 500 ETF | | | 5.97 | % |
| | 2 | | | iShares 1-3 Year Treasury Bond ETF | | | 5.43 | % |
| | 3 | | | American Funds – The Income Fund of America – Class F3 | | | 4.69 | % |
| | 4 | | | American Funds – Capital Income Builder – Class F3 | | | 4.63 | % |
| | 5 | | | iShares Core Aggressive Allocation ETF | | | 4.63 | % |
| | 6 | | | Vanguard Mortgage-Backed Securities ETF | | | 4.37 | % |
| | 7 | | | American Funds – Multi-Sector Income Fund – Class F3 | | | 4.04 | % |
| | 8 | | | American Funds – The Bond Fund of America – Class F3 | | | 4.01 | % |
| | 9 | | | iShares Core U.S. Aggregate Bond ETF | | | 4.00 | % |
| | 10 | | | iShares Core Growth Allocation ETF | | | 3.97 | % |
17
GuidePath Tactical Allocation Fund
MANAGER’S DISCUSSION OF FUND PERFORMANCE (Unaudited)
TOTAL RETURN BASED ON A $10,000 INVESTMENT
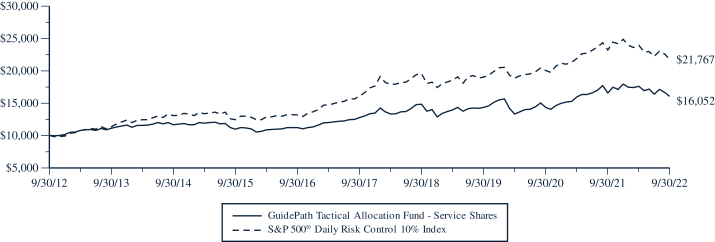
This chart assumes an initial gross investment of $10,000 made on September 30, 2012. Returns shown include the reinvestment of all dividends. Returns shown do not reflect the deduction of taxes that a shareholder would pay on Fund distributions or the redemption of Fund shares. In the absence of fee waivers and reimbursements, when they are necessary to keep expenses at the expense cap, total return would be reduced. Past performance is not predictive of future performance. Investment return and principal value will fluctuate so that your shares, when redeemed, may be worth more or less than the original cost. Index returns do not reflect the effects of fees or expenses. It is not possible to invest directly in an index.
S&P 500® DAILY RISK CONTROL 10% INDEX – The S&P 500® Daily Risk Control 10% Index represents a portfolio of the S&P 500® Low Volatility Index plus an interest accruing cash component. The index is dynamically rebalanced to target a 10% level of volatility. Volatility is calculated as a function of historical returns.
| | | | | | | | | | | | | | | | |
| AVERAGE ANNUAL TOTAL RETURN (for periods ended September 30) | |
| | | One Year
| | | Five Year
| | | Ten Year
| | | Since Inception(1)(2)
| |
GuidePath Tactical Allocation Fund(3) | | | | | | | | | | | | | | | | |
Service Shares | | | -3.15 | % | | | 4.66 | % | | | 4.85 | % | | | 3.95 | % |
Institutional Shares | | | -2.81 | % | | | 5.21 | % | | | 5.42 | % | | | 5.30 | % |
S&P 500® Daily Risk Control 10% Index | | | -6.31 | % | | | 6.24 | % | | | 8.09 | % | | | 6.95 | % |
| (1) | Inception date is April 29, 2011 for Service Shares and September 13, 2012 for Institutional Shares. |
| (2) | The return shown for the S&P 500® Daily Risk Control 10% Index is annualized from the inception date of the Service Shares. The S&P 500® Daily Risk Control 10% Index average annual return from the inception date of the Institutional Shares is 7.94%. |
| (3) | The returns reflect the actual performance for each period and do not include the impact of any adjustments made for financial reporting required by Generally Accepted Accounting Principles (GAAP). |
18
GuidePath Tactical Allocation Fund
MANAGER’S DISCUSSION OF FUND PERFORMANCE (Continued) (Unaudited)
| • | | For the 6 months ended September 30, 2022, the Fund’s Service Shares returned (8.82)%, outperforming the S&P® 500 Daily Risk Control 10% Index at (9.20)%. |
| • | | An Energy sector overweight helped returns as it was the best performing sector for the period. Overweight positioning in the defensive Healthcare sector also proved beneficial to performance. |
| • | | An underweight to the Technology sector was a tailwind as it was the second worst performing sector for the period. |
| • | | Higher total equity positioning relative to the benchmark was a detractor in light of the steady decline in equity markets over the reporting period, except for a mid-July to mid-August run-up. |
Components of Portfolio Holdings*

* Pie chart represents percentages of total portfolio, less securities lending collateral.
Top Ten Holdings
| | | | | | | | |
| Rank | | | Security/Holding | | % of Net
Assets | |
| | 1 | | | Aflac, Inc. | | | 2.66 | % |
| | 2 | | | Apple, Inc. | | | 2.59 | % |
| | 3 | | | Microsoft Corp. | | | 2.54 | % |
| | 4 | | | CVS Health Corp. | | | 2.47 | % |
| | 5 | | | Pfizer, Inc. | | | 2.47 | % |
| | 6 | | | Hartford Financials Services Group, Inc. | | | 2.39 | % |
| | 7 | | | Procter & Gamble Co. | | | 2.37 | % |
| | 8 | | | United Therapeutics Corp. | | | 2.26 | % |
| | 9 | | | Archer-Daniels-Midland Co. | | | 2.24 | % |
| | 10 | | | ConocoPhillips | | | 2.22 | % |
19
GuidePath Absolute Return Allocation Fund
MANAGER’S DISCUSSION OF FUND PERFORMANCE (Unaudited)
TOTAL RETURN BASED ON A $10,000 INVESTMENT
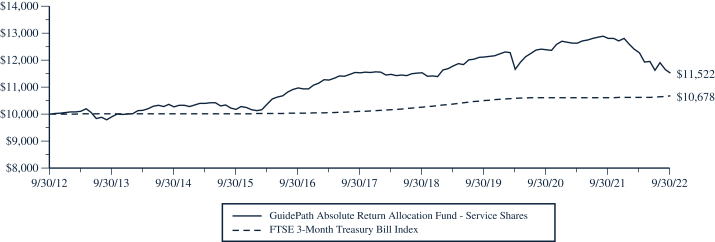
This chart assumes an initial gross investment of $10,000 made on September 30, 2012. Returns shown include the reinvestment of all dividends. Returns shown do not reflect the deduction of taxes that a shareholder would pay on Fund distributions or the redemption of Fund shares. In the absence of fee waivers and reimbursements, when they are necessary to keep expenses at the expense cap, total return would be reduced. Past performance is not predictive of future performance. Investment return and principal value will fluctuate so that your shares, when redeemed, may be worth more or less than the original cost. Index returns do not reflect the effects of fees or expenses. It is not possible to invest directly in an index.
FTSE 3-MONTH TREASURY BILL INDEX – The FTSE 3-Month Treasury Bill Index tracks the performance of U.S. Treasury Bills with a remaining maturity of three months.
| | | | | | | | | | | | | | | | |
| AVERAGE ANNUAL TOTAL RETURN (for periods ended September 30) | |
| | | One Year
| | | Five Year
| | | Ten Year
| | | Since Inception(1)(2)
| |
GuidePath Absolute Return Allocation Fund(3) | | | | | | | | | | | | | | | | |
Service Shares | | | -12.43 | % | | | -0.56 | % | | | 1.16 | % | | | 1.25 | % |
Institutional Shares | | | -12.11 | % | | | -0.03 | % | | | 1.74 | % | | | 1.75 | % |
FTSE 3-Month Treasury Bill Index | | | 0.63 | % | | | 1.13 | % | | | 0.66 | % | | | 0.58 | % |
| (1) | Inception date is April 29, 2011 for Service Shares and September 13, 2012 for Institutional Shares. |
| (2) | The return shown for the FTSE 3-Month Treasury Bill Index is annualized from the inception date of the Service Shares. The FTSE 3-Month Treasury Bill Index average annual return from the inception date of the Institutional Shares is 0.66%. |
| (3) | The returns reflect the actual performance for each period and do not include the impact of any adjustments made for financial reporting required by Generally Accepted Accounting Principles (GAAP). |
20
GuidePath Absolute Return Allocation Fund
MANAGER’S DISCUSSION OF FUND PERFORMANCE (Continued) (Unaudited)
| • | | For the 6 months ended September 30, 2022, the Fund’s Service Shares returned (8.58)%, underperforming the FTSE 3-Month Treasury Bill Index at 0.59%. |
| • | | Exposure to high yield bonds, emerging market government bonds, mortgage-backed securities, core fixed income and long-term Treasuries detracted from performance during the period as the Federal Reserve raised interest rates sharply. |
| • | | Small allocations to US and developed market equities were detractors as markets grew cautious in light of tightening monetary policies. |
| • | | Exposures to short-term Treasuries, low duration bonds and floating rate notes benefitted Fund performance during the period. |
Components of Portfolio Holdings*
* Pie chart represents percentages of total portfolio, less securities lending collateral.
Top Ten Holdings
| | | | | | | | |
| Rank | | | Security/Holding | | % of Net
Assets | |
| | 1 | | | Vanguard Intermediate-Term Corporate Bond ETF | | | 12.87 | % |
| | 2 | | | Vanguard Mortgage-Backed Securities ETF | | | 12.39 | % |
| | 3 | | | Vanguard Short-Term Corporate Bond ETF | | | 12.17 | % |
| | 4 | | | DoubleLine Total Return Bond Fund – Institutional Shares | | | 10.31 | % |
| | 5 | | | iShares 7-10 Year Treasury Bond ETF | | | 7.46 | % |
| | 6 | | | DoubleLine Low Duration Bond Fund – Institutional Shares | | | 7.42 | % |
| | 7 | | | BlackRock Low Duration Bond Portfolio – Insitutional Shares | | | 7.37 | % |
| | 8 | | | Schwab Short-Term U.S. Treasury ETF | | | 5.12 | % |
| | 9 | | | T. Rowe Price Institutional Floating Rate Fund – Investor Shares | | | 5.06 | % |
| | 10 | | | BlackRock Strategic Income Opportunities Portfolio – Institutional Shares | | | 3.28 | % |
21
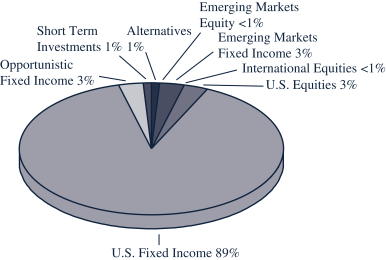
GuidePath Multi-Asset Income Allocation Fund
MANAGER’S DISCUSSION OF FUND PERFORMANCE (Unaudited)
TOTAL RETURN BASED ON A $10,000 INVESTMENT
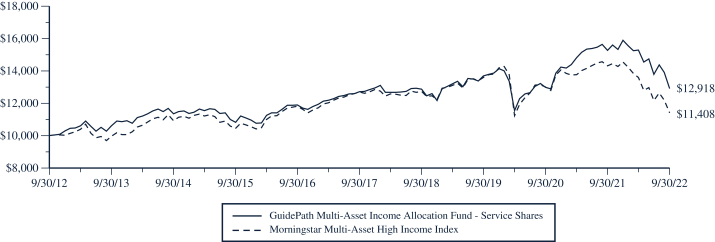
This chart assumes an initial gross investment of $10,000 made on September 30, 2012. Returns shown include the reinvestment of all dividends. Returns shown do not reflect the deduction of taxes that a shareholder would pay on Fund distributions or the redemption of Fund shares. In the absence of fee waivers and reimbursements, when they are necessary to keep expenses at the expense cap, total return would be reduced. Past performance is not predictive of future performance. Investment return and principal value will fluctuate so that your shares, when redeemed, may be worth more or less than the original cost. Index returns do not reflect the effects of fees or expenses. It is not possible to invest directly in an index.
MORNINGSTAR MULTI-ASSET HIGH INCOME INDEX – The Morningstar Multi-Asset High Income Index is a broadly diversified index that seeks to deliver high current income while maintaining long-term capital appreciation.
| | | | | | | | | | | | | | | | |
| AVERAGE ANNUAL TOTAL RETURN (for periods ended September 30) | |
| | | One Year
| | | Five Years
| | | Ten Years
| | | Since Inception(1)
| |
GuidePath Multi-Asset Income Allocation Fund(2) | | | | | | | | | | | | | | | | |
Service Shares | | | -15.42 | % | | | 0.33 | % | | | 2.59 | % | | | 2.71 | % |
Morningstar Multi-Asset High Income Index | | | -20.27 | % | | | -2.11 | % | | | 1.33 | % | | | 1.39 | % |
| (1) | Inception date is August 31, 2012. |
| (2) | The returns reflect the actual performance for each period and do not include the impact of any adjustments made for financial reporting required by Generally Accepted Accounting Principles (GAAP). |
22
GuidePath Multi-Asset Income Allocation Fund
MANAGER’S DISCUSSION OF FUND PERFORMANCE (Continued) (Unaudited)
| • | | For the 6 months ended September 30, 2022, the Fund’s Service Shares returned (15.47)%, outperforming the Morningstar Multi-Asset High Income Index at (16.02)%. |
| • | | Positioning in US dividend equity benefitted Fund performance, as did positioning in preferred stock. A small exposure to the Utilities sector also benefitted relative returns, as Utilities was the second-best performing sector during the period. |
| • | | Exposures to high yield bonds, mortgage-backed securities, and core fixed income benefitted Fund performance during the period. |
| • | | International dividend equity exposure detracted from performance. Global REITs exposure also hurt returns as central banks raised interest rates in an effort to fight persistently high inflation. Long-term Treasuries holdings also detracted from returns. |
Components of Portfolio Holdings*
* Pie chart represents percentages of total portfolio, less securities lending collateral.
Top Ten Holdings
| | | | | | | | |
| Rank | | | Security/Holding | | % of Net
Assets | |
| | 1 | | | Vanguard High-Yield Corporate Fund – Admiral Shares | | | 9.14 | % |
| | 2 | | | Global X US Preferred ETF | | | 7.42 | % |
| | 3 | | | Vanguard High Dividend Yield ETF | | | 5.50 | % |
| | 4 | | | iShares Emerging Markets Dividend ETF | | | 5.15 | % |
| | 5 | | | Schwab US Dividend Equity ETF | | | 5.14 | % |
| | 6 | | | Loomis Sayles Global Allocation Fund – Class Y | | | 4.70 | % |
| | 7 | | | iShares 0-5 Year High Yield Corporate Bond ETF | | | 4.54 | % |
| | 8 | | | T.Rowe Price Institutional Floating Rate Fund – Investor Shares | | | 4.35 | % |
| | 9 | | | WisdomTree U.S. Large Cap Dividend Fund | | | 4.24 | % |
| | 10 | | | iShares Select Dividend ETF | | | 4.14 | % |
23
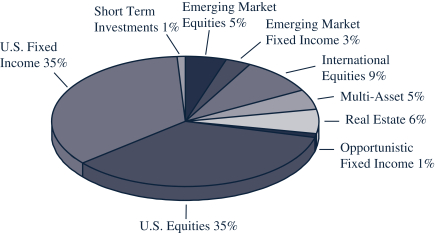
GuidePath Flexible Income Allocation Fund
MANAGER’S DISCUSSION OF FUND PERFORMANCE (Unaudited)
TOTAL RETURN BASED ON A $10,000 INVESTMENT
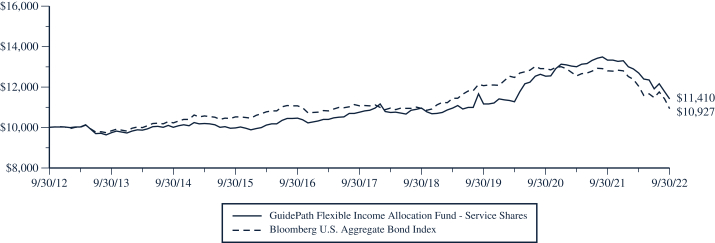
This chart assumes an initial gross investment of $10,000 made on September 30, 2012. Returns shown include the reinvestment of all dividends. Returns shown do not reflect the deduction of taxes that a shareholder would pay on Fund distributions or the redemption of Fund shares. In the absence of fee waivers and reimbursements, when they are necessary to keep expenses at the expense cap, total return would be reduced. Past performance is not predictive of future performance. Investment return and principal value will fluctuate so that your shares, when redeemed, may be worth more or less than the original cost. Index returns do not reflect the effects of fees or expenses. It is not possible to invest directly in an index.
BLOOMBERG U.S. AGGREGATE BOND INDEX – The Bloomberg U.S. Aggregate Bond Index is a broad-based benchmark that measures the investment-grade, U.S. dollar-denominated, fixed-rate taxable bond market, including Treasuries, government-related and corporate debt securities, mortgage- and asset-backed securities. All securities contained in the Bloomberg U.S. Aggregate Bond Index have a minimum term to maturity of one year.
| | | | | | | | | | | | | | | | |
| AVERAGE ANNUAL TOTAL RETURN (for periods ended September 30) | |
| | | One Year
| | | Five Years
| | | Ten Years
| | | Since Inception(1)(2)
| |
GuidePath Flexible Income Allocation Fund(3) | | | | | | | | | | | | | | | | |
Service Shares | | | -14.43 | % | | | 1.19 | % | | | 1.33 | % | | | 1.36 | % |
Institutional Shares | | | -14.14 | % | | | 1.72 | % | | | 1.96 | % | | | 1.99 | % |
Bloomberg U.S. Aggregate Bond Index | | | -14.60 | % | | | -0.27 | % | | | 0.89 | % | | | 0.90 | % |
| (1) | Inception date is August 31, 2012 for Service Shares and September 13, 2012 for Institutional Shares. |
| (2) | The return shown for the Bloomberg U.S. Aggregate Bond Index is from the inception date of the Service Shares. The Bloomberg U.S. Aggregate Bond Index return from the inception date of the Institutional Shares is 0.94%. |
| (3) | The returns reflect the actual performance for each period and do not include the impact of any adjustments made for financial reporting required by Generally Accepted Accounting Principles (GAAP). |
24
GuidePath Flexible Income Allocation Fund
MANAGER’S DISCUSSION OF FUND PERFORMANCE (Continued) (Unaudited)
| • | | For the 6 months ended September 30, 2022, the Fund’s Service Shares returned (10.13)%, underperforming the Bloomberg US Aggregate Bond Index at (9.22)%. |
| • | | Exposure to long-term Treasuries detracted from returns as the Federal Reserve continued to raise target interest rates. Exposure to Treasury Inflation Protected Securities (TIPS) also detracted from returns. |
| • | | A small exposure to Technology sector equity detracted from performance. |
| • | | Positioning in the US Dollar benefited returns as it rose strongly against all other major currencies during the period. Short-term Treasuries exposure also benefitted Fund performance during the period. |
Components of Portfolio Holdings*
* Pie chart represents percentages of total portfolio, less securities lending collateral.
Top Ten Holdings
| | | | | | | | |
| Rank | | | Security/Holding | | % of Net
Assets | |
| | 1 | | | SPDR Portfolio Short Term Treasury ETF | | | 22.70 | % |
| | 2 | | | Vanguard Short-Term Treasury ETF | | | 12.43 | % |
| | 3 | | | Vanguard Long-Term Treasury ETF | | | 7.21 | % |
| | 4 | | | Vanguard Total Bond Market ETF | | | 6.67 | % |
| | 5 | | | Schwab Short-Term U.S. Treasury ETF | | | 5.44 | % |
| | 6 | | | iShares Convertible Bond ETF | | | 4.94 | % |
| | 7 | | | JP Morgan Ultra-Short Income ETF | | | 4.10 | % |
| | 8 | | | BlackRock Short Maturity Bond ETF | | | 4.10 | % |
| | 9 | | | SPDR Portfolio Mortgage Backed Bond ETF | | | 3.36 | % |
| | 10 | | | iShares Agency Bond ETF | | | 3.33 | % |
25
GuidePath Managed Futures Strategy Fund
MANAGER’S DISCUSSION OF FUND PERFORMANCE (Unaudited)
TOTAL RETURN BASED ON A $10,000 INVESTMENT
This chart assumes an initial gross investment of $10,000 made on January 19, 2016 (commencement of the Fund’s operations). Returns shown include the reinvestment of all dividends. Returns shown do not reflect the deduction of taxes that a shareholder would pay on Fund distributions or the redemption of Fund shares. In the absence of fee waivers and reimbursements, when they are necessary to keep expenses at the expense cap, total return would be reduced. Past performance is not predictive of future performance. Investment return and principal value will fluctuate so that your shares, when redeemed, may be worth more or less than the original cost. Index returns do not reflect the effects of fees or expenses. It is not possible to invest directly in an index.
FTSE 3-MONTH TREASURY BILL INDEX – The FTSE 3-Month Treasury Bill Index tracks the performance of U.S. Treasury Bills with a remaining maturity of three months.
SG TREND INDEX – The SG Trend Index is designed to track the 10 largest (by AUM) trend following commodity trading advisors and be representative of the trend followers in the managed futures space. Managers must meet the following criteria: must be open to new investment, must report returns on a daily basis, must be an industry recognized trend follower as determined at the discretion of the SG Index Committee, and must exhibit significant correlation to trend following peers and the SG Trend Indicator. Currently, one of the ten managers whose performance is tracked by the SG Trend Index is AlphaSimplex Group LLC, sub-advisor to the GuidePath Managed Futures Strategy Fund.
| | | | | | | | | | | | |
| AVERAGE ANNUAL TOTAL RETURN (for periods ended September 30) | |
| | | One Year
| | | Five Year
| | | Since Inception(1)
| |
GuidePath Managed Futures Strategy Fund(2) | | | | | | | | | | | | |
Service Shares | | | 45.82 | % | | | 11.41 | % | | | 6.15 | % |
Institutional Shares | | | 46.95 | % | | | 12.08 | % | | | 6.79 | % |
FTSE 3-Month Treasury Bill Index | | | 0.63 | % | | | 1.13 | % | | | 0.96 | % |
SG Trend Index | | | 33.87 | % | | | 11.19 | % | | | 5.55 | % |
| (1) | Inception date is January 19, 2016 for Service Shares and Institutional Shares. |
| (2) | The returns reflect the actual performance for each period and do not include the impact of any adjustments made for financial reporting required by Generally Accepted Accounting Principles (GAAP). |
26
GuidePath Managed Futures Strategy Fund
MANAGER’S DISCUSSION OF FUND PERFORMANCE (Continued) (Unaudited)
| • | | For the 6 months ended September 30, 2022, the Fund’s Service Shares returned 25.27%, outperforming the SG Trend Index at 15.24%. |
| • | | Most of the Fund’s outperformance occurred during the second quarter of 2022 due to short positions to global fixed income and long positions to the US dollar. The Fund’s use of forwards and futures to implement its strategy had a positive impact on performance. |
| • | | Long energy positions contributed positively to Fund performance, while long agriculture positions detracted within commodities. |
| • | | Equity positioning was a detractor due to long positions to global markets. |
Components of Portfolio Holdings*
* Pie chart represents percentages of total portfolio.
Percentages expressed exclude derivative instruments, such as futures and forward currency contracts.
Top Ten Holdings
| | | | |
| Rank | | Security/Holding | | % of Net
Assets |
| The GuidePath Managed Futures Strategy Fund did not hold any long term investments as of September 30, 2022. |
27
GuidePath Conservative Income Fund
MANAGER’S DISCUSSION OF FUND PERFORMANCE (Unaudited)
TOTAL RETURN BASED ON A $10,000 INVESTMENT
This chart assumes an initial gross investment of $10,000 made on April 30, 2018 (commencement of the Fund’s operations). Returns shown include the reinvestment of all dividends. Returns shown do not reflect the deduction of taxes that a shareholder would pay on Fund distributions or the redemption of Fund shares. In the absence of fee waivers and reimbursements, when they are necessary to keep expenses at the expense cap, total return would be reduced. Past performance is not predictive of future performance. Investment return and principal value will fluctuate so that your shares, when redeemed, may be worth more or less than the original cost. Index returns do not reflect the effects of fees or expenses. It is not possible to invest directly in an index.
BLOOMBERG U.S. Treasury 1-3 YEAR BOND INDEX – The Bloomberg U.S. Treasury 1-3 Year Bond Index measures the performance of the US government bond market and includes public obligations of the U.S. Treasury with a maturity between 1 and up to (but not including) 3 years. Certain special issues, such as state and local government series bonds (SLGs), as well as U.S. Treasury TIPS, are excluded. Separate trading of registered interest and principal securities (STRIPS) are excluded from the Index because their inclusion would result in double-counting.
| | | | | | | | |
| AVERAGE ANNUAL TOTAL RETURN (for periods ended September 30) | |
| | | One Year
| | | Since Inception(1)
| |
GuidePath Conservative Income Fund(2) | | | | | | | | |
Shares | | | -2.52 | % | | | 0.15 | % |
Bloomberg U.S. Treasury 1-3 Year Bond Index | | | -5.07 | % | | | 0.75 | % |
| (1) | Inception date for the Fund is April 30, 2018. |
| (2) | The returns reflect the actual performance for each period and do not include the impact of any adjustments made for financial reporting required by Generally Accepted Accounting Principles (GAAP). |
28
GuidePath Conservative Income Fund
MANAGER’S DISCUSSION OF FUND PERFORMANCE (Continued) (Unaudited)
| • | | For the 6 months ended September 30, 2022, the Fund returned (1.14)%, outperforming the Bloomberg US Treasury 1-3 Year Bond Index at (2.06)%. |
| • | | Exposure to investment grade bonds benefitted Fund returns but was off-set by bank loan exposure in April and TIPS exposure in the latter part of the period. |
| • | | A target allocation of 50% to cash equivalents benefitted performance, outperforming the negative returns of short-term Treasuries as the Federal Reserve signaled its willingness to continue raising interest rates. |
Components of Portfolio Holdings*
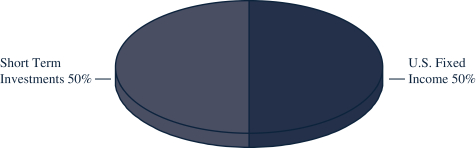
* Pie chart represents percentages of total portfolio, less securities lending collateral.
Top Ten Holdings
| | | | | | | | |
| Rank | | | Security/Holding | | % of Net
Assets | |
| | 1 | | | Schwab Short-Term U.S. Treasury ETF | | | 38.41 | % |
| | 2 | | | SPDR Bloomberg Investment Grade Floating Rate ETF | | | 11.48 | % |
29
GuidePath Income Fund
MANAGER’S DISCUSSION OF FUND PERFORMANCE (Unaudited)
TOTAL RETURN BASED ON A $10,000 INVESTMENT
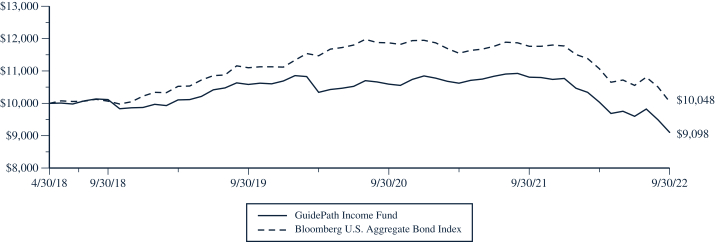
This chart assumes an initial gross investment of $10,000 made on April 30, 2018 (commencement of the Fund’s operations). Returns shown include the reinvestment of all dividends. Returns shown do not reflect the deduction of taxes that a shareholder would pay on Fund distributions or the redemption of Fund shares. In the absence of fee waivers and reimbursements, when they are necessary to keep expenses at the expense cap, total return would be reduced. Past performance is not predictive of future performance. Investment return and principal value will fluctuate so that your shares, when redeemed, may be worth more or less than the original cost. Index returns do not reflect the effects of fees or expenses. It is not possible to invest directly in an index.
BLOOMBERG U.S. AGGREGATE BOND INDEX – The Bloomberg U.S. Aggregate Bond Index is a broad-based benchmark that measures the investment-grade, U.S. dollar-denominated, fixed-rate taxable bond market, including Treasuries, government-related and corporate debt securities, mortgage- and asset-backed securities. All securities contained in the Bloomberg U.S. Aggregate Bond Index have a minimum term to maturity of one year.
| | | | | | | | |
| AVERAGE ANNUAL TOTAL RETURN (for periods ended September 30) | |
| | | One Year
| | | Since Inception(1)
| |
GuidePath Income Fund(2) | | | | | | | | |
Shares | | | -15.79 | % | | | -2.12 | % |
Bloomberg U.S. Aggregate Bond Index | | | -14.60 | % | | | 0.11 | % |
| (1) | Inception date for the Fund is April 30, 2018. |
| (2) | The returns reflect the actual performance for each period and do not include the impact of any adjustments made for financial reporting required by Generally Accepted Accounting Principles (GAAP). |
30
GuidePath Income Fund
MANAGER’S DISCUSSION OF FUND PERFORMANCE (Continued) (Unaudited)
| • | | For the 6 months ended September 30, 2022, the Fund returned (9.35)%, underperforming the Bloomberg US Aggregate Bond Index at (9.22)%. |
| • | | Exposure to investment grade credit within the Fund’s diversified bond allocation detracted from returns. |
| • | | Exposure to government bonds benefitted Fund returns during the period. |
Components of Portfolio Holdings*
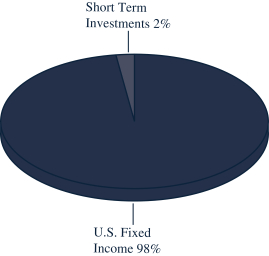
* Pie chart represents percentages of total portfolio, less securities lending collateral.
Top Ten Holdings
| | | | | | | | |
| Rank | | | Security/Holding | | % of Net
Assets | |
| | 1 | | | Vanguard Total Bond Market ETF | | | 49.06 | % |
| | 2 | | | iShares Core U.S. Aggregate Bond ETF | | | 48.62 | % |
31
GuidePath Growth and Income Fund
MANAGER’S DISCUSSION OF FUND PERFORMANCE (Unaudited)
TOTAL RETURN BASED ON A $10,000 INVESTMENT
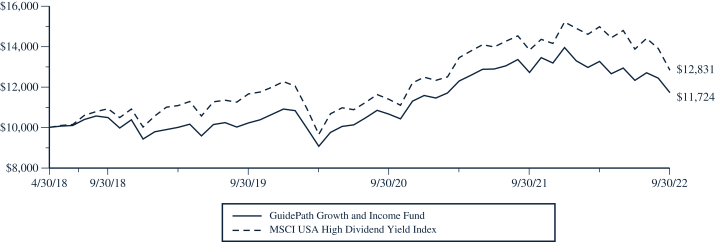
This chart assumes an initial gross investment of $10,000 made on April 30, 2018 (commencement of the Fund’s operations). Returns shown include the reinvestment of all dividends. Returns shown do not reflect the deduction of taxes that a shareholder would pay on Fund distributions or the redemption of Fund shares. In the absence of fee waivers and reimbursements, when they are necessary to keep expenses at the expense cap, total return would be reduced. Past performance is not predictive of future performance. Investment return and principal value will fluctuate so that your shares, when redeemed, may be worth more or less than the original cost. Index returns do not reflect the effects of fees or expenses. It is not possible to invest directly in an index.
MSCI USA HIGH DIVIDEND YIELD INDEX – The MSCI USA High Dividend Yield Index is based on the MSCI USA Index, its parent index, and includes large and mid cap stocks. The index is designed to reflect the performance of equities in the parent index (excluding REITs) with higher dividend income and quality characteristics than average dividend yields that are both sustainable and persistent. The index also applies quality screens and reviews 12-month past performance to omit stocks with potentially deteriorating fundamentals that could force them to cut or reduce dividends.
| | | | | | | | |
| AVERAGE ANNUAL TOTAL RETURN (for periods ended September 30) | |
| | | One Year
| | | Since Inception(1)
| |
GuidePath Growth and Income Fund(2) | | | | | | | | |
Shares | | | -7.82 | % | | | 3.67 | % |
MSCI USA High Dividend Yield Index | �� | | -7.28 | % | | | 5.80 | % |
| (1) | Inception date for the Fund is April 30, 2018. |
| (2) | The returns reflect the actual performance for each period and do not include the impact of any adjustments made for financial reporting required by Generally Accepted Accounting Principles (GAAP). |
32
GuidePath Growth and Income Fund
MANAGER’S DISCUSSION OF FUND PERFORMANCE (Continued) (Unaudited)
| • | | For the 6 months ended September 30, 2022, the Fund returned (11.67)%, outperforming the MSCI USA High Dividend Yield Index at (14.43)%. |
| • | | Exposure to MLPs and Energy sector-stocks boosted returns as energy prices gained traction, especially in May. |
| • | | The Fund’s put-write strategy detracted from returns, as the collection of the option premiums was offset by increased market volatility. |
| • | | The Fund’s volatility targeting component contributed to returns, especially during the August - September sharp market decline. |
Components of Portfolio Holdings*
* Pie chart represents percentages of total portfolio, less securities lending collateral.
Percentages expressed exclude derivative instruments, such as futures and options written.
Top Ten Holdings
| | | | | | | | |
| Rank | | | Security/Holding | | % of Net
Assets | |
| | 1 | | | Vanguard High Dividend Yield ETF | | | 26.79 | % |
| | 2 | | | Global X MLP ETF | | | 8.35 | % |
| | 3 | | | Johnson & Johnson | | | 1.29 | % |
| | 4 | | | Procter & Gamble, Co. | | | 1.16 | % |
| | 5 | | | Home Depot, Inc. | | | 1.16 | % |
| | 6 | | | Coca-Cola Co. | | | 1.15 | % |
| | 7 | | | PepsiCo, Inc. | | | 1.14 | % |
| | 8 | | | Merck & Co., Inc. | | | 1.06 | % |
| | 9 | | | McDonald’s Corp. | | | 0.90 | % |
| | 10 | | | Pfizer, Inc. | | | 0.90 | % |
33
GuideMark Funds & GuidePath Funds
EXPENSE EXAMPLE (Unaudited)
September 30, 2022
As a shareholder of the GuideMark & GuidePath Funds (the “Funds”), you incur ongoing costs, including management fees, distribution and/or service fees, and other Fund expenses. The Expense Example shown in this section is intended to help you understand your ongoing costs (in dollars) of investing in the Funds and to compare these costs with the ongoing costs of investing in other mutual funds.
The Expense Examples are based on an investment of $1,000 invested at the beginning of a six-month period and held for the entire period, which for all Funds is from April 1, 2022 to September 30, 2022, except as otherwise noted below.
Actual Expenses
The first line of the Expense Example table provides information about actual account values and actual expenses. You may use the information in this line, together with the amount you invested, to estimate the expenses that you paid over the period. Simply divide your account value by $1,000 (for example, an $8,600 account value divided by $1,000 = 8.6), then multiply the result by the number in the first line under the heading entitled “Expenses Paid During Period” to estimate the expenses you paid on your account during this period.
The example includes, but is not limited to, management fees, shareholder servicing fees, fund accounting fees, custody fees and transfer agent fees. However, the example below does not include portfolio trading commissions and related expenses, and other extraordinary expenses as determined under U.S. generally accepted accounting principles. To the extent that a Fund invests in shares of other investment companies as part of its investment strategy, you will indirectly bear your proportionate share of any fees and expenses charged by the underlying funds in which a Fund invests in addition to the expenses of the Fund. Actual expenses of the underlying funds are expected to vary among the various underlying funds. These expenses are not included in the example below.
Hypothetical Example for Comparison Purposes
The second line of the table below provides information about hypothetical account values and hypothetical expenses based on each Fund’s actual expenses ratios and an assumed rate of return of 5% per year before expenses, which is not the Fund’s actual return. The hypothetical account values and expenses may not be used to estimate the actual ending account balance or expenses you paid for the period. You may use this information to compare the ongoing costs of investing in the Funds and other funds. To do so, compare this 5% hypothetical example with the 5% hypothetical examples that appear in the shareholder reports of the other funds.
| | | | | | | | | | | | | | | | | | |
| Fund | | | | Beginning
Account Value
April 1, 2022 | | | Ending
Account Value
September 30, 2022 | | | Annualized
Expense Ratio1
based on the period
April 1, 2022 –
September 30, 2022 | | | Expenses Paid
During Period2
April 1, 2022 –
September 30, 2022 | |
| INSTITUTIONAL SHARES | | | | | | | | | | | | | | | | | | |
| GuideMark Large Cap | | Actual | | $ | 1,000.00 | | | $ | 795.40 | | | | 0.54% | | | $ | 2.43 | |
| Core Fund | | Hypothetical3 | | $ | 1,000.00 | | | $ | 1,022.36 | | | | 0.54% | | | $ | 2.74 | |
| GuideMark World | | Actual | | $ | 1,000.00 | | | $ | 774.50 | | | | 0.80% | | | $ | 3.56 | |
| ex-US Fund | | Hypothetical3 | | $ | 1,000.00 | | | $ | 1,021.16 | | | | 0.80% | | | $ | 4.05 | |
| GuidePath Growth | | Actual | | $ | 1,000.00 | | | $ | 778.00 | | | | 0.33% | | | $ | 1.46 | |
| Allocation Fund | | Hypothetical3 | | $ | 1,000.00 | | | $ | 1,023.43 | | | | 0.33% | | | $ | 1.66 | |
| GuidePath Conservative | | Actual | | $ | 1,000.00 | | | $ | 860.50 | | | | 0.23% | | | $ | 1.07 | |
| Allocation Fund | | Hypothetical3 | | $ | 1,000.00 | | | $ | 1,023.92 | | | | 0.23% | | | $ | 1.17 | |
| GuidePath Tactical | | Actual | | $ | 1,000.00 | | | $ | 913.50 | | | | 0.45% | | | $ | 2.16 | |
| Allocation Fund | | Hypothetical3 | | $ | 1,000.00 | | | $ | 1,022.81 | | | | 0.45% | | | $ | 2.28 | |
| GuidePath Absolute Return | | Actual | | $ | 1,000.00 | | | $ | 915.90 | | | | 0.29% | | | $ | 1.39 | |
| Allocation Fund | | Hypothetical3 | | $ | 1,000.00 | | | $ | 1,023.61 | | | | 0.29% | | | $ | 1.47 | |
| GuidePath Flexible Income | | Actual | | $ | 1,000.00 | | | $ | 900.40 | | | | 0.23% | | | $ | 1.10 | |
| Allocation Fund | | Hypothetical3 | | $ | 1,000.00 | | | $ | 1,023.92 | | | | 0.23% | | | $ | 1.17 | |
| GuidePath Managed Futures | | Actual | | $ | 1,000.00 | | | $ | 1,260.00 | | | | 1.14% | | | $ | 6.46 | |
| Strategy Fund | | Hypothetical3 | | $ | 1,000.00 | | | $ | 1,019.35 | | | | 1.14% | | | $ | 5.77 | |
| 1 | The expense ratio excludes securities lending credits as applicable. |
| 2 | Expenses (net of waivers, if applicable) are equal to the Fund’s annualized expense ratio, multiplied by the average account value over the period, multiplied by 183/365 to reflect the one-half year period. |
| 3 | 5% annualized return before expenses. |
34
GuideMark Funds & GuidePath Funds
EXPENSE EXAMPLE (Continued) (Unaudited)
September 30, 2022
| | | | | | | | | | | | | | | | | | |
| Fund | | | | Beginning
Account Value
April 1, 2022 | | | Ending
Account Value
September 30, 2022 | | | Annualized
Expense Ratio1
based on the period
April 1, 2022 –
September 30, 2022 | | | Expenses Paid
During Period2
April 1, 2022 –
September 30, 2022 | |
| SINGLE CLASS SHARES | | | | | | | | | | | | | | | | | | |
| GuidePath Conservative | | Actual | | $ | 1,000.00 | | | $ | 988.60 | | | | 0.75% | | | $ | 3.74 | |
| Income Fund | | Hypothetical3 | | $ | 1,000.00 | | | $ | 1,021.31 | | | | 0.75% | | | $ | 3.80 | |
| GuidePath Income | | Actual | | $ | 1,000.00 | | | $ | 906.50 | | | | 0.81% | | | $ | 3.87 | |
| Fund | | Hypothetical3 | | $ | 1,000.00 | | | $ | 1,021.01 | | | | 0.81% | | | $ | 4.10 | |
| GuidePath Growth and | | Actual | | $ | 1,000.00 | | | $ | 883.30 | | | | 0.94% | | | $ | 4.44 | |
| Income Fund | | Hypothetical3 | | $ | 1,000.00 | | | $ | 1,020.36 | | | | 0.94% | | | $ | 4.76 | |
| 1 | The expense ratio excludes securities lending credits as applicable. |
| 2 | Expenses (net of waivers, if applicable) are equal to the Fund’s annualized expense ratio, multiplied by the average account value over the period, multiplied by 183/365 to reflect the one-half year period. |
| 3 | 5% annualized return before expenses. |
| | | | | | | | | | | | | | | | | | |
| Fund | | | | Beginning
Account Value
April 1, 2022 | | | Ending
Account Value
September 30, 2022 | | | Annualized
Expense Ratio1
based on the period
April 1, 2022 –
September 30, 2022 | | | Expenses Paid
During Period2
April 1, 2022 –
September 30, 2022 | |
| SERVICE SHARES | | | | | | | | | | | | | | | | | | |
| GuideMark Large Cap | | Actual | | $ | 1,000.00 | | | $ | 795.40 | | | | 0.91% | | | $ | 4.10 | |
| Core Fund | | Hypothetical3 | | $ | 1,000.00 | | | $ | 1,020.51 | | | | 0.91% | | | $ | 4.61 | |
| GuideMark Emerging | | Actual | | $ | 1,000.00 | | | $ | 771.10 | | | | 1.42% | | | $ | 6.30 | |
| Markets Fund | | Hypothetical3 | | $ | 1,000.00 | | | $ | 1,017.95 | | | | 1.42% | | | $ | 7.18 | |
| GuideMark Small/Mid Cap | | Actual | | $ | 1,000.00 | | | $ | 801.80 | | | | 1.17% | | | $ | 5.28 | |
| Core Fund | | Hypothetical3 | | $ | 1,000.00 | | | $ | 1,019.20 | | | | 1.17% | | | $ | 5.92 | |
| GuideMark World | | Actual | | $ | 1,000.00 | | | $ | 769.20 | | | | 1.15% | | | $ | 5.10 | |
| ex-US Fund | | Hypothetical3 | | $ | 1,000.00 | | | $ | 1,019.30 | | | | 1.15% | | | $ | 5.82 | |
| GuideMark Core | | Actual | | $ | 1,000.00 | | | $ | 894.30 | | | | 0.95% | | | $ | 4.51 | |
| Fixed Income Fund | | Hypothetical3 | | $ | 1,000.00 | | | $ | 1,020.31 | | | | 0.95% | | | $ | 4.81 | |
| GuidePath Growth | | Actual | | $ | 1,000.00 | | | $ | 780.00 | | | | 0.69% | | | $ | 3.08 | |
| Allocation Fund | | Hypothetical3 | | $ | 1,000.00 | | | $ | 1,021.61 | | | | 0.69% | | | $ | 3.50 | |
| GuidePath Conservative | | Actual | | $ | 1,000.00 | | | $ | 858.20 | | | | 0.58% | | | $ | 2.70 | |
| Allocation Fund | | Hypothetical3 | | $ | 1,000.00 | | | $ | 1,022.16 | | | | 0.58% | | | $ | 2.94 | |
| GuidePath Tactical | | Actual | | $ | 1,000.00 | | | $ | 911.80 | | | | 0.80% | | | $ | 3.83 | |
| Allocation Fund | | Hypothetical3 | | $ | 1,000.00 | | | $ | 1,021.06 | | | | 0.80% | | | $ | 4.05 | |
| GuidePath Absolute Return | | Actual | | $ | 1,000.00 | | | $ | 914.20 | | | | 0.66% | | | $ | 3.17 | |
| Allocation Fund | | Hypothetical3 | | $ | 1,000.00 | | | $ | 1,021.76 | | | | 0.66% | | | $ | 3.35 | |
| GuidePath Multi-Asset Income | | Actual | | $ | 1,000.00 | | | $ | 845.30 | | | | 0.86% | | | $ | 3.98 | |
| Allocation Fund | | Hypothetical3 | | $ | 1,000.00 | | | $ | 1,020.76 | | | | 0.86% | | | $ | 4.36 | |
| GuidePath Flexible Income | | Actual | | $ | 1,000.00 | | | $ | 898.70 | | | | 0.58% | | | $ | 2.76 | |
| Allocation Fund | | Hypothetical3 | | $ | 1,000.00 | | | $ | 1,022.16 | | | | 0.58% | | | $ | 2.94 | |
| GuidePath Managed Futures | | Actual | | $ | 1,000.00 | | | $ | 1,252.70 | | | | 1.50% | | | $ | 8.47 | |
| Strategy Fund | | Hypothetical3 | | $ | 1,000.00 | | | $ | 1,017.55 | | | | 1.50% | | | $ | 7.59 | |
| 1 | The expense ratio excludes securities lending credits as applicable. |
| 2 | Expenses (net of waiver, if applicable) are equal to the Fund’s annualized expense ratio, multiplied by the average account value over the period, multiplied by 183/365 to reflect the one-half year period. |
| 3 | 5% annualized return before expenses. |
35
GuideMark Large Cap Core Fund
SCHEDULE OF INVESTMENTS (Unaudited)
September 30, 2022
| | | | | | | | |
Number of
Shares
| | | | | Value
| |
| | | | | COMMON STOCKS - 94.29% | |
| | | | | Aerospace & Defense - 1.10% | |
| | 1,531 | | | Curtiss-Wright Corp. (b) | | $ | 213,054 | |
| | 3,438 | | | General Dynamics Corp. | | | 729,440 | |
| | 1,041 | | | HEICO Corp. | | | 149,883 | |
| | 1,562 | | | HEICO Corp. - Class A | | | 179,036 | |
| | 1,955 | | | Hexcel Corp. (b) | | | 101,113 | |
| | 5,535 | | | Howmet Aerospace, Inc. | | | 171,197 | |
| | 1,434 | | | Huntington Ingalls Industries, Inc. | | | 317,631 | |
| | 599 | | | L3Harris Technologies, Inc. | | | 124,490 | |
| | 2,079 | | | Lockheed Martin Corp. | | | 803,097 | |
| | 1,458 | | | Northrop Grumman Corp. | | | 685,727 | |
| | 9,503 | | | Raytheon Technologies Corp. | | | 777,916 | |
| | 12,739 | | | Textron, Inc. | | | 742,174 | |
| | 385 | | | TransDigm Group, Inc. | | | 202,056 | |
| | | | | | |
|
|
|
| | | | | | | | 5,196,814 | |
| | | | | | |
|
|
|
| | | | | Air Freight & Logistics - 0.31% | | | | |
| | 6,607 | | | C.H. Robinson Worldwide, Inc. (b) | | | 636,320 | |
| | 2,843 | | | FedEx Corp. | | | 422,100 | |
| | 2,528 | | | United Parcel Service, Inc. - Class B (b) | | | 408,373 | |
| | | | | | |
|
|
|
| | | | | | | | 1,466,793 | |
| | | | | | |
|
|
|
| | | | | Airlines - 0.28% | | | | |
| | 20,098 | | | Alaska Air Group, Inc. (a) | | | 786,837 | |
| | 2,526 | | | Southwest Airlines Co. (a) | | | 77,902 | |
| | 13,654 | | | United Airlines Holdings, Inc. (a) | | | 444,164 | |
| | | | | | |
|
|
|
| | | | | | | | 1,308,903 | |
| | | | | | |
|
|
|
| | | | | Automobiles - 1.99% | | | | |
| | 106,087 | | | Ford Motor Co. | | | 1,188,174 | |
| | 6,050 | | | Harley-Davidson, Inc. | | | 211,024 | |
| | 25,548 | | | Tesla, Inc. (a) | | | 6,776,607 | |
| | 17,577 | | | Thor Industries, Inc. (b) | | | 1,230,039 | |
| | | | | | |
|
|
|
| | | | | | | | 9,405,844 | |
| | | | | | |
|
|
|
| | | | | Banks - 2.29% | | | | |
| | 45,952 | | | Bank of America Corp. | | | 1,387,751 | |
| | 2,038 | | | BOK Financial Corp. | | | 181,097 | |
| | 30,702 | | | Citigroup, Inc. | | | 1,279,352 | |
| | 4,566 | | | Citizens Financial Group, Inc. | | | 156,888 | |
| | 3,429 | | | Comerica, Inc. | | | 243,802 | |
| | 3,194 | | | Commerce Bancshares, Inc. | | | 211,315 | |
| | 2,506 | | | Cullen Frost Bankers, Inc. (b) | | | 331,343 | |
| | 18,459 | | | F.N.B. Corp. | | | 214,124 | |
| | 2,358 | | | Fifth Third Bancorp | | | 75,362 | |
| | 26,246 | | | JPMorgan Chase & Co. | | | 2,742,707 | |
| | 19,749 | | | KeyCorp | | | 316,379 | |
| | 1,274 | | | M&T Bank Corp. | | | 224,632 | |
| | 25,588 | | | PacWest Bancorp | | | 578,289 | |
| | 5,790 | | | Popular, Inc. - ADR | | | 417,227 | |
| | 3,226 | | | Prosperity Bancshares, Inc. | | | 215,110 | |
| | 13,484 | | | Regions Financial Corp. | | | 270,624 | |
| | 3,283 | | | Synovus Financial Corp. | | | 123,145 | |
| | 4,605 | | | Truist Financial Corp. (b) | | | 200,502 | |
| | 2,578 | | | U.S. Bancorp (b) | | | 103,945 | |
| | 32,406 | | | Wells Fargo & Co. | | | 1,303,369 | |
| | 2,597 | | | Wintrust Financial Corp. | | | 211,785 | |
| | | | | | |
|
|
|
| | | | | | | | 10,788,748 | |
| | | | | | |
|
|
|
| | | | | Beverages - 1.46% | | | | |
| | 1,404 | | | Boston Beer Co., Inc. - Class A (a) | | | 454,405 | |
| | 3,643 | | | Brown-Forman Corp. - Class A (b) | | | 246,121 | |
| | | | | | | | |
Number of
Shares
| | | | | Value
| |
| | | | | Beverages (Continued) | |
| | 4,069 | | | Brown-Forman Corp. - Class B | | $ | 270,873 | |
| | 1,364 | | | Constellation Brands, Inc. - Class A | | | 313,283 | |
| | 4,090 | | | Keurig Dr. Pepper, Inc. (b) | | | 146,504 | |
| | 22,211 | | | Molson Coors Brewing Co. - Class B (b) | | | 1,065,906 | |
| | 2,844 | | | Monster Beverage Corp. (a) | | | 247,314 | |
| | 15,960 | | | PepsiCo, Inc. | | | 2,605,630 | |
| | 27,582 | | | The Coca-Cola Co. | | | 1,545,144 | |
| | | | | | |
|
|
|
| | | | | | | | 6,895,180 | |
| | | | | | |
|
|
|
| | | | | Biotechnology - 1.98% | | | | |
| | 6,735 | | | Amgen, Inc. | | | 1,518,069 | |
| | 2,039 | | | Biogen, Inc. (a) | | | 544,413 | |
| | 2,514 | | | BioMarin Pharmaceutical, Inc. (a)(b) | | | 213,112 | |
| | 32,700 | | | Exelixis, Inc. (a) | | | 512,736 | |
| | 15,632 | | | Gilead Sciences, Inc. | | | 964,338 | |
| | 7,881 | | | Incyte Corp. (a) | | | 525,190 | |
| | 3,996 | | | Ionis Pharmaceuticals, Inc. (a) | | | 176,743 | |
| | 8,186 | | | Moderna, Inc. (a) | | | 967,994 | |
| | 1,545 | | | Regeneron Pharmaceuticals, Inc. (a)(b) | | | 1,064,304 | |
| | 1,881 | | | Sarepta Therapeutics, Inc. (a) | | | 207,926 | |
| | 1,822 | | | Seagen, Inc. (a) | | | 249,304 | |
| | 4,469 | | | United Therapeutics Corp. (a) | | | 935,719 | |
| | 5,127 | | | Vertex Pharmaceuticals, Inc. (a) | | | 1,484,472 | |
| | | | | | |
|
|
|
| | | | | | | | 9,364,320 | |
| | | | | | |
|
|
|
| | | | | Building Products - 0.91% | | | | |
| | 4,380 | | | A. O. Smith Corp. | | | 212,780 | |
| | 1,402 | | | Advanced Drainage Systems, Inc. | | | 174,367 | |
| | 26,529 | | | Builders FirstSource, Inc. (a) | | | 1,563,089 | |
| | 1,202 | | | Lennox International, Inc. | | | 267,649 | |
| | 9,739 | | | Masco Corp. | | | 454,714 | |
| | 14,470 | | | Owens Corning, Inc. (b) | | | 1,137,487 | |
| | 10,532 | | | Trex Co., Inc. (a) | | | 462,776 | |
| | | | | | |
|
|
|
| | | | | | | | 4,272,862 | |
| | | | | | |
|
|
|
| | | | | Capital Markets - 1.97% | | | | |
| | 2,888 | | | Ameriprise Financial, Inc. | | | 727,632 | |
| | 4,270 | | | Ares Management Corp. - Class A | | | 264,526 | |
| | 1,104 | | | CME Group, Inc. | | | 195,552 | |
| | 6,362 | | | Evercore, Inc. - Class A | | | 523,275 | |
| | 1,722 | | | FactSet Research Systems, Inc. | | | 688,989 | |
| | 22,233 | | | Franklin Resources, Inc. (b) | | | 478,454 | |
| | 49,823 | | | Invesco, Ltd. - ADR | | | 682,575 | |
| | 21,031 | | | Janus Henderson Group PLC - ADR | | | 427,140 | |
| | 14,557 | | | Lazard, Ltd. - Class A - ADR | | | 463,349 | |
| | 3,658 | | | LPL Financial Holdings, Inc. (b) | | | 799,200 | |
| | 2,500 | | | Moody’s Corp. | | | 607,775 | |
| | 5,495 | | | Morgan Stanley | | | 434,160 | |
| | 4,372 | | | Raymond James Financial, Inc. | | | 432,041 | |
| | 2,738 | | | SEI Investments Co. | | | 134,299 | |
| | 5,051 | | | Stifel Financial Corp. (b) | | | 262,197 | |
| | 1,153 | | | T. Rowe Price Group, Inc. | | | 121,077 | |
| | 2,206 | | | The Bank of New York Mellon Corp. | | | 84,975 | |
| | 11,414 | | | The Blackstone Group, Inc. (b) | | | 955,352 | |
| | 10,982 | | | The Carlyle Group, Inc. | | | 283,775 | |
| | 8,591 | | | The Charles Schwab Corp. | | | 617,435 | |
| | 4,447 | | | Virtu Financial, Inc. - Class A | | | 92,364 | |
| | | | | | |
|
|
|
| | | | | | | | 9,276,142 | |
| | | | | | |
|
|
|
| | | | | Chemicals - 1.20% | | | | |
| | 633 | | | Air Products & Chemicals, Inc. | | | 147,318 | |
| | 1,485 | | | Albemarle Corp. | | | 392,693 | |
See notes to financial statements.
36
GuideMark Large Cap Core Fund
SCHEDULE OF INVESTMENTS (Continued) (Unaudited)
September 30, 2022
| | | | | | | | |
Number of
Shares
| | | | | Value
| |
| | | | | COMMON STOCKS (Continued) | |
| | | | | Chemicals (Continued) | | | | |
| | 1,530 | | | Ashland Global Holdings, Inc. | | $ | 145,304 | |
| | 7,063 | | | CF Industries Holdings, Inc. | | | 679,814 | |
| | 8,748 | | | Corteva, Inc. | | | 499,948 | |
| | 12,363 | | | Dow, Inc. | | | 543,107 | |
| | 24,495 | | | Huntsman Corp. (b) | | | 601,107 | |
| | 1,448 | | | Linde PLC - ADR | | | 390,366 | |
| | 4,349 | | | LyondellBasell Industries NV - Class A - ADR | | | 327,393 | |
| | 10,435 | | | Olin Corp. | | | 447,453 | |
| | 2,974 | | | RPM International, Inc. | | | 247,764 | |
| | 4,012 | | | The Chemours Co. | | | 98,896 | |
| | 10,435 | | | The Mosaic Co. | | | 504,323 | |
| | 7,601 | | | Westlake Chemical Corp. (b) | | | 660,375 | |
| | | | | | |
|
|
|
| | | | | | | | 5,685,861 | |
| | | | | | |
|
|
|
| | | | | Commercial Services & Supplies - 0.58% | | | | |
| | 57,446 | | | ADT, Inc. | | | 430,271 | |
| | 2,097 | | | Cintas Corp. | | | 814,034 | |
| | 1,209 | | | Clean Harbors, Inc. (a) | | | 132,966 | |
| | 2,559 | | | Republic Services, Inc. | | | 348,126 | |
| | 16,847 | | | Rollins, Inc. | | | 584,254 | |
| | 2,600 | | | Waste Management, Inc. | | | 416,546 | |
| | | | | | |
|
|
|
| | | | | | | | 2,726,197 | |
| | | | | | |
|
|
|
| | | | | Communications Equipment - 1.34% | | | | |
| | 5,464 | | | Arista Networks, Inc. (a) | | | 616,831 | |
| | 35,419 | | | Cisco Systems, Inc. | | | 1,416,760 | |
| | 1,503 | | | F5 Networks, Inc. (a) | | | 217,529 | |
| | 6,819 | | | Juniper Networks, Inc. | | | 178,113 | |
| | 2,667 | | | Lumentum Holdings, Inc. (a)(b) | | | 182,876 | |
| | 2,030 | | | Motorola Solutions, Inc. | | | 454,659 | |
| | 4,311 | | | Palo Alto Networks, Inc. (a) | | | 706,099 | |
| | 15,706 | | | Qualcomm, Inc. | | | 1,774,464 | |
| | 2,654 | | | Ubiquiti, Inc. | | | 779,108 | |
| | | | | | |
|
|
|
| | | | | | | | 6,326,439 | |
| | | | | | |
|
|
|
| | | | | Construction & Engineering - 0.35% | | | | |
| | 10,326 | | | AECOM | | | 705,989 | |
| | 4,043 | | | KBR, Inc. | | | 174,738 | |
| | 5,246 | | | MasTec, Inc. (a) | | | 333,121 | |
| | 1,712 | | | Quanta Services, Inc. (b) | | | 218,092 | |
| | 5,370 | | | WillScot Mobile Mini Holdings Corp. (a) | | | 216,572 | |
| | | | | | |
|
|
|
| | | | | | | | 1,648,512 | |
| | | | | | |
|
|
|
| | | | | Consumer Finance - 1.17% | | | | |
| | 30,965 | | | Ally Financial, Inc. | | | 861,756 | |
| | 6,569 | | | American Express Co. | | | 886,224 | |
| | 10,462 | | | Capital One Financial Corp. | | | 964,283 | |
| | 850 | | | Credit Acceptance Corp. (a)(b) | | | 372,300 | |
| | 4,392 | | | Discover Financial Services | | | 399,321 | |
| | 27,476 | | | OneMain Holdings, Inc. (b) | | | 811,091 | |
| | 16,455 | | | SLM Corp. | | | 230,205 | |
| | 34,869 | | | Synchrony Financial | | | 982,957 | |
| | | | | | |
|
|
|
| | | | | | | | 5,508,137 | |
| | | | | | |
|
|
|
| | | | | Containers & Packaging - 0.21% | | | | |
| | 8,343 | | | Ardagh Group SA - ADR (c)(d)(f) | | | 67,620 | |
| | 9,685 | | | Graphic Packaging Holding Co. | | | 191,182 | |
| | 1,803 | | | Sealed Air Corp. | | | 80,251 | |
| | 3,529 | | | Silgan Holdings, Inc. | | | 148,359 | |
| | 16,693 | | | WestRock Co. | | | 515,647 | |
| | | | | | |
|
|
|
| | | | | | | | 1,003,059 | |
| | | | | | |
|
|
|
| | | | | | | | |
Number of
Shares
| | | | | Value
| |
| | | | | Distributors - 0.28% | | | | |
| | 3,815 | | | Genuine Parts Co. | | $ | 569,656 | |
| | 16,411 | | | LKQ Corp. | | | 773,778 | |
| | | | | | |
|
|
|
| | | | | | | | 1,343,434 | |
| | | | | | |
|
|
|
| | | | | Diversified Consumer Services - 0.29% | | | | |
| | 5,911 | | | Grand Canyon Education, Inc. (a) | | | 486,180 | |
| | 14,908 | | | H&R Block, Inc. (b) | | | 634,186 | |
| | 3,946 | | | Service Corp. International | | | 227,842 | |
| | | | | | |
|
|
|
| | | | | | | | 1,348,208 | |
| | | | | | |
|
|
|
| | | | | Diversified Financial Services - 0.43% | | | | |
| | 23,931 | | | Equitable Holdings, Inc. | | | 630,582 | |
| | 30,698 | | | Jefferies Financial Group, Inc. | | | 905,591 | |
| | 8,526 | | | Voya Financial, Inc. (b) | | | 515,823 | |
| | | | | | |
|
|
|
| | | | | | | | 2,051,996 | |
| | | | | | |
|
|
|
| | | | | Diversified Telecommunication Services - 0.49% | | | | |
| | 43,038 | | | AT&T, Inc. | | | 660,203 | |
| | 130,742 | | | Lumen Technologies, Inc. (b) | | | 951,802 | |
| | 17,961 | | | Verizon Communications, Inc. | | | 681,979 | |
| | | | | | |
|
|
|
| | | | | | | | 2,293,984 | |
| | | | | | |
|
|
|
| | | | | Electric Utilities - 1.21% | | | | |
| | 5,290 | | | American Electric Power Co., Inc. | | | 457,320 | |
| | 3,162 | | | Constellation Energy Corp. | | | 263,047 | |
| | 5,841 | | | Duke Energy Corp. | | | 543,330 | |
| | 6,501 | | | Edison International (b) | | | 367,827 | |
| | 919 | | | Entergy Corp. | | | 92,479 | |
| | 3,221 | | | Evergy, Inc. | | | 191,327 | |
| | 1,933 | | | Eversource Energy | | | 150,697 | |
| | 15,716 | | | Exelon Corp. | | | 588,721 | |
| | 9,810 | | | FirstEnergy Corp. | | | 362,970 | |
| | 3,852 | | | Hawaiian Electric Industries, Inc. | | | 133,510 | |
| | 1,190 | | | IDACORP, Inc. | | | 117,822 | |
| | 10,096 | | | NextEra Energy, Inc. | | | 791,627 | |
| | 9,054 | | | OGE Energy Corp. | | | 330,109 | |
| | 30,589 | | | PG&E Corp. (a) | | | 382,363 | |
| | 7,509 | | | PPL Corp. | | | 190,353 | |
| | 8,814 | | | The Southern Co. | | | 599,352 | |
| | 2,275 | | | Xcel Energy, Inc. | | | 145,600 | |
| | | | | | |
|
|
|
| | | | | | | | 5,708,454 | |
| | | | | | |
|
|
|
| | | | | Electrical Equipment - 0.31% | | | | |
| | 3,363 | | | Acuity Brands, Inc. | | | 529,572 | |
| | 1,318 | | | Agilent Technologies, Inc. (b) | | | 160,203 | |
| | 728 | | | Enphase Energy, Inc. (a) | | | 201,998 | |
| | 915 | | | Hubbell, Inc. | | | 204,045 | |
| | 5,392 | | | nVent Electric PLC - ADR | | | 170,441 | |
| | 3,808 | | | Plug Power, Inc. (a)(b) | | | 80,006 | |
| | 3,228 | | | Sensata Technologies Holding PLC - ADR | | | 120,340 | |
| | | | | | |
|
|
|
| | | | | | | | 1,466,605 | |
| | | | | | |
|
|
|
| | | | | Electronic Equipment, Instruments & Components - 0.33% | |
| | 3,057 | | | Amphenol Corp. - Class A | | | 204,697 | |
| | 880 | | | Arrow Electronics, Inc. (a) | | | 81,127 | |
| | 2,930 | | | Avnet, Inc. | | | 105,831 | |
| | 3,844 | | | Cognex Corp. | | | 159,334 | |
| | 2,181 | | | Dolby Laboratories, Inc. - Class A | | | 142,092 | |
| | 2,344 | | | Keysight Technologies, Inc. (a) | | | 368,852 | |
| | 11,309 | | | National Instruments Corp. | | | 426,802 | |
| | 229 | | | Zebra Technologies Corp. - Class A (a) | | | 60,000 | |
| | | | | | |
|
|
|
| | | | | | | | 1,548,735 | |
| | | | | | |
|
|
|
See notes to financial statements.
37
GuideMark Large Cap Core Fund
SCHEDULE OF INVESTMENTS (Continued) (Unaudited)
September 30, 2022
| | | | | | | | |
Number of
Shares
| | | | | Value
| |
| | | | | COMMON STOCKS (Continued) | |
| | | | | Energy Equipment & Services - 0.22% | | | | |
| | 7,438 | | | Baker Hughes Co. | | $ | 155,900 | |
| | 14,088 | | | Halliburton Co. | | | 346,847 | |
| | 11,049 | | | NOV, Inc. | | | 178,773 | |
| | 10,332 | | | Schlumberger Ltd. - ADR | | | 370,919 | |
| | | | | | |
|
|
|
| | | | | | | | 1,052,439 | |
| | | | | | |
|
|
|
| | | | | Entertainment - 0.43% | | | | |
| | 71,740 | | | Discovery Communications, Inc. - Series C (a) | | | 825,010 | |
| | 2,752 | | | Electronic Arts, Inc. | | | 318,434 | |
| | 5,382 | | | Liberty Media Corp. - Liberty Formula One - Class C (a) | | | 314,847 | |
| | 22,547 | | | Playtika Holding Corp. (a)(b) | | | 211,716 | |
| | 1,379 | | | Spotify Technology SA - ADR (a) | | | 119,008 | |
| | 469 | | | The Walt Disney Co. (a) | | | 44,241 | |
| | 2,978 | | | World Wrestling Entertainment, Inc. - Class A (b) | | | 208,966 | |
| | | | | | |
|
|
|
| | | | | | | | 2,042,222 | |
| | | | | | |
|
|
|
| | | | | Food & Staples Retailing - 2.76% | | | | |
| | 36,075 | | | Albertsons Cos., Inc. - Class A | | | 896,824 | |
| | 3,074 | | | BJ’s Wholesale Club Holdings, Inc. (a) | | | 223,818 | |
| | 3,130 | | | Casey’s General Stores, Inc. (b) | | | 633,888 | |
| | 5,759 | | | Costco Wholesale Corp. | | | 2,719,803 | |
| | 27,332 | | | CVS Health Corp. | | | 2,606,653 | |
| | 5,397 | | | Grocery Outlet Holding Corp. (a) | | | 179,666 | |
| | 28,109 | | | Kroger Co. (b) | | | 1,229,769 | |
| | 4,989 | | | Performance Food Group Co. (a) | | | 214,278 | |
| | 12,857 | | | SYSCO Corp. | | | 909,118 | |
| | 3,306 | | | US Foods Holding Corp. (a) | | | 87,411 | |
| | 35,403 | | | Walgreens Boots Alliance, Inc. | | | 1,111,654 | |
| | 16,903 | | | Walmart, Inc. | | | 2,192,319 | |
| | | | | | |
|
|
|
| | | | | | | | 13,005,201 | |
| | | | | | |
|
|
|
| | | | | Food Products - 1.91% | | | | |
| | 15,996 | | | Archer-Daniels-Midland Co. | | | 1,286,878 | |
| | 5,225 | | | Bunge, Ltd. - ADR | | | 431,428 | |
| | 3,660 | | | Campbell Soup Co. | | | 172,459 | |
| | 5,966 | | | ConAgra Brands, Inc. | | | 194,671 | |
| | 1,855 | | | Darling International, Inc. (a) | | | 122,708 | |
| | 28,315 | | | Flowers Foods, Inc. | | | 699,097 | |
| | 10,412 | | | General Mills, Inc. | | | 797,663 | |
| | 4,373 | | | Hormel Foods Corp. | | | 198,709 | |
| | 2,570 | | | Ingredion, Inc. | | | 206,936 | |
| | 5,636 | | | Kellogg Co. | | | 392,604 | |
| | 1,894 | | | Lamb Weston Holdings, Inc. | | | 146,558 | |
| | 2,481 | | | McCormick & Co, Inc. - Non Voting | | | 176,821 | |
| | 8,527 | | | Mondelez International, Inc. - Class A | | | 467,535 | |
| | 17,271 | | | Pilgrim’s Pride Corp. (a) | | | 397,579 | |
| | 12,414 | | | Post Holdings, Inc. (a) | | | 1,016,831 | |
| | 4,385 | | | The Hershey Co. | | | 966,761 | |
| | 1,762 | | | The J.M. Smucker Co. | | | 242,117 | |
| | 14,285 | | | The Kraft Heinz Co. | | | 476,405 | |
| | 9,723 | | | Tyson Foods, Inc. - Class A | | | 641,037 | |
| | | | | | |
|
|
|
| | | | | | | | 9,034,797 | |
| | | | | | |
|
|
|
| | | | | Gas Utilities - 0.37% | | | | |
| | 1,901 | | | Atmos Energy Corp. | | | 193,617 | |
| | 10,717 | | | EQT Corp. (b) | | | 436,718 | |
| | 6,556 | | | National Fuel Gas Co. (b) | | | 403,522 | |
| | 21,910 | | | UGI Corp. | | | 708,350 | |
| | | | | | |
|
|
|
| | | | | | | | 1,742,207 | |
| | | | | | |
|
|
|
| | | | | | | | |
Number of
Shares
| | | | | Value
| |
| | | | | Health Care Equipment & Supplies - 1.18% | | | | |
| | 1,606 | | | ABIOMED, Inc. (a) | | $ | 394,530 | |
| | 1,838 | | | Align Technology, Inc. (a) | | | 380,668 | |
| | 988 | | | Becton Dickinson and Co. | | | 220,156 | |
| | 3,544 | | | Danaher Corp. | | | 915,380 | |
| | 7,617 | | | Dentsply Sirona, Inc. | | | 215,942 | |
| | 2,217 | | | DexCom, Inc. (a) | | | 178,557 | |
| | 9,508 | | | Edwards Lifesciences Corp. (a) | | | 785,646 | |
| | 2,382 | | | Globus Medical, Inc. - Class A (a) | | | 141,896 | |
| | 3,011 | | | Hologic, Inc. (a)(b) | | | 194,270 | |
| | 2,108 | | | IDEXX Laboratories, Inc. (a) | | | 686,786 | |
| | 794 | | | Insulet Corp. (a) | | | 182,144 | |
| | 670 | | | Masimo Corp. (a) | | | 94,577 | |
| | 1,026 | | | Novocure, Ltd. - ADR (a)(b) | | | 77,955 | |
| | 753 | | | Penumbra, Inc. (a)(b) | | | 142,769 | |
| | 2,512 | | | ResMed, Inc. | | | 548,370 | |
| | 910 | | | Stryker Corp. | | | 184,311 | |
| | 1,413 | | | Tandem Diabetes Care, Inc. (a) | | | 67,612 | |
| | 683 | | | West Pharmaceutical Services, Inc. | | | 168,073 | |
| | | | | | |
|
|
|
| | | | | | | | 5,579,642 | |
| | | | | | |
|
|
|
| | | | | Health Care Providers & Services - 3.77% | | | | |
| | 2,115 | | | Acadia Healthcare Co., Inc. (a)(b) | | | 165,351 | |
| | 2,825 | | | Amedisys, Inc. (a) | | | 273,432 | |
| | 2,943 | | | AmerisourceBergen Corp. | | | 398,276 | |
| | 3,247 | | | Anthem, Inc. | | | 1,474,917 | |
| | 6,469 | | | Cardinal Health, Inc. (b) | | | 431,353 | |
| | 22,522 | | | Centene Corp. (a) | | | 1,752,437 | |
| | 1,036 | | | Chemed Corp. | | | 452,276 | |
| | 7,794 | | | Cigna Corp. | | | 2,162,601 | |
| | 895 | | | DaVita, Inc. (a)(b) | | | 74,079 | |
| | 1,052 | | | HCA Healthcare, Inc. | | | 193,347 | |
| | 8,034 | | | Henry Schein, Inc. (a) | | | 528,396 | |
| | 2,066 | | | Humana, Inc. | | | 1,002,403 | |
| | 2,510 | | | Laboratory Corp. of America Holdings | | | 514,073 | |
| | 2,444 | | | McKesson Corp. | | | 830,642 | |
| | 1,074 | | | Molina Healthcare, Inc. (a) | | | 354,248 | |
| | 1,510 | | | PerkinElmer, Inc. | | | 181,699 | |
| | 3,142 | | | Quest Diagnostics, Inc. (b) | | | 385,492 | |
| | 12,029 | | | UnitedHealth Group, Inc. | | | 6,075,126 | |
| | 6,143 | | | Universal Health Services, Inc. - Class B (b) | | | 541,690 | |
| | | | | | |
|
|
|
| | | | | | | | 17,791,838 | |
| | | | | | |
|
|
|
| | | | | Health Care Technology - 0.02% | | | | |
| | 559 | | | Veeva Systems, Inc. - Class A (a) | | | 92,168 | |
| | | | | | |
|
|
|
| | | | | Hotels, Restaurants & Leisure - 1.02% | | | | |
| | 6,085 | | | Aramark | | | 189,852 | |
| | 5,739 | | | Boyd Gaming Corp. (b) | | | 273,463 | |
| | 1,942 | | | Domino’s Pizza, Inc. | | | 602,409 | |
| | 2,541 | | | Hyatt Hotels Corp. - Class A (a) | | | 205,719 | |
| | 1,742 | | | Marriott International, Inc. - Class A | | | 244,124 | |
| | 2,279 | | | Marriott Vacations Worldwide Corp. (b) | | | 277,719 | |
| | 5,144 | | | McDonald’s Corp. | | | 1,186,927 | |
| | 11,590 | | | MGM Resorts International | | | 344,455 | |
| | 34,218 | | | Penn National Gaming, Inc. (a)(b) | | | 941,337 | |
| | 5,280 | | | Yum! Brands, Inc. | | | 561,475 | |
| | | | | | |
|
|
|
| | | | | | | | 4,827,480 | |
| | | | | | |
|
|
|
| | | | | Household Durables - 0.63% | | | | |
| | 901 | | | Garmin Ltd. - ADR | | | 72,359 | |
| | 8,482 | | | Lennar Corp. - Class A (b) | | | 632,333 | |
| | 9,292 | | | Lennar Corp. - Class B | | | 552,967 | |
See notes to financial statements.
38
GuideMark Large Cap Core Fund
SCHEDULE OF INVESTMENTS (Continued) (Unaudited)
September 30, 2022
| | | | | | | | |
Number of
Shares
| | | | | Value
| |
| | | | | COMMON STOCKS (Continued) | |
| | | | | Household Durables (Continued) | | | | |
| | 98 | | | NVR, Inc. (a) | | $ | 390,734 | |
| | 4,925 | | | PulteGroup, Inc. (b) | | | 184,688 | |
| | 13,089 | | | Tempur Sealy International, Inc. (b) | | | 315,968 | |
| | 19,741 | | | Toll Brothers, Inc. (b) | | | 829,122 | |
| | | | | | |
|
|
|
| | | | | | | | 2,978,171 | |
| | | | | | |
|
|
|
| | | | | Household Products - 1.10% | | | | |
| | 3,675 | | | Church & Dwight, Inc. | | | 262,542 | |
| | 1,937 | | | Clorox Co. | | | 248,691 | |
| | 14,603 | | | Colgate-Palmolive Co. | | | 1,025,861 | |
| | 2,187 | | | Kimberly-Clark Corp. | | | 246,125 | |
| | 27,017 | | | The Procter & Gamble Co. | | | 3,410,896 | |
| | | | | | |
|
|
|
| | | | | | | | 5,194,115 | |
| | | | | | |
|
|
|
| | | | | Independent Power and Renewable Electricity Producers - 0.53% | |
| | 50,221 | | | NRG Energy, Inc. | | | 1,921,958 | |
| | 28,773 | | | Vistra Energy Corp. | | | 604,233 | |
| | | | | | |
|
|
|
| | | | | | | | 2,526,191 | |
| | | | | | |
|
|
|
| | | | | Industrial Conglomerates - 0.28% | | | | |
| | 3,326 | | | 3M Co. | | | 367,523 | |
| | 1,805 | | | Carlisle Companies, Inc. | | | 506,140 | |
| | 6,873 | | | General Electric Co. | | | 425,507 | |
| | | | | | |
|
|
|
| | | | | | | | 1,299,170 | |
| | | | | | |
|
|
|
| | | | | Insurance - 3.99% | | | | |
| | 7,483 | | | Aflac, Inc. | | | 420,545 | |
| | 227 | | | Alleghany Corp. (a) | | | 190,537 | |
| | 2,958 | | | American Financial Group, Inc. | | | 363,627 | |
| | 19,070 | | | American International Group, Inc. | | | 905,444 | |
| | 4,564 | | | Aon PLC - Class A - ADR | | | 1,222,559 | |
| | 3,982 | | | Arch Capital Group, Ltd. - ADR (a) | | | 181,340 | |
| | 3,483 | | | Arthur J. Gallagher & Co. | | | 596,359 | |
| | 1,594 | | | Assurant, Inc. | | | 231,560 | |
| | 5,740 | | | Assured Guaranty, Ltd. - ADR | | | 278,103 | |
| | 5,972 | | | Axis Capital Holdings, Ltd. - ADR | | | 293,524 | |
| | 14,307 | | | Berkshire Hathaway, Inc. - Class B (a) | | | 3,820,255 | |
| | 16,634 | | | Brighthouse Financial, Inc. (a) | | | 722,248 | |
| | 7,509 | | | Brown & Brown, Inc. | | | 454,144 | |
| | 2,644 | | | Chubb, Ltd. - ADR | | | 480,891 | |
| | 1,436 | | | Cincinnati Financial Corp. | | | 128,623 | |
| | 3,936 | | | CNA Financial Corp. | | | 145,238 | |
| | 697 | | | Erie Indemnity Co. - Class A | | | 154,950 | |
| | 397 | | | Everest Re Group, Ltd. - ADR | | | 104,189 | |
| | 17,457 | | | Fidelity National Financial, Inc. | | | 631,943 | |
| | 13,479 | | | First American Financial Corp. | | | 621,382 | |
| | 1,308 | | | Globe Life, Inc. | | | 130,408 | |
| | 3,585 | | | Hartford Financial Services Group, Inc. | | | 222,055 | |
| | 10,612 | | | Lincoln National Corp. | | | 465,973 | |
| | 2,883 | | | Loews Corp. | | | 143,689 | |
| | 7,043 | | | Marsh & McLennan Cos., Inc. | | | 1,051,450 | |
| | 11,741 | | | MetLife, Inc. | | | 713,618 | |
| | 25,640 | | | Old Republic International Corp. | | | 536,645 | |
| | 4,163 | | | Principal Financial Group, Inc. (b) | | | 300,360 | |
| | 4,067 | | | Prudential Financial, Inc. | | | 348,867 | |
| | 1,526 | | | Reinsurance Group of America, Inc. | | | 191,986 | |
| | 4,732 | | | Ryan Specialty Holdings, Inc. (a) | | | 192,214 | |
| | 1,381 | | | The Allstate Corp. | | | 171,976 | |
| | 5,485 | | | The Progressive Corp. | | | 637,412 | |
| | 1,357 | | | The Travelers Cos., Inc. | | | 207,892 | |
| | 25,098 | | | Unum Group | | | 973,802 | |
| | 6,600 | | | W.R. Berkley Corp. | | | 426,228 | |
| | 137 | | | White Mountains Insurance Group, Ltd. - ADR | | | 178,514 | |
| | | | | | |
|
|
|
| | | | | | | | 18,840,550 | |
| | | | | | |
|
|
|
| | | | | | | | |
Number of
Shares
| | | | | Value
| |
| | | | | Interactive Media & Services - 3.90% | | | | |
| | 70,937 | | | Alphabet, Inc. - Class A (a) | | $ | 6,785,124 | |
| | 64,128 | | | Alphabet, Inc. - Class C (a) | | | 6,165,907 | |
| | 8,164 | | | Match Group, Inc. (a) | | | 389,831 | |
| | 24,477 | | | Meta Platforms, Inc. - Class A (a) | | | 3,321,039 | |
| | 19,641 | | | Pinterest, Inc. - Class A (a) | | | 457,635 | |
| | 8,122 | | | TripAdvisor, Inc. (a) | | | 179,334 | |
| | 18,905 | | | Zillow Group, Inc. - Class A (a) | | | 541,250 | |
| | 19,583 | | | Zillow Group, Inc. - Class C (a) | | | 560,270 | |
| | | | | | |
|
|
|
| | | | | | | | 18,400,390 | |
| | | | | | |
|
|
|
| | | | | Internet & Direct Marketing Retail - 2.64% | | | | |
| | 98,823 | | | Amazon.com, Inc. (a) | | | 11,166,999 | |
| | 263 | | | Booking Holdings, Inc. (a) | | | 432,164 | |
| | 3,909 | | | eBay, Inc. | | | 143,890 | |
| | 3,529 | | | Etsy, Inc. (a)(b) | | | 353,359 | |
| | 10,528 | | | Wayfair, Inc. - Class A (a)(b) | | | 342,687 | |
| | | | | | |
|
|
|
| | | | | | | | 12,439,099 | |
| | | | | | |
|
|
|
| | | | | IT Services - 3.97% | | | | |
| | 7,973 | | | Accenture PLC - Class A - ADR | | | 2,051,453 | |
| | 3,022 | | | Akamai Technologies, Inc. (a) | | | 242,727 | |
| | 7,417 | | | Amdocs, Ltd. - ADR | | | 589,281 | |
| | 3,884 | | | Automatic Data Processing, Inc. | | | 878,522 | |
| | 2,513 | | | Block, Inc. (a) | | | 138,190 | |
| | 3,010 | | | Booz Allen Hamilton Holding Corp. | | | 277,973 | |
| | 3,072 | | | CACI International, Inc. - Class A (a) | | | 801,976 | |
| | 14,162 | | | Cognizant Technology Solutions Corp. - Class A | | | 813,465 | |
| | 4,398 | | | Concentrix Corp. | | | 490,949 | |
| | 71,521 | | | DXC Technology Co. (a) | | | 1,750,834 | |
| | 643 | | | EPAM Systems, Inc. (a) | | | 232,888 | |
| | 5,157 | | | Euronet Worldwide, Inc. (a) | | | 390,694 | |
| | 8,456 | | | Fidelity National Information Services, Inc. | | | 639,020 | |
| | 6,795 | | | Fiserv, Inc. (a) | | | 635,808 | |
| | 487 | | | FleetCor Technologies, Inc. (a) | | | 85,795 | |
| | 1,753 | | | Gartner, Inc. (a) | | | 485,038 | |
| | 5,124 | | | Genpact, Ltd. - ADR | | | 224,277 | |
| | 4,359 | | | Global Payments, Inc. | | | 470,990 | |
| | 2,328 | | | GoDaddy, Inc. - Class A (a) | | | 165,009 | |
| | 7,505 | | | MasterCard, Inc. - Class A (b) | | | 2,133,972 | |
| | 5,565 | | | Paychex, Inc. | | | 624,449 | |
| | 6,136 | | | PayPal Holdings, Inc. (a) | | | 528,126 | |
| | 3,623 | | | Science Applications International Corp. | | | 320,382 | |
| | 11,561 | | | Switch, Inc. - Class A | | | 389,490 | |
| | 29,697 | | | The Western Union Co. | | | 400,909 | |
| | 1,297 | | | T-Mobile USA, Inc. (a)(b) | | | 174,018 | |
| | 3,594 | | | VeriSign, Inc. (a) | | | 624,278 | |
| | 11,103 | | | Visa, Inc. - Class A (b) | | | 1,972,448 | |
| | 2,734 | | | Wix.com, Ltd. - ADR (a) | | | 213,881 | |
| | | | | | |
|
|
|
| | | | | | | | 18,746,842 | |
| | | | | | |
|
|
|
| | | | | Leisure Products - 0.25% | | | | |
| | 26,821 | | | Mattel, Inc. (a)(b) | | | 507,990 | |
| | 1,161 | | | Pool Corp. (b) | | | 369,442 | |
| | 10,585 | | | YETI Holdings, Inc. (a)(b) | | | 301,884 | |
| | | | | | |
|
|
|
| | | | | | | | 1,179,316 | |
| | | | | | |
|
|
|
| | | | | Life Sciences Tools & Services - 0.77% | | | | |
| | 5,149 | | | 10X Genomics, Inc. - Class A (a) | | | 146,644 | |
| | 6,810 | | | Avantor, Inc. (a) | | | 133,476 | |
| | 162 | | | Bio-Techne Corp. | | | 46,008 | |
| | 1,077 | | | Bruker Corp. | | | 57,146 | |
| | 426 | | | IQVIA Holdings, Inc. (a) | | | 77,166 | |
See notes to financial statements.
39
GuideMark Large Cap Core Fund
SCHEDULE OF INVESTMENTS (Continued) (Unaudited)
September 30, 2022
| | | | | | | | |
Number of
Shares
| | | | | Value
| |
| | | | | COMMON STOCKS (Continued) | |
| | | | | Life Sciences Tools & Services (Continued) | | | | |
| | 541 | | | Mettler-Toledo International, Inc. (a) | | $ | 586,509 | |
| | 13,136 | | | Syneos Health, Inc. (a) | | | 619,362 | |
| | 2,923 | | | Thermo Fisher Scientific, Inc. | | | 1,482,516 | |
| | 1,848 | | | Waters Corp. (a) | | | 498,091 | |
| | | | | | |
|
|
|
| | | | | | | | 3,646,918 | |
| | | | | | |
|
|
|
| | | | | Machinery - 1.20% | | | | |
| | 7,297 | | | Allison Transmission Holdings, Inc. | | | 246,347 | |
| | 1,013 | | | Deere & Co. | | | 338,231 | |
| | 4,671 | | | Donaldson Co., Inc. | | | 228,926 | |
| | 14,290 | | | Esab Corp. | | | 476,714 | |
| | 49,452 | | | Gates Industrial Corp PLC - ADR (a) | | | 482,651 | |
| | 4,072 | | | Graco, Inc. | | | 244,116 | |
| | 2,106 | | | Illinois Tool Works, Inc. | | | 380,449 | |
| | 3,784 | | | Lincoln Electric Holdings, Inc. | | | 475,724 | |
| | 1,111 | | | Nordson Corp. | | | 235,832 | |
| | 13,985 | | | Oshkosh Corp. | | | 983,006 | |
| | 4,720 | | | Otis Worldwide Corp. | | | 301,136 | |
| | 2,353 | | | PACCAR, Inc. | | | 196,923 | |
| | 1,042 | | | Parker-Hannifin Corp. | | | 252,487 | |
| | 816 | | | Snap-on, Inc. (b) | | | 164,302 | |
| | 2,771 | | | The Toro Co. | | | 239,636 | |
| | 585 | | | Valmont Industries, Inc. | | | 157,143 | |
| | 3,193 | | | Wabtec Corp. (b) | | | 259,750 | |
| | | | | | |
|
|
|
| | | | | | | | 5,663,373 | |
| | | | | | |
|
|
|
| | | | | Marine - 0.04% | | | | |
| | 3,493 | | | Kirby Corp. (a)(b) | | | 212,270 | |
| | | | | | |
|
|
|
| | | | | Media - 1.41% | | | | |
| | 39,713 | | | Comcast Corp. - Class A | | | 1,164,782 | |
| | 16,294 | | | Fox Corp. - Class A (b) | | | 499,900 | |
| | 16,700 | | | Fox Corp. - Class B | | | 475,950 | |
| | 18,163 | | | Liberty Media Corp.-Liberty SiriusXM - Class A (a)(b) | | | 691,465 | |
| | 18,628 | | | Liberty Media Corp.-Liberty SiriusXM - Class C (a) | | | 702,462 | |
| | 5,043 | | | Liberty Media Group - Class A (a) | | | 264,858 | |
| | 47,972 | | | News Corp. - Class A | | | 724,857 | |
| | 46,028 | | | News Corp. - Class B (b) | | | 709,752 | |
| | 4,542 | | | Nexstar Media Group, Inc. | | | 757,833 | |
| | 84,549 | | | Sirius XM Holdings, Inc. (b) | | | 482,775 | |
| | 6,819 | | | The New York Times Co. - Class A | | | 196,046 | |
| | | | | | |
|
|
|
| | | | | | | | 6,670,680 | |
| | | | | | |
|
|
|
| | | | | Metals & Mining - 1.02% | | | | |
| | 9,173 | | | Alcoa Corp. | | | 308,763 | |
| | 43,807 | | | Cleveland-Cliffs, Inc. (a)(b) | | | 590,080 | |
| | 9,522 | | | Nucor Corp. (b) | | | 1,018,759 | |
| | 6,398 | | | Reliance Steel & Aluminum Co. | | | 1,115,875 | |
| | 13,343 | | | Steel Dynamics, Inc. (b) | | | 946,686 | |
| | 46,935 | | | United States Steel Corp. (b) | | | 850,462 | |
| | | | | | |
|
|
|
| | | | | | | | 4,830,625 | |
| | | | | | |
|
|
|
| | | | | Multiline Retail - 1.18% | | | | |
| | 3,053 | | | Burlington Stores, Inc. (a)(b) | | | 341,600 | |
| | 3,691 | | | Dollar General Corp. | | | 885,323 | |
| | 3,988 | | | Dollar Tree, Inc. (a) | | | 542,767 | |
| | 29,475 | | | Kohl’s Corp. | | | 741,296 | |
| | 101,583 | | | Macy’s, Inc. (b) | | | 1,591,806 | |
| | 31,801 | | | Nordstrom, Inc. (b) | | | 532,031 | |
| | 6,457 | | | Target Corp. | | | 958,154 | |
| | | | | | |
|
|
|
| | | | | | | | 5,592,977 | |
| | | | | | |
|
|
|
| | | | | | | | |
Number of
Shares
| | | | | Value
| |
| | | | | Multi-Utilities - 0.70% | | | | |
| | 3,455 | | | Ameren Corp. | | $ | 278,300 | |
| | 15,531 | | | CenterPoint Energy, Inc. | | | 437,664 | |
| | 3,140 | | | CMS Energy Corp. | | | 182,874 | |
| | 6,339 | | | Consolidated Edison, Inc. | | | 543,633 | |
| | 4,850 | | | Dominion Energy, Inc. | | | 335,183 | |
| | 3,096 | | | DTE Energy Co. | | | 356,195 | |
| | 13,074 | | | NiSource, Inc. | | | 329,334 | |
| | 3,105 | | | Public Service Enterprise Group, Inc. | | | 174,594 | |
| | 2,579 | | | Sempra Energy | | | 386,695 | |
| | 2,958 | | | WEC Energy Group, Inc. | | | 264,534 | |
| | | | | | |
|
|
|
| | | | | | | | 3,289,006 | |
| | | | | | |
|
|
|
| | | | | Oil, Gas & Consumable Fuels - 5.47% | | | | |
| | 20,466 | | | Antero Midstream Corp. | | | 187,878 | |
| | 12,435 | | | Antero Resources Corp. (a) | | | 379,640 | |
| | 12,469 | | | APA Corp. | | | 426,315 | |
| | 16,111 | | | Cabot Oil & Gas Corp. | | | 420,819 | |
| | 4,601 | | | Cheniere Energy, Inc. | | | 763,352 | |
| | 19,532 | | | Chevron Corp. | | | 2,806,162 | |
| | 15,411 | | | ConocoPhillips | | | 1,577,162 | |
| | 5,348 | | | Continental Resources, Inc. | | | 357,300 | |
| | 13,578 | | | Devon Energy Corp. (b) | | | 816,445 | |
| | 3,471 | | | Diamondback Energy, Inc. | | | 418,117 | |
| | 6,168 | | | DT Midstream, Inc. | | | 320,057 | |
| | 3,777 | | | Enviva, Inc. | | | 226,847 | |
| | 7,453 | | | EOG Resources, Inc. | | | 832,724 | |
| | 48,222 | | | Exxon Mobil Corp. | | | 4,210,263 | |
| | 3,058 | | | Hess Corp. (b) | | | 333,291 | |
| | 18,087 | | | HF Sinclair Corp. | | | 973,804 | |
| | 8,134 | | | Kinder Morgan, Inc. | | | 135,350 | |
| | 53,570 | | | Marathon Oil Corp. | | | 1,209,610 | |
| | 16,731 | | | Marathon Petroleum Corp. | | | 1,661,890 | |
| | 3,273 | | | New Fortress Energy, Inc. (b) | | | 143,063 | |
| | 18,607 | | | Occidental Petroleum Corp. (b) | | | 1,143,400 | |
| | 6,520 | | | ONEOK, Inc. | | | 334,085 | |
| | 12,115 | | | OVINTIV, Inc. | | | 557,290 | |
| | 6,789 | | | PDC Energy, Inc. | | | 392,336 | |
| | 15,129 | | | Phillips 66 | | | 1,221,213 | |
| | 3,162 | | | Pioneer Natural Resources Co. | | | 684,668 | |
| | 11,115 | | | Range Resources Corp. (b) | | | 280,765 | |
| | 30,123 | | | Southwestern Energy Co. (a) | | | 184,353 | |
| | 11,412 | | | Targa Resources Corp. | | | 688,600 | |
| | 129 | | | Texas Pacific Land Corp. (b) | | | 229,263 | |
| | 17,509 | | | The Williams Companies, Inc. (b) | | | 501,283 | |
| | 12,955 | | | Valero Energy Corp. | | | 1,384,242 | |
| | | | | | |
|
|
|
| | | | | | | | 25,801,587 | |
| | | | | | |
|
|
|
| | | | | Paper & Forest Products - 0.16% | | | | |
| | 15,112 | | | Louisiana-Pacific Corp. (b) | | | 773,583 | |
| | | | | | |
|
|
|
| | | | | Personal Products - 0.28% | | | | |
| | 97,419 | | | Coty, Inc. - Class A (a) | | | 615,688 | |
| | 3,254 | | | The Estee Lauder Cos., Inc. - Class A | | | 702,539 | |
| | | | | | |
|
|
|
| | | | | | | | 1,318,227 | |
| | | | | | |
|
|
|
| | | | | Pharmaceuticals - 5.34% | | | | |
| | 14,269 | | | Abbott Laboratories | | | 1,380,668 | |
| | 23,946 | | | AbbVie, Inc. | | | 3,213,793 | |
| | 34,066 | | | Bristol-Myers Squibb Co. | | | 2,421,752 | |
| | 31,144 | | | Elanco Animal Health, Inc. (a) | | | 386,497 | |
| | 10,792 | | | Eli Lilly & Co. | | | 3,489,593 | |
| | 3,875 | | | Horizon Therapeutics PLC - ADR (a) | | | 239,824 | |
See notes to financial statements.
40
GuideMark Large Cap Core Fund
SCHEDULE OF INVESTMENTS (Continued) (Unaudited)
September 30, 2022
| | | | | | | | |
Number of
Shares
| | | | | Value
| |
| | | | | COMMON STOCKS (Continued) | |
| | | | | Pharmaceuticals (Continued) | | | | |
| | 2,516 | | | Jazz Pharmaceuticals PLC - ADR (a) | | $ | 335,358 | |
| | 33,424 | | | Johnson & Johnson | | | 5,460,145 | |
| | 33,602 | | | Merck & Co., Inc. | | | 2,893,804 | |
| | 69,216 | | | Pfizer, Inc. | | | 3,028,892 | |
| | 2,426 | | | Royalty Pharma Plc - Class A - ADR | | | 97,477 | |
| | 192,862 | | | Viatris, Inc. | | | 1,643,184 | |
| | 4,191 | | | Zoetis, Inc. | | | 621,483 | |
| | | | | | |
|
|
|
| | | | | | | | 25,212,470 | |
| | | | | | |
|
|
|
| | | | | Professional Services - 0.42% | | | | |
| | 2,315 | | | FTI Consulting, Inc. (a)(b) | | | 383,619 | |
| | 497 | | | Jacobs Solutions, Inc. (b) | | | 53,920 | |
| | 13,663 | | | ManpowerGroup, Inc. | | | 883,859 | |
| | 8,429 | | | Robert Half International, Inc. | | | 644,818 | |
| | | | | | |
|
|
|
| | | | | | | | 1,966,216 | |
| | | | | | |
|
|
|
| | | | | Real Estate Management & Development - 0.36% | |
| | 8,333 | | | CBRE Group, Inc. - Class A (a) | | | 562,561 | |
| | 7,434 | | | Jones Lang LaSalle, Inc. (a) | | | 1,123,054 | |
| | | | | | |
|
|
|
| | | | | | | | 1,685,615 | |
| | | | | | |
|
|
|
| | | | | Road & Rail - 0.75% | | | | |
| | 5,140 | | | CSX Corp. | | | 136,930 | |
| | 1,343 | | | J.B. Hunt Transport Services, Inc. | | | 210,072 | |
| | 22,310 | | | Knight-Swift Transportation Holdings, Inc. (b) | | | 1,091,628 | |
| | 4,215 | | | Landstar System, Inc. | | | 608,520 | |
| | 922 | | | Norfolk Southern Corp. | | | 193,297 | |
| | 1,714 | | | Old Dominion Freight Line, Inc. (b) | | | 426,392 | |
| | 9,554 | | | Schneider National, Inc. - Class B | | | 193,946 | |
| | 3,445 | | | Union Pacific Corp. | | | 671,155 | |
| | | | | | |
|
|
|
| | | | | | | | 3,531,940 | |
| | | | | | |
|
|
|
| | | | | Semiconductors & Semiconductor Equipment - 3.59% | |
| | 11,019 | | | Advanced Micro Devices, Inc. (a)(b) | | | 698,164 | |
| | 10,229 | | | Allegro MicroSystems, Inc. (a) | | | 223,504 | |
| | 3,197 | | | Analog Devices, Inc. | | | 445,470 | |
| | 11,588 | | | Applied Materials, Inc. | | | 949,405 | |
| | 4,662 | | | Broadcom, Inc. | | | 2,069,975 | |
| | 8,232 | | | Cirrus Logic, Inc. (a) | | | 566,362 | |
| | 32,668 | | | Intel Corp. | | | 841,854 | |
| | 2,420 | | | KLA-Tencor Corp. | | | 732,365 | |
| | 1,993 | | | Lam Research Corp. | | | 729,438 | |
| | 4,631 | | | Lattice Semiconductor Corp. (a) | | | 227,891 | |
| | 2,041 | | | Microchip Technology, Inc. | | | 124,562 | |
| | 23,179 | | | Micron Technology, Inc. | | | 1,161,268 | |
| | 3,761 | | | MKS Instruments, Inc. (b) | | | 310,809 | |
| | 1,466 | | | Monolithic Power Systems, Inc. (b) | | | 532,744 | |
| | 28,337 | | | NVIDIA Corp. | | | 3,439,828 | |
| | 17,003 | | | ON Semiconductor Corp. (a) | | | 1,059,797 | |
| | 8,289 | | | Qorvo, Inc. (a) | | | 658,229 | |
| | 1,875 | | | Skyworks Solutions, Inc. | | | 159,881 | |
| | 8,037 | | | Teradyne, Inc. (b) | | | 603,981 | |
| | 9,222 | | | Texas Instruments, Inc. | | | 1,427,381 | |
| | | | | | |
|
|
|
| | | | | | | | 16,962,908 | |
| | | | | | |
|
|
|
| | | | | Software - 8.12% | | | | |
| | 4,977 | | | Adobe Systems, Inc. (a) | | | 1,369,670 | |
| | 1,578 | | | Alteryx, Inc. - Class A (a) | | | 88,116 | |
| | 7,331 | | | AppLovin Corp. - Class A (a)(b) | | | 142,881 | |
| | 2,965 | | | Atlassian Corp. PLC - Class A - ADR (a) | | | 624,399 | |
| | 2,880 | | | Autodesk, Inc. (a) | | | 537,984 | |
| | 7,165 | | | Cadence Design System, Inc. (a) | | | 1,170,976 | |
| | | | | | | | |
Number of
Shares
| | | | | Value
| |
| | | | | Software (Continued) | | | | |
| | 2,655 | | | Citrix Systems, Inc. (c)(d)(f) | | $ | 276,120 | |
| | 2,284 | | | Datadog, Inc. - Class A (a) | | | 202,774 | |
| | 9,347 | | | DocuSign, Inc. (a)(b) | | | 499,784 | |
| | 24,724 | | | Dropbox, Inc. - Class A (a) | | | 512,281 | |
| | 2,727 | | | Elastic NV - ADR (a) | | | 195,635 | |
| | 1,413 | | | Fair Isaac Corp. (a) | | | 582,170 | |
| | 18,088 | | | Fortinet, Inc. (a) | | | 888,664 | |
| | 1,649 | | | HubSpot, Inc. (a) | | | 445,428 | |
| | 5,275 | | | Informatica, Inc. - Class A (a) | | | 105,869 | |
| | 2,045 | | | Intuit, Inc. | | | 792,069 | |
| | 2,996 | | | Jack Henry & Associates, Inc. | | | 546,081 | |
| | 4,511 | | | Manhattan Associates, Inc. (a) | | | 600,098 | |
| | 94,636 | | | Microsoft Corp. | | | 22,040,724 | |
| | 4,363 | | | New Relic, Inc. (a) | | | 250,349 | |
| | 16,159 | | | NortonLifeLock, Inc. | | | 325,442 | |
| | 20,642 | | | Nutanix, Inc. - Class A (a)(b) | | | 429,973 | |
| | 6,262 | | | Oracle Corp. | | | 382,420 | |
| | 12,346 | | | Pegasystems, Inc. (b) | | | 396,801 | |
| | 9,657 | | | RingCentral, Inc. - Class A (a) | | | 385,894 | |
| | 4,895 | | | salesforce.com, Inc. (a) | | | 704,097 | |
| | 2,314 | | | ServiceNow, Inc. (a) | | | 873,790 | |
| | 10,260 | | | Smartsheet, Inc. - Class A (a) | | | 352,534 | |
| | 2,609 | | | Splunk, Inc. (a) | | | 196,197 | |
| | 9,616 | | | SS&C Technologies Holdings, Inc. | | | 459,164 | |
| | 3,074 | | | Synopsys, Inc. (a) | | | 939,138 | |
| | 2,572 | | | VMware, Inc. - Class A | | | 273,815 | |
| | 4,934 | | | Zendesk, Inc. (a) | | | 375,477 | |
| | 4,836 | | | Zoom Video Communications, Inc. - Class A (a)(b) | | | 355,881 | |
| | | | | | |
|
|
|
| | | | | | | | 38,322,695 | |
| | | | | | |
|
|
|
| | | | | Specialty Retail - 3.98% | | | | |
| | 1,688 | | | Advance Auto Parts, Inc. | | | 263,902 | |
| | 16,697 | | | AutoNation, Inc. (a)(b) | | | 1,700,923 | |
| | 642 | | | AutoZone, Inc. (a) | | | 1,375,119 | |
| | 10,200 | | | Bath & Body Works, Inc. | | | 332,520 | |
| | 8,947 | | | Best Buy Co., Inc. | | | 566,703 | |
| | 7,880 | | | Dick’s Sporting Goods, Inc. (b) | | | 824,563 | |
| | 2,505 | | | Floor & Decor Holdings, Inc. - Class A (a)(b) | | | 176,001 | |
| | 11,892 | | | GameStop Corp. - Class A (a)(b) | | | 298,846 | |
| | 17,831 | | | Leslie’s, Inc. (a) | | | 262,294 | |
| | 2,020 | | | Lithia Motors, Inc. (b) | | | 433,391 | |
| | 10,227 | | | Lowe’s Cos., Inc. | | | 1,920,733 | |
| | 1,897 | | | O’Reilly Automotive, Inc. (a) | | | 1,334,255 | |
| | 16,111 | | | Penske Automotive Group, Inc. (b) | | | 1,585,806 | |
| | 7,473 | | | Petco Health & Wellness Co., Inc. (a) | | | 83,399 | |
| | 2,275 | | | Ross Stores, Inc. | | | 191,714 | |
| | 1,884 | | | Sherwin-Williams Co. | | | 385,749 | |
| | 38,075 | | | The Gap, Inc. (b) | | | 312,596 | |
| | 11,606 | | | The Home Depot, Inc. | | | 3,202,560 | |
| | 11,871 | | | The TJX Cos., Inc. | | | 737,426 | |
| | 4,309 | | | Tractor Supply Co. | | | 800,957 | |
| | 2,472 | | | Ulta Beauty, Inc. (a) | | | 991,742 | |
| | 14,546 | | | Victoria’s Secret & Co. (a) | | | 423,579 | |
| | 4,940 | | | Williams Sonoma, Inc. (b) | | | 582,179 | |
| | | | | | |
|
|
|
| | | | | | | | 18,786,957 | |
| | | | | | |
|
|
|
| | | | | Technology Hardware, Storage & Peripherals - 7.13% | |
| | 199,818 | | | Apple, Inc. | | | 27,614,847 | |
| | 80,263 | | | Hewlett Packard Enterprise Co. | | | 961,551 | |
| | 11,898 | | | HP, Inc. | | | 296,498 | |
See notes to financial statements.
41
GuideMark Large Cap Core Fund
SCHEDULE OF INVESTMENTS (Continued) (Unaudited)
September 30, 2022
| | | | | | | | |
Number of
Shares
| | | | | Value
| |
| | | | | COMMON STOCKS (Continued) | |
| | | | | Technology Hardware, Storage & Peripherals (Continued) | |
| | 11,395 | | | International Business Machines Corp. | | $ | 1,353,840 | |
| | 47,717 | | | NCR Corp. (a) | | | 907,100 | |
| | 4,802 | | | NetApp, Inc. | | | 297,004 | |
| | 21,613 | | | Pure Storage, Inc. - Class A (a) | | | 591,548 | |
| | 25,975 | | | Teradata Corp. (a)(b) | | | 806,783 | |
| | 24,974 | | | Western Digital Corp. (a) | | | 812,904 | |
| | | | | | |
|
|
|
| | | | | | | | 33,642,075 | |
| | | | | | |
|
|
|
| | | | | Textiles, Apparel & Luxury Goods - 1.43% | | | | |
| | 10,991 | | | Capri Holdings, Ltd. - ADR (a)(b) | | | 422,494 | |
| | 7,250 | | | Carter’s, Inc. (b) | | | 475,092 | |
| | 7,074 | | | Columbia Sportswear Co. | | | 476,080 | |
| | 1,749 | | | Deckers Outdoor Corp. (a) | | | 546,755 | |
| | 10,079 | | | Hanesbrands, Inc. | | | 70,150 | |
| | 2,521 | | | lululemon athletica, Inc. (a) | | | 704,771 | |
| | 9,575 | | | NIKE, Inc. - Class B | | | 795,874 | |
| | 18,415 | | | PVH Corp. | | | 824,992 | |
| | 5,399 | | | Ralph Lauren Corp. (b) | | | 458,537 | |
| | 10,632 | | | Skechers U.S.A., Inc. - Class A (a) | | | 337,247 | |
| | 16,599 | | | Tapestry, Inc. | | | 471,910 | |
| | 69,351 | | | Under Armour, Inc. - Class A (a)(b) | | | 461,184 | |
| | 70,634 | | | Under Armour, Inc. - Class C (a) | | | 420,979 | |
| | 10,118 | | | VF Corp. (b) | | | 302,629 | |
| | | | | | |
|
|
|
| | | | | | | | 6,768,694 | |
| | | | | | |
|
|
|
| | | | | Thrifts & Mortgage Finance - 0.22% | | | | |
| | 18,556 | | | MGIC Investment Corp. | | | 237,888 | |
| | 52,561 | | | New York Community Bancorp, Inc. (b) | | | 448,345 | |
| | 28,453 | | | Rocket Cos, Inc. - Class A (b) | | | 179,823 | |
| | 56,087 | | | UWM Holdings Corp. (b) | | | 164,335 | |
| | | | | | |
|
|
|
| | | | | | | | 1,030,391 | |
| | | | | | |
|
|
|
| | | | | Tobacco - 0.45% | | | | |
| | 14,228 | | | Altria Group, Inc. | | | 574,527 | |
| | 18,734 | | | Philip Morris International, Inc. | | | 1,555,109 | |
| | | | | | |
|
|
|
| | | | | | | | 2,129,636 | |
| | | | | | |
|
|
|
| | | | | Trading Companies & Distributors - 0.79% | | | | |
| | 18,710 | | | Fastenal Co. | | | 861,408 | |
| | 7,330 | | | MSC Industrial Direct Co., Inc. - Class A | | | 533,697 | |
| | 2,139 | | | SiteOne Landscape Supply, Inc. (a) | | | 222,756 | |
| | 18,930 | | | Univar Solutions, Inc. (a) | | | 430,468 | |
| | 1,961 | | | W.W. Grainger, Inc. (b) | | | 959,302 | |
| | 1,989 | | | Watsco, Inc. (b) | | | 512,088 | |
| | 1,627 | | | WESCO International, Inc. (a)(b) | | | 194,231 | |
| | | | | | |
|
|
|
| | | | | | | | 3,713,950 | |
| | | | | | |
|
|
|
| | | | | Water Utilities - 0.03% | | | | |
| | 2,931 | | | Essential Utilities, Inc. | | | 121,285 | |
| | | | | | |
|
|
|
| | | | | Total Common Stocks
(Cost $312,212,672) | | | 445,081,143 | |
| | | | | | |
|
|
|
| | | | | INVESTMENT COMPANIES - 3.69% | |
| | | | | Domestic Equity Funds - 3.69% | |
| | 53,000 | | | Vanguard S&P 500 ETF | | | 17,399,900 | |
| | | | | | |
|
|
|
| | | | | Total Investment Companies
(Cost $15,129,651) | | | 17,399,900 | |
| | | | | | |
|
|
|
| | | | | | | | |
Number of
Shares
| | | | | Value
| |
| | | | | REAL ESTATE INVESTMENT TRUSTS - 1.49% | |
| | | | | Real Estate Investment Trusts - 1.49% | |
| | 13,991 | | | Annaly Capital Management, Inc. | | $ | 240,086 | |
| | 5,511 | | | Brixmor Property Group, Inc. | | | 101,788 | |
| | 313 | | | Crown Castle International Corp. | | | 45,244 | |
| | 4,782 | | | Douglas Emmett, Inc. (b) | | | 85,741 | |
| | 8,317 | | | Duke Realty Corp. | | | 400,879 | |
| | 5,185 | | | EPR Properties | | | 185,934 | |
| | 2,556 | | | Extra Space Storage, Inc. | | | 441,447 | |
| | 2,516 | | | First Industrial Realty Trust, Inc. | | | 112,742 | |
| | 4,152 | | | Gaming and Leisure Properties, Inc. | | | 183,684 | |
| | 3,666 | | | Highwoods Properties, Inc. | | | 98,835 | |
| | 8,562 | | | Host Hotels & Resorts, Inc. | | | 135,965 | |
| | 52,700 | | | Hudson Pacific Properties, Inc. | | | 577,065 | |
| | 2,912 | | | Invitation Homes, Inc. | | | 98,338 | |
| | 7,387 | | | Iron Mountain, Inc. | | | 324,806 | |
| | 6,194 | | | Kimco Realty Corp. | | | 114,032 | |
| | 2,849 | | | Life Storage, Inc. | | | 315,555 | |
| | 2,425 | | | National Retail Properties, Inc. | | | 96,661 | |
| | 83,160 | | | New Residential Investment Corp. | | | 608,731 | |
| | 27,284 | | | Park Hotels & Resorts, Inc. | | | 307,218 | |
| | 5,522 | | | Prologis, Inc. | | | 561,035 | |
| | 1,750 | | | Public Storage | | | 512,418 | |
| | 6,814 | | | Realty Income Corp. | | | 396,575 | |
| | 1,480 | | | Regency Centers Corp. | | | 79,698 | |
| | 3,701 | | | Rexford Industrial Realty, Inc. | | | 192,452 | |
| | 8,649 | | | VICI Properties, Inc. | | | 258,173 | |
| | 3,002 | | | Vornado Realty Trust | | | 69,526 | |
| | 8,617 | | | Weyerhaeuser Co. | | | 246,102 | |
| | 3,513 | | | WP Carey, Inc. (b) | | | 245,207 | |
| | | | | | |
|
|
|
| | | | | Total Real Estate Investment Trusts
(Cost $8,730,724) | | | 7,035,937 | |
| | | | | | |
|
|
|
| | | | | SHORT TERM INVESTMENTS - 0.48% | |
| | | | | Money Market Funds - 0.48% | |
| | 2,263,271 | | | DWS Government Money Market Series - Institutional Shares
Effective Yield, 3.04% (e) | | | 2,263,271 | |
| | | | | | |
|
|
|
| | | | | Total Short Term Investments
(Cost $2,263,271) | | | 2,263,271 | |
| | | | | | |
|
|
|
| | |
Number of
Units
| | | | |
| |
| | | | | INVESTMENTS PURCHASED WITH PROCEEDS FROM SECURITIES LENDING COLLATERAL - 10.78% | |
| | 50,893,955 | | | Mount Vernon Liquid Assets Portfolio, LLC Effective Yield, 3.18% (e) | | | 50,893,955 | |
| | | | | | |
|
|
|
| | | | | Total Investments Purchased with Proceeds from Securities Lending Collateral
(Cost $50,893,955) | | | 50,893,955 | |
| | | | | | |
|
|
|
| | | | | Total Investments
(Cost $389,230,273) - 110.73% | | | 522,674,206 | |
| | | | | Liabilities in Excess of
Other Assets - (10.73)% | | | (50,654,129 | ) |
| | | | | | |
|
|
|
| | | | | TOTAL NET ASSETS - 100.00% | | $ | 472,020,077 | |
| | | | | | |
|
|
|
See notes to financial statements.
42
GuideMark Large Cap Core Fund
SCHEDULE OF INVESTMENTS (Continued) (Unaudited)
September 30, 2022
Percentages are stated as a percent of net assets.
| (a) | | Non-income producing security. |
| (b) | | All or portion of this security is on loan. |
| (c) | | Value determined using significant unobservable inputs. Classified as Level 3 in the fair value hierarchy. |
| (d) | | As of September 30, 2022, the Valuation Committee has fair valued this security. The value of this security was $343,740, which represents 0.07% of total net assets. |
| (e) | | Seven-day yield as of September 30, 2022. |
| (f) | | These securities have been deemed illiquid according to the Fund’s liquidity guidelines. The value of these securities was $343,740, which represents 0.07% of total net assets. |
Glossary of Terms
| | | | |
| ADR | | - | | American Depositary Receipt |
See notes to financial statements.
43
GuideMark Emerging Markets Fund
SCHEDULE OF INVESTMENTS (Unaudited)
September 30, 2022
| | | | | | | | |
Number of
Shares
| | | | | Value
| |
| | | | | COMMON STOCKS - 90.15% | |
| | | | | Bermuda - 0.04% | |
| | 15,969 | | | Hopson Development Holdings, Ltd. | | $ | 16,628 | |
| | | | | | |
|
|
|
| | | | | Brazil - 3.44% | |
| | 12,706 | | | Ambev SA (a) | | | 36,627 | |
| | 13,497 | | | B3 SA - Brasil Bolsa Balcao | | | 32,902 | |
| | 15,847 | | | Banco do Brasil SA | | | 112,955 | |
| | 33,563 | | | BB Seguridade Participacoes SA | | | 165,315 | |
| | 9,249 | | | Cia de Saneamento Basico do Estado de Sao Paulo | | | 85,077 | |
| | 9,346 | | | Cia Siderurgica Nacional SA | | | 22,073 | |
| | 27,412 | | | JBS SA | | | 128,260 | |
| | 13,627 | | | Natura & Co., Holding SA (a) | | | 37,387 | |
| | 52,328 | | | Petroleo Brasileiro SA | | | 322,833 | |
| | 21,499 | | | Raia Drogasil SA (a) | | | 90,669 | |
| | 1,310 | | | SUZANO SA | | | 10,848 | |
| | 34,446 | | | Vale SA | | | 460,911 | |
| | 4,552 | | | WEG SA | | | 27,045 | |
| | | | | | |
|
|
|
| | | | | | | | 1,532,902 | |
| | | | | | |
|
|
|
| | | | | Cayman Islands - 6.14% | |
| | 5,531 | | | 360 DigiTech, Inc. - ADR | | | 70,907 | |
| | 82,803 | | | Alibaba Group Holding, Ltd. (a) | | | 826,319 | |
| | 5,462 | | | Baidu, Inc. - Class A (a) | | | 80,407 | |
| | 171,507 | | | China Evergrande Group (a)(e)(f)(g) | | | 29,682 | |
| | 84,652 | | | China Feihe, Ltd. | | | 59,106 | |
| | 64,482 | | | China Medical System Holdings, Ltd. | | | 76,813 | |
| | 12,599 | | | China Meidong Auto Holdings, Ltd. | | | 19,937 | |
| | 8,006 | | | China Resources Land, Ltd. | | | 31,359 | |
| | 55,030 | | | China State Construction International Holdings, Ltd. | | | 55,453 | |
| | 26,053 | | | Chinasoft International, Ltd. | | | 15,914 | |
| | 1,641 | | | Daqo New Energy Corp. - ADR (a) | | | 87,104 | |
| | 26,212 | | | Dongyue Group, Ltd. | | | 25,975 | |
| | 7,011 | | | Genscript Biotech Corp. (a) | | | 15,177 | |
| | 16,148 | | | Greentown China Holdings, Ltd. | | | 30,307 | |
| | 64,718 | | | Haidilao International Holding, Ltd. (a) | | | 125,532 | |
| | 8,689 | | | JD.com, Inc. - Class A | | | 219,208 | |
| | 35,061 | | | Jiumaojiu International Holdings, Ltd. | | | 57,017 | |
| | 6,861 | | | Kuaishou Technology (a) | | | 44,007 | |
| | 1,055 | | | Li Auto, Inc. - ADR (a) | | | 24,276 | |
| | 17,798 | | | Meituan - Class B (a) | | | 374,051 | |
| | 5,922 | | | NetEase, Inc. | | | 89,360 | |
| | 507 | | | Parade Technologies, Ltd. | | | 9,316 | |
| | 1,134 | | | Pinduoduo, Inc. - ADR (a)(b) | | | 70,966 | |
| | 32,449 | | | RLX Technology, Inc. - ADR (a) | | | 34,071 | |
| | 118,740 | | | Seazen Group, Ltd. (a) | | | 27,626 | |
| | 3,236 | | | Silergy Corp. | | | 42,204 | |
| | 8,701 | | | Smoore International Holdings, Ltd. | | | 10,322 | |
| | 138,091 | | | Topsports International Holdings, Ltd. | | | 96,531 | |
| | 2,820 | | | Wuxi Biologics Cayman, Inc. (a) | | | 16,787 | |
| | 17,398 | | | Xiaomi Corp. - Class B (a) | | | 19,701 | |
| | 15,353 | | | Yadea Group Holdings, Ltd. | | | 24,538 | |
| | 8,274 | | | Zhen Ding Technology Holding, Ltd. | | | 27,435 | |
| | | | | | |
|
|
|
| | | | | | | | 2,737,408 | |
| | | | | | |
|
|
|
| | | | | Chile - 0.27% | |
| | 33,942 | | | Cencosud SA | | | 42,931 | |
| | 6,643 | | | Cia Cervecerias Unidas SA | | | 36,068 | |
| | 636,448 | | | Cia Sud Americana de Vapores SA | | | 43,850 | |
| | | | | | |
|
|
|
| | | | | | | | 122,849 | |
| | | | | | |
|
|
|
| | | | | | | | | |
| | | | | | | | |
Number of
Shares
| | | | | Value
| |
| | | | | China - 21.24% | |
| | 22,900 | | | 37 Interactive Entertainment Network Technology Group Co., Ltd. - Class A | | $ | 56,030 | |
| | 373,865 | | | Agricultural Bank of China, Ltd. - Series H | | | 111,896 | |
| | 5,155 | | | Aier Eye Hospital Group Co., Ltd. - Class A | | | 20,795 | |
| | 14,300 | | | Air China, Ltd. - Class A (a) | | | 21,049 | |
| | 28,224 | | | Air China, Ltd. - Series H (a) | | | 21,466 | |
| | 10,867 | | | Anhui Conch Cement Co., Ltd. - Series H | | | 34,348 | |
| | 12,089 | | | ANTA Sports Products, Ltd. | | | 126,896 | |
| | 828,188 | | | Bank of China, Ltd. - Series H | | | 270,482 | |
| | 90,100 | | | Bank of Communications Co., Ltd. - Class A | | | 58,632 | |
| | 246,960 | | | Bank of Communications Co., Ltd. - Series H | | | 130,191 | |
| | 3,900 | | | Beijing Tongrentang Co., Ltd. - Class A | | | 24,932 | |
| | 1,500 | | | Beijing United Information Technology Co., Ltd. - Class A | | | 22,770 | |
| | 2,755 | | | Beijing Wantai Biological Pharmacy Enterprise Co., Ltd. - Class A | | | 44,311 | |
| | 1,600 | | | Bloomage Biotechnology Corp, Ltd. - Class A | | | 29,404 | |
| | 5,139 | | | BYD Co., Ltd. - Series H | | | 126,602 | |
| | 12,800 | | | By-health Co., Ltd. - Class A | | | 31,720 | |
| | 1,500 | | | Changchun High & New Technology Industry Group, Inc. - Class A | | | 35,926 | |
| | 5,084 | | | Chengxin Lithium Group Co., Ltd. - Class A | | | 33,415 | |
| | 569,672 | | | China Cinda Asset Management Co., Ltd. - Series H | | | 62,897 | |
| | 268,528 | | | China CITIC Bank Corp., Ltd. - Series H | | | 106,564 | |
| | 135,583 | | | China Coal Energy Co., Ltd. - Series H | | | 122,145 | |
| | 324,598 | | | China Communications Services Corp., Ltd. - Series H | | | 109,129 | |
| | 723,610 | | | China Construction Bank Corp. - Series H | | | 417,669 | |
| | 100,600 | | | China Everbright Bank Co., Ltd. - Class A | | | 39,928 | |
| | 347,000 | | | China Everbright Bank Co., Ltd. - Series H | | | 95,276 | |
| | 103,748 | | | China Hongqiao Group, Ltd. | | | 84,929 | |
| | 17,280 | | | China Merchants Bank Co., Ltd. - Series H | | | 79,969 | |
| | 19,900 | | | China Merchants Energy Shipping Co., Ltd. - Class A | | | 19,858 | |
| | 129,568 | | | China National Building Material Co., Ltd. - Series H | | | 98,656 | |
| | 5,200 | | | China Northern Rare Earth Group High-Tech Co., Ltd. - Class A | | | 19,384 | |
| | 320,832 | | | China Petroleum & Chemical Corp. - Series H | | | 137,004 | |
| | 100,382 | | | China Power International Development, Ltd. | | | 39,739 | |
| | 17,814 | | | China Resources Sanjiu Medical & Pharmaceutical Co., Ltd. - Class A | | | 96,205 | |
| | 7,500 | | | China Shenhua Energy Co., Ltd. - Class A | | | 33,375 | |
| | 27,821 | | | China Shenhua Energy Co., Ltd. - Series H | | | 82,786 | |
| | 1,648 | | | China Tourism Group Duty Free Corp, Ltd. - Class A | | | 45,534 | |
| | 81,300 | | | China United Network Communications, Ltd. - Class A | | | 38,330 | |
| | 8,400 | | | China Yangtze Power Co., Ltd. - Class A | | | 26,888 | |
| | 4,000 | | | China Zhenhua Group Science & Technology Co., Ltd. - Class A | | | 65,254 | |
| | 3,700 | | | Chongqing Brewery Co., Ltd. - Class A | | | 58,207 | |
| | 2,100 | | | Chongqing Zhifei Biological Products Co., Ltd. - Class A | | | 25,512 | |
| | 746 | | | Contemporary Amperex Technology Co., Ltd. - Class A | | | 42,003 | |
| | 22,700 | | | COSCO SHIPPING Energy Transportation Co., Ltd. - Class A (a) | | | 57,737 | |
| | 112,436 | | | COSCO SHIPPING Holdings Co., Ltd. - Series H | | | 130,782 | |
See notes to financial statements.
44
GuideMark Emerging Markets Fund
SCHEDULE OF INVESTMENTS (Continued) (Unaudited)
September 30, 2022
| | | | | | | | |
Number of
Shares
| | | | | Value
| |
| | | | | COMMON STOCKS (Continued) | | | | |
| | | | | China (Continued) | | | | |
| | 169,456 | | | Country Garden Holdings Co., Ltd. | | $ | 39,144 | |
| | 160,393 | | | CSPC Pharmaceutical Group, Ltd. | | | 158,978 | |
| | 20,000 | | | Daan Gene Co., Ltd. - Class A | | | 46,672 | |
| | 11,760 | | | DaShenLin Pharmaceutical Group Co., Ltd. - Class A | | | 50,003 | |
| | 87,253 | | | Dongfeng Motor Group Co., Ltd. - Series H | | | 46,642 | |
| | 4,800 | | | Ecovacs Robotics Co., Ltd. - Class A | | | 44,907 | |
| | 57,500 | | | Focus Media Information Technology Co., Ltd. - Class A | | | 44,629 | |
| | 700 | | | G-bits Network Technology Xiamen Co., Ltd. - Class A | | | 24,415 | |
| | 33,800 | | | GD Power Development Co., Ltd. - Class A (a) | | | 19,329 | |
| | 38,114 | | | Guanghui Energy Co., Ltd. - Class A | | | 66,134 | |
| | 4,438 | | | Guangzhou Baiyunshan Pharmaceutical Holdings Co., Ltd. - Class A | | | 16,187 | |
| | 3,000 | | | Guangzhou Kingmed Diagnostics Group Co., Ltd. - Class A | | | 26,676 | |
| | 8,000 | | | Guangzhou Tinci Materials Technology Co., Ltd. - Class A (a) | | | 49,455 | |
| | 9,000 | | | Hangzhou Robam Appliances Co., Ltd. - Class A | | | 29,005 | |
| | 3,900 | | | Hithink RoyalFlush Information Network Co., Ltd. - Class A | | | 42,417 | |
| | 3,396 | | | Hoshine Silicon Industry Co., Ltd. - Class A | | | 52,323 | |
| | 6,869 | | | Huadong Medicine Co., Ltd. - Class A | | | 38,756 | |
| | 63,100 | | | Huaxia Bank Co., Ltd. - Class A | | | 44,686 | |
| | 8,446 | | | Hubei Xingfa Chemicals Group Co., Ltd. - Class A | | | 39,530 | |
| | 2,400 | | | Huizhou Desay Sv Automotive Co., Ltd. - Class A | | | 46,492 | |
| | 5,200 | | | Hundsun Technologies, Inc. - Class A | | | 24,743 | |
| | 392,052 | | | Industrial & Commercial Bank of China, Ltd. - Series H | | | 183,914 | |
| | 49,177 | | | Inner Mongolia BaoTou Steel Union Co., Ltd. - Class A | | | 12,710 | |
| | 6,575 | | | Inner Mongolia Yili Industrial Group Co., Ltd. - Class A | | | 30,507 | |
| | 5,376 | | | JA Solar Technology Co., Ltd. - Class A | | | 48,395 | |
| | 8,800 | | | Jafron Biomedical Co., Ltd. - Class A | | | 60,121 | |
| | 8,200 | | | Jiangsu Hengrui Medicine Co., Ltd. - Class A | | | 40,416 | |
| | 11,700 | | | Jiangxi Copper Co., Ltd. - Class A | | | 25,018 | |
| | 25,097 | | | Jiangxi Copper Co., Ltd. Series H | | | 28,953 | |
| | 130,700 | | | Jinke Properties Group Co., Ltd. (a) | | | 38,430 | |
| | 2,300 | | | JiuGui Liquor Co., Ltd. - Class A | | | 40,629 | |
| | 11,771 | | | Joincare Pharmaceutical Group Industry Co., Ltd. - Class A | | | 17,405 | |
| | 200 | | | Kweichow Moutai Co., Ltd. - Class A | | | 52,636 | |
| | 140,696 | | | Lenovo Group, Ltd. | | | 97,319 | |
| | 18,519 | | | Li Ning Co., Ltd. | | | 140,520 | |
| | 1,400 | | | Luzhou Laojiao Co., Ltd. - Class A | | | 45,487 | |
| | 93,200 | | | Metallurgical Corp of China, Ltd. - Class A | | | 39,125 | |
| | 3,600 | | | Muyuan Foods Co., Ltd. - Class A | | | 27,641 | |
| | 6,400 | | | Ninestar Corp. - Class A | | | 38,835 | |
| | 5,100 | | | Ningbo Orient Wires & Cables Co., Ltd. - Class A | | | 49,833 | |
| | 5,100 | | | Ningbo Tuopu Group Co., Ltd. - Class A | | | 52,753 | |
| | 25,169 | | | Nongfu Spring Co., Ltd. - Class H | | | 145,559 | |
| | 13,903 | | | North Industries Group Red Arrow Co., Ltd. - Class A | | | 43,723 | |
| | 34,200 | | | PetroChina Co., Ltd. - Class A | | | 24,797 | |
| | 272,281 | | | PetroChina Co., Ltd. - Series H | | | 111,306 | |
| | 172,318 | | | PICC Property & Casualty Co., Ltd. - Series H | | | 178,191 | |
| | 29,743 | | | Ping An Insurance Group Co. of China, Ltd. - Series H | | | 148,382 | |
| | | | | | | | |
Number of
Shares
| | | | | Value
| |
| | | | | China (Continued) | | | | |
| | 4,180 | | | Proya Cosmetics Co., Ltd. - Class A | | $ | 95,861 | |
| | 2,600 | | | Sangfor Technologies, Inc. - Class A | | | 36,547 | |
| | 11,200 | | | Seazen Holdings Co., Ltd. - Class A (a) | | | 27,509 | |
| | 1,650 | | | SG Micro Corp. - Class A | | | 32,663 | |
| | 9,200 | | | Shaanxi Coal Industry Co., Ltd. - Class A | | | 29,489 | |
| | 8,800 | | | Shan Xi Hua Yang Group New Energy Co., Ltd. - Class A | | | 22,536 | |
| | 21,100 | | | Shandong Buchang Pharmaceuticals Co., Ltd. - Class A | | | 51,931 | |
| | 75,500 | | | Shanghai Construction Group Co., Ltd. - Class A | | | 26,806 | |
| | 2,600 | | | Shanghai International Airport Co., Ltd. - Class A (a) | | | 21,090 | |
| | 2,900 | | | Shanghai Jinjiang International Hotels Co., Ltd. - Class A | | | 23,503 | |
| | 6,100 | | | Shanghai M&G Stationery, Inc. - Class A | | | 38,731 | |
| | 1,100 | | | Shanxi Xinghuacun Fen Wine Factory Co., Ltd. - Class A | | | 46,817 | |
| | 1,153 | | | Shenzhen Kedali Industry Co., Ltd. - Class A | | | 15,583 | |
| | 11,770 | | | Shijiazhuang Yiling Pharmaceutical Co., Ltd. - Class A | | | 35,947 | |
| | 35,432 | | | Shimao Property Holdings, Ltd. (a)(e)(f)(g) | | | 15,453 | |
| | 67,836 | | | Sichuan Hebang Biotechnology Co., Ltd. - Class A | | | 30,615 | |
| | 28,555 | | | Sichuan Road & Bridge Co., Ltd. - Class A | | | 41,033 | |
| | 3,200 | | | Sichuan Swellfun Co., Ltd. - Class A | | | 28,187 | |
| | 46,301 | | | Sunac China Holdings, Ltd. (a)(e)(f)(g) | | | 20,761 | |
| | 1,319 | | | Sunny Optical Technology Group Co., Ltd. | | | 12,535 | |
| | 19,186 | | | TAL Education Group - ADR (a) | | | 94,779 | |
| | 42,900 | | | Tencent Holdings, Ltd. | | | 1,449,004 | |
| | 5,590 | | | Tibet Summit Resources Co., Ltd. - Class A (a) | | | 17,433 | |
| | 66,102 | | | Tingyi Cayman Islands Holding Corp. | | | 113,835 | |
| | 11,434 | | | Titan Wind Energy Suzhou Co., Ltd. - Class A | | | 20,316 | |
| | 3,751 | | | Tsingtao Brewery Co., Ltd. - Series H | | | 35,364 | |
| | 1,041 | | | Unigroup Guoxin Microelectronics Co., Ltd. - Class A | | | 21,128 | |
| | 78,261 | | | Uni-President China Holdings, Ltd. | | | 65,576 | |
| | 16,004 | | | Vipshop Holdings, Ltd. - ADR (a) | | | 134,594 | |
| | 75,147 | | | Want Want China Holdings, Ltd. | | | 49,076 | |
| | 9,500 | | | Wens Foodstuffs Group Co., Ltd. - Class A (a) | | | 27,435 | |
| | 34,300 | | | Xiamen C & D, Inc. - Class A | | | 66,792 | |
| | 1,054 | | | Xiamen Faratronic Co., Ltd. - Class A | | | 23,700 | |
| | 6,100 | | | Yankuang Energy Group Co., Ltd. - Class A | | | 43,044 | |
| | 46,289 | | | Yanzhou Coal Mining Co., Ltd. Series H | | | 167,135 | |
| | 3,353 | | | Yifeng Pharmacy Chain Co., Ltd. - Class A | | | 23,438 | |
| | 20,942 | | | Yihai International Holding, Ltd. | | | 44,101 | |
| | 1,063 | | | YongXing Special Materials Technology Co., Ltd. - Class A | | | 18,507 | |
| | 1,772 | | | Youngy Co., Ltd. - Class A (a) | | | 28,011 | |
| | 11,400 | | | YTO Express Group Co., Ltd. - Class A | | | 33,255 | |
| | 2,665 | | | Yum China Holdings, Inc. (b) | | | 126,134 | |
| | 1,000 | | | Yunnan Botanee Bio-Technology Group Co., Ltd. - Class A | | | 24,231 | |
| | 2,380 | | | Zhejiang Orient Gene Biotech Co., Ltd. - Class A | | | 25,207 | |
| | 9,000 | | | Zhejiang Supor Co., Ltd. - Class A | | | 58,462 | |
| | 13,855 | | | Zhejiang Weixing New Building Materials Co., Ltd. - Class A | | | 40,107 | |
| | 6,700 | | | Zhejiang Wolwo Bio-Pharmaceutical Co., Ltd. - Class A | | | 45,995 | |
| | 10,601 | | | Zhuzhou Kibing Group Co., Ltd. - Class A | | | 14,321 | |
| | | | | | |
|
|
|
| | | | | | | | 9,474,930 | |
| | | | | | |
|
|
|
See notes to financial statements.
45
GuideMark Emerging Markets Fund
SCHEDULE OF INVESTMENTS (Continued) (Unaudited)
September 30, 2022
| | | | | | | | |
Number of
Shares
| | | | | Value
| |
| | | | | COMMON STOCKS (Continued) | | | | |
| | | | | Cyprus - 0.00% | | | | |
| | 2,617 | | | TCS Group Holding PLC (a)(d)(e)(f)(g) | | $ | 0 | |
| | | | | | |
|
|
|
| | | | | Czech Republic - 0.26% | | | | |
| | 3,091 | | | CEZ AS | | | 105,921 | |
| | 467 | | | Komercni Banka AS | | | 11,680 | |
| | | | | | |
|
|
|
| | | | | | | | 117,601 | |
| | | | | | |
|
|
|
| | | | | Egypt - 0.29% | | | | |
| | 101,153 | | | Commercial International Bank Egypt SAE | | | 129,870 | |
| | | | | | |
|
|
|
| | | | | Hong Kong - 1.54% | | | | |
| | 4,653 | | | Beijing Enterprises Holdings, Ltd. | | | 13,040 | |
| | 224,427 | | | Bosideng International Holdings, Ltd. | | | 110,674 | |
| | 28,602 | | | China Mengniu Dairy Co., Ltd. | | | 113,067 | |
| | 7,635 | | | China Overseas Land & Investment, Ltd. | | | 19,863 | |
| | 1,938 | | | China Resources Beer Holdings Co., Ltd. | | | 13,443 | |
| | 96,339 | | | China Taiping Insurance Holdings Co., Ltd. | | | 80,753 | |
| | 66,261 | | | China Traditional Chinese Medicine Holdings Co., Ltd. | | | 23,052 | |
| | 128,661 | | | CITIC, Ltd. | | | 121,219 | |
| | 26,844 | | | Kingboard Chemical Holdings, Ltd. | | | 75,569 | |
| | 3,050 | | | Orient Overseas International, Ltd. | | | 53,079 | |
| | 59,913 | | | Sino Biopharmaceutical, Ltd. | | | 28,077 | |
| | 29,505 | | | Yuexiu Property Co., Ltd. | | | 35,553 | |
| | | | | | |
|
|
|
| | | | | | | | 687,389 | |
| | | | | | |
|
|
|
| | | | | Hungary - 0.29% | | | | |
| | 18,405 | | | MOL Hungarian Oil & Gas PLC | | | 102,216 | |
| | 1,461 | | | OTP Bank PLC | | | 26,653 | |
| | | | | | |
|
|
|
| | | | | | | | 128,869 | |
| | | | | | |
|
|
|
| | | | | India - 14.92% | | | | |
| | 1,378 | | | ACC, Ltd. | | | 40,734 | |
| | 4,246 | | | Adani Enterprises, Ltd. | | | 179,201 | |
| | 1,516 | | | Adani Green Energy, Ltd. (a) | | | 41,724 | |
| | 11,182 | | | Adani Power, Ltd. (a) | | | 50,833 | |
| | 2,744 | | | Adani Total Gas, Ltd. | | | 111,894 | |
| | 3,370 | | | Adani Transmission, Ltd. (a) | | | 135,048 | |
| | 5,194 | | | Ambuja Cements, Ltd. | | | 32,755 | |
| | 1,479 | | | Asian Paints, Ltd. | | | 60,464 | |
| | 13,505 | | | Aurobindo Pharma, Ltd. | | | 84,305 | |
| | 536 | | | Bajaj Finance, Ltd. | | | 47,891 | |
| | 34,011 | | | Bharat Electronics, Ltd. | | | 41,941 | |
| | 14,995 | | | Bharat Petroleum Corp., Ltd. | | | 55,831 | |
| | 4,538 | | | Bharti Airtel, Ltd. | | | 44,413 | |
| | 1,778 | | | Britannia Industries, Ltd. | | | 83,665 | |
| | 2,073 | | | Cholamandalam Investment and Finance Co., Ltd. | | | 18,524 | |
| | 7,603 | | | Cipla, Ltd. | | | 103,656 | |
| | 17,239 | | | Coal India, Ltd. | | | 44,673 | |
| | 4,611 | | | Colgate-Palmolive India, Ltd. | | | 92,127 | |
| | 5,408 | | | Dabur India, Ltd. | | | 37,898 | |
| | 488 | | | Divi’s Laboratories, Ltd. | | | 22,094 | |
| | 1,193 | | | Dr. Reddy’s Laboratories, Ltd. | | | 63,149 | |
| | 4,407 | | | Grasim Industries, Ltd. | | | 90,238 | |
| | 12,299 | | | HCL Technologies, Ltd. | | | 139,681 | |
| | 40,659 | | | Hindalco Industries, Ltd. | | | 192,730 | |
| | 29,305 | | | Hindustan Petroleum Corp, Ltd. | | | 77,422 | |
| | 2,222 | | | Hindustan Unilever, Ltd. | | | 73,280 | |
| | 6,856 | | | Housing Development Finance Corp., Ltd. | | | 191,279 | |
| | 25,648 | | | ICICI Bank, Ltd. | | | 269,285 | |
| | 76,571 | | | Indian Oil Corp, Ltd. | | | 62,627 | |
| | 4,986 | | | Indian Railway Catering & Tourism Corp., Ltd. | | | 42,826 | |
| | | | | | | | |
Number of
Shares
| | | | | Value
| |
| | | | | India (Continued) | | | | |
| | 26,368 | | | Infosys, Ltd. | | $ | 452,008 | |
| | 20,548 | | | ITC, Ltd. | | | 83,512 | |
| | 11,017 | | | Jindal Steel & Power, Ltd. | | | 57,419 | |
| | 14,098 | | | JSW Steel, Ltd. | | | 108,705 | |
| | 4,166 | | | Jubilant Foodworks, Ltd. | | | 31,583 | |
| | 2,387 | | | Larsen & Toubro Infotech, Ltd. | | | 129,309 | |
| | 5,480 | | | Larsen & Toubro, Ltd. | | | 123,713 | |
| | 4,140 | | | Lupin, Ltd. | | | 34,453 | |
| | 9,326 | | | Mahindra & Mahindra, Ltd. | | | 144,291 | |
| | 12,740 | | | Marico, Ltd. | | | 83,869 | |
| | 265 | | | Maruti Suzuki India, Ltd. | | | 28,606 | |
| | 2,442 | | | Mindtree, Ltd. | | | 93,567 | |
| | 3,222 | | | Mphasis, Ltd. | | | 81,705 | |
| | 3,914 | | | Muthoot Finance, Ltd. | | | 49,665 | |
| | 520 | | | Nestle India, Ltd. | | | 121,964 | |
| | 58,671 | | | NTPC, Ltd. | | | 114,588 | |
| | 128,778 | | | Oil & Natural Gas Corp., Ltd. | | | 199,484 | |
| | 288 | | | Page Industries, Ltd. | | | 178,539 | |
| | 1,592 | | | Pidilite Industries, Ltd. | | | 52,317 | |
| | 7,137 | | | Power Grid Corp of India, Ltd. | | | 18,531 | |
| | 13,509 | | | Reliance Industries, Ltd. | | | 392,059 | |
| | 1,322 | | | SRF, Ltd. | | | 40,361 | |
| | 16,763 | | | State Bank of India | | | 108,558 | |
| | 6,323 | | | Sun Pharmaceutical Industries, Ltd. | | | 73,434 | |
| | 8,075 | | | Tata Consultancy Services, Ltd. | | | 295,940 | |
| | 668 | | | Tata Elxsi, Ltd. | | | 69,532 | |
| | 27,719 | | | Tata Motors, Ltd. (a) | | | 136,381 | |
| | 195,360 | | | Tata Steel, Ltd. | | | 235,854 | |
| | 12,623 | | | Tech Mahindra, Ltd. | | | 154,942 | |
| | 13,560 | | | The Tata Power Co., Ltd. | | | 35,768 | |
| | 1,402 | | | Titan Co., Ltd. | | | 44,580 | |
| | 1,164 | | | Trent, Ltd. | | | 20,185 | |
| | 641 | | | UltraTech Cement, Ltd. | | | 49,032 | |
| | 71,220 | | | Vedanta, Ltd. | | | 233,716 | |
| | 9,175 | | | Wipro, Ltd. | | | 44,026 | |
| | | | | | |
|
|
|
| | | | | | | | 6,654,384 | |
| | | | | | |
|
|
|
| | | | | Indonesia - 2.51% | | | | |
| | 1,216,789 | | | Adaro Energy Tbk PT | | | 313,788 | |
| | 175,027 | | | Astra International Tbk PT | | | 75,743 | |
| | 102,700 | | | Bank Negara Indonesia Persero Tbk PT | | | 60,069 | |
| | 48,759 | | | Bank of Mandiri Persero Tbk PT | | | 29,940 | |
| | 111,277 | | | Bank Rakyat Indonesia Persero Tbk PT | | | 32,568 | |
| | 184,243 | | | Indah Kiat Pulp & Paper Corp. Tbk PT | | | 108,855 | |
| | 262,537 | | | Indofood Sukses Makmur Tbk PT | | | 103,734 | |
| | 510,158 | | | Kalbe Farma Tbk PT | | | 61,190 | |
| | 73,862 | | | Merdeka Copper Gold Tbk PT (a) | | | 19,013 | |
| | 352,514 | | | Sumber Alfaria Trijaya Tbk PT | | | 55,321 | |
| | 463,270 | | | Telekomunikasi Indonesia Persero Tbk PT | | | 135,018 | |
| | 393,038 | | | Unilever Indonesia Tbk PT | | | 124,322 | |
| | | | | | |
|
|
|
| | | | | | | | 1,119,561 | |
| | | | | | |
|
|
|
| | | | | Mexico - 1.99% | | | | |
| | 147,565 | | | America Movil SAB de CV - Series L | | | 121,557 | |
| | 4,805 | | | Arca Continental SAB de CV | | | 34,597 | |
| | 284,957 | | | Cemex SAB de CV (a) | | | 98,478 | |
| | 57,190 | | | Grupo Bimbo SAB de CV - Series A | | | 200,965 | |
| | 10,427 | | | Grupo Financiero Banorte SAB de CV - Series O | | | 66,794 | |
| | 51,303 | | | Grupo Financiero Inbursa SAB de CV - Series O (a) | | | 81,440 | |
| | 23,128 | | | Grupo Mexico SAB de CV - Series B | | | 78,114 | |
See notes to financial statements.
46
GuideMark Emerging Markets Fund
SCHEDULE OF INVESTMENTS (Continued) (Unaudited)
September 30, 2022
| | | | | | | | |
Number of
Shares
| | | | | Value
| |
| | | | | COMMON STOCKS (Continued) | | | | |
| | | | | Mexico (Continued) | | | | |
| | 16,455 | | | Orbia Advance Corp SAB de CV | | $ | 27,698 | |
| | 7,378 | | | Sitios Latinoamerica SAB de CV (a) | | | 3,359 | |
| | 49,475 | | | Wal-Mart de Mexico SAB de CV | | | 173,756 | |
| | | | | | |
|
|
|
| | | | | | | | 886,758 | |
| | | | | | |
|
|
|
| | | | | Peru - 0.15% | | | | |
| | 166 | | | Credicorp, Ltd. - ADR (b) | | | 20,385 | |
| | 1,024 | | | Southern Copper Corp. (b) | | | 45,916 | |
| | | | | | |
|
|
|
| | | | | | | | 66,301 | |
| | | | | | |
|
|
|
| | | | | Poland - 0.94% | | | | |
| | 2,858 | | | Bank Polska Kasa Opieki SA | | | 34,710 | |
| | 1,019 | | | CD Projekt SA | | | 20,406 | |
| | 2,379 | | | Dino Polska SA (a) | | | 144,098 | |
| | 18 | | | LPP SA | | | 28,080 | |
| | 51,462 | | | Orange Polska SA | | | 53,468 | |
| | 67,386 | | | PGE Polska Grupa Energetyczna SA (a) | | | 84,772 | |
| | 2,117 | | | Polski Koncern Naftowy Orlen SA | | | 22,726 | |
| | 6,724 | | | Powszechna Kasa Oszczednosci Bank Polski SA | | | 29,373 | |
| | | | | | |
|
|
|
| | | | | | | | 417,633 | |
| | | | | | |
|
|
|
| | | | | Qatar - 1.70% | | | | |
| | 17,004 | | | Industries Qatar QSC | | | 78,496 | |
| | 19,733 | | | Masraf Al Rayan QSC | | | 22,192 | |
| | 112,875 | | | Ooredoo QPSC | | | 275,082 | |
| | 10,659 | | | Qatar Islamic Bank SAQ | | | 71,947 | |
| | 44,056 | | | Qatar National Bank QPSC | | | 239,781 | |
| | 36,411 | | | The Commercial Bank PQSC | | | 70,098 | |
| | | | | | |
|
|
|
| | | | | | | | 757,596 | |
| | | | | | |
|
|
|
| | | | | Republic of Korea - 11.38% | | | | |
| | 925 | | | Amorepacific Corp. | | | 65,221 | |
| | 8,743 | | | Cheil Worldwide, Inc. | | | 137,822 | |
| | 1,964 | | | CJ Corp. | | | 94,696 | |
| | 791 | | | CJ ENM Co., Ltd. | | | 41,632 | |
| | 3,929 | | | DB Insurance Co., Ltd. | | | 150,524 | |
| | 1,412 | | | Ecopro BM Co., Ltd. | | | 85,421 | |
| | 872 | | | F&F Co., Ltd. | | | 82,704 | |
| | 5,210 | | | GS Engineering & Construction Corp. | | | 81,244 | |
| | 1,142 | | | GS Holdings Corp. | | | 33,061 | |
| | 3,983 | | | Hana Financial Group, Inc. | | | 97,803 | |
| | 3,378 | | | Hankook Tire Co., Ltd. | | | 82,452 | |
| | 524 | | | Hanwha Solutions Corp. (a) | | | 17,069 | |
| | 3,104 | | | HMM Co., Ltd. | | | 39,632 | |
| | 715 | | | Hotel Shilla Co., Ltd. | | | 35,561 | |
| | 2,507 | | | Hyundai Engineering & Construction Co., Ltd. | | | 65,020 | |
| | 457 | | | Hyundai Mobis Co., Ltd. | | | 60,326 | |
| | 4,746 | | | Hyundai Steel Co. | | | 92,190 | |
| | 240 | | | Iljin Materials Co., Ltd. | | | 8,391 | |
| | 14,389 | | | Industrial Bank of Korea | | | 95,156 | |
| | 4,354 | | | KB Financial Group, Inc. | | | 131,484 | |
| | 1,716 | | | Kia Motors Corp. | | | 85,409 | |
| | 2,697 | | | Korea Aerospace Industries, Ltd. | | | 90,895 | |
| | 667 | | | Korea Investment Holdings Co., Ltd. | | | 21,916 | |
| | 2,682 | | | Korean Air Lines Co., Ltd. (a) | | | 40,925 | |
| | 545 | | | KT&G Corp. | | | 32,907 | |
| | 713 | | | Kumho Petrochemical Co., Ltd. | | | 57,085 | |
| | 539 | | | L&F Co., Ltd. (a) | | | 65,544 | |
| | 107 | | | LG Chemical, Ltd. | | | 39,508 | |
| | 7,824 | | | LG Display Co., Ltd. | | | 64,840 | |
| | 1,432 | | | LG Electronics, Inc. | | | 77,708 | |
| | | | | | | | |
Number of
Shares
| | | | | Value
| |
| | | | | Republic of Korea (Continued) | | | | |
| | 208 | | | LG Household & Health Care, Ltd. | | $ | 91,170 | |
| | 400 | | | LG Innotek Co., Ltd. | | | 75,394 | |
| | 15,796 | | | LG Uplus Corp. | | | 118,119 | |
| | 4,274 | | | Meritz Financial Group, Inc. | | | 61,656 | |
| | 3,890 | | | Meritz Fire & Marine Insurance Co., Ltd. | | | 79,631 | |
| | 26,396 | | | Meritz Securities Co., Ltd. | | | 67,154 | |
| | 278 | | | NCSoft Corp. | | | 66,497 | |
| | 8,278 | | | NH Investment & Securities Co., Ltd. | | | 51,673 | |
| | 481 | | | Orion Corp. | | | 34,398 | |
| | 6,150 | | | Pan Ocean Co., Ltd. | | | 19,167 | |
| | 735 | | | Pearl Abyss Corp. (a) | | | 23,660 | |
| | 72 | | | POSCO | | | 10,502 | |
| | 452 | | | Samsung Electro-Mechanics Co., Ltd. | | | 34,874 | |
| | 36,297 | | | Samsung Electronics Co., Ltd. | | | 1,332,799 | |
| | 2,697 | | | Samsung Engineering Co., Ltd. (a) | | | 42,456 | |
| | 461 | | | Samsung Fire & Marine Insurance Co., Ltd. | | | 58,961 | |
| | 15,386 | | | Samsung Heavy Industries Co., Ltd. (a) | | | 56,687 | |
| | 2,897 | | | Samsung Securities Co., Ltd. | | | 61,670 | |
| | 1,177 | | | SD Biosensor, Inc. | | | 21,698 | |
| | 3,554 | | | Seegene, Inc. | | | 65,918 | |
| | 5,446 | | | Shinhan Financial Group Co., Ltd. | | | 126,506 | |
| | 5,225 | | | SK Hynix, Inc. | | | 298,871 | |
| | 246 | | | SKC Co., Ltd. | | | 14,211 | |
| | 2,544 | | | Woongjin Coway Co., Ltd. | | | 95,137 | |
| | 12,323 | | | Woori Financial Group Inc. | | | 91,451 | |
| | | | | | |
|
|
|
| | | | | | | | 5,074,406 | |
| | | | | | |
|
|
|
| | | | | Russian Federation - 0.00% | | | | |
| | 44,711 | | | Gazprom PJSC - ADR (a)(e)(f)(g) | | | 0 | |
| | 3,704 | | | LUKOIL PJSC - ADR (e)(f)(g) | | | 0 | |
| | 1,813 | | | Magnit PJSC (e)(f)(g) | | | 0 | |
| | 2 | | | Magnit PJSC - ADR (d)(e)(f)(g) | | | 0 | |
| | 5,783 | | | MMC Norilsk Nickel PJSC - ADR (e)(f)(g) | | | 0 | |
| | 4,954 | | | Novolipetsk Steel PJSC - ADR (e)(f)(g) | | | 0 | |
| | 5,230 | | | PhosAgro PJSC (a)(e)(f)(g) | | | 0 | |
| | 33 | | | PhosAgro PJSC - GDR (a)(d)(e)(f)(g) | | | 0 | |
| | 994 | | | Polyus PJSC - GDR - ADR (d)(e)(f)(g) | | | 0 | |
| | 13,382 | | | Rosneft Oil Co PJSC (e)(f)(g) | | | 0 | |
| | 120,116 | | | Sberbank Of Russia (a)(e)(f)(g) | | | 0 | |
| | 21,281 | | | Surgutneftegas OJSC - ADR (a)(e)(f)(g) | | | 0 | |
| | 4,243 | | | Tatneft PJSC - ADR (e)(f)(g) | | | 0 | |
| | 128,418,000 | | | VTB Bank PJSC (a)(e)(f)(g) | | | 0 | |
| | 3,865 | | | X5 Retail Group NV - ADR (d)(e)(f)(g) | | | 0 | |
| | 2,515 | | | Yandex NV - Class A - ADR (a)(e)(f)(g) | | | 0 | |
| | | | | | |
|
|
|
| | | | | | | | 0 | |
| | | | | | |
|
|
|
| | | | | Singapore - 0.04% | | | | |
| | 2,567 | | | BOC Aviation, Ltd. | | | 18,147 | |
| | | | | | |
|
|
|
| | | | | South Africa - 4.48% | | | | |
| | 13,641 | | | Absa Group, Ltd. | | | 132,508 | |
| | 2,453 | | | African Rainbow Minerals, Ltd. | | | 33,139 | |
| | 894 | | | Anglo American Platinum, Ltd. | | | 63,406 | |
| | 10,631 | | | Aspen Pharmacare Holdings, Ltd. | | | 78,570 | |
| | 5,766 | | | Bid Corp., Ltd. | | | 88,822 | |
| | 810 | | | Capitec Bank Holdings, Ltd. | | | 69,396 | |
| | 3,652 | | | Clicks Group, Ltd. | | | 57,597 | |
| | 30,263 | | | FirstRand, Ltd. | | | 101,026 | |
| | 4,916 | | | Gold Fields, Ltd. | | | 39,650 | |
| | 18,428 | | | Harmony Gold Mining Co., Ltd. | | | 43,436 | |
| | 13,423 | | | Impala Platinum Holdings, Ltd. | | | 124,802 | |
See notes to financial statements.
47
GuideMark Emerging Markets Fund
SCHEDULE OF INVESTMENTS (Continued) (Unaudited)
September 30, 2022
| | | | | | | | |
Number of
Shares
| | | | | Value
| |
| | | | | COMMON STOCKS (Continued) | | | | |
| | | | | South Africa (Continued) | | | | |
| | 4,136 | | | Kumba Iron Ore, Ltd. | | $ | 87,737 | |
| | 5,550 | | | Mr. Price Group, Ltd. | | | 52,875 | |
| | 19,943 | | | MTN Group, Ltd. | | | 131,584 | |
| | 15,906 | | | MultiChoice Group, Ltd. | | | 101,623 | |
| | 12,159 | | | Nedbank Group, Ltd. | | | 133,778 | |
| | 58,167 | | | Old Mutual, Ltd. | | | 31,258 | |
| | 54,379 | | | Pepkor Holdings, Ltd. | | | 62,401 | |
| | 7,886 | | | Sasol, Ltd. | | | 123,350 | |
| | 4,548 | | | Shoprite Holdings, Ltd. | | | 54,297 | |
| | 36,031 | | | Sibanye Stillwater, Ltd. | | | 82,710 | |
| | 14,073 | | | Standard Bank Group, Ltd. | | | 111,173 | |
| | 4,392 | | | The Bidvest Group, Ltd. | | | 47,574 | |
| | 43,859 | | | Woolworths Holdings, Ltd. | | | 147,376 | |
| | | | | | |
|
|
|
| | | | | | | | 2,000,088 | |
| | | | | | |
|
|
|
| | | | | South Korea - 0.28% | | | | |
| | 2,093 | | | Lotte Shopping Co., Ltd. | | | 125,529 | |
| | | | | | |
|
|
|
| | | | | Taiwan, Province of China - 13.86% | | | | |
| | 3,162 | | | Accton Technology Corp. | | | 26,970 | |
| | 5,147 | | | Advantech Co., Ltd. | | | 47,411 | |
| | 170,772 | | | AU Optronics Corp. (g) | | | 78,152 | |
| | 69,121 | | | Cathay Financial Holding Co., Ltd. | | | 86,632 | |
| | 6,458 | | | Chailease Holding Co., Ltd. | | | 36,889 | |
| | 44,823 | | | Chang Hwa Commercial Bank, Ltd. | | | 24,146 | |
| | 331,564 | | | China Development Financial Holding Corp. | | | 124,684 | |
| | 75,797 | | | China Steel Corp. | | | 63,543 | |
| | 19,247 | | | Chunghwa Telecom Co., Ltd. | | | 68,888 | |
| | 81,673 | | | CTBC Financial Holding Co., Ltd. | | | 50,809 | |
| | 3,456 | | | Delta Electronics, Inc. | | | 27,451 | |
| | 9,650 | | | E Ink Holdings, Inc. | | | 63,709 | |
| | 107,040 | | | E.SUN Financial Holdings Co., Ltd. | | | 86,610 | |
| | 2,098 | | | eMemory Technology, Inc. | | | 74,261 | |
| | 38,043 | | | Eva Airways Corp. | | | 33,632 | |
| | 30,495 | | | Evergreen Marine Corp. Taiwan, Ltd. | | | 139,040 | |
| | 67,203 | | | Far Eastern New Century Corp. | | | 68,231 | |
| | 25,258 | | | Far EasTone Telecommunications Co., Ltd. | | | 57,471 | |
| | 7,996 | | | Feng TAY Enterprise Co., Ltd. | | | 39,551 | |
| | 91,990 | | | First Financial Holding Co., Ltd. | | | 75,096 | |
| | 92,447 | | | Fubon Financial Holding Co., Ltd. | | | 144,570 | |
| | 32,529 | | | Hon Hai Precision Industry Co., Ltd. | | | 104,161 | |
| | 111,471 | | | Hua Nan Financial Holdings Co., Ltd. | | | 77,769 | |
| | 254,477 | | | Innolux Corp. (g) | | | 82,893 | |
| | 11,393 | | | MediaTek, Inc. | | | 196,602 | |
| | 60,181 | | | Mega Financial Holding Co., Ltd. | | | 58,880 | |
| | 9,860 | | | Micro-Star International Co., Ltd. | | | 33,190 | |
| | 1,837 | | | momo.com, Inc. | | | 30,656 | |
| | 25,095 | | | Nan Ya Plastics Corp. | | | 52,660 | |
| | 4,972 | | | Nan Ya Printed Circuit Board Corp. | | | 29,225 | |
| | 32,428 | | | Nanya Technology Corp. | | | 49,695 | |
| | 8,088 | | | Nien Made Enterprise Co., Ltd. | | | 63,850 | |
| | 12,818 | | | Novatek Microelectronics Corp. | | | 87,728 | |
| | 50,730 | | | Pegatron Corp. | | | 93,110 | |
| | 17,722 | | | President Chain Store Corp. | | | 157,245 | |
| | 8,575 | | | Quanta Computer, Inc. | | | 20,757 | |
| | 12,817 | | | Realtek Semiconductor Corp. | | | 108,202 | |
| | 41,142 | | | Ruentex Development Co., Ltd. | | | 66,133 | |
| | 290,751 | | | Shin Kong Financial Holding Co., Ltd. | | | 74,837 | |
| | 190,476 | | | SinoPac Financial Holdings Co., Ltd. | | | 103,351 | |
| | 24,831 | | | Synnex Technology International Corp. | | | 41,134 | |
| | | | | | | | |
Number of
Shares
| | | | | Value
| |
| | | | | Taiwan, Province of China (Continued) | | | | |
| | 7,095 | | | Taishin Financial Holding Co., Ltd. | | $ | 3,050 | |
| | 82,531 | | | Taiwan Cooperative Financial Holding Co., Ltd. | | | 67,950 | |
| | 8,931 | | | Taiwan Mobile Co., Ltd. | | | 26,879 | |
| | 184,675 | | | Taiwan Semiconductor Manufacturing Co., Ltd. | | | 2,447,940 | |
| | 27,459 | | | The Shanghai Commercial & Savings Bank, Ltd. | | | 42,391 | |
| | 13,818 | | | Unimicron Technology Corp. | | | 50,584 | |
| | 83,949 | | | Uni-President Enterprises Corp. | | | 177,535 | |
| | 100,601 | | | United Microelectronics Corp. | | | 112,582 | |
| | 19,114 | | | Wan Hai Lines, Ltd. | | | 39,872 | |
| | 136,715 | | | Winbond Electronics Corp. | | | 84,419 | |
| | 23,098 | | | WPG Holdings, Ltd. | | | 33,734 | |
| | 46,395 | | | Yang Ming Marine Transport Corp. | | | 89,135 | |
| | 90,245 | | | Yuanta Financial Holding Co., Ltd. | | | 55,344 | |
| | | | | | |
|
|
|
| | | | | | | | 6,181,239 | |
| | | | | | |
|
|
|
| | | | | Thailand - 1.08% | | | | |
| | 6,760 | | | Advanced Info Service PCL - NVDR | | | 34,866 | |
| | 12,884 | | | Airports of Thailand PCL - NVDR (a) | | | 24,678 | |
| | 184,823 | | | Asset World Corp PCL | | | 28,310 | |
| | 14,032 | | | Central Pattana PCL - NVDR | | | 24,135 | |
| | 4,020 | | | Delta Electronics Thailand PCL - NVDR | | | 69,272 | |
| | 40,177 | | | Gulf Energy Development PCL - NVDR | | | 55,674 | |
| | 45,073 | | | Home Product Center PCL - NVDR | | | 16,049 | |
| | 28,173 | | | JMT Network Services PCL | | | 50,713 | |
| | 78,908 | | | Krung Thai Bank PCL | | | 34,815 | |
| | 11,163 | | | Krungthai Card PCL | | | 16,931 | |
| | 60,632 | | | Osotspa PCL - NVDR | | | 43,677 | |
| | 4,955 | | | PTT Exploration & Production PCL | | | 21,129 | |
| | 26,741 | | | PTT Global Chemical PCL - NVDR | | | 29,264 | |
| | 243,554 | | | True Corp. PCL | | | 32,497 | |
| | | | | | |
|
|
|
| | | | | | | | 482,010 | |
| | | | | | |
|
|
|
| | | | | Turkey - 1.66% | | | | |
| | 176,271 | | | Akbank Turk AS | | | 107,216 | |
| | 15,190 | | | BIM Birlesik Magazalar AS | | | 94,635 | |
| | 32,172 | | | Eregli Demir ve Celik Fabrikalari TAS | | | 50,166 | |
| | 19,325 | | | Haci Omer Sabanci Holding AS | | | 26,808 | |
| | 48,789 | | | KOC Holding AS | | | 118,756 | |
| | 21,566 | | | Turk Hava Yollari AO (a) | | | 81,885 | |
| | 45,392 | | | Turkcell Iletisim Hizmetleri AS | | | 48,239 | |
| | 524,336 | | | Turkiye Is Bankasi - Series C | | | 211,159 | |
| | | | | | |
|
|
|
| | | | | | | | 738,864 | |
| | | | | | |
|
|
|
| | | | | United Arab Emirates - 1.65% | | | | |
| | 48,916 | | | Abu Dhabi Commercial Bank PJSC | | | 119,984 | |
| | 35,872 | | | Abu Dhabi Islamic Bank PJSC | | | 88,274 | |
| | 63,845 | | | Abu Dhabi National Oil Co. for Distribution PJSC | | | 77,174 | |
| | 86,422 | | | Aldar Properties PJSC | | | 98,656 | |
| | 89,456 | | | Emaar Properties PJSC | | | 140,368 | |
| | 21,120 | | | Emirates NBD Bank PJSC | | | 73,850 | |
| | 7,442 | | | Emirates Telecommunications Group Co. PJSC | | | 47,301 | |
| | 18,360 | | | First Abu Dhabi Bank PJSC | | | 89,055 | |
| | | | | | |
|
|
|
| | | | | | | | 734,662 | |
| | | | | | |
|
|
|
| | | | | Total Common Stocks
(Cost $42,155,658) | | | 40,205,624 | |
| | | | | | |
|
|
|
| | | | | INVESTMENT COMPANIES - 6.95% | | | | |
| | | | | China - 2.57% | | | | |
| | 26,661 | | | iShares Core MSCI Emerging Markets ETF | | | 1,145,890 | |
| | | | | | |
|
|
|
See notes to financial statements.
48
GuideMark Emerging Markets Fund
SCHEDULE OF INVESTMENTS (Continued) (Unaudited)
September 30, 2022
| | | | | | | | |
Number of
Shares
| | | | | Value
| |
| | | | | INVESTMENT COMPANIES (Continued) | | | | |
| | | | | Saudi Arabia - 4.38% | | | | |
| | 47,643 | | | iShares MSCI Saudi Arabia ETF (b) | | $ | 1,953,363 | |
| | | | | | |
|
|
|
| | | | | Total Investment Companies
(Cost $2,810,616) | | | 3,099,253 | |
| | | | | | |
|
|
|
| | | | | PREFERRED STOCKS - 2.79% | | | | |
| | | | | Brazil - 2.08% | | | | |
| | 37,803 | | | Banco Bradesco SA - Preference Shares | | | 139,037 | |
| | 14,963 | | | Braskem SA - Series A - Preference Shares | | | 72,785 | |
| | 53,341 | | | Cia Energetica de Minas Gerais - Preference Shares | | | 106,694 | |
| | 22,680 | | | Gerdau SA - Preference Shares | | | 102,756 | |
| | 37,716 | | | Itau Unibanco Holding SA - Preference Shares | | | 195,769 | |
| | 55,666 | | | Petroleo Brasileiro SA - Preference Shares | | | 309,167 | |
| | | | | | |
|
|
|
| | | | | | | | 926,208 | |
| | | | | | |
|
|
|
| | | | | Chile - 0.17% | | | | |
| | 843 | | | Sociedad Quimica y Minera de Chile SA - Class B | | | 78,456 | |
| | | | | | |
|
|
|
| | | | | Republic of Korea - 0.54% | | | | |
| | 434 | | | LG Household & Health Care, Ltd. - Preference Shares | | | 99,431 | |
| | 4,305 | | | Samsung Electronics Co., Ltd. - Preference Shares | | | 139,839 | |
| | | | | | |
|
|
|
| | | | | | | | 239,270 | |
| | | | | | |
|
|
|
| | | | | Total Preferred Stocks
(Cost $1,182,722) | | | 1,243,934 | |
| | | | | | |
|
|
|
| | | | | RIGHTS - 0.00% | | | | |
| | | | | China - 0.00% | | | | |
| | 142 | | | Guangzhou Tinci Materials Technology Co., Ltd. (e)(f) | | | 0 | |
| | 213 | | | Hubei Xingfa Chemicals Group Co., Ltd. (a)(e)(f) | | | 0 | |
| | | | | | |
|
|
|
| | | | | | | | 0 | |
| | | | | | |
|
|
|
| | | | | Total Rights
(Cost $0) | | | 0 | |
| | | | | | |
|
|
|
| | | | | SHORT TERM INVESTMENTS - 0.26% | | | | |
| | | | | Money Market Funds - 0.26% | | | | |
| | 116,460 | | | DWS Government Money Market Series -
Institutional Shares
Effective Yield, 3.04% (c) | | | 116,460 | |
| | | | | | |
|
|
|
| | | | | Total Short Term Investments
(Cost $116,460) | | | 116,460 | |
| | | | | | |
|
|
|
| | | | | | | | |
Number of
Units
| | | | | Value
| |
| | | | | INVESTMENTS PURCHASED WITH PROCEEDS FROM SECURITIES LENDING COLLATERAL - 4.78% | |
| | 2,132,591 | | | Mount Vernon Liquid Assets Portfolio, LLC
Effective Yield, 3.18% (c) | | $ | 2,132,591 | |
| | | | | | |
|
|
|
| | | | | Total Investments Purchased with Proceeds from Securities Lending Collateral
(Cost $2,132,591) | | | 2,132,591 | |
| | | | | | |
|
|
|
| | | | | Total Investments
(Cost $48,398,047) - 104.93% | | | 46,797,862 | |
| | | | | Liabilities in Excess of
Other Assets - (4.93)% | | | (2,197,740 | ) |
| | | | | | |
|
|
|
| | | | | TOTAL NET ASSETS - 100.00% | | $ | 44,600,122 | |
| | | | | | |
|
|
|
Percentages are stated as a percent of net assets.
| (a) | | Non-income producing security. |
| (b) | | All or portion of this security is on loan. |
| (c) | | Seven-day yield as of September 30, 2022. |
| (d) | | Regulation S securities, as defined under the Securities Act of 1933. Such securities are treated as liquid according to the Fund’s liquidity guidelines. The value of these securities total $0, which represents 0.00% of total net assets. |
| (e) | | Value determined using significant unobservable inputs. Classified as Level 3 in the fair value hierarchy. |
| (f) | | As of September 30, 2022, the Valuation Committee has fair valued these securities. The value of these securities were $65,896, which represents 0.15% of total net assets. |
| (g) | | These securities have been deemed illiquid according to the Fund’s liquidity guidelines. The value of these securities total $226,941, which represents 0.51% of total net assets. |
Glossary of Terms
| | | | |
| ADR | | - | | American Depositary Receipt |
| GDR | | - | | Global Depositary Receipt |
| NVDR | | - | | Non-Voting Depositary Receipt |
See notes to financial statements.
49
GuideMark Emerging Markets Fund
SCHEDULE OF INVESTMENTS BY INDUSTRY (Unaudited)
September 30, 2022
| | | | |
COMMON STOCKS | | | | |
| | | | 0.01% | |
Aerospace & Defense | | | 0.30% | |
Air Freight & Logistics | | | 0.07% | |
Airlines | | | 0.45% | |
Auto Components | | | 0.58% | |
Automobiles | | | 1.55% | |
Banks | | | 12.07% | |
Beverages | | | 1.38% | |
Biotechnology | | | 0.53% | |
Building Products | | | 0.12% | |
Capital Markets | | | 0.89% | |
Chemicals | | | 1.32% | |
Commercial Services & Supplies | | | 0.18% | |
Communications Equipment | | | 0.21% | |
Construction & Engineering | | | 1.06% | |
Construction Materials | | | 1.00% | |
Consumer Finance | | | 0.57% | |
Department Stores | | | 0.28% | |
Diversified Consumer Services | | | 0.21% | |
Diversified Financial Services | | | 0.51% | |
Diversified Telecommunication Services | | | 1.88% | |
Electric Utilities | | | 0.85% | |
Electrical Equipment | | | 0.57% | |
Electronic Equipment, Instruments & Components | | | 2.17% | |
Entertainment | | | 0.57% | |
Food & Staples Retailing | | | 2.32% | |
Food Products | | | 3.10% | |
Gas Utilities | | | 0.28% | |
Health Care Equipment & Supplies | | | 0.18% | |
Health Care Providers & Services | | | 0.19% | |
Hotels, Restaurants & Leisure | | | 0.88% | |
Household Durables | | | 1.11% | |
Household Products | | | 0.37% | |
Independent Power and Renewable Electricity Producers | | | 0.78% | |
Industrial Conglomerates | | | 1.19% | |
Insurance | | | 2.69% | |
Interactive Media & Services | | | 0.28% | |
Internet & Direct Marketing Retail | | | 3.71% | |
Internet Software & Services | | | 0.00% | |
IT Services | | | 6.40% | |
Life Sciences Tools & Services | | | 0.12% | |
Machinery | | | 0.23% | |
Marine | | | 1.24% | |
Media | | | 0.64% | |
Metals & Mining | | | 5.28% | |
Multiline Retail | | | 0.33% | |
Oil, Gas & Consumable Fuels | | | 6.03% | |
| | | | |
| | | | | |
Paper & Forest Products | | | 0.34% | |
Personal Products | | | 1.05% | |
Pharmaceuticals | | | 2.58% | |
Real Estate Management & Development | | | 1.48% | |
Semiconductors & Semiconductor Equipment | | | 11.29% | |
Software | | | 0.44% | |
Specialty Retail | | | 0.96% | |
Technology Hardware, Storage & Peripherals | | | 0.79% | |
Textiles, Apparel & Luxury Goods | | | 1.69% | |
Thrifts & Mortgage Finance | | | 0.43% | |
Tobacco | | | 0.36% | |
Trading Companies & Distributors | | | 0.64% | |
Transportation Infrastructure | | | 0.10% | |
Water Utilities | | | 0.19% | |
Wireless Telecommunication Services | | | 1.13% | |
| | |
|
|
|
TOTAL COMMON STOCKS | | | 90.15% | |
| | |
|
|
|
INVESTMENT COMPANIES | | | | |
International Equity Funds | | | 6.95% | |
| | |
|
|
|
TOTAL INVESTMENT COMPANIES | | | 6.95% | |
| | |
|
|
|
PREFERRED STOCKS | | | | |
Banks | | | 0.76% | |
Chemicals | | | 0.34% | |
Electric Utilities | | | 0.24% | |
Metals & Mining | | | 0.23% | |
Oil, Gas & Consumable Fuels | | | 0.69% | |
Personal Products | | | 0.22% | |
Semiconductors & Semiconductor Equipment | | | 0.31% | |
| | |
|
|
|
TOTAL PREFERRED STOCKS | | | 2.79% | |
| | |
|
|
|
RIGHTS | | | | |
Chemicals | | | 0.00% | |
| | |
|
|
|
TOTAL RIGHTS | | | 0.00% | |
| | |
|
|
|
SHORT TERM INVESTMENTS | | | | |
Money Market Funds | | | 0.26% | |
| | |
|
|
|
TOTAL SHORT TERM INVESTMENTS | | | 0.26% | |
| | |
|
|
|
INVESTMENTS PURCHASED WITH PROCEEDS FROM SECURITIES LENDING COLLATERAL | | | | |
Privat Investment Funds | | | 4.78% | |
| | |
|
|
|
TOTAL INVESTMENTS PURCHASED WITH PROCEEDS FROM SECURITIES LENDING COLLATERAL | | | 4.78% | |
| | |
|
|
|
TOTAL INVESTMENTS | | | 104.93% | |
Liabilities in Excess of Other Assets | | | (4.93)% | |
| | |
|
|
|
TOTAL NET ASSETS | | | 100.00% | |
| | |
|
|
|
See notes to financial statements.
50
GuideMark Small/Mid Cap Core Fund
SCHEDULE OF INVESTMENTS (Unaudited)
September 30, 2022
| | | | | | | | |
Number of
Shares
| | | | | Value
| |
| | | | | COMMON STOCKS - 90.72% | |
| | | | | Aerospace & Defense - 1.00% | |
| | 1,220 | | | AAR Corp. (a)(b) | | $ | 43,700 | |
| | 476 | | | Aerojet Rocketdyne Holdings, Inc. (a) | | | 19,035 | |
| | 211 | | | AeroVironment, Inc. (a) | | | 17,589 | |
| | 938 | | | Axon Enterprise, Inc. (a) | | | 108,574 | |
| | 567 | | | Curtiss-Wright Corp. (b) | | | 78,904 | |
| | 684 | | | Ducommun, Inc. (a) | | | 27,127 | |
| | 647 | | | Hexcel Corp. (b) | | | 33,463 | |
| | 3,348 | | | Howmet Aerospace, Inc. | | | 103,554 | |
| | 485 | | | Huntington Ingalls Industries, Inc. | | | 107,428 | |
| | 1,506 | | | Maxar Technologies, Inc. | | | 28,192 | |
| | 660 | | | Moog, Inc. - Class A | | | 46,431 | |
| | 908 | | | Parsons Corp. (a) | | | 35,594 | |
| | 2,897 | | | Textron, Inc. | | | 168,779 | |
| | 1,721 | | | Triumph Group, Inc. (a) | | | 14,783 | |
| | 1,164 | | | Vectrus, Inc. (a) | | | 41,206 | |
| | 2,033 | | | Virgin Galactic Holdings, Inc. (a) | | | 9,575 | |
| | | | | | |
|
|
|
| | | | | | | | 883,934 | |
| | | | | | |
|
|
|
| | | | | Air Freight & Logistics - 0.39% | |
| | 981 | | | Air Transport Services Group, Inc. (a) | | | 23,632 | |
| | 930 | | | Atlas Air Worldwide Holdings, Inc. (a) | | | 88,880 | |
| | 541 | | | Forward Air Corp. | | | 48,831 | |
| | 1,186 | | | GXO Logistics, Inc. (a) | | | 41,581 | |
| | 732 | | | Hub Group, Inc. - Class A (a) | | | 50,493 | |
| | 8,035 | | | Radiant Logistics, Inc. (a) | | | 45,719 | |
| | 978 | | | XPO Logistics, Inc. (a)(b) | | | 43,541 | |
| | | | | | |
|
|
|
| | | | | | | | 342,677 | |
| | | | | | |
|
|
|
| | | | | Airlines - 0.17% | |
| | 1,405 | | | Alaska Air Group, Inc. (a) | | | 55,006 | |
| | 280 | | | Allegiant Travel Co. (a)(b) | | | 20,434 | |
| | 2,027 | | | American Airlines Group, Inc. (a)(b) | | | 24,405 | |
| | 2,954 | | | JetBlue Airways Corp. (a) | | | 19,585 | |
| | 3,835 | | | Joby Aviation, Inc. (a)(b) | | | 16,606 | |
| | 750 | | | SkyWest, Inc. (a) | | | 12,195 | |
| | | | | | |
|
|
|
| | | | | | | | 148,231 | |
| | | | | | |
|
|
|
| | | | | Auto Components - 0.70% | |
| | 1,357 | | | Adient PLC - ADR (a) | | | 37,657 | |
| | 3,589 | | | American Axle & Manufacturing Holdings, Inc. (a) | | | 24,513 | |
| | 2,430 | | | BorgWarner, Inc. | | | 76,302 | |
| | 807 | | | Dana, Inc. | | | 9,224 | |
| | 404 | | | Dorman Products, Inc. (a) | | | 33,176 | |
| | 381 | | | Fox Factory Holding Corp. (a) | | | 30,129 | |
| | 2,920 | | | Gentex Corp. | | | 69,613 | |
| | 464 | | | Gentherm, Inc. (a) | | | 23,075 | |
| | 4,193 | | | Goodyear Tire & Rubber Co. (a) | | | 42,307 | |
| | 425 | | | LCI Industries | | | 43,121 | |
| | 513 | | | Lear Corp. | | | 61,401 | |
| | 2,834 | | | Modine Manufacturing Co. (a) | | | 36,672 | |
| | 894 | | | Standard Motor Products, Inc. | | | 29,055 | |
| | 1,319 | | | Stoneridge, Inc. (a) | | | 22,357 | |
| | 147 | | | Visteon Corp. (a) | | | 15,591 | |
| | 1,020 | | | XPEL, Inc. (a) | | | 65,729 | |
| | | | | | |
|
|
|
| | | | | | | | 619,922 | |
| | | | | | |
|
|
|
| | | | | Automobiles - 0.17% | |
| | 1,852 | | | Harley-Davidson, Inc. | | | 64,598 | |
| | 722 | | | Thor Industries, Inc. (b) | | | 50,526 | |
| | | | | | | | |
Number of
Shares
| | | | | Value
| |
| | | | | Automobiles (Continued) | |
| | 674 | | | Winnebago Industries, Inc. (b) | | $ | 35,863 | |
| | | | | | |
|
|
|
| | | | | | | | 150,987 | |
| | | | | | |
|
|
|
| | | | | Banks - 6.67% | |
| | 624 | | | Amerant Bancorp, Inc. | | | 15,500 | |
| | 1,128 | | | Ameris Bancorp (b) | | | 50,433 | |
| | 2,420 | | | Associated Banc-Corp. | | | 48,594 | |
| | 975 | | | Atlantic Union Bankshares Corp. | | | 29,620 | |
| | 195 | | | BancFirst Corp. | | | 17,447 | |
| | 2,010 | | | Banco Latinoamericano de Comercio Exterior SA - Class E - ADR | | | 26,251 | |
| | 3,049 | | | Bancorp, Inc. (a) | | | 67,017 | |
| | 590 | | | Bank of Hawaii Corp. | | | 44,911 | |
| | 1,563 | | | Bank OZK | | | 61,832 | |
| | 1,297 | | | BankUnited, Inc. (b) | | | 44,318 | |
| | 3,152 | | | Blue Ridge Bankshares Inc. | | | 40,062 | |
| | 429 | | | BOK Financial Corp. | | | 38,121 | |
| | 993 | | | Business First Bancshares, Inc. | | | 21,379 | |
| | 943 | | | Byline Bancorp, Inc. | | | 19,096 | |
| | 2,799 | | | Cadence Bank | | | 71,123 | |
| | 261 | | | Cambridge Bancorp | | | 20,812 | |
| | 481 | | | Camden National Corp. | | | 20,491 | |
| | 1,993 | | | Capital Bancorp, Inc. | | | 46,038 | |
| | 1,616 | | | Capstar Financial Holdings, Inc. | | | 29,944 | |
| | 1,275 | | | Cathay General Bancorp | | | 49,036 | |
| | 815 | | | Central Pacific Financial Corp. | | | 16,862 | |
| | 340 | | | City Holding Co. | | | 30,155 | |
| | 933 | | | Civista Bancshares, Inc. | | | 19,369 | |
| | 1,331 | | | CNB Financial Corp. | | | 31,372 | |
| | 1,036 | | | Coastal Financial Corp. (a) | | | 41,171 | |
| | 2,369 | | | Comerica, Inc. | | | 168,436 | |
| | 1,391 | | | Commerce Bancshares, Inc. (b) | | | 92,029 | |
| | 304 | | | Community Bank Systems, Inc. (b) | | | 18,264 | |
| | 1,094 | | | ConnectOne Bancorp, Inc. | | | 25,228 | |
| | 500 | | | Cullen Frost Bankers, Inc. (b) | | | 66,110 | |
| | 2,096 | | | Customers Bancorp, Inc. (a) | | | 61,790 | |
| | 1,254 | | | CVB Financial Corp. | | | 31,751 | |
| | 988 | | | Dime Community Bancshares, Inc. | | | 28,929 | |
| | 579 | | | Eagle Bancorp, Inc. | | | 25,951 | |
| | 2,323 | | | East West Bancorp, Inc. | | | 155,966 | |
| | 1,635 | | | Eastern Bankshares, Inc. | | | 32,111 | |
| | 675 | | | Enterprise Bancorp, Inc. | | | 20,189 | |
| | 1,168 | | | Enterprise Financial Services Corp. | | | 51,439 | |
| | 1,035 | | | Equity Bancshares, Inc. - Class A | | | 30,667 | |
| | 4,067 | | | F.N.B. Corp. | | | 47,177 | |
| | 528 | | | FB Financial Corp. | | | 20,175 | |
| | 1,462 | | | Financial Institutions, Inc. | | | 35,190 | |
| | 785 | | | First Bancorp | | | 28,715 | |
| | 5,140 | | | First Bancorp - ADR | | | 70,315 | |
| | 854 | | | First Bancshares, Inc. | | | 25,509 | |
| | 2,391 | | | First Bank | | | 32,685 | |
| | 1,247 | | | First Busey Corp. | | | 27,409 | |
| | 146 | | | First Citizens BancShares, Inc. - Class A | | | 116,425 | |
| | 2,384 | | | First Commonwealth Financial Corp. | | | 30,611 | |
| | 676 | | | First Community Bancshares, Inc. | | | 21,652 | |
| | 1,512 | | | First Financial Bancorp. | | | 31,873 | |
| | 1,365 | | | First Financial Bankshares, Inc. | | | 57,098 | |
| | 792 | | | First Financial Corp. | | | 35,790 | |
| | 902 | | | First Foundation, Inc. | | | 16,362 | |
| | 1,585 | | | First Hawaiian, Inc. | | | 39,039 | |
See notes to financial statements.
51
GuideMark Small/Mid Cap Core Fund
SCHEDULE OF INVESTMENTS (Continued) (Unaudited)
September 30, 2022
| | | | | | | | |
Number of
Shares
| | | | | Value
| |
| | | | | COMMON STOCKS (Continued) | |
| | | | | Banks (Continued) | |
| | 7,822 | | | First Horizon National Corp. | | $ | 179,124 | |
| | 1,030 | | | First Internet Bancorp | | | 34,876 | |
| | 450 | | | First Interstate BancSystem, Inc. - Class A | | | 18,158 | |
| | 3,010 | | | Fulton Financial Corp. | | | 47,558 | |
| | 571 | | | German American Bancorp, Inc. | | | 20,390 | |
| | 1,277 | | | Glacier Bancorp, Inc. | | | 62,739 | |
| | 1,511 | | | Hancock Whitney Corp. | | | 69,219 | |
| | 2,112 | | | Hanmi Financial Corp. | | | 50,012 | |
| | 2,308 | | | HarborOne Bancorp, Inc. | | | 30,973 | |
| | 1,650 | | | HBT Financial, Inc. | | | 29,948 | |
| | 682 | | | Heartland Financial U.S.A., Inc. | | | 29,572 | |
| | 1,809 | | | Hilltop Holdings, Inc. | | | 44,954 | |
| | 932 | | | Home BancShares, Inc. (b) | | | 20,979 | |
| | 1,149 | | | HomeTrust Bancshares, Inc. | | | 25,393 | |
| | 3,219 | | | Hope Bancorp, Inc. | | | 40,688 | |
| | 1,337 | | | Independent Bank Corp. | | | 25,537 | |
| | 383 | | | Independent Bank Corp. | | | 28,545 | |
| | 551 | | | Independent Bank Group, Inc. | | | 33,826 | |
| | 1,211 | | | Lakeland Bancorp, Inc. | | | 19,388 | |
| | 573 | | | Lakeland Financial Corp. | | | 41,720 | |
| | 876 | | | Live Oak Bancshares, Inc. | | | 26,806 | |
| | 1,080 | | | Mercantile Bank Corp. | | | 32,087 | |
| | 1,438 | | | Metrocity Bankshares, Inc. | | | 28,242 | |
| | 348 | | | Metropolitan Bank Holding Corp. (a) | | | 22,397 | |
| | 822 | | | Mid Penn Bancorp, Inc. | | | 23,616 | |
| | 1,269 | | | Midland States Bancorp, Inc. | | | 29,910 | |
| | 1,015 | | | MidWestOne Financial Group, Inc. | | | 27,699 | |
| | 971 | | | MVB Financial Corp. | | | 27,023 | |
| | 519 | | | National Bank Holdings Corp. - Class A | | | 19,198 | |
| | 727 | | | NBT Bancorp, Inc. | | | 27,590 | |
| | 328 | | | Nicolet Bankshares, Inc. (a) | | | 23,104 | |
| | 1,437 | | | OFG Bancorp - ADR | | | 36,112 | |
| | 2,825 | | | Old National Bancorp | | | 46,528 | |
| | 1,813 | | | Old Second Bancorp, Inc. | | | 23,660 | |
| | 716 | | | Origin Bancorp, Inc. | | | 27,545 | |
| | 1,386 | | | Orrstown Financial Services, Inc. | | | 33,153 | |
| | 963 | | | Pacific Premier Bancorp, Inc. | | | 29,814 | |
| | 2,153 | | | PacWest Bancorp | | | 48,658 | |
| | 229 | | | Park National Corp. | | | 28,506 | |
| | 671 | | | Peapack Gladstone Financial Corp. | | | 22,579 | |
| | 874 | | | Pinnacle Financial Partners, Inc. | | | 70,881 | |
| | 1,178 | | | Popular, Inc. - ADR (b) | | | 84,887 | |
| | 551 | | | Preferred Bank | | | 35,942 | |
| | 738 | | | Premier Financial Corp. | | | 18,967 | |
| | 971 | | | Prosperity Bancshares, Inc. (b) | | | 64,746 | |
| | 586 | | | QCR Holdings, Inc. | | | 29,851 | |
| | 1,313 | | | RBB Bancorp | | | 27,284 | |
| | 435 | | | Republic Bancorp, Inc. - Class A | | | 16,661 | |
| | 6,556 | | | Republic First Bancorp, Inc. (a) | | | 18,553 | |
| | 1,011 | | | S&T Bancorp, Inc. | | | 29,632 | |
| | 695 | | | Sandy Spring Bancorp, Inc. | | | 24,506 | |
| | 985 | | | ServisFirst Bancshares, Inc. (b) | | | 78,800 | |
| | 842 | | | Signature Bank | | | 127,142 | |
| | 307 | | | Silvergate Capital Corp. - Class A (a) | | | 23,132 | |
| | 1,861 | | | Simmons First National Corp. - Class A | | | 40,551 | |
| | 865 | | | SmartFinancial, Inc. | | | 21,374 | |
| | 1,398 | | | South Plains Financial, Inc. | | | 38,529 | |
| | 1,043 | | | South State Corp. | | | 82,522 | |
| | 631 | | | Southern First Bancshares, Inc. (a) | | | 26,287 | |
| | | | | | | | |
Number of
Shares
| | | | | Value
| |
| | | | | Banks (Continued) | |
| | 547 | | | Southside Bancshares, Inc. | | $ | 19,342 | |
| | 549 | | | Stock Yards Bancorp, Inc. | | | 37,337 | |
| | 1,277 | | | Summit Financial Group, Inc. | | | 34,402 | |
| | 2,558 | | | Synovus Financial Corp. | | | 95,951 | |
| | 675 | | | Texas Capital Bancshares, Inc. (a)(b) | | | 39,845 | |
| | 1,000 | | | The Bank of N.T. Butterfield & Son, Ltd. - ADR | | | 32,460 | |
| | 1,049 | | | TowneBank | | | 28,145 | |
| | 500 | | | Triumph Bancorp, Inc. (a) | | | 27,175 | |
| | 1,050 | | | Trustmark Corp. | | | 32,162 | |
| | 669 | | | UMB Financial Corp. | | | 56,390 | |
| | 3,842 | | | Umpqua Holdings Corp. | | | 65,660 | |
| | 1,585 | | | United Bankshares, Inc. | | �� | 56,664 | |
| | 2,294 | | | United Community Banks, Inc. | | | 75,931 | |
| | 1,224 | | | Univest Corp. of Pennsylvania | | | 28,740 | |
| | 5,260 | | | Valley National Bancorp | | | 56,808 | |
| | 909 | | | Veritex Holdings, Inc. | | | 24,170 | |
| | 527 | | | Washington Trust Bancorp, Inc. | | | 24,495 | |
| | 1,620 | | | Webster Financial Corp. | | | 73,224 | |
| | 1,440 | | | WesBanco, Inc. | | | 48,053 | |
| | 1,329 | | | West Bancorporation, Inc. | | | 27,656 | |
| | 1,946 | | | Western Alliance Bancorp | | | 127,930 | |
| | 851 | | | Wintrust Financial Corp. | | | 69,399 | |
| | 2,824 | | | Zions Bancorporation | | | 143,629 | |
| | | | | | |
|
|
|
| | | | | | | | 5,869,480 | |
| | | | | | |
|
|
|
| | | | | Beverages - 0.55% | |
| | 171 | | | Boston Beer Co., Inc. - Class A (a)(b) | | | 55,344 | |
| | 1,979 | | | Celsius Holdings, Inc. (a)(b) | | | 179,456 | |
| | 252 | | | Coca-Cola Consolidated, Inc. | | | 103,756 | |
| | 478 | | | MGP Ingredients, Inc. | | | 50,745 | |
| | 1,321 | | | National Beverage Corp. | | | 50,911 | |
| | 3,800 | | | Primo Water Corp. - ADR | | | 47,690 | |
| | | | | | |
|
|
|
| | | | | | | | 487,902 | |
| | | | | | |
|
|
|
| | | | | Biotechnology - 3.01% | |
| | 3,712 | | | ACADIA Pharmaceuticals, Inc. (a) | | | 60,728 | |
| | 4,854 | | | Achillion Pharmaceuticals, Inc. (a)(c)(e)(f) | | | 2,233 | |
| | 1,181 | | | Aduro Biotech, Inc. (a)(c)(e)(f) | | | 0 | |
| | 6,592 | | | Alector, Inc. (a) | | | 62,360 | |
| | 4,144 | | | Alkermes PLC - ADR (a) | | | 92,536 | |
| | 666 | | | Apellis Pharmaceuticals, Inc. (a) | | | 45,488 | |
| | 2,128 | | | Arcus Biosciences, Inc. (a) | | | 55,669 | |
| | 2,265 | | | BioCryst Pharmaceuticals, Inc. (a) | | | 28,539 | |
| | 835 | | | Biohaven Pharmaceutical Holding Co., Ltd. - ADR (a)(b) | | | 126,227 | |
| | 1,051 | | | CareDx, Inc. (a) | | | 17,888 | |
| | 15,091 | | | Catalyst Pharmaceuticals, Inc. (a) | | | 193,618 | |
| | 4,694 | | | Coherus Biosciences, Inc. (a) | | | 45,109 | |
| | 866 | | | Crinetics Pharmaceuticals, Inc. (a) | | | 17,008 | |
| | 653 | | | Cytokinetics, Inc. (a)(b) | | | 31,638 | |
| | 5,534 | | | Dynavax Technologies Corp. (a)(b) | | | 57,775 | |
| | 3,593 | | | Eagle Pharmaceuticals, Inc. (a) | | | 94,927 | |
| | 3,690 | | | Emergent BioSolutions, Inc. (a) | | | 77,453 | |
| | 277 | | | Enanta Pharmaceuticals, Inc. (a) | | | 14,368 | |
| | 8,793 | | | Exelixis, Inc. (a) | | | 137,874 | |
| | 3,154 | | | Foghorn Therapeutics, Inc. (a) | | | 27,061 | |
| | 425 | | | Global Blood Therapeutics, Inc. (a) | | | 28,943 | |
| | 1,156 | | | Halozyme Therapeutics, Inc. (a)(b) | | | 45,708 | |
| | 749 | | | Ionis Pharmaceuticals, Inc. (a) | | | 33,128 | |
| | 6,114 | | | Ironwood Pharmaceuticals, Inc. (a)(b) | | | 63,341 | |
| | 5,381 | | | iTeos Therapeutics, Inc. (a) | | | 102,508 | |
See notes to financial statements.
52
GuideMark Small/Mid Cap Core Fund
SCHEDULE OF INVESTMENTS (Continued) (Unaudited)
September 30, 2022
| | | | | | | | |
Number of
Shares
| | | | | Value
| |
| | | | | COMMON STOCKS (Continued) | |
| | | | | Biotechnology (Continued) | |
| | 179 | | | Karuna Therapeutics, Inc. (a) | | $ | 40,262 | |
| | 7,593 | | | Karyopharm Therapeutics, Inc. (a) | | | 41,458 | |
| | 3,139 | | | Kezar Life Sciences, Inc. (a) | | | 27,027 | |
| | 7,439 | | | MannKind Corp. (a) | | | 22,987 | |
| | 12,644 | | | MiMedx Group, Inc. (a) | | | 36,288 | |
| | 1,419 | | | Myriad Genetics, Inc. (a) | | | 27,075 | |
| | 394 | | | Natera, Inc. (a) | | | 17,265 | |
| | 713 | | | Neurocrine Biosciences, Inc. (a) | | | 75,728 | |
| | 20,079 | | | OPKO Health, Inc. (a)(b) | | | 37,949 | |
| | 26,513 | | | Organogenesis Holdings, Inc. (a) | | | 85,902 | |
| | 354 | | | Prometheus Biosciences, Inc. (a) | | | 20,890 | |
| | 362 | | | PTC Therapeutics, Inc. (a)(b) | | | 18,172 | |
| | 6,802 | | | Radius Health, Inc. (a)(c)(e)(f) | | | 544 | |
| | 2,910 | | | REGENXBIO, Inc. (a) | | | 76,911 | |
| | 379 | | | Repligen Corp. (a) | | | 70,915 | |
| | 508 | | | Sarepta Therapeutics, Inc. (a) | | | 56,154 | |
| | 797 | | | Travere Therapeutics, Inc. (a) | | | 19,638 | |
| | 1,170 | | | United Therapeutics Corp. (a) | | | 244,975 | |
| | 9,018 | | | Vanda Pharmaceuticals, Inc. (a) | | | 89,098 | |
| | 2,767 | | | Vericel Corp. (a)(b) | | | 64,194 | |
| | 5,973 | | | Vir Biotechnology, Inc. (a)(b) | | | 115,159 | |
| | | | | | |
|
|
|
| | | | | | | | 2,650,718 | |
| | | | | | |
|
|
|
| | | | | Building Products - 1.91% | |
| | 2,043 | | | A. O. Smith Corp. | | | 99,249 | |
| | 778 | | | Advanced Drainage Systems, Inc. | | | 96,760 | |
| | 1,101 | | | Allegion PLC - ADR | | | 98,738 | |
| | 748 | | | American Woodmark Corp. (a) | | | 32,807 | |
| | 1,160 | | | Apogee Enterprises, Inc. | | | 44,335 | |
| | 216 | | | Armstrong World Industries, Inc. | | | 17,114 | |
| | 4,524 | | | Builders FirstSource, Inc. (a) | | | 266,554 | |
| | 224 | | | CSW Industrials, Inc. | | | 26,835 | |
| | 2,034 | | | Fortune Brands Home & Security, Inc. | | | 109,205 | |
| | 1,017 | | | Griffon Corp. | | | 30,022 | |
| | 1,371 | | | Insteel Industries, Inc. | | | 36,373 | |
| | 1,681 | | | JELD-WEN Holding, Inc. (a)(b) | | | 14,709 | |
| | 473 | | | Lennox International, Inc. | | | 105,323 | |
| | 608 | | | Masonite International Corp. - ADR (a)(b) | | | 43,344 | |
| | 1,509 | | | Owens Corning, Inc. (b) | | | 118,622 | |
| | 485 | | | Patrick Industries, Inc. | | | 21,262 | |
| | 2,650 | | | PGT Innovations, Inc. (a) | | | 55,544 | |
| | 2,745 | | | Quanex Building Products Corp. | | | 49,849 | |
| | 2,310 | | | Resideo Technologies, Inc. (a)(b) | | | 44,029 | |
| | 865 | | | Simpson Manufacturing Co., Inc. | | | 67,816 | |
| | 1,851 | | | Trex Co., Inc. (a) | | | 81,333 | |
| | 1,938 | | | UFP Industries, Inc. | | | 139,846 | |
| | 12,670 | | | View, Inc. (a)(b) | | | 16,978 | |
| | 2,799 | | | Zurn Elkay Water Solutions Corp. | | | 68,576 | |
| | | | | | |
|
|
|
| | | | | | | | 1,685,223 | |
| | | | | | |
|
|
|
| | | | | Capital Markets - 3.12% | |
| | 761 | | | Affiliated Managers Group, Inc. | | | 85,118 | |
| | 1,629 | | | Artisan Partners Asset Management, Inc. - Class A (b) | | | 43,869 | |
| | 903 | | | B. Riley Financial, Inc. (b) | | | 40,202 | |
| | 975 | | | Blucora, Inc. (a) | | | 18,856 | |
| | 2,549 | | | Brightsphere Investment Group, Inc. | | | 38,006 | |
| | 841 | | | Cboe Global Markets, Inc. | | | 98,708 | |
| | 1,025 | | | Cohen & Steers, Inc. | | | 64,196 | |
| | 2,109 | | | Cowen Group, Inc. - Class A | | | 81,492 | |
| | | | | | | | |
Number of
Shares
| | | | | Value
| |
| | | | | Capital Markets (Continued) | |
| | 334 | | | Diamond Hill Investment Group, Inc. | | $ | 55,110 | |
| | 1,980 | | | Donnelley Financial Solutions, Inc. (a)(b) | | | 73,201 | |
| | 1,019 | | | Evercore, Inc. - Class A | | | 83,813 | |
| | 521 | | | FactSet Research Systems, Inc. | | | 208,457 | |
| | 2,306 | | | Federated Investors, Inc. | | | 76,375 | |
| | 2,298 | | | GAMCO Investors, Inc. - Class A | | | 39,181 | |
| | 859 | | | Hamilton Lane, Inc. - Class A | | | 51,205 | |
| | 1,127 | | | Houlihan Lokey, Inc. | | | 84,953 | |
| | 4,225 | | | Invesco, Ltd. - ADR | | | 57,883 | |
| | 2,781 | | | Janus Henderson Group PLC - ADR (b) | | | 56,482 | |
| | 2,429 | | | Lazard, Ltd. - Class A - ADR | | | 77,315 | |
| | 1,383 | | | LPL Financial Holdings, Inc. (b) | | | 302,158 | |
| | 288 | | | MarketAxess Holdings, Inc. | | | 64,077 | |
| | 1,978 | | | Moelis & Co. - Class A | | | 66,876 | |
| | 478 | | | Morningstar, Inc. | | | 101,489 | |
| | 4,517 | | | Open Lending Corp. - Class A (a)(b) | | | 36,317 | |
| | 1,125 | | | Oppenheimer Holdings, Inc. - Class A | | | 34,852 | |
| | 574 | | | Piper Jaffray Cos. (b) | | | 60,121 | |
| | 1,011 | | | PJT Partners, Inc. - Class A (b) | | | 67,555 | |
| | 6,361 | | | Pzena Investment Management, Inc. - Class A | | | 60,302 | |
| | 3,147 | | | Robinhood Markets, Inc. - Class A (a)(b) | | | 31,785 | |
| | 1,754 | | | SEI Investments Co. | | | 86,034 | |
| | 1,047 | | | Silvercrest Asset Management Group, Inc. - Class A | | | 17,118 | |
| | 1,471 | | | StepStone Group, Inc. - Class A | | | 36,054 | |
| | 2,110 | | | Stifel Financial Corp. (b) | | | 109,530 | |
| | 828 | | | StoneX Group, Inc. (a) | | | 68,674 | |
| | 3,817 | | | The Carlyle Group, Inc. | | | 98,631 | |
| | 2,062 | | | Valhi, Inc. | | | 51,880 | |
| | 3,300 | | | Virtu Financial, Inc. - Class A | | | 68,541 | |
| | 293 | | | Virtus Investment Partners, Inc. | | | 46,739 | |
| | | | | | |
|
|
|
| | | | | | | | 2,743,155 | |
| | | | | | |
|
|
|
| | | | | Chemicals - 1.36% | |
| | 1,698 | | | AdvanSix, Inc. | | | 54,506 | |
| | 2,040 | | | American Vanguard Corp. (b) | | | 38,148 | |
| | 773 | | | Ashland Global Holdings, Inc. | | | 73,412 | |
| | 1,053 | | | Avient Corp. | | | 31,906 | |
| | 2,211 | | | Axalta Coating Systems, Ltd. - ADR (a) | | | 46,564 | |
| | 229 | | | Balchem Corp. | | | 27,842 | |
| | 565 | | | Cabot Corp. | | | 36,098 | |
| | 3,196 | | | Element Solutions, Inc. | | | 51,999 | |
| | 580 | | | H.B. Fuller Co. | | | 34,858 | |
| | 948 | | | Hawkins, Inc. | | | 36,962 | |
| | 3,147 | | | Huntsman Corp. (b) | | | 77,227 | |
| | 461 | | | Ingevity Corp. (a) | | | 27,950 | |
| | 464 | | | Innospec, Inc. | | | 39,751 | |
| | 1,174 | | | Intrepid Potash, Inc. (a) | | | 46,455 | |
| | 1,084 | | | Koppers Holdings, Inc. | | | 22,526 | |
| | 2,242 | | | Livent Corp. (a)(b) | | | 68,717 | |
| | 460 | | | Minerals Technologies, Inc. | | | 22,729 | |
| | 81 | | | NewMarket Corp. | | | 24,367 | |
| | 2,726 | | | Olin Corp. (b) | | | 116,891 | |
| | 1,698 | | | RPM International, Inc. | | | 141,460 | |
| | 298 | | | Sensient Technologies Corp. | | | 20,663 | |
| | 1,979 | | | The Chemours Co. | | | 48,782 | |
| | 783 | | | Trinseo PLC - ADR | | | 14,345 | |
| | 2,871 | | | Tronox Holdings PLC - ADR | | | 35,170 | |
| | 2,407 | | | Valvoline, Inc. | | | 60,993 | |
| | | | | | |
|
|
|
| | | | | | | | 1,200,321 | |
| | | | | | |
|
|
|
See notes to financial statements.
53
GuideMark Small/Mid Cap Core Fund
SCHEDULE OF INVESTMENTS (Continued) (Unaudited)
September 30, 2022
| | | | | | | | |
Number of
Shares
| | | | | Value
| |
| | | | | COMMON STOCKS (Continued) | |
| | | | | Commercial Services & Supplies - 1.13% | |
| | 835 | | | ABM Industries, Inc. | | $ | 31,922 | |
| | 4,135 | | | ACCO Brands Corp. | | | 20,261 | |
| | 3,855 | | | ADT, Inc. | | | 28,874 | |
| | 1,147 | | | Avery Dennison Corp. | | | 186,617 | |
| | 2,399 | | | BrightView Holdings, Inc. (a) | | | 19,048 | |
| | 422 | | | Casella Waste Systems, Inc. - Class A (a) | | | 32,237 | |
| | 1,217 | | | Cimpress PLC - ADR (a) | | | 29,792 | |
| | 670 | | | Clean Harbors, Inc. (a) | | | 73,687 | |
| | 896 | | | Comfort Systems USA, Inc. | | | 87,208 | |
| | 2,045 | | | Deluxe Corp. | | | 34,049 | |
| | 1,097 | | | Heritage-Crystal Clean, Inc. (a) | | | 32,438 | |
| | 2,274 | | | Herman Miller, Inc. | | | 35,474 | |
| | 1,519 | | | HNI Corp. | | | 40,269 | |
| | 783 | | | IAA, Inc. (a) | | | 24,938 | |
| | 3,635 | | | Interface, Inc. | | | 32,679 | |
| | 4,551 | | | Kimball International, Inc. - Class B | | | 28,626 | |
| | 290 | | | McGrath RentCorp | | | 24,319 | |
| | 476 | | | MSA Safety, Inc. | | | 52,017 | |
| | 3,990 | | | NL Industries, Inc. | | | 30,843 | |
| | 5,960 | | | Pitney Bowes, Inc. | | | 13,887 | |
| | 2,956 | | | Steelcase, Inc. - Class A (b) | | | 19,273 | |
| | 500 | | | Stericycle, Inc. (a)(b) | | | 21,055 | |
| | 500 | | | Tetra Tech, Inc. | | | 64,265 | |
| | 720 | | | The Brinks Co. (b) | | | 34,877 | |
| | | | | | |
|
|
|
| | | | | | | | 998,655 | |
| | | | | | |
|
|
|
| | | | | Communications Equipment - 1.61% | |
| | 1,732 | | | ADTRAN Holdings, Inc. (b) | | | 33,913 | |
| | 922 | | | Aviat Networks, Inc. (a) | | | 25,244 | |
| | 2,860 | | | Calix, Inc. (a) | | | 174,860 | |
| | 2,972 | | | Cambium Networks Corp. - ADR (a) | | | 50,286 | |
| | 6,414 | | | Casa Systems, Inc. (a) | | | 20,076 | |
| | 2,543 | | | Ciena Corp. (a)(b) | | | 102,813 | |
| | 1,147 | | | Clearfield, Inc. (a) | | | 120,022 | |
| | 1,906 | | | Comtech Telecommunications Corp. | | | 19,079 | |
| | 1,468 | | | Digi International, Inc. (a) | | | 50,749 | |
| | 2,317 | | | DZS, Inc. (a) | | | 26,182 | |
| | 1,814 | | | EchoStar Corp. - Class A (a) | | | 29,877 | |
| | 11,381 | | | Extreme Networks, Inc. (a)(b) | | | 148,750 | |
| | 996 | | | F5 Networks, Inc. (a) | | | 144,151 | |
| | 3,420 | | | Harmonic, Inc. (a)(b) | | | 44,699 | |
| | 15,636 | | | Inseego Corp. (a)(b) | | | 32,367 | |
| | 719 | | | InterDigital, Inc. | | | 29,062 | |
| | 5,889 | | | Juniper Networks, Inc. | | | 153,821 | |
| | 850 | | | Lumentum Holdings, Inc. (a)(b) | | | 58,284 | |
| | 1,293 | | | NETGEAR, Inc. (a) | | | 25,912 | |
| | 1,833 | | | NetScout Systems, Inc. (a) | | | 57,410 | |
| | 14,036 | | | Ribbon Communications, Inc. (a) | | | 31,160 | |
| | 2,605 | | | Viavi Solutions, Inc. (a) | | | 33,995 | |
| | | | | | |
|
|
|
| | | | | | | | 1,412,712 | |
| | | | | | |
|
|
|
| | | | | Construction & Engineering - 1.38% | |
| | 2,048 | | | AECOM | | | 140,022 | |
| | 614 | | | Ameresco, Inc. - Class A (a) | | | 40,819 | |
| | 2,526 | | | API Group Corp. (a) | | | 33,520 | |
| | 862 | | | Arcosa, Inc. | | | 49,289 | |
| | 504 | | | Dycom Industries, Inc. (a) | | | 48,147 | |
| | 1,010 | | | EMCOR Group, Inc. | | | 116,635 | |
| | 1,747 | | | Fluor Corp. (a)(b) | | | 43,483 | |
| | 1,189 | | | IES Holdings, Inc. (a) | | | 32,840 | |
| | | | | | | | |
Number of
Shares
| | | | | Value
| |
| | | | | Construction & Engineering (Continued) | |
| | 1,792 | | | KBR, Inc. (b) | | $ | 77,450 | |
| | 909 | | | MasTec, Inc. (a)(b) | | | 57,722 | |
| | 559 | | | MYR Group, Inc. (a) | | | 47,364 | |
| | 1,083 | | | Northwest Pipe Co. (a) | | | 30,432 | |
| | 500 | | | NV5 Global, Inc. (a) | | | 61,910 | |
| | 1,601 | | | Primoris Services Corp. | | | 26,016 | |
| | 1,717 | | | Quanta Services, Inc. (b) | | | 218,729 | |
| | 2,237 | | | Sterling Infrastructure, Inc. (a) | | | 48,028 | |
| | 6,243 | | | Tutor Perini Corp. (a) | | | 34,461 | |
| | 2,661 | | | WillScot Mobile Mini Holdings Corp. (a)(b) | | | 107,318 | |
| | | | | | |
|
|
|
| | | | | | | | 1,214,185 | |
| | | | | | |
|
|
|
| | | | | Construction Materials - 0.12% | |
| | 526 | | | Eagle Materials, Inc. | | | 56,377 | |
| | 1,604 | | | Summit Materials, Inc. - Class A (a) | | | 38,432 | |
| | 135 | | | United States Lime & Minerals, Inc. | | | 13,797 | |
| | | | | | |
|
|
|
| | | | | | | | 108,606 | |
| | | | | | |
|
|
|
| | | | | Consumer Finance - 0.86% | |
| | 2,036 | | | Atlanticus Holdings Corp. (a) | | | 53,404 | |
| | 4,512 | | | Consumer Portfolio Services, Inc. (a) | | | 32,802 | |
| | 203 | | | Credit Acceptance Corp. (a)(b) | | | 88,914 | |
| | 2,599 | | | Enova International, Inc. (a) | | | 76,073 | |
| | 3,102 | | | EZCORP, Inc. - Class A (a) | | | 23,916 | |
| | 395 | | | FirstCash Holdings, Inc. | | | 28,973 | |
| | 1,903 | | | LendingClub Corp. (a) | | | 21,028 | |
| | 6,122 | | | Navient Corp. | | | 89,932 | |
| | 651 | | | Nelnet, Inc. - Class A | | | 51,553 | |
| | 3,056 | | | OneMain Holdings, Inc. (b) | | | 90,213 | |
| | 2,131 | | | Oportun Financial Corp. (a) | | | 9,313 | |
| | 648 | | | PRA Group, Inc. (a) | | | 21,293 | |
| | 1,815 | | | PROG Holdings, Inc. (a) | | | 27,189 | |
| | 1,540 | | | Regional Management Corp. | | | 43,182 | |
| | 5,849 | | | SLM Corp. | | | 81,828 | |
| | 1,022 | | | Upstart Holdings, Inc. (a)(b) | | | 21,247 | |
| | | | | | |
|
|
|
| | | | | | | | 760,860 | |
| | | | | | |
|
|
|
| | | | | Containers & Packaging - 0.86% | |
| | 456 | | | AptarGroup, Inc. | | | 43,334 | |
| | 1,281 | | | Ardagh Group SA - ADR (c)(e)(f) | | | 10,382 | |
| | 1,518 | | | Berry Global Group, Inc. (a) | | | 70,632 | |
| | 1,343 | | | Crown Holdings, Inc. | | | 108,823 | |
| | 2,258 | | | Graphic Packaging Holding Co. | | | 44,573 | |
| | 696 | | | Greif, Inc. - Class A | | | 41,461 | |
| | 436 | | | Greif, Inc. - Class B | | | 26,509 | |
| | 2,215 | | | Myers Industries, Inc. | | | 36,481 | |
| | 3,037 | | | O-I Glass, Inc. (a) | | | 39,329 | |
| | 1,166 | | | Packaging Corp. of America (b) | | | 130,930 | |
| | 2,098 | | | Sealed Air Corp. | | | 93,382 | |
| | 1,249 | | | Silgan Holdings, Inc. | | | 52,508 | |
| | 538 | | | Sonoco Products Co. | | | 30,521 | |
| | 338 | | | UFP Technologies, Inc. (a) | | | 29,014 | |
| | | | | | |
|
|
|
| | | | | | | | 757,879 | |
| | | | | | |
|
|
|
| | | | | Distributors - 0.06% | |
| | 2,813 | | | Funko, Inc. - Class A (a)(b) | | | 56,879 | |
| | | | | | |
|
|
|
| | | | | Diversified Consumer Services - 1.21% | |
| | 1,613 | | | Adtalem Global Education, Inc. (a)(b) | | | 58,794 | |
| | 2,218 | | | American Public Education, Inc. (a) | | | 20,273 | |
| | 37,684 | | | Beachbody Co., Inc. (a) | | | 38,061 | |
| | 231 | | | Bright Horizons Family Solutions, Inc. (a) | | | 13,317 | |
See notes to financial statements.
54
GuideMark Small/Mid Cap Core Fund
SCHEDULE OF INVESTMENTS (Continued) (Unaudited)
September 30, 2022
| | | | | | | | |
Number of
Shares
| | | | | Value
| |
| | | | | COMMON STOCKS (Continued) | |
| | | | | Diversified Consumer Services (Continued) | |
| | 1,319 | | | Carriage Services, Inc. | | $ | 42,419 | |
| | 1,083 | | | Franchise Group, Inc. | | | 26,317 | |
| | 2,598 | | | frontdoor, Inc. (a) | | | 52,973 | |
| | 112 | | | Graham Holdings Co. - Class B | | | 60,254 | |
| | 840 | | | Grand Canyon Education, Inc. (a) | | | 69,090 | |
| | 3,807 | | | H&R Block, Inc. (b) | | | 161,950 | |
| | 1,493 | | | Hillenbrand, Inc. | | | 54,823 | |
| | 3,845 | | | Laureate Education, Inc. (b) | | | 40,565 | |
| | 1,233 | | | Matthews International Corp. - Class A | | | 27,632 | |
| | 15,467 | | | Nerdy, Inc. (a) | | | 32,635 | |
| | 8,341 | | | Perdoceo Education Corp. (a) | | | 85,912 | |
| | 1,753 | | | Service Corp. International | | | 101,218 | |
| | 523 | | | Strategic Education, Inc. | | | 32,117 | |
| | 2,317 | | | Stride, Inc. (a)(b) | | | 97,383 | |
| | 2,395 | | | Udemy, Inc. (a) | | | 28,956 | |
| | 5,579 | | | WW International, Inc. (a) | | | 21,925 | |
| | | | | | |
|
|
|
| | | | | | | | 1,066,614 | |
| | | | | | |
|
|
|
| | | | | Diversified Financial Services - 0.70% | |
| | 1,609 | | | Alerus Financial Corp. | | | 35,559 | |
| | 2,868 | | | A-Mark Precious Metals, Inc. | | | 81,423 | |
| | 17,205 | | | Douglas Elliman, Inc. (b) | | | 70,540 | |
| | 1,478 | | | Encore Capital Group, Inc. (a)(b) | | | 67,219 | |
| | 2,242 | | | Jackson Financial, Inc. - Class A | | | 62,215 | |
| | 4,221 | | | Jefferies Financial Group, Inc. (b) | | | 124,520 | |
| | 1,560 | | | Primis Financial Corp. | | | 18,923 | |
| | 2,295 | | | Voya Financial, Inc. (b) | | | 138,848 | |
| | 198 | | | World Acceptance Corp. (a) | | | 19,170 | |
| | | | | | |
|
|
|
| | | | | | | | 618,417 | |
| | | | | | |
|
|
|
| | | | | Diversified Telecommunication Services - 0.28% | |
| | 558 | | | Cogent Communications Holdings, Inc. | | | 29,105 | |
| | 1,181 | | | Frontier Communications Parent, Inc. (a)(b) | | | 27,671 | |
| | 3,834 | | | IDT Corp. - Class B (a) | | | 95,198 | |
| | 542 | | | Iridium Communications, Inc. (a) | | | 24,049 | |
| | 4,385 | | | Ooma, Inc. (a) | | | 53,935 | |
| | 2,059 | | | Radius Global Infrastructure, Inc. - Class A (a) | | | 19,396 | |
| | | | | | |
|
|
|
| | | | | | | | 249,354 | |
| | | | | | |
|
|
|
| | | | | Electric Utilities - 0.49% | |
| | 347 | | | ALLETE, Inc. | | | 17,367 | |
| | 1,641 | | | Hawaiian Electric Industries, Inc. | | | 56,877 | |
| | 598 | | | IDACORP, Inc. | | | 59,208 | |
| | 415 | | | MGE Energy, Inc. | | | 27,236 | |
| | 1,515 | | | OGE Energy Corp. | | | 55,237 | |
| | 819 | | | Pinnacle West Capital Corp. | | | 52,834 | |
| | 635 | | | PNM Resources, Inc. | | | 29,039 | |
| | 1,233 | | | Portland General Electric Co. | | | 53,586 | |
| | 485 | | | Unitil Corp. | | | 22,528 | |
| | 8,616 | | | Via Renewables, Inc. | | | 59,537 | |
| | | | | | |
|
|
|
| | | | | | | | 433,449 | |
| | | | | | |
|
|
|
| | | | | Electrical Equipment - 1.51% | |
| | 738 | | | Acuity Brands, Inc. | | | 116,213 | |
| | 1,116 | | | Allied Motion Technologies, Inc. | | | 31,940 | |
| | 1,540 | | | Atkore International Group, Inc. (a) | | | 119,827 | |
| | 865 | | | AZZ, Inc. | | | 31,581 | |
| | 4,498 | | | Babcock & Wilcox Enterprises, Inc. (a) | | | 28,697 | |
| | 1,016 | | | Belden, Inc. | | | 60,980 | |
| | 760 | | | Bloom Energy Corp. - Class A (a) | | | 15,192 | |
| | | | | | | | |
Number of
Shares
| | | | | Value
| |
| | | | | Electrical Equipment (Continued) | |
| | 926 | | | Brady Corp. - Class A | | $ | 38,642 | |
| | 1,769 | | | ChargePoint Holdings, Inc. (a)(b) | | | 26,111 | |
| | 1,196 | | | Encore Wire Corp. (b) | | | 138,186 | |
| | 799 | | | Franklin Electric Co., Inc. | | | 65,286 | |
| | 14,577 | | | GrafTech International, Ltd. | | | 62,827 | |
| | 582 | | | Hubbell, Inc. | | | 129,786 | |
| | 2,620 | | | nVent Electric PLC - ADR | | | 82,818 | |
| | 2,678 | | | Plug Power, Inc. (a)(b) | | | 56,265 | |
| | 910 | | | Preformed Line Products Co. | | | 64,747 | |
| | 705 | | | Regal Beloit Corp. (b) | | | 98,954 | |
| | 1,292 | | | Sensata Technologies Holding PLC - ADR | | | 48,166 | |
| | 2,001 | | | Thermon Group Holdings, Inc. (a) | | | 30,835 | |
| | 849 | | | Vicor Corp. (a) | | | 50,210 | |
| | 362 | | | Woodward Governor Co. | | | 29,054 | |
| | | | | | |
|
|
|
| | | | | | | | 1,326,317 | |
| | | | | | |
|
|
|
| | | | | Electronic Equipment, Instruments & Components - 1.79% | |
| | 3,654 | | | Arlo Technologies, Inc. (a) | | | 16,955 | |
| | 1,052 | | | Arrow Electronics, Inc. (a) | | | 96,984 | |
| | 1,446 | | | Avnet, Inc. | | | 52,230 | |
| | 1,066 | | | Benchmark Electronics, Inc. | | | 26,416 | |
| | 1,908 | | | Cognex Corp. (b) | | | 79,087 | |
| | 1,583 | | | Coherent Corp. (a)(b) | | | 55,168 | |
| | 1,302 | | | CTS Corp. (b) | | | 54,228 | |
| | 1,199 | | | Dolby Laboratories, Inc. - Class A | | | 78,115 | |
| | 549 | | | Fabrinet - ADR (a)(b) | | | 52,402 | |
| | 694 | | | FARO Technologies, Inc. (a) | | | 19,043 | |
| | 2,471 | | | Identiv, Inc. (a) | | | 30,986 | |
| | 832 | | | Insight Enterprises, Inc. (a)(b) | | | 68,565 | |
| | 252 | | | IPG Photonics Corp. (a)(b) | | | 21,256 | |
| | 409 | | | Itron, Inc. (a) | | | 17,223 | |
| | 1,851 | | | Jabil, Inc. | | | 106,821 | |
| | 2,685 | | | Knowles Corp. (a) | | | 32,676 | |
| | 181 | | | Littelfuse, Inc. | | | 35,963 | |
| | 788 | | | Methode Electronics, Inc. (b) | | | 29,274 | |
| | 3,428 | | | Napco Security Technologies, Inc. (a) | | | 99,686 | |
| | 2,266 | | | National Instruments Corp. (b) | | | 85,519 | |
| | 501 | | | Novanta, Inc. - ADR (a) | | | 57,941 | |
| | 364 | | | OSI Systems, Inc. (a) | | | 26,230 | |
| | 926 | | | PC Connection, Inc. | | | 41,753 | |
| | 272 | | | Plexus Corp. (a) | | | 23,816 | |
| | 166 | | | Rogers Corp. (a) | | | 40,152 | |
| | 1,430 | | | Sanmina Corp. (a)(b) | | | 65,894 | |
| | 1,282 | | | ScanSource, Inc. (a) | | | 33,858 | |
| | 726 | | | SYNNEX Corp. (b) | | | 58,944 | |
| | 3,515 | | | TTM Technologies, Inc. (a) | | | 46,328 | |
| | 227 | | | Universal Display Corp. | | | 21,417 | |
| | 2,848 | | | Vishay Intertechnology, Inc. | | | 50,666 | |
| | 2,979 | | | Vontier Corp. (b) | | | 49,779 | |
| | | | | | |
|
|
|
| | | | | | | | 1,575,375 | |
| | | | | | |
|
|
|
| | | | | Energy Equipment & Services - 0.69% | |
| | 3,136 | | | Archrock, Inc. | | | 20,133 | |
| | 1,624 | | | Bristow Group, Inc. (a) | | | 38,148 | |
| | 611 | | | Cactus, Inc. - Class A | | | 23,481 | |
| | 1,730 | | | ChampionX Corp. (b) | | | 33,856 | |
| | 10,332 | | | Helix Energy Solutions Group, Inc. (a) | | | 39,881 | |
| | 736 | | | Helmerich & Payne, Inc. | | | 27,210 | |
| | 346 | | | Nabors Industries, Ltd. - ADR (a) | | | 35,102 | |
| | 5,229 | | | National Energy Services Reunited Corp. - ADR (a) | | | 31,060 | |
See notes to financial statements.
55
GuideMark Small/Mid Cap Core Fund
SCHEDULE OF INVESTMENTS (Continued) (Unaudited)
September 30, 2022
| | | | | | | | |
Number of
Shares
| | | | | Value
| |
| | | | | COMMON STOCKS (Continued) | |
| | | | | Energy Equipment & Services (Continued) | |
| | 11,309 | | | Newpark Resources, Inc. (a) | | $ | 28,499 | |
| | 1,997 | | | NexTier Oilfield Solutions, Inc. (a) | | | 14,778 | |
| | 3,407 | | | NOV, Inc. (b) | | | 55,125 | |
| | 3,036 | | | Oceaneering International, Inc. (a) | | | 24,166 | |
| | 4,821 | | | Oil States International, Inc. (a) | | | 18,754 | |
| | 4,342 | | | Patterson-UTI Energy, Inc. | | | 50,714 | |
| | 4,112 | | | ProPetro Holding Corp. (a) | | | 33,102 | |
| | 9,166 | | | TETRA Technologies, Inc. (a) | | | 32,906 | |
| | 5,080 | | | US Silica Holdings, Inc. (a) | | | 55,626 | |
| | 406 | | | Valaris, Ltd. - ADR (a) | | | 19,870 | |
| | 822 | | | Weatherford International PLC - ADR (a) | | | 26,542 | |
| | | | | | |
|
|
|
| | | | | | | | 608,953 | |
| | | | | | |
|
|
|
| | | | | Entertainment - 0.31% | |
| | 1,777 | | | Liberty Media Corp. - Liberty Formula One - Class C (a)(b) | | | 103,954 | |
| | 9,230 | | | Playstudios, Inc. (a) | | | 32,213 | |
| | 3,749 | | | Playtika Holding Corp. (a)(b) | | | 35,203 | |
| | 15,957 | | | Skillz, Inc. (a) | | | 16,276 | |
| | 2,021 | | | The Marcus Corp. | | | 28,072 | |
| | 853 | | | World Wrestling Entertainment, Inc. - Class A (b) | | | 59,855 | |
| | | | | | |
|
|
|
| | | | | | | | 275,573 | |
| | | | | | |
|
|
|
| | | | | Food & Staples Retailing - 1.76% | |
| | 4,871 | | | Albertsons Cos., Inc. - Class A | | | 121,093 | |
| | 2,977 | | | BJ’s Wholesale Club Holdings, Inc. (a)(b) | | | 216,755 | |
| | 740 | | | Casey’s General Stores, Inc. (b) | | | 149,865 | |
| | 1,608 | | | Grocery Outlet Holding Corp. (a) | | | 53,530 | |
| | 4,122 | | | HF Foods Group, Inc. (a) | | | 15,952 | |
| | 1,257 | | | Ingles Markets, Inc. - Class A | | | 99,567 | |
| | 3,381 | | | Natural Grocers by Vitamin Cottage, Inc. | | | 36,481 | |
| | 3,255 | | | Performance Food Group Co. (a) | | | 139,802 | |
| | 396 | | | PriceSmart, Inc. | | | 22,806 | |
| | 6,432 | | | Rite Aid Corp. (a) | | | 31,839 | |
| | 3,427 | | | SpartanNash Co. (b) | | | 99,452 | |
| | 4,490 | | | Sprouts Farmers Market, Inc. (a)(b) | | | 124,598 | |
| | 1,011 | | | The Andersons, Inc. | | | 31,371 | |
| | 1,091 | | | The Chefs’ Warehouse, Inc. (a) | | | 31,606 | |
| | 2,843 | | | The Fresh Market (a)(c)(e)(f) | | | 0 | |
| | 3,654 | | | United Natural Foods, Inc. (a) | | | 125,588 | |
| | 4,162 | | | US Foods Holding Corp. (a) | | | 110,043 | |
| | 2,516 | | | Village Super Market, Inc. - Class A | | | 48,634 | |
| | 1,221 | | | Weis Markets, Inc. | | | 86,984 | |
| | | | | | |
|
|
|
| | | | | | | | 1,545,966 | |
| | | | | | |
|
|
|
| | | | | Food Products - 0.94% | |
| | 421 | | | Cal-Maine Foods, Inc. | | | 23,403 | |
| | 1,901 | | | Darling International, Inc. (a) | | | 125,751 | |
| | 4,417 | | | Flowers Foods, Inc. | | | 109,056 | |
| | 1,120 | | | Fresh Del Monte Produce, Inc. - ADR | | | 26,029 | |
| | 2,081 | | | Hostess Brands, Inc. (a) | | | 48,362 | |
| | 813 | | | Ingredion, Inc. | | | 65,463 | |
| | 160 | | | J&J Snack Foods Corp. | | | 20,715 | |
| | 383 | | | John B. Sanfilippo & Son, Inc. | | | 29,005 | |
| | 673 | | | Lamb Weston Holdings, Inc. | | | 52,077 | |
| | 242 | | | Lancaster Colony Corp. | | | 36,368 | |
| | 1,107 | | | Pilgrim’s Pride Corp. (a) | | | 25,483 | |
| | 749 | | | Post Holdings, Inc. (a) | | | 61,351 | |
| | 912 | | | Seneca Foods Corp. - Class A (a) | | | 46,001 | |
| | | | | | | | |
Number of
Shares
| | | | | Value
| |
| | | | | Food Products (Continued) | |
| | 929 | | | Simply Good Foods Co. (a) | | $ | 29,719 | |
| | 1,004 | | | The Hain Celestial Group, Inc. (a) | | | 16,947 | |
| | 1,238 | | | TreeHouse Foods, Inc. (a) | | | 52,516 | |
| | 3,411 | | | Vital Farms, Inc. (a) | | | 40,830 | |
| | 3,672 | | | Whole Earth Brands, Inc. (a) | | | 14,100 | |
| | | | | | |
|
|
|
| | | | | | | | 823,176 | |
| | | | | | |
|
|
|
| | | | | Gas Utilities - 0.65% | |
| | 2,005 | | | Brookfield Infrastructure Corp. - Class A - ADR (b) | | | 81,603 | |
| | 4,250 | | | EQT Corp. (b) | | | 173,188 | |
| | 785 | | | National Fuel Gas Co. (b) | | | 48,317 | |
| | 810 | | | New Jersey Resources Corp. | | | 31,347 | |
| | 388 | | | ONE Gas, Inc. | | | 27,311 | |
| | 931 | | | South Jersey Industries, Inc. (b) | | | 31,114 | |
| | 541 | | | Southwest Gas Holdings, Inc. | | | 37,735 | |
| | 344 | | | Spire, Inc. | | | 21,442 | |
| | 3,752 | | | UGI Corp. (b) | | | 121,302 | |
| | | | | | |
|
|
|
| | | | | | | | 573,359 | |
| | | | | | |
|
|
|
| | | | | Health Care Equipment & Supplies - 2.71% | |
| | 3,514 | | | Alphatec Holdings, Inc. (a)(b) | | | 30,712 | |
| | 1,314 | | | AngioDynamics, Inc. (a) | | | 26,885 | |
| | 1,594 | | | Anika Therapeutics, Inc. (a) | | | 37,937 | |
| | 743 | | | AtriCure, Inc. (a) | | | 29,051 | |
| | 1,771 | | | Avanos Medical, Inc. (a) | | | 38,572 | |
| | 216 | | | Axonics, Inc. (a)(b) | | | 15,215 | |
| | 2,571 | | | Cardiovascular Systems, Inc. (a) | | | 35,634 | |
| | 7,600 | | | Cerus Corp. (a)(b) | | | 27,360 | |
| | 304 | | | CONMED Corp. | | | 24,372 | |
| | 2,317 | | | Cutera, Inc. (a)(b) | | | 105,655 | |
| | 2,183 | | | Dentsply Sirona, Inc. | | | 61,888 | |
| | 2,595 | | | Embecta Corp. | | | 74,710 | |
| | 1,120 | | | Enovis Corp. (a) | | | 51,599 | |
| | 2,291 | | | Envista Holdings Corp. (a)(b) | | | 75,168 | |
| | 6,758 | | | Figs, Inc. - Class A (a)(b) | | | 55,754 | |
| | 1,062 | | | Globus Medical, Inc. - Class A (a)(b) | | | 63,263 | |
| | 626 | | | Haemonetics Corp. (a) | | | 46,343 | |
| | 177 | | | ICU Medical, Inc. (a) | | | 26,656 | |
| | 989 | | | Inari Medical, Inc. (a) | | | 71,841 | |
| | 785 | | | Inogen, Inc. (a) | | | 19,060 | |
| | 479 | | | Integer Holdings Corp. (a) | | | 29,808 | |
| | 804 | | | Integra LifeSciences Holdings Corp. (a)(b) | | | 34,058 | |
| | 1,234 | | | iRadimed Corp. | | | 37,094 | |
| | 580 | | | iRhythm Technologies, Inc. (a) | | | 72,663 | |
| | 1,267 | | | Lantheus Holdings, Inc. (a) | | | 89,108 | |
| | 1,238 | | | LeMaitre Vascular, Inc. | | | 62,742 | |
| | 512 | | | LivaNova PLC - ADR (a) | | | 25,994 | |
| | 591 | | | Masimo Corp.(a) | | | 83,426 | |
| | 4,094 | | | Meridian Bioscience, Inc. (a) | | | 129,084 | |
| | 534 | | | Merit Medical Systems, Inc.(a)(b) | | | 30,176 | |
| | 640 | | | Novocure, Ltd. - ADR (a)(b) | | | 48,627 | |
| | 556 | | | NuVasive, Inc. (a) | | | 24,358 | |
| | 2,120 | | | Orthofix Medical, Inc. (a) | | | 40,513 | |
| | 474 | | | Penumbra, Inc. (a)(b) | | | 89,870 | |
| | 463 | | | QuidelOrtho Corp. (a) | | | 33,095 | |
| | 2,448 | | | SeaSpine Holdings Corp. (a) | | | 13,905 | |
| | 620 | | | Shockwave Medical, Inc. (a)(b) | | | 172,403 | |
| | 1,859 | | | SI-BONE, Inc. (a) | | | 32,458 | |
| | 1,248 | | | Silk Road Medical, Inc. (a) | | | 56,160 | |
| | 1,258 | | | STAAR Surgical Co. (a)(b) | | | 88,752 | |
See notes to financial statements.
56
GuideMark Small/Mid Cap Core Fund
SCHEDULE OF INVESTMENTS (Continued) (Unaudited)
September 30, 2022
| | | | | | | | |
Number of
Shares
| | | | | Value
| |
| | | | | COMMON STOCKS (Continued) | |
| | | | | Health Care Equipment & Supplies (Continued) | |
| | 721 | | | SurModics, Inc. (a) | | $ | 21,918 | |
| | 8,842 | | | Tactile Systems Technology, Inc. (a) | | | 68,879 | |
| | 1,260 | | | Tandem Diabetes Care, Inc. (a) | | | 60,291 | |
| | 242 | | | Utah Medical Products, Inc. | | | 20,645 | |
| | 1,893 | | | Varex Imaging Corp. (a) | | | 40,018 | |
| | 6,439 | | | Zynex, Inc. (b) | | | 58,402 | |
| | | | | | |
|
|
|
| | | | | | | | 2,382,122 | |
| | | | | | |
|
|
|
| | | | | Health Care Providers & Services - 2.61% | |
| | 1,618 | | | Acadia Healthcare Co., Inc. (a)(b) | | | 126,495 | |
| | 1,889 | | | AdaptHealth Corp. (a) | | | 35,475 | |
| | 539 | | | Addus HomeCare Corp. (a) | | | 51,334 | |
| | 2,834 | | | AirSculpt Technologies, Inc. | | | 18,223 | |
| | 724 | | | Amedisys, Inc. (a) | | | 70,076 | |
| | 1,381 | | | AMN Healthcare Services, Inc. (a) | | | 146,331 | |
| | 17,348 | | | ATI Physical Therapy, Inc. (a) | | | 17,348 | |
| | 9,615 | | | Aveanna Healthcare Holdings, Inc. (a) | | | 14,423 | |
| | 258 | | | Chemed Corp. (b) | | | 112,633 | |
| | 356 | | | CorVel Corp. (a) | | | 49,281 | |
| | 2,025 | | | Covetrus, Inc. (a) | | | 42,282 | |
| | 5,262 | | | Cross Country Healthcare, Inc. (a) | | | 149,283 | |
| | 690 | | | DaVita, Inc. (a)(b) | | | 57,111 | |
| | 804 | | | Encompass Health Corp. | | | 36,365 | |
| | 1,010 | | | Enhabit, Inc. (a) | | | 14,180 | |
| | 1,980 | | | Fulgent Genetics, Inc. (a)(b) | | | 75,478 | |
| | 1,911 | | | Hanger Orthopedic Group, Inc. (a) | | | 35,774 | |
| | 553 | | | HealthEquity, Inc. (a)(b) | | | 37,145 | |
| | 2,936 | | | Henry Schein, Inc. (a) | | | 193,101 | |
| | 14,417 | | | Innovage Holding Corp. (a)(b) | | | 84,772 | |
| | 437 | | | LHC Group, Inc. (a) | | | 71,519 | |
| | 491 | | | ModivCare, Inc. (a) | | | 48,943 | |
| | 707 | | | National HealthCare Corp. | | | 44,781 | |
| | 1,573 | | | National Research Corp. | | | 62,605 | |
| | 2,400 | | | Option Care Health, Inc. (a) | | | 75,528 | |
| | 2,590 | | | Owens & Minor, Inc. (b) | | | 62,419 | |
| | 2,306 | | | Patterson Cos., Inc. | | | 55,390 | |
| | 2,348 | | | Pediatrix Medical Group, Inc. (a) | | | 38,766 | |
| | 1,110 | | | PetIQ, Inc. (a) | | | 7,659 | |
| | 1,671 | | | Premier, Inc. - Class A | | | 56,714 | |
| | 671 | | | Progyny, Inc. (a)(b) | | | 24,867 | |
| | 955 | | | R1 RCM, Inc. (a) | | | 17,696 | |
| | 730 | | | Select Medical Holdings Corp. | | | 16,133 | |
| | 926 | | | Surgery Partners, Inc. (a)(b) | | | 21,668 | |
| | 1,777 | | | Tenet Healthcare Corp. (a) | | | 91,658 | |
| | 898 | | | The Ensign Group, Inc. | | | 71,391 | |
| | 3,292 | | | The Joint Corp. (a) | | | 51,717 | |
| | 995 | | | Universal Health Services, Inc. - Class B (b) | | | 87,739 | |
| | 245 | | | US Physical Therapy, Inc. | | | 18,625 | |
| | | | | | |
|
|
|
| | | | | | | | 2,292,928 | |
| | | | | | |
|
|
|
| | | | | Health Care Technology - 0.74% | |
| | 3,872 | | | Allscripts Healthcare Solutions, Inc. (a)(b) | | | 58,971 | |
| | 3,939 | | | Change Healthcare, Inc. (a)(b) | | | 108,283 | |
| | 1,866 | | | Computer Programs & Systems, Inc. (a) | | | 52,024 | |
| | 1,153 | | | Convey Health Solutions Holdings, Inc. (a) | | | 12,118 | |
| | 1,621 | | | Evolent Health, Inc. - Class A (a) | | | 58,242 | |
| | 1,709 | | | HealthStream, Inc. (a) | | | 36,333 | |
| | 477 | | | Inspire Medical Systems, Inc. (a) | | | 84,605 | |
| | 16,353 | | | Multiplan Corp. (a) | | | 46,770 | |
| | 6,097 | | | NextGen Healthcare, Inc. (a) | | | 107,917 | |
| | | | | | | | |
Number of
Shares
| | | | | Value
| |
| | | | | Health Care Technology (Continued) | |
| | 419 | | | Omnicell, Inc. (a) | | $ | 36,466 | |
| | 2,115 | | | Teladoc Health, Inc. (a)(b) | | | 53,615 | |
| | | | | | |
|
|
|
| | | | | | | | 655,344 | |
| | | | | | |
|
|
|
| | | | | Hotels, Restaurants & Leisure - 1.66% | |
| | 1,237 | | | Aramark | | | 38,594 | |
| | 327 | | | Biglari Holdings, Inc. - Class B (a) | | | 37,801 | |
| | 731 | | | BJ’s Restaurants, Inc. (a) | | | 17,434 | |
| | 1,792 | | | Bloomin’ Brands, Inc. (b) | | | 32,847 | |
| | 1,821 | | | Bluegreen Vacations Holding Corp. | | | 30,083 | |
| | 1,258 | | | Boyd Gaming Corp. (b) | | | 59,944 | |
| | 729 | | | Brinker International, Inc. (a) | | | 18,210 | |
| | 627 | | | Callaway Golf Co. (a)(b) | | | 12,076 | |
| | 2,494 | | | Century Casinos, Inc. (a) | | | 16,361 | |
| | 478 | | | Choice Hotels International, Inc. | | | 52,351 | |
| | 203 | | | Churchill Downs, Inc. | | | 37,383 | |
| | 1,016 | | | Chuy’s Holdings, Inc. (a) | | | 23,551 | |
| | 256 | | | Cracker Barrel Old Country Store, Inc. (b) | | | 23,701 | |
| | 1,072 | | | Dave & Buster’s Entertainment, Inc. (a)(b) | | | 33,264 | |
| | 422 | | | Dine Brands Global, Inc. (b) | | | 26,822 | |
| | 2,776 | | | El Pollo Loco Holdings, Inc. (a) | | | 24,762 | |
| | 1,453 | | | Everi Holdings, Inc. (a) | | | 23,568 | |
| | 1,239 | | | Hilton Grand Vacations, Inc. (a) | | | 40,751 | |
| | 464 | | | Hyatt Hotels Corp. - Class A (a) | | | 37,565 | |
| | 3,157 | | | Inspired Entertainment, Inc. (a) | | | 27,876 | |
| | 3,100 | | | International Game Technology PLC | | | 48,980 | |
| | 564 | | | Kura Sushi USA, Inc. - Class A (a) | | | 41,499 | |
| | 1,433 | | | Light & Wonder, Inc. (a) | | | 61,447 | |
| | 597 | | | Marriott Vacations Worldwide Corp. (b) | | | 72,750 | |
| | 618 | | | Papa John’s International, Inc. | | | 43,266 | |
| | 1,832 | | | Penn National Gaming, Inc. (a)(b) | | | 50,398 | |
| | 406 | | | Planet Fitness, Inc. - Class A (a) | | | 23,410 | |
| | 623 | | | RCI Hospitality Holdings, Inc. | | | 40,707 | |
| | 710 | | | Red Rock Resorts, Inc. - Class A | | | 24,325 | |
| | 1,474 | | | Ruth’s Hospitality Group, Inc. | | | 24,852 | |
| | 777 | | | SeaWorld Entertainment, Inc. (a) | | | 35,361 | |
| | 9,220 | | | Target Hospitality Corp. (a) | | | 116,356 | |
| | 563 | | | Texas Roadhouse, Inc. | | | 49,127 | |
| | 3,028 | | | The ONE Group Hospitality, Inc. (a) | | | 20,106 | |
| | 790 | | | Travel + Leisure Co. | | | 26,955 | |
| | 226 | | | Vail Resorts, Inc. | | | 48,735 | |
| | 614 | | | Wingstop, Inc. | | | 77,008 | |
| | 689 | | | Wyndham Hotels & Resorts Inc. (b) | | | 42,270 | |
| | | | | | |
|
|
|
| | | | | | | | 1,462,496 | |
| | | | | | |
|
|
|
| | | | | Household Durables - 1.77% | |
| | 10,784 | | | Aterian, Inc. (a)(b) | | | 13,372 | |
| | 1,900 | | | Beazer Homes USA, Inc. (a) | | | 18,373 | |
| | 207 | | | Cavco Industries, Inc. (a)(b) | | | 42,592 | |
| | 692 | | | Century Communities, Inc. | | | 29,604 | |
| | 2,485 | | | Ethan Allen Interiors, Inc. | | | 52,533 | |
| | 6,318 | | | GoPro, Inc. - Class A (a) | | | 31,148 | |
| | 2,156 | | | Green Brick Partners, Inc. (a) | | | 46,095 | |
| | 358 | | | Helen of Troy, Ltd. - ADR (a) | | | 34,526 | |
| | 629 | | | Hovnanian Enterprises, Inc. - Class A (a) | | | 22,455 | |
| | 549 | | | Installed Building Products, Inc. | | | 44,463 | |
| | 932 | | | iRobot Corp. (a) | | | 52,500 | |
| | 799 | | | KB Home | | | 20,710 | |
| | 5,380 | | | Landsea Homes Corp. (a) | | | 25,663 | |
| | 2,098 | | | La-Z-Boy, Inc. (b) | | | 47,352 | |
| | 716 | | | Leggett & Platt, Inc. (b) | | | 23,785 | |
See notes to financial statements.
57
GuideMark Small/Mid Cap Core Fund
SCHEDULE OF INVESTMENTS (Continued) (Unaudited)
September 30, 2022
| | | | | | | | |
Number of
Shares
| | | | | Value
| |
| | | | | COMMON STOCKS (Continued) | |
| | | | | Household Durables (Continued) | |
| | 346 | | | LGI Homes, Inc. (a)(b) | | $ | 28,154 | |
| | 3,627 | | | Lifetime Brands, Inc. | | | 24,555 | |
| | 1,726 | | | Lovesac Co. (a) | | | 35,176 | |
| | 840 | | | M/I Homes, Inc. (a) | | | 30,433 | |
| | 563 | | | Meritage Homes Corp. (a) | | | 39,562 | |
| | 686 | | | Mohawk Industries, Inc. (a)(b) | | | 62,556 | |
| | 4,029 | | | Newell Rubbermaid, Inc. (b) | | | 55,963 | |
| | 3,826 | | | PulteGroup, Inc. (b) | | | 143,475 | |
| | 4,884 | | | Purple Innovation, Inc. (a) | | | 19,780 | |
| | 1,396 | | | Skyline Champion Corp. (a) | | | 73,806 | |
| | 2,136 | | | Snap One Holdings Corp. (a) | | | 21,659 | |
| | 3,326 | | | Sonos, Inc. (a) | | | 46,231 | |
| | 2,661 | | | Taylor Morrison Home Corp. (a) | | | 62,055 | |
| | 3,862 | | | Tempur Sealy International, Inc. (b) | | | 93,229 | |
| | 1,872 | | | Toll Brothers, Inc. (b) | | | 78,624 | |
| | 452 | | | TopBuild Corp. (a) | | | 74,481 | |
| | 4,096 | | | Traeger, Inc. (a) | | | 11,551 | |
| | 3,387 | | | TRI Pointe Group, Inc. (a) | | | 51,178 | |
| | 6,168 | | | Tupperware Brands Corp. (a) | | | 40,400 | |
| | 2,153 | | | Turtle Beach Corp. (a) | | | 14,683 | |
| | 1,264 | | | Universal Electronics, Inc. (a) | | | 24,863 | |
| | 3,221 | | | Weber, Inc. - Class A (b) | | | 21,162 | |
| | | | | | |
|
|
|
| | | | | | | | 1,558,747 | |
| | | | | | |
|
|
|
| | | | | Household Products - 0.17% | |
| | 537 | | | Central Garden & Pet Co. (a) | | | 19,354 | |
| | 890 | | | Central Garden & Pet Co. - Class A (a) | | | 30,402 | |
| | 649 | | | Spectrum Brands Holdings, Inc. | | | 25,330 | |
| | 438 | | | WD-40 Co. | | | 76,974 | |
| | | | | | |
|
|
|
| | | | | | | | 152,060 | |
| | | | | | |
|
|
|
| | | | | Independent Power and Renewable Electricity Producers - 0.59% | |
| | 480 | | | Brookfield Renewable Corp. - Class A - ADR | | | 15,687 | |
| | 2,339 | | | Clearway Energy, Inc. - Class A | | | 68,065 | |
| | 2,378 | | | Clearway Energy, Inc. - Class C | | | 75,739 | |
| | 5,168 | | | NRG Energy, Inc. | | | 197,779 | |
| | 399 | | | Ormat Technologies, Inc. (b) | | | 34,394 | |
| | 6,074 | | | Vistra Energy Corp. | | | 127,554 | |
| | | | | | |
|
|
|
| | | | | | | | 519,218 | |
| | | | | | |
|
|
|
| | | | | Industrial Conglomerates - 0.36% | |
| | 567 | | | Carlisle Companies, Inc. | | | 158,992 | |
| | 1,299 | | | Otter Tail Corp. | | | 79,915 | |
| | 8 | | | Seaboard Corp. | | | 27,221 | |
| | 343 | | | Standex International Corp. | | | 28,006 | |
| | 2,129 | | | Tredegar Corp. | | | 20,098 | |
| | | | | | |
|
|
|
| | | | | | | | 314,232 | |
| | | | | | |
|
|
|
| | | | | Insurance - 3.30% | |
| | 166 | | | Alleghany Corp. (a) | | | 139,336 | |
| | 2,669 | | | American Equity Investment Life Holding Co. | | | 99,527 | |
| | 1,435 | | | American Financial Group, Inc. | | | 176,405 | |
| | 619 | | | AMERISAFE, Inc. | | | 28,926 | |
| | 619 | | | Argo Group International Holdings, Ltd. - ADR | | | 11,922 | |
| | 683 | | | Assurant, Inc. | | | 99,219 | |
| | 1,300 | | | Assured Guaranty, Ltd. - ADR | | | 62,985 | |
| | 1,392 | | | Axis Capital Holdings, Ltd. - ADR | | | 68,417 | |
| | 1,726 | | | Brighthouse Financial, Inc. (a) | | | 74,943 | |
| | 3,370 | | | Brown & Brown, Inc. | | | 203,818 | |
| | | | | | | | |
Number of
Shares
| | | | | Value
| |
| | | | | Insurance (Continued) | |
| | 2,228 | | | CNO Financial Group, Inc. | | $ | 40,037 | |
| | 3,215 | | | Crawford & Co. - Class A | | | 18,454 | |
| | 2,200 | | | Donegal Group, Inc. - Class A | | | 29,678 | |
| | 662 | | | Employers Holdings, Inc. | | | 22,832 | |
| | 419 | | | Erie Indemnity Co. - Class A | | | 93,148 | |
| | 545 | | | Everest Re Group, Ltd. - ADR | | | 143,030 | |
| | 2,393 | | | First American Financial Corp. | | | 110,317 | |
| | 11,950 | | | Genworth Financial, Inc. - Class A (a) | | | 41,825 | |
| | 1,159 | | | Globe Life, Inc. (b) | | | 115,552 | |
| | 3,853 | | | Greenlight Capital RE, Ltd. - Class A - ADR (a) | | | 28,666 | |
| | 852 | | | Horace Mann Educators Corp. | | | 30,067 | |
| | 249 | | | Investors Title Co. | | | 35,109 | |
| | 326 | | | Kemper Corp. | | | 13,451 | |
| | 376 | | | Kinsale Capital Group, Inc. (b) | | | 96,038 | |
| | 1,729 | | | Lincoln National Corp. | | | 75,920 | |
| | 4,760 | | | MBIA, Inc. (a) | | | 43,792 | |
| | 132 | | | National Western Life Group, Inc. - Class A | | | 22,546 | |
| | 6,325 | | | Old Republic International Corp. | | | 132,382 | |
| | 709 | | | Primerica, Inc. | | | 87,526 | |
| | 946 | | | ProAssurance Corp. | | | 18,457 | |
| | 908 | | | Reinsurance Group of America, Inc. | | | 114,236 | |
| | 354 | | | RenaissanceRe Holdings, Ltd. - ADR | | | 49,698 | |
| | 564 | | | RLI Corp. | | | 57,742 | |
| | 1,009 | | | Ryan Specialty Holdings, Inc. (a) | | | 40,986 | |
| | 338 | | | Safety Insurance Group, Inc. | | | 27,567 | |
| | 885 | | | Selective Insurance Group, Inc. (b) | | | 72,039 | |
| | 1,050 | | | Stewart Information Services Corp. | | | 45,822 | |
| | 699 | | | The Hanover Insurance Group, Inc. (b) | | | 89,570 | |
| | 4,162 | | | Tiptree, Inc. | | | 44,783 | |
| | 2,820 | | | Trean Insurance Group, Inc. (a) | | | 9,588 | |
| | 757 | | | United Fire Group, Inc. | | | 21,749 | |
| | 2,164 | | | Universal Insurance Holdings, Inc. | | | 21,315 | |
| | 3,133 | | | Unum Group | | | 121,560 | |
| | 15 | | | White Mountains Insurance Group, Ltd. - ADR | | | 19,545 | |
| | | | | | |
|
|
|
| | | | | | | | 2,900,525 | |
| | | | | | |
|
|
|
| | | | | Interactive Media & Services - 0.51% | |
| | 2,647 | | | Arena Group Holdings, Inc. (a) | | | 34,676 | |
| | 3,229 | | | Cargurus, Inc. (a) | | | 45,755 | |
| | 5,388 | | | Cars.com, Inc. (a) | | | 61,962 | |
| | 5,208 | | | DHI Group, Inc. (a) | | | 28,019 | |
| | 4,765 | | | EverQuote, Inc. - Class A (a) | | | 32,497 | |
| | 1,795 | | | MediaAlpha, Inc. - Class A (a) | | | 15,706 | |
| | 1,981 | | | QuinStreet, Inc. (a) | | | 20,800 | |
| | 1,765 | | | TripAdvisor, Inc. (a)(b) | | | 38,971 | |
| | 18,058 | | | TrueCar, Inc. (a) | | | 27,268 | |
| | 2,787 | | | Yelp, Inc. (a)(b) | | | 94,507 | |
| | 1,698 | | | Zillow Group, Inc. - Class C (a) | | | 48,580 | |
| | | | | | |
|
|
|
| | | | | | | | 448,741 | |
| | | | | | |
|
|
|
| | | | | Internet & Direct Marketing Retail - 0.71% | |
| | 5,674 | | | 1-800-Flowers.com, Inc. - Class A (a) | | | 36,824 | |
| | 21,574 | | | aka Brands Holding Corp. (a) | | | 31,282 | |
| | 26,633 | | | Boxed, Inc. (a)(b) | | | 24,556 | |
| | 7,464 | | | CarParts.com, Inc. (a) | | | 38,589 | |
| | 20,138 | | | ContextLogic, Inc. - Class A (a) | | | 14,779 | |
| | 6,393 | | | Duluth Holdings, Inc. - Class B (a) | | | 45,007 | |
| | 4,130 | | | Groupon, Inc. (a)(b) | | | 32,875 | |
| | 3,825 | | | Lands’ End, Inc. (a) | | | 29,529 | |
| | 3,945 | | | Lulu’s Fashion Lounge Holdings, Inc. (a) | | | 18,384 | |
See notes to financial statements.
58
GuideMark Small/Mid Cap Core Fund
SCHEDULE OF INVESTMENTS (Continued) (Unaudited)
September 30, 2022
| | | | | | | | |
Number of
Shares
| | | | | Value
| |
| | | | | COMMON STOCKS (Continued) | |
| | | | | Internet & Direct Marketing Retail (Continued) | |
| | 1,348 | | | PetMed Express, Inc. (b) | | $ | 26,313 | |
| | 8,052 | | | Quotient Technology, Inc. (a) | | | 18,600 | |
| | 8,880 | | | Qurate Retail, Inc. - Series A | | | 17,849 | |
| | 1,742 | | | Revolve Group, Inc. - Class A (a)(b) | | | 37,784 | |
| | 931 | | | Shutterstock, Inc. (b) | | | 46,708 | |
| | 9,554 | | | Stitch Fix, Inc. - Class A (a) | | | 37,738 | |
| | 15,128 | | | The RealReal, Inc. (a) | | | 22,692 | |
| | 3,235 | | | Vivid Seats, Inc. - Class A (b) | | | 24,780 | |
| | 1,239 | | | Wayfair, Inc. - Class A (a)(b) | | | 40,330 | |
| | 1,336 | | | Xometry, Inc. - Class A (a) | | | 75,871 | |
| | | | | | |
|
|
|
| | | | | | | | 620,490 | |
| | | | | | |
|
|
|
| | | | | Internet Software & Services - 0.08% | |
| | 6,885 | | | Benefitfocus, Inc. (a) | | | 43,720 | |
| | 1,558 | | | Liquidity Services, Inc. (a) | | | 25,333 | |
| | | | | | |
|
|
|
| | | | | | | | 69,053 | |
| | | | | | |
|
|
|
| | | | | IT Services - 3.24% | |
| | 2,210 | | | Amdocs, Ltd. - ADR | | | 175,584 | |
| | 1,286 | | | Black Knight, Inc. (a) | | | 83,243 | |
| | 2,269 | | | Booz Allen Hamilton Holding Corp. | | | 209,542 | |
| | 1,847 | | | Bread Financial Holdings, Inc. | | | 58,088 | |
| | 9,511 | | | Brightcove, Inc. (a) | | | 59,919 | |
| | 529 | | | CACI International, Inc. - Class A (a) | | | 138,101 | |
| | 1,526 | | | Cass Information Systems, Inc. | | | 52,937 | |
| | 1,007 | | | Concentrix Corp. | | | 112,411 | |
| | 15,110 | | | Conduent, Inc. (a) | | | 50,467 | |
| | 21,023 | | | Core Scientific, Inc. (a)(b) | | | 27,330 | |
| | 1,962 | | | CSG Systems International, Inc. | | | 103,751 | |
| | 409 | | | DigitalOcean Holdings, Inc. (a)(b) | | | 14,794 | |
| | 4,207 | | | DXC Technology Co. (a) | | | 102,987 | |
| | 639 | | | Euronet Worldwide, Inc. (a) | | | 48,411 | |
| | 1,046 | | | EVERTEC, Inc. - ADR | | | 32,792 | |
| | 1,301 | | | Evo Payments, Inc. - Class A (a) | | | 43,323 | |
| | 745 | | | ExlService Holdings, Inc. - Class A (a)(b) | | | 109,783 | |
| | 3,389 | | | Genpact, Ltd. - ADR | | | 148,337 | |
| | 2,713 | | | Gogo, Inc. (a) | | | 32,882 | |
| | 1,738 | | | Grid Dynamics Holdings, Inc. (a) | | | 32,553 | |
| | 2,765 | | | I3 Verticals, Inc. - Class A (a) | | | 55,383 | |
| | 3,989 | | | IBEX Holdings, Ltd. - ADR (a) | | | 74,076 | |
| | 14,346 | | | Information Services Group, Inc. | | | 68,287 | |
| | 2,102 | | | International Money Express, Inc. (a) | | | 47,905 | |
| | 2,572 | | | LiveRamp Holdings, Inc. (a) | | | 46,708 | |
| | 1,551 | | | Maximus, Inc. (b) | | | 89,756 | |
| | 2,190 | | | MoneyGram International, Inc. (a) | | | 22,776 | |
| | 33,696 | | | Paysafe, Ltd. - ADR (a) | | | 46,500 | |
| | 1,704 | | | Perficient, Inc. (a) | | | 110,794 | |
| | 2,388 | | | Priority Technology Holdings, Inc. (a) | | | 10,770 | |
| | 10,940 | | | Rackspace Technology, Inc. (a)(b) | | | 44,635 | |
| | 6,220 | | | Repay Holdings Corp. (a) | | | 43,913 | |
| | 578 | | | Science Applications International Corp. | | | 51,113 | |
| | 447 | | | Shift4 Payments, Inc. - Class A (a) | | | 19,941 | |
| | 2,715 | | | SolarWinds Corp. (a) | | | 21,041 | |
| | 1,732 | | | Squarespace, Inc. - Class A (a)(b) | | | 36,996 | |
| | 8,040 | | | StoneCo, Ltd. - Class A - ADR (a) | | | 76,621 | |
| | 1,314 | | | Switch, Inc. - Class A (b) | | | 44,269 | |
| | 4,254 | | | The Hackett Group, Inc. | | | 75,381 | |
| | 4,937 | | | The Western Union Co. | | | 66,649 | |
| | 840 | | | TTEC Holdings, Inc. | | | 37,220 | |
| | 3,906 | | | Unisys Corp. (a) | | | 29,490 | |
| | | | | | | | |
Number of
Shares
| | | | | Value
| |
| | | | | IT Services (Continued) | |
| | 2,139 | | | Verra Mobility Corp. (a) | | $ | 32,876 | |
| | 217 | | | WEX, Inc. (a) | | | 27,546 | |
| | 420 | | | Wix.com, Ltd. - ADR (a) | | | 32,857 | |
| | | | | | |
|
|
|
| | | | | | | | 2,850,738 | |
| | | | | | |
|
|
|
| | | | | Leisure Products - 1.06% | |
| | 1,131 | | | Acushnet Holdings Corp. | | | 49,187 | |
| | 1,380 | | | Brunswick Corp. | | | 90,321 | |
| | 1,230 | | | Clarus Corp. (b) | | | 16,568 | |
| | 1,750 | | | Hayward Holdings, Inc. (a) | | | 15,523 | |
| | 509 | | | Johnson Outdoors, Inc. - Class A | | | 26,117 | |
| | 2,975 | | | Latham Group, Inc. (a) | | | 10,680 | |
| | 856 | | | Malibu Boats, Inc. - Class A (a) | | | 41,080 | |
| | 2,765 | | | Marine Products Corp. | | | 23,392 | |
| | 2,894 | | | MasterCraft Boat Holdings, Inc. (a) | | | 54,552 | |
| | 6,336 | | | Mattel, Inc. (a)(b) | | | 120,004 | |
| | 1,002 | | | Polaris Industries, Inc. (b) | | | 95,841 | |
| | 611 | | | Pool Corp. (b) | | | 194,426 | |
| | 3,842 | | | Smith & Wesson Brands, Inc. | | | 39,842 | |
| | 3,865 | | | Solo Brands, Inc. - Class A (a) | | | 14,687 | |
| | 817 | | | Sturm, Ruger & Co., Inc. (b) | | | 41,495 | |
| | 2,451 | | | Vista Outdoor, Inc. (a)(b) | | | 59,608 | |
| | 1,459 | | | YETI Holdings, Inc. (a)(b) | | | 41,611 | |
| | | | | | |
|
|
|
| | | | | | | | 934,934 | |
| | | | | | |
|
|
|
| | | | | Life Sciences Tools & Services - 0.90% | |
| | 936 | | | 10X Genomics, Inc. - Class A (a) | | | 26,657 | |
| | 5,266 | | | AbCellera Biologics, Inc. - ADR (a) | | | 52,081 | |
| | 512 | | | Bio-Techne Corp. | | | 145,408 | |
| | 1,583 | | | Bruker Corp. | | | 83,994 | |
| | 503 | | | Charles River Laboratories International, Inc. (a) | | | 98,990 | |
| | 2,411 | | | Inotiv, Inc. (a) | | | 40,625 | |
| | 1,873 | | | Maravai LifeSciences Holdings, Inc. - Class A (a) | | | 47,818 | |
| | 517 | | | Medpace holdings, Inc. (a)(b) | | | 81,257 | |
| | 3,173 | | | QIAGEN NV - ADR (a) | | | 130,982 | |
| | 1,706 | | | Syneos Health, Inc. (a) | | | 80,438 | |
| | | | | | |
|
|
|
| | | | | | | | 788,250 | |
| | | | | | |
|
|
|
| | | | | Machinery - 3.22% | |
| | 1,016 | | | AGCO Corp. | | | 97,709 | |
| | 225 | | | Alamo Group, Inc. | | | 27,511 | |
| | 409 | | | Albany International Corp. - Class A (b) | | | 32,242 | |
| | 1,469 | | | Allison Transmission Holdings, Inc. | | | 49,593 | |
| | 1,361 | | | Altra Industrial Motion Corp. | | | 45,757 | |
| | 506 | | | Astec Industries, Inc. | | | 15,782 | |
| | 525 | | | Badger Meter, Inc. | | | 48,505 | |
| | 840 | | | Barnes Group, Inc. | | | 24,259 | |
| | 260 | | | Chart Industries, Inc. (a)(b) | | | 47,931 | |
| | 1,868 | | | CIRCOR International, Inc. (a) | | | 30,803 | |
| | 1,262 | | | Columbus McKinnon Corp. | | | 33,014 | |
| | 734 | | | Crane Holdings Co. | | | 64,254 | |
| | 1,705 | | | Donaldson Co., Inc. | | | 83,562 | |
| | 2,190 | | | Energy Recovery, Inc. (a) | | | 47,611 | |
| | 547 | | | EnPro Industries, Inc. | | | 46,484 | |
| | 1,166 | | | Esab Corp. | | | 38,898 | |
| | 272 | | | ESCO Technologies, Inc. | | | 19,976 | |
| | 1,477 | | | Evoqua Water Technologies Corp. (a) | | | 48,844 | |
| | 8,956 | | | Fathom Digital Manufacturing Corp. (a) | | | 18,181 | |
| | 753 | | | Federal Signal Corp. (b) | | | 28,102 | |
| | 1,122 | | | Flowserve Corp. | | | 27,265 | |
See notes to financial statements.
59
GuideMark Small/Mid Cap Core Fund
SCHEDULE OF INVESTMENTS (Continued) (Unaudited)
September 30, 2022
| | | | | | | | |
Number of
Shares
| | | | | Value
| |
| | | | | COMMON STOCKS (Continued) | |
| | | | | Machinery (Continued) | |
| | 3,275 | | | Gates Industrial Corp PLC - ADR (a) | | $ | 31,964 | |
| | 2,320 | | | Graco, Inc. | | | 139,084 | |
| | 417 | | | Helios Technologies, Inc. | | | 21,100 | |
| | 640 | | | ITT, Inc. | | | 41,818 | |
| | 449 | | | John Bean Technologies Corp. | | | 38,614 | |
| | 293 | | | Kadant, Inc. | | | 48,875 | |
| | 1,046 | | | Kennametal, Inc. | | | 21,527 | |
| | 10,029 | | | Lightning eMotors, Inc. (a)(b) | | | 15,545 | |
| | 866 | | | Lincoln Electric Holdings, Inc. | | | 108,874 | |
| | 154 | | | Lindsay Corp. | | | 22,065 | |
| | 2,175 | | | Mueller Industries, Inc. (b) | | | 129,282 | |
| | 1,838 | | | Mueller Water Products, Inc. - Class A | | | 18,876 | |
| | 803 | | | Nordson Corp. | | | 170,453 | |
| | 577 | | | Omega Flex, Inc. | | | 53,442 | |
| | 905 | | | Oshkosh Corp. | | | 63,612 | |
| | 2,170 | | | Pentair PLC - ADR | | | 88,167 | |
| | 770 | | | Proto Labs, Inc. (a) | | | 28,051 | |
| | 143 | | | RBC Bearings, Inc. (a)(b) | | | 29,717 | |
| | 3,472 | | | REV Group, Inc. | | | 38,296 | |
| | 1,026 | | | Snap-on, Inc. (b) | | | 206,585 | |
| | 626 | | | SPX Technologies, Inc. (a) | | | 34,568 | |
| | 591 | | | Tennant Co. | | | 33,427 | |
| | 1,521 | | | Terex Corp. | | | 45,235 | |
| | 3,275 | | | The Manitowoc Co., Inc. (a) | | | 25,381 | |
| | 475 | | | The Middleby Corp. (a) | | | 60,881 | |
| | 2,159 | | | The Shyft Group Inc (b) | | | 44,108 | |
| | 859 | | | The Timken Co. | | | 50,715 | |
| | 1,609 | | | The Toro Co. (b) | | | 139,146 | |
| | 2,756 | | | Titan International, Inc. (a) | | | 33,458 | |
| | 1,035 | | | TriMas Corp. | | | 25,947 | |
| | 250 | | | Valmont Industries, Inc. | | | 67,155 | |
| | 1,200 | | | Wabash National Corp. (b) | | | 18,672 | |
| | 510 | | | Watts Water Technologies, Inc. - Class A | | | 64,122 | |
| | | | | | |
|
|
|
| | | | | | | | 2,835,045 | |
| | | | | | |
|
|
|
| | | | | Marine - 0.27% | |
| | 882 | | | Eagle Bulk Shipping, Inc. - ADR (b) | | | 38,085 | |
| | 2,455 | | | Genco Shipping & Trading, Ltd. - ADR | | | 30,761 | |
| | 1,577 | | | Golden Ocean Group, Ltd. - ADR | | | 11,780 | |
| | 747 | | | Kirby Corp. (a)(b) | | | 45,395 | |
| | 1,003 | | | Matson, Inc. | | | 61,705 | |
| | 9,051 | | | Safe Bulkers, Inc. - ADR | | | 22,356 | |
| | 2,752 | | | SFL Corp., Ltd. - ADR | | | 25,071 | |
| | | | | | |
|
|
|
| | | | | | | | 235,153 | |
| | | | | | |
|
|
|
| | | | | Media - 1.08% | |
| | 5,242 | | | Advantage Solutions, Inc. (a) | | | 11,166 | |
| | 954 | | | AMC Networks, Inc. - Class A (a) | | | 19,366 | |
| | 7,233 | | | Entravision Communications Corp. - Class A | | | 28,715 | |
| | 11,078 | | | Gannett Co, Inc. (a) | | | 16,949 | |
| | 2,271 | | | Gray Television, Inc. | | | 32,521 | |
| | 2,219 | | | iHeartMedia, Inc. - Class A (a) | | | 16,265 | |
| | 870 | | | John Wiley & Sons, Inc. - Class A | | | 32,677 | |
| | 4,323 | | | Liberty Latin America, Ltd. - Class A - ADR (a) | | | 26,759 | |
| | 2,759 | | | Liberty Latin America, Ltd. - Class C - ADR (a) | | | 16,968 | |
| | 393 | | | Liberty Media Group - Class A (a) | | | 20,640 | |
| | 5,686 | | | News Corp. - Class A | | | 85,916 | |
| | 2,667 | | | News Corp. - Class B (b) | | | 41,125 | |
| | 609 | | | Nexstar Media Group, Inc. (b) | | | 101,612 | |
| | 1,467 | | | Scholastic Corp. | | | 45,125 | |
| | | | | | | | |
Number of
Shares
| | | | | Value
| |
| | | | | Media (Continued) | |
| | 1,227 | | | Sinclair Broadcast Group, Inc. - Class A | | $ | 22,196 | |
| | 726 | | | TechTarget, Inc. (a) | | | 42,979 | |
| | 3,522 | | | TEGNA, Inc. | | | 72,835 | |
| | 2,882 | | | The E.W. Scripps Co. - Class A (a) | | | 32,480 | |
| | 5,323 | | | The Interpublic Group of Companies, Inc. | | | 136,269 | |
| | 2,099 | | | The New York Times Co. - Class A | | | 60,346 | |
| | 2,391 | | | Thryv Holdings, Inc. (a) | | | 54,587 | |
| | 688 | | | Value Line, Inc. | | | 30,203 | |
| | | | | | |
|
|
|
| | | | | | | | 947,699 | |
| | | | | | |
|
|
|
| | | | | Metals & Mining - 1.79% | |
| | 2,708 | | | Alcoa Corp. | | | 91,151 | |
| | 539 | | | Alpha Metallurgical Resources, Inc. (b) | | | 73,757 | |
| | 1,212 | | | ATI Inc. (a)(b) | | | 32,251 | |
| | 8,770 | | | Cleveland-Cliffs, Inc. (a)(b) | | | 118,132 | |
| | 2,114 | | | Commercial Metals Co. | | | 75,005 | |
| | 1,797 | | | Constellium SE - ADR (a) | | | 18,221 | |
| | 503 | | | Gibraltar Industries, Inc. (a) | | | 20,588 | |
| | 693 | | | Haynes International, Inc. | | | 24,338 | |
| | 5,106 | | | Hecla Mining Co. | | | 20,118 | |
| | 262 | | | Kaiser Aluminum Corp. | | | 16,074 | |
| | 305 | | | Materion Corp. | | | 24,400 | |
| | 806 | | | MP Materials Corp. (a) | | | 22,004 | |
| | 2,390 | | | Olympic Steel, Inc. | | | 54,516 | |
| | 1,307 | | | Reliance Steel & Aluminum Co. | | | 227,954 | |
| | 271 | | | Royal Gold, Inc. | | | 25,425 | |
| | 4,713 | | | Ryerson Holding Corp. | | | 121,313 | |
| | 1,101 | | | Schnitzer Steel Industries, Inc. - Class A | | | 31,334 | |
| | 1,870 | | | SSR Mining, Inc. - ADR | | | 27,508 | |
| | 3,701 | | | Steel Dynamics, Inc. (b) | | | 262,586 | |
| | 6,980 | | | SunCoke Energy, Inc. | | | 40,554 | |
| | 4,206 | | | TimkenSteel Corp. (a)(b) | | | 63,048 | |
| | 5,843 | | | United States Steel Corp. (b) | | | 105,875 | |
| | 2,494 | | | Warrior Met Coal, Inc. | | | 70,929 | |
| | 259 | | | Worthington Industries, Inc. | | | 9,878 | |
| | | | | | |
|
|
|
| | | | | | | | 1,576,959 | |
| | | | | | |
|
|
|
| | | | | Multiline Retail - 0.60% | |
| | 1,756 | | | Big Lots, Inc. | | | 27,411 | |
| | 778 | | | Dillard’s, Inc. - Class A (b) | | | 212,208 | |
| | 3,351 | | | Kohl’s Corp. (b) | | | 84,278 | |
| | 8,172 | | | Macy’s, Inc. (b) | | | 128,055 | |
| | 2,677 | | | Nordstrom, Inc. (b) | | | 44,786 | |
| | 645 | | | Ollie’s Bargain Outlet Holdings, Inc. (a)(b) | | | 33,282 | |
| | | | | | |
|
|
|
| | | | | | | | 530,020 | |
| | | | | | |
|
|
|
| | | | | Multi-Utilities - 0.26% | |
| | 740 | | | Avista Corp. | | | 27,417 | |
| | 625 | | | Black Hills Corp. | | | 42,332 | |
| | 2,372 | | | MDU Resources Group, Inc. | | | 64,874 | |
| | 3,669 | | | NiSource, Inc. | | | 92,422 | |
| | | | | | |
|
|
|
| | | | | | | | 227,045 | |
| | | | | | |
|
|
|
| | | | | Oil, Gas & Consumable Fuels - 3.80% | |
| | 5,775 | | | Alto Ingredients, Inc. (a) | | | 21,021 | |
| | 692 | | | Altus Midstream Co. | | | 22,545 | |
| | 3,973 | | | Amplify Energy Corp. (a) | | | 26,103 | |
| | 2,675 | | | Antero Midstream Corp. | | | 24,556 | |
| | 4,620 | | | Antero Resources Corp. (a) | | | 141,049 | |
| | 6,201 | | | APA Corp. | | | 212,012 | |
| | 377 | | | Arch Resources, Inc. (b) | | | 44,712 | |
See notes to financial statements.
60
GuideMark Small/Mid Cap Core Fund
SCHEDULE OF INVESTMENTS (Continued) (Unaudited)
September 30, 2022
| | | | | | | | |
Number of
Shares
| | | | | Value
| |
| | | | | COMMON STOCKS (Continued) | |
| | | | | Oil, Gas & Consumable Fuels (Continued) | |
| | 1,378 | | | Battalion Oil Corp. (a) | | $ | 16,398 | |
| | 4,684 | | | Berry Corp. | | | 35,130 | |
| | 1,116 | | | Brigham Minerals, Inc. - Class A | | | 27,532 | |
| | 1,483 | | | California Resources Corp. | | | 56,992 | |
| | 728 | | | Callon Petroleum Co. (a) | | | 25,487 | |
| | 839 | | | Centrus Energy Corp. - Class A (a) | | | 34,382 | |
| | 175 | | | Chesapeake Utilities Corp. | | | 20,193 | |
| | 801 | | | Chord Energy Corp. (b) | | | 109,553 | |
| | 909 | | | Civitas Resources, Inc. (b) | | | 52,168 | |
| | 2,890 | | | CNX Resources Corp. (a) | | | 44,882 | |
| | 3,364 | | | Comstock Resources, Inc. (a)(b) | | | 58,164 | |
| | 1,996 | | | CONSOL Energy, Inc. | | | 128,383 | |
| | 1,014 | | | CVR Energy, Inc. | | | 29,386 | |
| | 1,832 | | | Delek US Holdings, Inc (b) | | | 49,720 | |
| | 592 | | | Denbury, Inc. (a) | | | 51,066 | |
| | 2,527 | | | Dorian LPG, Ltd. - ADR | | | 34,291 | |
| | 661 | | | DT Midstream, Inc. | | | 34,299 | |
| | 3,214 | | | Earthstone Energy, Inc. - Class A (a)(b) | | | 39,596 | |
| | 4,962 | | | Energy Fuels, Inc. - ADR (a) | | | 30,367 | |
| | 306 | | | Enviva, Inc. | | | 18,378 | |
| | 7,781 | | | Equitrans Midstream Corp. (b) | | | 58,202 | |
| | 1,401 | | | Frontline, Ltd. - ADR (b) | | | 15,313 | |
| | 1,287 | | | Golar LNG, Ltd. - ADR (a) | | | 32,072 | |
| | 759 | | | Green Plains, Inc. (a) | | | 22,064 | |
| | 1,984 | | | HF Sinclair Corp. | | | 106,819 | |
| | 535 | | | International Seaways, Inc. - ADR | | | 18,795 | |
| | 4,521 | | | Kosmos Energy, Ltd. (a) | | | 23,374 | |
| | 584 | | | Laredo Petroleum, Inc. (a)(b) | | | 36,704 | |
| | 4,506 | | | Magnolia Oil & Gas Corp. - Class A (b) | | | 89,264 | |
| | 2,256 | | | Matador Resources Co. (b) | | | 110,364 | |
| | 2,607 | | | Murphy Oil Corp. | | | 91,688 | |
| | 832 | | | NACCO Industries, Inc. - Class A | | | 39,129 | |
| | 388 | | | New Fortress Energy, Inc. (b) | | | 16,959 | |
| | 1,224 | | | Northern Oil and Gas, Inc. (b) | | | 33,550 | |
| | 3,466 | | | OVINTIV, Inc. (b) | | | 159,436 | |
| | 2,757 | | | PBF Energy, Inc. - Class A (a) | | | 96,936 | |
| | 1,440 | | | PDC Energy, Inc. | | | 83,218 | |
| | 3,067 | | | Peabody Energy Corp. (a)(b) | | | 76,123 | |
| | 9,317 | | | Permian Resources Corp. (a) | | | 63,356 | |
| | 3,498 | | | Range Resources Corp. (b) | | | 88,359 | |
| | 1,154 | | | Ranger Oil Corp. - Class A | | | 36,293 | |
| | 11,401 | | | Ring Energy, Inc. (a) | | | 26,450 | |
| | 746 | | | Scorpio Tankers, Inc. - ADR (b) | | | 31,362 | |
| | 844 | | | SilverBow Resources, Inc. (a) | | | 22,687 | |
| | 1,245 | | | Sitio Royalties Corp. (b) | | | 27,527 | |
| | 2,769 | | | SM Energy Co. | | | 104,142 | |
| | 21,175 | | | Southwestern Energy Co. (a) | | | 129,591 | |
| | 3,722 | | | Talos Energy, Inc. (a) | | | 61,971 | |
| | 8,927 | | | Teekay Corp. - ADR (a) | | | 32,048 | |
| | 8,338 | | | Tellurian, Inc. (a)(b) | | | 19,928 | |
| | 56 | | | Texas Pacific Land Corp. | | | 99,525 | |
| | 8,983 | | | Uranium Energy Corp. (a) | | | 31,440 | |
| | 9,899 | | | Vaalco Energy, Inc. | | | 43,160 | |
| | 1,111 | | | World Fuel Services Corp. | | | 26,042 | |
| | | | | | |
|
|
|
| | | | | | | | 3,342,256 | |
| | | | | | |
|
|
|
| | | | | Paper & Forest Products - 0.46% | |
| | 2,267 | | | Boise Cascade Co. | | | 134,796 | |
| | 1,153 | | | Clearwater Paper Corp. (a)(b) | | | 43,352 | |
| | | | | | | | |
Number of
Shares
| | | | | Value
| |
| | | | | Paper & Forest Products (Continued) | |
| | 2,153 | | | Glatfelter Corp. | | $ | 6,696 | |
| | 2,836 | | | Louisiana-Pacific Corp. (b) | | | 145,175 | |
| | 2,770 | | | Resolute Forest Products, Inc. (a) | | | 55,400 | |
| | 522 | | | Sylvamo Corp. (b) | | | 17,696 | |
| | | | | | |
|
|
|
| | | | | | | | 403,115 | |
| | | | | | |
|
|
|
| | | | | Personal Products - 0.68% | |
| | 2,487 | | | BellRing Brands, Inc. (a) | | | 51,257 | |
| | 3,902 | | | Coty, Inc. - Class A (a)(b) | | | 24,661 | |
| | 994 | | | Edgewell Personal Care Co. (b) | | | 37,176 | |
| | 2,147 | | | elf Beauty, Inc. (a) | | | 80,770 | |
| | 2,463 | | | Herbalife Nutrition, Ltd. - ADR (a) | | | 48,989 | |
| | 658 | | | Inter Parfums, Inc. | | | 49,653 | |
| | 546 | | | Medifast, Inc. | | | 59,165 | |
| | 4,728 | | | Nature’s Sunshine Products, Inc. (a) | | | 38,959 | |
| | 1,975 | | | Nu Skin Enterprises, Inc. - Class A | | | 65,906 | |
| | 2,957 | | | The Beauty Health Co. (a) | | | 34,863 | |
| | 6,107 | | | The Honest Co., Inc. (a) | | | 21,374 | |
| | 7,999 | | | Thorne HealthTech, Inc. (a) | | | 37,835 | |
| | 929 | | | USANA Health Sciences, Inc. (a) | | | 52,070 | |
| | | | | | |
|
|
|
| | | | | | | | 602,678 | |
| | | | | | |
|
|
|
| | | | | Pharmaceuticals - 1.58% | |
| | 2,722 | | | Aerie Pharmaceuticals, Inc. (a) | | | 41,184 | |
| | 27,825 | | | Amneal Pharmaceuticals, Inc. (a) | | | 56,207 | |
| | 3,857 | | | Amphastar Pharmaceuticals, Inc. (a) | | | 108,382 | |
| | 1,100 | | | Arvinas, Inc. (a) | | | 48,939 | |
| | 18,514 | | | BARK, Inc. (a) | | | 33,695 | |
| | 4,309 | | | Collegium Pharmaceutical, Inc. (a) | | | 69,030 | |
| | 5,510 | | | Corcept Therapeutics, Inc. (a)(b) | | | 141,276 | |
| | 1,300 | | | Harmony Biosciences Holdings, Inc. (a)(b) | | | 57,577 | |
| | 7,266 | | | Innoviva, Inc. (a)(b) | | | 84,358 | |
| | 758 | | | Intra-Cellular Therapies, Inc. (a) | | | 35,270 | |
| | 2,288 | | | IVERIC Bio, Inc. (a) | | | 41,047 | |
| | 1,114 | | | Jazz Pharmaceuticals PLC - ADR (a) | | | 148,485 | |
| | 1,460 | | | Organon & Co. (b) | | | 34,164 | |
| | 852 | | | Pacira Pharmaceuticals, Inc. (a)(b) | | | 45,318 | |
| | 2,246 | | | Perrigo Co. PLC - ADR | | | 80,092 | |
| | 1,570 | | | Phibro Animal Health Corp. - Class A | | | 20,865 | |
| | 1,992 | | | Prestige Consumer Healthcare, Inc. (a) | | | 99,261 | |
| | 14,034 | | | SIGA Technologies, Inc. | | | 144,550 | |
| | 2,950 | | | Supernus Pharmaceuticals, Inc. (a)(b) | | | 99,858 | |
| | | | | | |
|
|
|
| | | | | | | | 1,389,558 | |
| | | | | | |
|
|
|
| | | | | Professional Services - 1.60% | |
| | 965 | | | ASGN, Inc. (a)(b) | | | 87,207 | |
| | 6,678 | | | Atlas Technical Consultants, Inc. (a)(b) | | | 44,409 | |
| | 1,010 | | | CBIZ, Inc. (a) | | | 43,208 | |
| | 422 | | | CRA International, Inc. | | | 37,448 | |
| | 379 | | | Exponent, Inc. | | | 33,227 | |
| | 751 | | | Forrester Research, Inc. (a) | | | 27,044 | |
| | 1,236 | | | Franklin Covey Co. (a) | | | 56,102 | |
| | 569 | | | FTI Consulting, Inc. (a)(b) | | | 94,289 | |
| | 981 | | | Heidrick & Struggles International, Inc. | | | 25,496 | |
| | 648 | | | Huron Consulting Group, Inc. (a) | | | 42,930 | |
| | 520 | | | ICF International, Inc. (b) | | | 56,690 | |
| | 705 | | | Insperity, Inc. | | | 71,973 | |
| | 1,821 | | | Kelly Services, Inc. - Class A | | | 24,747 | |
| | 1,318 | | | Kforce, Inc. | | | 77,301 | |
| | 850 | | | Korn Ferry International | | | 39,908 | |
| | 4,364 | | | Legalzoom.com, Inc. (a) | | | 37,400 | |
See notes to financial statements.
61
GuideMark Small/Mid Cap Core Fund
SCHEDULE OF INVESTMENTS (Continued) (Unaudited)
September 30, 2022
| | | | | | | | |
Number of
Shares
| | | | | Value
| |
| | | | | COMMON STOCKS (Continued) | |
| | | | | Professional Services (Continued) | |
| | 903 | | | ManpowerGroup, Inc. | | $ | 58,415 | |
| | 4,211 | | | Nielsen Holdings PLC - ADR | | | 116,729 | |
| | 1,451 | | | Red Violet, Inc. (a) | | | 25,131 | |
| | 3,696 | | | Resources Connection, Inc. | | | 66,787 | |
| | 2,408 | | | Robert Half International, Inc. | | | 184,212 | |
| | 610 | | | TriNet Group, Inc. (a) | | | 43,444 | |
| | 3,068 | | | TrueBlue, Inc. (a) | | | 58,537 | |
| | 2,231 | | | Upwork, Inc. (a) | | | 30,386 | |
| | 453 | | | VSE Corp. | | | 16,036 | |
| | 837 | | | Willdan Group, Inc. (a) | | | 12,396 | |
| | | | | | |
|
|
|
| | | | | | | | 1,411,452 | |
| | | | | | |
|
|
|
| | | | | Real Estate Management & Development - 0.51% | |
| | 7,456 | | | Anywhere Real Estate, Inc. (a)(b) | | | 60,468 | |
| | 8,613 | | | Compass, Inc. - Class A (a) | | | 19,982 | |
| | 4,494 | | | Cushman & Wakefield PLC - ADR (a) | | | 51,456 | |
| | 6,875 | | | eXp World Holdings, Inc. (b) | | | 77,069 | |
| | 2,406 | | | Forestar Group, Inc. (a) | | | 26,923 | |
| | 641 | | | Jones Lang LaSalle, Inc. (a) | | | 96,836 | |
| | 2,316 | | | Marcus & Millichap, Inc. | | | 75,919 | |
| | 1,248 | | | RE/MAX Holdings, Inc. - Class A | | | 23,600 | |
| | 470 | | | The St. Joe Co. | | | 15,054 | |
| | | | | | |
|
|
|
| | | | | | | | 447,307 | |
| | | | | | |
|
|
|
| | | | | Road & Rail - 0.83% | |
| | 1,081 | | | ArcBest Corp. (b) | | | 78,621 | |
| | 364 | | | Avis Budget Group, Inc. (a)(b) | | | 54,039 | |
| | 1,552 | | | Covenant Transportation Group, Inc. | | | 44,542 | |
| | 5,512 | | | Daseke, Inc. (a) | | | 29,820 | |
| | 1,042 | | | Hertz Global Holdings, Inc. (a)(b) | | | 16,964 | |
| | 2,390 | | | Knight-Swift Transportation Holdings, Inc. | | | 116,943 | |
| | 856 | | | Landstar System, Inc. (b) | | | 123,581 | |
| | 1,204 | | | Lyft, Inc. - Class A (a)(b) | | | 15,857 | |
| | 3,064 | | | PAM Transportation Services, Inc. (a) | | | 94,861 | |
| | 1,183 | | | Ryder System, Inc. | | | 89,305 | |
| | 255 | | | Saia, Inc. (a)(b) | | | 48,450 | |
| | 485 | | | Werner Enterprises, Inc. (b) | | | 18,236 | |
| | | | | | |
|
|
|
| | | | | | | | 731,219 | |
| | | | | | |
|
|
|
| | | | | Semiconductors & Semiconductor Equipment - 1.99% | |
| | 514 | | | Advanced Energy Industries, Inc. | | | 39,789 | |
| | 2,084 | | | Allegro MicroSystems, Inc. (a)(b) | | | 45,535 | |
| | 2,097 | | | Alpha & Omega Semiconductor, Ltd. - ADR (a)(b) | | | 64,504 | |
| | 481 | | | Ambarella, Inc. - ADR (a) | | | 27,023 | |
| | 4,307 | | | Amkor Technology, Inc. | | | 73,434 | |
| | 1,199 | | | Axcelis Technologies, Inc. (a) | | | 72,611 | |
| | 561 | | | CEVA, Inc. (a)(b) | | | 14,715 | |
| | 1,474 | | | Cirrus Logic, Inc. (a) | | | 101,411 | |
| | 1,566 | | | Cohu, Inc. (a)(b) | | | 40,372 | |
| | 509 | | | CyberOptics Corp. (a) | | | 27,374 | |
| | 957 | | | Diodes, Inc. (a)(b) | | | 62,119 | |
| | 1,137 | | | Entegris, Inc. (b) | | | 94,394 | |
| | 663 | | | First Solar, Inc. (a)(b) | | | 87,695 | |
| | 1,653 | | | FormFactor, Inc. (a)(b) | | | 41,408 | |
| | 728 | | | Impinj, Inc. (a) | | | 58,262 | |
| | 1,897 | | | Kulicke & Soffa Industries, Inc. (b) | | | 73,091 | |
| | 2,076 | | | Lattice Semiconductor Corp. (a) | | | 102,160 | |
| | 612 | | | MACOM Technology Solutions Holdings, Inc. (a)(b) | | | 31,695 | |
| | | | | | | | |
Number of
Shares
| | | | | Value
| |
| | | | | Semiconductors & Semiconductor Equipment (Continued) | |
| | 1,894 | | | MaxLinear, Inc. (a)(b) | | $ | 61,782 | |
| | 830 | | | MKS Instruments, Inc. | | | 68,591 | |
| | 1,115 | | | Onto Innovation, Inc. (a)(b) | | | 71,416 | |
| | 4,972 | | | Photronics, Inc. (a) | | | 72,691 | |
| | 1,112 | | | Power Integrations, Inc. | | | 71,524 | |
| | 2,869 | | | Rambus, Inc. (a)(b) | | | 72,930 | |
| | 1,097 | | | Semtech Corp. (a) | | | 32,263 | |
| | 319 | | | Silicon Laboratories, Inc. (a)(b) | | | 39,377 | |
| | 272 | | | SiTime Corp. (a) | | | 21,415 | |
| | 3,330 | | | SMART Global Holdings, Inc. - ADR (a) | | | 52,847 | |
| | 1,404 | | | Ultra Clean Holdings, Inc. (a) | | | 36,153 | |
| | 1,626 | | | Veeco Instruments, Inc. (a)(b) | | | 29,788 | |
| | 601 | | | Wolfspeed, Inc. (a)(b) | | | 62,119 | |
| | | | | | |
|
|
|
| | | | | | | | 1,750,488 | |
| | | | | | |
|
|
|
| | | | | Software - 5.18% | |
| | 1,438 | | | 2U, Inc. (a) | | | 8,987 | |
| | 14,430 | | | 8x8, Inc. (a) | | | 49,783 | |
| | 7,306 | | | A10 Networks, Inc. | | | 96,951 | |
| | 2,670 | | | ACI Worldwide, Inc. (a) | | | 55,803 | |
| | 1,402 | | | Agilysys, Inc. (a) | | | 77,601 | |
| | 959 | | | Alarm.com Holdings, Inc. (a)(b) | | | 62,201 | |
| | 1,157 | | | Altair Engineering, Inc. - Class A (a) | | | 51,162 | |
| | 651 | | | Alteryx, Inc. - Class A (a) | | | 36,352 | |
| | 2,127 | | | American Software, Inc. - Class A | | | 32,586 | |
| | 601 | | | Appfolio, Inc. - Class A (a) | | | 62,937 | |
| | 877 | | | Appian Corp. - Class A (a) | | | 35,808 | |
| | 2,763 | | | AppLovin Corp. - Class A (a)(b) | | | 53,851 | |
| | 1,874 | | | Asana, Inc. - Class A (a) | | | 41,659 | |
| | 298 | | | Aspen Technology, Inc. (a)(b) | | | 70,984 | |
| | 9,278 | | | Avaya Holdings Corp. (a)(b) | | | 14,752 | |
| | 1,022 | | | Bentley Systems, Inc. - Class B | | | 31,263 | |
| | 621 | | | Bill.com Holdings, Inc. (a) | | | 82,202 | |
| | 909 | | | Blackbaud, Inc. (a) | | | 40,050 | |
| | 3,537 | | | Box, Inc. - Class A (a)(b) | | | 86,267 | |
| | 2,098 | | | Cerence, Inc. (a) | | | 33,043 | |
| | 6,151 | | | ChannelAdvisor Corp. (a) | | | 139,382 | |
| | 1,629 | | | CommVault Systems, Inc. (a) | | | 86,402 | |
| | 1,477 | | | Couchbase, Inc. (a) | | | 21,077 | |
| | 8,055 | | | Cvent Holding Corp. (a)(b) | | | 42,289 | |
| | 2,213 | | | Digital Turbine, Inc. (a) | | | 31,889 | |
| | 2,227 | | | Domo, Inc. - Class B (a) | | | 40,064 | |
| | 6,270 | | | Dropbox, Inc. - Class A (a) | | | 129,914 | |
| | 1,863 | | | Dynatrace, Inc. (a)(b) | | | 64,851 | |
| | 3,491 | | | Ebix, Inc. (b) | | | 66,224 | |
| | 5,611 | | | eGain Corp. (a) | | | 41,241 | |
| | 890 | | | Elastic NV - ADR (a) | | | 63,849 | |
| | 824 | | | Envestnet, Inc. (a) | | | 36,586 | |
| | 896 | | | ePlus, Inc. (a) | | | 37,220 | |
| | 2,057 | | | EverCommerce, Inc. (a) | | | 22,483 | |
| | 380 | | | Fair Isaac Corp. (a) | | | 156,564 | |
| | 723 | | | Five9, Inc. (a)(b) | | | 54,210 | |
| | 352 | | | Globant SA - ADR (a)(b) | | | 65,852 | |
| | 1,131 | | | Informatica, Inc. - Class A (a) | | | 22,699 | |
| | 1,025 | | | Jack Henry & Associates, Inc. | | | 186,827 | |
| | 7,971 | | | Kaleyra, Inc. (a) | | | 7,732 | |
| | 1,426 | | | LivePerson, Inc. (a) | | | 13,433 | |
| | 1,209 | | | Manhattan Associates, Inc. (a) | | | 160,833 | |
| | 4,010 | | | Mitek Systems, Inc. (a) | | | 36,732 | |
| | 1,181 | | | Model N, Inc. (a) | | | 40,426 | |
See notes to financial statements.
62
GuideMark Small/Mid Cap Core Fund
SCHEDULE OF INVESTMENTS (Continued) (Unaudited)
September 30, 2022
| | | | | | | | |
Number of
Shares
| | | | | Value
| |
| | | | | COMMON STOCKS (Continued) | |
| | | | | Software (Continued) | |
| | 4,424 | | | Momentive Global, Inc. (a) | | $ | 25,703 | |
| | 2,046 | | | N-able, Inc. (a) | | | 18,885 | |
| | 804 | | | New Relic, Inc. (a) | | | 46,133 | |
| | 8,352 | | | NortonLifeLock, Inc. | | | 168,209 | |
| | 3,423 | | | Nutanix, Inc. - Class A (a)(b) | | | 71,301 | |
| | 2,018 | | | OneSpan, Inc. (a) | | | 17,375 | |
| | 223 | | | Paylocity Holding Corp. (a)(b) | | | 53,872 | |
| | 1,362 | | | Pegasystems, Inc. (b) | | | 43,775 | |
| | 569 | | | Ping Identity Holding Corp. (a) | | | 15,972 | |
| | 1,970 | | | Progress Software Corp. (b) | | | 83,823 | |
| | 1,250 | | | PTC, Inc. (a)(b) | | | 130,750 | |
| | 683 | | | Qualys, Inc. (a) | | | 95,203 | |
| | 1,025 | | | Rapid7, Inc. (a) | | | 43,972 | |
| | 18,493 | | | Rimini Street Inc. (a) | | | 86,177 | |
| | 1,261 | | | RingCentral, Inc. - Class A (a) | | | 50,390 | |
| | 1,100 | | | Sapiens International Corp NV - ADR | | | 21,098 | |
| | 4,170 | | | SecureWorks Corp. - Class A (a) | | | 33,568 | |
| | 701 | | | SentinelOne, Inc. - Class A (a) | | | 17,918 | |
| | 881 | | | ShotSpotter, Inc. (a) | | | 25,338 | |
| | 1,520 | | | Smartsheet, Inc. - Class A (a) | | | 52,227 | |
| | 948 | | | Sprout Social, Inc. - Class A (a)(b) | | | 57,525 | |
| | 762 | | | SPS Commerce, Inc. (a)(b) | | | 94,663 | |
| | 1,579 | | | Tenable Holdings, Inc. (a) | | | 54,949 | |
| | 896 | | | UiPath, Inc. - Class A (a) | | | 11,299 | |
| | 5,676 | | | Upland Software, Inc. (a) | | | 46,146 | |
| | 2,078 | | | Varonis Systems, Inc. (a) | | | 55,109 | |
| | 2,216 | | | Verint Systems, Inc. (a) | | | 74,413 | |
| | 2,971 | | | Veritone, Inc. (a) | | | 16,727 | |
| | 1,122 | | | Workiva, Inc. (a) | | | 87,292 | |
| | 5,761 | | | Xperi Holding Corp. | | | 81,460 | |
| | 8,583 | | | Yext, Inc. (a) | | | 38,280 | |
| | 1,446 | | | Zendesk, Inc. (a) | | | 110,041 | |
| | 8,822 | | | Zeta Global Holdings Corp. - Class A (a)(b) | | | 58,313 | |
| | 859 | | | Ziff Davis, Inc. (a) | | | 58,824 | |
| | 3,228 | | | Zuora, Inc. - Class A (a) | | | 23,823 | |
| | | | | | |
|
|
|
| | | | | | | | 4,563,574 | |
| | | | | | |
|
|
|
| | | | | Specialty Retail - 4.43% | |
| | 3,108 | | | Abercrombie & Fitch Co. - Class A (a)(b) | | | 48,329 | |
| | 2,730 | | | Academy Sports & Outdoors, Inc. | | | 115,151 | |
| | 3,165 | | | American Eagle Outfitters, Inc. (b) | | | 30,795 | |
| | 773 | | | America’s Car-Mart, Inc. (a) | | | 47,168 | |
| | 522 | | | Asbury Automotive Group, Inc. (a) | | | 78,874 | |
| | 1,252 | | | AutoNation, Inc. (a)(b) | | | 127,541 | |
| | 4,674 | | | Bed Bath & Beyond, Inc. (a)(b) | | | 28,465 | |
| | 3,864 | | | Big 5 Sporting Goods Corp. (b) | | | 41,499 | |
| | 909 | | | Boot Barn Holdings, Inc. (a)(b) | | | 53,140 | |
| | 2,827 | | | Build-A-Bear Workshop, Inc. | | | 37,684 | |
| | 4,189 | | | Caleres, Inc. | | | 101,458 | |
| | 1,566 | | | Camping World Holdings, Inc. - Class A | | | 39,651 | |
| | 12,365 | | | Chico’s FAS, Inc. (a)(b) | | | 59,847 | |
| | 2,170 | | | Citi Trends, Inc. (a) | | | 33,657 | |
| | 3,115 | | | Conn’s, Inc. (a) | | | 22,054 | |
| | 4,179 | | | Designer Brands, Inc. - Class A | | | 63,981 | |
| | 9,912 | | | Destination XL Group, Inc. (a) | | | 53,723 | |
| | 1,401 | | | Dick’s Sporting Goods, Inc. (b) | | | 146,601 | |
| | 3,842 | | | EVgo, Inc. (a)(b) | | | 30,390 | |
| | 22,622 | | | Express, Inc. (a) | | | 24,658 | |
| | 663 | | | Five Below, Inc. (a)(b) | | | 91,275 | |
| | | | | | | | |
Number of
Shares
| | | | | Value
| |
| | | | | Specialty Retail (Continued) | |
| | 1,241 | | | Floor & Decor Holdings, Inc. - Class A (a)(b) | | $ | 87,193 | |
| | 1,866 | | | Foot Locker, Inc. (b) | | | 58,089 | |
| | 4,972 | | | GameStop Corp. - Class A (a)(b) | | | 124,946 | |
| | 1,394 | | | Genesco, Inc. (a) | | | 54,812 | |
| | 591 | | | Group 1 Automotive, Inc. (b) | | | 84,436 | |
| | 1,392 | | | Guess?, Inc. | | | 20,421 | |
| | 2,397 | | | Haverty Furniture Cos., Inc. | | | 59,685 | |
| | 1,720 | | | Hibbett Sports, Inc. | | | 85,673 | |
| | 4,208 | | | JOANN, Inc. (b) | | | 27,857 | |
| | 3,434 | | | Leslie’s, Inc. (a) | | | 50,514 | |
| | 534 | | | Lithia Motors, Inc. (b) | | | 114,570 | |
| | 5,536 | | | Lumber Liquidators Holdings, Inc. (a) | | | 38,364 | |
| | 1,827 | | | MarineMax, Inc. (a)(b) | | | 54,426 | |
| | 396 | | | Monro, Inc. (b) | | | 17,210 | |
| | 585 | | | Murphy USA, Inc. (b) | | | 160,822 | |
| | 1,678 | | | National Vision Holdings, Inc. (a)(b) | | | 54,787 | |
| | 2,017 | | | ODP Corp. (a) | | | 70,898 | |
| | 842 | | | Penske Automotive Group, Inc. (b) | | | 82,878 | |
| | 2,191 | | | Petco Health & Wellness Co., Inc. (a)(b) | | | 24,452 | |
| | 2,384 | | | Rent-A-Center, Inc. | | | 41,744 | |
| | 1,206 | | | REX American Resources Corp. (a)(b) | | | 33,672 | |
| | 315 | | | RH (a) | | | 77,512 | |
| | 5,338 | | | Sally Beauty Holdings, Inc. (a)(b) | | | 67,259 | |
| | 2,422 | | | Shoe Carnival, Inc. (b) | | | 51,928 | |
| | 2,149 | | | Signet Jewelers, Ltd. - ADR (b) | | | 122,901 | |
| | 1,610 | | | Sleep Number Corp. (a) | | | 54,434 | |
| | 1,367 | | | Sonic Automotive, Inc. - Class A (b) | | | 59,191 | |
| | 6,041 | | | Sportsman’s Warehouse Holdings, Inc. (a) | | | 50,140 | |
| | 3,493 | | | The Aaron’s Co., Inc. | | | 33,952 | |
| | 1,628 | | | The Buckle, Inc. (b) | | | 51,543 | |
| | 4,077 | | | The Cato Corp. - Class A | | | 38,895 | |
| | 1,432 | | | The Children’s Place, Inc. (a)(b) | | | 44,234 | |
| | 6,889 | | | The Container Store Group, Inc. (a) | | | 33,756 | |
| | 5,188 | | | The Gap, Inc. (b) | | | 42,593 | |
| | 5,677 | | | Tile Shop Holdings, Inc. | | | 19,983 | |
| | 4,339 | | | Tilly’s, Inc. - Class A | | | 30,026 | |
| | 6,106 | | | Torrid Holdings, Inc. (a)(b) | | | 25,462 | |
| | 1,085 | | | TravelCenters of America, Inc. (a) | | | 58,514 | |
| | 1,714 | | | Urban Outfitters, Inc. (a) | | | 33,680 | |
| | 1,427 | | | Victoria’s Secret & Co. (a)(b) | | | 41,554 | |
| | 12,423 | | | Volta, Inc. (a)(b) | | | 15,032 | |
| | 2,256 | | | Warby Parker, Inc. - Class A (a) | | | 30,095 | |
| | 1,516 | | | Williams Sonoma, Inc. (b) | | | 178,661 | |
| | 330 | | | Winmark Corp. | | | 71,392 | |
| | 2,120 | | | Zumiez, Inc. (a)(b) | | | 45,644 | |
| | | | | | |
|
|
|
| | | | | | | | 3,901,771 | |
| | | | | | |
|
|
|
| | | | | Technology Hardware, Storage & Peripherals - 0.76% | |
| | 4,908 | | | Avid Technology, Inc. (a) | | | 114,160 | |
| | 1,343 | | | Corsair Gaming, Inc. (a)(b) | | | 15,243 | |
| | 6,639 | | | Diebold Nixdorf, Inc. (a) | | | 16,199 | |
| | 3,469 | | | NCR Corp. (a) | | | 65,946 | |
| | 5,014 | | | Pure Storage, Inc. - Class A (a)(b) | | | 137,233 | |
| | 915 | | | Super Micro Computer, Inc. (a) | | | 50,389 | |
| | 1,256 | | | Synaptics, Inc. (a)(b) | | | 124,356 | |
| | 3,443 | | | Teradata Corp. (a)(b) | | | 106,940 | |
| | 2,946 | | | Xerox Holdings Corp. (b) | | | 38,534 | |
| | | | | | |
|
|
|
| | | | | | | | 669,000 | |
| | | | | | |
|
|
|
See notes to financial statements.
63
GuideMark Small/Mid Cap Core Fund
SCHEDULE OF INVESTMENTS (Continued) (Unaudited)
September 30, 2022
| | | | | | | | |
Number of
Shares
| | | | | Value
| |
| | | | | COMMON STOCKS (Continued) | |
| | | | | Textiles, Apparel & Luxury Goods - 1.76% | |
| | 3,391 | | | Capri Holdings, Ltd. - ADR (a)(b) | | $ | 130,350 | |
| | 737 | | | Carter’s, Inc.(b) | | | 48,296 | |
| | 846 | | | Columbia Sportswear Co. | | | 56,936 | |
| | 2,014 | | | Crocs, Inc. (a) | | | 138,281 | |
| | 585 | | | Deckers Outdoor Corp. (a)(b) | | | 182,877 | |
| | 8,398 | | | Fossil Group, Inc. (a) | | | 28,721 | |
| | 2,482 | | | G-III Apparel Group, Ltd. (a) | | | 37,106 | |
| | 5,673 | | | Hanesbrands, Inc. (b) | | | 39,484 | |
| | 2,060 | | | Kontoor Brands, Inc. (b) | | | 69,237 | |
| | 2,555 | | | Movado Group, Inc. (b) | | | 72,000 | |
| | 970 | | | Oxford Industries, Inc. (b) | | | 87,087 | |
| | 4,675 | | | PLBY Group, Inc. (a) | | | 18,840 | |
| | 1,173 | | | PVH Corp. (b) | | | 52,550 | |
| | 996 | | | Ralph Lauren Corp. (b) | | | 84,590 | |
| | 830 | | | Rocky Brands, Inc. | | | 16,650 | |
| | 1,994 | | | Skechers U.S.A., Inc. - Class A (a) | | | 63,250 | |
| | 1,971 | | | Steven Madden, Ltd. | | | 52,566 | |
| | 2,247 | | | Superior Uniform Group, Inc. | | | 19,953 | |
| | 5,543 | | | Tapestry, Inc. (b) | | | 157,587 | |
| | 6,655 | | | Under Armour, Inc. - Class A (a)(b) | | | 44,256 | |
| | 7,580 | | | Under Armour, Inc. - Class C (a) | | | 45,177 | |
| | 1,790 | | | Unifi, Inc. (a) | | | 17,023 | |
| | 213 | | | UniFirst Corp. | | | 35,833 | |
| | 736 | | | Weyco Group, Inc. | | | 14,970 | |
| | 2,333 | | | Wolverine World Wide, Inc. | | | 35,905 | |
| | | | | | |
|
|
|
| | | | | | | | 1,549,525 | |
| | | | | | |
|
|
|
| | | | | Thrifts & Mortgage Finance - 1.64% | |
| | 1,401 | | | Axos Financial, Inc. (a) | | | 47,956 | |
| | 1,240 | | | Berkshire Hills Bancorp, Inc. (b) | | | 33,852 | |
| | 1,990 | | | Bridgewater Bancshares, Inc. (a) | | | 32,775 | |
| | 1,806 | | | Columbia Financial, Inc. (a) | | | 38,161 | |
| | 1,805 | | | Enact Holdings, Inc. | | | 40,017 | |
| | 2,098 | | | Essent Group, Ltd. - ADR | | | 73,157 | |
| | 586 | | | Federal Agricultural Mortgage Corp. - Class C | | | 58,096 | |
| | 1,523 | | | Flagstar Bancorp, Inc. | | | 50,868 | |
| | 1,873 | | | Flushing Financial Corp. | | | 36,280 | |
| | 189 | | | Hingham Institution for Savings | | | 47,460 | |
| | 850 | | | Home Bancorp, Inc. | | | 33,142 | |
| | 8,224 | | | Home Point Capital, Inc. | | | 12,665 | |
| | 1,221 | | | HomeStreet, Inc. | | | 35,177 | |
| | 1,757 | | | Kearny Financial Corp. (b) | | | 18,659 | |
| | 2,399 | | | Luther Burbank Corp. | | | 27,876 | |
| | 2,008 | | | Merchants Bancorp | | | 46,325 | |
| | 6,500 | | | MGIC Investment Corp. | | | 83,330 | |
| | 2,979 | | | Mr Cooper Group, Inc. (a) | | | 120,650 | |
| | 5,982 | | | New York Community Bancorp, Inc. (b) | | | 51,026 | |
| | 2,319 | | | NMI Holdings, Inc. - Class A (a) | | | 47,238 | |
| | 1,957 | | | Northfield Bancorp, Inc. | | | 28,005 | |
| | 1,703 | | | Northwest Bancshares, Inc. | | | 23,008 | |
| | 1,458 | | | PennyMac Financial Services, Inc. | | | 62,548 | |
| | 1,937 | | | Provident Bancorp, Inc. | | | 27,718 | |
| | 1,422 | | | Provident Financial Services, Inc. | | | 27,729 | |
| | 4,194 | | | Radian Group, Inc. | | | 80,902 | |
| | 700 | | | Southern Missouri Bancorp, Inc. | | | 35,721 | |
| | 9,914 | | | UWM Holdings Corp. (b) | | | 29,048 | |
| | 2,069 | | | Velocity Financial, Inc. (a) | | | 22,428 | |
| | 875 | | | Walker & Dunlop, Inc. (b) | | | 73,264 | |
| | 1,191 | | | Washington Federal, Inc. | | | 35,706 | |
| | | | | | | | |
Number of
Shares
| | | | | Value
| |
| | | | | Thrifts & Mortgage Finance (Continued) | |
| | 2,042 | | | Waterstone Financial, Inc. | | $ | 32,999 | |
| | 685 | | | WSFS Financial Corp. | | | 31,825 | |
| | | | | | |
|
|
|
| | | | | | | | 1,445,611 | |
| | | | | | |
|
|
|
| | | | | Tobacco - 0.10% | |
| | 990 | | | Turning Point Brands, Inc. | | | 21,018 | |
| | 752 | | | Universal Corp. | | | 34,622 | |
| | 3,407 | | | Vector Group, Ltd. (b) | | | 30,015 | |
| | | | | | |
|
|
|
| | | | | | | | 85,655 | |
| | | | | | |
|
|
|
| | | | | Trading Companies & Distributors - 2.16% | |
| | 2,166 | | | Alta Equipment Group, Inc. | | | 23,848 | |
| | 996 | | | Applied Industrial Technologies, Inc. | | | 102,369 | |
| | 1,572 | | | Beacon Roofing Supply, Inc. (a)(b) | | | 86,020 | |
| | 1,602 | | | BlueLinx Holdings, Inc. (a) | | | 99,484 | |
| | 845 | | | Core & Main, Inc. - Class A (a) | | | 19,215 | |
| | 2,406 | | | DXP Enterprises, Inc. (a) | | | 56,974 | |
| | 330 | | | GATX Corp. | | | 28,099 | |
| | 1,962 | | | Global Industrial Co. | | | 52,640 | |
| | 2,276 | | | GMS, Inc. (a) | | | 91,063 | |
| | 1,102 | | | H&E Equipment Services, Inc. | | | 31,231 | |
| | 484 | | | Herc Holdings, Inc. | | | 50,278 | |
| | 8,134 | | | Hudson Technologies, Inc. (a) | | | 59,785 | |
| | 611 | | | Kaman Corp. | | | 17,065 | |
| | 2,731 | | | Karat Packaging, Inc. (a) | | | 43,669 | |
| | 4,114 | | | MRC Global, Inc. (a) | | | 29,580 | |
| | 975 | | | MSC Industrial Direct Co., Inc. - Class A | | | 70,990 | |
| | 6,286 | | | NOW, Inc. (a) | | | 63,174 | |
| | 1,262 | | | Rush Enterprises, Inc. - Class A | | | 55,351 | |
| | 882 | | | Rush Enterprises, Inc. - Class B | | | 42,257 | |
| | 941 | | | SiteOne Landscape Supply, Inc. (a) | | | 97,996 | |
| | 1,587 | | | Textainer Group Holdings, Ltd. - ADR | | | 42,627 | |
| | 2,662 | | | Titan Machinery, Inc. (a) | | | 75,228 | |
| | 650 | | | Transcat, Inc. (a) | | | 49,198 | |
| | 954 | | | Triton International, Ltd. - ADR | | | 52,212 | |
| | 4,754 | | | Univar Solutions, Inc. (a) | | | 108,106 | |
| | 2,084 | | | Veritiv Corp. (a) | | | 203,753 | |
| | 519 | | | Watsco, Inc. (b) | | | 133,622 | |
| | 988 | | | WESCO International, Inc. (a)(b) | | | 117,947 | |
| | | | | | |
|
|
|
| | | | | | | | 1,903,781 | |
| | | | | | |
|
|
|
| | | | | Water Utilities - 0.16% | |
| | 244 | | | American States Water Co. | | | 19,020 | |
| | 470 | | | Artesian Resources Corp. - Class A | | | 22,617 | |
| | 531 | | | California Water Service Group (b) | | | 27,978 | |
| | 1,648 | | | Essential Utilities, Inc. | | | 68,194 | |
| | | | | | |
|
|
|
| | | | | | | | 137,809 | |
| | | | | | |
|
|
|
| | | | | Wireless Telecommunication Services - 0.05% | |
| | 1,576 | | | Telephone & Data Systems, Inc. | | | 21,906 | |
| | 716 | | | United States Cellular Corp. (a) | | | 18,638 | |
| | | | | | |
|
|
|
| | | | | | | | 40,544 | |
| | | | | | |
|
|
|
| | | | | Total Common Stocks
(Cost $67,408,532) | | | 79,866,021 | |
| | | | | | |
|
|
|
| | | | | INVESTMENT COMPANIES - 3.29% | |
| | | | | International Equity Funds - 3.29% | |
| | 22,758 | | | Vanguard Extended Market ETF | | | 2,892,769 | |
| | | | | | |
|
|
|
| | | | | Total Investment Companies
(Cost $3,011,933) | | | 2,892,769 | |
| | | | | | |
|
|
|
See notes to financial statements.
64
GuideMark Small/Mid Cap Core Fund
SCHEDULE OF INVESTMENTS (Continued) (Unaudited)
September 30, 2022
| | | | | | | | |
Number of
Shares
| | | | | Value
| |
| | | | | REAL ESTATE INVESTMENT TRUSTS - 5.54% | |
| | | | | Real Estate Investment Trusts - 5.54% | |
| | 2,287 | | | Acadia Realty Trust | | $ | 28,862 | |
| | 483 | | | Agree Realty Corp. | | | 32,641 | |
| | 1,730 | | | Alexander & Baldwin, Inc. | | | 28,683 | |
| | 677 | | | American Assets Trust, Inc. | | | 17,412 | |
| | 3,179 | | | American Homes 4 Rent - Class A | | | 104,303 | |
| | 1,201 | | | Americold Realty Trust, Inc. (b) | | | 29,545 | |
| | 5,448 | | | Annaly Capital Management, Inc. | | | 93,488 | |
| | 822 | | | Apartment Income REIT Corp. | | | 31,746 | |
| | 6,603 | | | Apartment Investment and Management Co. - Class A | | | 48,202 | |
| | 3,391 | | | Apollo Commercial Real Estate Finance, Inc. | | | 28,145 | |
| | 4,839 | | | Apple Hospitality REIT, Inc. | | | 68,036 | |
| | 4,100 | | | Arbor Realty Trust, Inc. (b) | | | 47,150 | |
| | 2,207 | | | Ares Commercial Real Estate Corp. (b) | | | 23,063 | |
| | 2,472 | | | Armada Hoffler Properties, Inc. | | | 25,659 | |
| | 1,865 | | | Blackstone Mortgage Trust, Inc. - Class A (b) | | | 43,529 | |
| | 11,688 | | | Braemar Hotels & Resorts, Inc. | | | 50,258 | |
| | 3,238 | | | Brandywine Realty Trust | | | 21,856 | |
| | 4,302 | | | Brixmor Property Group, Inc. | | | 79,458 | |
| | 1,826 | | | Broadstone Net Lease, Inc. (b) | | | 28,358 | |
| | 815 | | | Camden Property Trust | | | 97,352 | |
| | 1,596 | | | CBL & Associates Properties, Inc. (b) | | | 40,874 | |
| | 4,458 | | | Chatham Lodging Trust (a) | | | 44,000 | |
| | 3,267 | | | City Office REIT, Inc. | | | 32,572 | |
| | 2,455 | | | Clipper Realty, Inc. | | | 17,111 | |
| | 4,177 | | | CoreCivic, Inc. (a) | | | 36,925 | |
| | 1,579 | | | Corporate Office Properties Trust | | | 36,680 | |
| | 2,150 | | | Cousins Properties, Inc. | | | 50,202 | |
| | 1,376 | | | CubeSmart | | | 55,123 | |
| | 4,239 | | | DiamondRock Hospitality Co. | | | 31,835 | |
| | 8,723 | | | Diversified Healthcare Trust | | | 8,637 | |
| | 1,770 | | | Douglas Emmett, Inc. | | | 31,736 | |
| | 3,808 | | | Dynex Capital, Inc. (b) | | | 44,363 | |
| | 1,084 | | | Easterly Government Properties, Inc. (b) | | | 17,095 | |
| | 296 | | | EastGroup Properties, Inc. | | | 42,725 | |
| | 2,168 | | | Ellington Financial, Inc. (b) | | | 24,650 | |
| | 5,645 | | | Empire State Realty Trust, Inc. - Class A | | | 37,031 | |
| | 1,398 | | | EPR Properties | | | 50,132 | |
| | 1,135 | | | Equity LifeStyle Properties, Inc. | | | 71,323 | |
| | 1,203 | | | Essential Properties Realty Trust, Inc. | | | 23,398 | |
| | 2,660 | | | Farmland Partners, Inc. | | | 33,702 | |
| | 507 | | | Federal Realty OP LP | | | 45,691 | |
| | 851 | | | First Industrial Realty Trust, Inc. | | | 38,133 | |
| | 1,492 | | | Gaming and Leisure Properties, Inc. | | | 66,006 | |
| | 1,216 | | | Gladstone Commercial Corp. | | | 18,848 | |
| | 1,311 | | | Gladstone Land Corp. | | | 23,729 | |
| | 1,307 | | | Global Medical REIT, Inc. | | | 11,136 | |
| | 2,975 | | | Global Net Lease, Inc. | | | 31,684 | |
| | 2,624 | | | Granite Point Mortgage Trust, Inc. | | | 16,899 | |
| | 3,323 | | | Healthcare Realty Trust, Inc. | | | 69,284 | |
| | 4,780 | | | Hersha Hospitality Trust - Class A | | | 38,144 | |
| | 1,400 | | | Highwoods Properties, Inc. | | | 37,744 | |
| | 7,240 | | | Host Hotels & Resorts, Inc. | | | 114,971 | |
| | 3,005 | | | Hudson Pacific Properties, Inc. | | | 32,905 | |
| | 1,665 | | | Independence Realty Trust, Inc. (b) | | | 27,855 | |
| | 2,702 | | | Industrial Logistics Properties Trust | | | 14,861 | |
| | 2,001 | | | Iron Mountain, Inc. | | | 87,984 | |
| | 1,544 | | | JBG SMITH Properties (b) | | | 28,688 | |
| | 1,015 | | | Kennedy-Wilson Holdings, Inc. (b) | | | 15,692 | |
| | | | | | | | |
Number of
Shares
| | | | | Value
| |
| | | | | Real Estate Investment Trusts (Continued) | |
| | 1,696 | | | Kilroy Realty Corp. | | $ | 71,419 | |
| | 6,694 | | | Kimco Realty Corp. | | | 123,237 | |
| | 3,552 | | | Kite Realty Group Trust | | | 61,165 | |
| | 1,079 | | | KKR Real Estate Finance Trust, Inc. (b) | | | 17,534 | |
| | 519 | | | Lamar Advertising Co. - Class A | | | 42,812 | |
| | 537 | | | Life Storage, Inc. | | | 59,478 | |
| | 457 | | | LTC Properties, Inc. | | | 17,115 | |
| | 2,483 | | | LXP Industrial Trust | | | 22,744 | |
| | 5,334 | | | Macerich Co. | | | 42,352 | |
| | 5,837 | | | Medical Properties Trust, Inc. | | | 69,227 | |
| | 247 | | | National Health Investors, Inc. | | | 13,963 | |
| | 1,218 | | | National Retail Properties, Inc. | | | 48,549 | |
| | 925 | | | National Storage Affiliates Trust | | | 38,462 | |
| | 394 | | | NexPoint Residential Trust, Inc. | | | 18,207 | |
| | 2,535 | | | Office Properties Income Trust | | | 35,617 | |
| | 1,106 | | | Omega Healthcare Investors, Inc. | | | 32,616 | |
| | 3,416 | | | Orion Office REIT, Inc. | | | 29,890 | |
| | 924 | | | Outfront Media, Inc. | | | 14,036 | |
| | 7,463 | | | Paramount Group, Inc. | | | 46,494 | |
| | 2,989 | | | Park Hotels & Resorts, Inc. | | | 33,656 | |
| | 2,889 | | | Pebblebrook Hotel Trust (b) | | | 41,919 | |
| | 1,052 | | | Phillips Edison & Co, Inc. (b) | | | 29,509 | |
| | 1,431 | | | Physicians Realty Trust | | | 21,522 | |
| | 3,538 | | | Piedmont Office Realty Trust, Inc. - Class A | | | 37,361 | |
| | 1,082 | | | Plymouth Industrial REIT, Inc. | | | 18,188 | |
| | 1,745 | | | Postal Realty Trust, Inc. - Class A | | | 25,599 | |
| | 2,643 | | | PotlatchDeltic Corp. | | | 108,469 | |
| | 1,128 | | | Rayonier, Inc. | | | 33,806 | |
| | 2,811 | | | Ready Capital Corp. | | | 28,504 | |
| | 4,507 | | | Redwood Trust, Inc. | | | 25,870 | |
| | 1,819 | | | Regency Centers Corp. | | | 97,953 | |
| | 3,205 | | | Retail Opportunity Investments Corp. | | | 44,101 | |
| | 1,208 | | | Rexford Industrial Realty, Inc. | | | 62,816 | |
| | 8,954 | | | Rithm Capital Corp. (b) | | | 65,543 | |
| | 2,198 | | | RLJ Lodging Trust | | | 22,244 | |
| | 3,658 | | | RPT Realty | | | 27,654 | |
| | 363 | | | Ryman Hospitality Properties, Inc. (b) | | | 26,713 | |
| | 2,930 | | | Sabra Health Care REIT, Inc. | | | 38,442 | |
| | 709 | | | Saul Centers, Inc. | | | 26,588 | |
| | 8,877 | | | Service Properties Trust | | | 46,072 | |
| | 3,318 | | | SITE Centers Corp. | | | 35,536 | |
| | 892 | | | SL Green Realty Corp. (b) | | | 35,823 | |
| | 1,424 | | | Spirit Realty Capital, Inc. | | | 51,492 | |
| | 748 | | | STAG Industrial, Inc. | | | 21,266 | |
| | 3,266 | | | Starwood Property Trust, Inc. (b) | | | 59,507 | |
| | 2,166 | | | STORE Capital Corp. | | | 67,861 | |
| | 5,458 | | | Summit Hotel Properties, Inc. | | | 36,678 | |
| | 3,469 | | | Sunstone Hotel Investors, Inc. | | | 32,678 | |
| | 3,216 | | | Tanger Factory Outlet Centers, Inc. | | | 43,995 | |
| | 463 | | | Terreno Realty Corp. | | | 24,534 | |
| | 11,390 | | | The Geo Group, Inc. (a)(b) | | | 87,703 | |
| | 5,976 | | | The Necessity Retail REIT, Inc. - Class A | | | 35,139 | |
| | 2,435 | | | TPG RE Finance Trust, Inc. | | | 17,045 | |
| | 10,081 | | | Two Harbors Investment Corp. | | | 33,469 | |
| | 3,497 | | | Uniti Group, Inc. | | | 24,304 | |
| | 1,406 | | | Urban Edge Properties | | | 18,756 | |
| | 1,582 | | | Urstadt Biddle Properties, Inc. - Class A (b) | | | 24,537 | |
| | 3,287 | | | Veris Residential, Inc. (a) | | | 37,373 | |
| | 2,380 | | | Vornado Realty Trust | | | 55,121 | |
See notes to financial statements.
65
GuideMark Small/Mid Cap Core Fund
SCHEDULE OF INVESTMENTS (Continued) (Unaudited)
September 30, 2022
| | | | | | | | |
Number of
Shares
| | | | | Value
| |
| | | | | REAL ESTATE INVESTMENT TRUSTS (Continued) | |
| | | | | Real Estate Investment Trusts (Continued) | |
| | 6,037 | | | Whitestone | | $ | 51,073 | |
| | 3,015 | | | Xenia Hotels & Resorts, Inc. | | | 41,577 | |
| | | | | | |
|
|
|
| | | | | Total Real Estate Investment Trusts
(Cost $6,068,990) | | | 4,881,027 | |
| | | | | | |
|
|
|
| | | | | SHORT TERM INVESTMENTS - 0.36% | |
| | | | | Money Market Funds - 0.36% | |
| | 315,900 | | | DWS Government Money Market
Series - Institutional Shares
Effective Yield, 3.04% (d) | | | 315,900 | |
| | | | | | |
|
|
|
| | | | | Total Short Term Investments
(Cost $315,900) | | | 315,900 | |
| | | | | | |
|
|
|
| | |
Number of
Units
| | | | | | |
| | | | |
| |
| | | | | INVESTMENTS PURCHASED WITH PROCEEDS FROM SECURITIES LENDING COLLATERAL - 25.88% | |
| | 22,782,871 | | | Mount Vernon Liquid Assets Portfolio, LLC Effective Yield, 3.18% (d) | | | 22,782,871 | |
| | | | | | |
|
|
|
| | | | | Total Investments Purchased with Proceeds from Securities Lending Collateral
(Cost $22,782,871) | | | 22,782,871 | |
| | | | | | |
|
|
|
| | | | | Total Investments
(Cost $99,588,226) - 125.79% | | | 110,738,588 | |
| | | | | Liabilities in Excess of
Other Assets - (25.79)% | | | (22,701,529 | ) |
| | | | | | |
|
|
|
| | | | | TOTAL NET ASSETS - 100.00% | | $ | 88,037,059 | |
| | | | | | |
|
|
|
Percentages are stated as a percent of net assets.
ADR American Depositary Receipt
| (a) | | Non-income producing security. |
| (b) | | All or portion of this security is on loan. |
| (c) | | Value determined using significant unobservable inputs. Classified as Level 3 in the fair value hierarchy. |
| (d) | | Seven-day yield as of September 30, 2022. |
| (e) | | As of September 30, 2022, the Valuation Committee has fair valued these securities. The value of these securities were $13,159, which represents 0.01% of total net assets. |
| (f) | | These securities have been deemed illiquid according to the Fund’s liquidity guidelines. The value of these securities total $13,159, which represents 0.01% of the total assets. |
See notes to financial statements.
66
GuideMark World ex-US Fund
SCHEDULE OF INVESTMENTS (Unaudited)
September 30, 2022
| | | | | | | | |
Number of
Shares
| | | | | Value
| |
| | | | | COMMON STOCKS - 94.29% | |
| | | | | Australia - 5.32% | |
| | 1,541 | | | Ampol, Ltd. | | $ | 28,504 | |
| | 9,368 | | | APA Group - Stapled Security | | | 57,641 | |
| | 1,030 | | | Aristocrat Leisure, Ltd. | | | 21,719 | |
| | 8,393 | | | Australia & New Zealand Banking Group, Ltd. | | | 122,864 | |
| | 24,842 | | | BHP Billiton, Ltd. | | | 617,528 | |
| | 30,278 | | | BlueScope Steel, Ltd. | | | 294,050 | |
| | 1,464 | | | Cochlear, Ltd. | | | 181,855 | |
| | 26,268 | | | Coles Group, Ltd. | | | 276,928 | |
| | 4,886 | | | Commonwealth Bank of Australia | | | 284,244 | |
| | 7,085 | | | Computershare, Ltd. | | | 113,007 | |
| | 863 | | | CSL, Ltd. | | | 156,952 | |
| | 7,418 | | | Endeavour Group, Ltd. | | | 33,338 | |
| | 11,894 | | | Fortescue Metals Group, Ltd. | | | 127,687 | |
| | 8,917 | | | IDP Education, Ltd. | | | 149,792 | |
| | 1,172 | | | Macquarie Group, Ltd. | | | 114,341 | |
| | 12,150 | | | National Australia Bank, Ltd. | | | 224,966 | |
| | 2,143 | | | Orica, Ltd. | | | 18,245 | |
| | 20,788 | | | Origin Energy, Ltd. | | | 68,974 | |
| | 1,051 | | | REA Group, Ltd. | | | 76,499 | |
| | 4,037 | | | Rio Tinto, Ltd. | | | 244,208 | |
| | 10,723 | | | Santos, Ltd. | | | 49,535 | |
| | 1,299 | | | Sonic Healthcare, Ltd. | | | 25,337 | |
| | 76,385 | | | South32, Ltd. | | | 181,332 | |
| | 4,380 | | | Suncorp Group, Ltd. | | | 28,264 | |
| | 17,261 | | | Telstra Corp., Ltd. | | | 42,621 | |
| | 88,104 | | | The Lottery Corp., Ltd. (a) | | | 236,115 | |
| | 4,750 | | | Transurban Group - Stapled Security | | | 37,513 | |
| | 6,377 | | | Wesfarmers, Ltd. | | | 174,338 | |
| | 6,555 | | | Westpac Banking Corp. | | | 86,723 | |
| | 1,030 | | | WiseTech Global, Ltd. | | | 33,653 | |
| | 7,912 | | | Woodside Energy Group, Ltd. | | | 161,655 | |
| | 11,616 | | | Woolworths, Ltd. | | | 252,424 | |
| | | | | | |
|
|
|
| | | | | | | | 4,522,852 | |
| | | | | | |
|
|
|
| | | | | Austria - 0.49% | |
| | 5,017 | | | Erste Group Bank AG | | | 109,983 | |
| | 6,936 | | | OMV AG | | | 251,035 | |
| | 695 | | | Verbund AG | | | 59,337 | |
| | | | | | |
|
|
|
| | | | | | | | 420,355 | |
| | | | | | |
|
|
|
| | | | | Belgium - 0.78% | |
| | 3,726 | | | Ageas SA | | | 135,893 | |
| | 3,141 | | | Anheuser-Busch InBev SA | | | 142,276 | |
| | 790 | | | D’ieteren Group | | | 111,311 | |
| | 919 | | | Elia Group SA | | | 108,139 | |
| | 687 | | | Solvay SA | | | 53,189 | |
| | 1,597 | | | UCB SA | | | 110,828 | |
| | | | | | |
|
|
|
| | | | | | | | 661,636 | |
| | | | | | |
|
|
|
| | | | | Canada - 11.69% | |
| | 5,341 | | | Alimentation Couche-Tard, Inc. | | | 215,016 | |
| | 4,684 | | | AltaGas, Ltd. | | | 89,689 | |
| | 18,336 | | | ARC Resources, Ltd. | | | 220,215 | |
| | 3,697 | | | Bank of Montreal | | | 324,028 | |
| | 5,058 | | | Barrick Gold Corp. | | | 78,395 | |
| | 4,376 | | | Bausch Health Cos., Inc. (a) | | | 30,222 | |
| | 444 | | | BCE, Inc. | | | 18,617 | |
| | 1,639 | | | Brookfield Asset Management, Inc. - Class A | | | 67,050 | |
| | 2,007 | | | BRP, Inc. | | | 123,629 | |
| | 2,546 | | | Canadian Imperial Bank of Commerce | | | 111,435 | |
| | | | | | | | |
Number of
Shares
| | | | | Value
| |
| | | | | Canada (Continued) | |
| | 1,005 | | | Canadian National Railway Co. | | $ | 108,536 | |
| | 5,965 | | | Canadian Natural Resources, Ltd. | | | 277,663 | |
| | 1,863 | | | Canadian Pacific Railway, Ltd. | | | 124,362 | |
| | 224 | | | Canadian Tire Corp., Ltd. - Class A | | | 23,846 | |
| | 2,838 | | | Canadian Utilities, Ltd. - Class A | | | 73,819 | |
| | 24,495 | | | Cenovus Energy, Inc. | | | 376,287 | |
| | 653 | | | CGI, Inc. (a) | | | 49,159 | |
| | 282 | | | Constellation Software, Inc. | | | 392,391 | |
| | 5,349 | | | Dollarama, Inc. | | | 307,073 | |
| | 13,461 | | | Empire Co., Ltd. - Series A | | | 334,832 | |
| | 6,422 | | | Enbridge, Inc. | | | 238,126 | |
| | 375 | | | Fairfax Financial Holdings, Ltd. | | | 171,270 | |
| | 5,922 | | | First Quantum Minerals, Ltd. | | | 100,533 | |
| | 659 | | | FirstService Corp. | | | 78,444 | |
| | 1,080 | | | Fortis, Inc. | | | 41,031 | |
| | 2,226 | | | George Weston, Ltd. | | | 233,066 | |
| | 3,017 | | | Great-West Lifeco, Inc. | | | 65,130 | |
| | 2,681 | | | Hydro One, Ltd. | | | 65,562 | |
| | 2,575 | | | iA Financial Corp., Inc. | | | 130,842 | |
| | 6,792 | | | Imperial Oil, Ltd. | | | 294,081 | |
| | 701 | | | Intact Financial Corp. | | | 99,206 | |
| | 6,443 | | | Loblaw Cos., Ltd. | | | 510,179 | |
| | 36,892 | | | Lundin Mining Corp. | | | 186,416 | |
| | 999 | | | Magna International, Inc. | | | 47,392 | |
| | 23,146 | | | Manulife Financial Corp. | | | 363,272 | |
| | 1,709 | | | Metro, Inc. | | | 85,577 | |
| | 746 | | | National Bank of Canada | | | 46,758 | |
| | 2,747 | | | Nutrien, Ltd. | | | 229,091 | |
| | 3,535 | | | Pembina Pipeline Corp. | | | 107,379 | |
| | 7,950 | | | Power Corp. of Canada | | | 179,160 | |
| | 8,049 | | | Royal Bank of Canada | | | 724,693 | |
| | 1,020 | | | Sun Life Financial, Inc. | | | 40,561 | |
| | 11,124 | | | Suncor Energy, Inc. | | | 313,261 | |
| | 2,229 | | | TC Energy Corp. (b) | | | 89,783 | |
| | 7,502 | | | Teck Resources, Ltd. - Class B (a) | | | 228,153 | |
| | 2,367 | | | TELUS Corp. | | | 47,002 | |
| | 4,879 | | | The Bank of Nova Scotia | | | 232,056 | |
| | 8,740 | | | The Toronto-Dominion Bank | | | 536,036 | |
| | 535 | | | Toromont Industries, Ltd. | | | 37,243 | |
| | 3,928 | | | Tourmaline Oil Corp. | | | 204,142 | |
| | 6,620 | | | West Fraser Timber Co., Ltd. | | | 478,906 | |
| | 3,441 | | | WSP GLOBAL, Inc. | | | 378,937 | |
| | | | | | |
|
|
|
| | | | | | | | 9,929,552 | |
| | | | | | |
|
|
|
| | | | | Denmark - 2.58% | | | | |
| | 119 | | | A.P. Moeller - Maersk AS - Class A | | | 210,245 | |
| | 136 | | | A.P. Moeller - Maersk AS - Class B | | | 247,143 | |
| | 598 | | | Coloplast AS - Series B | | | 60,771 | |
| | 10,430 | | | Danske Bank AS | | | 129,819 | |
| | 293 | | | DSV AS | | | 34,324 | |
| | 11,383 | | | Novo Nordisk AS - Series B | | | 1,133,950 | |
| | 3,939 | | | Pandora AS | | | 184,212 | |
| | 552 | | | Rockwool International AS - B Shares | | | 87,071 | |
| | 2,277 | | | Tryg AS | | | 47,006 | |
| | 2,346 | | | William Demant Holdings AS (a) | | | 57,997 | |
| | | | | | |
|
|
|
| | | | | | | | 2,192,538 | |
| | | | | | |
|
|
|
| | | | | Finland - 0.97% | | | | |
| | 446 | | | Elisa OYJ | | | 20,208 | |
| | 8,205 | | | Fortum OYJ | | | 110,250 | |
| | 18,353 | | | Nokia OYJ | | | 78,790 | |
See notes to financial statements.
67
GuideMark World ex-US Fund
SCHEDULE OF INVESTMENTS (Continued) (Unaudited)
September 30, 2022
| | | | | | | | |
Number of
Shares
| | | | | Value
| |
| | | | | COMMON STOCKS (Continued) | |
| | | | | Finland (Continued) | |
| | 12,637 | | | Nordea Bank Abp | | $ | 108,150 | |
| | 6,949 | | | Orion OYJ - Class B | | | 292,604 | |
| | 2,888 | | | Sampo OYJ - Series A | | | 123,293 | |
| | 4,899 | | | Stora Enso OYJ - R Shares | | | 62,234 | |
| | 829 | | | UPM-Kymmene OYJ | | | 26,308 | |
| | | | | | |
|
|
|
| | | | | | | | 821,837 | |
| | | | | | |
|
|
|
| | | | | France - 10.49% | |
| | 730 | | | Aeroports de Paris (a) | | | 84,359 | |
| | 1,187 | | | Air Liquide SA | | | 135,673 | |
| | 12,537 | | | AXA SA | | | 273,718 | |
| | 1,331 | | | BioMerieux | | | 105,282 | |
| | 6,645 | | | BNP Paribas SA | | | 280,679 | |
| | 45,490 | | | Bollore SA | | | 208,710 | |
| | 555 | | | Capgemini SE | | | 88,855 | |
| | 15,254 | | | Carrefour SA | | | 211,558 | |
| | 7,445 | | | Cie de Saint-Gobain | | | 266,200 | |
| | 22,232 | | | Credit Agricole SA | | | 180,479 | |
| | 1,187 | | | Danone SA | | | 56,127 | |
| | 920 | | | Dassault Aviation SA | | | 104,669 | |
| | 309 | | | Dassault Systemes SE | | | 10,668 | |
| | 1,215 | | | Edenred | | | 55,976 | |
| | 3,958 | | | Eiffage SA | | | 317,403 | |
| | 5,238 | | | Electricite de France SA | | | 60,747 | |
| | 8,718 | | | Engie SA | | | 100,343 | |
| | 620 | | | EssilorLuxottica SA | | | 84,272 | |
| | 2,705 | | | Eurazeo SE | | | 141,150 | |
| | 8,086 | | | Getlink SE | | | 125,392 | |
| | 271 | | | Hermes International | | | 318,727 | |
| | 4,485 | | | Ipsen SA | | | 415,086 | |
| | 237 | | | Kering SA | | | 105,121 | |
| | 10,540 | | | La Francaise des Jeux SAEM | | | 312,657 | |
| | 1,546 | | | L’Oreal SA | | | 494,319 | |
| | 1,501 | | | LVMH Moet Hennessy Louis Vuitton SE | | | 884,948 | |
| | 11,492 | | | Orange SA | | | 103,939 | |
| | 333 | | | Pernod Ricard SA | | | 61,090 | |
| | 3,149 | | | Publicis Groupe SA | | | 149,208 | |
| | 128 | | | Remy Cointreau SA | | | 21,241 | |
| | 6,552 | | | Renault SA (a) | | | 177,270 | |
| | 766 | | | Safran SA | | | 69,698 | |
| | 6,107 | | | Sanofi-Aventis SA | | | 465,025 | |
| | 267 | | | Sartorius Stedim Biotech | | | 81,898 | |
| | 1,042 | | | Schneider Electric SE | | | 117,694 | |
| | 4,067 | | | SEB SA | | | 255,817 | |
| | 10,614 | | | Societe Generale SA | | | 209,903 | |
| | 1,215 | | | Sodexo SA | | | 91,247 | |
| | 1,053 | | | Thales SA | | | 116,034 | |
| | 14,273 | | | Total SA | | | 669,609 | |
| | 504 | | | Ubisoft Entertainment SA (a) | | | 13,851 | |
| | 1,498 | | | Unibail-Rodamco-Westfield (a) | | | 61,987 | |
| | 4,850 | | | Valeo SA | | | 73,282 | |
| | 964 | | | Veolia Environnement SA | | | 18,424 | |
| | 2,782 | | | Vinci SA | | | 224,954 | |
| | 14,994 | | | Vivendi SA | | | 116,302 | |
| | 5,446 | | | Wendel SA | | | 389,796 | |
| | | | | | |
|
|
|
| | | | | | | | 8,911,387 | |
| | | | | | |
|
|
|
| | | | | Germany - 6.94% | |
| | 1,947 | | | adidas AG | | | 223,829 | |
| | 1,270 | | | Allianz SE | | | 200,068 | |
| | | | | | | | |
Number of
Shares
| | | | | Value
| |
| | | | | Germany (Continued) | |
| | 5,098 | | | Bayer AG | | $ | 234,887 | |
| | 3,239 | | | Bayerische Motoren Werke AG | | | 219,531 | |
| | 624 | | | Beiersdorf AG | | | 61,315 | |
| | 518 | | | Carl Zeiss Meditec AG | | | 53,807 | |
| | 26,833 | | | Commerzbank AG (a) | | | 191,024 | |
| | 796 | | | Covestro AG | | | 22,759 | |
| | 6,389 | | | Daimler AG | | | 323,071 | |
| | 3,644 | | | Daimler Truck Holding AG (a) | | | 82,381 | |
| | 30,052 | | | Deutsche Bank AG | | | 222,504 | |
| | 782 | | | Deutsche Boerse AG | | | 128,190 | |
| | 42,020 | | | Deutsche Lufthansa AG (a) | | | 241,537 | |
| | 11,721 | | | Deutsche Post AG | | | 353,266 | |
| | 15,607 | | | Deutsche Telekom AG | | | 265,656 | |
| | 7,009 | | | Fresenius Medical Care AG & Co. KGaA | | | 197,464 | |
| | 11,521 | | | Fresenius SE & Co. KGaA | | | 245,571 | |
| | 686 | | | GEA Group AG | | | 22,201 | |
| | 2,673 | | | HeidelbergCement AG | | | 105,594 | |
| | 9,801 | | | HelloFresh SE (a) | | | 205,153 | |
| | 2,233 | | | Knorr-Bremse AG | | | 95,892 | |
| | 985 | | | Merck KGaA | | | 159,452 | |
| | 358 | | | MTU Aero Engines AG | | | 53,505 | |
| | 326 | | | Muenchener Rueckversicherungs-Gesellschaft AG | | | 78,475 | |
| | 4,483 | | | Nemetschek SE | | | 212,792 | |
| | 3,889 | | | Puma SE | | | 179,905 | |
| | 417 | | | Rational AG | | | 201,961 | |
| | 1,127 | | | Rheinmetall AG | | | 173,521 | |
| | 4,440 | | | RWE AG | | | 163,196 | |
| | 2,026 | | | SAP SE | | | 165,109 | |
| | 1,773 | | | Siemens AG | | | 173,297 | |
| | 5,488 | | | Siemens Energy AG | | | 60,427 | |
| | 40,454 | | | Telefonica Deutschland Holding AG | | | 81,790 | |
| | 3,667 | | | Uniper SE | | | 13,840 | |
| | 6,614 | | | United Internet AG | | | 123,641 | |
| | 868 | | | Volkswagen AG | | | 141,457 | |
| | 1,406 | | | Vonovia SE | | | 30,344 | |
| | 9,637 | | | Zalando SE (a) | | | 188,238 | |
| | | | | | |
|
|
|
| | | | | | | | 5,896,650 | |
| | | | | | |
|
|
|
| | | | | Hong Kong - 2.14% | |
| | 17,385 | | | AIA Group, Ltd. | | | 144,746 | |
| | 26,522 | | | BOC Hong Kong Holdings, Ltd. | | | 88,205 | |
| | 10,212 | | | Budweiser Brewing Co., APAC, Ltd. | | | 26,593 | |
| | 22,972 | | | CK Asset Holdings, Ltd. | | | 137,910 | |
| | 44,574 | | | CK Hutchison Holdings, Ltd. | | | 245,435 | |
| | 8,670 | | | CK Infrastructure Holdings, Ltd. | | | 44,220 | |
| | 4,480 | | | Hong Kong Exchange & Clearing, Ltd. | | | 153,137 | |
| | 5,973 | | | Jardine Matheson Holdings, Ltd. | | | 301,983 | |
| | 32,127 | | | New World Development Co., Ltd. | | | 91,243 | |
| | 5,530 | | | Power Assets Holdings, Ltd. | | | 27,721 | |
| | 41,366 | | | Sino Land Co., Ltd. | | | 54,410 | |
| | 90,276 | | | SITC International Holdings Co., Ltd. | | | 165,560 | |
| | 8,675 | | | Techtronic Industries Co., Ltd. | | | 82,778 | |
| | 411,102 | | | WH Group, Ltd. | | | 258,558 | |
| | | | | | |
|
|
|
| | | | | | | | 1,822,499 | |
| | | | | | |
|
|
|
| | | | | Ireland - 0.22% | |
| | 743 | | | CRH PLC | | | 23,889 | |
| | 751 | | | DCC PLC | | | 39,001 | |
| | 3,992 | | | James Hardie Industries PLC | | | 78,413 | |
| | 1,075 | | | Kingspan Group PLC | | | 48,119 | |
| | | | | | |
|
|
|
| | | | | | | | 189,422 | |
| | | | | | |
|
|
|
See notes to financial statements.
68
GuideMark World ex-US Fund
SCHEDULE OF INVESTMENTS (Continued) (Unaudited)
September 30, 2022
| | | | | | | | |
Number of
Shares
| | | | | Value
| |
| | | | | COMMON STOCKS (Continued) | |
| | | | | Isle Of Man - 0.05% | |
| | 3,698 | | | Entain PLC | | $ | 44,215 | |
| | | | | | |
|
|
|
| | | | | Israel - 1.17% | |
| | 2,510 | | | Bank Hapoalim BM | | | 21,188 | |
| | 13,040 | | | Bank Leumi Le-Israel BM | | | 111,372 | |
| | 49,714 | | | Bezeq the Israel Telecommunication Corp., Ltd. | | | 81,267 | |
| | 134 | | | Elbit Systems, Ltd. | | | 25,371 | |
| | 17,483 | | | ICL Group, Ltd. | | | 140,117 | |
| | 4,105 | | | Israel Discount Bank, Ltd. - Series A | | | 20,670 | |
| | 2,037 | | | Mizrahi Tefahot Bank, Ltd. | | | 71,313 | |
| | 18,873 | | | Teva Pharmaceutical Industries, Ltd. - ADR (a) | | | 152,305 | |
| | 446 | | | Tower Semiconductor, Ltd. (a) | | | 19,468 | |
| | 186 | | | Wix.com, Ltd. - ADR (a) | | | 14,551 | |
| | 14,283 | | | ZIM Integrated Shipping Services, Ltd. - ADR (b) | | | 335,650 | |
| | | | | | |
|
|
|
| | | | | | | | 993,272 | |
| | | | | | |
|
|
|
| | | | | Italy - 2.00% | |
| | 13,156 | | | Assicurazioni Generali SpA | | | 179,636 | |
| | 6,190 | | | Atlantia SpA | | | 136,586 | |
| | 32,459 | | | Eni SpA | | | 344,996 | |
| | 2,272 | | | Exor NV (d) | | | 145,802 | |
| | 2,533 | | | FinecoBank Banca Fineco SpA | | | 31,284 | |
| | 31,695 | | | Intesa Sanpaolo SpA | | | 52,392 | |
| | 4,350 | | | Moncler SpA | | | 177,586 | |
| | 25,981 | | | Poste Italiane SpA | | | 196,286 | |
| | 1,085 | | | Prysmian SpA | | | 31,078 | |
| | 1,660 | | | Recordati SpA | | | 60,753 | |
| | 2,493 | | | Snam SpA | | | 10,076 | |
| | 1,358,636 | | | Telecom Italia SpA (a) | | | 251,302 | |
| | 6,052 | | | Terna Rete Elettrica Nazionale SpA | | | 36,860 | |
| | 4,006 | | | UniCredit SpA | | | 40,557 | |
| | | | | | |
|
|
|
| | | | | | | | 1,695,194 | |
| | | | | | |
|
|
|
| | | | | Japan - 18.03% | |
| | 2,917 | | | Advantest Corp. | | | 134,709 | |
| | 3,659 | | | Ajinomoto Co., Inc. | | | 100,005 | |
| | 997 | | | Asahi Glass Co., Ltd. | | | 31,038 | |
| | 1,856 | | | Asahi Group Holdings, Ltd. | | | 57,863 | |
| | 20,059 | | | Astellas Pharma, Inc. | | | 265,728 | |
| | 1,836 | | | Bandai Namco Holdings, Inc. | | | 119,649 | |
| | 1,154 | | | Bridgestone Corp. | | | 37,321 | |
| | 7,845 | | | Brother Industries, Ltd. | | | 135,535 | |
| | 4,271 | | | Canon, Inc. | | | 93,289 | |
| | 2,836 | | | Capcom Co., Ltd. | | | 71,403 | |
| | 5,999 | | | Chugai Pharmaceutical Co., Ltd. | | | 149,874 | |
| | 21,610 | | | CyberAgent, Inc. | | | 181,959 | |
| | 2,683 | | | Dai Nippon Printing Co., Ltd. | | | 53,752 | |
| | 8,997 | | | Dai-ichi Life Holdings, Inc. | | | 143,055 | |
| | 6,007 | | | Daiichi Sankyo Co., Ltd. | | | 167,901 | |
| | 270 | | | Daikin Industries, Ltd. | | | 41,545 | |
| | 433 | | | Denso Corp. | | | 19,798 | |
| | 1,459 | | | Dentsu, Inc. | | | 41,476 | |
| | 178 | | | Disco Corp. | | | 39,240 | |
| | 3,051 | | | Eisai Co., Ltd. | | | 163,714 | |
| | 144 | | | Fast Retailing Co., Ltd. | | | 76,312 | |
| | 1,086 | | | Fujitsu, Ltd. | | | 119,082 | |
| | 696 | | | Hankyu Hanshin Holdings, Inc. | | | 20,947 | |
| | 4,390 | | | Hitachi, Ltd. | | | 186,821 | |
| | 14,763 | | | Honda Motor Co., Ltd. | | | 320,443 | |
| | 3,273 | | | Hoya Corp. | | | 315,382 | |
| | | | | | | | |
Number of
Shares
| | | | | Value
| |
| | | | | Japan (Continued) | | | | |
| | 3,194 | | | Idemitsu Kosan Co., Ltd. | | $ | 69,416 | |
| | 35,984 | | | Inpex Corp. | | | 335,626 | |
| | 9,860 | | | Isuzu Motors, Ltd. | | | 109,026 | |
| | 4,121 | | | Ito En, Ltd. | | | 166,694 | |
| | 13,432 | | | ITOCHU Corp. | | | 324,221 | |
| | 2,837 | | | Japan Post Bank Co., Ltd. | | | 19,831 | |
| | 32,630 | | | Japan Post Holdings Co., Ltd. | | | 216,181 | |
| | 14,765 | | | Japan Post Insurance Co., Ltd. | | | 206,800 | |
| | 5,548 | | | Japan Tobacco, Inc. | | | 91,169 | |
| | 11,565 | | | Kakaku.com, Inc. | | | 195,983 | |
| | 1,400 | | | Kao Corp. | | | 56,967 | |
| | 8,293 | | | KDDI Corp. | | | 242,456 | |
| | 252 | | | Keyence Corp. | | | 83,301 | |
| | 792 | | | Kikkoman Corp. | | | 44,899 | |
| | 1,374 | | | Kintetsu Group Holdings Co., Ltd. | | | 45,746 | |
| | 1,050 | | | Kirin Holdings Co., Ltd. | | | 16,176 | |
| | 399 | | | Konami Holdings Corp. | | | 18,475 | |
| | 2,291 | | | Kose Corp. | | | 236,212 | |
| | 382 | | | Kyocera Corp. | | | 19,245 | |
| | 3,551 | | | LIXIL Group Corp. | | | 52,103 | |
| | 338 | | | M3, Inc. | | | 9,438 | |
| | 40,531 | | | Marubeni Corp. | | | 353,653 | |
| | 11,066 | | | Mazda Motor Corp. | | | 73,480 | |
| | 6,007 | | | MISUMI Group, Inc. | | | 129,345 | |
| | 12,321 | | | Mitsubishi Corp. | | | 336,982 | |
| | 2,820 | | | Mitsubishi Electric Corp. | | | 25,516 | |
| | 1,446 | | | Mitsubishi Estate Co., Ltd. | | | 19,053 | |
| | 6,387 | | | Mitsubishi Heavy Industries, Ltd. | | | 212,427 | |
| | 44,033 | | | Mitsubishi UFJ Financial Group, Inc. | | | 199,475 | |
| | 17,786 | | | Mitsubishi UFJ Lease & Finance Co., Ltd. | | | 76,448 | |
| | 15,480 | | | Mitsui & Co., Ltd. | | | 329,411 | |
| | 864 | | | Mitsui Fudosan Co., Ltd. | | | 16,459 | |
| | 9,284 | | | Mitsui OSK Lines, Ltd. (b) | | | 166,115 | |
| | 9,801 | | | Mizuho Financial Group, Inc. | | | 106,092 | |
| | 15,863 | | | MonotaRO Co., Ltd. | | | 243,415 | |
| | 2,035 | | | MS & AD Insurance Group Holdings, Inc. (a) | | | 53,892 | |
| | 265 | | | Murata Manufacturing Co., Ltd. | | | 12,197 | |
| | 2,173 | | | NEC Corp. | | | 69,580 | |
| | 2,242 | | | Nexon Co., Ltd. | | | 39,611 | |
| | 2,612 | | | NGK Insulators, Ltd. | | | 32,511 | |
| | 2,990 | | | Nintendo Co., Ltd. | | | 120,600 | |
| | 1,374 | | | Nippon Steel & Sumitomo Metal Corp. | | | 19,069 | |
| | 19,971 | | | Nippon Telegraph & Telephone Corp. | | | 538,664 | |
| | 12,963 | | | Nippon Yusen Kabushiki Kaisha | | | 220,032 | |
| | 1,017 | | | Nissan Chemical Industries, Ltd. | | | 45,433 | |
| | 945 | | | Nitori Holdings Co., Ltd. | | | 79,305 | |
| | 961 | | | Nomura Research Institute, Ltd. | | | 23,471 | |
| | 2,407 | | | NTT Data Corp. | | | 31,091 | |
| | 47,328 | | | Oji Holdings Corp. | | | 175,618 | |
| | 11,782 | | | Olympus Corp. | | | 226,659 | |
| | 1,207 | | | OMRON Corp. | | | 55,301 | |
| | 4,218 | | | Ono Pharmaceutical Co., Ltd. | | | 98,527 | |
| | 1,510 | | | Oracle Corp. | | | 80,038 | |
| | 673 | | | Oriental Land Co., Ltd. | | | 91,278 | |
| | 7,117 | | | ORIX Corp. | | | 99,702 | |
| | 1,068 | | | Otsuka Holdings Co., Ltd. | | | 33,818 | |
| | 14,250 | | | Persol Holdings Co., Ltd. | | | 263,603 | |
| | 10,636 | | | Recruit Holdings Co., Ltd. | | | 306,377 | |
| | 3,916 | | | Renesas Electronics Corp. (a) | | | 32,829 | |
| | 26,078 | | | Resona Holdings, Inc. | | | 95,431 | |
See notes to financial statements.
69
GuideMark World ex-US Fund
SCHEDULE OF INVESTMENTS (Continued) (Unaudited)
September 30, 2022
| | | | | | | | |
Number of
Shares
| | | | | Value
| |
| | | | | COMMON STOCKS (Continued) | |
| | | | | Japan (Continued) | | | | |
| | 9,748 | | | Ricoh Co., Ltd. | | $ | 71,377 | |
| | 11,263 | | | SBI Holdings, Inc. | | | 202,115 | |
| | 690 | | | Secom Co., Ltd. | | | 39,343 | |
| | 4,399 | | | Seiko Epson Corp. | | | 60,066 | |
| | 1,357 | | | Sekisui House, Ltd. | | | 22,475 | |
| | 3,456 | | | Seven & I Holdings Co., Ltd. - Series A | | | 138,828 | |
| | 144 | | | Shimano, Inc. | | | 22,531 | |
| | 6,891 | | | Shiseido Co., Ltd. | | | 241,510 | |
| | 11,261 | | | SoftBank Corp. | | | 112,452 | |
| | 5,427 | | | SoftBank Group Corp. | | | 183,927 | |
| | 1,972 | | | Sompo Holdings, Inc. | | | 78,902 | |
| | 3,447 | | | Sony Corp. | | | 222,037 | |
| | 2,055 | | | Square Enix Holdings Co., Ltd. | | | 88,573 | |
| | 5,512 | | | Subaru Corp. | | | 83,299 | |
| | 54,861 | | | Sumitomo Chemical Co., Ltd. | | | 188,700 | |
| | 7,594 | | | Sumitomo Corp. | | | 93,819 | |
| | 2,081 | | | Sumitomo Electric Industries, Ltd. | | | 21,125 | |
| | 8,670 | | | Sumitomo Mitsui Financial Group, Inc. | | | 240,345 | |
| | 4,317 | | | Sumitomo Mitsui Trust Holdings, Inc. | | | 122,774 | |
| | 736 | | | Suntory Beverage & Food, Ltd. | | | 26,194 | |
| | 1,788 | | | Sysmex Corp. | | | 95,544 | |
| | 6,980 | | | Taisei Corp. | | | 193,581 | |
| | 7,503 | | | Takeda Pharmaceutical Co., Ltd. | | | 194,836 | |
| | 2,906 | | | The Kansai Electric Power Co., Inc. | | | 24,313 | |
| | 617 | | | TIS, Inc. | | | 16,381 | |
| | 7,158 | | | Tokio Marine Holdings, Inc. | | | 127,220 | |
| | 14,740 | | | Tokyo Electric Power Co. Holdings, Inc. (a) | | | 47,118 | |
| | 966 | | | Tokyo Electron, Ltd. | | | 238,018 | |
| | 1,829 | | | Tokyo Gas Co., Ltd. | | | 30,875 | |
| | 3,499 | | | Toppan Printing Co., Ltd. | | | 52,121 | |
| | 14,916 | | | TOSOH Corp. | | | 166,244 | |
| | 26,430 | | | Toyota Motor Corp. | | | 345,452 | |
| | 1,553 | | | Trend Micro, Inc. | | | 83,649 | |
| | 3,703 | | | USS Co., Ltd. | | | 57,190 | |
| | 11,512 | | | Welcia Holdings Co., Ltd. | | | 242,932 | |
| | 1,434 | | | Yakult Honsha Co., Ltd. | | | 83,265 | |
| | 1,935 | | | Yokogawa Electric Corp. | | | 30,484 | |
| | 12,374 | | | ZOZO, Inc. | | | 247,698 | |
| | | | | | |
|
|
|
| | | | | | | | 15,317,627 | |
| | | | | | |
|
|
|
| | | | | Jersey - 0.92% | | | | |
| | 3,249 | | | Ferguson PLC | | | 337,015 | |
| | 70,209 | | | Glencore PLC | | | 368,948 | |
| | 8,679 | | | WPP PLC (a) | | | 71,646 | |
| | | | | | |
|
|
|
| | | | | | | | 777,609 | |
| | | | | | |
|
|
|
| | | | | Luxembourg - 0.23% | | | | |
| | 28,581 | | | Aroundtown SA | | | 62,584 | |
| | 513 | | | Eurofins Scientific SE | | | 30,454 | |
| | 7,747 | | | Tenaris SA | | | 100,238 | |
| | | | | | |
|
|
|
| | | | | | | | 193,276 | |
| | | | | | |
|
|
|
| | | | | Netherlands - 4.59% | | | | |
| | 11,075 | | | ABN AMRO Group NV | | | 99,236 | |
| | 37,703 | | | Aegon NV | | | 149,869 | |
| | 3,757 | | | AerCap Holdings NV - ADR (a) | | | 159,034 | |
| | 1,173 | | | Airbus SE | | | 101,112 | |
| | 15,970 | | | ArcelorMittal | | | 317,775 | |
| | 193 | | | Argenx SE (a) | | | 68,684 | |
| | 1,554 | | | ASML Holding NV | | | 643,787 | |
| | | | | | | | |
Number of
Shares
| | | | | Value
| |
| | | | | Netherlands (Continued) | | | | |
| | 11,361 | | | CNH Industrial NV | | $ | 127,155 | |
| | 876 | | | Ferrari NV | | | 162,222 | |
| | 1,556 | | | Heineken Holding NV | | | 106,521 | |
| | 16,042 | | | ING Groep NV | | | 137,454 | |
| | 1,835 | | | JDE Peet’s NV | | | 53,652 | |
| | 15,585 | | | Koninklijke Ahold Delhaize NV | | | 396,971 | |
| | 24,755 | | | Koninklijke KPN NV | | | 66,996 | |
| | 11,528 | | | Koninklijke Philips NV | | | 177,490 | |
| | 8,074 | | | NN Group NV | | | 314,028 | |
| | 2,239 | | | OCI NV | | | 81,973 | |
| | 1,449 | | | Qiagen NV (a) | | | 60,343 | |
| | 3,822 | | | Randstad Holding NV | | | 164,960 | |
| | 17,126 | | | Stellantis NV | | | 202,299 | |
| | 2,100 | | | STMicroelectronics NV | | | 65,262 | |
| | 2,507 | | | Wolters Kluwer NV | | | 244,115 | |
| | | | | | |
|
|
|
| | | | | | | | 3,900,938 | |
| | | | | | |
|
|
|
| | | | | New Zealand - 0.27% | | | | |
| | 17,699 | | | Fisher & Paykel Healthcare Corp., Ltd. | | | 183,448 | |
| | 906 | | | Xero, Ltd. (a) | | | 41,927 | |
| | | | | | |
|
|
|
| | | | | | | | 225,375 | |
| | | | | | |
|
|
|
| | | | | Norway - 0.83% | | | | |
| | 2,658 | | | Aker BP ASA | | | 76,296 | |
| | 3,964 | | | DNB Bank ASA | | | 62,901 | |
| | 7,226 | | | Equinor ASA | | | 238,304 | |
| | 8,233 | | | Gjensidige Forsikring ASA | | | 141,272 | |
| | 2,597 | | | Kongsberg Gruppen ASA | | | 78,813 | |
| | 11,488 | | | Norsk Hydro ASA | | | 61,644 | |
| | 738 | | | Salmar ASA | | | 24,875 | |
| | 2,265 | | | Telenor ASA | | | 20,730 | |
| | | | | | |
|
|
|
| | | | | | | | 704,835 | |
| | | | | | |
|
|
|
| | | | | Portugal - 0.41% | | | | |
| | 4,641 | | | Galp Energia SGPS SA | | | 44,653 | |
| | 16,283 | | | Jeronimo Martins SGPS SA | | | 303,244 | |
| | | | | | |
|
|
|
| | | | | | | | 347,897 | |
| | | | | | |
|
|
|
| | | | | Singapore - 1.20% | | | | |
| | 24,267 | | | Capitaland Investment, Ltd. | | | 58,383 | |
| | 12,175 | | | City Developments, Ltd. | | | 64,164 | |
| | 7,071 | | | DBS Group Holdings, Ltd. | | | 163,576 | |
| | 26,373 | | | Keppel Corp., Ltd. | | | 126,904 | |
| | 22,294 | | | Oversea-Chinese Banking Corp., Ltd. | | | 182,675 | |
| | 10,673 | | | Singapore Airlines, Ltd. (a) | | | 37,722 | |
| | 18,556 | | | Singapore Exchange, Ltd. | | | 121,734 | |
| | 36,296 | | | Singapore Telecommunications, Ltd. | | | 66,975 | |
| | 10,981 | | | United Overseas Bank, Ltd. | | | 198,894 | |
| | | | | | |
|
|
|
| | | | | | | | 1,021,027 | |
| | | | | | |
|
|
|
| | | | | Spain - 2.26% | | | | |
| | 605 | | | Acciona SA | | | 106,332 | |
| | 3,551 | | | ACS, Actividades de Construccion y Servicios SA | | | 79,788 | |
| | 1,501 | | | Amadeus IT Holdings SA (a) | | | 69,590 | |
| | 37,348 | | | Banco Bilbao Vizcaya Argentaria SA | | | 167,537 | |
| | 102,103 | | | Banco Santander SA | | | 237,583 | |
| | 26,053 | | | CaixaBank SA | | | 83,913 | |
| | 3,673 | | | Ferrovial SA | | | 83,372 | |
| | 13,277 | | | Iberdrola SA | | | 123,797 | |
| | 15,970 | | | Industria de Diseno Textil SA | | | 329,566 | |
| | 4,899 | | | Naturgy Energy Group SA | | | 113,331 | |
| | 3,222 | | | Red Electrica Corp SA | | | 49,443 | |
See notes to financial statements.
70
GuideMark World ex-US Fund
SCHEDULE OF INVESTMENTS (Continued) (Unaudited)
September 30, 2022
| | | | | | | | |
Number of
Shares
| | | | | Value
| |
| | | | | COMMON STOCKS (Continued) | |
| | | | | Spain (Continued) | | | | |
| | 31,542 | | | Repsol SA | | $ | 362,424 | |
| | 35,176 | | | Telefonica SA | | | 116,288 | |
| | | | | | |
|
|
|
| | | | | | | | 1,922,964 | |
| | | | | | |
|
|
|
| | | | | Sweden - 1.38% | | | | |
| | 5,639 | | | Atlas Copco AB - A Shares | | | 52,411 | |
| | 3,028 | | | Atlas Copco AB - B Shares | | | 25,099 | |
| | 1,169 | | | Boliden AB | | | 36,117 | |
| | 4,067 | | | EQT AB | | | 78,583 | |
| | 18,193 | | | Hennes & Mauritz AB - Series B | | | 168,196 | |
| | 3,256 | | | Investor AB | | | 49,894 | |
| | 692 | | | Investor AB | | | 10,097 | |
| | 10,333 | | | Securitas AB - Series B | | | 71,732 | |
| | 7,058 | | | Skandinaviska Enskilda Banken AB - Class A | | | 67,268 | |
| | 4,846 | | | Svenska Handelsbanken AB - Class A | | | 39,781 | |
| | 38,110 | | | Swedish Match AB | | | 376,974 | |
| | 3,749 | | | Swedish Orphan Biovitrum AB (a) | | | 72,457 | |
| | 2,324 | | | Tele2 AB - B Shares | | | 20,055 | |
| | 11,726 | | | Telefonaktiebolaget LM Ericsson - Series B (b) | | | 68,544 | |
| | 1,125 | | | Volvo AB - Class A | | | 16,647 | |
| | 1,533 | | | Volvo AB - Class B | | | 21,694 | |
| | | | | | |
|
|
|
| | | | | | | | 1,175,549 | |
| | | | | | |
|
|
|
| | | | | Switzerland - 7.23% | | | | |
| | 682 | | | Baloise Holding AG | | | 87,142 | |
| | 1,896 | | | Cie Financiere Richemont SA - Class A | | | 178,974 | |
| | 2,523 | | | Clariant AG | | | 40,302 | |
| | 968 | | | Coca-Cola HBC AG | | | 20,226 | |
| | 145 | | | EMS-Chemie Holding AG | | | 91,532 | |
| | 361 | | | Geberit AG | | | 154,793 | |
| | 1,093 | | | Kuehne & Nagel International AG | | | 222,570 | |
| | 2,814 | | | LafargeHolcim, Ltd. | | | 115,319 | |
| | 3,423 | | | Logitech International SA | | | 156,491 | |
| | 12,601 | | | Nestle SA | | | 1,362,890 | |
| | 10,540 | | | Novartis AG | | | 803,538 | |
| | 262 | | | Partners Group Holding AG | | | 210,854 | |
| | 444 | | | Roche Holding AG | | | 173,440 | |
| | 4,063 | | | Roche Holdings AG - Non-Voting Shares | | | 1,322,640 | |
| | 109 | | | SGS SA | | | 233,232 | |
| | 317 | | | Sonova Holding AG | | | 69,759 | |
| | 1,360 | | | Straumann Holding AG | | | 124,386 | |
| | 269 | | | Swiss Life Holding AG | | | 118,847 | |
| | 241 | | | The Swatch Group AG - Group I | | | 54,128 | |
| | 868 | | | The Swatch Group AG - Group N | | | 36,363 | |
| | 18,742 | | | UBS Group AG | | | 271,908 | |
| | 493 | | | VAT Group AG | | | 100,044 | |
| | 494 | | | Zurich Insurance Group AG | | | 196,934 | |
| | | | | | |
|
|
|
| | | | | | | | 6,146,312 | |
| | | | | | |
|
|
|
| | | | | United Kingdom - 12.10% | | | | |
| | 10,664 | | | 3i Group PLC | | | 128,047 | |
| | 9,079 | | | Admiral Group PLC | | | 192,870 | |
| | 4,593 | | | Anglo American PLC | | | 137,908 | |
| | 14,051 | | | Associated British Foods PLC | | | 196,328 | |
| | 8,007 | | | AstraZeneca PLC | | | 880,201 | |
| | 47,210 | | | Auto Trader Group PLC | | | 267,730 | |
| | 21,918 | | | Aviva PLC - B Shares | | | 94,002 | |
| | 16,612 | | | BAE Systems PLC | | | 145,959 | |
| | 117,452 | | | Barclays PLC | | | 186,881 | |
| | 103,883 | | | BP PLC | | | 496,391 | |
| | | | | | | | |
Number of
Shares
| | | | | Value
| |
| | | | | United Kingdom (Continued) | | | | |
| | 12,143 | | | British American Tobacco PLC | | $ | 435,416 | |
| | 3,707 | | | Bunzl PLC | | | 113,259 | |
| | 12,132 | | | Burberry Group PLC | | | 242,342 | |
| | 1,398 | | | Coca-Cola European Partners PLC - ADR (b) | | | 59,583 | |
| | 21,114 | | | Compass Group PLC | | | 420,429 | |
| | 7,565 | | | Diageo PLC | | | 318,436 | |
| | 3,347 | | | Experian PLC | | | 97,975 | |
| | 24,787 | | | GSK PLC | | | 357,990 | |
| | 9,197 | | | Haleon PLC (a) | | | 28,676 | |
| | 23,884 | | | Hargreaves Lansdown PLC | | | 228,737 | |
| | 3,978 | | | Hikma Pharmaceuticals PLC | | | 59,960 | |
| | 64,306 | | | HSBC Holdings PLC | | | 332,966 | |
| | 8,119 | | | Imperial Brands PLC | | | 166,949 | |
| | 9,111 | | | Informa PLC | | | 52,077 | |
| | 1,813 | | | InterContinental Hotels Group PLC | | | 87,317 | |
| | 114,711 | | | J. Sainsbury PLC | | | 222,146 | |
| | 197,896 | | | JD Sports Fashion PLC | | | 218,017 | |
| | 57,456 | | | Kingfisher PLC | | | 139,860 | |
| | 43,323 | | | Legal & General Group PLC | | | 103,411 | |
| | 381,505 | | | Lloyds Banking Group PLC | | | 172,435 | |
| | 14,299 | | | M&G PLC | | | 26,340 | |
| | 21,069 | | | Melrose Industries PLC | | | 23,559 | |
| | 13,575 | | | National Grid PLC | | | 139,742 | |
| | 43,379 | | | NatWest Group PLC | | | 108,044 | |
| | 3,281 | | | Next PLC | | | 174,141 | |
| | 12,649 | | | Phoenix Group Holdings PLC | | | 73,666 | |
| | 1,587 | | | Reckitt Benckiser Group PLC | | | 105,188 | |
| | 10,464 | | | RELX PLC | | | 255,695 | |
| | 6,715 | | | Rio Tinto PLC | | | 363,319 | |
| | 40,038 | | | Shell PLC | | | 993,255 | |
| | 2,508 | | | Smith & Nephew PLC | | | 28,949 | |
| | 3,152 | | | Smiths Group PLC | | | 52,503 | |
| | 3,772 | | | SSE PLC | | | 63,694 | |
| | 14,777 | | | St. James’s Place PLC | | | 168,283 | |
| | 21,287 | | | Standard Chartered PLC | | | 133,140 | |
| | 82,168 | | | Standard Life Aberdeen PLC | | | 125,693 | |
| | 69,419 | | | Tesco PLC | | | 159,321 | |
| | 25,756 | | | The Sage Group PLC | | | 198,490 | |
| | 3,521 | | | Unilever PLC | | | 154,712 | |
| | 1,949 | | | United Utilities Group PLC | | | 19,245 | |
| | 295,406 | | | Vodafone Group PLC | | | 330,617 | |
| | | | | | |
|
|
|
| | | | | | | | 10,281,894 | |
| | | | | | |
|
|
|
| | | | | Total Common Stocks
(Cost $77,112,693) | | | 80,116,712 | |
| | | | | | |
|
|
|
| | | | | INVESTMENT COMPANIES - 3.97% | |
| | | | | Canada - 0.33% | |
| | 9,319 | | | iShares MSCI Canada ETF (b) | | | 286,652 | |
| | | | | | |
|
|
|
| | | | | Japan - 3.64% | |
| | 55,182 | | | iShares MSCI EAFE ETF (b) | | | 3,090,744 | |
| | | | | | |
|
|
|
| | | | | Total Investment Companies
(Cost $3,871,995) | | | 3,377,396 | |
| | | | | | |
|
|
|
| | | | | PREFERRED STOCKS - 0.43% | |
| | | | | Germany - 0.43% | |
| | 3,083 | | | Bayerische Motoren Werke AG - Preference Shares | | | 200,204 | |
| | 1,358 | | | Volkswagen AG - Preference Shares | | | 165,936 | |
| | | | | | |
|
|
|
| | | | | Total Preferred Stocks
(Cost $445,146) | | | 366,140 | |
| | | | | | |
|
|
|
See notes to financial statements.
71
GuideMark World ex-US Fund
SCHEDULE OF INVESTMENTS (Continued) (Unaudited)
September 30, 2022
| | | | | | | | |
Number of
Shares
| | | | | Value
| |
| | | | | REAL ESTATE INVESTMENT TRUSTS - 0.18% | |
| | | | | Australia - 0.03% | |
| | 12,051 | | | Scentre Group, Ltd. | | $ | 19,690 | |
| | | | | | |
|
|
|
| | | | | Canada - 0.01% | | | | |
| | 810 | | | RioCan Real Estate Investment Trust | | | 10,919 | |
| | | | | | |
|
|
|
| | | | | France - 0.06% | | | | |
| | 2,969 | | | Klepierre | | | 51,617 | |
| | | | | | |
|
|
|
| | | | | Singapore - 0.03% | | | | |
| | 18,390 | | | CapitaLand Mall Trust | | | 24,462 | |
| | | | | | |
|
|
|
| | | | | United Kingdom - 0.05% | | | | |
| | 7,533 | | | Land Securities Group PLC | | | 43,527 | |
| | | | | | |
|
|
|
| | | | | Total Real Estate Investment Trusts
(Cost $181,007) | | | 150,215 | |
| | | | | | |
|
|
|
| | | | | SHORT TERM INVESTMENTS - 0.23% | |
| | | | | Money Market Funds - 0.23% | |
| | 192,186 | | | DWS Government Money Market Series - Institutional Shares
Effective Yield, 3.04% (c) | | | 192,186 | |
| | | | | | |
|
|
|
| | | | | Total Short Term Investments
(Cost $192,186) | | | 192,186 | |
| | | | | | |
|
|
|
| | |
Number of
Units
| | | | | | |
| | | | | INVESTMENTS PURCHASED WITH PROCEEDS FROM SECURITIES LENDING COLLATERAL - 4.86% | |
| | 4,133,164 | | | Mount Vernon Liquid Assets Portfolio, LLC Effective Yield, 3.18% (c) | | | 4,133,164 | |
| | | | | | |
|
|
|
| | | | | Total Investments Purchased with Proceeds from Securities Lending Collateral
(Cost $4,133,164) | | | 4,133,164 | |
| | | | | | |
|
|
|
| | | | | Total Investments
(Cost $85,936,191) - 103.96% | | | 88,335,813 | |
| | | | | Liabilities in Excess of
Other Assets - (3.96)% | | | (3,368,150 | ) |
| | | | | | |
|
|
|
| | | | | TOTAL NET ASSETS - 100.00% | | $ | 84,967,663 | |
| | | | | | |
|
|
|
Percentages are stated as a percent of net assets.
| (a) | | Non-income producing security. |
| (b) | | All or portion of this security is on loan. |
| (c) | | Seven-day yield as of September 30, 2022. |
| (d) | | This security has been deemed illiquid according to the Fund’s liquidity guidelines. The value of this security totals $145,802, which represents 0.17% of total net assets. |
Glossary of Terms
| | | | |
| ADR | | - | | American Depositary Receipt |
See notes to financial statements.
72
GuideMark World ex-US Fund
SCHEDULE OF INVESTMENTS BY INDUSTRY (Unaudited)
September 30, 2022
| | | | |
COMMON STOCKS | | | | |
Aerospace & Defense | | | 1.02% | |
Air Freight & Logistics | | | 0.66% | |
Airlines | | | 0.33% | |
Auto Components | | | 0.21% | |
Automobiles | | | 2.54% | |
Banks | | | 8.83% | |
Beverages | | | 1.20% | |
Biotechnology | | | 0.35% | |
Building Products | | | 0.80% | |
Capital Markets | | | 2.47% | |
Chemicals | | | 1.43% | |
Commercial Services & Supplies | | | 0.44% | |
Communications Equipment | | | 0.17% | |
Construction & Engineering | | | 1.50% | |
Construction Materials | | | 0.38% | |
Distributors | | | 0.13% | |
Diversified Consumer Services | | | 0.18% | |
Diversified Financial Services | | | 1.25% | |
Diversified Telecommunication Services | | | 2.46% | |
Electric Utilities | | | 1.30% | |
Electrical Equipment | | | 0.23% | |
Electronic Equipment, Instruments & Components | | | 0.46% | |
Energy Equipment & Services | | | 0.12% | |
Entertainment | | | 0.39% | |
Food & Staples Retailing | | | 4.50% | |
Food Products | | | 2.75% | |
Gas Utilities | | | 0.34% | |
Health Care Equipment & Supplies | | | 1.98% | |
Health Care Providers & Services | | | 0.55% | |
Health Care Technology | | | 0.01% | |
Hotels, Restaurants & Leisure | | | 1.54% | |
Household Durables | | | 0.69% | |
Household Products | | | 0.19% | |
Independent Power and Renewable Electricity Producers | | | 0.02% | |
Industrial Conglomerates | | | 1.13% | |
Insurance | | | 5.60% | |
Interactive Media & Services | | | 0.64% | |
Internet & Direct Marketing Retail | | | 0.51% | |
IT Services | | | 0.62% | |
Leisure Equipment & Products | | | 0.03% | |
Leisure Products | | | 0.29% | |
Life Sciences Tools & Services | | | 0.20% | |
Machinery | | | 1.32% | |
Marine | | | 1.84% | |
Media | | | 0.58% | |
Metals & Mining | | | 3.96% | |
Multiline Retail | | | 0.80% | |
| | | | |
| | | | | |
Multi-Utilities | | | 0.50% | |
Oil, Gas & Consumable Fuels | | | 7.44% | |
Paper & Forest Products | | | 0.87% | |
Personal Products | | | 1.25% | |
Pharmaceuticals | | | 9.09% | |
Professional Services | | | 1.73% | |
Real Estate Management & Development | | | 0.79% | |
Road & Rail | | | 0.39% | |
Semiconductors & Semiconductor Equipment | | | 1.38% | |
Software | | | 1.59% | |
Specialty Retail | | | 1.26% | |
Technology Hardware, Storage & Peripherals | | | 0.69% | |
Textiles, Apparel & Luxury Goods | | | 3.14% | |
Tobacco | | | 1.26% | |
Trading Companies & Distributors | | | 2.74% | |
Transportation Infrastructure | | | 0.45% | |
Water Utilities | | | 0.02% | |
Wireless Telecommunication Services | | | 0.76% | |
| | |
|
|
|
TOTAL COMMON STOCKS | | | 94.29% | |
| | |
|
|
|
INVESTMENT COMPANIES | | | | |
International Equity Funds | | | 3.97% | |
| | |
|
|
|
TOTAL INVESTMENT COMPANIES | | | 3.97% | |
| | |
|
|
|
PREFERRED STOCKS | | | | |
Automobiles | | | 0.43% | |
| | |
|
|
|
TOTAL PREFERRED STOCKS | | | 0.43% | |
| | |
|
|
|
REAL ESTATE INVESTMENT TRUSTS | | | | |
Real Estate Investment Trusts | | | 0.18% | |
| | |
|
|
|
TOTAL REAL ESTATE INVESTMENT TRUSTS | | | 0.18% | |
| | |
|
|
|
SHORT TERM INVESTMENTS | | | | |
Money Market Funds | | | 0.23% | |
| | |
|
|
|
TOTAL SHORT TERM INVESTMENTS | | | 0.23% | |
| | |
|
|
|
INVESTMENTS PURCHASED WITH PROCEEDS FROM SECURITIES LENDING COLLATERAL | | | | |
Private Investment Funds | | | 4.86% | |
| | |
|
|
|
TOTAL INVESTMENTS PURCHASED WITH PROCEEDS FROM SECURITIES LENDING COLLATERAL | | | 4.86% | |
| | |
|
|
|
TOTAL INVESTMENTS | | | 103.96% | |
Liabilities in Excess of Other Assets | | | (3.96)% | |
| | |
|
|
|
TOTAL NET ASSETS | | | 100.00% | |
| | |
|
|
|
Percentages are stated as a percent of net assets.
See notes to financial statements.
73
GuideMark Core Fixed Income Fund
SCHEDULE OF INVESTMENTS (Unaudited)
September 30, 2022
| | | | | | | | |
Principal
Amount
| | | | | Value
| |
| | | | | ASSET BACKED SECURITIES - 6.94% | |
| | | | | Affirm Asset Securitization Trust | | | | |
| | 15,510 | | | Series 2020-Z1A, 3.460%, 10/15/2024 (c)(h) | | $ | 15,393 | |
| | 48,543 | | | Series 2020-Z2A, 1.900%, 01/15/2025 (c)(h) | | | 47,462 | |
| | 25,000 | | | American Credit Acceptance Receivables Trust
Series 2022-3, 4.550%, 10/13/2026 (c) | | | 24,660 | |
| | 150,000 | | | AmeriCredit Automobile Receivables Trust
Series 2019-3D, 2.580%, 09/18/2025 | | | 145,546 | |
| | 105,000 | | | Amur Equipment Finance Receivables XI LLC
Series 2022-2 A-2, 5.300%, 06/21/2028 (c)(e)(m) | | | 104,626 | |
| | 160,000 | | | Avant Loans Funding Trust
Series 2021-REV1 A, 1.210%, 07/15/2030 (c)(h) | | | 150,343 | |
| | 450,000 | | | Bain Capital Credit CLO, Ltd.
Series 2017-2A AR2, 3.963% (3 Month LIBOR USD + 1.180%, 1.180% Floor), 07/25/2034 (a)(c) | | | 429,897 | |
| | 61,492 | | | BHG Securitization Trust
Series 2021-B A, 0.900%, 10/17/2034 (c)(h) | | | 58,371 | |
| | | | | BlueMountain CLO, Ltd. | | | | |
| | 565,000 | | | Series 2021-31A A1, 3.888% (3 Month LIBOR USD + 1.150%, 1.150% Floor), 04/19/2034 (a)(c) | | | 543,381 | |
| | 260,000 | | | Series 2019-24A AR, 3.810% (3 Month LIBOR USD + 1.100%, 1.100% Floor), 04/20/2034 (a)(c) | | | 249,516 | |
| | 380,000 | | | Buckhorn Park CLO, Ltd.
Series 2019-1R A-R, 3.860% (3 Month LIBOR USD + 1.120%, 1.120% Floor), 07/18/2034 (a)(c) | | | 364,602 | |
| | 380,000 | | | Carvana Auto Receivables Trust
Series 2022-P2, 4.130%, 04/10/2027 | | | 375,486 | |
| | 90,145 | | | CF Hippolyta Issuer LLC
Series 2020-1A2, 1.990%, 07/15/2060 (c) | | | 75,315 | |
| | | | | Domino’s Pizza Master Issuer LLC | | | | |
| | 182,875 | | | Series 2018-1, 4.116%, 07/25/2048 (c)(h) | | | 173,139 | |
| | 73,125 | | | Series 2019-1, 3.668%, 10/25/2049 (c)(h) | | | 63,564 | |
| | 187,625 | | | Series 2021-1A A2I, 2.662%, 04/25/2051 (c) | | | 155,714 | |
| | 135,000 | | | Drive Auto Receivables Trust
Series 2019-4, 2.700%, 02/16/2027 | | | 132,983 | |
| | | | | Exeter Automobile Receivables Trust | | | | |
| | 295,620 | | | Series 2019-4, 2.580%, 09/15/2025 (c) | | | 291,768 | |
| | 90,000 | | | Series 2020-1, 2.730%, 12/15/2025 (c) | | | 88,633 | |
| | 120,000 | | | Series 2022-4, 4.570%, 01/15/2027 (c) | | | 117,816 | |
| | 204,000 | | | Flagship Credit Auto Trust
Series 2022-3, 4.690%, 07/17/2028 (c) | | | 198,463 | |
| | 609,537 | | | Galaxy XXIII CLO, Ltd.
Series 2017-23A AR, 3.653% (3 Month LIBOR USD + 0.870%, 0.870% Floor), 04/24/2029 (a)(c) | | | 599,774 | |
| | 40,000 | | | GLS Auto Receivables Issuer Trust
Series 2022-3, 4.920%, 01/15/2027 (c) | | | 39,511 | |
| | 300,000 | | | GTP Acquisition Partners I LLC
Series 2015-2, 3.482%, 06/15/2050 (c) | | | 283,542 | |
| | 605,000 | | | Harriman Park CLO, Ltd.
Series 2020-1A A1R, 3.830% (3 Month LIBOR USD + 1.120%, 1.120% Floor), 04/20/2034 (a)(c) | | | 581,879 | |
| | 91,717 | | | LCM XX LP
Series 2015-20R, 3.750% (3 Month LIBOR USD + 1.040%, 0.000% Floor), 10/20/2027 (a)(c) | | | 91,010 | |
| | | | | | | | |
Principal
Amount
| | | | | Value
| |
| | | | | ASSET BACKED SECURITIES (Continued) | |
| | 465,000 | | | Madison Park Funding, Ltd.
Series 2021-38A A, 3.860% (3 Month LIBOR USD + 1.120%, 1.120% Floor), 07/17/2034 (a)(c) | | $ | 445,108 | |
| | 336,815 | | | Madison Park Funding XLI, Ltd.
Series 2015-12R, 3.589% (3 Month LIBOR USD + 0.830%, 0.000% Floor), 04/22/2027 (a)(c) | | | 331,914 | |
| | 120,000 | | | Mercury Financial Credit Card Master Trust
Series 2021-1A, 1.540%, 03/20/2026 (c) | | | 114,075 | |
| | 127,445 | | | Navient Private Education Refi Loan Trust
Series 2021-E A, 0.970%, 12/16/2069 (c) | | | 106,982 | |
| | 465,000 | | | Neuberger Berman CLO XX, Ltd.
Series 2015-20RR A-RR, 3.672% (3 Month LIBOR USD + 1.160%, 1.160% Floor), 07/17/2034 (a)(c) | | | 445,228 | |
| | 191,737 | | | OZLM VII, Ltd.
Series 2014-7R, 3.750% (3 Month LIBOR USD + 1.010%, 1.010% Floor), 07/17/2029 (a)(c) | | | 189,144 | |
| | 30 | | | OZLM XII, Ltd.
Series 2015-12R, 3.832% (3 Month LIBOR USD + 1.050%, 1.050% Floor), 04/30/2027 (a)(c)(h) | | | 30 | |
| | 420,000 | | | Regatta VI Funding, Ltd.
Series 2016-1A AR2, 3.870% (3 Month LIBOR USD + 1.160%, 1.160% Floor), 04/20/2034 (a) | | | 398,018 | |
| | | | | RR, Ltd. | | | | |
| | 480,000 | | | Series 2017-1A A1AB, 3.662% (3 Month LIBOR USD + 1.150%, 1.150% Floor), 07/16/2035 (a)(c) | | | 461,339 | |
| | 330,000 | | | Series 2021-16A A1, 3.622% (3 Month LIBOR USD + 1.110%, 1.150% Floor), 07/15/2036 (a)(c) | | | 316,579 | |
| | | | | Santander Drive Auto Receivables Trust | | | | |
| | 149,889 | | | Series 2019-3, 2.680%, 10/15/2025 | | | 149,071 | |
| | 95,000 | | | Series 2022-5, 4.430%, 03/15/2027 | | | 93,035 | |
| | 65,000 | | | Series 2022-6, 4.720%, 06/15/2027 | | | 64,112 | |
| | 305,000 | | | Series 2022-4, 4.420%, 11/15/2027 | | | 297,275 | |
| | | | | Sound Point CLO, Ltd. | | | | |
| | 301,196 | | | Series 2018-3, 3.462% (3 Month LIBOR USD + 0.950%, 0.000% Floor), 04/16/2029 (a)(c) | | | 296,744 | |
| | 410,000 | | | Series 2021-1A A, 3.853% (3 Month LIBOR USD + 1.070%, 1.070% Floor), 04/25/2034 (a)(c) | | | 393,453 | |
| | 100,000 | | | Summit Issuer LLC
Series 2020-1, 2.290%, 12/20/2050 (c) | | | 87,980 | |
| | 405,000 | | | THL Credit Wind River CLO, Ltd.
Series 2020-1A, 4.140% (3 Month LIBOR USD + 1.430%, 1.430% Floor), 10/20/2033 (a)(c) | | | 391,637 | |
| | 140,785 | | | TICP CLO, Ltd.
Series 2018-3, 3.550% (3 Month LIBOR USD + 0.840%, 0.840% Floor), 04/20/2028 (a)(c) | | | 139,519 | |
| | | | | Upstart Securitization Trust | | | | |
| | 58,721 | | | Series 2021-3, 0.830%, 07/20/2031 (c) | | | 56,864 | |
| | 139,047 | | | Series 2021-4, 0.840%, 09/20/2031 (c) | | | 133,392 | |
| | | | | Venture CLO, Ltd. | | | | |
| | 410,000 | | | Series 2021-42A A1A, 3.642% (3 Month LIBOR USD + 1.130%, 1.130% Floor), 04/17/2034 (a)(c) | | | 391,408 | |
| | 180,000 | | | Series 2021-43A A1, 3.752% (3 Month LIBOR USD + 1.240%, 1.240% Floor), 04/17/2034 (a)(c) | | | 172,547 | |
See notes to financial statements.
74
GuideMark Core Fixed Income Fund
SCHEDULE OF INVESTMENTS (Continued) (Unaudited)
September 30, 2022
| | | | | | | | |
Principal
Amount
| | | | | Value
| |
| | | | | ASSET BACKED SECURITIES (Continued) | |
| | 332,456 | | | Voya CLO, Ltd.
Series 2015-1, 3.640% (3 Month LIBOR USD + 0.900%, 0.900% Floor), 01/18/2029 (a)(c) | | $ | 327,667 | |
| | 370,000 | | | Wellfleet CLO X, Ltd.
Series 2019-XA A1R, 3.880% (3 Month LIBOR USD + 1.170%, 0.000% Floor),
07/20/2032 (a)(c) | | | 356,777 | |
| | | | | Wendy’s Funding LLC | | | | |
| | 76,200 | | | Series 2018-1, 3.884%, 03/15/2048 (c)(h) | | | 68,271 | |
| | 241,938 | | | Series 2021-1A A2I, 2.370%, 06/15/2051 (c)(h) | | | 194,029 | |
| | | | | Westlake Automobile Receivables Trust | | | | |
| | 220,000 | | | Series 2019-3, 2.720%, 11/15/2024 (c) | | | 218,687 | |
| | 225,000 | | | Series 2022-2, 4.310%, 09/15/2027 (c) | | | 219,789 | |
| | 99,250 | | | Wingstop Funding LLC
Series 2020-1, 2.841%, 12/05/2050 (c)(h) | | | 85,069 | |
| | | | | | |
|
|
|
| | | | | Total Asset Backed Securities
(Cost $12,886,706) | | | 12,348,137 | |
| | | | | | |
|
|
|
| | | | | COLLATERALIZED MORTGAGE OBLIGATIONS - 15.82% | |
| | 293,799 | | | 510 Asset Backed Trust
Series 2021-NPL2 A-1, 2.116%,
06/25/2061 (c)(l) | | | 273,664 | |
| | 99,248 | | | Ajax Mortgage Loan Trust
Series 2021-C A, 2.115%, 01/25/2061 (c)(l) | | | 91,955 | |
| | | | | Angel Oak Mortgage Trust | | | | |
| | 2,971 | | | Series 2018-3, 3.649%, 09/25/2048 (b)(c) | | | 2,956 | |
| | 372 | | | Series 2019-2, 3.628%, 03/25/2049 (b)(c) | | | 371 | |
| | 14,222 | | | Series 2019-4, 2.993%, 07/25/2049 (b)(c) | | | 14,138 | |
| | 99,250 | | | Series 2020-R1, 0.990%, 04/25/2053 (b)(c) | | | 93,721 | |
| | 167,173 | | | Series 2021-4 A1, 1.035%, 01/20/2065 (b)(c) | | | 135,960 | |
| | 32,415 | | | Series 2020-6 TR, 1.261%, 05/25/2065 (b)(c) | | | 28,305 | |
| | 112,288 | | | Series 2021-1, 0.909%, 01/25/2066 (b)(c) | | | 96,408 | |
| | 106,034 | | | Series 2021-2 A1, 0.985%, 04/25/2066 (b)(c) | | | 90,541 | |
| | 211,218 | | | Series 2021-3 A1, 1.068%, 05/25/2066 (b)(c) | | | 180,605 | |
| | 270,909 | | | Series 2021-5 A1, 0.951%, 07/25/2066 (b)(c) | | | 225,198 | |
| | 194,378 | | | Series 2021-8, 1.820%, 11/25/2066 (b)(c) | | | 166,922 | |
| | 457,457 | | | Series 2022-1, 2.881%, 12/25/2066 (c)(l) | | | 397,564 | |
| | 100,000 | | | Arbor Realty Commercial Real Estate Notes 2021-FL2, Ltd.
Series 2021-FL2 A, 3.918% (1 Month LIBOR USD + 1.100%, 1.100% Floor),
05/15/2036 (a)(c) | | | 98,320 | |
| | | | | Arroyo Mortgage Trust | | | | |
| | 68,687 | | | Series 2019-3, 2.962%, 10/25/2048 (b)(c) | | | 63,797 | |
| | 75,355 | | | Series 2019-2, 3.347%, 04/25/2049 (b)(c) | | | 70,879 | |
| | | | | BANK | | | | |
| | 2,137,994 | | | Series 2019-BNK23, 0.810%, 12/17/2052 (b)(k) | | | 81,699 | |
| | 984,845 | | | Series 2019-BNK18, 1.039%, 05/17/2062 (b)(k) | | | 43,762 | |
| | 1,162,260 | | | Series 2019-BNK20, 0.938%, 09/15/2062 (b)(k) | | | 49,790 | |
| | 1,310,914 | | | Series 2019-BNK22, 0.711%, 11/17/2062 (b)(k) | | | 43,360 | |
| | 987,032 | | | Series 2019-BNK24, 0.760%, 11/17/2062 (b)(k) | | | 35,672 | |
| | 985,573 | | | Series 2020-BNK26, 1.343%, 03/16/2063 (b)(k) | | | 62,748 | |
| | 1,551,760 | | | Series 2020-BNK28, 1.896%, 03/16/2063 (b)(k) | | | 156,647 | |
| | 31,698 | | | Bayview Koitere Fund Trust
Series 2017-RT4, 3.500%, 07/28/2057 (b)(c) | | | 30,491 | |
| | 29,277 | | | Bayview Opportunity Master Fund IVb Trust
Series 2017-RT6, 3.500%, 10/28/2057 (b)(c) | | | 28,437 | |
| | | | | BBCMS Mortgage Trust | | | | |
| | 132,000 | | | Series 2017-DELC, 3.793% (1 Month LIBOR USD + 0.975%, 0.850% Floor),
08/15/2036 (a)(c) | | | 129,142 | |
| | 100,000 | | | Series 2022-C16, 4.600%, 06/17/2055 (b) | | | 95,651 | |
| | | | | | | | |
Principal
Amount
| | | | | Value
| |
| | | | | COLLATERALIZED MORTGAGE OBLIGATIONS (Continued) | |
| | | | | Benchmark Mortgage Trust | | | | |
| | 309,455 | | | Series 2019-B11, 3.410%, 05/17/2052 | | $ | 299,305 | |
| | 971,742 | | | Series 2019-B12, 1.170%, 08/16/2052 (b)(k) | | | 42,246 | |
| | 393,612 | | | Series 2020-B18, 1.915%, 07/17/2053 (b)(k) | | | 32,182 | |
| | 751,304 | | | Series 2020-B22, 1.631%, 01/15/2054 (b)(k) | | | 67,559 | |
| | 1,493,084 | | | Series 2019-B10, 1.385%, 03/17/2062 (b)(k) | | | 80,620 | |
| | 129,167 | | | BINOM Securitization Trust
Series 2021-INV1, 2.034%, 06/25/2056 (b)(c) | | | 112,657 | |
| | | | | BRAVO Residential Funding Trust | | | | |
| | 80,883 | | | Series 2021-NQM1 A1, 0.941%, 02/25/2049 (b)(c) | | | 74,679 | |
| | 76,285 | | | Series 2021-NQM2 A1, 0.970%, 03/25/2060 (b)(c) | | | 72,485 | |
| | 313,722 | | | Series 2021-C A1, 1.620%, 03/01/2061 (c)(l) | | | 287,506 | |
| | 260,622 | | | BX Commercial Mortgage Trust 2019-XL
Series 2019-XL, 3.738% (1 Month LIBOR USD + 0.920%, 0.920% Floor), 10/15/2036 (a)(c) | | | 256,898 | |
| | 100,000 | | | CAMB Commercial Mortgage Trust
Series 2019-LIFE, 4.268% (1 Month LIBOR USD + 1.450%, 1.450% Floor), 12/15/2037 (a)(c) | | | 96,716 | |
| | 145,000 | | | Century Plaza Towers
Series 2019-CPT, 2.865%, 11/16/2039 (c) | | | 118,530 | |
| | 7,305 | | | Chase Mortgage Finance Trust
Series 2007-A1, 2.448%, 02/25/2037 (b) | | | 7,137 | |
| | 3,191 | | | CIM Trust
Series 2017-7, 3.000%, 04/25/2057 (b)(c) | | | 3,184 | |
| | | | | Citigroup Commercial Mortgage Trust | | | | |
| | 376,000 | | | Series 2014-GC19, 4.023%, 03/12/2047 | | | 369,859 | |
| | 296,312 | | | Series 2016-P3, 3.329%, 04/16/2049 | | | 277,807 | |
| | 505,000 | | | Series 2016-P4, 2.902%, 07/12/2049 | | | 463,795 | |
| | | | | Citigroup Mortgage Loan Trust, Inc. | | | | |
| | 106,928 | | | Series 2018-RP2, 3.428%, 02/25/2058 (b)(c) | | | 102,954 | |
| | 45,380 | | | Series 2018-RP1, 3.000%, 09/25/2064 (b)(c) | | | 44,165 | |
| | 103,062 | | | Series 2019-E, 3.228%, 11/25/2070 (c)(l) | | | 99,841 | |
| | | | | COLT Mortgage Loan Trust | | | | |
| | 318,698 | | | Series 2020-RPL1, 1.390%, 01/25/2065 (b)(c) | | | 276,020 | |
| | 73,451 | | | Series 2020-2R, 1.325%, 10/26/2065 (b)(c) | | | 66,987 | |
| | 166,699 | | | Series 2021-1 A1, 0.910%, 06/25/2066 (b)(c) | | | 138,414 | |
| | 303,267 | | | Series 2021-3 A1, 0.956%, 09/27/2066 (b)(c) | | | 243,936 | |
| | 389,375 | | | Series 2021-HX1 A1, 1.110%, 10/25/2066 (b)(c) | | | 322,114 | |
| | 462,656 | | | Series 2022-1, 2.284%, 12/27/2066 (b)(c) | | | 404,944 | |
| | 94,767 | | | Series 2022-4 A-1, 4.301%, 03/25/2067 (b)(c) | | | 90,369 | |
| | | | | COMM Mortgage Trust | | | | |
| | 120,000 | | | Series 2013-300P, 4.353%, 08/12/2030 (c) | | | 118,251 | |
| | 100,000 | | | Series A, 2.819%, 01/10/2039 (c) | | | 87,239 | |
| | 100,000 | | | Series C, 3.376%, 01/10/2039 (c) | | | 85,547 | |
| | 58,099 | | | Connecticut Avenue Securities Trust
Series 2022-R08 1M-1, 4.855% (SOFR30A + 2.550%, 2.550% Floor), 07/25/2042 (a)(c) | | | 57,853 | |
| | | | | Countrywide Home Loans, Inc. | | | | |
| | 4,928 | | | Series 2004-HYB6, 3.303%, 11/20/2034 (b) | | | 4,702 | |
| | 57,211 | | | Series 2005-11, 3.684% (1 Month LIBOR USD + 0.600%, 0.600% Floor, 10.500% Cap), 03/25/2035 (a) | | | 41,165 | |
| | 259,012 | | | CSAIL Commercial Mortgage Trust
Series 2016-C6, 2.960%, 01/15/2049 | | | 249,862 | |
| | | | | CSMC Trust | | | | |
| | 97,883 | | | Series 2020-NET, 2.257%, 08/17/2037 (c) | | | 88,704 | |
| | 25,444 | | | Series 2017-FHA1, 3.250%, 04/25/2047 (b)(c) | | | 22,800 | |
See notes to financial statements.
75
GuideMark Core Fixed Income Fund
SCHEDULE OF INVESTMENTS (Continued) (Unaudited)
September 30, 2022
| | | | | | | | |
Principal
Amount
| | | | | Value
| |
| | | | | COLLATERALIZED MORTGAGE OBLIGATIONS (Continued) | |
| | 218,572 | | | Series 2020-RPL4, 2.000%, 01/25/2060 (b)(c) | | $ | 195,657 | |
| | 109,855 | | | Series 2021-RPL4 A1, 1.796%, 12/27/2060 (b)(c) | | | 102,732 | |
| | 120,336 | | | Series 2020-NQM1, 1.208%, 05/25/2065 (c)(l) | | | 110,578 | |
| | 200,997 | | | Series 2021-NQM2, 1.179%, 02/25/2066 (b)(c) | | | 175,299 | |
| | 154,822 | | | Series 2021-NQM5 A1, 0.938%, 05/25/2066 (b)(c) | | | 120,699 | |
| | 388,294 | | | Series 2021-NQM6 A1, 1.174%, 07/25/2066 (b)(c) | | | 312,239 | |
| | 196,413 | | | Series 2021-NQM8, 1.841%, 10/25/2066 (b)(c) | | | 165,395 | |
| | 486,645 | | | Series 2022-NQM1, 2.265%, 11/25/2066 (b)(c) | | | 419,372 | |
| | | | | DBGS Mortgage Trust | | | | |
| | 215,000 | | | Series 2018-C1, 4.466%, 10/17/2051 | | | 205,446 | |
| | 11,827,352 | | | Series 2018-C1, 0.321%, 10/17/2051 (b)(k) | | | 103,121 | |
| | | | | DBJPM Mortgage Trust | | | | |
| | 255,797 | | | Series 2016-C1, 3.038%, 05/12/2049 | | | 246,238 | |
| | 475,000 | | | Series 2016-C3, 2.890%, 08/12/2049 | | | 433,624 | |
| | 309,862 | | | Series 2020-C9, 1.827%, 08/15/2053 (b)(k) | | | 22,597 | |
| | 71,477 | | | Deephaven Residential Mortgage Trust
Series 2021-2 A1, 0.899%, 04/25/2066 (b)(c) | | | 60,728 | |
| | | | | Ellington Financial Mortgage Trust | | | | |
| | 72,815 | | | Series 2021-2 A1, 0.931%, 06/25/2066 (b)(c) | | | 60,992 | |
| | 228,179 | | | Series 2022-1, 2.206%, 01/25/2067 (b)(c) | | | 193,270 | |
| | | | | FirstKey Homes Trust | | | | |
| | 114,697 | | | Series 2022-SFR1, 4.145%, 05/19/2039 (c) | | | 110,447 | |
| | 484,268 | | | Series 2022-SFR2, 4.250%, 07/19/2039 (c) | | | 456,798 | |
| | | | | GCAT Trust | | | | |
| | 131,310 | | | Series 2021-NQM1, 0.874%, 01/25/2066 (b)(c) | | | 113,130 | |
| | 146,353 | | | Series 2021-NQM2 A1, 1.036%, 05/25/2066 (b)(c) | | | 124,440 | |
| | 193,486 | | | Series 2021-NQM3 A1, 1.091%, 05/25/2066 (b)(c) | | | 161,614 | |
| | 261,593 | | | Series 2021-NQM4, 1.093%, 08/25/2066 (b)(c) | | | 213,124 | |
| | 153,697 | | | Series 2021-NQM7, 1.915%, 08/25/2066 (b)(c) | | | 137,562 | |
| | | | | GS Mortgage Securities Trust | | | | |
| | 145,000 | | | Series 2012-BWTR, 2.954%, 11/07/2034 (c) | | | 137,887 | |
| | 35,000 | | | Series 2022-SHIP, 3.576% (TSFR1M + 0.731%, 0.731% Floor), 08/15/2036 (a)(c) | | | 34,440 | |
| | 35,000 | | | Series 2015-GC34, 3.506%, 10/13/2048 | | | 33,133 | |
| | 1,444,050 | | | Series 2020-GC45, 0.785%, 02/14/2053 (b)(k) | | | 49,403 | |
| | 220,000 | | | Hawaii Hotel Trust 2019-MAUI
Series 2019-MAUI, 3.968% (1 Month LIBOR USD + 1.150%, 1.150% Floor), 05/17/2038 (a)(c) | | | 214,690 | |
| | | | | Imperial Fund Mortgage Trust | | | | |
| | 149,483 | | | Series 2021-NQM2 A-1, 1.073%,
09/25/2056 (b)(c) | | | 118,149 | |
| | 482,794 | | | Series 2022-NQM2, 3.638%, 03/25/2067 (c)(l) | | | 439,452 | |
| | 90,000 | | | JPMBB Commercial Mortgage Securities Trust
Series 2020-NNN, 2.812%, 01/16/2037 (c) | | | 81,856 | |
| | | | | Legacy Mortgage Asset Trust | | | | |
| | 82,780 | | | Series 2021-GS4 A1, 1.650%, 11/25/2060 (c)(l) | | | 76,086 | |
| | 143,002 | | | Series 2021-GS3 A1, 1.750%, 07/25/2061 (c)(l) | | | 130,973 | |
| | 260,000 | | | MF1, Ltd.
Series 2022-FL8, 4.034% (SOFR30A + 1.750%, 1.750% Floor), 02/20/2037 (a)(c)(h) | | | 251,943 | |
| | | | | | | | |
Principal
Amount
| | | | | Value
| |
| | | | | COLLATERALIZED MORTGAGE OBLIGATIONS (Continued) | |
| | | | | MFRA Trust | | | | |
| | 114,882 | | | Series 2021-NQM2, 1.029%, 11/25/2064 (b)(c) | | $ | 93,768 | |
| | 27,681 | | | Series 2020-NQM3 A1, 1.014%, 01/26/2065 (b) | | | 25,458 | |
| | 95,651 | | | Series 2021-NQM1 A-1, 1.153%, 04/25/2065 (b)(c) | | | 88,477 | |
| | | | | Mill City Mortgage Loan Trust | | | | |
| | 52,677 | | | Series 2018-2, 3.500%, 05/25/2058 (b)(c) | | | 51,862 | |
| | 206,641 | | | Series 2019-GS1, 2.750%, 07/25/2059 (b)(c) | | | 198,624 | |
| | 59,285 | | | Series 2017-3, 2.750%, 01/25/2061 (b)(c) | | | 58,416 | |
| | 55,431 | | | Series 2018-1, 3.250%, 05/25/2062 (b)(c) | | | 53,777 | |
| | 131,684 | | | Series 2019-1, 3.250%, 10/25/2069 (b)(c) | | | 124,938 | |
| | 83,763 | | | Morgan Stanley ABS Capital I, Inc. Trust
Series 2003-NC10, 4.104% (1 Month LIBOR USD + 1.020%, 1.020% Floor), 10/25/2033 (a) | | | 81,743 | |
| | 175,000 | | | Morgan Stanley Bank of America Merrill Lynch Trust
Series 2016-C29, 3.325%, 05/17/2049 | | | 163,598 | |
| | | | | New Residential Mortgage Loan Trust | | | | |
| | 36,852 | | | Series 2016-2, 3.750%, 11/25/2035 (b)(c) | | | 34,590 | |
| | 87,217 | | | Series 2018-4, 3.194% (1 Month LIBOR USD + 0.750%, 0.750% Floor), 01/27/2048 (a)(c) | | | 84,672 | |
| | 32,716 | | | Series 2016-4, 3.750%, 11/25/2056 (b)(c) | | | 30,494 | |
| | 313,934 | | | Series 2021-NQM3 A1, 1.156%, 11/27/2056 (b)(c) | | | 269,807 | |
| | 51,930 | | | Series 2017-1, 4.000%, 02/25/2057 (b)(c) | | | 49,695 | |
| | 46,957 | | | Series 2017-2, 4.000%, 03/25/2057 (b)(c) | | | 44,793 | |
| | 26,264 | | | Series 2017-3, 4.000%, 04/25/2057 (b)(c) | | | 25,044 | |
| | 24,432 | | | Series 2017-4, 4.000%, 05/25/2057 (b)(c) | | | 23,131 | |
| | 23,559 | | | Series 2017-5, 4.584% (1 Month LIBOR USD + 1.500%, 1.500% Floor), 06/25/2057 (a)(c) | | | 23,276 | |
| | 41,084 | | | Series 2017-6, 4.000%, 08/25/2057 (b)(c) | | | 38,988 | |
| | 89,940 | | | Series 2018-1, 4.000%, 12/25/2057 (b)(c) | | | 85,883 | |
| | 74,449 | | | Series 2018-2, 4.500%, 02/25/2058 (b)(c) | | | 71,420 | |
| | 189,278 | | | Series 2018-3, 4.500%, 05/25/2058 (b)(c) | | | 183,027 | |
| | 79,530 | | | Series 2021-NQM2R A-1, 0.941%, 10/25/2058 (b)(c) | | | 74,789 | |
| | 135,072 | | | Series 2019-3, 3.750%, 11/25/2058 (b)(c) | | | 127,483 | |
| | 98,383 | | | Series 2019-5, 3.500%, 08/25/2059 (b)(c) | | | 93,813 | |
| | 26,410 | | | Series 2019-NQM4, 2.492%, 09/25/2059 (b)(c) | | | 24,325 | |
| | 448,257 | | | Series 2022-NQM1, 2.277%, 04/25/2061 (b)(c) | | | 377,323 | |
| | 314,329 | | | NMLT Trust
Series 2021-INV1 A1, 1.185%, 05/25/2056 (b)(c) | | | 268,374 | |
| | | | | OBX Trust | | | | |
| | 187,699 | | | Series 2021-NQM3 A1, 1.054%, 07/25/2061 (b)(c) | | | 150,741 | |
| | 403,770 | | | Series 2022-NQM1, 2.305%, 11/25/2061 (b)(c) | | | 348,739 | |
| | 178,548 | | | Series 2021-NQM1, 1.072%, 02/25/2066 (b)(c) | | | 156,051 | |
| | | | | Pretium Mortgage Credit Partners LLC | | | | |
| | 153,272 | | | Series 2021-NPL3 A1, 1.868%, 07/25/2051 (c)(l) | | | 137,165 | |
| | 151,672 | | | Series 2021-RN2 A1, 1.744%, 07/25/2051 (c)(l) | | | 139,671 | |
| | 185,935 | | | Series 2021-NPL2 A-1, 1.992%, 06/29/2060 (c)(l) | | | 173,867 | |
| | 308,196 | | | Series 2021-RN1 A1, 1.992%, 02/25/2061 (c)(l) | | | 289,254 | |
| | | | | Progress Residential Trust | | | | |
| | 373,715 | | | Series 2021-SFR3, 1.637%, 05/17/2026 (c) | | | 327,174 | |
| | 399,646 | | | Series 2021-SFR1, 1.052%, 04/17/2038 (c) | | | 345,154 | |
| | 329,695 | | | Series 2021-SFR8, 1.510%, 10/19/2038 (c) | | | 283,068 | |
See notes to financial statements.
76
GuideMark Core Fixed Income Fund
SCHEDULE OF INVESTMENTS (Continued) (Unaudited)
September 30, 2022
| | | | | | | | |
Principal
Amount
| | | | | Value
| |
| | | | | COLLATERALIZED MORTGAGE OBLIGATIONS (Continued) | |
| | 110,000 | | | Series 2022-SFR3, 3.200%, 04/19/2039 (c) | | $ | 102,869 | |
| | 99,735 | | | Series 2022-SFR5, 4.451%, 06/17/2039 (c) | | | 95,257 | |
| | 145,000 | | | Series 2022-SFR7, 4.750%, 10/19/2039 (c)(e)(m) | | | 142,607 | |
| | 300,000 | | | Series 2022-SFR4, 4.438%, 05/17/2041 (c) | | | 282,424 | |
| | | | | PRPM Trust | | | | |
| | 57,361 | | | Series 2020-6, 2.363%, 11/25/2025 (c)(l) | | | 54,809 | |
| | 154,521 | | | Series 2021-3 A1, 1.867%, 04/25/2026 (c)(l) | | | 141,470 | |
| | 199,790 | | | Series 2021-4 A1, 1.867%, 04/25/2026 (c)(l) | | | 184,053 | |
| | 193,835 | | | Series 2021-5 A1, 1.793%, 06/25/2026 (c)(l) | | | 175,359 | |
| | 184,843 | | | Series 2021-6 A1, 1.793%, 07/25/2026 (c)(l) | | | 170,997 | |
| | 295,903 | | | Series 2021-7 A1, 1.867%, 08/25/2026 (c)(l) | | | 272,714 | |
| | 379,914 | | | Series 2021-9, 2.363%, 10/25/2026 (c)(l) | | | 352,697 | |
| | | | | SBA Tower Trust | | | | |
| | 155,000 | | | Series 2019-1, 2.836%, 01/15/2025 (c) | | | 145,183 | |
| | 125,000 | | | Series 2018-1, 3.448%, 03/15/2048 (c) | | | 123,888 | |
| | 66,223 | | | Seasoned Credit Risk Transfer Trust Series
Series 2019-3, 3.500%, 10/25/2058 | | | 61,247 | |
| | | | | SG Commercial Mortgage Securities Trust | | | | |
| | 355,000 | | | Series 2020-COVE, 2.632%, 04/17/2037 (c) | | | 326,280 | |
| | 75,000 | | | Series 2016-C5, 3.055%, 10/13/2048 | | | 68,549 | |
| | 256,496 | | | SG Residential Mortgage Trust
Series 2021-1 A-1, 1.160%, 07/25/2061 (b)(c) | | | 210,498 | |
| | | | | Starwood Mortgage Residential Trust | | | | |
| | 23,089 | | | Series 2020-3, 1.486%, 04/25/2065 (b)(c) | | | 22,280 | |
| | 152,184 | | | Series 2021-1, 1.219%, 05/25/2065 (b)(c) | | | 142,054 | |
| | 62,902 | | | Series 2021-2 A1, 0.943%, 05/25/2065 (b)(c) | | | 58,859 | |
| | 299,876 | | | Series 2021-6, 1.920%, 11/25/2066 (b)(c) | | | 247,302 | |
| | 415,000 | | | Thompson Park CLO, Ltd.
Series 2021-1A A1, 3.512% (3 Month LIBOR USD + 1.000%, 1.000% Floor), 04/17/2034 (a)(c) | | | 397,852 | |
| | 230,000 | | | Toorak Mortgage Corp.
Series 2021-1 A1, 2.240%, 06/25/2024 (c)(l) | | | 219,231 | |
| | | | | Towd Point Mortgage Trust | | | | |
| | 170,496 | | | Series 2022-EBO1, 2.161%, 01/25/2052 (b)(c) | | | 167,511 | |
| | 75,237 | | | Series 2017-1, 2.750%, 10/25/2056 (b)(c) | | | 74,210 | |
| | 68,166 | | | Series 2017-5, 3.684% (1 Month LIBOR USD + 0.600%, 0.600% Floor), 02/26/2057 (a)(c) | | | 67,448 | |
| | 36,923 | | | Series 2017-2, 2.750%, 04/25/2057 (b)(c) | | | 36,617 | |
| | 13,553 | | | Series 2017-3, 2.750%, 06/25/2057 (b)(c) | | | 13,327 | |
| | 108,444 | | | Series 2017-4, 2.750%, 06/25/2057 (b)(c) | | | 104,369 | |
| | 165,004 | | | Series 2017-6, 2.750%, 10/25/2057 (b)(c) | | | 158,697 | |
| | 30,308 | | | Series 2018-1, 3.000%, 01/28/2058 (b)(c) | | | 29,474 | |
| | 98,784 | | | Series 2018-2, 3.250%, 03/25/2058 (b)(c) | | | 95,947 | |
| | 225,311 | | | Series 2019-1, 3.692%, 03/25/2058 (b)(c) | | | 213,094 | |
| | 89,230 | | | Series 2018-3, 3.750%, 05/25/2058 (b)(c) | | | 85,779 | |
| | 152,926 | | | Series 2020-4, 1.750%, 10/25/2060 (c) | | | 136,974 | |
| | 434,035 | | | Series 2021-R1 A1, 2.918%, 11/25/2060 (b) | | | 384,914 | |
| | 114,692 | | | Triangle Re 2021-3, Ltd.
Series 2021-3, 4.181% (SOFR30A + 1.900%, 1.900% Floor), 02/25/2034 (a)(c) | | | 113,860 | |
| | 505,000 | | | Tricon Residential Trust
Series 2022-SFR1, 3.856%, 04/17/2039 (c) | | | 467,044 | |
| | | | | VCAT Asset Securitization LLC | | | | |
| | 60,318 | | | Series 2021-NPL2 A1, 2.115%, 03/27/2051 (c)(l) | | | 57,239 | |
| | 178,098 | | | Series 2021-NPL3 A1, 1.743%, 05/25/2051 (c)(l) | | | 164,149 | |
| | | | | | | | |
Principal
Amount
| | | | | Value
| |
| | | | | COLLATERALIZED MORTGAGE OBLIGATIONS (Continued) | |
| | 261,183 | | | Series 2021-NPL4 A1, 1.868%, 08/25/2051 (c)(l) | | $ | 241,266 | |
| | 326,438 | | | Series 2021-NPL5, 1.868%, 08/25/2051 (c)(l) | | | 298,851 | |
| | 409,687 | | | Series 2021-NPL6, 1.917%, 09/25/2051 (c)(l) | | | 382,863 | |
| | | | | Vericrest Opportunity Loan Transferee | | | | |
| | 237,856 | | | Series 2021-R2 A1, 2.116%, 04/25/2051 (c)(l) | | | 221,158 | |
| | 99,680 | | | Series 2021-NPL9, 1.992%, 05/25/2051 (c)(l) | | | 91,319 | |
| | 217,976 | | | Series 2021-CF1 A1, 1.992%, 08/25/2051 (c)(l) | | | 205,171 | |
| | | | | Verus Securitization Trust | | | | |
| | 946 | | | Series 2020-NPL1, 3.598%, 08/25/2050 (c)(l) | | | 943 | |
| | 42,130 | | | Series 2019-4, 3.142%, 10/25/2059 (b)(c) | | | 41,270 | |
| | 92,053 | | | Series 2021-R2 A-1, 0.918%, 02/25/2064 (b)(c) | | | 84,620 | |
| | 91,063 | | | Series 2021-2, 1.031%, 02/25/2066 (b)(c) | | | 76,032 | |
| | 132,654 | | | Series 2021-4, 0.938%, 07/25/2066 (b)(c) | | | 107,138 | |
| | 338,206 | | | Series 2021-5 A-1, 1.013%, 09/25/2066 (b)(c) | | | 283,652 | |
| | 208,924 | | | Series 2021-8, 1.824%, 11/25/2066 (b)(c) | | | 179,558 | |
| | 304,442 | | | Series 2022-1 A-1, 2.724%, 01/25/2067 (c)(l) | | | 269,661 | |
| | 265,000 | | | Wells Fargo Commercial Mortgage Trust 2015-NXS1
Series A-5, 3.148%, 05/15/2048 | | | 251,710 | |
| | | | | | |
|
|
|
| | | | | Total Collateralized Mortgage Obligations
(Cost $31,346,777) | | | 28,137,665 | |
| | | | | | |
|
|
|
| | | | | CORPORATE OBLIGATIONS - 27.16% | |
| | | | | Aerospace & Defense - 0.40% | |
| | 283,000 | | | Boeing Co.
5.040%, 05/01/2027 | | | 273,042 | |
| | | | | L3Harris Technologies, Inc. | | | | |
| | 150,000 | | | 3.850%, 06/15/2023 | | | 149,345 | |
| | 31,000 | | | 4.400%, 06/15/2028 | | | 29,185 | |
| | 75,000 | | | Lockheed Martin Corp.
4.090%, 09/15/2052 | | | 62,579 | |
| | 189,000 | | | Northrop Grumman Corp.
5.150%, 05/01/2040 | | | 177,456 | |
| | 40,000 | | | Raytheon Technologies Corp.
3.030%, 03/15/2052 | | | 26,217 | |
| | | | | | |
|
|
|
| | | | | | | | 717,824 | |
| | | | | | |
|
|
|
| | | | | Banks - 5.37% | | | | |
| | | | | Bank of America Corp. | | | | |
| | 235,000 | | | 4.948% (SOFR + 2.040%), 07/22/2028 (a) | | | 226,143 | |
| | 720,000 | | | 1.922% (SOFR + 1.370%), 10/24/2031 (a) | | | 532,611 | |
| | 780,000 | | | 2.687% (SOFR + 1.320%), 04/22/2032 (a) | | | 608,471 | |
| | 115,000 | | | 2.299% (SOFR + 1.220%), 07/21/2032 (a) | | | 85,971 | |
| | 120,000 | | | 2.572% (SOFR + 1.210%), 10/20/2032 (a) | | | 91,867 | |
| | 135,000 | | | 5.015% (SOFR + 2.160%), 07/22/2033 (a) | | | 125,611 | |
| | 95,000 | | | 3.311% (SOFR + 1.580%), 04/22/2042 (a)(f) | | | 67,161 | |
| | 700,000 | | | 4.083% (3 Month LIBOR USD + 3.150%), 03/20/2051 (a) | | | 525,955 | |
| | 200,000 | | | BNP Paribas SA
2.219% (SOFR + 2.074%), 06/09/2026 (a)(c) | | | 180,014 | |
| | 250,000 | | | BPCE SA
2.045% (SOFR + 1.087%), 10/19/2027 (a)(c) | | | 210,884 | |
| | | | | Citigroup, Inc. | | | | |
| | 95,000 | | | 0.981% (SOFR + 0.669%), 05/01/2025 (a) | | | 88,108 | |
| | 330,000 | | | 1.462% (SOFR + 0.770%), 06/09/2027 (a) | | | 281,402 | |
| | 215,000 | | | 2.666% (SOFR + 1.146%), 01/29/2031 (a) | | | 171,845 | |
| | 35,000 | | | 2.520% (SOFR + 1.177%), 11/03/2032 (a) | | | 26,575 | |
| | 200,000 | | | Danske Bank AS
5.375%, 01/12/2024 (c) | | | 199,055 | |
See notes to financial statements.
77
GuideMark Core Fixed Income Fund
SCHEDULE OF INVESTMENTS (Continued) (Unaudited)
September 30, 2022
| | | | | | | | |
Principal
Amount
| | | | | Value
| |
| | | | | CORPORATE OBLIGATIONS (Continued) | |
| | | | | Banks (Continued) | | | | |
| | | | | HSBC Holdings PLC | | | | |
| | 200,000 | | | 0.976% (SOFR + 0.708%), 05/24/2025 (a) | | $ | 183,938 | |
| | 200,000 | | | 1.589% (SOFR + 1.290%), 05/24/2027 (a) | | | 167,460 | |
| | 305,000 | | | 5.210% (SOFR + 2.610%), 08/11/2028 (a) | | | 285,591 | |
| | 200,000 | | | 3.973% (3 Month LIBOR USD + 1.610%), 05/22/2030 (a) | | | 169,389 | |
| | 400,000 | | | 4.762% (SOFR + 2.530%), 03/29/2033 (a) | | | 328,780 | |
| | 520,000 | | | 5.402% (SOFR + 2.870%), 08/11/2033 (a)(f) | | | 462,863 | |
| | | | | JPMorgan Chase & Co. | | | | |
| | 150,000 | | | 3.797% (3 Month LIBOR USD + 0.890%), 07/23/2024 (a) | | | 148,023 | |
| | 225,000 | | | 3.220% (3 Month LIBOR USD + 1.155%), 03/01/2025 (a) | | | 217,915 | |
| | 300,000 | | | 3.782% (3 Month LIBOR USD + 1.337%), 02/01/2028 (a) | | | 275,515 | |
| | 425,000 | | | 4.323% (SOFR + 1.560%), 04/26/2028 (a) | | | 398,808 | |
| | 310,000 | | | 4.851% (SOFR + 1.990%), 07/25/2028 (a) | | | 297,797 | |
| | 80,000 | | | 3.509% (3 Month LIBOR USD + 0.945%), 01/23/2029 (a) | | | 70,908 | |
| | 105,000 | | | 2.739% (SOFR + 1.510%), 10/15/2030 (a) | | | 85,476 | |
| | 240,000 | | | 2.580% (SOFR + 1.250%), 04/22/2032 (a) | | | 186,048 | |
| | 350,000 | | | 2.545% (SOFR + 1.180%), 11/08/2032 (a) | | | 265,866 | |
| | 30,000 | | | 4.586% (SOFR + 1.800%), 04/26/2033 (a) | | | 27,026 | |
| | 65,000 | | | 4.912% (SOFR + 2.080%), 07/25/2033 (a) | | | 60,068 | |
| | 175,000 | | | 3.109% (SOFR + 2.460%), 04/22/2041 (a) | | | 121,543 | |
| | 155,000 | | | 3.157% (SOFR + 1.460%), 04/22/2042 (a) | | | 106,379 | |
| | 95,000 | | | 3.897% (3 Month LIBOR USD + 1.220%), 01/23/2049 (a) | | | 70,630 | |
| | 145,000 | | | KeyCorp
2.550%, 10/01/2029 | | | 118,620 | |
| | 490,000 | | | Societe Generale SA
6.221% (1 Year CMT Rate + 3.200%), 06/15/2033 (a)(c) | | | 434,860 | |
| | 160,000 | | | Truist Financial Corp.
1.887% (SOFR + 0.862%), 06/07/2029 (a) | | | 131,155 | |
| | | | | Wells Fargo & Co. | | | | |
| | 85,000 | | | 2.406% (SOFR + 1.087%), 10/30/2025 (a)(f) | | | 79,436 | |
| | 120,000 | | | 3.000%, 04/22/2026 | | | 110,116 | |
| | 200,000 | | | 3.908% (SOFR + 1.320%), 04/25/2026 (a) | | | 191,263 | |
| | 135,000 | | | 3.000%, 10/23/2026 | | | 122,488 | |
| | 210,000 | | | 4.808% (SOFR + 1.980%), 07/25/2028 (a) | | | 200,591 | |
| | 215,000 | | | 3.350% (SOFR + 1.500%), 03/02/2033 (a) | | | 174,557 | |
| | 590,000 | | | 4.897% (SOFR + 2.100%), 07/25/2033 (a) | | | 542,140 | |
| | 115,000 | | | 5.013% (SOFR + 4.502%), 04/04/2051 (a) | | | 99,304 | |
| | | | | | |
|
|
|
| | | | | | | | 9,556,226 | |
| | | | | | |
|
|
|
| | | | | Beverages - 0.39% | | | | |
| | | | | Anheuser-Busch InBev Worldwide, Inc. | | | | |
| | 180,000 | | | 5.450%, 01/23/2039 | | | 172,021 | |
| | 15,000 | | | 3.750%, 07/15/2042 | | | 11,435 | |
| | 20,000 | | | 4.900%, 02/01/2046 | | | 17,380 | |
| | 85,000 | | | 4.600%, 04/15/2048 | | | 70,650 | |
| | 112,000 | | | 4.750%, 04/15/2058 | | | 92,200 | |
| | | | | Constellation Brands, Inc. | | | | |
| | 25,000 | | | 4.650%, 11/15/2028 | | | 23,650 | |
| | 6,000 | | | 3.150%, 08/01/2029 | | | 5,161 | |
| | 200,000 | | | Diageo Capital Plc
2.000%, 04/29/2030 | | | 160,488 | |
| | 155,000 | | | Keurig Dr Pepper, Inc.
3.950%, 04/15/2029 | | | 141,086 | |
| | | | | | |
|
|
|
| | | | | | | | 694,071 | |
| | | | | | |
|
|
|
| | | | | | | | |
Principal
Amount
| | | | | Value
| |
| | | | | Biotechnology - 0.56% | | | | |
| | | | | AbbVie, Inc. | | | | |
| | 365,000 | | | 3.200%, 11/21/2029 (f) | | $ | 320,319 | |
| | 250,000 | | | 4.250%, 11/21/2049 | | | 201,041 | |
| | | | | CSL Finance PLC | | | | |
| | 170,000 | | | 4.050%, 04/27/2029 (c) | | | 156,866 | |
| | 170,000 | | | 4.250%, 04/27/2032 (c) | | | 155,342 | |
| | 200,000 | | | Gilead Sciences, Inc.
1.650%, 10/01/2030 | | | 153,590 | |
| | | | | | |
|
|
|
| | | | | | | | 987,158 | |
| | | | | | |
|
|
|
| | | | | Capital Markets - 2.61% | | | | |
| | | | | BP Capital Markets America, Inc. | | | | |
| | 145,000 | | | 3.633%, 04/06/2030 | | | 130,255 | |
| | 145,000 | | | 2.721%, 01/12/2032 (f) | | | 117,871 | |
| | 125,000 | | | 2.939%, 06/04/2051 | | | 79,658 | |
| | 140,000 | | | 3.379%, 02/08/2061 (f) | | | 91,670 | |
| | | | | Credit Suisse Group AG | | | | |
| | 250,000 | | | 6.442% (SOFR + 3.700%), 08/11/2028 (a)(c) | | | 232,909 | |
| | 500,000 | | | 6.537% (SOFR + 3.920%), 08/12/2033 (a)(c) | | | 449,899 | |
| | | | | Intercontinental Exchange, Inc. | | | | |
| | 55,000 | | | 4.350%, 06/15/2029 | | | 52,151 | |
| | 30,000 | | | 4.600%, 03/15/2033 | | | 27,991 | |
| | 20,000 | | | 4.950%, 06/15/2052 | | | 17,688 | |
| | | | | Morgan Stanley | | | | |
| | 195,000 | | | 3.737% (3 Month LIBOR USD + 0.847%), 04/24/2024 (a) | | | 193,022 | |
| | 310,000 | | | 1.593% (SOFR + 0.879%), 05/04/2027 (a) | | | 267,644 | |
| | 255,000 | | | 2.475% (SOFR + 1.000%), 01/21/2028 (a) | | | 222,901 | |
| | 210,000 | | | 4.210% (SOFR + 1.610%), 04/20/2028 (a) | | | 196,765 | |
| | 340,000 | | | 3.591% (3 Month LIBOR USD + 1.340%), 07/22/2028 (a)(f) | | | 306,655 | |
| | 55,000 | | | 4.431% (3 Month LIBOR USD + 1.628%), 01/23/2030 (a) | | | 50,613 | |
| | 210,000 | | | 2.699% (SOFR + 1.143%), 01/22/2031 (a) | | | 170,406 | |
| | 285,000 | | | 1.794% (SOFR + 1.034%), 02/13/2032 (a) | | | 208,540 | |
| | 145,000 | | | 1.928% (SOFR + 1.020%), 04/28/2032 (a) | | | 106,027 | |
| | 130,000 | | | 2.511% (SOFR + 1.200%), 10/20/2032 (a) | | | 99,434 | |
| | 60,000 | | | 4.889% (SOFR + 2.076%), 07/20/2033 (a) | | | 55,623 | |
| | 155,000 | | | 3.971% (3 Month LIBOR USD + 1.455%), 07/22/2038 (a) | | | 123,905 | |
| | 110,000 | | | The Bank of New York Mellon Corp.
2.050%, 01/26/2027 | | | 97,751 | |
| | | | | The Goldman Sachs Group, Inc. | | | | |
| | 90,000 | | | 0.925% (SOFR + 0.486%), 10/21/2024 (a) | | | 85,529 | |
| | 20,000 | | | 3.272% (3 Month LIBOR USD + 1.201%), 09/29/2025 (a) | | | 19,067 | |
| | 120,000 | | | 4.482% (SOFR + 1.725%), 08/23/2028 (a)(f) | | | 112,835 | |
| | 70,000 | | | 1.992% (SOFR + 1.090%), 01/27/2032 (a) | | | 51,826 | |
| | 560,000 | | | 2.615% (SOFR + 1.281%), 04/22/2032 (a) | | | 435,276 | |
| | 225,000 | | | 2.383% (SOFR + 1.248%), 07/21/2032 (a) | | | 169,829 | |
| | 40,000 | | | 2.650% (SOFR + 1.264%), 10/21/2032 (a) | | | 30,679 | |
| | 60,000 | | | 3.102% (SOFR + 1.410%), 02/24/2033 (a) | | | 47,684 | |
| | 20,000 | | | 6.250%, 02/01/2041 | | | 19,907 | |
| | 200,000 | | | UBS Group AG
4.751% (1 Year CMT Rate + 1.750%), 05/12/2028 (a)(c) | | | 188,072 | |
| | | | | Willis North America, Inc. | | | | |
| | 25,000 | | | 3.600%, 05/15/2024 | | | 24,297 | |
| | 195,000 | | | 2.950%, 09/15/2029 | | | 160,606 | |
| | | | | | |
|
|
|
| | | | | | | | 4,644,985 | |
| | | | | | |
|
|
|
See notes to financial statements.
78
GuideMark Core Fixed Income Fund
SCHEDULE OF INVESTMENTS (Continued) (Unaudited)
September 30, 2022
| | | | | | | | |
Principal
Amount
| | | | | Value
| |
| | | | | CORPORATE OBLIGATIONS (Continued) | |
| | | | | Chemicals - 0.25% | | | | |
| | 230,000 | | | Celanese US Holdings LLC
6.165%, 07/15/2027 | | $ | 217,286 | |
| | 290,000 | | | The Sherwin-Williams Co.
2.300%, 05/15/2030 | | | 231,949 | |
| | | | | | |
|
|
|
| | | | | | | | 449,235 | |
| | | | | | |
|
|
|
| | | | | Consumer Finance - 0.42% | | | | |
| | 205,000 | | | American Express Co.
2.550%, 03/04/2027 (f) | | | 182,950 | |
| | | | | Capital One Financial Corp. | | | | |
| | 420,000 | | | 5.247% (SOFR + 2.600%), 07/26/2030 (a) | | | 391,724 | |
| | 180,000 | | | 5.268% (SOFR + 2.370%), 05/10/2033 (a) | | | 166,514 | |
| | | | | | |
|
|
|
| | | | | | | | 741,188 | |
| | | | | | |
|
|
|
| | | | | Diversified Consumer Services - 0.08% | | | | |
| | | | | Howard University | | | | |
| | 100,000 | | | 2.901%, 10/01/2031 | | | 82,047 | |
| | 75,000 | | | 3.476%, 10/01/2041 | | | 55,289 | |
| | | | | | |
|
|
|
| | | | | | | | 137,336 | |
| | | | | | |
|
|
|
| | | | | Diversified Financial Services - 0.71% | | | | |
| | 235,000 | | | Athene Global Funding
2.646%, 10/04/2031 (c) | | | 177,029 | |
| | | | | Corebridge Financial, Inc. | | | | |
| | 150,000 | | | 3.850%, 04/05/2029 (c) | | | 132,447 | |
| | 40,000 | | | 3.900%, 04/05/2032 (c) | | | 33,720 | |
| | 300,000 | | | DAE Funding LLC
1.550%, 08/01/2024 (c) | | | 274,396 | |
| | 340,000 | | | Equitable Financial Life Global Funding
1.800%, 03/08/2028 (c) | | | 284,374 | |
| | 185,000 | | | National Rural Utilities Cooperative Finance Corp.
4.150%, 12/15/2032 | | | 169,519 | |
| | | | | Shell International Finance BV | | | | |
| | 180,000 | | | 3.250%, 04/06/2050 | | | 127,016 | |
| | 110,000 | | | 3.000%, 11/26/2051 | | | 73,152 | |
| | | | | | |
|
|
|
| | | | | | | | 1,271,653 | |
| | | | | | |
|
|
|
| | | | | Diversified Telecommunication Services - 0.62% | | | | |
| | | | | AT&T, Inc. | | | | |
| | 210,000 | | | 1.700%, 03/25/2026 | | | 186,256 | |
| | 175,000 | | | 4.500%, 05/15/2035 | | | 151,632 | |
| | 110,000 | | | 3.650%, 06/01/2051 | | | 74,663 | |
| | 168,000 | | | 3.500%, 09/15/2053 | | | 111,815 | |
| | 91,000 | | | 3.550%, 09/15/2055 | | | 59,878 | |
| | 113,000 | | | 3.800%, 12/01/2057 | | | 76,583 | |
| | | | | Verizon Communications, Inc. | | | | |
| | 420,000 | | | 2.355%, 03/15/2032 | | | 322,324 | |
| | 85,000 | | | 2.650%, 11/20/2040 | | | 55,607 | |
| | 85,000 | | | 2.850%, 09/03/2041 | | | 56,922 | |
| | | | | | |
|
|
|
| | | | | | | | 1,095,680 | |
| | | | | | |
|
|
|
| | | | | Electric Utilities - 3.40% | | | | |
| | 165,000 | | | Alabama Power Co.
3.450%, 10/01/2049 | | | 117,323 | |
| | 120,000 | | | Commonwealth Edison Co.
3.650%, 06/15/2046 | | | 90,384 | |
| | 130,000 | | | Consolidated Edison Co. of New York Inc.
3.200%, 12/01/2051 | | | 86,632 | |
| | | | | Duke Energy Carolinas LLC | | | | |
| | 45,000 | | | 2.500%, 03/15/2023 | | | 44,655 | |
| | 150,000 | | | 2.550%, 04/15/2031 | | | 123,289 | |
| | 301,000 | | | 5.300%, 02/15/2040 | | | 286,733 | |
| | | | | | | | |
Principal
Amount
| | | | | Value
| |
| | | | | Electric Utilities (Continued) | | | | |
| | | | | Duke Energy Corp. | | | | |
| | 429,000 | | | 2.550%, 06/15/2031 | | $ | 336,300 | |
| | 220,000 | | | 4.500%, 08/15/2032 | | | 199,155 | |
| | 95,000 | | | Duke Energy Indiana, Inc.
4.900%, 07/15/2043 | | | 83,671 | |
| | | | | Duke Energy Progress LLC | | | | |
| | 50,000 | | | 2.000%, 08/15/2031 | | | 38,701 | |
| | 75,000 | | | 4.000%, 04/01/2052 | | | 58,978 | |
| | 330,000 | | | Enel Finance International NV
5.000%, 06/15/2032 (c) | | | 282,003 | |
| | 45,000 | | | Evergy Metro, Inc.
2.250%, 06/01/2030 | | | 36,637 | |
| | | | | Evergy, Inc. | | | | |
| | 80,000 | | | 2.450%, 09/15/2024 | | | 75,761 | |
| | 155,000 | | | 2.900%, 09/15/2029 | | | 128,216 | |
| | | | | Exelon Corp. | | | | |
| | 10,000 | | | 4.700%, 04/15/2050 | | | 8,393 | |
| | 35,000 | | | 4.100%, 03/15/2052 (c) | | | 26,845 | |
| | | | | Georgia Power Co. | | | | |
| | 130,000 | | | 2.100%, 07/30/2023 | | | 127,182 | |
| | 120,000 | | | 4.700%, 05/15/2032 | | | 112,536 | |
| | 140,000 | | | 4.750%, 09/01/2040 | | | 118,064 | |
| | 210,000 | | | ITC Holdings Corp.
2.950%, 05/14/2030 (c) | | | 172,623 | |
| | | | | NextEra Energy Capital Holdings, Inc. | | | | |
| | 365,000 | | | 4.625%, 07/15/2027 | | | 353,503 | |
| | 325,000 | | | 2.250%, 06/01/2030 | | | 259,660 | |
| | 145,000 | | | Oglethorpe Power Corp.
5.050%, 10/01/2048 | | | 122,048 | |
| | | | | Oncor Electric Delivery Co. LLC | | | | |
| | 50,000 | | | 5.750%, 03/15/2029 | | | 51,472 | |
| | 235,000 | | | 2.750%, 05/15/2030 | | | 201,182 | |
| | | | | Pacific Gas and Electric Co. | | | | |
| | 490,000 | | | 5.450%, 06/15/2027 | | | 462,502 | |
| | 520,000 | | | 2.500%, 02/01/2031 | | | 378,852 | |
| | 120,000 | | | 3.250%, 06/01/2031 | | | 91,665 | |
| | 150,000 | | | 4.950%, 07/01/2050 | | | 110,222 | |
| | | | | PacifiCorp | | | | |
| | 60,000 | | | 2.700%, 09/15/2030 (f) | | | 50,170 | |
| | 33,000 | | | 4.125%, 01/15/2049 | | | 26,019 | |
| | 10,000 | | | 3.300%, 03/15/2051 | | | 6,985 | |
| | | | | Puget Energy, Inc. | | | | |
| | 135,000 | | | 3.650%, 05/15/2025 | | | 127,874 | |
| | 135,000 | | | 4.100%, 06/15/2030 | | | 119,101 | |
| | 110,000 | | | Sierra Pacific Power Co.
2.600%, 05/01/2026 | | | 101,732 | |
| | 122,000 | | | South Carolina Electric & Gas Co.
5.100%, 06/01/2065 | | | 110,426 | |
| | | | | Southern California Edison Co. | | | | |
| | 90,000 | | | 2.850%, 08/01/2029 | | | 75,990 | |
| | 225,000 | | | 2.250%, 06/01/2030 | | | 178,464 | |
| | 230,000 | | | 2.750%, 02/01/2032 | | | 182,435 | |
| | 19,000 | | | 4.000%, 04/01/2047 | | | 13,897 | |
| | 61,000 | | | 4.125%, 03/01/2048 | | | 45,509 | |
| | 80,000 | | | 3.650%, 02/01/2050 | | | 54,976 | |
| | | | | The Southern Co. | | | | |
| | 230,000 | | | 3.700%, 04/30/2030 | | | 202,688 | |
| | 25,000 | | | 4.400%, 07/01/2046 | | | 19,629 | |
| | 75,000 | | | Virginia Electric and Power Co.
4.625%, 05/15/2052 | | | 65,155 | |
See notes to financial statements.
79
GuideMark Core Fixed Income Fund
SCHEDULE OF INVESTMENTS (Continued) (Unaudited)
September 30, 2022
| | | | | | | | |
Principal
Amount
| | | | | Value
| |
| | | | | CORPORATE OBLIGATIONS (Continued) | |
| | | | | Electric Utilities (Continued) | | | | |
| | 95,000 | | | Xcel Energy, Inc.
4.600%, 06/01/2032 | | $ | 88,306 | |
| | | | | | |
|
|
|
| | | | | | | | 6,054,543 | |
| | | | | | |
|
|
|
| | | | | Electronic Equipment, Instruments & Components - 0.16% | |
| | | | | CDW LLC / CDW Finance Corp. | | | | |
| | 60,000 | | | 2.670%, 12/01/2026 | | | 52,137 | |
| | 55,000 | | | 3.276%, 12/01/2028 | | | 45,189 | |
| | 55,000 | | | 3.569%, 12/01/2031 | | | 43,030 | |
| | 150,000 | | | Microchip Technology, Inc.
2.670%, 09/01/2023 | | | 146,244 | |
| | | | | | |
|
|
|
| | | | | | | | 286,600 | |
| | | | | | |
|
|
|
| | | | | Energy Equipment & Services - 0.06% | | | | |
| | 65,000 | | | Halliburton Co.
4.850%, 11/15/2035 | | | 56,523 | |
| | 59,000 | | | Schlumberger Holdings Corp.
4.300%, 05/01/2029 (c) | | | 54,131 | |
| | | | | | |
|
|
|
| | | | | | | | 110,654 | |
| | | | | | |
|
|
|
| | | | | Equity Real Estate Investment Trusts (REITs) - 0.32% | |
| | | | | American Tower Corp. | | | | |
| | 95,000 | | | 1.450%, 09/15/2026 | | | 80,968 | |
| | 150,000 | | | 3.650%, 03/15/2027 | | | 137,422 | |
| | 100,000 | | | 2.700%, 04/15/2031 | | | 78,575 | |
| | | | | VICI Properties LP | | | | |
| | 125,000 | | | 4.950%, 02/15/2030 | | | 113,229 | |
| | 170,000 | | | 5.125%, 05/15/2032 | | | 151,065 | |
| | | | | | |
|
|
|
| | | | | | | | 561,259 | |
| | | | | | |
|
|
|
| | | | | Food Products - 0.27% | | | | |
| | | | | Cargill, Inc. | | | | |
| | 165,000 | | | 2.125%, 11/10/2031 (c) | | | 129,147 | |
| | 125,000 | | | 4.000%, 06/22/2032 (c) | | | 113,936 | |
| | 185,000 | | | Conagra Brands, Inc.
4.850%, 11/01/2028 | | | 174,909 | |
| | | | | Mondelez International, Inc. | | | | |
| | 40,000 | | | 2.625%, 03/17/2027 | | | 35,917 | |
| | 7,000 | | | 2.750%, 04/13/2030 | | | 5,838 | |
| | 30,000 | | | 3.000%, 03/17/2032 | | | 24,668 | |
| | | | | | |
|
|
|
| | | | | | | | 484,415 | |
| | | | | | |
|
|
|
| | | | | Health Care Equipment & Supplies - 0.29% | | | | |
| | 200,000 | | | Alcon Finance Corp.
2.750%, 09/23/2026 (c) | | | 179,204 | |
| | 260,000 | | | Baxter International, Inc.
2.272%, 12/01/2028 | | | 215,060 | |
| | 85,000 | | | Boston Scientific Corp.
1.900%, 06/01/2025 | | | 78,229 | |
| | 51,000 | | | Shire Acquisitions Investments Ireland Designated Activity Co.
2.875%, 09/23/2023 | | | 49,903 | |
| | | | | | |
|
|
|
| | | | | | | | 522,396 | |
| | | | | | |
|
|
|
| | | | | Health Care Providers & Services - 0.87% | | | | |
| | | | | Cigna Corp. | | | | |
| | 130,000 | | | 1.250%, 03/15/2026 | | | 114,046 | |
| | 160,000 | | | 4.375%, 10/15/2028 | | | 151,214 | |
| | 70,000 | | | CommonSpirit Health
2.760%, 10/01/2024 | | | 66,710 | |
| | | | | | | | |
Principal
Amount
| | | | | Value
| |
| | | | | Health Care Providers & Services (Continued) | | | | |
| | | | | CVS Health Corp. | | | | |
| | 100,000 | | | 4.125%, 04/01/2040 | | $ | 79,835 | |
| | 85,000 | | | 5.125%, 07/20/2045 | | | 74,613 | |
| | 100,000 | | | 5.050%, 03/25/2048 | | | 87,965 | |
| | | | | Elevance Health, Inc. | | | | |
| | 95,000 | | | 3.650%, 12/01/2027 | | | 88,649 | |
| | 155,000 | | | 2.875%, 09/15/2029 | | | 132,471 | |
| | | | | Humana, Inc. | | | | |
| | 76,000 | | | 3.700%, 03/23/2029 | | | 68,244 | |
| | 95,000 | | | 2.150%, 02/03/2032 | | | 72,295 | |
| | | | | Kaiser Foundation Hospitals | | | | |
| | 70,000 | | | 2.810%, 06/01/2041 | | | 49,035 | |
| | 115,000 | | | 3.002%, 06/01/2051 | | | 76,157 | |
| | 100,000 | | | Quest Diagnostics, Inc.
2.800%, 06/30/2031 | | | 80,726 | |
| | 75,000 | | | Sutter Health
3.361%, 08/15/2050 | | | 52,233 | |
| | | | | UnitedHealth Group, Inc. | | | | |
| | 135,000 | | | 2.300%, 05/15/2031 | | | 108,809 | |
| | 100,000 | | | 4.200%, 05/15/2032 | | | 92,928 | |
| | 10,000 | | | 3.500%, 08/15/2039 | | | 7,890 | |
| | 135,000 | | | 3.950%, 10/15/2042 | | | 109,846 | |
| | 30,000 | | | 4.950%, 05/15/2062 | | | 26,829 | |
| | | | | | |
|
|
|
| | | | | | | | 1,540,495 | |
| | | | | | |
|
|
|
| | | | | Hotels, Restaurants & Leisure - 0.16% | | | | |
| | 65,000 | | | GLP Capital LP / GLP Financing II, Inc.
5.300%, 01/15/2029 | | | 59,414 | |
| | 58,000 | | | Las Vegas Sands Corp.
3.500%, 08/18/2026 | | | 50,794 | |
| | | | | McDonald’s Corp. | | | | |
| | 50,000 | | | 4.600%, 05/26/2045 | | | 42,600 | |
| | 15,000 | | | 4.875%, 12/09/2045 | | | 13,303 | |
| | 55,000 | | | 3.625%, 09/01/2049 | | | 40,175 | |
| | 90,000 | | | 4.200%, 04/01/2050 | | | 72,305 | |
| | | | | | |
|
|
|
| | | | | | | | 278,591 | |
| | | | | | |
|
|
|
| | | | | Industrial Conglomerates - 0.15% | | | | |
| | | | | NXP BV / NXP Funding LLC / NXP USA, Inc. | | | | |
| | 147,000 | | | 4.875%, 03/01/2024 | | | 145,403 | |
| | 135,000 | | | 4.300%, 06/18/2029 | | | 121,028 | |
| | | | | | |
|
|
|
| | | | | | | | 266,431 | |
| | | | | | |
|
|
|
| | | | | Insurance - 0.43% | | | | |
| | 70,000 | | | Aon Corp / Aon Global Holdings PLC
3.900%, 02/28/2052 | | | 52,107 | |
| | 135,000 | | | Berkshire Hathaway Finance Corp.
4.200%, 08/15/2048 | | | 112,496 | |
| | 190,000 | | | Brighthouse Financial Global Funding
1.750%, 01/13/2025 (c) | | | 173,488 | |
| | | | | Marsh & McLennan Cos., Inc. | | | | |
| | 70,000 | | | 4.050%, 10/15/2023 | | | 69,491 | |
| | 90,000 | | | 4.750%, 03/15/2039 | | | 81,164 | |
| | 360,000 | | | Metropolitan Life Global Funding I
2.400%, 01/11/2032 (c) | | | 282,933 | |
| | | | | | |
|
|
|
| | | | | | | | 771,679 | |
| | | | | | |
|
|
|
| | | | | Internet & Direct Marketing Retail - 0.27% | | | | |
| | | | | Amazon.com, Inc. | | | | |
| | 150,000 | | | 3.875%, 08/22/2037 (f) | | | 130,558 | |
| | 435,000 | | | 4.100%, 04/13/2062 | | | 348,434 | |
| | | | | | |
|
|
|
| | | | | | | | 478,992 | |
| | | | | | |
|
|
|
See notes to financial statements.
80
GuideMark Core Fixed Income Fund
SCHEDULE OF INVESTMENTS (Continued) (Unaudited)
September 30, 2022
| | | | | | | | |
Principal
Amount
| | | | | Value
| |
| | | | | CORPORATE OBLIGATIONS (Continued) | |
| | | | | IT Services - 0.43% | | | | |
| | | | | Fiserv, Inc. | | | | |
| | 135,000 | | | 3.200%, 07/01/2026 | | $ | 124,404 | |
| | 130,000 | | | 2.250%, 06/01/2027 | | | 112,247 | |
| | | | | Global Payments, Inc. | | | | |
| | 60,000 | | | 2.150%, 01/15/2027 | | | 51,444 | |
| | 30,000 | | | 3.200%, 08/15/2029 | | | 25,040 | |
| | 125,000 | | | 5.300%, 08/15/2029 | | | 117,771 | |
| | 230,000 | | | 2.900%, 05/15/2030 | | | 183,628 | |
| | 100,000 | | | International Business Machines Corp.
2.720%, 02/09/2032 | | | 81,330 | |
| | 113,000 | | | Kyndryl Holdings, Inc.
3.150%, 10/15/2031 | | | 75,870 | |
| | | | | | |
|
|
|
| | | | | | | | 771,734 | |
| | | | | | |
|
|
|
| | | | | Machinery - 0.38% | | | | |
| | 540,000 | | | Otis Worldwide Corp.
2.565%, 02/15/2030 | | | 442,090 | |
| | | | | Parker-Hannifin Corp. | | | | |
| | 150,000 | | | 4.250%, 09/15/2027 | | | 143,176 | |
| | 100,000 | | | 4.500%, 09/15/2029 | | | 94,369 | |
| | | | | | |
|
|
|
| | | | | | | | 679,635 | |
| | | | | | |
|
|
|
| | | | | Media - 1.68% | | | | |
| | | | | Charter Communications Operating LLC / Charter Communications Operating Capital | | | | |
| | 210,000 | | | 2.250%, 01/15/2029 | | | 164,128 | |
| | 295,000 | | | 4.400%, 04/01/2033 | | | 243,941 | |
| | 74,000 | | | 3.500%, 03/01/2042 | | | 46,873 | |
| | 150,000 | | | 5.375%, 05/01/2047 | | | 116,429 | |
| | 55,000 | | | 5.750%, 04/01/2048 | | | 44,542 | |
| | 75,000 | | | 5.125%, 07/01/2049 | | | 55,882 | |
| | 160,000 | | | 4.800%, 03/01/2050 | | | 115,850 | |
| | 45,000 | | | 3.700%, 04/01/2051 (f) | | | 27,392 | |
| | 170,000 | | | 3.900%, 06/01/2052 | | | 105,667 | |
| | 70,000 | | | 4.400%, 12/01/2061 | | | 44,774 | |
| | | | | Comcast Corp. | | | | |
| | 35,000 | | | 3.200%, 07/15/2036 | | | 27,123 | |
| | 255,000 | | | 3.750%, 04/01/2040 | | | 201,147 | |
| | 160,000 | | | 2.937%, 11/01/2056 | | | 95,798 | |
| | | | | Cox Communications, Inc. | | | | |
| | 101,000 | | | 3.150%, 08/15/2024 (c) | | | 96,795 | |
| | 120,000 | | | 2.600%, 06/15/2031 (c) | | | 93,176 | |
| | | | | Discovery Communications, LLC | | | | |
| | 18,000 | | | 4.125%, 05/15/2029 | | | 15,424 | |
| | 179,000 | | | 5.200%, 09/20/2047 | | | 132,562 | |
| | 103,000 | | | 5.300%, 05/15/2049 | | | 77,100 | |
| | 115,000 | | | 4.650%, 05/15/2050 | | | 78,976 | |
| | | | | Paramount Global, Inc. | | | | |
| | 15,000 | | | 4.950%, 01/15/2031 | | | 13,242 | |
| | 255,000 | | | 4.200%, 05/19/2032 | | | 206,709 | |
| | 100,000 | | | 4.375%, 03/15/2043 | | | 66,856 | |
| | | | | Time Warner Cable, Inc. | | | | |
| | 30,000 | | | 5.500%, 09/01/2041 | | | 23,619 | |
| | 50,000 | | | 4.500%, 09/15/2042 | | | 34,634 | |
| | | | | Warnermedia Holdings, Inc. | | | | |
| | 360,000 | | | 4.279%, 03/15/2032 (c)(f) | | | 297,494 | |
| | 765,000 | | | 5.141%, 03/15/2052 (c)(f) | | | 559,111 | |
| | | | | | |
|
|
|
| | | | | | | | 2,985,244 | |
| | | | | | |
|
|
|
| | | | | | | | |
Principal
Amount
| | | | | Value
| |
| | | | | Metals & Mining - 0.16% | | | | |
| | 205,000 | | | Anglo American Capital PLC
3.875%, 03/16/2029 (c) | | $ | 176,506 | |
| | 140,000 | | | Vale Overseas, Ltd.
3.750%, 07/08/2030 | | | 113,278 | |
| | | | | | |
|
|
|
| | | | | | | | 289,784 | |
| | | | | | |
|
|
|
| | | | | Multi-Utilities - 0.63% | | | | |
| | | | | Berkshire Hathaway Energy Co. | | | | |
| | 50,000 | | | 3.250%, 04/15/2028 | | | 45,443 | |
| | 65,000 | | | 6.125%, 04/01/2036 | | | 66,472 | |
| | 75,000 | | | Dominion Energy, Inc.
3.375%, 04/01/2030 | | | 64,587 | |
| | | | | NiSource, Inc. | | | | |
| | 379,000 | | | 3.600%, 05/01/2030 (f) | | | 330,083 | |
| | 45,000 | | | 1.700%, 02/15/2031 | | | 33,330 | |
| | 475,000 | | | Public Service Enterprise Group, Inc.
1.600%, 08/15/2030 | | | 357,877 | |
| | | | | Sempra Energy | | | | |
| | 150,000 | | | 3.400%, 02/01/2028 | | | 135,713 | |
| | 35,000 | | | 3.700%, 04/01/2029 | | | 31,303 | |
| | 75,000 | | | 4.000%, 02/01/2048 | | | 56,132 | |
| | | | | | |
|
|
|
| | | | | | | | 1,120,940 | |
| | | | | | |
|
|
|
| | | | | Oil, Gas & Consumable Fuels - 2.20% | | | | |
| | 110,000 | | | Amerada Hess Corp.
7.875%, 10/01/2029 | | | 119,517 | |
| | 50,000 | | | Boston Gas Co.
3.757%, 03/16/2032 (c) | | | 42,173 | |
| | 95,000 | | | ConocoPhillips Co.
3.800%, 03/15/2052 | | | 72,913 | |
| | | | | Energy Transfer LP | | | | |
| | 180,000 | | | 5.250%, 04/15/2029 | | | 169,477 | |
| | 115,000 | | | 6.250%, 04/15/2049 | | | 103,330 | |
| | 140,000 | | | Energy Transfer Operating LP
6.125%, 12/15/2045 | | | 123,184 | |
| | | | | Enterprise Products Operating LLC | | | | |
| | 155,000 | | | 2.800%, 01/31/2030 | | | 129,615 | |
| | 240,000 | | | 4.800%, 02/01/2049 | | | 198,246 | |
| | | | | Equinor ASA | | | | |
| | 95,000 | | | 3.625%, 04/06/2040 | | | 76,248 | |
| | 100,000 | | | 3.700%, 04/06/2050 | | | 77,903 | |
| | 160,000 | | | Exxon Mobil Corp.
4.227%, 03/19/2040 | | | 139,395 | |
| | 196,522 | | | Galaxy Pipeline Assets Bidco, Ltd.
2.940%, 09/30/2040 (c) | | | 149,968 | |
| | 95,000 | | | Hess Corp.
7.300%, 08/15/2031 | | | 100,378 | |
| | 130,000 | | | Marathon Petroleum Corp.
4.700%, 05/01/2025 | | | 127,804 | |
| | | | | MPLX LP | | | | |
| | 90,000 | | | 4.125%, 03/01/2027 | | | 84,076 | |
| | 35,000 | | | 4.250%, 12/01/2027 | | | 32,658 | |
| | 250,000 | | | 4.950%, 09/01/2032 | | | 227,322 | |
| | 90,000 | | | 5.200%, 03/01/2047 | | | 74,250 | |
| | 100,000 | | | 4.950%, 03/14/2052 | | | 78,511 | |
| | | | | ONEOK, Inc. | | | | |
| | 55,000 | | | 4.550%, 07/15/2028 | | | 50,463 | |
| | 135,000 | | | 3.100%, 03/15/2030 | | | 109,829 | |
| | 62,000 | | | 6.350%, 01/15/2031 | | | 60,861 | |
| | 45,000 | | | Ovintiv, Inc.
7.375%, 11/01/2031 | | | 46,935 | |
See notes to financial statements.
81
GuideMark Core Fixed Income Fund
SCHEDULE OF INVESTMENTS (Continued) (Unaudited)
September 30, 2022
| | | | | | | | |
Principal
Amount
| | | | | Value
| |
| | | | | CORPORATE OBLIGATIONS (Continued) | |
| | | | | Oil, Gas & Consumable Fuels (Continued) | | | | |
| | | | | Plains All American Pipeline LP / PAA Finance Corp. | | | | |
| | 45,000 | | | 3.550%, 12/15/2029 | | $ | 37,533 | |
| | 80,000 | | | 3.800%, 09/15/2030 | | | 67,141 | |
| | | | | Sabine Pass Liquefaction LLC | | | | |
| | 40,000 | | | 5.625%, 03/01/2025 | | | 40,009 | |
| | 50,000 | | | 5.000%, 03/15/2027 | | | 48,018 | |
| | 285,000 | | | 4.500%, 05/15/2030 | | | 259,948 | |
| | 10,000 | | | Southern Co. Gas Capital Corp.
2.450%, 10/01/2023 | | | 9,771 | |
| | | | | Sunoco Logistics Partners Operations LP | | | | |
| | 5,000 | | | 5.300%, 04/01/2044 | | | 4,017 | |
| | 5,000 | | | 5.350%, 05/15/2045 | | | 4,035 | |
| | | | | Targa Resources Corp. | | | | |
| | 125,000 | | | 5.200%, 07/01/2027 | | | 120,510 | |
| | 115,000 | | | 4.200%, 02/01/2033 | | | 95,909 | |
| | 235,000 | | | Targa Resources Partners LP / Targa Resources Partners Finance Corp.
4.000%, 01/15/2032 | | | 194,282 | |
| | 245,000 | | | The Brooklyn Union Gas Co.
4.866%, 08/05/2032 (c) | | | 224,486 | |
| | | | | The Williams Companies, Inc. | | | | |
| | 95,000 | | | 2.600%, 03/15/2031 | | | 74,605 | |
| | 155,000 | | | 4.650%, 08/15/2032 | | | 140,732 | |
| | | | | TransCanada PipeLines, Ltd. | | | | |
| | 70,000 | | | 4.100%, 04/15/2030 | | | 62,705 | |
| | 105,000 | | | 2.500%, 10/12/2031 | | | 80,505 | |
| | 70,000 | | | Transcontinental Gas Pipe Line Co., LLC
3.250%, 05/15/2030 | | | 59,245 | |
| | | | | | |
|
|
|
| | | | | | | | 3,918,507 | |
| | | | | | |
|
|
|
| | | | | Personal Products - 0.15% | | | | |
| | 295,000 | | | GSK Consumer Healthcare Capital US LLC
3.375%, 03/24/2029 (c)(f) | | | 257,755 | |
| | | | | | |
|
|
|
| | | | | Pharmaceuticals - 0.68% | | | | |
| | 230,000 | | | Bayer US Finance II LLC
4.250%, 12/15/2025 (c) | | | 220,347 | |
| | | | | Bristol-Myers Squibb Co. | | | | |
| | 24,000 | | | 3.400%, 07/26/2029 | | | 21,840 | |
| | 195,000 | | | 3.550%, 03/15/2042 | | | 153,253 | |
| | 5,000 | | | 2.550%, 11/13/2050 | | | 3,096 | |
| | | | | Johnson & Johnson | | | | |
| | 75,000 | | | 3.550%, 03/01/2036 | | | 64,574 | |
| | 55,000 | | | 3.625%, 03/03/2037 | | | 47,611 | |
| | | | | Royalty Pharma PLC | | | | |
| | 190,000 | | | 1.750%, 09/02/2027 | | | 157,373 | |
| | 260,000 | | | 2.200%, 09/02/2030 | | | 198,752 | |
| | 210,000 | | | 2.150%, 09/02/2031 | | | 154,831 | |
| | 60,000 | | | 3.350%, 09/02/2051 | | | 36,324 | |
| | 200,000 | | | Takeda Pharmaceutical Co., Ltd.
2.050%, 03/31/2030 | | | 158,325 | |
| | | | | | |
|
|
|
| | | | | | | | 1,216,326 | |
| | | | | | |
|
|
|
| | | | | Road & Rail - 0.23% | | | | |
| | 120,000 | | | Canadian Pacific Railway Co.
2.450%, 12/02/2031 | | | 96,148 | |
| | 45,000 | | | CSX Corp.
4.500%, 03/15/2049 | | | 38,215 | |
| | 30,000 | | | Norfolk Southern Corp.
3.400%, 11/01/2049 | | | 21,108 | |
| | | | | | | | |
Principal
Amount
| | | | | Value
| |
| | | | | Road & Rail (Continued) | | | | |
| | | | | Union Pacific Corp. | | | | |
| | 95,000 | | | 2.800%, 02/14/2032 | | $ | 78,971 | |
| | 220,000 | | | 4.100%, 09/15/2067 | | | 166,526 | |
| | | | | | |
|
|
|
| | | | | | | | 400,968 | |
| | | | | | |
|
|
|
| | | | | Semiconductors & Semiconductor Equipment - 0.89% | |
| | | | | Broadcom, Inc. | | | | |
| | 95,000 | | | 4.300%, 11/15/2032 | | | 79,915 | |
| | 105,000 | | | 2.600%, 02/15/2033 (c) | | | 75,125 | |
| | 285,000 | | | 3.419%, 04/15/2033 (c) | | | 217,941 | |
| | 44,000 | | | 3.137%, 11/15/2035 (c) | | | 30,905 | |
| | 300,000 | | | 3.187%, 11/15/2036 (c) | | | 205,697 | |
| | 66,000 | | | 4.926%, 05/15/2037 (c) | | | 54,514 | |
| | | | | Intel Corp. | | | | |
| | 195,000 | | | 4.000%, 08/05/2029 | | | 181,342 | |
| | 135,000 | | | 4.150%, 08/05/2032 | | | 123,172 | |
| | 150,000 | | | 2.800%, 08/12/2041 | | | 101,227 | |
| | 70,000 | | | 3.250%, 11/15/2049 | | | 46,564 | |
| | 80,000 | | | 3.050%, 08/12/2051 | | | 51,554 | |
| | 160,000 | | | 5.050%, 08/05/2062 | | | 139,133 | |
| | | | | Marvell Technology, Inc. | | | | |
| | 30,000 | | | 2.450%, 04/15/2028 | | | 24,837 | |
| | 170,000 | | | 2.950%, 04/15/2031 | | | 132,016 | |
| | 150,000 | | | NVIDIA Corp.
3.500%, 04/01/2040 | | | 116,918 | |
| | | | | | |
|
|
|
| | | | | | | | 1,580,860 | |
| | | | | | |
|
|
|
| | | | | Software - 0.52% | | | | |
| | | | | Oracle Corp. | | | | |
| | 270,000 | | | 2.300%, 03/25/2028 | | | 226,063 | |
| | 145,000 | | | 2.875%, 03/25/2031 | | | 114,476 | |
| | 185,000 | | | 4.300%, 07/08/2034 | | | 151,059 | |
| | 25,000 | | | 3.900%, 05/15/2035 | | | 19,189 | |
| | 50,000 | | | 3.800%, 11/15/2037 | | | 36,228 | |
| | 212,000 | | | 3.600%, 04/01/2040 | | | 144,289 | |
| | 287,000 | | | 3.600%, 04/01/2050 | | | 180,152 | |
| | 85,000 | | | 4.100%, 03/25/2061 | | | 53,743 | |
| | | | | | |
|
|
|
| | | | | | | | 925,199 | |
| | | | | | |
|
|
|
| | | | | Specialty Retail - 0.37% | | | | |
| | | | | Lowe’s Cos, Inc. | | | | |
| | 30,000 | | | 3.750%, 04/01/2032 | | | 25,976 | |
| | 205,000 | | | 5.000%, 04/15/2033 | | | 194,258 | |
| | 25,000 | | | 3.700%, 04/15/2046 | | | 17,949 | |
| | 85,000 | | | 5.625%, 04/15/2053 | | | 78,998 | |
| | 215,000 | | | O’Reilly Automotive, Inc.
4.700%, 06/15/2032 | | | 201,625 | |
| | 155,000 | | | Penske Truck Leasing Co. LP / PTL Finance Corp.
4.400%, 07/01/2027 (c) | | | 145,687 | |
| | | | | | |
|
|
|
| | | | | | | | 664,493 | |
| | | | | | |
|
|
|
| | | | | Technology Hardware, Storage & Peripherals - 0.10% | |
| | | | | Apple, Inc. | | | | |
| | 25,000 | | | 3.450%, 02/09/2045 | | | 19,793 | |
| | 230,000 | | | 2.650%, 02/08/2051 | | | 151,912 | |
| | | | | | |
|
|
|
| | | | | | | | 171,705 | |
| | | | | | |
|
|
|
| | | | | Tobacco - 0.42% | | | | |
| | | | | Altria Group, Inc. | | | | |
| | 40,000 | | | 3.400%, 02/04/2041 | | | 25,308 | |
| | 10,000 | | | 3.700%, 02/04/2051 | | | 6,057 | |
See notes to financial statements.
82
GuideMark Core Fixed Income Fund
SCHEDULE OF INVESTMENTS (Continued) (Unaudited)
September 30, 2022
| | | | | | | | |
Principal
Amount
| | | | | Value
| |
| | | | | CORPORATE OBLIGATIONS (Continued) | |
| | | | | Tobacco (Continued) | | | | |
| | | | | BAT Capital Corp. | | | | |
| | 135,000 | | | 2.259%, 03/25/2028 | | $ | 107,646 | |
| | 100,000 | | | 3.462%, 09/06/2029 | | | 81,564 | |
| | 320,000 | | | 4.742%, 03/16/2032 | | | 268,105 | |
| | 205,000 | | | BAT International Finance PLC
4.448%, 03/16/2028 | | | 183,136 | |
| | 85,000 | | | Reynolds American, Inc.
5.700%, 08/15/2035 | | | 71,999 | |
| | | | | | |
|
|
|
| | | | | | | | 743,815 | |
| | | | | | |
|
|
|
| | | | | Water Utilities - 0.16% | | | | |
| | | | | American Water Capital Corp. | | | | |
| | 140,000 | | | 3.450%, 06/01/2029 | | | 124,817 | |
| | 140,000 | | | 4.450%, 06/01/2032 | | | 130,087 | |
| | 45,000 | | | 4.150%, 06/01/2049 | | | 36,142 | |
| | | | | | |
|
|
|
| | | | | | | | 291,046 | |
| | | | | | |
|
|
|
| | | | | Wireless Telecommunication Services - 0.37% | | | | |
| | 150,000 | | | Rogers Communications, Inc.
4.550%, 03/15/2052 (c) | | | 119,895 | |
| | | | | T-Mobile USA, Inc. | | | | |
| | 65,000 | | | 2.050%, 02/15/2028 | | | 53,993 | |
| | 180,000 | | | 3.875%, 04/15/2030 | | | 159,712 | |
| | 95,000 | | | 5.200%, 01/15/2033 (f) | | | 90,931 | |
| | 255,000 | | | 3.000%, 02/15/2041 | | | 170,879 | |
| | 60,000 | | | 5.650%, 01/15/2053 | | | 56,743 | |
| | | | | | |
|
|
|
| | | | | | | | 652,153 | |
| | | | | | |
|
|
|
| | | | | Total Corporate Obligations
(Cost $57,500,023) | | | 48,321,575 | |
| | | | | | |
|
|
|
| | | | | FOREIGN GOVERNMENT DEBT OBLIGATIONS - 1.38% | |
| | | | | Bermuda Government International Bond | | | | |
| | 200,000 | | | 2.375%, 08/20/2030 | | | 160,098 | |
| | 200,000 | | | 5.000%, 07/15/2032 (c) | | | 190,399 | |
| | 200,000 | | | Chile Government International Bond
3.500%, 01/31/2034 | | | 163,935 | |
| | 285,000 | | | Finance Department Government of Sharjah
3.625%, 03/10/2033 | | | 221,835 | |
| | 210,000 | | | Hungary Government International Bond
5.250%, 06/16/2029 (c) | | | 190,357 | |
| | | | | Mexico Government International Bond | | | | |
| | 210,000 | | | 3.500%, 02/12/2034 | | | 160,240 | |
| | 200,000 | | | 4.280%, 08/14/2041 | | | 146,086 | |
| | 280,000 | | | 4.750%, 03/08/2044 | | | 215,569 | |
| | | | | Panama Government International Bond | | | | |
| | 410,000 | | | 4.500%, 04/16/2050 | | | 286,894 | |
| | 220,000 | | | 3.870%, 07/23/2060 | | | 131,543 | |
| | 200,000 | | | 4.500%, 01/19/2063 | | | 132,649 | |
| | | | | Romanian Government International Bond | | | | |
| | 246,000 | | | 3.000%, 02/27/2027 (c) | | | 208,476 | |
| | 338,000 | | | 3.000%, 02/14/2031 | | | 241,302 | |
| | | | | | |
|
|
|
| | | | | Total Foreign Government Debt Obligations
(Cost $3,318,313) | | | 2,449,383 | |
| | | | | | |
|
|
|
| | | | | MORTGAGE BACKED SECURITIES - U.S. GOVERNMENT AGENCY - 34.03% | |
| | | | | Federal Home Loan Mortgage Corp. | | | | |
| | 1,513 | | | Pool #D9-6291 4.500%, 09/01/2023 | | | 1,454 | |
| | 4,202 | | | Pool #G1-3624 5.000%, 08/01/2024 | | | 4,224 | |
| | 82,000 | | | Series K-068, 3.244%, 08/25/2027 | | | 77,498 | |
| | | | | | | | |
Principal
Amount
| | | | | Value
| |
| | | | | MORTGAGE BACKED SECURITIES - U.S. GOVERNMENT AGENCY (Continued) | |
| | 333,883 | | | Series K-110, 1.814%, 04/25/2030 (b)(k) | | $ | 31,783 | |
| | 1,321,890 | | | Series K-111, 1.680%, 05/25/2030 (b)(k) | | | 120,696 | |
| | 931,559 | | | Series K-114, 1.211%, 06/25/2030 (b)(k) | | | 62,329 | |
| | 299,217 | | | Series K-122, 0.973%, 11/25/2030 (b)(k) | | | 16,139 | |
| | 60,779 | | | Series 2329, 6.500%, 06/15/2031 | | | 62,555 | |
| | 33,634 | | | Series 2338, 6.500%, 07/15/2031 | | | 35,121 | |
| | 37,504 | | | Pool #78-0447 2.972% (1 Year CMT Rate + 2.250%, 2.250% Floor, 9.308% Cap), 04/01/2033 (a) | | | 37,980 | |
| | 45 | | | Pool #A4-3129 5.500%, 02/01/2036 | | | 45 | |
| | 44,689 | | | Series 4216, 1.700%, 10/15/2039 | | | 43,128 | |
| | 31,755 | | | Series 3883, 3.000%, 05/15/2041 | | | 29,639 | |
| | 119,165 | | | Pool #U9-0688 4.000%, 05/01/2042 | | | 113,492 | |
| | 206,468 | | | Pool #Q4-9389 3.500%, 07/01/2047 | | | 189,285 | |
| | 184,098 | | | Pool #Q5-2093 3.500%, 11/01/2047 | | | 168,555 | |
| | 403,548 | | | Series 5170, 2.000%, 07/25/2050 | | | 343,552 | |
| | 1,829,762 | | | Pool #SD-8123 3.000%, 01/01/2051 | | | 1,606,889 | |
| | 2,880,128 | | | Pool #QC-8858 2.500%, 10/01/2051 | | | 2,445,392 | |
| | 374,128 | | | Pool #QD-1626 2.500%, 12/01/2051 | | | 316,130 | |
| | 4,945,680 | | | Pool #QD-4104 2.000%, 01/01/2052 | | | 4,016,925 | |
| | 148,613 | | | Pool #QE-0827 2.000%, 04/01/2052 | | | 120,817 | |
| | 3,817,097 | | | Pool #QE-4044 2.500%, 06/01/2052 | | | 3,220,542 | |
| | | | | Federal National Mortgage Association | | | | |
| | 135,723 | | | Pool #AJ8325 3.000%, 12/01/2026 | | | 132,343 | |
| | 530 | | | Pool #544859 2.564% (11th District Cost of Funds Index + 1.695%, 1.695% Floor, 13.695% Cap), 08/01/2029 (a) | | | 523 | |
| | 714,738 | | | Series K-104, 1.246%, 01/25/2030 (b)(k) | | | 44,812 | |
| | 21,254 | | | Pool #BC4938 2.500%, 04/01/2031 | | | 19,766 | |
| | 44,383 | | | Pool #786848 7.000%, 10/01/2031 | | | 45,705 | |
| | 1,586 | | | Pool #727181 5.000%, 08/01/2033 | | | 1,598 | |
| | 755 | | | Pool #730727 5.000%, 08/01/2033 | | | 759 | |
| | 237 | | | Pool #741862 5.500%, 09/01/2033 | | | 244 | |
| | 290 | | | Pool #766197 5.500%, 02/01/2034 | | | 296 | |
| | 62 | | | Pool #776974 5.500%, 04/01/2034 | | | 64 | |
| | 34,460 | | | Pool #888504 3.003% (1 Year CMT Rate + 2.003%, 2.003% Floor, 9.221% Cap), 04/01/2034 (a) | | | 35,119 | |
| | 113,469 | | | Pool #MA1870 4.500%, 04/01/2034 | | | 109,773 | |
| | 2,810 | | | Pool #775776 5.500%, 05/01/2034 | | | 2,894 | |
| | 1,526,653 | | | Series 2019-M21, 1.321%, 06/25/2034 (b)(k) | | | 139,486 | |
| | 80,295 | | | Pool #802783 2.622% (12 Month LIBOR USD + 1.612%, 1.612% Floor, 10.270% Cap), 10/01/2034 (a) | | | 79,509 | |
| | 1,864 | | | Pool #781629 5.500%, 12/01/2034 | | | 1,927 | |
| | 1,608 | | | Pool #822815 5.500%, 04/01/2035 | | | 1,634 | |
| | 2,462 | | | Pool #357850 5.500%, 07/01/2035 | | | 2,546 | |
| | 1,733 | | | Pool #820242 5.000%, 07/01/2035 | | | 1,750 | |
| | 353 | | | Pool #838452 5.500%, 09/01/2035 | | | 365 | |
| | 3,300,000 | | | Pool #TBA 1.500%, 10/15/2035 (i) | | | 2,830,315 | |
| | 1,854 | | | Pool #865854 6.000%, 03/01/2036 | | | 1,943 | |
| | 2,481 | | | Pool #891474 6.000%, 04/01/2036 | | | 2,573 | |
| | 1,380 | | | Pool #906000 6.000%, 01/01/2037 | | | 1,447 | |
| | 28 | | | Pool #928062 5.500%, 02/01/2037 | | | 29 | |
| | 27 | | | Pool #899119 5.500%, 04/01/2037 | | | 26 | |
| | 151,474 | | | Pool #AS9772 3.500%, 06/01/2037 | | | 141,582 | |
| | 63 | | | Pool #970131 5.500%, 03/01/2038 | | | 64 | |
| | 41 | | | Pool #985108 5.500%, 07/01/2038 | | | 42 | |
| | 47 | | | Pool #964930 5.500%, 08/01/2038 | | | 47 | |
See notes to financial statements.
83
GuideMark Core Fixed Income Fund
SCHEDULE OF INVESTMENTS (Continued) (Unaudited)
September 30, 2022
| | | | | | | | |
Principal
Amount
| | | | | Value
| |
| | | | | MORTGAGE BACKED SECURITIES - U.S. GOVERNMENT AGENCY (Continued) | |
| | 27 | | | Pool #987032 5.500%, 08/01/2038 | | $ | 27 | |
| | 21 | | | Pool #968371 5.500%, 09/01/2038 | | | 21 | |
| | 16 | | | Pool #993050 5.500%, 12/01/2038 | | | 16 | |
| | 7,054 | | | Pool #993579 4.000%, 05/01/2039 | | | 6,701 | |
| | 1,251 | | | Pool #AA5840 4.000%, 06/01/2039 | | | 1,188 | |
| | 27,990 | | | Pool #AA8715 4.000%, 06/01/2039 | | | 26,713 | |
| | 81,178 | | | Pool #AD0586 4.500%, 12/01/2039 | | | 79,710 | |
| | 173,579 | | | Pool #AD4062 5.000%, 05/01/2040 | | | 175,319 | |
| | 139,081 | | | Pool #AD6929 5.000%, 06/01/2040 | | | 140,483 | |
| | 3,415 | | | Pool #AD9896 4.000%, 08/01/2040 | | | 3,260 | |
| | 4,347 | | | Pool #AB1500 4.000%, 09/01/2040 | | | 4,149 | |
| | 4,898 | | | Pool #AD9856 4.000%, 09/01/2040 | | | 4,652 | |
| | 1,946 | | | Pool #AE2559 4.000%, 09/01/2040 | | | 1,858 | |
| | 774 | | | Pool #AE2562 4.000%, 09/01/2040 | | | 739 | |
| | 541 | | | Pool #AE2566 4.000%, 09/01/2040 | | | 516 | |
| | 8,176 | | | Pool #AE4124 4.000%, 10/01/2040 | | | 7,805 | |
| | 4,829 | | | Pool #AE4888 4.000%, 10/01/2040 | | | 4,610 | |
| | 5,582 | | | Pool #AE3916 4.000%, 11/01/2040 | | | 5,329 | |
| | 869 | | | Pool #AE5147 4.000%, 11/01/2040 | | | 829 | |
| | 9,711 | | | Pool #AE8715 4.000%, 11/01/2040 | | | 9,271 | |
| | 1,455 | | | Pool #AH0006 4.000%, 12/01/2040 | | | 1,389 | |
| | 4,649 | | | Pool #AH0020 4.000%, 12/01/2040 | | | 4,438 | |
| | 6,239 | | | Pool #AH0599 4.000%, 12/01/2040 | | | 5,955 | |
| | 1,852 | | | Pool #AH0601 4.000%, 12/01/2040 | | | 1,768 | |
| | 4,713 | | | Pool #AH1263 4.000%, 01/01/2041 | | | 4,499 | |
| | 23,030 | | | Pool #AL5233 4.000%, 01/01/2041 | | | 21,987 | |
| | 1,371 | | | Pool #AH4659 4.000%, 02/01/2041 | | | 1,295 | |
| | 23,479 | | | Pool #AH5653 4.000%, 02/01/2041 | | | 22,412 | |
| | 34,796 | | | Pool #AL0934 5.000%, 02/01/2041 | | | 35,147 | |
| | 53,132 | | | Pool #AD1889 4.500%, 03/01/2041 | | | 52,117 | |
| | 3,890 | | | Pool #AH6150 4.000%, 03/01/2041 | | | 3,714 | |
| | 32,687 | | | Pool #AL0215 4.500%, 04/01/2041 | | | 32,061 | |
| | 27,347 | | | Pool #AL0187 5.000%, 05/01/2041 | | | 27,623 | |
| | 4,931 | | | Pool #AL0456 5.000%, 06/01/2041 | | | 4,980 | |
| | 21,068 | | | Pool #AI8842 4.500%, 08/01/2041 | | | 20,666 | |
| | 17,356 | | | Pool #AL0815 4.000%, 09/01/2041 | | | 16,563 | |
| | 20,385 | | | Series 2012-21, 2.000%, 09/25/2041 | | | 18,495 | |
| | 7,763 | | | Pool #AJ1562 4.000%, 10/01/2041 | | | 7,400 | |
| | 3,841 | | | Pool #AJ1972 4.000%, 10/01/2041 | | | 3,666 | |
| | 228,276 | | | Pool #AJ2212 4.500%, 10/01/2041 | | | 223,913 | |
| | 8,967 | | | Pool #AJ4756 4.000%, 10/01/2041 | | | 8,558 | |
| | 2,000,000 | | | Pool #TBA 4.000%, 10/15/2041 (i) | | | 1,856,875 | |
| | 7,239 | | | Pool #AJ3330 4.000%, 11/01/2041 | | | 6,908 | |
| | 6,755 | | | Pool #AJ4549 4.000%, 11/01/2041 | | | 6,447 | |
| | 6,714 | | | Pool #AJ4698 4.000%, 11/01/2041 | | | 6,407 | |
| | 11,900 | | | Pool #AJ5424 4.000%, 11/01/2041 | | | 11,357 | |
| | 3,711 | | | Pool #AJ7840 4.000%, 11/01/2041 | | | 3,530 | |
| | 7,626 | | | Pool #AB3995 4.000%, 12/01/2041 | | | 7,278 | |
| | 7,351 | | | Pool #AI0848 4.000%, 12/01/2041 | | | 7,016 | |
| | 5,802 | | | Pool #AJ4187 4.000%, 12/01/2041 | | | 5,537 | |
| | 6,888 | | | Pool #AJ5736 4.000%, 12/01/2041 | | | 6,574 | |
| | 3,632 | | | Pool #AJ5968 4.000%, 12/01/2041 | | | 3,467 | |
| | 7,142 | | | Pool #AJ6061 4.000%, 12/01/2041 | | | 6,808 | |
| | 6,923 | | | Pool #AJ7868 4.000%, 12/01/2041 | | | 6,607 | |
| | 12,534 | | | Pool #AJ8104 4.000%, 12/01/2041 | | | 11,962 | |
| | 9,839 | | | Pool #AJ8109 4.000%, 12/01/2041 | | | 9,390 | |
| | 4,583 | | | Pool #AJ8171 4.000%, 12/01/2041 | | | 4,374 | |
| | 10,556 | | | Pool #AJ8341 4.000%, 12/01/2041 | | | 10,074 | |
| | 15,661 | | | Pool #AJ8436 4.000%, 12/01/2041 | | | 14,946 | |
| | | | | | | | |
Principal
Amount
| | | | | Value
| |
| | | | | MORTGAGE BACKED SECURITIES - U.S. GOVERNMENT AGENCY (Continued) | |
| | 5,650 | | | Pool #AJ8912 4.000%, 12/01/2041 | | $ | 5,392 | |
| | 6,499 | | | Pool #AJ9248 4.000%, 12/01/2041 | | | 6,202 | |
| | 34,093 | | | Series 2012-18, 2.000%, 12/25/2041 | | | 30,628 | |
| | 4,247 | | | Pool #AJ2446 4.000%, 01/01/2042 | | | 4,054 | |
| | 10,593 | | | Pool #AJ7538 4.000%, 01/01/2042 | | | 10,109 | |
| | 2,743 | | | Pool #AJ8001 4.000%, 01/01/2042 | | | 2,582 | |
| | 8,062 | | | Pool #AJ8369 4.000%, 01/01/2042 | | | 7,694 | |
| | 8,702 | | | Pool #AJ9162 4.000%, 01/01/2042 | | | 8,305 | |
| | 45,387 | | | Pool #AJ9330 4.000%, 01/01/2042 | | | 43,097 | |
| | 2,964 | | | Pool #AJ9779 4.000%, 01/01/2042 | | | 2,818 | |
| | 7,146 | | | Pool #AK0170 4.000%, 01/01/2042 | | | 6,820 | |
| | 17,279 | | | Pool #AK0543 4.000%, 01/01/2042 | | | 16,490 | |
| | 8,010 | | | Pool #AK0563 4.000%, 01/01/2042 | | | 7,645 | |
| | 13,035 | | | Pool #AK1827 4.000%, 01/01/2042 | | | 12,440 | |
| | 104,157 | | | Pool #AL2752 5.000%, 03/01/2042 | | | 105,206 | |
| | 30,130 | | | Series 2012-52, 3.500%, 05/25/2042 | | | 28,607 | |
| | 19,564 | | | Pool #AB5529 4.000%, 07/01/2042 | | | 18,610 | |
| | 66,573 | | | Pool #AB6228 3.500%, 09/01/2042 | | | 61,224 | |
| | 60,546 | | | Series 415, 3.000%, 11/01/2042 | | | 55,623 | |
| | 113,789 | | | Series 4961, 2.500%, 12/15/2042 | | | 102,851 | |
| | 171,219 | | | Pool #AQ9316 2.500%, 01/01/2043 | | | 146,132 | |
| | 49,466 | | | Series 2015-48, 3.000%, 02/25/2043 | | | 47,162 | |
| | 467,238 | | | Pool #AT2720 3.000%, 05/01/2043 | | | 419,479 | |
| | 281,850 | | | Pool #AT5900 3.000%, 06/01/2043 | | | 252,797 | |
| | 41,029 | | | Series 2013-77, 1.700%, 06/25/2043 | | | 39,190 | |
| | 174,551 | | | Pool #AU1625 3.500%, 07/01/2043 | | | 160,213 | |
| | 34,827 | | | Series 2017-26, 3.500%, 07/25/2044 | | | 34,091 | |
| | 205,136 | | | Pool #AS5469 4.000%, 07/01/2045 | | | 195,108 | |
| | 275,082 | | | Pool #AZ0832 4.000%, 07/01/2045 | | | 260,568 | |
| | 35,577 | | | Pool #AS5597 3.500%, 08/01/2045 | | | 32,736 | |
| | 26,372 | | | Series 2016-38, 3.000%, 01/25/2046 | | | 24,148 | |
| | 48,018 | | | Series 2016-11, 2.500%, 03/25/2046 | | | 44,421 | |
| | 134,574 | | | Pool #AS7170 3.500%, 05/01/2046 | | | 123,409 | |
| | 129,420 | | | Pool #AS7242 3.500%, 05/01/2046 | | | 118,885 | |
| | 245,480 | | | Pool #BC9468 3.000%, 06/01/2046 | | | 219,115 | |
| | 97,086 | | | Pool #AS7492 4.000%, 07/01/2046 | | | 92,264 | |
| | 3,950,000 | | | Pool #TBA 2.500%, 10/15/2046 (i) | | | 3,323,786 | |
| | 170,312 | | | Pool #AS8947 3.500%, 03/01/2047 | | | 156,024 | |
| | 21,319 | | | Series 2017-34, 3.000%, 05/25/2047 | | | 20,282 | |
| | 22,191 | | | Pool #MA3038 4.500%, 06/01/2047 | | | 21,541 | |
| | 1,407,479 | | | Pool #CA0858 3.500%, 12/01/2047 | | | 1,283,746 | |
| | 66,208 | | | Series 2018-23, 3.500%, 04/25/2048 | | | 61,296 | |
| | 420,444 | | | Pool #BN5279 4.000%, 02/01/2049 | | | 397,680 | |
| | 70,519 | | | Series 2019-07, 3.500%, 03/25/2049 | | | 66,951 | |
| | 89,882 | | | Series 2019-14, 3.500%, 04/25/2049 | | | 86,031 | |
| | 75,772 | | | Series 2019-45, 3.000%, 08/25/2049 | | | 69,261 | |
| | 1,150,000 | | | Pool #TBA 2.000%, 03/25/2050 (i) | | | 932,084 | |
| | 8,500,000 | | | Pool #TBA 3.000%, 10/15/2050 (i) | | | 7,406,289 | |
| | 2,170,123 | | | Pool #MA4307 3.000%, 04/01/2051 | | | 1,905,308 | |
| | 2,880,353 | | | Pool #FM7678 2.500%, 06/01/2051 | | | 2,440,118 | |
| | 370,803 | | | Pool #BT7155 2.000%, 08/01/2051 | | | 302,151 | |
| | 3,000,250 | | | Pool #FS1108 2.500%, 09/01/2051 | | | 2,542,231 | |
| | 3,053,803 | | | Pool #FM9491 2.500%, 11/01/2051 | | | 2,582,223 | |
| | 438,628 | | | Pool #FS1069 2.000%, 12/01/2051 | | | 357,012 | |
| | 796,329 | | | Pool #BV1380 2.000%, 01/01/2052 | | | 647,779 | |
| | 249,049 | | | Pool #BT2317 2.000%, 03/01/2052 | | | 202,586 | |
| | 901,683 | | | Pool #BV2993 2.000%, 04/01/2052 | | | 733,621 | |
| | 148,443 | | | Pool #FS1598 2.000%, 04/01/2052 | | | 120,808 | |
| | 2,416,800 | | | Pool #MA4577 2.000%, 04/01/2052 | | | 1,965,628 | |
See notes to financial statements.
84
GuideMark Core Fixed Income Fund
SCHEDULE OF INVESTMENTS (Continued) (Unaudited)
September 30, 2022
| | | | | | | | |
Principal
Amount
| | | | | Value
| |
| | | | | MORTGAGE BACKED SECURITIES - U.S. GOVERNMENT AGENCY (Continued) | |
| | 178,793 | | | Pool #BV9804 2.000%, 05/01/2052 | | $ | 145,388 | |
| | 40,908 | | | Series 2017-35, 3.500%, 04/25/2053 | | | 39,966 | |
| | 42,915 | | | Series 2017-84, 3.500%, 04/25/2053 | | | 41,829 | |
| | 38,779 | | | Series 2017-49, 4.000%, 07/25/2053 | | | 38,161 | |
| | 50,873 | | | Series 2018-70, 3.500%, 10/25/2056 | | | 49,126 | |
| | 80,646 | | | Series 2019-12, 3.500%, 11/25/2057 | | | 76,831 | |
| | 213,811 | | | Series 2020-1, 3.500%, 08/25/2058 | | | 203,044 | |
| | | | | Government National Mortgage Association | | | | |
| | 5,855 | | | Pool #TBA 5.000%, 08/15/2033 (i) | | | 5,799 | |
| | 12,005 | | | Pool #TBA 5.000%, 02/15/2039 (i) | | | 12,086 | |
| | 301,482 | | | Pool #TBA 5.000%, 10/15/2039 (i) | | | 304,562 | |
| | 36,205 | | | Series 2015-56, 1.500%, 04/16/2040 | | | 35,476 | |
| | 113,951 | | | Pool #TBA 3.500%, 09/15/2041 (i) | | | 106,158 | |
| | 39,148 | | | Series 2013-37, 2.000%, 01/20/2042 | | | 37,684 | |
| | 2,500,000 | | | Pool #TBA 3.000%, 10/15/2044 (i) | | | 2,210,742 | |
| | 13,675 | | | Series 2015-151, 1.700%, 10/20/2045 | | | 13,511 | |
| | 5,300,000 | | | Pool #TBA 2.500%, 10/15/2046 (i) | | | 4,560,795 | |
| | 24,452 | | | Pool #TBA 4.000%, 07/20/2047 (i) | | | 23,231 | |
| | 69,345 | | | Pool #TBA 3.500%, 08/20/2047 (i) | | | 64,043 | |
| | 108,010 | | | Pool #TBA 3.500%, 10/20/2047 (i) | | | 105,113 | |
| | 130,224 | | | Pool #TBA 4.000%, 10/20/2047 (i) | | | 120,190 | |
| | 91,624 | | | Pool #TBA 4.500%, 10/20/2047 (i) | | | 87,053 | |
| | 2,700,000 | | | Pool #TBA 2.000%, 10/15/2050 (i) | | | 2,251,652 | |
| | | | | | |
|
|
|
| | | | | Total Mortgage Backed Securities - U.S. Government Agency
(Cost $64,538,420) | | | 60,543,741 | |
| | | | | | |
|
|
|
| | | | | MUNICIPAL DEBT OBLIGATIONS - 1.61% | |
| | | | | California, GO, | | | | |
| | 30,000 | | | 7.550%, 04/01/2039 | | | 37,435 | |
| | 60,000 | | | 7.300%, 10/01/2039 | | | 71,948 | |
| | 105,000 | | | Chicago Transit Authority Sales & Transfer Tax Receipts, Series B, Revenue Bond,
Series B, 6.899%, 12/01/2040 | | | 119,023 | |
| | 20,000 | | | Chicago Transit Authority Sales Tax Receipts Fund, Revenue Bond,
3.912%, 12/01/2040 | | | 16,822 | |
| | 270,000 | | | Commonwealth of Massachusetts
4.110%, 07/15/2031 | | | 259,189 | |
| | | | | County of Riverside CA | | | | |
| | 345,000 | | | 2.963%, 02/15/2027 | | | 315,760 | |
| | 345,000 | | | 3.070%, 02/15/2028 | | | 310,416 | |
| | 155,000 | | | Dallas Fort Worth International Airport, Revenue Bond,
Series A, 4.507%, 11/01/2051 | | | 135,616 | |
| | 125,000 | | | District of Columbia, Revenue Bond,
3.432%, 04/01/2042 | | | 92,782 | |
| | | | | Metropolitan Transportation Authority | | | | |
| | 255,000 | | | 5.175%, 11/15/2049 | | | 227,696 | |
| | 100,000 | | | 5.000%, 11/15/2050 | | | 94,709 | |
| | 60,000 | | | New York State Thruway Authority - Class M, Revenue Bond,
2.900%, 01/01/2035 | | | 49,162 | |
| | 300,000 | | | New York Transportation Development Corp., Revenue Bond,
4.248%, 09/01/2035 | | | 286,051 | |
| | 355,000 | | | Philadelphia Authority for Industrial Development - Series C, Revenue Bond,
6.550%, 10/15/2028 | | | 376,176 | |
| | | | | | | | |
Principal
Amount
| | | | | Value
| |
| | | | | MUNICIPAL DEBT OBLIGATIONS (Continued) | |
| | 215,000 | | | Port Authority of New York & New Jersey, Series AAA, Revenue Bond,
1.086%, 07/01/2023 | | $ | 209,621 | |
| | 250,000 | | | State Board of Administration Finance Corp., Revenue Bond,
1.258%, 07/01/2025 | | | 226,456 | |
| | 35,000 | | | University of California Medical Center, Series H, Revenue Bond,
6.548%, 05/15/2048 (f) | | | 40,041 | |
| | | | | | |
|
|
|
| | | | | Total Municipal Debt Obligations
(Cost $3,174,821) | | | 2,868,903 | |
| | | | | | |
|
|
|
| | | | | U.S. TREASURY OBLIGATIONS - 26.17% | |
| | | | | U.S. Treasury Bonds - 11.05% | |
| | 960,000 | | | 6.875%, 08/15/2025 | | | 1,026,787 | |
| | 1,635,896 | | | 0.750%, 07/15/2028 (g) | | | 1,537,732 | |
| | 1,540,486 | | | 0.250%, 07/15/2029 (g) | | | 1,388,988 | |
| | 104,000 | | | 0.125%, 07/15/2030 (g) | | | 91,585 | |
| | 1,151,000 | | | 1.125%, 08/15/2040 | | | 713,575 | |
| | 1,090,000 | | | 3.375%, 08/15/2042 | | | 987,812 | |
| | 2,820,000 | | | 3.125%, 02/15/2043 | | | 2,427,293 | |
| | 795,000 | | | 3.750%, 11/15/2043 | | | 755,995 | |
| | 2,220,000 | | | 3.125%, 08/15/2044 | | | 1,899,921 | |
| | 920,000 | | | 2.500%, 02/15/2045 | | | 702,794 | |
| | 240,000 | | | 3.000%, 11/15/2045 | | | 200,662 | |
| | 950,000 | | | 2.500%, 02/15/2046 | | | 722,928 | |
| | 2,510,000 | | | 3.000%, 02/15/2047 | | | 2,102,762 | |
| | 1,050,000 | | | 2.750%, 11/15/2047 | | | 841,641 | |
| | 500,000 | | | 3.000%, 02/15/2048 | | | 421,602 | |
| | 940,000 | | | 3.125%, 05/15/2048 | | | 814,312 | |
| | 2,996,000 | | | 1.250%, 05/15/2050 | | | 1,678,579 | |
| | 390,000 | | | 1.375%, 08/15/2050 | | | 226,109 | |
| | 1,020,000 | | | 1.625%, 11/15/2050 | | | 633,755 | |
| | 782,268 | | | 0.125%, 02/15/2052 (g) | | | 493,038 | |
| | | | | | |
|
|
|
| | | | | | | | 19,667,870 | |
| | | | | | |
|
|
|
| | | | | U.S. Treasury Notes - 15.12% | | | | |
| | 1,485,000 | | | 2.750%, 05/15/2025 | | | 1,429,486 | |
| | 5,810,000 | | | 2.875%, 06/15/2025 | | | 5,605,742 | |
| | 390,000 | | | 2.875%, 07/31/2025 | | | 375,908 | |
| | 3,490,000 | | | 0.750%, 04/30/2026 (j) | | | 3,092,604 | |
| | 4,340,000 | | | 2.000%, 11/15/2026 | | | 3,988,392 | |
| | 340,000 | | | 1.125%, 08/31/2028 | | | 288,070 | |
| | 2,645,000 | | | 1.500%, 11/30/2028 | | | 2,281,416 | |
| | 5,260,000 | | | 1.875%, 02/28/2029 | | | 4,632,909 | |
| | 1,445,000 | | | 3.250%, 06/30/2029 | | | 1,381,922 | |
| | 708,000 | | | 1.625%, 08/15/2029 | | | 610,927 | |
| | 1,635,000 | | | 1.625%, 05/15/2031 | | | 1,372,825 | |
| | 1,030,000 | | | 1.375%, 11/15/2031 | | | 836,976 | |
| | 1,075,000 | | | 2.875%, 05/15/2032 | | | 993,787 | |
| | | | | | |
|
|
|
| | | | | | | | 26,890,964 | |
| | | | | | |
|
|
|
| | | | | Total U.S. Treasury Obligations
(Cost $54,556,021) | | | 46,558,834 | |
| | | | | | |
|
|
|
| | |
Number of
Shares
| | | | |
| |
| | | | | SHORT TERM INVESTMENTS - 2.61% | |
| | | | | Money Market Funds - 2.61% | | | | |
| | 4,647,462 | | | DWS Government Money Market Series - Institutional Shares
Effective Yield, 3.04% (d) | | | 4,647,462 | |
| | | | | | |
|
|
|
| | | | | Total Short Term Investments
(Cost $4,647,462) | | | 4,647,462 | |
| | | | | | |
|
|
|
See notes to financial statements.
85
GuideMark Core Fixed Income Fund
SCHEDULE OF INVESTMENTS (Continued) (Unaudited)
September 30, 2022
| | | | | | | | |
Number of
Units
| | | | | Value
| |
| | | | | INVESTMENTS PURCHASED WITH PROCEEDS FROM SECURITIES LENDING COLLATERAL - 1.72% | |
| | 3,061,000 | | | Mount Vernon Liquid Assets Portfolio, LLC
Effective Yield, 3.18% (d) | | $ | 3,061,000 | |
| | | | | | |
|
|
|
| | | | | Total Investments Purchased with Proceeds from Securities Lending Collateral
(Cost $3,061,000) | | | 3,061,000 | |
| | | | | | |
|
|
|
| | | | | Total Investments
(Cost $235,029,543) - 117.44% | | | 208,936,700 | |
| | | | | Liabilities in Excess of
Other Assets - (17.44)% | | | (31,032,537 | ) |
| | | | | | |
|
|
|
| | | | | TOTAL NET ASSETS - 100.00% | | $ | 177,904,163 | |
| | | | | | |
|
|
|
Percentages are stated as a percent of net assets.
Principal amounts are denominated in the currency in which the security was purchased.
| (a) | | Variable rate security based on a reference index and spread. Certain securities are fixed to variable and currently in the fixed phase. The rate reported is the rate in effect as of September 30, 2022. |
| (b) | | Variable rate security. The coupon is based on an underlying pool of assets. The rate reported is the rate in effect as of September 30, 2022. |
| (c) | | Securities were purchased exempt from registration in the U.S. pursuant to Rule 144A of the Securities Act of 1933 (the “Act”) or were acquired in a private placement, and, unless registered under the Act, may only be sold to “qualified institutional buyers” (as defined in the Act) or pursuant to another exemption from registration. The value of these securities total $42,274,911, which represents 23.76% of total net assets. |
| (d) | | Seven-Day yield as of September 30, 2022. |
| (e) | | As of September 30, 2022, the Valuation Committee has fair valued this security. The value of this security was $247,233, which represents 0.14% of total net assets. |
| (f) | | All or portion of this security is on loan. |
| (g) | | Represents a U.S. Treasury Inflation Protected Security. |
| (h) | | These securities have been deemed illiquid pursuant to the Fund’s liquidity guidelines. The value of these securities total $1,107,614, which represents 0.62% of total net assets. |
| (i) | | Security purchased on a when-issued basis. On September 30, 2022, the total value of investments purchased on a when-issued basis was $26,200,773 or 14.73% of total net assets. |
| (j) | | All or a portion of this security is held as collateral for certain swap, options written and futures contracts. The approximate value of the portion of this security held as collateral is $987,458. |
| (k) | | Represents an interest-only security that entitles holders to receive only interest payments on the underlying mortgages. The yield-to-maturity of an interest-only security is extremely sensitive to the rate of principal payments on the underlying mortgage assets. A rapid (slow) rate of principal repayments may have an adverse (positive) effect on yield to maturity. The principal amount shown is the underlying mortgages. Interest rate disclosed represents yield upon the estimated timing and amount of future cash flows at September 30, 2022. These securities are considered liquid pursuant to the Fund’s liquidity guidelines and the value of these securities total $1,286,651, which represents 0.72% of total net assets. |
| (l) | | Step-up bond; the interest rate shown is the rate in effect as of September 30, 2022. |
| (m) | | Value determined using significant unobservable inputs. Classified as Level 3 in the fair value hierarchy. |
Glossary of Terms
| | | | |
| LIBOR | | - | | London Interbank Offered Rate |
| CMT | | - | | Constant Maturing Treasury Rate |
| SOFR | | - | | Secured Overnight Financing Rate |
See notes to financial statements.
86
GuideMark Core Fixed Income Fund
SCHEDULE OF OPEN FUTURES CONTRACTS (Unaudited)
September 30, 2022
| | | | | | | | | | | | | | | | | | |
Description
| | Number of
Contracts
Purchased / (Sold)
| | | Long/Short
| | | Notional
Value
| | | Settlement
Month
| | Unrealized
Appreciation
(Depreciation)
| |
U.S. Treasury 2 Year Bond Future | | | 98 | | | | Long | | | $ | 20,128,281 | | | Dec-22 | | $ | (139,497 | ) |
U.S. Treasury 10 Year Note Future | | | (3 | ) | | | Short | | | | (336,187 | ) | | Dec-22 | | | 15,488 | |
U.S. Treasury Long Bond Future | | | (42 | ) | | | Short | | | | (5,309,063 | ) | | Dec-22 | | | 402,781 | |
U.S. Treasury Ultra 10 Year Note Future | | | (89 | ) | | | Short | | | | (10,545,109 | ) | | Dec-22 | | | 602,322 | |
U.S. Treasury Ultra Bond Future | | | (6 | ) | | | Short | | | | (822,000 | ) | | Dec-22 | | | 4,399 | |
| | | | | | | | | | | | | | | | |
|
|
|
| | | | | | | | | | | | | | | | | $ | 885,493 | |
| | | | | | | | | | | | | | | | |
|
|
|
GuideMark Core Fixed Income Fund
SCHEDULE OF OPTIONS WRITTEN (Unaudited)
September 30, 2022
| | | | | | | | |
Notional
Amount
| | | | | Value
| |
| | | | | Credit Default Swaptions | | | | |
| | | | | Call Options | | | | |
| $ | 9,295,000 | | | U.S. Dollar - Euro
Buy Protection CDX.NA.IG.39
Reference Rate: 1.000%
Frequency: Quarterly
Counterparty: Bank of America
Expiration: October, 2022
Exercise Price: $105.00 | | $ | (16,874 | ) |
| | 9,295,000 | | | U.S. Dollar - Euro
Buy Protection CDX.NA.IG.38
Reference Rate: 1.000%
Frequency: Quarterly
Counterparty: Citibank
Expiration: October, 2022
Exercise Price: $85.00 | | | (2,192 | ) |
| | |
| | | | | Put Options | | | | |
| | 9,295,000 | | | U.S. Dollar - Euro
Buy Protection CDX.NA.IG.39
Reference Rate: 1.000%
Frequency: Quarterly
Counterparty: Bank of America
Expiration: October, 2022
Exercise Price: $105.00 | | | (34,126 | ) |
| | 9,295,000 | | | U.S. Dollar - Euro
Buy Protection CDX.NA.IG.38
Reference Rate: 1.000%
Frequency: Quarterly
Counterparty: Citibank
Expiration: October, 2022
Exercise Price: $85.00 | | | (63,807 | ) |
| | | | | | |
|
|
|
| | | | | Total Options Written (Premiums Received $94,809) | | $ | (116,999 | ) |
| | | | | | |
|
|
|
See notes to financial statements.
87
GuideMark Core Fixed Income Fund
SCHEDULE OF OPEN SWAP CONTRACTS (Unaudited)
CREDIT DEFAULT SWAPS ON CREDIT INDICES — SELL PROTECTION(1)
September 30, 2022
| | | | | | | | | | | | | | | | | | | | | | | | | | | | | | | | |
Reference Obligation
| | Implied
Credit
Spread at
9/30/2022(2)
| | | Fixed
Pay
Rate
| | | Maturity
Date
| | Counterparty
| | Payment
Frequency
| | | Notional
Amount(3)
| | | Fair
Value
| | | Upfront
Premiums
Paid
(Received)
| | | Unrealized
Appreciation
(Depreciation)
| |
CDX-NAIGS39V-5Y* | | | 107.88% | | | | 1.000% | | | 12/20/2027 | | Morgan Stanley | | | Quarterly | | | $ | 4,085,000 | | | $ | (14,677 | ) | | $ | (3,043 | ) | | $ | (11,634 | ) |
| | | | | | | | | | | | | | | | | | | | | | |
|
|
| |
|
|
| |
|
|
|
| | | | | | | | | | | | | | | | | | | | | | | $ | (14,677 | ) | | $ | (3,043 | ) | | $ | (11,634 | ) |
| | | | | | | | | | | | | | | | | | | | | | |
|
|
| |
|
|
| |
|
|
|
INTEREST RATE SWAPS
September 30, 2022
| | | | | | | | | | | | | | | | | | | | | | | | | | | | | | | | | | | | |
Pay/Receive
Floating Rate
| | Floating Rate Index and Rate
at 9/30/2022
| | | Floating
Payment
Frequency
| | | Fixed
Pay
Rate
| | Fixed
Payment
Frequency
| | Maturity
Date
| | | Counterparty
| | | Notional
Amount
| | | Fair
Value
| | | Upfront
Premiums
Paid
(Received)
| | | Unrealized
Appreciation
(Depreciation)
| |
Receive | | | USD-SOFR-COMPOUND** 2.98% | | | | Annually | | | 1.5600% | | Annually | | | 12/15/2051 | | | | Morgan Stanley | | | $ | 565,000 | | | $ | 160,814 | | | $ | (3,424 | ) | | $ | 164,238 | |
| | | | | | | | | | | | | | | | | | | | | | | | | | |
|
|
| |
|
|
| |
|
|
|
| | | | | | | | | | | | | | | | | | | | | | | | | | | $ | 160,814 | | | $ | (3,424 | ) | | $ | 164,238 | |
| | | | | | | | | | | | | | | | | | | | | | | | | | |
|
|
| |
|
|
| |
|
|
|
| 1) | | If the Fund is a seller of protection and a credit event occurs, as defined under the terms of that particular swap agreement, the Fund will either (i) pay to the buyer of protection an amount equal to the notional amount of the swap and take delivery of the referenced obligation or underlying securities comprising the referenced index or (ii) pay a net settlement amount in the form of cash or securities equal to the notional amount of the swap less the recovery value of the referenced obligation or underlying securities comprising the referenced index. |
| 2) | | Implied credit spreads, represented in absolute terms, utilized in determining the fair value of credit default swap agreements on U.S. municipal issues, corporate issues or sovereign issues of an emerging country as of year end serve as an indicator of the current status of the payment/performance risk and represent the likelihood or risk of default for the credit derivative. The implied credit spread of a particular referenced entity reflects the cost of buying/selling protection and may include upfront payments required to be made to enter into the agreement. Wider credit spreads represent a deterioration of the referenced entity’s credit soundness and a greater likelihood or risk of default or other credit event occurring as defined under the terms of the agreement. A credit spread identified as “Defaulted” indicates a credit event has occurred for the referenced entity or obligation. |
| 3) | | The maximum potential amount the Fund could be required to pay as seller of credit protection or receive as a buyer of credit protection if a credit event occurs as defined under the terms of that particular swap agreement. |
| * | | Centrally cleared swap, clearing agent: ICE |
| ** | | Centrally cleared swap, clearing agent: LCH Group |
See notes to financial statements.
88
GuidePath Growth Allocation Fund
SCHEDULE OF INVESTMENTS (Unaudited)
September 30, 2022
| | | | | | | | |
Number of
Shares
| | | | | Value
| |
| | | | | INVESTMENT COMPANIES - 98.86% | |
| | | | | Domestic Equity Funds - 72.65% | |
| | 1,451,728 | | | AMCAP Fund - Class F3 | | $ | 41,780,746 | |
| | 749,404 | | | American Funds - Fundamental Investors - Class F3 | | | 41,584,428 | |
| | 507,705 | | | American Funds - New Economy Fund - Class F3 | | | 21,095,158 | |
| | 451,013 | | | American Funds - New Perspective Fund - Class F3 | | | 20,534,607 | |
| | 587,996 | | | American Funds - SMALLCAP World Fund, Inc. - Class F3 | | | 31,299,042 | |
| | 1,045,445 | | | American Funds - The Growth Fund of America - Class F3 | | | 52,784,502 | |
| | 23,099 | | | Invesco QQQ Trust Series 1 (a) | | | 6,173,439 | |
| | 623,002 | | | iShares Core S&P Small-Cap ETF | | | 54,319,544 | |
| | 1,352,888 | | | Schwab U.S. Large-Cap ETF (a) | | | 57,294,807 | |
| | 929,966 | | | Schwab U.S. Large-Cap Growth ETF (a) | | | 51,901,402 | |
| | 166,013 | | | SPDR S&P 600 Small Cap Growth ETF (a) | | | 11,308,806 | |
| | 769,680 | | | Vanguard Russell 1000 Growth ETF (a) | | | 41,724,353 | |
| | 108,022 | | | Vanguard Russell 2000 Growth ETF (a) | | | 16,247,589 | |
| | 453,786 | | | Vanguard S&P 500 ETF (a) | | | 148,977,944 | |
| | 48,913 | | | Vanguard Value ETF | | | 6,039,777 | |
| | | | | | |
|
|
|
| | | | | | | | 603,066,144 | |
| | | | | | |
|
|
|
| | | | | International Equity Funds - 23.33% | | | | |
| | 1,197,556 | | | iShares Core MSCI Emerging Markets ETF | | | 51,470,957 | |
| | 39,624 | | | iShares Core MSCI Europe ETF | | | 1,566,733 | |
| | 327,639 | | | iShares MSCI ACWI ETF (a) | | | 25,500,143 | |
| | 203,730 | | | iShares MSCI Switzerland ETF | | | 7,629,689 | |
| | 215,597 | | | JPMorgan Beta Builders Canada ETF | | | 11,523,660 | |
| | 160,105 | | | Vanguard FTSE All World ex-US Small-Cap ETF (a) | | | 14,859,345 | |
| | 2,231,453 | | | Vanguard FTSE Developed Markets ETF (a) | | | 81,135,631 | |
| | | | | | |
|
|
|
| | | | | | | | 193,686,158 | |
| | | | | | |
|
|
|
| | | | | Real Estate Funds - 2.88% | | | | |
| | 248,309 | | | Vanguard Global ex-U.S. Real Estate ETF | | | 9,475,471 | |
| | 179,791 | | | Vanguard Real Estate ETF (a) | | | 14,413,844 | |
| | | | | | |
|
|
|
| | | | | | | | 23,889,315 | |
| | | | | | |
|
|
|
| | | | | Total Investment Companies
(Cost $691,561,354) | | | 820,641,617 | |
| | | | | | |
|
|
|
| | | | | | | | |
Number of
Shares
| | | | | Value
| |
| | | | | SHORT TERM INVESTMENTS - 1.04% | | | | |
| | | | | Money Market Funds - 1.04% | | | | |
| | 8,598,917 | | | DWS Government Money Market Series - Institutional Shares
Effective Yield, 3.04% (b) | | $ | 8,598,917 | |
| | | | | | |
|
|
|
| | | | | Total Short Term Investments
(Cost $8,598,917) | | | 8,598,917 | |
| | | | | | |
|
|
|
| | |
Number of
Units
| | | | | | |
| | | | | INVESTMENTS PURCHASED WITH PROCEEDS FROM SECURITIES LENDING COLLATERAL - 18.92% | |
| | 157,022,731 | | | Mount Vernon Liquid Assets Portfolio, LLC
Effective Yield, 3.18% (b) | | | 157,022,731 | |
| | | | | | |
|
|
|
| | | | | Total Investments Purchased with Proceeds from Securities Lending Collateral
(Cost $157,022,731) | | | 157,022,731 | |
| | | | | | |
|
|
|
| | | | | Total Investments
(Cost $857,183,002) - 118.82% | | | 986,263,265 | |
| | | | | Liabilities in Excess of
Other Assets - (18.82)% | | | (156,181,967 | ) |
| | | | | | |
|
|
|
| | | | | TOTAL NET ASSETS - 100.00% | | $ | 830,081,298 | |
| | | | | | |
|
|
|
Percentages are stated as a percent of net assets.
| (a) | | All or portion of this security is on loan. |
| (b) | | Seven-day yield as of September 30, 2022. |
See notes to financial statements.
89
GuidePath Conservative Allocation Fund
SCHEDULE OF INVESTMENTS (Unaudited)
September 30, 2022
| | | | | | | | |
Number of
Shares
| | | | | Value
| |
| | | | | INVESTMENT COMPANIES - 98.94% | | | | |
| | | | | Alternative Funds - 1.54% | | | | |
| | 177,165 | | | SPDR Gold MiniShares Trust (a)(b) | | $ | 5,842,902 | |
| | | | | | |
|
|
|
| | | | | Domestic Equity Funds - 22.19% | | | | |
| | 210,027 | | | American Funds - Mutual Fund - Class F3 | | | 9,463,837 | |
| | 198,898 | | | American Funds - Washington Mutual Investors Fund - Class F3 | | | 9,427,755 | |
| | 163,884 | | | iShares Core S&P Small-Cap ETF | | | 14,289,046 | |
| | 100,853 | | | iShares Edge MSCI Min Vol USA ETF | | | 6,666,383 | |
| | 98,653 | | | Vanguard High Dividend Yield ETF | | | 9,360,197 | |
| | 69,018 | | | Vanguard S&P 500 ETF (a) | | | 22,658,609 | |
| | 99,801 | | | Vanguard Value ETF | | | 12,323,427 | |
| | | | | | |
|
|
|
| | | | | | | | 84,189,254 | |
| | | | | | |
|
|
|
| | | | | Domestic Fixed Income Funds - 46.45% | | | | |
| | 1,108,556 | | | American Funds - High-Income Trust - Class F3 | | | 9,821,807 | |
| | 1,757,352 | | | American Funds - Multi-Sector Income Fund - Class F3 | | | 15,324,113 | |
| | 1,355,231 | | | American Funds - The Bond Fund of America - Class F3 | | | 15,219,249 | |
| | 253,858 | | | iShares 1-3 Year Treasury Bond ETF (a) | | | 20,615,808 | |
| | 110,298 | | | iShares 7-10 Year Treasury Bond ETF (a) | | | 10,587,505 | |
| | 56,148 | | | iShares 10+ Year Investment Grade Corporate Bond ETF (a) | | | 2,708,018 | |
| | 246,440 | | | iShares Broad USD High Yield Corporate Bond ETF (a) | | | 8,285,313 | |
| | 258,326 | | | iShares Broad USD Investment Grade Corporate Bond ETF (a) | | | 12,412,564 | |
| | 157,358 | | | iShares Core U.S. Aggregate Bond ETF | | | 15,159,870 | |
| | 25,438 | | | iShares iBoxx High Yield Corporate Bond ETF (a) | | | 1,816,019 | |
| | 66,351 | | | iShares TIPS Bond ETF (a) | | | 6,960,220 | |
| | 150,332 | | | SPDR Bloomberg High Yield Bond ETF (a) | | | 13,206,666 | |
| | 2,590,117 | | | Vanguard High-Yield Corporate Fund - Admiral Shares | | | 12,898,783 | |
| | 60,061 | | | Vanguard Intermediate-Term Corporate Bond ETF | | | 4,545,416 | |
| | 118,086 | | | Vanguard Long-Term Treasury ETF | | | 7,432,333 | |
| | 367,491 | | | Vanguard Mortgage-Backed Securities ETF | | | 16,570,169 | |
| | 20,852 | | | Vanguard Short-Term Corporate Bond ETF (a) | | | 1,548,887 | |
| | 16,113 | | | Vanguard Total Bond Market ETF | | | 1,149,340 | |
| | | | | | |
|
|
|
| | | | | | | | 176,262,080 | |
| | | | | | |
|
|
|
| | | | | Hybrid Funds - 17.92% | | | | |
| | 306,360 | | | American Funds - Capital Income Builder - Class F3 | | | 17,575,858 | |
| | 828,409 | | | American Funds - The Income Fund of America - Class F3 | | | 17,785,951 | |
| | 316,918 | | | iShares Core Aggressive Allocation ETF | | | 17,573,103 | |
| | 336,422 | | | iShares Core Growth Allocation ETF (a) | | | 15,064,977 | |
| | | | | | |
|
|
|
| | | | | | | | 67,999,889 | |
| | | | | | |
|
|
|
| | | | | International Equity Funds - 7.88% | | | | |
| | 128,517 | | | iShares Core MSCI Emerging Markets ETF | | | 5,523,661 | |
| | 62,988 | | | iShares Core MSCI Europe ETF (a) | | | 2,490,546 | |
| | 41,766 | | | iShares MSCI EAFE Min Vol Factor ETF (a) | | | 2,381,080 | |
| | 116,651 | | | iShares MSCI Switzerland ETF (a) | | | 4,368,580 | |
| | 38,845 | | | JPMorgan Beta Builders Canada ETF | | | 2,076,265 | |
| | 359,199 | | | Vanguard FTSE Developed Markets ETF (a) | | | 13,060,476 | |
| | | | | | |
|
|
|
| | | | | | | | 29,900,608 | |
| | | | | | |
|
|
|
| | | | | | | | |
Number of
Shares
| | | | | Value
| |
| | | | | International Fixed Income Funds - 1.80% | | | | |
| | 42,473 | | | iShares J.P. Morgan USD Emerging Markets Bond ETF (a) | | $ | 3,372,356 | |
| | 91,380 | | | SPDR Bloomberg International Treasury Bond ETF (a) | | | 1,903,445 | |
| | 32,413 | | | Vanguard Total International Bond ETF (a) | | | 1,547,073 | |
| | | | | | |
|
|
|
| | | | | | | | 6,822,874 | |
| | | | | | |
|
|
|
| | | | | Real Estate Funds - 1.16% | | | | |
| | 32,781 | | | Vanguard Global ex-U.S. Real Estate ETF | | | 1,250,923 | |
| | 39,133 | | | Vanguard Real Estate ETF (a) | | | 3,137,293 | |
| | | | | | |
|
|
|
| | | | | | | | 4,388,216 | |
| | | | | | |
|
|
|
| | | | | Total Investment Companies
(Cost $384,941,360) | | | 375,405,823 | |
| | | | | | |
|
|
|
| | | | | SHORT TERM INVESTMENTS - 0.99% | | | | |
| | | | | Money Market Funds - 0.99% | | | | |
| | 3,741,259 | | | DWS Government Money Market Series - Institutional Shares
Effective Yield, 3.04% (c) | | | 3,741,259 | |
| | | | | | |
|
|
|
| | | | | Total Short Term Investments
(Cost $3,741,259) | | | 3,741,259 | |
| | | | | | |
|
|
|
| | |
Number of
Units
| | | | | | |
| | | | | INVESTMENTS PURCHASED WITH PROCEEDS FROM SECURITIES LENDING COLLATERAL - 27.50% | |
| | 104,331,390 | | | Mount Vernon Liquid Assets Portfolio, LLC
Effective Yield, 3.18% (c) | | | 104,331,390 | |
| | | | | | |
|
|
|
| | | | | Total Investments Purchased with Proceeds from Securities Lending Collateral
(Cost $104,331,390) | | | 104,331,390 | |
| | | | | | |
|
|
|
| | | | | Total Investments
(Cost $493,014,009) - 127.43% | | | 483,478,472 | |
| | | | | Liabilities in Excess of
Other Assets - (27.43)% | | | (104,067,776 | ) |
| | | | | | |
|
|
|
| | | | | TOTAL NET ASSETS - 100.00% | | $ | 379,410,696 | |
| | | | | | |
|
|
|
Percentages are stated as a percent of net assets.
| (a) | | All or portion of this security is on loan. |
| (b) | | Non-income producing security. |
| (c) | | Seven-day yield as of September 30, 2022 |
See notes to financial statements.
90
GuidePath Tactical Allocation Fund
SCHEDULE OF INVESTMENTS (Unaudited)
September 30, 2022
| | | | | | | | |
Number of
Shares
| | | | | Value
| |
| | | | | COMMON STOCKS - 54.65% | | | | |
| | | | | Air Freight & Logistics - 2.02% | | | | |
| | 107,240 | | | Expeditors International of Washington, Inc. | | $ | 9,470,364 | |
| | | | | | |
|
|
|
| | | | | Biotechnology - 6.30% | | | | |
| | 13,689 | | | Regeneron Pharmaceuticals, Inc. (a)(b) | | | 9,429,942 | |
| | 50,506 | | | United Therapeutics Corp. (b) | | | 10,574,946 | |
| | 32,789 | | | Vertex Pharmaceuticals, Inc. (b) | | | 9,493,727 | |
| | | | | | |
|
|
|
| | | | | | | | 29,498,615 | |
| | | | | | |
|
|
|
| | | | | Building Products - 1.71% | | | | |
| | 135,586 | | | Builders FirstSource, Inc. (a)(b) | | | 7,988,727 | |
| | | | | | |
|
|
|
| | | | | Chemicals - 1.17% | | | | |
| | 127,779 | | | Olin Corp. (a) | | | 5,479,164 | |
| | | | | | |
|
|
|
| | | | | Electric Utilities - 0.69% | | | | |
| | 88,248 | | | OGE Energy Corp. | | | 3,217,522 | |
| | | | | | |
|
|
|
| | | | | Food Products - 4.40% | | | | |
| | 130,669 | | | Archer-Daniels-Midland Co. | | | 10,512,321 | |
| | 153,408 | | | Tyson Foods, Inc. - Class A | | | 10,114,189 | |
| | | | | | |
|
|
|
| | | | | | | | 20,626,510 | |
| | | | | | |
|
|
|
| | | | | Health Care Equipment & Supplies - 2.16% | | | | |
| | 39,131 | | | Danaher Corp. | | | 10,107,146 | |
| | | | | | |
|
|
|
| | | | | Health Care Providers & Services - 4.54% | | | | |
| | 121,300 | | | CVS Health Corp. | | | 11,568,381 | |
| | 47,343 | | | Laboratory Corp. of America Holdings | | | 9,696,320 | |
| | | | | | |
|
|
|
| | | | | | | | 21,264,701 | |
| | | | | | |
|
|
|
| | | | | Household Products - 2.37% | | | | |
| | 88,118 | | | Procter & Gamble Co. | | | 11,124,897 | |
| | | | | | |
|
|
|
| | | | | Insurance - 6.35% | | | | |
| | 222,039 | | | Aflac, Inc. | | | 12,478,592 | |
| | 180,583 | | | Hartford Financial Services Group, Inc. | | | 11,185,311 | |
| | 289,812 | | | Old Republic International Corp. (a) | | | 6,065,765 | |
| | | | | | |
|
|
|
| | | | | | | | 29,729,668 | |
| | | | | | |
|
|
|
| | | | | Interactive Media & Services - 3.01% | | | | |
| | 90,986 | | | Alphabet, Inc. - Class A (b) | | | 8,702,811 | |
| | 39,841 | | | Meta Platforms, Inc. - Class A (b) | | | 5,405,627 | |
| | | | | | |
|
|
|
| | | | | | | | 14,108,438 | |
| | | | | | |
|
|
|
| | | | | Machinery - 1.70% | | | | |
| | 39,590 | | | Snap-on, Inc. (a) | | | 7,971,447 | |
| | | | | | |
|
|
|
| | | | | Media - 0.34% | | | | |
| | 75,877 | | | TEGNA, Inc. | | | 1,569,136 | |
| | | | | | |
|
|
|
| | | | | Multi-Utilities - 1.39% | | | | |
| | 75,842 | | | Consolidated Edison, Inc. | | | 6,504,210 | |
| | | | | | |
|
|
|
| | | | | Oil, Gas & Consumable Fuels - 4.48% | | | | |
| | 101,486 | | | ConocoPhillips | | | 10,386,077 | |
| | 112,398 | | | Devon Energy Corp. (a) | | | 6,758,492 | |
| | 66,527 | | | PDC Energy, Inc. | | | 3,844,595 | |
| | | | | | |
|
|
|
| | | | | | | | 20,989,164 | |
| | | | | | |
|
|
|
| | | | | Pharmaceuticals - 2.47% | | | | |
| | 264,095 | | | Pfizer, Inc. | | | 11,556,797 | |
| | | | | | |
|
|
|
| | | | | Professional Services - 1.65% | | | | |
| | 101,271 | | | Robert Half International, Inc. | | | 7,747,231 | |
| | | | | | |
|
|
|
| | | | | Road & Rail - 2.06% | | | | |
| | 197,688 | | | Knight-Swift Transportation Holdings, Inc. (a) | | | 9,672,874 | |
| | | | | | |
|
|
|
| | | | | Semiconductors & Semiconductor Equipment - 0.71% | |
| | 53,373 | | | ON Semiconductor Corp. (b) | | | 3,326,739 | |
| | | | | | |
|
|
|
| | | | | | | | |
Number of
Shares
| | | | | Value
| |
| | | | | Software - 2.54% | | | | |
| | 51,114 | | | Microsoft Corp. | | $ | 11,904,451 | |
| | | | | | |
|
|
|
| | | | | Technology Hardware, Storage & Peripherals - 2.59% | |
| | 87,779 | | | Apple, Inc. | | | 12,131,058 | |
| | | | | | |
|
|
|
| | | | | Total Common Stocks
(Cost $256,472,996) | | | 255,988,859 | |
| | | | | | |
|
|
|
| | | | | REAL ESTATE INVESTMENT TRUSTS - 0.00% (d) | |
| | | | | Real Estate Investment Trusts - 0.00% (d) | | | | |
| | 1 | | | SL Green Realty Corp. (a) | | | 40 | |
| | | | | | |
|
|
|
| | | | | Total Real Estate Investment Trusts
(Cost $39) | | | 40 | |
| | | | | | |
|
|
|
| | | | | SHORT TERM INVESTMENTS - 44.97% | | | | |
| | | | | Money Market Funds - 44.97% | | | | |
| | 210,645,791 | | | DWS Government Money Market Series - Institutional Shares
Effective Yield 3.04%, (c)(e) | | | 210,645,791 | |
| | | | | | |
|
|
|
| | | | | Total Short Term Investments
(Cost $210,645,791) | | | 210,645,791 | |
| | | | | | |
|
|
|
| | |
Number of
Units
| | | | | | |
| | | | | INVESTMENTS PURCHASED WITH PROCEEDS FROM SECURITIES LENDING COLLATERAL - 6.60% | |
| | 30,932,216 | | | Mount Vernon Liquid Assets Portfolio, LLC
Effective Yield, 3.18% (c) | | | 30,932,216 | |
| | | | | | |
|
|
|
| | | | | Total Investments Purchased with Proceeds from Securities Lending Collateral
(Cost $30,932,216) | | | 30,932,216 | |
| | | | | | |
|
|
|
| | | | | Total Investments
(Cost $498,051,042) - 106.22% | | | 497,566,906 | |
| | | | | Liabilities in Excess of
Other Assets - (6.22)% | | | (29,137,673 | ) |
| | | | | | |
|
|
|
| | | | | TOTAL NET ASSETS - 100.00% | | $ | 468,429,233 | |
| | | | | | |
|
|
|
Percentages are stated as a percent of net assets.
| (a) | | All or portion of this security is on loan. |
| (b) | | Non-income producing security. |
| (c) | | Seven-day yield as of September 30, 2022. |
| (e) | | Fair value of this security exceeds 25% of the Fund’s net assets. Additional information for this security, including financial statements, is available from the SEC’s EDGAR database at www.sec.gov. |
See notes to financial statements.
91
GuidePath Absolute Return Allocation Fund
SCHEDULE OF INVESTMENTS (Unaudited)
September 30, 2022
| | | | | | | | |
Number of
Shares
| | | | | Value
| |
| | | | | INVESTMENT COMPANIES - 99.03% | | | | |
| | | | | Alternative Funds - 1.10% | | | | |
| | 5,976 | | | Invesco DB Agriculture Fund (a) | | $ | 119,639 | |
| | 5,152 | | | Invesco DB Energy Fund (a) | | | 116,590 | |
| | 1,174 | | | Invesco DB Precious Metals Fund (a) | | | 50,391 | |
| | 49,862 | | | ProShares Investment Grade-Interest Rate Hedged ETF | | | 3,401,566 | |
| | | | | | |
|
|
|
| | | | | | | | 3,688,186 | |
| | | | | | |
|
|
|
| | | | | Domestic Equity Funds - 2.82% | | | | |
| | 647,291 | | | DoubleLine Shiller Enhanced CAPE - Institutional Shares | | | 8,272,382 | |
| | 3,485 | | | Vanguard S&P 500 ETF (b) | | | 1,144,125 | |
| | | | | | |
|
|
|
| | | | | | | | 9,416,507 | |
| | | | | | |
|
|
|
| | | | | Domestic Fixed Income Funds - 89.26% | | | | |
| | 2,766,811 | | | BlackRock Low Duration Bond Portfolio - Institutional Shares | | | 24,652,287 | |
| | 764,184 | | | DoubleLine Core Fixed Income Fund - Institutional Shares | | | 7,022,853 | |
| | 1,299,422 | | | DoubleLine Flexible Income Fund - Institutional Shares (d) | | | 10,928,138 | |
| | 2,649,583 | | | DoubleLine Low Duration Bond Fund - Institutional Shares | | | 24,826,591 | |
| | 3,886,584 | | | DoubleLine Total Return Bond Fund - Institutional Shares | | | 34,474,000 | |
| | 259,949 | | | iShares 7-10 Year Treasury Bond ETF (b) | | | 24,952,505 | |
| | 354,788 | | | Schwab Short-Term U.S. Treasury ETF (b) | | | 17,122,069 | |
| | 4,916 | | | SPDR Bloomberg 1-3 Month T-Bill ETF (b) | | | 450,307 | |
| | 1,864,409 | | | T. Rowe Price Institutional Floating Rate Fund - Investor Shares | | | 16,928,832 | |
| | 568,977 | | | Vanguard Intermediate-Term Corporate Bond ETF (b) | | | 43,060,179 | |
| | 25,883 | | | Vanguard Long-Term Treasury ETF | | | 1,629,076 | |
| | 919,327 | | | Vanguard Mortgage-Backed Securities ETF | | | 41,452,454 | |
| | 547,892 | | | Vanguard Short-Term Corporate Bond ETF (b) | | | 40,697,418 | |
| | 145,324 | | | Vanguard Total Bond Market ETF | | | 10,365,961 | |
| | | | | | |
|
|
|
| | | | | | | | 298,562,670 | |
| | | | | | |
|
|
|
| | | | | International Equity Funds - 0.15% | | | | |
| | 2,914 | | | iShares Core MSCI Emerging Markets ETF | | | 125,244 | |
| | 10,437 | | | Vanguard FTSE Developed Markets ETF (b) | | | 379,489 | |
| | | | | | |
|
|
|
| | | | | | | | 504,733 | |
| | | | | | |
|
|
|
| | | | | International Fixed Income Funds - 2.42% | | | | |
| | 140,507 | | | Vanguard Emerging Markets Government Bond ETF | | | 8,077,747 | |
| | | | | | |
|
|
|
| | | | | Opportunistic Fixed Income Funds - 3.28% | | | | |
| | 1,189,272 | | | BlackRock Strategic Income Opportunities Portfolio - Institutional Shares | | | 10,976,985 | |
| | | | | | |
|
|
|
| | | | | Total Investment Companies
(Cost $346,496,859) | | | 331,226,828 | |
| | | | | | |
|
|
|
| | | | | SHORT TERM INVESTMENTS - 0.85% | | | | |
| | | | | Money Market Funds - 0.85% | | | | |
| | 2,841,210 | | | DWS Government Money Market Series - Institutional Shares
Effective Yield, 3.04% (c) | | | 2,841,210 | |
| | | | | | |
|
|
|
| | | | | Total Short Term Investments
(Cost $2,841,210) | | | 2,841,210 | |
| | | | | | |
|
|
|
| | | | | | | | |
Number of
Units
| | | | | Value
| |
| | | | | INVESTMENTS PURCHASED WITH PROCEEDS FROM SECURITIES LENDING COLLATERAL - 18.03% | |
| | 60,309,447 | | | Mount Vernon Liquid Assets Portfolio, LLC
Effective Yield, 3.18% (c) | | $ | 60,309,447 | |
| | | | | | |
|
|
|
| | | | | Total Investments Purchased with Proceeds from Securities Lending Collateral
(Cost $60,309,447) | | | 60,309,447 | |
| | | | | | |
|
|
|
| | | | | Total Investments
(Cost $409,647,516) - 117.91% | | | 394,377,485 | |
| | | | | Liabilities in Excess of
Other Assets - (17.91)% | | | (59,903,522 | ) |
| | | | | | |
|
|
|
| | | | | TOTAL NET ASSETS - 100.00% | | $ | 334,473,963 | |
| | | | | | |
|
|
|
Percentages are stated as a percent of net assets.
| (a) | | Non-income producing security. |
| (b) | | All or portion of this security is on loan. |
| (c) | | Seven-day yield as of September 30, 2022. |
| (d) | | Certain GuidePath Funds invest in securities of unaffiliated underlying funds in accordance with Section 12(d)(1)(F) of the Investment Company Act of 1940. Such investments are potentially illiquid, because an unaffiliated underlying fund, under the terms of Section 12(d)(1)(F), is not obligated to redeem its shares in an amount exceeding 1% of its total outstanding shares during any period of less than thirty days. Investments made in accordance with Section 12(d)(1)(F) that exceed 1% of the outstanding shares of each underlying fund, and therefore are potentially illiquid, amount to $6,218,303 or 1.86% of total net assets as of September 30, 2022. |
See notes to financial statements.
92
GuidePath Multi-Asset Income Allocation Fund
SCHEDULE OF INVESTMENTS (Unaudited)
September 30, 2022
| | | | | | | | |
Number of
Shares
| | | | | Value
| |
| | | | | INVESTMENT COMPANIES - 98.22% | | | | |
| | | | | Domestic Equity Funds - 34.34% | | | | |
| | 32,117 | | | BlackRock High Equity Income Fund - Institutional Shares | | $ | 786,545 | |
| | 296,434 | | | Global X US Preferred ETF (a) | | | 6,079,861 | |
| | 31,641 | | | iShares Select Dividend ETF (a) | | | 3,392,548 | |
| | 63,363 | | | Schwab US Dividend Equity ETF (a) | | | 4,209,204 | |
| | 70,698 | | | SPDR Portfolio S&P 500 High Dividend ETF (a) | | | 2,507,658 | |
| | 47,536 | | | Vanguard High Dividend Yield ETF (a) | | | 4,510,216 | |
| | 1,400 | | | Vanguard S&P 500 ETF (a) | | | 459,620 | |
| | 62,809 | | | WisdomTree U.S. LargeCap Dividend Fund (a) | | | 3,470,825 | |
| | 106,018 | | | WisdomTree U.S. SmallCap Dividend Fund (a) | | | 2,728,903 | |
| | | | | | |
|
|
|
| | | | | | | | 28,145,380 | |
| | | | | | |
|
|
|
| | | | | Domestic Fixed Income Funds - 34.75% | | | | |
| | 93,247 | | | iShares 0-5 Year High Yield Corporate Bond ETF (a) | | | 3,724,285 | |
| | 10,034 | | | iShares 1-3 Year Treasury Bond ETF (a) | | | 814,861 | |
| | 2,510 | | | iShares 7-10 Year Treasury Bond ETF (a) | | | 240,935 | |
| | 54,196 | | | iShares Broad USD High Yield Corporate Bond ETF (a) | | | 1,822,070 | |
| | 35,243 | | | iShares Broad USD Investment Grade Corporate Bond ETF (a) | | | 1,693,426 | |
| | 16,867 | | | iShares iBoxx $Investment Grade Corporate Bond ETF (a) | | | 1,728,024 | |
| | 14,105 | | | Schwab U.S. TIPS ETF | | | 730,639 | |
| | 40,445 | | | SPDR Bloomberg Investment Grade Floating Rate ETF | | | 1,225,484 | |
| | 81,217 | | | SPDR Portfolio Aggregate Bond ETF (a) | | | 2,026,364 | |
| | 50,978 | | | SPDR Portfolio Long Term Corporate Bond ETF (a) | | | 1,108,772 | |
| | 392,703 | | | T. Rowe Price Institutional Floating Rate Fund - Investor Shares | | | 3,565,746 | |
| | 1,504,553 | | | Vanguard High-Yield Corporate Fund - Admiral Shares | | | 7,492,672 | |
| | 4,245 | | | Vanguard Intermediate-Term Treasury ETF | | | 247,526 | |
| | 32,788 | | | Vanguard Long-Term Treasury ETF | | | 2,063,677 | |
| | | | | | |
|
|
|
| | | | | | | | 28,484,481 | |
| | | | | | |
|
|
|
| | | | | International Equity Funds - 14.91% | | | | |
| | 185,980 | | | iShares Emerging Markets Dividend ETF (a) | | | 4,218,026 | |
| | 10,384 | | | iShares International Dividend Growth ETF (a) | | | 525,846 | |
| | 134,569 | | | iShares International Select Dividend ETF (a) | | | 3,031,840 | |
| | 29,177 | | | SPDR S&P Global Dividend ETF | | | 1,556,555 | |
| | 16,918 | | | SPDR S&P Global Infrastructure ETF | | | 808,342 | |
| | 72,033 | | | SPDR S&P International Dividend ETF | | | 2,074,550 | |
| | | | | | |
|
|
|
| | | | | | | | 12,215,159 | |
| | | | | | |
|
|
|
| | | | | International Fixed Income Funds - 2.76% | |
| | 39,309 | | | Vanguard Emerging Markets Government Bond ETF | | | 2,259,874 | |
| | | | | | |
|
|
|
| | | | | Multi-Asset Funds - 4.70% | | | | |
| | 191,138 | | | Loomis Sayles Global Allocation Fund - Class Y | | | 3,849,528 | |
| | | | | | |
|
|
|
| | | | | Opportunistic Fixed Income Funds - 0.72% | |
| | 63,906 | | | BlackRock Strategic Income Opportunities Portfolio - Institutional Shares | | | 589,848 | |
| | | | | | |
|
|
|
| | | | | Real Estate Funds - 6.04% | | | | |
| | 78,308 | | | Vanguard Global ex-U.S. Real Estate ETF | | | 2,988,233 | |
| | 24,442 | | | Vanguard Real Estate ETF (a) | | | 1,959,515 | |
| | | | | | |
|
|
|
| | | | | | | | 4,947,748 | |
| | | | | | |
|
|
|
| | | | | Total Investment Companies
(Cost $80,651,610) | | | 80,492,018 | |
| | | | | | |
|
|
|
| | | | | | | | |
Number of
Shares
| | | | | Value
| |
| | | | | SHORT TERM INVESTMENTS - 1.07% | |
| | | | | Money Market Funds - 1.07% | | | | |
| | 873,338 | | | DWS Government Money Market Series - Institutional Shares
Effective Yield 3.04% (b) | | $ | 873,338 | |
| | | | | | |
|
|
|
| | | | | Total Short Term Investments
(Cost $873,338) | | | 873,338 | |
| | | | | | |
|
|
|
| | |
Number of
Units
| | | | | | |
| | | | | INVESTMENTS PURCHASED WITH PROCEEDS FROM SECURITIES LENDING COLLATERAL - 29.06% | |
| | 23,811,535 | | | Mount Vernon Liquid Assets Portfolio, LLC
Effective Yield, 3.18% (b) | | | 23,811,535 | |
| | | | | | |
|
|
|
| | | | | Total Investments Purchased with Proceeds from Securities Lending Collateral
(Cost $23,811,535) | | | 23,811,535 | |
| | | | | | |
|
|
|
| | | | | Total Investments
(Cost $105,336,483) - 128.35% | | | 105,176,891 | |
| | | | | Liabilities in Excess of
Other Assets - (28.35)% | | | (23,231,750 | ) |
| | | | | | |
|
|
|
| | | | | TOTAL NET ASSETS - 100.00% | | $ | 81,945,141 | |
| | | | | | |
|
|
|
Percentages are stated as a percent of net assets.
| (a) | | All or portion of this security is on loan. |
| (b) | | Seven-day yield as of September 30, 2022. |
See notes to financial statements.
93
GuidePath Flexible Income Allocation Fund
SCHEDULE OF INVESTMENTS (Unaudited)
September 30, 2022
| | | | | | | | |
Number of
Shares
| | | | | Value
| |
| | | | | INVESTMENT COMPANIES - 86.96% | | | | |
| | | | | Alternative Funds - 3.29% | | | | |
| | 338,377 | | | WisdomTree Bloomberg U.S. Dollar Bullish Fund (a)(b) | | $ | 10,076,867 | |
| | | | | | |
|
|
|
| | | | | Domestic Equity Funds - 3.21% | | | | |
| | 82,942 | | | Technology Select Sector SPDR ETF (a) | | | 9,851,851 | |
| | | | | | |
|
|
|
| | | | | Domestic Fixed Income Funds - 80.46% | | | | |
| | 254,843 | | | BlackRock Short Maturity Bond ETF (a) | | | 12,553,566 | |
| | 255,694 | | | iShares 0-5 Year High Yield Corporate Bond ETF (a) | | | 10,212,418 | |
| | 95,897 | | | iShares Agency Bond ETF (a) | | | 10,213,031 | |
| | 219,726 | | | iShares Convertible Bond ETF | | | 15,139,121 | |
| | 250,396 | | | JPMorgan Ultra-Short Income ETF (a) | | | 12,559,863 | |
| | 177,447 | | | Schwab Intermediate-Term U.S. Treasury ETF | | | 8,719,746 | |
| | 345,300 | | | Schwab Short-Term U.S. Treasury ETF | | | 16,664,178 | |
| | 480,751 | | | SPDR Portfolio Mortgage Backed Bond ETF (a) | | | 10,312,109 | |
| | 2,406,606 | | | SPDR Portfolio Short Term Treasury ETF (a) | | | 69,574,979 | |
| | 351,315 | | | Vanguard Long-Term Treasury ETF (a) | | | 22,111,766 | |
| | 659,147 | | | Vanguard Short-Term Treasury ETF (a) | | | 38,092,105 | |
| | 286,629 | | | Vanguard Total Bond Market ETF | | | 20,445,247 | |
| | | | | | |
|
|
|
| | | | | | | | 246,598,129 | |
| | | | | | |
|
|
|
| | | | | Total Investment Companies
(Cost $280,866,343) | | | 266,526,847 | |
| | | | | | |
|
|
|
| | | | | SHORT TERM INVESTMENTS - 13.27% | | | | |
| | | | | Money Market Funds - 13.27% | | | | |
| | 40,677,529 | | | DWS Government Money Market Series - Institutional Shares
Effective Yield, 3.04% (c) | | | 40,677,529 | |
| | | | | | |
|
|
|
| | | | | Total Short Term Investments
(Cost $40,677,529) | | | 40,677,529 | |
| | | | | | |
|
|
|
| | | | | | | | |
Number of
Units
| | | | | Value
| |
| | | | | INVESTMENTS PURCHASED WITH PROCEEDS FROM SECURITIES LENDING COLLATERAL - 32.23% | |
| | 98,791,695 | | | Mount Vernon Liquid Assets Portfolio, LLC
Effective Yield, 3.18% (c) | | $ | 98,791,695 | |
| | | | | | |
|
|
|
| | | | | Total Investments Purchased with Proceeds from Securities Lending Collateral
(Cost $98,791,695) | | | 98,791,695 | |
| | | | | | |
|
|
|
| | | | | Total Investments
(Cost $420,335,567) - 132.46% | | | 405,996,071 | |
| | | | | Liabilities in Excess of
Other Assets - (32.46)% | | | (99,489,645 | ) |
| | | | | | |
|
|
|
| | | | | TOTAL NET ASSETS - 100.00% | | $ | 306,506,426 | |
| | | | | | |
|
|
|
Percentages are stated as a percent of net assets.
| (a) | | All or portion of this security is on loan. |
| (b) | | Non-income producing security. |
| (c) | | Seven-day yield as of September 30, 2022. |
See notes to financial statements.
94
GuidePath Managed Futures Strategy Fund
CONSOLIDATED SCHEDULE OF INVESTMENTS (Unaudited)
September 30, 2022
| | | | | | | | |
Principal
Amount
| | | | | Value
| |
| | | | | SHORT TERM INVESTMENTS - 97.50% | | | | |
| | | | | Certificate of Deposits - 58.62% | | | | |
| | | | | Bank of Nova Scotia | | | | |
| $ | 10,000,000 | | | 2.070%, 11/17/2022 | | $ | 10,000,065 | |
| | 4,000,000 | | | 2.970%, 08/16/2023 | | | 4,005,161 | |
| | | | | CIBC | | | | |
| | 2,000,000 | | | 2.910%, 12/21/2022 | | | 1,997,359 | |
| | 6,000,000 | | | 3.590%, 06/26/2023 | | | 5,954,231 | |
| | | | | Cooperatieve Centrale Raiffe | | | | |
| | 2,000,000 | | | 1.000%, 10/11/2022 | | | 2,000,000 | |
| | 5,000,000 | | | 3.350%, 02/13/2023 | | | 4,991,393 | |
| | | | | Mitsubishi Trust & Banking Corp. | | | | |
| | 10,000,000 | | | 4.520%, 04/21/2023 | | | 10,010,274 | |
| | 7,000,000 | | | 4.520%, 04/21/2023 | | | 7,007,213 | |
| | | | | Mizuho Bank, Ltd. | | | | |
| | 13,000,000 | | | 3.000%, 11/28/2022 | | | 13,000,000 | |
| | 7,000,000 | | | 2.587%, 01/20/2023 (c) | | | 7,000,188 | |
| | | | | Royal Bank of Canada | | | | |
| | 7,000,000 | | | 3.890%, 05/08/2023 | | | 6,973,740 | |
| | 3,000,000 | | | 3.000%, 06/05/2023 | | | 2,968,635 | |
| | | | | Sumitomo Mitsui Banking Corp. | | | | |
| | 7,000,000 | | | 2.500%, 10/17/2022 | | | 7,000,000 | |
| | 10,000,000 | | | 2.658%, 03/16/2023 (c) | | | 9,999,384 | |
| | | | | Sumitomo Mitsui Trust Bank, Ltd. | | | | |
| | 8,000,000 | | | 3.120%, 12/15/2022 | | | 7,993,227 | |
| | 5,000,000 | | | 3.200%, 12/28/2022 | | | 4,994,294 | |
| | | | | Svenska HandelBanken - A Shares | | | | |
| | 10,000,000 | | | 3.080%, 12/15/2022 | | | 9,993,706 | |
| | 3,000,000 | | | 3.220%, 12/22/2022 | | | 2,998,267 | |
| | 7,000,000 | | | 4.080%, 02/06/2023 (e)(f) | | | 7,001,225 | |
| | 2,000,000 | | | 3.460%, 06/13/2023 | | | 1,985,267 | |
| | | | | Toronto Dominion Bank | | | | |
| | 3,000,000 | | | 1.860%, 10/24/2022 | | | 3,000,019 | |
| | 3,000,000 | | | 4.020%, 08/22/2023 | | | 2,979,694 | |
| | 8,000,000 | | | Bank of America NA
3.250%, 01/13/2023 | | | 7,990,396 | |
| | 7,000,000 | | | Bank of Montreal
3.600%, 06/23/2023 | | | 6,949,154 | |
| | 14,000,000 | | | Commonwealth Bank of Australia
2.599%, 04/20/2023 (c) | | | 13,997,102 | |
| | 25,000,000 | | | DNB Bank ASA
3.000%, 10/04/2022 | | | 25,000,000 | |
| | 5,000,000 | | | Nordea Bank
2.970%, 12/07/2022 | | | 4,997,154 | |
| | 20,000,000 | | | Oversea-Chinese Banking Corp., Ltd.
2.592%, 02/23/2023 (c) | | | 20,001,938 | |
| | 3,000,000 | | | Westpac Banking Corp.
1.700%, 11/15/2022 | | | 3,000,000 | |
| | | | | | |
|
|
|
| | | | | | | | 215,789,086 | |
| | | | | | |
|
|
|
Number of
Shares
| | | | | | |
| | | | | Money Market Funds - 4.28% | |
| | 24,484,515 | | | DWS Government Money Market Series - Institutional Shares
Effective Yield, 3.040% (a)(b) | | | 24,484,515 | |
| | | | | | |
|
|
|
| | | | | | | | |
Principal
Amount
| | | | | Value
| |
| | | | | U.S. Treasury Bills - 34.60% | |
| $ | 7,000,000 | | | 2.149%, 10/04/2022 (c) | | $ | 6,998,769 | |
| | 10,000,000 | | | 2.238%, 10/06/2022 (b)(c)(d) | | | 9,996,946 | |
| | 25,000,000 | | | 2.347%, 10/11/2022 (c) | | | 24,983,958 | |
| | 3,000,000 | | | 2.260%, 10/13/2022 (c) | | | 2,997,780 | |
| | 15,000,000 | | | 2.476%, 10/18/2022 (c) | | | 14,982,740 | |
| | 12,000,000 | | | 2.623%, 10/25/2022 (c) | | | 11,979,380 | |
| | 35,000,000 | | | 2.428%, 10/27/2022 (c) | | | 34,939,694 | |
| | 30,000,000 | | | 2.441%, 11/01/2022 (c) | | | 29,938,108 | |
| | 15,000,000 | | | 2.520%, 11/03/2022 (b)(c)(d) | | | 14,965,993 | |
| | 5,000,000 | | | 2.461%, 11/08/2022 (c) | | | 4,987,254 | |
| | 10,000,000 | | | 2.520%, 11/10/2022 (c) | | | 9,972,556 | |
| | 24,000,000 | | | 2.684%, 11/15/2022 (c) | | | 23,920,987 | |
| | 5,000,000 | | | 2.602%, 11/17/2022 (c) | | | 4,983,354 | |
| | 20,000,000 | | | 2.984%, 11/22/2022 (c) | | | 19,915,356 | |
| | 7,000,000 | | | 2.832%, 11/25/2022 (c) | | | 6,970,323 | |
| | 9,000,000 | | | 2.853%, 11/29/2022 (c) | | | 8,958,700 | |
| | 19,000,000 | | | 2.893%, 12/01/2022 (c) | | | 18,910,086 | |
| | 15,000,000 | | | 3.020%, 12/08/2022 (c)(d) | | | 14,918,146 | |
| | 8,000,000 | | | 3.172%, 12/22/2022 (c) | | | 7,943,674 | |
| | 25,000,000 | | | 3.013%, 12/29/2022 (c) | | | 24,806,878 | |
| | 5,000,000 | | | 3.857%, 03/16/2023 (c) | | | 4,916,497 | |
| | 15,000,000 | | | 3.876%, 03/30/2023 (c) | | | 14,719,020 | |
| | | | | | |
|
|
|
| | | | | | | | 317,706,199 | |
| | | | | | |
|
|
|
| | | | | Total Short Term Investments
(Cost $558,199,381) | | | 557,979,800 | |
| | | | | | |
|
|
|
| | | | | Total Investments
(Cost $558,199,381) - 97.50% | | | 557,979,800 | |
| | | | | Other Assets in Excess of
Liabilities - 2.50% | | | 14,317,441 | |
| | | | | | |
|
|
|
| | | | | TOTAL NET ASSETS - 100.00% | | $ | 572,297,241 | |
| | | | | | |
|
|
|
Percentages are stated as a percent of net assets.
| (a) | | Seven-day yield as of September 30, 2022. |
| (b) | | All or a portion of this security is held by GuidePath Managed Futures Strategy Cayman Fund Ltd. |
| (c) | | Zero coupon bond. The effective yield is listed. |
| (d) | | All or a portion of this security is held as collateral for certain futures contracts. The approximate value of the portion of these securities held as collateral is $27,463,821. |
| (e) | | Value determined using significant unobservable inputs. Classified as Level 3 in the fair value hierarchy. |
| (f) | | As of September 30, 2022, the Valuation Committee has fair valued this security. The value of this security was $67,620, which represents 0.01% of total net assets. |
See notes to financial statements.
95
GuidePath Managed Futures Strategy Fund
CONSOLIDATED SCHEDULE OF OPEN FUTURES CONTRACTS (Unaudited)
September 30, 2022
| | | | | | | | | | | | | | | | | | | | |
Description
| | Number of
Contracts
Purchased / (Sold)
| | | Long/Short
| | | Notional
Value
| | | Settlement
Month
| | | Value / Unrealized
Appreciation
(Depreciation)
| |
Brazilian Real Futures | | | 31 | | | | Long | | | $ | 573,810 | | | | Oct-22 | | | $ | 874 | |
Brent Crude Futures (a) | | | 25 | | | | Long | | | | 2,088,000 | | | | Nov-22 | | | | (56,969 | ) |
Coffee ‘C’ Futures (a) | | | 27 | | | | Long | | | | 2,243,194 | | | | Dec-22 | | | | (22,503 | ) |
Corn Futures (a) | | | 131 | | | | Long | | | | 4,437,625 | | | | Dec-22 | | | | (43,772 | ) |
KC HRW Wheat Future (a) | | | 6 | | | | Long | | | | 297,450 | | | | Dec-22 | | | | 13,783 | |
Lean Hogs Futures (a) | | | 13 | | | | Long | | | | 396,370 | | | | Dec-22 | | | | (34,506 | ) |
Live Cattle Futures (a) | | | 32 | | | | Long | | | | 1,882,240 | | | | Dec-22 | | | | (46,839 | ) |
LME Aluminium Futures (a)(b) | | | 37 | | | | Long | | | | 1,998,925 | | | | Dec-22 | | | | (239,902 | ) |
LME Copper Futures (a)(b) | | | 7 | | | | Long | | | | 1,326,325 | | | | Dec-22 | | | | (41,381 | ) |
LME Nickel Futures (a)(b) | | | 2 | | | | Long | | | | 253,104 | | | | Dec-22 | | | | 16,325 | |
LME Zinc Futures (a)(b) | | | 16 | | | | Long | | | | 1,193,200 | | | | Dec-22 | | | | (199,495 | ) |
Low Sulphur Gas Oil Futures (a) | | | 27 | | | | Long | | | | 2,542,725 | | | | Nov-22 | | | | (227,509 | ) |
Mexican Peso Futures | | | 522 | | | | Long | | | | 12,791,610 | | | | Dec-22 | | | | (3,037 | ) |
Natural Gas Futures (a) | | | 27 | | | | Long | | | | 1,826,820 | | | | Oct-22 | | | | (485,942 | ) |
NY Harbor ULSD Futures (a) | | | 20 | | | | Long | | | | 2,626,680 | | | | Nov-22 | | | | (77,452 | ) |
RBOB Gasoline Futures (a) | | | 12 | | | | Long | | | | 1,148,566 | | | | Nov-22 | | | | (35,808 | ) |
Soybean Futures (a) | | | 37 | | | | Long | | | | 2,524,788 | | | | Nov-22 | | | | (225,033 | ) |
Soybean Meal Futures (a) | | | 68 | | | | Long | | | | 2,740,400 | | | | Dec-22 | | | | (63,409 | ) |
Soybean Oil Futures (a) | | | 9 | | | | Long | | | | 332,424 | | | | Dec-22 | | | | (24,758 | ) |
WTI Crude Futures (a) | | | 7 | | | | Long | | | | 551,040 | | | | Nov-22 | | | | (11,919 | ) |
3 Month SOFR Futures | | | (654 | ) | | | Short | | | | (156,273,300 | ) | | | Jun-23 | | | | 558,238 | |
90-Day Bank Bill Futures | | | (198 | ) | | | Short | | | | (125,353,268 | ) | | | Mar-23 | | | | (28,486 | ) |
Amsterdam IDX Futures | | | (8 | ) | | | Short | | | | (1,004,587 | ) | | | Oct-22 | | | | 65,552 | |
Australian 10-Year Treasury Bond Futures | | | (305 | ) | | | Short | | | | (22,848,709 | ) | | | Dec-22 | | | | 488,264 | |
Australian 3-Year Treasury Bond Futures | | | (477 | ) | | | Short | | | | (32,513,609 | ) | | | Dec-22 | | | | 367,614 | |
Australian Dollar Futures | | | (355 | ) | | | Short | | | | (22,775,025 | ) | | | Dec-22 | | | | 1,580,373 | |
Bank Accept Futures | | | (132 | ) | | | Short | | | | (22,821,805 | ) | | | Mar-23 | | | | 12 | |
British Pound Futures | | | (473 | ) | | | Short | | | | (33,053,831 | ) | | | Dec-22 | | | | 1,414,457 | |
CAC40 Index Futures | | | (32 | ) | | | Short | | | | (1,807,519 | ) | | | Oct-22 | | | | 25,430 | |
Canadian 10-Year Bond Futures | | | (142 | ) | | | Short | | | | (12,704,803 | ) | | | Dec-22 | | | | 80,740 | |
Canadian Dollar Futures | | | (551 | ) | | | Short | | | | (39,889,645 | ) | | | Dec-22 | | | | 2,052,041 | |
Cocoa Futures (a) | | | (71 | ) | | | Short | | | | (1,671,340 | ) | | | Dec-22 | | | | 38,934 | |
Copper Futures (a) | | | (111 | ) | | | Short | | | | (9,469,688 | ) | | | Dec-22 | | | | 539,634 | |
DAX® Index Futures | | | (9 | ) | | | Short | | | | (2,675,673 | ) | | | Dec-22 | | | | 219,951 | |
DJIA E-Mini CBOT Futures | | | (40 | ) | | | Short | | | | (5,760,200 | ) | | | Dec-22 | | | | 487,647 | |
E-mini NASDAQ 100 Futures | | | (25 | ) | | | Short | | | | (5,517,750 | ) | | | Dec-22 | | | | 622,656 | |
E-mini Russell 2000 Futures | | | (51 | ) | | | Short | | | | (4,257,990 | ) | | | Dec-22 | | | | 328,235 | |
E-mini S&P 500 Futures | | | (39 | ) | | | Short | | | | (7,022,925 | ) | | | Dec-22 | | | | 633,594 | |
E-mini S&P Mid Cap 400 Futures | | | (18 | ) | | | Short | | | | (3,974,760 | ) | | | Dec-22 | | | | 244,223 | |
Euribor 3 Month Futures | | | (901 | ) | | | Short | | | | (214,574,268 | ) | | | Mar-23 | | | | (378,095 | ) |
Euro Fx Futures | | | (272 | ) | | | Short | | | | (33,529,100 | ) | | | Dec-22 | | | | 1,006,351 | |
Euro Stoxx 50® Index Futures | | | (60 | ) | | | Short | | | | (1,949,312 | ) | | | Dec-22 | | | | 142,413 | |
Euro Stoxx 600 Futures | | | (55 | ) | | | Short | | | | (1,044,362 | ) | | | Dec-22 | | | | 82,135 | |
Euro-Bobl Futures | | | (294 | ) | | | Short | | | | (34,503,999 | ) | | | Dec-22 | | | | 587,111 | |
Euro-BTP Futures | | | (86 | ) | | | Short | | | | (9,438,120 | ) | | | Dec-22 | | | | 450,973 | |
Euro-BTP Futures - Short | | | (208 | ) | | | Short | | | | (21,469,442 | ) | | | Dec-22 | | | | 170,242 | |
Euro-Bund Futures | | | (133 | ) | | | Short | | | | (18,051,639 | ) | | | Dec-22 | | | | 771,939 | |
Euro-Buxl® 30 Year Futures | | | (51 | ) | | | Short | | | | (7,329,413 | ) | | | Dec-22 | | | | 653,608 | |
Euro-OAT Futures | | | (198 | ) | | | Short | | | | (25,637,775 | ) | | | Dec-22 | | | | 1,049,533 | |
Euro-Schatz Futures | | | (1,263 | ) | | | Short | | | | (132,648,668 | ) | | | Dec-22 | | | | 738,479 | |
FTSE China A50 Index Futures | | | (388 | ) | | | Short | | | | (5,011,408 | ) | | | Oct-22 | | | | (1,431 | ) |
FTSE JSE Top 40 Futures | | | (6 | ) | | | Short | | | | (191,639 | ) | | | Dec-22 | | | | (2,066 | ) |
FTSE MIB Index Futures | | | (23 | ) | | | Short | | | | (2,313,728 | ) | | | Dec-22 | | | | 155,578 | |
FTSE Taiwan Index Futures | | | (23 | ) | | | Short | | | | (1,074,100 | ) | | | Oct-22 | | | | 39,340 | |
Gold 100 Oz. Futures (a) | | | (122 | ) | | | Short | | | | (20,398,400 | ) | | | Dec-22 | | | | 459,151 | |
Hang Seng Index Futures | | | (44 | ) | | | Short | | | | (4,823,400 | ) | | | Oct-22 | | | | 150,751 | |
HSCEI Index Futures | | | (98 | ) | | | Short | | | | (3,691,706 | ) | | | Oct-22 | | | | 139,063 | |
IBEX 35® Index Futures | | | (31 | ) | | | Short | | | | (2,237,107 | ) | | | Oct-22 | | | | 112,177 | |
ICE 3 Month Sonia Futures | | | (388 | ) | | | Short | | | | (102,889,618 | ) | | | Mar-23 | | | | 1,683,996 | |
See notes to financial statements.
96
GuidePath Managed Futures Strategy Fund
CONSOLIDATED SCHEDULE OF OPEN FUTURES CONTRACTS (Continued) (Unaudited)
September 30, 2022
| | | | | | | | | | | | | | | | | | | | |
Description
| | Number of
Contracts
Purchased / (Sold)
| | | Long/Short
| | | Notional
Value
| | | Settlement
Month
| | | Value / Unrealized
Appreciation
(Depreciation)
| |
Indian Rupee Futures | | | (247 | ) | | | Short | | | $ | (6,044,090 | ) | | | Oct-22 | | | $ | 150,440 | |
Japanese Yen Futures | | | (475 | ) | | | Short | | | | (41,345,781 | ) | | | Dec-22 | | | | 644,847 | |
LME Aluminium Futures (a)(b) | | | (107 | ) | | | Short | | | | (5,780,675 | ) | | | Dec-22 | | | | 611,104 | |
LME Copper Futures (a)(b) | | | (14 | ) | | | Short | | | | (2,652,650 | ) | | | Dec-22 | | | | 40,420 | |
LME Nickel Futures (a)(b) | | | (2 | ) | | | Short | | | | (253,104 | ) | | | Dec-22 | | | | (26,605 | ) |
LME Zinc Futures (a)(b) | | | (19 | ) | | | Short | | | | (1,416,925 | ) | | | Dec-22 | | | | (7,939 | ) |
Long Gilt Futures | | | (203 | ) | | | Short | | | | (21,849,892 | ) | | | Dec-22 | | | | 2,673,940 | |
MSCI EAFE Index Futures | | | (104 | ) | | | Short | | | | (8,635,120 | ) | | | Dec-22 | | | | 1,165,134 | |
MSCI Emerging Markets Index Futures | | | (196 | ) | | | Short | | | | (8,540,700 | ) | | | Dec-22 | | | | 750,525 | |
MSCI Singapore Index Futures | | | (93 | ) | | | Short | | | | (1,817,264 | ) | | | Oct-22 | | | | 6,673 | |
New Zealand Dollar Futures | | | (529 | ) | | | Short | | | | (29,695,415 | ) | | | Dec-22 | | | | 2,006,077 | |
Nikkei 225 Futures | | | (4 | ) | | | Short | | | | (718,856 | ) | | | Dec-22 | | | | 6,063 | |
OMXS30 Futures | | | (155 | ) | | | Short | | | | (2,555,947 | ) | | | Oct-22 | | | | 129,965 | |
Platinum Futures (a) | | | (33 | ) | | | Short | | | | (1,417,515 | ) | | | Jan-23 | | | | 68,806 | |
S&P/TSX 60 Index Futures | | | (23 | ) | | | Short | | | | (3,716,364 | ) | | | Dec-22 | | | | 103,998 | |
SGX Iron Ore 62% Futures (a) | | | (67 | ) | | | Short | | | | (631,408 | ) | | | Nov-22 | | | | 49,435 | |
Silver Futures (a) | | | (68 | ) | | | Short | | | | (6,473,260 | ) | | | Dec-22 | | | | (191,069 | ) |
South African Rand Futures | | | (361 | ) | | | Short | | | | (9,904,938 | ) | | | Dec-22 | | | | 522,128 | |
SPI 200 Index Futures | | | (14 | ) | | | Short | | | | (1,447,597 | ) | | | Dec-22 | | | | 1,310 | |
Sugar No. 11 Futures (a) | | | (133 | ) | | | Short | | | | (2,633,613 | ) | | | Feb-23 | | | | 40,695 | |
Swiss Franc Futures | | | (105 | ) | | | Short | | | | (13,405,875 | ) | | | Dec-22 | | | | 447,351 | |
Topix Index Futures | | | (5 | ) | | | Short | | | | (636,530 | ) | | | Dec-22 | | | | 5,577 | |
U.S. Treasury 10-Year Note Futures | | | (291 | ) | | | Short | | | | (32,610,188 | ) | | | Dec-22 | | | | 1,159,956 | |
U.S. Treasury 2-Year Note Futures | | | (729 | ) | | | Short | | | | (149,729,766 | ) | | | Dec-22 | | | | 1,683,749 | |
U.S. Treasury 5-Year Note Futures | | | (489 | ) | | | Short | | | | (52,571,321 | ) | | | Dec-22 | | | | 1,384,424 | |
U.S. Treasury Long Bond Futures | | | (122 | ) | | | Short | | | | (15,421,563 | ) | | | Dec-22 | | | | 1,043,540 | |
U.S. Treasury Ultra Bond Futures | | | (74 | ) | | | Short | | | | (10,138,000 | ) | | | Dec-22 | | | | 833,047 | |
U.S. Ultra 10 Year Future | | | (170 | ) | | | Short | | | | (20,142,344 | ) | | | Dec-22 | | | | 971,961 | |
| | | | | | | | | | | | | | | | | | |
|
|
|
| | | | | | | | | | | | | | | | | | | $ | 32,196,657 | |
| | | | | | | | | | | | | | | | | | |
|
|
|
| (a) | | All or a portion of this security is held by GuidePath Managed Futures Strategy Cayman Fund Ltd. |
| (b) | | London Metal Exchange (“LME”) futures contracts settle on their respective maturity date, and do not have daily cash movements like other futures contracts. The unrealized appreciation on these contracts is a receivable for unsettled open futures contracts and the unrealized depreciation is a payable for unsettled open futures contracts on the Fund’s consolidated statement of assets and liabilities. |
GuidePath Managed Futures Strategy Fund
CONSOLIDATED SCHEDULE OF OPEN FORWARD CURRENCY CONTRACTS (Unaudited)
September 30, 2022
| | | | | | | | | | | | | | | | | | |
Forward
Expiration Date
| | Counterparty
| | Currency to be received
| | Amount of
Currency to
be received
| | | Currency to be delivered
| | Amount of
Currency to
be delivered
| | | Unrealized
Appreciation
(Depreciation)
| |
| 12/21/2022 | | NatWest | | Chinese Yuan Renminbi | | | 18,000,000 | | | U.S. Dollar | | | 2,585,907 | | | $ | (60,187 | ) |
| 12/21/2022 | | NatWest | | Chinese Yuan Renminbi | | | 11,000,000 | | | U.S. Dollar | | | 1,550,476 | | | | (6,980 | ) |
| 12/21/2022 | | NatWest | | Swedish Krona | | | 32,000,000 | | | U.S. Dollar | | | 2,931,051 | | | | (31,398 | ) |
| 12/21/2022 | | NatWest | | U.S. Dollar | | | 29,195,152 | | | Chinese Yuan Renminbi | | | 203,000,000 | | | | 710,646 | |
| 12/21/2022 | | NatWest | | U.S. Dollar | | | 1,216,650 | | | New Turkish Lira | | | 24,000,000 | | | | 49,846 | |
| 12/21/2022 | | NatWest | | U.S. Dollar | | | 10,045,723 | | | Norwegian Krone | | | 100,000,000 | | | | 842,230 | |
| 12/21/2022 | | NatWest | | U.S. Dollar | | | 10,153,673 | | | Polish Zloty | | | 47,500,000 | | | | 709,118 | |
| 12/21/2022 | | NatWest | | U.S. Dollar | | | 35,726,055 | | | Singapore Dollar | | | 49,875,000 | | | | 959,129 | |
| 12/21/2022 | | NatWest | | U.S. Dollar | | | 3,839,842 | | | Singapore Dollar | | | 5,500,000 | | | | 5,895 | |
| 12/21/2022 | | NatWest | | U.S. Dollar | | | 21,116,849 | | | Swedish Krona | | | 218,000,000 | | | | 1,363,579 | |
| | | | | | | | | | | | | | | | |
|
|
|
| | | | | | | | | | | | | | | | | $ | 4,541,878 | |
| | | | | | | | | | | | | | | | |
|
|
|
See notes to financial statements.
97
GuidePath Conservative Income Fund
SCHEDULE OF INVESTMENTS (Unaudited)
September 30, 2022
| | | | | | | | |
Number of
Shares
| | | | | Value
| |
| | | | | INVESTMENT COMPANIES - 49.89% | | | | |
| | | | | Domestic Fixed Income Funds - 49.89% | | | | |
| | 133,509 | | | Schwab Short-Term U.S. Treasury ETF (a)(c) | | $ | 6,443,144 | |
| | 63,544 | | | SPDR Bloomberg Investment Grade Floating Rate ETF (a) | | | 1,925,383 | |
| | | | | | |
|
|
|
| | | | | Total Investment Companies
(Cost $8,416,893) | | | 8,368,527 | |
| | | | | | |
|
|
|
| | | | | SHORT TERM INVESTMENTS - 50.25% | | | | |
| | | | | Money Market Funds - 38.48% | | | | |
| | 6,454,749 | | | DWS Government Money Market Series - Institutional Shares
Effective Yield, 3.04% (b)(c) | | | 6,454,749 | |
| | | | | | |
|
|
|
Principal
Amount
| | | | | | |
| | | | | U.S. Treasury Bills - 4.36% | |
| | 750,000 | | | 0.000%, 06/15/2023 | | | 730,834 | |
| | | | | | |
|
|
|
| | | | | U.S. Treasury Notes - 7.41% | | | | |
| | 750,000 | | | 0.125%, 11/30/2022 | | | 746,378 | |
| | 500,000 | | | 2.500%, 03/31/2023 | | | 496,770 | |
| | | | | | |
|
|
|
| | | | | | | | 1,243,148 | |
| | | | | | |
|
|
|
| | | | | Total Short Term Investments
(Cost $8,442,554) | | | 8,428,731 | |
| | | | | | |
|
|
|
| | |
Number of
Units
| | | | | | |
| | | | | INVESTMENTS PURCHASED WITH PROCEEDS FROM SECURITIES LENDING COLLATERAL - 12.98% | |
| | 2,178,040 | | | Mount Vernon Liquid Assets Portfolio, LLC
Effective Yield, 3.18% (b) | | | 2,178,040 | |
| | | | | | |
|
|
|
| | | | | Total Investments Purchased with Proceeds from Securities Lending Collateral
(Cost $2,178,040) | | | 2,178,040 | |
| | | | | | |
|
|
|
| | | | | Total Investments
(Cost $19,037,487) - 113.12% | | | 18,975,298 | |
| | | | | Liabilities in Excess of
Other Assets - (13.12)% | | | (2,201,431 | ) |
| | | | | | |
|
|
|
| | | | | TOTAL NET ASSETS - 100.00% | | $ | 16,773,867 | |
| | | | | | |
|
|
|
Percentages are stated as a percent of net assets.
| (a) | | All or portion of this security is on loan. |
| (b) | | Seven-day yield as of September 30, 2022. |
| (c) | | Fair value of this security exceeds 25% of the Fund’s net assets. Additional information for this security, including financial statements, is available from the SEC’s EDGAR database at www.sec.gov. |
See notes to financial statements.
98
GuidePath Income Fund
SCHEDULE OF INVESTMENTS (Unaudited)
September 30, 2022
| | | | | | | | |
Number of
Shares
| | | | | Value
| |
| | | | | INVESTMENT COMPANIES - 97.69% | | | | |
| | | | | Domestic Fixed Income Funds - 97.69% | | | | |
| | 270,415 | | | iShares Core U.S. Aggregate Bond ETF (a) | | $ | 26,051,781 | |
| | 368,545 | | | Vanguard Total Bond Market ETF (a) | | | 26,288,315 | |
| | | | | | |
|
|
|
| | | | | Total Investment Companies
(Cost $56,778,708) | | | 52,340,096 | |
| | | | | | |
|
|
|
| | | | | SHORT TERM INVESTMENTS - 2.39% | | | | |
| | | | | Money Market Funds - 2.39% | | | | |
| | 1,281,423 | | | DWS Government Money Market Series - Institutional Shares
Effective Yield 3.04% (b) | | | 1,281,423 | |
| | | | | | |
|
|
|
| | | | | Total Short Term Investments
(Cost $1,281,423) | | | 1,281,423 | |
| | | | | | |
|
|
|
| | | | | Total Investments
(Cost $58,060,131) - 100.08% | | | 53,621,519 | |
| | | | | Liabilities in Excess of
Other Assets - (0.08)% | | | (40,741 | ) |
| | | | | | |
|
|
|
| | | | | TOTAL NET ASSETS - 100.00% | | $ | 53,580,778 | |
| | | | | | |
|
|
|
Percentages are stated as a percent of net assets.
| (a) | | Fair value of this security exceeds 25% of the Fund’s net assets. Additional information for this security, including the financial statements, is available from the SEC’s EDGAR database at www.sec.gov. |
| (b) | | Seven-day yield as of September 30, 2022. |
See notes to financial statements.
99
GuidePath Growth and Income Fund
SCHEDULE OF INVESTMENTS (Unaudited)
September 30, 2022
| | | | | | | | |
Number of
Shares
| | | | | Value
| |
| | | | | COMMON STOCKS - 33.57% | | | | |
| | | | | Aerospace & Defense - 0.47% | | | | |
| | 645 | | | General Dynamics Corp. | | $ | 136,850 | |
| | 784 | | | Lockheed Martin Corp. | | | 302,851 | |
| | | | | | |
|
|
|
| | | | | | | | 439,701 | |
| | | | | | |
|
|
|
| | | | | Air Freight & Logistics - 0.50% | | | | |
| | 2,894 | | | United Parcel Service, Inc. - Class B (a) | | | 467,497 | |
| | | | | | |
|
|
|
| | | | | Banks - 1.30% | | | | |
| | 4,220 | | | Citizens Financial Group, Inc. | | | 144,999 | |
| | 13,225 | | | Huntington Bancshares, Inc. | | | 174,306 | |
| | 730 | | | M&T Bank Corp. | | | 128,714 | |
| | 1,002 | | | PNC Financial Services Group, Inc. | | | 149,719 | |
| | 8,856 | | | Regions Financial Corp. | | | 177,740 | |
| | 6,242 | | | Truist Financial Corp. (a) | | | 271,776 | |
| | 4,187 | | | U.S. Bancorp (a) | | | 168,820 | |
| | | | | | |
|
|
|
| | | | | | | | 1,216,074 | |
| | | | | | |
|
|
|
| | | | | Beverages - 2.29% | | | | |
| | 19,104 | | | Coca-Cola Co. | | | 1,070,206 | |
| | 6,543 | | | PepsiCo, Inc. | | | 1,068,210 | |
| | | | | | |
|
|
|
| | | | | | | | 2,138,416 | |
| | | | | | |
|
|
|
| | | | | Biotechnology - 1.52% | | | | |
| | 5,684 | | | AbbVie, Inc. | | | 762,849 | |
| | 2,929 | | | Amgen, Inc. (a) | | | 660,197 | |
| | | | | | |
|
|
|
| | | | | | | | 1,423,046 | |
| | | | | | |
|
|
|
| | | | | Building Products - 0.23% | | | | |
| | 4,279 | | | Johnson Controls International PLC - ADR | | | 210,612 | |
| | | | | | |
|
|
|
| | | | | Capital Markets - 1.24% | | | | |
| | 472 | | | BlackRock, Inc. | | | 259,732 | |
| | 3,205 | | | Blackstone, Inc. (a) | | | 268,258 | |
| | 1,272 | | | CME Group, Inc. | | | 225,309 | |
| | 3,634 | | | State Street Corp. | | | 220,984 | |
| | 1,783 | | | T. Rowe Price Group, Inc. (a) | | | 187,233 | |
| | | | | | |
|
|
|
| | | | | | | | 1,161,516 | |
| | | | | | |
|
|
|
| | | | | Chemicals - 0.66% | | | | |
| | 1,374 | | | Air Products & Chemicals, Inc. | | | 319,771 | |
| | 3,976 | | | LyondellBasell Industries NV - Class A - ADR | | | 299,313 | |
| | | | | | |
|
|
|
| | | | | | | | 619,084 | |
| | | | | | |
|
|
|
| | | | | Communications Equipment - 0.76% | | | | |
| | 17,803 | | | Cisco Systems, Inc. | | | 712,120 | |
| | | | | | |
|
|
|
| | | | | Consumer Finance - 0.50% | | | | |
| | 3,364 | | | Capital One Financial Corp. | | | 310,059 | |
| | 5,624 | | | Synchrony Financial | | | 158,541 | |
| | | | | | |
|
|
|
| | | | | | | | 468,600 | |
| | | | | | |
|
|
|
| | | | | Diversified Telecommunication Services - 1.14% | | | | |
| | 20,633 | | | AT&T, Inc. | | | 316,510 | |
| | 19,760 | | | Verizon Communications, Inc. | | | 750,287 | |
| | | | | | |
|
|
|
| | | | | | | | 1,066,797 | |
| | | | | | |
|
|
|
| | | | | Electric Utilities - 1.41% | | | | |
| | 2,144 | | | American Electric Power Co., Inc. | | | 185,349 | |
| | 999 | | | Eversource Energy | | | 77,882 | |
| | 10,020 | | | NextEra Energy, Inc. | | | 785,668 | |
| | 4,197 | | | Xcel Energy, Inc. | | | 268,608 | |
| | | | | | |
|
|
|
| | | | | | | | 1,317,507 | |
| | | | | | |
|
|
|
| | | | | | | | |
Number of
Shares
| | | | | Value
| |
| | | | | Electrical Equipment - 0.79% | | | | |
| | 2,948 | | | Eaton Corp. PLC - ADR | | $ | 393,145 | |
| | 4,712 | | | Emerson Electric Co. | | | 345,013 | |
| | | | | | |
|
|
|
| | | | | | | | 738,158 | |
| | | | | | |
|
|
|
| | | | | Food Products - 0.96% | | | | |
| | 2,765 | | | Archer-Daniels-Midland Co. | | | 222,444 | |
| | 4,472 | | | General Mills, Inc. | | | 342,600 | |
| | 5,976 | | | Mondelez International, Inc. - Class A | | | 327,664 | |
| | | | | | |
|
|
|
| | | | | | | | 892,708 | |
| | | | | | |
|
|
|
| | | | | Health Care Equipment & Supplies - 0.46% | | | | |
| | 5,334 | | | Medtronic PLC - ADR | | | 430,721 | |
| | | | | | |
|
|
|
| | | | | Health Care Providers & Services - 0.52% | | | | |
| | 5,094 | | | CVS Health Corp. | | | 485,815 | |
| | | | | | |
|
|
|
| | | | | Hotels, Restaurants & Leisure - 1.31% | | | | |
| | 3,659 | | | McDonald’s Corp. | | | 844,278 | |
| | 4,540 | | | Starbucks Corp. | | | 382,540 | |
| | | | | | |
|
|
|
| | | | | | | | 1,226,818 | |
| | | | | | |
|
|
|
| | | | | Household Durables - 0.12% | | | | |
| | 861 | | | Whirlpool Corp. (a) | | | 116,071 | |
| | | | | | |
|
|
|
| | | | | Household Products - 1.80% | | | | |
| | 5,673 | | | Colgate-Palmolive Co. | | | 398,528 | |
| | 1,744 | | | Kimberly-Clark Corp. | | | 196,270 | |
| | 8,589 | | | Procter & Gamble Co. | | | 1,084,361 | |
| | | | | | |
|
|
|
| | | | | | | | 1,679,159 | |
| | | | | | |
|
|
|
| | | | | Industrial Conglomerates - 1.18% | | | | |
| | 4,566 | | | 3M Co. | | | 504,543 | |
| | 3,583 | | | Honeywell International, Inc. | | | 598,253 | |
| | | | | | |
|
|
|
| | | | | | | | 1,102,796 | |
| | | | | | |
|
|
|
| | | | | Insurance - 1.28% | | | | |
| | 5,265 | | | Aflac, Inc. | | | 295,893 | |
| | 3,215 | | | Hartford Financial Services Group, Inc. | | | 199,137 | |
| | 4,857 | | | Progressive Corp. | | | 564,432 | |
| | 899 | | | Travelers Cos., Inc. | | | 137,727 | |
| | | | | | |
|
|
|
| | | | | | | | 1,197,189 | |
| | | | | | |
|
|
|
| | | | | IT Services - 1.26% | | | | |
| | 1,941 | | | Automatic Data Processing, Inc. | | | 439,035 | |
| | 4,814 | | | International Business Machines Corp. | | | 571,951 | |
| | 1,451 | �� | | Paychex, Inc. | | | 162,817 | |
| | | | | | |
|
|
|
| | | | | | | | 1,173,803 | |
| | | | | | |
|
|
|
| | | | | Leisure Products - 0.07% | | | | |
| | 904 | | | Hasbro, Inc. (a) | | | 60,948 | |
| | | | | | |
|
|
|
| | | | | Machinery - 0.64% | | | | |
| | 1,315 | | | Cummins, Inc. | | | 267,616 | |
| | 1,122 | | | Illinois Tool Works, Inc. | | | 202,689 | |
| | 1,540 | | | PACCAR, Inc. | | | 128,883 | |
| | | | | | |
|
|
|
| | | | | | | | 599,188 | |
| | | | | | |
|
|
|
| | | | | Media - 0.56% | | | | |
| | 12,814 | | | Comcast Corp. - Class A | | | 375,835 | |
| | 7,524 | | | Paramount Global - Class B (a) | | | 143,257 | |
| | | | | | |
|
|
|
| | | | | | | | 519,092 | |
| | | | | | |
|
|
|
| | | | | Metals & Mining - 0.20% | | | | |
| | 1,731 | | | NUCOR Corp. (a) | | | 185,200 | |
| | | | | | |
|
|
|
See notes to financial statements.
100
GuidePath Growth and Income Fund
SCHEDULE OF INVESTMENTS (Continued) (Unaudited)
September 30, 2022
| | | | | | | | |
Number of
Shares
| | | | | Value
| |
| | | | | Multi-Utilities - 0.98% | | | | |
| | 3,155 | | | Ameren Corp. | | $ | 254,135 | |
| | 2,159 | | | Consolidated Edison, Inc. | | | 185,156 | |
| | 1,689 | | | DTE Energy Co. | | | 194,319 | |
| | 1,856 | | | Sempra Energy | | | 278,289 | |
| | | | | | |
|
|
|
| | | | | | | | 911,899 | |
| | | | | | |
|
|
|
| | | | | Oil, Gas & Consumable Fuels - 0.40% | | | | |
| | 3,801 | | | Marathon Petroleum Corp. | | | 377,553 | |
| | | | | | |
|
|
|
| | | | | Pharmaceuticals - 4.11% | | | | |
| | 11,105 | | | Bristol-Myers Squibb Co. | | | 789,454 | |
| | 7,386 | | | Johnson & Johnson | | | 1,206,579 | |
| | 11,532 | | | Merck & Co., Inc. | | | 993,136 | |
| | 19,245 | | | Pfizer, Inc. | | | 842,161 | |
| | | | | | |
|
|
|
| | | | | | | | 3,831,330 | |
| | | | | | |
|
|
|
| | | | | Road & Rail - 0.38% | | | | |
| | 1,824 | | | Union Pacific Corp. | | | 355,352 | |
| | | | | | |
|
|
|
| | | | | Semiconductors & Semiconductor Equipment - 2.46% | |
| | 953 | | | Analog Devices, Inc. | | | 132,791 | |
| | 1,162 | | | Broadcom, Inc. | | | 515,940 | |
| | 15,321 | | | Intel Corp. | | | 394,822 | |
| | 5,317 | | | QUALCOMM, Inc. | | | 600,715 | |
| | 4,237 | | | Texas Instruments, Inc. | | | 655,802 | |
| | | | | | |
|
|
|
| | | | | | | | 2,300,070 | |
| | | | | | |
|
|
|
| | | | | Specialty Retail - 1.52% | | | | |
| | 1,758 | | | Advance Auto Parts, Inc. (a) | | | 274,846 | |
| | 897 | | | Best Buy Co., Inc. | | | 56,816 | |
| | 3,927 | | | Home Depot Inc. | | | 1,083,616 | |
| | | | | | |
|
|
|
| | | | | | | | 1,415,278 | |
| | | | | | |
|
|
|
| | | | | Technology Hardware, Storage & Peripherals - 0.19% | |
| | 7,006 | | | HP, Inc. | | | 174,590 | |
| | | | | | |
|
|
|
| | | | | Tobacco - 0.36% | | | | |
| | 4,057 | | | Philip Morris International, Inc. | | | 336,772 | |
| | | | | | |
|
|
|
| | | | | Total Common Stocks
(Cost $30,056,549) | | | 31,351,480 | |
| | | | | | |
|
|
|
| | | | | INVESTMENT COMPANIES - 35.75% | | | | |
| | | | | Domestic Equity Funds - 35.15% | | | | |
| | 197,610 | | | Global X MLP ETF | | | 7,793,738 | |
| | 263,718 | | | Vanguard High Dividend Yield ETF (d) | | | 25,021,564 | |
| | | | | | |
|
|
|
| | | | | | | | 32,815,302 | |
| | | | | | |
|
|
|
| | | | | Domestic Fixed Income Funds - 0.60% | | | | |
| | 6,142 | | | SPDR Bloomberg 1-3 Month T-Bill ETF (a) | | | 562,607 | |
| | | | | | |
|
|
|
| | | | | Total Investment Companies
(Cost $37,759,042) | | | 33,377,909 | |
| | | | | | |
|
|
|
| | | | | SHORT TERM INVESTMENTS - 31.86% | | | | |
| | | | | Money Market Funds - 22.34% | | | | |
| | 20,862,706 | | | DWS Government Money Market Series - Institutional Shares
Effective Yield, 3.04% (b) | | | 20,862,706 | |
| | | | | | |
|
|
|
| | | | | | | | |
Principal
Amount
| | | | | Value
| |
| | | | | U.S. Treasury Notes - 9.52% | |
| | 3,000,000 | | | 0.125%, 11/30/2022 (c) | | $ | 2,985,514 | |
| | 3,000,000 | | | 2.500%, 03/31/2023 (c) | | | 2,980,619 | |
| | 3,000,000 | | | 0.000%, 06/15/2023 | | | 2,923,337 | |
| | | | | | |
|
|
|
| | | | | | | | 8,889,470 | |
| | | | | | |
|
|
|
| | | | | Total Short Term Investments
(Cost $29,818,021) | | | 29,752,176 | |
| | | | | | |
|
|
|
| | |
Number of
Units
| | | | | | |
| | | | | INVESTMENTS PURCHASED WITH PROCEEDS FROM SECURITIES LENDING COLLATERAL - 3.08% | |
| | 2,875,955 | | | Mount Vernon Liquid Assets Portfolio, LLC
Effective Yield, 3.18% (b) | | | 2,875,955 | |
| | | | | | |
|
|
|
| | | | | Total Investments Purchased with Proceeds from Securities Lending Collateral
(Cost $2,875,955) | | | 2,875,955 | |
| | | | | | |
|
|
|
| | | | | Total Investments
(Cost $100,509,567) - 104.26% | | | 97,357,520 | |
| | | | | Liabilities in Excess of
Other Assets - (4.26)% | | | (3,975,799 | ) |
| | | | | | |
|
|
|
| | | | | TOTAL NET ASSETS - 100.00% | | $ | 93,381,721 | |
| | | | | | |
|
|
|
Percentages are stated as a percent of net assets.
| (a) | | All or portion of this security is on loan. |
| (b) | | Seven-day yield as of September 30, 2022. |
| (c) | | All or a portion of this security is held as collateral for certain written options contracts. The approximate value of the portion on these securities held as collateral is $5,468,580. |
| (d) | | Fair value of this security exceeds 25% of the Fund’s net assets. Additional information for this security, including the financial statements, is available from the SEC’s EDGAR database at www.sec.gov. |
Glossary of Terms
| | | | |
| ADR | | - | | American Depositary Receipt |
See notes to financial statements.
101
GuidePath Growth and Income Fund
SCHEDULE OF OPEN FUTURES CONTRACTS (Unaudited)
September 30, 2022
| | | | | | | | | | | | | | | | | | |
Description
| | Number of
Contracts
Purchased / (Sold)
| | | Long/Short
| | | Notional
Value
| | | Settlement
Month
| | Value / Unrealized
Appreciation
(Depreciation)
| |
E-mini S&P 500 Futures | | | (63 | ) | | | Short | | | $ | (11,344,725 | ) | | Dec-22 | | $ | 856,263 | |
| | | | | | | | | | | | | | | | |
|
|
|
| | | | | | | | | | | | | | | | | $ | 856,263 | |
| | | | | | | | | | | | | | | | |
|
|
|
GuidePath Growth and Income Fund
SCHEDULE OF OPTIONS WRITTEN (Unaudited)
September 30, 2022
| | | | | | | | | | | | |
Notional
Amount
| | | Number of
Contracts
| | | | | Value
| |
| | | | | | | | | Options on Equities | | | | |
| | | | | | | | | Put Options | | | | |
| $ | 3,930,000 | | | | 10 | | | CBOE S&P 500 Index
Counterparty: Interactive Brokers
Expiration: October 14, 2022
Exercise Price: $3,930.00 | | $ | (290,620 | ) |
| | 3,925,000 | | | | 10 | | | CBOE S&P 500 Index
Counterparty: Interactive Brokers
Expiration: October 21, 2022
Exercise Price: $3,925.00 | | | (310,000 | ) |
| | 5,917,500 | | | | 15 | | | CBOE S&P 500 Index
Counterparty: Interactive Brokers
Expiration: October 21, 2022
Exercise Price: $3,945.00 | | | (523,800 | ) |
| | 3,940,000 | | | | 10 | | | S&P 500 Index
Counterparty: Interactive Brokers
Expiration: October 28, 2022
Exercise Price: $3,940.00 | | | (347,200 | ) |
| | 3,870,000 | | | | 10 | | | S&P 500 Index
Counterparty: Interactive Brokers
Expiration: November 4, 2022
Exercise Price: $3,870.00 | | | (292,150 | ) |
| | 3,670,000 | | | | 10 | | | S&P 500 Index
Counterparty: Interactive Brokers
Expiration: November 11, 2022
Exercise Price: $3,670.00 | | | (164,000 | ) |
| | | | | | | | | | |
|
|
|
| | | | | | | | | Total Written Options
(Premiums Received $813,670) | | $ | (1,927,770 | ) |
| | | | | | | | | | |
|
|
|
See notes to financial statements.
102
GuideMark Funds & GuidePath Funds
STATEMENTS OF ASSETS & LIABILITIES
September 30, 2022 (Unaudited)
| | | | | | | | | | | | |
| | | Large Cap
Core Fund
| | | Emerging
Markets Fund
| | | Small/Mid Cap
Core Fund
| |
ASSETS: | | | | | | | | | | | | |
Investments, at value (cost $389,230,273, $48,398,047 and $99,588,226, respectively)1 | | $ | 522,674,206 | | | $ | 46,797,862 | | | $ | 110,738,588 | |
Foreign currencies (cost $0, $3,684, and $0, respectively) | | | — | | | | 3,664 | | | | — | |
Cash | | | — | | | | 14,437 | | | | — | |
Income receivable | | | 371,829 | | | | 116,034 | | | | 82,377 | |
Receivable for dividend reclaims | | | — | | | | 2,101 | | | | — | |
Receivable for investment securities sold | | | — | | | | — | | | | 45,430 | |
Receivable for fund shares sold | | | 581,151 | | | | 34,815 | | | | 108,752 | |
Other assets | | | 42,042 | | | | 21,603 | | | | 30,489 | |
| | |
|
|
| |
|
|
| |
|
|
|
Total Assets | | | 523,669,228 | | | | 46,990,516 | | | | 111,005,636 | |
| | |
|
|
| |
|
|
| |
|
|
|
LIABILITIES: | | | | | | | | | | | | |
Payable for collateral on securities loaned | | | 50,893,955 | | | | 2,132,591 | | | | 22,782,871 | |
Payable for fund shares redeemed | | | 310,153 | | | | 27,605 | | | | 59,480 | |
Payable to Investment Advisor | | | 268,962 | | | | 6,021 | | | | 64,011 | |
Payable to custodian | | | 6,278 | | | | 17,636 | | | | 3,319 | |
Accrued Trustee fees and expenses | | | 4,487 | | | | 401 | | | | 1,004 | |
Accrued shareholder servicing fees | | | 29,429 | | | | 7,062 | | | | 5,878 | |
Deferred tax | | | — | | | | 172,069 | | | | — | |
Other accrued expenses | | | 135,887 | | | | 27,009 | | | | 52,014 | |
| | |
|
|
| |
|
|
| |
|
|
|
Total Liabilities | | | 51,649,151 | | | | 2,390,394 | | | | 22,968,577 | |
| | |
|
|
| |
|
|
| |
|
|
|
NET ASSETS | | $ | 472,020,077 | | | $ | 44,600,122 | | | $ | 88,037,059 | |
| | |
|
|
| |
|
|
| |
|
|
|
NET ASSETS CONSIST OF: | | | | | | | | | | | | |
Capital stock | | | 294,494,817 | | | | 39,989,143 | | | | 75,584,577 | |
Total distributable earnings | | | 177,525,260 | | | | 4,610,979 | | | | 12,452,482 | |
| | |
|
|
| |
|
|
| |
|
|
|
Total Net Assets | | $ | 472,020,077 | | | $ | 44,600,122 | | | $ | 88,037,059 | |
| | |
|
|
| |
|
|
| |
|
|
|
Institutional Shares | | | | | | | | | | | | |
Shares outstanding (unlimited shares of no par value authorized) | | | 64 | | | | — | | | | — | |
Net assets | | | 1,499 | | | | — | | | | — | |
Net asset value, offering and redemption price per share | | $ | 23.286 | 2 | | $ | — | | | $ | — | |
| | |
|
|
| |
|
|
| |
|
|
|
Service Shares | | | | | | | | | | | | |
Shares outstanding (unlimited shares of no par value authorized) | | | 20,608,047 | | | | 4,259,797 | | | | 5,741,911 | |
Net assets | | | 472,018,578 | | | | 44,600,122 | | | | 88,037,059 | |
Net asset value, offering and redemption price per share | | $ | 22.905 | | | $ | 10.470 | | | $ | 15.332 | |
| | |
|
|
| |
|
|
| |
|
|
|
1Includes loaned securities with a value of: | | $ | 49,248,446 | | | $ | 2,084,034 | | | $ | 22,076,583 | |
| | |
|
|
| |
|
|
| |
|
|
|
2Differences in actual and calculated net asset value shown are due to rounding. | | | | | | | | | | | | |
See notes to financial statements.
103
GuideMark Funds & GuidePath Funds
STATEMENTS OF ASSETS & LIABILITIES (Continued)
September 30, 2022 (Unaudited)
| | | | | | | | | | | | |
| | | World
ex-US Fund
| | | Core
Fixed Income
Fund
| | | Growth
Allocation
Fund
| |
ASSETS: | | | | | | | | | | | | |
Investments, at value (cost $85,936,191, $235,029,543 and $857,183,002 respectively)1 | | $ | 88,335,813 | | | $ | 208,936,700 | | | $ | 986,263,265 | |
Foreign currencies (cost $168,631, $0, and $0, respectively) | | | 164,572 | | | | — | | | | — | |
Variation margin on futures | | | — | | | | 68,438 | | | | — | |
Cash | | | — | | | | 21,340 | | | | — | |
Appreciation on swap agreements | | | — | | | | 152,604 | | | | — | |
Income receivable | | | 277,967 | | | | 1,158,289 | | | | 856,495 | |
Receivable for dividend and interest reclaims | | | 399,607 | | | | 2,324 | | | | — | |
Receivable for investment securities sold | | | — | | | | 264,803 | | | | 93,927 | |
Receivable for fund shares sold | | | 102,388 | | | | 211,195 | | | | 894,043 | |
Other assets | | | 23,017 | | | | 25,466 | | | | 68,161 | |
| | |
|
|
| |
|
|
| |
|
|
|
Total Assets | | | 89,303,364 | | | | 210,841,159 | | | | 988,175,891 | |
| | |
|
|
| |
|
|
| |
|
|
|
LIABILITIES: | | | | | | | | | | | | |
Options written at value (Premium received $0, $94,809 and $0, respectively) | | | — | | | | 116,999 | | | | — | |
Payable for collateral on securities loaned | | | 4,133,164 | | | | 3,061,000 | | | | 157,022,731 | |
Payable for investment securities purchased | | | — | | | | 29,041,652 | | | | — | |
Payable for fund shares redeemed | | | 42,289 | | | | 366,728 | | | | 390,685 | |
Payable to Investment Advisor | | | 30,228 | | | | 89,750 | | | | 376,201 | |
Payable to custodian | | | 21,370 | | | | 4,562 | | | | 12,985 | |
Accrued Trustee fees and expenses | | | 853 | | | | 2,094 | | | | 10,689 | |
Accrued shareholder servicing fees | | | 11,318 | | | | 11,738 | | | | 84,825 | |
Swap premiums received | | | — | | | | 6,467 | | | | — | |
Due to broker for swaps for margin | | | — | | | | 143,868 | | | | — | |
Other accrued expenses | | | 96,479 | | | | 92,138 | | | | 196,477 | |
| | |
|
|
| |
|
|
| |
|
|
|
Total Liabilities | | | 4,335,701 | | | | 32,936,996 | | | | 158,094,593 | |
| | |
|
|
| |
|
|
| |
|
|
|
NET ASSETS | | $ | 84,967,663 | | | $ | 177,904,163 | | | $ | 830,081,298 | |
| | |
|
|
| |
|
|
| |
|
|
|
NET ASSETS CONSIST OF: | | | | | | | | | | | | |
Capital stock | | | 76,890,445 | | | | 211,876,028 | | | | 686,597,535 | |
Total distributable earnings (loss) | | | 8,077,218 | | | | (33,971,865 | ) | | | 143,483,763 | |
| | |
|
|
| |
|
|
| |
|
|
|
Total Net Assets | | $ | 84,967,663 | | | $ | 177,904,163 | | | $ | 830,081,298 | |
| | |
|
|
| |
|
|
| |
|
|
|
Institutional Shares | | | | | | | | | | | | |
Shares outstanding (unlimited shares of no par value authorized) | | | 25 | | | | — | | | | 468 | |
Net assets | | | 209 | | | | — | | | | 5,893 | |
Net asset value, offering and redemption price per share | | $ | 8.218 | 2 | | $ | — | | | $ | 12.598 | 2 |
| | |
|
|
| |
|
|
| |
|
|
|
Service Shares | | | | | | | | | | | | |
Shares outstanding (unlimited shares of no par value authorized) | | | 10,719,271 | | | | 22,352,335 | | | | 66,391,389 | |
Net assets | | | 84,967,454 | | | | 177,904,163 | | | | 830,075,405 | |
Net asset value, offering and redemption price per share | | $ | 7.927 | | | $ | 7.959 | | | $ | 12.503 | |
| | |
|
|
| |
|
|
| |
|
|
|
1Includes loaned securities with a value of: | | $ | 3,987,586 | | | $ | 3,005,026 | | | $ | 152,147,653 | |
| | |
|
|
| |
|
|
| |
|
|
|
2Differences in actual and calculated net asset value shown are due to rounding. | | | | | | | | | | | | |
See notes to financial statements.
104
GuideMark Funds & GuidePath Funds
STATEMENTS OF ASSETS & LIABILITIES (Continued)
September 30, 2022 (Unaudited)
| | | | | | | | | | | | |
| | | Conservative
Allocation
Fund
| | | Tactical
Allocation
Fund
| | | Absolute
Return
Allocation
Fund
| |
ASSETS: | | | | | | | | | | | | |
Investments, at value (cost $493,014,009, $498,051,042 and $409,647,516, respectively)1 | | $ | 483,478,472 | | | $ | 497,566,906 | | | $ | 394,377,485 | |
Income receivable | | | 216,359 | | | | 682,233 | | | | 218,995 | |
Receivable for investment securities sold | | | 209,418 | | | | 45,240,970 | | | | 486,895 | |
Receivable for fund shares sold | | | 478,119 | | | | 499,719 | | | | 367,043 | |
Other assets | | | 62,716 | | | | 30,203 | | | | 211,451 | |
| | |
|
|
| |
|
|
| |
|
|
|
Total Assets | | | 484,445,084 | | | | 544,020,031 | | | | 395,661,869 | |
| | |
|
|
| |
|
|
| |
|
|
|
LIABILITIES: | | | | | | | | | | | | |
Payable for collateral on securities loaned | | | 104,331,390 | | | | 30,932,216 | | | | 60,309,447 | |
Payable for investment securities purchased | | | 152,047 | | | | 43,903,541 | | | | — | |
Payable for fund shares redeemed | | | 273,841 | | | | 358,318 | | | | 419,225 | |
Payable to Investment Advisor | | | 126,981 | | | | 140,232 | | | | 136,892 | |
Payable to custodian | | | 9,532 | | | | 12,095 | | | | 3,760 | |
Accrued Trustee fees and expenses | | | 4,915 | | | | 5,146 | | | | 4,676 | |
Accrued shareholder servicing fees | | | 34,181 | | | | 38,379 | | | | 35,969 | |
Other accrued expenses | | | 101,501 | | | | 200,871 | | | | 277,937 | |
| | |
|
|
| |
|
|
| |
|
|
|
Total Liabilities | | | 105,034,388 | | | | 75,590,798 | | | | 61,187,906 | |
| | |
|
|
| |
|
|
| |
|
|
|
NET ASSETS | | $ | 379,410,696 | | | $ | 468,429,233 | | | $ | 334,473,963 | |
| | |
|
|
| |
|
|
| |
|
|
|
NET ASSETS CONSIST OF: | | | | | | | | | | | | |
Capital stock | | | 396,113,281 | | | | 475,538,358 | | | | 368,462,395 | |
Total distributable earnings (loss) | | | (16,702,585 | ) | | | (7,109,125 | ) | | | (33,988,432 | ) |
| | |
|
|
| |
|
|
| |
|
|
|
Total Net Assets | | $ | 379,410,696 | | | $ | 468,429,233 | | | $ | 334,473,963 | |
| | |
|
|
| |
|
|
| |
|
|
|
Institutional Shares | | | | | | | | | | | | |
Shares outstanding (unlimited shares of no par value authorized) | | | 966 | | | | 47,266 | | | | 2,590 | |
Net assets | | | 9,204 | | | | 496,464 | | | | 23,851 | |
Net asset value, offering and redemption price per share | | $ | 9.528 | | | $ | 10.504 | | | $ | 9.208 | 2 |
| | |
|
|
| |
|
|
| |
|
|
|
Service Shares | | | | | | | | | | | | |
Shares outstanding (unlimited shares of no par value authorized) | | | 40,273,520 | | | | 45,013,700 | | | | 36,291,435 | |
Net assets | | | 379,401,492 | | | | 467,932,769 | | | | 334,450,112 | |
Net asset value, offering and redemption price per share | | $ | 9.421 | | | $ | 10.395 | | | $ | 9.216 | |
| | |
|
|
| |
|
|
| |
|
|
|
1Includes loaned securities with a value of: | | $ | 101,248,469 | | | $ | 30,183,971 | | | $ | 58,851,434 | |
| | |
|
|
| |
|
|
| |
|
|
|
2Differences in actual and calculated net asset value shown are due to rounding. | | | | | | | | | | | | |
See notes to financial statements.
105
GuideMark Funds & GuidePath Funds
STATEMENTS OF ASSETS & LIABILITIES (Continued)
September 30, 2022 (Unaudited)
| | | | | | | | | | | | |
| | | Multi-Asset
Income
Allocation
Fund
| | | Flexible
Income
Allocation
Fund
| | | Managed2
Futures
Strategy
Fund
| |
ASSETS: | | | | | | | | | | | | |
Investments, at value (cost $105,336,483, $420,335,567 and $558,199,381, respectively)1 | | $ | 105,176,891 | | | $ | 405,996,071 | | | $ | 557,979,800 | |
Income receivable | | | 259,618 | | | | 149,554 | | | | 778,847 | |
Deposits with broker for futures | | | — | | | | — | | | | 8,497,695 | |
Receivable for investment securities sold | | | 63,668 | | | | 370,311 | | | | — | |
Receivable for fund shares sold | | | 434,680 | | | | 198,176 | | | | 1,371,018 | |
Receivable for unsettled open futures contracts | | | — | | | | — | | | | 667,849 | |
Appreciation on forward currency contracts | | | — | | | | — | | | | 4,640,443 | |
Other assets | | | 48,407 | | | | 236,460 | | | | 31,130 | |
| | |
|
|
| |
|
|
| |
|
|
|
Total Assets | | | 105,983,264 | | | | 406,950,572 | | | | 573,966,782 | |
| | |
|
|
| |
|
|
| |
|
|
|
LIABILITIES: | | | | | | | | | | | | |
Depreciation on forward currency contracts | | | — | | | | — | | | | 98,565 | |
Variation margin on futures | | | — | | | | — | | | | 36,288 | |
Payable for collateral on securities loaned | | | 23,811,535 | | | | 98,791,695 | | | | — | |
Payable for fund shares redeemed | | | 130,722 | | | | 1,253,122 | | | | 355,549 | |
Payable for unsettled open futures contracts | | | — | | | | — | | | | 515,322 | |
Payable to Investment Advisor | | | 43,717 | | | | 278,315 | | | | 529,618 | |
Payable to custodian | | | 5,016 | | | | 4,973 | | | | 1,310 | |
Accrued Trustee fees and expenses | | | 1,075 | | | | 3,731 | | | | 3,739 | |
Accrued shareholder servicing fees | | | 7,628 | | | | 28,638 | | | | 41,041 | |
Other accrued expenses | | | 38,430 | | | | 83,672 | | | | 88,109 | |
| | |
|
|
| |
|
|
| |
|
|
|
Total Liabilities | | | 24,038,123 | | | | 100,444,146 | | | | 1,669,541 | |
| | |
|
|
| |
|
|
| |
|
|
|
NET ASSETS | | $ | 81,945,141 | | | $ | 306,506,426 | | | $ | 572,297,241 | |
| | |
|
|
| |
|
|
| |
|
|
|
NET ASSETS CONSIST OF: | | | | | | | | | | | | |
Capital stock | | | 90,261,980 | | | | 357,228,854 | | | | 458,916,604 | |
Total distributable earnings (loss) | | | (8,316,839 | ) | | | (50,722,428 | ) | | | 113,380,637 | |
| | |
|
|
| |
|
|
| |
|
|
|
Total Net Assets | | $ | 81,945,141 | | | $ | 306,506,426 | | | $ | 572,297,241 | |
| | |
|
|
| |
|
|
| |
|
|
|
Institutional Shares | | | | | | | | | | | | |
Shares outstanding (unlimited shares of no par value authorized) | | | — | | | | 846 | | | | 412 | |
Net assets | | | — | | | | 7,600 | | | | 5,258 | |
Net asset value, offering and redemption price per share | | $ | — | | | $ | 8.984 | 3 | | $ | 12.775 | 3 |
| | |
|
|
| |
|
|
| |
|
|
|
Service Shares | | | | | | | | | | | | |
Shares outstanding (unlimited shares of no par value authorized) | | | 8,704,778 | | | | 34,433,404 | | | | 46,172,525 | |
Net assets | | | 81,945,141 | | | | 306,498,826 | | | | 572,291,983 | |
Net asset value, offering and redemption price per share | | $ | 9.414 | | | $ | 8.901 | | | $ | 12.395 | |
| | |
|
|
| |
|
|
| |
|
|
|
1Includes loaned securities with a value of: | | $ | 23,125,744 | | | $ | 96,118,055 | | | $ | — | |
| | |
|
|
| |
|
|
| |
|
|
|
2Consolidated Statement of Assets & Liabilities (see Note 3b). | | | | | | | | | | | | |
3Differences in actual and calculated net asset value shown are due to rounding. | | | | | | | | | | | | |
See notes to financial statements.
106
GuideMark Funds & GuidePath Funds
STATEMENTS OF ASSETS & LIABILITIES (Continued)
September 30, 2022 (Unaudited)
| | | | | | | | | | | | |
| | | Conservative
Income
Fund
| | | Income
Fund
| | | Growth &
Income
Fund
| |
ASSETS: | | | | | | | | | | | | |
Investments, at value (cost $19,037,487, $58,060,131, and $100,509,567 respectively)1 | | $ | 18,975,298 | | | $ | 53,621,519 | | | $ | 97,357,520 | |
Cash | | | — | | | | — | | | | 37,500 | |
Income receivable | | | 12,379 | | | | 2,625 | | | | 94,271 | |
Receivable for investment securities sold | | | 3,530,028 | | | | — | | | | — | |
Receivable for fund shares sold | | | 490 | | | | — | | | | — | |
Deposits with broker for futures | | | — | | | | — | | | | 796,529 | |
Other assets | | | 11,257 | | | | 12,512 | | | | 12,598 | |
| | |
|
|
| |
|
|
| |
|
|
|
Total Assets | | | 22,529,452 | | | | 53,636,656 | | | | 98,298,418 | |
| | |
|
|
| |
|
|
| |
|
|
|
LIABILITIES: | | | | | | | | | | | | |
Options written, at value (premiums received $0, $0, and $602,250) | | | — | | | | — | | | | 1,927,770 | |
Payable for collateral on securities loaned | | | 2,178,040 | | | | — | | | | 2,875,955 | |
Payable for investment securities purchased | | | 3,551,262 | | | | — | | | | — | |
Payable for fund shares redeemed | | | 2,490 | | | | — | | | | — | |
Payable to Investment Advisor | | | 7,999 | | | | 32,027 | | | | 55,057 | |
Payable to custodian | | | 246 | | | | 550 | | | | 3,613 | |
Payable for audit and tax fees | | | 7,979 | | | | 7,978 | | | | 10,727 | |
Payable for legal fees | | | 762 | | | | 2,897 | | | | — | |
Payable for printing and mailing fees | | | 872 | | | | 3,791 | | | | — | |
Payable for transfer agent fees and expenses | | | 524 | | | | 593 | | | | 629 | |
Accrued Trustee fees and expenses | | | 225 | | | | 589 | | | | 1,046 | |
Other accrued expenses | | | 5,186 | | | | 7,453 | | | | 41,900 | |
| | |
|
|
| |
|
|
| |
|
|
|
Total Liabilities | | | 5,755,585 | | | | 55,878 | | | | 4,916,697 | |
| | |
|
|
| |
|
|
| |
|
|
|
NET ASSETS | | $ | 16,773,867 | | | $ | 53,580,778 | | | $ | 93,381,721 | |
| | |
|
|
| |
|
|
| |
|
|
|
NET ASSETS CONSIST OF: | | | | | | | | | | | | |
Capital stock | | | 17,320,071 | | | | 63,723,550 | | | | 101,110,282 | |
Total distributable earnings (loss) | | | (546,204 | ) | | | (10,142,772 | ) | | | (7,728,561 | ) |
| | |
|
|
| |
|
|
| |
|
|
|
Total Net Assets | | $ | 16,773,867 | | | $ | 53,580,778 | | | $ | 93,381,721 | |
| | |
|
|
| |
|
|
| |
|
|
|
Shares outstanding (unlimited shares of no par value authorized) | | | 1,746,359 | | | | 6,470,509 | | | | 9,684,379 | |
Net assets | | | 16,773,867 | | | | 53,580,778 | | | | 93,381,721 | |
Net asset value, offering and redemption price per share | | $ | 9.605 | | | $ | 8.281 | | | $ | 9.643 | |
| | |
|
|
| |
|
|
| |
|
|
|
1Includes loaned securities with a value of: | | $ | 2,112,151 | | | $ | — | | | $ | 10,297,136 | |
| | |
|
|
| |
|
|
| |
|
|
|
See notes to financial statements.
107
GuideMark Funds & GuidePath Funds
STATEMENTS OF OPERATIONS
For the Period Ended September 30, 2022 (Unaudited)
| | | | | | | | | | | | |
| | | Large Cap
Core Fund
| | | Emerging
Markets Fund
| | | Small/Mid Cap
Core Fund
| |
INVESTMENT INCOME: | | | | | | | | | | | | |
Dividend income (net of withholding tax of $638, $186,910, and $768, respectively) | | $ | 4,259,504 | | | $ | 1,505,984 | | | $ | 771,647 | |
Interest income | | | 25,860 | | | | 1,438 | | | | 5,410 | |
| | |
|
|
| |
|
|
| |
|
|
|
Total investment income | | | 4,285,364 | | | | 1,507,422 | | | | 777,057 | |
| | |
|
|
| |
|
|
| |
|
|
|
EXPENSES: | | | | | | | | | | | | |
Investment advisory fees | | | 1,221,995 | | | | 165,271 | | | | 282,396 | |
Administrative service fees – Service Shares | | | 673,038 | | | | 69,105 | | | | 123,271 | |
Shareholder servicing fees – Service Shares | | | 271,536 | | | | 28,012 | | | | 49,543 | |
Administration fees | | | 53,009 | | | | 17,205 | | | | 19,817 | |
Reports to shareholders | | | 48,397 | | | | 6,472 | | | | 12,900 | |
Fund accounting fees | | | 45,833 | | | | 54,009 | | | | 34,060 | |
Legal fees | | | 44,160 | | | | 14,851 | | | | 7,441 | |
Trustee fees and expenses | | | 30,429 | | | | 3,202 | | | | 5,063 | |
Federal and state registration fees | | | 21,257 | | | | 18,633 | | | | 19,305 | |
Custody fees | | | 16,051 | | | | 96,642 | | | | 5,714 | |
Audit and tax fees | | | 11,591 | | | | 16,502 | | | | 12,049 | |
Compliance fees | | | 7,901 | | | | 793 | | | | 1,373 | |
Transfer agent fees and expenses | | | 7,869 | | | | 2,410 | | | | 2,838 | |
Insurance fees | | | 5,338 | | | | 731 | | | | 792 | |
Miscellaneous expenses | | | 822 | | | | 1,799 | | | | 579 | |
Interest expenses | | | — | | | | 1,785 | | | | — | |
| | |
|
|
| |
|
|
| |
|
|
|
Total expenses | | | 2,459,226 | | | | 497,422 | | | | 577,141 | |
| | |
|
|
| |
|
|
| |
|
|
|
Fees waived by the Advisor (See Note 4) | | | — | | | | (101,091 | ) | | | — | |
Less securities lending credit (See Note 6) | | | (70,592 | ) | | | (2,377 | ) | | | (56,231 | ) |
| | |
|
|
| |
|
|
| |
|
|
|
Net expenses | | | 2,388,634 | | | | 393,954 | | | | 520,910 | |
| | |
|
|
| |
|
|
| |
|
|
|
Net investment income | | | 1,896,730 | | | | 1,113,468 | | | | 256,147 | |
| | |
|
|
| |
|
|
| |
|
|
|
NET REALIZED AND UNREALIZED GAIN (LOSS) ON INVESTMENTS: | | | | | | | | | | | | |
Net realized gain (loss) on: | | | | | | | | | | | | |
Investments (net of foreign capital gains tax of $0, $85,927, and $0, respectively) | | | 31,674,772 | | | | 1,338,277 | | | | 1,566,703 | |
Foreign currencies | | | — | | | | (13,546 | ) | | | — | |
| | |
|
|
| |
|
|
| |
|
|
|
Total | | | 31,674,772 | | | | 1,324,731 | | | | 1,566,703 | |
| | |
|
|
| |
|
|
| |
|
|
|
Net change in unrealized appreciation (depreciation) on: | | | | | | | | | | | | |
Investments (net change in deferred foreign capital gains tax of $0, $259,274, and $0, respectively) | | | (162,842,345 | ) | | | (16,886,919 | ) | | | (23,360,968 | ) |
Foreign currencies | | | — | | | | 524 | | | | — | |
| | |
|
|
| |
|
|
| |
|
|
|
Total | | | (162,842,345 | ) | | | (16,886,395 | ) | | | (23,360,968 | ) |
| | |
|
|
| |
|
|
| |
|
|
|
Net realized and unrealized gain (loss) | | | (131,167,573 | ) | | | (15,561,664 | ) | | | (21,794,265 | ) |
| | |
|
|
| |
|
|
| |
|
|
|
NET DECREASE IN NET ASSETS RESULTING FROM OPERATIONS | | $ | (129,270,843 | ) | | $ | (14,448,196 | ) | | $ | (21,538,118 | ) |
| | |
|
|
| |
|
|
| |
|
|
|
See notes to financial statements.
108
GuideMark Funds & GuidePath Funds
STATEMENTS OF OPERATIONS (Continued)
For the Period Ended September 30, 2022 (Unaudited)
| | | | | | | | | | | | |
| | | World
ex-US Fund
| | | Core
Fixed Income
Fund
| | | Growth
Allocation
Fund
| |
INVESTMENT INCOME: | | | | | | | | | | | | |
Dividend income (net of withholding tax of $290,327, $0, and $0, respectively) | | $ | 2,168,729 | | | $ | — | | | $ | 7,029,029 | |
Interest income | | | 3,395 | | | | 2,770,001 | | | | 70,282 | |
| | |
|
|
| |
|
|
| |
|
|
|
Total investment income | | | 2,172,124 | | | | 2,770,001 | | | | 7,099,311 | |
| | |
|
|
| |
|
|
| |
|
|
|
EXPENSES: | | | | | | | | | | | | |
Investment advisory fees | | | 251,554 | | | | 385,835 | | | | 1,285,432 | |
Administrative service fees – Service Shares | | | 125,144 | | | | 239,089 | | | | 1,284,739 | |
Shareholder servicing fees – Service Shares | | | 50,308 | | | | 96,459 | | | | 514,101 | |
Administration fees | | | 24,763 | | | | 21,130 | | | | 76,648 | |
Reports to shareholders | | | 36,879 | | | | 11,986 | | | | 49,316 | |
Fund accounting fees | | | 54,254 | | | | 123,294 | | | | 61,087 | |
Legal fees | | | 12,104 | | | | 13,418 | | | | 70,930 | |
Trustee fees and expenses | | | 5,642 | | | | 9,763 | | | | 53,683 | |
Federal and state registration fees | | | 19,334 | | | | 19,883 | | | | 32,492 | |
Custody fees | | | 55,699 | | | | 17,513 | | | | 34,728 | |
Audit and tax fees | | | 14,062 | | | | 13,056 | | | | 8,480 | |
Compliance fees | | | 1,465 | | | | 2,655 | | | | 14,372 | |
Transfer agent fees and expenses | | | 2,960 | | | | 3,722 | | | | 12,384 | |
Insurance fees | | | 1,036 | | | | 1,739 | | | | 9,242 | |
Miscellaneous expenses | | | 610 | | | | 579 | | | | 912 | |
Interest expenses | | | 160 | | | | — | | | | 58,400 | |
| | |
|
|
| |
|
|
| |
|
|
|
Total expenses | | | 655,974 | | | | 960,121 | | | | 3,566,946 | |
| | |
|
|
| |
|
|
| |
|
|
|
Fees waived by the Advisor (See Note 4) | | | (75,413 | ) | | | (48,278 | ) | | | — | |
Less securities lending credit (See Note 6) | | | (6,868 | ) | | | (5,131 | ) | | | (233,814 | ) |
| | |
|
|
| |
|
|
| |
|
|
|
Net expenses | | | 573,693 | | | | 906,712 | | | | 3,333,132 | |
| | |
|
|
| |
|
|
| |
|
|
|
Net investment income | | | 1,598,431 | | | | 1,863,289 | | | | 3,766,179 | |
| | |
|
|
| |
|
|
| |
|
|
|
NET REALIZED AND UNREALIZED GAIN (LOSS) ON INVESTMENTS: | | | | | | | | | | | | |
Net realized gain (loss) on: | | | | | | | | | | | | |
Investments | | | 2,065,144 | | | | (9,050,348 | ) | | | (12,604,878 | ) |
Foreign currencies | | | 8,372 | | | | — | | | | — | |
Swaps | | | — | | | | (170,020 | ) | | | — | |
Net long-term capital gain distributions received | | | — | | | | — | | | | 4,368,149 | |
Futures contracts | | | — | | | | 1,737,673 | | | | — | |
Options written | | | — | | | | 485,725 | | | | — | |
| | |
|
|
| |
|
|
| |
|
|
|
Total | | | 2,073,516 | | | | (6,996,970 | ) | | | (8,236,729 | ) |
| | |
|
|
| |
|
|
| |
|
|
|
Net change in unrealized appreciation (depreciation) on: | | | | | | | | | | | | |
Investments | | | (29,622,124 | ) | | | (16,594,280 | ) | | | (236,284,584 | ) |
Foreign currencies | | | (55,491 | ) | | | — | | | | — | |
Swaps | | | — | | | | (134,303 | ) | | | — | |
Futures contracts | | | — | | | | 612,434 | | | | — | |
Options written | | | — | | | | (31,021 | ) | | | | |
| | |
|
|
| |
|
|
| |
|
|
|
Total | | | (29,677,615 | ) | | | (16,147,170 | ) | | | (236,284,584 | ) |
| | |
|
|
| |
|
|
| |
|
|
|
Net realized and unrealized gain (loss) | | | (27,604,099 | ) | | | (23,144,140 | ) | | | (244,521,313 | ) |
| | |
|
|
| |
|
|
| |
|
|
|
NET INCREASE (DERCREASE) IN NET ASSETS RESULTING FROM OPERATIONS | | $ | (26,005,668 | ) | | $ | (21,280,851 | ) | | $ | (240,755,134 | ) |
| | |
|
|
| |
|
|
| |
|
|
|
See notes to financial statements.
109
GuideMark Funds & GuidePath Funds
STATEMENTS OF OPERATIONS (Continued)
For the Period Ended September 30, 2022 (Unaudited)
| | | | | | | | | | | | |
| | | Conservative
Allocation
Fund
| | | Tactical
Allocation
Fund
| | | Absolute
Return
Allocation
Fund
| |
INVESTMENT INCOME: | | | | | | | | | | | | |
Dividend income | | $ | 6,634,796 | | | $ | 2,891,504 | | | $ | 5,057,695 | |
Interest income | | | 31,074 | | | | 1,508,459 | | | | 59,676 | |
| | |
|
|
| |
|
|
| |
|
|
|
Total investment income | | | 6,665,870 | | | | 4,399,963 | | | | 5,117,371 | |
| | |
|
|
| |
|
|
| |
|
|
|
EXPENSES: | | | | | | | | | | | | |
Investment advisory fees | | | 577,944 | | | | 866,006 | | | | 591,132 | |
Administrative service fees – Service Shares | | | 577,872 | | | | 617,888 | | | | 422,164 | |
Shareholder servicing fees – Service Shares | | | 231,149 | | | | 247,155 | | | | 168,866 | |
Administration fees | | | 39,978 | | | | 41,136 | | | | 19,153 | |
Reports to shareholders | | | 36,164 | | | | 48,341 | | | | 23,351 | |
Fund accounting fees | | | 30,470 | | | | 30,716 | | | | 18,457 | |
Legal fees | | | 27,630 | | | | 31,837 | | | | 11,710 | |
Trustee fees and expenses | | | 24,312 | | | | 24,953 | | | | 13,831 | |
Federal and state registration fees | | | 22,601 | | | | 19,307 | | | | 44,507 | |
Custody fees | | | 27,926 | | | | 21,723 | | | | 16,807 | |
Audit and tax fees | | | 8,420 | | | | 8,420 | | | | 7,992 | |
Compliance fees | | | 6,531 | | | | 6,745 | | | | 4,031 | |
Transfer agent fees and expenses | | | 6,743 | | | | 6,774 | | | | 4,639 | |
Insurance fees | | | 3,996 | | | | 3,965 | | | | 1,616 | |
Miscellaneous expenses | | | 731 | | | | 731 | | | | 640 | |
Interest expenses | | | 26,856 | | | | — | | | | 42,974 | |
| | |
|
|
| |
|
|
| |
|
|
|
Total expenses | | | 1,649,323 | | | | 1,975,697 | | | | 1,391,870 | |
| | |
|
|
| |
|
|
| |
|
|
|
Fees waived by the Advisor (See Note 4) | | | (314,257 | ) | | | — | | | | (275,043 | ) |
Less securities lending credit (See Note 6) | | | (268,012 | ) | | | (24,822 | ) | | | (145,033 | ) |
| | |
|
|
| |
|
|
| |
|
|
|
Net expenses | | | 1,067,054 | | | | 1,950,875 | | | | 971,794 | |
| | |
|
|
| |
|
|
| |
|
|
|
Net investment income | | | 5,598,816 | | | | 2,449,088 | | | | 4,145,577 | |
| | |
|
|
| |
|
|
| |
|
|
|
NET REALIZED AND UNREALIZED GAIN (LOSS) ON INVESTMENTS: | | | | | | | | | | | | |
Net realized gain (loss) on: | | | | | | | | | | | | |
Investments | | | (9,516,977 | ) | | | (26,454,798 | ) | | | (20,037,028 | ) |
Net long-term capital gain distributions received | | | 367,506 | | | | — | | | | 5,463 | |
| | |
|
|
| |
|
|
| |
|
|
|
Total | | | (9,149,471 | ) | | | (26,454,798 | ) | | | (20,031,565 | ) |
| | |
|
|
| |
|
|
| |
|
|
|
Net change in unrealized depreciation on: | | | | | | | | | | | | |
Investments | | | (63,492,412 | ) | | | (21,849,825 | ) | | | (13,771,239 | ) |
| | |
|
|
| |
|
|
| |
|
|
|
Total | | | (63,492,412 | ) | | | (21,849,825 | ) | | | (13,771,239 | ) |
| | |
|
|
| |
|
|
| |
|
|
|
Net realized and unrealized gain (loss) | | | (72,641,883 | ) | | | (48,304,623 | ) | | | (33,802,804 | ) |
| | |
|
|
| |
|
|
| |
|
|
|
NET INCREASE (DECREASE) IN NET ASSETS RESULTING FROM OPERATIONS | | $ | (67,043,067 | ) | | $ | (45,855,535 | ) | | $ | (29,657,227 | ) |
| | |
|
|
| |
|
|
| |
|
|
|
See notes to financial statements.
110
GuideMark Funds & GuidePath Funds
STATEMENTS OF OPERATIONS (Continued)
For the Period Ended September 30, 2022 (Unaudited)
| | | | | | | | | | | | |
| | | Multi-Asset
Income
Allocation
Fund
| | | Flexible
Income
Allocation
Fund
| | | Managed1
Futures
Strategy
Fund
| |
INVESTMENT INCOME: | | | | | | | | | | | | |
Dividend income | | $ | 2,100,499 | | | $ | 3,549,060 | | | $ | — | |
Interest income | | | 35,903 | | | | 165,025 | | | | 2,523,807 | |
| | |
|
|
| |
|
|
| |
|
|
|
Total investment income | | | 2,136,402 | | | | 3,714,085 | | | | 2,523,807 | |
| | |
|
|
| |
|
|
| |
|
|
|
EXPENSES: | | | | | | | | | | | | |
Investment advisory fees | | | 178,468 | | | | 421,948 | | | | 1,757,954 | |
Administrative service fees – Service Shares | | | 127,477 | | | | 421,939 | | | | 418,514 | |
Shareholder servicing fees – Service Shares | | | 50,991 | | | | 168,775 | | | | 167,406 | |
Administration fees | | | 8,629 | | | | 23,327 | | | | 19,190 | |
Reports to shareholders | | | 3,330 | | | | 15,470 | | | | 34,348 | |
Fund accounting fees | | | 6,526 | | | | 22,358 | | | | 27,337 | |
Legal fees | | | 6,129 | | | | 18,053 | | | | 17,229 | |
Trustee fees and expenses | | | 5,369 | | | | 17,175 | | | | 13,580 | |
Federal and state registration fees | | | 17,509 | | | | 33,029 | | | | 21,513 | |
Custody fees | | | 14,013 | | | | 14,038 | | | | 6,282 | |
Audit and tax fees | | | 7,992 | | | | 8,236 | | | | 16,716 | |
Compliance fees | | | 1,465 | | | | 4,669 | | | | 3,816 | |
Transfer agent fees and expenses | | | 2,380 | | | | 5,310 | | | | 4,579 | |
Insurance fees | | | 1,038 | | | | 2,562 | | | | 1,648 | |
Miscellaneous expenses | | | 519 | | | | 640 | | | | 579 | |
Interest expenses | | | 5,946 | | | | 7,019 | | | | — | |
| | |
|
|
| |
|
|
| |
|
|
|
Total expenses | | | 437,781 | | | | 1,184,548 | | | | 2,510,691 | |
| | |
|
|
| |
|
|
| |
|
|
|
Fees waived by the Advisor (See Note 4) | | | — | | | | (199,581 | ) | | | — | |
Less securities lending credit (See Note 6) | | | (135,990 | ) | | | (134,065 | ) | | | (268 | ) |
| | |
|
|
| |
|
|
| |
|
|
|
Net expenses | | | 301,791 | | | | 850,902 | | | | 2,510,423 | |
| | |
|
|
| |
|
|
| |
|
|
|
Net investment income | | | 1,834,611 | | | | 2,863,183 | | | | 13,384 | |
| | |
|
|
| |
|
|
| |
|
|
|
NET REALIZED AND UNREALIZED GAIN (LOSS) ON INVESTMENTS: | | | | | | | | | | | | |
Net realized gain (loss) on: | | | | | | | | | | | | |
Investments | | | (990,607 | ) | | | (34,517,682 | ) | | | (2,818 | ) |
Investments in affiliates | | | — | | | | 203,944 | | | | — | |
Foreign currencies | | | — | | | | — | | | | (833,634 | ) |
Forward currency contracts | | | — | | | | — | | | | 821,867 | |
Futures contracts | | | — | | | | — | | | | 68,066,678 | |
Net long-term capital gain distributions received | | | 328 | | | | 17,270 | | | | — | |
| | |
|
|
| |
|
|
| |
|
|
|
Total | | | (990,279 | ) | | | (34,296,468 | ) | | | 68,052,093 | |
| | |
|
|
| |
|
|
| |
|
|
|
Net change in unrealized appreciation (depreciation) on: | | | | | | | | | | | | |
Investments | | | (16,827,358 | ) | | | (4,748,328 | ) | | | (208,633 | ) |
Investments in affiliates | | | — | | | | 1,141,113 | | | | — | |
Foreign currencies | | | — | | | | — | | | | 197,660 | |
Forward currency contracts | | | — | | | | — | | | | 6,359,336 | |
Futures contracts | | | — | | | | — | | | | 14,824,438 | |
| | |
|
|
| |
|
|
| |
|
|
|
Total | | | (16,827,358 | ) | | | (3,607,215 | ) | | | 21,172,801 | |
| | |
|
|
| |
|
|
| |
|
|
|
Net realized and unrealized gain (loss) | | | (17,817,637 | ) | | | (37,903,683 | ) | | | 89,224,894 | |
| | |
|
|
| |
|
|
| |
|
|
|
NET INCREASE (DECREASE) IN NET ASSETS RESULTING FROM OPERATIONS | | $ | (15,983,026 | ) | | $ | (35,040,500 | ) | | $ | 89,238,278 | |
| | |
|
|
| |
|
|
| |
|
|
|
1Consolidated Statement of Operations for the year (see Note 3b). | | | | | | | | | | | | |
See notes to financial statements.
111
GuideMark Funds & GuidePath Funds
STATEMENTS OF OPERATIONS (Continued)
For the Period Ended September 30, 2022 (Unaudited)
| | | | | | | | | | | | |
| | | Conservative
Income
Fund
| | | Income
Fund
| | | Growth &
Income
Fund
| |
INVESTMENT INCOME: | | | | | | | | | | | | |
Dividend income | | $ | 122,790 | | | $ | 612,432 | | | $ | 1,191,699 | |
Interest income | | | 53,169 | | | | — | | | | 169,767 | |
| | |
|
|
| |
|
|
| |
|
|
|
Total investment income | | | 175,959 | | | | 612,432 | | | | 1,361,466 | |
| | |
|
|
| |
|
|
| |
|
|
|
EXPENSES: | | | | | | | | | | | | |
Investment advisory fees | | | 32,805 | | | | 123,836 | | | | 219,362 | |
Administrative service fees | | | 23,433 | | | | 68,798 | | | | 121,868 | |
Shareholder servicing fees | | | 52 | | | | 179 | | | | 440 | |
Reports to shareholders | | | 855 | | | | 976 | | | | 1,281 | |
Administration fees | | | 1,252 | | | | 3,570 | | | | 7,529 | |
Legal fees | | | 1,250 | | | | 3,263 | | | | 10,612 | |
Fund accounting fees | | | 1,160 | | | | 2,777 | | | | 7,012 | |
Trustee fees and expenses | | | 855 | | | | 2,532 | | | | 5,124 | |
Federal and state registration fees | | | 14,029 | | | | 14,914 | | | | 13,725 | |
Custody fees | | | 549 | | | | 1,465 | | | | 13,087 | |
Audit and tax fees | | | 7,992 | | | | 7,992 | | | | 10,768 | |
Transfer agent fees and expenses | | | 1,922 | | | | 2,106 | | | | 2,319 | |
Compliance fees | | | 183 | | | | 549 | | | | 1,067 | |
Insurance fees | | | 121 | | | | 274 | | | | 762 | |
Miscellaneous expenses | | | 244 | | | | 305 | | | | 305 | |
Interest expenses | | | — | | | | — | | | | 36,402 | |
| | |
|
|
| |
|
|
| |
|
|
|
Total expenses | | | 86,702 | | | | 233,536 | | | | 451,663 | |
| | |
|
|
| |
|
|
| |
|
|
|
Fees waived by the Advisor (See Note 4) | | | (16,163 | ) | | | (12,271 | ) | | | (2,958 | ) |
Fees recouped by the Advisor (See Note 4) | | | — | | | | 584 | | | | 8,730 | |
Less securities lending credit (See Note 6) | | | (10,552 | ) | | | (4,448 | ) | | | (35,931 | ) |
| | |
|
|
| |
|
|
| |
|
|
|
Net expenses | | | 59,987 | | | | 217,401 | | | | 421,504 | |
| | |
|
|
| |
|
|
| |
|
|
|
Net investment income | | | 115,972 | | | | 395,031 | | | | 939,962 | |
| | |
|
|
| |
|
|
| |
|
|
|
NET REALIZED AND UNREALIZED GAIN (LOSS) ON INVESTMENTS: | | | | | | | | | | | | |
Net realized gain (loss) on: | | | | | | | | | | | | |
Investments | | | (301,093 | ) | | | (2,605,846 | ) | | | 436,443 | |
Options written | | | — | | | | — | | | | (1,539,912 | ) |
Futures contracts | | | — | | | | — | | | | (469,254 | ) |
| | |
|
|
| |
|
|
| |
|
|
|
Total | | | (301,093 | ) | | | (2,605,846 | ) | | | (1,572,723 | ) |
| | |
|
|
| |
|
|
| |
|
|
|
Net change in unrealized appreciation (depreciation) on: | | | | | | | | | | | | |
Investments | | | (15,051 | ) | | | (3,146,137 | ) | | | (10,406,036 | ) |
Options written | | | — | | | | — | | | | (1,702,890 | ) |
Futures contracts | | | — | | | | — | | | | 802,234 | |
| | |
|
|
| |
|
|
| |
|
|
|
Total | | | (15,051 | ) | | | (3,146,137 | ) | | | (11,306,692 | ) |
| | |
|
|
| |
|
|
| |
|
|
|
Net realized and unrealized gain (loss) | | | (316,144 | ) | | | (5,751,983 | ) | | | (12,879,415 | ) |
| | |
|
|
| |
|
|
| |
|
|
|
NET INCREASE (DECREASE) IN NET ASSETS RESULTING FROM OPERATIONS | | $ | (200,172 | ) | | $ | (5,356,952 | ) | | $ | (11,939,453 | ) |
| | |
|
|
| |
|
|
| |
|
|
|
See notes to financial statements.
112
GuideMark Funds & GuidePath Funds
STATEMENTS OF CHANGES IN NET ASSETS
| | | | | | | | | | | | | | | | |
| | | Large Cap Core Fund
| | | Emerging Markets Fund
| |
| | | Period Ended
September 30,
2022
| | | Year Ended
March 31,
2022
| | | Period Ended
September 30,
2022
| | | Year Ended
March 31,
2022
| |
| | | (Unaudited) | | | | | | (Unaudited) | | | | |
OPERATIONS: | | | | | | | | | | | | | | | | |
Net investment income | | $ | 1,896,730 | | | $ | 2,272,053 | | | $ | 1,113,468 | | | $ | 1,217,861 | |
Net realized gain on investment transactions | | | 31,674,772 | | | | 33,586,242 | | | | 1,324,731 | | | | 8,873,790 | |
Net change in unrealized appreciation (depreciation) on investments | | | (162,842,345 | ) | | | 35,262,507 | | | | (16,886,395 | ) | | | (18,511,855 | ) |
| | |
|
|
| |
|
|
| |
|
|
| |
|
|
|
Net increase (decrease) in net assets resulting from operations | | | (129,270,843 | ) | | | 71,120,802 | | | | (14,448,196 | ) | | | (8,420,204 | ) |
| | |
|
|
| |
|
|
| |
|
|
| |
|
|
|
CAPITAL SHARE TRANSACTIONS: | | | | | | | | | | | | | | | | |
Institutional Shares | | | | | | | | | | | | | | | | |
Shares sold | | | 2,513 | | | | 68,056 | | | | — | | | | — | |
Shares issued to holders in reinvestment of dividends | | | — | | | | 11,114 | | | | — | | | | — | |
Shares redeemed | | | (192,141 | ) | | | (532,561 | ) | | | — | | | | — | |
| | |
|
|
| |
|
|
| |
|
|
| |
|
|
|
Net decrease | | | (189,628 | ) | | | (453,391 | ) | | | — | | | | — | |
| | |
|
|
| |
|
|
| |
|
|
| |
|
|
|
Service Shares | | | | | | | | | | | | | | | | |
Shares sold | | | 141,350,553 | | | | 184,811,275 | | | | 2,698,960 | | | | 12,108,881 | |
Shares issued to holders in reinvestment of dividends | | | — | | | | 21,862,003 | | | | — | | | | 7,603,555 | |
Shares redeemed | | | (232,015,164 | ) | | | (166,111,709 | ) | | | (15,430,675 | ) | | | (28,803,390 | ) |
| | |
|
|
| |
|
|
| |
|
|
| |
|
|
|
Net increase (decrease) | | | (90,664,611 | ) | | | 40,561,569 | | | | (12,731,715 | ) | | | (9,090,954 | ) |
| | |
|
|
| |
|
|
| |
|
|
| |
|
|
|
DIVIDENDS AND DISTRIBUTIONS TO SHAREHOLDERS: | | | | | | | | | | | | | | | | |
Net dividends and distributions – Institutional Shares | | | — | | | | (11,114 | ) | | | — | | | | — | |
Net dividends and distributions – Service Shares | | | — | | | | (21,862,004 | ) | | | — | | | | (7,604,672 | ) |
| | |
|
|
| |
|
|
| |
|
|
| |
|
|
|
Total dividends and distributions | | | — | | | | (21,873,118 | ) | | | — | | | | (7,604,672 | ) |
| | |
|
|
| |
|
|
| |
|
|
| |
|
|
|
INCREASE (DECREASE) IN NET ASSETS | | | (220,125,082 | ) | | | 89,355,862 | | | | (27,179,911 | ) | | | (25,115,830 | ) |
NET ASSETS: | | | | | | | | | | | | | | | | |
Beginning of year | | | 692,145,159 | | | | 602,789,297 | | | | 71,780,033 | | | | 96,895,863 | |
| | |
|
|
| |
|
|
| |
|
|
| |
|
|
|
End of year | | $ | 472,020,077 | | | $ | 692,145,159 | | | $ | 44,600,122 | | | $ | 71,780,033 | |
| | |
|
|
| |
|
|
| |
|
|
| |
|
|
|
CHANGES IN SHARES OUTSTANDING | | | | | | | | | | | | | | | | |
Institutional Shares | | | | | | | | | | | | | | | | |
Shares sold | | | 91 | | | | 2,293 | | | | — | | | | — | |
Shares issued to holders in reinvestment of dividends | | | — | | | | 356 | | | | — | | | | — | |
Shares redeemed | | | (7,078 | ) | | | (18,931 | ) | | | — | | | | — | |
| | |
|
|
| |
|
|
| |
|
|
| |
|
|
|
Net decrease | | | (6,987 | ) | | | (16,282 | ) | | | — | | | | — | |
| | |
|
|
| |
|
|
| |
|
|
| |
|
|
|
Service Shares | | | | | | | | | | | | | | | | |
Shares sold | | | 5,545,529 | | | | 6,340,347 | | | | 221,179 | | | | 768,538 | |
Shares issued to holders in reinvestment of dividends | | | — | | | | 710,405 | | | | — | | | | 522,653 | |
Shares redeemed | | | (8,965,321 | ) | | | (5,674,316 | ) | | | (1,249,651 | ) | | | (1,874,588 | ) |
| | |
|
|
| |
|
|
| |
|
|
| |
|
|
|
Net increase (decrease) | | | (3,419,792 | ) | | | 1,376,436 | | | | (1,028,472 | ) | | | (583,397 | ) |
| | |
|
|
| |
|
|
| |
|
|
| |
|
|
|
See notes to financial statements.
113
GuideMark Funds & GuidePath Funds
STATEMENTS OF CHANGES IN NET ASSETS (Continued)
| | | | | | | | | | | | | | | | |
| | | Small/Mid Cap Core Fund
| | | World ex-US Fund
| |
| | | Period Ended
September 30,
2022
| | | Year Ended
March 31,
2022
| | | Period Ended
September 30,
2022
| | | Year Ended
March 31,
2022
| |
| | | (Unaudited) | | | | | | (Unaudited) | | | | |
OPERATIONS: | | | | | | | | | | | | | | | | |
Net investment income | | $ | 256,147 | | | $ | 10,830 | | | $ | 1,598,431 | | | $ | 1,685,046 | |
Net realized gain on investment transactions | | | 1,566,703 | | | | 7,166,955 | | | | 2,073,516 | | | | 6,684,551 | |
Net change in unrealized depreciation on investments | | | (23,360,968 | ) | | | (6,144,525 | ) | | | (29,677,615 | ) | | | (8,039,202 | ) |
| | |
|
|
| |
|
|
| |
|
|
| |
|
|
|
Net increase (decrease) in net assets resulting from operations | | | (21,538,118 | ) | | | 1,033,260 | | | | (26,005,668 | ) | | | 330,395 | |
| | |
|
|
| |
|
|
| |
|
|
| |
|
|
|
CAPITAL SHARE TRANSACTIONS: | | | | | | | | | | | | | | | | |
Institutional Shares | | | | | | | | | | | | | | | | |
Shares sold | | | — | | | | — | | | | 147 | | | | 12,233 | |
Shares issued to holders in reinvestment of dividends | | | — | | | | — | | | | — | | | | 741 | |
Shares redeemed | | | — | | | | — | | | | (26,154 | ) | | | (72,840 | ) |
| | |
|
|
| |
|
|
| |
|
|
| |
|
|
|
Net decrease | | | — | | | | — | | | | (26,007 | ) | | | (59,866 | ) |
| | |
|
|
| |
|
|
| |
|
|
| |
|
|
|
Service Shares | | | | | | | | | | | | | | | | |
Shares sold | | | 15,326,010 | | | | 40,939,693 | | | | 20,150,826 | | | | 23,919,033 | |
Shares issued to holders in reinvestment of dividends | | | — | | | | 12,188,589 | | | | — | | | | 1,529,269 | |
Shares redeemed | | | (12,856,562 | ) | | | (27,623,574 | ) | | | (34,213,573 | ) | | | (37,238,743 | ) |
| | |
|
|
| |
|
|
| |
|
|
| |
|
|
|
Net increase (decrease) | | | 2,469,448 | | | | 25,504,708 | | | | (14,062,747 | ) | | | (11,790,441 | ) |
| | |
|
|
| |
|
|
| |
|
|
| |
|
|
|
DIVIDENDS AND DISTRIBUTIONS TO SHAREHOLDERS: | | | | | | | | | | | | | | | | |
Net dividends and distributions – Institutional Shares | | | — | | | | — | | | | — | | | | (741 | ) |
Net dividends and distributions – Service Shares | | | — | | | | (12,188,589 | ) | | | — | | | | (1,529,272 | ) |
| | |
|
|
| |
|
|
| |
|
|
| |
|
|
|
Total dividends and distributions | | | — | | | | (12,188,589 | ) | | | — | | | | (1,530,013 | ) |
| | |
|
|
| |
|
|
| |
|
|
| |
|
|
|
INCREASE (DECREASE) IN NET ASSETS | | | (19,068,670 | ) | | | 14,349,379 | | | | (40,094,422 | ) | | | (13,049,925 | ) |
NET ASSETS: | | | | | | | | | | | | | | | | |
Beginning of year | | | 107,105,729 | | | | 92,756,350 | | | | 125,062,085 | | | | 138,112,010 | |
| | |
|
|
| |
|
|
| |
|
|
| |
|
|
|
End of year | | $ | 88,037,059 | | | $ | 107,105,729 | | | $ | 84,967,663 | | | $ | 125,062,085 | |
| | |
|
|
| |
|
|
| |
|
|
| |
|
|
|
CHANGES IN SHARES OUTSTANDING | | | | | | | | | | | | | | | | |
Institutional Shares | | | | | | | | | | | | | | | | |
Shares sold | | | — | | | | — | | | | 16 | | | | 1,069 | |
Shares issued to holders in reinvestment of dividends | | | — | | | | — | | | | — | | | | 64 | |
Shares redeemed | | | — | | | | — | | | | (2,653 | ) | | | (6,671 | ) |
| | |
|
|
| |
|
|
| |
|
|
| |
|
|
|
Net decrease | | | — | | | | — | | | | (2,637 | ) | | | (5,538 | ) |
| | |
|
|
| |
|
|
| |
|
|
| |
|
|
|
Service Shares | | | | | | | | | | | | | | | | |
Shares sold | | | 886,571 | | | | 1,921,507 | | | | 2,252,064 | | | | 2,184,015 | |
Shares issued to holders in reinvestment of dividends | | | — | | | | 595,117 | | | | — | | | | 136,945 | |
Shares redeemed | | | (745,957 | ) | | | (1,318,150 | ) | | | (3,664,920 | ) | | | (3,403,084 | ) |
| | |
|
|
| |
|
|
| |
|
|
| |
|
|
|
Net increase (decrease) | | | 140,614 | | | | 1,198,474 | | | | (1,412,856 | ) | | | (1,082,124 | ) |
| | |
|
|
| |
|
|
| |
|
|
| |
|
|
|
See notes to financial statements.
114
GuideMark Funds & GuidePath Funds
STATEMENTS OF CHANGES IN NET ASSETS (Continued)
| | | | | | | | | | | | | | | | |
| | | Core Fixed Income Fund
| | | Growth Allocation Fund
| |
| | | Period Ended
September 30,
2022
| | | Year Ended
March 31,
2022
| | | Period Ended
September 30,
2022
| | | Year Ended
March 31,
2022
| |
| | | (Unaudited) | | | | | | (Unaudited) | | | | |
OPERATIONS: | | | | | | | | | | | | | | | | |
Net investment income | | $ | 1,863,289 | | | $ | 2,243,841 | | | $ | 3,766,179 | | | $ | 8,821,839 | |
Net realized gain (loss) on investment transactions | | | (6,996,970 | ) | | | (23,486 | ) | | | (8,236,729 | ) | | | 47,296,585 | |
Net change in unrealized appreciation (depreciation) on investments | | | (16,147,170 | ) | | | (12,718,312 | ) | | | (236,284,584 | ) | | | (272,220 | ) |
| | |
|
|
| |
|
|
| |
|
|
| |
|
|
|
Net increase (decrease) in net assets resulting from operations | | | (21,280,851 | ) | | | (10,497,957 | ) | | | (240,755,134 | ) | | | 55,846,204 | |
| | |
|
|
| |
|
|
| |
|
|
| |
|
|
|
CAPITAL SHARE TRANSACTIONS: | | | | | | | | | | | | | | | | |
Institutional Shares | | | | | | | | | | | | | | | | |
Shares sold | | | — | | | | — | | | | 24,728 | | | | 366,994 | |
Shares issued to holders in reinvestment of dividends | | | — | | | | — | | | | — | | | | 37,028 | |
Shares redeemed | | | — | | | | — | | | | (757,103 | ) | | | (2,541,121 | ) |
| | |
|
|
| |
|
|
| |
|
|
| |
|
|
|
Net decrease | | | — | | | | — | | | | (732,375 | ) | | | (2,137,099 | ) |
| | |
|
|
| |
|
|
| |
|
|
| |
|
|
|
Service Shares | | | | | | | | | | | | | | | | |
Shares sold | | | 28,155,429 | | | | 77,062,970 | | | | 149,079,725 | | | | 246,731,954 | |
Shares issued to holders in reinvestment of dividends | | | 2,273,819 | | | | 4,697,207 | | | | — | | | | 32,026,349 | |
Shares redeemed | | | (29,530,835 | ) | | | (54,038,488 | ) | | | (214,793,953 | ) | | | (241,243,938 | ) |
| | |
|
|
| |
|
|
| |
|
|
| |
|
|
|
Net increase (decrease) | | | 898,413 | | | | 27,721,689 | | | | (65,714,228 | ) | | | 37,514,365 | |
| | |
|
|
| |
|
|
| |
|
|
| |
|
|
|
DIVIDENDS AND DISTRIBUTIONS TO SHAREHOLDERS: | | | | | | | | | | | | | | | | |
Net dividends and distributions – Institutional Shares | | | — | | | | — | | | | — | | | | (37,028 | ) |
Net dividends and distributions – Service Shares | | | (2,273,831 | ) | | | (4,697,233 | ) | | | — | | | | (32,026,349 | ) |
| | |
|
|
| |
|
|
| |
|
|
| |
|
|
|
Total dividends and distributions | | | (2,273,831 | ) | | | (4,697,233 | ) | | | — | | | | (32,063,377 | ) |
| | |
|
|
| |
|
|
| |
|
|
| |
|
|
|
INCREASE (DECREASE) IN NET ASSETS | | | (22,656,269 | ) | | | 12,526,499 | | | | (307,201,737 | ) | | | 59,160,093 | |
NET ASSETS: | | | | | | | | | | | | | | | | |
Beginning of year | | | 200,560,432 | | | | 188,033,933 | | | | 1,137,283,035 | | | | 1,078,122,942 | |
| | |
|
|
| |
|
|
| |
|
|
| |
|
|
|
End of year | | $ | 177,904,163 | | | $ | 200,560,432 | | | $ | 830,081,298 | | | $ | 1,137,283,035 | |
| | |
|
|
| |
|
|
| |
|
|
| |
|
|
|
CHANGES IN SHARES OUTSTANDING | | | | | | | | | | | | | | | | |
Institutional Shares | | | | | | | | | | | | | | | | |
Shares sold | | | — | | | | — | | | | 1,624 | | | | 21,781 | |
Shares issued to holders in reinvestment of dividends | | | — | | | | — | | | | — | | | | 2,115 | |
Shares redeemed | | | — | | | | — | | | | (50,994 | ) | | | (157,429 | ) |
| | |
|
|
| |
|
|
| |
|
|
| |
|
|
|
Net decrease | | | — | | | | — | | | | (49,370 | ) | | | (133,533 | ) |
| | |
|
|
| |
|
|
| |
|
|
| |
|
|
|
Service Shares | | | | | | | | | | | | | | | | |
Shares sold | | | 3,290,144 | | | | 7,992,605 | | | | 10,541,708 | | | | 14,795,143 | |
Shares issued to holders in reinvestment of dividends | | | 275,562 | | | | 488,605 | | | | — | | | | 1,846,218 | |
Shares redeemed | | | (3,474,854 | ) | | | (5,603,826 | ) | | | (15,051,055 | ) | | | (14,505,542 | ) |
| | |
|
|
| |
|
|
| |
|
|
| |
|
|
|
Net increase (decrease) | | | 90,852 | | | | 2,877,384 | | | | (4,509,347 | ) | | | 2,135,819 | |
| | |
|
|
| |
|
|
| |
|
|
| |
|
|
|
See notes to financial statements.
115
GuideMark Funds & GuidePath Funds
STATEMENTS OF CHANGES IN NET ASSETS (Continued)
| | | | | | | | | | | | | | | | |
| | | Conservative Allocation Fund
| | | Tactical Allocation Fund
| |
| | | Period Ended
September 30,
2022
| | | Year Ended
March 31,
2022
| | | Period Ended
September 30,
2022
| | | Year Ended
March 31,
2022
| |
| | | (Unaudited) | | | | | | (Unaudited) | | | | |
OPERATIONS: | | | | | | | | | | | | | | | | |
Net investment income | | $ | 5,598,816 | | | $ | 9,061,342 | | | $ | 2,449,088 | | | $ | 1,976,066 | |
Net realized gain (loss) on investment transactions | | | (9,149,471 | ) | | | 9,055,589 | | | | (26,454,798 | ) | | | 69,033,903 | |
Net change in unrealized depreciation on investments | | | (63,492,412 | ) | | | (6,618,739 | ) | | | (21,849,825 | ) | | | (22,265,126 | ) |
| | |
|
|
| |
|
|
| |
|
|
| |
|
|
|
Net increase (decrease) in net assets resulting from operations | | | (67,043,067 | ) | | | 11,498,192 | | | | (45,855,535 | ) | | | 48,744,843 | |
| | |
|
|
| |
|
|
| |
|
|
| |
|
|
|
CAPITAL SHARE TRANSACTIONS: | | | | | | | | | | | | | | | | |
Institutional Shares | | | | | | | | | | | | | | | | |
Shares sold | | | 6,140 | | | | 142,707 | | | | 31,799 | | | | 128,879 | |
Shares issued to holders in reinvestment of dividends | | | — | | | | 19,960 | | | | — | | | | 95,752 | |
Shares redeemed | | | (267,848 | ) | | | (1,163,521 | ) | | | (270,288 | ) | | | (744,369 | ) |
| | |
|
|
| |
|
|
| |
|
|
| |
|
|
|
Net decrease | | | (261,708 | ) | | | (1,000,854 | ) | | | (238,489 | ) | | | (519,738 | ) |
| | |
|
|
| |
|
|
| |
|
|
| |
|
|
|
Service Shares | | | | | | | | | | | | | | | | |
Shares sold | | | 61,171,379 | | | | 143,881,416 | | | | 56,711,461 | | | | 110,745,122 | |
Shares issued to holders in reinvestment of dividends | | | — | | | | 17,723,039 | | | | — | | | | 49,222,037 | |
Shares redeemed | | | (124,538,630 | ) | | | (106,687,033 | ) | | | (61,601,151 | ) | | | (110,078,244 | ) |
| | |
|
|
| |
|
|
| |
|
|
| |
|
|
|
Net increase (decrease) | | | (63,367,251 | ) | | | 54,917,422 | | | | (4,889,690 | ) | | | 49,888,915 | |
| | |
|
|
| |
|
|
| |
|
|
| |
|
|
|
DIVIDENDS AND DISTRIBUTIONS TO SHAREHOLDERS: | | | | | | | | | | | | | | | | |
Net dividends and distributions – Institutional Shares | | | — | | | | (19,960 | ) | | | — | | | | (95,752 | ) |
Net dividends and distributions – Service Shares | | | — | | | | (17,723,039 | ) | | | — | | | | (49,222,036 | ) |
| | |
|
|
| |
|
|
| |
|
|
| |
|
|
|
Total dividends and distributions | | | — | | | | (17,742,999 | ) | | | — | | | | (49,317,788 | ) |
| | |
|
|
| |
|
|
| |
|
|
| |
|
|
|
INCREASE (DECREASE) IN NET ASSETS | | | (130,672,026 | ) | | | 47,671,761 | | | | (50,983,714 | ) | | | 48,796,232 | |
NET ASSETS: | | | | | | | | | | | | | | | | |
Beginning of year | | | 510,082,722 | | | | 462,410,961 | | | | 519,412,947 | | | | 470,616,715 | |
| | |
|
|
| |
|
|
| |
|
|
| |
|
|
|
End of year | | $ | 379,410,696 | | | $ | 510,082,722 | | | $ | 468,429,233 | | | $ | 519,412,947 | |
| | |
|
|
| |
|
|
| |
|
|
| |
|
|
|
CHANGES IN SHARES OUTSTANDING | | | | | | | | | | | | | | | | |
Institutional Shares | | | | | | | | | | | | | | | | |
Shares sold | | | 588 | | | | 12,238 | | | | 2,888 | | | | 10,641 | |
Shares issued to holders in reinvestment of dividends | | | — | | | | 1,726 | | | | — | | | | 8,163 | |
Shares redeemed | | | (25,517 | ) | | | (103,371 | ) | | | (24,304 | ) | | | (63,755 | ) |
| | |
|
|
| |
|
|
| |
|
|
| |
|
|
|
Net decrease | | | (24,929 | ) | | | (89,407 | ) | | | (21,416 | ) | | | (44,951 | ) |
| | |
|
|
| |
|
|
| |
|
|
| |
|
|
|
Service Shares | | | | | | | | | | | | | | | | |
Shares sold | | | 5,944,185 | | | | 12,598,971 | | | | 5,163,531 | | | | 9,337,653 | |
Shares issued to holders in reinvestment of dividends | | | — | | | | 1,544,088 | | | | — | | | | 4,229,060 | |
Shares redeemed | | | (12,110,662 | ) | | | (9,358,518 | ) | | | (5,642,885 | ) | | | (9,261,795 | ) |
| | |
|
|
| |
|
|
| |
|
|
| |
|
|
|
Net increase | | | (6,166,477 | ) | | | 4,784,541 | | | | (479,354 | ) | | | 4,304,918 | |
| | |
|
|
| |
|
|
| |
|
|
| |
|
|
|
See notes to financial statements.
116
GuideMark Funds & GuidePath Funds
STATEMENTS OF CHANGES IN NET ASSETS (Continued)
| | | | | | | | | | | | | | | | |
| | | Absolute Return
Allocation Fund
| | | Multi-Asset Income
Allocation Fund
| |
| | | Period Ended
September 30,
2022
| | | Year Ended
March 31,
2022
| | | Period Ended
September 30,
2022
| | | Year Ended
March 31,
2022
| |
| | | (Unaudited) | | | | | | (Unaudited) | | | | |
OPERATIONS: | | | | | | | | | | | | | | | | |
Net investment income | | $ | 4,145,577 | | | $ | 4,759,974 | | | $ | 1,834,611 | | | $ | 3,325,148 | |
Net realized gain (loss) on investment transactions | | | (20,031,565 | ) | | | 1,198,754 | | | | (990,279 | ) | | | 4,292,287 | |
Net change in unrealized depreciation on investments | | | (13,771,239 | ) | | | (12,428,090 | ) | | | (16,827,358 | ) | | | (3,308,389 | ) |
| | |
|
|
| |
|
|
| |
|
|
| |
|
|
|
Net increase (decrease) in net assets resulting from operations | | | (29,657,227 | ) | | | (6,469,362 | ) | | | (15,983,026 | ) | | | 4,309,046 | |
| | |
|
|
| |
|
|
| |
|
|
| |
|
|
|
CAPITAL SHARE TRANSACTIONS: | | | | | | | | | | | | | | | | |
Institutional Shares | | | | | | | | | | | | | | | | |
Shares sold | | | 5,188 | | | | 77,360 | | | | — | | | | — | |
Shares issued to holders in reinvestment of dividends | | | — | | | | 7,241 | | | | — | | | | — | |
Shares redeemed | | | (202,020 | ) | | | (316,904 | ) | | | — | | | | — | |
| | |
|
|
| |
|
|
| |
|
|
| |
|
|
|
Net decrease | | | (196,832 | ) | | | (232,303 | ) | | | — | | | | — | |
| | |
|
|
| |
|
|
| |
|
|
| |
|
|
|
Service Shares | | | | | | | | | | | | | | | | |
Shares sold | | | 285,061,237 | | | | 91,788,044 | | | | 12,264,593 | | | | 19,831,921 | |
Shares issued to holders in reinvestment of dividends | | | — | | | | 4,472,150 | | | | 1,999,620 | | | | 3,347,756 | |
Shares redeemed | | | (156,965,610 | ) | | | (61,979,678 | ) | | | (26,224,468 | ) | | | (45,073,938 | ) |
| | |
|
|
| |
|
|
| |
|
|
| |
|
|
|
Net increase (decrease) | | | 128,095,627 | | | | 34,280,516 | | | | (11,960,255 | ) | | | (21,894,261 | ) |
| | |
|
|
| |
|
|
| |
|
|
| |
|
|
|
DIVIDENDS AND DISTRIBUTIONS TO SHAREHOLDERS: | | | | | | | | | | | | | | | | |
Net dividends and distributions – Institutional Shares | | | — | | | | (7,241 | ) | | | — | | | | — | |
Net dividends and distributions – Service Shares | | | — | | | | (4,472,150 | ) | | | (1,999,620 | ) | | | (3,347,756 | ) |
| | |
|
|
| |
|
|
| |
|
|
| |
|
|
|
Total dividends and distributions | | | — | | | | (4,479,391 | ) | | | (1,999,620 | ) | | | (3,347,756 | ) |
| | |
|
|
| |
|
|
| |
|
|
| |
|
|
|
INCREASE (DECREASE) IN NET ASSETS | | | 98,241,568 | | | | 23,099,460 | | | | (29,942,901 | ) | | | (20,932,971 | ) |
NET ASSETS: | | | | | | | | | | | | | | | | |
Beginning of year | | | 236,232,395 | | | | 213,132,935 | | | | 111,888,042 | | | | 132,821,013 | |
| | |
|
|
| |
|
|
| |
|
|
| |
|
|
|
End of year | | $ | 334,473,963 | | | $ | 236,232,395 | | | $ | 81,945,141 | | | $ | 111,888,042 | |
| | |
|
|
| |
|
|
| |
|
|
| |
|
|
|
CHANGES IN SHARES OUTSTANDING | | | | | | | | | | | | | | | | |
Institutional Shares | | | | | | | | | | | | | | | | |
Shares sold | | | 541 | | | | 7,268 | | | | — | | | | — | |
Shares issued to holders in reinvestment of dividends | | | — | | | | 690 | | | | — | | | | — | |
Shares redeemed | | | (20,721 | ) | | | (30,333 | ) | | | — | | | | — | |
| | |
|
|
| |
|
|
| |
|
|
| |
|
|
|
Net decrease | | | (20,180 | ) | | | (22,375 | ) | | | — | | | | — | |
| | |
|
|
| |
|
|
| |
|
|
| |
|
|
|
CHANGES IN SHARES OUTSTANDING | | | | | | | | | | | | | | | | |
Service Shares | | | | | | | | | | | | | | | | |
Shares sold | | | 29,359,465 | | | | 8,737,172 | | | | 1,167,160 | | | | 1,705,565 | |
Shares issued to holders in reinvestment of dividends | | | — | | | | 424,585 | | | | 200,112 | | | | 285,830 | |
Shares redeemed | | | (16,480,662 | ) | | | (5,853,630 | ) | | | (2,500,889 | ) | | | (3,873,950 | ) |
| | |
|
|
| |
|
|
| |
|
|
| |
|
|
|
Net increase (decrease) | | | 12,878,803 | | | | 3,308,127 | | | | (1,133,617 | ) | | | (1,882,555 | ) |
| | |
|
|
| |
|
|
| |
|
|
| |
|
|
|
See notes to financial statements.
117
GuideMark Funds & GuidePath Funds
STATEMENTS OF CHANGES IN NET ASSETS (Continued)
| | | | | | | | | | | | | | | | |
| | | Flexible Income
Allocation Fund
| | | Managed Futures
Strategy Fund1
| |
| | | Period Ended
September 30,
2022
| | | Year Ended
March 31,
2022
| | | Period Ended
September 30,
2022
| | | Year Ended
March 31,
2022
| |
| | | (Unaudited) | | | | | | (Unaudited) | | | | |
OPERATIONS: | | | | | | | | | | | | | | | | |
Net investment income (loss) | | $ | 2,863,183 | | | $ | 6,467,892 | | | $ | 13,384 | | | $ | (3,161,620 | ) |
Net realized gain (loss) on investment transactions | | | (34,296,468 | ) | | | 1,219,012 | | | | 68,052,093 | | | | 27,516,644 | |
Net change in unrealized appreciation (depreciation) on investments | | | (3,607,215 | ) | | | (17,128,034 | ) | | | 21,172,801 | | | | 11,567,031 | |
| | |
|
|
| |
|
|
| |
|
|
| |
|
|
|
Net increase (decrease) in net assets resulting from operations | | | (35,040,500 | ) | | | (9,441,130 | ) | | | 89,238,278 | | | | 35,922,055 | |
| | |
|
|
| |
|
|
| |
|
|
| |
|
|
|
CAPITAL SHARE TRANSACTIONS: | | | | | | | | | | | | | | | | |
Institutional Shares | | | | | | | | | | | | | | | | |
Shares sold | | | 1,097 | | | | 1,684 | | | | 137 | | | | 86,012 | |
Shares issued to holders in reinvestment of dividends | | | 78 | | | | 239 | | | | — | | | | 25,077 | |
Shares redeemed | | | (1,275 | ) | | | (638 | ) | | | (192,016 | ) | | | (438,693 | ) |
| | |
|
|
| |
|
|
| |
|
|
| |
|
|
|
Net increase (decrease) | | | (100 | ) | | | 1,285 | | | | (191,879 | ) | | | (327,604 | ) |
| | |
|
|
| |
|
|
| |
|
|
| |
|
|
|
Service Shares | | | | | | | | | | | | | | | | |
Shares sold | | | 78,167,908 | | | | 188,621,759 | | | | 336,888,766 | | | | 71,484,905 | |
Shares issued to holders in reinvestment of dividends | | | 2,854,087 | | | | 8,321,885 | | | | — | | | | 19,330,980 | |
Shares redeemed | | | (84,396,177 | ) | | | (111,252,166 | ) | | | (105,087,125 | ) | | | (63,742,265 | ) |
| | |
|
|
| |
|
|
| |
|
|
| |
|
|
|
Net increase (decrease) | | | (3,374,182 | ) | | | 85,691,478 | | | | 231,801,641 | | | | 27,073,620 | |
| | |
|
|
| |
|
|
| |
|
|
| |
|
|
|
DIVIDENDS AND DISTRIBUTIONS TO SHAREHOLDERS: | | | | | | | | | | | | | | | | |
Net dividends and distributions – Institutional Shares | | | (78 | ) | | | (239 | ) | | | — | | | | (25,078 | ) |
Net dividends and distributions – Service Shares | | | (2,854,087 | ) | | | (8,321,884 | ) | | | — | | | | (19,330,980 | ) |
| | |
|
|
| |
|
|
| |
|
|
| |
|
|
|
Total dividends and distributions | | | (2,854,165 | ) | | | (8,322,123 | ) | | | — | | | | (19,356,058 | ) |
| | |
|
|
| |
|
|
| |
|
|
| |
|
|
|
INCREASE (DECREASE) IN NET ASSETS | | | (41,268,947 | ) | | | 67,929,510 | | | | 320,848,040 | | | | 43,312,013 | |
NET ASSETS: | | | | | | | | | | | | | | | | |
Beginning of year | | | 347,775,373 | | | | 279,845,863 | | | | 251,449,201 | | | | 208,137,188 | |
| | |
|
|
| |
|
|
| |
|
|
| |
|
|
|
End of year | | $ | 306,506,426 | | | $ | 347,775,373 | | | $ | 572,297,241 | | | $ | 251,449,201 | |
| | |
|
|
| |
|
|
| |
|
|
| |
|
|
|
CHANGES IN SHARES OUTSTANDING | | | | | | | | | | | | | | | | |
Institutional Shares | | | | | | | | | | | | | | | | |
Shares sold | | | 116 | | | | 158 | | | | 13 | | | | 8,939 | |
Shares issued to holders in reinvestment of dividends | | | 8 | | | | 22 | | | | — | | | | 2,894 | |
Shares redeemed | | | (131 | ) | | | (59 | ) | | | (17,033 | ) | | | (45,310 | ) |
| | |
|
|
| |
|
|
| |
|
|
| |
|
|
|
Net increase (decrease) | | | (7 | ) | | | 121 | | | | (17,020 | ) | | | (33,477 | ) |
| | |
|
|
| |
|
|
| |
|
|
| |
|
|
|
CHANGES IN SHARES OUTSTANDING | | | | | | | | | | | | | | | | |
Service Shares | | | | | | | | | | | | | | | | |
Shares sold | | | 8,223,947 | | | | 17,984,644 | | | | 30,275,308 | | | | 7,704,764 | |
Shares issued to holders in reinvestment of dividends | | | 311,904 | | | | 787,857 | | | | — | | | | 2,283,366 | |
Shares redeemed | | | (8,910,345 | ) | | | (10,621,780 | ) | | | (9,503,021 | ) | | | (6,994,195 | ) |
| | |
|
|
| |
|
|
| |
|
|
| |
|
|
|
Net increase (decrease) | | | (374,494 | ) | | | 8,150,721 | | | | 20,772,287 | | | | 2,993,935 | |
| | |
|
|
| |
|
|
| |
|
|
| |
|
|
|
1Consolidated Statements of Changes in Net Assets (see note 3b).
See notes to financial statements.
118
GuideMark Funds & GuidePath Funds
STATEMENTS OF CHANGES IN NET ASSETS (Continued)
| | | | | | | | | | | | | | | | |
| | | Conservative Income Fund
| | | Income Fund
| |
| | | Period Ended
September 30,
2022
| | | Year Ended
March 31,
2022
| | | Period Ended
September 30,
2022
| | | Year Ended
March 31,
2022
| |
| | | (Unaudited) | | | | | | (Unaudited) | | | | |
OPERATIONS: | | | | | | | | | | | | | | | | |
Net investment income | | $ | 115,972 | | | $ | 69,869 | | | $ | 395,031 | | | $ | 920,118 | |
Net realized loss on investment transactions | | | (301,093 | ) | | | (92,583 | ) | | | (2,605,846 | ) | | | (2,118,319 | ) |
Net change in unrealized depreciation on investments | | | (15,051 | ) | | | (102,101 | ) | | | (3,146,137 | ) | | | (1,507,377 | ) |
| | |
|
|
| |
|
|
| |
|
|
| |
|
|
|
Net decrease in net assets resulting from operations | | | (200,172 | ) | | | (124,815 | ) | | | (5,356,952 | ) | | | (2,705,578 | ) |
| | |
|
|
| |
|
|
| |
|
|
| |
|
|
|
CAPITAL SHARE TRANSACTIONS: | | | | | | | | | | | | | | | | |
Shares sold | | | 13,135,966 | | | | 6,864,164 | | | | 19,867,625 | | | | 14,999,784 | |
Shares issued to holders in reinvestment of dividends | | | 113,643 | | | | 76,343 | | | | 412,412 | | | | 918,443 | |
Shares redeemed | | | (7,073,776 | ) | | | (11,753,692 | ) | | | (5,400,286 | ) | | | (5,855,535 | ) |
| | |
|
|
| |
|
|
| |
|
|
| |
|
|
|
Net increase (decrease) | | | 6,175,833 | | | | (4,813,185 | ) | | | 14,879,751 | | | | 10,062,692 | |
| | |
|
|
| |
|
|
| |
|
|
| |
|
|
|
DIVIDENDS AND DISTRIBUTIONS TO SHAREHOLDERS: | | | | | | | | | | | | | | | | |
Net dividends and distributions | | | (113,643 | ) | | | 76,343 | | | | (412,412 | ) | | | (918,444 | ) |
| | |
|
|
| |
|
|
| |
|
|
| |
|
|
|
Total dividends and distributions | | | (113,643 | ) | | | 76,343 | | | | (412,412 | ) | | | (918,444 | ) |
| | |
|
|
| |
|
|
| |
|
|
| |
|
|
|
INCREASE (DECREASE) IN NET ASSETS | | | 5,862,018 | | | | (5,014,343 | ) | | | 9,110,387 | | | | 6,438,670 | |
NET ASSETS: | | | | | | | | | | | | | | | | |
Beginning of year | | | 10,911,849 | | | | 15,926,192 | | | | 44,470,391 | | | | 38,031,721 | |
| | |
|
|
| |
|
|
| |
|
|
| |
|
|
|
End of year | | $ | 16,773,867 | | | $ | 10,911,849 | | | $ | 53,580,778 | | | $ | 44,470,391 | |
| | |
|
|
| |
|
|
| |
|
|
| |
|
|
|
CHANGES IN SHARES OUTSTANDING | | | | | | | | | | | | | | | | |
Shares sold | | | 1,346,685 | | | | 692,076 | | | | 2,206,403 | | | | 1,509,807 | |
Shares issued to holders in reinvestment of dividends | | | 11,741 | | | | 7,690 | | | | 47,392 | | | | 92,304 | |
Shares redeemed | | | (728,264 | ) | | | (1,186,080 | ) | | | (615,123 | ) | | | (592,617 | ) |
| | |
|
|
| |
|
|
| |
|
|
| |
|
|
|
Net increase (decrease) | | | 630,162 | | | | (486,314 | ) | | | 1,638,672 | | | | 1,009,494 | |
| | |
|
|
| |
|
|
| |
|
|
| |
|
|
|
See notes to financial statements.
119
GuideMark Funds & GuidePath Funds
STATEMENTS OF CHANGES IN NET ASSETS (Continued)
| | | | | | | | |
| | | Growth & Income Fund
| |
| | | Period Ended
September 30,
2022
| | | Year Ended
March 31,
2022
| |
| | | (Unaudited) | | | | |
OPERATIONS: | | | | | | | | |
Net investment income | | $ | 939,962 | | | $ | 985,853 | |
Net realized gain (loss) on investment transactions | | | (1,572,723 | ) | | | 3,574,209 | |
Net change in unrealized appreciation (depreciation) on investments | | | (11,306,692 | ) | | | 2,729,306 | |
| | |
|
|
| |
|
|
|
Net increase (decrease) in net assets resulting from operations | | | (11,939,453 | ) | | | 7,289,368 | |
| | |
|
|
| |
|
|
|
CAPITAL SHARE TRANSACTIONS: | | | | | | | | |
Shares sold | | | 17,682,068 | | | | 33,406,696 | |
Shares issued to holders in reinvestment of dividends | | | 921,508 | | | | 15,108,720 | |
Shares redeemed | | | (29,194,467 | ) | | | (10,695,867 | ) |
| | |
|
|
| |
|
|
|
Net increase (decrease) | | | (10,590,891 | ) | | | 37,819,549 | |
| | |
|
|
| |
|
|
|
DIVIDENDS AND DISTRIBUTIONS TO SHAREHOLDERS: | | | | | | | | |
Net dividends and distributions | | | (921,508 | ) | | | (15,108,720 | ) |
| | |
|
|
| |
|
|
|
Total dividends and distributions | | | (921,508 | ) | | | (15,108,720 | ) |
| | |
|
|
| |
|
|
|
INCREASE (DECREASE) IN NET ASSETS | | | (23,451,852 | ) | | | 30,000,197 | |
NET ASSETS: | | | | | | | | |
Beginning of year | | | 116,833,573 | | | | 86,833,376 | |
| | |
|
|
| |
|
|
|
End of year | | $ | 93,381,721 | | | $ | 116,833,573 | |
| | |
|
|
| |
|
|
|
CHANGES IN SHARES OUTSTANDING | | | | | | | | |
Shares sold | | | 1,681,110 | | | | 2,763,459 | |
Shares issued to holders in reinvestment of dividends | | | 90,447 | | | | 1,297,682 | |
Shares redeemed | | | (2,686,353 | ) | | | (894,613 | ) |
| | |
|
|
| |
|
|
|
Net increase (decrease) | | | (914,796 | ) | | | 3,166,528 | |
| | |
|
|
| |
|
|
|
See notes to financial statements.
120
GuideMark Funds & GuidePath Funds
FINANCIAL HIGHLIGHTS
| | | | | | | | | | | | | | | | | | | | | | | | |
| | | Large Cap Core Fund
| |
| | | Institutional
| |
| | | Period Ended
September 30,
2022
| | | Year Ended
March 31,
2022
| | | Year Ended
March 31,
2021
| | | Year Ended
March 31,
2020
| | | Year Ended
March 31,
2019
| | | Year Ended
March 31,
2018
| |
| | | (Unaudited) | | | | | | | | | | | | | | | | |
Per share data for a share of capital stock outstanding for the entire period/year and selected information for the period/year are as follows: | | | | | | | | | | | | | | | | | | | | | | | | |
Net asset value, beginning of period/year | | | $29.278 | | | | $27.015 | | | | $16.348 | | | | $18.650 | | | | $17.755 | | | | $16.140 | |
Income from investment operations: | | | | | | | | | | | | | | | | | | | | | | | | |
Net investment income1 | | | 0.050 | | | | 0.194 | | | | 0.195 | | | | 0.234 | | | | 0.175 | | | | 0.157 | |
Net realized and unrealized gains (losses) on investments | | | (6.042 | ) | | | 3.110 | | | | 10.688 | | | | (2.234 | ) | | | 1.194 | | | | 2.280 | |
| | |
|
|
| |
|
|
| |
|
|
| |
|
|
| |
|
|
| |
|
|
|
Total from investment operations | | | (5.992 | ) | | | 3.304 | | | | 10.883 | | | | (2.000 | ) | | | 1.369 | | | | 2.437 | |
| | |
|
|
| |
|
|
| |
|
|
| |
|
|
| |
|
|
| |
|
|
|
Less distributions: | | | | | | | | | | | | | | | | | | | | | | | | |
Distributions from net investment income | | | — | | | | (0.234 | ) | | | (0.216 | ) | | | (0.116 | ) | | | (0.191 | ) | | | (0.163 | ) |
Distributions from net realized gains | | | — | | | | (0.807 | ) | | | — | | | | (0.186 | ) | | | (0.283 | ) | | | (0.659 | ) |
| | |
|
|
| |
|
|
| |
|
|
| |
|
|
| |
|
|
| |
|
|
|
Total distributions | | | — | | | | (1.041 | ) | | | (0.216 | ) | | | (0.302 | ) | | | (0.474 | ) | | | (0.822 | ) |
| | |
|
|
| |
|
|
| |
|
|
| |
|
|
| |
|
|
| |
|
|
|
Net asset value, end of period/year | | | $23.286 | | | | $29.278 | | | | $27.015 | | | | $16.348 | | | | $18.650 | | | | $17.755 | |
| | |
|
|
| |
|
|
| |
|
|
| |
|
|
| |
|
|
| |
|
|
|
Total return | | | (20.46)%3 | | | | 11.99% | | | | 66.66% | | | | (11.07)% | | | | 8.09% | | | | 15.10% | |
Supplemental data and ratios: | | | | | | | | | | | | | | | | | | | | | | | | |
Net assets, end of period/year | | | $1,499 | | | | $206,440 | | | | $630,350 | | | | $479,829 | | | | $538,016 | | | | $821,049 | |
Ratio of expenses to average net assets | | | | | | | | | | | | | | | | | | | | | | | | |
Before expense reimbursement (recapture) and securities lending credit2 | | | 0.54%4 | | | | 0.55% | | | | 0.56% | | | | 0.59% | | | | 0.63% | | | | 0.65% | |
After expense reimbursement (recapture) and securities lending credit2 | | | 0.52%4 | | | | 0.54% | | | | 0.51% | | | | 0.56% | | | | 0.60% | | | | 0.60% | |
Ratio of net investment income to average net assets | | | | | | | | | | | | | | | | | | | | | | | | |
Before expense reimbursement (recapture) and securities lending credit | | | 0.33%4 | | | | 0.64% | | | | 0.80% | | | | 1.16% | | | | 0.91% | | | | 0.91% | |
After expense reimbursement (recapture) and securities lending credit | | | 0.35%4 | | | | 0.65% | | | | 0.85% | | | | 1.19% | | | | 0.94% | | | | 0.96% | |
Portfolio turnover rate | | | 22.71%3 | | | | 25.18% | | | | 34.13% | | | | 28.54% | | | | 45.31% | | | | 55.07% | |
Portfolio Turnover is calculated for the Fund as a whole.
| 1 | | Net investment income per share has been calculated based on average shares outstanding during the period/year. |
| 2 | | Includes interest expense where applicable. See Note 5 in the Notes to the Financial Statements. Interest expense was 0.00%, 0.00%, 0.00%, 0.00%, 0.00% and 0.00%, respectively. |
See notes to financial statements.
121
GuideMark Funds & GuidePath Funds
FINANCIAL HIGHLIGHTS
| | | | | | | | | | | | | | | | | | | | | | | | |
| | | Large Cap Core Fund
| |
| | | Service
| |
| | | Period Ended
September 30,
2022
| | | Year Ended
March 31,
2022
| | | Year Ended
March 31,
2021
| | | Year Ended
March 31,
2020
| | | Year Ended
March 31,
2019
| | | Year Ended
March 31,
2018
| |
| | | (Unaudited) | | | | | | | | | | | | | | | | |
Per share data for a share of capital stock outstanding for the entire period/year and selected information for the period/year are as follows: | | | | | | | | | | | | | | | | | | | | | | | | |
Net asset value, beginning of period/year | | | $28.797 | | | | $26.584 | | | | $16.106 | | | | $18.401 | | | | $17.503 | | | | $15.930 | |
Income from investment operations: | | | | | | | | | | | | | | | | | | | | | | | | |
Net investment income1 | | | 0.091 | | | | 0.096 | | | | 0.059 | | | | 0.114 | | | | 0.073 | | | | 0.074 | |
Net realized and unrealized gains (losses) on investments | | | (5.983 | ) | | | 3.045 | | | | 10.515 | | | | (2.202 | ) | | | 1.184 | | | | 2.241 | |
| | |
|
|
| |
|
|
| |
|
|
| |
|
|
| |
|
|
| |
|
|
|
Total from investment operations | | | (5.892 | ) | | | 3.141 | | | | 10.574 | | | | (2.088 | ) | | | 1.257 | | | | 2.315 | |
| | |
|
|
| |
|
|
| |
|
|
| |
|
|
| |
|
|
| |
|
|
|
Less distributions: | | | | | | | | | | | | | | | | | | | | | | | | |
Distributions from net investment income | | | — | | | | (0.121 | ) | | | (0.096 | ) | | | (0.021 | ) | | | (0.076 | ) | | | (0.083 | ) |
Distributions from net realized gains | | | — | | | | (0.807 | ) | | | — | | | | (0.186 | ) | | | (0.283 | ) | | | (0.659 | ) |
| | |
|
|
| |
|
|
| |
|
|
| |
|
|
| |
|
|
| |
|
|
|
Total distributions | | | — | | | | (0.928 | ) | | | (0.096 | ) | | | (0.207 | ) | | | (0.359 | ) | | | (0.742 | ) |
| | |
|
|
| |
|
|
| |
|
|
| |
|
|
| |
|
|
| |
|
|
|
Net asset value, end of period/year | | | $22.905 | | | | $28.797 | | | | $26.584 | | | | $16.106 | | | | $18.401 | | | | $17.503 | |
| | |
|
|
| |
|
|
| |
|
|
| |
|
|
| |
|
|
| |
|
|
|
Total return | | | (20.46)%3 | | | | 11.59% | | | | 65.69% | | | | (11.59)% | | | | 7.47% | | | | 14.53% | |
Supplemental data and ratios: | | | | | | | | | | | | | | | | | | | | | | | | |
Net assets, end of period/year | | | $472,018,578 | | | | $691,938,719 | | | | $602,158,947 | | | | $326,952,939 | | | | $332,500,169 | | | | $306,450,000 | |
Ratio of expenses to average net assets | | | | | | | | | | | | | | | | | | | | | | | | |
Before expense reimbursement (recapture) and securities lending credit2 | | | 0.91%4 | | | | 0.89% | | | | 1.15% | | | | 1.18% | | | | 1.22% | | | | 1.21% | |
After expense reimbursement (recapture) and securities lending credit2 | | | 0.88%4 | | | | 0.89% | | | | 1.10% | | | | 1.14% | | | | 1.19% | | | | 1.17% | |
Ratio of net investment income (loss) to average net assets | | | | | | | | | | | | | | | | | | | | | | | | |
Before expense reimbursement (recapture) and securities lending credit | | | 0.67%4 | | | | 0.33% | | | | 0.21% | | | | 0.55% | | | | 0.37% | | | | 0.40% | |
After expense reimbursement (recapture) and securities lending credit | | | 0.70%4 | | | | 0.33% | | | | 0.26% | | | | 0.59% | | | | 0.40% | | | | 0.44% | |
Portfolio turnover rate | | | 22.71%3 | | | | 25.18% | | | | 34.13% | | | | 28.54% | | | | 45.31% | | | | 55.07% | |
Portfolio Turnover is calculated for the Fund as a whole.
| 1 | | Net investment income per share has been calculated based on average shares outstanding during the period/year. |
| 2 | | Includes interest expense where applicable. See Note 5 in the Notes to the Financial Statements. Interest expense was 0.00%, 0.00%, 0.00%, 0.00%, 0.00% and 0.00%, respectively. |
See notes to financial statements.
122
GuideMark Funds & GuidePath Funds
FINANCIAL HIGHLIGHTS
| | | | | | | | | | | | | | | | | | | | | | | | |
| | | Emerging Markets Fund
| |
| | | Service
| |
| | | Period Ended
September 30,
2022
| | | Year Ended
March 31,
2022
| | | Year Ended
March 31,
2021
| | | Year Ended
March 31,
2020
| | | Year Ended
March 31,
2019
| | | Year Ended
March 31,
2018
| |
| | | (Unaudited) | | | | | | | | | | | | | | | | |
Per share data for a share of capital stock outstanding for the entire period/year and selected information for the period/year are as follows: | | | | | | | | | | | | | | | | | | | | | | | | |
Net asset value, beginning of period/year | | | $13.573 | | | | $16.502 | | | | $10.516 | | | | $13.278 | | | | $17.063 | | | | $13.600 | |
Income from investment operations: | | | | | | | | | | | | | | | | | | | | | | | | |
Net investment income1 | | | 0.243 | | | | 0.214 | | | | 0.049 | | | | 0.175 | | | | 0.109 | | | | 0.096 | |
Net realized and unrealized gains (losses) on investments | | | (3.346 | ) | | | (1.727 | ) | | | 5.968 | | | | (2.690 | ) | | | (2.028 | ) | | | 3.485 | |
| | |
|
|
| |
|
|
| |
|
|
| |
|
|
| |
|
|
| |
|
|
|
Total from investment operations | | | (3.103 | ) | | | (1.513 | ) | | | 6.017 | | | | (2.515 | ) | | | (1.919 | ) | | | 3.581 | |
| | |
|
|
| |
|
|
| |
|
|
| |
|
|
| |
|
|
| |
|
|
|
Less distributions: | | | | | | | | | | | | | | | | | | | | | | | | |
Distributions from net investment income | | | — | | | | (0.258 | ) | | | (0.031 | ) | | | (0.247 | ) | | | (1.196 | ) | | | (0.118 | ) |
Distributions from net realized gains | | | — | | | | (1.158 | ) | | | — | | | | — | | | | (0.670 | ) | | | — | |
| | |
|
|
| |
|
|
| |
|
|
| |
|
|
| |
|
|
| |
|
|
|
Total distributions | | | — | | | | (1.416 | ) | | | (0.031 | ) | | | (0.247 | ) | | | (1.866 | ) | | | (0.118 | ) |
| | |
|
|
| |
|
|
| |
|
|
| |
|
|
| |
|
|
| |
|
|
|
Net asset value, end of period/year | | | $10.470 | | | | $13.573 | | | | $16.502 | | | | $10.516 | | | | $13.278 | | | | $17.063 | |
| | |
|
|
| |
|
|
| |
|
|
| |
|
|
| |
|
|
| |
|
|
|
Total return | | | (22.89)%4 | | | | (9.75)% | | | | 57.85%3 | | | | (19.40)% | | | | (10.05)% | | | | 26.37% | |
Supplemental data and ratios: | | | | | | | | | | | | | | | | | | | | | | | | |
Net assets, end of period/year | | | $44,600,122 | | | | $71,780,033 | | | | $96,895,863 | | | | $64,153,851 | | | | $85,623,549 | | | | $109,589,630 | |
Ratio of expenses to average net assets | | | | | | | | | | | | | | | | | | | | | | | | |
Before expense reimbursement (recapture) and securities lending credit2 | | | 1.78%5 | | | | 1.40% | | | | 1.55% | | | | 1.79% | | | | 1.69% | | | | 1.58% | |
After expense reimbursement (recapture) and securities lending credit2 | | | 1.41%5 | | | | 1.39% | | | | 1.64% | | | | 1.65% | | | | 1.66% | | | | 1.57% | |
Ratio of net investment income to average net assets | | | | | | | | | | | | | | | | | | | | | | | | |
Before expense reimbursement (recapture) and securities lending credit | | | 3.60%5 | | | | 1.32% | | | | 0.43% | | | | 1.20% | | | | 0.72% | | | | 0.61% | |
After expense reimbursement (recapture) and securities lending credit | | | 3.97%5 | | | | 1.33% | | | | 0.34% | | | | 1.34% | | | | 0.75% | | | | 0.62% | |
Portfolio turnover rate | | | 20.61%4 | | | | 47.80% | | | | 58.36% | | | | 42.60% | | | | 47.18% | | | | 30.97% | |
| 1 | | Net investment income per share has been calculated based on average shares outstanding during the period/year. |
| 2 | | Includes interest expense where applicable. See Note 5 in the Notes to the Financial Statements. Interest expense was 0.01%, 0.00%, 0.00%, 0.00%, 0.01% and 0.00%, respectively. |
| 3 | | The returns reflect the actual performance for each period and do not include the impact of any adjustments made for financial reporting required by Generally Accepted Accounting Principles (GAAP). |
See notes to financial statements.
123
GuideMark Funds & GuidePath Funds
FINANCIAL HIGHLIGHTS
| | | | | | | | | | | | | | | | | | | | | | | | |
| | | Small/Mid Cap Core Fund
| |
| | | Service
| |
| | | Period Ended
September 30,
2022
| | | Year Ended
March 31,
2022
| | | Year Ended
March 31,
2021
| | | Year Ended
March 31,
2020
| | | Year Ended
March 31,
2019
| | | Year Ended
March 31,
2018
| |
| | | (Unaudited) | | | | | | | | | | | | | | | | |
Per share data for a share of capital stock outstanding for the entire period/year and selected information for the period/year are as follows: | | | | | | | | | | | | | | | | | | | | | | | | |
Net asset value, beginning of period/year | | | $19.122 | | | | $21.067 | | | | $10.765 | | | | $14.385 | | | | $14.908 | | | | $17.860 | |
Income from investment operations: | | | | | | | | | | | | | | | | | | | | | | | | |
Net investment income (loss)1 | | | 0.045 | | | | 0.002 | | | | (0.040 | ) | | | (0.007 | ) | | | (0.022 | ) | | | (0.022 | ) |
Net realized and unrealized gains (losses) on investments | | | (3.835 | ) | | | 0.447 | | | | 10.720 | | | | (3.393 | ) | | | 0.348 | | | | 2.259 | |
| | |
|
|
| |
|
|
| |
|
|
| |
|
|
| |
|
|
| |
|
|
|
Total from investment operations | | | (3.790 | ) | | | 0.449 | | | | 10.680 | | | | (3.400 | ) | | | 0.326 | | | | 2.237 | |
| | |
|
|
| |
|
|
| |
|
|
| |
|
|
| |
|
|
| |
|
|
|
Less distributions: | | | | | | | | | | | | | | | | | | | | | | | | |
Distributions from net investment income | | | — | | | | (0.046 | ) | | | (0.024 | ) | | | (0.016 | ) | | | — | | | | (0.050 | ) |
Distributions from net realized gains | | | — | | | | (2.348 | ) | | | (0.354 | ) | | | (0.204 | ) | | | (0.849 | ) | | | (5.139 | ) |
| | |
|
|
| |
|
|
| |
|
|
| |
|
|
| |
|
|
| |
|
|
|
Total distributions | | | — | | | | (2.394 | ) | | | (0.378 | ) | | | (0.220 | ) | | | (0.849 | ) | | | (5.189 | ) |
| | |
|
|
| |
|
|
| |
|
|
| |
|
|
| |
|
|
| |
|
|
|
Net asset value, end of period/year | | | $15.332 | | | | $19.122 | | | | $21.067 | | | | $10.765 | | | | $14.385 | | | | $14.908 | |
| | |
|
|
| |
|
|
| |
|
|
| |
|
|
| |
|
|
| |
|
|
|
Total return | | | (19.82)%3 | | | | 1.38% | | | | 99.76% | | | | (24.10)% | | | | 2.99% | | | | 12.45% | |
Supplemental data and ratios: | | | | | | | | | | | | | | | | | | | | | | | | |
Net assets, end of period/year | | | $88,037,059 | | | | $107,105,729 | | | | $92,756,350 | | | | $52,904,611 | | | | $63,904,945 | | | | $54,471,360 | |
Ratio of expenses to average net assets | | | | | | | | | | | | | | | | | | | | | | | | |
Before expense reimbursement (recapture) and securities lending credit2 | | | 1.16%4 | | | | 1.17% | | | | 1.46% | | | | 1.50% | | | | 1.56% | | | | 1.55% | |
After expense reimbursement (recapture) and securities lending credit2 | | | 1.05%4 | | | | 1.14% | | | | 1.31% | | | | 1.39% | | | | 1.45% | | | | 1.39% | |
Ratio of net investment income to average net assets | | | | | | | | | | | | | | | | | | | | | | | | |
Before expense reimbursement (recapture) and securities lending credit | | | 0.41%4 | | | | (0.03)% | | | | (0.40)% | | | | (0.16)% | | | | (0.25)% | | | | (0.29)% | |
After expense reimbursement (recapture) and securities lending credit | | | 0.52%4 | | | | 0.01% | | | | (0.25)% | | | | (0.05)% | | | | (0.14)% | | | | (0.13)% | |
Portfolio turnover rate | | | 15.22%3 | | | | 36.38% | | | | 37.81% | | | | 26.54% | | | | 39.01% | | | | 32.87% | |
| 1 | | Net investment income/(loss) per share has been calculated based on average shares outstanding during the period/year. |
| 2 | | Includes interest expense where applicable. See Note 5 in the Notes to the Financial Statements. Interest expense was 0.00%, 0.00%, 0.00%, 0.00%, 0.00% and 0.00%, respectively. |
See notes to financial statements.
124
GuideMark Funds & GuidePath Funds
FINANCIAL HIGHLIGHTS
| | | | | | | | | | | | | | | | | | | | | | | | |
| | | World ex-US Fund
| |
| | | Institutional
| |
| | | Period Ended
September 30,
2022
| | | Year Ended
March 31,
2022
| | | Year Ended
March 31,
2021
| | | Year Ended
March 31,
2020
| | | Year Ended
March 31,
2019
| | | Year Ended
March 31,
2018
| |
| | | (Unaudited) | | | | | | | | | | | | | | | | |
Per share data for a share of capital stock outstanding for the entire period/year and selected information for the period/year are as follows: | | | | | | | | | | | | | | | | | | | | | | | | |
Net asset value, beginning of period/year | | | $10.611 | | | | $10.768 | | | | $7.537 | | | | $9.100 | | | | $9.759 | | | | $8.380 | |
Income from investment operations: | | | | | | | | | | | | | | | | | | | | | | | | |
Net investment income1 | | | 0.171 | | | | 0.158 | | | | 0.125 | | | | 0.222 | | | | 0.194 | | | | 0.243 | |
Net realized and unrealized gains (losses) on investments | | | (2.564 | ) | | | (0.136 | ) | | | 3.386 | | | | (1.610 | ) | | | (0.680 | ) | | | 1.305 | |
| | |
|
|
| |
|
|
| |
|
|
| |
|
|
| |
|
|
| |
|
|
|
Total from investment operations | | | (2.393 | ) | | | 0.022 | | | | 3.511 | | | | (1.388 | ) | | | (0.486 | ) | | | 1.548 | |
| | |
|
|
| |
|
|
| |
|
|
| |
|
|
| |
|
|
| |
|
|
|
Less distributions: | | | | | | | | | | | | | | | | | | | | | | | | |
Distributions from net investment income | | | — | | | | (0.179 | ) | | | (0.280 | ) | | | (0.175 | ) | | | (0.173 | ) | | | (0.169 | ) |
| | |
|
|
| |
|
|
| |
|
|
| |
|
|
| |
|
|
| |
|
|
|
Total distributions | | | — | | | | (0.179 | ) | | | (0.280 | ) | | | (0.175 | ) | | | (0.173 | ) | | | (0.169 | ) |
| | |
|
|
| |
|
|
| |
|
|
| |
|
|
| |
|
|
| |
|
|
|
Net asset value, end of period/year | | | $8.218 | | | | $10.611 | | | | $10.768 | | | | $7.537 | | | | $9.100 | | | | $9.759 | |
| | |
|
|
| |
|
|
| |
|
|
| |
|
|
| |
|
|
| |
|
|
|
Total return | | | (22.55)%5 | | | | 0.08% | | | | 46.72% | | | | (15.69)% | | | | (4.79)% | | | | 18.49%3 | |
Supplemental data and ratios: | | | | | | | | | | | | | | | | | | | | | | | | |
Net assets, end of period/year | | | $209 | | | | $28,243 | | | | $88,302 | | | | $78,232 | | | | $534,233 | | | | $822,817 | |
Ratio of expenses to average net assets | | | | | | | | | | | | | | | | | | | | | | | | |
Before expense reimbursement (recapture) and securities lending credit2 | | | 0.80%4 | | | | 0.89% | | | | 0.79% | | | | 0.77% | | | | 0.80% | | | | 0.83%4 | |
After expense reimbursement (recapture) and securities lending credit2 | | | 0.79%4 | | | | 0.79% | | | | 0.79% | | | | 0.79% | | | | 0.79% | | | | 0.79%4 | |
Ratio of net investment income to average net assets | | | | | | | | | | | | | | | | | | | | | | | | |
Before expense reimbursement (recapture) and securities lending credit | | | 3.27%4 | | | | 1.29% | | | | 1.30% | | | | 2.43% | | | | 2.04% | | | | 3.01%4 | |
After expense reimbursement (recapture) and securities lending credit | | | 3.28%4 | | | | 1.39% | | | | 1.30% | | | | 2.41% | | | | 2.05% | | | | 3.05%4 | |
Portfolio turnover rate | | | 26.50%5 | | | | 33.89% | | | | 46.15% | | | | 25.52% | | | | 59.18% | | | | 84.22% | |
Portfolio Turnover is calculated for the Fund as a whole.
| 1 | | Net investment income per share has been calculated based on average shares outstanding during the period/year. |
| 2 | | Includes interest expense where applicable. See Note 5 in the Notes to the Financial Statements. Interest expense was 0.00%, 0.00%, 0.00%, 0.00%, 0.00% and 0.00%, respectively. |
| 3 | | During the period August 3, 2017 through September 5, 2017 there were no Instutional Shares of the Fund outstanding. Performance information provided for the Institutional Shares during that period reflects the last calculated net asset value of the Institutional Shares on August 2, 2017, without any adjustments. Had there been Institutional Shares outstanding during the period August 3, 2017 through September 5, 2017, their annual returns would have been substantially similar to those of the Service Shares of the Fund because they would have been invested in the same portfolio securities, but would have differed to the extent that the classes have different expenses. Because the Service Shares have higher expenses than the Institutional Shares, the returns of the Service Shares would have been lower than the returns of the Institutional Shares during the same period. |
See notes to financial statements.
125
GuideMark Funds & GuidePath Funds
FINANCIAL HIGHLIGHTS
| | | | | | | | | | | | | | | | | | | | | | | | |
| | | World ex-US Fund
| |
| | | Service
| |
| | | Period Ended
September 30,
2022
| | | Year Ended
March 31,
2022
| | | Year Ended
March 31,
2021
| | | Year Ended
March 31,
2020
| | | Year Ended
March 31,
2019
| | | Year Ended
March 31,
2018
| |
| | | (Unaudited) | | | | | | | | | | | | | | | | |
Per share data for a share of capital stock outstanding for the entire period/year and selected information for the period/year are as follows: | | | | | | | | | | | | | | | | | | | | | | | | |
Net asset value, beginning of period/year | | | $10.306 | | | | $10.445 | | | | $7.303 | | | | $8.856 | | | | $9.507 | | | | $8.260 | |
Income from investment operations: | | | | | | | | | | | | | | | | | | | | | | | | |
Net investment income1 | | | 0.147 | | | | 0.131 | | | | 0.081 | | | | 0.142 | | | | 0.121 | | | | 0.087 | |
Net realized and unrealized gains (losses) on investments | | | (2.526 | ) | | | (0.150 | ) | | | 3.263 | | | | (1.538 | ) | | | (0.643 | ) | | | 1.296 | |
| | |
|
|
| |
|
|
| |
|
|
| |
|
|
| |
|
|
| |
|
|
|
Total from investment operations | | | (2.379 | ) | | | (0.019 | ) | | | 3.344 | | | | (1.396 | ) | | | (0.522 | ) | | | 1.383 | |
| | |
|
|
| |
|
|
| |
|
|
| |
|
|
| |
|
|
| |
|
|
|
Less distributions: | | | | | | | | | | | | | | | | | | | | | | | | |
Distributions from net investment income | | | — | | | | (0.120 | ) | | | (0.202 | ) | | | (0.157 | ) | | | (0.129 | ) | | | (0.136 | ) |
| | |
|
|
| |
|
|
| |
|
|
| |
|
|
| |
|
|
| |
|
|
|
Total distributions | | | — | | | | (0.120 | ) | | | (0.202 | ) | | | (0.157 | ) | | | (0.129 | ) | | | (0.136 | ) |
| | |
|
|
| |
|
|
| |
|
|
| |
|
|
| |
|
|
| |
|
|
|
Net asset value, end of period/year | | | $7.927 | | | | $10.306 | | | | $10.445 | | | | $7.303 | | | | $8.856 | | | | $9.507 | |
| | |
|
|
| |
|
|
| |
|
|
| |
|
|
| |
|
|
| |
|
|
|
Total return | | | (23.08)%3 | | | | (0.27)% | | | | 45.89% | | | | (16.16)% | | | | (5.36)% | | | | 16.76% | |
Supplemental data and ratios: | | | | | | | | | | | | | | | | | | | | | | | | |
Net assets, end of period/year | | | $84,967,454 | | | | $125,033,842 | | | | $138,023,708 | | | | $110,561,165 | | | | $216,435,566 | | | | $212,049,697 | |
Ratio of expenses to average net assets | | | | | | | | | | | | | | | | | | | | | | | | |
Before expense reimbursement (recapture) and securities lending credit2 | | | 1.30%4 | | | | 1.25% | | | | 1.38% | | | | 1.36% | | | | 1.40% | | | | 1.38% | |
After expense reimbursement (recapture) and securities lending credit2 | | | 1.14%4 | | | | 1.14% | | | | 1.37% | | | | 1.35% | | | | 1.39% | | | | 1.39% | |
Ratio of net investment income to average net assets | | | | | | | | | | | | | | | | | | | | | | | | |
Before expense reimbursement (recapture) and securities lending credit | | | 3.02%4 | | | | 1.08% | | | | 0.88% | | | | 1.58% | | | | 1.32% | | | | 0.95% | |
After expense reimbursement (recapture) and securities lending credit | | | 3.18%4 | | | | 1.19% | | | | 0.89% | | | | 1.59% | | | | 1.33% | | | | 0.94% | |
Portfolio turnover rate | | | 26.50%3 | | | | 33.89% | | | | 46.15% | | | | 25.52% | | | | 59.18% | | | | 84.22% | |
Portfolio Turnover is calculated for the Fund as a whole.
| 1 | | Net investment income per share has been calculated based on average shares outstanding during the period/year. |
| 2 | | Includes interest expense where applicable. See Note 5 in the Notes to the Financial Statements. Interest expense was 0.00%, 0.00%, 0.00%, 0.00%, 0.00% and 0.00%, respectively. |
See notes to financial statements.
126
GuideMark Funds & GuidePath Funds
FINANCIAL HIGHLIGHTS
| | | | | | | | | | | | | | | | | | | | | | | | |
| | | Core Fixed Income Fund
| |
| | | Service
| |
| | | Period Ended
September 30,
2022
| | | Year Ended
March 31,
2022
| | | Year Ended
March 31,
2021
| | | Year Ended
March 31,
2020
| | | Year Ended
March 31,
2019
| | | Year Ended
March 31,
2018
| |
| | | (Unaudited) | | | | | | | | | | | | | | | | |
Per share data for a share of capital stock outstanding for the entire period/year and selected information for the period/year are as follows: | | | | | | | | | | | | | | | | | | | | | | | | |
Net asset value, beginning of period/year | | | $9.009 | | | | $9.700 | | | | $9.798 | | | | $9.270 | | | | $9.131 | | | | $9.320 | |
Income from investment operations: | | | | | | | | | | | | | | | | | | | | | | | | |
Net investment income1 | | | 0.083 | | | | 0.110 | | | | 0.112 | | | | 0.170 | | | | 0.176 | | | | 0.133 | |
Net realized and unrealized gains (losses) on investments | | | (1.032 | ) | | | (0.571 | ) | | | 0.1413 | | | | 0.490 | | | | 0.144 | | | | (0.098 | ) |
| | |
|
|
| |
|
|
| |
|
|
| |
|
|
| |
|
|
| |
|
|
|
Total from investment operations | | | (0.949 | ) | | | (0.461 | ) | | | 0.253 | | | | 0.660 | | | | 0.320 | | | | 0.035 | |
| | |
|
|
| |
|
|
| |
|
|
| |
|
|
| |
|
|
| |
|
|
|
Less distributions: | | | | | | | | | | | | | | | | | | | | | | | | |
Distributions from net investment income | | | (0.101 | ) | | | (0.124 | ) | | | (0.184 | ) | | | (0.108 | ) | | | (0.181 | ) | | | (0.168 | ) |
Distributions from net realized gains | | | — | | | | (0.106 | ) | | | (0.167 | ) | | | (0.024 | ) | | | — | | | | (0.056 | ) |
| | |
|
|
| |
|
|
| |
|
|
| |
|
|
| |
|
|
| |
|
|
|
Total distributions | | | (0.101 | ) | | | (0.230 | ) | | | (0.351 | ) | | | (0.132 | ) | | | (0.181 | ) | | | (0.224 | ) |
| | |
|
|
| |
|
|
| |
|
|
| |
|
|
| |
|
|
| |
|
|
|
Net asset value, end of period/year | | | $7.959 | | | | $9.009 | | | | $9.700 | | | | $9.798 | | | | $9.270 | | | | $9.131 | |
| | |
|
|
| |
|
|
| |
|
|
| |
|
|
| |
|
|
| |
|
|
|
Total return | | | (10.57)%4 | | | | (4.88)% | | | | 2.47% | | | | 7.16% | | | | 3.57% | | | | 0.35% | |
Supplemental data and ratios: | | | | | | | | | | | | | | | | | | | | | | | | |
Net assets, end of period/year | | | $177,904,163 | | | | $200,560,432 | | | | $188,033,933 | | | | $135,386,961 | | | | $132,792,238 | | | | $134,255,059 | |
Ratio of expenses to average net assets | | | | | | | | | | | | | | | | | | | | | | | | |
Before expense reimbursement (recapture) and securities lending credit2 | | | 1.00%5 | | | | 0.99% | | | | 1.28% | | | | 1.29% | | | | 1.34% | | | | 1.38% | |
After expense reimbursement (recapture) and securities lending credit2 | | | 0.94%5 | | | | 0.94% | | | | 1.19% | | | | 1.19% | | | | 1.19% | | | | 1.26% | |
Ratio of net investment income to average net assets | | | | | | | | | | | | | | | | | | | | | | | | |
Before expense reimbursement (recapture) and securities lending credit | | | 1.87%5 | | | | 1.09% | | | | 1.01% | | | | 1.67% | | | | 1.80% | | | | 1.30% | |
After expense reimbursement (recapture) and securities lending credit | | | 1.93%5 | | | | 1.14% | | | | 1.10% | | | | 1.77% | | | | 1.95% | | | | 1.42% | |
Portfolio turnover rate | | | 125.32%4 | | | | 263.72% | | | | 283.45% | | | | 278.67% | | | | 239.11% | | | | 193.12% | |
| 1 | | Net investment income/(loss) per share has been calculated based on average shares outstanding during the period/year. |
| 2 | | Includes interest expense where applicable. See Note 5 in the Notes to the Financial Statements. Interest expense was 0.00%, 0.00%, 0.00%, 0.00%, 0.00% and 0.00%, respectively. |
| 3 | | Realized and unrealized gains and losses per shares in this caption are balancing amounts necessary to reconcile the change in net asset value per share for the year, and may not reconcile with aggregate gains and losses in the Statement of Operations due to share transactions for the year. |
See notes to financial statements.
127
GuideMark Funds & GuidePath Funds
FINANCIAL HIGHLIGHTS
| | | | | | | | | | | | | | | | | | | | | | | | |
| | | Growth Allocation Fund
| |
| | | Institutional
| |
| | | Period Ended
September 30,
2022
| | | Year Ended
March 31,
2022
| | | Year Ended
March 31,
2021
| | | Year Ended
March 31,
2020
| | | Year Ended
March 31,
2019
| | | Year Ended
March 31,
2018
| |
| | | (Unaudited) | | | | | | | | | | | | | | | | |
Per share data for a share of capital stock outstanding for the entire period/year and selected information for the period/year are as follows: | | | | | | | | | | | | | | | | | | | | | | | | |
Net asset value, beginning of period/year | | | $16.192 | | | | $15.776 | | | | $10.139 | | | | $11.553 | | | | $11.534 | | | | $11.340 | |
Income from investment operations: | | | | | | | | | | | | | | | | | | | | | | | | |
Net investment income1 | | | (0.017 | ) | | | 0.168 | | | | 0.140 | | | | 0.199 | | | | 0.227 | | | | 0.236 | |
Net realized and unrealized gains (losses) on investments | | | (3.577 | ) | | | 0.751 | | | | 5.843 | | | | (1.407 | ) | | | (0.003)5 | | | | 1.466 | |
| | |
|
|
| |
|
|
| |
|
|
| |
|
|
| |
|
|
| |
|
|
|
Total from investment operations | | | (3.594 | ) | | | 0.919 | | | | 5.983 | | | | (1.208 | ) | | | 0.224 | | | | 1.702 | |
| | |
|
|
| |
|
|
| |
|
|
| |
|
|
| |
|
|
| |
|
|
|
Less distributions: | | | | | | | | | | | | | | | | | | | | | | | | |
Distributions from net investment income | | | — | | | | (0.173 | ) | | | (0.147 | ) | | | (0.206 | ) | | | (0.193 | ) | | | (0.210 | ) |
Distributions from net realized gains | | | — | | | | (0.330 | ) | | | (0.199 | ) | | | — | | | | (0.012 | ) | | | (1.298 | ) |
| | |
|
|
| |
|
|
| |
|
|
| |
|
|
| |
|
|
| |
|
|
|
Total distributions | | | — | | | | (0.503 | ) | | | (0.346 | ) | | | (0.206 | ) | | | (0.205 | ) | | | (1.508 | ) |
| | |
|
|
| |
|
|
| |
|
|
| |
|
|
| |
|
|
| |
|
|
|
Net asset value, end of period/year | | | $12.598 | | | | $16.192 | | | | $15.776 | | | | $10.139 | | | | $11.553 | | | | $11.534 | |
| | |
|
|
| |
|
|
| |
|
|
| |
|
|
| |
|
|
| |
|
|
|
Total return | | | (22.20)%6 | | | | 5.59% | | | | 59.19% | | | | (10.82)% | | | | 2.22% | | | | 14.90% | |
Supplemental data and ratios: | | | | | | | | | | | | | | | | | | | | | | | | |
Net assets, end of period/year | | | $5,893 | | | | $806,977 | | | | $2,892,788 | | | | $4,402,611 | | | | $5,450,557 | | | | $6,646,937 | |
Ratio of expenses to average net assets2 | | | | | | | | | | | | | | | | | | | | | | | | |
Before expense reimbursement (recapture) and securities lending credit3 | | | 0.33%7 | | | | 0.33% | | | | 0.34% | | | | 0.38% | | | | 0.40% | | | | 0.40% | |
After expense reimbursement (recapture) and securities lending credit3 | | | 0.28%7 | | | | 0.29% | | | | 0.30% | | | | 0.33% | | | | 0.35% | | | | 0.35% | |
Ratio of net investment income to average net assets4 | | | | | | | | | | | | | | | | | | | | | | | | |
Before expense reimbursement (recapture) and securities lending credit | | | (0.27)%7 | | | | 0.96% | | | | 0.99% | | | | 1.60% | | | | 1.92% | | | | 1.91% | |
After expense reimbursement (recapture) and securities lending credit | | | (0.22)%7 | | | | 1.00% | | | | 1.03% | | | | 1.65% | | | | 1.97% | | | | 1.96% | |
Portfolio turnover rate | | | 12.14%6 | | | | 17.09% | | | | 39.58% | | | | 37.80% | | | | 53.89% | | | | 70.47% | |
| Portfolio | | Turnover is calculated for the Fund as a whole. |
| 1 | | Net investment income per share has been calculated based on average shares outstanding during the period/year. |
| 2 | | These ratios exclude the impact of the expenses of the underlying investment companies and exchange-traded funds in which the Fund invests. |
| 3 | | Includes interest expense where applicable. See Note 5 in the Notes to the Financial Statements. Interest expense was 0.00%, 0.00%, 0.00%, 0.00%, 0.01% and 0.00%, respectively. |
| 4 | | Recognition of the net investment income by the Fund is affected by the timing of the declaration of dividends by the underlying investment companies and exchange-traded funds in which the Fund invests. |
| 5 | | Realized and unrealized gains and losses per shares in this caption are balancing amounts necessary to reconcile the change in net asset value per share for the year, and may not reconcile with aggregate gains and losses in the Statement of Operations due to share transactions for the year. |
See notes to financial statements.
128
GuideMark Funds & GuidePath Funds
FINANCIAL HIGHLIGHTS
| | | | | | | | | | | | | | | | | | | | | | | | |
| | | Growth Allocation Fund
| |
| | | Service
| |
| | | Period Ended
September 30,
2022
| | | Year Ended
March 31,
2022
| | | Year Ended
March 31,
2021
| | | Year Ended
March 31,
2020
| | | Year Ended
March 31,
2019
| | | Year Ended
March 31,
2018
| |
| | | (Unaudited) | | | | | | | | | | | | | | | | |
Per share data for a share of capital stock outstanding for the entire period/year and selected information for the period/year are as follows: | | | | | | | | | | | | | | | | | | | | | | | | |
Net asset value, beginning of period/year | | | $16.029 | | | | $15.636 | | | | $10.062 | | | | $11.477 | | | | $11.458 | | | | $11.290 | |
Income from investment operations: | | | | | | | | | | | | | | | | | | | | | | | | |
Net investment income1 | | | 0.052 | | | | 0.126 | | | | 0.064 | | | | 0.128 | | | | 0.160 | | | | 0.152 | |
Net realized and unrealized gains (losses) on investments | | | (3.578 | ) | | | 0.726 | | | | 5.780 | | | | (1.402 | ) | | | 0.0035 | | | | 1.467 | |
| | |
|
|
| |
|
|
| |
|
|
| |
|
|
| |
|
|
| |
|
|
|
Total from investment operations | | | (3.526 | ) | | | 0.852 | | | | 5.844 | | | | (1.274 | ) | | | 0.163 | | | | 1.619 | |
| | |
|
|
| |
|
|
| |
|
|
| |
|
|
| |
|
|
| |
|
|
|
Less distributions: | | | | | | | | | | | | | | | | | | | | | | | | |
Distributions from net investment income | | | — | | | | (0.129 | ) | | | (0.072 | ) | | | (0.141 | ) | | | (0.132 | ) | | | (0.153 | ) |
Distributions from net realized gains | | | — | | | | (0.330 | ) | | | (0.198 | ) | | | — | | | | (0.012 | ) | | | (1.298 | ) |
| | |
|
|
| |
|
|
| |
|
|
| |
|
|
| |
|
|
| |
|
|
|
Total distributions | | | — | | | | (0.459 | ) | | | (0.270 | ) | | | (0.141 | ) | | | (0.144 | ) | | | (1.451 | ) |
| | |
|
|
| |
|
|
| |
|
|
| |
|
|
| |
|
|
| |
|
|
|
Net asset value, end of period/year | | | $12.503 | | | | $16.029 | | | | $15.636 | | | | $10.062 | | | | $11.477 | | | | $11.458 | |
| | |
|
|
| |
|
|
| |
|
|
| |
|
|
| |
|
|
| |
|
|
|
Total return | | | (22.00)%6 | | | | 5.22% | | | | 58.23% | | | | (11.35)% | | | | 1.61% | | | | 14.22% | |
Supplemental data and ratios: | | | | | | | | | | | | | | | | | | | | | | | | |
Net assets, end of period/year | | | $830,075,405 | | | | $1,136,476,058 | | | | $1,075,230,154 | | | | $739,949,997 | | | | $788,314,442 | | | | $611,928,879 | |
Ratio of expenses to average net assets2 | | | | | | | | | | | | | | | | | | | | | | | | |
Before expense reimbursement (recapture) and securities lending credit3 | | | 0.69%7 | | | | 0.68% | | | | 0.94% | | | | 0.97% | | | | 1.00% | | | | 1.00% | |
After expense reimbursement (recapture) and securities lending credit3 | | | 0.65%7 | | | | 0.64% | | | | 0.90% | | | | 0.93% | | | | 0.95% | | | | 0.95% | |
Ratio of net investment income to average net assets4 | | | | | | | | | | | | | | | | | | | | | | | | |
Before expense reimbursement (recapture) and securities lending credit | | | 0.69%7 | | | | 0.71% | | | | 0.44% | | | | 1.03% | | | | 1.35% | | | | 1.22% | |
After expense reimbursement (recapture) and securities lending credit | | | 0.73%7 | | | | 0.75% | | | | 0.48% | | | | 1.07% | | | | 1.40% | | | | 1.27% | |
Portfolio turnover rate | | | 12.14%6 | | | | 17.09% | | | | 39.58% | | | | 37.80% | | | | 53.89% | | | | 70.47% | |
Portfolio Turnover is calculated for the Fund as a whole.
| 1 | | Net investment income per share has been calculated based on average shares outstanding during the period/year. |
| 2 | | These ratios exclude the impact of the expenses of the underlying investment companies and exchange-traded funds in which the Fund invests. |
| 3 | | Includes interest expense where applicable. See Note 5 in the Notes to the Financial Statements. Interest expense was 0.01%, 0.00%, 0.00%, 0.00%, 0.01% and 0.01%, respectively. |
| 4 | | Recognition of the net investment income by the Fund is affected by the timing of the declaration of dividends by the underlying investment companies and exchange-traded funds in which the Fund invests. |
| 5 | | Realized and unrealized gains and losses per shares in this caption are balancing amounts necessary to reconcile the change in net asset value per share for the year, and may not reconcile with aggregate gains and losses in the Statement of Operations due to share transactions for the year. |
See notes to financial statements.
129
GuideMark Funds & GuidePath Funds
FINANCIAL HIGHLIGHTS
| | | | | | | | | | | | | | | | | | | | | | | | |
| | | Conservative Allocation Fund
| |
| | | Institutional
| |
| | | Period Ended
September 30,
2022
| | | Year Ended
March 31,
2022
| | | Year Ended
March 31,
2021
| | | Year Ended
March 31,
2020
| | | Year Ended
March 31,
2019
| | | Year Ended
March 31,
2018
| |
| | | (Unaudited) | | | | | | | | | | | | | | | | |
Per share data for a share of capital stock outstanding for the entire period/year and selected information for the period/year are as follows: | | | | | | | | | | | | | | | | | | | | | | | | |
Net asset value, beginning of period/year | | | $11.071 | | | | $11.164 | | | | $9.204 | | | | $9.677 | | | | $9.538 | | | | $9.100 | |
Income from investment operations: | | | | | | | | | | | | | | | | | | | | | | | | |
Net investment income1 | | | 0.130 | | | | 0.247 | | | | 0.262 | | | | 0.288 | | | | 0.255 | | | | 0.204 | |
Net realized and unrealized gains (losses) on investments | | | (1.673 | ) | | | 0.101 | | | | 1.978 | | | | (0.491 | ) | | | 0.104 | | | | 0.442 | |
| | |
|
|
| |
|
|
| |
|
|
| |
|
|
| |
|
|
| |
|
|
|
Total from investment operations | | | (1.543 | ) | | | 0.348 | | | | 2.240 | | | | (0.203 | ) | | | 0.359 | | | | 0.646 | |
| | |
|
|
| |
|
|
| |
|
|
| |
|
|
| |
|
|
| |
|
|
|
Less distributions: | | | | | | | | | | | | | | | | | | | | | | | | |
Distributions from net investment income | | | — | | | | (0.246 | ) | | | (0.244 | ) | | | (0.270 | ) | | | (0.205 | ) | | | (0.187 | ) |
Distributions from net realized gains | | | — | | | | (0.195 | ) | | | (0.036 | ) | | | — | | | | (0.015 | ) | | | (0.021 | ) |
| | |
|
|
| |
|
|
| |
|
|
| |
|
|
| |
|
|
| |
|
|
|
Total distributions | | | — | | | | (0.441 | ) | | | (0.280 | ) | | | (0.270 | ) | | | (0.220 | ) | | | (0.208 | ) |
| | |
|
|
| |
|
|
| |
|
|
| |
|
|
| |
|
|
| |
|
|
|
Net asset value, end of period/year | | | $9.528 | | | | $11.071 | | | | $11.164 | | | | $9.204 | | | | $9.677 | | | | $9.538 | |
| | |
|
|
| |
|
|
| |
|
|
| |
|
|
| |
|
|
| |
|
|
|
Total return | | | (13.95)%6 | | | | 2.95% | | | | 24.42% | | | | (2.41)% | | | | 3.97% | | | | 7.07% | |
Supplemental data and ratios: | | | | | | | | | | | | | | | | | | | | | | | | |
Net assets, end of period/year | | | $9,204 | | | | $286,674 | | | | $1,287,200 | | | | $1,713,169 | | | | $2,268,382 | | | | $3,140,896 | |
Ratio of expenses to average net assets2 | | | | | | | | | | | | | | | | | | | | | | | | |
Before expense reimbursement (recapture) and securities lending credit3 | | | 0.34%5 | | | | 0.35% | | | | 0.36% | | | | 0.40% | | | | 0.42% | | | | 0.44% | |
After expense reimbursement (recapture) and securities lending credit3 | | | 0.10%5 | | | | 0.10% | | | | 0.10% | | | | 0.10% | | | | 0.10% | | | | 0.27% | |
Ratio of net investment income to average net assets4 | | | | | | | | | | | | | | | | | | | | | | | | |
Before expense reimbursement (recapture) and securities lending credit | | | 2.16%5 | | | | 1.89% | | | | 2.22% | | | | 2.57% | | | | 2.35% | | | | 1.97% | |
After expense reimbursement (recapture) and securities lending credit | | | 2.40%5 | | | | 2.14% | | | | 2.48% | | | | 2.87% | | | | 2.67% | | | | 2.14% | |
Portfolio turnover rate | | | 13.92%6 | | | | 28.28% | | | | 38.17% | | | | 58.96% | | | | 69.19% | | | | 30.27% | |
Portfolio Turnover is calculated for the Fund as a whole.
| 1 | | Net investment income per share has been calculated based on average shares outstanding during the period/year. |
| 2 | | These ratios exclude the impact of the expenses of the underlying investment companies and exchange-traded funds in which the Fund invests. |
| 3 | | Includes interest expense where applicable. See Note 5 in the Notes to the Financial Statements. Interest expense was 0.00%, 0.00%, 0.00%, 0.00%, 0.00% and 0.00%, respectively. |
| 4 | | Recognition of the net investment income by the Fund is affected by the timing of the declaration of dividends by the underlying investment companies and exchange-traded funds in which the Fund invests. |
See notes to financial statements.
130
GuideMark Funds & GuidePath Funds
FINANCIAL HIGHLIGHTS
| | | | | | | | | | | | | | | | | | | | | | | | |
| | | Conservative Allocation Fund
| |
| | | Service
| |
| | | Period Ended
September 30,
2022
| | | Year Ended
March 31,
2022
| | | Year Ended
March 31,
2021
| | | Year Ended
March 31,
2020
| | | Year Ended
March 31,
2019
| | | Year Ended
March 31,
2018
| |
| | | (Unaudited) | | | | | | | | | | | | | | | | |
Per share data for a share of capital stock outstanding for the entire period/year and selected information for the period/year are as follows: | | | | | | | | | | | | | | | | | | | | | | | | |
Net asset value, beginning of period/year | | | $10.978 | | | | $11.070 | | | | $9.137 | | | | $9.617 | | | | $9.482 | | | | $9.060 | |
Income from investment operations: | | | | | | | | | | | | | | | | | | | | | | | | |
Net investment income1 | | | 0.125 | | | | 0.207 | | | | 0.199 | | | | 0.226 | | | | 0.196 | | | | 0.143 | |
Net realized and unrealized gains (losses) on investments | | | (1.682 | ) | | | 0.098 | | | | 1.959 | | | | (0.490 | ) | | | 0.107 | | | | 0.438 | |
| | |
|
|
| |
|
|
| |
|
|
| |
|
|
| |
|
|
| |
|
|
|
Total from investment operations | | | (1.557 | ) | | | 0.305 | | | | 2.158 | | | | (0.264 | ) | | | 0.303 | | | | 0.581 | |
| | |
|
|
| |
|
|
| |
|
|
| |
|
|
| |
|
|
| |
|
|
|
Less distributions: | | | | | | | | | | | | | | | | | | | | | | | | |
Distributions from net investment income | | | — | | | | (0.202 | ) | | | (0.189 | ) | | | (0.216 | ) | | | (0.153 | ) | | | (0.138 | ) |
Distributions from net realized gains | | | — | | | | (0.195 | ) | | | (0.036 | ) | | | — | | | | (0.015 | ) | | | (0.021 | ) |
| | |
|
|
| |
|
|
| |
|
|
| |
|
|
| |
|
|
| |
|
|
|
Total distributions | | | — | | | | (0.397 | ) | | | (0.225 | ) | | | (0.216 | ) | | | (0.168 | ) | | | (0.159 | ) |
| | |
|
|
| |
|
|
| |
|
|
| |
|
|
| |
|
|
| |
|
|
|
Net asset value, end of period/year | | | $9.421 | | | | $10.978 | | | | $11.070 | | | | $9.137 | | | | $9.617 | | | | $9.482 | |
| | |
|
|
| |
|
|
| |
|
|
| |
|
|
| |
|
|
| |
|
|
|
Total return | | | (14.18)%6 | | | | 2.60% | | | | 23.67% | | | | (2.99)% | | | | 3.35% | | | | 6.39% | |
Supplemental data and ratios: | | | | | | | | | | | | | | | | | | | | | | | | |
Net assets, end of period/year | | | $379,401,492 | | | | $509,796,048 | | | | $461,123,761 | | | | $314,935,864 | | | | $337,130,990 | | | | $268,079,977 | |
Ratio of expenses to average net assets2 | | | | | | | | | | | | | | | | | | | | | | | | |
Before expense reimbursement (recapture) and securities lending credit3 | | | 0.71%5 | | | | 0.70% | | | | 0.96% | | | | 0.99% | | | | 1.02% | | | | 1.03% | |
After expense reimbursement (recapture) and securities lending credit3 | | | 0.46%5 | | | | 0.45% | | | | 0.70% | | | | 0.70% | | | | 0.70% | | | | 0.83% | |
Ratio of net investment income to average net assets4 | | | | | | | | | | | | | | | | | | | | | | | | |
Before expense reimbursement (recapture) and securities lending credit | | | 2.17%5 | | | | 1.56% | | | | 1.64% | | | | 1.98% | | | | 1.75% | | | | 1.31% | |
After expense reimbursement (recapture) and securities lending credit | | | 2.42%5 | | | | 1.81% | | | | 1.90% | | | | 2.27% | | | | 2.07% | | | | 1.51% | |
Portfolio turnover rate | | | 13.92%6 | | | | 28.28% | | | | 38.17% | | | | 58.96% | | | | 69.19% | | | | 30.27% | |
Portfolio Turnover is calculated for the Fund as a whole.
| 1 | | Net investment income per share has been calculated based on average shares outstanding during the period/year. |
| 2 | | These ratios exclude the impact of the expenses of the underlying investment companies and exchange-traded funds in which the Fund invests. |
| 3 | | Includes interest expense where applicable. See Note 5 in the Notes to the Financial Statements. Interest expense was 0.01%, 0.00%, 0.00%, 0.00%, 0.00% and 0.00%, respectively. |
| 4 | | Recognition of the net investment income by the Fund is affected by the timing of the declaration of dividends by the underlying investment companies and exchange-traded funds in which the Fund invests. |
See notes to financial statements.
131
GuideMark Funds & GuidePath Funds
FINANCIAL HIGHLIGHTS
| | | | | | | | | | | | | | | | | | | | | | | | |
| | | Tactical Allocation Fund
| |
| | | Institutional
| |
| | | Period Ended
September 30,
2022
| | | Year Ended
March 31,
2022
| | | Year Ended
March 31,
2021
| | | Year Ended
March 31,
2020
| | | Year Ended
March 31,
2019
| | | Year Ended
March 31,
2018
| |
| | | (Unaudited) | | | | | | | | | | | | | | | | |
Per share data for a share of capital stock outstanding for the entire period/year and selected information for the period/year are as follows: | | | | | | | | | | | | | | | | | | | | | | | | |
Net asset value, beginning of period/year | | | $11.499 | | | | $11.487 | | | | $10.019 | | | | $10.962 | | | | $10.950 | | | | $10.250 | |
Income from investment operations: | | | | | | | | | | | | | | | | | | | | | | | | |
Net investment income1 | | | 0.069 | | | | 0.088 | | | | 0.073 | | | | 0.129 | | | | 0.138 | | | | 0.142 | |
Net realized and unrealized gains (losses) on investments | | | (1.064 | ) | | | 1.167 | | | | 1.958 | | | | (0.517 | ) | | | 0.408 | | | | 1.078 | |
| | |
|
|
| |
|
|
| |
|
|
| |
|
|
| |
|
|
| |
|
|
|
Total from investment operations | | | (0.995 | ) | | | 1.255 | | | | 2.031 | | | | (0.388 | ) | | | 0.546 | | | | 1.220 | |
| | |
|
|
| |
|
|
| |
|
|
| |
|
|
| |
|
|
| |
|
|
|
Less distributions: | | | | | | | | | | | | | | | | | | | | | | | | |
Distributions from net investment income | | | — | | | | (0.101 | ) | | | (0.051 | ) | | | (0.108 | ) | | | (0.128 | ) | | | (0.393 | ) |
Distributions from net realized gains | | | — | | | | (1.142 | ) | | | (0.512 | ) | | | (0.447 | ) | | | (0.406 | ) | | | (0.127 | ) |
| | |
|
|
| |
|
|
| |
|
|
| |
|
|
| |
|
|
| |
|
|
|
Total distributions | | | — | | | | (1.243 | ) | | | (0.563 | ) | | | (0.555 | ) | | | (0.534 | ) | | | (0.520 | ) |
| | |
|
|
| |
|
|
| |
|
|
| |
|
|
| |
|
|
| |
|
|
|
Net asset value, end of period/year | | | $10.504 | | | | $11.499 | | | | $11.487 | | | | $10.019 | | | | $10.962 | | | | $10.950 | |
| | |
|
|
| |
|
|
| |
|
|
| |
|
|
| |
|
|
| |
|
|
|
Total return | | | (8.65)%6 | | | | 10.71% | | | | 20.69% | | | | (4.27)% | | | | 5.59% | | | | 11.83% | |
Supplemental data and ratios: | | | | | | | | | | | | | | | | | | | | | | | | |
Net assets, end of period/year | | | $496,464 | | | | $789,761 | | | | $1,305,328 | | | | $1,553,075 | | | | $1,506,030 | | | | $1,681,043 | |
Ratio of expenses to average net assets2 | | | | | | | | | | | | | | | | | | | | | | | | |
Before expense reimbursement (recapture) and securities lending credit3 | | | 0.45%5 | | | | 0.46% | | | | 0.47% | | | | 0.50% | | | | 0.51% | | | | 0.52% | |
After expense reimbursement (recapture) and securities lending credit3 | | | 0.44%5 | | | | 0.43% | | | | 0.45% | | | | 0.46% | | | | 0.43% | | | | 0.45% | |
Ratio of net investment income to average net assets4 | | | | | | | | | | | | | | | | | | | | | | | | |
Before expense reimbursement (recapture) and securities lending credit | | | 1.23%5 | | | | 0.70% | | | | 0.65% | | | | 1.10% | | | | 1.15% | | | | 1.25% | |
After expense reimbursement (recapture) and securities lending credit | | | 1.24%5 | | | | 0.73% | | | | 0.67% | | | | 1.14% | | | | 1.23% | | | | 1.32% | |
Portfolio turnover rate | | | 147.51%6 | | | | 406.19% | | | | 443.30% | | | | 500.28% | | | | 336.60% | | | | 369.57% | |
Portfolio Turnover is calculated for the Fund as a whole.
| 1 | | Net investment income per share has been calculated based on average shares outstanding during the period/year. |
| 2 | | These ratios exclude the impact of the expenses of the underlying investment companies and exchange-traded funds in which the Fund invests. |
| 3 | | Includes interest expense where applicable. See Note 5 in the Notes to the Financial Statements. Interest expense was 0.00%, 0.00%, 0.00%, 0.00%, 0.00% and 0.00%, respectively. |
| 4 | | Recognition of the net investment income by the Fund is affected by the timing of the declaration of dividends by the underlying investment companies and exchange-traded funds in which the Fund invests. |
See notes to financial statements.
132
GuideMark Funds & GuidePath Funds
FINANCIAL HIGHLIGHTS
| | | | | | | | | | | | | | | | | | | | | | | | |
| | | Tactical Allocation Fund
| |
| | | Service
| |
| | | Period Ended
September 30,
2022
| | | Year Ended
March 31,
2022
| | | Year Ended
March 31,
2021
| | | Year Ended
March 31,
2020
| | | Year Ended
March 31,
2019
| | | Year Ended
March 31,
2018
| |
| | | (Unaudited) | | | | | | | | | | | | | | | | |
Per share data for a share of capital stock outstanding for the entire period/year and selected information for the period/year are as follows: | | | | | | | | | | | | | | | | | | | | | | | | |
Net asset value, beginning of period/year | | | $11.400 | | | | $11.394 | | | | $9.960 | | | | $10.919 | | | | $10.907 | | | | $10.150 | |
Income from investment operations: | | | | | | | | | | | | | | | | | | | | | | | | |
Net investment income1 | | | 0.054 | | | | 0.047 | | | | 0.010 | | | | 0.061 | | | | 0.074 | | | | 0.082 | |
Net realized and unrealized gains (losses) on investments | | | (1.059 | ) | | | 1.154 | | | | 1.941 | | | | (0.515 | ) | | | 0.410 | | | | 1.054 | |
| | |
|
|
| |
|
|
| |
|
|
| |
|
|
| |
|
|
| |
|
|
|
Total from investment operations | | | (1.005 | ) | | | 1.201 | | | | 1.951 | | | | (0.454 | ) | | | 0.484 | | | | 1.136 | |
| | |
|
|
| |
|
|
| |
|
|
| |
|
|
| |
|
|
| |
|
|
|
Less distributions: | | | | | | | | | | | | | | | | | | | | | | | | |
Distributions from net investment income | | | — | | | | (0.053 | ) | | | (0.005 | ) | | | (0.058 | ) | | | (0.066 | ) | | | (0.252 | ) |
Distributions from net realized gains | | | — | | | | (1.142 | ) | | | (0.512 | ) | | | (0.447 | ) | | | (0.406 | ) | | | (0.127 | ) |
| | |
|
|
| |
|
|
| |
|
|
| |
|
|
| |
|
|
| |
|
|
|
Total distributions | | | — | | | | (1.195 | ) | | | (0.517 | ) | | | (0.505 | ) | | | (0.472 | ) | | | (0.379 | ) |
| | |
|
|
| |
|
|
| |
|
|
| |
|
|
| |
|
|
| |
|
|
|
Net asset value, end of period/year | | | $10.395 | | | | $11.400 | | | | $11.394 | | | | $9.960 | | | | $10.919 | | | | $10.907 | |
| | |
|
|
| |
|
|
| |
|
|
| |
|
|
| |
|
|
| |
|
|
|
Total return | | | (8.82)%6 | | | | 10.32% | | | | 19.96% | | | | (4.83)% | | | | 4.96% | | | | 11.14% | |
Supplemental data and ratios: | | | | | | | | | | | | | | | | | | | | | | | | |
Net assets, end of period/year | | | $467,932,769 | | | | $518,623,186 | | | | $469,311,387 | | | | $323,199,482 | | | | $341,839,666 | | | | $271,460,164 | |
Ratio of expenses to average net assets2 | | | | | | | | | | | | | | | | | | | | | | | | |
Before expense reimbursement (recapture) and securities lending credit3 | | | 0.80%5 | | | | 0.81% | | | | 1.07% | | | | 1.10% | | | | 1.11% | | | | 1.11% | |
After expense reimbursement (recapture) and securities lending credit3 | | | 0.79%5 | | | | 0.78% | | | | 1.05% | | | | 1.06% | | | | 1.03% | | | | 1.03% | |
Ratio of net investment income to average net assets4 | | | | | | | | | | | | | | | | | | | | | | | | |
Before expense reimbursement (recapture) and securities lending credit | | | 0.98%5 | | | | 0.36% | | | | 0.07% | | | | 0.50% | | | | 0.58% | | | | 0.69% | |
After expense reimbursement (recapture) and securities lending credit | | | 0.99%5 | | | | 0.39% | | | | 0.09% | | | | 0.54% | | | | 0.66% | | | | 0.77% | |
Portfolio turnover rate | | | 147.51%6 | | | | 406.19% | | | | 443.30% | | | | 500.28% | | | | 336.60% | | | | 369.57% | |
Portfolio Turnover is calculated for the Fund as a whole.
| 1 | | Net investment income per share has been calculated based on average shares outstanding during the period/year. |
| 2 | | These ratios exclude the impact of the expenses of the underlying investment companies and exchange-traded funds in which the Fund invests. |
| 3 | | Includes interest expense where applicable. See Note 5 in the Notes to the Financial Statements. Interest expense was 0.00%, 0.00%, 0.00%, 0.00%, 0.00% and 0.00%, respectively. |
| 4 | | Recognition of the net investment income by the Fund is affected by the timing of the declaration of dividends by the underlying investment companies and exchange-traded funds in which the Fund invests. |
See notes to financial statements.
133
GuideMark Funds & GuidePath Funds
FINANCIAL HIGHLIGHTS
| | | | | | | | | | | | | | | | | | | | | | | | |
| | | Absolute Return Allocation Fund
| |
| | | Institutional
| |
| | | Period Ended
September 30,
2022
| | | Year Ended
March 31,
2022
| | | Year Ended
March 31,
2021
| | | Year Ended
March 31,
2020
| | | Year Ended
March 31,
2019
| | | Year Ended
March 31,
2018
| |
| | | (Unaudited) | | | | | | | | | | | | | | | | |
Per share data for a share of capital stock outstanding for the entire period/year and selected information for the period/year are as follows: | | | | | | | | | | | | | | | | | | | | | | | | |
Net asset value, beginning of period/year | | | $10.053 | | | | $10.554 | | | | $10.005 | | | | $10.402 | | | | $10.335 | | | | $10.290 | |
Income from investment operations: | | | | | | | | | | | | | | | | | | | | | | | | |
Net investment income1 | | | 0.168 | | | | 0.267 | | | | 0.256 | | | | 0.329 | | | | 0.346 | | | | 0.292 | |
Net realized and unrealized gains (losses) on investments | | | (1.013 | ) | | | (0.516 | ) | | | 0.638 | 2 | | | (0.367 | ) | | | (0.003)2 | | | | (0.037 | ) |
| | |
|
|
| |
|
|
| |
|
|
| |
|
|
| |
|
|
| |
|
|
|
Total from investment operations | | | (0.845 | ) | | | (0.249 | ) | | | 0.894 | | | | (0.038 | ) | | | 0.343 | | | | 0.255 | |
| | |
|
|
| |
|
|
| |
|
|
| |
|
|
| |
|
|
| |
|
|
|
Less distributions: | | | | | | | | | | | | | | | | | | | | | | | | |
Distributions from net investment income | | | — | | | | (0.252 | ) | | | (0.345 | ) | | | (0.359 | ) | | | (0.276 | ) | | | (0.210 | ) |
| | |
|
|
| |
|
|
| |
|
|
| |
|
|
| |
|
|
| |
|
|
|
Total distributions | | | — | | | | (0.252 | ) | | | (0.345 | ) | | | (0.359 | ) | | | (0.276 | ) | | | (0.210 | ) |
| | |
|
|
| |
|
|
| |
|
|
| |
|
|
| |
|
|
| |
|
|
|
Net asset value, end of period/year | | | $9.208 | | | | $10.053 | | | | $10.554 | | | | $10.005 | | | | $10.402 | | | | $10.335 | |
| | |
|
|
| |
|
|
| |
|
|
| |
|
|
| |
|
|
| |
|
|
|
Total return | | | (8.41)%6 | | | | (2.46 | )% | | | 8.92% | | | | (0.53)% | | | | 3.43% | | | | 2.47% | |
Supplemental data and ratios: | | | | | | | | | | | | | | | | | | | | | | | | |
Net assets, end of period/year | | | $23,851 | | | | $228,905 | | | | $476,449 | | | | $1,133,623 | | | | $667,898 | | | | $1,343,813 | |
Ratio of expenses to average net assets3 | | | | | | | | | | | | | | | | | | | | | | | | |
Before expense reimbursement (recapture) and securities lending credit4 | | | 0.47%7 | | | | 0.47% | | | | 0.49% | | | | 0.50% | | | | 0.51% | | | | 0.53% | |
After expense reimbursement (recapture) and securities lending credit4 | | | 0.21%7 | | | | 0.20% | | | | 0.21% | | | | 0.21% | | | | 0.20% | | | | 0.37% | |
Ratio of net investment income to average net assets5 | | | | | | | | | | | | | | | | | | | | | | | | |
Before expense reimbursement (recapture) and securities lending credit | | | 3.16%7 | | | | 2.26% | | | | 2.15% | | | | 2.82% | | | | 3.04% | | | | 2.64% | |
After expense reimbursement (recapture) and securities lending credit | | | 3.42%7 | | | | 2.53% | | | | 2.43% | | | | 3.11% | | | | 3.35% | | | | 2.80% | |
Portfolio turnover rate | | | 84.70%6 | | | | 27.64% | | | | 65.03% | | | | 161.00% | | | | 146.82% | | | | 154.33% | |
Portfolio Turnover is calculated for the Fund as a whole.
| 1 | | Net investment income per share has been calculated based on average shares outstanding during the period/year. |
| 2 | | Realized and unrealized gains and losses per share in this caption are balancing amounts necessary to reconcile the change in net asset value per share for the year, and may not reconcile with the aggregate gains and losses in the Statement of Operations due to share transactions for the year. |
| 3 | | These ratios exclude the impact of the expenses of the underlying investment companies and exchange-traded funds in which the Fund invests. |
| 4 | | Includes interest expense where applicable. See Note 5 in the Notes to the Financial Statements. Interest expense was 0.01%, 0.00%, 0.01%, 0.01%, 0.00% and 0.00%, respectively. |
| 5 | | Recognition of the net investment income by the Fund is affected by the timing of the declaration of dividends by the underlying investment companies and exchange-traded funds in which the Fund invests. |
See notes to financial statements.
134
GuideMark Funds & GuidePath Funds
FINANCIAL HIGHLIGHTS
| | | | | | | | | | | | | | | | | | | | | | | | |
| | | Absolute Return Allocation Fund
| |
| | | Service
| |
| | | Period Ended
September 30,
2022
| | | Year Ended
March 31,
2022
| | | Year Ended
March 31,
2021
| | | Year Ended
March 31,
2020
| | | Year Ended
March 31,
2019
| | | Year Ended
March 31,
2018
| |
| | | (Unaudited) | | | | | | | | | | | | | | | | |
Per share data for a share of capital stock outstanding for the entire period/year and selected information for the period/year are as follows: | | | | | | | | | | | | | | | | | | | | | | | | |
Net asset value, beginning of period/year | | | $10.080 | | | | $10.578 | | | | $10.010 | | | | $10.402 | | | | $10.348 | | | | $10.320 | |
Income from investment operations: | | | | | | | | | | | | | | | | | | | | | | | | |
Net investment income1 | | | 0.119 | | | | 0.227 | | | | 0.195 | | | | 0.266 | | | | 0.283 | | | | 0.231 | |
Net realized and unrealized gains (losses) on investments | | | (0.983 | ) | | | (0.515 | ) | | | 0.6345 | | | | (0.368 | ) | | | (0.001)5 | | | | (0.036 | ) |
| | |
|
|
| |
|
|
| |
|
|
| |
|
|
| |
|
|
| |
|
|
|
Total from investment operations | | | (0.864 | ) | | | (0.288 | ) | | | 0.829 | | | | (0.102 | ) | | | 0.282 | | | | 0.195 | |
| | |
|
|
| |
|
|
| |
|
|
| |
|
|
| |
|
|
| |
|
|
|
Less distributions: | | | | | | | | | | | | | | | | | | | | | | | | |
Distributions from net investment income | | | — | | | | (0.210 | ) | | | (0.261 | ) | | | (0.290 | ) | | | (0.228 | ) | | | (0.167 | ) |
| | |
|
|
| |
|
|
| |
|
|
| |
|
|
| |
|
|
| |
|
|
|
Total distributions | | | — | | | | (0.210 | ) | | | (0.261 | ) | | | (0.290 | ) | | | (0.228 | ) | | | (0.167 | ) |
| | |
|
|
| |
|
|
| |
|
|
| |
|
|
| |
|
|
| |
|
|
|
Net asset value, end of period/year | | | $9.216 | | | | $10.080 | | | | $10.578 | | | | $10.010 | | | | $10.402 | | | | $10.348 | |
| | |
|
|
| |
|
|
| |
|
|
| |
|
|
| |
|
|
| |
|
|
|
Total return | | | (8.57)%6 | | | | (2.80)% | | | | 8.26% | | | | (1.11)% | | | | 2.81% | | | | 1.88% | |
Supplemental data and ratios: | | | | | | | | | | | | | | | | | | | | | | | | |
Net assets, end of period/year | | | $334,450,112 | | | | $236,003,490 | | | | $212,656,486 | | | | $391,177,265 | | | | $312,866,645 | | | | 267,250,294 | |
Ratio of expenses to average net assets2 | | | | | | | | | | | | | | | | | | | | | | | | |
Before expense reimbursement (recapture) and securities lending credit3 | | | 0.82%7 | | | | 0.82% | | | | 1.09% | | | | 1.10% | | | | 1.11% | | | | 1.12% | |
After expense reimbursement (recapture) and securities lending credit3 | | | 0.57%7 | | | | 0.55% | | | | 0.81% | | | | 0.81% | | | | 0.80% | | | | 0.96% | |
Ratio of net investment income to average net assets4 | | | | | | | | | | | | | | | | | | | | | | | | |
Before expense reimbursement (recapture) and securities lending credit | | | 2.20%7 | | | | 1.87% | | | | 1.57% | | | | 2.22% | | | | 2.44% | | | | 2.04% | |
After expense reimbursement (recapture) and securities lending credit | | | 2.45%7 | | | | 2.14% | | | | 1.85% | | | | 2.51% | | | | 2.75% | | | | 2.20% | |
Portfolio turnover rate | | | 84.70%6 | | | | 27.64% | | | | 65.03% | | | | 161.00% | | | | 146.82% | | | | 154.33% | |
Portfolio Turnover is calculated for the Fund as a whole.
| 1 | | Net investment income per share has been calculated based on average shares outstanding during the period/year. |
| 2 | | These ratios exclude the impact of the expenses of the underlying investment companies and exchange-traded funds in which the Fund invests. |
| 3 | | Includes interest expense where applicable. See Note 5 in the Notes to the Financial Statements. Interest expense was 0.02%, 0.00%, 0.01%, 0.01%, 0.00% and 0.00%, respectively. |
| 4 | | Recognition of the net investment income by the Fund is affected by the timing of the declaration of dividends by the underlying investment companies and exchange-traded funds in which the Fund invests. |
| 5 | | Realized and unrealized gains and losses per share in this caption are balancing amounts necessary to reconcile the change in net asset value per share for the year, and may not reconcile with the aggregate gains and losses in the Statement of Operations due to share transactions for the year. |
See notes to financial statements.
135
GuideMark Funds & GuidePath Funds
FINANCIAL HIGHLIGHTS
| | | | | | | | | | | | | | | | | | | | | | | | |
| | | Multi-Asset Income Allocation Fund
| |
| | | Service
| |
| | | Period Ended
September 30,
2022
| | | Year Ended
March 31,
2022
| | | Year Ended
March 31,
2021
| | | Year Ended
March 31,
2020
| | | Year Ended
March 31,
2019
| | | Year Ended
March 31,
2018
| |
| | | (Unaudited) | | | | | | | | | | | | | | | | |
Per share data for a share of capital stock outstanding for the entire period/year and selected information for the period/year are as follows: | | | | | | | | | | | | | | | | | | | | | | | | |
Net asset value, beginning of period/year | | | $11.373 | | | | $11.332 | | | | $9.056 | | | | $10.660 | | | | $10.603 | | | | $10.460 | |
Income from investment operations: | | | | | | | | | | | | | | | | | | | | | | | | |
Net investment income1 | | | 0.190 | | | | 0.313 | | | | 0.270 | | | | 0.344 | | | | 0.358 | | | | 0.287 | |
Net realized and unrealized gains (losses) on investments | | | (1.938 | ) | | | 0.044 | | | | 2.272 | | | | (1.632 | ) | | | 0.062 | | | | 0.137 | |
| | |
|
|
| |
|
|
| |
|
|
| |
|
|
| |
|
|
| |
|
|
|
Total from investment operations | | | (1.748 | ) | | | 0.357 | | | | 2.542 | | | | (1.288 | ) | | | 0.420 | | | | 0.424 | |
| | |
|
|
| |
|
|
| |
|
|
| |
|
|
| |
|
|
| |
|
|
|
Less distributions: | | | | | | | | | | | | | | | | | | | | | | | | |
Distributions from net investment income | | | (0.211 | ) | | | (0.316 | ) | | | (0.266 | ) | | | (0.313 | ) | | | (0.363 | ) | | | (0.281 | ) |
Distributions from net realized gains | | | — | | | | — | | | | — | | | | (0.003 | ) | | | — | | | | — | |
| | |
|
|
| |
|
|
| |
|
|
| |
|
|
| |
|
|
| |
|
|
|
Total distributions | | | (0.211 | ) | | | (0.316 | ) | | | (0.266 | ) | | | (0.316 | ) | | | (0.363 | ) | | | (0.281 | ) |
| | |
|
|
| |
|
|
| |
|
|
| |
|
|
| |
|
|
| |
|
|
|
Net asset value, end of period/year | | | $9.414 | | | | $11.373 | | | | $11.332 | | | | $9.056 | | | | $10.660 | | | | $10.603 | |
| | |
|
|
| |
|
|
| |
|
|
| |
|
|
| |
|
|
| �� |
|
|
|
Total return | | | (15.47)%5 | | | | 3.09% | | | | 28.42% | | | | (12.53)% | | | | 4.13% | | | | 4.05% | |
Supplemental data and ratios: | | | | | | | | | | | | | | | | | | | | | | | | |
Net assets, end of period/year | | | $81,945,141 | | | | $111,888,042 | | | | $132,821,013 | | | | $112,044,753 | | | | $132,260,092 | | | | $119,091,615 | |
Ratio of expenses to average net assets2 | | | | | | | | | | | | | | | | | | | | | | | | |
Before expense reimbursement (recapture) and securities lending credit3 | | | 0.86%6 | | | | 0.84% | | | | 1.09% | | | | 1.12% | | | | 1.15% | | | | 1.13% | |
After expense reimbursement (recapture) and securities lending credit3 | | | 0.59%6 | | | | 0.70% | | | | 0.96% | | | | 0.92% | | | | 0.82% | | | | 0.98% | |
Ratio of net investment income to average net assets4 | | | | | | | | | | | | | | | | | | | | | | | | |
Before expense reimbursement (recapture) and securities lending credit | | | 3.33%6 | | | | 2.55% | | | | 2.48% | | | | 2.99% | | | | 3.08% | | | | 2.52% | |
After expense reimbursement (recapture) and securities lending credit | | | 3.60%6 | | | | 2.69% | | | | 2.61% | | | | 3.19% | | | | 3.41% | | | | 2.67% | |
Portfolio turnover rate | | | 28.92%5 | | | | 24.21% | | | | 73.27% | | | | 85.15% | | | | 44.77% | | | | 131.23% | |
| 1 | | Net investment income per share has been calculated based on average shares outstanding during the period/year. |
| 2 | | These ratios exclude the impact of the expenses of the underlying investment companies and exchange-traded funds in which the Fund invests. |
| 3 | | Includes interest expense where applicable. See Note 5 in the Notes to the Financial Statements. Interest expense was 0.01%, 0.00%, 0.00%, 0.00%, 0.00% and 0.00%, respectively. |
| 4 | | Recognition of the net investment income by the Fund is affected by the timing of the declaration of dividends by the underlying investment companies and exchange-traded funds in which the Fund invests. |
See notes to financial statements.
136
GuideMark Funds & GuidePath Funds
FINANCIAL HIGHLIGHTS
| | | | | | | | | | | | | | | | | | | | | | | | |
| | | Flexible Income Allocation Fund
| |
| | | Institutional
| |
| | | Period Ended
September 30,
2022
| | | Year Ended
March 31,
2022
| | | Year Ended
March 31,
2021
| | | Year Ended
March 31,
2020
| | | Year Ended
March 31,
2019
| | | Year Ended
March 31,
2018
| |
| | | (Unaudited) | | | | | | | | | | | | | | | | |
Per share data for a share of capital stock outstanding for the entire period/year and selected information for the period/year are as follows: | | | | | | | | | | | | | | | | | | | | | | | | |
Net asset value, beginning of period/year | | | $10.080 | | | | $10.582 | | | | $9.368 | | | | $9.422 | | | | $9.577 | | | | $9.670 | |
Income from investment operations: | | | | | | | | | | | | | | | | | | | | | | | | |
Net investment income1 | | | 0.099 | | | | 0.254 | | | | 0.511 | | | | 0.391 | | | | 0.426 | | | | 0.543 | |
Net realized and unrealized gains (losses) on investments | | | (1.099 | ) | | | (0.453 | ) | | | 0.9892 | | | | (0.076)2 | | | | (0.183 | ) | | | (0.158)2 | |
| | |
|
|
| |
|
|
| |
|
|
| |
|
|
| |
|
|
| |
|
|
|
Total from investment operations | | | (1.000 | ) | | | (0.199 | ) | | | 1.500 | | | | 0.315 | | | | 0.243 | | | | 0.385 | |
| | |
|
|
| |
|
|
| |
|
|
| |
|
|
| |
|
|
| |
|
|
|
Less distributions: | | | | | | | | | | | | | | | | | | | | | | | | |
Distributions from net investment income | | | (0.096 | ) | | | (0.236 | ) | | | (0.286 | ) | | | (0.369 | ) | | | (0.398 | ) | | | (0.478 | ) |
Distributions from net realized gains | | | — | | | | (0.067 | ) | | | — | | | | — | | | | — | | | | — | |
| | |
|
|
| |
|
|
| |
|
|
| |
|
|
| |
|
|
| |
|
|
|
Total distributions | | | (0.096 | ) | | | (0.303 | ) | | | (0.286 | ) | | | (0.369 | ) | | | (0.398 | ) | | | (0.478 | ) |
| | |
|
|
| |
|
|
| |
|
|
| |
|
|
| |
|
|
| |
|
|
|
Net asset value, end of period/year | | | $8.984 | | | | $10.080 | | | | $10.582 | | | | $9.368 | | | | $9.422 | | | | $9.577 | |
| | |
|
|
| |
|
|
| |
|
|
| |
|
|
| |
|
|
| |
|
|
|
Total return | | | (9.96)%6 | | | | (2.02)% | | | | 16.10% | | | | 3.38% | | | | 2.58% | | | | 3.99% | |
Supplemental data and ratios: | | | | | | | | | | | | | | | | | | | | | | | | |
Net assets, end of period/year | | | $7,600 | | | | $8,598 | | | | $7,747 | | | | $34,154 | | | | $26,280 | | | | $224,505 | |
Ratio of expenses to average net assets3 | | | | | | | | | | | | | | | | | | | | | | | | |
Before expense reimbursement (recapture) and securities lending credit4 | | | 0.31%7 | | | | 0.30% | | | | 0.37% | | | | 0.45% | | | | 0.56% | | | | 0.52% | |
After expense reimbursement (recapture) and securities lending credit4 | | | 0.15%7 | | | | 0.15% | | | | 0.15% | | | | 0.15% | | | | 0.16% | | | | 0.27% | |
Ratio of net investment income to average net assets5 | | | | | | | | | | | | | | | | | | | | | | | | |
Before expense reimbursement (recapture) and securities lending credit | | | 1.90%7 | | | | 2.24% | | | | 4.84% | | | | 3.81% | | | | 4.07% | | | | 5.27% | |
After expense reimbursement (recapture) and securities lending credit | | | 2.06%7 | | | | 2.39% | | | | 5.06% | | | | 4.11% | | | | 4.47% | | | | 5.52% | |
Portfolio turnover rate | | | 262.68%6 | | | | 195.55% | | | | 211.84% | | | | 517.05% | | | | 380.48% | | | | 232.11% | |
Portfolio Turnover is calculated for the Fund as a whole.
| 1 | | Net investment income per share has been calculated based on average shares outstanding during the period/year. |
| 2 | | Realized and unrealized gains and losses per share in this caption are balancing amounts necessary to reconcile the change in net asset value per share for the year, and may not reconcile with the aggregate gains and losses in the Statement of Operations due to share transactions for the period/year. |
| 3 | | These ratios exclude the impact of the expenses of the underlying investment companies and exchange-traded funds in which the Fund invests. |
| 4 | | Includes interest expense where applicable. See Note 5 in the Notes to the Financial Statements. Interest expense was 0.00%, 0.00%, 0.00%, 0.00%, 0.01% and 0.00%, respectively. |
| 5 | | Recognition of the net investment income by the Fund is affected by the timing of the declaration of dividends by the underlying investment companies and exchange-traded funds in which the Fund invests. |
See notes to financial statements.
137
GuideMark Funds & GuidePath Funds
FINANCIAL HIGHLIGHTS
| | | | | | | | | | | | | | | | | | | | | | | | |
| | | Flexible Income Allocation Fund
| |
| | | Service
| |
| | | Period Ended
September 30,
2022
| | | Year Ended
March 31,
2022
| | | Year Ended
March 31,
2021
| | | Year Ended
March 31,
2020
| | | Year Ended
March 31,
2019
| | | Year Ended
March 31,
2018
| |
| | | (Unaudited) | | | | | | | | | | | | | | | | |
Per share data for a share of capital stock outstanding for the entire period/year and selected information for the period/year are as follows: | | | | | | | | | | | | | | | | | | | | | | | | |
Net asset value, beginning of period/year | | | $9.991 | | | | $10.497 | | | | $9.304 | | | | $9.366 | | | | $9.525 | | | | $9.610 | |
Income from investment operations: | | | | | | | | | | | | | | | | | | | | | | | | |
Net investment income1 | | | 0.081 | | | | 0.213 | | | | 0.250 | | | | 0.331 | | | | 0.361 | | | | 0.340 | |
Net realized and unrealized gains (losses) on investments | | | (1.091 | ) | | | (0.445 | ) | | | 1.1752 | | | | (0.076)2 | | | | (0.173 | ) | | | (0.018)2 | |
| | |
|
|
| |
|
|
| |
|
|
| |
|
|
| |
|
|
| |
|
|
|
Total from investment operations | | | (1.010 | ) | | | (0.232 | ) | | | 1.425 | | | | 0.255 | | | | 0.188 | | | | 0.322 | |
| | |
|
|
| |
|
|
| |
|
|
| |
|
|
| |
|
|
| |
|
|
|
Less distributions: | | | | | | | | | | | | | | | | | | | | | | | | |
Distributions from net investment income | | | (0.080 | ) | | | (0.207 | ) | | | (0.232 | ) | | | (0.317 | ) | | | (0.347 | ) | | | (0.407 | ) |
Distributions from net realized gains | | | — | | | | (0.067 | ) | | | — | | | | — | | | | — | | | | — | |
| | |
|
|
| |
|
|
| |
|
|
| |
|
|
| |
|
|
| |
|
|
|
Total distributions | | | (0.080 | ) | | | (0.274 | ) | | | (0.232 | ) | | | (0.317 | ) | | | (0.347 | ) | | | (0.407 | ) |
| | |
|
|
| |
|
|
| |
|
|
| |
|
|
| |
|
|
| |
|
|
|
Net asset value, end of period/year | | | $8.901 | | | | $9.991 | | | | $10.497 | | | | $9.304 | | | | $9.366 | | | | $9.525 | |
| | |
|
|
| |
|
|
| |
|
|
| |
|
|
| |
|
|
| |
|
|
|
Total return | | | (10.13)%6 | | | | (2.33)% | | | | 15.38% | | | | 2.76% | | | | 2.00% | | | | 3.35% | |
Supplemental data and ratios: | | | | | | | | | | | | | | | | | | | | | | | | |
Net assets, end of period/year | | | $306,498,826 | | | | $347,766,775 | | | | $279,838,116 | | | | $98,516,379 | | | | $59,741,077 | | | | $55,246,464 | |
Ratio of expenses to average net assets3 | | | | | | | | | | | | | | | | | | | | | | | | |
Before expense reimbursement (recapture) and securities lending credit4 | | | 0.70%7 | | | | 0.70% | | | | 0.99% | | | | 1.05% | | | | 1.15% | | | | 1.12% | |
After expense reimbursement (recapture) and securities lending credit4 | | | 0.50%7 | | | | 0.50% | | | | 0.75% | | | | 0.75% | | | | 0.77% | | | | 0.93% | |
Ratio of net investment income to average net assets5 | | | | | | | | | | | | | | | | | | | | | | | | |
Before expense reimbursement (recapture) and securities lending credit | | | 1.50%7 | | | | 1.83% | | | | 2.17% | | | | 3.20% | | | | 3.45% | | | | 3.30% | |
After expense reimbursement (recapture) and securities lending credit | | | 1.70%7 | | | | 2.03% | | | | 2.41% | | | | 3.50% | | | | 3.83% | | | | 3.49% | |
Portfolio turnover rate | | | 262.68%6 | | | | 195.55% | | | | 211.84% | | | | 517.05% | | | | 380.48% | | | | 232.21% | |
Portfolio Turnover is calculated for the Fund as a whole.
| 1 | | Net investment income per share has been calculated based on average shares outstanding during the period/year. |
| 2 | | Realized and unrealized gains and losses per share in this caption are balancing amounts necessary to reconcile the change in net asset value per share for the year, and may not reconcile with the aggregate gains and losses in the Statement of Operations due to share transactions for the year. |
| 3 | | These ratios exclude the impact of the expenses of the underlying investment companies and exchange-traded funds in which the Fund invests. |
| 4 | | Includes interest expense where applicable. See Note 5 in the Notes to the Financial Statements. Interest expense was 0.00%, 0.00%, 0.00%, 0.00%, 0.02% and 0.00%, respectively. |
| 5 | | Recognition of the net investment income by the Fund is affected by the timing of the declaration of dividends by the underlying investment companies and exchange-traded funds in which the Fund invests. |
See notes to financial statements.
138
GuideMark Funds & GuidePath Funds
FINANCIAL HIGHLIGHTS
| | | | | | | | | | | | | | | | | | | | | | | | |
| | | Managed Futures Strategy Fund (Consolidated)
| |
| | | Institutional
| |
| | | Period Ended
September 30,
2022
| | | Year Ended
March 31,
2022
| | | Year Ended
March 31,
2021
| | | Year Ended
March 31,
2020
| | | Year Ended
March 31,
2019
| | | Year Ended
March 31,
2018
| |
| | | (Unaudited) | | | | | | | | | | | | | | | | |
Per share data for a share of capital stock outstanding for the entire period/year and selected information for the period/year are as follows: | | | | | | | | | | | | | | | | | | | | | | | | |
Net asset value, beginning of period/year | | | $10.136 | | | | $9.504 | | | | $8.813 | | | | $8.067 | | | | $8.665 | | | | $8.700 | |
Income from investment operations: | | | | | | | | | | | | | | | | | | | | | | | | |
Net investment income (loss)1 | | | (0.033 | ) | | | (0.106 | ) | | | (0.084 | ) | | | 0.063 | | | | 0.081 | | | | (0.002 | ) |
Net realized and unrealized gains (losses) on investments | | | 2.672 | | | | 1.607 | | | | 1.079 | | | | 1.097 | | | | (0.679 | ) | | | (0.033 | ) |
| | |
|
|
| |
|
|
| |
|
|
| |
|
|
| |
|
|
| |
|
|
|
Total from investment operations | | | 2.639 | | | | 1.501 | | | | 0.995 | | | | 1.160 | | | | (0.598 | ) | | | (0.035 | ) |
| | |
|
|
| |
|
|
| |
|
|
| |
|
|
| |
|
|
| |
|
|
|
Less distributions: | | | | | | | | | | | | | | | | | | | | | | | | |
Distributions from net investment income | | | — | | | | (0.262 | ) | | | — | | | | (0.131 | ) | | | — | | | | — | |
Distributions from net realized gains | | | — | | | | (0.607 | ) | | | (0.304 | ) | | | (0.283 | ) | | | — | | | | — | |
| | |
|
|
| |
|
|
| |
|
|
| |
|
|
| |
|
|
| |
|
|
|
Total distributions | | | — | | | | (0.869 | ) | | | (0.304 | ) | | | (0.414 | ) | | | — | | | | — | |
| | |
|
|
| |
|
|
| |
|
|
| |
|
|
| |
|
|
| |
|
|
|
Net asset value, end of period/year | | | $12.775 | | | | $10.136 | | | | $9.504 | | | | $ 8.813 | | | | $8.067 | | | | $8.665 | |
| | |
|
|
| |
|
|
| |
|
|
| |
|
|
| |
|
|
| |
|
|
|
Total return | | | 26.00%3 | | | | 17.34% | | | | 11.46% | | | | 14.70% | | | | (6.90)% | | | | (0.40)% | |
Supplemental data and ratios: | | | | | | | | | | | | | | | | | | | | | | | | |
Net assets, end of period/year | | | $5,258 | | | | $176,686 | | | | $483,785 | | | | $1,220,564 | | | | $961,919 | | | | $1,215,018 | |
Ratio of expenses to average net assets | | | | | | | | | | | | | | | | | | | | | | | | |
Before expense reimbursement (recapture) and fees waived2 | | | 1.14%4 | | | | 1.19% | | | | 1.21% | | | | 1.25% | | | | 1.27% | | | | 1.38% | |
After expense reimbursement (recapture) and fees waived2 | | | 1.14%4 | | | | 1.19% | | | | 1.29% | | | | 1.30% | | | | 1.30% | | | | 1.34% | |
Ratio of net investment gain (loss) to average net assets | | | | | | | | | | | | | | | | | | | | | | | | |
Before expense reimbursement (recapture) and fees waived | | | (0.61)%4 | | | | (1.12)% | | | | (0.87)% | | | | 0.79% | | | | 1.03% | | | | (0.07)% | |
After expense reimbursement (recapture) and fees waived | | | (0.61)%4 | | | | (1.12)% | | | | (0.95)% | | | | 0.74% | | | | 1.00% | | | | (0.03)% | |
Portfolio turnover rate | | | 0.00%3 | | | | 0.00% | | | | 0.00% | | | | 0.00% | | | | 0.00% | | | | 0.00% | |
Portfolio Turnover is calculated for the Fund as a whole.
| 1 | | Net investment income (loss) per share has been calculated based on average shares outstanding during the period/year. |
| 2 | | Includes interest expense where applicable. See Note 5 in the Notes to the Financial Statements. Interest expense was 0.00%, 0.00%, 0.00%, 0.00%, 0.00% and 0.04%, respectively. |
See notes to financial statements.
139
GuideMark Funds & GuidePath Funds
FINANCIAL HIGHLIGHTS
| | | | | | | | | | | | | | | | | | | | | | | | |
| | | Managed Futures Strategy Fund (Consolidated)
| |
| | | Service
| |
| | | Period Ended
September 30,
2022
| | | Year Ended
March 31,
2022
| | | Year Ended
March 31,
2021
| | | Year Ended
March 31,
2020
| | | Year Ended
March 31,
2019
| | | Year Ended
March 31,
2018
| |
| | | (Unaudited) | | | | | | | | | | | | | | | | |
Per share data for a share of capital stock outstanding for the entire period/year and selected information for the period/year are as follows: | | | | | | | | | | | | | | | | | | | | | | | | |
Net asset value, beginning of period/year | | | $9.893 | | | | $9.268 | | | | $8.648 | | | | $7.914 | | | | $8.551 | | | | $8.640 | |
Income from investment operations: | | | | | | | | | | | | | | | | | | | | | | | | |
Net investment income (loss)1 | | | 0.000 | | | | (0.136 | ) | | | (0.129 | ) | | | 0.011 | | | | 0.035 | | | | (0.050 | ) |
Net realized and unrealized gains (losses) on investments | | | 2.502 | | | | 1.570 | | | | 1.053 | | | | 1.077 | | | | (0.672 | ) | | | (0.039 | ) |
| | |
|
|
| |
|
|
| |
|
|
| |
|
|
| |
|
|
| |
|
|
|
Total from investment operations | | | 2.502 | | | | 1.434 | | | | 0.924 | | | | 1.088 | | | | (0.637 | ) | | | (0.089 | ) |
| | |
|
|
| |
|
|
| |
|
|
| |
|
|
| |
|
|
| |
|
|
|
Less distributions: | | | | | | | | | | | | | | | | | | | | | | | | |
Distributions from net investment income | | | — | | | | (0.202 | ) | | | — | | | | (0.071 | ) | | | — | | | | — | |
Distributions from net realized gains | | | — | | | | (0.607 | ) | | | (0.304 | ) | | | (0.283 | ) | | | — | | | | — | |
| | |
|
|
| |
|
|
| |
|
|
| |
|
|
| |
|
|
| |
|
|
|
Total distributions | | | — | | | | (0.809 | ) | | | (0.304 | ) | | | (0.354 | ) | | | — | | | | — | |
| | |
|
|
| |
|
|
| |
|
|
| |
|
|
| |
|
|
| |
|
|
|
Net asset value, end of period/year | | | $12.395 | | | | $9.893 | | | | $9.268 | | | | $8.648 | | | | $7.914 | | | | $8.551 | |
| | |
|
|
| |
|
|
| |
|
|
| |
|
|
| |
|
|
| |
|
|
|
Total return | | | 25.27%3 | | | | 16.94% | | | | 10.84% | | | | 14.03% | | | | (7.45)% | | | | (0.92)% | |
Supplemental data and ratios: | | | | | | | | | | | | | | | | | | | | | | | | |
Net assets, end of period/year | | | $572,291,983 | | | | $251,272,515 | | | | $207,653,403 | | | | $221,868,264 | | | | $156,397,141 | | | | $121,362,278 | |
Ratio of expenses to average net assets | | | | | | | | | | | | | | | | | | | | | | | | |
Before expense reimbursement (recapture) and fees waived2 | | | 1.50%4 | | | | 1.54% | | | | 1.80% | | | | 1.85% | | | | 1.87% | | | | 1.97% | |
After expense reimbursement (recapture) and fees waived2 | | | 1.50%4 | | | | 1.54% | | | | 1.81% | | | | 1.90% | | | | 1.90% | | | | 1.94% | |
Ratio of net investment gain (loss) to average net assets | | | | | | | | | | | | | | | | | | | | | | | | |
Before expense reimbursement (recapture) and fees waived | | | 0.01%4 | | | | (1.47)% | | | | (1.47)% | | | | 0.18% | | | | 0.47% | | | | (0.61)% | |
After expense reimbursement (recapture) and fees waived | | | 0.01%4 | | | | (1.47)% | | | | (1.48)% | | | | 0.13% | | | | 0.44% | | | | (0.58)% | |
Portfolio turnover rate | | | 0.00%3 | | | | 0.00% | | | | 0.00% | | | | 0.00% | | | | 0.00% | | | | 0.00% | |
Portfolio Turnover is calculated for the Fund as a whole.
| 1 | | Net investment income (loss) per share has been calculated based on average shares outstanding during the period/year. |
| 2 | | Includes interest expense where applicable. See Note 5 in the Notes to the Financial Statements. Interest expense was 0.00%, 0.00%, 0.00%, 0.00%, 0.00% and 0.04%, respectively. |
See notes to financial statements.
140
GuideMark Funds & GuidePath Funds
FINANCIAL HIGHLIGHTS
| | | | | | | | | | | | | | | | | | | | |
| | | Conservative Income Fund
| |
| | | Period Ended
September 30,
2022
| | | Year Ended
March 31,
2022
| | | Year Ended
March 31,
2021
| | | Year Ended
March 31,
2020
| | | April 30, 20181
through
March 31,
2019
| |
| | | (Unaudited) | | | | | | | | | | | | | |
Per share data for a share of capital stock outstanding for the entire period/year and selected information for the period/year are as follows: | | | | | | | | | | | | | | | | | | | | |
Net asset value, beginning of period/year | | | $9.776 | | | | $9.938 | | | | $9.899 | | | | $9.987 | | | | $10.000 | |
Income from investment operations: | | | | | | | | | | | | | | | | | | | | |
Net investment income2 | | | 0.060 | | | | 0.049 | | | | 0.029 | | | | 0.177 | | | | 0.153 | |
Net realized and unrealized gains (losses) on investments | | | (0.171 | ) | | | (0.159 | ) | | | 0.044 | | | | (0.092 | ) | | | (0.020)7 | |
| | |
|
|
| |
|
|
| |
|
|
| |
|
|
| |
|
|
|
Total from investment operations | | | (0.111 | ) | | | (0.110 | ) | | | 0.073 | | | | 0.085 | | | | 0.133 | |
| | |
|
|
| |
|
|
| |
|
|
| |
|
|
| |
|
|
|
Less distributions: | | | | | | | | | | | | | | | | | | | | |
Distributions from net investment income | | | (0.060 | ) | | | (0.052 | ) | | | (0.034 | ) | | | (0.173 | ) | | | (0.144 | ) |
Distributions from net realized gains | | | — | | | | — | | | | — | | | | — | | | | (0.002 | ) |
| | |
|
|
| |
|
|
| |
|
|
| |
|
|
| |
|
|
|
Total distributions | | | (0.060 | ) | | | (0.052 | ) | | | (0.034 | ) | | | (0.173 | ) | | | (0.146 | ) |
| | |
|
|
| |
|
|
| |
|
|
| |
|
|
| |
|
|
|
Net asset value, end of period/year | | | $9.605 | | | | $9.776 | | | | $9.938 | | | | $9.899 | | | | $9.987 | |
| | |
|
|
| |
|
|
| |
|
|
| |
|
|
| |
|
|
|
Total return | | | (1.14)%3 | | | | (1.12)% | | | | 0.74% | | | | 0.85% | | | | 1.34%3 | |
Supplemental data and ratios: | | | | | | | | | | | | | | | | | | | | |
Net assets, end of period/year | | | $16,773,867 | | | | $10,911,849 | | | | $15,926,192 | | | | $6,724,818 | | | | $973,527 | |
Ratio of expenses to average net assets4 | | | | | | | | | | | | | | | | | | | | |
Before expense reimbursement (recapture) and securities lending credit | | | 0.93%5 | | | | 1.06% | | | | 1.14% | | | | 2.23% | | | | 43.40%5 | |
After expense reimbursement (recapture) and securities lending credit | | | 0.64%5 | | | | 0.64% | | | | 0.64% | | | | 0.64% | | | | 0.64%5 | |
Ratio of net investment income to average net assets6 | | | | | | | | | | | | | | | | | | | | |
Before expense reimbursement (recapture) and fees waived | | | 0.95%5 | | | | 0.08% | | | | (0.20)% | | | | 0.18% | | | | (41.09)%5 | |
After expense reimbursement (recapture) and fees waived | | | 1.24%5 | | | | 0.50% | | | | 0.30% | | | | 1.77% | | | | 1.67%5 | |
Portfolio turnover rate | | | 241.71%3 | | | | 161.18% | | | | 190.65% | | | | 190.99% | | | | 388.79%3 | |
| 1 | | Commencement of operations. |
| 2 | | Net investment income per share has been calculated based on average shares outstanding during the period/year. |
| 4 | | These ratios exclude the impact of the expenses of the underlying investment companies and exchange-traded funds in which the Fund invests. |
| 6 | | Recognition of the net investment income by the Fund is affected by the timing of the declaration of dividends by the underlying investment companies and exchange-traded funds in which the Fund invests. |
| 7 | | Realized and unrealized gains and losses per shares in this caption are balancing amounts necessary to reconcile the change in net asset value per share for the year, and may not reconcile with aggregate gains and losses in the Statement of Operations due to share transactions for the year. |
See notes to financial statements.
141
GuideMark Funds & GuidePath Funds
FINANCIAL HIGHLIGHTS
| | | | | | | | | | | | | | | | | | | | |
| | | Income Fund
| |
| | | Period Ended
September 30,
2022
| | | Year Ended
March 31,
2022
| | | Year Ended
March 31,
2021
| | | Year Ended
March 31,
2020
| | | April 30, 20181
through
March 31,
2019
| |
| | | (Unaudited) | | | | | | | | | | | | | |
Per share data for a share of capital stock outstanding for the entire period/year and selected information for the period/year are as follows: | | | | | | | | | | | | | | | | | | | | |
Net asset value, beginning of period/year | | | $9.204 | | | | $9.950 | | | | $9.857 | | | | $9.892 | | | | $10.000 | |
Income from investment operations: | | | | | | | | | | | | | | | | | | | | |
Net investment income2 | | | 0.063 | | | | 0.208 | | | | 0.186 | | | | 0.284 | | | | 0.079 | |
Net realized and unrealized gains (losses) on investments | | | (0.921 | ) | | | (0.745 | ) | | | 0.0907 | | | | (0.048)7 | | | | 0.0167 | |
| | |
|
|
| |
|
|
| |
|
|
| |
|
|
| |
|
|
|
Total from investment operations | | | (0.858 | ) | | | (0.537 | ) | | | 0.276 | | | | 0.236 | | | | 0.095 | |
| | |
|
|
| |
|
|
| |
|
|
| |
|
|
| |
|
|
|
Less distributions: | | | | | | | | | | | | | | | | | | | | |
Distributions from net investment income | | | (0.065 | ) | | | (0.209 | ) | | | (0.183 | ) | | | (0.266 | ) | | | (0.203 | ) |
Distributions from net realized gains | | | — | | | | — | | | | — | | | | (0.005 | ) | | | — | |
| | |
|
|
| |
|
|
| |
|
|
| |
|
|
| |
|
|
|
Total distributions | | | (0.065 | ) | | | (0.209 | ) | | | (0.183 | ) | | | (0.271 | ) | | | (0.203 | ) |
| | |
|
|
| |
|
|
| |
|
|
| |
|
|
| |
|
|
|
Net asset value, end of period/year | | | $8.281 | | | | $9.204 | | | | $9.950 | | | | $9.857 | | | | $9.892 | |
| | |
|
|
| |
|
|
| |
|
|
| |
|
|
| |
|
|
|
Total return | | | (9.35)% | | | | (5.53)% | | | | 2.79% | | | | 2.34% | | | | 0.99%3 | |
Supplemental data and ratios: | | | | | | | | | | | | | | | | | | | | |
Net assets, end of period/year | | | $53,580,778 | | | | $44,470,391 | | | | $38,031,721 | | | | $32,494,874 | | | | $3,619,628 | |
Ratio of expenses to average net assets4 | | | | | | | | | | | | | | | | | | | | |
Before expense reimbursement (recapture) and securities lending credit8 | | | 0.85% | | | | 0.88% | | | | 0.92% | | | | 1.18% | | | | 16.23%5 | |
After expense reimbursement (recapture) and securities lending credit8 | | | 0.79% | | | | 0.79% | | | | 0.80% | | | | 0.79% | | | | 0.79%5 | |
Ratio of net investment income to average net assets6 | | | | | | | | | | | | | | | | | | | | |
Before expense reimbursement (recapture) and fees waived | | | 1.38% | | | | 2.02% | | | | 1.73% | | | | 2.39% | | | | (14.57)%5 | |
After expense reimbursement (recapture) and fees waived | | | 1.44% | | | | 2.11% | | | | 1.85% | | | | 2.79% | | | | 0.87%5 | |
Portfolio turnover rate | | | 97.41% | | | | 222.96% | | | | 194.13% | | | | 247.58% | | | | 801.50%3 | |
| 1 | | Commencement of operations. |
| 2 | | Net investment income per share has been calculated based on average shares outstanding during the period/year. |
| 4 | | These ratios exclude the impact of the expenses of the underlying investment companies and exchange-traded funds in which the Fund invests. |
| 6 | | Recognition of the net investment income by the Fund is affected by the timing of the declaration of dividends by the underlying investment companies and exchange-traded funds in which the Fund invests. |
| 7 | | Realized and unrealized gains and losses per shares in this caption are balancing amounts necessary to reconcile the change in net asset value per share for the year, and may not reconcile with aggregate gains and losses in the Statement of Operations due to share transactions for the year. |
| 8 | | Includes interest expense where applicable. See Note 5 in the Notes to the Financial Statements. Interest expense was 0.00%, 0.00%, 0.01%, 0.00% and 0.00%, respectively. |
See notes to financial statements.
142
GuideMark Funds & GuidePath Funds
FINANCIAL HIGHLIGHTS
| | | | | | | | | | | | | | | | | | | | |
| | | Growth & Income Fund
| |
| | | Period Ended
September 30,
2022
| | | Year Ended
March 31,
2022
| | | Year Ended
March 31,
2021
| | | Year Ended
March 31,
2020
| | | April 30, 20181
through
March 31,
2019
| |
| | | (Unaudited) | | | | | | | | | | | | | |
Per share data for a share of capital stock outstanding for the entire period/year and selected information for the period/year are as follows: | | | | | | | | | | | | | | | | | | | | |
Net asset value, beginning of period/year | | | $11.023 | | | | $11.683 | | | | $8.717 | | | | $9.772 | | | | $10.000 | |
Income from investment operations: | | | | | | | | | | | | | | | | | | | | |
Net investment income2 | | | 0.101 | | | | 0.110 | | | | 0.134 | | | | 0.189 | | | | 0.331 | |
Net realized and unrealized gains (losses) on investments | | | (1.383 | ) | | | 0.888 | | | | 2.959 | | | | (1.094 | ) | | | (0.320)7 | |
| | |
|
|
| |
|
|
| |
|
|
| |
|
|
| |
|
|
|
Total from investment operations | | | (1.282 | ) | | | 0.998 | | | | 3.093 | | | | (0.905 | ) | | | 0.011 | |
| | |
|
|
| |
|
|
| |
|
|
| |
|
|
| |
|
|
|
Less distributions: | | | | | | | | | | | | | | | | | | | | |
Distributions from net investment income | | | (0.098 | ) | | | (0.139 | ) | | | (0.127 | ) | | | (0.146 | ) | | | (0.239 | ) |
Distributions from net realized gains (losses) | | | — | | | | (1.519 | ) | | | — | | | | (0.004 | ) | | | — | |
| | |
|
|
| |
|
|
| |
|
|
| |
|
|
| |
|
|
|
Total distributions | | | (0.098 | ) | | | (1.658 | ) | | | (0.127 | ) | | | (0.150 | ) | | | (0.239 | ) |
| | |
|
|
| |
|
|
| |
|
|
| |
|
|
| |
|
|
|
Net asset value, end of period/year | | | $9.643 | | | | $11.023 | | | | $11.683 | | | | $8.717 | | | | $9.772 | |
| | |
|
|
| |
|
|
| |
|
|
| |
|
|
| |
|
|
|
Total return | | | (11.67)%3 | | | | 7.90% | | | | 35.67% | | | | (9.45)% | | | | 0.14%3 | |
Supplemental data and ratios: | | | | | | | | | | | | | | | | | | | | |
Net assets, end of period/year | | | $93,381,721 | | | | $116,833,573 | | | | $86,833,376 | | | | $33,927,659 | | | | $4,519,060 | |
Ratio of expenses to average net assets4 | | | | | | | | | | | | | | | | | | | | |
Before expense reimbursement (recapture) and securities lending credit8 | | | 0.92%5 | | | | 0.87% | | | | 0.95% | | | | 1.34% | | | | 27.58%5 | |
After expense reimbursement (recapture) and securities lending credit8 | | | 0.86%5 | | | | 0.81% | | | | 0.80% | | | | 0.79% | | | | 0.79%5 | |
Ratio of net investment income to average net assets6 | | | | | | | | | | | | | | | | | | | | |
Before expense reimbursement (recapture) and fees waived | | | 1.87%5 | | | | 0.86% | | | | 1.13% | | | | 1.34% | | | | (23.11)%5 | |
After expense reimbursement (recapture) and fees waived | | | 1.93%5 | | | | 0.92% | | | | 1.28% | | | | 1.89% | | | | 3.68%5 | |
Portfolio turnover rate | | | 19.61%3 | | | | 174.37% | | | | 108.96% | | | | 159.34% | | | | 123.50%3 | |
| 1 | | Commencement of operations. |
| 2 | | Net investment income per share has been calculated based on average shares outstanding during the period/year. |
| 4 | | These ratios exclude the impact of the expenses of the underlying investment companies and exchange-traded funds in which the Fund invests. |
| 6 | | Recognition of the net investment income by the Fund is affected by the timing of the declaration of dividends by the underlying investment companies and exchange-traded funds in which the Fund invests. |
| 7 | | Realized and unrealized gains and losses per shares in this caption are balancing amounts necessary to reconcile the change in net asset value per share for the year, and may not reconcile with aggregate gains and losses in the Statement of Operations due to share transactions for the year. |
| 8 | | Includes interest expense where applicable. See Note 5 in the Notes to the Financial Statements. Interest expense was 0.07%, 0.02%, 0.01%, 0.00% and 0.00%, respectively. |
See notes to financial statements.
143
GuideMark Funds & GuidePath Funds
NOTES TO FINANCIAL STATEMENTS (Unaudited)
September 30, 2022
GPS Funds I and GPS Funds II (the “Trusts”) are organized as Delaware statutory trusts under Declarations of Trusts dated January 2, 2001 and October 20, 2010, respectively. The Trusts are registered under the Investment Company Act of 1940, as amended (the “1940 Act”), as open-end management investment companies. GPS Funds I is comprised of the following 5 funds: GuideMark Large Cap Core Fund, GuideMark Emerging Markets Fund, GuideMark Small/Mid Cap Core Fund, GuideMark World ex-US Fund, GuideMark Core Fixed Income. GPS Funds II is comprised of the following 10 funds: GuidePath Growth Allocation Fund, GuidePath Conservative Allocation Fund, GuidePath Tactical Allocation Fund, GuidePath Absolute Return Allocation Fund, GuidePath Multi-Asset Income Allocation Fund, GuidePath Flexible Income Allocation Fund, GuidePath Managed Futures Strategy Fund, GuidePath Conservative Income Fund, GuidePath Income Fund and GuidePath Growth and Income Fund (collectively, the “Funds”). All of the Funds are classified and operate as diversified funds under the 1940 Act. Each Fund represents a distinct portfolio with its own investment objectives and policies. The assets of each Fund are segregated, and a shareholder’s interest is limited to the Fund in which shares are held. GuidePath Growth Allocation Fund, GuidePath Conservative Allocation Fund, GuidePath Tactical Allocation Fund and GuidePath Absolute Return Allocation Fund were seeded on March 4, 2011 and the prospectus went effective on April 1, 2011. The GuidePath Growth Allocation Fund, GuidePath Conservative Allocation Fund, GuidePath Tactical Allocation Fund and GuidePath Absolute Return Allocation Fund commenced operations on April 29, 2011. The GuidePath Multi-Asset Income Allocation Fund and GuidePath Flexible Income Allocation Fund commenced operations on August 31, 2012. The GuidePath Managed Futures Strategy Fund commenced operations on January 19, 2016. The GuidePath Conservative Income Fund, GuidePath Income Fund and GuidePath Growth and Income Fund commenced operations on April 30, 2018. Each Fund offers two classes of shares: Service Shares and Institutional Shares, except GuidePath Conservative Income Fund, GuidePath Income Fund and GuidePath Growth and Income Fund, which are only offered with a single share class. Certain Fund classes were without shares as of the year end; any share activity related to those classes is presented in the Statements of Changes in Net Assets. The Funds are investment companies and accordingly follow the investment company accounting and reporting guidance of the Financial Accounting Standards Board (“FASB”) Accounting Standards Codification Topic 946 Financial Services – Investment Companies.
The GuidePath Growth Allocation Fund, GuidePath Conservative Allocation Fund, GuidePath Absolute Return Allocation Fund, GuidePath Multi-Asset Income Allocation Fund, GuidePath Flexible Income Allocation Fund, GuidePath Conservative Income Fund, GuidePath Income Fund and GuidePath Growth and Income Fund each operate as a “Fund of Funds,” investing primarily or, in the case of the GuidePath Tactical Allocation Fund, between 10% and 100% of its assets, in registered investment companies, including mutual funds and exchange-traded funds (“ETFs”). The funds in which the Fund of Funds may invest are referred to herein as the “Underlying Funds.” The Advisor believes that investing in
Underlying Funds provides each Fund of Funds with an efficient means of creating a portfolio that provides investors with indirect exposure to a broad range of securities. By investing in a Fund of Funds, you will indirectly bear fees and expenses of the Underlying Funds in addition to the Fund’s direct fees and expenses. In order to obtain exposure to certain markets, asset classes or active management styles, each Fund of Funds may buy Underlying Funds managed by the Advisor or its affiliates, which in turn, invest in various securities, including ETFs. The Fund of Funds may also invest directly in securities and other exchange-traded products, such as exchange-traded notes.
| 3. | | Significant Accounting Policies |
The following is a summary of significant accounting policies consistently followed by the Funds in the preparation of the financial statements. These policies are in conformity with U.S. generally accepted accounting principles (“GAAP”).
The Funds value their investments at fair value. Portfolio securities listed on a national or foreign securities exchange, except those listed on NASDAQ, for which market quotations are available are valued at the last quoted sale price on each business day. Portfolio securities traded on NASDAQ are valued at the NASDAQ Official Closing Price (“NOCP”) on each business day. If there is no reported sale on an exchange or NASDAQ, the portfolio security will be valued at the mean between the most recent quoted bid and asked price. Price information on listed securities is taken from the exchange where the security is primarily traded.
All equity securities that are not traded on a listed exchange are valued at the last sale price in the over-the-counter market. If a non-exchange traded security does not trade on a particular day, then the mean between the last quoted closing bid and asked price will be used. Non-exchange traded ADRs are priced with an evaluated price as determined by the current evaluated pricing procedures of, and provided by, the pricing vendor.
Fixed income securities that have a maturity of greater than 60 days are generally valued on the basis of evaluations obtained from third party pricing services, which take into account appropriate factors such as institutional-sized trading in similar groups of securities, yield, quality, coupon rate, maturity, type of issue, trading characteristics and other market data. Short term investments having a maturity of less than 60 days are generally valued at amortized cost, which approximates fair value.
Investments in mutual funds are valued at the closing net asset value per share of each mutual fund on the day of valuation. These investments in mutual funds may include investments in affiliated mutual funds. Investments in mutual funds are generally priced using values supplied by the underlying funds themselves. Units of Mount Vernon Liquid Assets Portfolio are not traded on an exchange and are valued at the investment company’s NAV per share.
Securities for which no market quotations are readily available or when a significant event has occurred between the time of the security’s last close and the time that a Fund next calculates its
144
GuideMark Funds & GuidePath Funds
NOTES TO FINANCIAL STATEMENTS (Continued) (Unaudited)
September 30, 2022
net asset value will be valued at their fair value in accordance with the requirements of Rule 2a-5. The Board designated the Advisor as Valuation Designee of the Trusts. The Valuation Designee has established a Valuation Committee to oversee the implementation of the valuation procedures on behalf of the Funds.
The Funds have adopted authoritative fair valuation accounting standards which establish an authoritative definition of fair value and set out a hierarchy for measuring fair value. These standards require additional disclosures about the various inputs and valuation techniques used to develop the measurements of fair value and a discussion in changes in valuation techniques and related inputs, if any, during the year. In addition, these standards require expanded disclosure for each major category of assets. These inputs are summarized in the three broad levels listed below:
Level 1 – Quoted prices in active markets for identical securities.
Level 2 – Other significant observable inputs (including quoted prices for similar securities, interest rates, prepayment speeds, credit risk, etc.).
Level 3 – Significant unobservable inputs (including the Funds’ own assumptions in determining the fair value of investments).
During the year, certain securities and other instruments held by the Funds were categorized as Level 2 or Level 3 based upon the inputs and methodologies used to determine the fair value of the security or instrument. Descriptions of the inputs and valuation methodologies used to determine the fair values of each class of investments within Level 2 and Level 3 are set forth below.
Level 2 Investments. The Funds’ investments that were categorized as Level 2 include: (1) certain fixed income securities, including asset-backed securities, collateralized mortgage obligations, corporate obligations, U.S. and foreign government obligations, mortgage-backed securities and municipal bonds; (2) certain foreign common stocks, preferred stocks, participatory notes, and real estate investment trusts; and (3) certain over-the-counter derivative instruments, including forward currency contracts, options written, and swaps.
Fixed income securities are normally valued by pricing vendors that use broker-dealer quotations, reported trades or valuation estimates from their internal pricing models. The service providers’ internal models typically use inputs that are observable such as institutional-sized trading in similar groups of securities, yield, credit quality, coupon rate, maturity, type of issue, trading characteristics and other market data.
Certain common stocks that trade on foreign exchanges are subject to valuation adjustments. These valuation adjustments are applied to the foreign exchange-traded common stocks to account for the market movement between the close of the foreign market in which the security is traded and the close of the New York Stock Exchange. These securities are valued
using pricing vendors that consider the correlation patterns of price movements of the foreign security to the intraday trading in the U.S. markets.
Forward currency contracts, OTC options and swaps derive their value from underlying asset prices, indices, reference rates, and other inputs or a combination of these factors. These instruments are normally valued using pricing vendors. Depending upon the instrument, its value may be provided by a pricing vendor using a series of techniques, including pricing models. The pricing models typically use inputs that are observed from active markets such as indices, spreads, interest rates, curves, dividends and exchange rates.
Level 3 Investments. The Funds’ investments that were categorized as Level 3 include: fair valued securities.
Fair valued securities are normally valued by pricing vendors using relevant observable inputs, as described above. In certain circumstances, the types of observable inputs that are typically used by a pricing service may be unavailable or deemed by the pricing service to be unreliable. In these instances, the pricing vendor may value the security based upon significant unobservable inputs, or the pricing vendor may not provide a value for the security. To the extent that a pricing vendor does not provide a value for a particular security, or the pricing vendor provides a value that the Valuation Committee does not believe accurately reflects the value of the security, the security will be valued by the Valuation Committee based upon the information available to the Committee at the time of valuation and in accordance with procedures adopted by the Board. These methodologies may require subjective judgments and determinations about the value of a particular security. When significant unobservable inputs are used to value a security, the security is categorized as Level 3.
To verify Level 3 unobservable inputs, the Valuation Committee uses a variety of techniques as appropriate to substantiate these valuation approaches including a regular review of key inputs and assumptions, transaction back-testing or disposition analysis and review of related market activity.
The inputs or methodology used for valuing securities are not an indication of the risk associated with investing in those securities.
145
GuideMark Funds & GuidePath Funds
NOTES TO FINANCIAL STATEMENTS (Continued) (Unaudited)
September 30, 2022
The following is a summary of the inputs used to value the Funds’ net assets as of September 30, 2022:
GuideMark Large Cap Core Fund
| | | | | | | | | | | | | | | | |
| | | Level 1
| | | Level 2
| | | Level 3
| | | Total
| |
Common Stocks | | $ | 444,737,403 | | | $ | — | | | $ | 343,740 | | | $ | 445,081,143 | |
Investment Companies | | | 17,399,900 | | | | — | | | | — | | | | 17,399,900 | |
Real Estate Investment Trusts | | | 7,035,937 | | | | — | | | | — | | | | 7,035,937 | |
Short Term Investments | | | 2,263,271 | | | | — | | | | — | | | | 2,263,271 | |
Investments Purchased with Proceeds from Securities Lending Collateral* | | | — | | | | — | | | | — | | | | 50,893,955 | |
| | |
|
|
| |
|
|
| |
|
|
| |
|
|
|
Total Investments in Securities | | $ | 471,436,511 | | | $ | — | | | $ | 343,740 | | | $ | 522,674,206 | |
| | |
|
|
| |
|
|
| |
|
|
| |
|
|
|
| | * | | Certain investments that are measured at fair value using the net asset value per share (or its equivalent) practical expedient have not been categorized in the fair value hierarchy. The fair value amounts presented in the table are intended to permit reconciliation of the fair value hierarchy to the amounts presented in the Statements of Assets and Liabilities. |
For further information regarding security characteristics, see the Schedule of Investments.
Below is a reconciliation of Level 3 assets for which significant unobservable inputs were used to determine fair value.
| | | | |
Description
| | Common Stock
| |
Balance as of April 1, 2022 | | $ | 140,204 | |
Purchases | | | — | |
Sales proceeds and paydowns | | | — | |
Accreted discounts, net | | | — | |
Corporate Actions | | | — | |
Realized gain (loss) | | | — | |
Change in unrealized appreciation (depreciation) | | | (72,584 | ) |
Transfers into/(out of) Level 3 | | | 276,120 | * |
| | |
|
|
|
Balance as of September 30, 2022 | | $ | 343,740 | |
| | |
|
|
|
Change in unrealized appreciation (depreciation) during the year for Level 3 investments held at September 30, 2022. | | $ | 9,280 | |
| | |
|
|
|
| | * | | One common stock transferred from Level 1 to Level 3 due to a lack of observable market data. |
GuideMark Emerging Markets Fund
| | | | | | | | | | | | | | | | |
| | | Level 1
| | | Level 2
| | | Level 3
| | | Total
| |
Common Stocks | | | | | | | | | | | | | | | | |
Communication Services | | $ | 223,180 | | | $ | 3,232,655 | | | $ | — | | | $ | 3,455,835 | |
Consumer Discretionary | | | 639,358 | | | | 4,399,358 | | | | — | | | | 5,038,716 | |
Consumer Staples | | | 756,543 | | | | 3,066,123 | | | | 0 | | | | 3,822,666 | |
Energy | | | 322,833 | | | | 2,365,713 | | | | 0 | | | | 2,688,546 | |
Financials | | | 550,698 | | | | 7,212,600 | | | | 0 | | | | 7,763,298 | |
Health Care | | | — | | | | 1,609,748 | | | | — | | | | 1,609,748 | |
Industrials | | | 30,405 | | | | 2,718,085 | | | | — | | | | 2,748,490 | |
Information Technology | | | 87,104 | | | | 7,962,361 | | | | 0 | | | | 8,049,465 | |
Materials | | | 777,175 | | | | 2,761,384 | | | | 0 | | | | 3,538,559 | |
Real Estate | | | — | | | | 485,581 | | | | 65,895 | | | | 551,476 | |
Utilities | | | 190,998 | | | | 747,827 | | | | — | | | | 938,825 | |
| | |
|
|
| |
|
|
| |
|
|
| |
|
|
|
Total Common Stocks | | | 3,578,294 | | | | 36,561,435 | | | | 65,895 | | | | 40,205,624 | |
Investment Companies | | | 3,099,253 | | | | — | | | | — | | | | 3,099,253 | |
Preferred Stocks | | | | | | | | | | | | | | | | |
Consumer Staples | | | — | | | | 99,431 | | | | — | | | | 99,431 | |
Energy | | | 309,167 | | | | — | | | | — | | | | 309,167 | |
Financials | | | 334,806 | | | | — | | | | — | | | | 334,806 | |
Information Technology | | | — | | | | 139,839 | | | | — | | | | 139,839 | |
Materials | | | 175,541 | | | | 78,456 | | | | — | | | | 253,997 | |
Utilities | | | 106,694 | | | | — | | | | — | | | | 106,694 | |
| | |
|
|
| |
|
|
| |
|
|
| |
|
|
|
Total Preferred Stocks | | | 926,208 | | | | 317,726 | | | | — | | | | 1,243,934 | |
Rights | | | — | | | | — | | | | 0 | | | | — | |
Short Term Investments | | | 116,460 | | | | — | | | | — | | | | 116,460 | |
Investments Purchased with Proceeds from Securities Lending Collateral* | | | — | | | | — | | | | — | | | | 2,132,591 | |
| | |
|
|
| |
|
|
| |
|
|
| |
|
|
|
Total Investments in Securities | | $ | 7,720,215 | | | $ | 36,879,161 | | | $ | 65,895 | | | $ | 46,797,862 | |
| | |
|
|
| |
|
|
| |
|
|
| |
|
|
|
146
GuideMark Funds & GuidePath Funds
NOTES TO FINANCIAL STATEMENTS (Continued) (Unaudited)
September 30, 2022
| | * | | Certain investments that are measured at fair value using the net asset value per share (or its equivalent) practical expedient have not been categorized in the fair value hierarchy. The fair value amounts presented in the table are intended to permit reconciliation of the fair value hierarchy to the amounts presented in the Statement of Assets and Liabilities. |
For further information regarding security characteristics, see the Schedule of Investments.
Below is a reconciliation of Level 3 assets for which significant unobservable inputs were used to determine fair value.
| | | | | | | | |
Description
| | Common Stock
| | | Rights
| |
Balance as of April 1, 2022 | | $ | — | | | $ | — | |
Purchases | | | — | | | | — | |
Sales proceeds and paydowns | | | — | | | | — | |
Accreted discounts, net | | | — | | | | — | |
Corporate Actions | | | 425,258 | | | | 0 | |
Realized gain (loss) | | | — | | | | — | |
Change in unrealized appreciation (depreciation) | | | (425,258 | ) | | | — | |
Transfers into/(out of) Level 3 | | | 65,896 | * | | | — | |
| | |
|
|
| |
|
|
|
Balance as of September 30, 2022 | | $ | 0 | | | $ | 0 | |
| | |
|
|
| |
|
|
|
Change in unrealized appreciation (depreciation) during the year for Level 3 investments held at September 30, 2022. | | $ | (442,402 | ) | | $ | — | |
| | |
|
|
| |
|
|
|
| | * | | Three common stocks transferred from Level 2 to Level 3 due to a lack of observable market data. |
GuideMark Small/Mid Cap Core Fund
| | | | | | | | | | | | | | | | |
| | | Level 1
| | | Level 2
| | | Level 3
| | | Total
| |
Common Stocks | | $ | 79,852,862 | | | $ | — | | | $ | 13,159 | | | $ | 79,866,021 | |
Investment Companies | | | 2,892,769 | | | | — | | | | — | | | | 2,892,769 | |
Real Estate Investment Trusts | | | 4,881,027 | | | | — | | | | — | | | | 4,881,027 | |
Short Term Investments | | | 315,900 | | | | — | | | | — | | | | 315,900 | |
Investments Purchased with Proceeds from Securities Lending Collateral* | | | — | | | | — | | | | — | | | | 22,782,871 | |
| | |
|
|
| |
|
|
| |
|
|
| |
|
|
|
Total Investments in Securities | | $ | 87,942,558 | | | $ | — | | | $ | 13,159 | | | $ | 110,738,588 | |
| | |
|
|
| |
|
|
| |
|
|
| |
|
|
|
| | * | | Certain investments that are measured at fair value using the net asset value per share (or its equivalent) practical expedient have not been categorized in the fair value hierarchy. The fair value amounts presented in the table are intended to permit reconciliation of the fair value hierarchy to the amounts presented in the Statements of Assets and Liabilities. |
For further information regarding security characteristics, see the Schedule of Investments.
Below is a reconciliation of Level 3 assets for which significant unobservable inputs were used to determine fair value.
| | | | | | | | |
Description
| | Common Stocks
| | | Rights
| |
Balance as of April 1, 2022 | | $ | 23,760 | | | $ | 322 | |
Purchases | | | — | | | | — | |
Sales proceeds and paydowns | | | — | | | | — | |
Accreted discounts, net | | | — | | | | — | |
Corporate Actions | | | (544 | ) | | | — | |
Realized gain (loss) | | | 544 | | | | (2,026 | ) |
Change in unrealized appreciation (depreciation) | | | (10,601 | ) | | | 1,704 | |
Transfers into/(out of) Level 3 | | | — | | | | — | |
| | |
|
|
| |
|
|
|
Balance as of September 30, 2022 | | $ | 13,159 | | | $ | — | |
| | |
|
|
| |
|
|
|
Change in unrealized appreciation (depreciation) during the year for Level 3 investments held at September 30, 2022. | | $ | (10,601 | ) | | $ | — | |
| | |
|
|
| |
|
|
|
147
GuideMark Funds & GuidePath Funds
NOTES TO FINANCIAL STATEMENTS (Continued) (Unaudited)
September 30, 2022
GuideMark World ex-US Fund
| | | | | | | | | | | | | | | | |
| | | Level 1
| | | Level 2
| | | Level 3
| | | Total
| |
Common Stocks | | | | | | | | | | | | | | | | |
Communication Services | | $ | 65,619 | | | $ | 3,891,317 | | | $ | — | | | $ | 3,956,936 | |
Consumer Discretionary | | | 501,940 | | | | 9,540,827 | | | | — | | | | 10,042,767 | |
Consumer Staples | | | 1,466,929 | | | | 7,974,148 | | | | — | | | | 9,441,077 | |
Energy | | | 2,120,937 | | | | 4,300,989 | | | | — | | | | 6,421,926 | |
Financials | | | 3,237,298 | | | | 12,193,537 | | | | — | | | | 15,430,835 | |
Health Care | | | 182,527 | | | | 10,174,677 | | | | — | | | | 10,357,204 | |
Industrials | | | 1,143,762 | | | | 10,999,237 | | | | — | | | | 12,142,999 | |
Information Technology | | | 456,101 | | | | 3,716,589 | | | | — | | | | 4,172,690 | |
Materials | | | 1,301,494 | | | | 4,341,125 | | | | — | | | | 5,642,619 | |
Real Estate | | | 78,445 | | | | 580,077 | | | | — | | | | 658,522 | |
Utilities | | | 270,101 | | | | 1,579,035 | | | | — | | | | 1,849,136 | |
| | |
|
|
| |
|
|
| |
|
|
| |
|
|
|
Total Common Stocks | | | 10,825,154 | | | | 69,291,558 | | | | — | | | | 80,116,712 | |
Investment Companies | | | 3,377,396 | | | | — | | | | — | | | | 3,377,396 | |
Preferred Stocks | | | — | | | | 366,140 | | | | — | | | | 366,140 | |
Real Estate Investment Trusts | | | 10,919 | | | | 139,296 | | | | — | | | | 150,215 | |
Short Term Investments | | | 192,186 | | | | — | | | | — | | | | 192,186 | |
Investments Purchased with Proceeds from Securities Lending Collateral* | | | — | | | | — | | | | — | | | | 4,133,164 | |
| | |
|
|
| |
|
|
| |
|
|
| |
|
|
|
Total Investments in Securities | | $ | 14,405,655 | | | $ | 69,796,994 | | | $ | — | | | $ | 88,335,813 | |
| | |
|
|
| |
|
|
| |
|
|
| |
|
|
|
| | * | | Certain investments that are measured at fair value using the net asset value per share (or its equivalent) practical expedient have not been categorized in the fair value hierarchy. The fair value amounts presented in the table are intended to permit reconciliation of the fair value hierarchy to the amounts presented in the Statements of Assets and Liabilities. |
For further information regarding security characteristics, see the Schedule of Investments.
148
GuideMark Funds & GuidePath Funds
NOTES TO FINANCIAL STATEMENTS (Continued) (Unaudited)
September 30, 2022
GuideMark Core Fixed Income Fund
| | | | | | | | | | | | | | | | |
| | | Level 1
| | | Level 2
| | | Level 3
| | | Total
| |
Fixed Income | | | | | | | | | | | | | | | | |
Asset Backed Securities | | $ | — | | | $ | 12,100,904 | | | $ | 247,233 | | | $ | 12,348,137 | |
Collateralized Mortgage Obligations | | | — | | | | 28,137,665 | | | | — | | | | 28,137,665 | |
Corporate Obligations | | | — | | | | 48,321,575 | | | | — | | | | 48,321,575 | |
Foreign Government Debt Obligations | | | — | | | | 2,449,383 | | | | — | | | | 2,449,383 | |
Mortgage Backed Securities – U.S. Government Agency | | | — | | | | 60,543,741 | | | | — | | | | 60,543,741 | |
Municipal Debt Obligations | | | — | | | | 2,868,903 | | | | — | | | | 2,868,903 | |
U.S. Treasury Obligations | | | — | | | | 46,558,834 | | | | — | | | | 46,558,834 | |
| | |
|
|
| |
|
|
| |
|
|
| |
|
|
|
Total Fixed Income | | | — | | | | 200,981,005 | | | | 247,233 | | | | 201,228,238 | |
Short Term Investments | | | 4,647,462 | | | | — | | | | — | | | | 4,647,462 | |
Investments Purchased with Proceeds from Securities Lending Collateral* | | | — | | | | — | | | | — | | | | 3,061,000 | |
| | |
|
|
| |
|
|
| |
|
|
| |
|
|
|
Total Investments in Securities | | $ | 4,647,462 | | | $ | 200,981,005 | | | $ | 247,233 | | | $ | 208,936,700 | |
| | |
|
|
| |
|
|
| |
|
|
| |
|
|
|
Other Financial Instruments** | | | | | | | | | | | | | | | | |
Futures | | $ | 885,493 | | | $ | — | | | $ | — | | | $ | 885,493 | |
Options Written | | | — | | | | (116,999 | ) | | | — | | | | (116,999 | ) |
Swaps | | | — | | | | 152,604 | | | | — | | | | 152,604 | |
| | * | | Certain investments that are measured at fair value using the net asset value per share (or its equivalent) practical expedient have not been categorized in the fair value hierarchy. The fair value amounts presented in the table are intended to permit reconciliation of the fair value hierarchy to the amounts presented in the Statements of Assets and Liabilities. |
| | ** | | Other financial instruments are derivative instruments not reflected in the Schedule of Investments, such as futures, options written and swaps. Futures and swaps are reflected as the unrealized appreciation (depreciation) on the instrument, while options written are reflected at value. |
For further information regarding security characteristics, see the Schedule of Investments.
Below is a reconciliation of Level 3 assets for which significant unobservable inputs were used to determine fair value.
| | | | |
Description
| | Fixed Income
| |
Balance as of April 1, 2022 | | $ | — | |
Purchases | | | 248,393 | |
Sales proceeds and paydowns | | | — | |
Accreted discounts, net | | | — | |
Corporate Actions | | | — | |
Realized gain (loss) | | | — | |
Change in unrealized appreciation (depreciation) | | | (1,160 | ) |
Transfers into/(out of) Level 3 | | | — | |
| | |
|
|
|
Balance as of September 30, 2022 | | $ | 247,233 | |
| | |
|
|
|
Change in unrealized appreciation (depreciation) during the year for Level 3 investments held at September 30, 2022. | | $ | (1,160 | ) |
| | |
|
|
|
149
GuideMark Funds & GuidePath Funds
NOTES TO FINANCIAL STATEMENTS (Continued) (Unaudited)
September 30, 2022
GuidePath Growth Allocation Fund
| | | | | | | | | | | | | | | | |
| | | Level 1
| | | Level 2
| | | Level 3
| | | Total
| |
Investment Companies | | $ | 820,641,617 | | | $ | — | | | $ | — | | | $ | 820,641,617 | |
Short Term Investments | | | 8,598,917 | | | | — | | | | — | | | | 8,598,917 | |
Investments Purchased with Proceeds from Securities Lending Collateral* | | | — | | | | — | | | | — | | | | 157,022,731 | |
| | |
|
|
| |
|
|
| |
|
|
| |
|
|
|
Total Investments in Securities | | $ | 829,240,534 | | | $ | — | | | $ | — | | | $ | 986,263,265 | |
| | |
|
|
| |
|
|
| |
|
|
| |
|
|
|
| | * | | Certain investments that are measured at fair value using the net asset value per share (or its equivalent) practical expedient have not been categorized in the fair value hierarchy. The fair value amounts presented in the table are intended to permit reconciliation of the fair value hierarchy to the amounts presented in the Statements of Assets and Liabilities. |
For further information regarding security characteristics, see the Schedule of Investments.
GuidePath Conservative Allocation Fund
| | | | | | | | | | | | | | | | |
| | | Level 1
| | | Level 2
| | | Level 3
| | | Total
| |
Investment Companies | | $ | 375,405,823 | | | $ | — | | | $ | — | | | $ | 375,405,823 | |
Short Term Investments | | | 3,741,259 | | | | — | | | | — | | | | 3,741,259 | |
Investments Purchased with Proceeds from Securities Lending Collateral* | | | — | | | | — | | | | — | | | | 104,331,390 | |
| | |
|
|
| |
|
|
| |
|
|
| |
|
|
|
Total Investments in Securities | | $ | 379,147,082 | | | $ | — | | | $ | — | | | $ | 483,478,472 | |
| | |
|
|
| |
|
|
| |
|
|
| |
|
|
|
| | * | | Certain investments that are measured at fair value using the net asset value per share (or its equivalent) practical expedient have not been categorized in the fair value hierarchy. The fair value amounts presented in the table are intended to permit reconciliation of the fair value hierarchy to the amounts presented in the Statements of Assets and Liabilities. |
For further information regarding security characteristics, see the Schedule of Investments.
GuidePath Tactical Allocation Fund
| | | | | | | | | | | | | | | | |
| | | Level 1
| | | Level 2
| | | Level 3
| | | Total
| |
Common Stocks | | $ | 255,988,859 | | | $ | — | | | $ | — | | | $ | 255,988,859 | |
Real Estate Investment Trusts | | | 40 | | | | — | | | | — | | | | 40 | |
Short Term Investments | | | 210,645,791 | | | | — | | | | — | | | | 210,645,791 | |
Investments Purchased with Proceeds from Securities Lending Collateral* | | | — | | | | — | | | | — | | | | 30,932,216 | |
| | |
|
|
| |
|
|
| |
|
|
| |
|
|
|
Total Investments in Securities | | $ | 466,634,690 | | | $ | — | | | $ | — | | | $ | 497,566,906 | |
| | |
|
|
| |
|
|
| |
|
|
| |
|
|
|
| | * | | Certain investments that are measured at fair value using the net asset value per share (or its equivalent) practical expedient have not been categorized in the fair value hierarchy. The fair value amounts presented in the table are intended to permit reconciliation of the fair value hierarchy to the amounts presented in the Statements of Assets and Liabilities. |
For further information regarding security characteristics, see the Schedule of Investments.
GuidePath Absolute Return Allocation Fund
| | | | | | | | | | | | | | | | |
| | | Level 1
| | | Level 2
| | | Level 3
| | | Total
| |
Investment Companies | | $ | 331,226,828 | | | $ | — | | | $ | — | | | $ | 331,226,828 | |
Short Term Investments | | | 2,841,210 | | | | — | | | | — | | | | 2,841,210 | |
Investments Purchased with Proceeds from Securities Lending Collateral* | | | — | | | | — | | | | — | | | | 60,309,447 | |
| | |
|
|
| |
|
|
| |
|
|
| |
|
|
|
Total Investments in Securities | | $ | 334,068,038 | | | $ | — | | | $ | — | | | $ | 394,377,485 | |
| | |
|
|
| |
|
|
| |
|
|
| |
|
|
|
| | * | | Certain investments that are measured at fair value using the net asset value per share (or its equivalent) practical expedient have not been categorized in the fair value hierarchy. The fair value amounts presented in the table are intended to permit reconciliation of the fair value hierarchy to the amounts presented in the Statements of Assets and Liabilities. |
For further information regarding security characteristics, see the Schedule of Investments.
150
GuideMark Funds & GuidePath Funds
NOTES TO FINANCIAL STATEMENTS (Continued) (Unaudited)
September 30, 2022
GuidePath Multi-Asset Income Allocation Fund
| | | | | | | | | | | | | | | | |
| | | Level 1
| | | Level 2
| | | Level 3
| | | Total
| |
Investment Companies | | $ | 80,492,018 | | | $ | — | | | $ | — | | | $ | 80,492,018 | |
Short Term Investments | | | 873,338 | | | | — | | | | — | | | | 873,338 | |
Investments Purchased with Proceeds from Securities Lending Collateral* | | | — | | | | — | | | | — | | | | 23,811,535 | |
| | |
|
|
| |
|
|
| |
|
|
| |
|
|
|
Total Investments in Securities | | $ | 81,365,356 | | | $ | — | | | $ | — | | | $ | 105,176,891 | |
| | |
|
|
| |
|
|
| |
|
|
| |
|
|
|
| | * | | Certain investments that are measured at fair value using the net asset value per share (or its equivalent) practical expedient have not been categorized in the fair value hierarchy. The fair value amounts presented in the table are intended to permit reconciliation of the fair value hierarchy to the amounts presented in the Statements of Assets and Liabilities. |
For further information regarding security characteristics, see the Schedule of Investments.
GuidePath Flexible Income Allocation Fund
| | | | | | | | | | | | | | | | |
| | | Level 1
| | | Level 2
| | | Level 3
| | | Total
| |
Investment Companies | | $ | 266,526,847 | | | $ | — | | | $ | — | | | $ | 266,526,847 | |
Short Term Investments | | | 40,677,529 | | | | — | | | | — | | | | 40,677,529 | |
Investments Purchased with Proceeds from Securities Lending Collateral* | | | — | | | | — | | | | — | | | | 98,791,695 | |
| | |
|
|
| |
|
|
| |
|
|
| |
|
|
|
Total Investments in Securities | | $ | 307,204,376 | | | $ | — | | | $ | — | | | $ | 405,996,071 | |
| | |
|
|
| |
|
|
| |
|
|
| |
|
|
|
| | * | | Certain investments that are measured at fair value using the net asset value per share (or its equivalent) practical expedient have not been categorized in the fair value hierarchy. The fair value amounts presented in the table are intended to permit reconciliation of the fair value hierarchy to the amounts presented in the Statements of Assets and Liabilities. |
For further information regarding security characteristics, see the Schedule of Investments.
GuidePath Managed Futures Strategy Fund
| | | | | | | | | | | | | | | | |
| | | Level 1
| | | Level 2
| | | Level 3
| | | Total
| |
Short Term Investments | | $ | 24,484,515 | | | $ | 526,494,060 | | | $ | 7,001,225 | | | $ | 557,979,800 | |
| | |
|
|
| |
|
|
| |
|
|
| |
|
|
|
Total Investments in Securities | | $ | 24,484,515 | | | $ | 526,494,060 | | | $ | 7,001,225 | | | $ | 557,979,800 | |
| | |
|
|
| |
|
|
| |
|
|
| |
|
|
|
Other Financial Instruments* | | | | | | | | | | | | | | | | |
Futures | | $ | 32,196,657 | | | $ | — | | | $ | — | | | $ | 32,196,657 | |
Forward Currency Contracts | | $ | — | | | $ | 4,541,878 | | | $ | — | | | $ | 4,541,878 | |
| | * | | Other financial instruments are derivative instruments not reflected in the Consolidated Schedule of Investments, such as futures and forward currency contracts. Futures and forward currency contracts are reflected as the unrealized appreciation (depreciation) on the instrument. |
| | For | | further information regarding security characteristics, see the Consolidated Schedule of Investments. |
Below is a reconciliation of Level 3 assets for which significant unobservable inputs were used to determine fair value.
| | | | |
Description
| | Certificate of
Deposit
| |
Balance as of April 1, 2022 | | | — | |
Purchases | | | 7,000,249 | |
Sales proceeds and paydowns | | | — | |
Accreted discounts, net | | | (4 | ) |
Corporate Actions | | | — | |
Realized gain (loss) | | | — | |
Change in unrealized appreciation (depreciation) | | | 980 | |
Transfers into/(out of) Level 3 | | | — | |
| | |
|
|
|
Balance as of September 30, 2022 | | $ | 7,001,225 | |
| | |
|
|
|
Change in unrealized appreciation (depreciation) during the year for Level 3 investments held at September 30, 2022. | | $ | 980 | |
| | |
|
|
|
151
GuideMark Funds & GuidePath Funds
NOTES TO FINANCIAL STATEMENTS (Continued) (Unaudited)
September 30, 2022
GuidePath Conservative Income Fund
| | | | | | | | | | | | | | | | |
| | | Level 1
| | | Level 2
| | | Level 3
| | | Total
| |
Investment Companies | | $ | 8,368,527 | | | $ | — | | | $ | — | | | $ | 8,368,527 | |
Short Term Investments | | | 6,454,749 | | | | 1,973,982 | | | | — | | | | 8,428,731 | |
Investments Purchased with Proceeds from Securities Lending Collateral* | | | — | | | | — | | | | — | | | | 2,178,040 | |
| | |
|
|
| |
|
|
| |
|
|
| |
|
|
|
Total Investments in Securities | | $ | 14,823,276 | | | $ | 1,973,982 | | | $ | — | | | $ | 18,975,298 | |
| | |
|
|
| |
|
|
| |
|
|
| |
|
|
|
| | * | | Certain investments that are measured at fair value using the net asset value per share (or its equivalent) practical expedient have not been categorized in the fair value hierarchy. The fair value amounts presented in the table are intended to permit reconciliation of the fair value hierarchy to the amounts presented in the Statements of Assets and Liabilities. |
For further information regarding security characteristics, see the Schedule of Investments.
GuidePath Income Fund
| | | | | | | | | | | | | | | | |
| | | Level 1
| | | Level 2
| | | Level 3
| | | Total
| |
Investment Companies | | $ | 52,340,096 | | | $ | — | | | $ | — | | | $ | 52,340,096 | |
Short Term Investments | | | 1,281,423 | | | | — | | | | — | | | | 1,281,423 | |
| | |
|
|
| |
|
|
| |
|
|
| |
|
|
|
Total Investments in Securities | | $ | 53,621,519 | | | $ | — | | | $ | — | | | $ | 53,621,519 | |
| | |
|
|
| |
|
|
| |
|
|
| |
|
|
|
For further information regarding security characteristics, see the Schedule of Investments.
GuidePath Growth & Income Fund
| | | | | | | | | | | | | | | | |
| | | Level 1
| | | Level 2
| | | Level 3
| | | Total
| |
Common Stocks | | $ | 31,351,480 | | | $ | — | | | $ | — | | | $ | 31,351,480 | |
Investment Companies | | | 33,377,909 | | | | — | | | | — | | | | 33,377,909 | |
Short Term Investments | | | 20,862,706 | | | | 8,889,470 | | | | — | | | | 29,752,176 | |
Investments Purchased with Proceeds from Securities Lending Collateral* | | | — | | | | — | | | | — | | | | 2,875,955 | |
| | |
|
|
| |
|
|
| |
|
|
| |
|
|
|
Total Investments in Securities | | $ | 85,592,095 | | | $ | 8,889,470 | | | $ | — | | | $ | 97,357,520 | |
| | |
|
|
| |
|
|
| |
|
|
| |
|
|
|
Other Financial Instruments** | | | | | | | | | | | | | | | | |
Futures | | $ | 856,263 | | | $ | — | | | $ | — | | | $ | 856,263 | |
Options Written | | | (764,620 | ) | | | (1,163,150 | ) | | | — | | | | (1,927,770 | ) |
| | * | | Certain investments that are measured at fair value using the net asset value per share (or its equivalent) practical expedient have not been categorized in the fair value hierarchy. The fair value amounts presented in the table are intended to permit reconciliation of the fair value hierarchy to the amounts presented in the Statements of Assets and Liabilities. |
| | ** | | Other financial instruments are derivative instruments not reflected in the Schedule of Investments, such as futures and written options. Futures are reflected as unrealized appreciation (depreciation) on the instrument, while options written are reflected at value. |
For further information regarding security characteristics, see the Schedule of Investments.
| | (b) | | Consolidation of Subsidiary |
The GuidePath Managed Futures Strategy Fund may invest up to 25% of its total assets in GuidePath Managed Futures Strategy Cayman Fund Ltd. (the “Subsidiary”). The Subsidiary, which is organized under the laws of the Cayman Islands, is wholly-owned and controlled by GuidePath Managed Futures Strategy Fund. The financial statements of the GuidePath Managed Futures Strategy Fund include the operations of the Subsidiary. All intercompany accounts and transactions have been eliminated in consolidation. The Subsidiary acts as an investment vehicle in order to invest in commodity-linked derivative instruments consistent with the Fund’s investment objectives and policies. The GuidePath Managed Futures Strategy Fund had 1.40% of its total assets invested in the Subsidiary as of September 30, 2022.
The Subsidiary is an exempted Cayman Islands investment company and as such is not subject to Cayman Islands taxes at the
present time. For U.S. income tax purposes, the Subsidiary is a Controlled Foreign Corporation (“CFC”) not subject to U.S. income taxes. As a wholly-owned CFC, however, the Subsidiary’s net income and capital gains, if any, will be included each year in the Fund’s investment company taxable income.
| | (c) | | Subsequent Events Evaluation |
In preparing these financial statements, the Funds have evaluated events and transactions through the date of issuance for potential recognition or disclosure resulting from subsequent events. This evaluation did not result in any subsequent events that necessitated disclosures and/or adjustments to the financial statements.
| | (d) | | Repurchase Agreements |
Each Fund may enter into repurchase agreements with banks and securities dealers. These transactions involve the purchase of securities with a simultaneous commitment to sell the
152
GuideMark Funds & GuidePath Funds
NOTES TO FINANCIAL STATEMENTS (Continued) (Unaudited)
September 30, 2022
securities to the bank or the dealer at an agreed-upon date and price. A repurchase agreement is accounted for as an investment by the Fund, collateralized by securities, which are delivered to the Fund’s Custodian or to an agent bank under a tri-party agreement. The securities are marked-to-market daily and additional securities are acquired as needed, to ensure that their value equals or exceeds the repurchase price plus accrued interest.
The Funds intend to continue to comply with the requirements of sub-chapter M of the Internal Revenue Code necessary to qualify as regulated investment companies and to make the requisite distributions of income and capital gains to shareholders sufficient to relieve the Funds from all or substantially all Federal income taxes. Therefore, no Federal income tax provision is required.
The Funds have adopted financial reporting rules regarding recognition and measurement of tax positions taken or expected to be taken on a tax return. In order to avoid imposition of the excise tax applicable to regulated investment companies, it is also each Fund’s intention to declare as dividends in each calendar year at least 98% of its net investment income (earned during the calendar year) and 98.2% of its net realized capital gains (earned during the twelve months ended October 31) plus undistributed amounts from prior years. The Funds have reviewed all open tax years and major jurisdictions and concluded that no provision for income tax is required in the Funds’ financial statements. As of and during the year ended March 31, 2022, the Funds did not have any tax positions that did not meet the “more-likely-than-not” threshold of being sustained by the applicable tax authority and did not have liabilities for any unrecognized tax benefits. The Funds recognize interest and penalties, if any, related to unrecognized tax benefits as income tax expense on the Statements of Operations. During the fiscal year ended March 31, 2022, the Funds did not incur any interest or penalties. The Funds’ Federal and state income and Federal excise tax returns for tax years for which the applicable statutes of limitations have not expired are subject to examination by the Internal Revenue Service and state departments of revenue.
The preparation of financial statements in conformity with GAAP requires management to make estimates and assumptions that affect the reported amounts of assets and liabilities and disclosure of contingent assets and liabilities at the date of the financial statements and the reported amounts of revenues and expenses during the reported period. Actual results could differ from those estimates.
Under each Trust’s organizational documents, its officers and trustees are indemnified against certain liability arising out of their performance of their duties to the Funds. In addition, in the normal course of business, the Funds enter into contracts that contain a variety of representations and warranties that provide general indemnifications. The Funds’ maximum exposure under these arrangements is unknown as this would involve future claims that
may be made against the Funds that have not yet occurred. However, the Funds expect the risk of loss to be remote.
Many expenses of the Funds can be directly attributed to a specific Fund. Additionally, some expenses can be directly attributed to a specific Trust, in which case the expense is apportioned among the Funds within that Trust based on relative net assets. Expenses that cannot be directly attributed to a specific Fund or Trust are apportioned among all the Funds based on relative net assets. Income, other non-class-specific expenses, and realized and unrealized gains and losses on investments are allocated to each class of shares based on its relative net assets.
| | (i) | | Organization and Offering Costs |
Organization costs consist of costs incurred to establish a Fund and enable it legally to do business. The Funds expense organizational costs as incurred. These expenses were advanced by the Advisor, and the Advisor has agreed to reimburse the Funds for these expenses, subject to potential recovery (see Note 4). Offering costs are accounted for as deferred costs until operations begin. Offering costs include legal fees regarding the preparation of the initial registration statement. Offering costs are then amortized to expense over twelve months on a straight-line basis.
| | (j) | | Security Transactions and Income Recognition |
Security transactions are accounted for on trade date. Dividend income is recognized on the ex-dividend date. Non-cash dividends included in dividend income or separately disclosed, if any, are recorded at the fair value of the security received. Interest recorded using the effective yield method is accrued daily. Withholding taxes on foreign dividends and taxes on capital gains, which are included as a component of net investment income and realized gain (loss) on investments, respectively, have been provided in accordance with the Trusts’ understanding of the applicable country’s tax rules and rates. Realized gains and losses on investment transactions are determined using the high cost method. Return of capital distributions received from REIT securities are recorded as an adjustment to the cost of the security and thus may impact unrealized or realized gains or losses on the security. Gains and losses from paydowns on mortgage and asset backed securities are recorded as adjustments to interest income. Distributions from underlying investment companies are classified as investment income or realized gains based on the U.S. income tax characteristics of the distribution.
| | (k) | | Distributions to Shareholders |
The Funds, with the exception of the Core Fixed Income Fund, Multi-Asset Income Allocation Fund, Flexible Income Allocation Fund, Conservative Income Fund, Income Fund and Growth and Income Fund will distribute any net investment income at least annually. The Core Fixed Income Fund, Multi-Asset Income Allocation Fund and Flexible Income Allocation Fund will distribute any net investment income quarterly. The Conservative Income Fund, Income Fund and Growth and Income Fund will generally distribute any net investment income monthly. All of the Funds will generally distribute any
153
GuideMark Funds & GuidePath Funds
NOTES TO FINANCIAL STATEMENTS (Continued) (Unaudited)
September 30, 2022
net realized long or short-term capital gains at least annually. Certain Funds also utilize earnings and profits distributed to shareholders on redemptions of shares as part of the dividends paid deduction. Distributions to shareholders are recorded on the ex-dividend date. The Funds may also pay a special distribution at the end of the calendar year to comply with Federal tax requirements.
Each Fund may invest in derivative securities including call and put options, futures, forward currency contracts and swaps. These instruments may be used by a Fund for hedging purposes as well as direct investment.
Forward Currency Contracts
The Funds may enter into forward currency contracts, obligating the Funds to deliver and receive currency at a specified future date. Transactions involving forward currency contracts may serve as long hedges (for example, if a Fund seeks to buy a security denominated in a foreign security, it may purchase a forward currency contract to lock in the U.S. dollar price of the security) or as short hedges (if a Fund anticipates selling a security denominated in a foreign currency, it may sell a forward currency contract to lock in the U.S. dollar equivalent of the anticipated sales proceeds). Forward contracts are valued daily and unrealized appreciation or depreciation is recorded daily as the difference between the contract exchange rate and the closing forward rate applied to the face amount of the contract.
Options
The Funds may purchase and write call or put options on securities and indices and enter into related closing transactions. All of the Funds may invest in options that are listed on U.S. exchanges or traded over the counter. Exchange-traded options are valued at the last reported sale price on the exchange on which the security underlying the option is principally traded. If no sales are reported on a particular day for exchange-traded options, or the options are not exchange-traded, the options are valued at the mean between the most recent quoted bid and asked quotations at the close of the exchange. The premium that a Fund pays when purchasing a call option or receives when writing a call option will reflect, among other things, the market price of the security, the relationship of the exercise price to the market price of the security, the relationship of the exercise price to the volatility of the security, the length of the option period and supply and demand factors. The premium is the value of an option at the date of purchase.
A purchaser (holder) of a put option pays a non-refundable premium to the seller (writer) of a put option to obtain the right
to sell a specified amount of a security at a fixed price (the exercise price) during a specified period (exercise period). Conversely, the seller (writer) of a put option, upon payment by the holder of the premium, has the obligation to buy the security from the holder of the put option at the exercise price during the exercise period.
Futures
Each Fund has the ability to buy and sell stock index futures contracts traded on domestic stock exchanges to hedge the value of its portfolio against changes in market conditions. A stock index futures contract is an agreement between two parties to take or make delivery of an amount of cash equal to a specified dollar amount, times the difference between stock index value at the close of the last trading day of the contract and the price at which the futures contract is originally struck. A stock index futures contract does not involve the physical delivery of the underlying stocks in the index. Although stock index futures contracts call for the actual taking of delivery of cash, in most cases a Fund expects to liquidate its stock index futures positions through offsetting transactions, which may result in a gain or loss, before cash settlement is required.
The Funds may purchase or sell other types of futures contracts, including those based on particular interest rates, securities, foreign currencies, securities indices and other financial instruments and indices. The Funds may also purchase and write call and put options on such futures contracts, in order to seek to increase total return or to hedge against changes in interest rates, securities prices, or currency exchange rates, or, to the extent permitted by its investment policies, to otherwise manage its portfolio of investments.
Futures contracts are valued at the daily quoted settlement prices.
Swaps
The Funds may enter into interest rate, mortgage, credit, currency and total return swaps, interest rate caps, floors and collars. The Funds may also purchase and write (sell) options contracts on swaps, referred to as “swaptions”. The Funds may enter into swap transactions for hedging purposes or to seek to increase total return. Since interest rate, mortgage, credit and currency swaps and interest rate caps, floors and collars are individually negotiated, the Funds expect to achieve an acceptable degree of correlation between their portfolio investments and their swap, cap, floor and collar positions.
Swap agreements are valued using the daily mean and unrealized appreciation or depreciation is recorded daily as the difference between the prior day and current day closing price.
Derivative Instruments and Hedging Activities
Each Trust has adopted derivative instruments disclosure standards, in order to enable the investor to understand how and why an entity used derivatives, how derivatives are accounted for, and how derivative instruments affect an entity’s results of operations and financial position.
In general, the use of derivatives may increase the risk within the Funds. The use of over-the-counter derivatives involves the risk that the counterparty to the contract will fail to make required payments or otherwise comply with the terms of the contract. The results achieved by the use of derivatives in the Funds may not match or fully offset changes in the value of the underlying financial assets being hedged or the investment opportunity the Funds were pursuing, thereby failing to achieve, to an extent, the original purpose for using the derivatives. Certain types of derivatives may create leverage insofar as the Funds may receive returns (or suffer losses) exceeding the initial amounts the Funds committed in connection with the derivatives. The
154
GuideMark Funds & GuidePath Funds
NOTES TO FINANCIAL STATEMENTS (Continued) (Unaudited)
September 30, 2022
use of derivatives can result in losses or gains to the Funds exceeding the amount the Funds would have experienced in the absence of using derivatives. A relatively small price movement in a derivative may result in an immediate and substantial loss, or gain, to the Funds.
GuideMark Core Fixed Income Fund
During the period, the Fund used fixed income derivatives including U.S. Treasury futures and credit default swaps on investment grade fixed income indices (CDX and CMBX), for both hedging and investment purposes, primarily duration management, risk management, and the pursuit of relative value opportunities. Futures contracts used in the Fund during the period included those based on short, medium, and long-term U.S. Treasury debt.
The Fund used futures contracts during the period primarily to manage interest rate risk. The Fund used investment grade CDX, CMBX and purchased and sold (wrote) options to efficiently manage investment grade credit exposure.
Statement of Assets and Liabilities – Values of Derivative Instruments as of September 30, 2022
| | | | | | | | | | | | |
| | | Asset Derivatives
| | | Liability Derivatives
| |
| | | Statement of Assets and
Liabilities Location | | Value | | | Statement of Assets and
Liabilities Location | | Value | |
| Credit Contracts – Swaps | | Appreciation on swap agreements | | $ | — | | | Depreciation on swap agreements | | $ | 11,634 | |
| | | | |
| Interest Rate Contracts – Swaps | | Appreciation on swap agreements | | | 164,238 | | | Depreciation on swap agreements | | | — | |
| | | | |
| Interest Rate Contracts – Futures* | | Unrealized appreciation on futures contracts** | | | 1,024,990 | | | Unrealized depreciation on futures contracts** | | | 139,497 | |
| | | | |
| Credit Contracts – Options | | Options written, at value | | | — | | | Options written, at value | | | 116,999 | |
| Total | | | | $ | 1,189,228 | | | | | $ | 268,130 | |
| | * | | Includes cumulative appreciation/depreciation as reported on the Schedule of Open Futures Contracts. |
| | ** | | Included in total distributable earnings on the Statement of Assets and Liabilities. |
| | | | | | | | | | | | | | | | |
| The Effect of Derivative Instruments on the Statement of Operations for the period ended September 30, 2022 | |
|
| Amount of Realized Gain or (Loss) on Derivatives | |
| | | Futures
Contracts | | | Swaps | | | Options | | | Total | |
| Credit Contracts | | $ | — | | | $ | (459,966 | ) | | $ | 485,725 | | | $ | 25,759 | |
| Interest Rate Contracts | | | 1,737,673 | | | | 289,946 | | | | — | | | | 2,027,619 | |
| | | | |
| Total | | $ | 1,737,673 | | | $ | (170,020 | ) | | $ | 485,725 | | | $ | 2,053,378 | |
| | | | | | | | | | | | | | | | |
| Change in Unrealized Appreciation or (Depreciation) on Derivatives | |
| | | Futures
Contracts | | | Swaps | | | Options | | | Total | |
| Credit Contracts | | $ | — | | | $ | (11,634 | ) | | $ | (31,021 | ) | | $ | (42,655 | ) |
| Interest Rate Contracts | | | 612,434 | | | | (122,669 | ) | | | — | | | | 489,765 | |
| | | | |
| Total | | $ | 612,434 | | | $ | (134,303 | ) | | $ | (31,021 | ) | | $ | 447,110 | |
GuidePath Managed Futures Strategy Fund
The Fund uses a set of proprietary quantitative models to identify price trends in equity, fixed income, currency and commodity instruments, and may have both short and long exposures within an asset class based on an analysis of asset price trends. Under normal market conditions, the Fund will make extensive use of derivative instruments, in particular futures contracts, to capture the exposures suggested by its absolute return strategy while also adding value through volatility management. These market exposures, which are expected to change over time, may include exposures to global equity and fixed income securities, securities indices, currencies, commodities and other instruments. During the period ended September 30, 2022, the Fund used long and short contracts on U.S. and foreign government bonds, U.S. and foreign equity market indices, foreign currencies, commodities (through investments in the subsidiary) and short-term interest rates to capture the exposures suggested by the quantitative investment models.
155
GuideMark Funds & GuidePath Funds
NOTES TO FINANCIAL STATEMENTS (Continued) (Unaudited)
September 30, 2022
Consolidated Statement of Assets and Liabilities – Values of Derivative Instruments as of September 30, 2022
| | | | | | | | | | | | |
| | | Asset Derivatives
| | | Liability Derivatives
| |
| | | Statement of Assets and
Liabilities Location | | Value | | | Statement of Assets and
Liabilities Location | | Value | |
| Commodity Contracts – Futures* | | Unrealized appreciation on futures contracts** | | $ | 1,878,287 | | | Unrealized depreciation on futures contracts** | | $ | 2,062,810 | |
| | | | |
| Equity Contracts – Futures* | | Unrealized appreciation on futures contracts** | | | 5,617,990 | | | Unrealized depreciation on futures contracts** | | | 3,497 | |
| | | | |
| Foreign Exchange Contracts – Forward Currency Contracts | | Unrealized appreciation on forward currency contracts | | | 4,640,443 | | | Unrealized depreciation on forward currency contracts | | | 98,565 | |
| | | | |
| Foreign Exchange Contracts – Futures* | | Unrealized appreciation on futures contracts** | | | 9,824,939 | | | Unrealized depreciation on futures contracts** | | | 3,037 | |
| | | | |
| Interest Rate Contracts – Futures* | | Unrealized appreciation on futures contracts** | | | 17,351,366 | | | Unrealized depreciation on futures contracts** | | | 406,581 | |
| Total | | | | $ | 39,313,025 | | | | | $ | 2,574,490 | |
| | * | | Includes cumulative appreciation/depreciation as reported on the Consolidated Schedule of Open Futures Contracts. |
| | ** | | Included in total distributable earnings on the Consolidated Statement of Assets and Liabilities. |
| | | | | | | | |
| The Effect of Derivative Instruments on the Consolidated Statement of Operations for the period ended September 30, 2022 | |
|
| Amount of Realized Gain (Loss) on Derivatives | |
| | | Futures
Contracts | | | Forward
Currency
Contracts | |
| Commodity Contracts | | $ | 2,240,066 | | | $ | — | |
| Equity Contracts | | | (6,242,368 | ) | | | — | |
| Foreign Exchange Contracts | | | 21,998,272 | | | | 821,867 | |
| Interest Rate Contracts | | | 50,070,708 | | | | — | |
| | |
| Total | | $ | 68,066,678 | | | $ | 821,867 | |
|
| Change in Unrealized Appreciation (Depreciation) on Derivatives | |
| | | Futures
Contracts | | | Forward
Currency
Contracts | |
| Commodity Contracts | | $ | (4,186,016 | ) | | $ | — | |
| Equity Contracts | | | 6,446,131 | | | | — | |
| Foreign Exchange Contracts | | | 8,033,802 | | | | 6,359,336 | |
| Interest Rate Contracts | | | 4,530,521 | | | | — | |
| | |
| Total | | $ | 14,824,438 | | | $ | 6,359,336 | |
GuidePath Growth and Income Fund
During the period, the Fund used equity derivatives including S&P 500 Index futures and S&P 500 Index and exchange trade funds (“ETFs”) options, for both hedging and investment purposes, primarily risk management, and the pursuit of excess premium opportunities. The Fund used futures contracts during the period primarily to manage portfolio risk (volatility). The Fund wrote collateralized put options in an attempt to generate returns through receiving the option premiums; together with investments in fixed income instruments, it intended to lower the volatility relative to as if the Fund held the S&P 500 index.
156
GuideMark Funds & GuidePath Funds
NOTES TO FINANCIAL STATEMENTS (Continued) (Unaudited)
September 30, 2022
Statement of Assets and Liabilities – Values of Derivative Instruments as of September 30, 2022
| | | | | | | | | | | | |
| | | Asset Derivatives
| | | Liability Derivatives
| |
| | | Statement of Assets and
Liabilities Location | | Value | | | Statement of Assets and
Liabilities Location | | Value | |
| | | | |
| Equity Contracts – Futures* | | Unrealized appreciation on futures contracts** | | $ | 856,263 | | | Unrealized depreciation on futures contracts** | | $ | — | |
| | | | |
| Equity Contracts – Options | | Options written, at value | | | — | | | Options written, at value | | | 1,927,770 | |
| Total | | | | | $856,263 | | | | | $ | 1,927,770 | |
| | * | | Includes cumulative appreciation/depreciation as reported on the Schedule of Open Futures Contracts. |
| | ** | | Included in total distributable earnings on the Statement of Assets and Liabilities. |
| | | | | | | | |
| The Effect of Derivative Instruments on the Statement of Operations for the period ended September 30, 2022 | |
|
| Amount of Realized Gain (Loss) on Derivatives | |
| | | Futures
Contracts | | | Options
Written | |
| Equity Contracts | | $ | (469,254 | ) | | $ | (1,539,912 | ) |
| | |
| Total | | $ | (469,254 | ) | | $ | (1,539,912 | ) |
| | | | | | | | |
|
| Change in Unrealized Appreciation (Depreciation) on Derivatives | |
| | | Futures
Contracts | | | Options
Written | |
| Equity Contracts | | $ | 802,234 | | | $ | (1,702,890 | ) |
| | |
| Total | | $ | 802,234 | | | $ | (1,702,890 | ) |
Volume Disclosures
The average monthly value outstanding of options written during the period ended September 30, 2022 were as follows:
| | | | | | | | | | | | |
| | | GuideMark
Core Fixed
Income Fund | | | GuidePath
Managed Futures
Strategy Fund | | | GuidePath
Growth and
Income Fund | |
| Options Written | | $ | (33,285,714 | ) | | $ | — | | | $ | (794,361 | ) |
The average monthly notional amount outstanding of futures, forwards and swaps during the period ended September 30, 2022 were as follows:
| | | | | | | | | | | | |
| Long Positions | | GuideMark
Core Fixed
Income Fund | | | GuidePath
Managed Futures
Strategy Fund | | | GuidePath
Growth and
Income Fund | |
| Futures | | $ | 5,765,325 | | | $ | 91,437,365 | | | $ | 983,075 | |
| Forwards | | $ | — | | | $ | 96,648,242 | | | $ | — | |
| Swaps | | $ | 4,095,000 | | | $ | — | | | $ | — | |
| | | | | | | | | | | | |
| Short Positions | | GuideMark
Core Fixed
Income Fund | | | GuidePath
Managed Futures
Strategy Fund | | | GuidePath
Growth and
Income Fund | |
| Futures | | $ | (23,789,058 | ) | | $ | (1,343,418,665 | ) | | $ | (8,409,448 | ) |
| Forwards | | $ | — | | | $ | (20,256,004 | ) | | $ | — | |
Derivative Risks
The risks of using the various types of derivatives in which the Funds may engage include: the risk that movements in the value of the derivative may not fully offset or complement instruments currently held in the Funds in the manner intended by the Advisor or sub-advisor; the risk that the counterparty to a derivative contract may fail to comply with its obligations to the Funds; the risk that there may not be a liquid secondary market for the derivative at a time when the Funds would look to disengage the position; the risk that additional capital from the Funds may be called upon to fulfill the conditions of the derivative contract; the risk that the use of derivatives in the Funds may induce leverage in the Funds, and the risk that the cost of the derivative contracts may reduce the overall returns experienced by the Funds.
157
GuideMark Funds & GuidePath Funds
NOTES TO FINANCIAL STATEMENTS (Continued) (Unaudited)
September 30, 2022
Offsetting Assets and Liabilities
GuideMark Core Fixed Income Fund
The Fund is subject to various Master Netting Arrangements, which govern the terms of certain transactions with select counterparties. The Master Netting Arrangements allow the Fund to close out and net its total exposure to a counterparty in the event of a default with respect to all the transactions governed under a single agreement with a counterparty. The Master Netting Arrangements also specify collateral posting arrangements at pre-arranged exposure levels. Under the Master Netting Arrangements, collateral is routinely transferred if the total net exposure to certain transactions (net of existing collateral already in place) governed under the relevant Master Netting Arrangement with a counterparty in a given account exceeds a specified threshold depending on the counterparty and the type of Master Netting Arrangement.
The table below, as of September 30, 2022, discloses both gross information and net information about instruments and transactions eligible for offset in the Statements of Assets and Liabilities, and instruments and transactions that are subject to an agreement similar to a master netting agreement as well as amounts related to collateral held at clearing brokers and counterparties. For financial reporting purposes, the Fund does not offset derivative assets and liabilities, and any related collateral received or pledged, on the Statement of Assets and Liabilities, except in the case of futures contracts.
| | | | | | | | | | | | | | | | | | | | | | | | |
| Assets | | | | | | | | | | | Gross Amounts not offset in
the Statement of
Assets and Liabilities
| | | | |
| | | Gross Amounts
of Recognized
Assets
| | | Gross Amounts
Offset in the
Statement of
Assets and Liabilities
| | | Net Amounts
Presented in the
Statement of
Assets and Liabilities
| | | Financial
Instruments
| | | Collateral
Received
| | | Net
Amount
| |
Description / Counterparty | | | | | | | | | | | | | | | | | | | | | | | | |
Futures | | | | | | | | | | | | | | | | | | | | | | | | |
Citigroup | | $ | 1,024,990 | | | $ | — | | | $ | 1,024,990 | | | $ | (139,497 | ) | | $ | — | | | $ | 885,493 | |
Swaps | | | | | | | | | | | | | | | | | | | | | | | | |
Morgan Stanley | | | 164,238 | | | | — | | | | 164,238 | | | | (11,634 | ) | | | — | | | | 152,604 | |
| | |
|
|
| |
|
|
| |
|
|
| |
|
|
| |
|
|
| |
|
|
|
| | | $ | 1,189,228 | | | $ | — | | | $ | 1,189,228 | | | $ | (151,131 | ) | | $ | — | | | $ | 1,038,097 | |
| | |
|
|
| |
|
|
| |
|
|
| |
|
|
| |
|
|
| |
|
|
|
| | | | | | | | | | | | | | | | | | | | | | | | |
| Liabilities | | | | | | | | | | | Gross Amounts not offset in
the Statement of
Assets and Liabilities
| | | | |
| | | Gross Amounts
of Recognized
Liabilities
| | | Gross Amounts
Offset in the
Statement of
Assets and Liabilities
| | | Net Amounts
Presented in the
Statement of
Assets and Liabilities
| | | Financial
Instruments
| | | Collateral
Pledged
| | | Net
Amount
| |
Description / Counterparty | | | | | | | | | | | | | | | | | | | | | | | | |
Futures* | | | | | | | | | | | | | | | | | | | | | | | | |
Citigroup | | $ | 139,497 | | | $ | — | | | $ | 139,497 | | | $ | (139,497 | ) | | $ | — | | | $ | — | |
Options written | | | | | | | | | | | | | | | | | | | | | | | | |
Citigroup | | | 65,999 | | | | — | | | | 65,999 | | | | (65,999 | ) | | | — | | | | — | |
Bank of America | | | 51,000 | | | | — | | | | 51,000 | | | | (51,000 | ) | | | — | | | | — | |
Swaps | | | | | | | | | | | | | | | | | | | | | | | | |
Morgan Stanley | | | 11,634 | | | | — | | | | 11,634 | | | | (11,634 | ) | | | — | | | | — | |
| | |
|
|
| |
|
|
| |
|
|
| |
|
|
| |
|
|
| |
|
|
|
| | | $ | 268,130 | | | $ | — | | | $ | 268,130 | | | $ | (268,130 | ) | | $ | — | | | $ | — | |
| | |
|
|
| |
|
|
| |
|
|
| |
|
|
| |
|
|
| |
|
|
|
GuidePath Managed Futures Strategy Fund
The Fund is subject to various Master Netting Arrangements, which govern the terms of certain transactions with select counterparties. The Master Netting Arrangements allow the Fund to close out and net its total exposure to a counterparty in the event of a default with respect to all the transactions governed under a single agreement with a counterparty. The Master Netting Arrangements also specify collateral posting arrangements at pre-arranged exposure levels. Under the Master Netting Arrangements, collateral is routinely transferred if the total net exposure to certain transactions (net of existing collateral already in place) governed under the relevant Master Netting Arrangement with a counterparty in a given account exceeds a specified threshold depending on the counterparty and the type of Master Netting Arrangement.
158
GuideMark Funds & GuidePath Funds
NOTES TO FINANCIAL STATEMENTS (Continued) (Unaudited)
September 30, 2022
The table below, as of September 30, 2022, discloses both gross information and net information about instruments and transactions eligible for offset in the Consolidated Statement of Assets and Liabilities, and instruments and transactions that are subject to an agreement similar to a master netting agreement as well as amounts related to collateral held at clearing brokers and counterparties. For financial reporting purposes, the Fund does not offset derivative assets and liabilities, and any related collateral received or pledged, on the Consolidated Statement of Assets and Liabilities, except in the case of futures contracts.
| | | | | | | | | | | | | | | | | | | | | | | | |
| Assets | | | | | | | | | | | Gross Amounts not offset
in the Consolidated
Statement of
Assets and Liabilities
| | | | |
| | | Gross Amounts
of Recognized
Assets
| | | Gross Amounts
Offset in the
Consolidated
Statement of
Assets and Liabilities
| | | Net Amounts
Presented in the
Consolidated
Statement of
Assets and Liabilities
| | | Financial
Instruments
| | | Collateral
Received
| | | Net
Amount
| |
Description / Counterparty | | | | | | | | | | | | | | | | | | | | | | | | |
Forward | | | | | | | | | | | | | | | | | | | | | | | | |
NatWest | | $ | 4,640,443 | | | $ | — | | | $ | 4,640,443 | | | $ | (98,565 | ) | | $ | — | | | $ | 4,541,878 | |
Futures* | | | | | | | | | | | | | | | | | | | | | | | | |
Goldman Sachs | | | 3,265,664 | | | | (2,597,815 | ) | | | 667,849 | | | | (36,804 | ) | | | — | | | | 631,045 | |
| | |
|
|
| |
|
|
| |
|
|
| |
|
|
| |
|
|
| |
|
|
|
| | | $ | 7,906,107 | | | $ | (2,597,815 | ) | | $ | 5,308,292 | | | $ | (135,369 | ) | | $ | — | | | $ | 5,172,923 | |
| | |
|
|
| |
|
|
| |
|
|
| |
|
|
| |
|
|
| |
|
|
|
| | | | | | | | | | | | | | | | | | | | | | | | |
| Liabilities | | | | | | | | | | | Gross Amounts not offset
in the Consolidated
Statement of
Assets and Liabilities
| | | | |
| | | Gross Amounts
of Recognized
Liabilities
| | | Gross Amounts
Offset in the
Consolidated
Statement of
Assets and Liabilities
| | | Net Amounts
Presented in the
Consolidated
Statement of
Assets and Liabilities
| | | Financial
Instruments
| | | Collateral
Pledged
| | | Net
Amount
| |
Description / Counterparty | | | | | | | | | | | | | | | | | | | | | | | | |
Forward | | | | | | | | | | | | | | | | | | | | | | | | |
NatWest | | $ | 98,565 | | | $ | — | | | $ | 98,565 | | | $ | (98,565 | ) | | $ | — | | | $ | — | |
Futures* | | | | | | | | | | | | | | | | | | | | | | | | |
Goldman Sachs | | | 2,634,619 | | | | (2,597,815 | ) | | | 36,804 | | | | (36,804 | ) | | | | | | | — | |
| | |
|
|
| |
|
|
| |
|
|
| |
|
|
| |
|
|
| |
|
|
|
| | | $ | 2,733,184 | | | $ | (2,597,815 | ) | | $ | 135,369 | | | $ | (135,369 | ) | | $ | — | | | $ | — | |
| | |
|
|
| |
|
|
| |
|
|
| |
|
|
| |
|
|
| |
|
|
|
| * | | Cumulative appreciation/ depreciation on futures contracts is reported in the Consolidated Schedule of Open Futures Contracts – variation margin and recievable/payable for unsettled open futures contracts presented above is presented in the Consolidated Statement of Assets and Liabilities. |
In some instances, the collateral amounts disclosed in the tables were adjusted due to the requirement to limit the collateral amounts to avoid the effect of overcollateralization. Actual collateral received/pledged may be more than the amounts disclosed herein.
GuidePath Growth and Income Fund
The Fund is subject to various Master Netting Arrangements, which govern the terms of certain transactions with select counterparties. The Master Netting Arrangements allow the Fund to close out and net its total exposure to a counterparty in the event of a default with respect to all the transactions governed under a single agreement with a counterparty. The Master Netting Arrangements also specify collateral posting arrangements at pre-arranged exposure levels. Under the Master Netting Arrangements, collateral is routinely transferred if the total net exposure to certain transactions (net of existing collateral already in place) governed under the relevant Master Netting Arrangement with a counterparty in a given account exceeds a specified threshold depending on the counterparty and the type of Master Netting Arrangement.
159
GuideMark Funds & GuidePath Funds
NOTES TO FINANCIAL STATEMENTS (Continued) (Unaudited)
September 30, 2022
The table below, as of September 30, 2022, discloses both gross information and net information about instruments and transactions eligible for offset in the Statements of Assets and Liabilities, and instruments and transactions that are subject to an agreement similar to a master netting agreement as well as amounts related to collateral held at clearing brokers and counterparties. For financial reporting purposes, the Fund does not offset derivative assets and liabilities, and any related collateral received or pledged, on the Statement of Assets and Liabilities, except in the case of futures contracts.
| | | | | | | | | | | | | | | | | | | | | | | | |
| Liabilities | | | | | | | | | | | Gross Amounts not offset
in the Statement of
Assets and Liabilities
| | | | |
| | | Gross Amounts
of Recognized
Liabilities
| | | Gross Amounts
Offset in the
Statement of
Assets and Liabilities
| | | Net Amounts
Presented in the
Statement of
Assets and Liabilities
| | | Financial
Instruments
| | | Collateral
Pledged
| | | Net
Amount
| |
Description / Counterparty | | | | | | | | | | | | | | | | | | | | | | | | |
Options Written | | | | | | | | | | | | | | | | | | | | | | | | |
Interactive Brokers | | $ | 1,927,770 | | | $ | — | | | $ | 1,927,770 | | | $ | (1,927,770 | ) | | $ | — | | | $ | — | |
| | |
|
|
| |
|
|
| |
|
|
| |
|
|
| |
|
|
| |
|
|
|
| | | $ | 1,927,770 | | | $ | — | | | $ | 1,927,770 | | | $ | (1,927,770 | ) | | $ | — | | | $ | — | |
| | |
|
|
| |
|
|
| |
|
|
| |
|
|
| |
|
|
| |
|
|
|
Due to the absence of a master netting agreement relating to the Funds’ participation in securities lending, no additional disclosures have been made on behalf of the Funds. Please reference Note 7 for collateral related to securities on loan.
(m) Securities Purchased or Sold on a Forward-Commitment Basis The Funds may enter into when-issued or other purchase or sale transactions that specify forward delivery of a financial security. In connection with this ability, the Funds may enter into mortgage “dollar rolls” in which a Fund sells securities in the current month for delivery and simultaneously contracts with the same counterparty to repurchase similar (same type, coupon and maturity), but not identical securities on a specified future date. The party that is obligated to buy a security in the future will retain the use of their funds, and will benefit from any interest that is earned on those funds from the day that they enter into the forward contract until the day that they take delivery and pay for the security.
(n) Foreign Securities – For purposes of these financial statements, foreign securities are defined as securities issued by companies that are organized outside the United States. Investing in these types of securities make a fund more susceptible to additional risks. These risks include currency fluctuations, political and economic instability, less government regulation, less publicly available information, limited trading markets, differences in financial reporting standards, fewer protections for passive investors and less stringent regulation of securities markets. Moreover, securities of many foreign companies and foreign governments and their markets may be less liquid and their prices more volatile than those of securities of comparable U.S. companies and the U.S. government. Occasionally, events that affect these values and exchange rates may occur after the close of the exchange on which such securities are traded. If such events materially affect the value of a Fund’s securities, these securities may be valued at their fair value pursuant to procedures adopted by the Board.
(o) Foreign Currency Translation
The accounting records of the Funds are maintained in U.S. dollars. Investment securities and all other assets and liabilities of the Funds denominated in a foreign currency are translated into U.S. dollars at current exchange rates. Purchases and sales of securities, income receipts, and expense payments are translated into U.S. dollars at the exchange rate in effect on the dates of the respective transactions. The Funds do not isolate the
portion of the fluctuations on investments resulting from changes in foreign currency exchange rates from the fluctuations in market prices of investments held. Such fluctuations are included with the net realized and unrealized gain or loss from investments.
Net realized gain (loss) on foreign currencies include those gains and losses arising from the sale of foreign currencies, currency gains or losses realized between the trade and settlement dates on foreign currency transactions, the differences between the amounts of dividends, and foreign withholding taxes recorded on a Fund’s books, and the U.S. dollar equivalent of the amounts actually received or paid. Net unrealized appreciation (depreciation) on investments includes changes in the value of investments resulting from exchange rates.
The value of the Funds’ foreign holdings as measured in U.S. dollars may be affected unfavorably by changes in foreign currency exchange rates, as a change in the value of a foreign currency against the U.S. dollar generally will result in a corresponding change in the U.S. dollar value of securities denominated in that currency held by a Fund. In addition to the risks of foreign currency exchange rates generally, trading in the currencies of certain countries may face periods of limited liquidity or the political risk of exchange controls or currency repatriation restrictions, which may in turn make such holdings denominated in those currencies difficult to value. The Funds may also incur losses in connection with conversions between various currencies.
| | (p) | | Restricted and Illiquid Securities |
No Fund may acquire any illiquid investment if, immediately after the acquisition, the Fund would have invested more than 15% of it’s net assets in illiquid investments that are assets. The Advisor, with the assistance of the sub-advisors and/or pricing services, will determine the value of such securities in good faith pursuant to procedures adopted by the applicable Board of Trustees. Illiquid securities present the risks that a Fund may have difficulty valuing these holdings and/or may be unable to sell these holdings at the time or price desired. There are no
160
GuideMark Funds & GuidePath Funds
NOTES TO FINANCIAL STATEMENTS (Continued) (Unaudited)
September 30, 2022
restrictions on each Fund’s ability to invest in restricted securities (that is, securities that are not registered pursuant to the Securities Act of 1933), except to the extent such securities may be considered illiquid. Securities issued pursuant to Rule 144A of the Securities Act of 1933 will be considered liquid if determined to be so under the Funds’ liquidity guidelines.
| | (q) | | Auction Rate Securities |
The Core Fixed Income Fund and each of the GPS Funds II portfolios may invest in auction rate municipal securities. Auction rate securities usually permit the holder to sell the securities in an auction at par value at specified intervals. The dividend is reset by “Dutch” auction in which bids are made by broker-dealers and other institutions for a certain amount of securities at a specified minimum yield. The dividend rate set by the auction is the lowest interest or dividend rate that covers all securities offered for sale. While this process is designed to permit auction rate securities to be traded at par value, there is a risk that an auction will fail due to insufficient demand for the securities.
Although not currently part of any Fund’s principal investment strategy, each Fund has the ability to make equity short sales. Short sales are transactions where a Fund sells securities it does not own in anticipation of a decline in the value of the securities.
Effective April 1, 2021, for the services performed as Trustees of the consolidated Board of GPS Funds I and GPS Funds II, the Independent Trustees receive a retainer fee of $90,000 per year, $5,000 for each quarterly meeting and annual agreement renewal review meeting, whether held in-person or telephonically, $5,000 for each special meeting attended in person and $2,500 for each special meeting attended telephonically, as well as reimbursement for expenses incurred in connection with attendance at such meetings. The fees are allocated proportionally to each Fund within the Trusts based on total assets under management.
The “interested persons” who serve as Trustees of the Trusts receive no compensation from the Trusts for their services as Trustees. The Funds reimburse the Advisor an allocated amount for the compensation and related expenses of certain officers of the Trusts who provide compliance services to the Funds. The aggregate amount of all such reimbursements is determined by the Trustees. No other compensation or retirement benefits are received by any Trustee or officer from the Funds.
The Funds are subject to claims and suits that arise from time to time in the ordinary course of business. Although management currently believes that resolving claims against us, individually or in aggregate, will not have a material adverse impact on financial position, results of operations, or cash flows, these matters are subject to inherent uncertainties and management’s view of these matters may change in the future.
| | (u) | | Participatory Notes (“participation notes”) |
Each Fund may invest in participation notes. Participation notes are unsecured, bearer securities typically issued by financial
institutions, the return of which is generally linked to the performance of the underlying listed shares of a company in an emerging market (for example, the shares in a company incorporated in India and listed on the Bombay Stock Exchange). Participation notes are often used to gain exposure to securities of companies in the markets that restrict foreign ownership of local companies.
The terms of participation notes vary widely. Investors in participation notes do not have or receive any rights relating to the underlying shares, and the issuers of the notes may not be obligated to hold any shares in the underlying companies. Participation notes are not currently regulated by the governments of the countries upon which securities the notes are based. These instruments, issued by brokers with global registration, bear counterparty risk and may bear additional liquidity risk. These securities have been deemed to be liquid as of September 30, 2022.
Each Trust has an Investment Advisory Agreement (the “Agreement”) with AssetMark, Inc. (the “Advisor” or “AssetMark”), with whom certain officers and trustees of the Trust are affiliated, to furnish investment advisory services to the Funds. The Cayman subsidiary of the GuidePath Managed Futures Strategy Fund aslo has an Investment Advisory Agreement with AssetMark, with whom certain officers and trustees of the Trust are affiliated, to furnish investment advisory services to the Fund. Under the terms of the Agreement, the Funds compensate the Advisor monthly for its management services at the following contractual rates, based on each Fund’s average daily net assets:
| | | | |
Large Cap Core Fund | | | 0.45% | |
Emerging Markets Fund | | | 0.59% | |
Small/Mid Cap Core Fund | | | 0.57% | |
World ex-US Fund | | | 0.50% | |
Core Fixed Income Fund | | | 0.40% | |
Growth Allocation Fund | | | 0.25% | |
Conservative Allocation Fund | | | 0.25% | |
Tactical Allocation Fund | | | 0.35% | |
Absolute Return Allocation Fund | | | 0.35% | |
Multi-Asset Income Allocation Fund | | | 0.35% | |
Flexible Income Allocation Fund | | | 0.25% | |
Managed Futures Strategy Fund | | | 1.05% | |
Conservative Income Fund | | | 0.35% | |
Income Fund | | | 0.45% | |
Growth and Income Fund | | | 0.45% | |
AssetMark also provides certain administrative services to the shares of the Conservative Income Fund, Income Fund and Growth and Income Fund, and to the Service Shares of the remaining Funds, pursuant to Administrative Services Agreements between the Funds and AssetMark, for which AssetMark receives a monthly fee of 0.25% of the average daily net assets of the applicable class of shares of each Fund. Pursuant to an administrative services agreement, AssetMark provides services in connection with the operation and administration of the AssetMark Platform, including, among other things, back-office, administrative, custodial support and clerical services. Investors holding shares of the Funds outside of the AssetMark Platform are subject to these administrative services fees, but may not receive all of the related services.
161
GuideMark Funds & GuidePath Funds
NOTES TO FINANCIAL STATEMENTS (Continued) (Unaudited)
September 30, 2022
In addition, GPS Funds I and the Advisor have also entered into a Fee Waiver Agreement designed to provide Fund shareholders with the economic benefits of economies of scale that may be realized as Fund assets increase. Under the Fee Waiver Agreement, the Advisor has contractually agreed to waive, 0.025% of each Fund’s annual advisory fee on GPS Funds I assets in excess of $6 billion and an additional 0.025% of each Fund’s annual advisory fee on GPS Funds I assets in excess of $12 billion.
Each Fund and the Advisor have also entered into an Expense Limitation Agreement under which the Advisor has agreed to waive, through July 31, 2023, its management fee and/or reimburse each Fund’s other expenses to the extent necessary to ensure that the Fund’s net annual operating expenses (excluding taxes, interest, trading costs, acquired fund expenses, expenses paid with securities lending expense offset credits and non-routine expenses) do not exceed the following rates (“Expense Limits”), based on daily net assets of each class of each Fund:
| | | | | | | | | | | | |
| | | Service
Class
| | | Institutional
Class
| | | Single
Class
| |
Large Cap Core Fund | | | 0.99% | | | | 0.64% | | | | — | |
Emerging Markets Fund | | | 1.40% | | | | 1.05% | | | | — | |
Small/Mid Cap Core Fund | | | 1.20% | | | | 0.85% | | | | — | |
World ex-US Fund | | | 1.14% | | | | 0.79% | | | | — | |
Core Fixed Income Fund | | | 0.94% | | | | 0.59% | | | | — | |
Growth Allocation Fund | | | 0.75% | | | | 0.40% | | | | — | |
Conservative Allocation Fund | | | 0.45% | | | | 0.10% | | | | — | |
Tactical Allocation Fund | | | 0.85% | | | | 0.50% | | | | — | |
Absolute Return Allocation Fund | | | 0.55% | | | | 0.20% | | | | — | |
Multi-Asset Income Allocation Fund | | | 0.85% | | | | 0.50% | | | | — | |
Flexible Income Allocation Fund | | | 0.50% | | | | 0.15% | | | | — | |
Managed Futures Strategy Fund | | | 1.65% | | | | 1.30% | | | | — | |
Conservative Income Fund | | | — | | | | — | | | | 0.64% | |
Income Fund | | | — | | | | — | | | | 0.79% | |
Growth and Income Fund | | | — | | | | — | | | | 0.79% | |
Any such contractual waiver or reimbursement is subject to later adjustment to allow the Advisor to recoup amounts waived or reimbursed to the extent actual fees and expenses for a fiscal period are less than each Fund’s Expense Limits at the time of the waiver, provided, however, that the Advisor shall only be entitled to recoup such amounts for a period of three years after the end of the calendar month in which the fee or expense was waived or reimbursed. As of September 30, 2022, Large Cap Core Fund, Emerging Markets Fund Service Class Shares, Small/Mid Cap Core Fund, Growth Allocation Fund, Tactical Allocation Fund, Multi-Asset Income Allocation Fund and Managed Futures Strategy Fund have recouped all potential recoverable waivers or reimbursed expenses.
The Advisor is currently waiving fees and, in some cases, reimbursing expenses in the Funds listed below in order to keep these Funds at their Expense Limits. Waived expenses subject to potential recovery are as follows:
| | | | | | | | | | | | | | | | |
| | | Year of
Expiration
03/31/2023
| | | Year of
Expiration
03/31/2024
| | | Year of
Expiration
03/31/2025
| | | Year of
Expiration
03/31/2026
| |
Emerging Markets Fund | | $ | 9 | | | $ | — | | | $ | — | | | $ | 101,091 | |
World ex-US Fund | | | 3 | | | | 21 | | | | 155,025 | | | | 75,413 | |
Core Fixed Income Fund | | | 47,021 | | | | 123,677 | | | | 89,424 | | | | 48,278 | |
Conservative Allocation Fund | | | 389,424 | | | | 725,482 | | | | 812,082 | | | | 314,257 | |
Absolute Return Allocation Fund | | | 368,484 | | | | 590,940 | | | | 312,450 | | | | 275,043 | |
Flexible Income Allocation Fund | | | 109,083 | | | | 289,266 | | | | 212,963 | | | | 199,582 | |
Conservative Income Fund | | | 32,174 | | | | 38,716 | | | | 53,047 | | | | 16,163 | |
Income Fund | | | 34,524 | | | | 27,465 | | | | 3,614 | | | | 12,270 | |
Growth and Income Fund | | | 62,844 | | | | 81,402 | | | | 43,413 | | | | 2,958 | |
Sub-advisory services are provided to certain of the Funds, pursuant to agreements between the Advisor and various sub-advisors. Under the terms of these sub-advisory agreements, the Advisor compensates each sub-advisor based on the portion of each Fund’s average daily net assets that is allocated to the sub-advisor.
| 5. | | Service, Custody, and Line of Credit Agreements |
The Funds have entered into Service Agreements with U.S. Bancorp Fund Services, LLC, doing business as U.S. Bank Global Fund
Services (“Fund Services”) and a Custody Agreement with U.S. Bank, N.A. (“USB” or the “Custodian”), an affiliate of Fund Services. Under these agreements, Fund Services and the Custodian
162
GuideMark Funds & GuidePath Funds
NOTES TO FINANCIAL STATEMENTS (Continued) (Unaudited)
September 30, 2022
provide certain transfer agency, administrative, accounting and custody services.
The Funds have established a line of credit (“LoC”) with USB to be used for temporary or emergency purposes, primarily for financing redemption payments, using the securities in the Funds’ portfolios as collateral. The LoC was renewed August 1, 2022 and will mature, unless renewed, on July 25, 2023. Borrowing under the LoC
is limited to the lesser of 20% of the gross market value of a Fund, 20% of specific marketable securities acceptable to USB, or $250,000,000 for all Funds. The interest rate paid by the Funds on outstanding borrowings is equal to the prime rate, which was 6.25% at September 30, 2022. The Funds have authorized USB to charge any of the custody accounts of the Funds for any missed payments by the Funds. Interest expense incurred for the Funds is disclosed on the Statements of Operations.
During the period ended April 1, 2022 to September 30, 2022, the details of the borrowings were as follows:
| | | | | | | | | | | | |
Fund
| | Average Daily
Borrowings
| | | Weighted Average Annualized
Interest Rate
| | | Maximum
Borrowings
| |
Emerging Markets Fund | | $ | 87,421 | | | | 4.02 | % | | $ | 3,712,000 | |
World ex-US Fund | | | 5,705 | | | | 5.05 | % | | | 261,000 | |
Growth Allocation Fund | | | 2,098,000 | | | | 5.50 | % | | | 77,574,000 | |
Conservative Allocation Fund | | | 1,048,601 | | | | 5.33 | % | | | 43,493,000 | |
Absolute Return Allocation Fund | | | 1,537,082 | | | | 5.50 | % | | | 87,465,000 | |
Multi-Asset Income Allocation Fund | | | 215,596 | | | | 5.43 | % | | | 7,927,000 | |
Flexible Income Allocation Fund | | | 269,022 | | | | 5.13 | % | | | 21,521,000 | |
Growth and Income Fund | | | 167,158 | | | | 3.62 | % | | | 14,512,000 | |
The Trusts, on behalf of certain of the Funds, entered into securities lending arrangements with the Custodian. Under the terms of the agreement, the Custodian is authorized to loan securities on behalf of the Funds to approved brokers. In exchange, under normal market conditions, the Funds receive cash collateral in the amount of at least 102% of the value of securities loaned for domestic securities, and 105% of the value of securities loaned with respect to foreign securities. The cash collateral is invested in the Mount Vernon Liquid Assets Portfolio, LLC of which the investment objective is to seek to maximize income to the extent consistent with the preservation of capital and liquidity and maintain a stable Net Asset Value (“NAV”) of $1.00. Although risk is mitigated by the collateral, the Funds could experience a delay in recovering their securities and possible loss of income or value if the borrower fails to return the borrowed securities. In addition, the Funds bear the risk of loss associated with the investment of cash collateral received. After predetermined rebates to brokers, a percentage of
the net securities lending revenue is credited to the Funds to be used as an offset against costs and other charges incurred by the Funds with the Custodian or its affiliates or, as directed in writing by the Funds, other service providers. The Custodian is paid a fee for administering a securities lending program for the Funds, equal to the remaining percentage of the net securities lending revenues generated under the agreement.
During the period ended September 30, 2022, the Funds had loaned securities that were collateralized by cash. The Funds continue to receive interest payments or dividends on the securities loaned during the borrowing year. The cash collateral received was invested in securities as listed in each Fund’s Schedule of Investments. Income earned from these investments is allocated to each Fund based on each Fund’s portion of total cash collateral received. The Funds also receive compensation in the form of fees which depend on a number of factors including the type of security and length of the loan. Securities lending income is disclosed in each Fund’s Statement of Operations as a securities lending credit.
Secured Borrowings
| | | | |
Securities Lending Transactions
| | | |
Overnight and Continuous
| | Investments Purchased with
Proceeds from Securities
Lending Collateral
| |
Large Cap Core Fund | | $ | 50,893,955 | |
Emerging Markets Fund | | | 2,132,591 | |
Small/Mid Cap Core Fund | | | 22,782,871 | |
World ex-US Fund | | | 4,133,164 | |
Core Fixed Income Fund | | | 3,061,000 | |
Growth Allocation Fund | | | 157,022,731 | |
Conservative Allocation Fund | | | 104,331,390 | |
Tactical Allocation Fund | | | 30,932,216 | |
Absolute Return Allocation Fund | | | 60,309,447 | |
Multi-Asset Income Allocation Fund | | | 23,811,535 | |
Flexible Income Allocation Fund | | | 98,791,695 | |
Managed Futures Strategy Fund | | | — | |
Conservative Income Fund | | | 2,178,040 | |
Income Fund | | | — | |
Growth & Income Fund | | | 2,875,955 | |
| |
Amounts related to agreements not included in offsetting disclosure in Note 3 (Offsetting Assets and Liabilities). | | $ | 563,256,590 | |
163
GuideMark Funds & GuidePath Funds
NOTES TO FINANCIAL STATEMENTS (Continued) (Unaudited)
September 30, 2022
| 7. | | Investment Transactions |
The aggregate purchases and sales of securities, excluding short-term investments, for the period ended September 30, 2022 are summarized below.
| | | | | | | | |
| | | Purchases
| | | Sales
| |
Large Cap Core Fund | | $ | 123,167,758 | | | $ | 210,436,339 | |
Emerging Markets Fund | | | 11,555,598 | | | | 22,660,123 | |
Small/Mid Cap Core Fund | | | 18,568,024 | | | | 14,844,680 | |
World ex-US Fund | | | 26,499,795 | | | | 38,315,348 | |
Core Fixed Income Fund* | | | 284,722,430 | | | | 299,135,183 | |
Growth Allocation Fund | | | 122,570,438 | | | | 177,109,019 | |
Conservative Allocation Fund | | | 63,260,849 | | | | 118,873,914 | |
| | | | | | | | |
| | | Purchases
| | | Sales
| |
Tactical Allocation Fund | | $ | 397,264,994 | | | $ | 401,184,857 | |
Absolute Return Allocation Fund | | | 407,603,565 | | | | 276,105,717 | |
Multi-Asset Income Allocation Fund | | | 28,897,630 | | | | 41,253,055 | |
Flexible Income Allocation Fund | | | 801,315,910 | | | | 820,856,147 | |
Managed Futures Strategy Fund | | | — | | | | — | |
Conservative Income Fund | | | 25,142,369 | | | | 21,313,037 | |
Income Fund | | | 65,253,124 | | | | 50,998,105 | |
Growth and Income Fund | | | 13,653,401 | | | | 21,901,877 | |
| | * | | Included in these amounts were $251,170,055 of purchases and $262,149,666 of sales of U.S. Government Securities. |
| 8. | | Transactions with Affiliates |
The GuidePath Flexible Income Allocation Fund owned 5% or more of the voting securities of the following company during the period ended September 30, 2022. As a result, this company is deemed to be an affiliated company. The below table represents fair value:
| | | | | | | | | | | | | | | | |
Issuer
| | Value as of
April 1, 2022
| | | Purchases
| | | Sales
| | | Realized Gain
(Loss)
| |
WisdomTree Bloomberg U.S. Dollar Bullish Fund1 | | $ | 11,530,173 | | | $ | 2,105,102 | | | $ | 4,903,465 | | | $ | 203,944 | |
| | |
|
|
| |
|
|
| |
|
|
| |
|
|
|
| | | $ | 11,530,173 | | | $ | 2,105,102 | | | $ | 4,903,465 | | | $ | 203,944 | |
| | |
|
|
| |
|
|
| |
|
|
| |
|
|
|
| | | | | | | | | | | | | | | | |
Issuer
| | Change in
Unrealized
Appreciation
(Depreciation)
| | | Dividend
Income
| | | Fair Value
as of
September 30,
2022
| | | Share Balance
as of
September 30,
2022
| |
WisdomTree Bloomberg U.S. Dollar Bullish Fund1 | | $ | 1,141,113 | | | $ | — | | | $ | 10,076,867 | | | | 338,377 | |
| | |
|
|
| |
|
|
| |
|
|
| |
|
|
|
| | | $ | 1,141,113 | | | $ | — | | | $ | 10,076,867 | | | | 338,377 | |
| | |
|
|
| |
|
|
| |
|
|
| |
|
|
|
| | 1 | | No longer an affiliate as of September 30, 2022. |
The global outbreak of COVID-19, first detected in China in December 2019, has disrupted economic markets and the long-term economic impact is uncertain. The operational and financial performance of the issuers of securities in which a Fund invests depends on future developments, including the duration and spread of the outbreak, and such uncertainty may in turn impact the value of the Funds’ investments.
| 10. | | LIBOR Discontinuation |
Certain variable rate securities use the London Interbank Offered Rate (“LIBOR”) as a reference interest rate. On July 27, 2017, the head of the United Kingdom’s Financial Conduct Authority announced a planned phase out of LIBOR by the end of 2021. Although many LIBOR rates were phased out at the end of 2021 as originally intended, certain widely used US dollar (USD) LIBOR rate settings (overnight, 1-, 3- ,6-, and 12-month) will continue to be published in representative forms until June 30, 2023 in order to assist with the market transition away from LIBOR-based instruments. Actions by regulators have resulted in the establishment of alternative reference rates to LIBOR in most major currencies. The transition to alternative rates may adversely affect the value or liquidity of certain LIBOR-based investments or reduce the effectiveness of related transactions such as hedges and the ultimate impact of the transition on markets generally remains uncertain.
On February 24, 2022, Russia commenced a military attack on Ukraine. This has led to various countries, including the US, imposing economic sanctions on certain Russian individuals and entities. In response to these events, the Russian government has imposed capital controls to restrict movements of capital entering and exiting the country. The conflict and related events have and may continue to result in price volatility and liquidity constraints. Future market disruptions as a result of the war cannot be predicted, but could be significant and may include adverse effects on global economic growth as well as the markets for certain securities and commodities, such as oil and natural gas, among other sectors. The duration of the conflict, potential for escalation and ultimate effects on the Funds cannot currently be predicted.
12. Other Tax Information
Net investment income and realized gains and losses for Federal income tax purposes may differ from that reported on the financial statements because of permanent book-to-tax differences. GAAP requires that permanent differences between financial reporting and tax reporting be reclassified between various components of net assets.
164
GuideMark Funds & GuidePath Funds
NOTES TO FINANCIAL STATEMENTS (Continued) (Unaudited)
September 30, 2022
These differences are primarily due to CFC income reversal, partnerships and equalization. On the Statements of Assets and Liabilities, the following adjustments were made:
| | | | | | | | |
| | | Total Distrubutable
Earnings (Loss)
| | | Capital
Stock
| |
Large Cap Core Fund | | $ | (2,265,532 | ) | | $ | 2,265,532 | |
Emerging Markets Fund | | | (1,554,428 | ) | | | 1,554,428 | |
Small/Mid Cap Core Fund | | | (1,216,000 | ) | | | 1,216,000 | |
World ex-US Fund | | | (302,612 | ) | | | 302,612 | |
Core Fixed Income Fund | | | 1 | | | | (1 | ) |
Growth Allocation Fund | | | (5,298,616 | ) | | | 5,298,616 | |
Conservative Allocation Fund | | | (1,559,297 | ) | | | 1,559,297 | |
Tactical Allocation Fund | | | (6,146,034 | ) | | | 6,146,034 | |
Absolute Return Allocation Fund | | | — | | | | — | |
Multi-Asset Income Allocation Fund | | | — | | | | — | |
Flexible Income Allocation Fund | | | (547,924 | ) | | | 547,924 | |
Managed Futures Strategy Fund | | | (13,054,569 | ) | | | 13,054,569 | |
Conservative Income Fund | | | 6,986 | | | | (6,986 | ) |
Income Fund | | | — | | | | — | |
Growth and Income Fund | | | 78,295 | | | | (78,295 | ) |
The Funds intend to utilize capital loss carryforwards to offset future realized capital gains. Losses are carried forward indefinitely and any corresponding loss character is retained. Capital loss carryforwards available for Federal income tax purposes are as follows:
| | | | | | | | | | | | |
| | | Capital losses
| | | | |
| | | Short Term
| | | Long Term
| | | Utilized
| |
Large Cap Core Fund | | $ | — | | | $ | — | | | $ | (1,584,575 | ) |
Emerging Markets Fund | | | — | | | | — | | | | — | |
Small/Mid Cap Core Fund | | | — | | | | — | | | | — | |
World ex-US Fund | | | — | | | | — | | | | (5,299,983 | ) |
Core Fixed Income Fund | | | — | | | | — | | | | — | |
Growth Allocation Fund | | | — | | | | — | | | | — | |
Conservative Allocation Fund | | | — | | | | — | | | | — | |
Tactical Allocation Fund | | | — | | | | — | | | | — | |
Absolute Return Allocation Fund | | | — | | | | 1,353,616 | | | | (1,631,954 | ) |
Multi-Asset Income Allocation Fund | | | — | | | | 5,200,922 | | | | (4,520,738 | ) |
Flexible Income Allocation Fund | | | — | | | | — | | | | (529,452 | ) |
Managed Futures Strategy Fund | | | — | | | | — | | | | — | |
Conservative Income Fund | | | 133,132 | | | | 10,190 | | | | — | |
Income Fund | | | 1,581,781 | | | | — | | | | — | |
Growth and Income Fund | | | — | | | | — | | | | — | |
165
GuideMark Funds & GuidePath Funds
NOTES TO FINANCIAL STATEMENTS (Continued) (Unaudited)
September 30, 2022
Additionally, at March 31, 2022, the Funds deferred on a tax basis losses as follows:
| | | | | | | | |
| | | Ordinary Late
Year Loss
| | | Capital
Loss
| |
Large Cap Core Fund | | $ | — | | | $ | 111,429 | |
Emerging Markets Fund | | | — | | | | 355,705 | |
Small/Mid Cap Core Fund | | | 174,013 | | | | 740,379 | |
World ex-US Fund | | | — | | | | — | |
Core Fixed Income Fund | | | — | | | | 1,108,729 | |
Growth Allocation Fund | | | — | | | | — | |
Conservative Allocation Fund | | | — | | | | — | |
Tactical Allocation Fund | | | — | | | | — | |
Absolute Return Allocation Fund | | | — | | | | — | |
Multi-Asset Income Allocation Fund | | | — | | | | — | |
Flexible Income Allocation Fund | | | — | | | | 3,353,310 | |
Managed Futures Strategy Fund | | | — | | | | — | |
Conservative Income Fund | | | 3,165 | | | | — | |
Income Fund | | | — | | | | — | |
Growth and Income Fund | | | 67,920 | | | | 916,361 | |
A regulated investment company may elect for any taxable year to treat any portion of the qualified late year loss as arising on the first day of the next taxable year. Qualified late year losses are certain capital and ordinary losses which occur during the portion of the taxable year subsequent to October 31 and December 31, respectively.
The character of distributions for tax purposes paid during the fiscal years ended March 31, 2022 and March 31, 2021 are as follows:
| | | | | | | | | | | | |
| | | Year Ended March 31, 2022
| |
| | | Ordinary
Income
Distributions
| | | Long-Term
Capital Gain
Distributions
| | | Return of
Capital
| |
Large Cap Core Fund | | $ | 4,380,405 | | | $ | 17,492,713 | | | $ | — | |
Emerging Markets Fund | | | 2,454,324 | | | | 5,150,349 | | | | — | |
Small/Mid Cap Core Fund | | | 1,322,987 | | | | 10,865,602 | | | | — | |
World ex-US Fund | | | 1,530,013 | | | | — | | | | — | |
Core Fixed Income Fund | | | 2,772,722 | | | | 1,924,511 | | | | — | |
Growth Allocation Fund | | | 15,113,758 | | | | 16,949,619 | | | | — | |
Conservative Allocation Fund | | | 11,536,921 | | | | 6,206,078 | | | | — | |
Tactical Allocation Fund | | | 39,531,728 | | | | 9,786,060 | | | | — | |
Absolute Return Allocation Fund | | | 4,479,391 | | | | — | | | | — | |
Multi-Asset Income Allocation Fund | | | 3,347,756 | | | | — | | | | — | |
Flexible Income Allocation Fund | | | 8,322,123 | | | | — | | | | — | |
Managed Futures Strategy Fund | | | 14,193,380 | | | | 5,162,678 | | | | — | |
Conservative Income Fund | | | 69,357 | | | | — | | | | 6,986 | |
Income Fund | | | 918,444 | | | | — | | | | — | |
Growth and Income Fund | | | 6,681,000 | | | | 8,349,427 | | | | 78,293 | |
166
GuideMark Funds & GuidePath Funds
NOTES TO FINANCIAL STATEMENTS (Continued) (Unaudited)
September 30, 2022
| | | | | | | | |
| | | Year Ended March 31, 2021
| |
| | | Ordinary
Income
Distributions
| | | Long-Term
Capital Gain
Distributions
| |
Large Cap Core Fund | | $ | 2,201,345 | | | $ | — | |
Emerging Markets Fund | | | 177,627 | | | | — | |
Small/Mid Cap Core Fund | | | 110,758 | | | | 1,642,553 | |
World ex-US Fund | | | 2,716,002 | | | | — | |
Core Fixed Income Fund | | | 4,964,515 | | | | 636,513 | |
Growth Allocation Fund | | | 4,754,892 | | | | 13,935,648 | |
Conservative Allocation Fund | | | 7,633,082 | | | | 1,474,838 | |
Tactical Allocation Fund | | | 2,082,296 | | | | 18,172,038 | |
Absolute Return Allocation Fund | | | 5,196,739 | | | | — | |
Multi-Asset Income Allocation Fund | | | 3,193,649 | | | | — | |
Flexible Income Allocation Fund | | | 4,975,241 | | | | — | |
Managed Futures Strategy Fund | | | — | | | | 6,730,017 | |
Conservative Income Fund | | | 33,188 | | | | — | |
Income Fund | | | 628,224 | | | | — | |
Growth and Income Fund | | | 795,837 | | | | — | |
At March 31, 2022, the components of accumulated earnings (losses) on a tax basis were as follows:
| | | | | | | | | | | | | | | | | | | | |
| | | Large Cap Core
Fund
| | | Emerging
Markets Fund
| | | Small/Mid
Cap Core
Fund
| | | World
ex-US
Fund
| | | Core
Fixed Income
Fund
| |
Cost of Portfolio* | | $ | 483,488,173 | | | $ | 59,638,941 | | | $ | 108,694,135 | | | $ | 96,135,002 | | | $ | 261,602,958 | |
| | |
|
|
| |
|
|
| |
|
|
| |
|
|
| |
|
|
|
Gross Unrealized Appreciation | | $ | 309,218,459 | | | $ | 22,820,985 | | | $ | 39,907,800 | | | $ | 37,164,771 | | | $ | 1,361,450 | |
Gross Unrealized Depreciation | | | (13,691,251 | ) | | | (8,192,515 | ) | | | (5,786,515 | ) | | | (6,020,911 | ) | | | (11,157,925 | ) |
| | |
|
|
| |
|
|
| |
|
|
| |
|
|
| |
|
|
|
Net Unrealized Appreciation/(Depreciation) | | | 295,527,208 | | | | 14,628,470 | | | | 34,121,285 | | | | 31,143,860 | | | | (9,796,475 | ) |
| | |
|
|
| |
|
|
| |
|
|
| |
|
|
| |
|
|
|
Undistributed Ordinary Income | | | — | | | | — | | | | — | | | | 2,185,741 | | | | 488,021 | |
Undistributed Long-Term Cap Gains | | | 11,380,540 | | | | 4,786,410 | | | | 783,736 | | | | 753,285 | | | | — | |
Other Accumulated Gains/(Losses) | | | (111,645 | ) | | | (355,705 | ) | | | (914,421 | ) | | | — | | | | (1,108,729 | ) |
| | |
|
|
| |
|
|
| |
|
|
| |
|
|
| |
|
|
|
Total Distributable Earnings/(Loss) | | | 306,796,103 | | | | 19,059,175 | | | | 33,990,600 | | | | 34,082,886 | | | | (10,417,183 | ) |
| | |
|
|
| |
|
|
| |
|
|
| |
|
|
| |
|
|
|
| | | | | |
| | | Growth
Allocation
Fund
| | | Conservative
Allocation
Fund
| | | Tactical
Allocation
Fund
| | | Absolute
Return
Allocation
Fund
| | | Multi-Asset
Income
Allocation
Fund
| |
Cost of Portfolio* | | $ | 1,026,512,042 | | | $ | 557,607,670 | | | $ | 555,369,963 | | | $ | 271,071,560 | | | $ | 127,282,927 | |
| | |
|
|
| |
|
|
| |
|
|
| |
|
|
| |
|
|
|
Gross Unrealized Appreciation | | $ | 376,431,974 | | | $ | 66,047,672 | | | $ | 29,130,266 | | | $ | 4,994,240 | | | $ | 18,749,721 | |
Gross Unrealized Depreciation | | | (25,848,357 | ) | | | (18,707,528 | ) | | | (12,927,846 | ) | | | (9,005,584 | ) | | | (4,381,519 | ) |
| | |
|
|
| |
|
|
| |
|
|
| |
|
|
| |
|
|
|
Net Unrealized Appreciation/(Depreciation) | | | 350,583,617 | | | | 47,340,144 | | | | 16,202,420 | | | | (4,011,344 | ) | | | 14,368,202 | |
| | |
|
|
| |
|
|
| |
|
|
| |
|
|
| |
|
|
|
Undistributed Ordinary Income | | | 662,293 | | | | 1,599,360 | | | | 13,931,946 | | | | 1,043,414 | | | | 498,527 | |
Undistributed Long-Term Cap Gains | | | 33,002,646 | | | | 1,410,637 | | | | 8,621,703 | | | | — | | | | — | |
Other Accumulated Gains/(Losses) | | | (9,659 | ) | | | (9,659 | ) | | | (9,659 | ) | | | (1,363,275 | ) | | | (5,200,922 | ) |
| | |
|
|
| |
|
|
| |
|
|
| |
|
|
| |
|
|
|
Total Distributable Earnings/(Loss) | | | 384,238,897 | | | | 50,340,482 | | | | 38,746,410 | | | | (4,331,205 | ) | | | 9,665,807 | |
| | |
|
|
| |
|
|
| |
|
|
| |
|
|
| |
|
|
|
167
GuideMark Funds & GuidePath Funds
NOTES TO FINANCIAL STATEMENTS (Continued) (Unaudited)
September 30, 2022
| | | | | | | | | | | | | | | | | | | | |
| | | Flexible
Income
Allocation
Fund
| | | Managed
Futures
Strategy
Fund
| | | Conservative
Income
Fund
| | | Income
Fund
| | | Growth and
Income
Fund
| |
Cost of Portfolio* | | $ | 409,246,214 | | | $ | 242,000,490 | | | $ | 11,021,918 | | | $ | 47,396,113 | | | $ | 121,215,978 | |
| | |
|
|
| |
|
|
| |
|
|
| |
|
|
| |
|
|
|
Gross Unrealized Appreciation | | $ | 335,666 | | | $ | 3,304,628 | | | $ | 25,002 | | | $ | — | | | $ | 8,714,381 | |
Gross Unrealized Depreciation | | | (12,008,084 | ) | | | (1,259,456 | ) | | | (103,918 | ) | | | (2,799,400 | ) | | | (2,597,700 | ) |
| | |
|
|
| |
|
|
| |
|
|
| |
|
|
| |
|
|
|
Net Unrealized Appreciation/(Depreciation) | | | (11,672,418 | ) | | | 2,045,172 | | | | (78,916 | ) | | | (2,799,400 | ) | | | 6,116,681 | |
| | |
|
|
| |
|
|
| |
|
|
| |
|
|
| |
|
|
|
Undistributed Ordinary Income | | | — | | | | 18,236,864 | | | | — | | | | 7,773 | | | | — | |
Undistributed Long-Term Cap Gains | | | 2,197,965 | | | | 702,935 | | | | — | | | | — | | | | — | |
Other Accumulated Gains/(Losses) | | | (3,353,310 | ) | | | 3,157,388 | | | | (146,487 | ) | | | (1,581,781 | ) | | | (984,281 | ) |
| | |
|
|
| |
|
|
| |
|
|
| |
|
|
| |
|
|
|
Total Distributable Earnings/(Loss) | | | (12,827,763 | ) | | | 24,142,359 | | | | (225,403 | ) | | | (4,373,408 | ) | | | 5,132,400 | |
| | |
|
|
| |
|
|
| |
|
|
| |
|
|
| |
|
|
|
The differences between book-basis and tax-basis unrealized appreciation and depreciation is primarily attributable to the tax deferral of losses on wash sales and other temporary differences.
| | * | | Portfolio includes investments and derivative contracts |
168
GuideMark Funds & GuidePath Funds
ADDITIONAL INFORMATION
September 30, 2022
Additional Information
| 1. | | Shareholder Notification of Federal Tax Status (Unaudited) |
The Funds designated the following percentages of dividends during the fiscal year ended March 31, 2022 as dividends qualifying for the dividends received deduction available to corporate shareholders and as dividends from net investment income that are qualifying income under the Jobs and Growth Tax Relief Reconciliation Act of 2003, respectively:
| | | | | | | | |
| | | Dividends received
deduction % for
corporate shareholders
| | | % of dividends as
qualified income
| |
Large Cap Core Fund | | | 100.00% | | | | 100.00% | |
Emerging Markets Fund | | | 0.95% | | | | 77.71% | |
Small/Mid Cap Core Fund | | | 95.88% | | | | 99.21% | |
World ex-US Fund | | | 0.00% | | | | 100.00% | |
Core Fixed Income Fund | | | 0.00% | | | | 0.00% | |
Growth Allocation Fund | | | 27.72% | | | | 77.31% | |
Conservative Allocation Fund | | | 12.26% | | | | 35.42% | |
Tactical Allocation Fund | | | 9.60% | | | | 10.85% | |
Absolute Return Allocation Fund | | | 0.03% | | | | 0.27% | |
Multi-Asset Income Allocation Fund | | | 31.27% | | | | 58.15% | |
Flexible Income Allocation Fund | | | 1.19% | | | | 3.08% | |
Managed Futures Strategy Fund | | | 0.00% | | | | 0.00% | |
Conservative Income Fund | | | 0.00% | | | | 0.00% | |
Income Fund | | | 8.94% | | | | 9.03% | |
Growth and Income Fund | | | 0.55% | | | | 2.03% | |
The Percentage of taxable ordinary income distributions that are designated as short-term capital gain distributions under Internal Revenue Section 871 (k)(2)(c) for each Fund were as follows (unaudited).
| | | | |
| | | % of dividends as
short-term
capital gain
| |
Large Cap Core Fund | | | 20.74% | |
Emerging Markets Fund | | | 64.67% | |
Small/Mid Cap Core Fund | | | 86.22% | |
World ex-US Fund | | | 0.00% | |
Core Fixed Income Fund | | | 9.52% | |
Growth Allocation Fund | | | 0.00% | |
Conservative Allocation Fund | | | 0.00% | |
Tactical Allocation Fund | | | 0.00% | |
Absolute Return Allocation Fund | | | 0.00% | |
Multi-Asset Income Allocation Fund | | | 0.00% | |
Flexible Income Allocation Fund | | | 0.00% | |
Managed Futures Strategy Fund | | | 0.00% | |
Conservative Income Fund | | | 0.00% | |
Income Fund | | | 0.00% | |
Growth and Income Fund | | | 0.00% | |
| 2. | | Foreign Tax Credit Pass Through (Unaudited) |
Pursuant to Section 853 of the Internal Revenue Code, the following Funds designate the following amounts as foreign taxes paid for the year ended March 31, 2022. Foreign taxes paid for purposes of Section 853 may be less than actual foreign taxes paid for financial statement purposes.
| | | | | | | | | | | | |
| | | Creditable Foreign
Taxes Paid
| | | Per Share
Amount
| | | Portion of Ordinary Income
Distribution Derived from
Foreign Sourced Income*
| |
Emerging Markets | | $ | 305,998 | | | $ | 0.0579 | | | | 96.16 | % |
World ex-US Fund | | | 305,942 | | | | 0.0252 | | | | 96.75 | % |
| | * | | The Funds listed above did not derive any income from “ineligible foreign sources” as defined under Section 901(j) of the Internal Revenue Code. |
169
GuideMark Funds & GuidePath Funds
ADDITIONAL INFORMATION (Continued)
September 30, 2022
Foreign taxes paid or withheld should be included in taxable income with an offsetting deduction from gross income or as a credit for taxes paid to foreign governments.
Above figures may differ from those cited elsewhere in this report due to differences in the calculation of income and gains under U.S. generally accepted accounting principles (book) purposes and Internal Revenue Service (tax) purposes.
Shareholders are strongly advised to consult their own tax advisers with respect to the tax consequences of their investments in the Funds. In January, shareholders, excluding corporate shareholders, receive an IRS 1099-DIV regarding the Federal tax status of the dividends and distributions they received in the calendar year.
| 3. | | Disclosure Regarding Fund Trustees and Officers (Unaudited) |
| | | | | | | | | | | | |
Name, Address and Year of Birth
| | Position(s) Held
with the Trusts
| | Term of Office and
Length of Time Served
| | Principal Occupation During Past Five Years or Longer
| | # of
Portfolios
in Fund
Complex
Overseen
by Trustee
| | | Other Director/
Trustee Positions
|
GPS Funds I and GPS Funds II |
|
Independent Trustees |
| | | | | |
David M. Dunford Year of Birth: 1949 c/o AssetMark, Inc. 1655 Grant Street, 10th Floor Concord, CA 94520 | | Lead Independent Trustee | | Indefinite Term (since 2013 for GPS Funds I and since 2011 for GPS Funds II) | | Retired; formerly, Senior Vice President, Merrill Lynch Insurance Group (1989-2001). | | | 15 | | | Trustee, Savos Investments Trust (2015-2022); Director, New England Bancorp (2006-2016); |
| | | | | |
Paul S. Feinberg Year of Birth: 1942 c/o AssetMark, Inc. 1655 Grant Street, 10th Floor Concord, CA 94520 | | Independent Trustee | | Indefinite Term (since 2013 for GPS Funds I and since 2011 for GPS Funds II) | | Retired; formerly, President, CitiStreet Funds, Inc. (2000-2005); Executive Vice President and General Counsel, CitiStreet Associates LLC (insurance agency), CitiStreet Equities LLC (broker- dealer), CitiStreet Financial Services LLC (registered investment advisor) and CitiStreet Funds Management LLC (registered investment advisor) (1990-2005). | | | 15 | | | Trustee, Savos Investments Trust (2015-2022); |
| | | | | |
Dennis G. Schmal Year of Birth: 1947 c/o AssetMark, Inc. 1655 Grant Street, 10th Floor Concord, CA 94520 | | Independent Trustee | | Indefinite Term (since 2007 for GPS Funds I and since 2013 for GPS Funds II) | | Self-employed consultant (1999-present); formerly, Partner, Arthur Andersen LLP (audit services) (1972-1999). | | | 15 | | | Trustee, Savos Investments Trust (2015-2022); Director, Blue Calypso, Inc. (2015-2019); Director, Owens Realty Mortage Inc. (2013-2019); Cambria ETF Series Trust (2013-present); Director, Wells Fargo GAI Hedge Funds (2008-2019); Director, First Guarantee Mortgage Corporation (2021-present). |
Interested Trustee | | | | | | | | | | | | |
| | | | | |
Carrie E. Hansen* Year of Birth: 1970 c/o AssetMark, Inc. 1655 Grant Street, 10th Floor Concord, CA 94520 | | Interested Trustee and Chairperson President | | Indefinite Term since 2014 Renewed 1-Year Term since 2008 | | President, GPS Funds I (2008-present) and GPS Funds II (2011-present); President, Savos Investments Trust (“Savos”) (2008-2022); Executive Vice President and Chief Operating Officer, AssetMark (2008-present); President, AssetMark Brokerage®, LLC (2014-present). | | | 15 | | | Trustee, Savos Investments Trust (2008-2022); Director and Chairperson, AssetMark Trust Co. (2008-present); Director, AssetMark, Inc. (2013-present); Treasurer, Acalanes Booster Club (2017-2019); Director, Rheumatology Research Foundation (2021-present); |
170
GuideMark Funds & GuidePath Funds
ADDITIONAL INFORMATION (Continued)
September 30, 2022
| | | | | | |
Name, Address
and Year of Birth
| | Position(s) Held
with the Trusts
| | Term of Office and
Length of Time Served
| | Principal Occupation During Past Five Years
|
Officers of the Trusts** |
| | | |
John Koval Year of Birth: 1966 c/o AssetMark, Inc. 1655 Grant Street, 10th Floor Concord, CA 94520 | | Chief Compliance Officer and AML Compliance Officer | | Renewed 1-Year Term since 2013 | | Chief Compliance Officer, GPS Funds I, GPS Funds II, and Savos (2013-present); Interim Chief Compliance Officer, GPS Funds I, GPS Funds II, and Savos (September 2012-January 2013); Senior Compliance Officer, AssetMark (2011-2012); Chief Operating Officer, SEAL Capital, Inc. (2009-2010); Chief Compliance Officer, Cliffwood Partners LLC (2004-2009). |
| | | |
Patrick R. Young Year of Birth: 1982 c/o AssetMark, Inc. 1655 Grant Street, 10th Floor Concord, CA 94520 | | Vice President and Treasurer | | Renewed 1-Year Term since 2014 | | Vice President and Treasurer, GPS Funds I, GPS Funds II, and Savos (May 2014-present); Director of Mutual Fund Operations and Finance, AssetMark (February 2016-present); Manager of Fund Administration, AssetMark (May 2014-February 2016); Senior Fund Administration Officer, AssetMark (2008-May 2014). |
| | | |
Christine Villas-Chernak Year of Birth: 1968 c/o AssetMark, Inc. 1655 Grant Street, 10th Floor Concord, CA 94520 | | Secretary | | Renewed 1-Year Term since 2014 | | Secretary, GPS Funds I (2006-2013 and May 2014- present), GPS Funds II (2011-2013 and May 2014- present), Savos (2009-2010 and May 2014-present) Deputy Chief Compliance Officer, GPS Funds I (2009-present), GPS Funds II (2011-present) and GVIT (2009-2012); Senior Compliance Officer, AssetMark (2005-2009). |
| * | | Ms. Hansen is a Trustee who is an “interested person” of the Trusts as defined in the 1940 Act because she is an officer of AssetMark or certain of its affiliates. |
| ** | | Each Officer of the Trusts serves at the pleasure of the Board. |
The Statement of Additional Information includes additional information about the Funds’ Trustees and is available free of charge upon request by calling the Funds toll free at (888) 278-5809.
| 4. | | Proxy Voting Policies and Procedures and Proxy Voting Record (Unaudited) |
A description of the policies and procedures that the Funds use to determine how to vote proxies related to the Funds’ portfolio securities as well as information regarding how the Funds voted proxies relating to portfolio securities during the most recent 12-month period ended June 30 is available without charge, upon request, by calling (888) 278-5809. Furthermore, you can obtain the Fund’s proxy voting records on the SEC’s website at http://www.sec.gov.
| 5. | | Availability of Quarterly Portfolio Holdings Schedules (Unaudited) |
The Funds file their complete schedules of portfolio holdings with the SEC for their first and third fiscal quarters on Part F of Form N-PORT. Once filed, the Funds’ Part F of Form N-PORT is available without charge, upon request on the SEC’s website (http://www.sec.gov) and is available by calling (888) 278-5809.
171
GuideMark Funds
GuidePath Funds
GUIDEMARK FUNDS & GUIDEPATH FUNDS
GuideMark Large Cap Core Fund
GuideMark Emerging Markets Fund
GuideMark Small/Mid Cap Core Fund
GuideMark World ex-US Fund
GuideMark Core Fixed Income Fund
GuidePath Growth Allocation Fund
GuidePath Conservative Allocation Fund
GuidePath Tactical Allocation Fund
GuidePath Absolute Return Allocation Fund
GuidePath Multi-Asset Income Allocation Fund
GuidePath Flexible Income Allocation Fund
GuidePath Managed Futures Strategy Fund
GuidePath Conservative Income Fund
GuidePath Income Fund
GuidePath Growth and Income Fund
Investment Advisor
AssetMark, Inc.
1655 Grant Street, 10th Floor
Concord, CA 94520
Legal Counsel
Stradley Ronon Stevens & Young, LLP
2005 Market Street, Suite 2600
Philadelphia, PA 19103
Independent Registered Public Accounting Firm
Cohen & Company, Ltd.
342 North Water St.
Suite 830
Milwaukee, WI 53202
Transfer Agent, Fund Accountant and Fund Administrator
U.S. Bancorp Fund Services, LLC,
doing business as U.S. Bank Global Fund Services
615 East Michigan Street
Milwaukee, WI 53202
Custodian
U.S. Bank, N.A.
1555 North RiverCenter Drive, Suite 302
Milwaukee, WI 53212
Distributor
AssetMark Brokerage, LLC
1655 Grant Street, 10th Floor
Concord, CA 94520
This document must be preceded or accompanied by a free prospectus. Investors should consider the Funds’ investment objectives, risks, charges and expenses carefully before investing. The prospectus contains this and other important information about the Funds. Please read the prospectus carefully before you invest or send money.
Semi-Annual Report
September 30, 2022
Item 2. Code of Ethics.
Not applicable for semi-annual reports.
Item 3. Audit Committee Financial Expert.
Not applicable for semi-annual reports.
Item 4. Principal Accountant Fees and Services.
Not applicable for semi-annual reports.
Item 5. Audit Committee of Listed Registrants.
Not applicable to registrants who are not listed issuers (as defined in Rule 10A-3 under the Securities Exchange Act of 1934).
Item 6. Investments.
Schedule of Investments is included as part of the report to shareholders filed under Item 1 of this Form.
Item 7. Disclosure of Proxy Voting Policies and Procedures for Closed-End Management Investment Companies.
Not applicable to open-end investment companies.
Item 8. Portfolio Managers of Closed-End Management Investment Companies.
Not applicable to open-end investment companies.
Item 9. Purchases of Equity Securities by Closed-End Management Investment Company and Affiliated Purchasers.
Not applicable to open-end investment companies.
Item 10. Submission of Matters to a Vote of Security Holders.
None.
Item 11. Controls and Procedures.
| (a) | The Registrant’s President/Principal Executive Officer and Treasurer/Principal Financial Officer have reviewed the Registrant’s disclosure controls and procedures (as defined in |
1
| | Rule 30a-3(c) under the Investment Company Act of 1940 (the “Act”)) as of a date within 90 days of the filing of this report, as required by Rule 30a-3(b) under the Act and Rules 13a-15(b) or 15d-15(b) under the Securities Exchange Act of 1934. Based on their review, such officers have concluded that the disclosure controls and procedures are effective in ensuring that information required to be disclosed in this report is appropriately recorded, processed, summarized and reported and made known to them by others within the Registrant and by the Registrant’s service provider. |
| (b) | There were no changes in the Registrant’s internal control over financial reporting (as defined in Rule 30a-3(d) under the Act) that occurred during the period covered by this report that has materially affected, or is reasonably likely to materially affect, the Registrant’s internal control over financial reporting. |
Item 12. Disclosure of Securities Lending Activities for Closed-End Management Investment Companies
Not applicable to open-end investment companies.
Item 13. Exhibits.
| (a) | (1) Any code of ethics or amendment thereto, that is the subject of the disclosure required by Item 2, to the extent that the registrant intends to satisfy Item 2 requirements through filing an exhibit. Not applicable for semi-annual reports. |
(2) A separate certification for each principal executive and principal financial officer pursuant to Section 302 of the Sarbanes-Oxley Act of 2002. Filed herewith.
(3) Any written solicitation to purchase securities under Rule 23c-1 under the Investment Company Act of 1940 sent or given during the period covered by the report by or on behalf of the registrant to 10 or more persons. Not applicable.
(4) Change in the registrant’s independent public accountant. There was no change in the registrant’s independent public accountant for the period covered by this report.
2
SIGNATURES
Pursuant to the requirements of the Securities Exchange Act of 1934 and the Investment Company Act of 1940, the registrant has duly caused this report to be signed on its behalf by the undersigned, thereunto duly authorized.
| | | | |
| By (Signature and Title) | | /s/ Carrie E. Hansen | | |
| | Carrie E. Hansen, Principal Executive Officer/President | | |
Pursuant to the requirements of the Securities Exchange Act of 1934 and the Investment Company Act of 1940, this report has been signed below by the following persons on behalf of the registrant and in the capacities and on the dates indicated.
| | | | |
| By (Signature and Title) | | /s/ Carrie E. Hansen | | |
| | Carrie E. Hansen, Principal Executive Officer/President | | |
| | | | |
| By (Signature and Title) | | /s/ Patrick R. Young | | |
| | Patrick R Young, Vice President/Treasurer | | |
3