Washington, D.C. 20549
Kevin J. McCarthy
Form N-CSR is to be used by management investment companies to file reports with the Commission not later than 10 days after the transmission to stockholders of any report that is required to be transmitted to stockholders under Rule 30e-1 under the Investment Company Act of 1940 (17 CFR 270.30e-1). The Commission may use the information provided on Form N-CSR in its regulatory, disclosure review, inspection, and policymaking roles.
A registrant is required to disclose the information specified by Form N-CSR, and the Commission will make this information public. A registrant is not required to respond to the collection of information contained in Form N-CSR unless the Form displays a currently valid Office of Management and Budget ("OMB") control number. Please direct comments concerning the accuracy of the information collection burden estimate and any suggestions for reducing the burden to Secretary, Securities and Exchange Commission, 450 Fifth Street, NW, Washington, DC 20549-0609. The OMB has reviewed this collection of information under the clearance requirements of 44 U.S.C. ss. 3507.
ITEM 1. REPORTS TO STOCKHOLDERS.
LIFE IS COMPLEX.
Nuveen makes things e-simple.
It only takes a minute to sign up for e-Reports. Once enrolled, you’ll receive an e-mail as soon as your Nuveen Fund information is ready. No more waiting for delivery by regular mail. Just click on the link within the e-mail to see the report and save it on your computer if you wish.
Free e-Reports right to your e-mail!
www.investordelivery.com
If you receive your Nuveen Fund distributions and statements from your financial advisor or brokerage account.
OR
www.nuveen.com/accountaccess
If you receive your Nuveen Fund distributions and statements directly from Nuveen.
Table of Contents
| Chairman’s Letter to Shareholders | 4 |
| | |
| Portfolio Manager’s Comments | 5 |
| | |
| Fund Leverage | 10 |
| | |
| Common Share Information | 12 |
| | |
| Risk Considerations | 14 |
| | |
| Performance Overview and Holding Summaries | 15 |
| | |
| Shareholder Meeting Report | 21 |
| | |
| Portfolios of Investments | 23 |
| | |
| Statement of Assets and Liabilities | 67 |
| | |
| Statement of Operations | 69 |
| | |
| Statement of Changes in Net Assets | 70 |
| | |
| Statement of Cash Flows | 72 |
| | |
| Financial Highlights | 74 |
| | |
| Notes to Financial Statements | 82 |
| | |
| Reinvest Automatically, Easily and Conveniently | 97 |
| | |
| Glossary of Terms Used in this Report | 99 |
| | |
| Additional Fund Information | 103 |
Chairman’s
Letter to Shareholders
Dear Shareholders,
The global economy continues to struggle with low growth rates. The European Central Bank’s commitment to “do what it takes” to support sovereign debt markets has stabilized the broader euro area financial markets. The larger member states of the European Union (EU) are working diligently on a tighter financial and banking union and meaningful progress is being made. However, economic conditions in the southern tier members are not improving and their political leaders are becoming more forceful in their demands for loosening the current EU fiscal targets and timetables. Economic growth in emerging market countries continues to be buffeted by lower overseas demand for their manufactured products and raw materials.
In the U.S., the Fed’s commitment to low interest rates through Quantitative Easing is the subject of increasing debate in its policy making deliberations and many independent economists are expressing concern about the economic distortions resulting from negative real interest rates. There are encouraging signs in Congress that both political parties are working toward compromises on previously irreconcilable issues such as reforming immigration laws and the tax code. It is too early to tell whether those efforts will produce meaningful results or pave the way for cooperation on the major fiscal issues that loom ahead. Over the longer term, there are some positive trends for the U.S. economy: house prices are clearly recovering, banks and corporations continue to strengthen their financial positions and incentives for capital investment in the U.S. by domestic and foreign corporations are increasing due to more competitive energy and labor costs.
During the last eighteen months, U.S. investors have benefited from strong returns in the domestic equity markets and steady total returns in many fixed income markets. However, many macroeconomic risks remain unresolved, including negotiating through the many U.S. fiscal issues, achieving a better balance between fiscal discipline and encouraging economic growth in the euro area and reducing the potential economic impact of geopolitical issues, particularly in the Middle East and East Asia. In the face of these uncertainties, the experienced investment professionals at Nuveen Investments seek out investments that are enjoying positive and sustainable returns. At the same time they are always on the alert for risks in markets that are subject to the excessive optimism that can accompany an extended period of abnormally low interest rates. Monitoring this process is a critical function for the Fund Board as it oversees your Nuveen Fund on your behalf.
As always, I encourage you to communicate with your financial consultant if you have any questions about your investment in a Nuveen Fund. On behalf of the other members of your Fund Board, we look forward to continuing to earn your trust in the months and years ahead.
Sincerely,
Robert P. Bremner
Chairman of the Board
May 24, 2013
Portfolio Manager’s Comments
Nuveen New York Municipal Value Fund, Inc. (NNY)
Nuveen New York Municipal Value Fund 2 (NYV)
Nuveen New York Performance Plus Municipal Fund, Inc. (NNP)
Nuveen New York Dividend Advantage Municipal Fund (NAN)
Nuveen New York Dividend Advantage Municipal Fund 2 (NXK)
Nuveen New York AMT-Free Municipal Income Fund (NRK)
Portfolio manager Scott Romans discusses key investment strategies and the six-month performance of these Nuveen New York Funds. Scott assumed portfolio management responsibility for these six Funds in 2011.
FUND REORGANIZATIONS
Effective before the opening of business on March 11, 2013, certain New York Funds (the Acquired Funds) were reorganized into one, larger-state New York Fund included in this report (the Acquiring Fund) as follows:
| | | | | | | | |
| Acquired Funds | | Symbol | | Acquiring Fund | | Symbol |
| • | Nuveen New York Quality | | NUN | | Nuveen New York AMT-Free | | NRK |
| | Income Municipal Fund, Inc. | | | | Municipal Income Fund | | |
| • | Nuveen New York Premium | | NNF | | | | |
| | Income Municipal Fund, Inc. | | | | | | |
| • | Nuveen New York Investment | | NQN | | | | |
| | Quality Municipal Fund, Inc. | | | | | | |
| • | Nuveen New York Select | | NVN | | | | |
| | Quality Municipal Fund, Inc. | | | | | | |
| • | Nuveen New York Dividend | | NKO | | | | |
| | Advantage Municipal Income | | | | | | |
| | Fund | | | | | | |
Upon the closing of the reorganizations, the Acquired Funds transferred their assets to the Acquiring Fund in exchange for common and preferred shares of the Acquiring Fund and the assumption by the Acquiring Fund of the liabilities of the Acquired Funds. The Acquired Funds were then liquidated, dissolved and terminated in accordance with their Declaration of Trust. Shareholders of the Acquired Funds became shareholders of the Acquiring Fund. Holders of common shares of the Acquired Funds received newly issued common shares of the Acquiring Fund, the aggregate net asset value of which was equal to the aggregate net asset value of the common shares of the Acquired Funds held immediately prior to the reorganizations (including for this purpose fractional Acquiring Fund shares to which shareholders would be entitled). Fractional shares were sold on the open market and shareholders received cash in lieu of such fractional shares. Holders of
Certain statements in this report are forward-looking statements. Discussions of specific investments are for illustration only and are not intended as recommendations of individual investments. The forward-looking statements and other views expressed herein are those of the portfolio manager as of the date of this report. Actual future results or occurrences may differ significantly from those anticipated in any forward-looking statements, and the views expressed herein are subject to change at any time, due to numerous market and other factors. The Funds disclaim any obligation to update publicly or revise any forward-looking statements or views expressed herein.
Ratings shown are the highest rating given by one of the following national rating agencies: Standard & Poor’s, Moody’s Investors Service, Inc. or Fitch, Inc. Credit ratings are subject to change. AAA, AA, A, and BBB are investment grade ratings; BB, B, CCC, CC, C and D are below-investment grade ratings. Certain bonds backed by U.S. Government or agency securities are regarded as having an implied rating equal to the rating of such securities. Holdings designated N/R are not rated by these national rating agencies.
preferred shares of the Acquired Funds received on a one-for-one basis newly issued preferred shares of the Acquiring Fund, in exchange for their preferred shares of the Acquired Funds held immediately prior to the reorganizations.
What key strategies were used to manage these Nuveen New York Funds during the six-month reporting period ended March 31, 2013?
During this reporting period, municipal bonds generally continued to perform well, driven by solid demand and the tight supply of new municipal paper. However, the municipal market also encountered some additional volatility generated by the political environment, particularly the “fiscal cliff” at the end of 2012 and the approach of federal tax season. The total volume of tax-exempt supply declined from the same six-month period a year earlier, both nationally and in New York. At the same time, yields remained relatively low. We continued to see borrowers come to market seeking to take advantage of the low rate environment through refunding activity, with approximately two-thirds of municipal paper issued by borrowers that were calling existing debt and refinancing at lower rates. In this environment, we continued to take a bottom-up approach to discovering sectors that appeared undervalued as well as individual credits that had the potential to perform well over the long term and helped us keep our Funds fully invested.
Much of our investment activity during this period was opportunistic, with purchases driven by the timing of cash flows from refunding activity as well as called or maturing bonds. Because the issuance of new municipal supply in the primary market continued to be limited, especially in New York, we looked to the secondary market as an additional source of attractive opportunities. In particular, we focused on bonds with call dates between 2019 and 2021, a structure that we believed offered value, specifically, attractive pricing and yields relative to the bonds’ call dates. In addition, if these bonds are not called in 2019 to 2021, we potentially stand to receive a higher yield by holding the bonds until they mature or are called. This type of bond is sometimes referred to as a “kicker bond” because of the additional yield, or “kick” to maturity, once the bond passes its initial call date.
In general, our purchase activity emphasized higher grade bonds with good structures, particularly attractive call provisions. We also added some lower rated bonds, especially in NRK, which was managed under an insured mandate until January 2012. Since the change in NRK’s investment policy, we have made incremental increases to its holdings of bonds rated BBB and lower in order to build the Fund’s exposure to this quality sector.
Cash for new purchases during this reporting period was generated primarily by the proceeds from bond calls resulting from the increase in refinancings. These bond calls provided a good source of liquidity, which drove much of our activity during this period as we worked to redeploy these proceeds, as well as those from maturing bonds, to
keep the Funds fully invested and support their income streams. Overall, selling was minimal because the bonds in our portfolios generally offered higher yields than those available in the current marketplace.
As of March 31, 2013, all six of these Funds continued to use inverse floating rate securities. We employ inverse floaters for a variety of reasons, including duration management, income enhancement and total return enhancement. As part of our duration management strategies, NYV also used forward interest rate swaps to reduce its price volatility risk to movements in U.S. interest rates relative to the Fund’s benchmark. During this period, these derivatives functioned as intended, while contributing modestly to NYV’s performance, as interest rates increased.
How did the Funds perform during the six-month reporting period ended March 31, 2013?
The tables in each Fund’s Performance Overview and Holding Summaries section of this report provide total returns for the Funds for the one-year, five-year, ten-year and since inception periods ended March 31, 2013. Each Fund’s total returns are compared with the performance of a corresponding market index and Lipper classification average.
For the six months ended March 31, 2013, the cumulative return on common share net asset value (NAV) for NYV exceeded the returns for the S&P Municipal Bond New York Index and the S&P Municipal Bond Index, while the remaining five Funds underperformed these Indexes. For the same period, NYV also outperformed the average return for the Lipper New York Municipal Debt Funds Classification Average, NNY performed in line with this return and the other four Funds lagged the classification average.
Key management factors that influenced the Funds’ returns during this period included duration and yield curve positioning, credit exposure and sector allocation. The use of leverage also was an important factor in performance during this period. Leverage is discussed in more detail later in this report.
During this six-month period, municipal bonds with maturities of ten years and longer generally outperformed those with shorter maturities. Duration and yield curve positioning remained an important factor in the Funds’ performances. In general, the Funds were helped by their allocations of long duration bonds, many of which had zero percent coupons, which outperformed the market as a whole for the period.
Credit exposure was another major factor in the Funds’ performance during these six months, as lower quality bonds generally outperformed higher quality bonds. This outperformance was due in part to the greater demand for lower rated bonds as investors looked for investment vehicles offering higher yields. As investors became more comfortable taking on additional investment risk, credit spreads, or the difference in yield spreads between U.S. Treasury securities and comparable investments such as
municipal bonds, narrowed through a variety of rating categories. As a result of this spread compression, the Funds generally benefited from their holdings of lower rated credits, especially sub-investment grade bonds. As previously discussed, NRK, which was managed under an insured mandate until January 2012, continued to build exposure to lower rated bonds during this period and thus had a more modest overweight in this market segment than the other New York Funds in this report.
During this period, revenue bonds as a whole outperformed the general municipal market. Holdings that generally made positive contributions to the Funds’ returns included industrial development revenue (IDR) credits, health care (together with hospitals) and housing bonds. NYV, in particular, benefited from its overweighting in the health care sector. Tobacco credits backed by the 1998 master tobacco settlement agreement also were among the top performing market sectors for this period, helped by their longer effective durations and the increased demand for higher yielding investments by investors who had become less risk-averse. In addition, based on recent data showing that cigarette sales had fallen less steeply than anticipated, the 46 states participating in the agreement, including New York, stand to receive increased payments from the tobacco companies. During this period, as the tobacco sector rallied, these Funds benefited from their holdings of tobacco credits, with NYV having the heaviest weighting of tobacco bonds. However, the Funds’ participation in the rally in this sector was limited by the shorter duration of their tobacco holdings.
In contrast, pre-refunded bonds, which are often backed by U.S. Treasury securities, were the poorest performing market segment during this period. The underperformance of these bonds can be attributed primarily to their shorter effective maturities and higher credit quality. As of March 31, 2013, NRK and NNP had the heaviest weightings in pre-refunded bonds, which hampered their performance, while NYV and NXK held negligible amount of pre-refunded bonds, which lessened the negative impact of these bonds. We continued to hold pre-refunded bonds in our portfolios due to the higher yields they provided. Also lagging the performance of the general municipal market for this period were general obligation (GO) bonds, utilities, and water and sewer credits. In addition, NRK was underweighted in the “other revenue” sector (i.e., bonds other than GOs and appropriation debt that are backed by tax revenues), which outperformed during this period. This detracted from NRK’s performance.
Shareholders also should be aware of an issue involving some of the Funds’ holdings, i.e., the downgrades of bonds issued by Puerto Rico. In December 2012, Moody’s downgraded Puerto Rico GO bonds to Baa3 from Baa1 based on Puerto Rico’s ongoing economic problems, unfunded pension liabilities, elevated debt levels and structural budget gaps. Prior to this reporting period, bonds issued by the Puerto Rico Sales Tax Financing Corporation (COFINA) also were downgraded by Moody’s to Aa3 from Aa2 in July 2012. The downgrade of the COFINA bonds was due mainly to the performance of Puerto Rico’s economy and its impact on the projected growth of sales tax revenues, and
not to any sector or structural issues. In addition, the COFINA bonds were able to maintain a higher rating than the GOs because, unlike the revenue streams supporting some Puerto Rican issues, the sales taxes supporting the COFINA bonds cannot be diverted and used to support the commonwealth’s GO bonds. All of these Funds have exposure to Puerto Rico bonds, the majority of which are the dedicated sales tax bonds issued by COFINA, but no exposure to Puerto Rico GOs. During this period, we also added to our COFINA holdings in all of the Funds (except NYV) based on the credit strength of these bonds. In addition, NNY, NAN, and NRK hold Puerto Rico tobacco bonds and NRK also has a position in Puerto Rico highway revenue credits insured by AGM. These holdings were generally purchased as part of our efforts to keep the Funds fully invested and to provide higher yields, added diversification, and triple exemption (i.e., exemption from federal, state, and local taxes). For the reporting period ended March 31, 2013, Puerto Rico paper generally underperformed the market as whole. Because most of our holdings were the COFINA bonds, the overall impact on performance was minimal, differing from Fund to Fund in line with the type and amount of its holdings. As we continue to emphasize Puerto Rico’s stronger credits, we view the COFINA bonds as long-term holdings and note that the commonwealth’s recent enforcement of sales tax collections has improved significantly.
Fund Leverage
IMPACT OF THE FUNDS’ LEVERAGE STRATEGIES ON PERFORMANCE
One important factor impacting the return of NNP, NAN, NXK and NRK relative to their benchmarks was the Funds’ use of leverage. The Funds use leverage because their manager believes that, over time, leveraging provides opportunities for additional income and total return for common shareholders. However, use of leverage also can expose common shareholders to additional volatility. For example, as the prices of securities held by a Fund decline, the negative impact of these valuation changes on common share net asset value and common shareholder total return is magnified by the use of leverage. Conversely, leverage may enhance common share returns during periods when the prices of securities held by a Fund generally are rising. Leverage had a positive impact on the performance of the Funds over this reporting period.
As of March 31, 2013, the Funds’ percentages of effective and regulatory leverage are shown in the accompanying table.
| | | | Effective | | | Regulatory | |
| Fund | | | Leverage | * | | Leverage | * |
| NNY | | | 2.64% | | | 0.00% | |
| NYV | | | 4.96% | | | 0.00% | |
| NNP | | | 34.78% | | | 26.37% | |
| NAN | | | 34.69% | | | 27.42% | |
| NXK | | | 33.77% | | | 27.19% | |
| NRK | | | 36.80% | | | 30.28% | |
| * | Effective Leverage is a Fund’s effective economic leverage, and includes both regulatory leverage and the leverage effects of certain derivative and other investments in a Fund’s portfolio that increase the Fund’s investment exposure. Currently, the leverage effects of Tender Option Bond (TOB) inverse floater holdings are included in effective leverage values, in addition to any regulatory leverage. Regulatory leverage consists of preferred shares issued or borrowings of a Fund. Both of these are part of a Fund’s capital structure. Regulatory leverage is sometimes referred to as “‘40 Act Leverage” and is subject to asset coverage limits set forth in the Investment Company Act of 1940. |
THE FUNDS’ REGULATORY LEVERAGE
As of March 31, 2013, the Funds have issued and outstanding MuniFund Term Preferred (MTP) Shares, Variable Rate MuniFund Term Preferred (VMTP) Shares and Variable Rate Demand Preferred (VRDP) Shares as shown in the accompanying tables.
MTP Shares
| | | | | MTP Shares Issued | | Annual | | NYSE |
| Fund | | Series | | at Liquidation Value | | Interest Rate | | Ticker |
| NAN | | 2015 | | $30,000,000 | | 2.70% | | NAN PrC |
| NAN | | 2016 | | $25,360,000 | | 2.50% | | NAN PrD |
| NXK | | 2015 | | $37,890,000 | | 2.55% | | NXK PrC |
| NRK | | 2015 | | $27,680,000 | | 2.55% | | NRK PrC |
VMTP Shares
| | | | VMTP Shares Issued |
| Fund | Series | | at Liquidation Value |
| NRK* | 2014 | | $50,700,000 |
* VMTP Shares issued in connection with the reorganization.
VRDP Shares
| | | | |
| | | VRDP Shares Issued |
| Fund | | at Liquidation Value |
| NNP | | $ | 89,000,000 |
| NRK** | | $ | 488,800,000 |
** VRDP Shares issued in connection with the reorganization.
Refer to Notes to Financial Statements, Footnote 1 – General Information and Significant Accounting Policies for further details on MTP, VMTP and VRDP Shares.
Common Share Information
COMMON SHARE DIVIDEND INFORMATION
During the six-month reporting period ended March 31, 2013, the Funds’ monthly dividends to common shareholders were as shown in the accompanying table.
| | | Per Common Share Amounts | |
| | | | NNY | | | NYV | | | NNP | | | NAN | | | NXK | | | NRK | |
| October | | $ | 0.0345 | | $ | 0.0560 | | $ | 0.0735 | | $ | 0.0655 | | $ | 0.0665 | | $ | 0.0585 | |
| November | | | 0.0345 | | | 0.0560 | | | 0.0735 | | | 0.0655 | | | 0.0665 | | | 0.0585 | |
| December | | | 0.0330 | | | 0.0560 | | | 0.0710 | | | 0.0630 | | | 0.0630 | | | 0.0570 | |
| January | | | 0.0330 | | | 0.0560 | | | 0.0710 | | | 0.0630 | | | 0.0630 | | | 0.0570 | |
| February | | | 0.0330 | | | 0.0560 | | | 0.0710 | | | 0.0630 | | | 0.0630 | | | 0.0570 | |
| March | | | 0.0330 | | | 0.0560 | | | 0.0710 | | | 0.0630 | | | 0.0590 | | | 0.1080 | |
| | | | | | | | | | | | | | | | | | | | |
| Long-Term Capital Gain*** | | $ | 0.0145 | | | — | | $ | 0.0390 | | $ | 0.0308 | | $ | 0.0229 | | $ | 0.0213 | |
| Short-Term Capital Gain*** | | $ | 0.0006 | | | — | | | — | | | — | | | — | | | — | |
| Ordinary Income Distribution*** | | $ | 0.0010 | | | — | | $ | 0.0027 | | $ | 0.0011 | | $ | 0.0019 | | | — | |
| | | | | | | | | | | | | | | | | | | | |
| Market Yield**** | | | 3.91% | | | 4.32% | | | 5.16% | | | 5.01% | | | 4.81% | | | 4.49% | |
| Taxable-Equivalent Yield**** | | | 5.82% | | | 6.43% | | | 7.68% | | | 7.46% | | | 7.16% | | | 6.68% | |
| *** | Distribution paid in December 2012. |
| **** | Market Yield is based on the Fund’s current annualized monthly dividend divided by the Fund’s current market price as of the end of the reporting period. Taxable-Equivalent Yield represents the yield that must be earned on a fully taxable investment in order to equal the yield of the Fund on an after-tax basis. It is based on a combined federal and state income tax rate of 32.8%. When comparing a Fund to investments that generate qualified dividend income, the Taxable-Equivalent Yield is lower. |
All of the Funds in this report seek to pay stable dividends at rates that reflect each Fund’s past results and projected future performance. During certain periods, each Fund may pay dividends at a rate that may be more or less than the amount of net investment income actually earned by the Fund during the period. If a Fund has cumulatively earned more than it has paid in dividends, it holds the excess in reserve as undistributed net investment income (UNII) as part of the Fund’s NAV. Conversely, if a Fund has cumulatively paid dividends in excess of its earnings, the excess constitutes negative UNII that is likewise reflected in the Fund’s NAV. Each Fund will, over time, pay all of its net investment income as dividends to shareholders. As of March 31, 2013, all of the Funds in this report had positive UNII balances for tax and financial reporting purposes.
COMMON SHARE REPURCHASES
During November 2012, the Nuveen Funds’ Board of Directors/Trustees reauthorized the Funds’ open-market share repurchase program, allowing each Fund to repurchase an aggregate of up to approximately 10% of its outstanding common shares.
As of March 31, 2013, and since the inception of the Funds’ repurchase programs, the Funds have cumulatively repurchased and retired common shares as shown in the accompanying table. Since the inception of the Funds’ repurchase programs, NNY, NYV and NAN have not repurchased any of their outstanding common shares.
| | Common Shares | | % of Common Shares |
| Fund | Repurchased and Retired | | Authorized for Repurchase |
| NNY | — | | — |
| NYV | — | | — |
| NNP | 27,800 | | 3.0% |
| NAN | — | | — |
| NXK | 7,200 | | 0.5% |
| NRK | 6,800 | | 0.5% |
During the six-month reporting period, the Funds did not repurchase any of their outstanding common shares.
COMMON SHARE OTHER INFORMATION
As of March 31, 2013, and during the six-month reporting period, the Funds’ share prices were trading at a premium/(discount) to their common share NAV as shown in the accompanying table.
| | | | | | | | | | | | | | | | | | | | |
| | | | NNY | | | NYV | | | NNP | | | NAN | | | NXK | | | NRK | |
| Common Share NAV | | $ | 10.28 | | $ | 16.30 | | $ | 16.49 | | $ | 15.82 | | $ | 15.64 | | $ | 14.91 | |
| Common Share Price | | $ | 10.12 | | $ | 15.56 | | $ | 16.50 | | $ | 15.09 | | $ | 14.73 | | $ | 14.43 | |
| Premium/(Discount) to NAV | | | (1.56 | )% | | (4.54 | )% | | 0.06 | % | | (4.61 | )% | | (5.82 | )% | | (3.22 | )% |
| 12-Month Average | | | | | | | | | | | | | | | | | | | |
| Premium/(Discount) to NAV | | | (0.03 | )% | | (1.78 | )% | | 0.31 | % | | (2.67 | )% | | (3.76 | )% | | (0.72 | )% |
Risk Considerations
Fund shares are not guaranteed or endorsed by any bank or other insured depository institution, and are not federally insured by the Federal Deposit Insurance Corporation. Past performance is no guarantee of future results. Fund common shares are subject to a variety of risks, including:
Investment, Market and Price Risk. An investment in common shares is subject to investment risk, including the possible loss of the entire principal amount that you invest. Your investment in common shares represents an indirect investment in the municipal securities owned by the Fund, which generally trade in the over-the-counter markets. Shares of closed-end investment companies like these Funds frequently trade at a discount to their net asset value (NAV). Your common shares at any point in time may be worth less than your original investment, even after taking into account the reinvestment of Fund dividends and distributions.
Leverage Risk. Each Fund’s use of leverage creates the possibility of higher volatility for the Fund’s per share NAV, market price, distributions and returns. There is no assurance that a Fund’s leveraging strategy will be successful.
Tax Risk. The tax treatment of Fund distributions may be affected by new IRS interpretations of the Internal Revenue Code and future changes in tax laws and regulations.
Issuer Credit Risk. This is the risk that a security in a Fund’s portfolio will fail to make dividend or interest payments when due.
Interest Rate Risk. Fixed-income securities such as bonds, preferred, convertible and other debt securities will decline in value if market interest rates rise.
Reinvestment Risk. If market interest rates decline, income earned from a Fund’s portfolio may be reinvested at rates below that of the original bond that generated the income.
Call Risk or Prepayment Risk. Issuers may exercise their option to prepay principal earlier than scheduled, forcing a Fund to reinvest in lower-yielding securities.
Inverse Floater Risk. The Funds invest in inverse floaters. Due to their leveraged nature, these investments can greatly increase a Fund’s exposure to interest rate risk and credit risk. In addition, investments in inverse floaters involve the risk that the Fund could lose more than its original principal investment.
Nuveen New York Municipal Value Fund, Inc. (NNY)
Performance Overview and Holding Summaries as of March 31, 2013
Average Annual Total Returns as of March 31, 2013
| | | | Cumulative | | | Average Annual | |
| | | | 6-Month | | | 1-Year | | | 5-Year | | | 10-Year | |
| NNY at Common Share NAV | | | 0.83% | | | 5.72% | | | 5.92% | | | 4.91% | |
| NNY at Common Share Price | | | (2.04)% | | | 6.62% | | | 6.28% | | | 5.54% | |
| S&P Municipal Bond New York Index | | | 1.00% | | | 5.30% | | | 5.90% | | | 5.07% | |
| S&P Municipal Bond Index | | | 1.26% | | | 5.80% | | | 6.11% | | | 5.15% | |
| Lipper New York Municipal Debt Funds Classification Average | | | 0.89% | | | 7.96% | | | 7.01% | | | 5.77% | |
Past performance is not predictive of future results. Current performance may be higher or lower than the data shown. Returns do not reflect the deduction of taxes that shareholders may have to pay on Fund distributions or upon the sale of Fund shares. Comparative index and Lipper return information is provided for the Fund’s shares at NAV only. Indexes and Lipper averages are not available for direct investment.
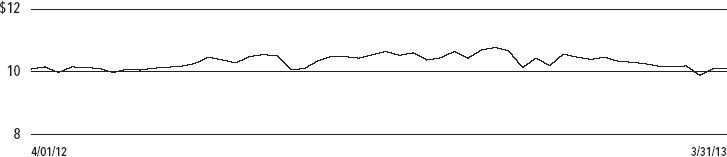
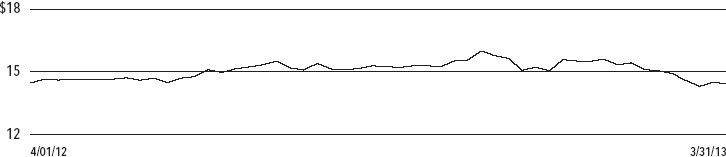
Common Share Price Performance — Weekly Closing Price
Portfolio Composition1 | | | | |
| (as a % of total investments) | | | | |
| Tax Obligation/Limited | | | 26.7 | % |
| Education and Civic Organizations | | | 15.4 | % |
| Tax Obligation/General | | | 9.8 | % |
| Health Care | | | 9.6 | % |
| Transportation | | | 9.1 | % |
| Utilities | | | 7.3 | % |
| Water and Sewer | | | 5.4 | % |
| Housing/Multifamily | | | 4.0 | % |
| Other | | | 12.7 | % |
Credit Quality1,2,3 | | | | |
| (as a % of total investment exposure) | | | | |
| AAA/U.S.Guaranteed | | | 18 | % |
| AA | | | 37 | % |
| A | | | 18 | % |
| BBB | | | 11 | % |
| BB or Lower | | | 7 | % |
| N/R | | | 7 | % |
Refer to the Glossary of Terms Used in this Report for further definition of the terms used within this Fund’s Performance Overview and Holding Summaries page.
| 1 | Holdings are subject to change. |
| 2 | Ratings shown are the highest rating given by one of the following national rating agencies: Standard & Poor’s Group, Moody’s Investors Service, Inc. or Fitch, Inc. Credit ratings are subject to change. AAA, AA, A and BBB are investment grade ratings; BB, B, CCC, CC, C and D are below-investment grade ratings. Certain bonds backed by U.S. Government or agency securities are regarded as having an implied rating equal to the rating of such securities. Holdings designated N/R are not rated by these national rating agencies. |
| 3 | Percentages may not add to 100% due to the exclusion of Other Assets Less Liabilities from the table. |
Nuveen New York Municipal Value Fund 2 (NYV)
Performance Overview and Holding Summaries as of March 31, 2013
Average Annual Total Returns as of March 31, 2013
| | | | Cumulative | | | Average Annual | |
| | | | 6-Month | | | 1-Year | | | Since Inception5 | |
| NYV at Common Share NAV | | | 1.69% | | | 7.57% | | | 8.15% | |
| NYV at Common Share Price | | | (2.70)% | | | 6.05% | | | 5.86% | |
| S&P Municipal Bond New York Index | | | 1.00% | | | 5.30% | | | 6.60% | |
| S&P Municipal Bond Index | | | 1.26% | | | 5.80% | | | 7.12% | |
| Lipper New York Municipal Debt Funds Classification Average | | | 0.89% | | | 7.96% | | | 8.18% | |
Past performance is not predictive of future results. Current performance may be higher or lower than the data shown. Returns do not reflect the deduction of taxes that shareholders may have to pay on Fund distributions or upon the sale of Fund shares. Comparative index and Lipper return information is provided for the Fund’s shares at NAV only. Indexes and Lipper averages are not available for direct investment.
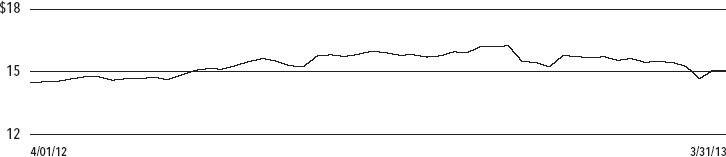
Common Share Price Performance — Weekly Closing Price
Portfolio Composition1,4 | | | | |
| (as a % of total investments) | | | | |
| Tax Obligation/Limited | | | 29.3 | % |
| Health Care | | | 21.1 | % |
| Housing/Multifamily | | | 13.1 | % |
| Education and Civic Organizations | | | 11.0 | % |
| Transportation | | | 10.5 | % |
| Tax Obligation/General | | | 5.7 | % |
| Other | | | 9.3 | % |
Credit Quality1,2,3 | | | | |
| (as a % of total investment exposure) | | | | |
| AAA/U.S.Guaranteed | | | 17 | % |
| AA | | | 34 | % |
| A | | | 26 | % |
| BBB | | | 11 | % |
| BB or Lower | | | 4 | % |
| N/R | | | 6 | % |
Refer to the Glossary of Terms Used in this Report for further definition of the terms used within this Fund’s Performance Overview and Holding Summaries page.
| 1 | Holdings are subject to change. |
| 2 | Ratings shown are the highest rating given by one of the following national rating agencies: Standard & Poor’s Group, Moody’s Investors Service, Inc. or Fitch, Inc. Credit ratings are subject to change. AAA, AA, A and BBB are investment grade ratings; BB, B, CCC, CC, C and D are below-investment grade ratings. Certain bonds backed by U.S. Government or agency securities are regarded as having an implied rating equal to the rating of such securities. Holdings designated N/R are not rated by these national rating agencies. |
| 3 | Percentages may not add to 100% due to the exclusion of Other Assets Less Liabilities from the table. |
| 4 | Excluding investments in derivatives. |
| 5 | Since inception returns are from 4/28/09. |
Nuveen New York Performance Plus Municipal Fund, Inc. (NNP)
Performance Overview and Holding Summaries as of March 31, 2013
Average Annual Total Returns as of March 31, 2013
| | | | Cumulative | | | Average Annual | |
| | | | 6-Month | | | 1-Year | | | 5-Year | | | 10-Year | |
| NNP at Common Share NAV | | | 0.72% | | | 7.30% | | | 8.03% | | | 6.25% | |
| NNP at Common Share Price | | | (1.21)% | | | 12.41% | | | 9.98% | | | 7.15% | |
| S&P Municipal Bond New York Index | | | 1.00% | | | 5.30% | | | 5.90% | | | 5.07% | |
| S&P Municipal Bond Index | | | 1.26% | | | 5.80% | | | 6.11% | | | 5.15% | |
| Lipper New York Municipal Debt Funds Classification Average | | | 0.89% | | | 7.96% | | | 7.01% | | | 5.77% | |
Past performance is not predictive of future results. Current performance may be higher or lower than the data shown. Returns do not reflect the deduction of taxes that shareholders may have to pay on Fund distributions or upon the sale of Fund shares. Comparative index and Lipper return information is provided for the Fund’s shares at NAV only. Indexes and Lipper averages are not available for direct investment.
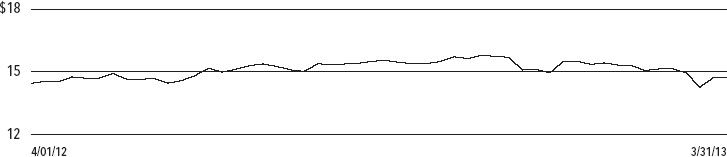
Common Share Price Performance — Weekly Closing Price
Portfolio Composition1 | | | | |
| (as a % of total investments) | | | | |
| Tax Obligation/Limited | | | 27.5 | % |
| Education and Civic Organizations | | | 15.2 | % |
| Health Care | | | 9.9 | % |
| Tax Obligation/General | | | 9.5 | % |
| Transportation | | | 8.6 | % |
| Water and Sewer | | | 6.4 | % |
| Utilities | | | 6.4 | % |
| U.S. Guaranteed | | | 5.6 | % |
| Other | | | 10.9 | % |
Credit Quality1,2,3 | | | | |
| (as a % of total investment exposure) | | | | |
| AAA/U.S.Guaranteed | | | 21 | % |
| AA | | | 39 | % |
| A | | | 16 | % |
| BBB | | | 9 | % |
| BB or Lower | | | 5 | % |
| N/R | | | 8 | % |
Refer to the Glossary of Terms Used in this Report for further definition of the terms used within this Fund’s Performance Overview and Holding Summaries page.
| 1 | Holdings are subject to change. |
| 2 | Ratings shown are the highest rating given by one of the following national rating agencies: Standard & Poor’s Group, Moody’s Investors Service, Inc. or Fitch, Inc. Credit ratings are subject to change. AAA, AA, A and BBB are investment grade ratings; BB, B, CCC, CC, C and D are below-investment grade ratings. Certain bonds backed by U.S. Government or agency securities are regarded as having an implied rating equal to the rating of such securities. Holdings designated N/R are not rated by these national rating agencies. |
| 3 | Percentages may not add to 100% due to the exclusion of Other Assets Less Liabilities from the table. |
Nuveen New York Dividend Advantage Municipal Fund (NAN)
Performance Overview and Holding Summaries as of March 31, 2013
Average Annual Total Returns as of March 31, 2013
| | | | Cumulative | | | Average Annual | |
| | | | 6-Month | | | 1-Year | | | 5-Year | | | 10-Year | |
| NAN at Common Share NAV | | | 0.58% | | | 7.63% | | | 7.89% | | | 6.28% | |
| NAN at Common Share Price | | | (3.14)% | | | 10.19% | | | 8.92% | | | 6.50% | |
| S&P Municipal Bond New York Index | | | 1.00% | | | 5.30% | | | 5.90% | | | 5.07% | |
| S&P Municipal Bond Index | | | 1.26% | | | 5.80% | | | 6.11% | | | 5.15% | |
| Lipper New York Municipal Debt Funds Classification Average | | | 0.89% | | | 7.96% | | | 7.01% | | | 5.77% | |
Past performance is not predictive of future results. Current performance may be higher or lower than the data shown. Returns do not reflect the deduction of taxes that shareholders may have to pay on Fund distributions or upon the sale of Fund shares. Comparative index and Lipper return information is provided for the Fund’s shares at NAV only. Indexes and Lipper averages are not available for direct investment.
Common Share Price Performance — Weekly Closing Price
Portfolio Composition1 | | | | |
| (as a % of total investments) | | | | |
| Tax Obligation/Limited | | | 26.0 | % |
| Health Care | | | 12.5 | % |
| Transportation | | | 12.1 | % |
| Education and Civic Organizations | | | 11.6 | % |
| Tax Obligation/General | | | 10.8 | % |
| Utilities | | | 6.3 | % |
| Housing/Multifamily | | | 4.4 | % |
| Water and Sewer | | | 4.3 | % |
| Other | | | 12.0 | % |
Credit Quality1,2,3 | | | | |
| (as a % of total investment exposure) | | | | |
| AAA/U.S.Guaranteed | | | 17 | % |
| AA | | | 38 | % |
| A | | | 18 | % |
| BBB | | | 10 | % |
| BB or Lower | | | 7 | % |
| N/R | | | 8 | % |
Refer to the Glossary of Terms Used in this Report for further definition of the terms used within this Fund’s Performance Overview and Holding Summaries page.
| 1 | Holdings are subject to change. |
| 2 | Ratings shown are the highest rating given by one of the following national rating agencies: Standard & Poor’s Group, Moody’s Investors Service, Inc. or Fitch, Inc. Credit ratings are subject to change. AAA, AA, A and BBB are investment grade ratings; BB, B, CCC, CC, C and D are below-investment grade ratings. Certain bonds backed by U.S. Government or agency securities are regarded as having an implied rating equal to the rating of such securities. Holdings designated N/R are not rated by these national rating agencies. |
| 3 | Percentages may not add to 100% due to the exclusion of Other Assets Less Liabilities from the table. |
Nuveen New York Dividend Advantage Municipal Fund 2 (NXK)
Performance Overview and Holding Summaries as of March 31, 2013
Average Annual Total Returns as of March 31, 2013
| | | | Cumulative | | | Average Annual | |
| | | | 6-Month | | | 1-Year | | | 5-Year | | | 10-Year | |
| NXK at Common Share NAV | | | 0.52% | | | 6.98% | | | 7.75% | | | 6.40% | |
| NXK at Common Share Price | | | (2.47)% | | | 7.11% | | | 8.89% | | | 6.78% | |
| S&P Municipal Bond New York Index | | | 1.00% | | | 5.30% | | | 5.90% | | | 5.07% | |
| S&P Municipal Bond Index | | | 1.26% | | | 5.80% | | | 6.11% | | | 5.15% | |
| Lipper New York Municipal Debt Funds Classification Average | | | 0.89% | | | 7.96% | | | 7.01% | | | 5.77% | |
Past performance is not predictive of future results. Current performance may be higher or lower than the data shown. Returns do not reflect the deduction of taxes that shareholders may have to pay on Fund distributions or upon the sale of Fund shares. Comparative index and Lipper return information is provided for the Fund’s shares at NAV only. Indexes and Lipper averages are not available for direct investment.
Common Share Price Performance — Weekly Closing Price
Portfolio Composition1 | | | | |
| (as a % of total investments) | | | | |
| Tax Obligation/Limited | | | 30.4 | % |
| Education and Civic Organizations | | | 17.7 | % |
| Transportation | | | 13.8 | % |
| Tax Obligation/General | | | 9.0 | % |
| Health Care | | | 7.6 | % |
| Utilities | | | 6.1 | % |
| Water and Sewer | | | 4.3 | % |
| Other | | | 11.1 | % |
Credit Quality1,2,3 | | | | |
| (as a % of total investment exposure) | | | | |
| AAA/U.S.Guaranteed | | | 20 | % |
| AA | | | 31 | % |
| A | | | 21 | % |
| BBB | | | 13 | % |
| BB or Lower | | | 6 | % |
| N/R | | | 8 | % |
Refer to the Glossary of Terms Used in this Report for further definition of the terms used within this Fund’s Performance Overview and Holding Summaries page.
| 1 | Holdings are subject to change. |
| 2 | Ratings shown are the highest rating given by one of the following national rating agencies: Standard & Poor’s Group, Moody’s Investors Service, Inc. or Fitch, Inc. Credit ratings are subject to change. AAA, AA, A and BBB are investment grade ratings; BB, B, CCC, CC, C and D are below-investment grade ratings. Certain bonds backed by U.S. Government or agency securities are regarded as having an implied rating equal to the rating of such securities. Holdings designated N/R are not rated by these national rating agencies. |
| 3 | Percentages may not add to 100% due to the exclusion of Other Assets Less Liabilities from the table. |
Nuveen New York AMT-Free Municipal Income Fund (NRK)
Performance Overview and Holding Summaries as of March 31, 2013
Average Annual Total Returns as of March 31, 2013
| | | | Cumulative | | | Average Annual | |
| | | | 6-Month | | | 1-Year | | | 5-Year | | | 10-Year | |
| NRK at Common Share NAV | | | (0.76)% | | | 3.19% | | | 5.99% | | | 5.58% | |
| NRK at Common Share Price | | | (2.98)% | | | 5.44% | | | 7.36% | | | 5.32% | |
| S&P Municipal Bond New York Index | | | 1.00% | | | 5.30% | | | 5.90% | | | 5.07% | |
| S&P Municipal Bond Index | | | 1.26% | | | 5.80% | | | 6.11% | | | 5.15% | |
| Lipper New York Municipal Debt Funds Classification Average | | | 0.89% | | | 7.96% | | | 7.01% | | | 5.77% | |
Past performance is not predictive of future results. Current performance may be higher or lower than the data shown. Returns do not reflect the deduction of taxes that shareholders may have to pay on Fund distributions or upon the sale of Fund shares. Comparative index and Lipper return information is provided for the Fund’s shares at NAV only. Indexes and Lipper averages are not available for direct investment.
Common Share Price Performance — Weekly Closing Price
Portfolio Composition1 | | | | |
| (as a % of total investments) | | | | |
| Tax Obligation/Limited | | | 39.6 | % |
| Education and Civic Organizations | | | 17.5 | % |
| Tax Obligation/General | | | 7.9 | % |
| Utilities | | | 7.3 | % |
| Transportation | | | 7.1 | % |
| U.S. Guaranteed | | | 5.9 | % |
| Water and Sewer | | | 5.7 | % |
| Other | | | 9.0 | % |
Credit Quality1,2,3 | | | | |
| (as a % of total investment exposure) | | | | |
| AAA/U.S.Guaranteed | | | 24 | % |
| AA | | | 47 | % |
| A | | | 17 | % |
| BBB | | | 15 | % |
| BB or Lower | | | 3 | % |
| N/R | | | 2 | % |
Refer to the Glossary of Terms Used in this Report for further definition of the terms used within this Fund’s Performance Overview and Holding Summaries page.
| 1 | Holdings are subject to change. |
| 2 | Ratings shown are the highest rating given by one of the following national rating agencies: Standard & Poor’s Group, Moody’s Investors Service, Inc. or Fitch, Inc. Credit ratings are subject to change. AAA, AA, A and BBB are investment grade ratings; BB, B, CCC, CC, C and D are below-investment grade ratings. Certain bonds backed by U.S. Government or agency securities are regarded as having an implied rating equal to the rating of such securities. Holdings designated N/R are not rated by these national rating agencies. |
| 3 | Percentages may not add to 100% due to the exclusion of Other Assets Less Liabilities from the table. |
| NRK | | Shareholder Meeting Report |
| NQN | | A special meeting of shareholders was held in the offices of Nuveen Investments on November 27, 2012; at this meeting the shareholders were asked to vote on the approval of an Agreement and Plan of Reorganization and the approval of the issuance of additional common shares. The meeting was subsequently adjourned to December 14, 2012. The meeting for NUN, NNF, NQN, NVN and NKO was subsequently adjourned to January 24, 2013. The meeting for NNF was additionally adjourned to January 28, 2013. |
| NVN | |
| | | NRK | | NQN | | NVN | |
| | | Common and Preferred shares voting together as a class | | Preferred shares | | Common Shares | | Common and Preferred shares voting together as a class | | Preferred shares | | Common and Preferred shares voting together as a class | | Preferred shares | |
| To approve an Agreement and Plan of Reorganization. | | | | | | | | | | | | | | | | | | | | | | |
| For | | | — | | | 1,449,371 | | | — | | | 8,917,011 | | | 1,107 | | | 11,981,830 | | | 1,590 | |
| Against | | | — | | | 143,073 | | | — | | | 683,759 | | | — | | | 938,838 | | | — | |
| Abstain | | | — | | | 13,528 | | | — | | | 449,512 | | | 16 | | | 798,325 | | | 58 | |
| Total | | | — | | | 1,605,972 | | | — | | | 10,050,282 | | | 1,123 | | | 13,718,993 | | | 1,648 | |
| | | | | | | | | | | | | | | | | | | | | | | |
| To approve the issuance of additional common shares in connection with each Reorganization. | | | | | | | | | | | | | | | | | | | | | | |
| For | | | 3,127,701 | | | — | | | 1,680,330 | | | — | | | — | | | — | | | — | |
| Against | | | 249,515 | | | — | | | 104,442 | | | — | | | — | | | — | | | — | |
| Abstain | | | 124,193 | | | — | | | 110,665 | | | — | | | — | | | — | | | — | |
| Total | | | 3,501,409 | | | — | | | 1,895,437 | | | — | | | — | | | — | | | — | |
| NUN | | Shareholder Meeting Report (continued) |
| NNF | | |
| NKO | | |
| | | NUN | | NNF | | NKO | |
| | | Common and Preferred shares voting together as a class | | Preferred shares | | Common and Preferred shares voting together as a class | | Preferred shares | | Common and Preferred shares voting together as a class | | Preferred shares | |
| To approve an Agreement and Plan of Reorganization. | | | | | | | | | | | | | | | | | | | |
| For | | | 12,092,242 | | | 1,558 | | | 4,293,918 | | | 507 | | | 4,008,141 | | | 348 | |
| Against | | | 1,026,258 | | | — | | | 236,888 | | | — | | | 323,632 | | | — | |
| Abstain | | | 970,194 | | | 59 | | | 169,575 | | | — | | | 160,538 | | | 42 | |
| Total | | | 14,088,694 | | | 1,617 | | | 4,700,381 | | | 507 | | | 4,492,311 | | | 390 | |
| | | | | | | | | | | | | | | | | | | | |
| To approve the issuance of additional common shares in connection with each Reorganization. | | | | | | | | | | | | | | | | | | | |
| For | | | — | | | — | | | — | | | — | | | — | | | — | |
| Against | | | — | | | — | | | — | | | — | | | — | | | — | |
| Abstain | | | — | | | — | | | — | | | — | | | — | | | — | |
| Total | | | — | | | — | | | — | | | — | | | — | | | — | |
| | | Nuveen New York Municipal Value Fund, Inc. |
| NNY | | Portfolio of Investments |
| | | March 31, 2013 (Unaudited) |
| | Principal | | | Optional Call | | | | | | |
| | Amount (000) | | Description (1) | Provisions (2) | | Ratings (3) | | | Value | |
| | | | Consumer Discretionary – 1.5% (1.5% of Total Investments) | | | | | | | |
| $ | 275 | | New York City Industrial Development Agency, New York, Liberty Revenue Bonds, IAC/InterActiveCorp, Series 2005, 5.000%, 9/01/35 | 9/15 at 100.00 | | BBB | | $ | 286,979 | |
| | 1,950 | | Seneca Nation of Indians Capital Improvements Authority, New York, Special Obligation Bonds, Series 2007A, 5.000%, 12/01/23 | 6/17 at 100.00 | | BB | | | 2,054,852 | |
| | 2,225 | | Total Consumer Discretionary | | | | | | 2,341,831 | |
| | | | Consumer Staples – 2.0% (2.0% of Total Investments) | | | | | | | |
| | 150 | | New York Counties Tobacco Trust II, Tobacco Settlement Pass-Through Bonds, Series 2001, 5.250%, 6/01/25 | 6/13 at 100.00 | | A3 | | | 146,496 | |
| | 1,375 | | New York Counties Tobacco Trust III, Tobacco Settlement Pass-Through Bonds, Series 2003, 5.750%, 6/01/33 | 6/13 at 100.00 | | A1 | | | 1,377,420 | |
| | 365 | | Puerto Rico, The Children’s Trust Fund, Tobacco Settlement Asset-Backed Refunding Bonds, Series 2002, 5.375%, 5/15/33 | 5/13 at 100.00 | | BBB+ | | | 369,110 | |
| | 95 | | Rensselaer Tobacco Asset Securitization Corporation, New York, Tobacco Settlement Asset-Backed Bonds, Series 2001A, 5.200%, 6/01/25 | 5/13 at 100.00 | | A3 | | | 94,064 | |
| | | | TSASC Inc., New York, Tobacco Asset-Backed Bonds, Series 2006: | | | | | | | |
| | 810 | | 4.750%, 6/01/22 | 6/16 at 100.00 | | BBB | | | 815,403 | |
| | 345 | | 5.000%, 6/01/26 | 6/16 at 100.00 | | BB– | | | 341,043 | |
| | 3,140 | | Total Consumer Staples | | | | | | 3,143,536 | |
| | | | Education and Civic Organizations – 15.3% (15.4% of Total Investments) | | | | | | | |
| | 275 | | Albany Industrial Development Agency, New York, Revenue Bonds, Albany Law School, Series 2007A, 5.000%, 7/01/31 | 7/17 at 100.00 | | BBB | | | 287,295 | |
| | 415 | | Albany Industrial Development Agency, New York, Revenue Bonds, Brighter Choice Charter Schools, Series 2007A, 5.000%, 4/01/37 | 4/17 at 100.00 | | BB+ | | | 406,476 | |
| | 1,350 | | Brooklyn Arena Local Development Corporation, New York, Payment in Lieu of Taxes Revenue Bonds, Barclays Center Project, Series 2009, 6.250%, 7/15/40 | 1/20 at 100.00 | | BBB– | | | 1,617,449 | |
| | 750 | | Buffalo and Erie County Industrial Land Development Corporation, New York, Tax-Exempt Revenue Bonds, Enterprise Charter School Project, Series 2011A, 7.500%, 12/01/40 | 12/20 at 100.00 | | BBB– | | | 879,705 | |
| | 90 | | Cattaraugus County Industrial Development Agency, New York, Revenue Bonds, St. Bonaventure University, Series 2006, 5.000%, 5/01/23 | 5/16 at 100.00 | | BBB– | | | 93,253 | |
| | 1,175 | | Dormitory Authority of the State of New York, General Revenue Bonds, Manhattan College, Series 2007A, 5.000%, 7/01/41 – RAAI Insured | 7/17 at 100.00 | | N/R | | | 1,206,619 | |
| | 1,000 | | Dormitory Authority of the State of New York, Housing Revenue Bonds, Fashion Institute of Technology, Series 2007, 5.250%, 7/01/34 – FGIC Insured | No Opt. Call | | N/R | | | 1,136,710 | |
| | 505 | | Dormitory Authority of the State of New York, Lease Revenue Bonds, State University Dormitory Facilities, Series 2004A, 5.000%, 7/01/29 – NPFG Insured | 7/15 at 100.00 | | Aa2 | | | 543,683 | |
| | 525 | | Dormitory Authority of the State of New York, Revenue Bonds, New School University, Series 2010, 5.250%, 7/01/30 | 7/20 at 100.00 | | A– | | | 587,160 | |
| | 280 | | Dormitory Authority of the State of New York, Revenue Bonds, St. Joseph’s College, Series 2010, 5.250%, 7/01/35 | 7/20 at 100.00 | | Baa1 | | | 309,358 | |
| | 2,170 | | Dutchess County Industrial Development Agency, New York, Civic Facility Revenue Bonds, Bard College Refunding, Series 2007-A1, 5.000%, 8/01/46 | 8/17 at 100.00 | | Baa1 | | | 2,260,164 | |
| | 265 | | Hempstead Town Industrial Development Agency, New York, Revenue Bonds, Adelphi University, Civic Facility Project, Series 2005, 5.000%, 10/01/35 | 10/15 at 100.00 | | A | | | 283,017 | |
| | 880 | | Hempstead Town Local Development Corporation, New York, Revenue Bonds, Molloy College Project, Series 2009, 5.750%, 7/01/39 | 7/19 at 100.00 | | BBB+ | | | 993,793 | |
| | | | Monroe County Industrial Development Corporation, New York, Revenue Bonds, St. John Fisher College, Series 2011: | | | | | | | |
| | 1,000 | | 6.000%, 6/01/30 | 6/21 at 100.00 | | BBB+ | | | 1,151,780 | |
| | 1,000 | | 6.000%, 6/01/34 | 6/21 at 100.00 | | BBB+ | | | 1,133,600 | |
| | 3,000 | | Monroe County Industrial Development Corporation, New York, Revenue Bonds, University of Rochester Project, Series 2011B, 5.000%, 7/01/41 | 7/21 at 100.00 | | AA– | | | 3,323,580 | |
| | | Nuveen New York Municipal Value Fund, Inc. (continued) |
| NNY | | Portfolio of Investments |
| | | March 31, 2013 (Unaudited) |
| | Principal | | | Optional Call | | | | | | |
| | Amount (000) | | Description (1) | Provisions (2) | | Ratings (3) | | | Value | |
| | | | Education and Civic Organizations (continued) | | | | | | | |
| $ | 245 | | New York City Industrial Development Agency, New York, Civic Facility Revenue Bonds, St. Francis College, Series 2004, 5.000%, 10/01/34 | 10/14 at 100.00 | | A– | | $ | 250,696 | |
| | 260 | | New York City Industrial Development Agency, New York, Civic Facility Revenue Bonds, Vaughn College of Aeronautics, Series 2006A, 5.000%, 12/01/28 | 12/16 at 100.00 | | BB+ | | | 271,957 | |
| | | | New York City Industrial Development Agency, New York, PILOT Revenue Bonds, Queens Baseball Stadium Project, Series 2006: | | | | | | | |
| | 1,500 | | 5.000%, 1/01/39 – AMBAC Insured | 1/17 at 100.00 | | Ba1 | | | 1,527,120 | |
| | 1,175 | | 4.750%, 1/01/42 – AMBAC Insured | 1/17 at 100.00 | | Ba1 | | | 1,175,717 | |
| | | | New York City Industrial Development Authority, New York, PILOT Revenue Bonds, Yankee Stadium Project, Series 2006: | | | | | | | |
| | 1,610 | | 4.500%, 3/01/39 – FGIC Insured | 9/16 at 100.00 | | BBB | | | 1,625,875 | |
| | 800 | | 4.750%, 3/01/46 – NPFG Insured | 9/16 at 100.00 | | BBB | | | 814,488 | |
| | 170 | | Seneca County Industrial Development Authority, New York, Revenue Bonds, New York Chiropractic College, Series 2007, 5.000%, 10/01/27 | 10/17 at 100.00 | | BBB | | | 180,404 | |
| | 1,345 | | Tompkins County Development Corporation, New York, Revenue Bonds, Ithaca College, Series 2011, 5.375%, 7/01/41 – AGM Insured | 1/21 at 100.00 | | A2 | | | 1,516,434 | |
| | 300 | | Troy Capital Resource Corporation, New York, Revenue Bonds, Rensselaer Polytechnic Institute, Series 2010A, 5.125%, 9/01/40 | 9/20 at 100.00 | | A– | | | 328,443 | |
| | 22,085 | | Total Education and Civic Organizations | | | | | | 23,904,776 | |
| | | | Financials – 1.3% (1.3% of Total Investments) | | | | | | | |
| | 400 | | Liberty Development Corporation, New York, Goldman Sachs Headquarter Revenue Bonds, Series 2005, 5.250%, 10/01/35 | No Opt. Call | | A | | | 468,816 | |
| | 1,305 | | Liberty Development Corporation, New York, Goldman Sachs Headquarters Revenue Bonds Series 2007, 5.500%, 10/01/37 | No Opt. Call | | A | | | 1,582,365 | |
| | 1,705 | | Total Financials | | | | | | 2,051,181 | |
| | | | Health Care – 9.6% (9.6% of Total Investments) | | | | | | | |
| | 990 | | Albany Industrial Development Agency, New York, Revenue Bonds, Saint Peter’s Hospital, Series 2008D, 5.750%, 11/15/27 | 11/17 at 100.00 | | A3 | | | 1,122,789 | |
| | 1,005 | | Dormitory Authority of the State of New York, FHA-Insured Mortgage Revenue Bonds, Montefiore Hospital, Series 2004, 5.000%, 8/01/29 – FGIC Insured | 2/15 at 100.00 | | N/R | | | 1,065,260 | |
| | 995 | | Dormitory Authority of the State of New York, FHA-Insured Mortgage Revenue Bonds, New York Hospital Medical Center of Queens, Series 2007, 4.650%, 8/15/27 | 2/17 at 100.00 | | N/R | | | 1,077,685 | |
| | 700 | | Dormitory Authority of the State of New York, FHA-Insured Revenue Bonds,
Montefiore Medical Center, Series 2005, 5.000%, 2/01/22 – FGIC Insured | 2/15 at 100.00 | | N/R | | | 750,666 | |
| | 1,825 | | Dormitory Authority of the State of New York, FHA-Insured Revenue Bonds, St. Lukes Roosevelt Hospital, Series 2005, 4.900%, 8/15/31 | 8/15 at 100.00 | | N/R | | | 1,950,086 | |
| | 350 | | Dormitory Authority of the State of New York, Highland Hospital of Rochester Revenue Bonds, Series 2010, 5.000%, 7/01/26 | 7/20 at 100.00 | | A2 | | | 386,799 | |
| | 380 | | Dormitory Authority of the State of New York, Orange Regional Medical Center Obligated Group Revenue Bonds, Series 2008, 6.250%, 12/01/37 | 12/18 at 100.00 | | Ba1 | | | 420,561 | |
| | 2,350 | | Dormitory Authority of the State of New York, Revenue Bonds, Memorial Sloan Kettering Cancer Center, Series 2006-1, 5.000%, 7/01/35 | 7/16 at 100.00 | | AA | | | 2,575,154 | |
| | 1,405 | | Dormitory Authority of the State of New York, Revenue Bonds, New York and Presbyterian Hospital, Series 2004A, 5.250%, 8/15/15 – AGM Insured | 8/14 at 100.00 | | AA– | | | 1,502,395 | |
| | 2,100 | | Dormitory Authority of the State of New York, Revenue Bonds, NYU Hospitals Center, Series 2011A, 6.000%, 7/01/40 | 7/20 at 100.00 | | A– | | | 2,453,598 | |
| | 290 | | Livingston County Industrial Development Agency, New York, Civic Facility Revenue Bonds, Nicholas H. Noyes Hospital, Series 2005, 6.000%, 7/01/30 | 5/13 at 100.00 | | BB | | | 290,305 | |
| | | | Madison County Industrial Development Agency, New York, Civic Facility Revenue Bonds, Oneida Health System, Series 2007A: | | | | | | | |
| | 280 | | 5.250%, 2/01/27 | 2/17 at 100.00 | | BBB– | | | 285,662 | |
| | 260 | | 5.500%, 2/01/32 | 2/17 at 100.00 | | BBB– | | | 266,344 | |
| | Principal | | | Optional Call | | | | | | |
| | Amount (000) | | Description (1) | Provisions (2) | | Ratings (3) | | | Value | |
| | | | Health Care (continued) | | | | | | | |
| $ | 295 | | Suffolk County Economic Development Corp / Nassau County Local Economic Assistance & Financing Corp., New York, Revenue Bonds, Catholic Health Services of Long Island Obligated Group Project, Series 2011, 5.000%, 7/01/28 | 7/21 at 100.00 | | A– | | $ | 334,055 | |
| | 500 | | Yonkers Industrial Development Agency, New York, Revenue Bonds, St. John’s Riverside Hospital, Series 2001A, 7.125%, 7/01/31 | 7/13 at 100.00 | | B+ | | | 500,805 | |
| | 13,725 | | Total Health Care | | | | | | 14,982,164 | |
| | | | Housing/Multifamily – 4.0% (4.0% of Total Investments) | | | | | | | |
| | 315 | | East Syracuse Housing Authority, New York, FHA-Insured Section 8 Assisted Revenue Refunding Bonds, Bennet Project, Series 2001A, 6.700%, 4/01/21 | 10/13 at 100.00 | | AA+ | | | 315,958 | |
| | 1,690 | | New York City Housing Development Corporation, New York, Capital Fund Program Revenue Bonds, Series 2005A, 5.000%, 7/01/25 – FGIC Insured | 7/15 at 100.00 | | AA– | | | 1,830,456 | |
| | 1,000 | | New York City Housing Development Corporation, New York, Multifamily Housing Revenue Bonds, Series 2009C-1, 5.500%, 11/01/34 | 5/19 at 100.00 | | AA | | | 1,102,780 | |
| | 1,250 | | New York City Housing Development Corporation, New York, Multifamily Housing Revenue Bonds, Series 2009M, 5.150%, 11/01/45 | 5/19 at 100.00 | | AA | | | 1,339,550 | |
| | 405 | | New York State Housing Finance Agency, Secured Mortgage Program Multifamily Housing Revenue Bonds, Series 2001E, 5.600%, 8/15/20 (Alternative Minimum Tax) | 8/13 at 100.00 | | Aa1 | | | 405,879 | |
| | 1,225 | | Westchester County Industrial Development Agency, New York, GNMA Collateralized Mortgage Loan Revenue Bonds, Living Independently for the Elderly Inc., Series 2001A, 5.375%, 8/20/21 | 8/13 at 100.00 | | Aaa | | | 1,240,692 | |
| | 5,885 | | Total Housing/Multifamily | | | | | | 6,235,315 | |
| | | | Housing/Single Family – 1.4% (1.4% of Total Investments) | | | | | | | |
| | 950 | | New York State Mortgage Agency, Homeowner Mortgage Revenue Bonds, Series 130, 4.650%, 4/01/27 (Alternative Minimum Tax) | 4/15 at 100.00 | | Aa1 | | | 969,912 | |
| | 360 | | New York State Mortgage Agency, Homeowner Mortgage Revenue Bonds, Series 148, 5.200%, 10/01/32 (Alternative Minimum Tax) | 10/17 at 100.00 | | Aa1 | | | 380,779 | |
| | 750 | | New York State Mortgage Agency, Mortgage Revenue Bonds, Thirty-Third Series A, 4.750%, 4/01/23 (Alternative Minimum Tax) | 4/15 at 100.00 | | Aaa | | | 758,310 | |
| | 2,060 | | Total Housing/Single Family | | | | | | 2,109,001 | |
| | | | Long-Term Care – 2.9% (3.0% of Total Investments) | | | | | | | |
| | 2,000 | | Dormitory Authority of the State of New York, FHA-Insured Mortgage Revenue Bonds, W.K. Nursing Home Corporation, Series 1996, 6.125%, 2/01/36 | 8/13 at 100.00 | | AAA | | | 2,008,400 | |
| | 435 | | Dormitory Authority of the State of New York, GNMA Collateralized Revenue Bonds, Cabrini of Westchester Project, Series 2006, 5.200%, 2/15/41 | 2/17 at 103.00 | | AA+ | | | 471,758 | |
| | 270 | | Dormitory Authority of the State of New York, Non-State Supported Debt, Ozanam Hall of Queens Nursing Home Revenue Bonds, Series 2006, 5.000%, 11/01/31 | 11/16 at 100.00 | | Ba3 | | | 264,074 | |
| | 135 | | Dormitory Authority of the State of New York, Revenue Bonds, Providence Rest, Series 2005, 5.000%, 7/01/35 – ACA Insured | 7/15 at 100.00 | | N/R | | | 125,811 | |
| | 135 | | New York City Industrial Development Agency, New York, Civic Facility Revenue Bonds, Special Needs Facilities Pooled Program, Series 2000, 8.125%, 7/01/19 | 5/13 at 100.00 | | N/R | | | 135,284 | |
| | 315 | | New York City Industrial Development Agency, New York, Civic Facility Revenue Bonds, Special Needs Facilities Pooled Program, Series 2001A-1, 7.250%, 7/01/16 | 7/13 at 100.00 | | N/R | | | 316,421 | |
| | 820 | | New York City Industrial Development Agency, New York, Civic Facility Revenue Bonds, Special Needs Facilities Pooled Program, Series 2008A-1, 5.500%, 7/01/18 | 7/16 at 101.00 | | N/R | | | 805,962 | |
| | 235 | | Suffolk County Industrial Development Agency, New York, Civic Facility Revenue Bonds, Special Needs Facilities Pooled Program, Series 2008-B1, 5.800%, 7/01/23 | 7/16 at 101.00 | | N/R | | | 230,199 | |
| | 225 | | Yonkers Industrial Development Agency, New York, Civic Facilities Revenue Bonds, Special Needs Facilities Pooled Program Bonds, Series 2008-C1, 5.800%, 7/01/23 | 7/16 at 101.00 | | N/R | | | 220,403 | |
| | 4,570 | | Total Long-Term Care | | | | | | 4,578,312 | |
| | | Nuveen New York Municipal Value Fund, Inc. (continued) |
| NNY | | Portfolio of Investments |
| | | March 31, 2013 (Unaudited) |
| | Principal | | | Optional Call | | | | | | |
| | Amount (000) | | Description (1) | Provisions (2) | | Ratings (3) | | | Value | |
| | | | Materials – 0.2% (0.2% of Total Investments) | | | | | | | |
| $ | 240 | | Jefferson County Industrial Development Agency, New York, Solid Waste Disposal Revenue Bonds, International Paper Company Project, Series 2003A, 5.200%, 12/01/20 (Alternative Minimum Tax) | 12/13 at 100.00 | | BBB | | $ | 246,398 | |
| | | | Tax Obligation/General – 9.8% (9.8% of Total Investments) | | | | | | | |
| | 4,760 | | New York City, New York, General Obligation Bonds, Fiscal 2008 Series D, 5.125%, 12/01/25 | 12/17 at 100.00 | | AA | | | 5,572,532 | |
| | 2,000 | | New York City, New York, General Obligation Bonds, Fiscal 2010 Series C, 5.000%, 8/01/23 | 8/19 at 100.00 | | AA | | | 2,427,180 | |
| | 20 | | New York City, New York, General Obligation Bonds, Fiscal Series 2004C, 5.250%, 8/15/16 | 8/14 at 100.00 | | AA | | | 21,361 | |
| | 625 | | New York City, New York, General Obligation Bonds, Fiscal Series 2004E, 5.000%, 11/01/19 – AGM Insured | No Opt. Call | | AA | | | 670,569 | |
| | 2,000 | | New York City, New York, General Obligation Bonds, Fiscal Series 2005F-1, 5.000%, 9/01/19 – SYNCORA GTY Insured | 9/15 at 100.00 | | AA | | | 2,217,280 | |
| | 2,795 | | New York City, New York, General Obligation Bonds, Fiscal Series 2007A, 5.000%, 8/01/25 | 8/16 at 100.00 | | AA | | | 3,160,307 | |
| | 1,000 | | New York City, New York, General Obligation Bonds, Subseries G-1 Fiscal Series 2012, 5.000%, 4/01/26 | 4/22 at 100.00 | | AA | | | 1,184,850 | |
| | 13,200 | | Total Tax Obligation/General | | | | | | 15,254,079 | |
| | | | Tax Obligation/Limited – 26.6% (26.7% of Total Investments) | | | | | | | |
| | 1,000 | | Battery Park City Authority, New York, Lease Revenue Bonds, Senior Lien Series 2003A, 5.250%, 11/01/21 | 11/13 at 100.00 | | AAA | | | 1,030,200 | |
| | 395 | | Dormitory Authority of the State of New York, Department of Health Revenue Bonds, Series 2005A, 5.250%, 7/01/24 – CIFG Insured | 7/15 at 100.00 | | AA– | | | 434,117 | |
| | | | Dormitory Authority of the State of New York, Second General Resolution Consolidated Revenue Bonds, City University System, Series 1993A: | | | | | | | |
| | 1,000 | | 5.750%, 7/01/18 | No Opt. Call | | AA– | | | 1,151,230 | |
| | 1,400 | | 6.000%, 7/01/20 | No Opt. Call | | AA– | | | 1,743,448 | |
| | 15 | | Dormitory Authority of the State of New York, State Personal Income Tax Revenue Bonds, Series 2005F, 5.000%, 3/15/21 – AGM Insured | 3/15 at 100.00 | | AAA | | | 16,339 | |
| | 1,500 | | Metropolitan Transportation Authority, New York, Dedicated Tax Fund Bonds, Series 2009B, 5.000%, 11/15/34 | 11/19 at 100.00 | | AA | | | 1,674,810 | |
| | 560 | | Monroe Newpower Corporation, New York, Power Facilities Revenue Bonds, Series 2003, 5.500%, 1/01/34 | 1/15 at 100.00 | | BBB | | | 565,852 | |
| | | | New York City Sales Tax Asset Receivable Corporation, New York, Dedicated Revenue Bonds, Local Government Assistance Corporation, Series 2004A: | | | | | | | |
| | 740 | | 5.000%, 10/15/25 – NPFG Insured | 10/14 at 100.00 | | AAA | | | 791,474 | |
| | 550 | | 5.000%, 10/15/26 – NPFG Insured | 10/14 at 100.00 | | AAA | | | 587,901 | |
| | 1,890 | | 5.000%, 10/15/29 – AMBAC Insured | 10/14 at 100.00 | | AAA | | | 2,011,811 | |
| | 1,200 | | New York City Transitional Finance Authority, New York, Building Aid Revenue Bonds, Fiscal Series 2007S-2, 5.000%, 1/15/28 – FGIC Insured | 1/17 at 100.00 | | AA– | | | 1,344,612 | |
| | 1,500 | | New York City Transitional Finance Authority, New York, Building Aid Revenue Bonds, Fiscal Series 2009-S5, 5.250%, 1/15/39 | 1/19 at 100.00 | | AA– | | | 1,722,585 | |
| | 4,075 | | New York City Transitional Finance Authority, New York, Future Tax Secured Bonds, Fiscal 2012 Series E-1, 5.000%, 2/01/42 | 2/22 at 100.00 | | AAA | | | 4,557,550 | |
| | 25 | | New York City Transitional Finance Authority, New York, Future Tax Secured Bonds, Fiscal Series 2003E, 5.000%, 2/01/23 – FGIC Insured | 5/13 at 100.00 | | AAA | | | 25,099 | |
| | 1,530 | | New York City Transitional Finance Authority, New York, Future Tax Secured Bonds, Fiscal Series 2007C-1, 5.000%, 11/01/27 | 11/17 at 100.00 | | AAA | | | 1,762,178 | |
| | 1,000 | | New York State Environmental Facilities Corporation, Infrastructure Revenue Bonds, Series 2003A, 5.000%, 3/15/21 | 3/14 at 100.00 | | AA– | | | 1,042,450 | |
| | 2,100 | | New York State Environmental Facilities Corporation, State Personal Income Tax Revenue Bonds, Series 2008A, 5.000%, 12/15/27 (UB) | 12/17 at 100.00 | | AAA | | | 2,434,194 | |
| | 840 | | New York State Housing Finance Agency, State Personal Income Tax Revenue Bonds, Economic Development and Housing, Series 2006A, 5.000%, 3/15/36 | 9/15 at 100.00 | | AAA | | | 914,138 | |
| | 1,000 | | New York State Thruway Authority, Highway and Bridge Trust Fund Bonds, Second General, Series 2005B, 5.000%, 4/01/21 – AMBAC Insured | 10/15 at 100.00 | | AA | | | 1,107,920 | |
| | Principal | | | Optional Call | | | | | | |
| | Amount (000) | | Description (1) | Provisions (2) | | Ratings (3) | | | Value | |
| | | | Tax Obligation/Limited (continued) | | | | | | | |
| $ | 1,175 | | New York State Thruway Authority, Highway and Bridge Trust Fund Bonds, Series 2007, 5.000%, 4/01/27 | 10/17 at 100.00 | | AA | | $ | 1,342,214 | |
| | 2,450 | | New York State Thruway Authority, Highway and Bridge Trust Fund Bonds, Series 2005B, 5.500%, 4/01/20 – AMBAC Insured (UB) (4) | No Opt. Call | | AA | | | 3,086,265 | |
| | | | New York State Tobacco Settlement Financing Corporation, Tobacco Settlement Asset-Backed and State Contingency Contract-Backed Bonds, Series 2003A-1: | | | | | | | |
| | 1,800 | | 5.250%, 6/01/20 – AMBAC Insured | 6/13 at 100.00 | | AA– | | | 1,815,534 | |
| | 2,000 | | 5.250%, 6/01/22 – AMBAC Insured | 6/13 at 100.00 | | AA– | | | 2,017,040 | |
| | 1,000 | | New York State Tobacco Settlement Financing Corporation, Tobacco Settlement Asset-Backed and State Contingency Contract-Backed Bonds, Series 2003B-1C, 5.500%, 6/01/21 | 6/13 at 100.00 | | AA– | | | 1,009,250 | |
| | 600 | | New York State Urban Development Corporation, Special Project Revenue Bonds, University Facilities Grants, Series 1995, 5.875%, 1/01/21 | No Opt. Call | | AA– | | | 767,586 | |
| | 2,000 | | New York State Urban Development Corporation, State Personal Income Tax Revenue Bonds, Series 2011A, 5.000%, 3/15/29 | 3/21 at 100.00 | | AAA | | | 2,299,040 | |
| | 5,500 | | Puerto Rico Sales Tax Financing Corporation, Sales Tax Revenue Bonds, First Subordinate Series 2010A, 0.000%, 8/01/33 | 8/29 at 100.00 | | A+ | | | 4,328,665 | |
| | 38,845 | | Total Tax Obligation/Limited | | | | | | 41,583,502 | |
| | | | Transportation – 9.1% (9.1% of Total Investments) | | | | | | | |
| | 2,500 | | Metropolitan Transportation Authority, New York, Transportation Revenue Bonds, Series 2007B, 5.000%, 11/15/33 | 11/17 at 100.00 | | A | | | 2,769,650 | |
| | 1,500 | | New York City Industrial Development Agency, New York, Civic Facility Revenue Bonds, Bronx Parking Development Company, LLC Project, Series 2007, 5.875%, 10/01/46 (5) | 10/17 at 102.00 | | N/R | | | 632,400 | |
| | 1,100 | | New York City Industrial Development Agency, New York, Special Facilities Revenue Bonds, British Airways PLC, Series 1998, 5.250%, 12/01/32 (Alternative Minimum Tax) | 6/13 at 100.00 | | BB | | | 1,099,934 | |
| | 1,000 | | New York City Industrial Development Agency, New York, Special Facilities Revenue Bonds, JFK Airport – American Airlines Inc., Series 2002B, 8.500%, 8/01/28 (Alternative Minimum Tax) | 8/13 at 100.50 | | N/R | | | 1,105,000 | |
| | 700 | | New York City Industrial Development Agency, New York, Special Facilities Revenue Bonds, Terminal One Group JFK Project, Series 2005, 5.500%, 1/01/24 (Alternative Minimum Tax) | 1/16 at 100.00 | | A3 | | | 771,862 | |
| | 1,000 | | New York City Industrial Development Agency, New York, Special Facility Revenue Bonds, JetBlue Airways Corporation Project, Series 2006, 5.125%, 5/15/30 (Alternative Minimum Tax) | 5/13 at 100.00 | | B– | | | 991,500 | |
| | 660 | | New York Liberty Development Corporation, Liberty Revenue Bonds, 4 World Trade Center Project, Series 2011, 5.000%, 11/15/44 | 11/21 at 100.00 | | A+ | | | 726,198 | |
| | 165 | | New York State Thruway Authority, General Revenue Bonds, Series 2005F, 5.000%, 1/01/30 – AMBAC Insured | 1/15 at 100.00 | | A+ | | | 175,560 | |
| | 400 | | New York State Thruway Authority, General Revenue Bonds, Series 2005G, 5.000%, 1/01/30 – AGM Insured | 7/15 at 100.00 | | AA– | | | 431,856 | |
| | 500 | | Niagara Frontier Airport Authority, New York, Airport Revenue Bonds, Buffalo Niagara International Airport, Series 1999A, 5.625%, 4/01/29 – NPFG Insured (Alternative Minimum Tax) | 10/13 at 100.00 | | Baa2 | | | 505,640 | |
| | | | Port Authority of New York and New Jersey, Consolidated Revenue Bonds, One Hundred Fortieth Series 2005: | | | | | | | |
| | 1,000 | | 5.000%, 12/01/28 – SYNCORA GTY Insured | 6/15 at 101.00 | | AA– | | | 1,091,730 | |
| | 435 | | 5.000%, 12/01/31 – SYNCORA GTY Insured | 6/15 at 101.00 | | AA– | | | 470,605 | |
| | 325 | | Port Authority of New York and New Jersey, Consolidated Revenue Bonds, One Hundred Forty Eighth Series 2008, Trust 2920, 17.812%, 8/15/32 – AGM Insured (IF) | 8/17 at 100.00 | | AA– | | | 497,874 | |
| | | | Port Authority of New York and New Jersey, Special Project Bonds, JFK International Air Terminal LLC Project, Eighth Series 2010: | | | | | | | |
| | 225 | | 6.500%, 12/01/28 | 12/15 at 100.00 | | BBB– | | | 248,384 | |
| | 1,160 | | 6.000%, 12/01/36 | 12/20 at 100.00 | | BBB– | | | 1,358,754 | |
| | | | Triborough Bridge and Tunnel Authority, New York, Subordinate Lien General Purpose Revenue Refunding Bonds, Series 2002E: | | | | | | | |
| | 780 | | 5.500%, 11/15/20 – NPFG Insured | No Opt. Call | | A+ | | | 989,914 | |
| | 335 | | 5.250%, 11/15/22 – NPFG Insured | 11/22 at 100.00 | | A+ | | | 336,394 | |
| | 13,785 | | Total Transportation | | | | | | 14,203,255 | |
| | | Nuveen New York Municipal Value Fund, Inc. (continued) |
| NNY | | Portfolio of Investments |
| | | March 31, 2013 (Unaudited) |
| | Principal | | | Optional Call | | | | | | |
| | Amount (000) | | Description (1) | Provisions (2) | | Ratings (3) | | | Value | |
| | | | U.S. Guaranteed – 3.3% (3.3% of Total Investments) (6) | | | | | | | |
| $ | 1,625 | | Dormitory Authority of the State of New York, Judicial Facilities Lease Revenue Bonds, Suffolk County Issue, Series 1986, 7.375%, 7/01/16 (ETM) | No Opt. Call | | Aaa | | $ | 1,812,574 | |
| | 500 | | Dormitory Authority of the State of New York, Revenue Bonds, South Nassau Communities Hospital, Series 2003B, 5.500%, 7/01/23 (Pre-refunded 7/01/13) | 7/13 at 100.00 | | Baa1 (6) | | | 506,790 | |
| | 260 | | Dormitory Authority of the State of New York, State Personal Income Tax Revenue Bonds, Series 2005F, 5.000%, 3/15/21 (Pre-refunded 3/15/15) – AGM Insured | 3/15 at 100.00 | | AA– (6) | | | 283,819 | |
| | 25 | | Dormitory Authority of the State of New York, Suffolk County, Lease Revenue Bonds, Judicial Facilities, Series 1991A, 9.500%, 4/15/14 – FGIC Insured (ETM) | 10/13 at 100.81 | | Baa1 (6) | | | 26,452 | |
| | 350 | | Erie County Industrial Development Agency, New York, School Facility Revenue Bonds, Buffalo City School District, Series 2004, 5.750%, 5/01/26 (Pre-refunded 5/01/14) – AGM Insured | 5/14 at 100.00 | | AA– (6) | | | 371,021 | |
| | 960 | | Metropolitan Transportation Authority, New York, Commuter Facilities Revenue Bonds, Series 1997B, 5.000%, 7/01/20 – AMBAC Insured (ETM) | 5/13 at 100.00 | | N/R (6) | | | 1,002,653 | |
| | 730 | | New York City, New York, General Obligation Bonds, Fiscal Series 2004C, 5.250%, 8/15/16 (Pre-refunded 8/15/14) | 8/14 at 100.00 | | Aa2 (6) | | | 780,428 | |
| | 375 | | New York City, New York, General Obligation Bonds, Fiscal Series 2004E, 5.000%, 11/01/19 (Pre-refunded 11/01/14) – AGM Insured | 11/14 at 100.00 | | Aa2 (6) | | | 403,264 | |
| | 4,825 | | Total U.S. Guaranteed | | | | | | 5,187,001 | |
| | | | Utilities – 7.3% (7.3% of Total Investments) | | | | | | | |
| | 1,000 | | Chautauqua County Industrial Development Agency, New York, Exempt Facility Revenue Bonds, NRG Dunkirk Power Project, Series 2009, 5.875%, 4/01/42 | 2/20 at 100.00 | | Baa3 | | | 1,115,000 | |
| | 90 | | Guam Power Authority, Revenue Bonds, Series 2012A, 5.000%, 10/01/34 | 10/22 at 100.00 | | BBB | | | 99,132 | |
| | | | Long Island Power Authority, New York, Electric System General Revenue Bonds, Series 2006A: | | | | | | | |
| | 1,500 | | 5.000%, 12/01/23 – FGIC Insured | 6/16 at 100.00 | | A | | | 1,662,840 | |
| | 1,500 | | 5.000%, 12/01/24 – FGIC Insured | 6/16 at 100.00 | | A | | | 1,658,910 | |
| | 250 | | Long Island Power Authority, New York, Electric System General Revenue Bonds, Series 2006B, 5.000%, 12/01/35 – CIFG Insured | 6/16 at 100.00 | | A | | | 269,693 | |
| | 1,510 | | Long Island Power Authority, New York, Electric System Revenue Bonds, Refunding Series 2009A, 5.700%, 4/01/30 | 4/19 at 100.00 | | A | | | 1,789,773 | |
| | 1,650 | | Long Island Power Authority, New York, Electric System Revenue Bonds, Series 2011A, 5.000%, 5/01/38 | 5/21 at 100.00 | | A | | | 1,790,943 | |
| | 1,000 | | Nassau County Industrial Development Authority, New York, Keyspan Glenwood Energy Project, Series 2003, 5.250%, 6/01/27 (Alternative Minimum Tax) | 6/13 at 100.00 | | A– | | | 1,007,020 | |
| | 1,320 | | Niagara Area Development Corporation, New York, Solid Waste Disposal Facility Revenue Refunding Bonds, Covanta Energy Project, Series 2012A, 5.250%, 11/01/42 | No Opt. Call | | BB+ | | | 1,360,603 | |
| | 25 | | Power Authority of the State of New York, General Revenue Bonds, Series 2006A, 5.000%, 11/15/19 – FGIC Insured | 11/15 at 100.00 | | Aa2 | | | 27,975 | |
| | 575 | | Suffolk County Industrial Development Agency, New York, Revenue Bonds, Nissequogue Cogeneration Partners Facility, Series 1998, 5.500%, 1/01/23 (Alternative Minimum Tax) | 7/13 at 100.00 | | N/R | | | 574,977 | |
| | 10,420 | | Total Utilities | | | | | | 11,356,866 | |
| | Principal | | | Optional Call | | | | | | |
| | Amount (000) | | Description (1) | Provisions (2) | | Ratings (3) | | | Value | |
| | | | Water and Sewer – 5.4% (5.4% of Total Investments) | | | | | | | |
| $ | 2,000 | | New York City Municipal Water Finance Authority, New York, Water and Sewer System Revenue Bonds, Fiscal 2009 Series 2008A, 5.750%, 6/15/40 | No Opt. Call | | AAA | | $ | 2,364,080 | |
| | 4,440 | | New York City Municipal Water Finance Authority, New York, Water and Sewer System Revenue Bonds, Second Generation Resolution, Fiscal 2012 Series BB, 5.000%, 6/15/44 | 12/21 at 100.00 | | AA+ | | | 4,899,407 | |
| | 1,000 | | New York State Environmental Facilities Corporation, Revenue Bonds, State Revolving Funds Master Financing, Series 2012B, 5.000%, 2/15/42 | 2/22 at 100.00 | | AAA | | | 1,136,080 | |
| | 7,440 | | Total Water and Sewer | | | | | | 8,399,567 | |
| $ | 144,150 | | Total Investments (cost $145,046,470) – 99.7% | | | | | | 155,576,784 | |
| | | | Floating Rate Obligations – (2.1)% | | | | | | (3,255,000 | ) |
| | | | Other Assets Less Liabilities – 2.4% | | | | | | 3,775,759 | |
| | | | Net Assets – 100% | | | | | $ | 156,097,543 | |
| (1) | | All percentages shown in the Portfolio of Investments are based on net assets unless otherwise noted. |
| (2) | | Optional Call Provisions: Dates (month and year) and prices of the earliest optional call or redemption. There may be other call provisions at varying prices at later dates. Certain mortgage-backed securities may be subject to periodic principal paydowns. |
| (3) | | Ratings: Using the highest of Standard & Poor’s Group (“Standard & Poor’s”), Moody’s Investors Service, Inc. (“Moody’s”) or Fitch, Inc. (“Fitch”) rating. Ratings below BBB by Standard & Poor’s, Baa by Moody’s or BBB by Fitch are considered to be below investment grade. Holdings designated N/R are not rated by any of these national rating agencies. |
| (4) | | Investment, or portion of investment, has been pledged to collateralize the net payment obligations for investments in inverse floating rate transactions. |
| (5) | | At or subsequent to the end of the reporting period, this security is non-income producing. Non-income producing security, in the case of a fixed-income security, generally denotes that the issuer has (1) defaulted on the payment of principal or interest, (2) is under the protection of the Federal Bankruptcy Court or (3) the Fund’s Adviser has concluded that the issue is not likely to meet its future interest payment obligations and has directed the Fund’s custodian to cease accruing additional income on the Fund’s records. |
| (6) | | Backed by an escrow or trust containing sufficient U.S. Government or U.S. Government agency securities, which ensure the timely payment of principal and interest. Certain bonds backed by U.S. Government or agency securities are regarded as having an implied rating equal to the rating of such securities. |
| N/R | | Not rated. |
| (ETM) | | Escrowed to maturity. |
| (IF) | | Inverse floating rate investment. |
| (UB) | | Underlying bond of an inverse floating rate trust reflected as a financing transaction. See Notes to Financial Statements, Footnote 1 – General Information and Significant Accounting Policies, Inverse Floating Rate Securities for more information. |
See accompanying notes to financial statements.
| | | Nuveen New York Municipal Value Fund 2 |
| NYV | | Portfolio of Investments |
| | | March 31, 2013 (Unaudited) |
| | Principal | | | Optional Call | | | | | | |
| | Amount (000) | | Description (1) | Provisions (2) | | Ratings (3) | | | Value | |
| | | | Consumer Staples – 4.2% (4.2% of Total Investments) | | | | | | | |
| $ | 1,350 | | District of Columbia Tobacco Settlement Corporation, Tobacco Settlement Asset-Backed Bonds, Series 2001, 6.500%, 5/15/33 | No Opt. Call | | Baa1 | | $ | 1,599,291 | |
| | | | Education and Civic Organizations – 10.8% (11.0% of Total Investments) | | | | | | | |
| | 1,200 | | Albany Industrial Development Agency, New York, Revenue Bonds, Brighter Choice Charter Schools, Series 2007A, 5.000%, 4/01/37 | 4/17 at 100.00 | | BB+ | | | 1,175,352 | |
| | 380 | | Buffalo and Erie County Industrial Land Development Corporation, New York, Tax-Exempt Revenue Bonds, Enterprise Charter School Project, Series 2011A, 6.000%, 12/01/19 | No Opt. Call | | BBB– | | | 415,272 | |
| | 1,000 | | Dormitory Authority of the State of New York, Lease Revenue Bonds, State University Dormitory Facilities, Series 2007, 5.000%, 7/01/37 | 7/17 at 100.00 | | Aa2 | | | 1,110,610 | |
| | 65 | | New York City Industrial Development Agency, New York, Civic Facility Revenue Bonds, Vaughn College of Aeronautics, Series 2006A, 5.000%, 12/01/28 | 12/16 at 100.00 | | BB+ | | | 67,989 | |
| | 4,895 | | New York City Industrial Development Agency, New York, Revenue Bonds, Yankee Stadium Project PILOT, Series 2009A, 0.000%, 3/01/40 – AGC Insured | No Opt. Call | | AA– | | | 1,387,684 | |
| | 7,540 | | Total Education and Civic Organizations | | | | | | 4,156,907 | |
| | | | Financials – 0.9% (0.9% of Total Investments) | | | | | | | |
| | 300 | | Liberty Development Corporation, New York, Goldman Sachs Headquarter Revenue Bonds, Series 2005, 5.250%, 10/01/35 | No Opt. Call | | A | | | 351,612 | |
| | | | Health Care – 20.8% (21.1% of Total Investments) | | | | | | | |
| | 290 | | Albany Capital Resource Corporation, New York, St. Peter’s Hospital Project, Series 2011, 6.000%, 11/15/25 | 11/20 at 100.00 | | A3 | | | 349,766 | |
| | 700 | | Delaware County Hospital Authority, Indiana, Hospital Revenue Bonds, Cardinal Health System, Series 2006, 5.000%, 8/01/24 | 8/16 at 100.00 | | Baa2 | | | 750,162 | |
| | 500 | | Dormitory Authority of the State of New York, FHA-Insured Revenue Bonds, St. Lukes Roosevelt Hospital, Series 2005, 4.900%, 8/15/31 | 8/15 at 100.00 | | N/R | | | 534,270 | |
| | 50 | | Dormitory Authority of the State of New York, Highland Hospital of Rochester Revenue Bonds, Series 2010, 5.000%, 7/01/26 | 7/20 at 100.00 | | A2 | | | 55,257 | |
| | 1,000 | | Dormitory Authority of the State of New York, Insured Revenue Bonds, Franciscan Health Partnership Obligated Group – Frances Shervier Home and Hospital, Series 1997, 5.500%, 7/01/27 – RAAI Insured | 7/13 at 100.00 | | A3 | | | 1,001,280 | |
| | 85 | | Dormitory Authority of the State of New York, Orange Regional Medical Center Obligated Group Revenue Bonds, Series 2008, 6.250%, 12/01/37 | 12/18 at 100.00 | | Ba1 | | | 94,073 | |
| | 1,500 | | Dormitory Authority of the State of New York, Revenue Bonds, North Shore Long Island Jewish Obligated Group, Series 2006B, 5.000%, 11/01/34 | 11/16 at 100.00 | | A3 | | | 1,580,190 | |
| | 1,500 | | Dormitory Authority of the State of New York, Revenue Bonds, North Shore Long Island Jewish Obligated Group, Series 2009A, 5.500%, 5/01/37 | 5/19 at 100.00 | | A– | | | 1,699,725 | |
| | 1,010 | | Dormitory Authority of the State of New York, Revenue Bonds, NYU Hospitals Center, Series 2007B, 5.625%, 7/01/37 | 7/17 at 100.00 | | A– | | | 1,098,961 | |
| | 725 | | Illinois Finance Authority, Revenue Bonds, OSF Healthcare System, Series 2007A, 5.750%, 11/15/37 | 11/17 at 100.00 | | A | | | 794,955 | |
| | 7,360 | | Total Health Care | | | | | | 7,958,639 | |
| | | | Housing/Multifamily – 12.9% (13.1% of Total Investments) | | | | | | | |
| | 1,500 | | New York City Housing Development Corporation, New York, FNMA Backed Progress of Peoples Development Multifamily Rental Housing Revenue Bonds, Series 2005B, 4.950%, 5/15/36 (Alternative Minimum Tax) | 11/15 at 100.00 | | AA+ | | | 1,546,215 | |
| | 1,800 | | New York City Housing Development Corporation, New York, Multifamily Housing Revenue Bonds, Series 2004-H2, 5.125%, 11/01/34 (Alternative Minimum Tax) | 11/14 at 100.00 | | AA | | | 1,835,928 | |
| | Principal | | | Optional Call | | | | | | |
| | Amount (000) | | Description (1) | Provisions (2) | | Ratings (3) | | | Value | |
| | | | Housing/Multifamily (continued) | | | | | | | |
| $ | 1,000 | | New York State Housing Finance Agency, Affordable Housing Revenue Bonds, Series 2009A, 5.250%, 11/01/41 | 5/19 at 100.00 | | Aa2 | | $ | 1,073,100 | |
| | 450 | | New York State Housing Finance Agency, Affordable Housing Revenue Bonds, Series 2009B, 4.500%, 11/01/29 | 5/19 at 100.00 | | Aa2 | | | 488,619 | |
| | 4,750 | | Total Housing/Multifamily | | | | | | 4,943,862 | |
| | | | Tax Obligation/General – 5.7% (5.7% of Total Investments) | | | | | | | |
| | 1,500 | | New York City, New York, General Obligation Bonds, Fiscal 2009 Series J1, 5.000%, 5/15/36 | 5/19 at 100.00 | | AA | | | 1,707,585 | |
| | 400 | | Yonkers, New York, General Obligation Bonds, Series 2011A, 5.000%, 10/01/24 – AGM Insured | 10/21 at 100.00 | | AA– | | | 459,908 | |
| | 1,900 | | Total Tax Obligation/General | | | | | | 2,167,493 | |
| | | | Tax Obligation/Limited – 28.9% (29.3% of Total Investments) | | | | | | | |
| | 1,200 | | Dormitory Authority of the State of New York, State Personal Income Tax Revenue Bonds, Education Series 2009A, 5.000%, 3/15/38 | 3/19 at 100.00 | | AAA | | | 1,359,348 | |
| | 1,200 | | Guam Government, Limited Obligation Section 30 Revenue Bonds, Series 2009A, 5.750%, 12/01/34 | 12/19 at 100.00 | | BBB+ | | | 1,327,440 | |
| | 1,710 | | Hudson Yards Infrastructure Corporation, New York, Revenue Bonds, Series 2006A, 5.000%, 2/15/47 | 2/17 at 100.00 | | A | | | 1,819,437 | |
| | | | New York City Sales Tax Asset Receivable Corporation, New York, Dedicated Revenue Bonds, Local Government Assistance Corporation, Series 2004A: | | | | | | | |
| | 750 | | 5.000%, 10/15/26 – AGM Insured | 10/14 at 100.00 | | AAA | | | 801,683 | |
| | 1,000 | | 5.000%, 10/15/32 – AGM Insured | 10/14 at 100.00 | | AAA | | | 1,062,530 | |
| | 1,500 | | New York City Transitional Finance Authority, New York, Building Aid Revenue Bonds, Fiscal Series 2009-S5, 5.250%, 1/15/39 | 1/19 at 100.00 | | AA– | | | 1,722,585 | |
| | 25 | | New York City Transitional Finance Authority, New York, Future Tax Secured Revenue Bonds, Subordinate Lien Series 2011C, 5.500%, 11/01/35 | 11/20 at 100.00 | | AAA | | | 29,578 | |
| | 1,000 | | New York State Urban Development Corporation, State Personal Income Tax Revenue Bonds, Tender Option Bond Trust 09-6W, 13.825%, 3/15/37 (IF) (4) | 3/17 at 100.00 | | AAA | | | 1,349,280 | |
| | 1,500 | | Puerto Rico Sales Tax Financing Corporation, Sales Tax Revenue Bonds, First Subordinate Series 2009A, 6.000%, 8/01/42 | 8/19 at 100.00 | | A+ | | | 1,612,995 | |
| | 9,885 | | Total Tax Obligation/Limited | | | | | | 11,084,876 | |
| | | | Transportation – 10.4% (10.5% of Total Investments) | | | | | | | |
| | | | New York City Industrial Development Agency, New York, American Airlines-JFK International Airport Special Facility Revenue Bonds, Series 2005: | | | | | | | |
| | 500 | | 7.500%, 8/01/16 (Alternative Minimum Tax) | No Opt. Call | | N/R | | | 531,850 | |
| | 500 | | 7.750%, 8/01/31 (Alternative Minimum Tax) | 8/16 at 101.00 | | N/R | | | 573,755 | |
| | 2,000 | | New York City Industrial Development Agency, New York, Civic Facility Revenue Bonds, Bronx Parking Development Company, LLC Project, Series 2007, 5.750%, 10/01/37 (5) | 10/17 at 100.00 | | N/R | | | 843,340 | |
| | 155 | | New York Liberty Development Corporation, Liberty Revenue Bonds, 4 World Trade Center Project, Series 2011, 5.000%, 11/15/44 | 11/21 at 100.00 | | A+ | | | 170,547 | |
| | | | Port Authority of New York and New Jersey, Special Project Bonds, JFK International Air Terminal LLC Project, Eighth Series 2010: | | | | | | | |
| | 180 | | 6.500%, 12/01/28 | 12/15 at 100.00 | | BBB– | | | 198,707 | |
| | 140 | | 6.000%, 12/01/36 | 12/20 at 100.00 | | BBB– | | | 163,988 | |
| | 1,325 | | Triborough Bridge and Tunnel Authority, New York, General Purpose Revenue Bonds, Refunding Series 2008A, 5.000%, 11/15/33 | 5/18 at 100.00 | | AA– | | | 1,497,568 | |
| | 4,800 | | Total Transportation | | | | | | 3,979,755 | |
| | | | U.S. Guaranteed – 0.6% (0.6% of Total Investments) (6) | | | | | | | |
| | 225 | | Wisconsin Health and Educational Facilities Authority, Revenue Bonds, ProHealth Care, Inc. Obligated Group, Series 2009, 6.625%, 2/15/32 (Pre-refunded 2/18/14) | 2/14 at 100.00 | | A+ (6) | | | 237,623 | |
| | | Nuveen New York Municipal Value Fund 2 (continued) |
| NYV | | Portfolio of Investments |
| | | March 31, 2013 (Unaudited) |
| | Principal | | | Optional Call | | | | | | |
| | Amount (000) | | Description (1) | Provisions (2) | | Ratings (3) | | | Value | |
| | | | Utilities – 1.0% (1.0% of Total Investments) | | | | | | | |
| $ | 25 | | Guam Power Authority, Revenue Bonds, Series 2012A, 5.000%, 10/01/34 | 10/22 at 100.00 | | BBB | | $ | 27,537 | |
| | 330 | | Niagara Area Development Corporation, New York, Solid Waste Disposal Facility Revenue Refunding Bonds, Covanta Energy Project, Series 2012A, 5.250%, 11/01/42 | No Opt. Call | | BB+ | | | 340,151 | |
| | 355 | | Total Utilities | | | | | | 367,688 | |
| | | | Water and Sewer – 2.6% (2.6% of Total Investments) | | | | | | | |
| | 900 | | New York City Municipal Water Finance Authority, New York, Water and Sewer System Revenue Bonds, Second Generation Resolution, Fiscal 2012 Series BB, 5.000%, 6/15/44 | 12/21 at 100.00 | | AA+ | | | 993,123 | |
| $ | 39,365 | | Total Investments (cost $32,705,238) – 98.8% | | | | | | 37,840,869 | |
| | | | Other Assets Less Liabilities – 1.2% (7) | | | | | | 467,070 | |
| | | | Net Assets – 100% | | | | | $ | 38,307,939 | |
Investments in Derivatives as of March 31, 2013 |
| |
| Swaps outstanding: |
| | | | | Fund | | | | | | Fixed Rate | | | | | | Unrealized | |
| | | Notional | | Pay/Receive | | Floating Rate | | Fixed Rate | | Payment | | Effective | | Termination | | Appreciation | |
| Counterparty | | Amount | | Floating Rate | | Index | | (Annualized) | | Frequency | | Date (8) | | Date | | (Depreciation) (7) | |
| Barclays Bank PLC | | $2,750,000 | | Receive | | 3-Month USD-LIBOR | | 3.190% | | Semi-Annually | | 4/30/14 | | 4/30/34 | | $(81,419) | |
| (1) | | All percentages shown in the Portfolio of Investments are based on net assets unless otherwise noted. |
| (2) | | Optional Call Provisions: Dates (month and year) and prices of the earliest optional call or redemption. There may be other call provisions at varying prices at later dates. Certain mortgage-backed securities may be subject to periodic principal paydowns. |
| (3) | | Ratings: Using the highest of Standard & Poor’s Group (“Standard & Poor’s”), Moody’s Investors Service, Inc. (“Moody’s”) or Fitch, Inc. (“Fitch”) rating. Ratings below BBB by Standard & Poor’s, Baa by Moody’s or BBB by Fitch are considered to be below investment grade. Holdings designated N/R are not rated by any of these national rating agencies. |
| (4) | | Investment, or portion of investment, has been pledged to collateralize the net payment obligations for investments in derivatives and/or inverse floating rate transactions. |
| (5) | | At or subsequent to the end of the reporting period, this security is non-income producing. Non-income producing security, in the case of a fixed-income security, generally denotes that the issuer has (1) defaulted on the payment of principal or interest, (2) is under the protection of the Federal Bankruptcy Court or (3) the Fund’s Adviser has concluded that the issue is not likely to meet its future interest payment obligations and has directed the Fund’s custodian to cease accruing additional income on the Fund’s records. |
| (6) | | Backed by an escrow or trust containing sufficient U.S. Government or U.S. Government agency securities, which ensure the timely payment of principal and interest. Certain bonds backed by U.S. Government or agency securities are regarded as having an implied rating equal to the rating of such securities. |
| (7) | | Other Assets Less Liabilities includes the Unrealized Appreciation (Depreciation) of derivative instruments as listed within Investments in Derivatives as of the end of the reporting period. |
| (8) | | Effective date represents the date on which both the Fund and Counterparty commence interest payment accruals on each forward swap contract. |
| N/R | | Not rated. |
| (IF) | | Inverse floating rate investment. |
| USD-LIBOR | | United States Dollar-London Inter-Bank Offered Rate. |
See accompanying notes to financial statements.
| | | Nuveen New York Performance Plus Municipal Fund, Inc. |
| NNP | | Portfolio of Investments |
| | | March 31, 2013 (Unaudited) |
| | Principal | | | Optional Call | | | | | | |
| | Amount (000) | | Description (1) | Provisions (2) | | Ratings (3) | | | Value | |
| | | | Consumer Discretionary – 0.3% (0.2% of Total Investments) | | | | | | | |
| $ | 685 | | New York City Industrial Development Agency, New York, Liberty Revenue Bonds, IAC/InterActiveCorp, Series 2005, 5.000%, 9/01/35 | 9/15 at 100.00 | | BBB | | $ | 714,839 | |
| | | | Consumer Staples – 2.4% (1.6% of Total Investments) | | | | | | | |
| | 310 | | New York Counties Tobacco Trust II, Tobacco Settlement Pass-Through Bonds, Series 2001, 5.250%, 6/01/25 | 6/13 at 100.00 | | A3 | | | 302,758 | |
| | 915 | | New York Counties Tobacco Trust III, Tobacco Settlement Pass-Through Bonds, Series 2003, 5.750%, 6/01/33 | 6/13 at 100.00 | | A1 | | | 916,610 | |
| | 235 | | Rensselaer Tobacco Asset Securitization Corporation, New York, Tobacco Settlement Asset-Backed Bonds, Series 2001A, 5.200%, 6/01/25 | 5/13 at 100.00 | | A3 | | | 232,685 | |
| | | | TSASC Inc., New York, Tobacco Asset-Backed Bonds, Series 2006: | | | | | | | |
| | 2,140 | | 4.750%, 6/01/22 | 6/16 at 100.00 | | BBB | | | 2,154,274 | |
| | 930 | | 5.000%, 6/01/26 | 6/16 at 100.00 | | BB– | | | 919,333 | |
| | 500 | | 5.000%, 6/01/34 | 6/16 at 100.00 | | B+ | | | 453,240 | |
| | 1,050 | | 5.125%, 6/01/42 | 6/16 at 100.00 | | B+ | | | 928,001 | |
| | 6,080 | | Total Consumer Staples | | | | | | 5,906,901 | |
| | | | Education and Civic Organizations – 22.2% (15.2% of Total Investments) | | | | | | | |
| | 655 | | Albany Industrial Development Agency, New York, Revenue Bonds, Albany Law School, Series 2007A, 5.000%, 7/01/31 | 7/17 at 100.00 | | BBB | | | 684,285 | |
| | 925 | | Albany Industrial Development Agency, New York, Revenue Bonds, Brighter Choice Charter Schools, Series 2007A, 5.000%, 4/01/37 | 4/17 at 100.00 | | BB+ | | | 906,001 | |
| | 1,000 | | Brooklyn Arena Local Development Corporation, New York, Payment in Lieu of Taxes Revenue Bonds, Barclays Center Project, Series 2009, 6.375%, 7/15/43 | 1/20 at 100.00 | | BBB– | | | 1,198,940 | |
| | 1,630 | | Buffalo and Erie County Industrial Land Development Corporation, New York, Tax-Exempt Revenue Bonds, Enterprise Charter School Project, Series 2011A, 7.500%, 12/01/40 | 12/20 at 100.00 | | BBB– | | | 1,911,892 | |
| | 1,285 | | Cattaraugus County Industrial Development Agency, New York, Revenue Bonds, St. Bonaventure University, Series 1998B, 5.000%, 9/15/13 | 5/13 at 100.00 | | BBB– | | | 1,287,531 | |
| | 90 | | Cattaraugus County Industrial Development Agency, New York, Revenue Bonds, St. Bonaventure University, Series 2006, 5.000%, 5/01/23 | 5/16 at 100.00 | | BBB– | | | 93,253 | |
| | 2,815 | | Dormitory Authority of the State of New York, General Revenue Bonds, Manhattan College, Series 2007A, 5.000%, 7/01/41 – RAAI Insured | 7/17 at 100.00 | | N/R | | | 2,890,752 | |
| | 2,120 | | Dormitory Authority of the State of New York, General Revenue Bonds, New York University, Series 2001-1, 5.500%, 7/01/20 – AMBAC Insured | No Opt. Call | | AA– | | | 2,681,079 | |
| | 1,000 | | Dormitory Authority of the State of New York, Housing Revenue Bonds, Fashion Institute of Technology, Series 2007, 5.250%, 7/01/29 – FGIC Insured | No Opt. Call | | N/R | | | 1,152,850 | |
| | 1,215 | | Dormitory Authority of the State of New York, Lease Revenue Bonds, State University Dormitory Facilities, Series 2004A, 5.000%, 7/01/29 – NPFG Insured | 7/15 at 100.00 | | Aa2 | | | 1,308,069 | |
| | 1,000 | | Dormitory Authority of the State of New York, Lease Revenue Bonds, State University Dormitory Facilities, Series 2011A, 5.000%, 7/01/41 | 7/21 at 100.00 | | Aa2 | | | 1,113,930 | |
| | 2,500 | | Dormitory Authority of the State of New York, Revenue Bonds, Columbia University, Series 2011A, 5.000%, 10/01/41 | 4/21 at 100.00 | | AAA | | | 2,879,525 | |
| | 2,100 | | Dormitory Authority of the State of New York, Revenue Bonds, Marymount Manhattan College, Series 2009, 5.250%, 7/01/29 | 7/19 at 100.00 | | Baa2 | | | 2,226,630 | |
| | 875 | | Dormitory Authority of the State of New York, Revenue Bonds, New School University, Series 2010, 5.250%, 7/01/30 | 7/20 at 100.00 | | A– | | | 978,600 | |
| | 5,000 | | Dormitory Authority of the State of New York, Revenue Bonds, New York University, Series 2007, 5.000%, 7/01/32 – AMBAC Insured | 7/17 at 100.00 | | AA– | | | 5,575,650 | |
| | 290 | | Dormitory Authority of the State of New York, Revenue Bonds, New York University, Series 2009A, 5.000%, 7/01/39 | 7/19 at 100.00 | | AA– | | | 328,123 | |
| | | Nuveen New York Performance Plus Municipal Fund, Inc. (continued) |
| NNP | | Portfolio of Investments |
| | | March 31, 2013 (Unaudited) |
| | Principal | | | Optional Call | | | | | | |
| | Amount (000) | | Description (1) | Provisions (2) | | Ratings (3) | | | Value | |
| | | | Education and Civic Organizations (continued) | | | | | | | |
| $ | 2,000 | | Dormitory Authority of the State of New York, Revenue Bonds, Non State Supported Debt, Cornell University, Series 2010A, 5.000%, 7/01/40 | 7/20 at 100.00 | | Aa1 | | $ | 2,270,940 | |
| | 640 | | Dormitory Authority of the State of New York, Revenue Bonds, St. Joseph’s College, Series 2010, 5.250%, 7/01/35 | 7/20 at 100.00 | | Baa1 | | | 707,104 | |
| | 925 | | Dutchess County Industrial Development Agency, New York, Civic Facility Revenue Bonds, Bard College Project, Series 2007-A2, 4.500%, 8/01/36 | 8/17 at 100.00 | | Baa1 | | | 943,408 | |
| | 3,880 | | Dutchess County Industrial Development Agency, New York, Civic Facility Revenue Bonds, Bard College Refunding, Series 2007-A1, 5.000%, 8/01/46 | 8/17 at 100.00 | | Baa1 | | | 4,041,214 | |
| | 635 | | Hempstead Town Industrial Development Agency, New York, Revenue Bonds, Adelphi University, Civic Facility Project, Series 2005, 5.000%, 10/01/35 | 10/15 at 100.00 | | A | | | 678,174 | |
| | 1,885 | | Hempstead Town Local Development Corporation, New York, Revenue Bonds, Molloy College Project, Series 2009, 5.750%, 7/01/39 | 7/19 at 100.00 | | BBB+ | | | 2,128,749 | |
| | 1,260 | | Madison County Capital Resource Corporation, New York, Revenue Bonds, Colgate University Project, Series 2010A, 5.000%, 7/01/40 | 7/20 at 100.00 | | AA | | | 1,405,366 | |
| | 580 | | New York City Industrial Development Agency, New York, Civic Facility Revenue Bonds, St. Francis College, Series 2004, 5.000%, 10/01/34 | 10/14 at 100.00 | | A– | | | 593,485 | |
| | 560 | | New York City Industrial Development Agency, New York, Civic Facility Revenue Bonds, Vaughn College of Aeronautics, Series 2006A, 5.000%, 12/01/28 | 12/16 at 100.00 | | BB+ | | | 585,754 | |
| | | | New York City Industrial Development Agency, New York, PILOT Revenue Bonds, Queens Baseball Stadium Project, Series 2006: | | | | | | | |
| | 2,515 | | 5.000%, 1/01/39 – AMBAC Insured | 1/17 at 100.00 | | Ba1 | | | 2,560,471 | |
| | 2,300 | | 4.750%, 1/01/42 – AMBAC Insured | 1/17 at 100.00 | | Ba1 | | | 2,301,403 | |
| | | | New York City Industrial Development Authority, New York, PILOT Revenue Bonds, Yankee Stadium Project, Series 2006: | | | | | | | |
| | 3,855 | | 4.500%, 3/01/39 – FGIC Insured | 9/16 at 100.00 | | BBB | | | 3,893,010 | |
| | 1,000 | | 4.750%, 3/01/46 – NPFG Insured | 9/16 at 100.00 | | BBB | | | 1,018,110 | |
| | 420 | | Seneca County Industrial Development Authority, New York, Revenue Bonds, New York Chiropractic College, Series 2007, 5.000%, 10/01/27 | 10/17 at 100.00 | | BBB | | | 445,704 | |
| | 1,750 | | St. Lawrence County Industrial Development Agency Civic Development Corporation, New York, Revenue Bonds, Clarkson University Project, Series 2012A, 5.000%, 9/01/41 | 3/22 at 100.00 | | A3 | | | 1,940,488 | |
| | 1,425 | | Troy Capital Resource Corporation, New York, Revenue Bonds, Rensselaer Polytechnic Institute, Series 2010A, 5.125%, 9/01/40 | 9/20 at 100.00 | | A– | | | 1,560,104 | |
| | 660 | | Yonkers Industrial Development Agency, New York, Civic Facility Revenue Bonds, Sarah Lawrence College Project, Series 2001A Remarketed, 6.000%, 6/01/41 | 6/19 at 100.00 | | BBB+ | | | 740,560 | |
| | 50,790 | | Total Education and Civic Organizations | | | | | | 55,031,154 | |
| | | | Financials – 1.3% (0.9% of Total Investments) | | | | | | | |
| | 1,000 | | Liberty Development Corporation, New York, Goldman Sachs Headquarter Revenue Bonds, Series 2005, 5.250%, 10/01/35 | No Opt. Call | | A | | | 1,172,040 | |
| | 1,740 | | Liberty Development Corporation, New York, Goldman Sachs Headquarters Revenue Bonds Series 2007, 5.500%, 10/01/37 | No Opt. Call | | A | | | 2,109,820 | |
| | 2,740 | | Total Financials | | | | | | 3,281,860 | |
| | | | Health Care – 14.4% (9.9% of Total Investments) | | | | | | | |
| | 1,000 | | Dormitory Authority of the State of New York , Revenue Bonds, NYU Hospitals Center, Refunding Series 2007A, 5.000%, 7/01/36 | 7/17 at 100.00 | | A– | | | 1,055,370 | |
| | 1,235 | | Dormitory Authority of the State of New York, FHA-Insured Mortgage Revenue Bonds, Montefiore Hospital, Series 2004, 5.000%, 8/01/29 – FGIC Insured | 2/15 at 100.00 | | N/R | | | 1,309,051 | |
| | 1,700 | | Dormitory Authority of the State of New York, FHA-Insured Revenue Bonds,
Montefiore Medical Center, Series 2005, 5.000%, 2/01/22 – FGIC Insured | 2/15 at 100.00 | | N/R | | | 1,823,046 | |
| | 8,500 | | Dormitory Authority of the State of New York, FHA-Insured Revenue Bonds, St. Lukes Roosevelt Hospital, Series 2005, 4.900%, 8/15/31 | 8/15 at 100.00 | | N/R | | | 9,082,590 | |
| | Principal | | | Optional Call | | | | | | |
| | Amount (000) | | Description (1) | Provisions (2) | | Ratings (3) | | | Value | |
| | | | Health Care (continued) | | | | | | | |
| $ | 350 | | Dormitory Authority of the State of New York, Highland Hospital of Rochester Revenue Bonds, Series 2010, 5.000%, 7/01/26 | 7/20 at 100.00 | | A2 | | $ | 386,799 | |
| | 805 | | Dormitory Authority of the State of New York, Orange Regional Medical Center Obligated Group Revenue Bonds, Series 2008, 6.250%, 12/01/37 | 12/18 at 100.00 | | Ba1 | | | 890,926 | |
| | 5,590 | | Dormitory Authority of the State of New York, Revenue Bonds, Memorial Sloan Kettering Cancer Center, Series 2006, 5.000%, 7/01/35 (UB) | 7/16 at 100.00 | | AA | | | 6,125,578 | |
| | 2,575 | | Dormitory Authority of the State of New York, Revenue Bonds, New York and Presbyterian Hospital, Series 2004A, 5.250%, 8/15/15 – AGM Insured | 8/14 at 100.00 | | AA– | | | 2,753,499 | |
| | 1,800 | | Dormitory Authority of the State of New York, Revenue Bonds, North Shore Long Island Jewish Obligated Group, Series 2005A, 5.000%, 11/01/34 | 11/16 at 100.00 | | A3 | | | 1,892,502 | |
| | 3,750 | | Dormitory Authority of the State of New York, Revenue Bonds, NYU Hospitals Center, Series 2011A, 6.000%, 7/01/40 | 7/20 at 100.00 | | A– | | | 4,381,425 | |
| | 500 | | Dutchess County Local Development Corporation, New York, Revenue Bonds, Health Quest System Inc, Series 2010A, 5.750%, 7/01/30 | 7/20 at 100.00 | | A– | | | 589,595 | |
| | | | Madison County Industrial Development Agency, New York, Civic Facility Revenue Bonds, Oneida Health System, Series 2007A: | | | | | | | |
| | 710 | | 5.250%, 2/01/27 | 2/17 at 100.00 | | BBB– | | | 724,356 | |
| | 625 | | 5.500%, 2/01/32 | 2/17 at 100.00 | | BBB– | | | 640,250 | |
| | 2,730 | | Suffolk County Economic Development Corp / Nassau County Local Economic Assistance & Financing Corp., New York, Revenue Bonds, Catholic Health Services of Long Island Obligated Group Project, Series 2011, 5.000%, 7/01/28 | 7/21 at 100.00 | | A– | | | 3,091,425 | |
| | 1,100 | | Yonkers Industrial Development Agency, New York, Revenue Bonds, St. John’s Riverside Hospital, Series 2001A, 7.125%, 7/01/31 | 7/13 at 100.00 | | B+ | | | 1,101,771 | |
| | 32,970 | | Total Health Care | | | | | | 35,848,183 | |
| | | | Housing/Multifamily – 5.2% (3.6% of Total Investments) | | | | | | | |
| | 4,530 | | New York City Housing Development Corporation, New York, Capital Fund Program Revenue Bonds, Series 2005A, 5.000%, 7/01/25 – NPFG (UB) (4) | 7/15 at 100.00 | | AA– | | | 4,906,488 | |
| | 5 | | New York City Housing Development Corporation, New York, Multifamily Housing Revenue Bonds, Series 2002A, 5.500%, 11/01/34 (Alternative Minimum Tax) | 5/13 at 100.00 | | AA | | | 5,029 | |
| | 1,500 | | New York City Housing Development Corporation, New York, Multifamily Housing Revenue Bonds, Series 2004A, 5.250%, 11/01/30 | 5/14 at 100.00 | | AA | | | 1,530,900 | |
| | 345 | | New York City Housing Development Corporation, New York, Multifamily Housing Revenue Bonds, Series 2010D-1A, 5.000%, 11/01/42 | 5/20 at 100.00 | | AA | | | 371,848 | |
| | 2,000 | | New York State Housing Finance Agency, Affordable Housing Revenue Bonds, Series 2007B, 5.300%, 11/01/37 (Alternative Minimum Tax) | 11/17 at 100.00 | | Aa2 | | | 2,110,320 | |
| | 2,000 | | New York State Housing Finance Agency, Affordable Housing Revenue Bonds, Series 2010A, 5.000%, 11/01/42 | 5/20 at 100.00 | | Aa2 | | | 2,159,520 | |
| | 690 | | New York State Housing Finance Agency, Affordable Housing Revenue, Series 2007A, 5.250%, 11/01/38 (Alternative Minimum Tax) | 11/17 at 100.00 | | Aa2 | | | 723,258 | |
| | 1,100 | | New York State Housing Finance Agency, Secured Mortgage Program Multifamily Housing Revenue Bonds, Series 1999I, 6.200%, 2/15/20 (Alternative Minimum Tax) | 8/13 at 100.00 | | Aa1 | | | 1,102,508 | |
| | 12,170 | | Total Housing/Multifamily | | | | | | 12,909,871 | |
| | | | Housing/Single Family – 3.2% (2.2% of Total Investments) | | | | | | | |
| | 2,295 | | New York State Mortgage Agency, Homeowner Mortgage Revenue Bonds, Series 130, 4.650%, 4/01/27 (Alternative Minimum Tax) | 4/15 at 100.00 | | Aa1 | | | 2,343,103 | |
| | 735 | | New York State Mortgage Agency, Homeowner Mortgage Revenue Bonds, Series 145, 5.125%, 10/01/37 (Alternative Minimum Tax) | 4/17 at 100.00 | | Aa1 | | | 763,628 | |
| | 850 | | New York State Mortgage Agency, Homeowner Mortgage Revenue Bonds, Series 148, 5.200%, 10/01/32 (Alternative Minimum Tax) | 10/17 at 100.00 | | Aa1 | | | 899,062 | |
| | | Nuveen New York Performance Plus Municipal Fund, Inc. (continued) |
| NNP | | Portfolio of Investments |
| | | March 31, 2013 (Unaudited) |
| | Principal | | | Optional Call | | | | | | |
| | Amount (000) | | Description (1) | Provisions (2) | | Ratings (3) | | | Value | |
| | | | Housing/Single Family (continued) | | | | | | | |
| $ | 2,475 | | New York State Mortgage Agency, Homeowner Mortgage Revenue Bonds, Series 97, 5.500%, 4/01/31 (Alternative Minimum Tax) | 5/13 at 100.00 | | Aa1 | | $ | 2,478,119 | |
| | 1,490 | | New York State Mortgage Agency, Mortgage Revenue Bonds, Thirty-Third Series A, 4.750%, 4/01/23 (Alternative Minimum Tax) | 4/15 at 100.00 | | Aaa | | | 1,506,509 | |
| | 7,845 | | Total Housing/Single Family | | | | | | 7,990,421 | |
| | | | Long-Term Care – 3.2% (2.2% of Total Investments) | | | | | | | |
| | 1,070 | | Dormitory Authority of the State of New York, GNMA Collateralized Revenue Bonds, Cabrini of Westchester Project, Series 2006, 5.200%, 2/15/41 | 2/17 at 103.00 | | AA+ | | | 1,160,415 | |
| | 645 | | Dormitory Authority of the State of New York, Non-State Supported Debt, Ozanam Hall of Queens Nursing Home Revenue Bonds, Series 2006, 5.000%, 11/01/31 | 11/16 at 100.00 | | Ba3 | | | 630,842 | |
| | | | Dormitory Authority of the State of New York, Revenue Bonds, Providence Rest, Series 2005: | | | | | | | |
| | 50 | | 5.125%, 7/01/30 – ACA Insured | 7/15 at 100.00 | | N/R | | | 49,320 | |
| | 425 | | 5.000%, 7/01/35 – ACA Insured | 7/15 at 100.00 | | N/R | | | 396,070 | |
| | 1,615 | | East Rochester Housing Authority, New York, Senior Living Revenue Bonds, Woodland Village Project, Series 2006, 5.500%, 8/01/33 | 8/16 at 101.00 | | N/R | | | 1,631,231 | |
| | 355 | | New York City Industrial Development Agency, New York, Civic Facility Revenue Bonds, Special Needs Facilities Pooled Program, Series 2000, 8.125%, 7/01/19 | 5/13 at 100.00 | | N/R | | | 355,746 | |
| | 795 | | New York City Industrial Development Agency, New York, Civic Facility Revenue Bonds, Special Needs Facilities Pooled Program, Series 2001A-1, 7.250%, 7/01/16 | 7/13 at 100.00 | | N/R | | | 798,585 | |
| | | | New York City Industrial Development Agency, New York, Civic Facility Revenue Bonds, Special Needs Facilities Pooled Program, Series 2008A-1: | | | | | | | |
| | 1,965 | | 5.500%, 7/01/18 | 7/16 at 101.00 | | N/R | | | 1,931,359 | |
| | 755 | | 5.800%, 7/01/23 | 7/16 at 101.00 | | N/R | | | 739,575 | |
| | 340 | | Suffolk County Industrial Development Agency, New York, Civic Facility Revenue Bonds, Special Needs Facilities Pooled Program, Series 2008-B1, 5.800%, 7/01/23 | 7/16 at 101.00 | | N/R | | | 333,054 | |
| | 8,015 | | Total Long-Term Care | | | | | | 8,026,197 | |
| | | | Materials – 0.2% (0.2% of Total Investments) | | | | | | | |
| | 575 | | Jefferson County Industrial Development Agency, New York, Solid Waste Disposal Revenue Bonds, International Paper Company Project, Series 2003A, 5.200%, 12/01/20 (Alternative Minimum Tax) | 12/13 at 100.00 | | BBB | | | 590,330 | |
| | | | Tax Obligation/General – 14.0% (9.5% of Total Investments) | | | | | | | |
| | 10,000 | | New York City, New York, General Obligation Bonds, Fiscal 2007 Series D-1, 5.125%, 12/01/26 (UB) | 12/17 at 100.00 | | AA | | | 11,662,500 | |
| | 400 | | New York City, New York, General Obligation Bonds, Fiscal 2009 Series E, 5.000%, 8/01/28 | 8/19 at 100.00 | | AA | | | 475,060 | |
| | 3,000 | | New York City, New York, General Obligation Bonds, Fiscal Series 2005F-1, 5.000%, 9/01/19 – SYNCORA GTY Insured | 9/15 at 100.00 | | AA | | | 3,325,920 | |
| | 6,400 | | New York City, New York, General Obligation Bonds, Fiscal Series 2006J-1, 5.000%, 6/01/25 (UB) | 6/16 at 100.00 | | AA | | | 7,198,848 | |
| | 1,800 | | New York City, New York, General Obligation Bonds, Series 2004C-1, 5.250%, 8/15/16 (UB) | 8/14 at 100.00 | | AA | | | 1,921,266 | |
| | | | New York City, New York, General Obligation Bonds, Subseries G-1 Fiscal Series 2012: | | | | | | | |
| | 4,365 | | 5.000%, 4/01/26 | 4/22 at 100.00 | | AA | | | 5,171,870 | |
| | 1,915 | | 5.000%, 4/01/29 | 4/22 at 100.00 | | AA | | | 2,217,819 | |
| | 2,500 | | New York City, New York, General Obligation Bonds, Series 2004E, 5.000%, 11/01/19 – AGM Insured (UB) | 11/14 at 100.00 | | AA | | | 2,682,275 | |
| | 30,380 | | Total Tax Obligation/General | | | | | | 34,655,558 | |
| | Principal | | | Optional Call | | | | | | |
| | Amount (000) | | Description (1) | Provisions (2) | | Ratings (3) | | | Value | |
| | | | Tax Obligation/Limited – 40.2% (27.5% of Total Investments) | | | | | | | |
| $ | 2,400 | | Battery Park City Authority, New York, Lease Revenue Bonds, Senior Lien Series 2003A, 5.000%, 11/01/23 | 11/13 at 100.00 | | AAA | | $ | 2,467,200 | |
| | 345 | | Dormitory Authority of the State of New York, Consolidated Revenue Bonds, City University System, Series 1993B, 6.000%, 7/01/14 – AGM Insured | No Opt. Call | | AA– | | | 357,520 | |
| | 1,000 | | Dormitory Authority of the State of New York, Revenue Bonds, Mental Health Services Facilities Improvements, Series 2005D-1, 5.000%, 8/15/23 – FGIC Insured | 2/15 at 100.00 | | AA– | | | 1,080,090 | |
| | 2,500 | | Dormitory Authority of the State of New York, Revenue Bonds, State University Educational Facilities, Series 1993A, 5.875%, 5/15/17 – FGIC Insured | No Opt. Call | | AA– | | | 2,916,975 | |
| | | | Dormitory Authority of the State of New York, State Personal Income Tax Revenue Bonds, General Purpose Series 2011C: | | | | | | | |
| | 1,000 | | 5.000%, 3/15/34 | No Opt. Call | | AAA | | | 1,128,270 | |
| | 4,500 | | 5.000%, 3/15/41 | 3/21 at 100.00 | | AAA | | | 5,026,856 | |
| | 35 | | Dormitory Authority of the State of New York, State Personal Income Tax Revenue Bonds, Series 2005F, 5.000%, 3/15/21 – AGM Insured | 3/15 at 100.00 | | AAA | | | 38,124 | |
| | 2,700 | | Hudson Yards Infrastructure Corporation, New York, Revenue Bonds, Senior Fiscal 2012 Series 2011A, 5.750%, 2/15/47 | 2/21 at 100.00 | | A | | | 3,166,263 | |
| | 500 | | Hudson Yards Infrastructure Corporation, New York, Revenue Bonds, Series 2006A, 5.000%, 2/15/47 | 2/17 at 100.00 | | A | | | 532,000 | |
| | 2,175 | | Metropolitan Transportation Authority, New York, State Service Contract Refunding Bonds, Series 2002A, 5.750%, 7/01/18 | No Opt. Call | | AA– | | | 2,688,431 | |
| | 1,680 | | Monroe Newpower Corporation, New York, Power Facilities Revenue Bonds, Series 2003, 5.500%, 1/01/34 | 1/15 at 100.00 | | BBB | | | 1,697,556 | |
| | | | New York City Sales Tax Asset Receivable Corporation, New York, Dedicated Revenue Bonds, Local Government Assistance Corporation, Series 2004A: | | | | | | | |
| | 2,670 | | 5.000%, 10/15/25 – NPFG Insured (UB) (4) | 10/14 at 100.00 | | AAA | | | 2,855,725 | |
| | 2,125 | | 5.000%, 10/15/26 – NPFG Insured (UB) (4) | 10/14 at 100.00 | | AAA | | | 2,271,434 | |
| | 2,475 | | 5.000%, 10/15/29 – AMBAC Insured (UB) (4) | 10/14 at 100.00 | | AAA | | | 2,634,514 | |
| | 3,100 | | New York City Transitional Finance Authority, New York, Building Aid Revenue Bonds, Fiscal Series 2007S-2, 5.000%, 1/15/28 – FGIC Insured | 1/17 at 100.00 | | AA– | | | 3,473,581 | |
| | | | New York City Transitional Finance Authority, New York, Future Tax Secured Bonds, Fiscal 2012 Series E-1: | | | | | | | |
| | 1,570 | | 5.000%, 2/01/35 | 2/22 at 100.00 | | AAA | | | 1,793,207 | |
| | 1,915 | | 5.000%, 2/01/37 | 2/22 at 100.00 | | AAA | | | 2,177,757 | |
| | 45 | | New York City Transitional Finance Authority, New York, Future Tax Secured Bonds, Fiscal Series 2003E, 5.000%, 2/01/23 | 5/13 at 100.00 | | AAA | | | 45,178 | |
| | 3,640 | | New York City Transitional Finance Authority, New York, Future Tax Secured Bonds, Fiscal Series 2007C-1, 5.000%, 11/01/27 | 11/17 at 100.00 | | AAA | | | 4,192,370 | |
| | 2,400 | | New York City Transitional Finance Authority, New York, Future Tax Secured Bonds, Tender Option Bond Trust 3545, 13.763%, 5/01/32 (IF) | 5/19 at 100.00 | | AAA | | | 3,395,256 | |
| | 2,500 | | New York City Transitional Finance Authority, New York, Future Tax Secured Revenue Bonds, Subordinate Lien Series 2011C, 5.500%, 11/01/35 | 11/20 at 100.00 | | AAA | | | 2,957,750 | |
| | 2,800 | | New York City Transitional Finance Authority, New York, Future Tax Secured Revenue Bonds, SubSeries 2011D-1, 5.000%, 2/01/28 | No Opt. Call | | AAA | | | 3,257,660 | |
| | 1,000 | | New York City, New York, Educational Construction Fund, Revenue Bonds, Series 2011A, 5.750%, 4/01/41 | 4/21 at 100.00 | | AA– | | | 1,203,480 | |
| | 1,000 | | New York State Environmental Facilities Corporation, Infrastructure Revenue Bonds, Series 2003A, 5.000%, 3/15/21 | 3/14 at 100.00 | | AA– | | | 1,042,450 | |
| | 5,000 | | New York State Environmental Facilities Corporation, State Personal Income Tax Revenue Bonds, Series 2008A, 5.000%, 12/15/27 (UB) | 12/17 at 100.00 | | AAA | | | 5,795,700 | |
| | 2,030 | | New York State Housing Finance Agency, State Personal Income Tax Revenue Bonds, Economic Development and Housing, Series 2006A, 5.000%, 3/15/36 | 9/15 at 100.00 | | AAA | | | 2,209,168 | |
| | | Nuveen New York Performance Plus Municipal Fund, Inc. (continued) |
| NNP | | Portfolio of Investments |
| | | March 31, 2013 (Unaudited) |
| | Principal | | | Optional Call | | | | | | |
| | Amount (000) | | Description (1) | Provisions (2) | | Ratings (3) | | | Value | |
| | | | Tax Obligation/Limited (continued) | | | | | | | |
| $ | 1,000 | | New York State Thruway Authority, Highway and Bridge Trust Fund Bonds, Second General, Series 2005B, 5.000%, 4/01/21 – AMBAC Insured | 10/15 at 100.00 | | AA | | $ | 1,107,920 | |
| | 2,800 | | New York State Thruway Authority, Highway and Bridge Trust Fund Bonds, Series 2007, 5.000%, 4/01/27 | 10/17 at 100.00 | | AA | | | 3,198,468 | |
| | 5,600 | | New York State Thruway Authority, Highway and Bridge Trust Fund Bonds, Series 2005B, 5.500%, 4/01/20 – AMBAC Insured (UB) (4) | No Opt. Call | | AA | | | 7,054,320 | |
| | 1,600 | | New York State Thruway Authority, State Personal Income Tax Revenue Bonds, Series 2010A, 5.000%, 3/15/29 | 9/20 at 100.00 | | AAA | | | 1,877,456 | |
| | 6,700 | | New York State Tobacco Settlement Financing Corporation, Tobacco Settlement Asset-Backed and State Contingency Contract-Backed Bonds, Series 2003A-1, 5.250%, 6/01/20 – AMBAC Insured | 6/13 at 100.00 | | AA– | | | 6,757,821 | |
| | 3,000 | | New York State Tobacco Settlement Financing Corporation, Tobacco Settlement Asset-Backed and State Contingency Contract-Backed Bonds, Series 2003B-1C, 5.500%, 6/01/21 | 6/13 at 100.00 | | AA– | | | 3,027,750 | |
| | 1,045 | | New York State Urban Development Corporation, State Personal Income Tax Revenue Bonds, Series 2005B, 5.000%, 3/15/30 – AGM Insured | 3/15 at 100.00 | | AAA | | | 1,085,671 | |
| | | | Puerto Rico Sales Tax Financing Corporation, Sales Tax Revenue Bonds, First Subordinate Series 2010A: | | | | | | | |
| | 9,000 | | 0.000%, 8/01/33 | 8/29 at 100.00 | | A+ | | | 7,083,270 | |
| | 1,950 | | 5.500%, 8/01/42 | 2/20 at 100.00 | | A+ | | | 2,004,054 | |
| | 21,400 | | Puerto Rico Sales Tax Financing Corporation, Sales Tax Revenue Bonds, Senior Series 2011C, 0.000%, 8/01/39 | No Opt. Call | | AA– | | | 4,862,936 | |
| | 10,000 | | Puerto Rico Sales Tax Financing Corporation, Sales Tax Revenue Bonds, Series 2007A, 0.000%, 8/01/45 – NPFG Insured | No Opt. Call | | AA– | | | 1,516,000 | |
| | 117,200 | | Total Tax Obligation/Limited | | | | | | 99,980,181 | |
| | | | Transportation – 12.5% (8.6% of Total Investments) | | | | | | | |
| | 1,500 | | Metropolitan Transportation Authority, New York, Transportation Revenue Bonds, Series 2003A, 5.000%, 11/15/15 – FGIC Insured | No Opt. Call | | A | | | 1,673,160 | |
| | 2,000 | | Metropolitan Transportation Authority, New York, Transportation Revenue Bonds, Series 2010D, 5.000%, 11/15/34 | 11/20 at 100.00 | | A | | | 2,219,800 | |
| | 2,000 | | New York City Industrial Development Agency, New York, Civic Facility Revenue Bonds, Bronx Parking Development Company, LLC Project, Series 2007, 5.875%, 10/01/46 (5) | 10/17 at 102.00 | | N/R | | | 843,200 | |
| | 1,985 | | New York City Industrial Development Agency, New York, Special Facilities Revenue Bonds, British Airways PLC, Series 1998, 5.250%, 12/01/32 (Alternative Minimum Tax) | 6/13 at 100.00 | | BB | | | 1,984,881 | |
| | 1,550 | | New York City Industrial Development Agency, New York, Special Facilities Revenue Bonds, Terminal One Group JFK Project, Series 2005, 5.500%, 1/01/24 (Alternative Minimum Tax) | 1/16 at 100.00 | | A3 | | | 1,709,123 | |
| | 1,420 | | New York Liberty Development Corporation, Liberty Revenue Bonds, 4 World Trade Center Project, Series 2011, 5.000%, 11/15/44 | 11/21 at 100.00 | | A+ | | | 1,562,426 | |
| | 215 | | New York State Thruway Authority, General Revenue Bonds, Series 2005F, 5.000%, 1/01/30 – AMBAC Insured | 1/15 at 100.00 | | A+ | | | 228,760 | |
| | 1,100 | | New York State Thruway Authority, General Revenue Bonds, Series 2005G, 5.000%, 1/01/30 – AGM Insured (UB) | 7/15 at 100.00 | | AA– | | | 1,187,604 | |
| | 3,380 | | New York State Thruway Authority, General Revenue Bonds, Series 2012I, 5.000%, 1/01/42 | 1/22 at 100.00 | | A+ | | | 3,715,262 | |
| | 1,000 | | Niagara Frontier Airport Authority, New York, Airport Revenue Bonds, Buffalo Niagara International Airport, Series 1999A, 5.625%, 4/01/29 – NPFG Insured (Alternative Minimum Tax) | 10/13 at 100.00 | | Baa2 | | | 1,011,280 | |
| | | | Port Authority of New York and New Jersey, Consolidated Revenue Bonds, One Hundred Fortieth Series 2005: | | | | | | | |
| | 2,300 | | 5.000%, 12/01/28 – SYNCORA GTY Insured | 6/15 at 101.00 | | AA– | | | 2,510,979 | |
| | 1,080 | | 5.000%, 12/01/31 – SYNCORA GTY Insured | 6/15 at 101.00 | | AA– | | | 1,168,398 | |
| | 770 | | Port Authority of New York and New Jersey, Consolidated Revenue Bonds, One Hundred Forty Eighth Series 2008, Trust 2920, 17.812%, 8/15/32 – AGM Insured (IF) | 8/17 at 100.00 | | AA– | | | 1,179,578 | |
| | Principal | | | Optional Call | | | | | | |
| | Amount (000) | | Description (1) | Provisions (2) | | Ratings (3) | | | Value | |
| | | | Transportation (continued) | | | | | | | |
| $ | 1,000 | | Port Authority of New York and New Jersey, Consolidated Revenue Bonds, One Hundred Sixty Sixth Series 2011, 5.000%, 1/15/41 | 1/21 at 100.00 | | AA– | | $ | 1,113,440 | |
| | | | Port Authority of New York and New Jersey, Special Project Bonds, JFK International Air Terminal LLC Project, Eighth Series 2010: | | | | | | | |
| | 520 | | 6.500%, 12/01/28 | 12/15 at 100.00 | | BBB– | | | 574,044 | |
| | 2,500 | | 6.000%, 12/01/36 | 12/20 at 100.00 | | BBB– | | | 2,928,350 | |
| | 2,040 | | Puerto Rico Ports Authority, Special Facilities Revenue Bonds, American Airlines Inc., Series 1996A, 6.250%, 6/01/26 (Alternative Minimum Tax) (5) | 6/13 at 100.00 | | N/R | | | 2,228,700 | |
| | 995 | | Triborough Bridge and Tunnel Authority, New York, Subordinate Lien General Purpose Revenue Refunding Bonds, Series 2002E, 5.250%, 11/15/22 – NPFG Insured | 5/13 at 100.00 | | A+ | | | 999,139 | |
| | 1,750 | | Triborough Bridge and Tunnel Authority, New York, Subordinate Lien General Purpose Revenue Refunding Bonds, Tender Option Bond Trust 1184, 9.325%, 5/15/16 (IF) | No Opt. Call | | AA– | | | 2,206,225 | |
| | 29,105 | | Total Transportation | | | | | | 31,044,349 | |
| | | | U.S. Guaranteed – 8.2% (5.6% of Total Investments) (6) | | | | | | | |
| | 1,250 | | Dormitory Authority of the State of New York, Revenue Bonds, South Nassau Communities Hospital, Series 2003B, 5.500%, 7/01/23 (Pre-refunded 7/01/13) | 7/13 at 100.00 | | Baa1 (6) | | | 1,266,975 | |
| | 900 | | Dormitory Authority of the State of New York, Revenue Bonds, Winthrop-South Nassau University Hospital Association, Series 2003A, 5.500%, 7/01/32 (Pre-refunded 7/01/13) | 7/13 at 100.00 | | Baa1 (6) | | | 912,105 | |
| | 655 | | Dormitory Authority of the State of New York, State Personal Income Tax Revenue Bonds, Series 2005F, 5.000%, 3/15/21 (Pre-refunded 3/15/15) – AGM Insured | 3/15 at 100.00 | | AA– (6) | | | 715,005 | |
| | 5,000 | | Metropolitan Transportation Authority, New York, Dedicated Tax Fund Bonds, Series 1998A, 4.500%, 4/01/18 (Pre-refunded 10/01/15) – FGIC Insured | 10/15 at 100.00 | | AA+ (6) | | | 5,511,150 | |
| | 255 | | New York State Urban Development Corporation, State Personal Income Tax Revenue Bonds, Series 2005B, 5.000%, 3/15/30 (Pre-refunded 3/15/15) – AGM Insured | 3/15 at 100.00 | | AA– (6) | | | 278,361 | |
| | 1,600 | | Triborough Bridge and Tunnel Authority, New York, General Purpose Revenue Bonds, Series 1993B, 5.000%, 1/01/20 (ETM) | No Opt. Call | | AA+ (6) | | | 1,954,576 | |
| | 7,500 | | Triborough Bridge and Tunnel Authority, New York, General Purpose Revenue Bonds, Series 1999B, 5.500%, 1/01/30 (Pre-refunded 1/01/22) | 1/22 at 100.00 | | AA+ (6) | | | 9,735,525 | |
| | 17,160 | | Total U.S. Guaranteed | | | | | | 20,373,697 | |
| | | | Utilities – 9.4% (6.4% of Total Investments) | | | | | | | |
| | 2,200 | | Chautauqua County Industrial Development Agency, New York, Exempt Facility Revenue Bonds, NRG Dunkirk Power Project, Series 2009, 5.875%, 4/01/42 | 2/20 at 100.00 | | Baa3 | | | 2,453,000 | |
| | 185 | | Guam Power Authority, Revenue Bonds, Series 2012A, 5.000%, 10/01/34 | 10/22 at 100.00 | | BBB | | | 203,772 | |
| | | | Long Island Power Authority, New York, Electric System General Revenue Bonds, Series 2006A: | | | | | | | |
| | 3,100 | | 5.000%, 12/01/23 – FGIC Insured | 6/16 at 100.00 | | A | | | 3,436,536 | |
| | 3,100 | | 5.000%, 12/01/24 – FGIC Insured | 6/16 at 100.00 | | A | | | 3,428,414 | |
| | 3,380 | | Long Island Power Authority, New York, Electric System Revenue Bonds, Series 2011A, 5.000%, 5/01/38 | 5/21 at 100.00 | | A | | | 3,668,720 | |
| | 2,300 | | Nassau County Industrial Development Authority, New York, Keyspan Glenwood Energy Project, Series 2003, 5.250%, 6/01/27 (Alternative Minimum Tax) | 6/13 at 100.00 | | A– | | | 2,316,146 | |
| | 2,745 | | Niagara Area Development Corporation, New York, Solid Waste Disposal Facility Revenue Refunding Bonds, Covanta Energy Project, Series 2012A, 5.250%, 11/01/42 | No Opt. Call | | BB+ | | | 2,829,436 | |
| | 820 | | Power Authority of the State of New York, General Revenue Bonds, Series 2006A, 5.000%, 11/15/19 – FGIC Insured | 11/15 at 100.00 | | Aa2 | | | 917,572 | |
| | 4,000 | | Suffolk County Industrial Development Agency, New York, Revenue Bonds, Nissequogue Cogeneration Partners Facility, Series 1998, 5.500%, 1/01/23 (Alternative Minimum Tax) | 7/13 at 100.00 | | N/R | | | 3,999,840 | |
| | 21,830 | | Total Utilities | | | | | | 23,253,436 | |
| | | Nuveen New York Performance Plus Municipal Fund, Inc. (continued) |
| NNP | | Portfolio of Investments |
| | | March 31, 2013 (Unaudited) |
| | Principal | | | Optional Call | | | | | | |
| | Amount (000) | | Description (1) | Provisions (2) | | Ratings (3) | | | Value | |
| | | | Water and Sewer – 9.4% (6.4% of Total Investments) | | | | | | | |
| $ | 1,995 | | Guam Government Waterworks Authority, Water and Wastewater System Revenue Bonds, Series 2010, 5.625%, 7/01/40 | 7/20 at 100.00 | | Ba2 | | $ | 2,117,673 | |
| | 3,000 | | New York City Municipal Water Finance Authority, New York, Water and Sewer System Revenue Bonds, Second Generation Resolution, Fiscal 2010 Series 2009BB, 5.000%, 6/15/27 | 6/19 at 100.00 | | AA+ | | | 3,575,910 | |
| | 12,000 | | New York City Municipal Water Finance Authority, New York, Water and Sewer System Revenue Bonds, Second Generation Resolution, Fiscal 2012 Series BB, 5.000%, 6/15/44 | 12/21 at 100.00 | | AA+ | | | 13,241,640 | |
| | 3,840 | | New York State Environmental Facilities Corporation, Revenue Bonds, State Revolving Funds Master Financing, Series 2010C, 5.000%, 10/15/35 | 4/20 at 100.00 | | AAA | | | 4,383,437 | |
| | 20,835 | | Total Water and Sewer | | | | | | 23,318,660 | |
| $ | 358,380 | | Total Investments (cost $337,110,589) – 146.1% | | | | | | 362,925,637 | |
| | | | Floating Rate Obligations – (13.9)% | | | | | | (34,645,000 | ) |
| | | | Variable Rate Demand Preferred Shares, at Liquidation Value – (35.8)% (7) | | | | | | (89,000,000 | ) |
| | | | Other Assets Less Liabilities – 3.6% | | | | | | 9,181,669 | |
| | | | Net Assets Applicable to Common Shares – 100% | | | | | $ | 248,462,306 | |
| (1) | | All percentages shown in the Portfolio of Investments are based on net assets applicable to Common shares unless otherwise noted. |
| (2) | | Optional Call Provisions: Dates (month and year) and prices of the earliest optional call or redemption. There may be other call provisions at varying prices at later dates. Certain mortgage-backed securities may be subject to periodic principal paydowns. |
| (3) | | Ratings: Using the highest of Standard & Poor’s Group (“Standard & Poor’s”), Moody’s Investors Service, Inc. (“Moody’s”) or Fitch, Inc. (“Fitch”) rating. Ratings below BBB by Standard & Poor’s, Baa by Moody’s or BBB by Fitch are considered to be below investment grade. Holdings designated N/R are not rated by any of these national rating agencies. |
| (4) | | Investment, or portion of investment, has been pledged to collateralize the net payment obligations for investments in inverse floating rate transactions. |
| (5) | | At or subsequent to the end of the reporting period, this security is non-income producing. Non-income producing security, in the case of a fixed-income security, generally denotes that the issuer has (1) defaulted on the payment of principal or interest, (2) is under the protection of the Federal Bankruptcy Court or (3) the Fund’s Adviser has concluded that the issue is not likely to meet its future interest payment obligations and has directed the Fund’s custodian to cease accruing additional income on the Fund’s records. |
| (6) | | Backed by an escrow or trust containing sufficient U.S. Government or U.S. Government agency securities, which ensure the timely payment of principal and interest. Certain bonds backed by U.S. Government or agency securities are regarded as having an implied rating equal to the rating of such securities. |
| (7) | | Variable Rate Demand Preferred Shares, at Liquidation Value as a percentage of Total Investments is 24.5%. |
| N/R | | Not rated. |
| (ETM) | | Escrowed to maturity. |
| (IF) | | Inverse floating rate investment. |
| (UB) | | Underlying bond of an inverse floating rate trust reflected as a financing transaction. See Notes to Financial Statements, Footnote 1 – General Information and Significant Accounting Policies, Inverse Floating Rate Securities for more information. |
See accompanying notes to financial statements.
| | | Nuveen New York Dividend Advantage Municipal Fund |
| NAN | | Portfolio of Investments |
| | | March 31, 2013 (Unaudited) |
| | Principal | | | Optional Call | | | | | | |
| | Amount (000) | | Description (1) | Provisions (2) | | Ratings (3) | | | Value | |
| | | | Consumer Discretionary – 3.1% (2.1% of Total Investments) | | | | | | | |
| $ | 950 | | New York City Industrial Development Agency, New York, Liberty Revenue Bonds, IAC/InterActiveCorp, Series 2005, 5.000%, 9/01/35 | 9/15 at 100.00 | | BBB | | $ | 991,382 | |
| | 3,350 | | Seneca Nation of Indians Capital Improvements Authority, New York, Special Obligation Bonds, Series 2007A, 5.000%, 12/01/23 | 6/17 at 100.00 | | BB | | | 3,530,130 | |
| | 4,300 | | Total Consumer Discretionary | | | | | | 4,521,512 | |
| | | | Consumer Staples – 3.0% (2.0% of Total Investments) | | | | | | | |
| | 205 | | New York Counties Tobacco Trust II, Tobacco Settlement Pass-Through Bonds, Series 2001, 5.250%, 6/01/25 | 6/13 at 100.00 | | A3 | | | 200,211 | |
| | 725 | | Puerto Rico, The Children’s Trust Fund, Tobacco Settlement Asset-Backed Refunding Bonds, Series 2002, 5.375%, 5/15/33 | 5/13 at 100.00 | | BBB+ | | | 733,164 | |
| | 135 | | Rensselaer Tobacco Asset Securitization Corporation, New York, Tobacco Settlement Asset-Backed Bonds, Series 2001A, 5.200%, 6/01/25 | 5/13 at 100.00 | | A3 | | | 133,670 | |
| | | | TSASC Inc., New York, Tobacco Asset-Backed Bonds, Series 2006: | | | | | | | |
| | 720 | | 4.750%, 6/01/22 | 6/16 at 100.00 | | BBB | | | 724,802 | |
| | 2,625 | | 5.000%, 6/01/26 | 6/16 at 100.00 | | BB– | | | 2,594,891 | |
| | 4,410 | | Total Consumer Staples | | | | | | 4,386,738 | |
| | | | Education and Civic Organizations – 17.2% (11.6% of Total Investments) | | | | | | | |
| | 380 | | Albany Industrial Development Agency, New York, Revenue Bonds, Albany Law School, Series 2007A, 5.000%, 7/01/31 | 7/17 at 100.00 | | BBB | | | 396,990 | |
| | 550 | | Albany Industrial Development Agency, New York, Revenue Bonds, Brighter Choice Charter Schools, Series 2007A, 5.000%, 4/01/37 | 4/17 at 100.00 | | BB+ | | | 538,703 | |
| | 1,725 | | Brooklyn Arena Local Development Corporation, New York, Payment in Lieu of Taxes Revenue Bonds, Barclays Center Project, Series 2009, 6.250%, 7/15/40 | 1/20 at 100.00 | | BBB– | | | 2,066,740 | |
| | 965 | | Buffalo and Erie County Industrial Land Development Corporation, New York, Tax-Exempt Revenue Bonds, Enterprise Charter School Project, Series 2011A, 7.500%, 12/01/40 | 12/20 at 100.00 | | BBB– | | | 1,131,887 | |
| | 120 | | Cattaraugus County Industrial Development Agency, New York, Revenue Bonds, St. Bonaventure University, Series 2006, 5.000%, 5/01/23 | 5/16 at 100.00 | | BBB– | | | 124,337 | |
| | 1,635 | | Dormitory Authority of the State of New York, General Revenue Bonds, Manhattan College, Series 2007A, 5.000%, 7/01/41 – RAAI Insured | 7/17 at 100.00 | | N/R | | | 1,678,998 | |
| | 1,000 | | Dormitory Authority of the State of New York, Lease Revenue Bonds, State University Dormitory Facilities, Series 2003B, 5.250%, 7/01/32 (Mandatory put 7/01/13) – SYNCORA GTY Insured | No Opt. Call | | Aa2 | | | 1,012,990 | |
| | 705 | | Dormitory Authority of the State of New York, Lease Revenue Bonds, State University Dormitory Facilities, Series 2004A, 5.000%, 7/01/29 – NPFG Insured | 7/15 at 100.00 | | Aa2 | | | 759,003 | |
| | 700 | | Dormitory Authority of the State of New York, Revenue Bonds, New School University, Series 2010, 5.250%, 7/01/30 | 7/20 at 100.00 | | A– | | | 782,880 | |
| | 1,000 | | Dormitory Authority of the State of New York, Revenue Bonds, Non State Supported Debt, Cornell University, Series 2010A, 5.000%, 7/01/40 | 7/20 at 100.00 | | Aa1 | | | 1,135,470 | |
| | 680 | | Dormitory Authority of the State of New York, Revenue Bonds, St. Joseph’s College, Series 2010, 5.250%, 7/01/35 | 7/20 at 100.00 | | Baa1 | | | 751,298 | |
| | 1,630 | | Dutchess County Industrial Development Agency, New York, Civic Facility Revenue Bonds, Bard College Project, Series 2007-A2, 4.500%, 8/01/36 | 8/17 at 100.00 | | Baa1 | | | 1,662,437 | |
| | 1,300 | | Dutchess County Industrial Development Agency, New York, Civic Facility Revenue Bonds, Bard College Refunding, Series 2007-A1, 5.000%, 8/01/46 | 8/17 at 100.00 | | Baa1 | | | 1,354,015 | |
| | 370 | | Hempstead Town Industrial Development Agency, New York, Revenue Bonds, Adelphi University, Civic Facility Project, Series 2005, 5.000%, 10/01/35 | 10/15 at 100.00 | | A | | | 395,156 | |
| | 250 | | Hempstead Town Local Development Corporation, New York, Revenue Bonds, Adelphi University Project, Series 2009B, 5.250%, 2/01/39 | 2/19 at 100.00 | | A | | | 274,375 | |
| | 1,085 | | Hempstead Town Local Development Corporation, New York, Revenue Bonds, Molloy College Project, Series 2009, 5.750%, 7/01/39 | 7/19 at 100.00 | | BBB+ | | | 1,225,301 | |
| | 330 | | New York City Industrial Development Agency, New York, Civic Facility Revenue Bonds, St. Francis College, Series 2004, 5.000%, 10/01/34 | 10/14 at 100.00 | | A– | | | 337,673 | |
| | | Nuveen New York Dividend Advantage Municipal Fund (continued) |
| NAN | | Portfolio of Investments |
| | | March 31, 2013 (Unaudited) |
| | Principal | | | Optional Call | | | | | | |
| | Amount (000) | | Description (1) | Provisions (2) | | Ratings (3) | | | Value | |
| | | | Education and Civic Organizations (continued) | | | | | | | |
| $ | 335 | | New York City Industrial Development Agency, New York, Civic Facility Revenue Bonds, Vaughn College of Aeronautics, Series 2006A, 5.000%, 12/01/28 | 12/16 at 100.00 | | BB+ | | $ | 350,407 | |
| | | | New York City Industrial Development Agency, New York, PILOT Revenue Bonds, Queens Baseball Stadium Project, Series 2006: | | | | | | | |
| | 160 | | 5.000%, 1/01/36 – AMBAC Insured | 1/17 at 100.00 | | Ba1 | | | 163,670 | |
| | 1,000 | | 5.000%, 1/01/39 – AMBAC Insured | 1/17 at 100.00 | | Ba1 | | | 1,018,080 | |
| | 1,630 | | 4.750%, 1/01/42 – AMBAC Insured | 1/17 at 100.00 | | Ba1 | | | 1,630,994 | |
| | | | New York City Industrial Development Authority, New York, PILOT Revenue Bonds, Yankee Stadium Project, Series 2006: | | | | | | | |
| | 2,240 | | 4.500%, 3/01/39 – FGIC Insured | 9/16 at 100.00 | | BBB | | | 2,262,086 | |
| | 1,000 | | 4.750%, 3/01/46 – NPFG Insured | 9/16 at 100.00 | | BBB | | | 1,018,110 | |
| | 1,000 | | New York City Trust for Cultural Resources, New York, Revenue Bonds, Whitney Museum of American Art, Series 2011, 5.000%, 7/01/31 | 1/21 at 100.00 | | A | | | 1,110,780 | |
| | 245 | | Seneca County Industrial Development Authority, New York, Revenue Bonds, New York Chiropractic College, Series 2007, 5.000%, 10/01/27 | 10/17 at 100.00 | | BBB | | | 259,994 | |
| | 1,050 | | St. Lawrence County Industrial Development Agency Civic Development Corporation, New York, Revenue Bonds, Clarkson University Project, Series 2012A, 5.250%, 9/01/33 | 3/22 at 100.00 | | A3 | | | 1,197,998 | |
| | 535 | | Troy Capital Resource Corporation, New York, Revenue Bonds, Rensselaer Polytechnic Institute, Series 2010A, 5.125%, 9/01/40 | 9/20 at 100.00 | | A– | | | 585,723 | |
| | 23,620 | | Total Education and Civic Organizations | | | | | | 25,226,095 | |
| | | | Financials – 2.3% (1.6% of Total Investments) | | | | | | | |
| | 1,100 | | Liberty Development Corporation, New York, Goldman Sachs Headquarter Revenue Bonds, Series 2005, 5.250%, 10/01/35 | No Opt. Call | | A | | | 1,289,244 | |
| | 1,740 | | Liberty Development Corporation, New York, Goldman Sachs Headquarters Revenue Bonds Series 2007, 5.500%, 10/01/37 | No Opt. Call | | A | | | 2,109,820 | |
| | 2,840 | | Total Financials | | | | | | 3,399,064 | |
| | | | Health Care – 18.4% (12.5% of Total Investments) | | | | | | | |
| | 995 | | Dormitory Authority of the State of New York, FHA-Insured Mortgage Hospital Revenue Bonds, Memorial Hospital of William F. and Gertrude F. Jones Inc., Series 1999, 5.250%, 8/01/19 – NPFG Insured | 8/13 at 100.00 | | Baa2 | | | 999,080 | |
| | 625 | | Dormitory Authority of the State of New York, FHA-Insured Mortgage Revenue Bonds, Montefiore Hospital, Series 2004, 5.000%, 8/01/29 – FGIC Insured | 2/15 at 100.00 | | N/R | | | 662,475 | |
| | 3,600 | | Dormitory Authority of the State of New York, FHA-Insured Revenue Bonds, St. Lukes Roosevelt Hospital, Series 2005, 4.900%, 8/15/31 | 8/15 at 100.00 | | N/R | | | 3,846,744 | |
| | 200 | | Dormitory Authority of the State of New York, Highland Hospital of Rochester Revenue Bonds, Series 2010, 5.200%, 7/01/32 | 7/20 at 100.00 | | A2 | | | 219,692 | |
| | | | Dormitory Authority of the State of New York, Insured Revenue Bonds, Franciscan Health Partnership Obligated Group – Frances Shervier Home and Hospital, Series 1997: | | | | | | | |
| | 1,505 | | 5.500%, 7/01/17 – RAAI Insured | 7/13 at 100.00 | | A3 | | | 1,508,958 | |
| | 2,000 | | 5.500%, 7/01/27 – RAAI Insured | 7/13 at 100.00 | | A3 | | | 2,002,560 | |
| | 1,000 | | Dormitory Authority of the State of New York, North Shore Long Island Jewish Obligated Group Revenue Bonds, Series 2011A, 5.000%, 5/01/41 | 5/21 at 100.00 | | A– | | | 1,115,700 | |
| | 3,160 | | Dormitory Authority of the State of New York, Revenue Bonds, Memorial Sloan Kettering Cancer Center, Series 2006, 5.000%, 7/01/35 (UB) | 7/16 at 100.00 | | AA | | | 3,462,760 | |
| | 1,245 | | Dormitory Authority of the State of New York, Revenue Bonds, New York and Presbyterian Hospital, Series 2004A, 5.250%, 8/15/15 – AGM Insured | 8/14 at 100.00 | | AA– | | | 1,331,303 | |
| | 1,000 | | Dormitory Authority of the State of New York, Revenue Bonds, North Shore Long Island Jewish Obligated Group, Series 2005A, 5.000%, 11/01/34 | 11/16 at 100.00 | | A3 | | | 1,051,390 | |
| | 2,000 | | Dormitory Authority of the State of New York, Revenue Bonds, NYU Hospitals Center, Series 2007B, 5.625%, 7/01/37 | 7/17 at 100.00 | | A– | | | 2,176,160 | |
| | 750 | | Dormitory Authority of the State of New York, Revenue Bonds, NYU Hospitals Center, Series 2011A, 6.000%, 7/01/40 | 7/20 at 100.00 | | A– | | | 876,285 | |
| | 420 | | Livingston County Industrial Development Agency, New York, Civic Facility Revenue Bonds, Nicholas H. Noyes Hospital, Series 2005, 6.000%, 7/01/30 | 5/13 at 100.00 | | BB | | | 420,441 | |
| | Principal | | | Optional Call | | | | | | |
| | Amount (000) | | Description (1) | Provisions (2) | | Ratings (3) | | | Value | |
| | | | Health Care (continued) | | | | | | | |
| | | | Madison County Industrial Development Agency, New York, Civic Facility Revenue Bonds, Oneida Health System, Series 2007A: | | | | | | | |
| $ | 410 | | 5.250%, 2/01/27 | 2/17 at 100.00 | | BBB– | | $ | 418,290 | |
| | 360 | | 5.500%, 2/01/32 | 2/17 at 100.00 | | BBB– | | | 368,784 | |
| | 715 | | Monroe County Industrial Development Corporation, New York, FHA Insured Mortgage Revenue Bonds, Unity Hospital of Rochester Project, Series 2010, 5.750%, 8/15/35 | 2/21 at 100.00 | | Aa2 | | | 858,450 | |
| | 1,750 | | New York City Health and Hospitals Corporation, New York, Health System Revenue Bonds, Series 2003A, 5.250%, 2/15/22 – AMBAC Insured | 4/13 at 100.00 | | A+ | | | 1,755,950 | |
| | 470 | | Suffolk County Economic Development Corp / Nassau County Local Economic Assistance & Financing Corp., New York, Revenue Bonds, Catholic Health Services of Long Island Obligated Group Project, Series 2011, 5.000%, 7/01/28 | 7/21 at 100.00 | | A– | | | 532,223 | |
| | 2,460 | | Yates County Industrial Development Agency, New York, FHA-Insured Civic Facility Mortgage Revenue Bonds, Soldiers and Sailors Memorial Hospital, Series 1999A, 5.650%, 2/01/39 | 8/13 at 100.00 | | N/R | | | 2,485,855 | |
| | 950 | | Yonkers Industrial Development Agency, New York, Revenue Bonds, St. John’s Riverside Hospital, Series 2001A, 7.125%, 7/01/31 | 7/13 at 100.00 | | B+ | | | 951,530 | |
| | 25,615 | | Total Health Care | | | | | | 27,044,630 | |
| | | | Housing/Multifamily – 6.6% (4.4% of Total Investments) | | | | | | | |
| | 400 | | Canton Capital Resource Corporation, New York, Student Housing Facility Revenue Bonds, Grasse River LLC at SUNY Canton Project Series 2010A, 5.000%, 5/01/40 | 5/20 at 100.00 | | AA– | | | 435,152 | |
| | 2,585 | | New York City Housing Development Corporation, New York, Capital Fund Program Revenue Bonds, Series 2005A, 5.000%, 7/01/25 – NPFG Insured (UB) (4) | 7/15 at 100.00 | | AA– | | | 2,799,839 | |
| | 750 | | New York City Housing Development Corporation, New York, Multifamily Housing Revenue Bonds, Series 2004A, 5.250%, 11/01/30 | 5/14 at 100.00 | | AA | | | 765,450 | |
| | 4,000 | | New York City Housing Development Corporation, New York, Multifamily Housing Revenue Bonds, Series 2009J, 4.800%, 5/01/36 | 5/19 at 100.00 | | AA | | | 4,264,840 | |
| | 290 | | New York City Housing Development Corporation, New York, Multifamily Housing Revenue Bonds, Series 2010D-1A, 5.000%, 11/01/42 | 5/20 at 100.00 | | AA | | | 312,568 | |
| | 600 | | New York State Housing Finance Agency, Affordable Housing Revenue Bonds, Series 2009B, 4.500%, 11/01/29 | 5/19 at 100.00 | | Aa2 | | | 651,492 | |
| | 405 | | New York State Housing Finance Agency, Affordable Housing Revenue, Series 2007A, 5.250%, 11/01/38 (Alternative Minimum Tax) | 11/17 at 100.00 | | Aa2 | | | 424,521 | |
| | 9,030 | | Total Housing/Multifamily | | | | | | 9,653,862 | |
| | | | Housing/Single Family – 2.6% (1.8% of Total Investments) | | | | | | | |
| | 645 | | Guam Housing Corporation, Mortgage-Backed Securities Program Single Family Mortgage Revenue Bonds, Series 1998A, 5.750%, 9/01/31 (Alternative Minimum Tax) | No Opt. Call | | N/R | | | 692,911 | |
| | 1,350 | | New York State Mortgage Agency, Homeowner Mortgage Revenue Bonds, Series 130, 4.650%, 4/01/27 (Alternative Minimum Tax) | 4/15 at 100.00 | | Aa1 | | | 1,378,296 | |
| | 430 | | New York State Mortgage Agency, Homeowner Mortgage Revenue Bonds, Series 145, 5.125%, 10/01/37 (Alternative Minimum Tax) | 4/17 at 100.00 | | Aa1 | | | 446,749 | |
| | 495 | | New York State Mortgage Agency, Homeowner Mortgage Revenue Bonds, Series 148, 5.200%, 10/01/32 (Alternative Minimum Tax) | 10/17 at 100.00 | | Aa1 | | | 523,571 | |
| | 755 | | New York State Mortgage Agency, Mortgage Revenue Bonds, Thirty-Third Series A, 4.750%, 4/01/23 (Alternative Minimum Tax) | 4/15 at 100.00 | | Aaa | | | 763,365 | |
| | 3,675 | | Total Housing/Single Family | | | | | | 3,804,892 | |
| | | | Long-Term Care – 4.8% (3.2% of Total Investments) | | | | | | | |
| | 2,000 | | Dormitory Authority of the State of New York, FHA-Insured Nursing Home Mortgage Revenue Bonds, Gurwin Jewish Geriatric Center of Long Island, Series 2005A, 4.900%, 2/15/41 | 2/15 at 100.00 | | AA | | | 2,109,520 | |
| | 585 | | Dormitory Authority of the State of New York, GNMA Collateralized Revenue Bonds, Cabrini of Westchester Project, Series 2006, 5.200%, 2/15/41 | 2/17 at 103.00 | | AA+ | | | 634,433 | |
| | 375 | | Dormitory Authority of the State of New York, Non-State Supported Debt, Ozanam Hall of Queens Nursing Home Revenue Bonds, Series 2006, 5.000%, 11/01/31 | 11/16 at 100.00 | | Ba3 | | | 366,769 | |
| | 250 | | Dormitory Authority of the State of New York, Revenue Bonds, Providence Rest, Series 2005, 5.000%, 7/01/35 – ACA Insured | 7/15 at 100.00 | | N/R | | | 232,983 | |
| | | Nuveen New York Dividend Advantage Municipal Fund (continued) |
| NAN | | Portfolio of Investments |
| | | March 31, 2013 (Unaudited) |
| | Principal | | | Optional Call | | | | | | |
| | Amount (000) | | Description (1) | Provisions (2) | | Ratings (3) | | | Value | |
| | | | Long-Term Care (continued) | | | | | | | |
| $ | 960 | | East Rochester Housing Authority, New York, Senior Living Revenue Bonds, Woodland Village Project, Series 2006, 5.500%, 8/01/33 | 8/16 at 101.00 | | N/R | | $ | 969,648 | |
| | 175 | | New York City Industrial Development Agency, New York, Civic Facility Revenue Bonds, Special Needs Facilities Pooled Program, Series 2000, 8.125%, 7/01/19 | 5/13 at 100.00 | | N/R | | | 175,368 | |
| | 440 | | New York City Industrial Development Agency, New York, Civic Facility Revenue Bonds, Special Needs Facilities Pooled Program, Series 2001A-1, 7.250%, 7/01/16 | 7/13 at 100.00 | | N/R | | | 441,984 | |
| | | | New York City Industrial Development Agency, New York, Civic Facility Revenue Bonds, Special Needs Facilities Pooled Program, Series 2008A-1: | | | | | | | |
| | 1,140 | | 5.500%, 7/01/18 | 7/16 at 101.00 | | N/R | | | 1,120,483 | |
| | 635 | | 5.800%, 7/01/23 | 7/16 at 101.00 | | N/R | | | 622,027 | |
| | 325 | | Yonkers Industrial Development Agency, New York, FHA-Insured Mortgage Revenue Bonds, Michael Malotz Skilled Nursing Pavilion, Series 1999, 5.450%, 2/01/29 – NPFG Insured | 8/13 at 100.00 | | Baa2 | | | 325,611 | |
| | 6,885 | | Total Long-Term Care | | | | | | 6,998,826 | |
| | | | Materials – 0.2% (0.2% of Total Investments) | | | | | | | |
| | 330 | | Jefferson County Industrial Development Agency, New York, Solid Waste Disposal Revenue Bonds, International Paper Company Project, Series 2003A, 5.200%, 12/01/20 (Alternative Minimum Tax) | 12/13 at 100.00 | | BBB | | | 338,798 | |
| | | | Tax Obligation/General – 15.9% (10.8% of Total Investments) | | | | | | | |
| | 6,590 | | New York City, New York, General Obligation Bonds, Fiscal 2007 Series D-1, 5.125%, 12/01/25 (UB) | 12/17 at 100.00 | | AA | | | 7,714,913 | |
| | 2,000 | | New York City, New York, General Obligation Bonds, Fiscal 2010 Series C, 5.000%, 8/01/23 | 8/19 at 100.00 | | AA | | | 2,427,180 | |
| | 980 | | New York City, New York, General Obligation Bonds, Fiscal 2012 Series I, 5.000%, 8/01/32 | 8/22 at 100.00 | | AA | | | 1,127,833 | |
| | 3,700 | | New York City, New York, General Obligation Bonds, Fiscal Series 2007A, 5.000%, 8/01/25 | 8/16 at 100.00 | | AA | | | 4,183,590 | |
| | 1,000 | | New York City, New York, General Obligation Bonds, Series 2004C-1, 5.250%, 8/15/16 (UB) | 8/14 at 100.00 | | AA | | | 1,067,370 | |
| | | | New York City, New York, General Obligation Bonds, Subseries G-1 Fiscal Series 2012: | | | | | | | |
| | 3,300 | | 5.000%, 4/01/26 | 4/22 at 100.00 | | AA | | | 3,910,005 | |
| | 1,025 | | 5.000%, 4/01/29 | 4/22 at 100.00 | | AA | | | 1,187,083 | |
| | | | Rochester, New York, General Obligation Bonds, Series 1999: | | | | | | | |
| | 720 | | 5.250%, 10/01/18 – NPFG Insured | No Opt. Call | | Aa3 | | | 870,070 | |
| | 720 | | 5.250%, 10/01/19 – NPFG Insured | No Opt. Call | | Aa3 | | | 882,418 | |
| | 20,035 | | Total Tax Obligation/General | | | | | | 23,370,462 | |
| | | | Tax Obligation/Limited – 38.5% (26.0% of Total Investments) | | | | | | | |
| | 1,000 | | Battery Park City Authority, New York, Lease Revenue Bonds, Senior Lien Series 2003A, 5.250%, 11/01/21 | 11/13 at 100.00 | | AAA | | | 1,030,200 | |
| | 590 | | Dormitory Authority of the State of New York, Department of Health Revenue Bonds, Series 2005A, 5.250%, 7/01/24 – CIFG Insured | 7/15 at 100.00 | | AA– | | | 648,428 | |
| | 1,850 | | Dormitory Authority of the State of New York, Secured Hospital Revenue Refunding Bonds, Wyckoff Heights Medical Center, Series 1998H, 5.300%, 8/15/21 – NPFG Insured | 8/13 at 100.00 | | AA– | | | 1,857,585 | |
| | 3,000 | | Dormitory Authority of the State of New York, State Personal Income Tax Revenue Bonds, General Purpose Series 2011C, 5.000%, 3/15/41 | 3/21 at 100.00 | | AAA | | | 3,351,240 | |
| | 10 | | Dormitory Authority of the State of New York, State Personal Income Tax Revenue Bonds, Series 2005F, 5.000%, 3/15/21 – AGM Insured | 3/15 at 100.00 | | AAA | | | 10,893 | |
| | 1,130 | | Monroe Newpower Corporation, New York, Power Facilities Revenue Bonds, Series 2003, 5.500%, 1/01/34 | 1/15 at 100.00 | | BBB | | | 1,141,809 | |
| | | | New York City Sales Tax Asset Receivable Corporation, New York, Dedicated Revenue Bonds, Local Government Assistance Corporation, Series 2004A: | | | | | | | |
| | 1,100 | | 5.000%, 10/15/25 – NPFG Insured (UB) (4) | 10/14 at 100.00 | | AAA | | | 1,176,516 | |
| | 810 | | 5.000%, 10/15/26 – NPFG Insured (UB) (4) | 10/14 at 100.00 | | AAA | | | 865,817 | |
| | 2,375 | | 5.000%, 10/15/29 – AMBAC Insured (UB) (4) | 10/14 at 100.00 | | AAA | | | 2,528,069 | |
| | 2,100 | | New York City Transitional Finance Authority, New York, Building Aid Revenue Bonds, Fiscal Series 2007S-2, 5.000%, 1/15/28 – FGIC Insured | 1/17 at 100.00 | | AA– | | | 2,353,071 | |
| | | | New York City Transitional Finance Authority, New York, Future Tax Secured Bonds, Fiscal 2012 Series E-1: | | | | | | | |
| | 840 | | 5.000%, 2/01/35 | 2/22 at 100.00 | | AAA | | | 959,423 | |
| | 1,025 | | 5.000%, 2/01/37 | 2/22 at 100.00 | | AAA | | | 1,165,640 | |
| | Principal | | | Optional Call | | | | | | |
| | Amount (000) | | Description (1) | Provisions (2) | | Ratings (3) | | | Value | |
| | | | Tax Obligation/Limited (continued) | | | | | | | |
| $ | 30 | | New York City Transitional Finance Authority, New York, Future Tax Secured Bonds, Fiscal Series 2003E, 5.000%, 2/01/23 – FGIC Insured | 5/13 at 100.00 | | AAA | | $ | 30,119 | |
| | 2,115 | | New York City Transitional Finance Authority, New York, Future Tax Secured Bonds, Fiscal Series 2007C-1, 5.000%, 11/01/27 | 11/17 at 100.00 | | AAA | | | 2,435,951 | |
| | | | New York City Transitional Finance Authority, New York, Future Tax Secured Revenue Bonds, Subordinate Lien Series 2011C: | | | | | | | |
| | 2,500 | | 5.500%, 11/01/35 | 11/20 at 100.00 | | AAA | | | 2,957,750 | |
| | 2,000 | | 5.000%, 11/01/39 | 11/20 at 100.00 | | AAA | | | 2,234,440 | |
| | 1,000 | | New York City Transitional Finance Authority, New York, Future Tax Secured Revenue Bonds, SubSeries 2011D-1, 5.250%, 2/01/30 | 2/21 at 100.00 | | AAA | | | 1,177,160 | |
| | 4,000 | | New York City, New York, Educational Construction Fund, Revenue Bonds, Series 2011A, 5.750%, 4/01/41 | 4/21 at 100.00 | | AA– | | | 4,813,915 | |
| | 1,000 | | New York State Environmental Facilities Corporation, Infrastructure Revenue Bonds, Series 2003A, 5.000%, 3/15/21 | 3/14 at 100.00 | | AA– | | | 1,042,450 | |
| | 2,920 | | New York State Environmental Facilities Corporation, State Personal Income Tax Revenue Bonds, Series 2008A, 5.000%, 12/15/26 (UB) | 12/17 at 100.00 | | AAA | | | 3,391,317 | |
| | 1,190 | | New York State Housing Finance Agency, State Personal Income Tax Revenue Bonds, Economic Development and Housing, Series 2006A, 5.000%, 3/15/36 | 9/15 at 100.00 | | AAA | | | 1,295,029 | |
| | 1,000 | | New York State Thruway Authority, Highway and Bridge Trust Fund Bonds, Second General, Series 2005B, 5.000%, 4/01/21 – AMBAC Insured | 10/15 at 100.00 | | AA | | | 1,107,920 | |
| | 1,625 | | New York State Thruway Authority, Highway and Bridge Trust Fund Bonds, Series 2007, 5.000%, 4/01/27 | 10/17 at 100.00 | | AA | | | 1,856,254 | |
| | 3,400 | | New York State Thruway Authority, Highway and Bridge Trust Fund Bonds, Series 2005B, 5.500%, 4/01/20 – AMBAC Insured (UB) (4) | No Opt. Call | | AA | | | 4,282,980 | |
| | 510 | | New York State Thruway Authority, State Personal Income Tax Revenue Bonds, Series 2010A, 5.000%, 3/15/29 | 9/20 at 100.00 | | AAA | | | 598,439 | |
| | | | New York State Tobacco Settlement Financing Corporation, Tobacco Settlement Asset-Backed and State Contingency Contract-Backed Bonds, Series 2003A-1: | | | | | | | |
| | 4,000 | | 5.250%, 6/01/20 – AMBAC Insured | 6/13 at 100.00 | | AA– | | | 4,034,520 | |
| | 2,000 | | 5.250%, 6/01/22 – AMBAC Insured | 6/13 at 100.00 | | AA– | | | 2,017,040 | |
| | 1,000 | | New York State Tobacco Settlement Financing Corporation, Tobacco Settlement Asset-Backed and State Contingency Contract-Backed Bonds, Series 2003B-1C, 5.500%, 6/01/21 | 6/13 at 100.00 | | AA– | | | 1,009,250 | |
| | 1,330 | | New York State Urban Development Corporation, State Personal Income Tax Revenue Bonds, Tender Option Bond Trust 09-6W, 13.825%, 3/15/37 (IF) (4) | 3/17 at 100.00 | | AAA | | | 1,794,542 | |
| | 3,000 | | Puerto Rico Sales Tax Financing Corporation, Sales Tax Revenue Bonds, First Subordinate Series 2010A, 0.000%, 8/01/33 | 8/29 at 100.00 | | A+ | | | 2,361,090 | |
| | 4,000 | | Puerto Rico Sales Tax Financing Corporation, Sales Tax Revenue Bonds, Senior Series 2011C, 0.000%, 8/01/39 | No Opt. Call | | AA– | | | 908,960 | |
| | 54,450 | | Total Tax Obligation/Limited | | | | | | 56,437,817 | |
| | | | Transportation – 18.0% (12.1% of Total Investments) | | | | | | | |
| | 2,000 | | Metropolitan Transportation Authority, New York, Transportation Revenue Bonds, Series 2003A, 5.000%, 11/15/25 – AGM Insured | 11/13 at 100.00 | | AA– | | | 2,054,740 | |
| | 3,000 | | Metropolitan Transportation Authority, New York, Transportation Revenue Bonds, Series 2007B, 5.000%, 11/15/33 | 11/17 at 100.00 | | A | | | 3,323,580 | |
| | 1,000 | | Metropolitan Transportation Authority, New York, Transportation Revenue Bonds, Series 2010D, 5.000%, 11/15/34 | 11/20 at 100.00 | | A | | | 1,109,900 | |
| | 1,560 | | Metropolitan Transportation Authority, New York, Transportation Revenue Bonds, Series 2012C, 5.000%, 11/15/41 | 11/22 at 100.00 | | A | | | 1,722,318 | |
| | 1,750 | | New York City Industrial Development Agency, New York, American Airlines-JFK International Airport Special Facility Revenue Bonds, Series 2005, 7.750%, 8/01/31 (Alternative Minimum Tax) | 8/16 at 101.00 | | N/R | | | 2,008,143 | |
| | | | New York City Industrial Development Agency, New York, Civic Facility Revenue Bonds, Bronx Parking Development Company, LLC Project, Series 2007: | | | | | | | |
| | 200 | | 5.750%, 10/01/37 (5) | 10/17 at 100.00 | | N/R | | | 84,334 | |
| | 2,000 | | 5.875%, 10/01/46 (5) | 10/17 at 102.00 | | N/R | | | 843,200 | |
| | | Nuveen New York Dividend Advantage Municipal Fund (continued) |
| NAN | | Portfolio of Investments |
| | | March 31, 2013 (Unaudited) |
| | Principal | | | Optional Call | | | | | | |
| | Amount (000) | | Description (1) | Provisions (2) | | Ratings (3) | | | Value | |
| | | | Transportation (continued) | | | | | | | |
| $ | 105 | | New York City Industrial Development Agency, New York, Special Facilities Revenue Bonds, British Airways PLC, Series 1998, 5.250%, 12/01/32 (Alternative Minimum Tax) | 6/13 at 100.00 | | BB | | $ | 104,994 | |
| | 1,000 | | New York City Industrial Development Agency, New York, Special Facilities Revenue Bonds, JFK Airport – American Airlines Inc., Series 2002B, 8.500%, 8/01/28 (Alternative Minimum Tax) | 8/13 at 100.50 | | N/R | | | 1,105,000 | |
| | 900 | | New York City Industrial Development Agency, New York, Special Facilities Revenue Bonds, Terminal One Group JFK Project, Series 2005, 5.500%, 1/01/24 (Alternative Minimum Tax) | 1/16 at 100.00 | | A3 | | | 992,394 | |
| | | | New York City Industrial Development Agency, New York, Special Facility Revenue Bonds, JetBlue Airways Corporation Project, Series 2006: | | | | | | | |
| | 410 | | 5.000%, 5/15/20 (Alternative Minimum Tax) | 5/13 at 100.00 | | B– | | | 409,975 | |
| | 1,000 | | 5.125%, 5/15/30 (Alternative Minimum Tax) | 5/13 at 100.00 | | B– | | | 991,500 | |
| | 845 | | New York Liberty Development Corporation, Liberty Revenue Bonds, 4 World Trade Center Project, Series 2011, 5.000%, 11/15/44 | 11/21 at 100.00 | | A+ | | | 929,754 | |
| | 160 | | New York State Thruway Authority, General Revenue Bonds, Series 2005F, 5.000%, 1/01/30 – AMBAC Insured | 1/15 at 100.00 | | A+ | | | 170,240 | |
| | 700 | | New York State Thruway Authority, General Revenue Bonds, Series 2005G, 5.000%, 1/01/30 – AGM Insured (UB) | 7/15 at 100.00 | | AA– | | | 755,748 | |
| | 845 | | New York State Thruway Authority, General Revenue Bonds, Series 2012I, 5.000%, 1/01/42 | 1/22 at 100.00 | | A+ | | | 928,816 | |
| | 500 | | Niagara Frontier Airport Authority, New York, Airport Revenue Bonds, Buffalo Niagara International Airport, Series 1999A, 5.625%, 4/01/29 – NPFG Insured (Alternative Minimum Tax) | 10/13 at 100.00 | | Baa2 | | | 505,640 | |
| | | | Port Authority of New York and New Jersey, Consolidated Revenue Bonds, One Hundred Fortieth Series 2005: | | | | | | | |
| | 1,300 | | 5.000%, 12/01/28 – SYNCORA GTY Insured | 6/15 at 101.00 | | AA– | | | 1,419,249 | |
| | 615 | | 5.000%, 12/01/31 – SYNCORA GTY Insured | 6/15 at 101.00 | | AA– | | | 665,338 | |
| | 440 | | Port Authority of New York and New Jersey, Consolidated Revenue Bonds, One Hundred Forty Eighth Series 2008, Trust 2920, 17.812%, 8/15/32 – AGM Insured (IF) | 8/17 at 100.00 | | AA– | | | 674,045 | |
| | 2,000 | | Port Authority of New York and New Jersey, Consolidated Revenue Bonds, One Hundred Sixty Sixth Series 2011, 5.000%, 1/15/41 | 1/21 at 100.00 | | AA– | | | 2,226,880 | |
| | | | Port Authority of New York and New Jersey, Special Project Bonds, JFK International Air Terminal LLC Project, Eighth Series 2010: | | | | | | | |
| | 290 | | 6.500%, 12/01/28 | 12/15 at 100.00 | | BBB– | | | 320,140 | |
| | 1,470 | | 6.000%, 12/01/36 | 12/20 at 100.00 | | BBB– | | | 1,721,870 | |
| | 1,000 | | Triborough Bridge and Tunnel Authority, New York, Subordinate Lien General Purpose Revenue Refunding Bonds, Tender Option Bond Trust 1184, 9.325%, 5/15/16 (IF) | No Opt. Call | | AA– | | | 1,260,700 | |
| | 25,090 | | Total Transportation | | | | | | 26,328,498 | |
| | | | U.S. Guaranteed – 1.7% (1.1% of Total Investments) (6) | | | | | | | |
| | 500 | | Dormitory Authority of the State of New York, Revenue Bonds, South Nassau Communities Hospital, Series 2003B, 5.500%, 7/01/23 (Pre-refunded 7/01/13) | 7/13 at 100.00 | | Baa1 (6) | | | 506,790 | |
| | 600 | | Dormitory Authority of the State of New York, Revenue Bonds, Winthrop-South Nassau University Hospital Association, Series 2003A, 5.500%, 7/01/32 (Pre-refunded 7/01/13) | 7/13 at 100.00 | | Baa1 (6) | | | 608,070 | |
| | 175 | | Dormitory Authority of the State of New York, State Personal Income Tax Revenue Bonds, Series 2005F, 5.000%, 3/15/21 (Pre-refunded 3/15/15) – AGM Insured | 3/15 at 100.00 | | AA– (6) | | | 191,032 | |
| | 550 | | Erie County Industrial Development Agency, New York, School Facility Revenue Bonds, Buffalo City School District, Series 2004, 5.750%, 5/01/26 (Pre-refunded 5/01/14) – AGM Insured | 5/14 at 100.00 | | AA– (6) | | | 583,033 | |
| | 535 | | Metropolitan Transportation Authority, New York, Commuter Facilities Revenue Bonds, Series 1997B, 5.000%, 7/01/20 – AMBAC Insured (ETM) | 5/13 at 100.00 | | N/R (6) | | | 558,770 | |
| | 2,360 | | Total U.S. Guaranteed | | | | | | 2,447,695 | |
| | | | Utilities – 9.3% (6.3% of Total Investments) | | | | | | | |
| | 1,300 | | Chautauqua County Industrial Development Agency, New York, Exempt Facility Revenue Bonds, NRG Dunkirk Power Project, Series 2009, 5.875%, 4/01/42 | 2/20 at 100.00 | | Baa3 | | | 1,449,500 | |
| | 110 | | Guam Power Authority, Revenue Bonds, Series 2012A, 5.000%, 10/01/34 | 10/22 at 100.00 | | BBB | | | 121,162 | |
| | | | Long Island Power Authority, New York, Electric System General Revenue Bonds, Series 2006A: | | | | | | | |
| | 2,500 | | 5.000%, 12/01/23 – FGIC Insured | 6/16 at 100.00 | | A | | | 2,771,400 | |
| | 500 | | 5.000%, 12/01/24 – FGIC Insured | 6/16 at 100.00 | | A | | | 552,970 | |
| | Principal | | | Optional Call | | | | | | |
| | Amount (000) | | Description (1) | Provisions (2) | | Ratings (3) | | | Value | |
| | | | Utilities (continued) | | | | | | | |
| $ | 5,135 | | Long Island Power Authority, New York, Electric System Revenue Bonds, Series 2011A, 5.000%, 5/01/38 | 5/21 at 100.00 | | A | | $ | 5,573,632 | |
| | 1,400 | | Nassau County Industrial Development Authority, New York, Keyspan Glenwood Energy Project, Series 2003, 5.250%, 6/01/27 (Alternative Minimum Tax) | 6/13 at 100.00 | | A– | | | 1,409,828 | |
| | 1,665 | | Niagara Area Development Corporation, New York, Solid Waste Disposal Facility Revenue Refunding Bonds, Covanta Energy Project, Series 2012A, 5.250%, 11/01/42 | No Opt. Call | | BB+ | | | 1,716,215 | |
| | 12,610 | | Total Utilities | | | | | | 13,594,707 | |
| | | | Water and Sewer – 6.3% (4.3% of Total Investments) | | | | | | | |
| | 1,185 | | Guam Government Waterworks Authority, Water and Wastewater System Revenue Bonds, Series 2010, 5.625%, 7/01/40 | 7/20 at 100.00 | | Ba2 | | | 1,257,866 | |
| | 2,000 | | New York City Municipal Water Finance Authority, New York, Water and Sewer System Revenue Bonds, Second Generation Resolution, Fiscal 2010 Series 2009BB, 5.000%, 6/15/27 | 6/19 at 100.00 | | AA+ | | | 2,383,940 | |
| | 4,875 | | New York State Environmental Facilities Corporation, State Clean Water and Drinking Water Revolving Funds Revenue Bonds, New York City Municipal Water Finance Authority Projects, Second Resolution Series 2011B, 5.000%, 6/15/41 | 6/21 at 100.00 | | AAA | | | 5,581,826 | |
| | 8,060 | | Total Water and Sewer | | | | | | 9,223,632 | |
| $ | 203,310 | | Total Investments (cost $202,438,639) – 147.9% | | | | | | 216,777,228 | |
| | | | Floating Rate Obligations – (11.9)% | | | | | | (17,465,000 | ) |
| | | | MuniFund Term Preferred Shares, at Liquidation Value – (37.8)% (7) | | | | | | (55,360,000 | ) |
| | | | Other Assets Less Liabilities – 1.8% | | | | | | 2,608,091 | |
| | | | Net Assets Applicable to Common Shares – 100% | | | | | $ | 146,560,319 | |
| (1) | | All percentages shown in the Portfolio of Investments are based on net assets applicable to Common shares unless otherwise noted. |
| (2) | | Optional Call Provisions: Dates (month and year) and prices of the earliest optional call or redemption. There may be other call provisions at varying prices at later dates. Certain mortgage-backed securities may be subject to periodic principal paydowns. |
| (3) | | Ratings: Using the highest of Standard & Poor’s Group (“Standard & Poor’s”), Moody’s Investors Service, Inc. (“Moody’s”) or Fitch, Inc. (“Fitch”) rating. Ratings below BBB by Standard & Poor’s, Baa by Moody’s or BBB by Fitch are considered to be below investment grade. Holdings designated N/R are not rated by any of these national rating agencies. |
| (4) | | Investment, or portion of investment, has been pledged to collateralize the net payment obligations for investments in inverse floating rate transactions. |
| (5) | | At or subsequent to the end of the reporting period, this security is non-income producing. Non-income producing security, in the case of a fixed-income security, generally denotes that the issuer has (1) defaulted on the payment of principal or interest, (2) is under the protection of the Federal Bankruptcy Court or (3) the Fund’s Adviser has concluded that the issue is not likely to meet its future interest payment obligations and has directed the Fund’s custodian to cease accruing additional income on the Fund’s records. |
| (6) | | Backed by an escrow or trust containing sufficient U.S. Government or U.S. Government agency securities, which ensure the timely payment of principal and interest. Certain bonds backed by U.S. Government or agency securities are regarded as having an implied rating equal to the rating of such securities. |
| (7) | | MuniFund Term Preferred Shares, at Liquidation Value as a percentage of Total Investments is 25.5%. |
| N/R | | Not rated. |
| (ETM) | | Escrowed to maturity. |
| (IF) | | Inverse floating rate investment. |
| (UB) | | Underlying bond of an inverse floating rate trust reflected as a financing transaction. See Notes to Financial Statements, Footnote 1 – General Information and Significant Accounting Policies, Inverse Floating Rate Securities for more information. |
See accompanying notes to financial statements.
| | | Nuveen New York Dividend Advantage Municipal Fund 2 |
| NXK | | Portfolio of Investments |
| | | March 31, 2013 (Unaudited) |
| | Principal | | | Optional Call | | | | | | |
| | Amount (000) | | Description (1) | Provisions (2) | | Ratings (3) | | | Value | |
| | | | Consumer Discretionary – 2.7% (1.9% of Total Investments) | | | | | | | |
| $ | 700 | | New York City Industrial Development Agency, New York, Liberty Revenue Bonds, IAC/InterActiveCorp, Series 2005, 5.000%, 9/01/35 | 9/15 at 100.00 | | BBB | | $ | 730,492 | |
| | 1,950 | | Seneca Nation of Indians Capital Improvements Authority, New York, Special Obligation Bonds, Series 2007A, 5.000%, 12/01/23 | 6/17 at 100.00 | | BB | | | 2,054,852 | |
| | 2,650 | | Total Consumer Discretionary | | | | | | 2,785,344 | |
| | | | Consumer Staples – 2.5% (1.7% of Total Investments) | | | | | | | |
| | 205 | | New York Counties Tobacco Trust II, Tobacco Settlement Pass-Through Bonds, Series 2001, 5.250%, 6/01/25 | 6/13 at 100.00 | | A3 | | | 200,211 | |
| | 455 | | New York Counties Tobacco Trust III, Tobacco Settlement Pass-Through Bonds, Series 2003, 5.750%, 6/01/33 | 6/13 at 100.00 | | A1 | | | 455,801 | |
| | 85 | | Rensselaer Tobacco Asset Securitization Corporation, New York, Tobacco Settlement Asset-Backed Bonds, Series 2001A, 5.200%, 6/01/25 | 6/13 at 100.00 | | A3 | | | 84,163 | |
| | | | TSASC Inc., New York, Tobacco Asset-Backed Bonds, Series 2006: | | | | | | | |
| | 540 | | 4.750%, 6/01/22 | 6/16 at 100.00 | | BBB | | | 543,602 | |
| | 835 | | 5.000%, 6/01/26 | 6/16 at 100.00 | | BB– | | | 825,423 | |
| | 500 | | 5.000%, 6/01/34 | 6/16 at 100.00 | | B+ | | | 453,240 | |
| | 2,620 | | Total Consumer Staples | | | | | | 2,562,440 | |
| | | | Education and Civic Organizations – 26.0% (17.7% of Total Investments) | | | | | | | |
| | 260 | | Albany Industrial Development Agency, New York, Revenue Bonds, Albany Law School, Series 2007A, 5.000%, 7/01/31 | 7/17 at 100.00 | | BBB | | | 271,625 | |
| | 380 | | Albany Industrial Development Agency, New York, Revenue Bonds, Brighter Choice Charter Schools, Series 2007A, 5.000%, 4/01/37 | 4/17 at 100.00 | | BB+ | | | 372,195 | |
| | 1,225 | | Brooklyn Arena Local Development Corporation, New York, Payment in Lieu of Taxes Revenue Bonds, Barclays Center Project, Series 2009, 6.250%, 7/15/40 | 1/20 at 100.00 | | BBB– | | | 1,467,685 | |
| | 670 | | Buffalo and Erie County Industrial Land Development Corporation, New York, Tax-Exempt Revenue Bonds, Enterprise Charter School Project, Series 2011A, 7.500%, 12/01/40 | 12/20 at 100.00 | | BBB– | | | 785,870 | |
| | 90 | | Cattaraugus County Industrial Development Agency, New York, Revenue Bonds, St. Bonaventure University, Series 2006, 5.000%, 5/01/23 | 5/16 at 100.00 | | BBB– | | | 93,253 | |
| | 1,125 | | Dormitory Authority of the State of New York, General Revenue Bonds, Manhattan College, Series 2007A, 5.000%, 7/01/41 – RAAI Insured | 7/17 at 100.00 | | N/R | | | 1,155,274 | |
| | 1,000 | | Dormitory Authority of the State of New York, Housing Revenue Bonds, Fashion Institute of Technology, Series 2007, 5.250%, 7/01/29 – FGIC Insured | No Opt. Call | | N/R | | | 1,152,850 | |
| | 2,000 | | Dormitory Authority of the State of New York, Insured Revenue Bonds,
New York Medical College, Series 1998, 5.000%, 7/01/21 – NPFG Insured | 7/13 at 100.00 | | Baa2 | | | 2,006,920 | |
| | 1,000 | | Dormitory Authority of the State of New York, Lease Revenue Bonds, State University Dormitory Facilities, Series 2003B, 5.250%, 7/01/32 (Mandatory put 7/01/13) – SYNCORA GTY Insured | No Opt. Call | | Aa2 | | | 1,012,990 | |
| | 485 | | Dormitory Authority of the State of New York, Lease Revenue Bonds, State University Dormitory Facilities, Series 2004A, 5.000%, 7/01/29 – NPFG Insured | 7/15 at 100.00 | | Aa2 | | | 522,151 | |
| | 1,500 | | Dormitory Authority of the State of New York, Lease Revenue Bonds, State University Dormitory Facilities, Series 2011A, 5.000%, 7/01/41 | 7/21 at 100.00 | | Aa2 | | | 1,670,895 | |
| | 1,000 | | Dormitory Authority of the State of New York, Lease Revenue Bonds, State University Dormitory Facilities, Series 2012A, 5.000%, 7/01/42 | 7/22 at 100.00 | | Aa2 | | | 1,135,900 | |
| | 2,000 | | Dormitory Authority of the State of New York, Revenue Bonds, Columbia University, Series 2011A, 5.000%, 10/01/41 | 4/21 at 100.00 | | AAA | | | 2,303,620 | |
| | 175 | | Dormitory Authority of the State of New York, Revenue Bonds, New School University, Series 2010, 5.250%, 7/01/30 | 7/20 at 100.00 | | A– | | | 195,720 | |
| | 2,000 | | Dormitory Authority of the State of New York, Revenue Bonds, Non State Supported Debt, Cornell University, Series 2010A, 5.000%, 7/01/40 | 7/20 at 100.00 | | Aa1 | | | 2,270,940 | |
| | 280 | | Dormitory Authority of the State of New York, Revenue Bonds, St. Joseph’s College, Series 2010, 5.250%, 7/01/35 | 7/20 at 100.00 | | Baa1 | | | 309,358 | |
| | Principal | | | Optional Call | | | | | | |
| | Amount (000) | | Description (1) | Provisions (2) | | Ratings (3) | | | Value | |
| | | | Education and Civic Organizations (continued) | | | | | | | |
| $ | 1,835 | | Dutchess County Industrial Development Agency, New York, Civic Facility Revenue Bonds, Bard College Refunding, Series 2007-A1, 5.000%, 8/01/46 | 8/17 at 100.00 | | Baa1 | | $ | 1,911,244 | |
| | 265 | | Hempstead Town Industrial Development Agency, New York, Revenue Bonds, Adelphi University, Civic Facility Project, Series 2005, 5.000%, 10/01/35 | 10/15 at 100.00 | | A | | | 283,017 | |
| | 1,475 | | Hempstead Town Local Development Corporation, New York, Revenue Bonds, Molloy College Project, Series 2009, 5.750%, 7/01/39 | 7/19 at 100.00 | | BBB+ | | | 1,665,732 | |
| | 890 | | Monroe County Industrial Development Corporation, New York, Revenue Bonds, St. John Fisher College, Series 2011, 6.000%, 6/01/30 | 6/21 at 100.00 | | BBB+ | | | 1,025,084 | |
| | 245 | | New York City Industrial Development Agency, New York, Civic Facility Revenue Bonds, St. Francis College, Series 2004, 5.000%, 10/01/34 | 10/14 at 100.00 | | A– | | | 250,696 | |
| | 230 | | New York City Industrial Development Agency, New York, Civic Facility Revenue Bonds, Vaughn College of Aeronautics, Series 2006A, 5.000%, 12/01/28 | 12/16 at 100.00 | | BB+ | | | 240,578 | |
| | 1,120 | | New York City Industrial Development Agency, New York, PILOT Revenue Bonds, Queens Baseball Stadium Project, Series 2006, 4.750%, 1/01/42 – AMBAC Insured | 1/17 at 100.00 | | Ba1 | | | 1,120,683 | |
| | | | New York City Industrial Development Authority, New York, PILOT Revenue Bonds, Yankee Stadium Project, Series 2006: | | | | | | | |
| | 1,460 | | 4.500%, 3/01/39 – FGIC Insured | 9/16 at 100.00 | | BBB | | | 1,474,396 | |
| | 750 | | 4.750%, 3/01/46 – NPFG Insured | 9/16 at 100.00 | | BBB | | | 763,583 | |
| | 170 | | Seneca County Industrial Development Authority, New York, Revenue Bonds, New York Chiropractic College, Series 2007, 5.000%, 10/01/27 | 10/17 at 100.00 | | BBB | | | 180,404 | |
| | 300 | | Troy Capital Resource Corporation, New York, Revenue Bonds, Rensselaer Polytechnic Institute, Series 2010A, 5.125%, 9/01/40 | 9/20 at 100.00 | | A– | | | 328,443 | |
| | 340 | | Yonkers Industrial Development Agency, New York, Civic Facility Revenue Bonds, Sarah Lawrence College Project, Series 2001A Remarketed, 6.000%, 6/01/41 | 6/19 at 100.00 | | BBB+ | | | 381,500 | |
| | 24,270 | | Total Education and Civic Organizations | | | | | | 26,352,606 | |
| | | | Financials – 2.1% (1.5% of Total Investments) | | | | | | | |
| | 500 | | Liberty Development Corporation, New York, Goldman Sachs Headquarter Revenue Bonds, Series 2005, 5.250%, 10/01/35 | No Opt. Call | | A | | | 586,020 | |
| | 1,305 | | Liberty Development Corporation, New York, Goldman Sachs Headquarters Revenue Bonds Series 2007, 5.500%, 10/01/37 | No Opt. Call | | A | | | 1,582,365 | |
| | 1,805 | | Total Financials | | | | | | 2,168,385 | |
| | | | Health Care – 11.2% (7.6% of Total Investments) | | | | | | | |
| | 1,620 | | Dormitory Authority of the State of New York, FHA-Insured Revenue Bonds,
Montefiore Medical Center, Series 2005, 5.000%, 2/01/22 – FGIC Insured | 2/15 at 100.00 | | N/R | | | 1,737,256 | |
| | 1,700 | | Dormitory Authority of the State of New York, FHA-Insured Revenue Bonds, St. Lukes Roosevelt Hospital, Series 2005, 4.900%, 8/15/31 | 8/15 at 100.00 | | N/R | | | 1,816,518 | |
| | 150 | | Dormitory Authority of the State of New York, Highland Hospital of Rochester Revenue Bonds, Series 2010, 5.200%, 7/01/32 | 7/20 at 100.00 | | A2 | | | 164,769 | |
| | 375 | | Dormitory Authority of the State of New York, Insured Revenue Bonds, Franciscan Health Partnership Obligated Group – Frances Shervier Home and Hospital, Series 1997, 5.500%, 7/01/17 - RAAI Insured | 7/13 at 100.00 | | A3 | | | 375,986 | |
| | 340 | | Dormitory Authority of the State of New York, Orange Regional Medical Center Obligated Group Revenue Bonds, Series 2008, 6.250%, 12/01/37 | 12/18 at 100.00 | | Ba1 | | | 376,292 | |
| | 2,300 | | Dormitory Authority of the State of New York, Revenue Bonds, Memorial Sloan Kettering Cancer Center, Series 2006, 5.000%, 7/01/35 (UB) | 7/16 at 100.00 | | AA | | | 2,520,363 | |
| | 465 | | Dormitory Authority of the State of New York, Revenue Bonds, New York and Presbyterian Hospital, Series 2004A, 5.250%, 8/15/15 – AGM Insured | 8/14 at 100.00 | | AA– | | | 497,234 | |
| | 1,500 | | Dormitory Authority of the State of New York, Revenue Bonds, NYU Hospitals Center, Series 2007B, 5.625%, 7/01/37 | 7/17 at 100.00 | | A– | | | 1,632,120 | |
| | 1,000 | | Dormitory Authority of the State of New York, Revenue Bonds, NYU Hospitals Center, Series 2011A, 6.000%, 7/01/40 | 7/20 at 100.00 | | A– | | | 1,168,380 | |
| | | Nuveen New York Dividend Advantage Municipal Fund 2 (continued) |
| NXK | | Portfolio of Investments |
| | | March 31, 2013 (Unaudited) |
| | Principal | | | Optional Call | | | | | | |
| | Amount (000) | | Description (1) | Provisions (2) | | Ratings (3) | | | Value | |
| | | | Health Care (continued) | | | | | | | |
| $ | 290 | | Livingston County Industrial Development Agency, New York, Civic Facility Revenue Bonds, Nicholas H. Noyes Hospital, Series 2005, 6.000%, 7/01/30 | 5/13 at 100.00 | | BB | | $ | 290,305 | |
| | | | Madison County Industrial Development Agency, New York, Civic Facility Revenue Bonds, Oneida Health System, Series 2007A: | | | | | | | |
| | 275 | | 5.250%, 2/01/27 | 2/17 at 100.00 | | BBB– | | | 280,561 | |
| | 250 | | 5.500%, 2/01/32 | 2/17 at 100.00 | | BBB– | | | 256,100 | |
| | 215 | | Yonkers Industrial Development Agency, New York, Revenue Bonds, St. John’s Riverside Hospital, Series 2001A, 7.125%, 7/01/31 | 7/13 at 100.00 | | B+ | | | 215,346 | |
| | 10,480 | | Total Health Care | | | | | | 11,331,230 | |
| | | | Housing/Multifamily – 0.9% (0.6% of Total Investments) | | | | | | | |
| | 500 | | New York City Housing Development Corporation, New York, Multifamily Housing Revenue Bonds, Series 2004A, 5.250%, 11/01/30 | 5/14 at 100.00 | | AA | | | 510,300 | |
| | 70 | | New York City Housing Development Corporation, New York, Multifamily Housing Revenue Bonds, Series 2010D-1A, 5.000%, 11/01/42 | 5/20 at 100.00 | | AA | | | 75,447 | |
| | 290 | | New York State Housing Finance Agency, Affordable Housing Revenue, Series 2007A, 5.250%, 11/01/38 (Alternative Minimum Tax) | 11/17 at 100.00 | | Aa2 | | | 303,978 | |
| | 860 | | Total Housing/Multifamily | | | | | | 889,725 | |
| | | | Housing/Single Family – 1.6% (1.1% of Total Investments) | | | | | | | |
| | 950 | | New York State Mortgage Agency, Homeowner Mortgage Revenue Bonds, Series 130, 4.650%, 4/01/27 (Alternative Minimum Tax) | 4/15 at 100.00 | | Aa1 | | | 969,912 | |
| | 295 | | New York State Mortgage Agency, Homeowner Mortgage Revenue Bonds, Series 145, 5.125%, 10/01/37 (Alternative Minimum Tax) | 4/17 at 100.00 | | Aa1 | | | 306,490 | |
| | 340 | | New York State Mortgage Agency, Homeowner Mortgage Revenue Bonds, Series 148, 5.200%, 10/01/32 (Alternative Minimum Tax) | 10/17 at 100.00 | | Aa1 | | | 359,625 | |
| | 1,585 | | Total Housing/Single Family | | | | | | 1,636,027 | |
| | | | Long-Term Care – 5.4% (3.7% of Total Investments) | | | | | | | |
| | 440 | | Dormitory Authority of the State of New York, GNMA Collateralized Revenue Bonds, Cabrini of Westchester Project, Series 2006, 5.200%, 2/15/41 | 2/17 at 103.00 | | AA+ | | | 477,180 | |
| | 2,120 | | Dormitory Authority of the State of New York, Insured Revenue Bonds, Rehabilitation Association Pooled Loan Program 1, Series 2001A, 5.000%, 7/01/23 – AMBAC Insured | 7/13 at 100.00 | | A2 | | | 2,143,850 | |
| | 255 | | Dormitory Authority of the State of New York, Non-State Supported Debt, Ozanam Hall of Queens Nursing Home Revenue Bonds, Series 2006, 5.000%, 11/01/31 | 11/16 at 100.00 | | Ba3 | | | 249,403 | |
| | | | Dormitory Authority of the State of New York, Revenue Bonds, Providence Rest, Series 2005: | | | | | | | |
| | 50 | | 5.125%, 7/01/30 – ACA Insured | 7/15 at 100.00 | | N/R | | | 49,320 | |
| | 175 | | 5.000%, 7/01/35 – ACA Insured | 7/15 at 100.00 | | N/R | | | 163,088 | |
| | 665 | | East Rochester Housing Authority, New York, Senior Living Revenue Bonds, Woodland Village Project, Series 2006, 5.500%, 8/01/33 | 8/16 at 101.00 | | N/R | | | 671,683 | |
| | 310 | | New York City Industrial Development Agency, New York, Civic Facility Revenue Bonds, Special Needs Facilities Pooled Program, Series 2001A-1, 7.250%, 7/01/16 | 7/13 at 100.00 | | N/R | | | 311,398 | |
| | | | New York City Industrial Development Agency, New York, Civic Facility Revenue Bonds, Special Needs Facilities Pooled Program, Series 2008A-1: | | | | | | | |
| | 355 | | 5.500%, 7/01/18 | 7/16 at 101.00 | | N/R | | | 348,922 | |
| | 440 | | 5.800%, 7/01/23 | 7/16 at 101.00 | | N/R | | | 431,011 | |
| | 430 | | Suffolk County Industrial Development Agency, New York, Civic Facility Revenue Bonds, Special Needs Facilities Pooled Program, Series 2008-B1, 5.500%, 7/01/18 | 7/16 at 100.00 | | N/R | | | 422,638 | |
| | 170 | | Yonkers Industrial Development Agency, New York, Civic Facilities Revenue Bonds, Special Needs Facilities Pooled Program Bonds, Series 2008-C1, 5.800%, 7/01/23 | 7/16 at 101.00 | | N/R | | | 166,527 | |
| | 5,410 | | Total Long-Term Care | | | | | | 5,435,020 | |
| | Principal | | | Optional Call | | | | | | |
| | Amount (000) | | Description (1) | Provisions (2) | | Ratings (3) | | | Value | |
| | | | Materials – 0.2% (0.2% of Total Investments) | | | | | | | |
| $ | 230 | | Jefferson County Industrial Development Agency, New York, Solid Waste Disposal Revenue Bonds, International Paper Company Project, Series 2003A, 5.200%, 12/01/20 (Alternative Minimum Tax) | 12/13 at 100.00 | | BBB | | $ | 236,132 | |
| | | | Tax Obligation/General – 13.2% (9.0% of Total Investments) | | | | | | | |
| | 4,540 | | New York City, New York, General Obligation Bonds, Fiscal 2007 Series D-1, 5.125%, 12/01/25 (UB) | 12/17 at 100.00 | | AA | | | 5,314,978 | |
| | 1,000 | | New York City, New York, General Obligation Bonds, Fiscal 2012 Series F, 5.000%, 8/01/31 | 2/22 at 100.00 | | AA | | | 1,147,160 | |
| | 45 | | New York City, New York, General Obligation Bonds, Fiscal Series 1998H, 5.375%, 8/01/27 – NPFG Insured | 6/13 at 100.00 | | AA | | | 45,173 | |
| | 2,000 | | New York City, New York, General Obligation Bonds, Fiscal Series 2005F-1, 5.000%, 9/01/19 – SYNCORA GTY Insured | 9/15 at 100.00 | | AA | | | 2,217,280 | |
| | 2,600 | | New York City, New York, General Obligation Bonds, Fiscal Series 2006J-1, 5.000%, 6/01/25 (UB) | 6/16 at 100.00 | | AA | | | 2,924,532 | |
| | 750 | | New York City, New York, General Obligation Bonds, Series 2004C-1, 5.250%, 8/15/16 (UB) | 8/14 at 100.00 | | AA | | | 800,528 | |
| | 835 | | New York City, New York, General Obligation Bonds, Subseries G-1 Fiscal Series 2012, 5.000%, 4/01/29 | 4/22 at 100.00 | | AA | | | 967,039 | |
| | 11,770 | | Total Tax Obligation/General | | | | | | 13,416,690 | |
| | | | Tax Obligation/Limited – 44.6% (30.4% of Total Investments) | | | | | | | |
| | 1,000 | | Battery Park City Authority, New York, Lease Revenue Bonds, Senior Lien Series 2003A, 5.250%, 11/01/21 | 11/13 at 100.00 | | AAA | | | 1,030,200 | |
| | 3,000 | | Dormitory Authority of the State of New York, State Personal Income Tax Revenue Bonds, General Purpose Series 2012D, 5.000%, 2/15/31 | 2/22 at 100.00 | | AAA | | | 3,460,830 | |
| | 5 | | Dormitory Authority of the State of New York, State Personal Income Tax Revenue Bonds, Series 2005F, 5.000%, 3/15/21 – AGM Insured | 3/15 at 100.00 | | AAA | | | 5,446 | |
| | 2,000 | | Hudson Yards Infrastructure Corporation, New York, Revenue Bonds, Senior Fiscal 2012 Series 2011A, 5.750%, 2/15/47 | 2/21 at 100.00 | | A | | | 2,345,380 | |
| | 5,000 | | Hudson Yards Infrastructure Corporation, New York, Revenue Bonds, Series 2006A, 5.000%, 2/15/47 | 2/17 at 100.00 | | A | | | 5,320,000 | |
| | 560 | | Monroe Newpower Corporation, New York, Power Facilities Revenue Bonds, Series 2003, 5.500%, 1/01/34 | 1/15 at 100.00 | | BBB | | | 565,852 | |
| | 1,425 | | New York City Sales Tax Asset Receivable Corporation, New York, Dedicated Revenue Bonds, Local Government Assistance Corporation, Series 2004A, 5.000%, 10/15/26 – AGM Insured | 10/14 at 100.00 | | AAA | | | 1,523,197 | |
| | | | New York City Sales Tax Asset Receivable Corporation, New York, Dedicated Revenue Bonds, Local Government Assistance Corporation, Series 2004A: | | | | | | | |
| | 1,140 | | 5.000%, 10/15/25- NPFG Insured (UB) (4) | 10/14 at 100.00 | | AAA | | | 1,219,298 | |
| | 835 | | 5.000%, 10/15/26 – NPFG Insured (UB) (4) | 10/14 at 100.00 | | AAA | | | 892,540 | |
| | 750 | | 5.000%, 10/15/29 – AMBAC Insured (UB) (4) | 10/14 at 100.00 | | AAA | | | 798,338 | |
| | 1,300 | | New York City Transitional Finance Authority, New York, Building Aid Revenue Bonds, Fiscal Series 2007S-2, 5.000%, 1/15/28 – FGIC Insured | 1/17 at 100.00 | | AA– | | | 1,456,663 | |
| | | | New York City Transitional Finance Authority, New York, Future Tax Secured Bonds, Fiscal 2012 Series E-1: | | | | | | | |
| | 680 | | 5.000%, 2/01/35 | 2/22 at 100.00 | | AAA | | | 776,676 | |
| | 835 | | 5.000%, 2/01/37 | 2/22 at 100.00 | | AAA | | | 949,570 | |
| | 15 | | New York City Transitional Finance Authority, New York, Future Tax Secured Bonds, Fiscal Series 2003E, 5.000%, 2/01/23 | 5/13 at 100.00 | | AAA | | | 15,059 | |
| | 1,200 | | New York City Transitional Finance Authority, New York, Future Tax Secured Bonds, Fiscal Series 2007B, 5.000%, 11/01/30 | 5/17 at 100.00 | | AAA | | | 1,357,488 | |
| | 1,460 | | New York City Transitional Finance Authority, New York, Future Tax Secured Bonds, Fiscal Series 2007C-1, 5.000%, 11/01/27 | 11/17 at 100.00 | | AAA | | | 1,681,555 | |
| | 3,775 | | New York City Transitional Finance Authority, New York, Future Tax Secured Revenue Bonds, Refunding Subordinate Lien Series 2010D, 5.000%, 11/01/25 | 5/20 at 100.00 | | AAA | | | 4,518,029 | |
| | | Nuveen New York Dividend Advantage Municipal Fund 2 (continued) |
| NXK | | Portfolio of Investments |
| | | March 31, 2013 (Unaudited) |
| | Principal | | | Optional Call | | | | | | |
| | Amount (000) | | Description (1) | Provisions (2) | | Ratings (3) | | | Value | |
| | | | Tax Obligation/Limited (continued) | | | | | | | |
| $ | 1,000 | | New York City, New York, Educational Construction Fund, Revenue Bonds, Series 2011A, 5.750%, 4/01/41 | 4/21 at 100.00 | | AA– | | $ | 1,203,480 | |
| | 1,000 | | New York State Environmental Facilities Corporation, Infrastructure Revenue Bonds, Series 2003A, 5.000%, 3/15/21 | 3/14 at 100.00 | | AA– | | | 1,042,450 | |
| | 2,020 | | New York State Environmental Facilities Corporation, State Personal Income Tax Revenue Bonds,Series 2008A, 5.000%, 12/15/27 (UB) | 12/17 at 100.00 | | AAA | | | 2,341,463 | |
| | 840 | | New York State Housing Finance Agency, State Personal Income Tax Revenue Bonds, Economic Development and Housing, Series 2006A, 5.000%, 3/15/36 | 9/15 at 100.00 | | AAA | | | 914,138 | |
| | 1,125 | | New York State Thruway Authority, Highway and Bridge Trust Fund Bonds, Series 2007, 5.000%, 4/01/27 | 10/17 at 100.00 | | AA | | | 1,285,099 | |
| | 2,300 | | New York State Thruway Authority, Highway and Bridge Trust Fund Bonds, Series 2005B, 5.500%, 4/01/20 – AMBAC Insured (UB) (4) | No Opt. Call | | AA | | | 2,897,310 | |
| | 2,100 | | New York State Tobacco Settlement Financing Corporation, Tobacco Settlement Asset-Backed and State Contingency Contract-Backed Bonds, Series 2003A-1, 5.250%, 6/01/22 – AMBAC Insured | 6/13 at 100.00 | | AA– | | | 2,117,892 | |
| | 1,000 | | New York State Tobacco Settlement Financing Corporation, Tobacco Settlement Asset-Backed and State Contingency Contract-Backed Bonds, Series 2003B-1C, 5.500%, 6/01/21 | 6/13 at 100.00 | | AA– | | | 1,009,250 | |
| | 3,500 | | Puerto Rico Sales Tax Financing Corporation, Sales Tax Revenue Bonds, First Subordinate Series 2010A, 0.000%, 8/01/33 | 8/29 at 100.00 | | A+ | | | 2,754,605 | |
| | 8,000 | | Puerto Rico Sales Tax Financing Corporation, Sales Tax Revenue Bonds, Senior Series 2011C, 0.000%, 8/01/39 | No Opt. Call | | AA– | | | 1,817,920 | |
| | 47,865 | | Total Tax Obligation/Limited | | | | | | 45,299,728 | |
| | | | Transportation – 20.3% (13.8% of Total Investments) | | | | | | | |
| | 2,500 | | Metropolitan Transportation Authority, New York, Transportation Revenue Bonds, Series 2007B, 5.000%, 11/15/33 | 11/17 at 100.00 | | A | | | 2,769,650 | |
| | 1,000 | | Metropolitan Transportation Authority, New York, Transportation Revenue Bonds, Series 2010D, 5.000%, 11/15/34 | 11/20 at 100.00 | | A | | | 1,109,900 | |
| | 1,250 | | New York City Industrial Development Agency, New York, American Airlines-JFK International Airport Special Facility Revenue Bonds, Series 2005, 7.750%, 8/01/31 (Alternative Minimum Tax) | 8/16 at 101.00 | | N/R | | | 1,434,388 | |
| | 1,500 | | New York City Industrial Development Agency, New York, Civic Facility Revenue Bonds, Bronx Parking Development Company, LLC Project, Series 2007, 5.875%, 10/01/46 (5) | 10/17 at 102.00 | | N/R | | | 632,400 | |
| | 125 | | New York City Industrial Development Agency, New York, Special Facilities Revenue Bonds, British Airways PLC, Series 1998, 5.250%, 12/01/32 (Alternative Minimum Tax) | 6/13 at 100.00 | | BB | | | 124,993 | |
| | 1,000 | | New York City Industrial Development Agency, New York, Special Facilities Revenue Bonds, JFK Airport – American Airlines Inc., Series 2002B, 8.500%, 8/01/28 (Alternative Minimum Tax) | 8/13 at 100.50 | | N/R | | | 1,105,000 | |
| | 650 | | New York City Industrial Development Agency, New York, Special Facilities Revenue Bonds, Terminal One Group JFK Project, Series 2005, 5.500%, 1/01/24 (Alternative Minimum Tax) | 1/16 at 100.00 | | A3 | | | 716,729 | |
| | | | New York City Industrial Development Agency, New York, Special Facility Revenue Bonds, JetBlue Airways Corporation Project, Series 2006: | | | | | | | |
| | 45 | | 5.000%, 5/15/20 (Alternative Minimum Tax) | 5/13 at 100.00 | | B– | | | 44,997 | |
| | 750 | | 5.125%, 5/15/30 (Alternative Minimum Tax) | 5/13 at 100.00 | | B– | | | 743,625 | |
| | 585 | | New York Liberty Development Corporation, Liberty Revenue Bonds, 4 World Trade Center Project, Series 2011, 5.000%, 11/15/44 | 11/21 at 100.00 | | A+ | | | 643,676 | |
| | 300 | | New York State Thruway Authority, General Revenue Bonds, Series 2005G, 5.000%, 1/01/30 – AGM Insured (UB) | 7/15 at 100.00 | | AA– | | | 323,892 | |
| | 3,400 | | Niagara Frontier Airport Authority, New York, Airport Revenue Bonds, Buffalo Niagara International Airport, Series 1999A, 5.625%, 4/01/29 – NPFG Insured (Alternative Minimum Tax) | 10/13 at 100.00 | | Baa2 | | | 3,438,352 | |
| | Principal | | | Optional Call | | | | | | |
| | Amount (000) | | Description (1) | Provisions (2) | | Ratings (3) | | | Value | |
| | | | Transportation (continued) | | | | | | | |
| | | | Port Authority of New York and New Jersey, Consolidated Revenue Bonds, One Hundred Fortieth Series 2005: | | | | | | | |
| $ | 1,000 | | 5.000%, 12/01/28 – SYNCORA GTY Insured | 6/15 at 101.00 | | AA– | | $ | 1,091,730 | |
| | 280 | | 5.000%, 12/01/31 – SYNCORA GTY Insured | 6/15 at 101.00 | | AA– | | | 302,918 | |
| | 310 | | Port Authority of New York and New Jersey, Consolidated Revenue Bonds, One Hundred Forty Eighth Series 2008, Trust 2920, 17.812%, 8/15/32 – AGM Insured (IF) | 8/17 at 100.00 | | AA– | | | 474,895 | |
| | 2,000 | | Port Authority of New York and New Jersey, Consolidated Revenue Bonds, One Hundred Sixty Sixth Series 2011, 5.000%, 1/15/41 | 1/21 at 100.00 | | AA– | | | 2,226,880 | |
| | | | Port Authority of New York and New Jersey, Special Project Bonds, JFK International Air Terminal LLC Project, Eighth Series 2010: | | | | | | | |
| | 210 | | 6.500%, 12/01/28 | 12/15 at 100.00 | | BBB– | | | 231,825 | |
| | 1,030 | | 6.000%, 12/01/36 | 12/20 at 100.00 | | BBB– | | | 1,206,480 | |
| | 780 | | Triborough Bridge and Tunnel Authority, New York, Subordinate Lien General Purpose Revenue Refunding Bonds, Series 2002E, 5.500%, 11/15/20 – NPFG Insured | No Opt. Call | | A+ | | | 989,914 | |
| | 750 | | Triborough Bridge and Tunnel Authority, New York, Subordinate Lien General Purpose Revenue Refunding Bonds, Tender Option Bond Trust 1184, 9.325%, 5/15/16 (IF) | No Opt. Call | | AA– | | | 945,525 | |
| | 19,465 | | Total Transportation | | | | | | 20,557,769 | |
| | | | U.S. Guaranteed – 0.6% (0.4% of Total Investments) (6) | | | | | | | |
| | 500 | | Dormitory Authority of the State of New York, Revenue Bonds, Winthrop-South Nassau University Hospital Association, Series 2003A, 5.500%, 7/01/32 (Pre-refunded 7/01/13) | 7/13 at 100.00 | | Baa1 (6) | | | 506,725 | |
| | 120 | | Dormitory Authority of the State of New York, State Personal Income Tax Revenue Bonds, Series 2005F, 5.000%, 3/15/21 (Pre-refunded 3/15/15) – AGM Insured | 3/15 at 100.00 | | AA– (6) | | | 130,993 | |
| | 620 | | Total U.S. Guaranteed | | | | | | 637,718 | |
| | | | Utilities – 9.0% (6.1% of Total Investments) | | | | | | | |
| | 75 | | Guam Power Authority, Revenue Bonds, Series 2012A, 5.000%, 10/01/34 | 10/22 at 100.00 | | BBB | | | 82,610 | |
| | | | Long Island Power Authority, New York, Electric System General Revenue Bonds, Series 2006A: | | | | | | | |
| | 1,700 | | 5.000%, 12/01/23 – FGIC Insured | 6/16 at 100.00 | | A | | | 1,884,552 | |
| | 1,700 | | 5.000%, 12/01/24 – FGIC Insured | 6/16 at 100.00 | | A | | | 1,880,098 | |
| | 250 | | Long Island Power Authority, New York, Electric System General Revenue Bonds, Series 2006B, 5.000%, 12/01/35 – CIFG Insured | 6/16 at 100.00 | | A | | | 269,693 | |
| | | | Long Island Power Authority, New York, Electric System Revenue Bonds, Series 2011A: | | | | | | | |
| | 1,000 | | 5.000%, 5/01/36 – AGM Insured | 5/21 at 100.00 | | AA– | | | 1,104,510 | |
| | 1,000 | | 5.000%, 5/01/38 | 5/21 at 100.00 | | A | | | 1,085,420 | |
| | 900 | | Nassau County Industrial Development Authority, New York, Keyspan Glenwood Energy Project, Series 2003, 5.250%, 6/01/27 (Alternative Minimum Tax) | 6/13 at 100.00 | | A– | | | 906,318 | |
| | 1,125 | | Niagara Area Development Corporation, New York, Solid Waste Disposal Facility Revenue Refunding Bonds, Covanta Energy Project, Series 2012A, 5.250%, 11/01/42 | No Opt. Call | | BB+ | | | 1,159,605 | |
| | 750 | | Suffolk County Industrial Development Agency, New York, Revenue Bonds, Nissequogue Cogeneration Partners Facility, Series 1998, 5.500%, 1/01/23 (Alternative Minimum Tax) | 7/13 at 100.00 | | N/R | | | 749,970 | |
| | 8,500 | | Total Utilities | | | | | | 9,122,776 | |
| | | Nuveen New York Dividend Advantage Municipal Fund 2 (continued) |
| NXK | | Portfolio of Investments |
| | | March 31, 2013 (Unaudited) |
| | Principal | | | Optional Call | | | | | | |
| | Amount (000) | | Description (1) | Provisions (2) | | Ratings (3) | | | Value | |
| | | | Water and Sewer – 6.4% (4.3% of Total Investments) | | | | | | | |
| $ | 820 | | Guam Government Waterworks Authority, Water and Wastewater System Revenue Bonds, Series 2010, 5.625%, 7/01/40 | 7/20 at 100.00 | | Ba2 | | $ | 870,422 | |
| | 4,875 | | New York State Environmental Facilities Corporation, State Clean Water and Drinking Water Revolving Funds Revenue Bonds, New York City Municipal Water Finance Authority Projects, Second Resolution Series 2011B, 5.000%, 6/15/41 | 6/21 at 100.00 | | AAA | | | 5,581,826 | |
| | 5,695 | | Total Water and Sewer | | | | | | 6,452,248 | |
| $ | 143,825 | | Total Investments (cost $139,560,284) – 146.7% | | | | | | 148,883,838 | |
| | | | Floating Rate Obligations – (12.0)% | | | | | | (12,150,000 | ) |
| | | | MuniFund Term Preferred Shares, at Liquidation Value – (37.3)% (7) | | | | | | (37,890,000 | ) |
| | | | Other Assets Less Liabilities – 2.6% | | | | | | 2,637,290 | |
| | | | Net Assets Applicable to Common Shares – 100% | | | | | $ | 101,481,128 | |
| (1) | | All percentages shown in the Portfolio of Investments are based on net assets applicable to Common shares unless otherwise noted. |
| (2) | | Optional Call Provisions: Dates (month and year) and prices of the earliest optional call or redemption. There may be other call provisions at varying prices at later dates. Certain mortgage-backed securities may be subject to periodic principal paydowns. |
| (3) | | Ratings: Using the highest of Standard & Poor’s Group (“Standard & Poor’s”), Moody’s Investors Service, Inc. (“Moody’s”) or Fitch, Inc. (“Fitch”) rating. Ratings below BBB by Standard & Poor’s, Baa by Moody’s or BBB by Fitch are considered to be below investment grade. Holdings designated N/R are not rated by any of these national rating agencies. |
| (4) | | Investment, or portion of investment, has been pledged to collateralize the net payment obligations for investments in inverse floating rate transactions. |
| (5) | | At or subsequent to the end of the reporting period, this security is non-income producing. Non-income producing security, in the case of a fixed-income security, generally denotes that the issuer has (1) defaulted on the payment of principal or interest, (2) is under the protection of the Federal Bankruptcy Court or (3) the Fund’s Adviser has concluded that the issue is not likely to meet its future interest payment obligations and has directed the Fund’s custodian to cease accruing additional income on the Fund’s records. |
| (6) | | Backed by an escrow or trust containing sufficient U.S. Government or U.S. Government agency securities, which ensure the timely payment of principal and interest. Certain bonds backed by U.S. Government or agency securities are regarded as having an implied rating equal to the rating of such securities. |
| (7) | | MuniFund Term Preferred Shares, at Liquidation Value as a percentage of Total Investments is 25.4%. |
| N/R | | Not rated. |
| (IF) | | Inverse floating rate investment. |
| (UB) | | Underlying bond of an inverse floating rate trust reflected as a financing transaction. See Notes to Financial Statements, Footnote 1 – General Information and Significant Accounting Policies, Inverse Floating Rate Securities for more information. |
See accompanying notes to financial statements.
| | | Nuveen New York AMT-Free Municipal Income Fund |
| NRK | | Portfolio of Investments |
| | | March 31, 2013 (Unaudited) |
| | Principal | | | Optional Call | | | | | | |
| | Amount (000) | | Description (1) | Provisions (2) | | Ratings (3) | | | Value | |
| | | | Consumer Staples – 2.6% (1.7% of Total Investments) | | | | | | | |
| $ | 1,210 | | New York Counties Tobacco Trust II, Tobacco Settlement Pass-Through Bonds, Series 2001, 5.250%, 6/01/25 | 6/13 at 100.00 | | A3 | | $ | 1,181,734 | |
| | 2,290 | | New York Counties Tobacco Trust III, Tobacco Settlement Pass-Through Bonds, Series 2003, 5.750%, 6/01/33 | 6/13 at 100.00 | | A1 | | | 2,294,030 | |
| | 975 | | Puerto Rico, The Children’s Trust Fund, Tobacco Settlement Asset-Backed Refunding Bonds, Series 2002, 5.375%, 5/15/33 | 5/13 at 100.00 | | BBB+ | | | 985,979 | |
| | 32,925 | | TSASC Inc., New York, Tobacco Asset-Backed Bonds, Series 2006, 5.125%, 6/01/42 | 6/16 at 100.00 | | B+ | | | 29,099,444 | |
| | 37,400 | | Total Consumer Staples | | | | | | 33,561,187 | |
| | | | Education and Civic Organizations – 26.6% (17.5% of Total Investments) | | | | | | | |
| | 1,475 | | Dormitory Authority of the State of New York, 853 Schools Program Insured Revenue Bonds, St. Anne Institute, Issue 2, Series 1998E, 5.000%, 7/01/18 – AMBAC Insured | 7/13 at 100.00 | | N/R | | | 1,480,236 | |
| | | | Dormitory Authority of the State of New York, General Revenue Bonds, New York University, Series 2001-1: | | | | | | | |
| | 1,500 | | 5.500%, 7/01/24 – AMBAC Insured | No Opt. Call | | AA– | | | 1,950,270 | |
| | 4,000 | | 5.500%, 7/01/40 – AMBAC Insured | No Opt. Call | | AA– | | | 5,245,040 | |
| | 9,400 | | Dormitory Authority of the State of New York, General Revenue Bonds, Saint Johns University, Series 2007A, 5.250%, 7/01/32 – NPFG Insured | 7/17 at 100.00 | | A– | | | 10,528,564 | |
| | 4,265 | | Dormitory Authority of the State of New York, Housing Revenue Bonds, Fashion Institute of Technology, Series 2007, 5.250%, 7/01/34 – FGIC Insured | No Opt. Call | | N/R | | | 4,848,068 | |
| | 6,000 | | Dormitory Authority of the State of New York, Insured Revenue Bonds, Mount Sinai School of Medicine, Series 1994A, 5.150%, 7/01/24 – NPFG Insured | No Opt. Call | | A– | | | 6,913,140 | |
| | 7,780 | | Dormitory Authority of the State of New York, Insured Revenue Bonds, New York Medical College, Series 1998, 5.000%, 7/01/21 – NPFG Insured | 7/13 at 100.00 | | Baa2 | | | 7,806,919 | |
| | 10,000 | | Dormitory Authority of the State of New York, Lease Revenue Bonds, State University Dormitory Facilities, Series 2003B, 5.250%, 7/01/32 (Mandatory put 7/01/13) – SYNCORA GTY Insured | No Opt. Call | | Aa2 | | | 10,129,900 | |
| | 6,660 | | Dormitory Authority of the State of New York, Lease Revenue Bonds, State University Dormitory Facilities, Series 2004A, 5.000%, 7/01/29 – NPFG Insured | 7/15 at 100.00 | | Aa2 | | | 7,170,156 | |
| | 10,000 | | Dormitory Authority of the State of New York, Lease Revenue Bonds, State University Dormitory Facilities, Series 2006A, 5.000%, 7/01/31 – NPFG Insured | 7/16 at 100.00 | | Aa2 | | | 10,951,400 | |
| | 6,215 | | Dormitory Authority of the State of New York, Lease Revenue Bonds, State University Dormitory Facilities, Series 2009A, 5.000%, 7/01/39 | 7/19 at 100.00 | | Aa2 | | | 6,872,485 | |
| | 7,500 | | Dormitory Authority of the State of New York, Lease Revenue Bonds, State University Dormitory Facilities, Series 2011A, 5.000%, 7/01/41 | 7/21 at 100.00 | | Aa2 | | | 8,354,475 | |
| | 1,000 | | Dormitory Authority of the State of New York, Lease Revenue Bonds, State University Dormitory Facilities, Series 2012A, 5.000%, 7/01/42 | 7/22 at 100.00 | | Aa2 | | | 1,135,900 | |
| | | | Dormitory Authority of the State of New York, Revenue Bonds, Barnard College, Series 2007A: | | | | | | | |
| | 2,000 | | 5.000%, 7/01/25 – FGIC Insured | 7/17 at 100.00 | | N/R | | | 2,243,860 | |
| | 2,525 | | 5.000%, 7/01/37 – FGIC Insured | 7/17 at 100.00 | | N/R | | | 2,716,572 | |
| | 1,150 | | Dormitory Authority of the State of New York, Revenue Bonds, Canisius College, Series 2005, 5.000%, 7/01/21 – NPFG Insured | 7/15 at 100.00 | | Baa2 | | | 1,195,713 | |
| | 19,180 | | Dormitory Authority of the State of New York, Revenue Bonds, Columbia University, Series 2011A, 5.000%, 10/01/41 | 4/21 at 100.00 | | AAA | | | 22,091,716 | |
| | | | Dormitory Authority of the State of New York, Revenue Bonds, Convent of the Sacred Heart, Series 2011: | | | | | | | |
| | 1,000 | | 5.625%, 11/01/35 – AGM Insured | 5/21 at 100.00 | | AA– | | | 1,155,830 | |
| | 5,980 | | 5.750%, 11/01/40 – AGM Insured | 5/21 at 100.00 | | AA– | | | 6,959,703 | |
| | 3,000 | | Dormitory Authority of the State of New York, Revenue Bonds, Fordham University, Series 2008B, 5.000%, 7/01/38 – AGC Insured | 7/18 at 100.00 | | A2 | | | 3,286,050 | |
| | 1,000 | | Dormitory Authority of the State of New York, Revenue Bonds, Marymount Manhattan College, Series 2009, 5.250%, 7/01/29 | 7/19 at 100.00 | | Baa2 | | | 1,060,300 | |
| | | Nuveen New York AMT-Free Municipal Income Fund (continued) |
| NRK | | Portfolio of Investments |
| | | March 31, 2013 (Unaudited) |
| | Principal | | | Optional Call | | | | | | |
| | Amount (000) | | Description (1) | Provisions (2) | | Ratings (3) | | | Value | |
| | | | Education and Civic Organizations (continued) | | | | | | | |
| $ | 875 | | Dormitory Authority of the State of New York, Revenue Bonds, New School University, Series 2010, 5.250%, 7/01/30 | 7/20 at 100.00 | | A– | | $ | 978,600 | |
| | 3,250 | | Dormitory Authority of the State of New York, Revenue Bonds, New York University, Series 1998A, 6.000%, 7/01/18 – NPFG Insured | No Opt. Call | | AA– | | | 4,074,623 | |
| | 3,415 | | Dormitory Authority of the State of New York, Revenue Bonds, New York University, Series 2007, 5.000%, 7/01/32 – AMBAC Insured | 7/17 at 100.00 | | AA– | | | 3,808,169 | |
| | | | Dormitory Authority of the State of New York, Revenue Bonds, New York University, Series 2009A: | | | | | | | |
| | 10,000 | | 5.250%, 7/01/34 | 7/19 at 100.00 | | AA– | | | 11,757,800 | |
| | 3,890 | | 5.000%, 7/01/39 | 7/19 at 100.00 | | AA– | | | 4,401,379 | |
| | 13,500 | | Dormitory Authority of the State of New York, Revenue Bonds, New York University, Series 2009B, 5.000%, 7/01/39 | 7/19 at 100.00 | | AA– | | | 15,274,710 | |
| | 3,115 | | Dormitory Authority of the State of New York, Revenue Bonds, New York University, Series 2012A, 5.000%, 7/01/32 | 7/22 at 100.00 | | AA– | | | 3,611,126 | |
| | 2,800 | | Dormitory Authority of the State of New York, Revenue Bonds, Non State Supported Debt, Cornell University, Series 2008C, 5.000%, 7/01/37 | 7/20 at 100.00 | | Aa1 | | | 3,197,012 | |
| | | | Dormitory Authority of the State of New York, Revenue Bonds, Non State Supported Debt, Cornell University, Series 2010A: | | | | | | | |
| | 5,000 | | 5.000%, 7/01/35 | 7/20 at 100.00 | | Aa1 | | | 5,726,600 | |
| | 14,795 | | 5.000%, 7/01/40 | 7/20 at 100.00 | | Aa1 | | | 16,799,279 | |
| | | | Dormitory Authority of the State of New York, Revenue Bonds, Rochester Institute of Technology, Series 2006A: | | | | | | | |
| | 2,500 | | 5.250%, 7/01/20 – AMBAC Insured | No Opt. Call | | A1 | | | 3,059,550 | |
| | 2,000 | | 5.250%, 7/01/21 – AMBAC Insured | No Opt. Call | | A1 | | | 2,466,780 | |
| | 1,250 | | Dormitory Authority of the State of New York, Revenue Bonds, University of Rochester, Refunding Series 2009A, 5.125%, 7/01/39 | No Opt. Call | | AA– | | | 1,413,200 | |
| | 6,435 | | Dormitory Authority of the State of New York, State and Local Appropriation Lease Bonds, Upstate Community Colleges, Series 2005A, 5.000%, 7/01/19 – FGIC Insured | 7/15 at 100.00 | | AA– | | | 7,012,026 | |
| | 1,000 | | Dutchess County Local Development Corporation, New York, Revenue Bonds, Marist College Project, Series 2013A, 5.000%, 7/01/39 | 7/23 at 100.00 | | A2 | | | 1,110,530 | |
| | 5,520 | | Madison County Industrial Development Agency, New York, Civic Facility Revenue Bonds, Colgate University, Tender Option Bond Trust 3127, 13.261%, 1/01/14 – AMBAC Insured (IF) | No Opt. Call | | AA+ | | | 6,102,139 | |
| | 7,250 | | New York City Industrial Development Agency, New York, Civic Facility Revenue Bonds, Horace Mann School, Series 1998, 5.000%, 7/01/28 – NPFG Insured | 7/13 at 100.00 | | Baa2 | | | 7,274,433 | |
| | 4,775 | | New York City Industrial Development Agency, New York, Civic Facility Revenue Bonds, Trinity Episcopal School, Series 1997, 5.250%, 6/15/27 – NPFG Insured | 6/13 at 100.00 | | Baa2 | | | 4,790,567 | |
| | 3,155 | | New York City Industrial Development Agency, New York, Civic Facility Revenue Bonds, Vaughn College of Aeronautics, Series 2006A, 5.000%, 12/01/28 | 12/16 at 100.00 | | BB+ | | | 3,300,098 | |
| | | | New York City Industrial Development Agency, New York, Payment in Lieu of Taxes Revenue Bonds, Queens Baseball Stadium Project, Series 2009: | | | | | | | |
| | 1,000 | | 6.125%, 1/01/29 – AGC Insured | 1/19 at 100.00 | | AA– | | | 1,156,410 | |
| | 1,000 | | 6.375%, 1/01/39 – AGC Insured | 1/19 at 100.00 | | AA– | | | 1,159,550 | |
| | | | New York City Industrial Development Agency, New York, PILOT Revenue Bonds, Queens Baseball Stadium Project, Series 2006: | | | | | | | |
| | 6,815 | | 5.000%, 1/01/31 – AMBAC Insured | 1/17 at 100.00 | | Ba1 | | | 7,021,426 | |
| | 5,000 | | 5.000%, 1/01/36 – AMBAC Insured | 1/17 at 100.00 | | Ba1 | | | 5,114,700 | |
| | 1,030 | | 4.750%, 1/01/42 – AMBAC Insured | 1/17 at 100.00 | | Ba1 | | | 1,030,628 | |
| | 11,000 | | 5.000%, 1/01/46 – AMBAC Insured | 1/17 at 100.00 | | Ba1 | | | 11,179,850 | |
| | 4,730 | | New York City Industrial Development Agency, New York, Revenue Bonds, Yankee Stadium Project PILOT, Series 2009A, 7.000%, 3/01/49 – AGC Insured | 3/19 at 100.00 | | AA– | | | 5,829,347 | |
| | | | New York City Industrial Development Authority, New York, PILOT Revenue Bonds, Yankee Stadium Project, Series 2006: | | | | | | | |
| | 4,280 | | 5.000%, 3/01/31 – FGIC Insured | 9/16 at 100.00 | | BBB | | | 4,463,612 | |
| | 31,650 | | 5.000%, 3/01/36 – NPFG Insured | 9/16 at 100.00 | | BBB | | | 32,801,427 | |
| | 20,210 | | 4.500%, 3/01/39 – FGIC Insured | 9/16 at 100.00 | | BBB | | | 20,409,271 | |
| | Principal | | | Optional Call | | | | | | |
| | Amount (000) | | Description (1) | Provisions (2) | | Ratings (3) | | | Value | |
| | | | Education and Civic Organizations (continued) | | | | | | | |
| $ | 6,560 | | New York City Trust for Cultural Resources, New York, Revenue Bonds, American Museum of Natural History, Series 2004A, 5.000%, 7/01/36 – NPFG Insured | 7/14 at 100.00 | | AA | | $ | 6,846,278 | |
| | 3,400 | | New York City Trust for Cultural Resources, New York, Revenue Bonds, Whitney Museum of American Art, Series 2011, 5.000%, 7/01/31 | 1/21 at 100.00 | | A | | | 3,776,652 | |
| | | | Niagara Area Development Corporation, New York, Niagara University Project, Series 2012A: | | | | | | | |
| | 600 | | 5.000%, 5/01/35 | 5/22 at 100.00 | | BBB+ | | | 653,688 | |
| | 1,000 | | 5.000%, 5/01/42 | 5/22 at 100.00 | | BBB+ | | | 1,086,280 | |
| | 1,750 | | Onondaga Civic Development Corporation, New York, Revenue Bonds, Le Moyne College Project, Series 2012, 5.000%, 7/01/42 | 7/22 at 100.00 | | Baa2 | | | 1,877,890 | |
| | 1,000 | | Onongada County Trust For Cultural Resources, New York, Revenue Bonds, Syracuse University Project, Series 2011, 5.000%, 12/01/36 | 12/21 at 100.00 | | Aa3 | | | 1,143,100 | |
| | | | Tompkins County Development Corporation, New York, Revenue Bonds, Ithaca College, Series 2011: | | | | | | | |
| | 1,390 | | 5.500%, 7/01/33 – AGM Insured | 1/21 at 100.00 | | A2 | | | 1,598,250 | |
| | 1,000 | | 5.250%, 7/01/36 – AGM Insured | 1/21 at 100.00 | | A2 | | | 1,124,810 | |
| | 4,000 | | 5.375%, 7/01/41 – AGM Insured | 1/21 at 100.00 | | A2 | | | 4,509,840 | |
| | 3,700 | | Troy Capital Resource Corporation, New York, Revenue Bonds, Rensselaer Polytechnic Institute, Series 2010A, 5.125%, 9/01/40 | 9/20 at 100.00 | | A– | | | 4,050,797 | |
| | 317,270 | | Total Education and Civic Organizations | | | | | | 347,088,724 | |
| | | | Financials – 1.6% (1.1% of Total Investments) | | | | | | | |
| | 18,400 | | Liberty Development Corporation, New York, Goldman Sachs Headquarter Revenue Bonds, Series 2005, 5.250%, 10/01/35 | No Opt. Call | | A | | | 21,565,536 | |
| | | | Health Care – 6.8% (4.5% of Total Investments) | | | | | | | |
| | 5,315 | | Albany Capital Resource Corporation, New York, St. Peter’s Hospital Project, Series 2011, 6.125%, 11/15/30 | 11/20 at 100.00 | | A3 | | | 6,373,854 | |
| | 2,495 | | Dormitory Authority of the State of New York, FHA-Insured Mortgage Hospital Revenue Bonds, Hospital for Special Surgery, Series 2009, 6.250%, 8/15/34 | 8/19 at 100.00 | | AA+ | | | 3,031,250 | |
| | | | Dormitory Authority of the State of New York, FHA-Insured Mortgage Hospital Revenue Bonds, St. Barnabas Hospital, Series 2002A: | | | | | | | |
| | 2,800 | | 5.125%, 2/01/22 – AMBAC Insured | 5/13 at 100.00 | | N/R | | | 2,809,744 | |
| | 3,000 | | 5.000%, 2/01/31 – AMBAC Insured | 5/13 at 100.00 | | N/R | | | 3,009,540 | |
| | 8,230 | | Dormitory Authority of the State of New York, FHA-Insured Mortgage Revenue Bonds, Hudson Valley Hospital Center, Series 2007, 5.000%, 8/15/27 – AGM Insured | 8/17 at 100.00 | | AA– | | | 9,296,197 | |
| | | | Dormitory Authority of the State of New York, FHA-Insured Mortgage Revenue Bonds, Montefiore Hospital, Series 2004: | | | | | | | |
| | 9,330 | | 5.000%, 8/01/29 – FGIC Insured | 2/15 at 100.00 | | N/R | | | 9,889,427 | |
| | 425 | | 5.000%, 8/01/33 – FGIC Insured | 2/15 at 100.00 | | N/R | | | 449,344 | |
| | 8,035 | | Dormitory Authority of the State of New York, FHA-Insured Revenue Bonds, Montefiore Medical Center, Series 2005, 5.000%, 2/01/22 – FGIC Insured | 2/15 at 100.00 | | N/R | | | 8,616,573 | |
| | 2,250 | | Dormitory Authority of the State of New York, FHA-Insured Revenue Bonds, St. Lukes Roosevelt Hospital, Series 2005, 4.900%, 8/15/31 | 8/15 at 100.00 | | N/R | | | 2,404,215 | |
| | 5,000 | | Dormitory Authority of the State of New York, North Shore Long Island Jewish Obligated Group Revenue Bonds, Series 2011A, 5.000%, 5/01/41 | 5/21 at 100.00 | | A– | | | 5,578,500 | |
| | 2,000 | | Dormitory Authority of the State of New York, Orange Regional Medical Center Obligated Group Revenue Bonds, Series 2008, 6.250%, 12/01/37 | 12/18 at 100.00 | | Ba1 | | | 2,213,480 | |
| | | | Dormitory Authority of the State of New York, Revenue Bonds, Health Quest System Inc., Series 2007B: | | | | | | | |
| | 3,865 | | 5.250%, 7/01/27 – AGC Insured | 7/17 at 100.00 | | AA– | | | 4,408,264 | |
| | 3,500 | | 5.125%, 7/01/37 – AGC Insured | 7/17 at 100.00 | | AA– | | | 3,868,375 | |
| | 9,825 | | Dormitory Authority of the State of New York, Revenue Bonds, New York and Presbyterian Hospital, Series 2004A, 5.250%, 8/15/15 – AGM Insured | 8/14 at 100.00 | | AA– | | | 10,506,069 | |
| | 900 | | Dutchess County Local Development Corporation, New York, Revenue Bonds, Health Quest System Inc, Series 2010A, 5.750%, 7/01/40 – AGM Insured | 7/20 at 100.00 | | A– | | | 1,042,812 | |
| | | Nuveen New York AMT-Free Municipal Income Fund (continued) |
| NRK | | Portfolio of Investments |
| | | March 31, 2013 (Unaudited) |
| | Principal | | | Optional Call | | | | | | |
| | Amount (000) | | Description (1) | Provisions (2) | | Ratings (3) | | | Value | |
| | | | Health Care (continued) | | | | | | | |
| $ | 1,875 | | Monroe County Industrial Development Corporation, New York, FHA Insured Mortgage Revenue Bonds, Unity Hospital of Rochester Project, Series 2010, 5.750%, 8/15/35 | 2/21 at 100.00 | | Aa2 | | $ | 2,251,181 | |
| | 6,540 | | Suffolk County Economic Development Corp / Nassau County Local Economic Assistance & Financing Corp., New York, Revenue Bonds, Catholic Health Services of Long Island Obligated Group Project, Series 2011, 5.000%, 7/01/28 | 7/21 at 100.00 | | A– | | | 7,405,831 | |
| | 4,850 | | Westchester County Health Care Corporation, New York, Senior Lien Revenue Bonds, Series 2010-C2, 6.125%, 11/01/37 | 11/20 at 100.00 | | A3 | | | 5,729,354 | |
| | 80,235 | | Total Health Care | | | | | | 88,884,010 | |
| | | | Housing/Multifamily – 2.6% (1.7% of Total Investments) | | | | | | | |
| | | | Canton Capital Resource Corporation, New York, Student Housing Facility Revenue Bonds, Grasse River LLC at SUNY Canton Project Series 2010A: | | | | | | | |
| | 1,000 | | 5.000%, 5/01/40 | 5/20 at 100.00 | | AA– | | | 1,087,880 | |
| | 1,000 | | 5.000%, 5/01/45 – AGM Insured | 5/20 at 100.00 | | AA– | | | 1,088,540 | |
| | | | New York City Housing Development Corporation, New York, Capital Fund Program Revenue Bonds, Series 2005A: | | | | | | | |
| | 4,600 | | 5.000%, 7/01/14 – FGIC Insured | No Opt. Call | | AA– | | | 4,855,990 | |
| | 4,600 | | 5.000%, 7/01/16 – FGIC Insured | 7/15 at 100.00 | | AA– | | | 5,058,206 | |
| | 18,865 | | New York City Housing Development Corporation, New York, Capital Fund Program Revenue Bonds, Series 2005A, 5.000%, 7/01/25 – NPFG Insured (UB) (4) | 7/15 at 100.00 | | AA– | | | 20,432,870 | |
| | 1,040 | | New York City Housing Development Corporation, New York, Multifamily Housing Revenue Bonds, Series 2010D-1A, 5.000%, 11/01/42 | 5/20 at 100.00 | | AA | | | 1,120,933 | |
| | 450 | | New York State Housing Finance Agency, Affordable Housing Revenue Bonds, Series 2009B, 4.500%, 11/01/29 | 5/19 at 100.00 | | Aa2 | | | 488,619 | |
| | | | New York State Housing Finance Agency, Mortgage Revenue Refunding Bonds, Housing Project, Series 1996A: | | | | | | | |
| | 70 | | 6.100%, 11/01/15 – AGM Insured | 5/13 at 100.00 | | AA– | | | 70,339 | |
| | 390 | | 6.125%, 11/01/20 – AGM Insured | 5/13 at 100.00 | | AA– | | | 390,987 | |
| | 32,015 | | Total Housing/Multifamily | | | | | | 34,594,364 | |
| | | | Long-Term Care – 0.1% (0.0% of Total Investments) | | | | | | | |
| | 800 | | Dormitory Authority of the State of New York, GNMA Collateralized Revenue Bonds, Cabrini of Westchester Project, Series 2006, 5.200%, 2/15/41 | 2/17 at 103.00 | | AA+ | | | 867,600 | |
| | | | Tax Obligation/General – 12.0% (7.9% of Total Investments) | | | | | | | |
| | 3,000 | | Dormitory Authority of the State of New York, School Districts Revenue Bond Financing Program, Peekskill City School District, Series 2005D, 5.000%, 10/01/33 – NPFG Insured | 10/15 at 100.00 | | Aa3 | | | 3,236,340 | |
| | 2,500 | | Erie County, New York, General Obligation Bonds, Series 2004B, 5.250%, 4/01/13 – NPFG Insured | No Opt. Call | | A2 | | | 2,500,947 | |
| | 2,000 | | Erie County, New York, General Obligation Bonds, Series 2005A, 5.000%, 12/01/18 – NPFG Insured | 12/15 at 100.00 | | A2 | | | 2,183,500 | |
| | 1,000 | | Nassau County, New York, General Obligation Bonds, General Improvement Series 2009C, 5.000%, 10/01/29 – AGC Insured | 10/19 at 100.00 | | AA– | | | 1,122,160 | |
| | 210 | | Nassau County, New York, General Obligation Improvement Bonds, Series 1993H, 5.500%, 6/15/16 – NPFG Insured | No Opt. Call | | A+ | | | 240,710 | |
| | 1,200 | | New York City, New York, General Obligation Bonds, Fiscal 2009 Series E, 5.000%, 8/01/28 | 8/19 at 100.00 | | AA | | | 1,425,180 | |
| | 3,000 | | New York City, New York, General Obligation Bonds, Fiscal 2010 Series C, 5.000%, 8/01/23 | 8/19 at 100.00 | | AA | | | 3,640,770 | |
| | 7,000 | | New York City, New York, General Obligation Bonds, Fiscal 2012 Series F, 5.000%, 8/01/31 | 2/22 at 100.00 | | AA | | | 8,030,120 | |
| | | | New York City, New York, General Obligation Bonds, Fiscal 2012 Series I: | | | | | | | |
| | 1,000 | | 5.000%, 8/01/30 | 8/22 at 100.00 | | AA | | | 1,157,870 | |
| | 2,000 | | 5.000%, 8/01/31 | 8/22 at 100.00 | | AA | | | 2,308,720 | |
| | | | New York City, New York, General Obligation Bonds, Fiscal 2013 Series A-1: | | | | | | | |
| | 5,000 | | 5.000%, 10/01/28 | 10/22 at 100.00 | | AA | | | 5,860,300 | |
| | 2,000 | | 5.000%, 10/01/32 | No Opt. Call | | AA | | | 2,306,420 | |
| | 3,300 | | 5.000%, 10/01/33 | 10/22 at 100.00 | | AA | | | 3,790,941 | |
| | Principal | | | Optional Call | | | | | | |
| | Amount (000) | | Description (1) | Provisions (2) | | Ratings (3) | | | Value | |
| | | | Tax Obligation/General (continued) | | | | | | | |
| | | | New York City, New York, General Obligation Bonds, Fiscal 2013 Series C: | | | | | | | |
| $ | 4,610 | | 5.000%, 8/01/25 | 8/22 at 100.00 | | AA | | $ | 5,520,521 | |
| | 7,190 | | 5.000%, 8/01/28 | 8/22 at 100.00 | | AA | | | 8,407,986 | |
| | | | New York City, New York, General Obligation Bonds, Fiscal 2013 Series F-1: | | | | | | | |
| | 3,600 | | 5.000%, 3/01/33 | 3/23 at 100.00 | | AA | | | 4,155,480 | |
| | 3,400 | | 5.000%, 3/01/31 (WI/DD, Settling 4/04/13) | 3/23 at 100.00 | | AA | | | 3,944,238 | |
| | | | New York City, New York, General Obligation Bonds, Fiscal Series 1998H: | | | | | | | |
| | 135 | | 5.125%, 8/01/25 – NPFG Insured | 5/13 at 100.00 | | AA | | | 135,548 | |
| | 70 | | 5.375%, 8/01/27 – NPFG Insured | 5/13 at 100.00 | | AA | | | 70,270 | |
| | | | New York City, New York, General Obligation Bonds, Fiscal Series 2001D: | | | | | | | |
| | 5 | | 5.250%, 8/01/15 – AGM Insured | 6/13 at 100.00 | | AA | | | 5,021 | |
| | 5 | | 5.000%, 8/01/16 – FGIC Insured | 6/13 at 100.00 | | AA | | | 5,020 | |
| | 10,330 | | New York City, New York, General Obligation Bonds, Fiscal Series 2005J, 5.000%, 3/01/19 – FGIC Insured | 3/15 at 100.00 | | AA | | | 11,230,260 | |
| | 750 | | New York City, New York, General Obligation Bonds, Fiscal Series 2006C, 5.000%, 8/01/16 – AGM Insured | 8/15 at 100.00 | | AA | | | 828,968 | |
| | 9,885 | | New York City, New York, General Obligation Bonds, Series 2011D-I, 5.000%, 10/01/29 | 10/21 at 100.00 | | AA | | | 11,387,915 | |
| | | | New York City, New York, General Obligation Bonds, Subseries G-1 Fiscal Series 2012: | | | | | | | |
| | 8,700 | | 5.000%, 4/01/26 | 4/22 at 100.00 | | AA | | | 10,308,195 | |
| | 6,225 | | 5.000%, 4/01/29 | 4/22 at 100.00 | | AA | | | 7,209,359 | |
| | | | New York City, New York, General Obligation Bonds, Series 2004E: | | | | | | | |
| | 12,550 | | 5.000%, 11/01/19 – AGM Insured (UB) | 11/14 at 100.00 | | AA | | | 13,465,022 | |
| | 7,850 | | 5.000%, 11/01/20 – AGM Insured (UB) | 11/14 at 100.00 | | AA | | | 8,422,344 | |
| | | | Pavilion Central School District, Genesee County, New York, General Obligation Bonds, Series 2005: | | | | | | | |
| | 1,650 | | 5.000%, 6/15/16 – AGM Insured | 6/15 at 100.00 | | AA– | | | 1,791,669 | |
| | 1,815 | | 5.000%, 6/15/18 – AGM Insured | 6/15 at 100.00 | | AA– | | | 1,992,434 | |
| | | | Rensselaer County, New York, General Obligation Bonds, Series 1991: | | | | | | | |
| | 960 | | 6.700%, 2/15/16 – AMBAC Insured | No Opt. Call | | AA– | | | 1,121,318 | |
| | 960 | | 6.700%, 2/15/17 – AMBAC Insured | No Opt. Call | | AA– | | | 1,170,950 | |
| | 960 | | 6.700%, 2/15/18 – AMBAC Insured | No Opt. Call | | AA– | | | 1,210,483 | |
| | 960 | | 6.700%, 2/15/19 – AMBAC Insured | No Opt. Call | | AA– | | | 1,248,442 | |
| | 960 | | 6.700%, 2/15/20 – AMBAC Insured | No Opt. Call | | AA– | | | 1,280,794 | |
| | 747 | | 6.700%, 2/15/21 – AMBAC Insured | No Opt. Call | | AA– | | | 1,016,757 | |
| | | | Rochester, New York, General Obligation Bonds, Series 1999: | | | | | | | |
| | 735 | | 5.250%, 10/01/20 – NPFG Insured | No Opt. Call | | Aa3 | | | 909,842 | |
| | 735 | | 5.250%, 10/01/21 – NPFG Insured | No Opt. Call | | Aa3 | | | 917,648 | |
| | 730 | | 5.250%, 10/01/22 – NPFG Insured | No Opt. Call | | Aa3 | | | 914,960 | |
| | 730 | | 5.250%, 10/01/23 – NPFG Insured | No Opt. Call | | Aa3 | | | 905,740 | |
| | 730 | | 5.250%, 10/01/24 – NPFG Insured | No Opt. Call | | Aa3 | | | 916,376 | |
| | 730 | | 5.250%, 10/01/25 – NPFG Insured | No Opt. Call | | Aa3 | | | 917,902 | |
| | 725 | | 5.250%, 10/01/26 – NPFG Insured | No Opt. Call | | Aa3 | | | 911,985 | |
| | 1,145 | | Three Village Central School District, Brookhaven and Smithtown, Suffolk County, New York, General Obligation Bonds, Series 2005, 5.000%, 6/01/18 – FGIC Insured | No Opt. Call | | Aa2 | | | 1,371,321 | |
| | 1,620 | | West Islip Union Free School District, Suffolk County, New York, General Obligation Bonds, Series 2005, 5.000%, 10/01/16 – AGM Insured | 10/15 at 100.00 | | Aa3 | | | 1,800,711 | |
| | 7,635 | | Yonkers, New York, General Obligation Bonds, Series 2005A, 5.000%, 8/01/16 – NPFG Insured | 8/15 at 100.00 | | BBB+ | | | 8,261,681 | |
| | | | Yonkers, New York, General Obligation Bonds, Series 2005B: | | | | | | | |
| | 2,190 | | 5.000%, 8/01/19 – NPFG Insured | 8/15 at 100.00 | | BBB+ | | | 2,329,919 | |
| | 2,305 | | 5.000%, 8/01/20 – NPFG Insured | 8/15 at 100.00 | | BBB+ | | | 2,443,692 | |
| | 137,537 | | Total Tax Obligation/General | | | | | | 156,334,749 | |
| | | Nuveen New York AMT-Free Municipal Income Fund (continued) |
| NRK | | Portfolio of Investments |
| | | March 31, 2013 (Unaudited) |
| | Principal | | | Optional Call | | | | | | |
| | Amount (000) | | Description (1) | Provisions (2) | | Ratings (3) | | | Value | |
| | | | Tax Obligation/Limited – 60.2% (39.6% of Total Investments) | | | | | | | |
| $ | 2,330 | | Dormitory Authority of the State of New York, 853 Schools Program Insured Revenue Bonds, Harmony Heights School, Issue 1, Series 1999C, 5.500%, 7/01/18 – AMBAC Insured | 7/13 at 100.00 | | N/R | | $ | 2,339,273 | |
| | 165 | | Dormitory Authority of the State of New York, 853 Schools Program Insured Revenue Bonds, Vanderheyden Hall Inc., Issue 2, Series 1998F, 5.250%, 7/01/18 – AMBAC Insured | 5/13 at 100.00 | | N/R | | | 165,619 | |
| | 1,645 | | Dormitory Authority of the State of New York, Consolidated Revenue Bonds, City University System, Series 1993A, 5.750%, 7/01/13 – NPFG Insured | No Opt. Call | | Aa3 | | | 1,668,326 | |
| | 2,265 | | Dormitory Authority of the State of New York, Department of Health Revenue Bonds, Series 2005A, 5.250%, 7/01/24 – CIFG Insured | 7/15 at 100.00 | | AA– | | | 2,489,303 | |
| | 1,095 | | Dormitory Authority of the State of New York, Insured Revenue Bonds, 853 Schools Program – Anderson School, Series 1999E, Issue 2, 5.750%, 7/01/19 – AMBAC Insured | 7/13 at 100.00 | | N/R | | | 1,099,588 | |
| | 9,145 | | Dormitory Authority of the State of New York, Insured Revenue Bonds, Special Act School District Program, Series 1999, 5.750%, 7/01/19 – NPFG Insured | 7/13 at 100.00 | | Baa2 | | | 9,182,495 | |
| | | | Dormitory Authority of the State of New York, Lease Revenue Bonds, Madison-Oneida Board of Cooperative Educational Services, Series 2002: | | | | | | | |
| | 1,045 | | 5.250%, 8/15/20 – AGM Insured | 5/13 at 100.00 | | AA– | | | 1,049,211 | |
| | 1,100 | | 5.250%, 8/15/21 – AGM Insured | 5/13 at 100.00 | | AA– | | | 1,104,389 | |
| | 365 | | 5.250%, 8/15/22 – AGM Insured | 5/13 at 100.00 | | AA– | | | 366,445 | |
| | 2,000 | | Dormitory Authority of the State of New York, Lease Revenue Bonds, Wayne-Finger Lakes Board of Cooperative Education Services, Series 2004, 5.000%, 8/15/23 – AGM Insured | 8/14 at 100.00 | | AA– | | | 2,123,580 | |
| | 1,000 | | Dormitory Authority of the State of New York, Master Lease Program Revenue Bonds, Nassau County Board of Cooperative Educational Services, Series 2009A, 5.000%, 8/15/28 – AGC Insured | 8/19 at 100.00 | | AA– | | | 1,130,510 | |
| | 10,840 | | Dormitory Authority of the State of New York, Revenue Bonds, Department of Health, Series 2004-2, 5.000%, 7/01/20 – FGIC Insured | 7/14 at 100.00 | | AA– | | | 11,480,752 | |
| | | | Dormitory Authority of the State of New York, Revenue Bonds, Mental Health Services Facilities Improvements, Series 2005D-1: | | | | | | | |
| | 5,315 | | 5.000%, 2/15/15 – FGIC Insured | No Opt. Call | | AA– | | | 5,768,688 | |
| | 4,715 | | 5.000%, 8/15/23 – FGIC Insured | 2/15 at 100.00 | | AA– | | | 5,092,624 | |
| | 65 | | Dormitory Authority of the State of New York, Revenue Bonds, School Districts Financing Program, Series 2002D, 5.250%, 10/01/23 – NPFG Insured | 5/13 at 100.00 | | A+ | | | 65,262 | |
| | 1,000 | | Dormitory Authority of the State of New York, Revenue Bonds, School Districts Financing Program, Series 2009A, 5.625%, 10/01/29 – AGC Insured | 10/19 at 100.00 | | AA– | | | 1,166,370 | |
| | 4,000 | | Dormitory Authority of the State of New York, Revenue Bonds, State University Educational Facilities, 1989 Resolution, Series 2000C, 5.750%, 5/15/16 – AGM Insured | No Opt. Call | | AA– | | | 4,634,360 | |
| | 1,000 | | Dormitory Authority of the State of New York, Revenue Bonds, State University Educational Facilities, Series 1993A, 5.500%, 5/15/19 – AMBAC Insured | No Opt. Call | | Aa3 | | | 1,183,730 | |
| | 4,115 | | Dormitory Authority of the State of New York, Second General Resolution Consolidated Revenue Bonds, City University System, Series 1993A, 5.750%, 7/01/18 – AGM Insured | No Opt. Call | | AA– | | | 4,737,311 | |
| | | | Dormitory Authority of the State of New York, State Personal Income Tax Revenue Bonds, General Purpose Series 2011C: | | | | | | | |
| | 8,545 | | 5.000%, 3/15/34 | No Opt. Call | | AAA | | | 9,641,067 | |
| | 50,170 | | 5.000%, 3/15/41 | 3/21 at 100.00 | | AAA | | | 56,043,905 | |
| | 18,385 | | Dormitory Authority of the State of New York, State Personal Income Tax Revenue Bonds, General Purpose Series 2012D, 5.000%, 2/15/31 | 2/22 at 100.00 | | AAA | | | 21,209,120 | |
| | 155 | | Dormitory Authority of the State of New York, State Personal Income Tax Revenue Bonds, Series 2005F, 5.000%, 3/15/21 – AGM Insured | 3/15 at 100.00 | | AAA | | | 168,834 | |
| | 3,540 | | Erie County Industrial Development Agency, New York, School Facility Revenue Bonds, Buffalo City School District Project, Series 2008A, 5.750%, 5/01/27 – AGM Insured (UB) | 5/18 at 100.00 | | AA– | | | 4,198,192 | |
| | 10,125 | | Erie County Industrial Development Agency, New York, School Facility Revenue Bonds, Buffalo City School District Project, Series 2009A, 5.000%, 5/01/31 | 5/19 at 100.00 | | AA– | | | 11,406,623 | |
| | 5,000 | | Erie County Industrial Development Agency, New York, School Facility Revenue Bonds, Buffalo City School District Project, Series 2008A, 5.750%, 5/01/28 – AGM Insured (UB) | 5/18 at 100.00 | | AA– | | | 5,897,701 | |
| | | | Erie County Industrial Development Agency, New York, School Facility Revenue Bonds, Buffalo City School District, Series 2007A: | | | | | | | |
| | 5,980 | | 5.750%, 5/01/27 – AGM Insured (UB) | 5/17 at 100.00 | | AA– | | | 6,925,318 | |
| | 21,030 | | 5.750%, 5/01/28 – AGM Insured (UB) | 5/17 at 100.00 | | AA– | | | 24,354,423 | |
| | Principal | | | Optional Call | | | | | | |
| | Amount (000) | | Description (1) | Provisions (2) | | Ratings (3) | | | Value | |
| | | | Tax Obligation/Limited (continued) | | | | | | | |
| | | | Hudson Yards Infrastructure Corporation, New York, Revenue Bonds, Senior Fiscal 2012 Series 2011A: | | | | | | | |
| $ | 19,730 | | 5.750%, 2/15/47 | 2/21 at 100.00 | | A | | $ | 23,137,174 | |
| | 1,850 | | 5.000%, 2/15/47 – AGM Insured | 2/21 at 100.00 | | AA– | | | 2,029,191 | |
| | | | Hudson Yards Infrastructure Corporation, New York, Revenue Bonds, Series 2006A: | | | | | | | |
| | 51,590 | | 5.000%, 2/15/47 – FGIC Insured | 2/17 at 100.00 | | A | | | 54,891,760 | |
| | 4,200 | | 5.000%, 2/15/47 – AGM Insured | 2/17 at 100.00 | | AA– | | | 4,475,562 | |
| | 4,830 | | Metropolitan Transportation Authority, New York, Dedicated Tax Fund Bonds, Refunding Series 2012A, 5.000%, 11/15/29 | 11/22 at 100.00 | | AA | | | 5,701,284 | |
| | | | Metropolitan Transportation Authority, New York, State Service Contract Refunding Bonds, Series 2002A: | | | | | | | |
| | 1,000 | | 5.750%, 7/01/18 – AGM Insured | No Opt. Call | | AA– | | | 1,236,060 | |
| | 9,000 | | 5.750%, 7/01/18 – AGM Insured (UB) | No Opt. Call | | AA– | | | 11,124,540 | |
| | 560 | | Monroe Newpower Corporation, New York, Power Facilities Revenue Bonds, Series 2003, 5.500%, 1/01/34 | 1/15 at 100.00 | | BBB | | | 565,852 | |
| | 4,820 | | Nassau County Interim Finance Authority, New York, Sales and Use Tax Revenue Bonds, Series 2004H, 5.250%, 11/15/13 – AMBAC Insured | No Opt. Call | | AAA | | | 4,976,505 | |
| | | | New York City Sales Tax Asset Receivable Corporation, New York, Dedicated Revenue Bonds, Local Government Assistance Corporation, Series 2004A: | | | | | | | |
| | 3,400 | | 5.000%, 10/15/25 – NPFG Insured | 10/14 at 100.00 | | AAA | | | 3,636,504 | |
| | 10,090 | | 5.000%, 10/15/25 – NPFG Insured (UB) (4) | 10/14 at 100.00 | | AAA | | | 10,791,860 | |
| | 1,040 | | 5.000%, 10/15/26 – NPFG Insured | 10/14 at 100.00 | | AAA | | | 1,111,666 | |
| | 6,785 | | 5.000%, 10/15/26 – NPFG Insured (UB) (4) | 10/14 at 100.00 | | AAA | | | 7,252,555 | |
| | 300 | | 5.000%, 10/15/29 – AMBAC Insured | 10/14 at 100.00 | | AAA | | | 319,335 | |
| | 21,610 | | 5.000%, 10/15/29 – AMBAC Insured (UB) (4) | 10/14 at 100.00 | | AAA | | | 23,002,765 | |
| | 5,155 | | 5.000%, 10/15/32 – AMBAC Insured | 10/14 at 100.00 | | AAA | | | 5,477,342 | |
| | 4,500 | | 5.000%, 10/15/32 – AMBAC Insured (UB) (4) | 10/14 at 100.00 | | AAA | | | 4,781,385 | |
| | 9,000 | | 5.000%, 10/15/32 – AGM Insured | 10/14 at 100.00 | | AAA | | | 9,562,770 | |
| | 10,440 | | New York City Transitional Finance Authority, New York, Building Aid Revenue Bonds, Fiscal Series 2007S-2, 5.000%, 1/15/28 – FGIC Insured | 1/17 at 100.00 | | AA– | | | 11,698,124 | |
| | | | New York City Transitional Finance Authority, New York, Future Tax Secured Bonds, Fiscal 2012 Series E-1: | | | | | | | |
| | 5,100 | | 5.000%, 2/01/35 | 2/22 at 100.00 | | AAA | | | 5,825,067 | |
| | 6,225 | | 5.000%, 2/01/37 | 2/22 at 100.00 | | AAA | | | 7,079,132 | |
| | 16,655 | | 5.000%, 2/01/42 | 2/22 at 100.00 | | AAA | | | 18,627,285 | |
| | 40,000 | | New York City Transitional Finance Authority, New York, Future Tax Secured Bonds, Fiscal 2012 Series F-1, 5.000%, 5/01/39 | 5/22 at 100.00 | | AAA | | | 44,951,600 | |
| | 5 | | New York City Transitional Finance Authority, New York, Future Tax Secured Bonds, Fiscal Series 2001B, 5.250%, 5/01/16 – NPFG Insured | 6/13 at 100.00 | | AAA | | | 5,021 | |
| | 155 | | New York City Transitional Finance Authority, New York, Future Tax Secured Bonds, Fiscal Series 2003E, 5.250%, 2/01/22 – NPFG Insured | 5/13 at 100.00 | | AAA | | | 155,648 | |
| | 5 | | New York City Transitional Finance Authority, New York, Future Tax Secured Bonds, Fiscal Series 2004C, 5.000%, 2/01/19 – SYNCORA GTY Insured | 2/14 at 100.00 | | AAA | | | 5,201 | |
| | 3,800 | | New York City Transitional Finance Authority, New York, Future Tax Secured Bonds, Fiscal Series 2007B, 5.000%, 11/01/30 | 5/17 at 100.00 | | AAA | | | 4,298,712 | |
| | 5,000 | | New York City Transitional Finance Authority, New York, Future Tax Secured Bonds, Series 2009A-1, 5.000%, 5/01/36 | 5/19 at 100.00 | | AAA | | | 5,674,900 | |
| | | | New York City Transitional Finance Authority, New York, Future Tax Secured Revenue Bonds, Subordinate Lien Series 2011C: | | | | | | | |
| | 10,000 | | 5.500%, 11/01/35 | 11/20 at 100.00 | | AAA | | | 11,831,000 | |
| | 8,000 | | 5.000%, 11/01/39 | 11/20 at 100.00 | | AAA | | | 8,937,760 | |
| | | | New York City Transitional Finance Authority, New York, Future Tax Secured Revenue Bonds, SubSeries 2011D-1: | | | | | | | |
| | 2,000 | | 5.250%, 2/01/30 | 2/21 at 100.00 | | AAA | | | 2,354,320 | |
| | 1,480 | | 5.000%, 2/01/35 | 2/21 at 100.00 | | AAA | | | 1,669,425 | |
| | | Nuveen New York AMT-Free Municipal Income Fund (continued) |
| NRK | | Portfolio of Investments |
| | | March 31, 2013 (Unaudited) |
| | Principal | | | Optional Call | | | | | | |
| | Amount (000) | | Description (1) | Provisions (2) | | Ratings (3) | | | Value | |
| | | | Tax Obligation/Limited (continued) | | | | | | | |
| | | | New York City, New York, Educational Construction Fund, Revenue Bonds, Series 2011A: | | | | | | | |
| $ | 18,575 | | 5.750%, 4/01/33 – AGM Insured | 4/21 at 100.00 | | AA+ | | $ | 22,539,648 | |
| | 4,000 | | 5.750%, 4/01/41 | 4/21 at 100.00 | | AA– | | | 4,813,920 | |
| | | | New York Convention Center Development Corporation, Hotel Fee Revenue Bonds, Tender Option Bonds Trust 3095: | | | | | | | |
| | 2,890 | | 13.619%, 11/15/30 – AMBAC Insured (IF) (4) | 11/15 at 100.00 | | AA+ | | | 3,358,209 | |
| | 12,940 | | 13.605%, 11/15/44 – AMBAC Insured (IF) (4) | 11/15 at 100.00 | | AA+ | | | 14,543,395 | |
| | 8,250 | | New York State Local Government Assistance Corporation, Revenue Bonds, Series 1993E, 5.250%, 4/01/16 – AGM Insured (UB) | No Opt. Call | | AAA | | | 9,137,123 | |
| | | | New York State Thruway Authority, Highway and Bridge Trust Fund Bonds, Second General, Series 2004A: | | | | | | | |
| | 2,000 | | 5.000%, 4/01/22 – NPFG Insured | 4/14 at 100.00 | | AA | | | 2,095,560 | |
| | 1,000 | | 5.000%, 4/01/23 – NPFG Insured | 4/14 at 100.00 | | AA | | | 1,047,580 | |
| | | | New York State Thruway Authority, Highway and Bridge Trust Fund Bonds, Second General, Series 2005B: | | | | | | | |
| | 30,795 | | 5.500%, 4/01/20 – AMBAC Insured | No Opt. Call | | AA | | | 38,792,462 | |
| | 6,600 | | 5.000%, 4/01/21 – AMBAC Insured | 10/15 at 100.00 | | AA | | | 7,312,272 | |
| | 4,500 | | New York State Thruway Authority, State Personal Income Tax Revenue Bonds, Series 2004A, 5.000%, 3/15/24 – AMBAC Insured | 9/14 at 100.00 | | AAA | | | 4,796,820 | |
| | | | New York State Thruway Authority, State Personal Income Tax Revenue Bonds, Series 2010A: | | | | | | | |
| | 1,600 | | 5.000%, 3/15/29 | 9/20 at 100.00 | | AAA | | | 1,877,456 | |
| | 1,195 | | 5.000%, 3/15/30 | 9/20 at 100.00 | | AAA | | | 1,408,212 | |
| | | | New York State Tobacco Settlement Financing Corporation, Tobacco Settlement Asset-Backed and State Contingency Contract-Backed Bonds, Series 2003A-1: | | | | | | | |
| | 35,000 | | 5.250%, 6/01/20 – AMBAC Insured | 6/13 at 100.00 | | AA– | | | 35,302,050 | |
| | 2,000 | | 5.250%, 6/01/21 – AMBAC Insured | 6/13 at 100.00 | | AA– | | | 2,017,200 | |
| | 14,865 | | 5.250%, 6/01/22 – AMBAC Insured | 6/13 at 100.00 | | AA– | | | 14,991,650 | |
| | 1,500 | | New York State Tobacco Settlement Financing Corporation, Tobacco Settlement Asset-Backed and State Contingency Contract-Backed Bonds, Series 2003B-1C, 5.500%, 6/01/21 | 6/13 at 100.00 | | AA– | | | 1,513,875 | |
| | 665 | | New York State Urban Development Corporation, Revenue Bonds, Correctional Facilities, Series 1994A, 5.250%, 1/01/14 – AGM Insured | No Opt. Call | | AA– | | | 690,616 | |
| | 2,175 | | New York State Urban Development Corporation, Revenue Refunding Bonds, State Facilities, Series 1995, 5.600%, 4/01/15 – NPFG Insured | No Opt. Call | | AA– | | | 2,278,530 | |
| | 8,600 | | New York State Urban Development Corporation, Revenue Refunding Bonds, State Facilities, Series 1995, 5.700%, 4/01/20 – AGM Insured (UB) | No Opt. Call | | AA– | | | 10,332,212 | |
| | 2,000 | | New York State Urban Development Corporation, State Personal Income Tax Revenue Bonds, Series 2005B, 5.000%, 3/15/30 – AGM Insured | 3/15 at 100.00 | | AAA | | | 2,077,840 | |
| | 3,325 | | Niagara Falls City School District, Niagara County, New York, Certificates of Participation, High School Facility, Series 2005, 5.000%, 6/15/28 – AGM Insured | 6/15 at 100.00 | | AA– | | | 3,467,343 | |
| | | | Puerto Rico Highway and Transportation Authority, Highway Revenue Refunding Bonds, Series 2002E: | | | | | | | |
| | 3,000 | | 5.500%, 7/01/14 – AGM Insured | No Opt. Call | | AA– | | | 3,125,160 | |
| | 11,000 | | 5.500%, 7/01/18 – AGM Insured | No Opt. Call | | AA– | | | 12,342,220 | |
| | 7,500 | | Puerto Rico Sales Tax Financing Corporation, Sales Tax Revenue Bonds, First Subordinate Series 2009A, 0.000%, 8/01/32 | 8/26 at 100.00 | | A+ | | | 7,764,525 | |
| | | | Puerto Rico Sales Tax Financing Corporation, Sales Tax Revenue Bonds, First Subordinate Series 2010A: | | | | | | | |
| | 2,000 | | 0.000%, 8/01/33 | 8/29 at 100.00 | | A+ | | | 1,574,060 | |
| | 7,000 | | 5.000%, 8/01/40 – AGM Insured | 2/20 at 100.00 | | AA– | | | 7,172,690 | |
| | 6,765 | | Puerto Rico Sales Tax Financing Corporation, Sales Tax Revenue Bonds, First Subordinate Series 2010C, 5.125%, 8/01/42 – AGM Insured | 8/20 at 100.00 | | AA– | | | 7,011,449 | |
| | | | Puerto Rico Sales Tax Financing Corporation, Sales Tax Revenue Bonds, Senior Series 2011C: | | | | | | | |
| | 22,000 | | 0.000%, 8/01/37 | No Opt. Call | | AA– | | | 5,697,340 | |
| | 46,150 | | 0.000%, 8/01/39 | No Opt. Call | | AA– | | | 10,487,126 | |
| | Principal | | | Optional Call | | | | | | |
| | Amount (000) | | Description (1) | Provisions (2) | | Ratings (3) | | | Value | |
| | | | Tax Obligation/Limited (continued) | | | | | | | |
| | | | Puerto Rico Sales Tax Financing Corporation, Sales Tax Revenue Bonds, Series 2007A: | | | | | | | |
| $ | 11,000 | | 0.000%, 8/01/41 – NPFG Insured | No Opt. Call | | AA– | | $ | 2,162,160 | |
| | 13,520 | | 0.000%, 8/01/42 – NPFG Insured | No Opt. Call | | AA– | | | 2,483,624 | |
| | 25,395 | | 0.000%, 8/01/44 – NPFG Insured | No Opt. Call | | AA– | | | 4,104,848 | |
| | 9,250 | | 0.000%, 8/01/45 – NPFG Insured | No Opt. Call | | AA– | | | 1,402,300 | |
| | 201,690 | | 0.000%, 8/01/46 – NPFG Insured | No Opt. Call | | AA– | | | 28,583,507 | |
| | 99,130 | | 0.000%, 8/01/47 – AMBAC Insured | No Opt. Call | | AA– | | | 13,125,803 | |
| | 1,090 | | Suffolk County Industrial Development Agency, New York, Revenue Bonds, Hampton Bays Public Library, Series 1999A, 6.000%, 10/01/19 – NPFG Insured | 10/13 at 100.00 | | Baa2 | | | 1,094,022 | |
| | 1,075,425 | | Total Tax Obligation/Limited | | | | | | 786,405,131 | |
| | | | Transportation – 10.8% (7.1% of Total Investments) | | | | | | | |
| | 500 | | Metropolitan Transportation Authority, New York, Transportation Revenue Bonds, Refunding Series 2012H, 5.000%, 11/15/29 | No Opt. Call | | A | | | 573,400 | |
| | 4,000 | | Metropolitan Transportation Authority, New York, Transportation Revenue Bonds, Series 2003A, 5.000%, 11/15/25 – AGM Insured | 11/13 at 100.00 | | AA– | | | 4,109,480 | |
| | | | Metropolitan Transportation Authority, New York, Transportation Revenue Bonds, Series 2005A: | | | | | | | |
| | 4,500 | | 4.750%, 11/15/27 – NPFG Insured | 11/15 at 100.00 | | AA– | | | 4,889,790 | |
| | 10,000 | | 4.750%, 11/15/30 – AMBAC Insured | 11/15 at 100.00 | | A | | | 10,709,000 | |
| | 7,575 | | Metropolitan Transportation Authority, New York, Transportation Revenue Bonds, Series 2006B, 4.500%, 11/15/36 – AGM Insured | 11/16 at 100.00 | | AA– | | | 7,906,861 | |
| | 1,000 | | Metropolitan Transportation Authority, New York, Transportation Revenue Bonds, Series 2011A, 5.000%, 11/15/41 | 11/21 at 100.00 | | A | | | 1,100,300 | |
| | 5,195 | | Metropolitan Transportation Authority, New York, Transportation Revenue Bonds, Series 2012C, 5.000%, 11/15/41 | 11/22 at 100.00 | | A | | | 5,735,540 | |
| | 16,090 | | Metropolitan Transportation Authority, New York, Transportation Revenue Bonds, Series 2013B, 5.000%, 11/15/30 (WI/DD, Settling 4/02/13) | 5/23 at 100.00 | | A | | | 18,361,586 | |
| | 8,055 | | New York Liberty Development Corporation, Liberty Revenue Bonds, 4 World Trade Center Project, Series 2011, 5.000%, 11/15/44 | 11/21 at 100.00 | | A+ | | | 8,862,917 | |
| | 3,420 | | New York State Thruway Authority, General Revenue Bonds, Refunding Series 2007H, 5.000%, 1/01/25 – FGIC Insured | 1/18 at 100.00 | | A+ | | | 3,924,416 | |
| | | | New York State Thruway Authority, General Revenue Bonds, Series 2005F: | | | | | | | |
| | 10,910 | | 5.000%, 1/01/20 – AMBAC Insured | 1/15 at 100.00 | | A+ | | | 11,749,306 | |
| | 12,100 | | 5.000%, 1/01/30 – AMBAC Insured | 1/15 at 100.00 | | A+ | | | 12,874,400 | |
| | | | New York State Thruway Authority, General Revenue Bonds, Series 2005G: | | | | | | | |
| | 5,800 | | 5.000%, 1/01/30 – AGM Insured (UB) | 7/15 at 100.00 | | AA– | | | 6,261,912 | |
| | 3,000 | | 5.000%, 1/01/32 – AGM Insured | 7/15 at 100.00 | | AA– | | | 3,238,920 | |
| | 7,615 | | New York State Thruway Authority, General Revenue Bonds, Series 2012I, 5.000%, 1/01/42 | 1/22 at 100.00 | | A+ | | | 8,370,332 | |
| | | | Port Authority of New York and New Jersey, Consolidated Revenue Bonds, One Hundred Fortieth Series 2005: | | | | | | | |
| | 2,580 | | 5.000%, 12/01/19 – AGM Insured | 6/15 at 101.00 | | AA– | | | 2,857,660 | |
| | 4,625 | | 5.000%, 12/01/28 – SYNCORA GTY Insured | 6/15 at 101.00 | | AA– | | | 5,049,251 | |
| | 5,760 | | 5.000%, 12/01/31 – SYNCORA GTY Insured | 6/15 at 101.00 | | AA– | | | 6,231,456 | |
| | 4,185 | | Port Authority of New York and New Jersey, Consolidated Revenue Bonds, One Hundred Forty Eighth Series 2008, Trust 2920, 17.812%, 8/15/32 – AGM Insured (IF) | 8/17 at 100.00 | | AA– | | | 6,411,085 | |
| | | | Triborough Bridge and Tunnel Authority, New York, Subordinate Lien General Purpose Revenue Refunding Bonds, Series 2002E: | | | | | | | |
| | 5,480 | | 5.500%, 11/15/20 – NPFG Insured | No Opt. Call | | A+ | | | 6,954,778 | |
| | 5,070 | | 5.250%, 11/15/22 – NPFG Insured | 5/13 at 100.00 | | A+ | | | 5,091,091 | |
| | 127,460 | | Total Transportation | | | | | | 141,263,481 | |
| | | Nuveen New York AMT-Free Municipal Income Fund (continued) |
| NRK | | Portfolio of Investments |
| | | March 31, 2013 (Unaudited) |
| | Principal | | | Optional Call | | | | | | |
| | Amount (000) | | Description (1) | Provisions (2) | | Ratings (3) | | | Value | |
| | | | U.S. Guaranteed – 9.0% (5.9% of Total Investments) (5) | | | | | | | |
| | | | Dormitory Authority of the State of New York, Judicial Facilities Lease Revenue Bonds, Suffolk County Issue, Series 1986: | | | | | | | |
| $ | 1,520 | | 7.375%, 7/01/16 (ETM) | No Opt. Call | | Aaa | | $ | 1,695,454 | |
| | 485 | | 7.375%, 7/01/16 – BIGI Insured (ETM) | No Opt. Call | | Aaa | | | 540,984 | |
| | | | Dormitory Authority of the State of New York, Revenue Bonds, Memorial Sloan-Kettering Cancer Center, Series 2003-1: | | | | | | | |
| | 2,765 | | 5.000%, 7/01/21 (Pre-refunded 7/01/13) – NPFG Insured | 7/13 at 100.00 | | AA (5) | | | 2,798,982 | |
| | 5,760 | | 5.000%, 7/01/22 (Pre-refunded 7/01/13) – NPFG Insured | 7/13 at 100.00 | | AA (5) | | | 5,830,790 | |
| | 1,000 | | Dormitory Authority of the State of New York, Revenue Bonds, Mount St. Mary College, Series 2003, 5.000%, 7/01/32 (Pre-refunded 7/01/13) – RAAI Insured | 7/13 at 100.00 | | A– (5) | | | 1,012,160 | |
| | 500 | | Dormitory Authority of the State of New York, Revenue Bonds, North Shore Long Island Jewish Group, Series 2003, 5.375%, 5/01/23 (Pre-refunded 5/01/13) | 5/13 at 100.00 | | Aaa | | | 502,360 | |
| | 750 | | Dormitory Authority of the State of New York, Revenue Bonds, South Nassau Communities Hospital, Series 2003B, 5.500%, 7/01/23 (Pre-refunded 7/01/13) | 7/13 at 100.00 | | Baa1 (5) | | | 760,185 | |
| | 7,480 | | Dormitory Authority of the State of New York, Revenue Bonds, The New York and Presbyterian Hospital Project, Series 2007, 5.000%, 8/15/36 (Pre-refunded 8/15/14) – AGM Insured | 8/14 at 100.00 | | AA– (5) | | | 7,958,047 | |
| | 2,885 | | Dormitory Authority of the State of New York, State Personal Income Tax Revenue Bonds, Series 2005F, 5.000%, 3/15/21 (Pre-refunded 3/15/15) – AGM Insured | 3/15 at 100.00 | | AA– (5) | | | 3,149,295 | |
| | 505 | | Dormitory Authority of the State of New York, Suffolk County, Lease Revenue Bonds, Judicial Facilities, Series 1991A, 9.500%, 4/15/14 – FGIC Insured (ETM) | 10/13 at 100.81 | | Baa1 (5) | | | 534,320 | |
| | 5,200 | | Erie County Industrial Development Agency, New York, School Facility Revenue Bonds, Buffalo City School District, Series 2004, 5.750%, 5/01/26 (Pre-refunded 5/01/14) – AGM Insured | 5/14 at 100.00 | | AA– (5) | | | 5,512,312 | |
| | 35 | | Erie County Water Authority, New York, Water Revenue Bonds, Series 1990B, 6.750%, 12/01/14 – AMBAC Insured (ETM) | No Opt. Call | | AA (5) | | | 37,472 | |
| | 2,620 | | Long Island Power Authority, New York, Electric System General Revenue Bonds, Series 2003C, 5.000%, 9/01/16 (Pre-refunded 9/01/13) – CIFG Insured | 9/13 at 100.00 | | A (5) | | | 2,673,815 | |
| | 945 | | Metropolitan Transportation Authority, New York, Commuter Facilities Revenue Bonds, Series 1997B, 5.000%, 7/01/20 – AMBAC Insured (ETM) | 5/13 at 100.00 | | N/R (5) | | | 986,986 | |
| | | | Metropolitan Transportation Authority, New York, Dedicated Tax Fund Bonds, Series 1998A: | | | | | | | |
| | 5,090 | | 5.000%, 4/01/23 (Pre-refunded 10/01/15) – FGIC Insured | 10/15 at 100.00 | | AA+ (5) | | | 5,681,916 | |
| | 11,000 | | 4.750%, 4/01/28 (Pre-refunded 10/01/15) – FGIC Insured | 10/15 at 100.00 | �� | AA+ (5) | | | 12,193,060 | |
| | | | Metropolitan Transportation Authority, New York, Dedicated Tax Fund Bonds, Series 1999A: | | | | | | | |
| | 8,000 | | 5.000%, 4/01/17 (Pre-refunded 10/01/14) – AGM Insured | 10/14 at 100.00 | | AA+ (5) | | | 8,573,600 | |
| | 5,750 | | 5.000%, 4/01/29 (Pre-refunded 10/01/14) – AGM Insured | 10/14 at 100.00 | | AA+ (5) | | | 6,162,275 | |
| | | | Metropolitan Transportation Authority, New York, Transit Facilities Revenue Bonds, Series 1998B: | | | | | | | |
| | 10,000 | | 4.875%, 7/01/18 – FGIC Insured (ETM) | 5/13 at 100.00 | | AA+ (5) | | | 10,157,600 | |
| | 4,500 | | 4.750%, 7/01/26 – FGIC Insured (ETM) | 5/13 at 100.00 | | AA+ (5) | | | 4,609,350 | |
| | | | Nassau County Interim Finance Authority, New York, Sales Tax Secured Revenue Bonds, Series 2003A: | | | | | | | |
| | 3,000 | | 5.000%, 11/15/18 (Pre-refunded 11/15/13) – AMBAC Insured | 11/13 at 100.00 | | AAA | | | 3,090,690 | |
| | 1,500 | | 4.750%, 11/15/21 (Pre-refunded 11/15/13) – AMBAC Insured | 11/13 at 100.00 | | AAA | | | 1,542,990 | |
| | 1,500 | | 4.750%, 11/15/22 (Pre-refunded 11/15/13) – AMBAC Insured | 11/13 at 100.00 | | AAA | | | 1,542,990 | |
| | 850 | | New York City Municipal Water Finance Authority, New York, Water and Sewerage System Revenue Bonds, Fiscal Series 2004C, 5.000%, 6/15/35 (Pre-refunded 6/15/14) – AMBAC Insured | 6/14 at 100.00 | | Aa1 (5) | | | 899,190 | |
| | 10,000 | | New York City Municipal Water Finance Authority, New York, Water and Sewerage System Revenue Refunding Bonds, Fiscal Series 2003E, 5.000%, 6/15/34 (Pre-refunded 6/15/13) | 6/13 at 100.00 | | AAA | | | 10,103,400 | |
| | 7,340 | | New York City Transitional Finance Authority, New York, Future Tax Secured Bonds, Fiscal Series 2004C, 5.000%, 2/01/19 (Pre-refunded 2/01/14) – SYNCORA GTY Insured | 2/14 at 100.00 | | AAA | | | 7,636,903 | |
| | 500 | | New York State Urban Development Corporation, State Personal Income Tax Revenue Bonds, Series 2005B, 5.000%, 3/15/30 (Pre-refunded 3/15/15) – AGM Insured | 3/15 at 100.00 | | AA– (5) | | | 545,805 | |
| | 9,395 | | Suffolk County Water Authority, New York, Waterworks Revenue Bonds, Series 2005C, 5.000%, 6/01/28 (Pre-refunded 6/01/15) – NPFG Insured | 6/15 at 100.00 | | AAA | | | 10,314,771 | |
| | 110,875 | | Total U.S. Guaranteed | | | | | | 117,047,702 | |
| | Principal | | | Optional Call | | | | | | |
| | Amount (000) | | Description (1) | Provisions (2) | | Ratings (3) | | | Value | |
| | | | Utilities – 11.1% (7.3% of Total Investments) | | | | | | | |
| $ | 2,450 | | Chautauqua County Industrial Development Agency, New York, Exempt Facility Revenue Bonds, NRG Dunkirk Power Project, Series 2009, 5.875%, 4/01/42 | 2/20 at 100.00 | | Baa3 | | $ | 2,731,750 | |
| | 3,000 | | Guam Power Authority, Revenue Bonds, Series 2010A, 5.000%, 10/01/37 – AGM Insured | 10/20 at 100.00 | | AA– | | | 3,195,900 | |
| | 1,045 | | Guam Power Authority, Revenue Bonds, Series 2012A, 5.000%, 10/01/34 | 10/22 at 100.00 | | BBB | | | 1,151,036 | |
| | | | Long Island Power Authority, New York, Electric System General Revenue Bonds, Series 2000A: | | | | | | | |
| | 8,000 | | 0.000%, 6/01/24 – AGM Insured | No Opt. Call | | AA– | | | 5,826,560 | |
| | 8,000 | | 0.000%, 6/01/25 – AGM Insured | No Opt. Call | | AA– | | | 5,549,280 | |
| | 20,000 | | 0.000%, 6/01/26 – AGM Insured | No Opt. Call | | AA– | | | 13,138,200 | |
| | 10,000 | | 0.000%, 6/01/27 – AGM Insured | No Opt. Call | | AA– | | | 6,196,500 | |
| | 15,000 | | 0.000%, 6/01/28 – AGM Insured | No Opt. Call | | AA– | | | 8,826,750 | |
| | 10,000 | | 0.000%, 6/01/29 – AGM Insured | No Opt. Call | | AA– | | | 5,592,900 | |
| | | | Long Island Power Authority, New York, Electric System General Revenue Bonds, Series 2006A: | | | | | | | |
| | 21,830 | | 5.000%, 12/01/23 – FGIC Insured | 6/16 at 100.00 | | A | | | 24,199,865 | |
| | 27,015 | | 5.000%, 12/01/25 – FGIC Insured | 6/16 at 100.00 | | A | | | 29,876,969 | |
| | 11,000 | | 5.000%, 12/01/26 – AGC Insured | 6/16 at 100.00 | | AA+ | | | 12,165,340 | |
| | 2,750 | | Long Island Power Authority, New York, Electric System General Revenue Bonds, Series 2006B, 5.000%, 12/01/35 – CIFG Insured | 6/16 at 100.00 | | A | | | 2,966,618 | |
| | 3,310 | | Long Island Power Authority, New York, Electric System Revenue Bonds, Series 2008A, 5.500%, 5/01/33 – BHAC Insured | 5/19 at 100.00 | | AA+ | | | 3,896,036 | |
| | 5,000 | | Long Island Power Authority, New York, Electric System Revenue Bonds, Series 2011A, 5.000%, 5/01/38 | 5/21 at 100.00 | | A | | | 5,427,100 | |
| | 5,000 | | New York State Energy Research and Development Authority, Pollution Control Revenue Refunding Bonds, Niagara Mohawk Power Corporation, Series 1998A, 5.150%, 11/01/25 – AMBAC Insured | 5/13 at 100.00 | | A– | | | 5,009,050 | |
| | 6,500 | | Niagara Area Development Corporation, New York, Solid Waste Disposal Facility Revenue Refunding Bonds, Covanta Energy Project, Series 2012B, 4.000%, 11/01/24 | No Opt. Call | | BB+ | | | 6,706,245 | |
| | 2,635 | | Power Authority of the State of New York, General Revenue Bonds, Series 2006A, 5.000%, 11/15/19 – FGIC Insured | 11/15 at 100.00 | | Aa2 | | | 2,948,539 | |
| | 162,535 | | Total Utilities | | | | | | 145,404,638 | |
| | | | Water and Sewer – 8.6% (5.7% of Total Investments) | | | | | | | |
| | 800 | | New York City Municipal Water Finance Authority, New York, Water and Sewer System Revenue Bonds, Fiscal 2009 Series 2008A, 5.750%, 6/15/40 | No Opt. Call | | AAA | | | 945,632 | |
| | 10,000 | | New York City Municipal Water Finance Authority, New York, Water and Sewer System Revenue Bonds, Second Generation Resolution, Fiscal 2010 Series 2009BB, 5.000%, 6/15/27 | 6/19 at 100.00 | | AA+ | | | 11,919,700 | |
| | 19,660 | | New York City Municipal Water Finance Authority, New York, Water and Sewer System Revenue Bonds, Second Generation Resolution, Fiscal 2012 Series BB, 5.000%, 6/15/44 | 12/21 at 100.00 | | AA+ | | | 21,694,220 | |
| | 5,000 | | New York City Municipal Water Finance Authority, New York, Water and Sewer System Revenue Bonds, Second Generation Resolution, Series 2007AA, 5.000%, 6/15/37 | 6/17 at 100.00 | | AA+ | | | 5,552,450 | |
| | 12,365 | | New York City Municipal Water Finance Authority, New York, Water and Sewer System Revenue Bonds, Series 2006B, 5.000%, 6/15/36 – NPFG Insured (UB) | 6/16 at 100.00 | | AAA | | | 13,648,735 | |
| | 19,455 | | New York City Municipal Water Finance Authority, New York, Water and Sewerage System Revenue Bonds, Fiscal Series 2005C, 5.000%, 6/15/27 – NPFG Insured (UB) | 6/15 at 100.00 | | AAA | | | 21,195,639 | |
| | 11,455 | | New York City Municipal Water Finance Authority, New York, Water and Sewerage System Revenue Bonds, Fiscal Series 2004C, 5.000%, 6/15/35 – AMBAC Insured | 6/14 at 100.00 | | AAA | | | 12,009,307 | |
| | 3,845 | | New York State Environmental Facilities Corporation, Revenue Bonds, State Revolving Funds Master Financing, Series 2010C, 5.000%, 10/15/35 | 4/20 at 100.00 | | AAA | | | 4,389,144 | |
| | 3,095 | | New York State Environmental Facilities Corporation, Revenue Bonds, State Revolving Funds Master Financing, Series 2012B, 5.000%, 2/15/42 | 2/22 at 100.00 | | AAA | | | 3,516,168 | |
| | 14,700 | | Suffolk County Water Authority, New York, Waterworks Revenue Bonds, Series 2005C, 5.000%, 6/01/28 – NPFG Insured (UB) | 6/15 at 100.00 | | AAA | | | 16,139,130 | |
| | | Nuveen New York AMT-Free Municipal Income Fund (continued) |
| NRK | | Portfolio of Investments |
| | | March 31, 2013 (Unaudited) |
| | Principal | | | Optional Call | | | | | | |
| | Amount (000) | | Description (1) | Provisions (2) | | Ratings (3) | | | Value | |
| | | | Water and Sewer (continued) | | | | | | | |
| $ | 2,230 | | Upper Mohawk Valley Regional Water Finance Authority, New York, Water System Revenue Bonds, Series 2000, 0.000%, 4/01/23 – AMBAC Insured | No Opt. Call | | A1 | | $ | 1,659,053 | |
| | 102,605 | | Total Water and Sewer | | | | | | 112,669,178 | |
| $ | 2,202,557 | | Total Investments (cost $1,863,602,104) – 152.0% | | | | | | 1,985,686,300 | |
| | | | Floating Rate Obligations – (10.6)% | | | | | | (138,905,000 | ) |
| | | | MuniFund Term Preferred Shares, at Liquidation Value – (2.1)% (6) | | | | | | (27,680,000 | ) |
| | | | Variable Rate MuniFund Term Preferred Shares, at Liquidation Value – (3.9)% (7) | | | | | | (50,700,000 | ) |
| | | | Variable Rate Demand Preferred Shares, at Liquidation Value – (37.4)% (8) | | | | | | (488,800,000 | ) |
| | | | Other Assets Less Liabilities – 2.0% | | | | | | 26,579,777 | |
| | | | Net Assets Applicable to Common Shares – 100% | | | | | $ | 1,306,181,077 | |
| (1) | | All percentages shown in the Portfolio of Investments are based on net assets applicable to Common shares unless otherwise noted. |
| (2) | | Optional Call Provisions: Dates (month and year) and prices of the earliest optional call or redemption. There may be other call provisions at varying prices at later dates. Certain mortgage-backed securities may be subject to periodic principal paydowns. |
| (3) | | Ratings: Using the highest of Standard & Poor’s Group (“Standard & Poor’s”), Moody’s Investors Service, Inc. (“Moody’s”) or Fitch, Inc. (“Fitch”) rating. Ratings below BBB by Standard & Poor’s, Baa by Moody’s or BBB by Fitch are considered to be below investment grade. Holdings designated N/R are not rated by any of these national rating agencies. |
| (4) | | Investment, or portion of investment, has been pledged to collateralize the net payment obligations for investments in inverse floating rate transactions. |
| (5) | | Backed by an escrow or trust containing sufficient U.S. Government or U.S. Government agency securities, which ensure the timely payment of principal and interest. Certain bonds backed by U.S. Government or agency securities are regarded as having an implied rating equal to the rating of such securities. |
| (6) | | MuniFund Term Preferred Shares, at Liquidation Value as a percentage of Total Investments is 1.4%. |
| (7) | | Variable Rate MuniFund Term Preferred Shares, at Liquidation Value as a percentage of Total Investments is 2.6%. |
| (8) | | Variable Rate Demand Preferred Shares, at Liquidation Value as a percentage of Total Investments is 24.6%. |
| N/R | | Not rated. |
| WI/DD | | Investment, or portion of investment, purchased on a when-issued or delayed delivery basis. |
| (ETM) | | Escrowed to maturity. |
| (IF) | | Inverse floating rate investment. |
| (UB) | | Underlying bond of an inverse floating rate trust reflected as a financing transaction. See Notes to Financial Statements, Footnote 1 – General Information and Significant Accounting Policies, Inverse Floating Rate Securities for more information. |
See accompanying notes to financial statements.
| | | Statement of |
| | | Assets & Liabilities |
| | | |
| | | March 31, 2013 (Unaudited) |
| | | | | | | | | | New York | |
| | | | New York | | | New York | | Performance | |
| | | | Value | | | Value 2 | | | Plus | |
| | | | (NNY | ) | | (NYV | ) | | (NNP | ) |
| Assets | | | | | | | | | | |
| Investments, at value (cost $145,046,470, $32,705,238 and $337,110,589, respectively) | | $ | 155,576,784 | | $ | 37,840,869 | | $ | 362,925,637 | |
| Cash | | | — | | | 94,783 | | | 1,824,684 | |
| Receivables: | | | | | | | | | | |
| Interest | | | 2,108,387 | | | 612,505 | | | 4,900,439 | |
| Investments sold | | | 2,301,252 | | | — | | | 2,441,984 | |
| Deferred offering costs | | | — | | | — | | | 1,101,098 | |
| Other assets | | | 7,068 | | | 496 | | | 137,294 | |
| Total assets | | | 159,993,491 | | | 38,548,653 | | | 373,331,136 | |
| Liabilities | | | | | | | | | | |
| Cash overdraft | | | 69,330 | | | — | | | — | |
| Floating rate obligations | | | 3,255,000 | | | — | | | 34,645,000 | |
| Unrealized depreciation on swaps | | | — | | | 81,419 | | | — | |
| Payables: | | | | | | | | | | |
| Common share dividends | | | 443,644 | | | 118,595 | | | 908,234 | |
| Interest | | | — | | | — | | | — | |
| Investments purchased | | | — | | | — | | | — | |
| Offering costs | | | — | | | — | | | — | |
| MuniFund Term Preferred (MTP) Shares, at liquidation value | | | — | | | — | | | — | |
| Variable Rate MuniFund Term Preferred (VMTP) Shares, at liquidation value | | | — | | | — | | | — | |
| Variable Rate Demand Preferred (VRDP) Shares, at liquidation value | | | — | | | — | | | 89,000,000 | |
| Accrued expenses: | | | | | | | | | | |
| Management fees | | | 65,525 | | | 19,465 | | | 192,573 | |
| Directors/Trustees fees | | | 924 | | | 226 | | | 44,391 | |
| Reorganization | | | — | | | — | | | — | |
| Other | | | 61,525 | | | 21,009 | | | 78,632 | |
| Total liabilities | | | 3,895,948 | | | 240,714 | | | 124,868,830 | |
| Net assets applicable to Common shares | | $ | 156,097,543 | | $ | 38,307,939 | | $ | 248,462,306 | |
| Common shares outstanding | | | 15,191,165 | | | 2,349,612 | | | 15,063,511 | |
| Net asset value per Common share outstanding (net assets applicable to Common shares, divided by Common shares outstanding) | | $ | 10.28 | | $ | 16.30 | | $ | 16.49 | |
| Net assets applicable to Common shares consist of: | | | | | | | | | | |
| Common shares, $.01 par value per share | | $ | 151,912 | | $ | 23,496 | | $ | 150,635 | |
| Paid-in surplus | | | 144,979,430 | | | 33,590,704 | | | 220,047,207 | |
| Undistributed (Over-distribution of) net investment income | | | 401,026 | | | 223,888 | | | 2,769,468 | |
| Accumulated net realized gain (loss) | | | 34,861 | | | (584,361 | ) | | (320,052 | ) |
| Net unrealized appreciation (depreciation) | | | 10,530,314 | | | 5,054,212 | | | 25,815,048 | |
| Net assets applicable to Common shares | | $ | 156,097,543 | | $ | 38,307,939 | | $ | 248,462,306 | |
| Authorized shares: | | | | | | | | | | |
| Common | | | 250,000,000 | | | Unlimited | | | 200,000,000 | |
| Preferred | | | N/A | | | N/A | | | 950,000 | |
See accompanying notes to financial statements.
| | | Statement of |
| | | Assets & Liabilities (continued) |
| | | |
| | | March 31, 2013 (Unaudited) |
| | | | New York | | | New York | | | New York | |
| | | | Dividend | | | Dividend | | | AMT-Free | |
| | | | Advantage | | Advantage 2 | | | Income | |
| | | | (NAN | ) | | (NXK | ) | | (NRK | ) |
| Assets | | | | | | | | | | |
| Investments, at value (cost $202,438,639, $139,560,284 and $1,863,602,104, respectively) | | $ | 216,777,228 | | $ | 148,883,838 | | $ | 1,985,686,300 | |
| Cash | | | — | | | 203,295 | | | 1,431,252 | |
| Receivables: | | | | | | | | | | |
| Interest | | | 3,076,294 | | | 2,117,519 | | | 25,609,378 | |
| Investments sold | | | 85,000 | | | 504,885 | | | 26,011,779 | |
| Deferred offering costs | | | 634,531 | | | 357,019 | | | 3,393,554 | |
| Other assets | | | 29,689 | | | 12,483 | | | 556,551 | |
| Total assets | | | 220,602,742 | | | 152,079,039 | | | 2,042,688,814 | |
| Liabilities | | | | | | | | | | |
| Cash overdraft | | | 252,640 | | | — | | | — | |
| Floating rate obligations | | | 17,465,000 | | | 12,150,000 | | | 138,905,000 | |
| Unrealized depreciation on swaps | | | — | | | — | | | — | |
| Payables: | | | | | | | | | | |
| Common share dividends | | | 554,773 | | | 366,728 | | | 371,474 | |
| Interest | | | 120,334 | | | 80,517 | | | 92,866 | |
| Investments purchased | | | — | | | — | | | 26,423,140 | |
| Offering costs | | | 129,791 | | | — | | | 3,789 | |
| MuniFund Term Preferred (MTP) Shares, at liquidation value | | | 55,360,000 | | | 37,890,000 | | | 27,680,000 | |
| Variable Rate MuniFund Term Preferred (VMTP) Shares, at liquidation value | | | — | | | — | | | 50,700,000 | |
| Variable Rate Demand Preferred (VRDP) Shares, at liquidation value | | | — | | | — | | | 488,800,000 | |
| Accrued expenses: | | | | | | | | | | |
| Management fees | | | 114,164 | | | 79,580 | | | 998,434 | |
| Directors/Trustees fees | | | 1,196 | | | 826 | | | 189,344 | |
| Reorganization | | | — | | | — | | | 1,928,359 | |
| Other | | | 44,525 | | | 30,260 | | | 415,331 | |
| Total liabilities | | | 74,042,423 | | | 50,597,911 | | | 736,507,737 | |
| Net assets applicable to Common shares | | $ | 146,560,319 | | $ | 101,481,128 | | $ | 1,306,181,077 | |
| Common shares outstanding | | | 9,265,330 | | | 6,488,516 | | | 87,618,504 | |
| Net asset value per Common share outstanding (net assets applicable to Common shares, divided by Common shares outstanding) | | $ | 15.82 | | $ | 15.64 | | $ | 14.91 | |
| Net assets applicable to Common shares consist of: | | | | | | | | | | |
| Common shares, $.01 par value per share | | $ | 92,653 | | $ | 64,885 | | $ | 876,185 | |
| Paid-in surplus | | | 131,191,709 | | | 92,005,588 | | | 1,168,243,120 | |
| Undistributed (Over-distribution of) net investment income | | | 1,065,957 | | | 147,671 | | | 3,445,415 | |
| Accumulated net realized gain (loss) | | | (128,589 | ) | | (60,570 | ) | | 11,532,161 | |
| Net unrealized appreciation (depreciation) | | | 14,338,589 | | | 9,323,554 | | | 122,084,196 | |
| Net assets applicable to Common shares | | $ | 146,560,319 | | $ | 101,481,128 | | $ | 1,306,181,077 | |
| Authorized shares: | | | | | | | | | | |
| Common | | | Unlimited | | | Unlimited | | | Unlimited | |
| Preferred | | | Unlimited | | | Unlimited | | | Unlimited | |
See accompanying notes to financial statements.
| | | Statement of | |
| | | Operations | |
| | | | Six Months Ended March 31, 2013 |
| | | | (Unaudited) |
| | | | | | | | | | New York | | | New York | | | New York | | | New York | |
| | | | New York | | | New York | | Performance | | | Dividend | | | Dividend | | | AMT-Free | |
| | | | Value | | | Value 2 | | | Plus | | Advantage | | Advantage 2 | | | Income | |
| | | | (NNY | ) | | (NYV | ) | | (NNP | ) | | (NAN | ) | | (NXK | ) | | (NRK | ) |
| Investment Income | | $ | 3,561,898 | | $ | 1,055,325 | | $ | 8,250,836 | | $ | 4,934,241 | | $ | 3,317,308 | | $ | 7,272,504 | |
| Expenses | | | | | | | | | | | | | | | | | | | |
| Management fees | | | 395,899 | | | 114,932 | | | 1,141,735 | | | 677,088 | | | 472,242 | | | 887,228 | |
| Shareholder servicing agent fees and expenses | | | 12,563 | | | 94 | | | 12,270 | | | 11,523 | | | 8,714 | | | 15,092 | |
| Interest expense and amortization of offering costs | | | 6,997 | | | — | | | 221,688 | | | 908,181 | | | 599,625 | | | 916,849 | |
| Liquidity fees | | | — | | | — | | | 458,268 | | | — | | | — | | | 225,233 | |
| Remarketing fees | | | — | | | — | | | 44,995 | | | — | | | — | | | 28,513 | |
| Custodian fees and expenses | | | 17,179 | | | 5,660 | | | 33,091 | | | 21,409 | | | 18,253 | | | 31,543 | |
| Directors/Trustees fees and expenses | | | 2,285 | | | 698 | | | 4,594 | | | 2,812 | | | 2,000 | | | 3,904 | |
| Professional fees | | | 12,596 | | | 10,424 | | | 21,917 | | | 18,701 | | | 16,338 | | | 19,483 | |
| Shareholder reporting expenses | | | 18,594 | | | 4,816 | | | 22,939 | | | 19,231 | | | 12,882 | | | 58,790 | |
| Stock exchange listing fees | | | 4,260 | | | 159 | | | 4,243 | | | 19,179 | | | 7,907 | | | 7,706 | |
| Investor relations expenses | | | 8,469 | | | 1,945 | | | 13,486 | | | 9,232 | | | 7,196 | | | 5,770 | |
| Reorganization expenses | | | — | | | — | | | — | | | — | | | — | | | 391,638 | |
| Other expenses | | | 5,359 | | | 2,198 | | | 23,283 | | | 21,219 | | | 16,339 | | | 20,329 | |
| Total expenses | | | 484,201 | | | 140,926 | | | 2,002,509 | | | 1,708,575 | | | 1,161,496 | | | 2,612,078 | |
| Net investment income (loss) | | | 3,077,697 | | | 914,399 | | | 6,248,327 | | | 3,225,666 | | | 2,155,812 | | | 4,660,426 | |
| Realized and Unrealized Gain (Loss) | | | | | | | | | | | | | | | | | | | |
| Net realized gain (loss) from investments | | | 67,461 | | | 17,704 | | | 110,656 | | | 91,139 | | | 11,021 | | | 12,025,716 | |
| Change in net unrealized appreciation (depreciation) of: | | | | | | | | | | | | | | | | | | | |
| Investments | | | (1,883,817 | ) | | (427,351 | ) | | (4,506,649 | ) | | (2,329,527 | ) | | (1,579,647 | ) | | (21,561,388 | ) |
| Swaps | | | — | | | 144,738 | | | — | | | — | | | — | | | — | |
| Net realized and unrealized gain (loss) | | | (1,816,356 | ) | | (264,909 | ) | | (4,395,993 | ) | | (2,238,388 | ) | | (1,568,626 | ) | | (9,535,672 | ) |
| Net increase (decrease) in net assets applicable to Common shares from operations | | $ | 1,261,341 | | $ | 649,490 | | $ | 1,852,334 | | $ | 987,278 | | $ | 587,186 | | $ | (4,875,246 | ) |
See accompanying notes to financial statements.
| | | Statement of |
| | | Changes in Net Assets (Unaudited) |
| | | New York Value (NNY) | | | New York Value 2 (NYV) | | | New York Performance Plus (NNP) | |
| | | Six Months | | | | | | Six Months | | | | | | Six Months | | | | |
| | | Ended | | | Year Ended | | | Ended | | | Year Ended | | | Ended | | | Year Ended | |
| | | 3/31/13 | | | 9/30/12 | | | 3/31/13 | | | 9/30/12 | | | 3/31/13 | | | 9/30/12 | |
| Operations | | | | | | | | | | | | | | | | | | |
| Net investment income (loss) | | $ | 3,077,697 | | | $ | 6,383,358 | | | $ | 914,399 | | | $ | 1,683,539 | | | $ | 6,248,327 | | | $ | 12,923,555 | |
| Net realized gain (loss) from: | | | | | | | | | | | | | | | | | | | | | | | | |
| Investments | | | 67,461 | | | | 176,773 | | | | 17,704 | | | | 107,680 | | | | 110,656 | | | | 715,122 | |
| Swaps | | | — | | | | — | | | | — | | | | (496,286 | ) | | | — | | | | — | |
| Change in net unrealized appreciation (depreciation) of: | | | | | | | | | | | | | | | | | | | | | | | | |
| Investments | | | (1,883,817 | ) | | | 7,141,141 | | | | (427,351 | ) | | | 2,341,526 | | | | (4,506,649 | ) | | | 14,379,139 | |
| Swaps | | | — | | | | — | | | | 144,738 | | | | 306,743 | | | | — | | | | — | |
| Net increase (decrease) in net assets applicable to Common shares from operations | | | 1,261,341 | | | | 13,701,272 | | | | 649,490 | | | | 3,943,202 | | | | 1,852,334 | | | | 28,017,816 | |
| Distributions to Common Shareholders | | | | | | | | | | | | | | | | | | | | | | | | |
| From net investment income | | | (3,067,740 | ) | | | (6,356,338 | ) | | | (789,470 | ) | | | (1,577,484 | ) | | | (6,531,746 | ) | | | (13,265,348 | ) |
| From accumulated net realized gains | | | (229,332 | ) | | | — | | | | — | | | | — | | | | (587,477 | ) | | | — | |
| Decrease in net assets applicable to Common shares from distributions to Common shareholders | | | (3,297,072 | ) | | | (6,356,338 | ) | | | (789,470 | ) | | | (1,577,484 | ) | | | (7,119,223 | ) | | | (13,265,348 | ) |
| Capital Share Transactions | | | | | | | | | | | | | | | | | | | | | | | | |
| Common shares: | | | | | | | | | | | | | | | | | | | | | | | | |
Issued in the Reorganizations(1) | | | — | | | | — | | | | — | | | | — | | | | — | | | | — | |
| Net proceeds from shares issued to shareholders due to reinvestment of distributions | | | 154,748 | | | | 79,085 | | | | 13,897 | | | | 28,388 | | | | 303,049 | | | | 101,538 | |
| Net increase (decrease) in net assets applicable to Common shares from capital share transactions | | | 154,748 | | | | 79,085 | | | | 13,897 | | | | 28,388 | | | | 303,049 | | | | 101,538 | |
| Net increase (decrease) in net assets applicable to Common shares | | | (1,880,983 | ) | | | 7,424,019 | | | | (126,083 | ) | | | 2,394,106 | | | | (4,963,840 | ) | | | 14,854,006 | |
| Net assets applicable to Common shares at the beginning of period | | | 157,978,526 | | | | 150,554,507 | | | | 38,434,022 | | | | 36,039,916 | | | | 253,426,146 | | | | 238,572,140 | |
| Net assets applicable to Common shares at the end of period | | $ | 156,097,543 | | | $ | 157,978,526 | | | $ | 38,307,939 | | | $ | 38,434,022 | | | $ | 248,462,306 | | | $ | 253,426,146 | |
| Undistributed (Over-distribution of) net investment income at the end of period | | $ | 401,026 | | | $ | 391,069 | | | $ | 223,888 | | | $ | 98,959 | | | $ | 2,769,468 | | | $ | 3,052,887 | |
(1) Refer to Footnote 8 – Fund Reorganizations for further details.
See accompanying notes to financial statements.
| | | New York | | | New York | | | New York | |
| | | Dividend Advantage (NAN) | | | Dividend Advantage 2 (NXK) | | | AMT-Free Income (NRK) | |
| | | Six Months | | | | | | Six Months | | | | | | Six Months | | | | |
| | | Ended | | | Year Ended | | | Ended | | | Year Ended | | | Ended | | | Year Ended | |
| | | 3/31/13 | | | 9/30/12 | | | 3/31/13 | | | 9/30/12 | | | 3/31/13 | | | 9/30/12 | |
| Operations | | | | | | | | | | | | | | | | | | |
| Net investment income (loss) | | $ | 3,225,666 | | | $ | 6,772,762 | | | $ | 2,155,812 | | | $ | 4,657,528 | | | $ | 4,660,426 | | | $ | 2,325,727 | |
| Net realized gain (loss) from: | | | | | | | | | | | | | | | | | | | | | | | | |
| Investments | | | 91,139 | | | | 263,666 | | | | 11,021 | | | | 173,499 | | | | 12,025,716 | | | | 59,743 | |
| Swaps | | | — | | | | — | | | | — | | | | — | | | | — | | | | — | |
| Change in net unrealized appreciation (depreciation) of: | | | | | | | | | | | | | | | | | | | | | | | | |
| Investments | | | (2,329,527 | ) | | | 10,658,485 | | | | (1,579,647 | ) | | | 6,934,212 | | | | (21,561,388 | ) | | | 1,557,950 | |
| Swaps | | | — | | | | — | | | | — | | | | — | | | | — | | | | — | |
| Net increase (decrease) in net assets applicable to Common shares from operations | | | 987,278 | | | | 17,694,913 | | | | 587,186 | | | | 11,765,239 | | | | (4,875,246 | ) | | | 3,943,420 | |
| Distributions to Common Shareholders | | | | | | | | | | | | | | | | | | | | | | | | |
| From net investment income | | | (3,558,813 | ) | | | (7,282,550 | ) | | | (2,484,453 | ) | | | (5,177,836 | ) | | | (1,388,749 | ) | | | (2,461,605 | ) |
| From accumulated net realized gains | | | (285,372 | ) | | | (54,665 | ) | | | (148,587 | ) | | | — | | | | (74,697 | ) | | | (36,118 | ) |
| Decrease in net assets applicable to Common shares from distributions to Common shareholders | | | (3,844,185 | ) | | | (7,337,215 | ) | | | (2,633,040 | ) | | | (5,177,836 | ) | | | (1,463,446 | ) | | | (2,497,723 | ) |
| Capital Share Transactions | | | | | | | | | | | | | | | | | | | | | | | | |
| Common shares: | | | | | | | | | | | | | | | | | | | | | | | | |
Issued in the Reorganizations(1) | | | — | | | | — | | | | — | | | | — | | | | 1,258,369,560 | | | | — | |
| Net proceeds from shares issued to shareholders due to reinvestment of distributions | | | — | | | | — | | | | — | | | | — | | | | 10,707 | | | | — | |
| Net increase (decrease) in net assets applicable to Common shares from capital share transactions | | | — | | | | — | | | | — | | | | — | | | | 1,258,380,267 | | | | — | |
| Net increase (decrease) in net assets applicable to Common shares | | | (2,856,907 | ) | | | 10,357,698 | | | | (2,045,854 | ) | | | 6,587,403 | | | | 1,252,041,575 | | | | 1,445,697 | |
| Net assets applicable to Common shares at the beginning of period | | | 149,417,226 | | | | 139,059,528 | | | | 103,526,982 | | | | 96,939,579 | | | | 54,139,502 | | | | 52,693,805 | |
| Net assets applicable to Common shares at the end of period | | $ | 146,560,319 | | | $ | 149,417,226 | | | $ | 101,481,128 | | | $ | 103,526,982 | | | $ | 1,306,181,077 | | | $ | 54,139,502 | |
| Undistributed (Over-distribution of) net investment income at the end of period | | $ | 1,065,957 | | | $ | 1,399,104 | | | $ | 147,671 | | | $ | 476,312 | | | $ | 3,445,415 | | | $ | 173,738 | |
(1) Refer to Footnote 8 – Fund Reorganizations for further details.
See accompanying notes to financial statements.
| | | Statement of | |
| | | Cash Flows | |
| | | | Six Months Ended March 31, 2013 |
| | | | (Unaudited) |
| | | | New York | | | New York | |
| | | Performance | | | Dividend | |
| | | | Plus | | | Advantage | |
| | | | (NNP | ) | | (NAN | ) |
| Cash Flows from Operating Activities: | | | | | | | |
| Net Increase (Decrease) in Net Assets Applicable to Common Shares from Operations | | $ | 1,852,334 | | $ | 987,278 | |
| Adjustments to reconcile the net increase (decrease) in net assets applicable to | | | | | | | |
| Common shares from operations to net cash provided by (used in) operating activities: | | | | | | | |
| Purchases of investments | | | (34,586,383 | ) | | (12,852,745 | ) |
| Proceeds from sales and maturities of investments | | | 32,456,565 | | | 11,280,416 | |
| Assets and (Liabilities) acquired in the Reorganization, net | | | — | | | — | |
| Amortization (Accretion) of premiums and discounts, net | | | 281,124 | | | 225,742 | |
| (Increase) Decrease in: | | | | | | | |
| Receivable for interest | | | 242,121 | | | 77,944 | |
| Receivable for investments sold | | | (599,788 | ) | | (85,000 | ) |
| Other assets | | | (12,359 | ) | | (14,099 | ) |
| Increase (Decrease) in: | | | | | | | |
| Payable for interest | | | — | | | (1 | ) |
| Payable for investments purchased | | | — | | | — | |
| Accrued management fees | | | 4,840 | | | 2,801 | |
| Accrued Directors/Trustees fees | | | 1,946 | | | (86 | ) |
| Accrued reorganization expenses | | | — | | | — | |
| Accrued other expenses | | | (18,718 | ) | | (19,512 | ) |
| Net realized (gain) loss from: | | | | | | | |
| Investments | | | (110,656 | ) | | (91,139 | ) |
| Paydowns | | | — | | | — | |
| Change in net unrealized (appreciation) depreciation of investments | | | 4,506,649 | | | 2,329,527 | |
| Taxes paid on undistributed capital gains | | | (3,019 | ) | | (14,516 | ) |
| Net cash provided by (used in) operating activities | | | 4,014,656 | | | 1,826,610 | |
| Cash Flows from Financing Activities: | | | | | | | |
| (Increase) Decrease in deferred offering costs | | | 20,383 | | | 140,847 | |
| Increase (Decrease) in: | | | | | | | |
| Cash overdraft balance | | | — | | | 252,640 | |
| Floating rate obligations | | | — | | | (270,000 | ) |
| Payable for offering costs | | | — | | | (4,901 | ) |
| VMTP Shares, at liquidation value | | | — | | | — | |
| VRDP Shares, at liquidation value | | | — | | | — | |
| Cash distributions paid to Common shareholders | | | (6,839,055 | ) | | (3,866,185 | ) |
| Net cash provided by (used in) financing activities | | | (6,818,672 | ) | | (3,747,599 | ) |
| Net Increase (Decrease) in Cash | | | (2,804,016 | ) | | (1,920,989 | ) |
| Cash at the beginning of period | | | 4,628,700 | | | 1,920,989 | |
| Cash at the End of Period | | $ | 1,824,684 | | $ | — | |
Supplemental Disclosure of Cash Flow Information
Non-cash financing activities not included herein consists of reinvestments of Common share distributions as follows:
| | | | New York | | | New York | |
| | | Performance | | | Dividend | |
| | | | Plus | | | Advantage | |
| | | | (NNP | ) | | (NAN | ) |
| | | $ | 303,049 | | $ | — | |
Cash paid for interest (excluding amortization of offering costs) was as follows:
| | | | New York | | | New York | |
| | | Performance | | | Dividend | |
| | | | Plus | | | Advantage | |
| | | | (NNP | ) | | (NAN | ) |
| | | $ | 201,306 | | $ | 767,334 | |
See accompanying notes to financial statements.
| | | | New York | | | New York | |
| | | | Dividend | | | AMT-Free | |
| | | Advantage 2 | | | Income | |
| | | | (NXK | ) | | (NRK | ) |
| Cash Flows from Operating Activities: | | | | | | | |
| Net Increase (Decrease) in Net Assets Applicable to Common Shares from Operations | | $ | 587,186 | | $ | (4,875,246 | ) |
| Adjustments to reconcile the net increase (decrease) in net assets applicable to | | | | | | | |
| Common shares from operations to net cash provided by (used in) operating activities: | | | | | | | |
| Purchases of investments | | | (15,145,047 | ) | | (55,950,208 | ) |
| Proceeds from sales and maturities of investments | | | 14,233,535 | | | 40,599,450 | |
| Assets and (Liabilities) acquired in the Reorganization, net | | | — | | | (502,179,068 | ) |
| Amortization (Accretion) of premiums and discounts, net | | | 207,978 | | | (294,235 | ) |
| (Increase) Decrease in: | | | | | | | |
| Receivable for interest | | | 49,368 | | | (24,634,557 | ) |
| Receivable for investments sold | | | (504,885 | ) | | (26,011,779 | ) |
| Other assets | | | (4,255 | ) | | (549,758 | ) |
| Increase (Decrease) in: | | | | | | | |
| Payable for interest | | | — | | | 34,046 | |
| Payable for investments purchased | | | (1,139,787 | ) | | 26,423,140 | |
| Accrued management fees | | | 1,876 | | | 956,989 | |
| Accrued Directors/Trustees fees | | | (61 | ) | | 188,826 | |
| Accrued reorganization expenses | | | — | | | 1,928,359 | |
| Accrued other expenses | | | (23,577 | ) | | 366,878 | |
| Net realized (gain) loss from: | | | | | | | |
| Investments | | | (11,021 | ) | | (12,025,716 | ) |
| Paydowns | | | — | | | (658 | ) |
| Change in net unrealized (appreciation) depreciation of investments | | | 1,579,647 | | | 21,561,388 | |
| Taxes paid on undistributed capital gains | | | (8,721 | ) | | (4,917 | ) |
| Net cash provided by (used in) operating activities | | | (177,764 | ) | | (534,467,066 | ) |
| Cash Flows from Financing Activities: | | | | | | | |
| (Increase) Decrease in deferred offering costs | | | 85,387 | | | (3,050,822 | ) |
| Increase (Decrease) in: | | | | | | | |
| Cash overdraft balance | | | — | | | — | |
| Floating rate obligations | | | — | | | — | |
| Payable for offering costs | | | — | | | (2,036 | ) |
| VMTP Shares, at liquidation value | | | — | | | 50,700,000 | |
| VRDP Shares, at liquidation value | | | — | | | 488,800,000 | |
| Cash distributions paid to Common shareholders | | | (2,679,134 | ) | | (1,278,844 | ) |
| Net cash provided by (used in) financing activities | | | (2,593,747 | ) | | 535,168,298 | |
| Net Increase (Decrease) in Cash | | | (2,771,511 | ) | | 701,232 | |
| Cash at the beginning of period | | | 2,974,806 | | | 730,020 | |
| Cash at the End of Period | | $ | 203,295 | | $ | 1,431,252 | |
Supplemental Disclosure of Cash Flow Information
Non-cash financing activities not included herein consists of reinvestments of Common share distributions as follows:
| | | | New York | | | New York | |
| | | | Dividend | | | AMT-Free | |
| | | Advantage 2 | | | Income | |
| | | | (NXK | ) | | (NRK | ) |
| | | $ | — | | $ | 10,707 | |
Cash paid for interest (excluding amortization of offering costs) was as follows:
| | | | New York | | | New York | |
| | | | Dividend | | | AMT-Free | |
| | | Advantage 2 | | | Income | |
| | | | (NXK | ) | | (NRK | ) |
| | | $ | 514,238 | | $ | 803,459 | |
See accompanying notes to financial statements.
| | | Financial |
| | | Highlights (Unaudited) |
| | | |
| | Selected data for a Common share outstanding throughout each period: |
| | | | | Investment Operations | | Less Distributions | | | | | | | | | |
| | | Beginning Common Share Net Asset Value | | Net Investment Income (Loss | ) | Net Realized/ Unrealized Gain (Loss | ) | Total | | From Net Investment Income to Common Shareholders | | From Accumulated Net Realized Gains to Common Shareholders | | | Total | | Discount from Common Shares Repurchased and Retired | | Initial Offering Costs | | Ending Common Share Net Asset Value | | Ending Market Value | |
| New York Value (NNY) | | | | | | | | | | | | | | | | | | | | | | | | | | | | |
| Year Ended 9/30: | | | | | | | | | | | | | | | | | | | | | | | | | | | | |
| 2013(d) | | $ | 10.41 | | $ | .20 | | $ | (.11 | ) | $ | .09 | | $ | (.20 | ) | $ | (.02 | ) | $ | (.22 | ) | $ | — | | $ | — | | $ | 10.28 | | $ | 10.12 | |
| 2012 | | | 9.93 | | | .42 | | | .48 | | | .90 | | | (.42 | ) | | — | | | (.42 | ) | | — | | | — | | | 10.41 | | | 10.55 | |
| 2011 | | | 10.02 | | | .43 | | | (.08 | ) | | .35 | | | (.43 | ) | | (.01 | ) | | (.44 | ) | | — | | | — | | | 9.93 | | | 9.47 | |
| 2010 | | | 9.91 | | | .42 | | | .14 | | | .56 | | | (.43 | ) | | (.02 | ) | | (.45 | ) | | — | | | — | | | 10.02 | | | 9.88 | |
| 2009 | | | 9.28 | | | .43 | | | .73 | | | 1.16 | | | (.43 | ) | | (.10 | ) | | (.53 | ) | | — | | | — | | | 9.91 | | | 9.51 | |
| 2008 | | | 9.94 | | | .43 | | | (.65 | ) | | (.22 | ) | | (.43 | ) | | (.01 | ) | | (.44 | ) | | — | | | — | | | 9.28 | | | 9.01 | |
| | | | | | | | | | | | | | | | | | | | | | | | | | | | | | | | | | | |
| New York Value 2 (NYV) | | | | | | | | | | | | | | | | | | | | | | | | | | | | |
| Year Ended 9/30: | | | | | | | | | | | | | | | | | | | | | | | | | | | | |
| 2013(d) | | | 16.36 | | | .39 | | | (.11 | ) | | .28 | | | (.34 | ) | | — | | | (.34 | ) | | — | | | — | | | 16.30 | | | 15.56 | |
| 2012 | | | 15.36 | | | .72 | | | .95 | | | 1.67 | | | (.67 | ) | | — | | | (.67 | ) | | — | | | — | | | 16.36 | | | 16.33 | |
| 2011 | | | 16.10 | | | .75 | | | (.74 | ) | | .01 | | | (.75 | ) | | — | | | (.75 | ) | | — | | | — | | | 15.36 | | | 14.13 | |
| 2010 | | | 15.91 | | | .79 | | | .17 | | | .96 | | | (.77 | ) | | — | | | (.77 | ) | | — | | | — | | | 16.10 | | | 15.38 | |
| 2009(c) | | | 14.33 | | | .23 | | | 1.64 | | | 1.87 | | | (.26 | ) | | — | | | (.26 | ) | | — | | | (.03 | ) | | 15.91 | | | 14.84 | |
| | | | | | | | Ratios/Supplemental Data | | | | |
| | | | | | | | Ratios to Average Net Assets | | | | |
| | Total Returns | | | | | | Applicable to Common Shares | | | | |
| | | | | Based | | | Ending | | | | | | | | | | |
| | | | | on | | | Net | | | | | | | | | | |
| | Based | | | Common | | | Assets | | | | | | | | | | |
| | on | | | Share Net | | | Applicable | | | | | | Net | | | Portfolio | |
| | Market | | | Asset | | | to Common | | | | | | Investment | | | Turnover | |
| | Value | (a) | | Value | (a) | | Shares (000 | ) | | Expenses | (b) | | Income (Loss | ) | | Rate | |
| | | | | | | | | | | | | | | | | | |
| | | | | | | | | | | | | | | | | | |
| | (2.04 | )% | | .83 | % | $ | 156,098 | | | .62 | %* | | 3.91 | %* | | 7 | % |
| | 16.11 | | | 9.23 | | | 157,979 | | | .65 | | | 4.14 | | | 10 | |
| | .39 | | | 3.62 | | | 150,555 | | | .65 | | | 4.40 | | | 10 | |
| | 8.78 | | | 5.82 | | | 152,031 | | | .67 | | | 4.30 | | | 5 | |
| | 11.78 | | | 13.00 | | | 150,063 | | | .71 | | | 4.58 | | | 3 | |
| | (.62 | ) | | (2.38 | ) | | 140,285 | | | .71 | | | 4.39 | | | 16 | |
| | | | | | | | | | | | | | | | | | |
| | | | | | | | | | | | | | | | | | |
| | (2.70 | ) | | 1.69 | | | 38,308 | | | .73 | * | | 4.75 | * | | 1 | |
| | 20.74 | | | 11.12 | | | 38,434 | | | .75 | | | 4.55 | | | 10 | |
| | (3.15 | ) | | .27 | | | 36,040 | | | .77 | | | 4.99 | | | 18 | |
| | 9.12 | | | 6.26 | | | 37,796 | | | .74 | | | 5.04 | | | 2 | |
| | .73 | | | 12.99 | | | 37,347 | | | .84 | * | | 3.66 | * | | 4 | |
| (a) | Total Return Based on Market Value is the combination of changes in the market price per share and the effect of reinvested dividend income and reinvested capital gains distributions, if any, at the average price paid per share at the time of reinvestment. The last dividend declared in the period, which is typically paid on the first business day of the following month, is assumed to be reinvested at the ending market price. The actual reinvestment for the last dividend declared in the period may take place over several days, and in some instances may not be based on the market price, so the actual reinvestment price may be different from the price used in the calculation. Total returns are not annualized. |
| | Total Return Based on Common Share Net Asset Value is the combination of changes in Common share net asset value, reinvested dividend income at net asset value and reinvested capital gains distributions at net asset value, if any. The last dividend declared in the period, which is typically paid on the first business day of the following month, is assumed to be reinvested at the ending net asset value. The actual reinvest price for the last dividend declared in the period may often be based on the Fund’s market price (and not its net asset value), and therefore may be different from the price used in the calculation. Total returns are not annualized. |
| (b) | The expense ratios reflect, among other things, the interest expense deemed to have been paid by the Fund on the floating rate certificates issued by the special purpose trusts for the self-deposited inverse floaters held by the Fund, where applicable, as described in Footnote 1 – General Information and Significant Accounting Policies, Inverse Floating Rate Securities, as follows: |
| New York Value (NNY) | | | | |
| Year Ended 9/30: | | | | |
| 2013(d) | | | .01 | % |
| 2012 | | | .01 | |
| 2011 | | | .01 | |
| 2010 | | | .01 | |
| 2009 | | | .03 | |
| 2008 | | | .03 | |
| New York Value 2 (NYV) | | | | |
| Year Ended 9/30: | | | | |
| 2013(d) | | | — | % |
| 2012 | | | — | |
| 2011 | | | — | |
| 2010 | | | — | |
| 2009(c) | | | — | |
| (c) | For the period April 28, 2009 (commencement of operations) through September 30, 2009. |
| (d) | For the six months ended March 31, 2013. |
| * | Annualized. |
See accompanying notes to financial statements.
| | | Financial |
| | | Highlights (Unaudited) (continued) |
| | | |
| | Selected data for a Common share outstanding throughout each period: |
| | | | | Investment Operations | | Less Distributions | | | | | | | |
| | | Beginning Common Share Net Asset Value | | Net Investment Income (Loss | ) | Net Realized/ Unrealized Gain (Loss | ) | Distributions from Net Investment Income to Auction Rate Preferred Shareholders | (a) | Distributions from Accumulated Net Realized Gains to Auction Rate Preferred Shareholders | (a) | Total | | From Net Investment Income to Common Shareholders | | From Accumulated Net Realized Gains to Common Shareholders | | Total | | Discount from Common Shares Repurchased and Retired | | Ending Common Share Net Asset Value | | Ending Market Value | |
| New York Performance Plus (NNP) | | | | | | | | | | | | | | | | | | | | | | | | | | | | |
| Year Ended 9/30: | | | | | | | | | | | | | | | | | | | | | | | | | |
| 2013(f) | $ | 16.84 | | $ | .41 | | $ | (.29 | ) | $ | — | | $ | — | | $ | .12 | | $ | (.43 | ) | $ | (.04 | ) | $ | (.47 | ) | $ | — | | $ | 16.49 | | $ | 16.50 | |
| 2012 | | | 15.86 | | | .86 | | | 1.00 | | | — | | | — | | | 1.86 | | | (.88 | ) | | — | | | (.88 | ) | | — | | | 16.84 | | | 17.18 | |
| 2011 | | | 16.05 | | | .88 | | | (.18 | ) | | — | | | — | | | .70 | | | (.88 | ) | | (.01 | ) | | (.89 | ) | | — | | | 15.86 | | | 14.93 | |
| 2010 | | | 15.63 | | | .91 | | | .38 | | | (.01 | ) | | — | * | | 1.28 | | | (.84 | ) | | (.02 | ) | | (.86 | ) | | — | | | 16.05 | | | 15.52 | |
| 2009 | | | 13.74 | | | .96 | | | 1.89 | | | (.05 | ) | | (.04 | ) | | 2.76 | | | (.74 | ) | | (.13 | ) | | (.87 | ) | | — | * | | 15.63 | | | 14.77 | |
| 2008 | | | 15.48 | | | .98 | | | (1.69 | ) | | (.27 | ) | | (.01 | ) | | (.99 | ) | | (.72 | ) | | (.03 | ) | | (.75 | ) | | — | | | 13.74 | | | 11.16 | |
| | | | | | | | | | | | | | | | | | | | | | | | | | | | | | | | | | | | | | |
| New York Dividend Advantage (NAN) | | | | | | | | | | | | | | | | | | | | | | | | | | | | |
| Year Ended 9/30: | | | | | | | | | | | | | | | | | | | | | | | | | |
| 2013(f) | | 16.13 | | | .35 | | | (.25 | ) | | — | | | — | | | .10 | | | (.38 | ) | | (.03 | ) | | (.41 | ) | | — | | | 15.82 | | | 15.09 | |
| 2012 | | | 15.01 | | | .73 | | | 1.19 | | | — | | | — | | | 1.92 | | | (.79 | ) | | (.01 | ) | | (.80 | ) | | — | | | 16.13 | | | 16.00 | |
| 2011 | | | 15.17 | | | .76 | | | (.10 | ) | | — | * | | — | | | .66 | | | (.79 | ) | | (.03 | ) | | (.82 | ) | | — | | | 15.01 | | | 13.70 | |
| 2010 | | | 14.82 | | | .84 | | | .34 | | | (.01 | ) | | — | * | | 1.17 | | | (.78 | ) | | (.04 | ) | | (.82 | ) | | — | | | 15.17 | | | 14.43 | |
| 2009 | | | 13.12 | | | .93 | | | 1.68 | | | (.06 | ) | | (.03 | ) | | 2.52 | | | (.73 | ) | | (.09 | ) | | (.82 | ) | | — | | | 14.82 | | | 13.38 | |
| 2008 | | | 14.95 | | | .96 | | | (1.76 | ) | | (.24 | ) | | (.02 | ) | | (1.06 | ) | | (.70 | ) | | (.07 | ) | | (.77 | ) | | — | | | 13.12 | | | 11.36 | |
| (a) | The amounts shown are based on Common share equivalents. |
| (b) | Total Return Based on Market Value is the combination of changes in the market price per share and the effect of reinvested dividend income and reinvested capital gains distributions, if any, at the average price paid per share at the time of reinvestment. The last dividend declared in the period, which is typically paid on the first business day of the following month, is assumed to be reinvested at the ending market price. The actual reinvestment for the last dividend declared in the period may take place over several days, and in some instances may not be based on the market price, so the actual reinvestment price may be different from the price used in the calculation. Total returns are not annualized. |
| | Total Return Based on Common Share Net Asset Value is the combination of changes in Common share net asset value, reinvested dividend income at net asset value and reinvested capital gains distributions at net asset value, if any. The last dividend declared in the period, which is typically paid on the first business day of the following month, is assumed to be reinvested at the ending net asset value. The actual reinvest price for the last dividend declared in the period may often be based on the Fund’s market price (and not its net asset value), and therefore may be different from the price used in the calculation. Total returns are not annualized. |
| | | | | | | | Ratios/Supplemental Data | | | | |
| | Total Returns | | | | | | Ratios to Average Net Assets Applicable to Common Shares Before Reimbursement(c) | | Ratios to Average Net Assets Applicable to Common Shares After Reimbursement(c)(d) | | | | |
| | | | | Based | | | Ending | | | | | | | | | | | | | | | | |
| | | | | on | | | Net | | | | | | | | | | | | | | | | |
| | Based | | | Common | | | Assets | | | | | | Net | | | | | | Net | | | | |
| | on | | | Share Net | | | Applicable | | | | | | Investment | | | | | | Investment | | | Portfolio | |
| | Market | | | Asset | | | to Common | | | | | | Income | | | | | | Income | | | Turnover | |
| | Value | (b) | | Value | (b) | | Shares (000 | ) | | Expenses | (e) | | (Loss | ) | | Expenses | (e) | | (Loss | ) | | Rate | |
| | | | | | | | | | | | | | | | | | | | | | | | |
| | | | | | | | | | | | | | | | | | | | | | | | |
| | (1.21 | )% | | .72 | % | $ | 248,462 | | | 1.59 | %** | | 4.96 | %** | | N/A | | | N/A | | | 9 | % |
| | 21.58 | | | 12.05 | | | 253,426 | | | 1.64 | | | 5.27 | | | N/A | | | N/A | | | 11 | |
| | 2.30 | | | 4.78 | | | 238,572 | | | 1.77 | | | 5.77 | | | N/A | | | N/A | | | 6 | |
| | 11.39 | | | 8.46 | | | 241,450 | | | 1.53 | | | 5.84 | | | N/A | | | N/A | | | 9 | |
| | 42.29 | | | 21.05 | | | 235,108 | | | 1.39 | | | 6.91 | | | N/A | | | N/A | | | 1 | |
| | (17.61 | ) | | (6.71 | ) | | 206,976 | | | 1.42 | | | 6.48 | | | N/A | | | N/A | | | 16 | |
| | | | | | | | | | | | | | | | | | | | | | | | |
| | | | | | | | | | | | | | | | | | | | | | | | |
| | (3.14 | ) | | .58 | | | 146,560 | | | 2.30 | ** | | 4.35 | ** | | N/A | | | N/A | | | 5 | |
| | 23.20 | | | 13.05 | | | 149,417 | | | 2.37 | | | 4.71 | | | N/A | | | N/A | | | 9 | |
| | 0.98 | | | 4.75 | | | 139,060 | | | 2.42 | | | 5.26 | | | N/A | | | N/A | | | 10 | |
| | 14.63 | | | 8.28 | | | 140,525 | | | 1.74 | | | 5.74 | | | N/A | | | N/A | | | 10 | |
| | 26.58 | | | 20.29 | | | 137,268 | | | 1.37 | | | 7.07 | | | 1.31 | % | | 7.13 | % | | 4 | |
| | (16.02 | ) | | (7.45 | ) | | 121,533 | | | 1.36 | | | 6.45 | | | 1.22 | | | 6.59 | | | 17 | |
| (c) | Ratios do not reflect the effect of dividend payments to Auction Rate Preferred shareholders, where applicable; Net Investment Income (Loss) ratios reflect income earned and expenses incurred on assets attributable to Auction Rate Preferred Shares (“ARPS”), MTP Shares and/or VRDP Shares, where applicable. |
| (d) | After expense reimbursement from the Adviser, where applicable. As of August 1, 2009, the Adviser is no longer reimbursing New York Dividend Advantage (NAN) for any fees and expenses. |
| (e) | The expense ratios reflect, among other things, all interest expense and other costs related to MTP Shares, VRDP Shares and/or the interest expense deemed to have been paid by the Fund on the floating rate certificates issued by the special purpose trusts for the self-deposited inverse floaters held by the Fund, where applicable, each as described in Footnote 1 – General Information and Significant Accounting Policies, MuniFund Term Preferred Shares, Variable Rate Demand Preferred Shares and Inverse Floating Rate Securities, respectively, as follows: |
| New York Performance Plus (NNP) | | | | |
| Year Ended 9/30: | | | | |
| 2013(f) | | | .58 | % |
| 2012 | | | .61 | |
| 2011 | | | .70 | |
| 2010 | | | .40 | |
| 2009 | | | .22 | |
| 2008 | | | .15 | |
| | | | | |
| New York Dividend Advantage (NAN) | | | | |
| Year Ended 9/30: | | | | |
| 2013(f) | | | 1.22 | % |
| 2012 | | | 1.27 | |
| 2011 | | | 1.27 | |
| 2010 | | | .63 | |
| 2009 | | | .20 | |
| 2008 | | | .13 | |
| (f) | For the six months ended March 31, 2013. |
| * | Rounds to less than $.01 per share. |
| ** | Annualized. |
| N/A | Fund did not have, or no longer has, a contractual reimbursement agreement with the Adviser. |
See accompanying notes to financial statements.
| | | Financial |
| | | Highlights (Unaudited) (continued) |
| | | |
| | Selected data for a Common share outstanding throughout each period: |
| | | | | | Investment Operations | | Less Distributions | | | | | | | | | | |
| | | Beginning Common Share Net Asset Value | | Net Investment Income (Loss | ) | Net Realized/ Unrealized Gain (Loss | ) | Distributions from Net Investment Income to Auction Rate Preferred Shareholders | (a) | Distributions from Accumulated Net Realized Gains to Auction Rate Preferred Shareholders | (a) | Total | | From Net Investment Income to Common Shareholders | | From Accumulated Net Realized Gains to Common Shareholders | | Total | | Discount from Common Shares Repurchased and Retired | | Ending Common Share Net Asset Value | | Ending Market Value | |
| New York Dividend Advantage 2 (NXK) | | | | | | | | | | | | | | | | | | | | | | | | | |
| Year Ended 9/30: | | | | | | | | | | | | | | | | | | | | | | | | | |
| 2013(f) | $ | 15.96 | | $ | .33 | | $ | (.25 | ) | $ | — | | $ | — | | $ | .08 | | $ | (.38 | ) | $ | (.02 | ) | $ | (.40 | ) | $ | — | | $ | 15.64 | | $ | 14.73 | |
| 2012 | | | 14.94 | | | .72 | | | 1.10 | | | — | | | — | | | 1.82 | | | (.80 | ) | | — | | | (.80 | ) | | — | | | 15.96 | | | 15.51 | |
| 2011 | | | 15.13 | | | .74 | | | (.13 | ) | | — | | | — | | | .61 | | | (.80 | ) | | — | | | (.80 | ) | | — | | | 14.94 | | | 13.60 | |
| 2010 | | | 14.76 | | | .83 | | | .36 | | | (.01 | ) | | — | * | | 1.18 | | | (.80 | ) | | (.01 | ) | | (.81 | ) | | — | | | 15.13 | | | 14.37 | |
| 2009 | | | 13.14 | | | .92 | | | 1.66 | | | (.05 | ) | | (.04 | ) | | 2.49 | | | (.73 | ) | | (.14 | ) | | (.87 | ) | | — | * | | 14.76 | | | 13.41 | |
| 2008 | | | 14.80 | | | .95 | | | (1.64 | ) | | (.23 | ) | | (.01 | ) | | (.93 | ) | | (.69 | ) | | (.04 | ) | | (.73 | ) | | — | | | 13.14 | | | 11.15 | |
| | | | | | | | | | | | | | | | | | | | | | | | | | | | | | | | | | | | | | |
| New York AMT-Free Income (NRK) | | | | | | | | | | | | | | | | | | | | | | | | | |
| Year Ended 9/30: | | | | | | | | | | | | | | | | | | | | | | | | | |
| 2013(f) | | 15.44 | | | .33 | | | (.44 | ) | | — | | | — | | | (.11 | ) | | (.40 | ) | | (.02 | ) | | (.42 | ) | | — | | | 14.91 | | | 14.43 | |
| 2012 | | | 15.03 | | | .66 | | | .46 | | | — | | | — | | | 1.12 | | | (.70 | ) | | (.01 | ) | | (.71 | ) | | — | | | 15.44 | | | 15.29 | |
| 2011 | | | 15.36 | | | .65 | | | (.24 | ) | | — | | | — | | | .41 | | | (.74 | ) | | — | | | (.74 | ) | | — | | | 15.03 | | | 13.86 | |
| 2010 | | | 15.18 | | | .77 | | | .23 | | | (.01 | ) | | (.01 | ) | | .98 | | | (.73 | ) | | (.07 | ) | | (.80 | ) | | — | | | 15.36 | | | 14.75 | |
| 2009 | | | 13.31 | | | .83 | | | 1.81 | | | (.10 | ) | | — | * | | 2.54 | | | (.66 | ) | | (.01 | ) | | (.67 | ) | | — | * | | 15.18 | | | 13.70 | |
| 2008 | | | 14.65 | | | .88 | | | (1.32 | ) | | (.25 | ) | | — | * | | (.69 | ) | | (.65 | ) | | — | * | | (.65 | ) | | — | | | 13.31 | | | 11.52 | |
| (a) | The amounts shown are based on Common share equivalents. |
| (b) | Total Return Based on Market Value is the combination of changes in the market price per share and the effect of reinvested dividend income and reinvested capital gains distributions, if any, at the average price paid per share at the time of reinvestment. The last dividend declared in the period, which is typically paid on the first business day of the following month, is assumed to be reinvested at the ending market price. The actual reinvestment for the last dividend declared in the period may take place over several days, and in some instances may not be based on the market price, so the actual reinvestment price may be different from the price used in the calculation. Total returns are not annualized. |
| | Total Return Based on Common Share Net Asset Value is the combination of changes in Common share net asset value, reinvested dividend income at net asset value and reinvested capital gains distributions at net asset value, if any. The last dividend declared in the period, which is typically paid on the first business day of the following month, is assumed to be reinvested at the ending net asset value. The actual reinvest price for the last dividend declared in the period may often be based on the Fund’s market price (and not its net asset value), and therefore may be different from the price used in the calculation. Total returns are not annualized. |
| | | | | | | | | | | Ratios/Supplemental Data | | | | |
| | Total Returns | | | | | | Ratios to Average Net Assets Applicable to Common Shares Before Reimbursement(c) | | Ratios to Average Net Assets Applicable to Common Shares After Reimbursement(c)(d) | | | | |
| | | | | | | | Ending | | | | | | | | | | | | | | | | |
| | | | | Based | | | Net | | | | | | | | | | | | | | | | |
| | | | | on | | | Assets | | | | | | | | | | | | | | | | |
| | Based | | | Common | | | Applicable | | | | | | Net | | | | | | Net | | | | |
| | on | | | Share Net | | to Common | | | | | Investment | | | | | Investment | | | Portfolio | |
| | Market | | | Asset | | Shares | | | | | Income | | | | | Income | | | Turnover | |
| | Value | (b) | | Value | (b) | | (000 | ) | | Expenses | (e) | | (Loss | ) | | Expenses | (e) | | (Loss | ) | | Rate | |
| | | | | | | | | | | | | | | | | | | | | | | | |
| | | | | | | | | | | | | | | | | | | | | | | | |
| | (2.47 | )% | | .52 | % | $ | 101,481 | | | 2.26 | %** | | 4.19 | %** | | N/A | | | N/A | | | 9 | % |
| | 20.38 | | | 12.47 | | | 103,527 | | | 2.32 | | | 4.66 | | | N/A | | | N/A | | | 10 | |
| | .49 | | | 4.38 | | | 96,940 | | | 2.44 | | | 5.12 | | | 2.41 | % | | 5.16 | % | | 14 | |
| | 13.65 | | | 8.27 | | | 98,156 | | | 1.74 | | | 5.54 | | | 1.63 | | | 5.65 | | | 6 | |
| | 29.95 | | | 20.06 | | | 95,751 | | | 1.36 | | | 6.83 | | | 1.18 | | | 7.01 | | | 0 | |
| | (16.79 | ) | | (6.63 | ) | | 85,340 | | | 1.37 | | | 6.25 | | | 1.11 | | | 6.51 | | | 17 | |
| | | | | | | | | | | | | | | | | | | | | | | | |
| | | | | | | | | | | | | | | | | | | | | | | | |
| | (2.98 | ) | | (.76 | ) | | 1,306,181 | | | 2.53 | ** | | 4.88 | ** | | N/A | | | N/A | | | 9 | |
| | 15.78 | | | 7.63 | | | 54,140 | | | 2.82 | | | 4.35 | | | N/A | | | N/A | | | 15 | |
| | (.81 | ) | | 2.91 | | | 52,694 | | | 2.91 | | | 4.44 | | | 2.89 | | | 4.47 | | | 6 | |
| | 13.97 | | | 6.70 | ** | | 53,866 | | | 1.95 | | | 5.01 | | | 1.81 | | | 5.15 | | | 4 | |
| | 25.65 | | | 19.67 | | | 53,223 | | | 1.40 | | | 5.77 | | | 1.13 | | | 6.04 | | | 4 | |
| | (11.94 | ) | | (4.91 | ) | | 46,769 | | | 1.41 | | | 5.68 | | | 1.02 | | | 6.07 | | | 8 | |
| (c) | Ratios do not reflect the effect of dividend payments to Auction Rate Preferred shareholders, where applicable; Net Investment Income (Loss) ratios reflect income earned and expenses incurred on assets attributable to ARPS, MTP, VMTP and/or VRDP Shares, where applicable. |
| (d) | After expense reimbursement from the Adviser, where applicable. As of March 31, 2011 and November 30, 2010, the Adviser is no longer reimbursing New York Dividend Advantage 2 (NXK) and New York AMT-Free Income (NRK), respectively, for any fees or expenses. |
| (e) | The expense ratios reflect, among other things, all interest expense and other costs related to MTP Shares, VMTP Shares and/or VRDP Shares and/or the interest expense deemed to have been paid by the Fund on the floating rate certificates issued by the special purpose trusts for the self-deposited inverse floaters held by the Fund, where applicable, each as described in Footnote 1 – General Information and Significant Accounting Policies, MuniFund Term Preferred Shares, Variable Rate MuniFund Term Preferred Shares, Variable Rate Demand Preferred Shares and Inverse Floating Rate Securities, respectively, as follows: |
| New York Dividend Advantage 2 (NXK) | | | | |
| Year Ended 9/30: | | | | |
| 2013(f) | | | 1.17 | % |
| 2012 | | | 1.20 | |
| 2011 | | | 1.29 | |
| 2010 | | | .63 | |
| 2009 | | | .20 | |
| 2008 | | | .14 | |
| | | | | |
| New York AMT-Free Income (NRK) | | | | |
| Year Ended 9/30: | | | | |
| 2013(f) | | | 1.23 | % |
| 2012 | | | 1.59 | |
| 2011 | | | 1.66 | |
| 2010 | | | .77 | |
| 2009 | | | .09 | |
| 2008 | | | .15 | |
| (f) | For the six months ended March 31, 2013. |
| * | Rounds to less than $.01 per share. |
| ** | Annualized. |
| N/A | Fund no longer has a contractual reimbursement agreement with the Adviser. |
See accompanying notes to financial statements.
| | | Financial |
| | | Highlights (Unaudited) (continued) |
| | | ARPS at the End of Period | | MTP Shares at the End of Period (g) | | VRDP Shares at the End of Period | | ARPS and MTP Shares at the End of Period | |
| | | Aggregate Amount Outstanding (000 | ) | Asset Coverage Per $25,000 Share | | Aggregate Amount Outstanding (000 | ) | Asset Coverage Per $10 Share | | Aggregate Amount Outstanding (000 | ) | Asset Coverage Per $100,000 Share | | Asset Coverage Per $1 Liquidation Preference | |
| New York Performance Plus (NNP) | | | | | | | | | | | | | | | | |
| Year Ended 9/30: | | | | | | | | | | | | | | | | | | | |
| 2013(f) | | $ | — | | $ | — | | $ | — | | $ | — | | $ | 89,000 | | $ | 379,171 | | $ | — | |
| 2012 | | | — | | | — | | | — | | | — | | | 89,000 | | | 384,748 | | | — | |
| 2011 | | | — | | | — | | | — | | | — | | | 89,000 | | | 368,059 | | | — | |
| 2010 | | | — | | | — | | | — | | | — | | | 89,000 | | | 371,292 | | | — | |
| 2009 | | | 87,650 | | | 92,059 | | | — | | | — | | | — | | | — | | | — | |
| 2008 | | | 87,650 | | | 84,035 | | | — | | | — | | | — | | | — | | | — | |
| | | | | | | | | | | | | | | | | |
| New York Dividend Advantage (NAN) | | | | | | | | | | | | | | | | |
| Year Ended 9/30: | | | | | | | | | | | | | | | | |
| 2013(f) | | | — | | | — | | | 55,360 | | | 36.47 | | | — | | | — | | | — | |
| 2012 | | | — | | | — | | | 55,360 | | | 36.99 | | | — | | | — | | | — | |
| 2011 | | | — | | | — | | | 55,360 | | | 35.12 | | | — | | | — | | | — | |
| 2010 | | | 21,900 | | | 92,690 | | | 30,000 | | | 37.08 | | | — | | | — | | | 3.71 | |
| 2009 | | | 51,400 | | | 91,765 | | | — | | | — | | | — | | | — | | | — | |
| 2008 | | | 51,400 | | | 84,112 | | | — | | | — | | | — | | | — | | | — | |
| (f) | For the six months ended March 31, 2013. |
| (g) | The Ending and Average Market Value Per Share for each Series of the Fund’s MTP Shares were as follows: |
| | | | | | | Ending | | | Average | | | | | | Ending | �� | | Average | |
| | | | | | | Market Value | | | Market Value | | | | | | Market Value | | | Market Value | |
| | | | Series | | | Per Share | | | Per Share | | | Series | | | Per Share | | | Per Share | |
| New York Dividend Advantage (NAN) | | | | | | | | | | | | | |
| Year Ended 9/30: | | | | | | | | | | | | | |
| 2013(f) | | | 2015 | | $ | 10.12 | | $ | 10.11 | | | 2016 | | $ | 10.16 | | $ | 10.12 | |
| 2012 | | | 2015 | | | 10.08 | | | 10.11 | | | 2016 | | | 10.09 | | | 10.11 | |
| 2011 | | | 2015 | | | 10.09 | | | 10.08 | | | 2016 | | | 10.06 | | | 9.95 | ^^ |
| 2010 | | | 2015 | | | 10.16 | | | 10.09 | ^ | | — | | | — | | | — | |
| 2009 | | | — | | | — | | | — | | | — | | | — | | | — | |
| 2008 | | | — | | | — | | | — | | | — | | | — | | | — | |
| ^ | For the period December 21, 2009 (first issuance date of shares) through September 30, 2010. |
| ^^ | For the period December 13, 2010 (first issuance date of shares) through September 30, 2011. |
| | | ARPS at the End of Period | | MTP Shares at the End of Period (g) | | VMTP Shares at the End of Period | | VRDP Shares at the End of Period | | MTP, VMTP and VRDP Shares at the End of Period | |
| | | Aggregate Amount Outstanding (000 | ) | Asset Coverage Per $25,000 Share | | Aggregate Amount Outstanding (000 | ) | Asset Coverage Per $10 Share | | Aggregate Amount Outstanding (000 | ) | Asset Coverage Per $100,000 Share | | Aggregate Amount Outstanding (000 | ) | Asset Coverage Per $100,000 Share | | Asset Coverage Per $1 Liquidation Preference | |
| New York Dividend Advantage 2 (NXK) | | | | | | | | | | | | | | | | | | | |
| Year Ended 9/30: | | | | | | | | | | | | | | | | | | | | | | |
| 2013(f) | | $ | — | | $ | — | | $ | 37,890 | | $ | 36.78 | | $ | — | | $ | — | | $ | — | | $ | — | | $ | — | |
| 2012 | | | — | | | — | | | 37,890 | | | 37.32 | | | — | | | — | | | — | | | — | | | — | |
| 2011 | | | — | | | — | | | 37,890 | | | 35.58 | | | — | | | — | | | — | | | — | | | — | |
| 2010 | | | — | | | — | | | 37,890 | | | 35.91 | | | — | | | — | | | — | | | — | | | — | |
| 2009 | | | 34,100 | | | 95,198 | | | — | | | — | | | — | | | — | | | — | | | — | | | — | |
| 2008 | | | 34,100 | | | 87,566 | | | — | | | — | | | — | | | — | | | — | | | — | | | — | |
| | | | | | | | | | | | | | | | | | | | | | | | | | | | | |
| New York AMT-Free Income (NRK) | | | | | | | | | | | | | | | | | | | |
| Year Ended 9/30: | | | | | | | | | | | | | | | | | | | |
| 2013(f) | | | — | | | — | | | 27,680 | | | 33.03 | | | 50,700 | | | 330,294 | | | 488,800 | | | 330,294 | | | 3.30 | |
| 2012 | | | — | | | — | | | 27,680 | | | 29.56 | | | — | | | — | | | — | | | — | | | — | |
| 2011 | | | — | | | — | | | 27,680 | | | 29.04 | | | — | | | — | | | — | | | — | | | — | |
| 2010 | | | — | | | — | | | 27,680 | | | 29.46 | | | — | | | — | | | — | | | — | | | — | |
| 2009 | | | 27,000 | | | 74,281 | | | — | | | — | | | — | | | — | | | — | | | — | | | — | |
| 2008 | | | 27,000 | | | 68,304 | | | — | | | — | | | — | | | — | | | — | | | — | | | — | |
| (g) | The Ending and Average Market Value Per Share for each Series of the Fund’s MTP Shares were as follows: |
| | | | | | | Ending | | | Average | |
| | | | | | | Market Value | | | Market Value | |
| | | | Series | | | Per Share | | | Per Share | |
| New York Dividend Advantage 2 (NXK) | | | | | | | | | | |
| Year Ended 9/30: | | | | | | | | | | |
| 2013(f) | | | 2015 | | $ | 10.06 | | $ | 10.08 | |
| 2012 | | | 2015 | | | 10.07 | | | 10.09 | |
| 2011 | | | 2015 | | | 10.11 | | | 10.05 | |
| 2010 | | | 2015 | | | 10.14 | | | 10.05 | ^^^ |
| 2009 | | | — | | | — | | | — | |
| 2008 | | | — | | | — | | | — | |
| | | | | | | | | | | |
| New York AMT-Free Income (NRK) | | | | | | | | | | |
| Year Ended 9/30: | | | | | | | | | | |
| 2013(f) | | | 2015 | | | 10.10 | | | 10.09 | |
| 2012 | | | 2015 | | | 10.14 | | | 10.10 | |
| 2011 | | | 2015 | | | 10.10 | | | 10.06 | |
| 2010 | | | 2015 | | | 10.33 | | | 10.09 | ^^^ |
| 2009 | | | — | | | — | | | — | |
| 2008 | | | — | | | — | | | — | |
| ^^^ | For the period April 14, 2010 (first issuance date of shares) through September 30, 2010. |
See accompanying notes to financial statements.
| | | Notes to |
| | | Financial Statements (Unaudited) |
1. General Information and Significant Accounting Policies
General Information
The funds covered in this report and their corresponding Common share stock exchange symbols are Nuveen New York Municipal Value Fund, Inc. (NNY), Nuveen New York Municipal Value Fund 2 (NYV), Nuveen New York Performance Plus Municipal Fund, Inc. (NNP), Nuveen New York Dividend Advantage Municipal Fund (NAN), Nuveen New York Dividend Advantage Municipal Fund 2 (NXK) and Nuveen New York AMT-Free Municipal Income Fund (NRK) (each a “Fund” and collectively, the “Funds”). Common shares of New York Value (NNY), New York Performance Plus (NNP) and New York Dividend Advantage (NAN) are traded on the New York Stock Exchange (“NYSE”) while Common shares of New York Value 2 (NYV), New York Dividend Advantage 2 (NXK) and New York AMT-Free Income Fund (NRK) are traded on the NYSE MKT. The Funds are registered under the Investment Company Act of 1940, as amended, as diversified (non-diversified for New York Municipal Value 2 (NYV), closed-end registered investment companies.
On December 31, 2012, the Funds’ investment adviser converted from a Delaware corporation to a Delaware limited liability company. As a result, Nuveen Fund Advisers, Inc., a wholly-owned subsidiary of Nuveen Investments, Inc. (“Nuveen”), changed its name to Nuveen Fund Advisors, LLC (the “Adviser”). There were no changes to the identities or roles of any personnel as a result of the change.
Each Fund seeks to provide current income exempt from both regular federal and New York state income taxes, and in the case of New York AMT-Free Income (NRK) the alternative minimum tax applicable to individuals, by investing primarily in a portfolio of municipal obligations issued by state and local government authorities within the state of New York or certain U.S. territories.
Fund Reorganizations
Effective before the opening of business on March 11, 2013, certain New York funds (the “Acquired Funds”) were reorganized into one, larger-state fund (the “Acquiring Fund”) included in this report (each a “Reorganization” and collectively the “Reorganizations”) as follows:
| | Acquired Funds | Acquiring Fund |
| | Nuveen New York Investment Quality Municipal Fund, Inc. (NQN) | New York AMT-Free Income (NRK) |
| | (“New York Investment Quality”) | |
| | Nuveen New York Select Quality Municipal Fund, Inc. (NVN) | |
| | (“New York Select Quality”) | |
| | Nuveen New York Quality Income Municipal Fund, Inc. (NUN) | |
| | (“New York Quality Income”) | |
| | Nuveen New York Premium Income Municipal Fund, Inc. (NNF) | |
| | (“New York Premium Income”) | |
| | Nuveen New York Dividend Advantage Municipal Income Fund (NKO) | |
| | (“New York Dividend Advantage Income”) | |
The Reorganizations of the Funds were approved by the shareholders of the Acquired Funds at a special meeting on January 28, 2013.
Upon the closing of each Fund’s Reorganization, the Acquired Funds transferred their assets to the Acquiring Fund in exchange for common and preferred shares of the Acquiring Fund and the assumption by the Acquiring Fund of the liabilities of the Acquired Funds. The Acquired Funds were then liquidated, dissolved and terminated in accordance with their Declaration of Trust. Shareholders of the Acquired Funds became shareholders of the Acquiring Fund. Holders of common shares of the Acquired Funds received newly issued common shares of the Acquiring Fund, the aggregate net asset value of which was equal to the aggregate net asset value of the common shares of the Acquired Funds held immediately prior to the Reorganizations (including for this purpose fractional Acquiring Fund shares to which shareholders would be entitled). Fractional shares were sold on the open market and shareholders received cash in lieu of such fractional shares. Holders of preferred shares of the Acquired Funds received on a one-for-one basis newly issued preferred shares of the Acquiring Fund, in exchange for preferred shares of the Acquired Funds held immediately prior to the Reorganizations. Details of the Funds’ Reorganizations are further described in the Variable Rate MuniFund Term Preferred Shares and Variable Rate Demand Preferred Shares sections of this footnote and Footnote 8 – Fund Reorganizations.
Significant Accounting Policies
The following is a summary of significant accounting policies followed by the Funds in the preparation of their financial statements in accordance with U.S. generally accepted accounting principles (“U.S. GAAP”).
Investment Valuation
Prices of municipal bonds and swap contracts are provided by a pricing service approved by the Funds’ Board of Directors/Trustees. These securities are generally classified as Level 2 for fair value measurement purposes. The pricing service establishes a security’s fair value using methods that may include consideration of the following: yields or prices of investments of comparable quality, type of issue, coupon, maturity and rating, market quotes or indications of value from security dealers, evaluations of anticipated cash flows or collateral, general market conditions and other information and analysis, including the obligor’s credit characteristics considered relevant. In pricing certain securities, particularly less liquid and lower quality securities, the pricing service may consider information about a security, its issuer, or market activity provided by the Adviser. These securities are generally classified as Level 2 or Level 3 depending on the priority of the significant inputs.
Certain securities may not be able to be priced by the pre-established pricing methods as described above. Such securities may be valued by the Funds’ Board of Directors/Trustees or its designee at fair value. These securities generally include, but are not limited to, restricted securities (securities which may not be publicly sold without registration under the Securities Act of 1933, as amended) for which a pricing service is unable to provide a market price; securities whose trading has been formally suspended; debt securities that have gone into default and for which there is no current market quotation; a security whose market price is not available from a pre-established pricing source; a security with respect to which an event has occurred that is likely to materially affect the value of the security after the market has closed but before the calculation of a Fund’s net asset value (as may be the case in non-U.S. markets on which the security is primarily traded) or make it difficult or impossible to obtain a reliable market quotation; and a security whose price, as provided by the pricing service, is not deemed to reflect the security’s fair value. As a general principle, the fair value of a security would appear to be the amount that the owner might reasonably expect to receive for it in a current sale. A variety of factors may be considered in determining the fair value of those securities, which may include consideration of the following: yields or prices of investments of comparable quality, type of issue, coupon, maturity and rating, market quotes or indications of value from security dealers, evaluations of anticipated cash flows or collateral, general market conditions and other information and analysis, including the obligor’s credit characteristics considered relevant. These securities are generally classified as Level 2 or Level 3 depending on the priority of the significant inputs. Regardless of the method employed to value a particular security, all valuations are subject to review by the Funds’ Board of Directors/Trustees or its designee.
Refer to Footnote 2 – Fair Value Measurements for further details on the leveling of securities held by the Funds as of the end of the reporting period.
Investment Transactions
Investment transactions are recorded on a trade date basis. Realized gains and losses from transactions are determined on the specific identification method, which is the same basis used for federal income tax purposes. Investments purchased on a when-issued/delayed delivery basis may have extended settlement periods. Any investments so purchased are subject to market fluctuation during this period. The Funds have instructed the custodian to earmark securities in the Funds’ portfolios with a current value at least equal to the amount of the when-issued/delayed delivery purchase commitments. As of March 31, 2013, New York AMT-Free Income (NRK) had outstanding when-issued/delayed delivery purchase commitments of $22,273,648. There were no such outstanding purchase commitments in any of the other Funds.
Investment Income
Investment income, which reflects the amortization of premiums and includes accretion of discounts for financial reporting purposes, is recorded on an accrual basis. Investment income also reflects paydown gains and losses, if any.
Professional Fees
Professional fees presented on the Statement of Operations consist of legal fees incurred in the normal course of operations, audit fees, tax consulting fees and, in some cases, workout expenditures. Workout expenditures are incurred in an attempt to protect or enhance an investment, or to pursue other claims or legal actions on behalf of Fund shareholders. Legal fee refund presented on the Statement of Operations reflects a refund of workout expenditures paid in a prior reporting period, when applicable.
Income Taxes
Each Fund is a separate taxpayer for federal income tax purposes. Each Fund intends to distribute substantially all of its net investment income and net capital gains to shareholders and to otherwise comply with the requirements of Subchapter M of the Internal Revenue Code applicable to regulated investment companies. Therefore, no federal income tax provision is required. Furthermore, each Fund intends to satisfy conditions that will enable interest from municipal securities, which is exempt from regular federal and New York state income taxes, and in the case of New York AMT-Free Income (NRK) the alternative minimum tax applicable to individuals, to retain such tax-exempt status when distributed to shareholders of the Funds. Net realized capital gains and ordinary income distributions paid by the Funds are subject to federal taxation.
| | | Notes to |
| | | Financial Statements (Unaudited) (continued) |
For all open tax years and all major taxing jurisdictions, management of the Funds has concluded that there are no significant uncertain tax positions that would require recognition in the financial statements. Open tax years are those that are open for examination by taxing authorities (i.e., generally the last four tax year ends and the interim tax period since then). Furthermore, management of the Funds is also not aware of any tax positions for which it is reasonably possible that the total amounts of unrecognized tax benefits will significantly change in the next twelve months.
Dividends and Distributions to Common Shareholders
Dividends from net investment income are declared monthly. Net realized capital gains and/or market discount from investment transactions, if any, are distributed to shareholders at least annually. Furthermore, capital gains are distributed only to the extent they exceed available capital loss carryforwards.
Distributions to Common shareholders of net investment income, net realized capital gains and/or market discount, if any, are recorded on the ex-dividend date. The amount and timing of distributions are determined in accordance with federal income tax regulations, which may differ from U.S. GAAP.
Auction Rate Preferred Shares
Each Fund except New York Value (NNY) and New York Value 2 (NYV) is authorized to issue Auction Rate Preferred Shares (“ARPS”). As of September 30, 2011, the Funds redeemed all of their outstanding ARPS at liquidation value.
MuniFund Term Preferred Shares
The following Funds have issued and outstanding MuniFund Term Preferred (“MTP”) Shares, with a $10 stated (“par”) value per share. Each Fund’s MTP Shares are issued in one or more Series and trade on NYSE. Dividends on MTP Shares, which are recognized as interest expense for financial reporting purposes, are paid monthly at a fixed annual rate, subject to adjustments in certain circumstances.
| | | | Series | | | NYSE Ticker | | | Shares Outstanding | | | Shares Outstanding at $10 Per Share Liquidation Value | | | Annual Interest Rate | |
| New York Dividend Advantage (NAN) | | | | | | | | | | | | | | | | |
| | | | 2015 | | | NAN Pr C | | | 3,000,000 | | $ | 30,000,000 | | | 2.70 | % |
| | | | 2016 | | | NAN Pr D | | | 2,536,000 | | | 25,360,000 | | | 2.50 | |
| New York Dividend Advantage 2 (NXK) | | | | | | | | | | | | | | | | |
| | | | 2015 | | | NXK Pr C | | | 3,789,000 | | $ | 37,890,000 | | | 2.55 | % |
| New York AMT-Free Income (NRK) | | | | | | | | | | | | | | | | |
| | | | 2015 | | | NRK Pr C | | | 2,768,000 | | $ | 27,680,000 | | | 2.55 | % |
Each Fund is obligated to redeem its MTP Shares by the date as specified in its offering document (“Term Redemption Date”), unless earlier redeemed or repurchased by the Fund. MTP Shares are subject to optional and mandatory redemption in certain circumstances. MTP Shares will be subject to redemption at the option of each Fund (“Optional Redemption Date”), subject to a payment of premium for one year following the Optional Redemption Date (“Premium Expiration Date”), and at par thereafter. MTP Shares also will be subject to redemption, at the option of each Fund, at par in the event of certain changes in the credit rating of the MTP Shares. Each Fund may be obligated to redeem certain of the MTP Shares if the Fund fails to maintain certain asset coverage and leverage ratio requirements and such failures are not cured by the applicable cure date. The redemption price per share is equal to the sum of the liquidation value per share plus any accumulated but unpaid dividends. The Term Redemption Date, Optional Redemption Date and Premium Expiration Date for each Fund’s series of MTP Shares by NYSE ticker symbol are as follows:
| | | | Series | | | NYSE Ticker | | | Term Redemption Date | | | Optional Redemption Date | | | Premium Expiration Date | |
| New York Dividend Advantage (NAN) | | | | | | | | | | | | | | | | |
| | | | 2015 | | | NAN Pr C | | | January 1, 2015 | | | January 1, 2011 | | | December 31, 2011 | |
| | | | 2016 | | | NAN Pr D | | | January 1, 2016 | | | January 1, 2012 | | | December 31, 2012 | |
| New York Dividend Advantage 2 (NXK) | | | | | | | | | | | | | | | | |
| | | | 2015 | | | NXK Pr C | | | May 1, 2015 | | | May 1, 2011 | | | April 30, 2012 | |
| New York AMT-Free Income (NRK) | | | | | | | | | | | | | | | | |
| | | | 2015 | | | NRK Pr C | | | May 1, 2015 | | | May 1, 2011 | | | April 30, 2012 | |
The average liquidation value for all series of each Fund’s MTP Shares outstanding during the six months ended March 31, 2013, was as follows:
| | | | | | | | | | |
| | | New York Dividend Advantage (NAN | ) | | New York Dividend Advantage 2 (NXK | ) | | New York AMT-Free Income (NRK | ) |
| Average liquidation value of MTP Shares outstanding | | $ | 55,360,000 | | | $ | 37,890,000 | | | $ | 27,680,000 | |
For financial reporting purposes only, the liquidation value of MTP Shares is recorded as a liability and recognized as “MuniFund Term Preferred (MTP) Shares, at liquidation value” on the Statement of Assets and Liabilities. Unpaid dividends on MTP Shares are recognized as a component of “Interest payable” on the Statement of Assets and Liabilities. Costs incurred by the Funds in connection with their offerings of MTP Shares were recorded as a deferred charge, which are amortized over the life of the shares and are recognized as components of “Deferred offering costs” on the Statement of Assets and Liabilities and “Interest expense and amortization of offering costs” on the Statement of Operations. Dividends paid on MTP Shares and each Fund’s amortized deferred charges are recognized as a component of “Interest expense and amortization of offering costs” on the Statement of Operations.
Variable Rate MuniFund Term Preferred Shares
New York AMT-Free Income (NRK) has issued and outstanding Variable Rate MuniFund Term Preferred (“VMTP”) Shares, with a $100,000 liquidation value per share. The Fund issued its VMTP Shares in a privately negotiated offering. The Fund’s VMTP Shares were offered to qualified institutional buyers pursuant to Rule 144A under the Securities Act of 1933.
In connection with New York AMT-Free Income (NRK) Reorganizations, holders of VMTP Shares of the Acquired Funds received on a one-for-one basis newly issued VMTP Shares of the Acquiring Funds, in exchange for VMTP Shares of the Acquired Funds held immediately prior to the Reorganizations. New York AMT-Free Income (NRK) Series 2014 VMTP Shares were issued in conjunction with the Reorganization of New York Premium Income (NNF).
As of March 31, 2013, the number of VMTP Shares outstanding, at liquidation value, for the Fund is as follows:
| | | | |
| | | New York AMT-Free Income (NRK | ) |
| Series 2014 * | | $ | 50,700,000 | |
| * | VMTP Shares issued in connection with the Reorganizations. |
The Fund is obligated to redeem its VMTP Shares by the date as specified in its offering document (“Term Redemption Date”), unless earlier redeemed or repurchased by the Fund. VMTP Shares are subject to optional and mandatory redemption in certain circumstances. The VMTP Shares are subject to redemption at the option of each Fund (“Optional Redemption Date”), subject to payment of premium for one year following the Optional Redemption Date (“Premium Expiration Date”), and at par thereafter. The Fund may be obligated to redeem certain of the VMTP Shares if the Fund fails to maintain certain asset coverage and leverage ratio requirements and such failures are not cured by the applicable cure date. The redemption price per share is equal to the sum of the liquidation value per share plus any accumulated but unpaid dividends. The Term Redemption Date, Optional Redemption Date and Premium Expiration Date for the Fund’s VMTP Shares are as follows:
| | | | |
| | | New York AMT-Free Income (NRK | ) |
| Series | | 2014 | * |
| Term Redemption Date | | October 1, 2014 | |
| Optional Redemption Date | | October 1, 2012 | |
| Premium Expiration Date | | September 30, 2012 | |
| * | VMTP Shares issued in connection with the Reorganizations. |
| | | Notes to |
| | | Financial Statements (Unaudited) (continued) |
The average liquidation value of VMTP Shares outstanding and annualized dividend rate of VMTP Shares for the Fund during the six months ended March 31, 2013, were as follows:
| | | | |
| | | New York AMT-Free Income (NRK | )* |
| Average liquidation value of VMTP Shares outstanding | | $ | 50,700,000 | |
| Annualized dividend rate | | | 1.17% | |
| * | For the period March 11, 2013 (effective date of the Reorganizations) through March 31, 2013. |
Dividends on VMTP shares (which are treated as interest payments for financial reporting purposes) are set weekly.
For financial reporting purposes only, the liquidation value of VMTP Shares is recorded as a liability on the Statement of Assets and Liabilities. Unpaid dividends on VMTP Shares are recognized as a component of “Interest payable” on the Statement of Assets and Liabilities. Costs incurred by the Fund in connection with its offering of VMTP Shares were recorded as a deferred charge, which are amortized over the life of the shares and are recognized as components of “Deferred offering costs” on the Statement of Assets and Liabilities and “Interest expense and amortization of offering costs” on the Statement of Operations. Dividends paid on VMTP Shares are recognized as a component of “Interest expense and amortization of offering costs” on the Statement of Operations.
Variable Rate Demand Preferred Shares
The following Funds have issued and outstanding Variable Rate Demand Preferred (“VRDP”) Shares, with a $100,000 liquidation value per share. New York Performance Plus (NNP) and New York AMT-Free Income (NRK) issued their VRDP Shares in a privately negotiated offering. The VRDP Shares were offered to qualified institutional buyers pursuant to Rule 144A under the Securities Act of 1933.
In connection with New York AMT-Free Income’s (NRK) Reorganizations, holders of VRDP Shares of the Acquired Funds received on a one-for-one basis newly issued VRDP Shares of the Acquiring Funds, in exchange for VRDP Shares of the Acquired Funds held immediately prior to the Reorganizations. New York AMT-Free Income (NRK) Series 1, Series 2, Series 3 and Series 4 VRDP Shares were issued in conjunction with the Reorganizations of New York Investment Quality (NQN), New York Select Quality (NVN), New York Quality Income (NUN) and New York Dividend Advantage Income (NKO), respectively.
As of March 31, 2013, the number of VRDP Shares outstanding and maturity date for each Fund are as follows:
| | | | | | | | | | | | | | | | |
| | | New York Performance Plus (NNP | ) | | New York AMT-Free Income (NRK | ) | | New York AMT-Free Income (NRK | ) | | New York AMT-Free Income (NRK | ) | | New York AMT-Free Income (NRK | ) |
| Series | | | 1 | | | | 1 | | | | 2 | | | | 3 | | | | 4 | |
| VRDP Shares outstanding | | | 890 | | | | 1,123 | | | | 1,648 | | | | 1,617 | | | | 500 | |
| Maturity | | March 1, 2040 | | | August 1, 2040 | | | August 1, 2040 | | | December 1, 2040 | | | June 1, 2040 | |
VRDP Shares include a liquidity feature that allows VRDP shareholders to have their shares purchased by a liquidity provider with whom each Fund has contracted in the event that purchase orders for VRDP Shares in a remarketing are not sufficient in number to be matched with the sale orders in that remarketing. Each Fund is required to redeem any VRDP Shares that are still owned by the liquidity provider after six months of continuous, unsuccessful remarketing. Each Fund pays an annual remarketing fee of .10% of the aggregate principal amount of all VRDP Shares outstanding. Each Fund’s VRDP Shares have successfully remarketed since issuance.
Dividends on the VRDP Shares (which are treated as interest payments for financial reporting purposes) are set weekly at a rate established by a remarketing agent; therefore, the market value of the VRDP Shares is expected to approximate its liquidation value. If remarketings for VRDP Shares are continuously unsuccessful for six months, the maximum rate is designed to escalate according to a specified schedule in order to enhance the remarketing agent’s ability to successfully remarket the VRDP Shares.
Subject to certain conditions, VRDP Shares may be redeemed, in whole or in part, at any time at the option of each Fund. Each Fund may also redeem certain of the VRDP Shares if the Fund fails to maintain certain asset coverage requirements and such failures are not cured by the applicable cure date. The redemption price per share is equal to the sum of the liquidation value per share plus any accumulated but unpaid dividends.
The average liquidation value of VRDP Shares outstanding and annualized dividend rate of VRDP Shares for each Fund during the six months ended March 31, 2013, were as follows:
| | | | | | | |
| | | New York Performance Plus (NNP | ) | | New York AMT-Free Income (NRK | )* |
| Average liquidation value of VRDP Shares outstanding | | $ | 89,000,000 | | | $ | 488,800,000 | |
| Annualized dividend rate | | | 0.25% | | | | 0.20% | |
| * | For the period March 11, 2013 (effective date of the Reorganization) through March 31, 2013. |
For financial reporting purposes only, the liquidation value of VRDP Shares is recognized as a liability on the Statement of Assets and Liabilities. Unpaid dividends on VRDP Shares are recognized as a component of “Interest payable” on the Statement of Assets and Liabilities, when applicable. Costs incurred by the Funds in connection with their offerings of VRDP Shares were recorded as a deferred charge, which are amortized over the life of the shares and are recognized as a component of “Deferred offering costs” on the Statement of Assets and Liabilities and “Interest expense and amortization of offerings costs” on the Statement of Operations. Dividends paid on the VRDP Shares are recognized as a component of “Interest expense and amortization of offering costs” on the Statement of Operations. In addition to interest expense, each Fund also pays a per annum liquidity fee to the liquidity provider, as well as a remarketing fee, which are recognized as “Liquidity fees” and “Remarketing fees”, respectively, on the Statement of Operations.
Inverse Floating Rate Securities
Each Fund is authorized to invest in inverse floating rate securities. An inverse floating rate security is created by depositing a municipal bond, typically with a fixed interest rate, into a special purpose trust created by a broker-dealer. In turn, this trust (a) issues floating rate certificates, in face amounts equal to some fraction of the deposited bond’s par amount or market value, that typically pay short-term tax-exempt interest rates to third parties, and (b) issues to a long-term investor (such as one of the Funds) an inverse floating rate certificate (sometimes referred to as an “inverse floater”) that represents all remaining or residual interest in the trust. The income received by the inverse floater holder varies inversely with the short-term rate paid to the floating rate certificates’ holders, and in most circumstances the inverse floater holder bears substantially all of the underlying bond’s downside investment risk and also benefits disproportionately from any potential appreciation of the underlying bond’s value. The price of an inverse floating rate security will be more volatile than that of the underlying bond because the interest rate is dependent on not only the fixed coupon rate of the underlying bond but also on the short-term interest paid on the floating rate certificates, and because the inverse floating rate security essentially bears the risk of loss of the greater face value of the underlying bond.
A Fund may purchase an inverse floating rate security in a secondary market transaction without first owning the underlying bond (referred to as an “externally-deposited inverse floater”), or instead by first selling a fixed-rate bond to a broker-dealer for deposit into the special purpose trust and receiving in turn the residual interest in the trust (referred to as a “self-deposited inverse floater”). The inverse floater held by a Fund gives the Fund the right (a) to cause the holders of the floating rate certificates to tender their notes at par, and (b) to have the broker transfer the fixed-rate bond held by the trust to the Fund, thereby collapsing the trust. An investment in an externally-deposited inverse floater is identified in the Portfolio of Investments as “(IF) – Inverse floating rate investment.” An investment in a self-deposited inverse floater is accounted for as a financing transaction. In such instances, a fixed-rate bond deposited into a special purpose trust is identified in the Portfolio of Investments as “(UB) – Underlying bond of an inverse floating rate trust reflected as a financing transaction,” with the Fund accounting for the short-term floating rate certificates issued by the trust as “Floating rate obligations” on the Statement of Assets and Liabilities. In addition, the Fund reflects in “Investment Income” the entire earnings of the underlying bond and the related interest paid to the holders of the short-term floating rate certificates as a component of “Interest expense and amortization of offering costs” on the Statement of Operations.
During the six months ended March 31, 2013, each Fund invested in externally-deposited inverse floaters and/or self-deposited inverse floaters.
Each Fund may also enter into shortfall and forbearance agreements (sometimes referred to as a “recourse trust” or “credit recovery swap”) (such agreements referred to herein as “Recourse Trusts”) with a broker-dealer by which a Fund agrees to reimburse the broker-dealer, in certain circumstances, for the difference between the liquidation value of the fixed-rate bond held by the trust and the liquidation value of the floating rate certificates issued by the trust plus any shortfalls in interest cash flows. Under these agreements, a Fund’s potential exposure to losses related to or on inverse floaters may increase beyond the value of a Fund’s inverse floater investments as a Fund may potentially be liable to fulfill all amounts owed to holders of the floating rate certificates. At period end, any such shortfall is recognized as “Unrealized depreciation on Recourse Trusts” on the Statement of Assets and Liabilities.
As of March 31, 2013, each Fund’s maximum exposure to the floating rate obligations issued by externally-deposited Recourse Trusts, was as follows:
| | | | | | | | | | | | | | | | | | | | |
| | | | | | | | | | New York | | | | | | New York | | | New York | |
| | | | New York | | | New York | | Performance | | | Dividend | | | Dividend | | | AMT-Free | |
| | | | Value | | | Value 2 | | | Plus | | | Advantage | | Advantage 2 | | | Income | |
| | | | (NNY | ) | | (NYV | ) | | (NNP | ) | | (NAN | ) | | (NXK | ) | | (NRK | ) |
| Maximum exposure to Recourse Trusts | | $ | — | | $ | 2,000,000 | | $ | — | | $ | 2,670,000 | | $ | — | | $ | 31,665,000 | |
| | | Notes to |
| | | Financial Statements (Unaudited) (continued) |
The average floating rate obligations outstanding and average annual interest rate and fees related to self-deposited inverse floaters during the six months ended March 31, 2013, were as follows:
| | | | | | | | | | | | | | | | | | | | |
| | | | | | | | | | New York | | | | | | New York | | | New York | |
| | | | New York | | | New York | | Performance | | | Dividend | | | Dividend | | | AMT-Free | |
| | | | Value | | | Value 2 | | | Plus | | | Advantage | | Advantage 2 | | | Income | |
| | | | (NNY | ) | | (NYV | ) | | (NNP | ) | | (NAN | ) | | (NXK | ) | | (NRK | ) |
| Average floating rate obligations outstanding | | $ | 3,255,000 | | $ | — | | $ | 34,645,000 | | $ | 17,512,473 | | $ | 12,150,000 | | $ | 138,905,000 | |
| Average annual interest rate and fees | | | .43 | % | | — | % | | .53 | % | | .52 | % | | .51 | % | | .57 | % |
Swap Contracts
Each Fund is authorized to enter into interest rate swap and forward interest rate swap contracts (“swap contracts”) consistent with their investment objectives and policies to reduce, increase or otherwise alter its risk profile or to alter its portfolio characteristics (i.e. duration, yield curve positioning and credit quality). Each Fund is subject to interest rate risk in the normal course of pursuing its investment. Each Fund’s use of swap contracts is intended to help the Fund manage its overall interest rate sensitivity, either shorter or longer, generally to more closely align the Fund’s interest rate sensitivity with that of the broader market.
Interest rate swap contracts involve each Fund’s agreement with the counterparty to pay or receive a fixed rate payment in exchange for the counterparty receiving or paying a variable rate payment. Forward interest rate swap transactions involve a Fund’s agreement with a counterparty to pay, in the future, a fixed or variable rate payment in exchange for the counterparty paying a Fund a variable or fixed rate payment, the accruals for which would begin at a specified date in the future (the “effective date”). Accordingly, the risk of loss with respect to the swap counterparty on such transactions is limited to the net amount of interest payments that each Fund is to receive. The payment obligation is based on the notional amount of the swap contract and the termination date of the swap (which is akin to a bond’s maturity). The value of a Fund’s swap contract would increase or decrease based primarily on the extent to which long-term interest rates for bonds having a maturity of the swap contract’s termination date increase or decrease. Swap contracts are valued daily. Upon entering into an interest rate swap (and beginning on the effective date for a forward interest rate swap), each Fund accrues the fixed rate payment expected to be paid or received and the variable rate payment expected to be received or paid on a daily basis, and recognizes the daily change in the market value of the Fund’s contractual rights and obligations under the contracts. The net amount recorded for these transactions for each counterparty is recognized on the Statement of Assets and Liabilities as a component of “Unrealized appreciation or depreciation on swaps (,net)” with the change during the fiscal period recognized on the Statement of Operations as a component of “Change in net unrealized appreciation (depreciation) of swaps.” Income received or paid by each Fund is recognized as a component of “Net realized gain (loss) from swaps” on the Statement of Operations, in addition to the net realized gains or losses recognized upon the termination of an interest rate swap contract, and are equal to the difference between the Fund’s basis in the interest rate swap and the proceeds from (or cost of) the closing transaction. Payments received or made at the beginning of the measurement period are recognized as a component of “Swap premiums paid and/or received” on the Statement of Assets and Liabilities, when applicable. For tax purposes, periodic payments are treated as ordinary income or expense.
Each Fund may terminate a swap contract prior to the effective date, at which point a realized gain or loss is recognized. When a swap contract is terminated, it ordinarily does not involve the delivery of securities or other underlying assets or principal, but rather is settled in cash on a net basis. Once periodic payments are settled in cash, they are combined with the net realized gain or loss recorded upon the termination of the swap contracts.
During the six months ended March 31, 2013, New York Value 2 (NYV) entered into swap transactions to manage the duration of the Fund’s portfolio and to reduce its price volatility risk to movements in U.S. interest rates relative to the Fund’s benchmark. The average notional amount of swap contracts outstanding during the six months ended March 31, 2013 was as follows:
| | | | | |
| | | | New York | |
| | | | Value 2 | |
| | | | (NYV | ) |
| Average notional amount of swap contracts outstanding* | | $ | 2,750,000 | |
| * | The average notional amount is calculated based on the outstanding notional at the beginning of the fiscal year and at the end of each fiscal quarter within the current fiscal year. |
Refer to Footnote 3 – Derivative Instruments and Hedging Activities for further details on swap contract activity.
Market and Counterparty Credit Risk
In the normal course of business each Fund may invest in financial instruments and enter into financial transactions where risk of potential loss exists due to changes in the market (market risk) or failure of the other party to the transaction to perform (counterparty credit risk). The potential loss could exceed the value of the financial assets recorded on the financial statements. Financial assets, which potentially expose each Fund to counterparty credit risk, consist principally of cash due from counterparties on forward, option and swap transactions, when applicable. The extent of each Fund’s exposure to counterparty credit risk in respect to these financial assets approximates their carrying value as recorded on the Statement of Assets and Liabilities. Futures contracts, when applicable, expose a Fund to minimal counterparty credit risk as they are exchange traded and the exchange’s clearinghouse, which is counterparty to all exchange traded futures, guarantees the futures contracts against default.
Each Fund helps manage counterparty credit risk by entering into agreements only with counterparties the Adviser believes have the financial resources to honor their obligations and by having the Adviser monitor the financial stability of the counterparties. Additionally, counterparties may be required to pledge collateral daily (based on the daily valuation of the financial asset) on behalf of each Fund with a value approximately equal to the amount of any unrealized gain above a pre-determined threshold. Reciprocally, when each Fund has an unrealized loss, the Funds have instructed the custodian to pledge assets of the Funds as collateral with a value approximately equal to the amount of the unrealized loss above a pre-determined threshold. Collateral pledges are monitored and subsequently adjusted if and when the valuations fluctuate, either up or down, by at least the predetermined threshold amount.
Zero Coupon Securities
Each Fund is authorized to invest in zero coupon securities. A zero coupon security does not pay a regular interest coupon to its holders during the life of the security. Income to the holder of the security comes from accretion of the difference between the original purchase price of the security at issuance and the par value of the security at maturity and is effectively paid at maturity. The market prices of zero coupon securities generally are more volatile than the market prices of securities that pay interest periodically.
Indemnifications
Under the Funds’ organizational documents, their officers and directors/trustees are indemnified against certain liabilities arising out of the performance of their duties to the Funds. In addition, in the normal course of business, the Funds enter into contracts that provide general indemnifications to other parties. The Funds’ maximum exposure under these arrangements is unknown as this would involve future claims that may be made against the Funds that have not yet occurred. However, the Funds have not had prior claims or losses pursuant to these contracts and expect the risk of loss to be remote.
Use of Estimates
The preparation of financial statements in conformity with U.S. GAAP requires management to make estimates and assumptions that affect the reported amounts of assets and liabilities at the date of the financial statements and the reported amounts of increases and decreases in net assets applicable to Common shares from operations during the reporting period. Actual results may differ from those estimates.
2. Fair Value Measurements
Fair value is defined as the price that the Funds would receive upon selling an investment or transferring a liability in an orderly transaction to an independent buyer in the principal or most advantageous market for the investment. A three-tier hierarchy is used to maximize the use of observable market data and minimize the use of unobservable inputs and to establish classification of fair value measurements for disclosure purposes. Observable inputs reflect the assumptions market participants would use in pricing the asset or liability. Observable inputs are based on market data obtained from sources independent of the reporting entity. Unobservable inputs reflect the reporting entity’s own assumptions about the assumptions market participants would use in pricing the asset or liability. Unobservable inputs are based on the best information available in the circumstances. The following is a summary of the three-tiered hierarchy of valuation input levels.
| | Level 1 – | Inputs are unadjusted and prices are determined using quoted prices in active markets for identical securities. |
| | | |
| | Level 2 – | Prices are determined using other significant observable inputs (including quoted prices for similar securities, interest rates, prepayment speeds, credit risk, etc.). |
| | | |
| | Level 3 – | Prices are determined using significant unobservable inputs (including management’s assumptions in determining the fair value of investments). |
| | | Notes to |
| | | Financial Statements (Unaudited) (continued) |
The inputs or methodologies used for valuing securities are not an indication of the risks associated with investing in those securities. The following is a summary of each Fund’s fair value measurements as of the end of the reporting period:
| | | | | | | | | | | | | |
| New York Value (NNY) | | Level 1 | | | Level 2 | | | Level 3 | | | Total | |
| Long-Term Investments*: | | | | | | | | | | | | |
| Municipal Bonds | | $ | — | | | $ | 155,576,784 | | | $ | — | | | $ | 155,576,784 | |
| | | | | | | | | | | | | |
| New York Value 2 (NYV) | | Level 1 | | | Level 2 | | | Level 3 | | | Total | |
| Long-Term Investments*: | | | | | | | | | | | | | | | | |
| Municipal Bonds | | $ | — | | | $ | 37,840,869 | | | $ | — | | | $ | 37,840,869 | |
| Derivatives: | | | | | | | | | | | | | | | | |
| Swaps** | | | — | | | | (81,419 | ) | | | — | | | | (81,419 | ) |
| Total | | $ | — | | | $ | 37,759,450 | | | $ | — | | | $ | 37,759,450 | |
| | | | | | | | | | | | | |
| New York Performance Plus (NNP) | | Level 1 | | | Level 2 | | | Level 3 | | | Total | |
| Long-Term Investments*: | | | | | | | | | | | | | | | | |
| Municipal Bonds | | $ | — | | | $ | 362,925,637 | | | $ | — | | | $ | 362,925,637 | |
| | | | | | | | | | | | | |
| New York Dividend Advantage (NAN) | | Level 1 | | | Level 2 | | | Level 3 | | | Total | |
| Long-Term Investments*: | | | | | | | | | | | | | | | | |
| Municipal Bonds | | $ | — | | | $ | 216,777,228 | | | $ | — | | | $ | 216,777,228 | |
| | | | | | | | | | | | | |
| New York Dividend Advantage 2 (NXK) | | Level 1 | | | Level 2 | | | Level 3 | | | Total | |
| Long-Term Investments*: | | | | | | | | | | | | | | | | |
| Municipal Bonds | | $ | — | | | $ | 148,883,838 | | | $ | — | | | $ | 148,883,838 | |
| | | | | | | | | | | | | |
| New York AMT-Free Income (NRK) | | Level 1 | | | Level 2 | | | Level 3 | | | Total | |
| Long-Term Investments*: | | | | | | | | | | | | | | | | |
| Municipal Bonds | | $ | — | | | $ | 1,985,686,300 | | | $ | — | | | $ | 1,985,686,300 | |
| * | Refer to the Fund’s Portfolio of Investments for industry classifications. |
| ** | Represents net unrealized appreciation (depreciation) as reported in the Fund’s Portfolio of Investments. |
The Nuveen funds’ Board of Directors/Trustees is responsible for the valuation process and has delegated the oversight of the daily valuation process to the Adviser’s Valuation Committee. The Valuation Committee, pursuant to the valuation policies and procedures adopted by the Board of Directors/Trustees, is responsible for making fair value determinations, evaluating the effectiveness of the funds’ pricing policies, and reporting to the Board of Directors/Trustees. The Valuation Committee is aided in its efforts by the Adviser’s dedicated Securities Valuation Team, which is responsible for administering the daily valuation process and applying fair value methodologies as approved by the Valuation Committee. When determining the reliability of independent pricing services for investments owned by the funds, the Valuation Committee, among other things, conducts due diligence reviews of the pricing services and monitors the quality of security prices received through various testing reports conducted by the Securities Valuation Team.
The Valuation Committee will consider pricing methodologies it deems relevant and appropriate when making fair value determinations. Examples of possible methodologies include, but are not limited to, multiple of earnings; discount from market of a similar freely traded security; discounted cash-flow analysis; book value or a multiple thereof; risk premium/yield analysis; yield to maturity; and/or fundamental investment analysis. The Valuation Committee will also consider factors it deems relevant and appropriate in light of the facts and circumstances. Examples of possible factors include, but are not limited to, the type of security; the issuer’s financial statements; the purchase price of the security; the discount from market value of unrestricted securities of the same class at the time of purchase; analysts’ research and observations from financial institutions; information regarding any transactions or offers with respect to the security; the existence of merger proposals or tender offers affecting the security; the price and extent of public trading in similar securities of the issuer or comparable companies; and the existence of a shelf registration for restricted securities.
For each portfolio security that has been fair valued pursuant to the policies adopted by the Board of Directors/Trustees, the fair value price is compared against the last available and next available market quotations. The Valuation Committee reviews the results of such testing and fair valuation occurrences are reported to the Board of Directors/Trustees.
3. Derivative Instruments and Hedging Activities
The Funds record derivative instruments at fair value, with changes in fair value recognized on the Statement of Operations, when applicable. Even though the Funds’ investments in derivatives may represent economic hedges, they are not considered to be hedge transactions for financial reporting purposes. For additional information on the derivative instruments in which each Fund was invested during and at the end of the reporting period, refer to the Portfolios of Investments, Financial Statements and Footnote 1 - General Information and Significant Accounting Policies.
The following table presents the fair value of all derivative instruments held by the Funds as of March 31, 2013, the location of these instruments on the Statement of Assets and Liabilities and the primary underlying risk exposure.
| | | | | | | Location on the Statement of Assets and Liabilities | |
| Underlying | | | Derivative | | | Asset Derivatives | | | Liability Derivatives | |
| Risk Exposure | | | Instrument | | | Location | | | Value | | | Location | | | Value | |
| Interest Rate | | | Swaps | | | | | | | | | Unrealized depreciation | | | | |
| | | | | | | — | | | | | | on swaps | | | | ) |
The following tables present the amount of net realized gain (loss) and change in net unrealized appreciation (depreciation) recognized for the six months ended March 31, 2013, on derivative instruments, as well as the primary risk exposure associated with each.
| | | | | |
| | | | New York | |
| | | | Value 2 | |
| Net Realized Gain (Loss) from Swaps | | | (NYV | ) |
| Risk Exposure | | | | |
| Interest Rate | | $ | — | |
| | | | | |
| | | | New York | |
| | | | Value 2 | |
| Change in Net Unrealized Appreciation (Depreciation) of Swaps | | | (NYV | ) |
| Risk Exposure | | | | |
| Interest Rate | | $ | 144,738 | |
4. Fund Shares
Common Shares
The Funds have not repurchased any of their outstanding common shares during the six months ended March 31, 2013 or fiscal year ended September 30, 2012.
Transactions in Common shares were as follows:
| | | | | | | | | | | | | | | New York | |
| | | New York Value (NNY) | | | New York Value 2 (NYV) | | | Performance Plus (NNP) | |
| | | Six Months | | | | | | | | | | | | Six Months | | | | |
| | | Ended | | | Year Ended | | | Ended | | | Year Ended | | | Ended | | | Year Ended | |
| | | 3/31/13 | | | 9/30/12 | | | 3/31/13 | | | 9/30/12 | | | 3/31/13 | | | 9/30/12 | |
| Common shares: | | | | | | | | | | | | | | | | | | |
| Issued to shareholders due to reinvestment of distributions | | | 14,833 | | | | 7,655 | | | | 849 | | | | 1,763 | | | | 17,886 | | | | 6,054 | |
| | | New York | | | New York | | | New York AMT-Free | |
| | Dividend Advantage (NAN) | | Dividend Advantage 2 (NXK) | | | Income (NRK) | |
| | | Six Months | | | | | | | Six Months | | | | | | | Six Months | | | | | |
| | | Ended | | | Year Ended | | | Ended | | | Year Ended | | | Ended | | | | |
| | | 3/31/13 | | | 9/30/12 | | | 3/31/13 | | | 9/30/12 | | | 3/31/13 | | | 9/30/12 | |
| Common shares: | | | | | | | | | | | | | | | | | | | | | | | | |
Issued in the Reorganizations(1) | | | — | | | | — | | | | — | | | | — | | | | 84,111,257 | | | | — | |
| Issued to shareholders due to reinvestment of distributions | | | — | | | | — | | | | — | | | | — | | | | 687 | | | | — | |
| (1) | Refer to Footnote 8 – Fund Reorganizations for further details. |
Preferred Shares
New York Dividend Advantage (NAN), New York Dividend Advantage 2 (NXK) and New York AMT-Free Income (NRK) did not have any transactions in MTP Shares during the six months ended March 31, 2013 and fiscal year ended September 30, 2012.
| | | Notes to |
| | | Financial Statements (Unaudited) (continued) |
Transactions in VMTP Shares for New York AMT-Free Income (NRK) was as follows:
| | | | New York AMT-Free Income (NRK) | |
| | | | Six Months | | | | |
| | | | Ended | | | Year Ended | |
| | | | 3/31/13 | | | 9/30/12 | |
| | | | Shares | | | Amount | | | Shares | | | Amount | |
VMTP Shares issued in the Reorganizations(1): | | | | | | | | | | | | | |
| Series 2014 | | | 507 | | $ | 50,700,000 | | | — | | $ | — | |
| (1) | Refer to Footnote 8 – Fund Reorganizations for further details. |
New York Performance Plus (NNP) did not have any transactions in VRDP Shares during the six months ended March 31, 2013 and fiscal year ended September 30, 2012.
Transactions in VRDP Shares were as follows:
| | | | New York AMT-Free Income (NRK) | |
| | | | Six Months | | | | |
| | | | Ended | | | Year Ended | |
| | | | 3/31/13 | | | 9/30/12 | |
| | | | Shares | | | Amount | | | Shares | | | Amount | |
VRDP Shares issued in the Reorganizations(1): | | | | | | | | | | | | | |
| Series 1 | | | 1,123 | | $ | 112,300,000 | | | — | | $ | — | |
| Series 2 | | | 1,648 | | | 164,800,000 | | | — | | | — | |
| Series 3 | | | 1,617 | | | 161,700,000 | | | — | | | — | |
| Series 4 | | | 500 | | | 50,000,000 | | | — | | | — | |
| Total | | | 4,888 | | $ | 488,800,000 | | | — | | $ | — | |
| (1) | Refer to Footnote 8 – Fund Reorganizations for further details. |
5. Investment Transactions
Purchases and sales (including maturities but excluding short-term investments and derivative transactions, where applicable) during the six months ended March 31, 2013, were as follows:
| | | | | | | | | | | | | | | New York | | | New York | |
| | | New York | | | New York | | Performance | | | Dividend | | | Dividend | | | AMT-Free | |
| | | Value | | | Value 2 | | | Plus | | | Advantage | | Advantage 2 | | | Income | |
| | | (NNY | ) | | (NYV | ) | | (NNP | ) | | (NAN | ) | | (NXK | ) | | (NRK | ) |
| Purchases | | $ | 12,033,928 | | | $ | 814,791 | | | $ | 34,586,383 | | | $ | 12,852,745 | | | $ | 15,145,047 | | | $ | 55,950,208 | |
| Sales and maturities | | | 11,697,656 | | | | 561,208 | | | | 32,456,565 | | | | 11,280,416 | | | | 14,233,535 | | | | 40,599,450 | |
6. Income Tax Information
The following information is presented on an income tax basis. Differences between amounts for financial statement and federal income tax purposes are primarily due to the timing differences in recognizing taxable market discount, timing differences in recognizing certain gains and losses on investment transactions and the treatment of investments in inverse floating rate securities reflected as financing transactions, if any. To the extent that differences arise that are permanent in nature, such amounts are reclassified within the capital accounts as detailed below. Temporary differences do not require reclassification. Temporary and permanent differences do not impact the net asset values of the Funds.
At March 31, 2013, the cost and unrealized appreciation (depreciation) of investments (excluding investments in derivatives, where applicable), as determined on a federal income tax basis, were as follows:
| | | | | | | | | | | | | | | New York | | | New York | |
| | | New York | | | New York | | | Performance | | | Dividend | | | Dividend | | | AMT-Free | |
| | | Value | | | Value 2 | | | Plus | | | Advantage | | Advantage 2 | | | Income | |
| | | (NNY | ) | | (NYV | ) | | (NNP | ) | | (NAN | ) | | (NXK | ) | | (NRK | ) |
| Cost of investments | | $ | 141,417,014 | | | $ | 32,481,857 | | | $ | 301,812,084 | | | $ | 184,734,340 | | | $ | 127,237,095 | | | $ | 1,712,067,589 | |
| Gross unrealized: | | | | | | | | | | | | | | | | | | | | | | | | |
| Appreciation | | $ | 12,020,774 | | | $ | 5,648,028 | | | $ | 29,156,762 | | | $ | 16,174,021 | | | $ | 10,948,242 | | | $ | 145,517,268 | |
| Depreciation | | | (1,118,666 | ) | | | (289,016 | ) | | | (2,687,970 | ) | | | (1,595,764 | ) | | | (1,449,403 | ) | | | (10,805,428 | ) |
| Net unrealized appreciation (depreciation) of investments | | $ | 10,902,108 | | | $ | 5,359,012 | | | $ | 26,468,792 | | | $ | 14,578,257 | | | $ | 9,498,839 | | | $ | 134,711,840 | |
Permanent differences, primarily due to federal taxes paid, taxable market discount and nondeductible offering costs, resulted in reclassifications among the Funds’ components of Common share net assets at September 30, 2012, the Funds’ last tax year end, as follows:
| | | | | | | | | | | | | | | | | | |
| | | New York | | | New York | | | Performance | | | Dividend | | Dividend | | | AMT-Free | |
| | | Value | | | Value 2 | | | Plus | | | Advantage | | Advantage 2 | | | Income | |
| | | (NNY | ) | | (NYV | ) | | (NNP | ) | | (NAN | ) | | (NXK | ) | | (NRK | ) |
| Paid-in-surplus | | $ | 19,553 | | | $ | — | | | $ | (41,377 | ) | | $ | (276,142 | ) | | $ | (148,166 | ) | | $ | (125,652 | ) |
| Undistributed (Over-distribution of) net investment income | | | (61,458 | ) | | | — | | | | 18,366 | | | | 273,021 | | | | 151,935 | | | | 133,022 | |
| Accumulated net realized gain (loss) | | | 41,905 | | | | — | | | | 23,011 | | | | 3,121 | | | | (3,769 | ) | | | (7,370 | ) |
The tax components of undistributed net tax-exempt income, net ordinary income and net long-term capital gains at September 30, 2012, the Funds’ last tax year end, were as follows:
| | | | | | | | | | | | | | | New York | | | New York | |
| | | New York | | | New York | | Performance | | | Dividend | | | Dividend | | | AMT-Free | |
| | | Value | | | Value 2 | | | Plus | | | Advantage | | Advantage 2 | | | Income | |
| | | (NNY | ) | | (NYV | ) | | (NNP | ) | | (NAN | ) | | (NXK | ) | | (NRK | ) |
| Undistributed net tax-exempt income * | | $ | 549,502 | | | $ | 90,759 | | | $ | 3,559,391 | | | $ | 1,926,043 | | | $ | 862,932 | | | $ | 394,040 | |
| Undistributed net ordinary income ** | | | 23,450 | | | | 8,772 | | | | 41,172 | | | | 12,137 | | | | 14,520 | | | | — | |
| Undistributed net long-term capital gains | | | 187,735 | | | | — | | | | 535,351 | | | | 247,222 | | | | 158,461 | | | | 63,711 | |
The tax character of distributions paid during the Funds’ last tax year ended September 30, 2012, was designated for purposes of the dividends paid deduction as follows:
| | | | | | | | | | | | | | | New York | | | New York | |
| | | New York | | | New York | | Performance | | | Dividend | | | Dividend | | | AMT-Free | |
| | | Value | | | Value 2 | | | Plus | | | Advantage | | Advantage 2 | | | Income | |
| | | (NNY | ) | | (NYV | ) | | (NNP | ) | | (NAN | ) | | (NXK | ) | | (NRK | ) |
| Distributions from net tax-exempt income | | $ | 6,371,242 | | | $ | 1,577,385 | | | $ | 13,524,780 | | | $ | 8,726,540 | | | $ | 6,144,031 | | | $ | 3,167,445 | |
| Distributions from net ordinary income ** | | | — | | | | — | | | | — | | | | — | | | | — | | | | — | |
| Distributions from net long-term capital gains | | | — | | | | — | | | | — | | | | 54,665 | | | | — | | | | 36,118 | |
| * | Undistributed net tax-exempt income (on a tax basis) has not been reduced for the dividend declared on September 4, 2012, and paid on October 1, 2012. |
| ** | Net ordinary income consists of taxable market discount income and net short-term capital gains, if any. |
During the Funds’ last tax year ended September 30, 2012, the following Funds utilized capital loss carryforwards as follows:
| | | | | | | New York | |
| | | | New York | | | Performance | |
| | | | Value | | | Plus | |
| | | | (NNY | ) | | (NNP | ) |
| Utilized capital loss carryforwards | | $ | 21,947 | | $ | 51,614 | |
Under the Regulated Investment Company Modernization Act of 2010, capital losses incurred by the Fund after December 31, 2010, will not be subject to expiration. During the Funds’ last tax year ended September 30, 2012, the following Fund generated post-enactment capital losses as follows:
| | | New York | |
| | | Value 2 | |
| | | (NYV | ) |
| Post-enactment losses: | | | |
| Short-term | | $ | 66,389 | |
| Long-term | | | 141,465 | |
| | | Notes to |
| | | Financial Statements (Unaudited) (continued) |
The Funds have elected to defer net realized losses from investments incurred from November 1, 2011 through September 30, 2012, the Funds’ last tax year end, in accordance with federal income tax rules. These losses are treated as having arisen on the first day of the current fiscal year. The following Fund has elected to defer losses as follows:
| | | | |
| | | New York | |
| | | Value 2 | |
| | | (NYV | ) |
| Post-October capital losses | | $ | 395,527 | |
| Late-year ordinary losses | | | — | |
7. Management Fees and Other Transactions with Affiliates
Each Fund’s management fee consists of two components — a fund-level fee, based only on the amount of assets within the Fund, and a complex-level fee, based on the aggregate amount of all eligible fund assets managed by the Adviser and for New York Value (NNY) a gross interest income component. This pricing structure enables Fund shareholders to benefit from growth in the assets within their respective Fund as well as from growth in the amount of complex-wide assets managed by the Adviser.
New York Value (NNY) pays an annual fund-level fee, payable monthly, of .15% of the average daily net assets* of the Fund, as well as 4.125% of the gross interest income (excluding interest on bonds underlying a “self-deposited inverse floater” trust that is attributed to the Fund over and above the net interest earned on the inverse floater itself) of the Fund.
The annual fund-level fee for the following Funds, payable monthly, is calculated according to the following schedules:
| | | | | |
| | | | New York Performance Plus (NNP | ) |
| Average Daily Managed Assets* | | | Fund-Level Fee Rate | |
| For the first $125 million | | | .4500 | % |
| For the next $125 million | | | .4375 | |
| For the next $250 million | | | .4250 | |
| For the next $500 million | | | .4125 | |
| For the next $1 billion | | | .4000 | |
| For the next $3 billion | | | .3875 | |
| For managed assets over $5 billion | | | .3750 | |
| | | | New York Value 2 (NYV | ) |
| Average Daily Managed Assets* | | | Fund-Level Fee Rate | |
| For the first $125 million | | | .4000 | % |
| For the next $125 million | | | .3875 | |
| For the next $250 million | | | .3750 | |
| For the next $500 million | | | .3625 | |
| For the next $1 billion | | | .3500 | |
| For managed assets over $2 billion | | | .3375 | |
| | | | New York Dividend Advantage (NAN | ) |
| | | | New York Dividend Advantage 2 (NXK | ) |
| | | | New York AMT-Free Income (NRK | ) |
| Average Daily Managed Assets* | | | Fund-Level Fee Rate | |
| For the first $125 million | | | .4500 | % |
| For the next $125 million | | | .4375 | |
| For the next $250 million | | | .4250 | |
| For the next $500 million | | | .4125 | |
| For the next $1 billion | | | .4000 | |
| For managed assets over $2 billion | | | .3750 | |
The annual complex-level fee for each fund, payable monthly, is calculated according to the following schedule:
| Complex-Level Managed Asset Breakpoint Level* | Effective Rate at Breakpoint Level |
| $55 billion | .2000 | % |
| $56 billion | .1996 | |
| $57 billion | .1989 | |
| $60 billion | .1961 | |
| $63 billion | .1931 | |
| $66 billion | .1900 | |
| $71 billion | .1851 | |
| $76 billion | .1806 | |
| $80 billion | .1773 | |
| $91 billion | .1691 | |
| $125 billion | .1599 | |
| $200 billion | .1505 | |
| $250 billion | .1469 | |
| $300 billion | .1445 | |
| * | For the fund-level and complex-level fees, managed assets include closed-end fund assets managed by the Adviser that are attributable to financial leverage. For these purposes, financial leverage includes the funds’ use of preferred stock and borrowings and certain investments in the residual interest certificates (also called inverse floating rate securities) in tender option bond (TOB) trusts, including the portion of assets held by a TOB trust that has been effectively financed by the trust’s issuance of floating rate securities, subject to an agreement by the Adviser as to certain funds to limit the amount of such assets for determining managed assets in certain circumstances. The complex-level fee is calculated based upon the aggregate daily managed assets of all Nuveen Funds that constitute “eligible assets.” Eligible assets do not include assets attributable to investments in other Nuveen Funds or assets in excess of $2 billion added to the Nuveen Fund complex in connection with the Adviser’s assumption of the management of the former First American Funds effective January 1, 2011. As of March 31, 2013, the complex-level fee rate for each of these Funds was .1668%. |
The management fee compensates the Adviser for overall investment advisory and administrative services and general office facilities. The Adviser is responsible for each Fund’s overall strategy and asset allocation decisions. The Adviser has entered into sub-advisory agreements with Nuveen Asset Management, LLC (the “Sub-Adviser”), a wholly-owned subsidiary of the Adviser, under which the Sub-Adviser manages the investment portfolios of the Funds. The Sub-Adviser is compensated for its services to the Funds from the management fees paid to the Adviser.
The Funds pay no compensation directly to those of its directors/trustees who are affiliated with the Adviser or to its officers, all of whom receive remuneration for their services to the Funds from the Adviser or its affiliates. The Board of Directors/Trustees has adopted a deferred compensation plan for independent directors/trustees that enables directors/trustees to elect to defer receipt of all or a portion of the annual compensation they are entitled to receive from certain Nuveen-advised funds. Under the plan, deferred amounts are treated as though equal dollar amounts had been invested in shares of select Nuveen-advised funds.
8. Fund Reorganizations
The Reorganizations were structured to qualify as tax-free reorganizations under the Internal Revenue Code for federal income tax purposes, and the Acquired Funds’ shareholders will recognize no gain or loss for federal income tax purposes as a result of the Reorganizations. Prior to the closing of each of the Reorganizations, the Acquired Funds distributed all of their net investment income and capital gains, if any. Such a distribution may be taxable to the Acquired Funds’ shareholders for federal income tax purposes.
The cost, fair value and net unrealized appreciation (depreciation) of the investments of the Acquired Funds as of the date of their respective Reorganization, were as follows:
| | | | | | | | | | | | | | | New York | |
| | | New York | | | New York | | | New York | | | New York | | | Dividend | |
| | | Investment | | | Select | | | Quality | | | Premium | | | Advantage | |
| | | Quality | | | Quality | | | Income | | | Income | | | Income | |
| | | (NQN | ) | | (NVN | ) | | (NUN | ) | | (NNF | ) | | (NKO | ) |
| Cost of investments | | $ | 348,182,862 | | | $ | 476,216,543 | | | $ | 478,297,401 | | | $ | 163,394,915 | | | $ | 155,567,322 | |
| Fair value of investments | | | 376,348,298 | | | | 521,396,683 | | | | 519,126,736 | | | | 176,673,173 | | | | 167,003,737 | |
| Net unrealized appreciation (depreciation) of investments | | | 28,165,436 | | | | 45,180,140 | | | | 40,829,335 | | | | 13,278,258 | | | | 11,436,415 | |
For financial reporting purposes, assets received and shares issued by the Acquiring Fund were recorded at fair value; however, the cost basis of the investments received from the Acquired Funds were carried forward to align ongoing reporting of the Acquiring Fund’s realized and unrealized gains and losses with amounts distributable to shareholders for tax purposes.
| | | Notes to |
| | | Financial Statements (Unaudited) (continued) |
For accounting and performance reporting purposes, the Acquiring Fund is the survivor. The shares outstanding, net assets and net asset value (“NAV”) per Common share immediately before and after the Reorganizations are as follows:
| | | | | | | | | | | | | | | New York | |
| | | New York | | | New York | | | New York | | | New York | | | Dividend | |
| | | Investment | | | Select | | | Quality | | | Premium | | | Advantage | |
| | | Quality | | | Quality | | | Income | | | Income | | | Income | |
| Acquired Funds – Prior to Reorganizations | | (NQN | ) | | (NVN | ) | | (NUN | ) | | (NNF | ) | | (NKO | ) |
| Common shares outstanding | | | 17,542,953 | | | | 23,230,215 | | | | 23,782,336 | | | | 8,264,230 | | | | 7,937,601 | |
| Net assets applicable to Common shares | | $ | 271,545,473 | | | $ | 366,948,175 | | | $ | 367,935,364 | | | $ | 129,402,295 | | | $ | 122,538,253 | |
| NAV per Common share outstanding | | $ | 15.48 | | | $ | 15.80 | | | $ | 15.47 | | | $ | 15.66 | | | $ | 15.44 | |
| | | | | | | | | | | | | | | | | | | New York | |
| | | | | | | | | | | | | | | | | | | AMT-Free | |
| | | | | | | | | | | | | | | | | | | Income | |
| Acquiring Fund – Prior to Reorganizations | | | | | | | | | | | | | | | | | | (NRK | ) |
| Common shares outstanding | | | | | | | | | | | | | | | | | | | 3,507,247 | |
| Net assets applicable to Common shares | | | | | | | | | | | | | | | | | | $ | 52,471,137 | |
| NAV per Common share outstanding | | | | | | | | | | | | | | | | | | $ | 14.96 | |
| | | | | | | | | | | | | | | | | | | New York | |
| | | | | | | | | | | | | | | | | | | AMT-Free | |
| | | | | | | | | | | | | | | | | | | Income | |
| Acquiring Fund – Post Reorganizations | | | | | | | | | | | | | | | | | | (NRK | ) |
| Common shares outstanding | | | | | | | | | | | | | | | | | | | 87,618,504 | |
| Net assets applicable to Common shares | | | | | | | | | | | | | | | | | | $ | 1,310,840,698 | |
| NAV per Common share outstanding | | | | | | | | | | | | | | | | | | $ | 14.96 | |
The beginning of the Acquired Funds’ current fiscal period was October 1, 2012.
Assuming the Reorganizations had been completed on October 1, 2012, the beginning of the Acquiring Funds’ current fiscal period, the pro forma results of operations for the six months ended March 31, 2013, are as follows:
| | | New York | |
| | | AMT-Free | |
| | | Income | |
| | | (NRK | ) |
| Net investment income (loss) | | $ | 31,162,232 | |
| Net realized and unrealized gains (losses) | | | (12,216,339 | ) |
| Change in net assets resulting from operations | | | 18,945,893 | |
Because the combined investment portfolios for each Reorganization have been managed as a single integrated portfolio since each Reorganization was completed, it is not practicable to separate the amounts of revenue and earnings of the Acquired Funds that have been included in the Statement of Operations since the Reorganizations were consummated.
In connection with the Reorganizations, the Acquiring Fund has accrued for certain associated costs and expenses. Such amounts are included as components of “Accrued Reorganization expenses” on the Statement of Assets and Liabilities and “Reorganization expenses” on the Statement of Operations.
9. New Accounting Pronouncements
Financial Accounting Standards Board (“FASB”) Balance Sheet (Topic 210): Disclosures about Offsetting Assets and Liabilities
In January 2013, Accounting Standards Update (“ASU”) 2013-01, Clarifying the Scope of Disclosures about Offsetting Assets and Liabilities, replaced ASU 2011-11, Disclosures about Offsetting Assets and Liabilities. ASU 2013-01 is effective for fiscal years beginning on or after January 1, 2013. ASU 2011-11 was intended to enhance disclosure requirements on the offsetting of financial assets and liabilities. ASU 2013-01 limits the scope of the new balance sheet offsetting disclosures to derivatives, repurchase agreements and securities lending transactions to the extent that they are (1) offset in the financial statements or (2) subject to an enforceable master netting arrangement or similar agreement. Management is currently evaluating the application of ASU 2013-01 and its impact to the financial statements and footnote disclosures, if any.
Reinvest Automatically,
Easily and Conveniently
Nuveen makes reinvesting easy. A phone call is all it takes to set up your reinvestment account.
Nuveen Closed-End Funds Automatic Reinvestment Plan
Your Nuveen Closed-End Fund allows you to conveniently reinvest distributions in additional Fund shares.
By choosing to reinvest, you’ll be able to invest money regularly and automatically, and watch your investment grow through the power of compounding. Just like distributions in cash, there may be times when income or capital gains taxes may be payable on distributions that are reinvested.
It is important to note that an automatic reinvestment plan does not ensure a profit, nor does it protect you against loss in a declining market.
Easy and convenient
To make recordkeeping easy and convenient, each month you’ll receive a statement showing your total distributions, the date of investment, the shares acquired and the price per share, and the total number of shares you own.
How shares are purchased
The shares you acquire by reinvesting will either be purchased on the open market or newly issued by the Fund. If the shares are trading at or above net asset value at the time of valuation, the Fund will issue new shares at the greater of the net asset value or 95% of the then-current market price. If the shares are trading at less than net asset value, shares for your account will be purchased on the open market. If the Plan Agent begins purchasing Fund shares on the open market while shares are trading below net asset value, but the Fund’s shares subsequently trade at or above their net asset value before the Plan Agent is able to complete its purchases, the Plan Agent may cease open-market purchases and may invest the uninvested portion of the distribution in newly-issued Fund shares at a price equal to the greater of the shares’ net asset value or 95% of the shares’ market value on the last business day immediately prior to the purchase date. Distributions received to purchase shares in the open market will normally be invested shortly after the distribution payment date. No interest will be paid on distributions awaiting reinvestment. Because the market price of the shares may increase before purchases are completed, the average purchase price per share may
| Reinvest Automatically, |
Easily and Conveniently (continued) |
exceed the market price at the time of valuation, resulting in the acquisition of fewer shares than if the distribution had been paid in shares issued by the Fund. A pro rata portion of any applicable brokerage commissions on open market purchases will be paid by Plan participants. These commissions usually will be lower than those charged on individual transactions.
Flexible
You may change your distribution option or withdraw from the Plan at any time, should your needs or situation change.
You can reinvest whether your shares are registered in your name, or in the name of a brokerage firm, bank, or other nominee. Ask your investment advisor if his or her firm will participate on your behalf. Participants whose shares are registered in the name of one firm may not be able to transfer the shares to another firm and continue to participate in the Plan.
The Fund reserves the right to amend or terminate the Plan at any time. Although the Fund reserves the right to amend the Plan to include a service charge payable by the participants, there is no direct service charge to participants in the Plan at this time.
Call today to start reinvesting distributions
For more information on the Nuveen Automatic Reinvestment Plan or to enroll in or withdraw from the Plan, speak with your financial advisor or call us at (800) 257-8787.
Glossary of Terms
Used in this Report
| ■ | Auction Rate Bond: An auction rate bond is a security whose interest payments are adjusted periodically through an auction process, which process typically also serves as a means for buying and selling the bond. Auctions that fail to attract enough buyers for all the shares offered for sale are deemed to have “failed,” with current holders receiving a formula-based interest rate until the next scheduled auction. |
| | |
| ■ | Average Annual Total Return: This is a commonly used method to express an investment’s performance over a particular, usually multi-year time period. It expresses the return that would have been necessary each year to equal the investment’s actual cumulative performance (including change in NAV or market price and reinvested dividends and capital gains distributions, if any) over the time period being considered. |
| | |
| ■ | Duration: Duration is a measure of the expected period over which a bond’s principal and interest will be paid, and consequently is a measure of the sensitivity of a bond’s or bond Fund’s value to changes when market interest rates change. Generally, the longer a bond’s or Fund’s duration, the more the price of the bond or Fund will change as interest rates change. |
| | |
| ■ | Effective Leverage: Effective leverage is a Fund’s effective economic leverage, and includes both regulatory leverage (see leverage) and the leverage effects of certain derivative investments in the Fund’s portfolio. Currently, the leverage effects of Tender Option Bond (TOB) inverse floater holdings are included in effective leverage values, in addition to any regulatory leverage. |
| | |
| ■ | Forward Interest Rate Swap: A contractual agreement between two counterparties under which one party agrees to make periodic payments to the other for an agreed period of time based on a fixed rate, while the other party agrees to make periodic payments based on a floating rate of interest based on an underlying index. Alternatively, both series of cash flows to be exchanged could be calculated using floating rates of interest but floating rates that are based upon different underlying indexes. |
| | |
| ■ | Gross Domestic Product (GDP): The total market value of all final goods and services produced in a country/region in a given year, equal to total consumer, investment and government spending, plus the value of exports, minus the value of imports. |
| | |
| ■ | Inverse Floating Rate Securities: Inverse floating rate securities, also known as inverse floaters or tender option bonds (TOBs), are created by depositing a municipal bond, typically with a fixed interest rate, into a special purpose trust created by a broker-dealer. This trust, in turn, (a) issues floating rate certificates typically paying short-term tax-exempt interest rates to third parties in amounts equal to some fraction of the deposited bond’s par amount or market value, and (b) issues an inverse floating rate certificate (sometimes referred to as an “inverse floater”) to an investor |
Glossary of Terms
Used in this Report (continued)
| | (such as a Fund) interested in gaining investment exposure to a long-term municipal bond. The income received by the holder of the inverse floater varies inversely with the short-term rate paid to the floating rate certificates’ holders, and in most circumstances the holder of the inverse floater bears substantially all of the underlying bond’s downside investment risk. The holder of the inverse floater typically also benefits disproportionately from any potential appreciation of the underlying bond’s value. Hence, an inverse floater essentially represents an investment in the underlying bond on a leveraged basis. |
| | |
| ■ | Leverage: Using borrowed money to invest in securities or other assets, seeking to increase the return of an investment or portfolio. |
| | |
| ■ | Lipper New York Municipal Debt Funds Classification Average: Calculated using the returns of all closed-end funds in this category. Lipper returns account for the effects of management fees and assume reinvestment of distributions, but do not reflect any applicable sales charges. |
| | |
| ■ | Net Asset Value (NAV): The net market value of all securities held in a portfolio. |
| | |
| ■ | Net Asset Value (NAV) Per Share: The market value of one share of a mutual fund or closed-end fund. For a Fund, the NAV is calculated daily by taking the Fund’s total assets (securities, cash, and accrued earnings), subtracting the Fund’s liabilities, and dividing by the number of shares outstanding. |
| | |
| ■ | Pre-Refunding: Pre-Refunding, also known as advanced refundings or refinancings, is a procedure used by state and local governments to refinance municipal bonds to lower interest expenses. The issuer sells new bonds with a lower yield and uses the proceeds to buy U.S. Treasury securities, the interest from which is used to make payments on the higher-yielding bonds. Because of this collateral, pre-refunding generally raises a bond’s credit rating and thus its value. |
| | |
| ■ | Regulatory Leverage: Regulatory Leverage consists of preferred shares issued by or borrowings of a Fund. Both of these are part of a Fund’s capital structure. Regulatory leverage is sometimes referred to as “‘40 Act Leverage” and is subject to asset coverage limits set in the Investment Company Act of 1940. |
| | |
| ■ | S&P Municipal Bond Index: An unleveraged, market value-weighted index designed to measure the performance of the tax-exempt, investment grade U.S. municipal bond market. Index returns assume reinvestment of distributions but do not reflect any applicable sales charges or management fees. |
| | |
| ■ | S&P Municipal Bond New York Index: An unleveraged, market value-weighted index designed to measure the performance of the tax-exempt, investment grade New York municipal bond market. Index returns assume reinvestment of distributions but do not reflect any applicable sales charges or management fees. |
| ■ | Total Investment Exposure: Total investment exposure is a Fund’s assets managed by the Adviser that are attributable to financial leverage. For these purposes, financial leverage includes a Fund’s use of preferred stock and borrowings and investments in the residual interest certificates (also called inverse floating rate securities) in tender option bond (TOB) trusts, including the portion of assets held by a TOB trust that has been effectively financed by the trust’s issuance of floating rate securities. |
| | |
| ■ | Zero Coupon Bond: A zero coupon bond does not pay a regular interest coupon to its holders during the life of the bond. Tax-exempt income to the holder of the bond comes from accretion of the difference between the original purchase price of the bond at issuance and the par value of the bond at maturity and is effectively paid at maturity. The market prices of zero coupon bonds generally are more volatile than the market prices of bonds that pay interest periodically. |
Notes
Additional Fund Information
| Board of |
| Directors/Trustees |
| John P. Amboian |
| Robert P. Bremner |
| Jack B. Evans |
| William C. Hunter |
| David J. Kundert |
| William J. Schneider |
| Judith M. Stockdale |
| Carole E. Stone |
| Virginia L. Stringer |
| Terence J. Toth |
| |
| Fund Manager |
| Nuveen Fund Advisors, LLC |
| 333 West Wacker Drive |
| Chicago, IL 60606 |
| |
| Custodian |
| State Street Bank |
| & Trust Company |
| Boston, MA |
| |
| Transfer Agent and |
| Shareholder Services |
| State Street Bank |
| & Trust Company |
| Nuveen Funds |
| P.O. Box 43071 |
| Providence, RI 02940-3071 |
| (800) 257-8787 |
| |
| Legal Counsel |
| Chapman and Cutler LLP |
| Chicago, IL |
| |
| Independent Registered |
| Public Accounting Firm |
| Ernst & Young LLP |
| Chicago, IL |
Quarterly Form N-Q Portfolio of Investments Information
Each Fund is required to file its complete schedule of portfolio holdings with the Securities and Exchange Commission (SEC) for the first and third quarters of each fiscal year on Form N-Q. You may obtain this information directly from the SEC. Visit the SEC on-line at http://www.sec.gov or in person at the SEC’s Public Reference Room in Washington, D.C. Call the SEC toll-free at (800) SEC -0330 for room hours and operation.
Nuveen Funds’ Proxy Voting Information
You may obtain (i) information regarding how each Fund voted proxies relating to portfolio securities held during the most recent twelve-month period ended June 30, and (ii) a description of the policies and procedures that each Fund used to determine how to vote proxies relating to portfolio securities without charge, upon request, by calling Nuveen Investments toll-free at (800) 257-8787 or on Nuveen’s website at www.nuveen.com. You may also obtain this information directly from the SEC. Visit the SEC on-line at http://www.sec.gov.
CEO Certification Disclosure
Each Fund’s Chief Executive Officer (CEO) has submitted to the New York Stock Exchange (NYSE) the annual CEO certification as required by Section 303A.12(a) of the NYSE Listed Company Manual.
Each Fund has filed with the SEC the certification of its Chief Executive Officer and Chief Financial Officer required by Section 302 of the Sarbanes-Oxley Act.
Common Share Information
Each Fund intends to repurchase shares of its own common stock at such times and in such amounts as is deemed advisable. During the period covered by this report, the Funds repurchased shares of their common stock as shown in the accompanying table.
| | |
| | Common Shares |
| Fund | Repurchased |
| NNY | — |
| NYV | — |
| NNP | — |
| NAN | — |
| NXK | — |
| NRK | — |
Any future repurchases will be reported to shareholders in the next annual or semi-annual report.
Nuveen Investments:
Serving Investors for Generations
Since 1898, financial advisors and their clients have relied on Nuveen Investments to provide dependable investment solutions through continued adherence to proven, long-term investing principles. Today, we offer a range of high quality equity and fixed-income solutions designed to be integral components of a well-diversified core portfolio.
Focused on meeting investor needs.
Nuveen Investments provides high-quality investment services designed to help secure the long-term goals of institutional and individual investors as well as the consultants and financial advisors who serve them. Nuveen Investments markets a wide range of specialized investment solutions which provide investors access to capabilities of its high-quality boutique investment affiliates—Nuveen Asset Management, Symphony Asset Management, NWQ Investment Management Company, Santa Barbara Asset Management, Tradewinds Global Investors, Winslow Capital Management and Gresham Investment Management. In total, Nuveen Investments managed $224 billion as of March 31, 2013.
Find out how we can help you.
To learn more about how the products and services of Nuveen Investments may be able to help you meet your financial goals, talk to your financial advisor, or call us at (800) 257-8787. Please read the information provided carefully before you invest. Investors should consider the investment objective and policies, risk considerations, charges and expenses of any investment carefully. Where applicable, be sure to obtain a prospectus, which contains this and other relevant information. To obtain a prospectus, please contact your securities representative or Nuveen Investments, 333 W. Wacker Dr., Chicago, IL 60606. Please read the prospectus carefully before you invest or send money.
Learn more about Nuveen Funds at: www.nuveen.com/cef
Distributed by
Nuveen Securities, LLC
333 West Wacker Drive
Chicago, IL 60606
www.nuveen.com/cef
ESA-A-0313D
ITEM 2. CODE OF ETHICS.
Not applicable to this filing.
ITEM 3. AUDIT COMMITTEE FINANCIAL EXPERT.
Not applicable to this filing.
ITEM 4. PRINCIPAL ACCOUNTANT FEES AND SERVICES.
Not applicable to this filing.
ITEM 5. AUDIT COMMITTEE OF LISTED REGISTRANTS.
Not applicable to this filing.
ITEM 6. SCHEDULE OF INVESTMENTS.
(a) See Portfolio of Investments in Item 1.
(b) Not applicable.
ITEM 7. DISCLOSURE OF PROXY VOTING POLICIES AND PROCEDURES FOR CLOSED-END MANAGEMENT INVESTMENT COMPANIES.
Not applicable to this filing.
ITEM 8. PORTFOLIO MANAGERS OF CLOSED-END MANAGEMENT INVESTMENT COMPANIES.
Not applicable to this filing.
ITEM 9. PURCHASES OF EQUITY SECURITIES BY CLOSED-END MANAGEMENT INVESTMENT COMPANY AND AFFILIATED PURCHASERS.
Not applicable.
ITEM 10. SUBMISSION OF MATTERS TO A VOTE OF SECURITY HOLDERS.
There have been no material changes to the procedures by which shareholders may recommend nominees to the registrant's Board implemented after the registrant last provided disclosure in response to this Item.
ITEM 11. CONTROLS AND PROCEDURES.
ITEM 12. EXHIBITS.
File the exhibits listed below as part of this Form.
Pursuant to the requirements of the Securities Exchange Act of 1934 and the Investment Company Act of 1940, the registrant has duly caused this report to be signed on its behalf by the undersigned, thereunto duly authorized.
Kevin J. McCarthy
Pursuant to the requirements of the Securities Exchange Act of 1934 and the Investment Company Act of 1940, this report has been signed below by the following persons on behalf of the registrant and in the capacities and on the dates indicated.
Gifford R. Zimmerman
Stephen D. Foy