First Quarter Fiscal Year 2013 
Prepared Remarks May 2, 2013
Jonathan Bush, President, Chairman & Chief Executive Officer
Tim Adams, Senior Vice President & Chief Financial Officer
About These Remarks
The following commentary is provided by management in conjunction with the first quarter fiscal year 2013 earnings press release issued by athenahealth, Inc. (the “Company,” “we,” or “athenahealth”). These remarks represent management’s current views on the Company’s financial and operational performance and are provided to give investors and analysts more time to analyze and understand our performance in advance of the earnings conference call. These prepared remarks will not be read on the conference call. A complete reconciliation between GAAP and non-GAAP results, as well as a summary of supplemental metrics and definitions, is provided in the tables following these prepared remarks.
Earnings Conference Call Information
To participate in the Company’s live conference call and webcast, please dial 800-447-0521 (or 847-413-3238 for international calls) using conference code No. 34414714, or visit the Investors section of the Company’s web site at www.athenahealth.com. A replay will be available for one week following the conference call at 888-843-7419 (and 630-652-3042 for international calls) using conference code No. 34414714. A webcast replay will also be archived on the Company’s website.
Safe Harbor and Forward-Looking Statements
These remarks contain forward-looking statements, which are made pursuant to the safe harbor provisions of the Private Securities Litigation Reform Act of 1995, including statements reflecting management’s expectations for future financial and operational performance and operational expenditures, expected growth, and business outlook; statements regarding the Company’s research and development efforts and product offering and upgrade plans and timelines; the benefits of and anticipated operational results from the Company’s service offerings; the further integration of the Company’s services and the resulting benefits; changes in the types of providers and health care entities the Company serves and the range of tasks the Company performs for clients; the Company’s sales and marketing activities and plans; the transaction with Epocrates; customer and client behavior and preferences; the Company's market position and awareness among physicians; the potential for cross-sales among service offerings and sales involving multiple services; the Company’s implementation pipeline; the expansion of the number of users of the Company’s care coordination and credentialing services; the benefits of and plans for Healthcare Data Services LLC; the Company’s plans in regard to Stage 2 of Meaningful Use; changes in the industry, including an increased emphasis on coordinated care; the creation of a sustainable market for health information exchange, a social network for health care, an ecosystem of developers and third-party service providers, and a national health IT network; statements regarding the consummation and timing of the financing and property transactions; and statements found under the Company’s “Reconciliation of Non-GAAP Financial Measures to Comparable GAAP Measures” section of these remarks. The forward-looking statements in these remarks do not constitute guarantees of future performance. These statements are neither promises nor guarantees, and are subject to a variety of risks and uncertainties, many of which are beyond the Company’s control, which could cause actual results to differ materially from those contemplated in these forward-looking statements. In particular, the risks and uncertainties include, among other things: the Company’s fluctuating operating results; the Company’s variable sales and implementation cycles, which may result in fluctuations in its quarterly results; risks associated with the acquisition and integration of companies and new technologies, including those related to the Company’s ability to successfully integrate the athenaCoordinator® service and successfully scale the Healthcare Data Services services and technologies to achieve expected synergies, those related to the Company's ability to integrate the services and offerings of Epocrates and realize the expected benefits; risks associated with the expected performance of athenaClaritySM; risks associated with its expectations regarding its ability to maintain profitability; the impact of increased sales and marketing expenditures, including whether increased expansion in revenues is attained and
whether impact on margins and profitability is longer term than expected; changes in tax rates or exposure to additional tax liabilities; the highly competitive industry in which the Company operates and the relative immaturity of the market for its service offerings; and the evolving and complex governmental and regulatory compliance environment in which the Company and its clients operate. Existing and prospective investors are cautioned not to place undue reliance on these forward-looking statements, which speak only as of the date hereof. The Company undertakes no obligation to update or revise the information contained in these remarks, whether as a result of new information, future events or circumstances, or otherwise. For additional disclosure regarding these and other risks faced by the Company, see the disclosures contained in its public filings with the Securities and Exchange Commission, available on the Investors section of the Company’s website at http://www.athenahealth.com and on the SEC’s website at http://www.sec.gov.
Use of Non-GAAP Financial Measures
These remarks contain non-GAAP financial measures, as defined by SEC Regulation G. The GAAP financial measure most directly comparable to each non-GAAP financial measure used or discussed, and a reconciliation of the differences between each non-GAAP financial measure and the comparable GAAP financial measure, are included following these prepared remarks or can be found within the Company’s first quarter fiscal year 2013 earnings press release on the Investors section of the Company’s web site at http://www.athenahealth.com.
Opening Remarks
The athenahealth team has enjoyed a tremendous start to 2013. We completed the largest acquisition in our company’s history, launched our fifth service offering, athenaClarity, and introduced a code of conduct aimed to rally other Health Information Technology (HIT) vendors to join us in transforming the health care industry. We reached a significant milestone this quarter with the acquisition of Epocrates, Inc., a mobile health pioneer recognized for developing the most widely adopted point-of-care medical application among U.S. physicians. With Epocrates, we are positioned to completely redefine the mobile toolset for care givers and realize our vision to build the nation's health information backbone. As part of our efforts to become a health information backbone, we continue to expand our suite of cloud-based services to provide a comprehensive solution for any health system. athenahealth launched our newest cloud-based service offering, athenaClarity, at the 2013 Health Information and Management Systems Society (HIMSS) conference in New Orleans. Born from the union of our Anodyne and Healthcare Data Services acquisitions, athenaClarity represents a natural extension of the services we deliver by helping providers thrive under any payment model. With the addition of athenaClarity, our services are coalescing around our Practice Solutions, athenaCollector®, athenaClinicals® and athenaCommunicator®, and our Network Solutions, athenaCoordinator and athenaClarity. athenahealth’s full suite of services and control structure help to both create and support high-performance medical groups. High-performance medical groups are the key to success in this ever-changing industry, whether the medical group is independent or part of a larger health system. We continue to believe and to demonstrate that “the cloud” is the only future-proof HIT platform for health care. athenahealth aims to deliver services that are future-proof and that help transform the health care industry. We know we can’t do this alone and look to other HIT vendors to join us in promoting ongoing disruption and improvement. To this end, athenahealth recently proposed a HIT ‘Code of Conduct’ that calls upon the health information industry to abide by five guiding principles to move the industry forward. We are asking the HIT vendors to join us in our quest to bring the industry into the 21st century by adhering to these five principles: 1) empower data portability and provider choice, 2) build a true nationwide information backbone, 3) protect patients, 4) prevent fraud, and 5) drive Meaningful Use. While we are still early in our quest, we keep moving closer toward our vision of a national information backbone that helps make health care work as it should.
Results Overview
athenahealth’s top line results for the first quarter of fiscal year (FY) 2013 reflect solid revenue growth:
| |
| ◦ | $125.6 million in Q1 2013, representing 30% growth over $96.6 million in Q1 2012 |
| |
| ◦ | Core athenahealth revenue was $120.1 million in Q1 2013, representing 24% growth |
| |
| ◦ | Epocrates revenue from the acquisition date of March 12, 2013, to the period ended March 31, 2013 was $5.5 million |
Our bottom line results for Q1 2013, consistent with our growth strategy, demonstrate strong sales, marketing, and research and development investments, and a focus on operating leverage:
| |
| • | Non-GAAP Adjusted Gross Profit: |
| |
| ◦ | $75.9 million, or 60.4% of total revenue, in Q1 2013, an increase of 28% over $59.4 million, or 61.5% of total revenue, in Q1 2012
|
| |
| • | GAAP selling and marketing expense: |
| |
| ◦ | $32.9 million, or 26.2% of total revenue, in Q1 2013, an increase of 39% over $23.7 million, or 24.6% of total revenue, in Q1 2012
|
| |
| • | GAAP research and development expense: |
| |
| ◦ | $11.9 million, or 9.5% of total revenue, in Q1 2013, an increase of 67% over $7.2 million, or 7.4% of total revenue, in Q1 2012
|
| |
| • | GAAP general and administrative expense: |
| |
| ◦ | $31.1 million, or 24.7% of total revenue, in Q1 2013, versus $16.2 million, or 16.8% of total revenue, in Q1 2012
|
| |
| • | Non-GAAP Adjusted EBITDA: |
| |
| ◦ | $17.6 million, or 14.0% of total revenue, in Q1 2013, an increase of 3% from $17.1 million, or 17.7% of total revenue, in Q1 2012
|
| |
| • | Non-GAAP Adjusted Operating Income: |
| |
| ◦ | $9.4 million, or 7.5% of total revenue, in Q1 2013, a decrease of 19% from $11.6 million, or 12.0% of total revenue, in Q1 2012 |
| |
| ◦ | Core athenahealth non-GAAP adjusted operating income was $9.1 million in Q1 2013 |
| |
| ◦ | Epocrates non-GAAP adjusted operating income from the acquisition date of March 12, 2013 to the period ended March 31, 2013 was $0.3 million
|
| |
| • | Non-GAAP Adjusted Net Income: |
| |
| ◦ | $14.2 million, or $0.38 per diluted share, in Q1 2013, an increase of 127% from $6.3 million, or $0.17 per diluted share, in Q1 2012
|
| |
| ◦ | Non-GAAP Adjusted Net Income excludes $5.7 million of integration and transaction costs relating to the acquisition of Epocrates, Inc. which closed on March 12, 2013, and the pending purchase of the Arsenal on the Charles campus in Watertown, Massachusetts |
We measure our performance based on a balanced scorecard model. We believe that this framework is an excellent report card for our performance for the current year and that it measures the key performance indicators required for long-term success. The table below shows the scorecard results for Q1 2013. For certain metrics (i.e., Client DAR, Provider Documentation Time, and Days of Client Work), our goal is to
improve our performance by effectively reducing the scorecard metrics results throughout the year. Please note that all financial and operational metrics results exclude Epocrates.
|
| | |
| | Q1 2013
Results |
| |
| | |
| Stability (15% weight) | |
| Headcount - Role Vacancy | 4.11 | % |
| Corporate Citizenship | 89.0 | % |
| Employee Engagement | 4.0 |
|
| Stability Results | 86 | % |
| | |
| Performance (25% weight) | |
| Client Days in Accounts Receivable (DAR) | 37.6 |
|
| Total Automation Rate | 61.7 | % |
| Client Collection Rate | 96.3 | % |
| Performance Results | 96 | % |
| | |
| Satisfaction (25% weight) | |
| Provider Documentation Time | 5.1 |
|
| Days of Client Work | 7.1 |
|
| Client Satisfaction | 88.2 | % |
| athenaClinicals Penetration | 29.7 | % |
| Satisfaction Results | 102 | % |
| | |
| Financial (35% weight) | |
| Bookings (a) | (a) |
| Total Revenue | $120.1M |
|
| Non-GAAP Adjusted Operating Income | $9.1M |
|
| Financial Results | 91 | % |
| | |
| Total Results | 94 | % |
| |
| (a) | Since the bookings metric contains highly sensitive data, we do not disclose all of the specific performance measures and targets, because we believe that such disclosure would result in serious competitive harm. |
We believe that the Company’s underlying drivers of long-term success remain strong as supported by the following metric results:
| |
| • | Employee Engagement at 4.0 out of 5.0 in Q1 2013, versus goal of 4.1 and Q1 2012 actual result of 4.1
|
| |
| • | Average Client Days in Accounts Receivable (DAR) of 37.6 days in Q1 2013, versus goal of 38.0 days and Q1 2012 actual result of 40.0
|
| |
| • | Total Automation Rate of 61.7% in Q1 2013, shy of our goal of 68.7%
|
| |
| • | Client Collection Rate of 96.3% in Q1 2013, in line with our goal of 96.0%
|
| |
| • | Provider Documentation Time per Appointment of 5.1 minutes in Q1 2013, versus goal of 5.0 minutes and Q1 2012 actual result of 5.4
|
| |
| • | Days of Client Work of 7.1 days in Q1 2013, in line with our goal of 7.1 days |
| |
| • | Client Satisfaction of 88.2% in Q1 2013, versus goal of 85.0% and Q1 2012 actual result of 86.3%
|
| |
| • | athenaClinicals penetration of 29.7% in Q1 2013, in line with our goal of 30.1%
|
athenahealth’s client base continues to expand while client adoption of other services in the athenahealth service suite grows. As our client base expands outside the traditional ambulatory market, we believe that total active providers or nodes on our network will become a more appropriate metric to use in measuring our market share. During Q1 2013:
| |
| • | 79% of all new athenaCollector deals included athenaClinicals, compared to 80% in Q1 2012
|
| |
| • | 69% of all new athenaCollector deals included athenaClinicals and athenaCommunicator. Additionally, 69% of all new athenaOneSM deals sold during Q1 2013 also included athenaCoordinator Core. This compares to 62% of all new athenaCollector deals included athenaClinicals and athenaCommunicator in Q1 2012
|
| |
| • | Net new physicians and providers added sequentially to the network were as follows: |
|
| | | | | | | | | | | | | | |
| | athenaCollector | | athenaClinicals | | athenaCommunicator |
| Active physicians and providers: | Physicians | Providers | | Physicians | Providers | | Physicians | Providers |
| Beginning balance as of 12/31/12 | 28,011 |
| 39,752 |
| | 7,949 |
| 10,926 |
| | 10,153 |
| 14,065 |
|
| Net new additions | 839 |
| 1,185 |
| | 827 |
| 1,213 |
| | 1,687 |
| 2,231 |
|
| Ending balance as of 3/31/13 | 28,850 |
| 40,937 |
| | 8,776 |
| 12,139 |
| | 11,840 |
| 16,296 |
|
| Sequential growth % | 3 | % | 3 | % | | 10 | % | 11 | % | | 17 | % | 16 | % |
| |
| • | Net new physicians and providers added to the network since Q1 2012 were as follows: |
|
| | | | | | | | | | | | | | |
| | athenaCollector | | athenaClinicals | | athenaCommunicator |
| Active physicians and providers: | Physicians | Providers | | Physicians | Providers | | Physicians | Providers |
| Beginning balance as of 3/31/12 | 24,101 |
| 33,923 |
| | 5,331 |
| 7,402 |
| | 4,820 |
| 6,800 |
|
| Net new additions | 4,749 |
| 7,014 |
| | 3,445 |
| 4,737 |
| | 7,020 |
| 9,496 |
|
| Ending balance as of 3/31/13 | 28,850 |
| 40,937 |
| | 8,776 |
| 12,139 |
| | 11,840 |
| 16,296 |
|
| Y/Y growth % | 20 | % | 21 | % | | 65 | % | 64 | % | | 146 | % | 140 | % |
athenaCollector network performance metrics were as follows for Q1 2013:
| |
| • | $2,566,960,419 posted in total client collections, up 23% from Q1 2012
|
| |
| • | 20,732,485 total claims submitted, up 16% from Q1 2012
|
| |
| • | 81.8% electronic remittance advice (ERA) rate, up 3.8 points from 78.0% at Q1 2012
|
| |
| • | 93.9% first pass resolution (FPR) rate, up 2.6 points from 91.3% at Q1 2012
|
Product Development Discussion
Product development at athenahealth is organized around the goal of being the best in the world at getting medical care givers paid for doing the right thing. In order to fulfill this goal, we deliver services backed by cloud-based software, proprietary knowledge, and robust back-office services.
athenaCollector Service Offering
athenaCollector is our cloud-based medical billing and practice management solution. It is the foundation of our service portfolio and entered general availability in 2000.
athenahealth continues to successfully shift the lines of comparative advantage by taking work away from our clients. Backed by our fifteen years of experience with managing the revenue cycle process, we continue to search for opportunities to expand the services we provide to our clients. By taking on more work, we free up our clients and allow them to focus on their patients and more revenue-generating activities. We have extended our revenue cycle management capabilities with the launch of our provider credentialing and contract management services. While contract management is still in the pilot phase, our provider credentialing service continues to grow at a steady pace with approximately 1,500 providers across 75 practices and 25 states enrolled to date. The value proposition of our provider credentialing service is clear and we are on track to penetrate 20% of our athenaCollector provider base by year-end. In addition to driving adoption of our expanded services, the athenaCollector team is also preparing for the next big change in health care compliance, the International Statistical Classification of Diseases and Related Health Problems, 10th Revision (ICD-10). We plan on unveiling our change management approach for the seamless ICD-10 transition later this year. Our differentiated cloud-based services model enables athenahealth to be uniquely positioned to best prepare medical care givers for the coming HIT armageddon in 2014 with the ICD-10 transition and the initiation of Meaningful Use (MU) Stage 2.
athenaClinicals Service Offering
athenaClinicals is our cloud-based electronic health record (EHR) management service. It entered general availability in 2006 and was made available as a stand-alone service in 2010.
Our cloud-based services model enables us to influence the behavior of care givers at the point of care. athenaClinicals has been engineered to measure and optimize the performance of a physician. The MU program has been the bellwether program for testing EHR vendors’ ability to drive performance at the point of care and to help medical care givers succeed in pay-for-performance programs. Our clients’ success with the Stage 1 2011 and 2012 MU programs is a testament to our differentiated cloud-based services model. As posted on our MU performance online dashboard, 96% of participating athenaClinicals providers have successfully attested for the 2012 Medicare MU Stage 1, Year 1 program. This MU attestation success builds on our 2011 Medicare MU Stage 1, Year 1 attestation rate of 85%. Furthermore, the strength of our deployment model and differentiated service approach drives sustainable MU success as proven by our 96% attestation success for the full year Stage 1, Year 2 program. MU attestation success will become even more critical for medical care givers as we shift from the incentive phase of the program to the penalty phase. For example, providers who began MU in 2011 or 2012 must attest this year to avoid a 1% fee schedule reduction in 2015. And the penalties will only increase each year after 2015 with a 2% fee schedule reduction in 2016 and a 3% fee schedule reduction in 2017. We remain so confident in our ability to help our clients successfully attest for MU that we have extended our MU guarantee to include both Stage 1 and Stage 2 attestation. This means that any provider looking to partner with athenahealth and attest to MU Stage 1 or Stage 2 in 2014 is eligible for the guarantee as long as they go-live by June 30, 2014. We are actively preparing for MU Stage 2 and anticipate getting athenaClinicals certified on the 2014 MU requirements by Q2 2013.
In addition to securing MU incentives for our clients, the athenaClinicals development team is focused on transforming the user experience on athenaNet®. Design is now a core competency of our team and we are in the midst of creating an EHR that is far more elegant and purposeful than any EHR that exists today. These efforts began with the expansion of our browser support to include mobile Safari® and desktop Safari® application programs for all athenaNet workflows in Q1 2013. We are also on track to support athenaNet on additional standard modern browsers, including the Google ChromeTM browser and Firefox® by Q2 2013. In addition to cross-browser support, we began our mobile efforts with the availability of the iPhone® mobile digital device application in 2012 and the release of the iPad® mobile
digital device application along with an updated iPhone mobile digital device application in April 2013. Adoption of our mobile application continues to grow rapidly with approximately 45% of our athenaClinicals users loyal today. All of these efforts laid the necessary groundwork to completely re-design the user experience on athenaClinicals and the team has now shifted focus to this grand initiative that we call athenaX. The athenaX project is our disruptive new take on the physician’s experience with an EHR. We are currently in alpha testing with physicians documenting complete patient visits in the new application and expect to move into beta testing with several specialties by the end of 2013. Our goal is to release the redesigned version of athenaClinicals in 2014.
athenahealth has emerged as the best ambulatory EHR vendor with Best in KLAS rankings, industry-leading MU attestation results, and a unique design approach focused on the user experience. We remain uniquely positioned to compete and win in both the greenfield and growing EHR replacement markets.
athenaCommunicator Service Offering
athenaCommunicator is our cloud-based patient communication management service. It entered general availability in 2010 and, at this time, requires adoption of athenaCollector or athenaClinicals.
The athenaCommunicator product team is focused on improving the patient experience and patient interactions outside of the physician’s office. The athenaCommunicator service offering reduces the administrative work required to manage patient relationships, improves self-pay collections, and increases schedule density. The demonstrated benefits of this service offering continue to drive rapid adoption across the client base. As of Q1 2013, the provider adoption rate was 40%, as compared to 35% in Q4 2012 and 20% in Q1 2012. As we increase the penetration of athenaCommunicator across our athenaCollector client base, the volume of work performed on behalf of our clients continues to grow dramatically. athenaCommunicator delivered over 20.7 million automated messages during Q1 2013 across our active patient base (over 9.7 million patients). Increased adoption of the patient portal component of athenaCommunicator will allow our clients to fully maximize the benefits of this service offering. Usage of the patient portal significantly reduces administrative tasks and improves the patient experience both inside and outside the physician’s office. Patient portal adoption has increased by 27% since Q4 2012 to 1,400,000 patients registered as of Q1 2013. Another significant benefit of this service offering includes management of self-pay collections which remains critical to our clients’ financial health. athenaCommunicator assisted our clients with their self-pay collections by collecting over $7.1 million during Q1 2013 via the patient portal and our live operator service, an increase of 58% over the Q4 2012 self-pay collections. Finally, our ability to reduce the no-show rate not only drives more revenue to our clients but also improves the overall patient experience. Our athenaCommunicator clients see, on average, an 8% reduction in their no-show rate.
The athenaCommunicator product development team remains focused on initiatives that enhance the value proposition of this service offering for both our clients and their patients. Service enhancements released in late 2012, including Online Check-In functionality, enhanced e-mail communications, and a mobile version of the patient portal have continued to drive improved patient engagement and patient activation. We are thrilled to announce a new offering with one of our More Disruption Please partners, iTriage, to further promote patient engagement and improve schedule density for our athenaCommunicator clients. iTriage provides consumers with a tool to research symptoms, explore causes, locate a nearby provider and even make an appointment for treatment. By signing up with iTriage, our athenaCommunicator clients will be able to accept new patients sourced from the iTriage application. This is just one example of how athenahealth is partnering with innovative companies to drive improved financial and operational performance for our clients. Finally, the development team is on track to deliver the additional athenaCommunicator functionality needed to certify athenaClinicals on the 2014 MU requirements by Q2 2013. Our differentiated cloud-based services offer a proven model for quickly adapting to industry change and securing MU incentives for our client practices.
athenaCoordinator Service Offering
Our care coordination service offerings include athenaCoordinator Core and athenaCoordinator Plus. athenaCoordinator Core is a cloud-based order transmission service for all receiver types and physicians using athenaClinicals. athenaCoordinator Plus is our cloud-based care coordination service for order transmission, insurance pre-certification, and patient registration among physicians and hospitals, surgical centers, and imaging centers. athenaCoordinator Plus entered general availability in 2011 following the acquisition of Proxsys LLC, and the athenaCoordinator Core service offering entered general availability in 2012.
athenahealth believes that there should be an open market exchange for information in the health care industry. In order for the health care industry to move into the 21st century, health information should be liquid and move easily along the health care supply chain. Our emerging sustainable business model for health information exchange was born from the successful integration of athenaCoordinator and athenaClinicals with orders-based pricing. While still early in our pursuit, we continue to be encouraged by the progress we are making in creating a sustainable market for health information exchange between senders and receivers. We remain focused on seeding our network of both senders and receivers. Following are more examples of the progress we are making in building our two-sided market in health care:
| |
| 1. | We recently signed a large obstetrics & gynecology practice onto our athenaOne services. The practice’s decision to sign with athenahealth was influenced by our growing receiver network which includes the largest clinical laboratory in its area. This is representative of a growing number of clients who become drawn to athenahealth because an important supply chain partner has agreed to share in the cost of care coordination. |
| |
| 2. | A small group practice that recently went live on athenaOne was being pressured by a national lab company to continue to use its lab ordering portal versus using the order workflow within athenaClinicals. In order to assist the practice in avoiding duplicative order entry work, athenahealth organized a meeting between the practice and a regional lab company already signed up on athenaCoordinator Core to discuss opportunities for improved care coordination. Eager to drive improved care coordination, the practice has decided to move its lab business to the in-network regional lab receiver. As a result, the practice will not have to use a separate lab portal and will now be clinically integrated with its new lab partner. |
| |
| 3. | Upon learning of the signing of a particular regional imaging center onto athenaCoordinator Plus, one of its partner hospitals also signed up for athenaCoordinator Plus. Although the two organizations had already worked together under a joint venture relationship, the hospital’s decision to join the athenahealth network was influenced by both its desire to become easier to do business with and its desire to remain competitive. |
We knew the creation of a two-sided market in health care was not going to happen overnight. We did, however, reach an important milestone during Q1 2013 with at least one in-network Coordinator receiver for every athenaClinicals client. Although we are still in the infancy stage of building a two-sided market, the orders are starting to flow across our growing network of senders and receivers. We expect to enjoy viral network growth as we continue to sign more senders and receivers onto our network.
The athenaCoordinator service offering has the DNA to scale like athenaCollector. Although the transformation from a highly manual service to a highly automated service takes time, we are starting to make progress in scaling our operations. The athenaCoordinator operations team remains focused on implementing work flow distribution tools and streamlining workflows through automation and task standardization. The athenaCoordinator product development team is on track to deliver features and
functionality that improve visibility and insight into our clients’ referral activities and that enhance the exchange of health information for our clients.
athenaClarity Service Offering
athenaClarity is a cloud-based service that provides visibility into the financial and clinical health of the health care network, helping health care organizations manage both networks of caregivers and populations of patients. By harmonizing data across practice management systems, Electronic Health Records (EHR), and claims systems, athenaClarity provides health care organizations with a single source of truth. athenaClarity turns insight into action, guiding data-driven decision-making at the point of care. athenaClarity service offering was born from the union of athenahealth’s Anodyne Solutions and HDS service offerings. athenahealth acquired Anodyne Health Partners, Inc. in October of 2009 and acquired Healthcare Data Services LLC in October of 2012. athenaClarity service offering entered general availability in 2013.
We are seeing a shift in reimbursement from pay-for-volume to pay-for-value and have been engineering our cloud-based services to keep pace with the trend. The fundamental pre-requisite for success in a global risk market is the high performance medical group. athenahealth offers the most highly differentiated cloud-based services that help create and support the high performance medical group. We unveiled our latest cloud-based service offering, athenaClarity, at the 2013 HIMSS conference in New Orleans. athenaClarity was created by combining the resources and expertise of the Anodyne and HDS teams. This cloud-based service offering converts revenue cycle, productivity, and population health data into actionable insight necessary to manage networks of caregivers and patient populations under any payment scenario. Unlike traditional business intelligence tools and static health information exchange capabilities, athenaClarity:
| |
| 1. | Harmonizes data across disparate EHR, practice management, and claims systems; |
| |
| 2. | Provides a single, cloud-based platform to develop insight from that data; and |
| |
| 3. | Guides action at the point-of-care that aligns with revenue goals and care outcomes. |
It is important to remember that information has no value until it is turned into meaningful insight as illustrated by the following equation: 100% Insight x 0% Action = Zero Results. athenaClarity transforms data into insight and action across systems and relationships to deliver desired outcomes. With athenaClarity, providers, medical groups, and health systems can thrive in any reimbursement scenario, ranging from traditional fee-for-service (FFS) to bundled payment and shared savings models. By offering one solution, our clients can succeed under any payment model and seamlessly support their movement along the payment paradigm. athenaClarity helps guide providers’ performance by benchmarking their productivity under a FFS contract and by measuring adherence to network-wide quality measures for a shared savings contract. Regardless of the EHR or practice management system vendor, athenaClarity provides a clear view on the performance of financial operations under different payment models. athenaClarity supports population health management workflows by converting clinical and claim data from across a care network into a single consolidated view, making it easy to understand revenue cycle and provider performance. A consolidated view on data makes it possible and simple to understand activity related to collections, referrals, denials, and days in accounts receivable in addition to viewing data dashboards by location, department, practice, specialty, or geography. This insight helps with quality management, population health outreach, utilization, tracking care trends over time and against budget and provider-administrator alignment. We continue to deliver cloud-based services that are future-proof and athenaClarity is the only business intelligence solution nimble enough to keep pace with changes in reimbursement models.
Business Development Update
More Disruption Please
Joy’s Law provides that “no matter who you are, most of the smartest people work for someone else.” We know we can’t innovate everything on our own and look to find other disruptive technologies that advance our mission. We believe that a vibrant ecosystem is a key to success. In furtherance of this belief, athenahealth is making significant investments to open athenaNet to an increasing number of “More Disruption Please” (MDP) partners. Our MDP business development program attracts like-minded entrepreneurs, health care IT companies, investors, and thought leaders. These MDP partners share our vision of making health care work as it should through openness and connectivity of disruptive solutions. To date, we are engaged with thirteen MDP partners and are making progress toward our goal of working with over twenty partners by year-end. Committed to helping our MDP partners accelerate their growth, we formally launched the athenahealth Marketplace, our version of the Apple App StoreSM, at our User Conference in April 2013. Please visit our athenahealth Marketplace at www.athenahealth.com/marketplace. We also showcased several of our MDP partners at our 2013 User Conference to further promote their service offerings to our client base. The athenahealth Marketplace offers another avenue where our provider base can shop for the best toolsets, technologies and services to help them deliver better care to their patients. Today, the athenahealth Marketplace offers seven capabilities consisting of scheduling, transcription, medical records request, contract management, personal health records, marketing and communications and patient surveys. The athenahealth marketplace should further accelerate adoption of our MDP partners’ solutions by athenahealth clients. athenahealth’s platform for our MDP partners has become even more attractive with the acquisition of Epocrates. Our long-term plans include folding Epocrates into our MDP platform and creating a secondary delivery mechanism for our MDP partners. The major tenet of our program is to open athenaNet to allow our partners to easily connect and build onto our platform. The pilot program involving Smart Scheduling, an original athenahealth MDP partner and Steward Health Care, an athenahealth client, is an example of such a partnership. Smart Scheduling is a predictive analytics software that delivers insight into the likelihood of patient no-shows and tardiness. No-shows are very costly to medical care givers in terms of lost revenue and disruption to the patient experience. Smart Scheduling’s guidance and decision support for intelligent overbooking delivers incremental value to our clients. By building this open platform, we can attract the most innovative and valuable solutions to our network, benefiting our clients and the health care industry. To learn more about our MDP program or to sign up as an MDP member, please access our MDP website at www.athenahealth.com/disruption.
Epocrates Acquisition
The athenahealth team reached a major milestone on March 12, 2013 with the completion of the Epocrates, Inc. acquisition. We are thrilled to call the Epocrates team our colleagues and are excited about what we can accomplish together. Our missions align so beautifully. We are positioned to be the best in the world at supporting clinicians in making confident and efficient decisions in the moment of care. We are currently at the tail end of a project prioritization planning process with the Epocrates team which will carry them through the end of year. We will then integrate them into our 2014 planning process which begins at the end of July 2013. By leveraging Epocrates’ mobile expertise with the knowledge and data from athenahealth’s cloud-based network, the combined company is uniquely positioned to introduce new mobile workflows and applications to fuel the delivery of high-value information to the clinical community. Moreover, this acquisition accelerates athenahealth’s awareness and access to the clinician market, growing our current provider base of nearly 40,000 to include the more than one million clinicians on the Epocrates’ network. Stay tuned for more information on integration plans and progress being made against our near term strategic priorities.
CommonWell Alliance
athenahealth recently joined Cerner, McKesson, Allscripts, Greenway, and RelayHealth to form the CommonWell Health AllianceTM, an independent not-for-profit organization that will support and promote seamless interoperability of and access to patient data across the health care system. We have joined the
CommonWell Health Alliance because we believe that being open matters, especially when it comes to patient care. CommonWell’s efforts to bring developers and industry thought leaders together to pilot patient linking and matching across HIT systems and care settings is an important step to move the health care industry into the 21st century. Information opacity is stifling the innovation and advancement so desperately needed by the health care industry. The free flow of health information is absolutely critical to improving the quality and cost of care delivered. athenahealth is proud to be a founding member of the CommonWell Health Alliance and we look forward to helping make true health information exchange happen.
Revenue Discussion
Q1 2013 revenue reached $125.6 million and grew by 30% (or $29.0 million) over Q1 2012. Excluding Epocrates revenue contribution of $5.5 million, Q1 2013 revenue was $120.1 million and grew by 24% over prior year. Q1 2013 also represents our 53rd quarter of consecutive revenue growth.
|
| | | | |
| | Q1 2013 | Q1 2012 | Y/Y Growth% |
| athenahealth | $120.1 | $96.6 | 24 | % |
| Epocrates | $5.5 | $0.0 | n/a |
|
| Consolidated | $125.6 | $96.6 | 30 | % |
In terms of trends in our recurring revenue base, same-store analysis of claims created—a proxy for physician office utilization—indicates that physician office activity in Q1 2013 increased modestly over physician office activity during Q1 2012 but was relatively flat compared to physician office activity in Q4 2012. This was not unexpected as we typically see an increase in claims created from Q3 to Q4 due to seasonality (flu season) and then remain relatively flat from Q4 to Q1.
Client Base Discussion
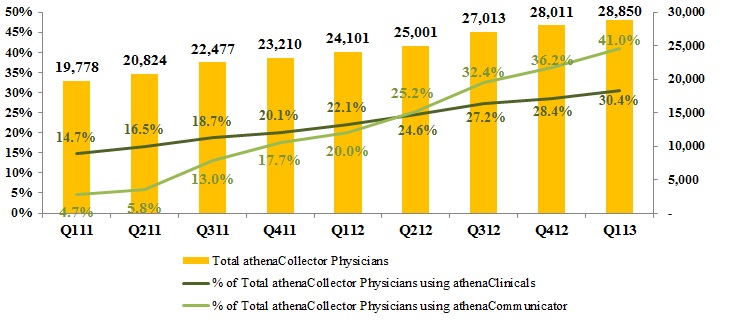
The total number of physicians who have gone live on athenaCollector, our core service offering, is the metric we currently use to define our client base and market share. However, as our client base expands outside the traditional ambulatory market, total active providers—or nodes on our network—will become a more appropriate metric used to define our client base and market share. Annual growth in total revenue continues to outpace growth in our physician base. We believe that this trend will continue as athenaClinicals and athenaCommunicator are included in a growing portion of new deals and adoption of these services spreads across our existing client base.
During Q1 2013, 79% of all new athenaCollector deals included athenaClinicals, down slightly from 80% in Q1 2012. 69% of all new athenaCollector deals included athenaCommunicator and athenaClinicals. Additionally, 69% of all new athenaOne deals also included athenaCoordinator Core. The athenaOne rate of 69% in Q1 2013 compares to 62% in Q1 2012. Among “live” (i.e., implemented and active) athenaCollector clients, adoption of athenaClinicals and athenaCommunicator continues to grow rapidly and resulted in continued growth to our installed base across all of our service offerings. As our client base expands outside the traditional ambulatory market, total active providers-or nodes on our network-will become a more appropriate metric used to measure of our market share.
athenahealth Service Offering Adoption
athenaCollector Clients
During Q1 2013, total active physicians on athenaCollector grew by 20% year-over-year, to 28,850. On a sequential basis, we added 839 net new active physicians on athenaCollector, versus 891 in Q1 2012. Our quarterly net new physician additions may vary widely due to the number and size of clients that go live in a particular quarter. Furthermore, our larger clients can be more complex and take longer to go live, particularly if our clients request a more phased implementation approach. Total active providers on athenaCollector grew by 21% year-over-year, to 40,937. On a sequential basis, we added 1,185 net new active providers on athenaCollector, versus 1,183 in Q1 2012.
athenaClinicals Clients
We continue to experience rapid growth in client adoption of athenaClinicals. Total active physicians live on athenaClinicals grew by 65% year-over-year, to 8,776. On a sequential basis, we added 827 net new active physicians on athenaClinicals, versus 669 in Q1 2012. This equates to an overall adoption rate of 30% of total athenaCollector physicians, up from 22% in Q1 2012. Total active providers on athenaClinicals grew by 64% year-over-year, to 12,139. On a sequential basis, we added 1,213 net new active providers on athenaClinicals, versus 877 in Q1 2012. We expect the athenaClinicals client base to increase significantly over time due to cross-selling within our existing base and growth in the volume of athenaOne deals.
athenaCommunicator Clients
Our athenaCommunicator client base is also growing rapidly. Total active physicians live on athenaCommunicator grew by an impressive 146% year-over-year, to 11,840. On a sequential basis, we added 1,687 net new active physicians on athenaCommunicator, versus 722 in Q1 2012. This equates to an overall adoption rate of 41% of total athenaCollector physicians, up from 20% in Q1 2012. Total active providers on athenaCommunicator grew by 140%, to 16,296. On a sequential basis, we added 2,231 net new providers on athenaCommunicator, versus 970 in Q1 2012. We expect the athenaCommunicator client base to increase significantly over time due to cross-selling within our existing base and growth in the volume of athenaOne deals.
New Deals
On May 1, 2013, we announced that Lahey Health selected athenaClarity, athenahealth’s cloud-based analytics service that delivers actionable insight to both fee-for-service and risk-based payment
environments. athenaClarity will be used to gain advanced insight into network-wide data across disparate information systems and in turn support Lahey Health’s management of population health and changing payment models. Lahey Health is a next generation health care system comprised of award-winning hospitals, primary care providers, specialist physicians, behavioral health, and senior care resources and services throughout Eastern Massachusetts and Southern New Hampshire.
Client Implementations
As of March 31, 2013, our publicly disclosed implementation pipeline includes the following status updates: University Hospitals academic medical center (~850 physicians; ~1,000 providers) brought the first wave live on athenaCollector in Q1 2013. Continuing the momentum, University Hospitals brought the second wave live in early April and is on track to bring its remaining physicians and providers live on athenaCollector by Q3 2013. Lowell General Physician Hospital Organization went live on athenaClarity in Q1 2013, less than six weeks after selecting our patient population management and surveillance service. Soon after we closed the quarter (early April 2013), Mid Dakota Clinic (~60 physicians, ~90 providers) went live on our full suite of services including athenaCollector, athenaClinicals, athenaCommunicator, and athenaCoordinator Core. Emergency Medicine Physicians (~800 physicians) kicked off their implementation during Q1 2013 and went live on athenaCollector and athenaCommunicator in early April. The athenaOne implementations at Health Management Associates (~900 physicians, ~1,200 providers), Martin's Point Health Care (~79 physicians and ~100 providers), Palmetto Primary Care Physicians (~50 physicians, ~80 providers), and Children's Hospital Central California (~100 physicians, ~130 providers) are all progressing as planned. Building upon its December go-live success, Health Management Associates brought two additional waves live during January and April and remains on track to bring its remaining physicians and providers live by Q3 2013. Martin’s Point Health Care is expected to be fully live by Q2/Q3 2013 and Palmetto Primary Care and Children’s Hospital Central California are close to follow with go-live dates in Q3 2013. Implementation of our full suite of services, including Anodyne Solutions, at Prospira PainCare (~20 physicians, ~50 providers) is on track for completion in early Q3 2013. Finally, Children's Hospital Los Angeles Medical Group (~450 physicians) is expected to be fully live on athenaCollector by early Q3 2013.
Non-GAAP Adjusted Gross Margin Discussion
Our Non-GAAP Adjusted Gross Margin was 60.4% for Q1 2013, down approximately 110 basis points from 61.5% in Q1 2012. As anticipated, this year-over-year decline in our Non-GAAP Adjusted Gross Margin was driven by service mix and continued investments in our service offerings. One of our goals is to improve gross margin on a service-line basis each year. As previously discussed, the expansion of our newer service offerings, such as athenaCoordinator, will serve as a headwind to margin expansion until these new services become more automated and scalable.
Marketing and Selling Discussion
As an innovative, high growth company with a relatively small share of a very large market opportunity, our business model is still new to health care, and market awareness remains our biggest challenge. To improve awareness, we remain focused on expanding and enhancing our selling and marketing activities. These activities incur both fixed and variable costs, as they range from investment in personnel and infrastructure to spending on new advertising campaigns and paid search terms. We continue to experiment with and expand upon our awareness-building efforts as quickly as we deem them to be effective. The productivity of these investments is largely measured over the long term, particularly as it may take six to nine months of implementation before new clients fully contribute to revenue and join the ranks of our active client base.
Marketing Update
The athenahealth marketing organization encompasses our growth and sales operations, event and partner marketing, inside sales agents (ISAs), advertising, corporate communications, and product
marketing teams. This organization executes in-market investments in an effort to generate new business opportunities for athenahealth.
Our public relations and marketing efforts are off to a strong start in 2013. We continue to increase and expand our thought leadership campaigns and press announcements in order to build greater brand awareness and industry recognition. athenahealth has received substantial recognition as an innovative thought leader in the health care community. Jeremy Delinsky, athenahealth’s Chief Technology Officer, was selected by Kathleen Sebelius, Health and Human Services Secretary, to fill the innovator seat on the influential Health Information Technology Standards Committee. Also, motivated by Dr. Farzad Mostashari’s comments challenging the HIT vendors to ‘step up’, athenahealth proposed an HIT ‘Code of Conduct’ that calls upon the health information industry to abide by five guiding principles necessary to move the HIT industry forward and transform health care. We are requiring our MDP partners to sign our ‘Code of Conduct’ as a condition of access to our MDP sales channel. In addition, athenahealth joined McKesson, Cerner, Allscripts, and Greenway, to form the CommonWell Health alliance and will play a leadership role in making health care IT open and interoperable. athenahealth continues to move forward on our vision of building the nation's health information backbone and the industry is taking note. athenahealth had the honor of being the only health care IT company named to Fast Company’s “World’s Most Innovative Health Care Companies” list. athenahealth was recognized for our pioneering cloud-based services with a #8 ranking from Fast Company on its prestigious list.
athenahealth also made a splash at this year’s HIMSS convention and showcased our new marketing campaign, “One Patient. Total Clarity. Everywhere.SM” The key message of our new marketing campaign is that we are building the most interoperable information backbone in the nation, enabling patient data to flow across the continuum of care. Our booth at HIMSS was humming with the team delivering non-stop demos of athenaOne and athenaClarity. We also announced the extension of our MU guarantee program to include both Stage 1 and Stage 2 attestation. We believe our MU guarantee program further reinforces our commitment to help our clients thrive in the face of industry change and pressure and will help us win in the expanding EHR replacement market.
Selling Update
The athenahealth sales organization includes all quota-carrying sales representatives, as well as our sales team leaders, channel sales team, and sales training and development organization.
Our sales organization carried the positive momentum from their strong finish last year into 2013. Our February sales meeting was a huge success and galvanized the team around our bookings goals and strategic initiatives for this year. The athenaX project team received a standing ovation at this meeting when they presented a glimpse of the re-designed user experience on athenaClinicals to the sales team. Our sales team has many new desirable offerings to present to prospects including our newest service offering, athenaClarity, our expanded MU guarantee program, and our cross-browser support of mobile Safari and desktop Safari application programs. The excitement around our service offerings was apparent at HIMSS and generated activity levels more than double those of last year. athenahealth added to this general excitement with the completion of the Epocrates acquisition in March 2013. Epocrates will become our largest sales channel and will expand our provider base to include the more than one million health care professionals on the Epocrates network. We expect that the Epocrates acquisition will accelerate our awareness and drive growth of our core service offerings across the clinician market.
As of March 31, 2013, we have a total of 114 quota-carrying sales representatives, up 9% from 105 quota-carrying sales representatives as of March 31, 2012. In order to better allocate resources and better support our sales team, we moved 3 quota-carrying representatives into market strategy roles which doubled our market strategists from 3 to 6. The goal of our market strategists is to effectively determine where to fight, how to fight, and build a coordinated attack strategy in each market. We have seen the
investment in our market strategy improve the productivity of our overall geographic attack and help drive adoption across all of our service offerings.
Balance Sheet and Cash Flow Highlights
As of March 31, 2013, our cash and cash equivalents totaled $47.8 million and the balance outstanding on our line of credit was $105.0 million. Cash flow used by operations increased $5.2 million to net cash used in operating activities of $5.5 million for the three months ended March 31, 2013, compared to the three months ended March 31, 2012. The increase in cash flow used in operations was primarily driven by an increase in variable compensation payments due to headcount growth. Our capital expenditures, including capitalized software development, were $15.8 million (or 12.6% of total revenue) in Q1 2013.
Fiscal Year 2013 Outlook
Now that the Epocrates acquisition is closed and the Arsenal transaction and new financing are anticipated to close in early May, we are updating our guidance for fiscal year 2013. Please note that the guidance for core athenahealth remains unchanged from the original guidance communicated on December 5, 2012, in conjunction with our Investor Summit. Our updated fiscal year 2013 guidance incorporating the Epocrates transaction and the anticipated closing of the Arsenal and debt financing transactions is summarized in the following table:
|
| |
| For the Fiscal Year Ending December 31, 2013 |
| Forward Looking Guidance |
| GAAP Total Revenue | $580 - $615 million |
| Non-GAAP Adjusted Gross Margin | 63.0% - 64.0% |
| Non-GAAP Adjusted Operating Income | $68 - $80 million |
| Non-GAAP Adjusted Net Income per Diluted Share | $1.05 - $1.15 |
Our updated GAAP revenue guidance of $580 million to $615 million includes approximately $55 million to $65 million of revenue contribution relating to the Epocrates transaction and the anticipated completion of the Arsenal transaction.
| |
| • | The range for Epocrates revenue is $46 million to $55 million which includes an approximate $10 million reduction in revenue attributed to the purchase accounting treatment of Epocrates’ deferred revenue, and an approximate $15 million reduction in revenue due to the changes made to our market research offerings. |
| |
| • | The Arsenal purchase, if completed, is expected to add approximately $10 million of revenue related to third-party tenants who currently occupy a portion of the Arsenal campus. |
Our updated guidance for Non-GAAP Adjusted Net Income per Diluted Share is $1.05 to $1.15.
| |
| • | The approximate $10 million reduction in revenue attributed to the purchase accounting treatment of Epocrates’ deferred revenue results in a reduction in Non-GAAP Adjusted Net Income per Diluted Share. |
| |
| • | The updated guidance range also reflects an anticipated fiscal year 2013 GAAP effective tax rate of approximately 70% to 90%. |
| |
| • | The change in the anticipated fiscal year 2013 GAAP effective tax rate is driven by the purchase of Epocrates. Excluding the impact from Epocrates, the estimated fiscal year 2013 GAAP effective tax rate remains otherwise materially unchanged from our original guidance communicated in December 2012. |
| |
| • | Our 2013 consolidated GAAP pre-tax income forecast has been reduced from previous estimates due to the projected GAAP pre-tax loss for Epocrates that is primarily attributed to integration and transaction costs, stock compensation expense, and amortization of purchased intangibles for the remainder of 2013 post-acquisition. This projected lower GAAP pre-tax income results in an increase in the effective tax rate because permanent differences, which remained otherwise materially unchanged other than acquisition-related expenses, are a greater percentage of a lower estimated GAAP pre-tax income. |
| |
| • | Our estimated cash taxes are expected to be substantially lower than our previous estimates for fiscal year 2013. |
Our new debt financing, anticipated to close next week, will include a $200 million term loan and a $125 million revolving credit facility.
Closing Remarks
athenahealth is truly at a pivotal point. We have several developments underway that are changing the character of our company and positioning us for sustainable growth. During Q1 2013, we have taken some big steps towards achieving our vision of building an information backbone that helps make health care work as it should. We took a new step into mobile and added a new revenue stream with the acquisition of Epocrates. We took some wonderful steps towards building a sustainable market for health information exchange by joining the CommonWell Alliance and announcing our HIT “Code of Conduct”. We also took a leap towards helping care givers win in a global risk market with the formation of our fifth service offering, athenaClarity. All of these steps, whether big or small, get us closer to achieving our vision. We are building the health information backbone this nation needs so badly and our progress is tangible.
Stock-Based Compensation Expense, Summary of Cash Balance, Reporting by Business and Reconciliation of Non-GAAP Financial Measures
athenahealth, Inc.
STOCK-BASED COMPENSATION
(Unaudited, in thousands)
Set forth below is a breakout of stock-based compensation impacting the Condensed Consolidated Statements of Income for the three months ended March 31, 2013 and 2012:
|
| | | | | | | |
| | Three Months Ended March 31, |
| | 2013 | | 2012 |
| Stock-based compensation charged to Consolidated Statements of Income: | | | |
| Direct operating | $ | 1,717 |
| | $ | 908 |
|
| Selling and marketing | 2,876 |
| | 1,672 |
|
| Research and development | 1,323 |
| | 765 |
|
| General and administrative | 7,742 |
| | 2,288 |
|
| Total stock-based compensation expense | 13,658 |
| | 5,633 |
|
| Amortization of capitalized stock-based compensation related to software development (1) | 156 |
| | — |
|
| Total | $ | 13,814 |
| | $ | 5,633 |
|
| |
| (1) | In addition, for the three months ended March 31, 2013, $0.4 million of stock-based compensation was capitalized in the line item Capitalized Software Costs in the Consolidated Balance Sheet for which $0.2 million of amortization was included in the line item Depreciation and Amortization Expense in the Consolidated Statement of Income. The amount of stock-based compensation related to capitalized software development costs in prior periods was not significant. |
athenahealth, Inc.
CASH, CASH EQUIVALENTS, AND AVAILABLE-FOR-SALE INVESTMENTS
(Unaudited, in thousands)
Set forth below is a breakout of total cash, cash equivalents, and available-for-sale investments as of March 31, 2013, and December 31, 2012:
|
| | | | | | | |
| | March 31, 2013 | | December 31, 2012 |
| | | | |
| Cash, cash equivalents | $ | 47,807 |
| | $ | 154,988 |
|
| Short-term investments | — |
| | 38,092 |
|
| | | | |
| Total | $ | 47,807 |
| | $ | 193,080 |
|
athenahealth, Inc.
REVENUE AND NON-GAAP ADJUSTED OPERATING INCOME BY BUSINESS
(Unaudited, in thousands)
Set for below is a breakout of revenue and “Non-GAAP Adjusted Operating Income” by business for the three months ended March 31, 2013 and 2012:
|
| | | | | | | | | |
| | | | Three months ended March 31, |
| | | | 2013 | | 2012 |
| Revenue: | | | | |
| | Business services: | | | | |
| | athenahealth | | $ | 115,946 |
| | $ | 93,549 |
|
| | Epocrates | | 5,517 |
| | — |
|
| | Implementation and other: | | | | |
| | athenahealth | | 4,133 |
| | 3,017 |
|
| Total revenue | | $ | 125,596 |
| | $ | 96,566 |
|
|
| | | | | | | | | |
| | | | Three months ended March 31, |
| | | | 2013 | | 2012 |
| Non-GAAP Adjusted Operating Income: | | | |
| | athenahealth | | $ | 9,064 |
| | $ | 11,573 |
|
| | Epocrates | | 326 |
| | — |
|
| Total Non-GAAP Adjusted Operating Income | 9,390 |
| | 11,573 |
|
| | Stock-based compensation expense | 13,814 |
| | 5,633 |
|
| | Integration and transaction costs | 5,709 |
| | — |
|
| | Amortization of purchased intangibles | 1,740 |
| | 753 |
|
| Total operating income (loss) | (11,873 | ) | | 5,187 |
|
| Other (expense) income | (110 | ) | | 134 |
|
| (Loss) income before income tax benefit (provision) | (11,983 | ) | | 5,321 |
|
| Income tax benefit (provision) | 12,683 |
| | (2,893 | ) |
| Net income | | $ | 700 |
| | $ | 2,428 |
|
athenahealth, Inc.
RECONCILIATION OF NON-GAAP FINANCIAL MEASURES
TO COMPARABLE GAAP MEASURES
(Unaudited, in thousands, except per share amounts)
The following is a reconciliation of the non-GAAP financial measures used by the Company to describe the Company’s financial results determined in accordance with accounting principles generally accepted in the United States of America (GAAP). An explanation of these measures is also included below under the heading “Explanation of Non-GAAP Financial Measures.”
While management believes that these non-GAAP financial measures provide useful supplemental information to investors regarding the underlying performance of the Company’s business operations, investors are reminded to consider these non-GAAP measures in addition to, and not as a substitute for, financial performance measures prepared in accordance with GAAP. In addition, it should be noted that these non-GAAP financial measures may be different from non-GAAP measures used by other companies, and management may utilize other measures to illustrate performance in the future. Non-GAAP measures have limitations in that they do not reflect all of the amounts associated with the Company’s results of operations as determined in accordance with GAAP.
Please note that these figures may not sum exactly due to rounding.
Non-GAAP Adjusted Gross Margin
Set forth below is a presentation of the Company’s “Non-GAAP Adjusted Gross Profit” and “Non-GAAP Adjusted Gross Margin,” which represents Non-GAAP Adjusted Gross Profit as a percentage of total revenue.
|
| | | | | | | |
| (unaudited, in thousands) | Three Months Ended |
| | March 31, |
| | 2013 | | 2012 |
| | | | |
| Total revenue | $ | 125,596 |
| | $ | 96,566 |
|
| Direct operating expense | 53,185 |
| | 38,798 |
|
| Total revenue less direct | | | |
| operating expense | 72,411 |
| | 57,768 |
|
| Add: Stock-based compensation | | | |
| allocated to direct operating expense | 1,717 |
| | 908 |
|
| Add: Amortization of purchased intangibles | 1,740 |
| | 753 |
|
| | | | |
| Non-GAAP Adjusted Gross Profit | $ | 75,868 |
| | $ | 59,429 |
|
| | | | |
| Non-GAAP Adjusted Gross Margin | 60.4 | % | | 61.5 | % |
Non-GAAP Adjusted EBITDA
Set forth below is a reconciliation of the Company’s “Non-GAAP Adjusted EBITDA” and “Non-GAAP Adjusted EBITDA Margin,” which represents Non-GAAP Adjusted EBITDA as a percentage of total revenue.
|
| | | | | | | |
| (unaudited, in thousands) | Three Months Ended |
| | March 31, |
| | 2013 | | 2012 |
| | | | |
| Total Revenue | $ | 125,596 |
| | $ | 96,566 |
|
| | | | |
| GAAP net income | 700 |
| | 2,428 |
|
| Add: (Benefit) provision for income taxes | (12,683 | ) | | 2,893 |
|
| Less: Total other expense (income) | 110 |
| | (134 | ) |
| Add: Stock-based compensation expense | 13,658 |
| | 5,633 |
|
| Add: Depreciation and amortization | 8,341 |
| | 5,486 |
|
| Add: Amortization of purchased intangibles | 1,740 |
| | 753 |
|
| Add: Integration and transaction costs | 3,794 |
| | — |
|
| Add: Non-tax deductible transaction costs | 1,915 |
| | — |
|
| | | | |
| Non-GAAP Adjusted EBITDA | $ | 17,575 |
| | $ | 17,059 |
|
| | | | |
| Non-GAAP Adjusted EBITDA Margin | 14.0 | % | | 17.7 | % |
Non-GAAP Adjusted Operating Income
Set forth below is a reconciliation of the Company’s “Non-GAAP Adjusted Operating Income” and “Non-GAAP Adjusted Operating Income Margin,” which represents Non-GAAP Adjusted Operating Income as a percentage of total revenue.
|
| | | | | | | |
| (unaudited, in thousands) | Three Months Ended |
| | March 31, |
| | 2013 | | 2012 |
| | | | |
| Total revenue | $ | 125,596 |
| | $ | 96,566 |
|
| | | | |
| GAAP net income | 700 |
| | 2,428 |
|
| Add: (Benefit) provision for income taxes | (12,683 | ) | | 2,893 |
|
| Less: Total other expense (income) | 110 |
| | (134 | ) |
| Add: Stock-based compensation expense | 13,658 |
| | 5,633 |
|
| Add: Amortization of capitalized stock-based compensation related to software development | 156 |
| | — |
|
| Add: Amortization of purchased intangibles | 1,740 |
| | 753 |
|
| Add: Integration and transaction costs | 3,794 |
| | — |
|
| Add: Non-tax deductible transaction costs | 1,915 |
| | — |
|
| | | | |
| Non-GAAP Adjusted Operating Income | $ | 9,390 |
| | $ | 11,573 |
|
| | | | |
| Non-GAAP Adjusted Operating Income Margin | 7.5 | % | | 12.0 | % |
Non-GAAP Adjusted Net Income
Set forth below is a reconciliation of the Company’s “Non-GAAP Adjusted Net Income” and “Non-GAAP Adjusted Net Income per Diluted Share.” |
| | | | | | | |
| (unaudited, in thousands) | Three Months Ended |
| | March 31, |
| | 2013 | | 2012 |
| | | | |
| GAAP net income | $ | 700 |
| | $ | 2,428 |
|
| Add: Stock-based compensation expense | 13,658 |
| | 5,633 |
|
| Add: Amortization of capitalized stock-based compensation related to software development | 156 |
| | — |
|
| Add: Amortization of purchased intangibles | 1,740 |
| | 753 |
|
| Add: Integration and transaction costs | 3,794 |
| | — |
|
| | | | |
| Sub-total of tax deductible items | 19,348 |
| | 6,386 |
|
| | | | |
| (Less): Tax impact of tax deductible items (1) | (7,739 | ) | | (2,554 | ) |
| Add: Non-tax deductible transaction costs | 1,915 |
| | — |
|
| | | | |
| Non-GAAP Adjusted Net Income | $ | 14,224 |
| | $ | 6,260 |
|
| | | | |
| Weighted average shares - diluted | 37,744 |
| | 36.996 |
|
| | | | |
| Non-GAAP Adjusted Net Income per Diluted Share | $ | 0.38 |
| | $ | 0.17 |
|
| |
| (1) | Tax impact calculated using a statutory tax rate of 40%. |
|
| | | | | | | |
| (unaudited, in thousands) | Three Months Ended |
| | March 31, |
| | 2013 | | 2012 |
| | | | |
| GAAP net income per share - diluted | $ | 0.02 |
| | $ | 0.07 |
|
| Add: Stock-based compensation expense | 0.36 |
| | 0.15 |
|
| Add: Amortization of capitalized stock-based compensation related to software development | — |
| | — |
|
| Add: Amortization of purchased intangibles | 0.05 |
| | 0.02 |
|
| Add: Integration and transaction costs | 0.10 |
| | — |
|
| | | | |
| Sub-total of tax deductible items | 0.51 |
| | 0.17 |
|
| | | |
| (Less): Tax impact of tax deductible items (1) | (0.21 | ) | | (0.07 | ) |
| Add: Non-tax deductible transaction costs | 0.05 |
| | — |
|
| | | | |
| Non-GAAP Adjusted Net Income per Diluted Share | $ | 0.38 |
| | $ | 0.17 |
|
| | | |
| Weighted average shares - diluted | 37,744 |
| | 36,996 |
|
| |
| (1) | Tax impact calculated using a statutory tax rate of 40%. |
athenahealth, Inc.
RECONCILIATION OF NON-GAAP FINANCIAL MEASURES
TO COMPARABLE GAAP MEASURES FOR FISCAL YEAR 2013 GUIDANCE
(Unaudited, in millions, except per share amounts)
Please note that the figures presented below may not sum exactly due to rounding.
Non-GAAP Adjusted Gross Margin Guidance
Set forth below is a presentation of the Company’s “Non-GAAP Adjusted Gross Profit” and “Non-GAAP Adjusted Gross Margin” guidance for fiscal year 2013, which represents Non-GAAP Adjusted Gross Profit as a percentage of total revenue.
|
| | | | | | |
| | LOW | HIGH |
| | Fiscal Year Ending December 31, 2013 |
| Total revenue | $ | 580.0 |
| $ | 615.0 |
|
| Direct operating expense | 233.4 |
| 240.2 |
|
| Total revenue less direct operating expense | $ | 346.7 |
| $ | 374.9 |
|
| | | |
| Add: Stock-based compensation expense | 5.3 |
| 5.3 |
|
| allocated to direct operating expense | | |
| Add: Amortization of purchased intangibles (1) | 13.4 |
| 13.4 |
|
| | | |
| Non-GAAP Adjusted Gross Profit | $ | 365.4 |
| $ | 393.6 |
|
| | | |
| Non-GAAP Adjusted Gross Margin | 63.0 | % | 64.0 | % |
| |
| (1) | Based on preliminary estimates related to purchase accounting for the Epocrates transaction. |
Non-GAAP Adjusted Operating Income Guidance
Set forth below is a reconciliation of the Company’s “Non-GAAP Adjusted Operating Income” and “Non-GAAP Adjusted Operating Income Margin” guidance for fiscal year 2013, which represents Non-GAAP Adjusted Operating Income as a percentage of total revenue.
|
| | | | | | |
| | LOW | HIGH |
| | Fiscal Year Ending December 31, 2013 |
| Total revenue | $ | 580.0 |
| $ | 615.0 |
|
| | | |
| GAAP net (loss) income | (0.4 | ) | 3.2 |
|
| Add: (Benefit) provision for income taxes | (2.2 | ) | 7.6 |
|
| Add (less): Total other (income) expense | 5.0 |
| 3.5 |
|
| Add: Stock-based compensation expense | 42.5 |
| 42.5 |
|
| Add: Amortization of capitalized stock-based compensation related to software development | 0.5 |
| 0.5 |
|
| Add: Amortization of purchased intangibles (1) | 13.4 |
| 13.4 |
|
| Add: Integration and transaction costs | 7.0 |
| 7.0 |
|
| Add: Non-tax deductible transaction costs | 2.2 |
| 2.2 |
|
| | | |
| Non-GAAP Adjusted Operating Income | $ | 68.0 |
| $ | 80.0 |
|
| | | |
| Non-GAAP Adjusted Operating Income Margin | 11.7 | % | 13 | % |
| |
| (1) | Based on preliminary estimates related to purchase accounting for the Epocrates transaction. |
Non-GAAP Adjusted Net Income Guidance
Set forth below is a reconciliation of the Company’s “Non-GAAP Adjusted Net Income” and “Non-GAAP Adjusted Net Income per Diluted Share” guidance for fiscal year 2013.
|
| | | | | | |
| | LOW | HIGH |
| | Fiscal Year Ending December 31, 2013 |
| GAAP net (loss) income | $ | (0.4 | ) | $ | 3.2 |
|
| Add: Stock-based compensation expense | 42.5 |
| 42.5 |
|
| Add: Amortization of capitalized stock-based compensation related to software development | 0.5 |
| 0.5 |
|
| Add: Amortization of purchased intangibles (1) | 13.4 |
| 13.4 |
|
| Add: Integration and transaction costs | 7.0 |
| 7.0 |
|
| | | |
| Sub-total of tax deductible items | $ | 63.4 |
| $ | 63.4 |
|
| | | |
| (Less): Tax impact of tax deductible items (2) | (25.3 | ) | (25.3 | ) |
| Add: Non-tax deductible transaction costs | 2.2 |
| 2.2 |
|
| | | |
| Non-GAAP Adjusted Net Income | $ | 39.8 |
| $ | 43.4 |
|
| | | |
| Weighted average shares - diluted | 37.9 |
| 37.9 |
|
| | | |
| Non-GAAP Adjusted Net Income per Diluted Share | $ | 1.05 |
| $ | 1.15 |
|
| |
| (1) | Based on preliminary estimates related to purchase accounting for the Epocrates transaction. |
| |
| (2) | Tax impact calculated using a statutory tax rate of 40%. |
|
| | | | | | |
| | LOW | HIGH |
| | Fiscal Year Ending December 31, 2013 |
| GAAP net (loss) income per share - diluted | $ | (0.01 | ) | $ | 0.08 |
|
| Add: Stock-based compensation expense | 1.12 |
| 1.12 |
|
| Add: Amortization of capitalized stock-based compensation related to software development | 0.01 |
| 0.01 |
|
| Add: Amortization of purchased intangibles (1) | 0.35 |
| 0.35 |
|
| Add: Integration and transaction costs | 0.18 |
| 0.18 |
|
| | | |
| Sub-total of tax deductible items | $ | 1.67 |
| $ | 1.67 |
|
| | | |
| (Less): Tax impact of tax deductible items (2) | (0.67 | ) | (0.67 | ) |
| Add: Non-tax deductible transaction costs | 0.06 |
| 0.06 |
|
| | | |
| Non-GAAP Adjusted Net Income per Diluted Share | $ | 1.05 |
| $ | 1.15 |
|
| | | |
| Weighted average shares - diluted | 37.9 |
| 37.9 |
|
| |
| (1) | Based on preliminary estimates related to purchase accounting for the Epocrates transaction. |
| |
| (2) | Tax impact calculated using a statutory tax rate of 40%. |
Explanation of Non-GAAP Financial Measures
The Company reports its financial results in accordance with accounting principles generally accepted in the United States of America, or GAAP. However, management believes that, in order to properly understand the Company’s short-term and long-term financial and operational trends, investors may wish to consider the impact of certain non-cash or non-recurring items, when used as a supplement to financial performance measures in accordance with GAAP. These items result from facts and circumstances that vary in frequency and impact on continuing operations. Management also uses results of operations before such items to evaluate the operating performance of the Company and compare it against past periods, make operating decisions, and serve as a basis for strategic planning. These non-GAAP financial measures provide management with additional means to understand and evaluate the operating results and trends in the Company’s ongoing business by eliminating certain non-cash expenses and other items that management believes might otherwise make comparisons of the Company’s ongoing business with prior periods more difficult, obscure trends in ongoing operations, or reduce management’s ability to make useful forecasts. Management believes that these non-GAAP financial measures provide additional means of evaluating period-over-period operating performance. In addition, management understands that some investors and financial analysts find this information helpful in analyzing the Company’s financial and operational performance and comparing this performance to its peers and competitors.
Management defines “Non-GAAP Adjusted Gross Profit” as total revenue, less direct operating expense, plus (1) stock-based compensation expense allocated to direct operating expense and (2) amortization of purchased intangibles, and “Non-GAAP Adjusted Gross Margin” as Non-GAAP Adjusted Gross Profit as a percentage of total revenue. Management considers these non-GAAP financial measures to be important indicators of the Company’s operational strength and performance of its business and a good measure of its historical operating trends. Moreover, management believes that these measures enable investors and financial analysts to closely monitor and understand changes in the Company’s ability to generate income from ongoing business operations.
Management defines “Non-GAAP Adjusted EBITDA” as the sum of GAAP net income before (benefit) provision for income taxes, total other (income) expense, stock-based compensation expense, depreciation and amortization, amortization of purchased intangibles, integration costs, and transaction costs and “Non-GAAP Adjusted EBITDA Margin” as Non-GAAP Adjusted EBITDA as a percentage of total revenue. Management defines “Non-GAAP Adjusted Operating Income” as the sum of GAAP net income before provision for income taxes, total other (income) expense, stock-based compensation expense, amortization of capitalized stock-based compensation related to software development, amortization of purchased intangibles, integration costs, and transaction costs and “Non-GAAP Adjusted Operating Income Margin” as Non-GAAP Adjusted Operating Income as a percentage of total revenue. Management defines “Non-GAAP Adjusted Net Income” as the sum of GAAP net income before stock-based compensation expense, amortization of capitalized stock-based compensation related to software development, amortization of purchased intangibles, integration costs, transaction costs and any tax impact related to these items, and “Non-GAAP Adjusted Net Income per Diluted Share” as Non-GAAP Adjusted Net Income divided by weighted average diluted shares outstanding. Management considers all of these non-GAAP financial measures to be important indicators of the Company’s operational strength and performance of its business and a good measure of its historical operating trends, in particular the extent to which ongoing operations impact the Company’s overall financial performance.
Management excludes each of the items identified below from the applicable non-GAAP financial measure referenced above for the reasons set forth with respect to that excluded item:
| |
| • | Stock-based compensation expense and amortization of capitalized stock-based compensation related to software development — excluded because these are non-cash expenditures that |
management does not consider part of ongoing operating results when assessing the performance of the Company’s business, and also because the total amount of the expenditure is partially outside of the Company’s control because it is based on factors such as stock price, volatility, and interest rates, which may be unrelated to the Company’s performance during the period in which the expense is incurred.
| |
| • | Amortization of purchased intangibles — purchased intangibles are amortized over their estimated useful life and generally cannot be changed or influenced by management after the acquisition. Accordingly, this item is not considered by management in making operating decisions. Management does not believe such charges accurately reflect the performance of the Company’s ongoing operations for the period in which such charge is incurred. |
| |
| • | Integration costs — integration costs are the severance and retention bonuses for certain employees relating to the Epocrates acquisition. Accordingly, these costs are not considered by management in making operating decisions, and management believes that such expenses do not have a direct correlation to future business operations. Management does not believe such charges accurately reflect the performance of the Company’s ongoing operations for the period in which such charge is incurred. |
| |
| • | Transaction costs — transaction costs are non-recurring costs related to specific transactions. Accordingly, these costs are not considered by management in making operating decisions, and management believes that such expenses do not have a direct correlation to future business operations. Management does not believe such charges accurately reflect the performance of the Company’s ongoing operations for the period in which such charge is incurred. |
Supplemental Metrics and Definitions
|
| | | | | | | | | | | | | |
| | | | Fiscal Year 2012 | | Fiscal Year 2013 |
| | | | |
| | | | Q1 |
| Q2 |
| Q3 |
| Q4 |
| | Q1 |
|
| Client Base | | | | | | | | |
| Total Physicians on athenaCollector | | 24,101 |
| 25,001 |
| 27,013 |
| 28,011 |
| | 28,850 |
|
| Total Providers on athenaCollector | | 33,923 |
| 35,409 |
| 38,145 |
| 39,752 |
| | 40,937 |
|
| Total Physicians on athenaClinicals | | 5,331 |
| 6,151 |
| 7,340 |
| 7,949 |
| | 8,776 |
|
| Total Providers on athenaClinicals | | 7,402 |
| 8,558 |
| 10,062 |
| 10,926 |
| | 12,139 |
|
| Total Physicians on athenaCommunicator | | 4,820 |
| 6,306 |
| 8,739 |
| 10,153 |
| | 11,840 |
|
| Total Providers on athenaCommunicator | | 6,800 |
| 8,642 |
| 12,149 |
| 14,065 |
| | 16,296 |
|
| | | | | | | | | |
| Client Performance | | | | | | | | |
| Client Satisfaction | | | 86.3 | % | 89.8 | % | 87.2 | % | 87.2 | % | | 88.2 | % |
| Client Days in Accounts Receivable (DAR) | | 40.0 |
| 38.2 |
| 37.6 |
| 36.4 |
| | 37.6 |
|
| First Pass Resolution (FPR) Rate | | 91.3 | % | 92.9 | % | 93.7 | % | 94.2 | % | | 93.9 | % |
| Electronic Remittance Advice (ERA) Rate | | 78 | % | 77.7 | % | 79.8 | % | 81.7 | % | | 81.8 | % |
| Total Claims Submitted | | 17,839,150 |
| 17,467,447 |
| 17,706,432 |
| 20,055,715 |
| | 20,732,485 |
|
| Total Client Collections ($) | | 2,081,686,428 |
| 2,259,202,690 |
| 2,302,527,259 |
| 2,540,153,162 |
| | 2,566,960,419 |
|
| Total Working Days | | | 62 |
| 64 |
| 63 |
| 62 |
| | 61 |
|
| | | | | | | | | |
| Employees | | | | | | | | |
| Direct | | | 1,080 |
| 1,192 |
| 1,282 |
| 1,363 |
| | 1,365 |
|
| Sales & Marketing | | | 295 |
| 315 |
| 341 |
| 353 |
| | 358 |
|
| Research & Development | | 292 |
| 357 |
| 375 |
| 402 |
| | 429 |
|
| General & Administrative | | 187 |
| 196 |
| 205 |
| 222 |
| | 235 |
|
| Total Employees | | | 1,853 |
| 2,060 |
| 2,202 |
| 2,339 |
| | 2,386 |
|
| | | | | | | | | |
| Quota Carrying Sales Force | | | | | | | |
| Total Quota Carrying Sales Representatives | | 105 |
| 109 |
| 112 |
| 114 |
| | — |
|
|
| |
| Supplemental Metrics Definitions | |
| | |
| Client Base | |
| Total Physicians on athenaCollector | The number of physicians that have rendered a service which generated a medical claim that was billed during the last 91 days on the athenaCollector platform. Examples of physicians include Medical Doctors (MD) and Doctor of Osteopathic Medicine (DO). |
| Total Providers on athenaCollector | The number of providers, including physicians, that have rendered a service which generated a medical claim that was billed during the last 91 days on the athenaCollector platform. Examples of non-physician providers are Nurse Practitioners (NP) and Registered Nurses (RN). |
| Total Physicians on athenaClinicals | The number of physicians that have rendered a service through the athenaClinicals platform which generated a medical claim that was billed during the last 91 days on the athenaCollector platform. |
| Total Providers on athenaClinicals | The number of providers, including physicians, that have rendered a service through the athenaClinicals platform which generated a medical claim that was billed during the last 91 days on the athenaCollector platform. |
| Total Physicians on athenaCommunicator | The number of physicians that have rendered a service which generated a medical claim that was billed during the last 91 days on the athenaCollector platform and whose practice is actively using athenaCommunicator. |
| Total Providers on athenaCommunicator | The number of providers, including physicians, that have rendered a service which generated a medical claim that was billed during the last 91 days on the athenaCollector platform and whose practice is actively using athenaCommunicator. |
| | |
| Client Performance | |
| Client Satisfaction | The percentage of athenaCollector clients who chose 4 or 5 on a scale of 1 to 5 when asked if they would recommend athenahealth to a trusted friend or colleague. These responses are generated from a “client listening” survey that the company conducts for its client base twice per year. |
| Client Days in Accounts Receivable (DAR) | The average number of days that it takes outstanding balances on claims to be resolved, e.g. paid, for clients on athenaCollector. Clients that have been live less than 90 days are excluded, as well as clients who are terminating services. |
| First Pass Resolution (FPR) Rate | Approximates the percentage of primary claims that are favorably adjudicated and closed after a single submission during the period. Currently, the FPR rate is calculated on a monthly basis, and certain practices are excluded (e.g. those that have been live for less than 90 days). |
| Electronic Remittance Advice (ERA) Rate | Remittance refers to the information about payments (a/k/a explanations of benefits) received from insurance companies during the period. The ERA rate reflects the percentage of total charges that were posted using electronic remittance. |
| Total Claims Submitted | The number of claims billed through athenaNet during the period. |
| Total Client Collections | The dollar value of collections posted on behalf of clients during the period. |
| Total Working Days | The total number of days during the quarter minus weekends and U.S. Post Office holidays. |
| | |
| Employees | |
| Direct | The total number of full time equivalent individuals (FTEs) employed by the Company to support its service operations as of quarter end. This team includes production systems, enrollment services, paper claim submission, claim resolution, clinical operations, professional services, account management, and client services. |
| Sales & Marketing | The total number of FTEs employed by the Company to support its sales and marketing efforts as of quarter end. This team includes sales representatives, business development staff and the marketing team. |
| Research & Development | The total number of FTEs employed by the Company to support its research and development efforts as of quarter end. This team includes product development and product management. |
| General & Administrative | The total number of FTEs employed by the Company to support its general and administrative functions as of quarter end. This team includes finance, human resources, compliance, learning and development, internal audit, corporate technology, recruiting, facilities, and legal. |
| Total Employees | The total number of FTEs employed by the Company as of quarter end. This number excludes interns and seasonal employees. |
|
| |
| Corporate Scorecard Metrics Definitions |
| | |
| Stability | |
| Headcount - Role Vacancy | Percentage of unfilled headcount as compared to our quarterly forecasts. |
| Corporate Citizenship | Percentage of compliance tasks that are met within the deadline. |
| Employee Engagement | Quarterly engagement survey results for employees. |
| | |
| Performance | |
| Client Days in Accounts Receivable (DAR) | The average number of days that it takes outstanding balances on claims to be resolved, e.g. paid, for clients on athenaCollector. Clients that have been live less than 90 days are excluded, as well as clients who are terminating services. |
| Total Automation Rate | Percentage of major clinicals and revenue cycle management transactions that were sent or received in a structured electronic format. |
| Client Collection Rate | The percentage of charges that are not written off to bad debt. |
| | |
| Satisfaction | |
| Provider Documentation Time per Appointment | The average number of minutes athenaClinicals providers spend on the computer documenting the exam and orders for each appointment. Providers that have been live less than 90 days are excluded. |
| Days of Client Work | The outstanding work that clients have in clinicals and revenue cycle. For clinicals, the total stock of work on the clinicals dashboard divided by the average daily inflow of tasks. For revenue cycle, the days in accounts receivable relating to work that needs to be resolved by the client. |
| Client Satisfaction | The percentage of clients who chose 4 or 5 on a scale of 1 to 5 when asked if they would recommend athenahealth to a trusted friend or colleague. These responses are generated from a "client listening" survey that the company conducts for its client base twice per year. |
| athenaClinicals Penetration | athenaClinicals physicians as a percentage of total athenaCollector physicians. |
| | |
| Financial | |
| Bookings | The annualized value of deals sold (excluding Epocrates). |
| Total Revenue | Total revenue (excluding Epocrates). |
| Non-GAAP Adjusted Operating Income | Total non-GAAP adjusted operating income (excluding Epocrates). |