First Quarter Fiscal Year 2014 
Prepared Remarks April 17, 2014
Jonathan Bush, Chairman & Chief Executive Officer
Tim Adams, Senior Vice President & Chief Financial Officer
About These Remarks
The following commentary is provided by management in conjunction with the first quarter fiscal year 2014 earnings press release issued by athenahealth, Inc. (“athenahealth” or “we”). These remarks represent management’s current views on our financial and operational performance and are provided to give investors and analysts more time to analyze and understand our performance in advance of the earnings conference call. These prepared remarks will not be read on the conference call. A complete reconciliation between generally accepted accounting principles “GAAP” and non-GAAP results, as well as a summary of supplemental metrics and definitions, is provided in the tables following these prepared remarks.
Earnings Conference Call Information
To participate in our live conference call and webcast, please dial 877-853-5645 (or 408-940-3868 for international calls) using conference code No.11893618, or visit the Investors section of our web site at www.athenahealth.com. A replay will be available for one week following the conference call at 855-859-2056 (and 404-537-3406 for international calls) using conference code No. 11893618. A webcast replay will also be archived on our website.
Safe Harbor and Forward-Looking Statements
These remarks contain forward-looking statements, which are made pursuant to the safe harbor provisions of the Private Securities Litigation Reform Act of 1995, including statements reflecting management’s expectations for future financial and operational performance and operational expenditures, expected growth, and business outlook; statements regarding our research and development efforts and product offering and upgrade plans and timelines; the benefits of and anticipated operational results from our service offerings and demands for our service offerings; the further integration of our services and the resulting benefits; changes in the types of providers and health care entities we serve and the range of tasks we perform for clients; our sales, marketing and partnering activities and plans; the benefits of integrating with partners and anticipated operational results from partners’ service offerings; the integration of Epocrates and building of new functionalities such as the Drug Monograph Alerts and Secure Text Messaging and integration of existing functionality with our EHR; customer and client behavior and preferences, and implementation of services for new clients and deals, including our expansion into the enterprise segment; our market position and awareness among physicians; the potential for cross-sales among service offerings and sales involving multiple services; our implementation pipeline and expectations on new deals and network growth; the expansion of the number of users of our services; our plans and readiness in regard to ICD-10 and Stage 2 of Meaningful Use; changes in the industry, including an increased emphasis on coordinated care; the creation of a sustainable market for health information exchange, an ecosystem of developers and third-party service providers, and a national health IT network; our progress and plans on the new athenaNet® experience (f/k/a athenaX) project, athenaCoordinator® Enterprise offering, and population health services; and statements found under our “Reconciliation of Non-GAAP Financial Measures to Comparable GAAP Measures” section of these remarks. Forward-looking statements may often be identified with words such as “we expect”, “we anticipate”, “upcoming” or similar indications of future expectations. These statements are neither promises nor guarantees, and are subject to a variety of risks and uncertainties, many of which are beyond our control, which could cause actual results to differ materially from those contemplated in these forward-looking statements. In particular, the risks and uncertainties include, among other things: our fluctuating operating results; our variable sales and implementation cycles, which may result in fluctuations in its quarterly results; risks associated with the acquisition and integration of companies and new technologies, including those related to our ability to successfully scale the athenaCoordinator services, those related to our ability to integrate the services and offerings of Epocrates and realize the expected benefits such as increased awareness among physicians of our overall services and offerings; risks associated with our ability to realize the expected benefits from the purchase of the Arsenal on the Charles campus in Watertown, Massachusetts;
1
risks associated with our expectations regarding our ability to maintain profitability; the impact of increased sales and marketing expenditures, including whether increased expansion in revenues is attained and whether impact on margins and profitability is longer term than expected; changes in tax rates or exposure to additional tax liabilities; the highly competitive industry in which we operate and the relative immaturity of the market for our service offerings; and the evolving and complex governmental and regulatory compliance environment in which we and our clients operate. Existing and prospective investors are cautioned not to place undue reliance on these forward-looking statements, which speak only as of the date hereof. We undertake no obligation to update or revise the information contained in these remarks, whether as a result of new information, future events or circumstances, or otherwise. For additional disclosure regarding these and other risks faced by us, see the disclosures contained in our public filings with the Securities and Exchange Commission (“SEC”), available on the Investors section of our website at www.athenahealth.com and on the SEC’s website at www.sec.gov.
Use of Non-GAAP Financial Measures
These remarks contain non-GAAP financial measures, as defined by SEC Regulation G. The GAAP financial measure most directly comparable to each non-GAAP financial measure used or discussed, and a reconciliation of the differences between each non-GAAP financial measure and the comparable GAAP financial measure, are included following these prepared remarks or can be found within our first quarter fiscal year 2014 earnings press release in the Investors section of our web site at www.athenahealth.com.
Opening Remarks
The athenahealth team continued to execute against our ever-expanding goals in Q1 2014. We added 2,674 providers onto the network, further increased penetration of athenaClinicals® into our enterprise segment, and signed our first athenaCoordinator Enterprise clients. Our vision is bold and big - to become the health care internet - and the athenahealth team remains singularly focused on achieving this vision.
Highlights from Q1 2014 include the following:
• | Grew consolidated revenue by 30% and athenahealth-branded revenue by 23% over Q1 2013 |
| • | Grew net new active physicians on athenaCollector® (1,805 physicians added), athenaClinicals (1,133 physicians added), and athenaCommunicator® (2,514 physicians added) in Q1 2014 |
| • | Grew athenaCollector physicians by 31% over Q1 2013, representing the highest network growth rate since 2009 |
| • | Completed implementations at Riverside Medical Group (athenaCollector) and Medical Professional Services (athenaCoordinator - Population Health Management) |
| • | Unveiled our newest service offering for hospitals and health systems, athenaCoordinator Enterprise, at the 2014 Healthcare Information and Management Systems Society (“HIMSS”) Annual Conference and Exhibition |
| • | Signed our first two athenaCoordinator Enterprise clients: Steward Medical Group and Griffin Hospital |
| • | Announced three large athenaOne® deals: Privia Medical Group (~154 providers), Saint Peter’s Healthcare System (~182 providers), and Phoebe Physician Group (~260 providers) |
| • | Embedded select drug monograph content from Epocrates’ valued and trusted, EpocratesRx®, directly within athenaClinicals |
Results Overview
athenahealth’s top line results for the first quarter of fiscal year (“FY”) 2014 reflect solid revenue growth:
| • | Total revenue: |
| ◦ | $163.0 million in Q1 2014, representing 30% growth over $125.6 million in Q1 2013 |
2
| ▪ | athenahealth-branded revenue was $148.2 million in Q1 2014, representing 23% growth |
| ▪ | Epocrates-branded revenue was $10.6 million |
| ▪ | Other revenue was $4.2 million |
Our bottom line results for Q1 2014, consistent with our growth strategy, demonstrate strong sales, marketing, and research and development investments, and a focus on operating efficiencies:
| • | Non-GAAP Adjusted Gross Profit: |
| ◦ | $97.4 million, or 59.8% of total revenue, in Q1 2014, an increase of 28% over $75.9 million, or 60.4% of total revenue, in Q1 2013 |
| • | GAAP selling and marketing expense: |
| ◦ | $43.2 million, or 26.5% of total revenue, in Q1 2014, an increase of 31% over $32.9 million, or 26.2% of total revenue, in Q1 2013 |
| • | GAAP research and development expense: |
| ◦ | $15.2 million, or 9.3% of total revenue, in Q1 2014, an increase of 27% over $11.9 million, or 9.5% of total revenue, in Q1 2013 |
| • | GAAP general and administrative expense: |
| ◦ | $29.4 million, or 18.0% of total revenue, in Q1 2014, a decrease of 6% from $31.1 million, or 24.7% of total revenue, in Q1 2013 |
| • | Non-GAAP Adjusted EBITDA: |
| ◦ | $22.6 million, or 13.9% of total revenue, in Q1 2014, an increase of 29% from $17.6 million, or 14.0% of total revenue, in Q1 2013 |
| • | Non-GAAP Adjusted Operating Income: |
| ◦ | $8.7 million, or 5.4% of total revenue, in Q1 2014, a decrease of 7% from $9.4 million, or 7.5% of total revenue, in Q1 2013 |
| • | Non-GAAP Adjusted Net Income: |
| ◦ | $4.4 million, or $0.12 per diluted share, in Q1 2014, a decrease of 69% from $14.2 million, or $0.38 per diluted share, in Q1 2013 |
| ◦ | For 2014, we are using a non-GAAP tax rate of 40% to normalize the tax impact to our Non-GAAP Adjusted Net Income per Diluted Share based on the fact that a relatively small change in pre-tax GAAP income could result in a volatile GAAP effective tax rate. If this approach had been used in 2013, our Q1 2013 Non-GAAP Adjusted Net Income per Diluted Share would have been $0.15 instead of $0.38. |
3
We measure our performance based on a balanced scorecard model. We believe that this framework is an excellent report card for our performance for the current year and that it measures the key performance indicators required for long-term success. The table below shows the scorecard results for Q1 2014. For certain metrics (i.e., Provider Documentation Time and Days of Client Work), our goal is to improve our performance by effectively reducing the scorecard metrics results throughout the year.
| Q1 2014 Results | ||
| Stability (10% weight) | ||
| Voluntary Turnover | 2.3 | % |
| Corporate Citizenship | 92.5 | % |
| Employee Engagement | 4.1 | |
| Stability Results | 101 | % |
| Performance (35% weight) | ||
| Total Automation Rate | 48.2 | % |
| Net On-boarding Success | 66.6 | % |
| Patient Full Registration | 49.5 | % |
| Performance Results | 103 | % |
| Satisfaction (25% weight) | ||
| Net Promoter Score | 44.7 | |
| Days of Client Work | 8.8 | |
| Provider Documentation Time | 5.4 | |
| Minutes per RVU | 11.7 | |
| Satisfaction Results | 92 | % |
| Financial (30% weight) | ||
| Bookings (a) | (a) | |
| Total Revenue ($M) | $163.0 | |
| Non-GAAP Adjusted Operating Income ($M) | $8.7 | |
| # Physicians on the Network | 296,477 | |
| Financial Results | 99 | % |
| Total Results | 99 | % |
| (a) | Since the bookings metric contains highly sensitive data, we do not disclose all of the specific performance measures and targets, because we believe that such disclosure would result in serious competitive harm. |
We believe that our underlying drivers of long-term success remain strong as supported by the following metric results:
• | Employee Engagement at 4.1 out of 5.0 in Q1 2014, versus goal of 4.1 and Q1 2013 actual result of 4.0 |
• | Total Automation Rate of 48.2% in Q1 2014, ahead of our goal of 47.0% |
• | Net On-boarding Success of 66.6% in Q1 2014, shy of our goal of 70.0% |
4
| • | Patient Full Registration of 49.5% in Q1 2014 , ahead of our goal of 45.0% |
| • | Net Promoter Score of 44.7 in Q1 2014, versus goal of 47.3 |
| • | Days of Client Work of 8.8 days in Q1 2014, versus goal of 8.0 days |
• | Provider Documentation Time per Appointment of 5.4 minutes in Q1 2014, versus goal of 5.0 minutes and Q1 2013 actual result of 5.1 minutes |
| • | Minutes per RVU of 11.7 minutes in Q1 2014, versus goal of 11.5 minutes |
athenahealth’s client base continues to expand while client adoption of other services in the athenahealth service suite grows. As our client base expands outside the traditional ambulatory market, we believe that total active providers, or nodes, on our network will become a more appropriate metric to use in measuring our market share. During Q1 2014:
| • | 78% of all new athenaCollector deals included athenaClinicals, compared to 79% in Q1 2013 |
• | 75% of all new athenaCollector deals included athenaClinicals and athenaCommunicator, compared to 69% in Q1 2013. Additionally, 75% of all new athenaOne deals sold during Q1 2014 also included athenaCoordinator Core, compared to 69% in Q1 2013 |
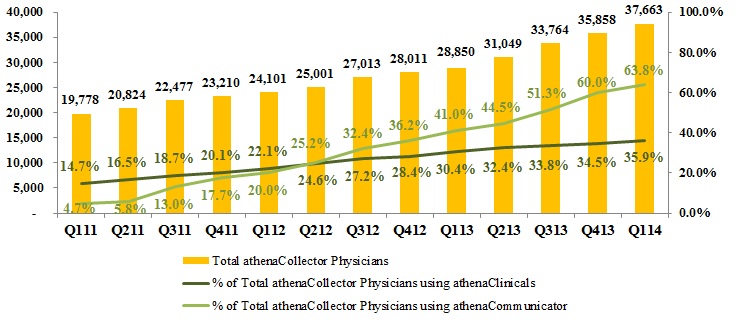
| • | 36% of total athenaCollector physicians have adopted athenaClinicals, up from 30% in Q1 2013 |
| • | 64% of total athenaCollector physicians have adopted athenaCommunicator, up from 41% in Q1 2013 |
• | Net new physicians and providers added sequentially to the network were as follows: |
| athenaCollector | athenaClinicals | athenaCommunicator | ||||||||||||
| Active physicians and providers: | Physicians | Providers | Physicians | Providers | Physicians | Providers | ||||||||
| Beginning balance as of 12/31/13 | 35,858 | 50,212 | 12,388 | 16,805 | 21,516 | 28,360 | ||||||||
| Net new additions | 1,805 | 2,674 | 1,133 | 1,538 | 2,514 | 3,347 | ||||||||
| Ending balance as of 3/31/14 | 37,663 | 52,886 | 13,521 | 18,343 | 24,030 | 31,707 | ||||||||
| Sequential growth % | 5 | % | 5 | % | 9 | % | 9 | % | 12 | % | 12 | % | ||
| • | Net new physicians and providers added to the network since Q1 2013 were as follows: |
| athenaCollector | athenaClinicals | athenaCommunicator | ||||||||||||
| Active physicians and providers: | Physicians | Providers | Physicians | Providers | Physicians | Providers | ||||||||
| Beginning balance as of 3/31/13 | 28,850 | 40,937 | 8,776 | 12,139 | 11,840 | 16,296 | ||||||||
| Net new additions | 8,813 | 11,949 | 4,745 | 6,204 | 12,190 | 15,411 | ||||||||
| Ending balance as of 3/31/14 | 37,663 | 52,886 | 13,521 | 18,343 | 24,030 | 31,707 | ||||||||
| Y/Y growth % | 31 | % | 29 | % | 54 | % | 51 | % | 103 | % | 95 | % | ||
athenaCollector network performance metrics were as follows for Q1 2014:
• | $3,172,115,234 posted in total client collections, up 23.6% from Q1 2013 |
• | 25,785,710 total claims submitted, up 24.4% from Q1 2013 |
• | 82.3% electronic remittance advice (“ERA”) rate, up 0.5 points from 81.8% at Q1 2013 |
• | 93.5% first pass resolution (“FPR”) rate, down 0.4 points from 93.9% at Q1 2013 |
| • | 41.1 average client days in accounts receivable (“DAR”), up 3.5 days from 37.6 days at Q1 2013 |
5
Revenue Discussion
Q1 2014 revenue was $163.0 million and grew by 30% (or $37.4 million) over Q1 2013. athenahealth-branded revenue for Q1 2014 was $148.2 million and grew by 23% over prior year.
| Q1 2014 | Q1 2013 | Y/Y Growth% | ||
| athenahealth-branded | $148.2 | $120.1 | 23 | % |
| Epocrates-branded | $10.6 | $5.5 | 93 | % |
| Other | $4.2 | $0.0 | n/a | |
| Consolidated | $163.0 | $125.6 | 30 | % |
In terms of trends in our recurring revenue base, same-store analysis of claims created—a proxy for physician office utilization—indicates that physician office activity in Q1 2014 increased slightly over physician office activity during Q1 2013. However, our analysis showed a slight decrease in physician office activity in Q1 2014 compared to Q4 2013, which was unexpected because we did not see a similar decrease from Q4 2012 to Q1 2013. The decrease in claim activity in Q1 2014 may be due to the sustained inclement weather experienced across much of the country during Q1 2014.
Non-GAAP Adjusted Gross Margin Discussion
Our Non-GAAP Adjusted Gross Margin was 59.8% for Q1 2014, down approximately 60 basis points from 60.4% in Q1 2013. One of our goals is to improve gross margin on a service-line basis each year. As previously discussed, the expansion of our newer service offerings, such as athenaCoordinator Enterprise, will serve as a headwind to total company margin expansion until these new services become more automated and scalable.
Balance Sheet and Cash Flow Highlights
As of March 31, 2014, we had cash and cash equivalents of $51.3 million and outstanding indebtedness of $220.0 million. Operating cash flow increased by $19.6 million from net cash used in operating activities of $5.5 million for the three months ended March 31, 2013, to net cash provided by operating activities of $14.1 million for the three months ended March 31, 2014.
Fiscal Year 2014 Outlook
athenahealth is not making any changes to the fiscal year 2014 guidance we presented at our 6th Annual Investor Summit on December 12, 2013.
| For the Fiscal Year Ending December 31, 2014 | |
| Forward Looking Guidance | |
| GAAP Total Revenue | $725 - $755 million |
| Non-GAAP Adjusted Gross Margin | 62.5% - 63.5% |
| Non-GAAP Adjusted Operating Income | $70 - $80 million |
| Non-GAAP Adjusted Net Income per Diluted Share | $0.98 - $1.10 |
| Non-GAAP Tax Rate | 40% |
6
Product Development Discussion
Product development at athenahealth is organized around our mission to be caregivers’ most trusted service, helping them do well doing the right thing. In order to fulfill this goal, we deliver services backed by cloud-based software, proprietary knowledge, and robust back-office services.
athenaCollector service offering
athenaCollector is our cloud-based medical billing and practice management solution. It is the foundation of our service portfolio and entered general availability in 2000.
While the deadline for the next big change in health care compliance, the International Statistical Classification of Diseases and Related Health Problems, 10th Revision (“ICD-10”), has been delayed until at least October 1, 2015, athenahealth and its clients have been and continue to be prepared for the ICD-10 transition. Our cloud-based software has been updated for ICD-10 since February 2014 and available to every caregiver on our network at once. Throughout Q1 2014, our payer outreach team continued to review payers’ ICD-10 readiness status and was focused on obtaining ICD-10 testing arrangements with targeted payers, who together represent approximately 88% of total athenaNet claim volume. The resounding message is that athenahealth was not only ready for the October 1, 2014, transition but will be long-ready for the October 1, 2015 delayed transition. Furthermore, we will continue to monitor the industry and work with payers and other industry participants as they adjust their testing and remediation plans. No matter the deadline, through our ICD-10 readiness center and behind the scenes work, the athenahealth team will support a seamless transition to ICD-10 or what we are calling a “business as usual” experience for our clients.
athenahealth remains focused on helping caregivers get paid more, faster, and with less work. To this end, we are keeping up with trends in the shifts in patient responsibility and are rolling out digital check-in partners through our More Disruption Please program. In addition to improving self-pay yield, these digital check-in partners will improve the check-in process, enable practices to gather more complete and accurate patient information, and will improve satisfaction for our clients and their patients. We are currently working with four digital check-in partners and expect to generally release these capabilities in 2014.
athenaClinicals service offering
athenaClinicals is our cloud-based electronic health record (“EHR”) management service. It entered general availability in 2006 and was made available as a stand-alone service in 2010.
Together, the athenahealth and Epocrates teams are focused on connecting caregivers with high-value resources during moments of care. One of our core competencies is to combine software, knowledge, and work to provide situational awareness at the point of care. We are thrilled to announce that athenaClinicals providers can now leverage the power of Epocrates directly within athenaClinicals. As of February 22, 2014, select drug monograph content from Epocrates’ valued and trusted drug reference tool, Epocrates Rx®, is now available as part of athenaClinicals. As part of a new workflow, athenaClinicals providers gain streamlined access to valuable information on dosing, contraindications, adverse reactions, and other key safety information for thousands of brand and generic drugs without having to leave their EHR interface. Additional sections of Epocrates’ drug monographs will be introduced into athenaClinicals over time.
January 1, 2014 marked the commencement of the first Stage 2 Meaningful Use (MU) reporting period and athenahealth is working closely with our athenaClinicals clients to attest to MU early in the year. We utilize a unique approach that will help our clients achieve Stage 2 MU success and allow us to once again deliver industry-leading attestation results. The athenahealth team can monitor the MU performance of every single one of our caregivers across all of the Stage 2 MU measures by accessing our cloud-based
7
platform. This visibility allows us to improve our software, make providers constantly aware of how well they are tracking against the measures, and provide necessary coaching to help our providers reach the all-important milestone of Stage 2 MU attestation.
Formerly known as “athenaX”, the new athenaNet experience will deliver a radically more beautiful experience to our users that is simple, elegant, and purposeful. The new athenaNet experience will provide our clients with a refined look, more intuitive navigation, and a redesigned home page for all users. In addition, a component of the new athenaNet experience includes a reimagined provider experience, which makes available both a classic view and a streamlined view of the clinical chart and encounter. This important initiative delivers a provider experience that engenders trust and is more supportive, less intrusive, and drives caregivers to the most efficient and effective behaviors. We are delighted we are on track with our release schedule and plan to release the new athenaNet experience to all users this fall. In addition, all athenaClinicals users, regardless of specialty, will have access to both the classic view and the streamlined view of the chart and the encounter with the release. However, it is important to note that some of the functionality needed for specific specialties will only be available in the classic view of the encounter. By the end of 2014, the streamlined encounter will be fine-tuned for internal medicine. During 2015, we will continue to fine-tune the streamlined clinical encounter for additional specialties. This initiative underscores the power of our cloud-based business model. We are delivering one system, one data store, and one clinical chart across two views, the classic view and the streamlined view. All athenaClinicals providers will be able to view both the streamlined and classic encounters and will be able to seamlessly transition between both views.
athenaCommunicator service offering
athenaCommunicator is our cloud-based patient communication management service. It entered general availability in 2010 and, at this time, requires adoption of athenaCollector or athenaClinicals.
The athenaCommunicator team continues to make progress on important initiatives aimed to drive patient engagement, improve patient access, and boost schedule density. During Q1 2014, we released the newest component of our patient engagement service focusing on population health. We are scheduled to launch fifteen population health campaigns in 2014. These population health campaigns enable our athenaOne clients to successfully stratify patients, identify care gaps, boost schedule density, and foster improved health outcomes. In addition, these clinically-driven campaigns assist in engaging patients to improve the role they play in managing their own health. We launched five of these campaigns in Q1 2014 focusing on influenza vaccinations, Medicare Annual Wellness Visits, diabetes (overdue HbA1C or LDL-C screening), hypertension (uncontrolled blood pressure), and colorectal cancer screenings. The next wave of population health campaigns to be launched in Q2 2014 includes Medicare pelvic examinations, adult annual preventive visits, breast cancer screenings, and diabetes (uncontrolled HbA1c>9% or LDL-C>100). The combination of these population health campaigns and our enhanced GroupCall service allows our athenaOne clients to identify patients with gaps in care and reach out to these patients and schedule appointments. Patient engagement is an active collaboration between patients and their providers, and is essential to improving the patient experience, advancing population health, and reducing costs. The patient portal is the best tool in the athenaCommunicator service for supporting this type of interaction with patients. The athenaCommunicator team has improved workflows and simplified patient access in order to enhance the patient portal’s usability and increase its adoption. These improvements include switching to a web standard login as well as streamlining secure access for both the patient and his/her health care proxy. Later this year, the athenaCommunicator team will introduce additional capabilities to enable a unified patient engagement experience across the health system network. These capabilities include supporting both single sign-on and MU Stage 2 patient engagement requirements for the inpatient setting.
Key Metrics as of Q1 2014:
8
• | Provider adoption rate of 60%, as compared to 56% in Q4 2013 and 40% in Q1 2013. |
• | athenaCommunicator delivered over 42.6 million automated messages during Q1 2014 across our active patient base of over 17.7 million patients. |
• | Patient portal adoption has increased by 19% since Q4 2013 to 3.0 million patients registered as of Q1 2014. |
• | athenaCommunicator collected $13.0 million in self-pay collections during Q1 2014 via the patient portal and our live operator service, an increase of 83% over the Q1 2013 self-pay collections of $7.1 million. |
athenaCoordinator service offerings
Our athenaCoordinator service offerings include athenaCoordinator Core, athenaCoordinator Analytics, and athenaCoordinator Enterprise. athenaCoordinator Core is a cloud-based order transmission service for all receiver types and physicians using athenaClinicals. athenaCoordinator Core entered general availability in 2012. athenaCoordinator Analytics is a cloud-based business intelligence service for health care professionals. athenaCoordinator Analytics has been generally available since 2004 through Anodyne Health Partners, Inc., which athenahealth acquired in October of 2009. athenaCoordinator Enterprise is our cloud-based clinical integration and patient access service designed to enhance physician and patient loyalty by ensuring successful care transitions.
We officially announced our newest service for hospitals and health systems, athenaCoordinator Enterprise, at the HIMSS14 Annual Conference & Exhibition in February 2014. athenaCoordinator Enterprise combines the power of cloud-based software, knowledge, and services to offer hospitals and health systems a fully supported, end-to-end way to activate patients, coordinate care, and analyze the clinical and financial aspects of that care. Through a combination of clinical integration and patient access services, athenaCoordinator Enterprise delivers a full suite of capabilities not found as part of any of today’s inpatient EHR systems. Also, athenaCoordinator Enterprise can be overlaid across multiple HIT systems to enable providers to share clinical briefings with other providers using different EHRs, an essential capability given that a significant amount of care is referred by out-of-network providers. athenaCoordinator Enterprise provides physicians and patients with a fully integrated medical record, complete clinical and financial transparency, and a red carpet online experience across the health system. The athenahealth network provides functionality that eliminates the need for health systems to purchase master patient index software, enterprise scheduling tools, health information exchange platforms, patient access portals, physician access portals, or analytics software. Because all fees for athenaCoordinator Enterprise are outcome-based and paid out of operating savings and increased revenue, health systems will enjoy all of these benefits and capabilities without any upfront expenditures. We reached our first major athenaCoordinator Enterprise milestone by signing Steward Medical Group and Griffin Hospital as our first clients. athenahealth will work closely with Steward Medical Group, Griffin Hospital, and future co-development partners to build out the complete service offering. The addition of athenaCoordinator Enterprise to our suite of cloud-based services further demonstrates that we are becoming the leader in population health, interoperability, patient activation, and care coordination.
Epocrates service offerings
Epocrates is recognized for developing the #1 medical application among U.S. physicians for clinical content, practice tools, and health industry engagement at the point of care. Epocrates has established a loyal network of more than one million health care professionals, including approximately 50 percent of U.S. physicians, who routinely use its intuitive solutions to help streamline workflow and improve patient care. For more information, please visit www.epocrates.com. Epocrates was acquired by athenahealth on March 12, 2013.
9
We remain singularly focused on keeping Epocrates the #1 source of content for helping caregivers make efficient and confident decisions. In January 2014, Epocrates launched drug monograph messaging which brings even more timely, contextual content to clinicians when they are viewing a drug profile in the Epocrates application. Monograph messages, delivered via the Epocrates app, promote drug information about dosing, safety information, and financial assistance programs. These Epocrates-approved messages will appear from content partners, pharmaceutical companies, and health plans with vital information that can impact clinical decisions during a patient encounter. We launched the first message in January 2014 and currently have fifteen messages live. In February 2014, Epocrates launched enhanced drug interaction features to further improve a provider’s access to information at the moment of care. Epocrates has upgraded both its drug monographs and its InteractionCheck®, the most valued feature affecting prescribing changes. Through the enhanced drug interaction features in the Epocrates App, health care providers now have access to advanced, detailed profiles of a drug’s interaction potential and risks in order to assist them in making better informed clinical decisions for their patients. During 2014, we will be working on several initiatives to expand the Epocrates business and to establish a clear and compelling onramp for the Epocrates user base onto athenahealth’s services. These initiatives will include an Epocrates/athenahealth brand strategy, an enhanced and unified user experience, secure text messaging and provider directory, and patient engagement campaigns. We are only just beginning to demonstrate the exciting potential that has been created by the combination of Epocrates and athenahealth.
Business Development Update
More Disruption Please (“MDP”)
Our MDP team was very busy in Q1 2014 evangelizing our mission and desire to launch a massive surge of disruptive innovation in the health care space. Our MDP team carried this message to the 32nd Annual J.P. Morgan Healthcare Conference in San Francisco, the HIMSS conference in Orlando, and the South by Southwest (“SXSW”) Interactive Festival in Austin. The team successfully attracted new MDP partners to the ecosystem, evaluated potential partners, and raised general awareness regarding our unique program across the health care IT community. During an event at the J.P. Morgan Healthcare Conference, the team launched our MDP code of conduct which pledges to increase and to incent competition and innovation in health care. athenahealth and scores of MDP ecosystem affiliates have made the following common pledge:
| 1. | Client data will not be held hostage! We guarantee interoperation with each other. MDP member companies strive to connect through monitored application programming interfaces (“API”) and global interfaces and provide them to our clients at no cost...ever. |
| 2. | We know what outcomes-oriented performance means and promise to share it. We will continually monitor how we perform for you and will work to report it out to you in real time. |
| 3. | If we don’t perform, we don’t mind being fired. Contracts with MDP members are at will. Give us prior notice and we will remove ourselves. In fact, we will help you move your data to whomever you use to replace us within the MDP network. |
athenahealth has always been focused on being an open platform. We believe that through this program and this pledge, we can connect key participants in the health care space and foster efficient creation and deployment of new technologies. Amazon is making it happen in the retail space and athenahealth’s MDP program is bringing it to health care. To this end, our MDP team was on site at SXSW along with Mashery, the world’s leading provider of API Management technology and services, to demonstrate several partners’ API innovations. Through this work with Mashery, athenahealth is unleashing turn-key connectivity to our cloud-based platform of HIT services and to our national provider network. After successfully building APIs for scheduling and digital check-in, the MDP team is now reaching out to our ecosystem of partners to help us prioritize the next wave of APIs. To learn more about our MDP program
10
and partnership opportunities and to explore the athenahealth Marketplace, please visit www.athenahealth.com/disruption.
Client Base Discussion
The total number of physicians who have gone live on athenaCollector, our core service offering, is the metric we currently use to define our client base and market share. However, as our client base expands outside the traditional ambulatory market, total active providers—or nodes on our network—will become a more appropriate metric used to define our client base and market share.
During Q1 2014, 78% of all new athenaCollector deals included athenaClinicals, down slightly from 79% in Q1 2013. 75% of all new athenaCollector deals included athenaCommunicator and athenaClinicals. Additionally, 75% of all new athenaOne deals also included athenaCoordinator Core. The athenaOne rate of 75% in Q1 2014 compares to 69% in Q1 2013. Among “live” (i.e., implemented and active) athenaCollector clients, adoption of athenaClinicals and athenaCommunicator continues to grow rapidly and resulted in continued growth to our installed base across all of our service offerings.
athenahealth Service Offering Adoption
athenaCollector Clients
During Q1 2014, total active physicians on athenaCollector grew by 31% year-over-year, to 37,663. On a sequential basis, we added 1,805 net new active physicians on athenaCollector, versus 839 in Q1 2013. Our quarterly net new physician additions may vary widely due to the number and size of clients that go live in a particular quarter. Furthermore, our larger clients can be more complex and take longer to go live, particularly if our clients request a more phased implementation approach. Total active providers on athenaCollector grew by 29% year-over-year, to 52,886. On a sequential basis, we added 2,674 net new active providers on athenaCollector, versus 1,185 in Q1 2013.
athenaClinicals Clients
We continue to experience rapid growth in client adoption of athenaClinicals. Total active physicians live on athenaClinicals grew by 54% year-over-year, to 13,521. On a sequential basis, we added 1,133 net new active physicians on athenaClinicals, versus 827 in Q1 2013. This equates to an overall adoption rate of 36% of total athenaCollector physicians, up from 30% in Q1 2013. Total active providers on athenaClinicals grew by 51% year-over-year, to 18,343. On a sequential basis, we added 1,538 net new active providers on athenaClinicals, versus 1,213 in Q1 2013. We expect the athenaClinicals client base to
11
increase over time due to cross-selling within our existing base and growth in the volume of athenaOne deals.
athenaCommunicator Clients
Our athenaCommunicator client base is also growing rapidly. Total active physicians live on athenaCommunicator grew by an impressive 103% year-over-year, to 24,030. On a sequential basis, we added a record 2,514 net new active physicians on athenaCommunicator, versus 1,687 in Q1 2013. This equates to an overall adoption rate of 64% of total athenaCollector physicians, up from 41% in Q1 2013. Total active providers on athenaCommunicator grew by 95%, to 31,707. On a sequential basis, we added a record 3,347 net new providers on athenaCommunicator, versus 2,231 in Q1 2013. We expect the athenaCommunicator client base to increase over time due to cross-selling within our existing base and growth in the volume of athenaOne deals.
New Deals
On February 11, 2014, we announced that Privia Medical Group has selected our suite of cloud-based services, athenaOne, to support clinical integration and connectedness across its rapidly growing, multi-specialty group and accountable care organization. Comprised of some of the most respected physicians in the Washington, DC, area, Privia Medical Group represents 154 providers who, in partnership with leading health plans and government payers, are working to improve both the quality and value of care for the more than 300,000 patients they currently serve. Privia Medical Group brought two waves live in Q1 2014 and is expected to bring the remaining physicians and providers live in Q2 2014.
On March 18, 2014, we announced that Saint Peter’s Healthcare System has selected our suite of cloud-based services, athenaOne, to support its growing physician network which is currently comprised of 176 hospital- and clinic-based physicians in New Brunswick, New Jersey, and New York City. Saint Peter’s Healthcare System is expected to go live on athenaCollector, athenaClinicals, and athenaCommunicator in Q3 2014.
On April 10, 2014, we announced that Phoebe Physician Group has selected our suite of cloud-based services, athenaOne, for use across its growing network of employed physicians. Phoebe Physician Group, comprised of 260 multi-specialty providers, will also leverage athenahealth’s population health management and analytics services to support its transition from volume to value-based care. Phoebe Physician Group is expected to go live on all services in the second half of 2014.
Client Implementations
Our publicly disclosed implementation pipeline includes the following status updates as of April 17, 2014:
| • | Riverside Medical Group (~300 physicians, ~400 providers) went live on athenaCollector in January 2014. |
| • | Medical Professional Services went live on athenaCoordinator - Population Health Management in Q1 2014. |
• | Health Management Associates (~900 physicians, ~1,200 providers), now part of Community Health Systems, is expected to bring its remaining providers and physicians live on our suite of cloud-based services by means of a phased implementation over the next twelve months. |
• | Ascension Health Alliance (over 4,000 providers) continued the phased implementation on athenaCollector, athenaCommunicator, and athenaCoordinator Analytics and brought two smaller waves live in Q1 2014 and another wave live in early April. |
| • | Hallmark Health is expected to go live on athenaCoordinator - Population Health Management in Q2 2014. |
| • | CaroMont Health is expected to go live on athenaCoordinator - Population Health Management in Q2 2014. |
12
| • | Children’s Integrated Care Organization is expected to go live on athenaCoordinator - Population Health Management in Q2 2014. |
| • | Marquette Physician Practices (~200 physicians, ~250 providers) is expected to go live on athenaCollector, athenaCommunicator, and athenaCoordinator Analytics in Q3 2014. |
| • | Hospital Physician Partners (~2,000 providers) is expected to go live on athenaCollector, athenaCommunicator, and athenaCoordinator Analytics by means of a phased implementation. Hospital Physician Partners brought its hospitalists (~169 providers) live on athenaCollector in Q1 2014. |
Marketing and Selling Discussion
Marketing Update
The athenahealth marketing organization encompasses our growth and sales operations, event and partner marketing, inside sales agents (“ISAs”), advertising, corporate communications, and product marketing teams. This organization executes in-market investments in an effort to generate new business opportunities for athenahealth.
We made another big splash at HIMSS this year with our theme “We Connect Care”. This central messaging of connecting care was tied to the launch of our newest service offering, athenaCoordinator Enterprise, which further builds on our ability to connect care across the continuum by ensuring more revenue, better quality, and more loyal patients and physicians. We also used HIMSS to showcase our new athenaNet experience and demonstrate via live demos how we connect caregivers and patients through a streamlined EHR experience. Finally, our Chief Operating Officer, Ed Park, ended our HIMSS experience on a very high note with his featured talk on “What Health Care Can Learn From Amazon”. Ed’s overall message was that the health care industry needs to put the patient at the center of care and align technology strategy with this new patient-centric mentality. Amazon put the customer at the center of its world and has arguably become the most cutting-edge company in retail. The health care industry can apply Amazon’s pioneering philosophies and cloud technology to activate big data on a national scale and embrace collaboration in the face of competition - all to deliver greater value to patients and caregivers. Unlike health care information technology vendors before us, athenahealth is taking a different path to help health care work as it should. We remain focused on becoming the health care internet and believe that we have the leadership and the footprint to achieve this vision.
On May 15, 2014, Jonathan Bush’s book entitled “Where Does It Hurt?: An Entrepreneur’s Guide to Fixing Health Care” will be released. The book is currently available for pre-order; more information can be found at: http://www.athenahealth.com/jonathan-bush/where-does-it-hurt.php.
Selling Update
The athenahealth sales organization includes all quota-carrying sales representatives, as well as our sales team leaders, channel sales team, and sales training and development organization.
As of March 31, 2014, we have a total of 133 quota-carrying sales representatives, up 17% from last year. Our athenahealth-branded services sales force is currently divided into three groups: the enterprise team, which is dedicated to serving the largest managed care organizations, as well as those with high growth potential; the group team, which is dedicated to medical practices with seven to 150 physicians; and the small group team, which is dedicated to medical practices with one to six physicians. Q1 2014 bookings for our small and group segments were ahead of plan, while bookings for our enterprise segment were behind plan. The enterprise team has continued to build out its pipeline of deals and remains focused on delivering approximately 50% of our total bookings in 2014.
13
Stock-Based Compensation Expense, Amortization of Purchased Intangible Assets, and Reconciliation of Non-GAAP Financial Measures
athenahealth, Inc.
STOCK-BASED COMPENSATION
(Unaudited, in thousands)
Set forth below is a breakout of stock-based compensation impacting the Condensed Consolidated Statements of Income for the three months ended March 31, 2014, and 2013:
| Three Months Ended March 31, | |||||||
| 2014 | 2013 | ||||||
| Stock-based compensation charged to Condensed Consolidated Statements of Income: | |||||||
| Direct operating | $ | 2,596 | $ | 1,717 | |||
| Selling and marketing | 3,024 | 2,876 | |||||
| Research and development | 1,664 | 1,323 | |||||
| General and administrative | 5,066 | 7,742 | |||||
| Total stock-based compensation expense | 12,350 | 13,658 | |||||
| Amortization of capitalized stock-based compensation related to software development (1) | 399 | 156 | |||||
| Total | $ | 12,749 | $ | 13,814 | |||
| (1) | In addition, for the three months ended March 31, 2014, and 2013, $0.8 million and $0.4 million, respectively, of stock-based compensation was capitalized in the line item Capitalized Software Costs in the Condensed Consolidated Balance Sheet for which $0.4 million and $0.2 million, respectively, of amortization was included in the line item Depreciation and Amortization Expense in the Condensed Consolidated Statements of Income. |
athenahealth, Inc.
AMORTIZATION OF PURCHASED INTANGIBLE ASSETS
(Unaudited, in thousands)
Set forth below is a breakout of amortization of purchased intangible assets impacting the Condensed Consolidated Statements of Income for the three months ended March 31, 2014, and 2013:
| Three Months Ended March 31, | |||||||
| Amortization of purchased intangible assets allocated to: | 2014 | 2013 | |||||
| Direct operating | $ | 3,939 | $ | 1,740 | |||
| Selling and marketing | 3,151 | — | |||||
| Total amortization of purchased intangible assets | $ | 7,090 | $ | 1,740 | |||
14
athenahealth, Inc.
RECONCILIATION OF NON-GAAP FINANCIAL MEASURES
TO COMPARABLE GAAP MEASURES
(Unaudited, in thousands, except per share amounts)
The following is a reconciliation of the non-GAAP financial measures used by us to describe our financial results determined in accordance with accounting principles generally accepted in the United States of America (“GAAP”). An explanation of these measures is also included below under the heading “Explanation of Non-GAAP Financial Measures.”
While management believes that these non-GAAP financial measures provide useful supplemental information to investors regarding the underlying performance of our business operations, investors are reminded to consider these non-GAAP measures in addition to, and not as a substitute for, financial performance measures prepared in accordance with GAAP. In addition, it should be noted that these non-GAAP financial measures may be different from non-GAAP measures used by other companies, and management may utilize other measures to illustrate performance in the future. Non-GAAP measures have limitations in that they do not reflect all of the amounts associated with our results of operations as determined in accordance with GAAP.
Please note that these figures may not sum exactly due to rounding.
Non-GAAP Adjusted Gross Margin
Set forth below is a presentation of our “Non-GAAP Adjusted Gross Profit” and “Non-GAAP Adjusted Gross Margin,” which represents Non-GAAP Adjusted Gross Profit as a percentage of total revenue.
| (unaudited, in thousands) | Three Months Ended | ||||||
| March 31, | |||||||
| 2014 | 2013 | ||||||
| Total revenue | $ | 163,035 | $ | 125,596 | |||
| Direct operating expense | 72,148 | 53,185 | |||||
| Total revenue less direct operating expense | 90,887 | 72,411 | |||||
| Add: Stock-based compensation allocated to direct operating expense | 2,596 | 1,717 | |||||
| Add: Amortization of purchased intangible assets allocated to direct operating expense | 3,939 | 1,740 | |||||
| Non-GAAP Adjusted Gross Profit | $ | 97,422 | $ | 75,868 | |||
| Non-GAAP Adjusted Gross Margin | 59.8 | % | 60.4 | % | |||
15
Non-GAAP Adjusted EBITDA
Set forth below is a reconciliation of our “Non-GAAP Adjusted EBITDA” and “Non-GAAP Adjusted EBITDA Margin,” which represents Non-GAAP Adjusted EBITDA as a percentage of total revenue.
| (unaudited, in thousands) | Three Months Ended | ||||||
| March 31, | |||||||
| 2014 | 2013 | ||||||
| Total Revenue | $ | 163,035 | $ | 125,596 | |||
| GAAP net (loss) income | (8,055 | ) | 700 | ||||
| Add: Benefit from income taxes | (4,482 | ) | (12,683 | ) | |||
| Add: Total other expense | 1,436 | 110 | |||||
| Add: Stock-based compensation expense | 12,350 | 13,658 | |||||
| Add: Depreciation and amortization | 14,249 | 8,341 | |||||
| Add: Amortization of purchased intangible assets | 7,090 | 1,740 | |||||
| Add: Integration and transaction costs | — | 3,794 | |||||
| Add: Non-tax deductible transaction costs | — | 1,915 | |||||
| Non-GAAP Adjusted EBITDA | $ | 22,588 | $ | 17,575 | |||
| Non-GAAP Adjusted EBITDA Margin | 13.9 | % | 14.0 | % | |||
Non-GAAP Adjusted Operating Income
Set forth below is a reconciliation of our “Non-GAAP Adjusted Operating Income” and “Non-GAAP Adjusted Operating Income Margin,” which represents Non-GAAP Adjusted Operating Income as a percentage of total revenue.
| (unaudited, in thousands) | Three Months Ended | ||||||
| March 31, | |||||||
| 2014 | 2013 | ||||||
| Total revenue | $ | 163,035 | $ | 125,596 | |||
| GAAP net (loss) income | (8,055 | ) | 700 | ||||
| Add: Benefit from income taxes | (4,482 | ) | (12,683 | ) | |||
| Add: Total other expense | 1,436 | 110 | |||||
| Add: Stock-based compensation expense | 12,350 | 13,658 | |||||
| Add: Amortization of capitalized stock-based compensation related to software development | 399 | 156 | |||||
| Add: Amortization of purchased intangible assets | 7,090 | 1,740 | |||||
| Add: Integration and transaction costs | — | 3,794 | |||||
| Add: Non-tax deductible transaction costs | — | 1,915 | |||||
| Non-GAAP Adjusted Operating Income | $ | 8,738 | $ | 9,390 | |||
| Non-GAAP Adjusted Operating Income Margin | 5.4 | % | 7.5 | % | |||
16
Non-GAAP Adjusted Net Income
Set forth below is a reconciliation of our “Non-GAAP Adjusted Net Income” and “Non-GAAP Adjusted Net Income per Diluted Share.”
| (unaudited, in thousands) | Three Months Ended | ||||||
| March 31, | |||||||
| 2014 | 2013 | ||||||
| GAAP net (loss) income | $ | (8,055 | ) | $ | 700 | ||
| Add: Stock-based compensation expense | 12,350 | 13,658 | |||||
| Add: Amortization of capitalized stock-based compensation related to software development | 399 | 156 | |||||
| Add: Amortization of purchased intangible assets | 7,090 | 1,740 | |||||
| Add: Integration and transaction costs | — | 3,794 | |||||
| Sub-total of tax deductible items | 19,839 | 19,348 | |||||
| Less: Tax impact of tax deductible items (1) | (7,936 | ) | (7,739 | ) | |||
| Add: Non-tax deductible transaction costs | — | 1,915 | |||||
| Add: Tax impact resulting from applying non-GAAP tax rate (2) | 533 | — | |||||
| Non-GAAP Adjusted Net Income | $ | 4,381 | $ | 14,224 | |||
| Weighted average shares - diluted | 37,484 | 37,744 | |||||
| Non-GAAP Adjusted Net Income per Diluted Share | $ | 0.12 | $ | 0.38 | |||
| (1) | Tax impact calculated using a statutory tax rate of 40%. |
| (2) | Represents adjusting the GAAP net loss at a non-GAAP tax rate of 40%. For 2014, we are using a non-GAAP tax rate of 40% to normalize the tax impact to our Non-GAAP Adjusted Net Income per Diluted Share based on the fact that a relatively small change in pre-tax GAAP income could result in a volatile GAAP effective tax rate. If this approach had been used in 2013, the tax impact from applying a non-GAAP tax rate would have been ($8,656) and our Q1 2013 Non-GAAP Adjusted Net Income per Diluted Share would have been $0.15 or a reduction of $0.23. |
| (unaudited, in thousands) | Three Months Ended | ||||||
| March 31, | |||||||
| 2014 | 2013 | ||||||
| GAAP net (loss) income per share - diluted | $ | (0.21 | ) | $ | 0.02 | ||
| Add: Stock-based compensation expense | 0.33 | 0.36 | |||||
| Add: Amortization of capitalized stock-based compensation related to software development | 0.01 | — | |||||
| Add: Amortization of purchased intangible assets | 0.19 | 0.05 | |||||
| Add: Integration and transaction costs | — | 0.10 | |||||
| Sub-total of tax deductible items | 0.53 | 0.51 | |||||
| Less: Tax impact of tax deductible items (1) | (0.21 | ) | (0.21 | ) | |||
| Add: Non-tax deductible transaction costs | — | 0.05 | |||||
| Add: Tax impact resulting from applying non-GAAP tax rate (2) | 0.01 | — | |||||
| Non-GAAP Adjusted Net Income per Diluted Share | $ | 0.12 | $ | 0.38 | |||
| Weighted average shares - diluted | 37,484 | 37,744 | |||||
17
| (1) | Tax impact calculated using a statutory tax rate of 40%. |
| (2) | Represents adjusting the GAAP net loss at a non-GAAP tax rate of 40%. For 2014, we are using a non-GAAP tax rate of 40% to normalize the tax impact to our Non-GAAP Adjusted Net Income per Diluted Share based on the fact that a relatively small change in pre-tax GAAP income could result in a volatile GAAP effective tax rate. If this approach had been used in 2013, the tax impact from applying a non-GAAP tax rate would have been ($8,656) and our Q1 2013 Non-GAAP Adjusted Net Income per Diluted Share would have been $0.15 or a reduction of $0.23. |
18
Explanation of Non-GAAP Financial Measures
We report our financial results in accordance with accounting principles generally accepted in the United States of America, or GAAP. However, management believes that, in order to properly understand our short-term and long-term financial and operational trends, investors may wish to consider the impact of certain non-cash or non-recurring items, when used as a supplement to financial performance measures in accordance with GAAP. These items result from facts and circumstances that vary in frequency and impact on continuing operations. Management also uses results of operations before such items to evaluate the operating performance of athenahealth and compare it against past periods, make operating decisions, and serve as a basis for strategic planning. These non-GAAP financial measures provide management with additional means to understand and evaluate the operating results and trends in our ongoing business by eliminating certain non-cash expenses and other items that management believes might otherwise make comparisons of our ongoing business with prior periods more difficult, obscure trends in ongoing operations, or reduce management’s ability to make useful forecasts. Management believes that these non-GAAP financial measures provide additional means of evaluating period-over-period operating performance. In addition, management understands that some investors and financial analysts find this information helpful in analyzing our financial and operational performance and comparing this performance to our peers and competitors.
Management defines “Non-GAAP Adjusted Gross Profit” as total revenue, less direct operating expense, plus (1) stock-based compensation expense allocated to direct operating expense and (2) amortization of purchased intangible assets allocated to direct operating expense, and “Non-GAAP Adjusted Gross Margin” as Non-GAAP Adjusted Gross Profit as a percentage of total revenue. Management considers these non-GAAP financial measures to be important indicators of our operational strength and performance of our business and a good measure of our historical operating trends. Moreover, management believes that these measures enable investors and financial analysts to closely monitor and understand changes in our ability to generate income from ongoing business operations.
Management defines “Non-GAAP Adjusted EBITDA” as the sum of GAAP net income before provision for (benefit) from income taxes, total other (income) expense, stock-based compensation expense, depreciation and amortization, amortization of purchased intangible assets, integration costs, and transaction costs and “Non-GAAP Adjusted EBITDA Margin” as Non-GAAP Adjusted EBITDA as a percentage of total revenue. Management defines “Non-GAAP Adjusted Operating Income” as the sum of GAAP net income before provision for (benefit) from income taxes, total other (income) expense, stock-based compensation expense, amortization of capitalized stock-based compensation related to software development, amortization of purchased intangible assets, integration costs, and transaction costs and “Non-GAAP Adjusted Operating Income Margin” as Non-GAAP Adjusted Operating Income as a percentage of total revenue. Management defines “Non-GAAP Adjusted Net Income” as the sum of GAAP net income before stock-based compensation expense, amortization of capitalized stock-based compensation related to software development, amortization of purchased intangible assets, integration costs, transaction costs, any tax impact related to these preceding items, and an adjustment to the tax provision for the non-GAAP tax rate and “Non-GAAP Adjusted Net Income per Diluted Share” as Non-GAAP Adjusted Net Income divided by weighted average diluted shares outstanding. Management considers all of these non-GAAP financial measures to be important indicators of our operational strength and performance of our business and a good measure of our historical operating trends, in particular the extent to which ongoing operations impact our overall financial performance.
19
Management excludes or adjusts each of the items identified below from the applicable non-GAAP financial measure referenced above for the reasons set forth with respect to that excluded item:
| • | Stock-based compensation expense and amortization of capitalized stock-based compensation related to software development — excluded because these are non-cash expenditures that management does not consider part of ongoing operating results when assessing the performance of our business, and also because the total amount of the expenditure is partially outside of our control because it is based on factors such as stock price, volatility, and interest rates, which may be unrelated to our performance during the period in which the expenses are incurred. |
| • | Amortization of purchased intangible assets — purchased intangible assets are amortized over their estimated useful lives and generally cannot be changed or influenced by management after the acquisition. Accordingly, this item is not considered by management in making operating decisions. Management does not believe such charges accurately reflect the performance of our ongoing operations for the period in which such charges are incurred. |
| • | Integration costs — integration costs are the severance and retention bonuses for certain employees relating to the Epocrates acquisition. Accordingly, management believes that such expenses do not have a direct correlation to future business operations, and therefore, these costs are not considered by management in making operating decisions. Management does not believe such charges accurately reflect the performance of our ongoing operations for the period in which such charges are incurred. |
| • | Transaction costs — transaction costs are non-recurring costs related to specific transactions. Accordingly, management believes that such expenses do not have a direct correlation to future business operations, and therefore, these costs are not considered by management in making operating decisions. Management does not believe such charges accurately reflect the performance of our ongoing operations for the period in which such charges are incurred. |
| • | Non-GAAP tax rate — For 2014, we are using a non-GAAP tax rate of 40% to normalize the tax impact to our Non-GAAP Adjusted Net Income per Diluted Share based on the fact that a relatively small change in pre-tax GAAP income could result in a volatile GAAP effective tax rate. |
20
Supplemental Metrics and Definitions
| Fiscal Year 2013 | Fiscal Year 2014 | ||||||||||||
| Q1 | Q2 | Q3 | Q4 | Q1 | |||||||||
| Client Base | |||||||||||||
| Total Physicians on athenaCollector | 28,850 | 31,049 | 33,764 | 35,858 | 37,663 | ||||||||
| Total Providers on athenaCollector | 40,937 | 43,858 | 47,195 | 50,212 | 52,886 | ||||||||
| Total Physicians on athenaClinicals | 8,776 | 10,058 | 11,401 | 12,388 | 13,521 | ||||||||
| Total Providers on athenaClinicals | 12,139 | 13,818 | 15,483 | 16,805 | 18,343 | ||||||||
| Total Physicians on athenaCommunicator | 11,840 | 13,831 | 17,330 | 21,516 | 24,030 | ||||||||
| Total Providers on athenaCommunicator | 16,296 | 18,762 | 23,024 | 28,360 | 31,707 | ||||||||
| Client Performance | |||||||||||||
| Net Promoter Score (1) | n/a | n/a | n/a | n/a | 44.7 | ||||||||
| Client Days in Accounts Receivable (“DAR”) | 37.6 | 37.0 | 38.4 | 38.0 | 41.1 | ||||||||
| First Pass Resolution (“FPR”) Rate | 93.9 | % | 94.2 | % | 94.1 | % | 93.9 | % | 93.5 | % | |||
| Electronic Remittance Advice (“ERA”) Rate | 81.8 | % | 82.8 | % | 82.0 | % | 83.3 | % | 82.3 | % | |||
| Total Claims Submitted | 20,732,485 | 21,691,357 | 22,903,118 | 25,435,690 | 25,785,710 | ||||||||
| Total Client Collections ($) | 2,566,960,419 | 2,836,765,406 | 2,974,736,918 | 3,285,027,602 | 3,172,115,234 | ||||||||
| Total Working Days | 61 | 64 | 64 | 62 | 61 | ||||||||
| Employees | |||||||||||||
| Direct | 1,426 | 1,438 | 1,460 | 1,533 | 1,573 | ||||||||
| Selling & Marketing | 426 | 455 | 464 | 473 | 509 | ||||||||
| Research & Development | 526 | 587 | 651 | 677 | 717 | ||||||||
| General & Administrative | 275 | 278 | 290 | 284 | 289 | ||||||||
| Total Employees | 2,652 | 2,758 | 2,865 | 2,966 | 3,088 | ||||||||
| Quota Carrying Sales Force | |||||||||||||
| Total Quota Carrying Sales Representatives | 114 | 119 | 120 | 126 | 133 | ||||||||
(1) Net Promoter Score is a new metric for 2014
| Supplemental Metrics Definitions | |
| Client Base | |
| Total Physicians on athenaCollector | The number of physicians that have rendered a service which generated a medical claim that was billed during the last 91 days on the athenaCollector platform. Examples of physicians include Medical Doctors (“MDs”) and Doctors of Osteopathic Medicine (“DOs”). |
| Total Providers on athenaCollector | The number of providers, including physicians, that have rendered a service which generated a medical claim that was billed during the last 91 days on the athenaCollector platform. Examples of non-physician providers are Nurse Practitioners (“NPs”) and Registered Nurses (“RNs”). |
| Total Physicians on athenaClinicals | The number of physicians that have rendered a service through the athenaClinicals platform which generated a medical claim that was billed during the last 91 days on the athenaCollector platform. |
| Total Providers on athenaClinicals | The number of providers, including physicians, that have rendered a service through the athenaClinicals platform which generated a medical claim that was billed during the last 91 days on the athenaCollector platform. |
| Total Physicians on athenaCommunicator | The number of physicians that have rendered a service which generated a medical claim that was billed during the last 91 days on the athenaCollector platform and whose practice is actively using athenaCommunicator. |
| Total Providers on athenaCommunicator | The number of providers, including physicians, that have rendered a service which generated a medical claim that was billed during the last 91 days on the athenaCollector platform and whose practice is actively using athenaCommunicator. |
| Client Performance | |
| Net Promoter Score | The percentage of clients who chose 9 or 10 ( defined as promoters) less the percentage of clients who choose 0 through 6 ( defined as detractors) on a scale of 1 to 10 when asked if they would recommend athenahealth to a trusted friend or colleague. These responses are generated from a "client listening" survey that the Company conducts for its client base twice per year. |
| Client Days in Accounts Receivable (“DAR”) | The average number of days that it takes outstanding balances on claims to be resolved, e.g. paid, for clients on athenaCollector. Clients that have been live less than 90 days are excluded, as well as clients who are terminating services. |
| First Pass Resolution (“FPR”) Rate | Approximates the percentage of primary claims that are favorably adjudicated and closed after a single submission during the period. Currently, the FPR rate is calculated on a monthly basis, and certain practices are excluded (e.g. those that have been live for less than 90 days). |
| Electronic Remittance Advice (“ERA”) Rate | Remittance refers to the information about payments (a/k/a explanations of benefits) received from insurance companies during the period. The ERA rate reflects the percentage of total charges that were posted using electronic remittance. |
| Total Claims Submitted | The number of claims billed through athenaNet during the period. |
| Total Client Collections | The dollar value of collections posted on behalf of clients during the period. |
| Total Working Days | The total number of days during the quarter minus weekends and U.S. Post Office holidays. |
| Employees | |
| Direct | The total number of full time equivalent individuals (“FTEs”) employed by the Company to support its service operations as of quarter end. This team includes production systems, enrollment services, paper claim submission, claim resolution, clinical operations, professional services, account management, and client services. |
| Selling & Marketing | The total number of FTEs employed by the Company to support its sales and marketing efforts as of quarter end. This team includes sales representatives, business development staff and the marketing team. |
| Research & Development | The total number of FTEs employed by the Company to support its research and development efforts as of quarter end. This team includes product development and product management. |
| General & Administrative | The total number of FTEs employed by the Company to support its general and administrative functions as of quarter end. This team includes finance, human resources, compliance, learning and development, internal audit, corporate technology, recruiting, facilities, and legal. |
| Total Employees | The total number of FTEs employed by the Company as of quarter end. This number excludes interns and seasonal employees. |
| Corporate Scorecard Metrics Definitions | |
| Stability | |
| Voluntary Turnover | A quarterly average of the number of voluntary terminations divided by starting headcount. Voluntary turnover excludes employees on action plans or employees on counseling out plans. |
| Corporate Citizenship | Percentage of compliance tasks that are met within the deadline. |
| Employee Engagement | Quarterly engagement survey results for employees. |
| Performance | |
| Total Automation Rate | Percentage of major revenue cycle management, clinicals and patient statement transactions that were sent or received in a structured electronic format. |
| Net On-boarding Success | This metric is calculates net on-boarding success which is champions plus neutrals less stragglers. Providers are categorized as either champions, neutrals or stragglers based on several key performance metrics including same day encounter close rate, provider documentation time, and the percentage of encounters documented during the patient visit. |
| Patient Full Registration | The percentage of patients in the current panel (claims created in the last 18 months) with complete patient registration information including driver's license, insurance card and confirmed eligibility. |
| Satisfaction | |
| Net Promoter Score | The percentage of clients who chose 9 or 10 ( defined as promoters) less the percentage of clients who choose 0 through 6 ( defined as detractors) on a scale of 1 to 10 when asked if they would recommend athenahealth to a trusted friend or colleague. These responses are generated from a “client listening” survey that the Company conducts for its client base twice per year. |
| Days of Client Work | The outstanding work that clients have in clinicals and revenue cycle. For clinicals, the total stock of work on the clinicals dashboard divided by average daily inflow of tasks. For revenue cycle, the days in accounts receivable relating to work that needs to be resolved by the client. Both clinicals and revenue cycle are weighted at 50%. |
| Provider Documentation Tim per Appointment | The average number of minutes athenaClinicals providers spend on the computer documenting the exam and orders for each appointment. Providers that have been live less than 90 days are excluded. |
| Minutes per RVU | Total minutes spent within athenaCollector webpages based on weblogs divided by RVU's posted. |
| Financial | |
| Bookings | The annualized value of deals sold. |
| Total Revenue | Total consolidated revenue. |
| Non-GAAP Adjusted Operating Income | Total non-GAAP adjusted operating income. |
| # Physicians on the Network | Active physicians in the last 90 days on Epocrates and rendering physicians live on athenaNet. Physicians live on athenaNet is defined as the number of physicians that have rendered a service which generated a medical claim that was billed during the last 91 days on the athenaCollector platform. Examples of physicians include Medical Doctors (“MD”) and Doctor of Osteopathic Medicine (“DO”). |