
7th Annual Investor Summit December 11, 2014

Welcome to Our 7th Annual Investor Summit! Dana Quattrochi Executive Director, Investor Relations

Agenda 3 Opening Remarks Jonathan Bush, Chairman & Chief Executive Officer 1 2 Financial Discussion Kristi Matus, EVP, Chief Financial & Administrative Officer 3 Core Business Update Ed Park, EVP, Chief Operating Officer 4 Emerging Services Update Jeremy Delinsky, SVP, Chief Technology Officer 5 Client Panel Discussion Stephen Kahane, M.D., M.S., President, Enterprise Solutions 6 Management Q&A and Closing Remarks Jonathan Bush, Chairman & Chief Executive Officer

Safe Harbor Statement This presentation contains forward-looking statements, which are made pursuant to the safe harbor provisions of the Private Securities Litigation Reform Act of 1995, including statements reflecting athenahealth, Inc. (“athenahealth” or “we”) management’s expectations for: future financial and operational performance; expected growth, including anticipated revenues, profitability, and bookings; market trends and business outlook (e.g., disconnected care, physician consolidation, health care expenditures, and the shift towards alternative reimbursement models); the anticipated benefits of our service offerings and plans and timelines for developing and expanding those offerings (e.g., athenaClinicals® Enterprise, athenaCoordinator® Enterprise, and athenaTextSM); marketing and sales plans, strategies, and trends, including increased awareness, athena-owned channel referrals, and cross-selling of our services); the integration of our services, acquisitions, and operations; and cultural, operational, and organizational goals and initiatives (e.g., supporting the continuum of care), as well as statements found under our reconciliation of Non-GAAP financial measures included within this presentation. Such statements do not constitute guarantees of future performance, are neither promises nor guarantees, and are subject to a variety of risks and uncertainties, many of which are our control, which could cause actual results to differ materially from those contemplated in these forward-looking statements. In particular, the risks and uncertainties include, among other things: our fluctuating operating results; our variable sales and implementation cycles; risks associated with our expectations regarding our ability to maintain profitability; the impact of increased sales and marketing and research and development expenditures, including whether increased expansion in revenues is attained and whether impact on margins and profitability is longer term than expected; changes in tax rates or exposure to additional tax liabilities; the highly competitive and rapidly changing industry in which we operate; and the evolving and complex governmental and regulatory compliance environment in which we and our clients operate. Existing and prospective investors are cautioned not to place undue reliance on these forward-looking statements, which speak only as of the date hereof. We undertake no obligation to update or revise the information contained in this presentation, whether as a result of new information, future events or circumstances, or otherwise. For additional disclosure regarding these and other risks faced by us, please see the disclosures contained in our public filings with the Securities and Exchange Commission, available on the Investors section of our website at http://www.athenahealth.com and on the SEC's website at http://www.sec.gov. 4

Use of Non-GAAP Financial Measures 5 In our earnings releases, conference calls, slide presentations, or webcasts, we may use or discuss non-GAAP financial measures as defined by SEC Regulation G. The GAAP financial measure most directly comparable to each non-GAAP financial measure used or discussed, and a reconciliation of the differences between each non-GAAP financial measure and the comparable GAAP financial measure, is available within this presentation and within our public filings with the Securities and Exchange Commission, available on the Investors section of our website at http://www.athenahealth.com.

Opening Remarks Jonathan Bush Chairman & CEO

Patients disconnected from their own care and from cost patients without a PCP 62M http://www.nachc.com/pressrelease- detail.cfm?pressreleaseID=897 88% of patients not receiving “Well Patient” visits SOURCE: http://downloads.cms.gov/files/Beneficiaries-Utilizing-Free- Preventive-Services-by-State-YTD2013.pdf

Providers disconnected from patients by EMRs, regulations, etc. Average visit duration :08M http://well.blogs.nytimes.com/2013/05/30/for-new-doctors-8-minutes-per-patient/?_r=0
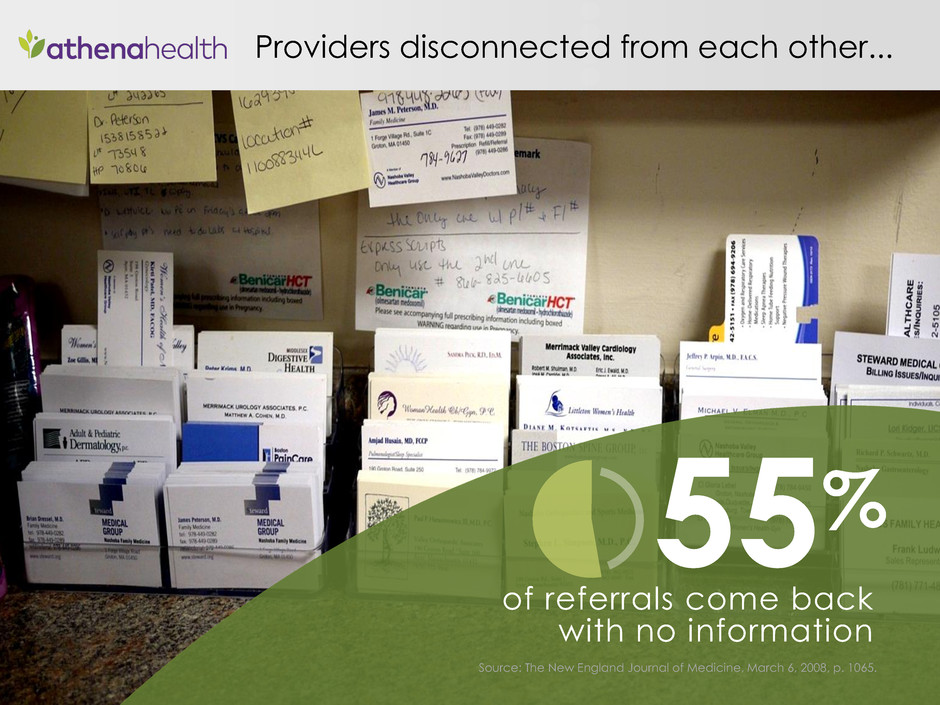
Providers disconnected from each other... of referrals come back with no information 55% Source: The New England Journal of Medicine, March 6, 2008, p. 1065.

... and from the rest of the continuum USA rank in global life expectancy #42 https://www.cia.gov/library/publications/the-world- factbook/rankorder/2102rank.html

... and from their sense of purpose. of doctors wouldn’t recommend medicine 59% http://www.prweb.com/releases/2013/6/prweb10881121.htm

12
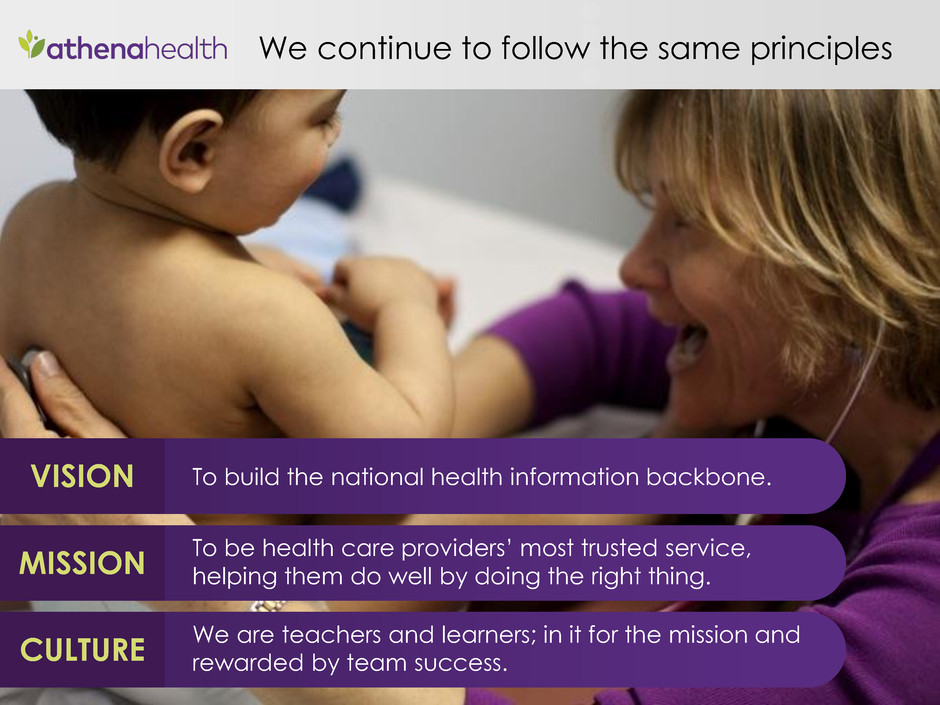
We continue to follow the same principles 13 To build the national health information backbone. To be health care providers’ most trusted service, helping them do well by doing the right thing. We are teachers and learners; in it for the mission and rewarded by team success. VISION MISSION CULTURE
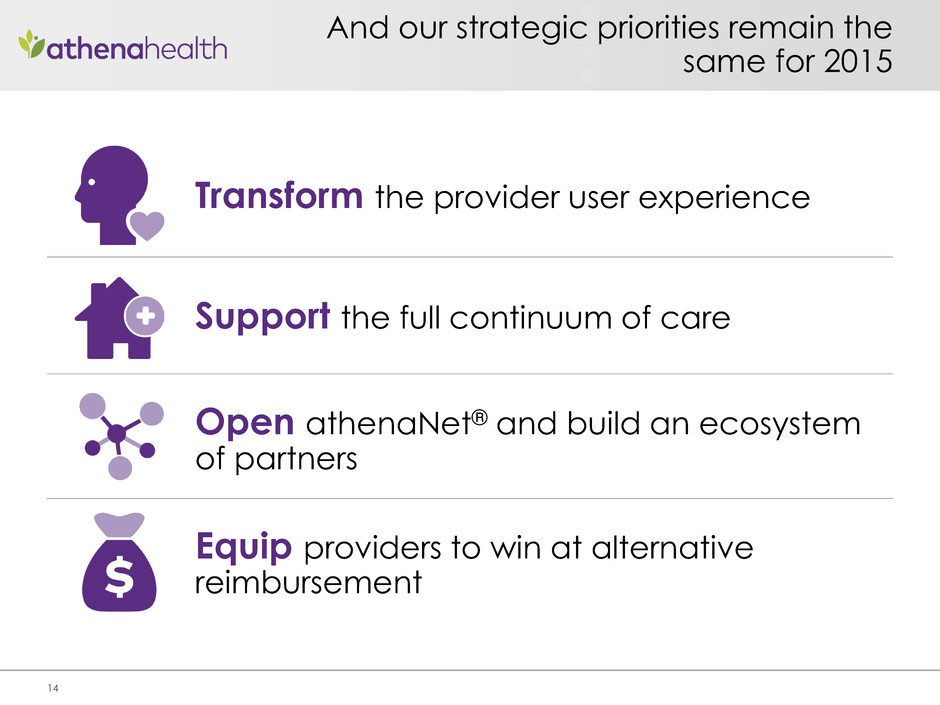
And our strategic priorities remain the same for 2015 14 Transform the provider user experience Support the full continuum of care Open athenaNet® and build an ecosystem of partners Equip providers to win at alternative reimbursement
We focus our work with a one-pager 15 athenaNation • Develop seamless connection & knowledge flow among employees and offices • Launch “athena-Moves-Faster” • Spread & embed our mobile competence across athenaNation athenaNet • Make athenahealth the continuum of care clinical and financial record • Master continuous streamlining of the athenaNet experience • Finalize athenaNet as an open platform • Package, promote, and deliver our services by targeted specialties and segments • Make client performance insight native to our services
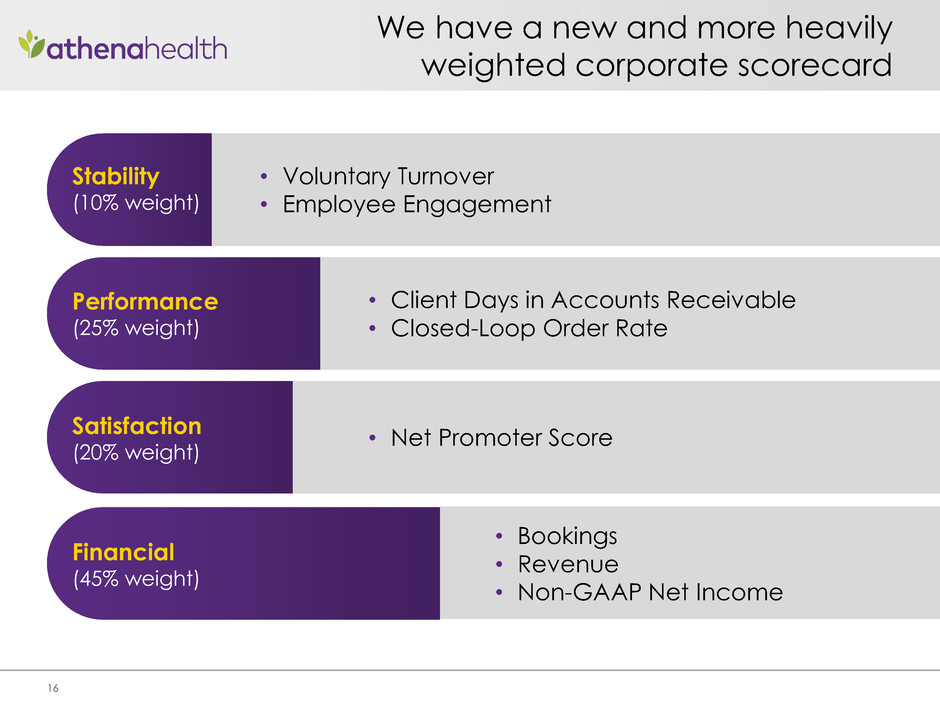
We have a new and more heavily weighted corporate scorecard 16 • Bookings • Revenue • Non-GAAP Net Income Financial (45% weight) Satisfaction (20% weight) Performance (25% weight) Stability (10% weight) • Net Promoter Score • Client Days in Accounts Receivable • Closed-Loop Order Rate • Voluntary Turnover • Employee Engagement

We are organizing ourselves around these strategic priorities 17 2015 Organization Chart “Same Game. New Teams” All Sales and account management for clients on athenahealth’s core services athenahealth network Administration of athenaNation Awareness by and access to the nation’s health care providers Creation and incubation of our new services and new relationships Steve Kahane, EVP Client Organization Ed Park, EVP Chief Operating Officer Kristi Matus, EVP Chief Financial & Administrative Officer Rob Cosinuke, SVP Chief Marketing Officer Jeremy Delinsky, SVP Chief Product Officer Jonathan Bush Chairman & CEO

Business Model Reminder


We provide five integrated services that deliver immediate value to providers and health systems 20 Improved clinical care and patient outcomes Population Health Management Revenue cycle management Documentation and workflow efficiency athenaCommunicator® Patient Engagement athenaCollector® Revenue Cycle Performance athenaClinicals® Clinical Performance athenaCoordinator® Enterprise Population Health Epocrates® Point of Care Medical Applications

Who We Target

First signs that physician consolidation has leveled off 22 Source: athenahealth’s addressable market (physicians) based on athenahealth analysis using SK&A, HIMSS, and self-collected data 800 700 600 500 400 300 200 100 - 2011 2012 2013 2014 % Employed Physicians 650K 676K 684K 692K 44% 50% 57% 57% 56% 50% 43% 43% Employed Independent

13% 13% 74% 101-300 physicians Under 100 physicians 301+ physicians It is not just large health systems employing physicians 23 Source: athenahealth’s addressable market (physicians) based on athenahealth analysis using SK&A, HIMSS, and self-collected data Hospitals and Health Systems Employing Physicians
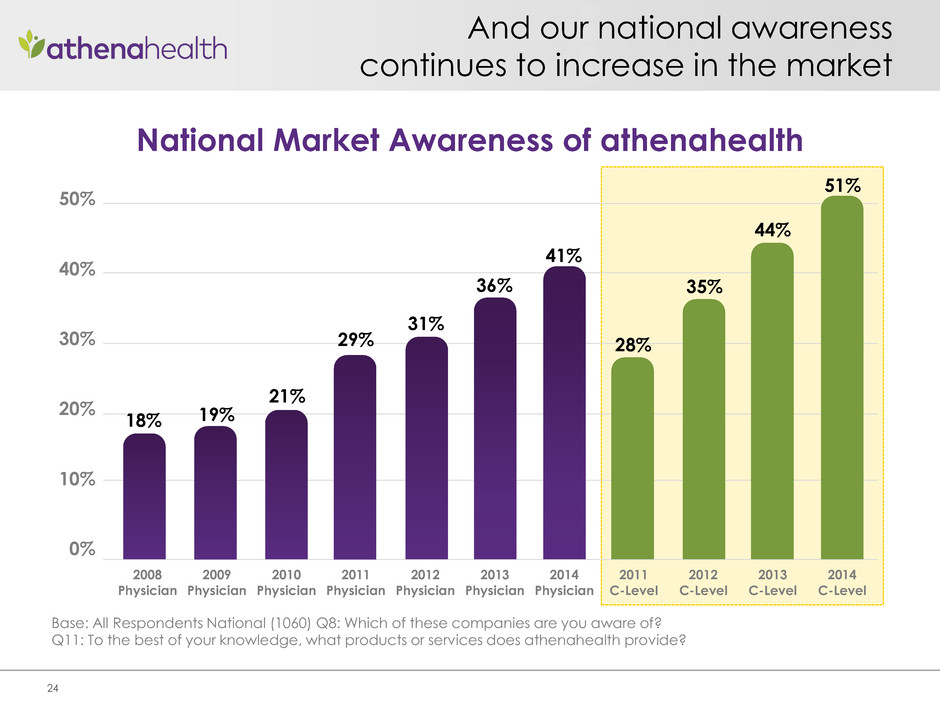
And our national awareness continues to increase in the market 24 Base: All Respondents National (1060) Q8: Which of these companies are you aware of? Q11: To the best of your knowledge, what products or services does athenahealth provide? National Market Awareness of athenahealth 50% 40% 30% 20% 10% 0% 2008 Physician 2009 Physician 2010 Physician 2011 Physician 2012 Physician 2013 Physician 2014 Physician 2011 C-Level 2012 C-Level 2013 C-Level 2014 C-Level 18% 19% 21% 29% 31% 28% 35% 36% 41% 44% 51%
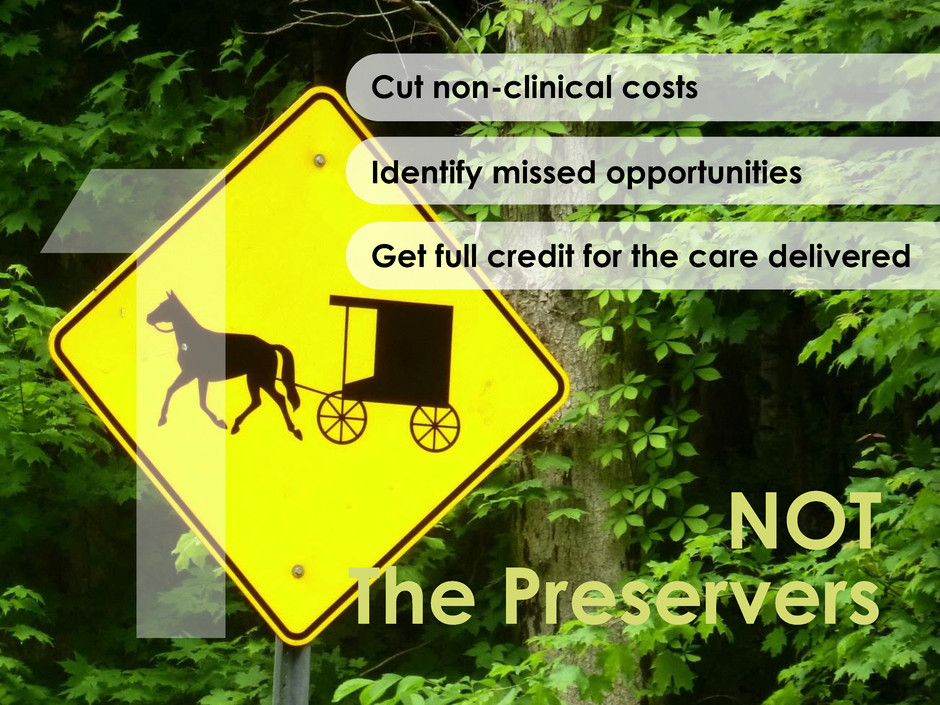
NOT The Preservers Cut non-clinical costs Identify missed opportunities Get full credit for the care delivered

The Newbies e.g., Privia; Target; MedExpress Make money through scale & access Use data to drive decisions Empowered to use their own data

The Transformers e.g., Ascension; CHRISTUS; Steward Position for the ability to shop, sell, harvest Actively identify and harvest savings Aggressively grow patient share Need a new photo – crazy ones?

The key to market share is cracking the code on patient engagement and patient experience 28 #2 #1 #3 Quality Empathy Access

We have built our growth strategy around the “Land War” 29 The Land War

…And also by building powerful brand bonds to get providers onto our network 30 Winning the Hearts and Minds

And this is how we are going after the market 31 Enterprises CDS, CME, athenaTextSM athenaText athenaOne® Enterprise Clinicals Enterprise Communicator Enterprise Collector Enterprise Coordinator Enterprise Individuals Informal groups Formal groups

We are on the right side of history and the opportunity for us is significant 32 Still have the right strategy 1 2 3 Still room to shop Still having fun

Financial Discussion Kristi Matus EVP, Chief Financial & Administrative Officer
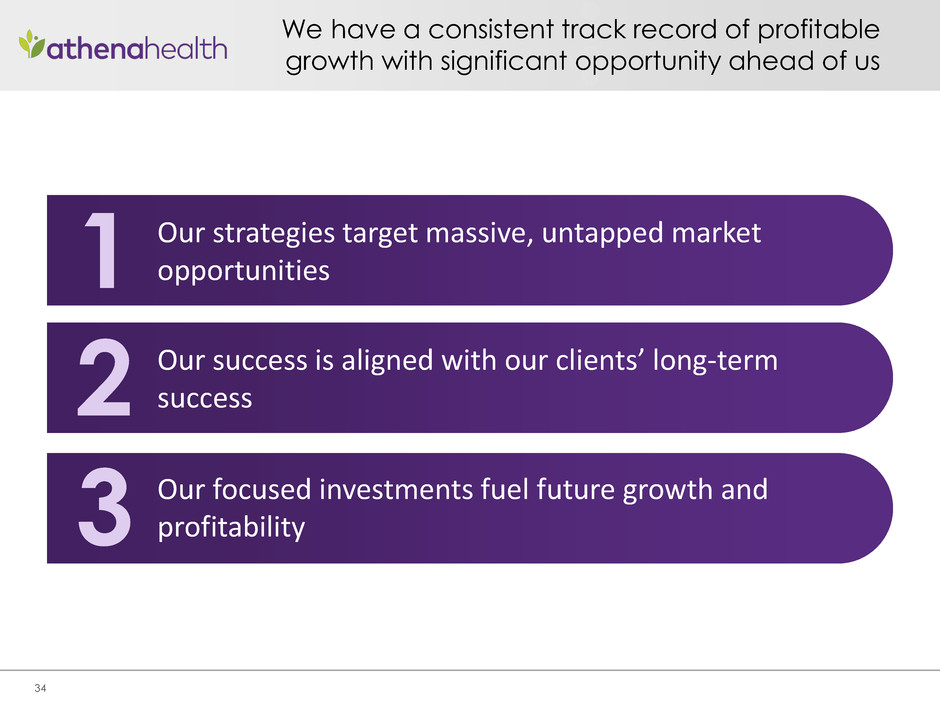
We have a consistent track record of profitable growth with significant opportunity ahead of us 34 Our strategies target massive, untapped market opportunities 1 2 3 Our success is aligned with our clients’ long-term success Our focused investments fuel future growth and profitability

We have a demonstrated track record of growth: above our 30% target 35 1 CAGR from 2007 to 2015 Guidance (Mid Point) Consolidated Revenue ($M) $98 $1,000 $800 $600 $400 $200 $- 2007 (IPO) 2008 2009 2010 2011 2012 2013 2014 Mid Pt 2015 Mid Pt $136 $189 $246 $324 $422 $595 $740 $913

7 years ago we were an emerging company just starting to grow… 36 providers Collector (2000) 12k

providers Epocrates (2013) 1.1M receiver nodes Coordinator (2012) 5k providers Communicator (2010) 39k providers Clinicals (2006) 23k …and today we are a proven aggressive growth company 37 providers Collector (2000) 59k

Our market opportunity is massive and growing 38 1 Calculated by multiplying athenahealth’s average billing rate of each service offering by $880B Hospital Expenditures and $560B Physician & Clinical Services, Centers for Medicare & Medicaid Services, Office of the Actuary, National Health Statistics Group, 2012. Road to Support Full Continuum of Care $38-$44 Billion1 $80-$95 Billion1 $30-$35 Billion1 Acute Care Services $8-$9 Billion Ambulatory Market $30-35 Billion athenaCollector Enterprise athenaCoordinator Enterprise Ambulatory Market $30-35 Billion Ambulatory Market $30-35 Billion athenaClinicals Enterprise Acute Care Services $50-60 Billion

increase in collections decrease in no-show rate Meaningful Use attestation rate reduction in days in accounts receivable EHR adoption rate We contribute directly to client success

ALIGNED INCENTIVES We succeed when our clients succeed 40 Client revenue and profit athenahealth fees Client revenue and profit athenahealth fees

We enjoy continued rapid adoption of our core services 41 74% of 2014 Deals were athenaOne1 1 YTD Q3 2014 athenaCollector Providers 80,000 60,000 40,000 20,000 - 2007 2008 2009 2010 2011 2012 2013 Q3 YTD 2014 80% 60% 40% 20% 0% 12,118 18,768 23,366 27,114 32,740 39,752 50,212 59,415 athenaCommunicator Adoption athenaClinicals Adoption

26%1 38%1 30%1 We grow as our clients grow 42 1 Percentage of athenaCollector Providers added from existing clients (go-live dates from prior years) 5,000 4,000 3,000 2,000 1,000 - Q1 12 Q2 12 Q3 12 Q4 12 Q1 13 Q2 13 Q3 13 Q4 13 Q1 14 Q2 14 Q3 14 1,183 1,486 2,736 1,607 1,185 2,921 3,337 2,017 2,674 2,539 3,990 athenaCollector Provider Adds

Client retention is high, and forward results are predictable Source: “Ambulatory EMR Perception 2014: New Leaders Emerging as Market Shifts,” August 2014. © KLAS Enterprises, LLC. All rights reserved. Stuck between a Rock and a Hard Place Are you leaving, do you wish you could leave, or are you staying? Over 75 Physicians 0% 10% 20% 30% 40% 50% 60% 70% 80% 90% 100% athenahealth Epic Cerner eClinicalWorks Allscripts NextGen GEHealthcare McKesson Cur re n t E M R V e n do r 7 45 7 6 9 4 1 5 7 10 17 5 2 2 4 6 2 1 Staying Stuck/Would Leave if Could Potentially Leaving

Client retention is high, and forward results are predictable Source: “Ambulatory EMR Perception 2014: New Leaders Emerging as Market Shifts,” August 2014. © KLAS Enterprises, LLC. All rights reserved. Stuck between a Rock and a Hard Place Are you leaving, do you wish you could leave, or are you staying? Over 75 Physicians 0% 10% 20% 30% 40% 50% 60% 70% 80% 90% 100% athenahealth Epic Cerner eClinicalWorks Allscripts NextGen GEHealthcare McKesson Cur re n t E M R V e n do r 7 45 7 6 9 4 1 5 7 10 17 5 2 2 4 6 2 1 Staying Stuck/Would Leave if Could Potentially Leaving 95% Customer Retention Rate
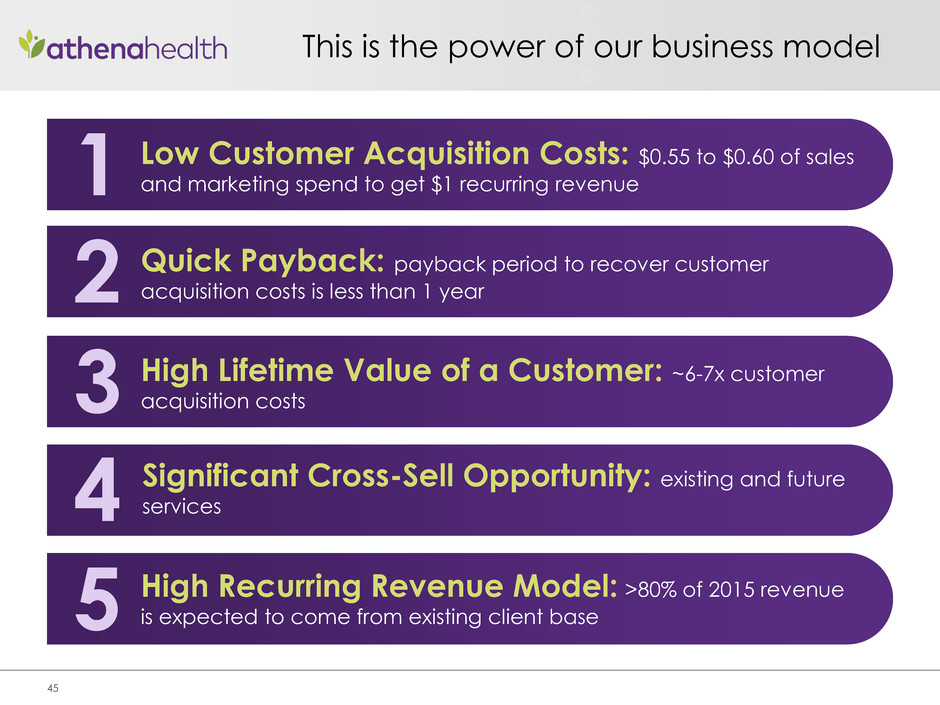
45 This is the power of our business model 1 2 3 4 5 Low Customer Acquisition Costs: $0.55 to $0.60 of sales and marketing spend to get $1 recurring revenue Quick Payback: payback period to recover customer acquisition costs is less than 1 year High Lifetime Value of a Customer: ~6-7x customer acquisition costs Significant Cross-Sell Opportunity: existing and future services High Recurring Revenue Model: >80% of 2015 revenue is expected to come from existing client base
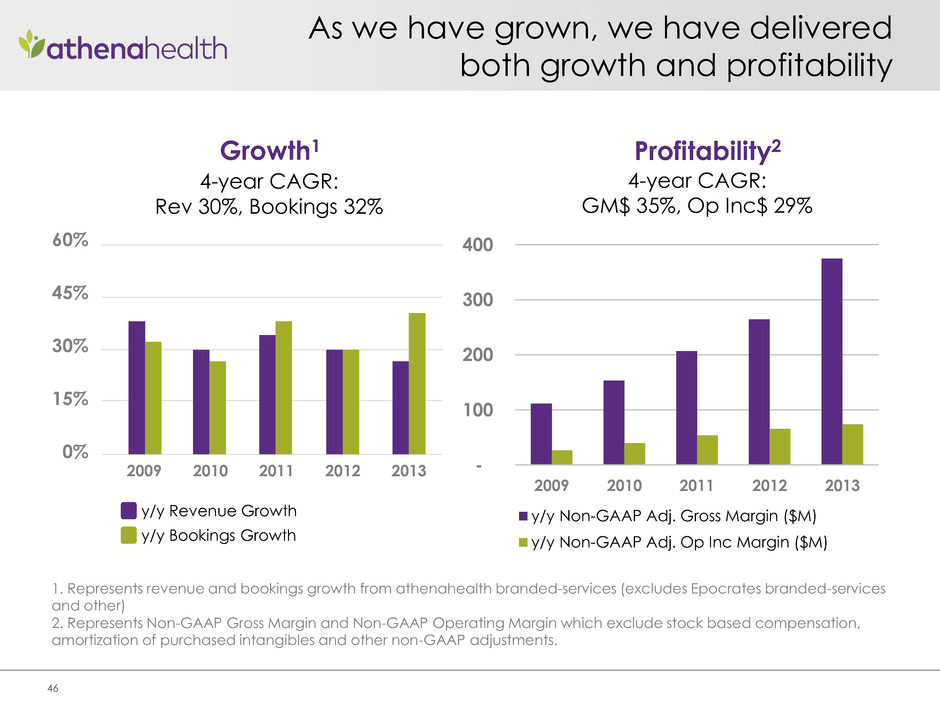
As we have grown, we have delivered both growth and profitability - 100 200 300 400 2009 2010 2011 2012 2013 y/y Non-GAAP Adj. Gross Margin ($M) y/y Non-GAAP Adj. Op Inc Margin ($M) 1. Represents revenue and bookings growth from athenahealth branded-services (excludes Epocrates branded-services and other) 2. Represents Non-GAAP Gross Margin and Non-GAAP Operating Margin which exclude stock based compensation, amortization of purchased intangibles and other non-GAAP adjustments. 46 Growth1 4-year CAGR: Rev 30%, Bookings 32% Profitability2 4-year CAGR: GM$ 35%, Op Inc$ 29% 60% 45% 30% 15% 0% 2009 2010 2011 2012 2013 y/y Revenue Growth y/y Bookings Growth

We continuously improve our gross margin while investing in our services 47 70’s1 Mature Services Emerging Services New Services 50’s – 60’s1 20’s or below1 1 Non-GAAP Adjusted Gross Margin, excluding implementation fees and implementation costs

Growing share from lower cost athena-owned channels 48 2015 budget includes a 30%+ increase in leads Developing low cost and high close rate channels 0% 10% 20% 30% 40% 50% 60% 70% 80% 90% 100% 2011 2012 2013 2014E 2015B Epocrates Affiliates Client Channel Partners Online Offline Events

Growing percentage of our R&D investment is focused on true innovation 49 1 R&D Project Categories: C1 (Stability), C2 (Gross Margin and Productivity), C3 (Service Enhancement), C4 ( New Service Development) 16% 12% 8% 4% 0% 2009 2010 2011 2012 2013 2014E 2015B C1/C2 61% 58% 56% 52% 50% 41% 39% C3/C4

We are making the necessary investments to attract, stimulate, and retain talent 50 San Francisco, CA Mobile Innovation Center of Excellent 200+ employees today Austin, TX Research & Development Hub 60+ today; 600 employees in 10 years Watertown, MA Company Headquarters 1400+ employees today Atlanta, GA Operations, Sales and Client Services Hub 200 today; 600 employees in 3 years Belfast, ME Operations Hub 700+ employees today Princeton, NJ Pharma Sales and Client Services 50+ employees today To support our growth, we are leveraging the competencies of different geographies Chennai, India Research & Development Hub 400+ employees today

51 We are athenaNation 3,525 employees 7 locations 5 services 48K applicants YTD 2014 5K unique candidate interviews YTD 2014 1200 new hires YTD 2014 44% new hires from employee referrals 4 day new hire immersive course 99% new hires attended NHO 4-7 week training for client-facing roles 30+ competency specific courses 4 leadership programs 65% unique learners in 2014* *On top of regulatory, compliance, and other required training
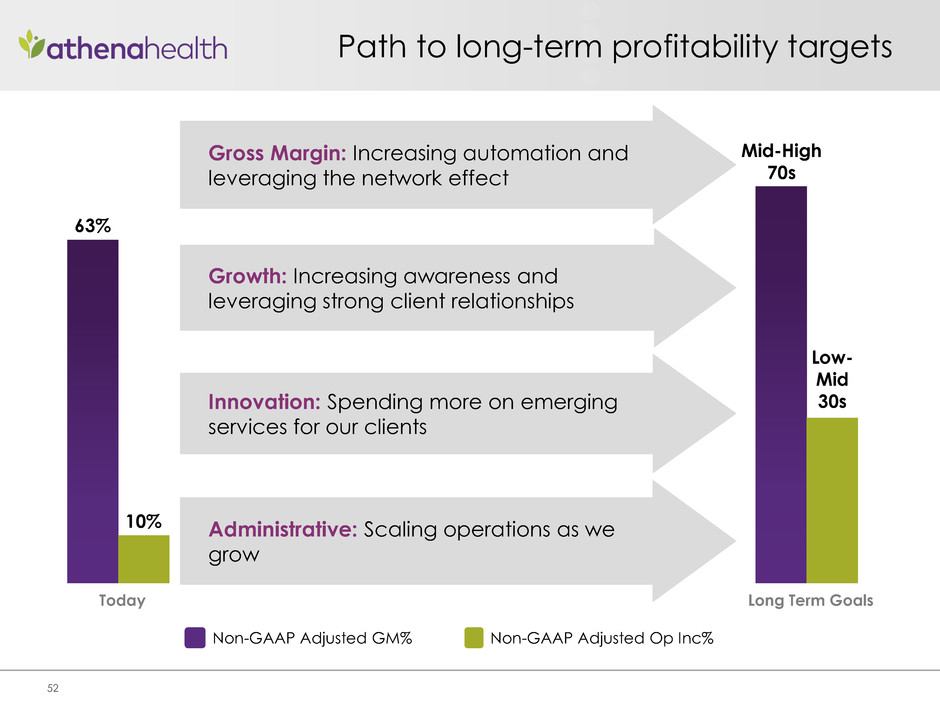
Path to long-term profitability targets 52 Today 63% 10% Long Term Goals Mid-High 70s Low- Mid 30s Gross Margin: Increasing automation and leveraging the network effect Growth: Increasing awareness and leveraging strong client relationships Innovation: Spending more on emerging services for our clients Administrative: Scaling operations as we grow Non-GAAP Adjusted GM% Non-GAAP Adjusted Op Inc%

53 2015 guiding principles 1 2 3 4 5 Grow bookings by 30% over fiscal year 2014 Maintain cost of bookings flat to fiscal year 2014 Improve non-GAAP adjusted gross margin for each service and overall Increase investment in research and development to support building our continuum of care strategy Scale general & administrative overall while strategically investing in select areas
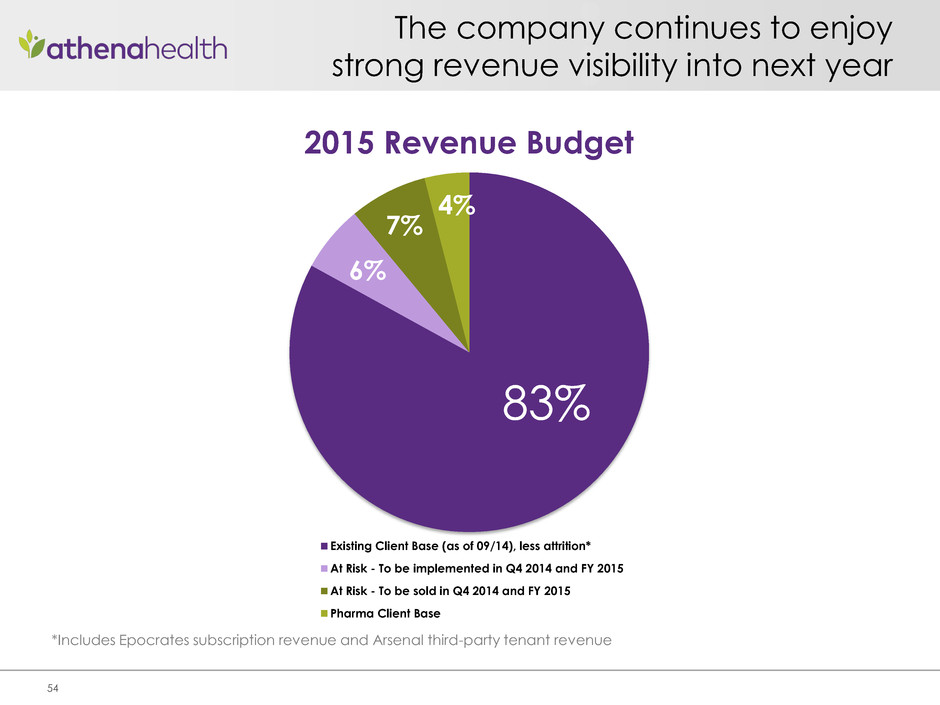
83% 6% 7% 4% Existing Client Base (as of 09/14), less attrition* At Risk - To be implemented in Q4 2014 and FY 2015 At Risk - To be sold in Q4 2014 and FY 2015 Pharma Client Base The company continues to enjoy strong revenue visibility into next year 54 *Includes Epocrates subscription revenue and Arsenal third-party tenant revenue 2015 Revenue Budget

We are introducing our fiscal year 2015 growth and profitability expectations 55 Fiscal Year 2015 Expectations GAAP Total Revenue $900 - $925 million Non-GAAP Adjusted Gross Margin1 63.0% - 64.0% Non-GAAP Adjusted Operating Income1 $80 - $90 million Non-GAAP Adjusted Net Income per Diluted Share1 $1.20 - $1.30 1 See non-GAAP reconciliation tables in the 12/10/14 press release Note: These estimates reflect our current operating plan as of December 11, 2014, and are subject to change as future events and opportunities arise.

The seeds of the health care internet are sprouting 56 Our strategies target massive, untapped market opportunities 1 2 3 Our success is aligned with our clients’ long- term success Our focused investments fuel future growth and profitability
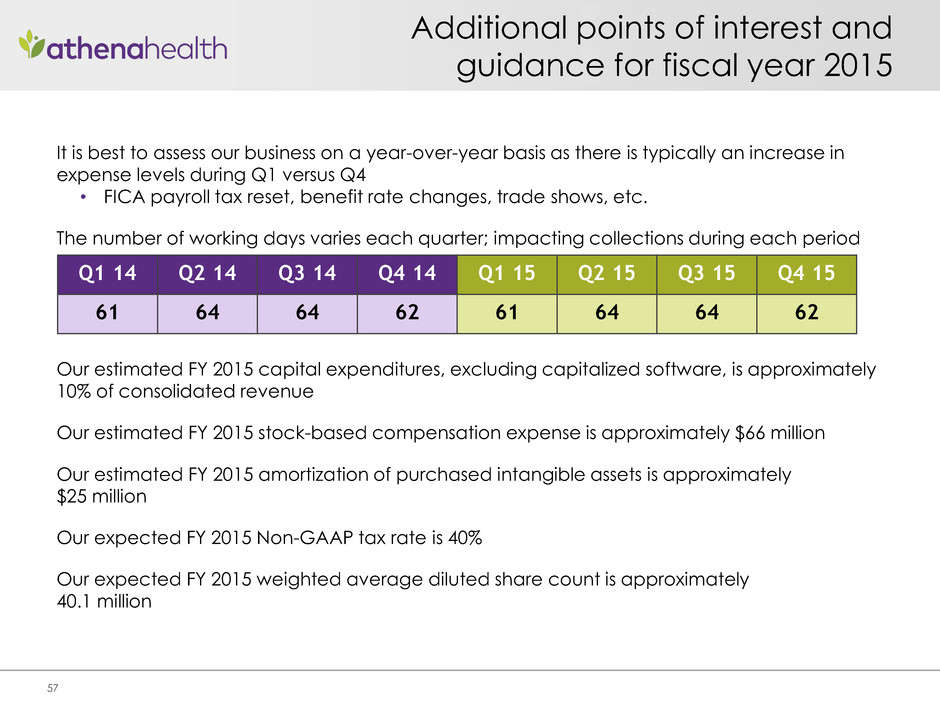
Additional points of interest and guidance for fiscal year 2015 57 It is best to assess our business on a year-over-year basis as there is typically an increase in expense levels during Q1 versus Q4 • FICA payroll tax reset, benefit rate changes, trade shows, etc. The number of working days varies each quarter; impacting collections during each period Our estimated FY 2015 capital expenditures, excluding capitalized software, is approximately 10% of consolidated revenue Our estimated FY 2015 stock-based compensation expense is approximately $66 million Our estimated FY 2015 amortization of purchased intangible assets is approximately $25 million Our expected FY 2015 Non-GAAP tax rate is 40% Our expected FY 2015 weighted average diluted share count is approximately 40.1 million Q1 14 Q2 14 Q3 14 Q4 14 Q1 15 Q2 15 Q3 15 Q4 15 61 64 64 62 61 64 64 62
Use of Non-GAAP financial measures In our earnings releases, conference calls, slide presentations, or webcasts, we may use or discuss non-GAAP financial measures as defined by SEC Regulation G. The GAAP financial measure most directly comparable to each non-GAAP financial measure used or discussed, and a reconciliation of the differences between each non-GAAP financial measure and the comparable GAAP financial measure, is available within this presentation and within our public filings with the Securities and Exchange Commission, available on the Investors section of our website at http://www.athenahealth.com. 58

Non-GAAP reconciliation for fiscal year 2014 expectations 59 Please note that the figures presented above may not sum exactly due to rounding. Non-GAAP Adjusted Gross Margin LOW HIGH Total revenue 725.0$ 755.0$ Direct operating expense 292.4 295.9 Total revenue less direct operating expense 432.6$ 459.1$ Add: Stock-based compensation expense allocated to direct operating expense 9.2 9.2 dd: Amortization of purchased intangible assets (1) allocated to direct operating expense 11.3 11.3 Non-GAAP Adjusted Gross Profit 453.1$ 479.6$ Non-GAAP Adjusted Gross Margin 62.5% 63.5% (1) Based on preliminary estimates related to purchase accounting for the Epocrates and Arsenal transactions. Fiscal Year Ending December 31, 2014

Non-GAAP reconciliation for fiscal year 2014 expectations 60 Non-GAAP Adjusted Operating Income Please note that the figures presented above may not sum exactly due to rounding. LOW HIGH Total revenue 725.0$ 755.0$ GAAP net loss (6.8) (1.2) Add: (Benefit) provision for income taxes (0.6) 1.7 Add: Total other expense 5.4 7.5 Add: Stock-based compensation expense 48.6 48.6 Add: Amortization of capitalized stock-based compensation related to software development 1.5 1.5 Add: Amortization of purchased intangible assets (1) 21.9 21.9 Non-GAAP Adjusted Operating Income 70.0$ 80.0$ Non-GAAP Adjusted Operating Income Margin 9.7% 10.6% (1) Based on preliminary estimates related to purchase accounting for the Epocrates and Arsenal transactions. Fiscal Year Ending December 31, 2014
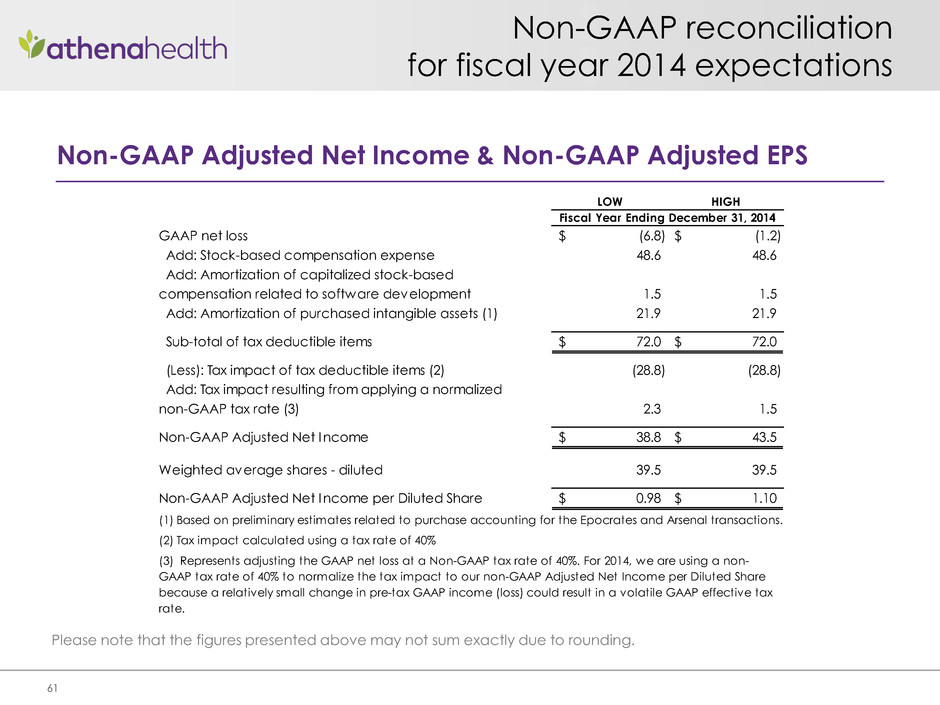
Non-GAAP reconciliation for fiscal year 2014 expectations 61 Please note that the figures presented above may not sum exactly due to rounding. Non-GAAP Adjusted Net Income & Non-GAAP Adjusted EPS LOW HIGH GAAP net loss (6.8)$ (1.2)$ Add: Stock-based compensation expense 48.6 48.6 Add: Amortization of capitalized stock-based compensation related to software development 1.5 1.5 Add: Amortization of purchased intangible assets (1) 21.9 21.9 Sub-total of tax deductible items 72.0$ 72.0$ (Less): Tax impact of tax deductible items (2) (28.8) (28.8) Add: Tax impact resulting from applying a normalized non-GAAP tax rate (3) 2.3 1.5 Non-GAAP Adjusted Net Income 38.8$ 43.5$ Weighted average shares - diluted 39.5 39.5 Non-GAAP Adjusted Net Income per Diluted Share 0.98$ 1.10$ (1) Bas d on preliminary estimates related to purchase accounting for the Epocrates and Arsenal transactions. (2) Tax impact calculated using a tax rate of 40% Fiscal Year Ending December 31, 2014 (3) Represents adjusting the GAAP net loss at a Non-GAAP tax rate of 40%. For 2014, we are using a non- GAAP tax rate of 40% to normalize the tax impact to our non-GAAP Adjusted Net Income per Diluted Share because a relatively small change in pre-tax GAAP income (loss) could result in a volatile GAAP effective tax rate.

Non-GAAP reconciliation for fiscal year 2014 expectations 62 Please note that the figures presented above may not sum exactly due to rounding. Non-GAAP Adjusted EPS LOW HIGH GAAP net loss per share - diluted (0.17)$ (0.03)$ Add: Stock-based compensation expense 1.23 1.23 Add: Amortization of capitalized stock-based compensation related to software development 0.04 0.04 Add: Amortization of purchased intangible assets (1) 0.55 0.55 Sub-total of tax deductible items 1.83$ 1.83$ (Less): Tax impact of tax deductible items (2) (0.73) (0.73) Add: Tax impact resulting from applying a normalized non-GAAP tax rate (3) 0.06 0.04 Non-GAAP Adjusted Net Income per Diluted Share 0.98$ 1.10$ Weighted average shares - diluted 39.5 39.5 (1) Based on preliminary estimates related to purchase accounting for the Epocrates and Arsenal transactions. (2) Tax impact calculated using a tax rate of 40% (3) Represents adjusting the GAAP net loss at a Non-GAAP tax rate of 40%. For 2014, we are using a non- GAAP tax rate of 40% to normalize the tax impact to our non-GAAP Adjusted Net Income per Diluted Share because a relatively small change in pre-tax GAAP income (loss) could result in a volatile GAAP effective tax rate. Fiscal Year Ending December 31, 2014
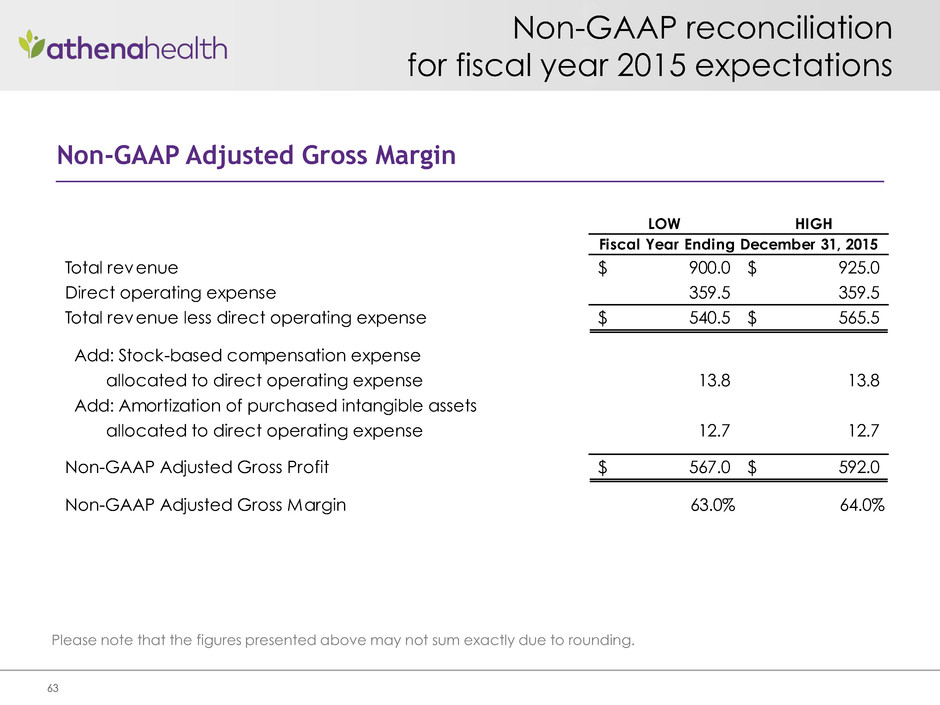
Non-GAAP reconciliation for fiscal year 2015 expectations 63 Please note that the figures presented above may not sum exactly due to rounding. Non-GAAP Adjusted Gross Margin LOW HIGH Total revenue 900.0$ 925.0$ Direct operating expense 359.5 359.5 Total revenue less direct operating expense 540.5$ 565.5$ Add: Stock-based compensation expense allocated to direct operating expense 13.8 13.8 Add: Amortization of purchased intangible assets allocated to direct operating expense 12.7 12.7 Non-GAAP Adjusted Gross Profit 567.0$ 592.0$ Non-GAAP Adjusted Gross Margin 63.0% 64.0% Fiscal Year Ending December 31, 2015

Non-GAAP reconciliation for fiscal year 2015 expectations 64 Please note that the figures presented above may not sum exactly due to rounding. Non-GAAP Adjusted Operating Income LOW HIGH Total revenue 900.0$ 925.0$ GAAP net loss (7.2) (3.1) Add: (Benefit) provision for income taxes (2.9) (0.4) Add: Total other (income) expense (0.2) 3.2 Add: Stock-based compensation expense 61.4 61.4 dd: Amortization of capitalized stock-based compensation related to software development 4.2 4.2 Add: Amortization of purchased intangible assets 24.7 24.7 Non-GAAP Adjusted Operating Income 80.0$ 90.0$ Non-GAAP Adjusted Operating Income Margin 8.9% 9.7% Fiscal Year Ending December 31, 2015

Non-GAAP reconciliation for fiscal year 2015 expectations 65 Please note that the figures presented above may not sum exactly due to rounding. Non-GAAP Adjusted Net Income and Non-GAAP Adjusted EPS LOW HIGH GAAP net loss (7.2)$ (3.1)$ Add: Stock-based compensation expense 61.4 61.4 Add: Amortization of capitalized stock-based compensation related to software development 4.2 4.2 Add: Amortization of purchased intangible assets 24.7 24.7 Sub-total of tax deductible items 90.3$ 90.3$ (Less): Tax impact of tax deductible items (1) (36.1) (36.1) Add: Tax impact resulting from applying a normalized non-GAAP tax rate (2) 1.2 1.0 Non-GAAP Adjusted Net Income 48.1$ 52.1$ Weighted average shares - diluted 40.1 40.1 Non-GAAP Adjusted Net Income per Diluted Share 1.20$ 1.30$ (1) Tax impact calculated using a tax rate of 40% Fiscal Year Ending December 31, 2015 (2) Represents adjusting the GAAP net loss at a Non-GAAP tax rate of 40%. For 2015, we are using a non-GAAP tax rate of 40% to normalize the tax impact to our non-GAAP Adjusted Net Income per Diluted Share because a relatively small change in pre-tax GAAP income (loss) could result in a volatile GAAP effective tax rate.

Non-GAAP reconciliation for fiscal year 2015 expectations 66 Please note that the figures presented above may not sum exactly due to rounding. Non-GAAP Adjusted EPS LOW HIGH GAAP net loss per share - diluted (0.18)$ (0.08)$ Add: Stock-based compensation expense 1.53 1.53 Add: Amortization of capitalized stock-based compensation related to software development 0.11 0.11 Add: Amortization of purchased intangible assets 0.61 0.61 Sub-total of tax deductible items 2.25$ 2.25$ (Less): Tax impact of tax deductible items (1) (0.90) (0.90) Add: Tax impact resulting from applying a normalized non-GAAP tax rate (2) 0.03 0.03 Non-GAAP Adjusted Net Income per Diluted Share 1.20$ 1.30$ Weighted average shares - diluted 40.1 40.1 (1) Tax impact calculated using a tax rate of 40% (2) Represents adjusting the GAAP net loss at a Non-GAAP tax rate of 40%. For 2015, we are using a non-GAAP tax rate of 40% to normalize the tax impact to our non-GAAP Adjusted Net Income per Diluted Share because a relatively small change in pre-tax GAAP income (loss) could result in a volatile GAAP effective tax rate. Fiscal Year Ending December 31, 2015

Presentation Break

Core Business Update Ed Park EVP, Chief Operating Officer

69

View From The Air
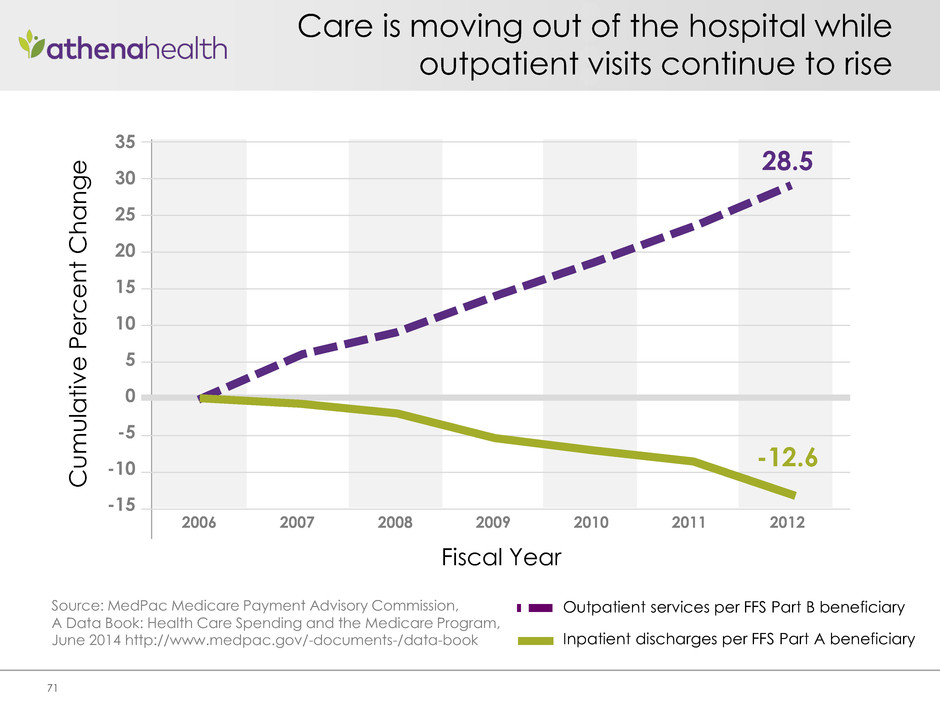
Care is moving out of the hospital while outpatient visits continue to rise 71 Source: MedPac Medicare Payment Advisory Commission, A Data Book: Health Care Spending and the Medicare Program, June 2014 http://www.medpac.gov/-documents-/data-book 2006 2007 2008 2009 2010 2011 2012 35 30 25 20 15 10 5 0 -5 -10 -15 Fiscal Year Cumu la ti v e Pe rc e n t C h a n g e 28.5 -12.6 Outpatient services per FFS Part B beneficiary Inpatient discharges per FFS Part A beneficiary

Well Visit (n=646,000) Colonoscopy (n=70,000) Outpatient Office Visit (n=6,683,000) MRI (n=45,000) Total Knee Replacement (n=15,000) One reason for this is that patients are bearing more of the cost of sick-care 72 Source: athenahealth data 2009 2012 $300 $250 $200 $150 $100 $50 $0 $15 Average Financial Responsibilit y $3 $53 $20 $32 $23 $132 $165 $170 $226 Note: For physicians in athenahealth network, patient obligations as a percent of allowables appear in bars Percent of Total Physician Allowable Charges 12% 2% 14% 9% 31% 33% 23% 28% 9% 11%


74 Source: Centers for Medicare & Medicaid Services, Office of the Actuary, Estimated Financial Effects of the “Patient Protection and Affordable Care Act,” as Amended, April 22, 2010 http://www.cms.gov/research-statistics-data-and-systems/research/actuarialstudies/downloads/ppaca_2010-04-22.pdf Medicare savings estimated at $575B The government is taking an axe to Medicare

Hospitals will bear the brunt of these cuts and margins will fall off a cliff 75 Source: http://www.tha.com/blog/Default.aspx?pid=17 5.0% 0.0% -5.0% -10.0% -15.0% -20.0% -25.0% Total Hospital Medicare Margins by Year 2003 2004 2005 2006 2007 2008 2009 2010 2011 2012 2013 2014 2015 2016 2017 2018 2019
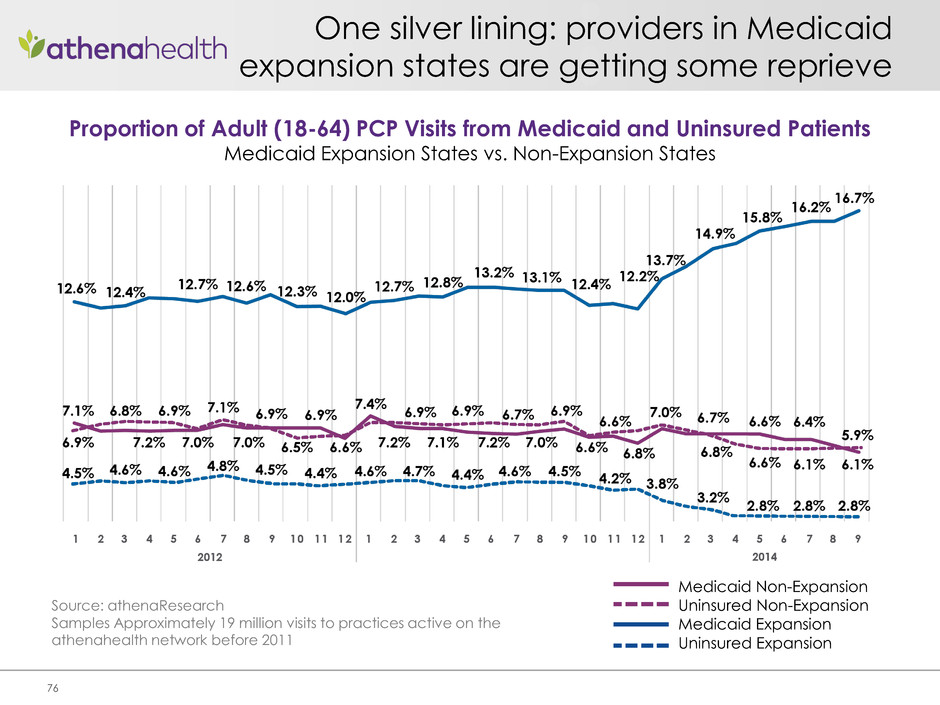
One silver lining: providers in Medicaid expansion states are getting some reprieve 76 Source: athenaResearch Samples Approximately 19 million visits to practices active on the athenahealth network before 2011 Proportion of Adult (18-64) PCP Visits from Medicaid and Uninsured Patients Medicaid Expansion States vs. Non-Expansion States Medicaid Non-Expansion Uninsured Non-Expansion Medicaid Expansion Uninsured Expansion

77 The new world order is creating a scramble for patient volume

Small Physician Group We see four consolidation plays on the healthcare chessboard 78 Hospital Imaging Center Lab Pharmacy Special Surgery Retail Clinic Small Physician Group At-risk health system Urgent Care Hospital Small Physician Group Small Physician Group Orthopedics Specialty Clinic At-risk health system 1. Hospital-Centered 2. Multi-Specialty Group 3. Focused Factory 4. Virtual Group

Regardless of strategy, providers need a partner to minimize controllable risks 79 Operational Risk Need “instant-on” implementations and best-practice core workflows 1 2 3 Regulatory Risk Need to guarantee MU/MU2 and be future-proofed against regulatory uncertainty– e.g., ICD-10 Financial Risk Must be capital-efficient – lightweight, self-funding models work best

80 The view from the trenches

Running a medical practice is a messy, complicated business 81 •Schedule visit •Run eligibility inquiry •Send reminder call •Collect co-pay via credit card or e-check transaction •Ask about P4P-related clinical protocol measure •Document visit •Order prescription •Order lab order •Send referral •Order Immunization •File with state immunization registry •Send claim to payer •Submit pay for performance report •Receive lab results •Notify patient of lab results on patient portal •Receive consult note •Receive EOB from payer •File appeal if claim denied •Post payment from payer •Pay outstanding balance via web portal

… and it is only getting more complex • Portal Registration • Direct scheduling • Referral management • Pre- authorization • Pre-certification • CCD exchange 82

83

84

We follow a tried and true approach for scaling and growing our services 85 Volume Cos t HIGH LOW LOW HIGH Service Maturity Perform & Learn Standardize & Aggregate Automate

Many folks still think of what we do as mostly software or mostly services Cost to operate & deliver services 86 Cost to license, implement & maintain software vs.

The truth is that we’re both, and that has created a powerful and forgiving business model 87

1 Visibility 2 Insight 3 Action

One example: although we’re in the age of “digitization,” paper is still ubiquitous 89

Building interfaces to eliminate this paper has created a scalable asset 90 # Electronic Transactions (Millions) # Active Interfaces (Thousands) 1,000 750 500 250 - 2010 2011 2012 2013 Q3 YTD 2014 200 150 100 50 0
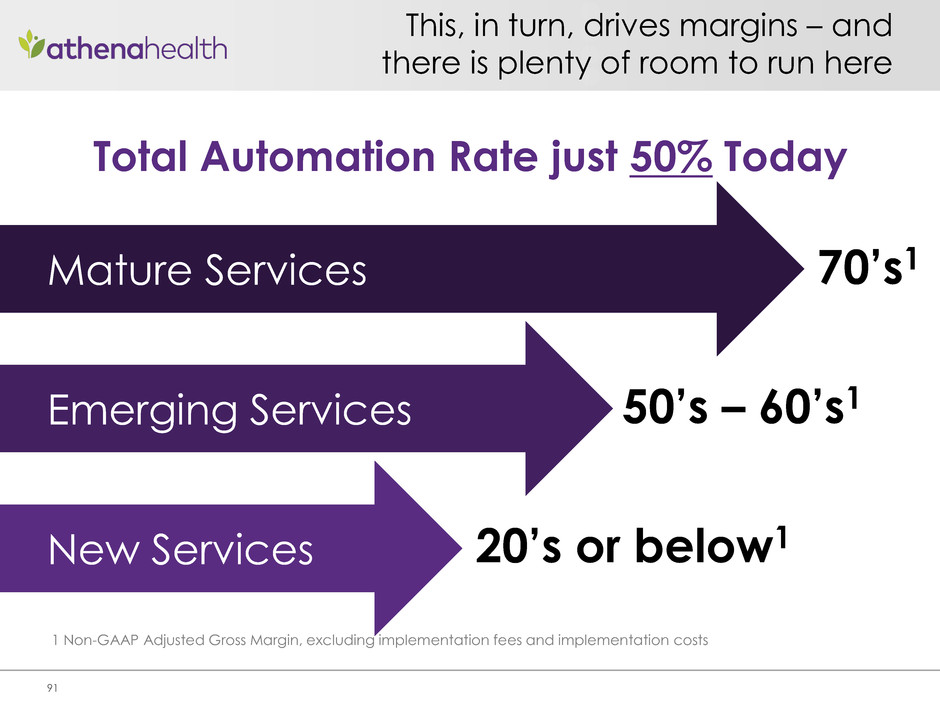
This, in turn, drives margins – and there is plenty of room to run here 91 1 Non-GAAP Adjusted Gross Margin, excluding implementation fees and implementation costs 70’s1 Mature Services Emerging Services New Services 50’s – 60’s1 20’s or below1 Total Automation Rate just 50% Today
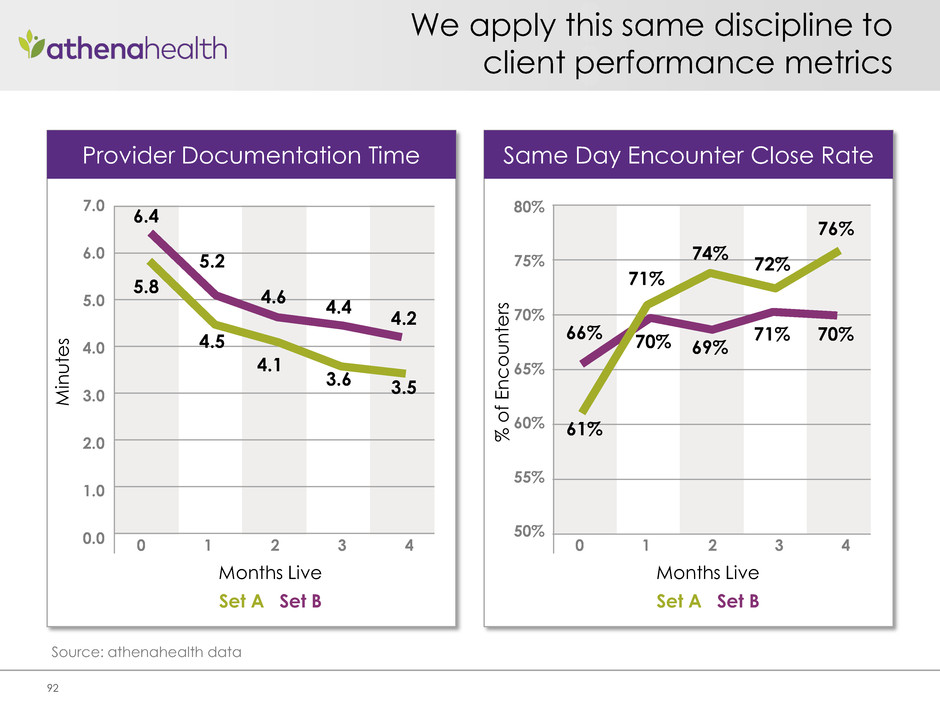
We apply this same discipline to client performance metrics 92 Provider Documentation Time Same Day Encounter Close Rate 0 1 2 3 4 Months Live 80% 75% 70% 65% 60% 55% 50% % of Encou n te rs Set A Set B 66% 70% 71% 69% 70% 71% 74% 72% 76% 61% 0 1 2 3 4 Months Live 7.0 6.0 5.0 4.0 3.0 2.0 1.0 0.0 M in u te s Set A Set B 6.4 5.2 4.6 4.4 4.2 5.8 4.5 4.1 3.6 3.5 Source: athenahealth data

And we’re applying this discipline to help clients close gaps in care 93 Medicare Annual Wellness Visit % of patients who utilized annual service 12% 33% National average athenahealth clients SOURCE: http://downloads.cms.gov/files/Beneficiaries-Utilizing-Free-Preventive-Services-by-State-YTD2013.pdf

6% increase in collections 8% decrease in no show rate 95% Meaningful Use attestation rate (2013) 32% reduction in days in accounts receivable 97% provider adoption rate

We are being rewarded as a first mover in a post-software world 95 athenaCollector Providers athenaClinicals Providers athenaCommunicator Providers 2007: 12,118 2009: 1,471 2010: 1,213 2014: 59,415 2014: 23,053 2014: 38,699

Key takeaways 96 The rules of the game keep changing and it is straining providers’ capabilities to keep up 1 2 3 Over the years, we’ve built a scalable asset that helps our clients thrive It is still the early innings of a long game and our results are being rewarded with growth

Emerging Services Update Jeremy Delinsky SVP, Chief Technology Officer

Our success formula requires an experience that feels native to athenaNet 98
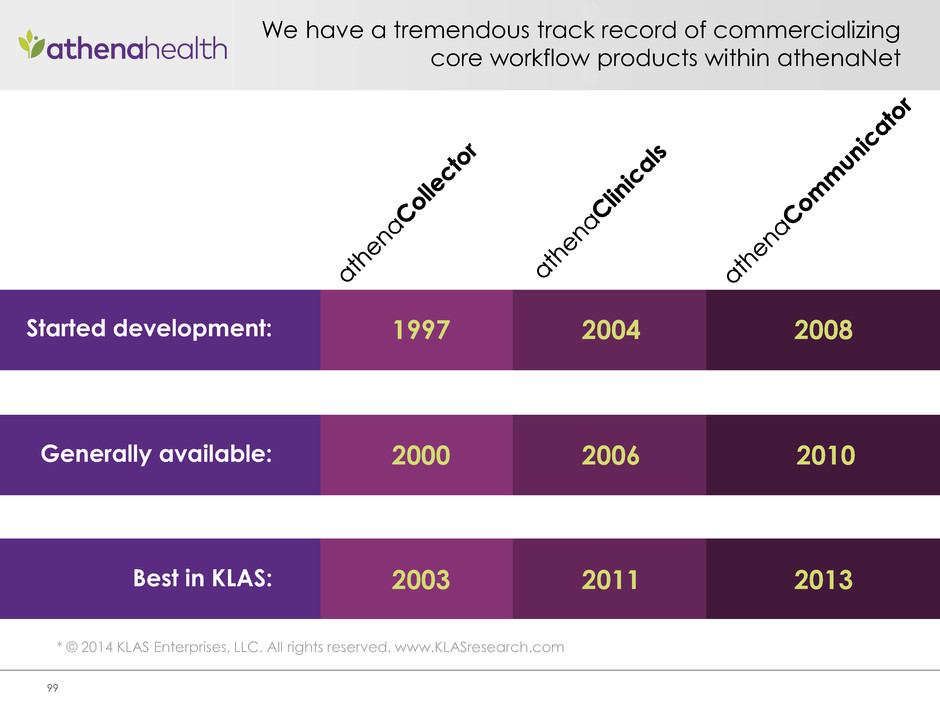
We have a tremendous track record of commercializing core workflow products within athenaNet 99 Started development: Generally available: Best in KLAS: 1997 2004 2008 2000 2006 2010 2003 2011 2013 * © 2014 KLAS Enterprises, LLC. All rights reserved. www.KLASresearch.com

Disciplined M&A has long been a key part of our core product development theory 100 Product Acceleration Capability and Expertise Access and Awareness Cost and Complexity ✔ ✔ ✔ ✔

More recently, the seamless integration of other cloud-based services became a key component of product theory 101 • Entrepreneurs and startups with a shared mission • Conferences, hackathons, and other events encourage collaboration across the continuum of care Network • Disruptive health IT solutions that are beta tested and integrated with athenaNet • athenahealth’s 59,000+ providers shop for integrated solutions Marketplace • Early-stage, high- potential startups based in Watertown headquarters • athenahealth invests in portfolio companies and provides access to resources and APIs Accelerator

And this is how we are going after the market 102 Enterprises CDS, CME, athenaTextSM athenaText Clinicals Enterprise Communicator Enterprise Collector Enterprise Coordinator Enterprise Individuals Informal groups Formal groups

Emerging Service athenaTextSM
104 Awareness and access Distribution of clinical decision support Personal hub for all physicians Remote control layer on top of EHR

Physicians are using tools from their consumer lives to coordinate care 105 82% of physicians indicate the need for better collaboration in patient care 7% no need 11% unsure 42% Unsecure text message non-HIPAA compliant 58% EHR HIPAA compliant 42% secure email HIPAA compliant 71% phone call HIPAA compliant Physician Collaboration Tools @ Source: 2014 HIMSS Analytics Mobile Technology Survey
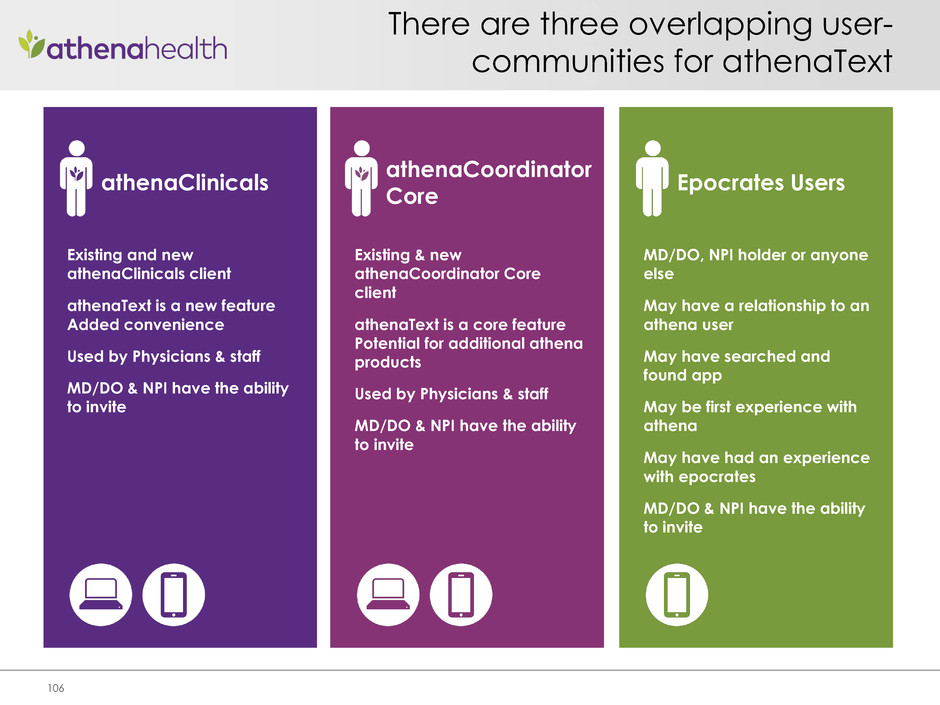
There are three overlapping user- communities for athenaText 106 athenaClinicals Epocrates Users athenaCoordinator Core Existing and new athenaClinicals client athenaText is a new feature Added convenience Used by Physicians & staff MD/DO & NPI have the ability to invite Existing & new athenaCoordinator Core client athenaText is a core feature Potential for additional athena products Used by Physicians & staff MD/DO & NPI have the ability to invite MD/DO, NPI holder or anyone else May have a relationship to an athena user May have searched and found app May be first experience with athena May have had an experience with epocrates MD/DO & NPI have the ability to invite

athenaText will simultaneously launch on three platforms 107 Secure. Immediate. Designed for health care providers. athenaText is a secure messaging application for medical professionals that enables better collaboration around patient care. Collaborative Connect across care teams Convenient Share information instantly Secure Enables HIPAA compliance

We are carefully “growth hacking” for network adoption 108 athenaClinicals & athenaCoordinator Core Users Epocrates Users

Emerging Service athenaCoordinator® Enterprise

The front-end of the health system is a revenue sieve… in an era of unprecedented financial pressure 110 Patients wait 33.4 days for follow-up care by playing appointment charades3 The average practice’s schedule is only3 70% full hospitals provided over $49B of uncompensated care in 20131 50% Of consult + imaging orders not closed3 88% Of patients have not received their Well Visit2 1 http://marketrealist.com/2014/11/understanding-hospitals-bad-debt-expenses-profitability/ 2 http://downloads.cms.gov/files/Beneficiaries-Utilizing-Free-Preventive-Services-by-State-YTD2013.pdf 3 athenahealth data

athenaCoordinator Enterprise uses a 3-pronged approach to deliver value 111 Open and optimize capacity 1 Identify patients in need of care 2 Enable seamless transitions in care 3

The results, though early, are promising in our Alpha deployment experience 112 Our tools help manage 8% of the at-risk lives in the country 18.8% of direct scheduled appointments made by affiliated entities 45.6% improvement in first year ACO33 quality scores 65.2% reduction in referral- related denials Appointment wait times reduced to 3.25 days from over 30 days X Source: athenahealth data

Emerging Service athenaClinicals® Enterprise
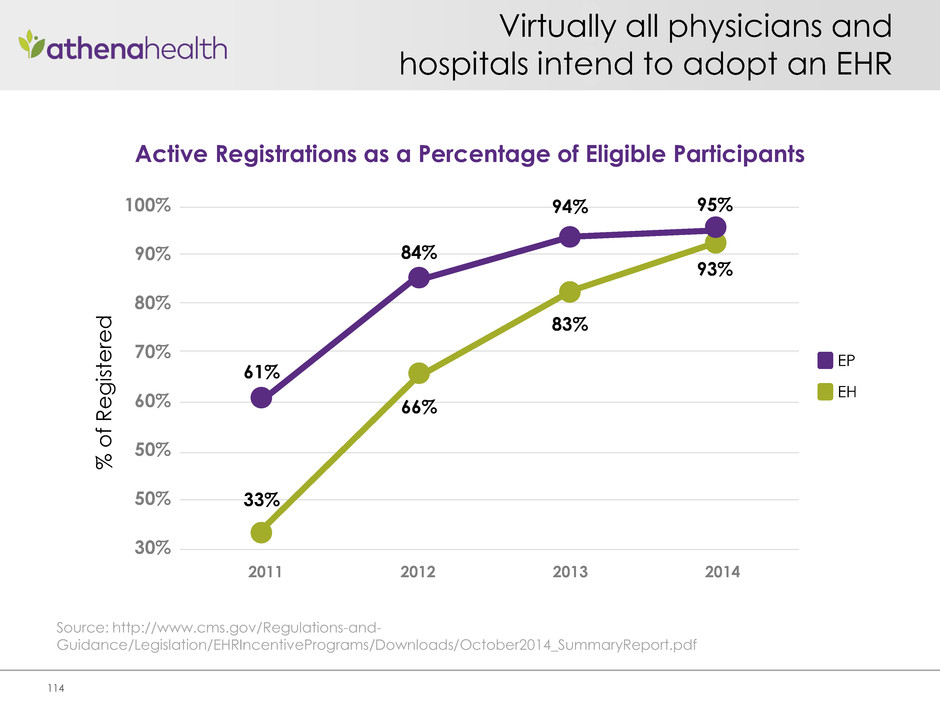
Virtually all physicians and hospitals intend to adopt an EHR EH EP Active Registrations as a Percentage of Eligible Participants 100% 90% 80% 70% 60% 50% 50% 30% % of R e g is te re d 2011 2012 2013 2014 33% 61% 84% 66% 83% 93% 95% 94% Source: http://www.cms.gov/Regulations-and- Guidance/Legislation/EHRIncentivePrograms/Downloads/October2014_SummaryReport.pdf 114

Those intentions aren’t translating into results 87% of physicians can’t exchange information electronically with others outside their organization of eligible hospitals attested to Stage 1 MU of eligible hospitals have attested to Stage 2 MU 85% 34% 41% of EHR adopters can’t even enter lab and imaging orders or request a consult electronically 72% of adults can’t access their online medical record Source: http://www.healthit.gov/facas/sites/faca/files/HITPC_CMS_DataUpdate_2014-12-09.pptx http://www.healthit.gov/FACAS/sites/faca/files/HITPC_InteroperabilityUpdate_2014-08-06.pdf 115

Fewer vendors than ever are passing today’s basic, MU-driven functional requirements 116 LOSSES WINS LEGEND Losses, 1-200 Beds Losses, Over 200 Beds Wins, 1-200 Beds Wins, Over 200 Beds Source: “Clinical Market Share 2014: Competition Mounts as Markets Collide,” June 2014. © KLAS Enterprises, LLC. All rights reserved. www.KLASresearch.com

And the hospital business model is under assault, necessitating new operating platforms 117 Source: http://www.tha.com/blog/Default.aspx?pid=17 5.0% 0.0% -5.0% -10.0% -15.0% -20.0% -25.0% Total Hospital Medicare Margins by Year 2003 2004 2005 2006 2007 2008 2009 2010 2011 2012 2013 2014 2015 2016 2017 2018 2019

…Which has led to declaration of the “post-EHR” or “post-MU” era 118 “U.S. providers are feeling themselves in a place where they may have implemented the full functionality of an EHR, and they look at the roadmap for their EHR supplier and do not see the types of tools they need in order to restore productivity. They're looking at communication and care coordination, and at things that go beyond EHRs” – Judy Hanover, Research Director, IDC “The EHR is still going to be the heavy transaction system as you move forward… It's going to be the plumbing, the foundation – but you're going to have a layer of smarts on top of that.” – Zane Burke, President, Cerner “We see this across industries and across time – technologies you put in place today, over the course of 10 years, become obsolete or are certainly overtaken by new, cool, much more potent stuff” – John Glaser, CEO, Siemens Healthcare

We’re ready to lead a “post-software” service-rich future beyond ambulatory Ready for fee-for-value Open platform Easy, automatic updates Rapid, low-cost implementation Best in KLAS usability #1 No capex Designed first for mobile Single patient record across the continuum of care Visibility, insight & performance coaching Interoperability-as-a-service Software | Knowledge | Work

Past performance is not an indicator of future outcomes… but we love our chances Convenient care Physician Office Ancillary Setting Hospital Post-Acute Care Long-Term Care Home Generally available: 2000 2006 2010 2015 2015 1997 2004 2008 2013 2014 2015 Started development: Best in KLAS: 2003 2011 2013 NA athenaOne athenaOne Enterprise

Presentation Break

Stephen Kahane, M.D., M.S. President, Enterprise Solutions Client Panel Discussion

Client Panel 123 Andrew Aronson, M.D. Chief Medical Officer Privia Health Peter Plantes, M.D. CEO & Chief Physician Executive CHRISTUS Physician Network John Stewart SVP & Operations Leader Ascension Physician Services Moderator Stephen Kahane, M.D., M.S., President, Enterprise Solutions Panelists

Management Q&A

Closing Remarks Jonathan Bush Chairman & CEO

Thank You