Fourth Quarter and Fiscal Year 2014 
Prepared Remarks February 5, 2015
Jonathan Bush, Chairman & Chief Executive Officer
Kristi Matus, Executive Vice President, Chief Financial & Administrative Officer
About These Remarks
The following commentary is provided by management in conjunction with the fourth quarter and full year 2014 earnings press release issued by athenahealth, Inc. (“athenahealth” or “we”). These remarks represent management’s current views on our financial and operational performance and are provided to give investors and analysts more time to analyze and understand our performance in advance of the earnings conference call. These prepared remarks will not be read on the conference call. A complete reconciliation between generally accepted accounting principles (“GAAP”) and non-GAAP results, as well as a summary of supplemental metrics and definitions, is provided in the tables following these prepared remarks.
Earnings Conference Call Information
We will conduct a conference call tomorrow, Friday, February 6, 2015, at 8:00 a.m. Eastern Time. To participate in our live conference call and webcast, please dial 877-853-5645 (or 408-940-3868 for international calls) using conference code No. 65581423, or visit the Investors section of our web site at www.athenahealth.com. A replay will be available for one week following the conference call at 855-859-2056 (and 404-537-3406 for international calls) using conference code No. 65581423. A webcast replay will also be archived on our website.
Safe Harbor and Forward-Looking Statements
These remarks contain forward-looking statements, which are made pursuant to the safe harbor provisions of the Private Securities Litigation Reform Act of 1995, including statements reflecting management’s expectations for future financial and operational performance and operational expenditures, expected growth, and business outlook, including the updated fiscal year 2015 guidance; statements regarding our research and development efforts and product offering and upgrade plans and timelines, including athenaClinicals® Enterprise, athenaCommunicator® Enterprise, athenaCoordinator® Enterprise, and the streamlined athenaNet® experience; the benefits of and anticipated operational results from our service offerings and demand for our service offerings; the further integration of our services and the resulting benefits; changes in the types of providers and health care entities we serve and the range of tasks we perform for clients; our sales, marketing and partnering activities and plans, including the increase of accelerator companies; the integration of Epocrates and building of new functionalities such as Secure Text Messaging and integration of existing functionality with our EHR; client behavior and preferences, and implementation of services for new clients and deals; our market position and awareness among physicians; the potential for cross-sales among service offerings and sales involving multiple services; our implementation pipeline and expectations on new deals and network growth; the expansion of the number of users of our services; our plans and readiness in regard to ICD-10 and Stage 2 of Meaningful Use; changes in the industry, including an increased emphasis on coordinated care; the creation of a sustainable market for health information exchange, an ecosystem of developers and third-party service providers, and the health care internet; and statements found under our “Reconciliation of Non-GAAP Financial Measures to Comparable GAAP Measures” and “Reconciliation of Non-GAAP Financial Measures to Comparable GAAP Measures for Fiscal Year Guidance” sections of these remarks. Forward-looking statements may often be identified with words such as “we expect,” “we anticipate,” “upcoming,” “plan,” “aim,”or similar indications of future expectations. These statements are neither promises nor guarantees, and are subject to a variety of risks and uncertainties, many of which are beyond our control, which could cause actual results to differ materially from those contemplated in these forward-looking statements. In particular, the risks and uncertainties include, among other things: our fluctuating operating results; our variable sales and implementation cycles, which may result in fluctuations in its quarterly results; risks associated with the acquisition and integration of companies and new technologies, including those related to our ability to successfully scale the athenaCoordinator services, those related to our ability to integrate the services, offerings, and technologies of Epocrates, RazorInsights, and webOMR and realize the expected benefits such as increased awareness among physicians of our overall services and offerings and coordination of care across all
settings; risks associated with our ability to realize the expected benefits from the purchase of the Arsenal on the Charles campus in Watertown, Massachusetts; risks associated with our expectations regarding our ability to maintain profitability; the impact of increased sales and marketing expenditures, including whether increased expansion in revenues is attained and whether impact on margins and profitability is longer term than expected; changes in tax rates or exposure to additional tax liabilities; the highly competitive industry in which we operate and the relative immaturity of the market for our service offerings; and the evolving and complex governmental and regulatory compliance environment in which we and our clients operate. Existing and prospective investors are cautioned not to place undue reliance on these forward-looking statements, which speak only as of the date hereof. We undertake no obligation to update or revise the information contained in these remarks, whether as a result of new information, future events or circumstances, or otherwise. For additional disclosure regarding these and other risks faced by us, see the disclosures contained in our public filings with the Securities and Exchange Commission (“SEC”), available on the Investors section of our website at www.athenahealth.com and on the SEC’s website at www.sec.gov.
Use of Non-GAAP Financial Measures
These remarks contain non-GAAP financial measures, as defined by SEC Regulation G. The GAAP financial measure most directly comparable to each non-GAAP financial measure used or discussed, and a reconciliation of the differences between each non-GAAP financial measure and the comparable GAAP financial measure, are included following these prepared remarks or can be found within our fourth quarter and full year 2014 earnings press release in the Investors section of our web site at www.athenahealth.com.
Opening Remarks
2014 has been a year of connecting to providers, trading partners, patients, and disruptive innovators. We connected 12,137 new athenaCollector® providers onto athenaNet bringing our total providers to 62,349. We connected these providers to their trading partners via our 161,337 active interfaces. We connected care across all key settings with our athenaCoordinator services and grew our sender base to 11,772 nodes and our receiver base to 5,449 nodes. We connected patients to better care by launching 16 population health campaigns as part of our athenaOne service. We also connected to innovators through our More Disruption Please program and exited the year with 36 partners selling their services into our client base. We believe in a more connected health care experience for all. We aim to build the necessary connections across the entire care continuum and are well on our way to building the health care internet.
Highlights from Q4 2014 are summarized below:
| |
• | Grew consolidated revenue by 24% and core athenahealth revenue by 31% over Q4 2013 |
| |
| • | Grew net new active physicians on athenaCollector (2,317 physicians added), athenaClinicals (1,353 physicians added), and athenaCommunicator (2,480 physicians added) in Q4 2014, compared to athenaCollector (2,094 physicians added), athenaClinicals (987 physicians added), and athenaCommunicator (4,186 physicians added) in Q4 2013 |
| |
| • | Signed our fourth athenaCoordinator Enterprise deal |
| |
| • | Completed implementations at Saint Peter’s Healthcare System (athenaOne®), University of Toledo Physicians (athenaOne), Granite Healthcare Network (athenaCoordinator Enterprise Population Manager) and Detroit Medical Group (athenaCollector) |
| |
| • | Grew physician awareness of athenahealth from 36% in 2013 to 41% in 2014 and C-suite awareness from 44% in 2013 to 51% in 2014. Note: a more accurate method of accounting for physicians in the market was put into practice for weighting purposes which changed 2013 awareness score from 39% to 36% |
| |
| • | Named gold award winner for “Best Mobile App for Healthcare” (Epocrates Bugs + Drugs) by Medical Marketing & Media in October 2014 |
| |
| • | Named #1 “Most Important Mobile Healthcare App” (Epocrates) by Modern Healthcare readers for the third year in a row in October 2014 |
| |
| • | Expanded our More Disruption Please Accelerator program to include CredSimple, a medical credentialing solution for hospitals and health insurers that automates the verification of providers’ qualifications; and RubiconMD, a medical referral company that connects primary care physicians with specialist expertise at the point of care via remote consults |
Results Overview
athenahealth’s top line results for the fourth quarter and fiscal year (“FY”) 2014 reflect solid revenue growth:
| |
| ◦ | $213.2 million in Q4 2014, representing 24% growth over $171.6 million in Q4 2013 |
| |
| ▪ | athenahealth-branded revenue was $195.9 million in Q4 2014, representing 31% growth over $149.0 million for Q4 2013 |
| |
| ▪ | Epocrates-branded revenue was $12.8 million in Q4 2014, representing a 32% decline from $18.9 million for Q4 2013 |
| |
| ▪ | Third-party tenant and other non-core revenue was $4.5 million in Q4 2014, representing 22% growth over $3.7 million for Q4 2013 |
| |
| ◦ | $752.6 million in FY 2014, representing 26% growth over $595.0 million in FY 2013 |
| |
| ▪ | athenahealth-branded revenue was $690.0 million in FY 2014, representing 29% growth over $532.9 million for FY 2013 |
| |
▪ | Epocrates-branded revenue was $44.5 million in FY 2014, representing a 15% decline from $52.4 million for FY 2013 |
| |
▪ | Third-party tenant and other non-core revenue was $18.1 million in FY 2014, representing 87% growth over $9.7 million for FY 2013 |
Our bottom line results for Q4 and FY 2014, consistent with our growth strategy, demonstrate focused sales, marketing, and research and development investments, and a focus on operating efficiencies:
| |
| • | Non-GAAP Adjusted Gross Profit: |
| |
| ◦ | $143.1 million, or 67.1% of total revenue, in Q4 2014, an increase of 26% over $113.7 million, or 66.2% of total revenue, in Q4 2013 |
| |
| ◦ | $474.3 million, or 63.0% of total revenue, in FY 2014, an increase of 27% over $374.7 million, or 63.0% of total revenue, in FY 2013 |
| |
| • | GAAP selling and marketing expense: |
| |
| ◦ | $50.5 million, or 23.7% of total revenue, in Q4 2014, an increase of 33% over $37.9 million, or 22.1% of total revenue, in Q4 2013 |
| |
| ◦ | $189.7 million, or 25.2% of total revenue, in FY 2014, an increase of 27% over $149.5 million, or 25.1% of total revenue, in FY 2013 |
| |
| • | GAAP research and development expense: |
| |
| ◦ | $19.8 million, or 9.3% of total revenue, in Q4 2014, an increase of 21% over $16.3 million, or 9.5% of total revenue, in Q4 2013 |
| |
| ◦ | $69.5 million, or 9.2% of total revenue, in FY 2014, an increase of 21% over $57.6 million, or 9.7% of total revenue, in FY 2013 |
| |
| • | GAAP general and administrative expense: |
| |
| ◦ | $33.6 million, or 15.8% of total revenue, in Q4 2014, an increase of 50% over $22.3 million, or 13.0% of total revenue, in Q4 2013 |
| |
| ◦ | $125.2 million, or 16.6% of total revenue, in FY 2014, an increase of 25% over $99.8 million, or 16.8% of total revenue, in FY 2013 |
| |
| • | Non-GAAP Adjusted EBITDA: |
| |
| ◦ | $55.8 million, or 26.2% of total revenue, in Q4 2014, an increase of 20% from $46.6 million, or 27.2% of total revenue, in Q4 2013 |
| |
| ◦ | $149.8 million, or 19.9% of total revenue in FY 2014, an increase of 29% over $116.5 million, or 19.6% of total revenue, in FY 2013 |
| |
| ◦ | Non-GAAP Adjusted Operating Income: |
| |
| ◦ | $38.5 million, or 18.0% of total revenue, in Q4 2014, an increase of 13% from $34.1 million, or 19.9% of total revenue, in Q4 2013 |
| |
| ◦ | $87.3 million, or 11.6% of total revenue in FY 2014, an increase of 18% over $74.0 million, or 12.4% of total revenue, in FY 2013 |
| |
| • | Non-GAAP Adjusted Net Income: |
| |
| ◦ | $22.5 million, or $0.58 per diluted share, in Q4 2014, an increase of 2% from $22.1 million, or $0.57 per diluted share, in Q4 2013 |
| |
| ▪ | For 2014, we used a non-GAAP tax rate of 40% to normalize the tax impact to our Non-GAAP Adjusted Net Income per Diluted Share based on the fact that a relatively small change in pre-tax GAAP income (loss) could result in a volatile GAAP effective tax rate. If this approach had been used for the three months ended December 31, 2013, our Non-GAAP Adjusted Net Income per Diluted Share would have been $0.51 instead of $0.57. |
| |
| ◦ | $49.5 million, or $1.31 per diluted share, in FY 2014, an increase of 12% from $44.3 million, or $1.16 per diluted share, in FY 2013 |
| |
| ▪ | For 2014, we used a non-GAAP tax rate of 40% to normalize the tax impact to our Non-GAAP Adjusted Net Income per Diluted Share based on the fact that a relatively small change in pre-tax GAAP income (loss) could result in a volatile GAAP effective tax rate. If this approach had been used for the twelve months ended December 31, 2013, our Non-GAAP Adjusted Net Income per Diluted Share would have been $1.10 instead of $1.16. |
We measure our performance based on a balanced scorecard model. We believe that this framework is an excellent report card for our performance for the current year and that it measures the key performance indicators required for long-term success. The table below shows the scorecard results for Q1 2014, Q2 2014, Q3 2014, Q4 2014, and FY 2014. For certain metrics (i.e., Days of Client Work and Provider Documentation Time), our goal is to improve our performance by effectively reducing the scorecard metrics results throughout the year. Please reference the last page of this document for definitions of our corporate scorecard metrics.
|
| | | | | | | | | | | | | | | |
| | Q1 2014
Results | Q2 2014
Results | Q3 2014
Results | Q4 2014 Results | FY 2014 Results |
| |
| | | | | | |
| Stability (10% weight) | | | | | |
| Voluntary Turnover | 2.3 | % | 3.2 | % | 2.5 | % | 2.2 | % | 10.2 | % |
| Corporate Citizenship | 92.5 | % | 90.8 | % | 95.4 | % | 91.5 | % | 92.5 | % |
| Employee Engagement | 4.1 |
| 4.1 |
| (a) |
| 4.1 |
| 4.1 |
|
| Stability Results | 101 | % | 80 | % | 98 | % | 102 | % | 95 | % |
| | | | | | |
| Performance (35% weight) | | | | | |
| Total Automation Rate | 48.2 | % | 49.0 | % | 49.7 | % | 51.2 | % | 49.5 | % |
| Net On-Boarding Success | 67.1 | % | 65.0 | % | 66.5 | % | 67.5 | % | 66.5 | % |
| Patient Full Registration | 49.5 | % | 50.8 | % | 52.4 | % | 53.7 | % | 51.6 | % |
| Performance Results | 103 | % | 101 | % | 99 | % | 95 | % | 99 | % |
| | | | | | |
| Satisfaction (25% weight) | | | | | |
| Net Promoter Score | 44.7 |
| 41.2 |
| 47.5 |
| 42.0 |
| 43.9 |
|
| Days of Client Work | 8.8 |
| 8.8 |
| 9.4 |
| 9.6 |
| 9.2 |
|
| Provider Documentation Time | 5.4 |
| 5.3 |
| 5.3 |
| 5.2 |
| 5.3 |
|
| Minutes per RVU | 11.7 |
| 12.0 |
| 10.8 |
| 10.1 |
| 11.2 |
|
| Satisfaction Results | 92 | % | 86 | % | 85 | % | 78 | % | 85 | % |
| | | | | | |
| Financial (30% weight) | | | | | |
| Bookings (b) | (b) | (b) | (b) | (b) | (b) |
| Total Revenue ($M) | $ | 163.0 |
| $ | 185.9 |
| $ | 190.4 |
| $ | 213.2 |
| $ | 752.6 |
|
| Non-GAAP Adjusted Operating Income ($M) | $ | 8.7 |
| $ | 21.6 |
| $ | 18.5 |
| $ | 38.5 |
| $ | 87.3 |
|
| #Physicians on the Network | 296,477 |
| 297,652 |
| 303,895 |
| 310,578 |
| 302,151 |
|
| Financial Results | 99 | % | 100 | % | 82 | % | 95 | % | 93 | % |
| | | | | | |
| Total Results | 99 | % | 95 | % | 90 | % | 92 | % | 94 | % |
| |
| (a) | Employee Engagement survey results reported in Q1, Q2, and Q4 only. |
| |
| (b) | Since the bookings metric contains highly sensitive data, we do not disclose all of the specific performance measures and targets, because we believe that such disclosure would result in serious competitive harm. |
We believe that our underlying drivers of long-term success remain strong as supported by the following metric results:
| |
• | Employee Engagement at 4.1 out of 5.0 in Q4 2014, versus goal of 4.1 and Q4 2013 actual result of 4.1 |
| |
• | Total Automation Rate of 51.2% in Q4 2014, shy of our goal of 53% but improved 1.5 points from 49.7% in Q3 2014. Notably, Total Automation Rate for December 2014 reached 51.6%. |
| |
• | Net On-boarding Success of 67.5% in Q4 2014, shy of our goal of 78.0%. We rolled out a new virtual coaching model in Q4 2014 and will continue to monitor key performance metrics and further refine the on-boarding process to improve net on-boarding success. |
| |
| • | Patient Full Registration of 53.7% in Q4 2014, in line with our goal of 53.0%. |
| |
| • | Net Promoter Score of 42.0 in Q4 2014, versus goal of 52.5. As we expected, the rollout of athenaNet purple addition nationwide temporarily impacted our Net Promoter Score. |
| |
| • | Days of Client Work of 9.6 days in Q4 2014, versus goal of 7.3 days. Days of Client Work has been impacted by growth in athenaCollector physicians and providers and payer driven revalidation efforts during initial onboarding. |
| |
• | Provider Documentation Time per Appointment of 5.2 minutes in Q4 2014, versus goal of 5.0 minutes and Q4 2013 actual result of 5.1 minutes. Provider Documentation Time has been adversely impacted by Meaningful Use Stage 2 measures. |
| |
• | Minutes per RVU of 10.1 minutes in Q4 2014, versus goal of 11.5 minutes |
athenahealth’s client base continues to expand while client adoption of other services in the athenahealth service suite grows. As our client base expands outside the traditional ambulatory market, we believe that total active providers, or nodes, on our network will become a more appropriate metric to use in measuring our market share. During Q4 2014 and FY 2014:
| |
| • | 74% of all new athenaCollector deals included athenaClinicals, compared to 79% in Q4 2013 |
| |
| ◦ | 77% of all new athenaCollector deals included athenaClinicals in FY 2014, compared to 80% in FY 2013 |
| |
• | 68% of all new athenaCollector deals included athenaClinicals and athenaCommunicator, compared to 72% in Q4 2013. Additionally, 68% of all new athenaOne deals sold during Q4 2014 also included athenaCoordinator Core, compared to 72% in Q4 2013 |
| |
| ◦ | 72% of all new athenaCollector deals included athenaClinicals, athenaCommunicator, and athenaCoordinator Core in FY 2014, compared to 67% in FY 2013 |
| |
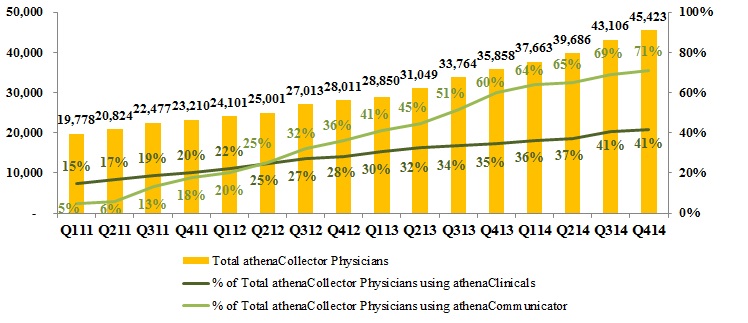
| • | 41% of total athenaCollector physicians have adopted athenaClinicals, up from 35% in Q4 2013 |
| |
| • | 71% of total athenaCollector physicians have adopted athenaCommunicator, up from 60% in Q4 2013 |
| |
• | Net new physicians and providers added sequentially to the network were as follows: |
|
| | | | | | | | | | | | | | |
| | athenaCollector | | athenaClinicals | | athenaCommunicator |
| Active physicians and providers: | Physicians | Providers | | Physicians | Providers | | Physicians | Providers |
| Beginning balance as of 9/30/14 | 43,106 |
| 59,415 |
| | 17,458 |
| 23,053 |
| | 29,683 |
| 38,699 |
|
| Net new additions | 2,317 |
| 2,934 |
| | 1,353 |
| 1,751 |
| | 2,480 |
| 3,078 |
|
| Ending balance as of 12/31/14 | 45,423 |
| 62,349 |
| | 18,811 |
| 24,804 |
| | 32,163 |
| 41,777 |
|
| Sequential growth % | 5 | % | 5 | % | | 8 | % | 8 | % | | 8 | % | 8 | % |
| |
| • | Net new physicians and providers added to the network since Q4 2013 were as follows: |
|
| | | | | | | | | | | | | | |
| | athenaCollector | | athenaClinicals | | athenaCommunicator |
| Active physicians and providers: | Physicians | Providers | | Physicians | Providers | | Physicians | Providers |
| Beginning balance as of 12/30/13 | 35,858 |
| 50,212 |
| | 12,388 |
| 16,805 |
| | 21,516 |
| 28,360 |
|
| Net new additions | 9,565 |
| 12,137 |
| | 6,423 |
| 7,999 |
| | 10,647 |
| 13,417 |
|
| Ending balance as of 12/31/14 | 45,423 |
| 62,349 |
| | 18,811 |
| 24,804 |
| | 32,163 |
| 41,777 |
|
| Y/Y growth % | 27 | % | 24 | % | | 52 | % | 48 | % | | 49 | % | 47 | % |
Revenue Discussion
Q4 2014 revenue reached $213.2 million and grew by 24% (or $41.6 million) over Q4 2013. athenahealth-branded revenue for Q4 2014 was $195.9 million and grew by 31% over prior year. Our total revenue of $752.6 for FY 2014 grew by 26% (or $157.6 million) over FY 2013. athenahealth-branded revenue for FY 2014 grew by 29% over FY 2013.
|
| | | | |
| | Q4 2014 | Q4 2013 | Y/Y Growth% |
| athenahealth-branded | $195.9 | $149.0 | 31 | % |
| Epocrates-branded | $12.8 | $18.9 | (32 | )% |
| Third-party tenant and other non-core | $4.5 | $3.7 | 22 | % |
| Consolidated | $213.2 | $171.6 | 24 | % |
|
| | | | |
| | FY 2014 | FY 2013 | Y/Y Growth% |
| athenahealth-branded | $690.0 | $532.9 | 29 | % |
| Epocrates-branded | $44.5 | $52.4 | (15 | )% |
| Third-party tenant and other non-core | $18.1 | $9.7 | 87 | % |
| Consolidated | $752.6 | $595.0 | 26 | % |
In terms of trends in our recurring revenue base, same-store analysis of claims created—a proxy for physician office utilization—indicates that physician office activity in Q4 2014 increased modestly over physician office activity during Q4 2013. In addition, as seen in prior years, our analysis also showed an increase in physician office activity in Q4 2014 compared to Q3 2014.
Claim activity is typically higher in Q4 due to flu diagnosis. Analysis by our athenaResearch team, who has been monitoring the nation’s flu activity since November 2014, showed that the rate of influenza-like illness from the 2014-2015 flu season has been tracking slightly higher than the 2012-2013 season and well above the 2013-2014 season. As a reminder, analysis from our athenaResearch team showed that the 2013-2014 flu season was running at levels roughly 30% below the 2012-2013 national level. It is too soon to confirm that this year’s flu season will be as severe as the 2012-2013 flu season as our data shows that providers are testing for flu more consistently than previous years, and prescribing antivirals more often. We will continue to monitor flu activity during Q1 2015 to determine how the 2014-2015 flu patterns continue to track against the more severe 2012-2013 season.
Fiscal Year 2015 Outlook
We are updating our fiscal year 2015 guidance to incorporate the acquisition of RazorInsights and the purchase of webOMR, the web-based clinical applications and electronic health record platform from Beth Israel Deaconess Medical Center. Please note that if it were not for these transactions, we would have reaffirmed the original fiscal year 2015 guidance communicated on December 11, 2014 at our 7th
Annual Investor Summit. athenahealth’s updated fiscal year 2015 guidance to reflect these transactions is presented below:
|
| |
| For the Fiscal Year Ending December 31, 2015 |
| Forward-Looking Guidance |
| GAAP Total Revenue | $905 - $925 million |
| Non-GAAP Adjusted Gross Margin | 62.5% - 63.5% |
| Non-GAAP Adjusted Operating Income | $75 - $85 million |
| Non-GAAP Adjusted Net Income per Diluted Share | $1.10 - $1.20 |
| Non-GAAP Tax Rate | 40% |
Non-GAAP Adjusted Gross Margin Discussion
Our Non-GAAP Adjusted Gross Margin was 67.1% for Q4 2014, up approximately 90 basis points from 66.2% in Q4 2013. Our Non-GAAP Adjusted Gross Margin was 63.0% for FY 2014, in line with our latest forecast and flat to 63.0% in FY 2013. One of our goals is to improve gross margin on a service-line basis each year. As previously discussed, the expansion of our newer service offerings, such as athenaCoordinator Enteprise, is expected to serve as a headwind to total company margin expansion until these new services become more automated and scalable.
Balance Sheet and Cash Flow Highlights
As of December 31, 2014, we had cash, cash equivalents and marketable securities of $114.7 million and outstanding indebtedness of $208.8 million. Operating cash flow increased by $55.8 million from net cash provided by operating activities of $93.3 million for the twelve months ended December 31, 2013, to net cash provided by operating activities of $149.1 million for the twelve months ended December 31, 2014.
Product Development Discussion
Product development at athenahealth is organized around our mission to be caregivers’ most trusted service, helping them do well doing the right thing. In order to fulfill this goal, we deliver services backed by cloud-based software, proprietary knowledge, and robust back-office services.
athenaCollector service offering
athenaCollector is our cloud-based medical billing and practice management solution. It is the foundation of our service portfolio and entered general availability in 2000.
In Q4 2014, KLAS issued its “2014 Ambulatory RCM Services Report: Uncovering Truths when Services Are Outsourced,” marking the first time KLAS has ever published a report specifically focused on ambulatory revenue cycle services. athenahealth had high rankings across the board, especially in the areas of consistency of claims processing, transparency, reporting, and handling government change. Notably, the KLAS 2014 Ambulatory RCM Services Report highlighted that athenahealth delivers the most consistently of all vendors across the ambulatory suite and is the only vendor that matches good RCM performance with strong ambulatory electronic medical record and practice management functionality and support. Additionally, athenahealth was the only vendor to score above average in every key category that was evaluated in this KLAS report including effectiveness of claims processing, denials and rejections management, transparency into billing and financial operations, quality of reports and reporting, and effectiveness of RCM vendor’s support. Our in demand athenaCollector services continue to earn praise and industry recognition. The KLAS 2014 Ambulatory RCM Services Report makes clear that ambulatory billing services and more comprehensive revenue cycle management services, like athenaCollector, are increasingly sought after to address the additional administrative demands of billing and the complexity of government change.
One of the key distinguishable strengths of our cloud-based service offering is our ability to identify and eliminate administrative burdens allowing our clients to stay focused on patient care and their own well-defined strategic initiatives. Our commitment to helping our clients successfully manage through industry change, like the upcoming transition to the International Statistical Classification of Diseases and Related Health Problems, 10th Revision (“ICD-10”), is unparalleled in the industry. We remain ready for the ICD-10 transition and will continue to focus our efforts on ensuring a smooth transition for our clients. In addition, our credentialing service, which we made generally available in Q2 2014, is another great example of how we relieve administrative burden. In this instance, we relieve administrative burden by taking over the credentialing process with payers on behalf of our clients. Unlike other stand-alone credentialing offerings, our credentialing service is deeply integrated with our athenaCollector service which generates a critical feedback loop and has a direct impact on delivering results via our revenue cycle management service. As of December 2014, we have enrolled approximately seven percent of our athenaCollector providers in our credentialing service and we expect to double this adoption rate by the end of fiscal year 2015.
athenaCollector network performance metrics were as follows for Q4 2014:
| |
| • | $4,263,271,914 posted in total client collections, up 29.8% from Q4 2013 |
| |
| • | 32,864,269 total claims submitted, up 29.2% from Q4 2013 |
| |
| • | 84.6% electronic remittance advice (“ERA”) rate, up 1.3 points from 83.3% at Q4 2013 |
| |
| • | 94.3% first pass resolution (“FPR”) rate, up 0.4 points from 93.9% at Q4 2013 |
| |
| • | 38.8 average client days in accounts receivable (“DAR”), up 0.8 days from 38.0 days at Q4 2013 |
athenaClinicals service offering
athenaClinicals is our cloud-based electronic health record (“EHR”) management service. It entered general availability in 2006 and was made available as a stand-alone service in 2010.
The athenahealth team has built a huge competitive advantage through years of focused execution and delivery of results. Health care is only getting more complex with health care reform and the transition to value-based reimbursement. The Meaningful Use (“MU”) program is a bellwether of health care reform. athenahealth has continued to demonstrate the strength of our software and service approach by delivering industry-leading MU attestation performance. The government mandates are only getting tougher, giving athenahealth more opportunities to demonstrate the power of our business model to influence patient and provider behavior and to deliver results. Two of the biggest differences between MU Stage 1 and MU Stage 2 are the increased emphasis on patient engagement and health information exchange - two aspects of MU that we address with technology and services already being utilized across our cloud-based network. The athenahealth team has been focused on adding new components to our service model to assist practices in patient engagement activities in order to help them meet the more difficult behavioral measures leading up to the end of 2014. We need these providers to complete a few remaining administrative tasks necessary to meet the submission deadline, but we remain confident that we can deliver against our 95% MU Stage 2 attestation goal. MU attestation success aside, we have proven with MU Stage 1 and MU Stage 2 that we can influence both provider behavior and patient behavior. We will continue to build on the MU experience and enhance our service offering to expand this influence and further drive improved patient engagement and outcomes.
We are also headlong into delivering a radically improved physician experience of the patient encounter. In 2015, we are focused on our final beta phases of the streamlined view of the clinical chart and encounter. We will move to our roll-out strategy of the streamlined view to new athenaClinicals clients first and then to our existing athenaClinicals client base. The streamlined view strives to reinforce effective delegation, encourage lightweight documentation, and illuminate the patient’s clinical story. We
are happy to announce that we are seeing some early success. For example, participants in our testing program have rated the streamlined view’s usability to be on par with consumer applications. Nonetheless, we know that change can be difficult for our installed base and we are actively preparing our clients for this major change. Stay tuned for more highlights as we introduce our streamlined view of the clinical chart and encounter to the health care marketplace starting in 2015.
athenaCommunicator service offering
athenaCommunicator is our cloud-based patient engagement service. It entered general availability in 2010 and, at this time, requires adoption of athenaCollector or athenaClinicals.
The athenaCommunicator team has played a major role in bringing about the success of our MU Stage 2 program. Certain patient engagement measures in MU Stage 2 are more difficult to achieve because they fall outside the control of vendors and providers - instead requiring both engagement and action by the patient. While meeting patient engagement measures has been problematic for many industry-wide, athenahealth’s providers represent a distinct exception. Over 95% of athenaClinicals providers have successfully satisfied the MU Stage 2 patient engagement measures including secure messaging, sending preventive care reminders and view/download/transmit of health information. This is just one more example of the power of our business model and our ability to combine software, knowledge, and work to deliver results for our clients. We not only embed technology into athenaCommunicator and athenaClinicals to help providers connect with their patients but we also tap into the work component of our service offerings to empower providers to conduct population health outreach, drive patient portal adoption, and provide regular MU Stage 2 performance updates.
The benefits provided by athenaCommunicator go well beyond MU attestation success for our clients. The real tangible benefit of patient engagement for our clients is improved population health management. Improved patient engagement begins with our efforts to help clients increase patient portal adoption. As a result of our efforts, we have averaged more than 250,000 new patient portal registrations per month in 2014 and we exited the year with 4.7 million patients registered/active on the portal. Increased portal adoption provides our clients with an important electronic channel that improves communication with patients and allows for the leveraging of our “pre-packaged” population health campaigns. During Q4 2014, we added six new campaigns (e.g., cervical cancer screenings and adolescent well care visits) increasing the total number of population health campaigns launched in 2014 to 16, exceeding our goal of 15. Since the launch of these services, our automated patient outreach programs for population health have touched patients 1.1 million times and generated approximately 150,000 scheduled appointments. Our population health goals in 2015 focus on significantly increasing the adoption of these campaigns across our client base as well as increasing appointment conversion rates supported by these campaigns in order to drive client revenue and improve clinical outcomes.
Key Metrics as of Q4 2014:
| |
• | Provider adoption rate of 67%, as compared to 65% in Q3 2014 and 56% in Q4 2013. |
| |
• | athenaCommunicator delivered over 65 million automated messages during Q4 2014 across our active patient base of 29 million patients, as compared to over 21.9 million automated messages during Q4 2013 across our active patient base of 16 million patients. |
| |
• | Patient portal adoption increased 30% since Q3 2014 from approximately 3.6 million to approximately 4.7 million patients registered as of Q4 2014. |
| |
• | athenaCommunicator collected over $24 million in self-pay collections during Q4 2014 via the patient portal and our live operator service, an increase of over 130% over the Q4 2013 self-pay collections of $10.3 million. |
athenaCoordinator service offering
Our athenaCoordinator service offerings include athenaCoordinator Core, athenaCoordinator Analytics, and athenaCoordinator Enterprise. athenaCoordinator Core is a cloud-based order transmission service for all receiver types and physicians using athenaClinicals. athenaCoordinator Core entered general availability in 2012. athenaCoordinator Analytics is a cloud-based business intelligence service for health care professionals. athenaCoordinator Analytics has been generally available since 2004 through Anodyne Health Partners, Inc., which athenahealth acquired in October of 2009. athenaCoordinator Enterprise is our cloud-based population health service designed to enhance physician and patient loyalty by delivering seamless transitions in care.
We continue to make strides in building out our athenahealth network and connecting care across all key settings by growing both our sender and our receiver bases. Since the launch of our athenaCoordinator Core service in 2012, we have added 5,449 active receiver nodes and 11,772 active sender nodes onto our network. As of December 2014, 9.9% of all orders are being sent in-network, up from 7.1% as of December 2013. We will continue to analyze the athenaClinicals order volumes to target and grow our core receiver network. For example, prescription orders represent approximately 50% of all orders processed through our network. In order to materially increase the volume of orders sent in-network and raise our closed-loop order rate, we must focus on the pharmacy space. We intend to develop a pharmacy offering to actively build and support a pharmacy core receiver base. The closed-loop order rate is a key performance metric that we will be closely monitoring and including in our 2015 corporate scorecard. Our goal is to improve the closed-loop order rate by 15% in 2015.
We expanded our care coordination service offerings with the launch of athenaCoordinator Enterprise service in early 2014. We have been actively promoting this new service to hospitals and health systems. We have also been working with our alpha clients to build out the complete service offering and to establish and prove the results we can generate for hospitals and health systems. athenaCoordinator Enterprise uses a three-pronged approach to deliver value to our clients: 1) open and optimize capacity; 2) identify patients in need of care; and 3) enable seamless transitions of care. As we discussed at our 7th Annual Investor Summit on December 11, 2014, our alpha clients are live on all major components of the service offering and we are generating some impactful performance statistics very early in the life of this new service offering. It also marked our first big step to address the needs of hospitals and health systems and has become our foundational service for moving across the continuum of care. As we move to launch athenaClinicals Enterprise, we are also repackaging athenaCommunicator Enterprise and athenaCoordinator Enterprise to better position us to win in the enterprise segment. As part of this repackaging, our athenaCoordinator Enterprise service will be focused on patient access to care and clean and efficient transitions of care. The population management component of athenaCoordinator Enterprise will move to our athenaCommunicator Enterprise offering. Lastly, the complete view of the patient across the continuum, or network facesheet, will become the foundation for athenaClinicals Enterprise. We will go-to-market with these three distinct and dynamic services that allow enterprises both choice and flexibility in meeting their ever-growing needs.
Epocrates service offerings
Epocrates has been recognized for developing the #1 medical application among U.S. physicians for clinical content, practice tools, and health industry engagement at the point of care. Epocrates has established a loyal network of more than one million health care professionals, including approximately 50% of U.S. physicians, who routinely use its intuitive solutions to help streamline workflow and improve patient care. Epocrates was acquired by athenahealth on March 12, 2013.
It has been almost two years since athenahealth acquired Epocrates. In 2014, we focused our energy and investment on strengthening the core Epocrates business. After successfully rebuilding the pharma sales team, we delivered the best bookings quarter (Q4 2014) since the acquisition. We also reached our subscriber bookings goal for Q4 2014, adding to our paid subscriber base and delivering a net positive retention rate in the subscriber base in 2014. In addition, we have started to tap into the strategic value of Epocrates by turning Epocrates into a gateway service or onramp to bring health care providers onto our athenahealth-branded services. Epocrates has begun to deliver as a lead generation platform enabling us to reach the lead and meetings goals from this athena-owned channel in 2014. While 2014 was about righting the Epocrates ship, 2015 will be about building deeper engagement with health care providers and advancing the Epocrates mission of helping heath care providers make more confident and efficient decisions in the moments of care. The Epocrates team will be working on improving the user experience, enhancing clinical decision support tools, and expanding the sponsor base beyond pharma.
Business Development Update
More Disruption Please (“MDP”)
As discussed at our 7th Annual Investor Summit on December 11, 2014, one of our top strategic priorities is to open athenaNet and build an ecosystem of partners. Through our MDP program, we will ensure that all of athenaNet is open with application programming interfaces for a whole new generation of innovators and entrepreneurs looking to disrupt the health care industry. The MDP program consists of three major pillars: Network, Marketplace, and Accelerator. The Network, representing the largest group of participants, is comprised of innovative thinkers, entrepreneurs, and startups with a shared mission to improve the state of health care. We gather this Network through conferences, hackathons, and other events encouraging thought leadership and collaboration across the continuum of care. We have enjoyed success through our MDP Marketplace program, having contracted with 36 companies to sell their technology and services to our client base. As of December 31, 2014, 699 clients have signed up for at least one solution offered by these MDP Marketplace partners. We recently elevated the Marketplace program by partnering with HITRUST, further underscoring MDP’s focus on security and on lowering the barriers of entry for high-potential health IT startups and entrepreneurs. Through this partnership, HITRUST will provide MDP Marketplace partners with data security assessments that will be subsidized by athenahealth. The third and potentially most exciting component of the MDP program is the Accelerator. Through this select program, athenahealth will provide entrepreneurs with the tools to test, grow, and optimize their solutions with the end goal of offering their services to our clients through the MDP Marketplace or building them directly into our core service offerings. Although the entrepreneurs who fill the Accelerator space are independent from athenahealth, we believe they are central to our vision of becoming the cloud-based information backbone for health care. We have invested in three participating portfolio companies (Smart Scheduling, RubiconMD, and CredSimple) since the launch of the Accelerator program in Q2 2014. This is just the beginning, however, as we expect approximately 30 accelerator companies, including both portfolio and co-working companies, to inhabit the MDP program’s Accelerator spaces on our Watertown and San Francisco campuses during 2015. To learn more about our MDP program and partnership opportunities and to explore the athenahealth Marketplace, please visit www.athenahealth.com/disruption.
Client Base Discussion
The total number of physicians who have gone live on athenaCollector, our core service offering, is the metric we currently use to define our client base and market share. However, as our client base expands outside the traditional ambulatory market, total active providers—or nodes on our network—will become a more appropriate metric used to define our client base and market share. Annual growth in total revenue continues to outpace growth in our physician base. We believe that this trend will continue as athenaClinicals and athenaCommunicator are included in a growing portion of new deals and adoption of these services spreads across our existing client base.
During Q4 2014, 74% of all new athenaCollector deals included athenaClinicals, down slightly from 79% in Q4 2013. 68% of all new athenaCollector deals included athenaCommunicator and athenaClinicals. Additionally, 68% of all new athenaOne deals also included athenaCoordinator Core. The athenaOne rate of 68% in Q4 2014 compares to 72% in Q4 2013. Among “live” (i.e., implemented and active) athenaCollector clients, adoption of athenaClinicals and athenaCommunicator continues to grow rapidly and resulted in continued growth to our installed base across all of our service offerings.
athenahealth Service Offering Adoption
athenaCollector Clients
During Q4 2014, total active physicians on athenaCollector grew by 27% year-over-year, to 45,423. On a sequential basis, we added 2,317 net new active physicians on athenaCollector, versus 2,094 in Q4 2013. Our quarterly net new physician additions may vary widely due to the number and size of clients that go live in a particular quarter. Furthermore, our larger clients can be more complex and take longer to go live, particularly if our clients request a more phased implementation approach. Total active providers on athenaCollector grew by 24% year-over-year, to 62,349. On a sequential basis, we added 2,934 net new active providers on athenaCollector, versus 3,017 in Q4 2013.
athenaClinicals Clients
We continue to experience rapid growth in client adoption of athenaClinicals. Total active physicians live on athenaClinicals grew by 52% year-over-year, to 18,811. On a sequential basis, we added 1,353 net new active physicians on athenaClinicals, versus 987 in Q4 2013. This equates to an overall adoption rate of 41% of total athenaCollector physicians, up from 35% in Q4 2013. Total active providers on athenaClinicals grew by 48% year-over-year, to 24,804. On a sequential basis, we added 1,751 net new active providers on athenaClinicals, versus 1,322 in Q4 2013. We expect the athenaClinicals client base to increase over time due to cross-selling within our existing base and growth in the volume of athenaOne deals.
athenaCommunicator Clients
Our athenaCommunicator client base is also growing rapidly. Total active physicians live on athenaCommunicator grew by 49% year-over-year, to 32,163. On a sequential basis, we added 2,480 net new active physicians on athenaCommunicator, versus 4,186 in Q4 2013. This equates to an overall adoption rate of 71% of total athenaCollector physicians, up from 60% in Q4 2013. Total active providers on athenaCommunicator grew by 47% year-over-year, to 41,777. On a sequential basis, we added 3,078
net new providers on athenaCommunicator, versus 5,336 in Q4 2013. We expect the athenaCommunicator client base to increase over time due to cross-selling within our existing base and growth in the volume of athenaOne deals.
New Deals
On December 3, 2014, we announced that Granite Healthcare Network (“GHN”) has selected our cloud-based athenaCoordinator Enterprise Population Manager to improve care quality and coordination across GHN’s growing network of risk-based payment arrangements, which now includes over 80,000 lives. GHN is a partnership of five independent New Hampshire charitable hospitals: GHN‘s Catholic Medical Center, Concord Hospital, LRGHealthcare, Southern New Hampshire Health System, and Wentworth-Douglas Hospital. GHN went live on athenaCoordinator Enterprise Population Manager in Q4 2014.
On December 11, 2014, we announced that Women’s Health USA selected our suite of cloud-based services, athenaOne, to support its network of over 250 providers in Connecticut and has selected athenaCollector and athenaCommunicator for its In Vitro business in Connecticut and New York. Women’s Health USA provides management services to independent women’s health care providers, in-vitro fertilization centers, and other physicians, helping them function more effectively in today’s changing environment. Women’s Health USA is expected to go live on our suite of services by means of a phased implementation in Q2 2015 and Q3 2015.
On January 23, 2015, we announced that Florida Cancer Specialists & Research Institute (“FCS”) selected athenaCollector as part of a pilot program which will be implemented in phases to support its team of 300 health care providers. FCS, the largest independent privately-held medical oncology/hematology practice in the United States, is partnering with athenahealth to streamline administrative work and enhance performance and financial results.
Client Implementations
Our publicly disclosed implementation pipeline includes the following status updates as of February 5, 2015:
| |
| • | Saint Peter’s Healthcare System (~170 physicians, ~180 providers) went live on our full suite of services, athenaOne, in Q4 2014. |
| |
| • | Detroit Medical Group (~125 physicians, ~400 providers) went live on athenaCollector in Q4 2014. Detroit Medical Group is using our athenaCollector services in concert with Tenet’s Conifer Health Solutions. |
| |
| • | Health Management Associates (~900 physicians, ~1,200 providers), now part of Community Health Systems, brought the remaining providers and physicians live on our suite of cloud-based services in Q4 2014. |
| |
| • | Ascension Health (over 4,000 providers) continued the phased rollout of athenaCollector, athenaCommunicator, and athenaCoordinator Analytics and brought three waves live in Q4 2014. Two of these three implementation waves included athenaClinicals. |
| |
| • | University of Toledo Physicians (~200 physicians, ~260 providers) went live on our full suite of services, athenaOne, in January 2015. |
| |
| • | Steward Medical Group is live on key components of the athenaCoordinator Enterprise offering. We will continue to work with our alpha clients on co-development efforts in 2015. |
| |
| • | Griffin Hospital is live on key components of the athenaCoordinator Enterprise offering. We will continue to work with our alpha clients on co-development efforts in 2015. |
| |
| • | Arise Austin Medical Center went live on key components of the athenaCoordinator Enterprise offering in December 2014. We will continue to work with Arise Austin Medical Center on building, deploying, and testing the athenaCoordinator Enterprise offering in 2015. |
| |
| • | Marquette Physician Practices (~200 physicians, ~250 providers) is expected to go live on athenaCollector, athenaCommunicator, and athenaCoordinator Analytics in Q1 2015. |
| |
| • | Summit Medical Group (~300 physicians, ~400 providers) is expected to go live on athenaCoordinator Enterprise Population Manager in early 2015. |
| |
| • | Hospital Physician Partners (~2,000 providers) went live on athenaCollector, athenaCommunicator, and athenaCoordinator Analytics with its hospital services business in March 2014 as part of the first phase of their implementation plan. We expect Hospital Physician Partners to focus on the next phase of their implementation plan starting in 2015. |
Growth Discussion
The athenahealth marketing organization encompasses our growth and sales operations, event and partner marketing, inside sales agents (“ISAs”), advertising, corporate communications, and product marketing teams. This organization executes in-market investments in an effort to generate new business opportunities for athenahealth. The athenahealth sales organization includes all quota-carrying sales representatives, as well as our sales team leaders, channel sales team, and sales training and development organization.
Although we fell short of our 30% bookings growth goal in 2014, we were able to finish the year strong and have entered 2015 with positive momentum. Despite lower than expected lead generation, the combined small and group sales teams still achieved their full year bookings goals representing a significant growth highlight in 2014. The enterprise team closed several new logo deals in Q4 2014, including our fourth athenaCoordinator Enterprise deal. And, the Epocrates team was also able to deliver its strongest quarterly bookings performance (Q4 2014) since the acquisition. We still believe 30% bookings growth is the right target for athenahealth based on our distinguishable strengths and our growing addressable market. We will continue to equip our sales teams with improvements to existing service offerings (e.g. streamlined encounter) as well as new service offerings (e.g. secure text messaging, athenaClinicals Enterprise) to help us achieve our growth goals.
As of December 31, 2014, we have a total of 153 quota-carrying sales representatives, up 21% from December 2013. Our athenahealth-branded services sales force is currently divided into three groups: enterprise, which is dedicated to serving the largest managed care organizations, as well as those with high growth potential; group, which is dedicated to medical practices with seven to 150 physicians; and small group, which is dedicated to medical practices with one to six physicians. Entering 2015, we have made a few changes to our organization structure in order to drive more direct accountability and to foster the athena-moves-faster mentality. As part of this reorganization, Dr. Stephen Kahane is now President of our Client Organization and is responsible for the entire client relationship across all segments.
Stock-Based Compensation Expense, Amortization of Purchased Intangible Assets, and Reconciliation of Non-GAAP Financial Measures
athenahealth, Inc.
STOCK-BASED COMPENSATION
(Unaudited, in thousands)
Set forth below is a breakout of stock-based compensation impacting the Consolidated Statements of Income for the three and twelve months ended December 31, 2014, and 2013:
|
| | | | | | | | | | | | | | | |
| | Three Months Ended December 31, | | Twelve Months Ended December 31, |
| | 2014 | | 2013 | | 2014 | | 2013 |
| Stock-based compensation charged to Consolidated Statements of Income: | | | | | | | |
| Direct operating | $ | 3,203 |
| | $ | 2,160 |
| | $ | 12,009 |
| | $ | 7,778 |
|
| Selling and marketing | 3,703 |
| | 2,848 |
| | 14,581 |
| | 12,057 |
|
| Research and development | 1,923 |
| | 991 |
| | 7,221 |
| | 4,238 |
|
| General and administrative | 7,743 |
| | 2,925 |
| | 21,747 |
| | 18,575 |
|
| Total stock-based compensation expense | 16,572 |
| | 8,924 |
| | 55,558 |
| | 42,648 |
|
| Amortization of capitalized stock-based compensation related to software development (1) | 743 |
| | 347 |
| | 2,258 |
| | 1,027 |
|
| Total | $ | 17,315 |
| | $ | 9,271 |
| | $ | 57,816 |
| | $ | 43,675 |
|
| | | | | | | | |
| |
| (1) | In addition, for the three months ended December 31, 2014, and 2013, $1.2 million and $0.5 million, respectively, of stock-based compensation was capitalized in the line item Capitalized Software Costs, net in the Consolidated Balance Sheets for which $0.7 million and $0.3 million, respectively, of amortization was included in the line item Depreciation and Amortization in the Consolidated Statements of Income. For the twelve months ended December 31, 2014, and 2013, $4.7 million and $2.2 million, respectively, of stock-based compensation was capitalized in the line item Capitalized Software Costs, net in the Consolidated Balance Sheets for which $2.3 million and $1.0 million, respectively, of amortization was included in the line item Depreciation and Amortization in the Consolidated Statements of Income. |
athenahealth, Inc.
AMORTIZATION OF PURCHASED INTANGIBLE ASSETS
(Unaudited, in thousands)
Set forth below is a breakout of amortization of purchased intangible assets impacting the Consolidated Statements of Income for the three and twelve months ended December 31, 2014, and 2013:
|
| | | | | | | | | | | | | | | |
| | Three Months Ended December 31, | | Twelve Months Ended December 31, |
| Amortization of purchased intangible assets allocated to: | 2014 | | 2013 | | 2014 | | 2013 |
| Direct operating | $ | 2,991 |
| | $ | 2,777 |
| | $ | 12,181 |
| | $ | 10,617 |
|
| Selling and marketing | 3,211 |
| | 2,419 |
| | 16,388 |
| | 7,261 |
|
| Total amortization of purchased intangible assets | $ | 6,202 |
| | $ | 5,196 |
| | $ | 28,569 |
| | $ | 17,878 |
|
| | | | | | | | |
athenahealth, Inc.
RECONCILIATION OF NON-GAAP FINANCIAL MEASURES
TO COMPARABLE GAAP MEASURES
(Unaudited, in thousands, except per share amounts)
The following is a reconciliation of the non-GAAP financial measures used by us to describe our financial results determined in accordance with accounting principles generally accepted in the United States of America (“GAAP”). An explanation of these measures is also included below under the heading “Explanation of Non-GAAP Financial Measures.”
While management believes that these non-GAAP financial measures provide useful supplemental information to investors regarding the underlying performance of our business operations, investors are reminded to consider these non-GAAP measures in addition to, and not as a substitute for, financial performance measures prepared in accordance with GAAP. In addition, it should be noted that these non-GAAP financial measures may be different from non-GAAP measures used by other companies, and management may utilize other measures to illustrate performance in the future. Non-GAAP measures have limitations in that they do not reflect all of the amounts associated with our results of operations as determined in accordance with GAAP.
Please note that these figures may not sum exactly due to rounding.
Non-GAAP Adjusted Gross Margin
Set forth below is a presentation of the Company’s “Non-GAAP Adjusted Gross Profit” and “Non-GAAP Adjusted Gross Margin,” which represents Non-GAAP Adjusted Gross Profit as a percentage of total revenue.
|
| | | | | | | | | | | | | | | |
| (unaudited, in thousands) | Three Months Ended | | Twelve Months Ended |
| | December 31, | | December 31, |
| | 2014 | | 2013 | | 2014 | | 2013 |
| | | | | | | | |
| Total revenue | $ | 213,214 |
| | $ | 171,579 |
| | $ | 752,599 |
| | $ | 595,003 |
|
| Direct operating expense | 76,274 |
| | 62,852 |
| | 302,539 |
| | 238,672 |
|
| | | | | | | | |
| Total revenue less direct operating expense | 136,940 |
| | 108,727 |
| | 450,060 |
| | 356,331 |
|
Add: Stock-based compensation
allocated to direct operating expense | 3,203 |
| | 2,160 |
| | 12,009 |
| | 7,778 |
|
Add: Amortization of purchased intangible assets
allocated to direct operating expense | 2,991 |
| | 2,777 |
| | 12,181 |
| | 10,617 |
|
| | | | | | | | |
| Non-GAAP Adjusted Gross Profit | $ | 143,134 |
| | $ | 113,664 |
| | $ | 474,250 |
| | $ | 374,726 |
|
| | | | | | | | |
| Non-GAAP Adjusted Gross Margin | 67.1 | % | | 66.2 | % | | 63.0 | % | | 63.0 | % |
Non-GAAP Adjusted EBITDA
Set forth below is a reconciliation of our “Non-GAAP Adjusted EBITDA” and “Non-GAAP Adjusted EBITDA Margin,” which represents Non-GAAP Adjusted EBITDA as a percentage of total revenue.
|
| | | | | | | | | | | | | | | |
| (unaudited, in thousands) | Three Months Ended | | Twelve Months Ended |
| | December 31, | | December 31, |
| | 2014 | | 2013 | | 2014 | | 2013 |
| | | | | | | | |
| Total Revenue | $ | 213,214 |
| | $ | 171,579 |
| | $ | 752,599 |
| | $ | 595,003 |
|
| | | | | | | | |
| GAAP net income (loss) | 8,729 |
| | 13,145 |
| | (3,119 | ) | | 2,594 |
|
| Add: Provision for (benefit from) income taxes | 5,329 |
| | 4,927 |
| | (745 | ) | | (363 | ) |
| Add: Total other expense | 884 |
| | 1,183 |
| | 4,819 |
| | 3,622 |
|
| Add: Stock-based compensation expense | 16,572 |
| | 8,924 |
| | 55,558 |
| | 42,648 |
|
| Add: Depreciation and amortization | 18,071 |
| | 12,864 |
| | 64,764 |
| | 43,575 |
|
| Add: Amortization of purchased intangible assets | 6,202 |
| | 5,196 |
| | 28,569 |
| | 17,878 |
|
| Add: Integration and transaction costs | — |
| | 397 |
| | — |
| | 6,865 |
|
| Add: Non-tax deductible transaction costs | — |
| | — |
| | — |
| | 2,159 |
|
| Less: Gain on early termination of lease | — |
| | — |
| | — |
| | (2,468 | ) |
| | | | | | | | |
| Non-GAAP Adjusted EBITDA | $ | 55,787 |
| | $ | 46,636 |
| | $ | 149,846 |
| | $ | 116,510 |
|
| | | | | | | | |
| Non-GAAP Adjusted EBITDA Margin | 26.2 | % | | 27.2 | % | | 19.9 | % | | 19.6 | % |
Non-GAAP Adjusted Operating Income
Set forth below is a reconciliation of our “Non-GAAP Adjusted Operating Income” and “Non-GAAP Adjusted Operating Income Margin,” which represents Non-GAAP Adjusted Operating Income as a percentage of total revenue.
|
| | | | | | | | | | | | | | | |
| (unaudited, in thousands) | Three Months Ended | | Twelve Months Ended |
| | December 31, | | December 31, |
| | 2014 | | 2013 | | 2014 | | 2013 |
| | | | | | | | |
| Total revenue | $ | 213,214 |
| | $ | 171,579 |
| | $ | 752,599 |
| | $ | 595,003 |
|
| | | | | | | | |
| GAAP net income (loss) | 8,729 |
| | 13,145 |
| | (3,119 | ) | | 2,594 |
|
| Add: Provision for (benefit from) income taxes | 5,329 |
| | 4,927 |
| | (745 | ) | | (363 | ) |
| Add: Total other expense | 884 |
| | 1,183 |
| | 4,819 |
| | 3,622 |
|
| Add: Stock-based compensation expense | 16,572 |
| | 8,924 |
| | 55,558 |
| | 42,648 |
|
| Add: Amortization of capitalized stock-based compensation related to software development | 743 |
| | 347 |
| | 2,258 |
| | 1,027 |
|
| Add: Amortization of purchased intangible assets | 6,202 |
| | 5,196 |
| | 28,569 |
| | 17,878 |
|
| Add: Integration and transaction costs | — |
| | 397 |
| | — |
| | 6,865 |
|
| Add: Non-tax deductible transaction costs | — |
| | — |
| | — |
| | 2,159 |
|
| Less: Gain on early termination of lease | — |
| | — |
| | — |
| | (2,468 | ) |
| | | | | | | | |
| Non-GAAP Adjusted Operating Income | $ | 38,459 |
| | $ | 34,119 |
| | $ | 87,340 |
| | $ | 73,962 |
|
| | | | | | | | |
| Non-GAAP Adjusted Operating Income Margin | 18.0 | % | | 19.9 | % | | 11.6 | % | | 12.4 | % |
Non-GAAP Adjusted Net Income
Set forth below is a reconciliation of our “Non-GAAP Adjusted Net Income” and “Non-GAAP Adjusted Net Income per Diluted Share.”
|
| | | | | | | | | | | | | | | |
| (unaudited, in thousands) | Three Months Ended | | Twelve Months Ended |
| | December 31, | | December 31, |
| | 2014 | | 2013 | | 2014 | | 2013 |
| | | | | | | | |
| GAAP net income (loss) | $ | 8,729 |
| | $ | 13,145 |
| | $ | (3,119 | ) | | $ | 2,594 |
|
| Add: Stock-based compensation expense | 16,572 |
| | 8,924 |
| | 55,558 |
| | 42,648 |
|
| Add: Amortization of capitalized stock-based compensation related to software development | 743 |
| | 347 |
| | 2,258 |
| | 1,027 |
|
| Add: Amortization of purchased intangible assets | 6,202 |
| | 5,196 |
| | 28,569 |
| | 17,878 |
|
| Add: Integration and transaction costs | — |
| | 397 |
| | — |
| | 6,865 |
|
| Less: Gain on early termination of lease | — |
| | — |
| | — |
| | (2,468 | ) |
| |
| |
| |
| |
|
| Sub-total of tax deductible items | 23,517 |
| | 14,864 |
| | 86,385 |
| | 65,950 |
|
| | | | | | | | |
| Less: Tax impact of tax deductible items (1) | (9,407 | ) | | (5,945.6 | ) | | (34,554 | ) | | (26,380 | ) |
| Add: Non-tax deductible transaction costs | — |
| | — |
| | — |
| | 2,159 |
|
| Add: Tax impact resulting from applying non-GAAP tax rate (2) | (294 | ) | | — |
| | 801 |
| | — |
|
| | | | | | | | |
| Non-GAAP Adjusted Net Income | $ | 22,545 |
| | $ | 22,063 |
| | $ | 49,513 |
| | $ | 44,323 |
|
| | | | | | | | |
| Weighted average shares - diluted | 39,040 |
| | 38,645 |
| | 37,862 |
| | 38,257 |
|
| | | | | | | | |
| Non-GAAP Adjusted Net Income per Diluted Share | $ | 0.58 |
| | $ | 0.57 |
| | $ | 1.31 |
| | $ | 1.16 |
|
| |
| (1) | Tax impact calculated using a statutory tax rate of 40%. |
| |
| (2) | Represents adjusting the GAAP net loss at a non-GAAP tax rate of 40%. For 2014, we are using a non-GAAP tax rate of 40% to normalize the tax impact to our Non-GAAP Adjusted Net Income per Diluted Share based on the fact that a relatively small change in pre-tax GAAP income (loss) could result in a volatile GAAP effective tax rate. If this approach had been used for the three months ended December 31, 2013, the tax impact from applying a non-GAAP tax rate would have been $(2,301) and our Non-GAAP Adjusted Net Income per Diluted Share would have been $0.51, or a decrease of $0.06. For the twelve months ended December 31, 2013, the tax impact from applying a non-GAAP tax rate would have been $(2,119) and our Non-GAAP Adjusted Net Income per Diluted Share would have been $1.10, or a decrease of $0.06. |
|
| | | | | | | | | | | | | | | |
| (unaudited, in thousands) | Three Months Ended | | Twelve Months Ended |
| | December 31, | | December 31, |
| | 2014 | | 2013 | | 2014 | | 2013 |
| | | | | | | | |
| GAAP net income (loss) per share - diluted | $ | 0.22 |
| | $ | 0.34 |
| | $ | (0.08 | ) | | $ | 0.07 |
|
| Add: Stock-based compensation expense | 0.42 |
| | 0.23 |
| | 1.47 |
| | 1.11 |
|
| Add: Amortization of capitalized stock-based compensation related to software development | 0.02 |
| | 0.01 |
| | 0.06 |
| | 0.03 |
|
| Add: Amortization of purchased intangible assets | 0.16 |
| | 0.13 |
| | 0.75 |
| | 0.47 |
|
| Add: Integration and transaction costs | — |
| | 0.01 |
| | — |
| | 0.18 |
|
| Less: Gain on early termination of lease | — |
| | — |
| | — |
| | (0.06 | ) |
| | | | | | | | |
| Sub-total of tax deductible items | 0.60 |
| | 0.38 |
| | 2.28 |
| | 1.72 |
|
| | | | | | | | |
| Less: Tax impact of tax deductible items (1) | (0.24 | ) | | (0.15 | ) | | (0.91 | ) | | (0.69 | ) |
| Add: Non-tax deductible transaction costs | — |
| | — |
| | — |
| | 0.06 |
|
Add: Tax impact resulting from applying non-GAAP tax rate (2)
| (0.01 | ) | | — |
| | 0.02 |
| | — |
|
| | | | | | | |
| Non-GAAP Adjusted Net Income per Diluted Share | $ | 0.58 |
| | $ | 0.57 |
| | $ | 1.31 |
| | $ | 1.16 |
|
| | | | | | | |
| Weighted average shares - diluted | 39,040 |
| | 38,645 |
| | 37,862 |
| | 38,257 |
|
| |
| (1) | Tax impact calculated using a statutory tax rate of 40%. |
| |
| (2) | Represents adjusting the GAAP net loss at a non-GAAP tax rate of 40%. For 2014, we are using a non-GAAP tax rate of 40% to normalize the tax impact to our Non-GAAP Adjusted Net Income per Diluted Share based on the fact that a relatively small change in pre-tax GAAP income (loss) could result in a volatile GAAP effective tax rate. If this approach had been used for the three months ended December 31, 2013, the tax impact from applying a non-GAAP tax rate would have been $(2,301) and our Non-GAAP Adjusted Net Income per Diluted Share would have been $0.51, or a decrease of $0.06. For the twelve months ended December 31, 2013, the tax impact from applying a non-GAAP tax rate would have been $(2,119) and our Non-GAAP Adjusted Net Income per Diluted Share would have been $1.10, or a decrease of $0.06. |
athenahealth, Inc.
RECONCILIATION OF NON-GAAP FINANCIAL MEASURES
TO COMPARABLE GAAP MEASURES FOR FISCAL YEAR 2015 GUIDANCE
(Unaudited, in millions, except per share amounts)
Please note that the figures presented below may not sum exactly due to rounding.
Non-GAAP Adjusted Gross Margin Guidance
Set forth below is a presentation of our “Non-GAAP Adjusted Gross Profit” and “Non-GAAP Adjusted Gross Margin” guidance for fiscal year 2015, which represents Non-GAAP Adjusted Gross Profit as a percentage of total revenue.
|
| | | | | | |
| | LOW | HIGH |
| | Fiscal Year Ending December 31, 2015 |
| Total revenue | $ | 905.0 |
| $ | 925.0 |
|
| Direct operating expense | 364.1 |
| 362.4 |
|
| Total revenue less direct operating expense | $ | 540.9 |
| $ | 562.6 |
|
| | | |
| Add: Stock-based compensation expense | | |
| allocated to direct operating expense | 13.8 |
| 13.8 |
|
| Add: Amortization of purchased intangible assets | | |
| allocated to direct operating expense (1) | 11.0 |
| 11.0 |
|
| | | |
| Non-GAAP Adjusted Gross Profit | $ | 565.6 |
| $ | 587.4 |
|
| | | |
| Non-GAAP Adjusted Gross Margin | 62.5 | % | 63.5 | % |
| | | |
| (1) Based on preliminary estimates related to purchase accounting. |
Non-GAAP Adjusted Operating Income Guidance
Set forth below is a reconciliation of our “Non-GAAP Adjusted Operating Income” and “Non-GAAP Adjusted Operating Income Margin” guidance for fiscal year 2015, which represents Non-GAAP Adjusted Operating Income as a percentage of total revenue.
|
| | | | | | |
| | LOW | HIGH |
| | Fiscal Year Ending December 31, 2015 |
| Total revenue | $ | 905.0 |
| $ | 925.0 |
|
| | | |
| GAAP net loss | (8.0 | ) | (3.8 | ) |
| Add: Benefit from income taxes | (4.3 | ) | (1.8 | ) |
| Add: Total other expense | 1.4 |
| 4.6 |
|
| Add: Stock-based compensation expense | 61.4 |
| 61.4 |
|
| Add: Amortization of capitalized stock-based compensation related to software development | 4.2 |
| 4.2 |
|
| Add: Amortization of purchased intangible assets (1) | 20.3 |
| 20.3 |
|
| | | |
| Non-GAAP Adjusted Operating Income | $ | 75.0 |
| $ | 85.0 |
|
| | | |
| Non-GAAP Adjusted Operating Income Margin | 8.3 | % | 9.2 | % |
| | | |
| (1) Based on preliminary estimates related to purchase accounting. |
Non-GAAP Adjusted Net Income Guidance
Set forth below is a reconciliation of our “Non-GAAP Adjusted Net Income” and “Non-GAAP Adjusted Net Income per Diluted Share” guidance for fiscal year 2015.
|
| | | | | | |
| | LOW | HIGH |
| | Fiscal Year Ending December 31, 2015 |
| GAAP net loss | $ | (8.0 | ) | $ | (3.8 | ) |
| Add: Stock-based compensation expense | 61.4 |
| 61.4 |
|
| Add: Amortization of capitalized stock-based compensation related to software development | 4.2 |
| 4.2 |
|
| Add: Amortization of purchased intangible assets (1) | 20.3 |
| 20.3 |
|
| | | |
| Sub-total of tax deductible items | $ | 85.9 |
| $ | 85.9 |
|
| | | |
| (Less): Tax impact of tax deductible items (2) | (34.4 | ) | (34.4 | ) |
| Add: Tax impact resulting from applying a normalized non-GAAP tax rate (3) | 0.6 |
| 0.5 |
|
| | | |
| Non-GAAP Adjusted Net Income | $ | 44.2 |
| $ | 48.2 |
|
| | | |
| Weighted average shares - diluted | 40.1 |
| 40.1 |
|
| | | |
| Non-GAAP Adjusted Net Income per Diluted Share | $ | 1.10 |
| $ | 1.20 |
|
| |
| (1) Based on preliminary estimates related to purchase accounting. |
| (2) Tax impact calculated using a statutory tax rate of 40%. |
| (3) Represents adjusting the GAAP net loss at a Non-GAAP tax rate of 40%. For 2015, we are using a non-GAAP tax rate of 40% to normalize the tax impact to our non-GAAP Adjusted Net Income per Diluted Share because a relatively small change in pre-tax GAAP income (loss) could result in a volatile GAAP effective tax rate. |
|
| | | | | | |
| | LOW | HIGH |
| | Fiscal Year Ending December 31, 2015 |
| GAAP net loss per share - diluted | $ | (0.20 | ) | $ | (0.09 | ) |
| Add: Stock-based compensation expense | 1.53 |
| 1.53 |
|
| Add: Amortization of capitalized stock-based compensation related to software development | 0.11 |
| 0.11 |
|
| Add: Amortization of purchased intangible assets (1) | 0.51 |
| 0.51 |
|
| | | |
| Sub-total of tax deductible items | $ | 2.14 |
| $ | 2.14 |
|
| | | |
| (Less): Tax impact of tax deductible items (2) | (0.86 | ) | (0.86 | ) |
Add: Tax impact resulting from applying a normalized non-GAAP tax rate (3)
| 0.02 |
| 0.01 |
|
| | | |
| Non-GAAP Adjusted Net Income per Diluted Share | $ | 1.10 |
| $ | 1.20 |
|
| | | |
| Weighted average shares - diluted | 40.1 |
| 40.1 |
|
| |
(1) Based on preliminary estimates related to purchase accounting.
|
| (2) Tax impact calculated using a statutory tax rate of 40%. |
| (3) Represents adjusting the GAAP net loss at a Non-GAAP tax rate of 40%. For 2015, we are using a non-GAAP tax rate of 40% to normalize the tax impact to our non-GAAP Adjusted Net Income per Diluted Share because a relatively small change in pre-tax GAAP income (loss) could result in a volatile GAAP effective tax rate. |
Explanation of Non-GAAP Financial Measures
We report our financial results in accordance with accounting principles generally accepted in the United States of America, or GAAP. However, management believes that, in order to properly understand our short-term and long-term financial and operational trends, investors may wish to consider the impact of certain non-cash or non-recurring items, when used as a supplement to financial performance measures in accordance with GAAP. These items result from facts and circumstances that vary in frequency and impact on continuing operations. Management also uses results of operations before such items to evaluate the operating performance of athenahealth and compare it against past periods, make operating decisions, and serve as a basis for strategic planning. These non-GAAP financial measures provide management with additional means to understand and evaluate the operating results and trends in our ongoing business by eliminating certain non-cash expenses and other items that management believes might otherwise make comparisons of our ongoing business with prior periods more difficult, obscure trends in ongoing operations, or reduce management’s ability to make useful forecasts. Management believes that these non-GAAP financial measures provide additional means of evaluating period-over-period operating performance. In addition, management understands that some investors and financial analysts find this information helpful in analyzing our financial and operational performance and comparing this performance to our peers and competitors.
Management defines “Non-GAAP Adjusted Gross Profit” as total revenue, less direct operating expense, plus (1) stock-based compensation expense allocated to direct operating expense and (2) amortization of purchased intangible assets allocated to direct operating expense, and “Non-GAAP Adjusted Gross Margin” as Non-GAAP Adjusted Gross Profit as a percentage of total revenue. Management considers these non-GAAP financial measures to be important indicators of our operational strength and performance of our business and a good measure of our historical operating trends. Moreover, management believes that these measures enable investors and financial analysts to closely monitor and understand changes in our ability to generate income from ongoing business operations.
Management defines “Non-GAAP Adjusted EBITDA” as the sum of GAAP net income (loss) before provision for (benefit from) income taxes, total other (income) expense, stock-based compensation expense, depreciation and amortization, amortization of purchased intangible assets, integration costs, transaction costs, and gain on early termination of lease and “Non-GAAP Adjusted EBITDA Margin” as Non-GAAP Adjusted EBITDA as a percentage of total revenue. Management defines “Non-GAAP Adjusted Operating Income” as the sum of GAAP net income (loss) before provision for (benefit from) income taxes, total other (income) expense, stock-based compensation expense, amortization of capitalized stock-based compensation related to software development, amortization of purchased intangible assets, integration costs, transaction costs, and gain on early termination of lease and “Non-GAAP Adjusted Operating Income Margin” as Non-GAAP Adjusted Operating Income as a percentage of total revenue. Management defines “Non-GAAP Adjusted Net Income (Loss)” as the sum of GAAP net income (loss) before stock-based compensation expense, amortization of capitalized stock-based compensation related to software development, amortization of purchased intangible assets, integration costs, transaction costs, and gain on early termination of lease and any tax impact related to these preceding items, and an adjustment to the tax provision for the non-GAAP tax rate and “Non-GAAP Adjusted Net Income (Loss) per Diluted Share” as Non-GAAP Adjusted Net Income (Loss) divided by weighted average diluted shares outstanding. Management considers all of these non-GAAP financial measures to be important indicators of our operational strength and performance of our business and a good measure of our historical operating trends, in particular the extent to which ongoing operations impact our overall financial performance.
Management excludes or adjusts each of the items identified below from the applicable non-GAAP financial measure referenced above for the reasons set forth with respect to that excluded item:
| |
| • | Stock-based compensation expense and amortization of capitalized stock-based compensation related to software development — excluded because these are non-cash expenditures that management does not consider part of ongoing operating results when assessing the performance of our business, and also because the total amount of the expenditure is partially outside of our control because it is based on factors such as stock price, volatility, and interest rates, which may be unrelated to our performance during the period in which the expenses are incurred. |
| |
| • | Amortization of purchased intangible assets — purchased intangible assets are amortized over their estimated useful lives and generally cannot be changed or influenced by management after the acquisition. Accordingly, this item is not considered by management in making operating decisions. Management does not believe such charges accurately reflect the performance of our ongoing operations for the period in which such charges are incurred. |
| |
| • | Integration costs — integration costs are the severance payments and retention bonuses for certain employees relating to the Epocrates acquisition. Accordingly, management believes that such expenses do not have a direct correlation to future business operations, and therefore, these costs are not considered by management in making operating decisions. Management does not believe such charges accurately reflect the performance of our ongoing operations for the period in which such charges are incurred. |
| |
| • | Transaction costs — transaction costs are non-recurring costs related to specific transactions. Accordingly, management believes that such expenses do not have a direct correlation to future business operations, and therefore, these costs are not considered by management in making operating decisions. Management does not believe such charges accurately reflect the performance of our ongoing operations for the period in which such charges are incurred. |
| |
| • | Gain on early termination of lease — Gain on early termination of lease was a non-recurring gain related to the early termination of the Arsenal on the Charles lease. Accordingly, this gain was not considered by management in making operating decisions, and management believes that this gain does not have a direct correlation to future business operations. Management does not believe such gain accurately reflects the performance of our ongoing operations for the period in which such gain was recorded. |
| |
| • | Non-GAAP tax rate — For 2014, we used a non-GAAP tax rate of 40% to normalize the tax impact to our Non-GAAP Adjusted Net Income (Loss) per Diluted Share based on the fact that a relatively small change in pre-tax GAAP income (loss) could result in a volatile GAAP effective tax rate. |
Supplemental Metrics and Definitions
|
| | | | | | | | | | | | | | | | | | | |
| | | | Fiscal Year 2013 | | Fiscal Year 2014 |
| | | | |
| | | | Q1 |
| Q2 |
| Q3 |
| Q4 |
| | Q1 |
| Q2 |
| Q3 |
| Q4 |
|
| Client Base | | | | | | | | | | | |
| Total Physicians on athenaCollector | | 28,850 |
| 31,049 |
| 33,764 |
| 35,858 |
| | 37,663 |
| 39,686 |
| 43,106 |
| 45,423 |
|
| Total Providers on athenaCollector | | 40,937 |
| 43,858 |
| 47,195 |
| 50,212 |
| | 52,886 |
| 55,425 |
| 59,415 |
| 62,349 |
|
| Total Physicians on athenaClinicals | | 8,776 |
| 10,058 |
| 11,401 |
| 12,388 |
| | 13,521 |
| 14,672 |
| 17,458 |
| 18,811 |
|
| Total Providers on athenaClinicals | | 12,139 |
| 13,818 |
| 15,483 |
| 16,805 |
| | 18,343 |
| 19,733 |
| 23,053 |
| 24,804 |
|
| Total Physicians on athenaCommunicator | | 11,840 |
| 13,831 |
| 17,330 |
| 21,516 |
| | 24,030 |
| 25,837 |
| 29,683 |
| 32,163 |
|
| Total Providers on athenaCommunicator | | 16,296 |
| 18,762 |
| 23,024 |
| 28,360 |
| | 31,707 |
| 33,976 |
| 38,699 |
| 41,777 |
|
| | | | | | | | | | | | |
| Client Performance | | | | | | | | | | | |
| Net Promoter Score (1) | | | n/a |
| n/a |
| n/a |
| n/a |
| | 44.7 |
| 41.2 |
| 47.5 |
| 42.0 |
|
| Client Days in Accounts Receivable (“DAR”) | | 37.6 |
| 37.0 |
| 38.4 |
| 38.0 |
| | 41.1 |
| 39.0 |
| 39.2 |
| 38.8 |
|
| First Pass Resolution (“FPR”) Rate | | 93.9 | % | 94.2 | % | 94.1 | % | 93.9 | % | | 93.5 | % | 93.7 | % | 93.7 | % | 94.3 | % |
| Electronic Remittance Advice (“ERA”) Rate | | 81.8 | % | 82.8 | % | 82.0 | % | 83.3 | % | | 82.3 | % | 82.6 | % | 82.8 | % | 84.6 | % |
| Total Claims Submitted | | 20,732,485 |
| 21,691,357 |
| 22,903,118 |
| 25,435,690 |
| | 25,785,710 |
| 28,177,665 |
| 29,169,062 |
| 32,864,269 |
|
| Total Client Collections ($) | | 2,566,960,419 |
| 2,836,765,406 |
| 2,974,736,918 |
| 3,285,027,602 |
| | 3,172,115,234 |
| 3,679,375,661 |
| 3,843,394,756 |
| 4,263,271,914 |
|
| Total Working Days | | | 61 |
| 64 |
| 64 |
| 62 |
| | 61 |
| 64 |
| 64 |
| 62 |
|
| | | | | | | | | | | | |
| Employees | | | | | | | | | | | |
| Direct | | | 1,426 |
| 1,438 |
| 1,460 |
| 1,533 |
| | 1,573 |
| 1,633 |
| 1,698 |
| 1,797 |
|
| Sales & Marketing | | | 426 |
| 455 |
| 464 |
| 473 |
| | 509 |
| 556 |
| 569 |
| 582 |
|
| Research & Development | | 526 |
| 587 |
| 651 |
| 677 |
| | 717 |
| 812 |
| 918 |
| 952 |
|
| General & Administrative | | 275 |
| 278 |
| 290 |
| 284 |
| | 289 |
| 311 |
| 340 |
| 345 |
|
| Total Employees | | | 2,652 |
| 2,758 |
| 2,865 |
| 2,966 |
| | 3,088 |
| 3,312 |
| 3,525 |
| 3,677 |
|
| | | | | | | | | | | | |
| Quota Carrying Sales Force | | | | | | | | | | |
| Total Quota Carrying Sales Representatives | | 114 |
| 119 |
| 120 |
| 126 |
| | 133 |
| 140 |
| 142 |
| 153 |
|
(1) Net Promoter Score is a new metric for 2014
|
| |
| Supplemental Metrics Definitions | |
| | |
| Client Base | |
| Total Physicians on athenaCollector | The number of physicians that have rendered a service which generated a medical claim that was billed during the last 91 days on the athenaCollector platform. Examples of physicians include Medical Doctors (“MDs”) and Doctors of Osteopathic Medicine (“DOs”).
|
| Total Providers on athenaCollector | The number of providers, including physicians, that have rendered a service which generated a medical claim that was billed during the last 91 days on the athenaCollector platform. Examples of non-physician providers are Nurse Practitioners (“NPs”) and Registered Nurses (“RNs”).
|
| Total Physicians on athenaClinicals | The number of physicians that have rendered a service through the athenaClinicals platform which generated a medical claim that was billed during the last 91 days on the athenaCollector platform. |
| Total Providers on athenaClinicals | The number of providers, including physicians, that have rendered a service through the athenaClinicals platform which generated a medical claim that was billed during the last 91 days on the athenaCollector platform. |
| Total Physicians on athenaCommunicator | The number of physicians that have rendered a service which generated a medical claim that was billed during the last 91 days on the athenaCollector platform and whose practice is actively using athenaCommunicator. |
| Total Providers on athenaCommunicator | The number of providers, including physicians, that have rendered a service which generated a medical claim that was billed during the last 91 days on the athenaCollector platform and whose practice is actively using athenaCommunicator. |
| | |
| Client Performance | |
| Net Promoter Score | The percentage of clients who chose 9 or 10 ( defined as promoters) less the percentage of clients who chose 0 through 6 ( defined as detractors) on a scale of 1 to 10 when asked if they would recommend athenahealth to a trusted friend or colleague. These responses are generated from a "client listening" survey that the Company conducts for its client base twice per year.
|
| Client Days in Accounts Receivable (“DAR”) | The average number of days that it takes outstanding balances on claims to be resolved, e.g. paid, for clients on athenaCollector. Clients that have been live less than 90 days are excluded, as well as clients who are terminating services.
|
| First Pass Resolution (“FPR”) Rate | Approximates the percentage of primary claims that are favorably adjudicated and closed after a single submission during the period. Currently, the FPR rate is calculated on a monthly basis, and certain practices are excluded (e.g. those that have been live for less than 90 days). |
| Electronic Remittance Advice (“ERA”) Rate | Remittance refers to the information about payments (a/k/a explanations of benefits) received from insurance companies during the period. The ERA rate reflects the percentage of total charges that were posted using electronic remittance. |
| Total Claims Submitted | The number of claims billed through athenaNet during the period. |
| Total Client Collections | The dollar value of collections posted on behalf of clients during the period. |
| Total Working Days | The total number of days during the quarter minus weekends and U.S. Post Office holidays. |
| | |
| Employees | |
| Direct | The total number of full time equivalent individuals (“FTEs”) employed by the Company to support its service operations as of quarter end. This team includes production systems, enrollment services, paper claim submission, claim resolution, clinical operations, professional services, account management, and client services. |
| Sales & Marketing | The total number of FTEs employed by the Company to support its sales and marketing efforts as of quarter end. This team includes sales representatives, business development staff and the marketing team. |
| Research & Development | The total number of FTEs employed by the Company to support its research and development efforts as of quarter end. This team includes product development and product management. |
| General & Administrative | The total number of FTEs employed by the Company to support its general and administrative functions as of quarter end. This team includes finance, human resources, compliance, learning and development, internal audit, corporate technology, recruiting, facilities, and legal. |
| Total Employees | The total number of FTEs employed by the Company as of quarter end. This number excludes interns and seasonal employees. |
| Total Quota Carrying Sales Representatives | The total number of sales representatives who carry quota for net new annual recurring revenue as of quarter end. |
|
| |
| Corporate Scorecard Metrics Definitions |
| | |
| Stability | |
| Voluntary Turnover | A quarterly average of the number of voluntary terminations divided by starting headcount. Voluntary turnover excludes employees on action plans or employees on counseling out plans.
|
| Corporate Citizenship | Percentage of compliance tasks that are met within the deadline. |
| Employee Engagement | Quarterly engagement survey results for employees. |
| | |
| Performance | |
| Total Automation Rate | Percentage of major revenue cycle management, clinicals and patient statement transactions that were sent or received in a structured electronic format. The Total Automation Rate definition changed from 2013 and the metric results may not be comparable.
|
| Net On-boarding Success | This metric calculates net on-boarding success which represents the number of providers added to athenaClinicals that are not considered stragglers in their fourth week post go-live. Providers are categorized as either champions, neutrals, or stragglers based on several key performance metrics including same day encounter close rate, provider documentation time, and the percentage of encounters documented during the patient visit.
|
| Patient Full Registration | The percentage of patients in the current panel (claims created in the last 18 months) with complete patient registration information including driver's license, insurance card and confirmed eligibility.
|
| | |
| Satisfaction | |
| Net Promoter Score | The percentage of clients who chose 9 or 10 ( defined as promoters) less the percentage of clients who chose 0 through 6 ( defined as detractors) on a scale of 1 to 10 when asked if they would recommend athenahealth to a trusted friend or colleague. These responses are generated from a “client listening” survey that the Company conducts for its client base twice per year.
|
| Days of Client Work | The outstanding work that clients have in our clinicals and revenue cycle offerings. For clinicals, the total stock of work on the clinicals dashboard divided by average daily inflow of tasks. For revenue cycle, the days in accounts receivable relating to work that needs to be resolved by the client. Both clinicals and revenue cycle are weighted at 50%.
|
| Provider Documentation Time per Appointment | The average number of minutes athenaClinicals providers spend on the computer documenting the exam and orders for each appointment. Providers that have been live less than 90 days are excluded.
|
| Minutes per RVU | Total minutes spent within athenaCollector webpages based on weblogs divided by RVU’s posted.
|
| | |
| Financial | |
| Bookings | The annualized value of deals sold. |
| Total Revenue | Total consolidated revenue. |
| Non-GAAP Adjusted Operating Income | Total non-GAAP adjusted operating income. |
| #Physicians on the Network | Active physicians in the last 90 days on Epocrates and rendering physicians live on athenaNet. Physicians live on athenaNet is defined as the number of physicians that have rendered a service which generated a medical claim that was billed during the last 91 days on the athenaCollector platform. Examples of physicians include Medical Doctors (“MDs”) and Doctors of Osteopathic Medicine (“DOs”).
|