Exhibit 99.2
First Quarter Fiscal Year 2016 
Prepared Remarks April 28, 2016
Jonathan Bush, Chairman & Chief Executive Officer
Kristi Matus, Executive Vice President, Chief Financial & Administrative Officer
About These Remarks
The following commentary is provided by management in conjunction with the first quarter fiscal year 2016 earnings press release issued by athenahealth, Inc. (“athenahealth” or “we”). These remarks represent management’s current views on our financial and operational performance and are provided to give investors and analysts more time to analyze and understand our performance in advance of the earnings conference call. These prepared remarks will not be read on the conference call. A complete reconciliation between generally accepted accounting principles (“GAAP”) and non-GAAP results, as well as a summary of supplemental metrics and definitions, is provided in the tables following these prepared remarks.
Earnings Conference Call Information
To participate in our live conference call and webcast, please dial 877-853-5645 (or 408-940-3868 for international calls) using conference code no. 86044982, or visit the Investors section of our website at www.athenahealth.com. A replay will be available for one week following the conference call at 855-859-2056 (and 404-537-3406 for international calls) using conference code no. 86044982. A webcast replay will also be archived on our website.
Safe Harbor and Forward-Looking Statements
These remarks contain forward-looking statements within the meaning of Section 27A of the Securities Act of 1933, as amended, and Section 21E of the Securities Exchange Act of 1934, as amended, including statements regarding management’s expectations for future financial and operational performance and operational expenditures, expected growth, and business outlook, including fiscal 2016 guidance; statements regarding our focus on leveraging our network to drive growth, broaden and deepen our services and build deeper and more strategic connections in the health care industry; statements regarding the strength of the drivers of our long-term success; statements regarding our ability to achieve full year PQRS goals; statements regarding improvement of our portal experience and adoption, and patient engagement; statements regarding improving our net promoter score; statements regarding the appropriate future metrics to use in measuring our market share; statements regarding the benefits of and demand for our service offerings, including our newer service offerings and timing of the availability of and transition to these newer offerings, including athenaClinicals Streamlined; statements regarding the potential expansion and value of our network and progress towards building the health care information backbone; investments in disruptive innovation and emerging services and the expected long-term value creation from our investments; developments and plans for inpatient service offerings and positioning to serve the hospital and health system market, including the expansion of services to support the acute care market by leveraging our More Disruption Please program; the timing and impact of expansion of our client base outside the traditional ambulatory market; the impact of acquisitions; and statements found under our “Reconciliation of Non-GAAP Financial Measures to Comparable GAAP Measures” and “Reconciliation of Non-GAAP Financial Measures to Comparable GAAP Measures for Fiscal Year 2016 Guidance” sections of these remarks. Forward-looking statements may be identified with words such as “will,” “may,” “expect,” “plan,” “anticipate,” “upcoming,” “believe,” “expect,” or similar terminology, and the
negative of these terms. Forward-looking statements are not promises or guarantees of future performance, and are subject to a variety of risks and uncertainties, many of which are beyond our control, which could cause actual results to differ materially from those contemplated in these forward-looking statements. These risks and uncertainties include: our highly competitive industry and our ability to compete effectively and remain innovative; our ability to retain members of our Epocrates network and to realize the anticipated benefits of the Epocrates and other acquisitions or investments; the development of the market for cloud-based health care information technology services; changes in the health care industry and their impact on the demand for our services; our ability to effectively manage our growth; our ability to protect our intellectual property; current and future litigation, including for intellectual property infringement; our dependence on third-party providers; risks and costs associated with our worldwide operations; our ability to attract and retain highly skilled employees; our fluctuating operating results; our ability to retain our clients and maintain client revenue; our tax liability; our variable sales and implementation cycles; the timing at which we recognize certain revenue and our ability to evaluate our prospects; defects and errors in our software or services, or interruptions or damages to our systems or those of third parties on which we rely; a data security breach; limitations on our use of data; the effect of payer and provider conduct; the failure of our services to provide accurate and timely information; increasing government regulation and the costs and challenges of compliance; the potential for illegal behavior by employees or subcontractors; and the price volatility of our common stock. Forward-looking statements speak only as of the date hereof and, except as required by law, we undertake no obligation to update or revise these forward-looking statements. For additional information regarding these and other risks faced by us, refer to our public filings with the Securities and Exchange Commission (“SEC”), available on the Investors section of our website at www.athenahealth.com and on the SEC’s website at www.sec.gov.
Use of Non-GAAP Financial Measures
These remarks contain non-GAAP financial measures, as defined by SEC Regulation G. The GAAP financial measure most directly comparable to each non-GAAP financial measure used or discussed, and a reconciliation of the differences between each non-GAAP financial measure and the comparable GAAP financial measure, are included following these prepared remarks or can be found within our first quarter fiscal year 2016 earnings press release in the Investors section of our website at www.athenahealth.com.
Opening Remarks
athenahealth’s vision is to build the health care internet and connect care across the continuum. We deliver network-enabled services that are focused on improving clinical outcomes and financial results for our clients. This results-driven approach is further evidenced by our noteworthy 2015 Meaningful Use attestation success and our 2015 Physician Quality Reporting System success. Our network has grown to over 78,000 providers, nearly 80 million unique patient records, and over 128,000 endpoints that exchange information across the network. This year we will focus on leveraging this vast and connected network to drive growth, broaden and deepen our services, and build deeper and more strategic connections in the health care industry.
Highlights from Q1 2016 include the following:
| |
• | Grew consolidated revenue by 24% over Q1 2015 |
| |
| • | Delivered Non-GAAP Adjusted Gross Margin rate of 62.0%, down from 62.7% in Q1 2015 |
| |
| • | Delivered Non-GAAP Adjusted Operating Margin rate of 9.5%, up from 7.9% in Q1 2015 |
| |
| • | Grew net new active physicians on athenaCollector® (1,816 physicians added), athenaClinicals (1,302 physicians added), and athenaCommunicator® (1,643 physicians added) in Q1 2016, compared to athenaCollector (1,639 physicians added), athenaClinicals (985 physicians added), and athenaCommunicator (1,415 physicians added) in Q1 2015 |
| |
| ◦ | Grew athenaCollector physicians by 21%, athenaClinicals physicians by 32%, and athenaCommunicator physicians by 26% over Q1 2015, representing continued strong network growth in 2016 |
| |
| • | Grew net new active providers on athenaCollector (2,742 providers added), athenaClinicals (1,892 providers added), and athenaCommunicator (2,423 providers added) in Q1 2016, compared to athenaCollector (2,299 providers added), athenaClinicals (1,362 providers added), and athenaCommunicator (1,993 providers added) in Q1 2015 |
| |
| ◦ | Grew athenaCollector providers by 21%, athenaClinicals providers by 32%, and athenaCommunicator providers by 26% over Q1 2015, representing continued strong network growth in 2016 |
| |
| • | Continued the implementation waves at Trinity Health (athenaOne), brought the first service area live at Dignity Health (Population Health) and kicked off the implementation at Adventist Health (athenaOne) |
| |
| • | Continued to help our clients avoid penalties related to the Meaningful Use and Physician Quality Reporting System programs |
| |
| ◦ | Exceeded our 95% ambulatory 2015 Meaningful Use attestation goal with 97.6% of our participating athenaClinicals providers successfully attesting for Meaningful Use in 2015 |
| |
| ◦ | Exceeded our 95% inpatient 2015 Meaningful Use attestation goal with 95.7% of our participating hospital clients successfully attesting for Meaningful Use in 2015 |
| |
| ◦ | Achieved our 2015 Physician Quality Reporting System (“PQRS”) goal with 94.7% of our athenaOne providers having successfully reported their data |
| |
| • | Joined Carequality and adopted the Carequality Interoperability Framework in order to promote and enable nationwide health information exchange |
| |
| • | Demonstrated success with our More Disruption Please program with the acquisition of Arsenal Health, formerly known as Smart Scheduling, Inc. |
| |
| • | Announced partnership with Intacct, a leading provider of best-in-class cloud enterprise resource planning software, to deliver a comprehensive cloud-based financial solution for hospitals |
| |
| • | Showcased our thought leadership on the benefits of a future-proof, interoperable network at 2016 HIMSS with the “Views from the Top” presentation by Jonathan Bush, CEO of athenahealth and John Halamka, CIO of Beth Israel Deaconess Medical Center |
| |
| • | Awarded the 2015 Best in KLAS rankings for athenaCollector for Practice Management (11-75 Physicians) and athenaClinicals for Ambulatory EMR (11-75 Physicians) and achieved number two rankings for athenaCollector for Practice Management (1-10 Physicians and Over 75 Physicians), athenaClinicals for Ambulatory EMR (Over 75 Physicians), athenaCommunicator for Patient Portal, and Overall Physician Practice Vendor |
Results Overview
athenahealth’s top line results for the first quarter of fiscal year (“FY”) 2016 reflect solid revenue growth:
| |
| ◦ | $256.1 million in Q1 2016, representing 24% growth over $206.4 million in Q1 2015 |
Our bottom line results for Q1 2016, consistent with our growth strategy, demonstrate deliberate sales, marketing, and research and development investments, and a focus on operating efficiencies:
| |
| • | Non-GAAP Adjusted Gross Profit and Margin: |
| |
| ◦ | $158.9 million, or 62.0% of total revenue, in Q1 2016, an increase of 23% over $129.4 million, or 62.7% of total revenue, in Q1 2015 |
| |
| • | GAAP Selling and Marketing expense: |
| |
| ◦ | $57.6 million, or 22.5% of total revenue, in Q1 2016, an increase of 8% over $53.4 million, or 25.9% of total revenue, in Q1 2015 |
| |
| • | GAAP Research and Development expense: |
| |
| ◦ | $25.1 million, or 9.8% of total revenue, in Q1 2016, an increase of 6% over $23.7 million, or 11.5% of total revenue, in Q1 2015 |
| |
| • | GAAP General and Administrative expense: |
| |
| ◦ | $40.9 million, or 16.0% of total revenue, in Q1 2016, an increase of 13% from $36.2 million, or 17.5% of total revenue, in Q1 2015 |
| |
| • | Non-GAAP Adjusted EBITDA: |
| |
| ◦ | $49.8 million, or 19.4% of total revenue, in Q1 2016, an increase of 40% from $35.7 million, or 17.3% of total revenue, in Q1 2015 |
| |
| • | GAAP Operating Income (Loss): |
| |
| ◦ | $0.3 million, or 0.1% of total revenue, in Q1 2016, compared to $(11.8) million, or (5.7)% of total revenue, in Q1 2015 |
| |
| • | Non-GAAP Adjusted Operating Income and Margin: |
| |
| ◦ | $24.2 million, or 9.5% of total revenue, in Q1 2016, an increase of 49% from $16.3 million, or 7.9% of total revenue, in Q1 2015 |
| |
| ◦ | $0.8 million, or loss of $0.02 per diluted share, in Q1 2016, compared to $8.8 million, or loss of $0.23 per diluted share, in Q1 2015 |
| |
| • | Non-GAAP Adjusted Net Income: |
| |
| ◦ | $13.4 million, or $0.34 per diluted share, in Q1 2016, an increase of 47% from $9.1 million, or $0.24 per diluted share, in Q1 2015 |
We measure our performance based on a balanced scorecard model. We believe that this framework is an excellent report card for our performance for the current year and that it measures the key performance indicators required for long-term success. For 2016, we have developed a more streamlined and more heavily weighted scorecard focused on eight key stability, performance, satisfaction and financial metrics. The table below shows the scorecard results for Q1 2016. Please reference the last page of this document for definitions of our corporate scorecard metrics.
|
| | | |
| | Q1 2016
Results |
| |
| | |
| Stability (10% weight) | |
| Voluntary Turnover | 2.4 | % |
| Employee Engagement | (a) |
| Stability Results | 113 | % |
| | |
| Performance (40% weight) | |
| athenaCollector Composite | 103.1 | % |
| athenaClinicals Composite | 89.1 | % |
| athenaCommunicator Composite | 96.8 | % |
| athenaCoordinator Composite | 108.0 | % |
| Epocrates Composite | 100.7 | % |
| Performance Results | 98 | % |
| | |
| Satisfaction (15% weight) | |
| Net Promoter Score | 34.0 |
|
| Satisfaction Results | 77 | % |
| | |
| Financial (35% weight) | |
| Bookings (b) | (b) |
| Non-GAAP Adjusted Operating Income ($M) | $ | 24.2 |
|
| Financial Results | 96 | % |
| | |
| Total Results | 96 | % |
| |
| (a) | Employee Engagement survey result reported in Q2 and Q4 only. |
| |
| (b) | Since the bookings metric contains highly sensitive data, we do not disclose all of the specific performance measures and targets, because we believe that such disclosure would result in serious competitive harm. |
We believe that our underlying drivers of long-term success remain relatively strong as supported by the following metric results:
| |
• | Voluntary Turnover of 2.4% in Q1 2016, favorable to our goal of 2.8%. We closely track employee retention metrics and monitor employee engagement via our semi-annual engagement surveys. We continue to focus on programs that attract and develop top talent across all of our locations. |
| |
| • | athenaCollector Composite result of 103.1%, driven by strong performance in the Time of Service “TOS” Collection Rate metric, mainly attributable to the introduction of our new TOS workflow in Q4 2015. |
| |
| • | athenaClinicals Composite result of 89.1%, driven by slightly lower than expected 2016 Physician Quality Reporting System (“PQRS”) results. We believe the first quarter miss in our PQRS metric was timing related and we remain confident in our ability to achieve our full year PQRS goals. |
| |
| • | athenaCommunicator Composite result of 96.8%, driven by slightly lower than expected Portal Adoption and Portal Engagement Rate metric results. We remain focused on improving our patient portal and broader patient communication strategies in order to improve portal experience and increase portal adoption and patient engagement over time. |
| |
| • | athenaCoordinator Composite result of 108.0%, driven by strong performance in the Coordinated Patient Rate metric, resulting from the growth in the amount of activity associated with chart sharing between athenaNet and third party vendors. |
| |
| • | Epocrates Composite result was 100.7% as the 90 Day Active Doc Engagement rate metric result was in line with our goal. |
| |
| • | Net Promoter Score of 34.0 in Q1 2016, versus goal of 44.0 and 40.3 in Q4 2015. We regularly solicit client feedback and we take it seriously. We have a number of initiatives underway that we believe will improve our net promoter score over the long run. First, we have product leaders focused solely on improving service delivery and performance. Second, we are reducing the number of releases that impact client workflows to three times a year. Finally, we are migrating the entire client base to athenaClinicals Streamlined. |
athenahealth’s client base continues to expand while client adoption of other services in the athenahealth service suite grows. As our client base expands outside the traditional ambulatory market, we believe that total active providers, receiver nodes, and eventually covered lives, total managed lives, and discharge bed days managed by or transacted across our network will become more appropriate metrics to use in measuring our market share. During Q1 2016:
| |
| • | 84% of all new athenaCollector deals included athenaClinicals, compared to 84% in Q1 2015 |
| |
• | 80% of all new athenaCollector deals included athenaClinicals, athenaCommunicator and athenaCoordinator, compared to 81% in Q1 2015. |
| |
| • | 46% of total athenaCollector physicians have adopted athenaClinicals, up from 42% in Q1 2015 |
| |
| • | 74% of total athenaCollector physicians have adopted athenaCommunicator, up from 71% in Q1 2015 |
| |
• | Net new physicians and providers added sequentially to the network were as follows: |
|
| | | | | | | | | | | | | | |
| | athenaCollector | | athenaClinicals | | athenaCommunicator |
| Active physicians and providers: | Physicians | Providers | | Physicians | Providers | | Physicians | Providers |
| Beginning balance as of 12/31/15 | 55,277 |
| 75,416 |
| | 24,867 |
| 32,684 |
| | 40,635 |
| 52,821 |
|
| Net new additions | 1,816 |
| 2,742 |
| | 1,302 |
| 1,892 |
| | 1,643 |
| 2,423 |
|
| Ending balance as of 3/31/16 | 57,093 |
| 78,158 |
| | 26,169 |
| 34,576 |
| | 42,278 |
| 55,244 |
|
| Sequential growth % | 3 | % | 4 | % | | 5 | % | 6 | % | | 4 | % | 5 | % |
| |
| • | Net new physicians and providers added to the network since Q1 2015 were as follows: |
|
| | | | | | | | | | | | | | |
| | athenaCollector | | athenaClinicals | | athenaCommunicator |
| Active physicians and providers: | Physicians | Providers | | Physicians | Providers | | Physicians | Providers |
| Beginning balance as of 3/31/15 | 47,062 |
| 64,648 |
| | 19,796 |
| 26,166 |
| | 33,578 |
| 43,770 |
|
| Net new additions | 10,031 |
| 13,510 |
| | 6,373 |
| 8,410 |
| | 8,700 |
| 11,474 |
|
| Ending balance as of 3/31/16 | 57,093 |
| 78,158 |
| | 26,169 |
| 34,576 |
| | 42,278 |
| 55,244 |
|
| Y/Y growth % | 21 | % | 21 | % | | 32 | % | 32 | % | | 26 | % | 26 | % |
| |
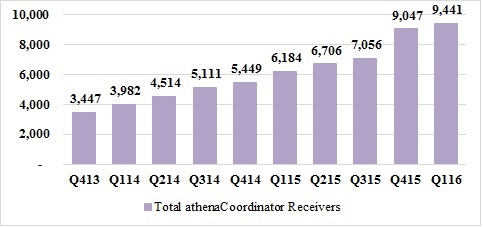
| • | 394 athenaCoordinator receivers were added to the network, bringing our athenaCoordinator receiver base to 9,441 receivers as of March 31, 2016 |
Revenue Discussion
Q1 2016 revenue was $256.1 million and grew by 24% (or $49.7 million) over Q1 2015.
|
| | | | |
| | Q1 2016 | Q1 2015 | Y/Y Growth% |
| Business Services | $247.5 | $197.8 | 25 | % |
| Implementation and other | $8.6 | $8.6 | — | % |
| Consolidated Revenue | $256.1 | $206.4 | 24 | % |
In terms of trends in our recurring revenue base, same-store analysis of claims created—a proxy for physician office utilization—indicates that physician office activity in Q1 2016 increased modestly over physician office activity during Q1 2015. However, our analysis showed a slight decrease in physician office activity in Q1 2016 compared to Q4 2015, which is consistent with prior year trends.
Non-GAAP Adjusted Gross Margin Discussion
Our Non-GAAP Adjusted Gross Margin was 62.0% for Q1 2016, down approximately 70 basis points from 62.7% in Q1 2015. First quarter Non-GAAP Adjusted Gross Margin was negatively impacted by timing of implementation and benefit costs. We expect these higher first quarter costs will be offset by lower costs in the second half of 2016. One of our goals is to improve gross margin on a service-line basis each year. As previously discussed, the expansion of our newer service offerings, such as athenaOne for Hospitals and Health Systems, is expected to serve as a headwind to total company margin expansion until these newer services become more automated and scalable. Our fiscal year 2016 Non-GAAP Adjusted Gross Margin guidance range remains at 63.5% to 64.5%.
Balance Sheet and Cash Flow Highlights
As of March 31, 2016, we had cash and cash equivalents of $100.6 million and outstanding indebtedness of $300.0 million. Operating cash flow decreased by $4.6 million from net cash provided by operating activities of $12.9 million for the three months ended March 31, 2015, to net cash provided by operating activities of $8.3 million for the three months ended March 31, 2016.
Fiscal Year 2016 Outlook
We are reaffirming the fiscal year 2016 guidance we communicated on December 10, 2015 at our 8th Annual Investor Summit. Our fiscal year 2016 guidance is summarized in the following table:
|
| |
| For the Fiscal Year Ending December 31, 2016 |
| Forward-Looking Guidance |
| GAAP Total Revenue | $1,085 - $1,115 million |
| Non-GAAP Adjusted Gross Margin | 63.5% - 64.5% |
| Non-GAAP Adjusted Operating Income | $120 - $135 million |
| Non-GAAP Adjusted Net Income per Diluted Share | $1.65 - $1.85 |
| Non-GAAP Tax Rate | 40% |
Service Development Discussion
Service development at athenahealth is organized around our mission to be health care providers’ most trusted service, helping them do well by doing the right thing. In order to fulfill this mission, we deliver services backed by our network, knowledge, and back-office work. We deliver network-enabled services for revenue cycle and practice management, electronic health records, patient engagement, patient access, care coordination, order transmission, population health management, and clinical decision support.
athenahealth-branded and Epocrates-branded service offerings
The following suite of network-enabled services connects our clients to financial results, clinical outcomes, patients, and the broader care continuum:
athenaCollector is our network-enabled revenue cycle and practice management service, which became generally available in 2000. Through this service, athenahealth helps to reduce administrative work and enables clients to improve performance and efficiency under reimbursement models, including Pay-for-Performance. athenaCollector is offered as a stand-alone solution for revenue cycle and practice management and athenaCollector for Hospitals and Health Systems is offered as a stand-alone revenue cycle solution for hospital clients. In addition, our revenue cycle services are also integrated with more comprehensive offerings: athenaOne and athenaOne for Hospitals and Health Systems, respectively.
athenaClinicals is our network-enabled electronic health record (“EHR”) service designed to make the documentation and exchange of health information easier by centering the workflow around the patient visit. athenaClinicals encourages delegation by intelligently surfacing relevant clinical content based on physician behavior across the network, and helps with tedious administrative work associated with managing orders and results. It entered general availability in 2006 and was made available as a stand-alone service in 2010. athenahealth also offers an EHR service to clients who provide care in the acute care setting - athenaClinicals for Hospitals and Health Systems - which transforms the core athenaClinicals services so that they are appropriate for the additional requirements of a non-ambulatory setting. Both athenaClinicals and athenaClinicals for Hospitals and Health Systems are also offered as part of comprehensive solutions: athenaOne and athenaOne for Hospitals and Health Systems, respectively.
athenaCommunicator is our network-enabled patient engagement and communication service. It entered general availability in 2010 and continues to help providers deepen their relationships with their patients. This service offers a unique approach to patient communication by combining web-based automated messaging and patient portal with the ability to speak to live operators for patients who receive specific call types. Clients who also use athenaClinicals can choose to allow their patients to view specific portions of their medical record via the patient portal.
athenahealth Population Health (formerly athenaCommunicator Enterprise) is our network-enabled population health management service. This comprehensive, network-enabled service combines software and analytics to execute, track, and coordinate care across a provider’s network. After clients transfer data from payers, finance systems, laboratories, clinical repositories, and/or EHRs, athenahealth Population Health processes and integrates that data and provides a platform through which clients can glean important insight into and manage the health of their patient population. athenahealth began offering population health management services in 2012 after the acquisition of Healthcare Data Services LLC. Effective 2016, this service has been rebranded as athenahealth Population Health.
athenaCoordinator is our EHR-agnostic, network-enabled order transmission service, which entered general availability in 2012. While most clients who use athenaClinicals are included in the receiver network, athenaCoordinator clients also include stand-alone facilities that receive orders via a “lite” portal to streamline receipt from their senders.
athenaCoordinator Enterprise is our network-enabled care coordination, patient access, and order transmission service. This service was first offered by athenahealth in 2011 after the acquisition of Proxsys, LLC. athenaCoordinator Enterprise is targeted at health systems navigating the difficult and costly work associated with coordinating care among multiple providers and trading partners in order to manage diverse populations of patients. This service enables smooth transitions in care, with direct scheduling across the client’s organization and secure mobile and desktop messaging for provider collaboration.
Epocrates-branded services center around a variety of clinical information and decision support offerings available through health care providers’ mobile devices. These services include: drug and disease information, medical calculator and tools, clinical guidelines, clinical messaging, virtual representative services, market research, and formulary hosting. The Epocrates network of members consists of over one million health care professionals, including approximately 50% of U.S. physicians. The features available through our Epocrates application help health care professionals make more informed prescribing
decisions, improve workflow, and enhance patient safety. athenahealth acquired Epocrates on March 12, 2013.
Connecting to financial results:
Our athenaCollector service enables clients to secure full payment faster, reduce administrative drag and cost, and stay current with industry change. Our clients gain greater control over their financial results with our unique rules engine, hands-on performance coaching, and comprehensive back-office services that include claim submission and denial management. The athenaCollector team is focused on three major areas in 2016: reducing client work, mastering collections of self-pay balances, and adding capabilities to expand in key markets. We made meaningful progress relative to these three objectives in the first quarter, particularly on the self-pay front with the introduction and adoption of our new Time of Service (“TOS”) workflows. Our new TOS workflow delivers an integrated and more intuitive workflow for the patient check-in process. It also provides an improved user interface and better information to assist the front office staff with patient collections. The TOS Collections Rate is a key metric we track across our network and is defined as the percentage of copays and outstanding balance dollars collected for each visit at the time of service. We started introducing the new TOS workflow to clients in late 2015 and successfully moved the entire athenaCollector client base onto the new workflow in early January 2016. Our ability to quickly and seamlessly introduce new workflows and effectively drive client performance is evidenced by our athenaCollector composite metric result. As you can see from the corporate scorecard, the athenaCollector composite metric was 103.1% for Q1 2016, with the over-performance driven mainly by the TOS Collection Rate.
Connecting to clinical outcomes:
Our athenaClinicals service helps providers deliver high quality care by organizing the moment of care for maximum clinical productivity. Our athenaClinicals clients benefit from continuous embedded access to the best practices of the nation’s largest clinical network, the most up-to-date and extensive quality rules and clinical guidelines, and performance management support from our team of quality experts. Our results oriented approach has yielded industry-leading performance in both the Meaningful Use (“MU”) and Physician Quality Reporting System (“PQRS”) programs. We are pleased to report that we exceeded our 95% MU goal with our 2015 ambulatory MU attestation success of 97.6% and our 2015 inpatient MU attestation success of 95.7%. We are also pleased to report that we achieved our 2015 PQRS goal of 95%. The final MU attestation success represents the percentage of providers on athenaClinicals enrolled in the Medicare MU program who successfully met program requirements for calendar year 2015 and submitted their information to athenahealth for registration and attestation with the Centers for Medicare and Medicaid Services (“CMS”). The final inpatient MU attestation success represents the percentage of hospital clients on athenaClinicals for Hospitals and Health Systems enrolled in the Medicare MU program who successfully met program requirements for calendar year 2015. PQRS is a CMS penalty-only program that uses patient data to measure quality outcomes and determine Medicare reimbursement accordingly. All physicians, therapists, and practitioners who bill Medicare must report PQRS. Those who did not report PQRS in 2015 will face a -2% downward adjustment to their Medicare payments in 2017. Today, approximately 4% of the physician market or 26,169 physicians have adopted athenaClinicals. We plan to accelerate the adoption of our athenaClinicals service by radically improving the physician experience with the broad launch of the athenaClinicals Streamlined experience. The athenaClinicals Streamlined experience is about reimagining our EHR from the perspective of the physician. It centers the encounter around the patient, improves the amount and ease of delegating work away from the physician, allows the physician to document as they would communicate, and includes a variety of accelerators to speed documentation of the patient story. Releasing the athenaClinicals Streamlined experience to all clients is a significant initiative for 2016. Starting in early 2016, we are marketing the athenaClinicals Streamlined experience across all sales segments and specialties. In addition, we are currently onboarding
all net new clients onto Streamlined while continuing to refine our rollout strategy to existing clients. We plan to bring the entire athenaClinicals client base onto Streamlined by the end of 2016.
Connecting to patients:
In the first quarter, we passed a major milestone on the path towards connecting and engaging patients and providers on our network. We added almost 1.3 million registered patients to our athenaCommunicator platform, surpassing 10 million registered patients. This achievement represents an exciting level of growth - 81% over the first quarter of 2015 - but also brings additional network effects to our network-enabled service through best practices research and content. Through our network insights, we determined that sending patient appointment reminders reduces appointment no-show rate by 1.7 percentage points. During the quarter, we also passed the 30% patient portal adoption threshold with 30.3% as of Q1 2016. Based on KLAS data, this places us in a leadership position amongst our competitive peers, and compares to our own performance level of 26.3% in Q1 2015. More importantly though, these higher levels of adoption enable our clients to more effectively develop lines of communication with their patients and ultimately improve clinical outcomes.
But we’re not satisfied yet. We continue to advocate for the use of best practices to drive metrics such as patient log-in volume, self-pay yield, and portal payment volume. Simultaneously, we are actively reimagining patient communication strategies. This is only possible on a network-enabled service. Importantly, we are also holding ourselves accountable to driving additional improvement in our network’s adoption rate. We track our performance with regard to increased portal adoption and patient engagement through our athenaCommunicator composite index on our corporate balanced scorecard.
Connecting to the care continuum:
Our network is broad, unique, and highly connected. We connect providers on athenaNet with labs, pharmacies, hospitals, radiology centers, and imaging centers as well as nearly every insurer in the country. Today, our network has grown to over 78,000 providers, nearly 80 million unique patient records, and over 128 thousand endpoints exchanging information across the network. We are committed to building the most connected network in health care. We further advanced this commitment by adopting the Carequality Interoperability Framework alongside a diverse group of health care constituents including provider organizations, national and regional data sharing networks, pharmacies, imaging and lab companies, payers, and EMR vendors (i.e., eClinicalWorks, Epic, NextGen Healthcare). athenahealth decided to become a Carequality member in order to proactively drive client performance related metrics, such as Coordinated Patient Rate and Coordinator Exchange Rate. Coordinated Patient Rate measures the percentage of time key patient information is available at the next point of care, while Coordinator Exchange Rate measures the percentage of patient information exchanged electronically. Both of these metrics exceeded our Q1 2016 targets as evidenced by the 13% growth in electronic transaction volume in Q1 2016 over Q4 2015. The combined performance of these metrics generated a first quarter athenaCoordinator index result of 108.0%. In the first quarter alone, over 1.3 billion electronic transactions were exchanged across the athenaNet network, up from over 1.1 billion electronic transactions exchanged in Q4 2015. Unlike a traditional on-premise software vendor, we are financially aligned with our clients. As a result, we will continue to join and participate in initiatives like Carequality and Commonwell that help us advance health information exchange and help us improve outcomes for our clients.
Under the leadership of our emerging services division, athenahealth is transforming into a continuum of care company. Building off the momentum from 2015, the emerging services team continues to execute on extending our suite of network-enabled services into health systems, with a focus on the inpatient setting. According to the American Hospital Association, approximately 82% of all hospitals in the United States have less than 250 beds. We believe this represents a large expansion opportunity for athenahealth warranting the same disruptive approach we used when entering the ambulatory side of the business. As a
result, we are focused on tackling the five bread and butter hospital ancillaries consisting of emergency, lab, nursing, pharmacy, and radiology. We have started with the under 50-bed hospital market and we will then scale our services to move up market over time - staying focused on removing fixed costs and transforming them to variable costs for these organizations along the way. During the first quarter, we signed additional new hospital deals, we moved existing Razor Insights clients onto athenaNet, and we started the implementation process with a number of hospital deals signed in 2015. In addition, our development partnership with University of Toledo Medical Center is off to a great start and we are already discussing how we can accelerate development efforts to support the acute care workflows for the larger hospital market. Finally, we have partnered with Intacct, a leading provider of best-in-class cloud enterprise resource planning software, in order to deliver a comprehensive cloud-based financial solution for hospitals. As part of this new partnership agreement, we will integrate, support, and sell Intacct’s financial applications with our revenue cycle management services. Our plan is to continue to leverage other best-in-breed, cloud-based companies as we seek to expand our service capabilities and accelerate our ever-increasing footprint in the hospital and health system market.
Business Development Update
More Disruption Please (“MDP”)
Our MDP program’s mission is to create a true distribution platform that attracts and supports new generations of innovators and entrepreneurs and delivers new innovative solutions that help our clients optimize their financial and operational performance. The MDP team remains focused on leveraging all three major components of this program - the network, the marketplace, and the accelerator - to identify opportunities in the market and seamlessly integrate innovative solutions that will benefit athenahealth, our clients, and the health care industry as a whole. While 2015 was a big year for the MDP Program, we expect 2016 to be even bigger. In the first quarter alone, we have grown the MDP Marketplace to 80 partners, 57 of which are generally available across 25 capabilities, and another 23 partners that are currently in the pilot phase. Finally, an additional 35 partners are in integration and testing. In Q1 2016, we also launched the MDP Innovation Challenge and completed the acquisition of Arsenal Health, formerly known as Smart Scheduling, Inc. With respect to the MDP Marketplace, there are now over 1,000 unique clients using an MDP solution, representing growth of 18% in just one quarter. We believe the MDP program has an important role to play in helping us fill ancillary sockets and expand our network-enabled services footprint across the continuum of care. To this end, we are counting on initiatives like the MDP Innovation Challenge to help accelerate our move into the larger, more complex acute care market and help our hospital clients optimize their athenaNet experience. We launched the MDP Innovation Challenge in early January and invited health tech innovators across the country to develop solutions that challenge the status quo in hospital IT. We are pleased to report that 292 participants registered for the MDP Innovation Challenge and we have received over 70 submissions that will be evaluated by a panel of industry experts. We look to provide updates on winners of the MDP Innovation Challenge later this year. We further demonstrated the benefits of our MDP program with the recent acquisition of Arsenal Health. Arsenal Health, our first accelerator investment, built its scheduling optimization application on athenahealth’s application programming interfaces and successfully scaled the company through athenahealth’s client base. We have always believed that the MDP Accelerator program could help successfully feed our mergers and acquisitions pipeline and de-risk potential acquisition targets. This acquisition demonstrates our ability to incubate companies and help them scale and ensure tight cultural and product integration once we have acquired them. The acquisition will make Arsenal Health’s schedule optimization solution widely available as a native part of athenaNet. In addition, we plan to leverage the platform that powers the scheduling optimization solution to build a general purpose predictive analytics engine that we can use for other purposes across athena. To learn more about our MDP program and partnership opportunities and to explore the athenahealth Marketplace, please visit www.athenahealth.com/disruption.
Client Base Discussion
The total number of physicians who have gone live on athenaCollector, our core service offering, is the metric we currently use to define our ambulatory client base and market share. However, as our client base expands outside the traditional ambulatory market, total active providers, network receivers, and eventually covered lives, total managed lives, and discharge bed days will become more appropriate metrics to use to define our network growth, client base, and market share.
During Q1 2016, 84% of all new athenaCollector deals included athenaClinicals, in line with 84% in Q1 2015. 80% of all new athenaCollector deals included athenaClinicals, athenaCommunicator, and athenaCoordinator. The athenaOne rate of 80% in Q1 2016 compares to 81% in Q1 2015. Among “live” (i.e., implemented and active) athenaCollector clients, adoption of athenaClinicals and athenaCommunicator continues to grow and resulted in continued growth to our installed base across all of our service offerings.
athenahealth Service Offering Adoption
(athenaCollector, athenaClinicals, and athenaCommunicator)
athenaCollector Clients
During Q1 2016, total active physicians on athenaCollector grew by 21% year-over-year, to 57,093. On a sequential basis, we added 1,816 net new active physicians on athenaCollector, versus 1,639 in Q1 2015. Our quarterly net new physician additions may vary widely due to the number and size of clients that go live in a particular quarter. Furthermore, our larger clients can be more complex and take longer to go live, particularly if our clients request a more phased implementation approach. Total active providers on athenaCollector grew by 21% year-over-year, to 78,158. On a sequential basis, we added 2,742 net new active providers on athenaCollector, versus 2,299 in Q1 2015.
athenaClinicals Clients
During Q1 2016, total active physicians live on athenaClinicals grew by 32% year-over-year, to 26,169. On a sequential basis, we added 1,302 net new active physicians on athenaClinicals, versus 985 in Q1 2015. This equates to an overall adoption rate of 46% of total athenaCollector physicians, up from 42% in Q1 2015. Total active providers on athenaClinicals grew by 32% year-over-year, to 34,576. On a sequential basis, we added 1,892 net new active providers on athenaClinicals, versus 1,362 in Q1 2015. We expect the athenaClinicals client base to increase over time due to cross-selling within our existing base and growth in the volume of athenaOne deals.
athenaCommunicator Clients
During Q1 2016, total active physicians live on athenaCommunicator grew by 26% year-over-year, to 42,278. On a sequential basis, we added 1,643 net new active physicians on athenaCommunicator, versus 1,415 in Q1 2015. This equates to an overall adoption rate of 74% of total athenaCollector physicians, up from 71% in Q1 2015. Total active providers on athenaCommunicator grew by 26% year-over-year, to 55,244. On a sequential basis, we added 2,423 net new providers on athenaCommunicator, versus 1,993 in Q1 2015. We expect the athenaCommunicator client base to increase over time due to cross-selling within our existing base and growth in the volume of athenaOne deals.
athenahealth Service Offering Adoption
(athenaCoordinator)
athenaCoordinator Receivers
Total athenaCoordinator receivers grew 53% year-over-year to 9,441. On a sequential basis, we added 354 athenaCoordinator receivers the network, versus 735 in Q1 2015.
New Deals
On April 25, 2016, we announced that Michigan State University (“MSU”) HealthTeam, the university’s multi-specialty group practice, has selected our athenaOne suite of network-enabled services to support its entire base of approximately 260 providers. Recognized as mid-Michigan’s leading provider of comprehensive and sub-specialty services, MSU HealthTeam spans more than thirty ambulatory locations, including the MSU Clinical Center on its East Lansing campus.
Client Implementations
Below are the publicly disclosed clients that went live or partially live during Q1 2016:
| |
| • | Trinity Health continued the phased rollout of our suite of services, athenaOne, in some of its physician network offices and brought another wave live in January 2016. |
| |
| • | Dignity Health started the phased rollout of our Population Health service, and brought the first service area live in Q1 2016. |
Growth Discussion
The athenahealth marketing organization encompasses our growth and sales operations, event and partner marketing, inside sales agents (“ISAs”), advertising, corporate communications, and product marketing teams. This organization executes in-market investments in an effort to generate new business opportunities for athenahealth. The athenahealth sales organization includes all quota-carrying sales representatives, as well as our sales team leaders, channel sales team, and sales training and development organization.
In the first quarter of 2016, we launched phase two of our successful “Let Doctors be Doctors” campaign. Its key themes remain the disconnectedness and lack of interoperability throughout the care continuum, this time demonstrated by the daily frustrations encountered by the very relatable Dr. Strings as he works at the mercy of “the system.” At the same time, we are championing the point of view that health care must move towards a new state of openness more energetically than ever. We brought our enthusiasm and sense of urgency to the 2016 HIMSS Annual Conference and Exhibition, where Jonathan Bush co-presented with industry thought leader and Beth Israel Deaconess Medical Center CIO Dr. John Halamka for the only vendor-led keynote presentation during the event. This was in addition to booth-side sessions that featured key leaders from a number of our marquee clients such as Trinity Health, Privia Health, University of Toledo Medical Center, Ascension Health, and NewYork-Presbyterian Medical Groups. These booth-side sessions drove strong demo and meeting activity for athenahealth across all segments and services, especially in the Enterprise segment, Hospital segment, and for our Population Health service. Our marketing and sales teams are positioned to engage and convert these opportunities more successfully than ever through tighter organizational alignment, demonstrable proof points, and a suite of services that are generally available to serve the ambulatory and acute care settings.
As of March 31, 2016, we have a total of 170 quota-carrying sales representatives, including hospital sales, up 11% from March 31, 2015. Our athenahealth-branded services sales force is currently divided into four groups: enterprise, which is dedicated to serving the largest managed care organizations, as well as those with high growth potential; group, which is dedicated to medical practices with seven to 150 physicians; small group, which is dedicated to medical practices with one to six physicians; and hospital, which is dedicated to hospitals and hospital-owned clinics and medical groups with 50 beds or less.
Stock-Based Compensation Expense, Amortization of Purchased Intangible Assets, and Reconciliation of Non-GAAP Financial Measures
athenahealth, Inc.
STOCK-BASED COMPENSATION
(Unaudited, in thousands)
Set forth below is a breakout of stock-based compensation impacting the Condensed Consolidated Statements of Income for the three months ended March 31, 2016, and 2015:
|
| | | | | | | |
| | Three Months Ended
March 31, |
| | 2016 | | 2015 |
| Stock-based compensation charged to Condensed Consolidated Statements of Income: | | | |
| Direct operating | $ | 4,843 |
| | $ | 3,696 |
|
| Selling and marketing | 4,052 |
| | 4,952 |
|
| Research and development | 2,657 |
| | 2,247 |
|
| General and administrative | 3,614 |
| | 4,979 |
|
| Total stock-based compensation expense | 15,166 |
| | 15,874 |
|
| Amortization of capitalized stock-based compensation related to software development (1) | 1,196 |
| | 934 |
|
| Total | $ | 16,362 |
| | $ | 16,808 |
|
| | | | |
| |
| (1) | In addition, for the three months ended March 31, 2016, and 2015, $0.2 million and $1.9 million, respectively, of stock-based compensation was capitalized in the line item Capitalized software costs, net in the Condensed Consolidated Balance Sheets for which $1.2 million and $0.9 million, respectively, of amortization was included in the line item Depreciation and amortization in the Condensed Consolidated Statements of Income. |
athenahealth, Inc.
AMORTIZATION OF PURCHASED INTANGIBLE ASSETS
(Unaudited, in thousands)
Set forth below is a breakout of amortization of purchased intangible assets impacting the Condensed Consolidated Statements of Income for the three months ended March 31, 2016, and 2015:
|
| | | | | | | |
| | Three Months Ended
March 31, |
| Amortization of purchased intangible assets allocated to: | 2016 | | 2015 |
| Direct operating | $ | 3,290 |
| | $ | 3,789 |
|
| Selling and marketing | 2,912 |
| | 2,284 |
|
| Total amortization of purchased intangible assets | $ | 6,202 |
| | $ | 6,073 |
|
| | | | |
athenahealth, Inc.
RECONCILIATION OF NON-GAAP FINANCIAL MEASURES
TO COMPARABLE GAAP MEASURES
(Unaudited, in thousands, except per share amounts)
The following is a reconciliation of the non-GAAP financial measures used by us to describe our financial results determined in accordance with accounting principles generally accepted in the United States of America (“GAAP”). An explanation of these measures is also included below under the heading “Explanation of Non-GAAP Financial Measures.”
While management believes that these non-GAAP financial measures provide useful supplemental information to investors regarding the underlying performance of our business operations, investors are reminded to consider these non-GAAP measures in addition to, and not as a substitute for, financial performance measures prepared in accordance with GAAP. In addition, it should be noted that these non-GAAP financial measures may be different from non-GAAP measures used by other companies, and management may utilize other measures to illustrate performance in the future. Non-GAAP measures have limitations in that they do not reflect all of the amounts associated with our results of operations as determined in accordance with GAAP.
Please note that these figures may not sum exactly due to rounding.
Non-GAAP Adjusted Gross Margin
Set forth below is a presentation of our “Non-GAAP Adjusted Gross Profit” and “Non-GAAP Adjusted Gross Margin,” which represents Non-GAAP Adjusted Gross Profit as a percentage of total revenue.
|
| | | | | | | |
| (unaudited, in thousands) | Three Months Ended |
| | March 31, |
| | 2016 | | 2015 |
| | | | |
| Total revenue | $ | 256,149 |
| | $ | 206,434 |
|
| Direct operating expense | 105,389 |
| | 84,557 |
|
| | | | |
| Total revenue less direct operating expense | 150,760 |
| | 121,877 |
|
Add: Stock-based compensation
allocated to direct operating expense | 4,843 |
| | 3,696 |
|
Add: Amortization of purchased intangible assets
allocated to direct operating expense | 3,290 |
| | 3,789 |
|
| | | | |
| Non-GAAP Adjusted Gross Profit | $ | 158,893 |
| | $ | 129,362 |
|
| | | | |
| Non-GAAP Adjusted Gross Margin | 62.0 | % | | 62.7 | % |
Non-GAAP Adjusted EBITDA
Set forth below is a reconciliation of our “Non-GAAP Adjusted EBITDA” and “Non-GAAP Adjusted EBITDA Margin,” which represents Non-GAAP Adjusted EBITDA as a percentage of total revenue.
|
| | | | | | | |
| (unaudited, in thousands) | Three Months Ended |
| | March 31, |
| | 2016 | | 2015 |
| | | | |
| Total revenue | $ | 256,149 |
| | $ | 206,434 |
|
| | | | |
| GAAP net loss | (833 | ) | | (8,832 | ) |
| Add: Benefit from income taxes | (731 | ) | | (3,963 | ) |
| Add: Total other expense | 1,888 |
| | 1,015 |
|
| Add: Stock-based compensation expense | 15,166 |
| | 15,874 |
|
| Add: Depreciation and amortization | 26,774 |
| | 20,352 |
|
| Add: Amortization of purchased intangible assets | 6,202 |
| | 6,073 |
|
| Add: Integration and transaction costs | 210 |
| | 964 |
|
| Add: Exit costs, including restructuring costs | 1,136 |
| | 4,185 |
|
| | | | |
| Non-GAAP Adjusted EBITDA | $ | 49,812 |
| | $ | 35,668 |
|
| | | | |
| Non-GAAP Adjusted EBITDA Margin | 19.4 | % | | 17.3 | % |
Non-GAAP Adjusted Operating Income
Set forth below is a reconciliation of our “Non-GAAP Adjusted Operating Income” and “Non-GAAP Adjusted Operating Income Margin,” which represents Non-GAAP Adjusted Operating Income as a percentage of total revenue.
|
| | | | | | | |
| (unaudited, in thousands) | Three Months Ended |
| | March 31, |
| | 2016 | | 2015 |
| | | | |
| Total revenue | $ | 256,149 |
| | $ | 206,434 |
|
| | | | |
| GAAP net loss | (833 | ) | | (8,832 | ) |
| Add: Benefit from income taxes | (731 | ) | | (3,963 | ) |
| Add: Total other expense | 1,888 |
| | 1,015 |
|
| Add: Stock-based compensation expense | 15,166 |
| | 15,874 |
|
| Add: Amortization of capitalized stock-based compensation related to software development | 1,196 |
| | 934 |
|
| Add: Amortization of purchased intangible assets | 6,202 |
| | 6,073 |
|
| Add: Integration and transaction costs | 210 |
| | 964 |
|
| Add: Exit costs, including restructuring costs | 1,136 |
| | 4,185 |
|
| | | | |
| Non-GAAP Adjusted Operating Income | $ | 24,234 |
| | $ | 16,250 |
|
| | | | |
| Non-GAAP Adjusted Operating Income Margin | 9.5 | % | | 7.9 | % |
Non-GAAP Adjusted Net Income
Set forth below is a reconciliation of our “Non-GAAP Adjusted Net Income” and “Non-GAAP Adjusted Net Income per Diluted Share.”
|
| | | | | | | |
| (unaudited, in thousands) | Three Months Ended |
| | March 31, |
| | 2016 | | 2015 |
| | | | |
| GAAP net loss | $ | (833 | ) | | $ | (8,832 | ) |
| Add: Stock-based compensation expense | 15,166 |
| | 15,874 |
|
| Add: Amortization of capitalized stock-based compensation related to software development | 1,196 |
| | 934 |
|
| Add: Amortization of purchased intangible assets | 6,202 |
| | 6,073 |
|
| Add: Integration and transaction costs | 210 |
| | 964 |
|
| Add: Exit costs, including restructuring costs | 1,136 |
| | 4,185 |
|
| | | | |
| Sub-total of tax deductible items | 23,910 |
| | 28,030 |
|
| | | | |
| Less: Tax impact of tax deductible items (1) | (9,564 | ) | | (11,212 | ) |
| Add: Tax impact resulting from applying non-GAAP tax rate (2) | (105 | ) | | 1,155 |
|
| | | | |
| Non-GAAP Adjusted Net Income | $ | 13,408 |
| | $ | 9,141 |
|
| | | | |
| Weighted average shares - diluted | 39,034 |
| | 38,278 |
|
| | | | |
| Non-GAAP Adjusted Net Income per Diluted Share | $ | 0.34 |
| | $ | 0.24 |
|
| |
| (1) | Tax impact calculated using a statutory tax rate of 40%. |
| |
| (2) | Represents adjusting the GAAP net loss at a non-GAAP tax rate of 40%. We used a non-GAAP tax rate of 40% to normalize the tax impact to our Non-GAAP Adjusted Net Income per Diluted Share based on the fact that a relatively small change in pre-tax GAAP income (loss) in any one period could result in a volatile GAAP effective tax rate. |
|
| | | | | | | |
| (unaudited, in thousands) | Three Months Ended |
| | March 31, |
| | 2016 | | 2015 |
| | | | |
| GAAP net loss per share - diluted | $ | (0.02 | ) | | $ | (0.23 | ) |
| Add: Stock-based compensation expense | 0.39 |
| | 0.41 |
|
| Add: Amortization of capitalized stock-based compensation related to software development | 0.03 |
| | 0.02 |
|
| Add: Amortization of purchased intangible assets | 0.16 |
| | 0.16 |
|
| Add: Integration and transaction costs | 0.01 |
| | 0.03 |
|
| Add: Exit costs, including restructuring costs | 0.03 |
| | 0.11 |
|
| | | | |
| Sub-total of tax deductible items | 0.61 |
| | 0.73 |
|
| | | | |
| Less: Tax impact of tax deductible items (1) | (0.25 | ) | | (0.29 | ) |
| Add: Tax impact resulting from applying non-GAAP tax rate (2) | — |
| | 0.03 |
|
| | | |
| Non-GAAP Adjusted Net Income per Diluted Share | $ | 0.34 |
| | $ | 0.24 |
|
| | | |
| Weighted average shares - diluted | 39,034 |
| | 38,278 |
|
| |
| (1) | Tax impact calculated using a statutory tax rate of 40%. |
| |
| (2) | Represents adjusting the GAAP net loss at a non-GAAP tax rate of 40%. We used a non-GAAP tax rate of 40% to normalize the tax impact to our Non-GAAP Adjusted Net Income per Diluted Share based on the fact that a relatively small change in pre-tax GAAP income (loss) in any one period could result in a volatile GAAP effective tax rate. |
athenahealth, Inc.
RECONCILIATION OF NON-GAAP FINANCIAL MEASURES
TO COMPARABLE GAAP MEASURES FOR FISCAL YEAR 2016 GUIDANCE
(Unaudited, in millions, except per share amounts)
Please note that the figures presented below may not sum exactly due to rounding.
Non-GAAP Adjusted Gross Margin Guidance
Set forth below is a presentation of our “Non-GAAP Adjusted Gross Profit” and “Non-GAAP Adjusted Gross Margin” guidance for fiscal year 2016, which represents Non-GAAP Adjusted Gross Profit as a percentage of total revenue.
|
| | | | | | |
| | LOW | HIGH |
| | Fiscal Year Ending December 31, 2016 |
| Total revenue | $ | 1,085.0 |
| $ | 1,115.0 |
|
| Direct operating expense | 423.4 |
| 423.2 |
|
| Total revenue less direct operating expense | $ | 661.6 |
| $ | 691.7 |
|
| | | |
| Add: Stock-based compensation expense | | |
| allocated to direct operating expense | 19.0 |
| 19.0 |
|
| Add: Amortization of purchased intangible assets | | |
| allocated to direct operating expense | 8.4 |
| 8.4 |
|
| | | |
| Non-GAAP Adjusted Gross Profit | $ | 689.0 |
| $ | 719.2 |
|
| | | |
| Non-GAAP Adjusted Gross Margin | 63.5 | % | 64.5 | % |
| |
Non-GAAP Adjusted Operating Income Guidance
Set forth below is a reconciliation of our “Non-GAAP Adjusted Operating Income” and “Non-GAAP Adjusted Operating Income Margin” guidance for fiscal year 2016, which represents Non-GAAP Adjusted Operating Income as a percentage of total revenue.
|
| | | | | | |
| | LOW | HIGH |
| | Fiscal Year Ending December 31, 2016 |
| Total revenue | $ | 1,085.0 |
| $ | 1,115.0 |
|
| | | |
| GAAP net income | 10.8 |
| 19.5 |
|
| Add: Provision for income taxes | 7.6 |
| 12.9 |
|
| Add: Total other expense | 5.3 |
| 6.4 |
|
| Add: Stock-based compensation expense | 69.4 |
| 69.4 |
|
| Add: Amortization of capitalized stock-based compensation related to software development | 6.8 |
| 6.8 |
|
| Add: Amortization of purchased intangible assets | 20.0 |
| 20.0 |
|
| | | |
| Non-GAAP Adjusted Operating Income | $ | 120.0 |
| $ | 135.0 |
|
| | | |
| Non-GAAP Adjusted Operating Income Margin | 11.1 | % | 12.1 | % |
| |
Non-GAAP Adjusted Net Income Guidance
Set forth below is a reconciliation of our “Non-GAAP Adjusted Net Income” and “Non-GAAP Adjusted Net Income per Diluted Share” guidance for fiscal year 2016.
|
| | | | | | |
| | LOW | HIGH |
| | Fiscal Year Ending December 31, 2016 |
| GAAP net income | $ | 10.8 |
| $ | 19.5 |
|
| Add: Stock-based compensation expense | 69.4 |
| 69.4 |
|
| Add: Amortization of capitalized stock-based compensation related to software development | 6.8 |
| 6.8 |
|
| Add: Amortization of purchased intangible assets | 20.0 |
| 20.0 |
|
| | | |
| Sub-total of tax deductible items | $ | 96.2 |
| $ | 96.2 |
|
| | | |
| (Less): Tax impact of tax deductible items (1) | (38.5 | ) | (38.5 | ) |
Add: Tax impact resulting from applying a normalized
non-GAAP tax rate (2) | 0.2 |
| (0.1 | ) |
| | | |
| Non-GAAP Adjusted Net Income | $ | 68.8 |
| $ | 77.2 |
|
| | | |
| Weighted average shares - diluted | 41.7 |
| 41.7 |
|
| | | |
| Non-GAAP Adjusted Net Income per Diluted Share | $ | 1.65 |
| $ | 1.85 |
|
| |
| (1) | Tax impact calculated using a statutory tax rate of 40%. |
| |
| (2) | Represents adjusting the GAAP net income at a non-GAAP tax rate of 40%. For 2016, we will use a non-GAAP tax rate of 40% to normalize the tax impact to our Non-GAAP Adjusted Net Income per Diluted Share based on the fact that a relatively small change in pre-tax GAAP income (loss) in any one period could result in a volatile GAAP effective tax rate. |
|
| | | | | | |
| | LOW | HIGH |
| | Fiscal Year Ending December 31, 2016 |
| GAAP net income per share - diluted | $ | 0.26 |
| $ | 0.47 |
|
| Add: Stock-based compensation expense | 1.66 |
| 1.66 |
|
| Add: Amortization of capitalized stock-based compensation related to software development | 0.16 |
| 0.16 |
|
| Add: Amortization of purchased intangible assets | 0.48 |
| 0.48 |
|
| | | |
| Sub-total of tax deductible items | $ | 2.31 |
| $ | 2.31 |
|
| | | |
| (Less): Tax impact of tax deductible items (1) | (0.92 | ) | (0.92 | ) |
Add: Tax impact resulting from applying a normalized
non-GAAP tax rate (2) | 0.01 |
| — |
|
| | | |
| Non-GAAP Adjusted Net Income per Diluted Share | $ | 1.65 |
| $ | 1.85 |
|
| | | |
| Weighted average shares - diluted | 41.7 |
| 41.7 |
|
| |
| (1) | Tax impact calculated using a statutory tax rate of 40%. |
| |
| (2) | Represents adjusting the GAAP net income at a non-GAAP tax rate of 40%. For 2016, we will use a non-GAAP tax rate of 40% to normalize the tax impact to our Non-GAAP Adjusted Net Income per Diluted Share based on the fact that a relatively small change in pre-tax GAAP income (loss) in any one period could result in a volatile GAAP effective tax rate. |
Explanation of Non-GAAP Financial Measures
We report our financial results in accordance with accounting principles generally accepted in the United States of America, or GAAP. However, management believes that, in order to properly understand our short-term and long-term financial and operational trends, investors may wish to consider the impact of certain non-cash or non-recurring items, when used as a supplement to financial performance measures in accordance with GAAP. These items result from facts and circumstances that vary in frequency and impact on continuing operations. Management also uses results of operations before such items to evaluate the operating performance of athenahealth and compare it against past periods, make operating decisions, and serve as a basis for strategic planning. These non-GAAP financial measures provide management with additional means to understand and evaluate the operating results and trends in our ongoing business by eliminating certain non-cash expenses and other items that management believes might otherwise make comparisons of our ongoing business with prior periods more difficult, obscure trends in ongoing operations, or reduce management’s ability to make useful forecasts. Management believes that these non-GAAP financial measures provide additional means of evaluating period-over-period operating performance. In addition, management understands that some investors and financial analysts find this information helpful in analyzing our financial and operational performance and comparing this performance to our peers and competitors.
Management defines “Non-GAAP Adjusted Gross Profit” as total revenue, less direct operating expense, plus (1) stock-based compensation expense allocated to direct operating expense and (2) amortization of purchased intangible assets allocated to direct operating expense, and “Non-GAAP Adjusted Gross Margin” as Non-GAAP Adjusted Gross Profit as a percentage of total revenue. Management considers these non-GAAP financial measures to be important indicators of our operational strength and performance of our business and a good measure of our historical operating trends. Moreover, management believes that these measures enable investors and financial analysts to closely monitor and understand changes in our ability to generate income from ongoing business operations.
Management defines “Non-GAAP Adjusted EBITDA” as the sum of GAAP net loss before benefit from income taxes; total other expense (income); stock-based compensation expense; depreciation and amortization; amortization of purchased intangible assets; integration and transaction costs; and exit costs, including restructuring costs; and “Non-GAAP Adjusted EBITDA Margin” as Non-GAAP Adjusted EBITDA as a percentage of total revenue. Management defines “Non-GAAP Adjusted Operating Income” as the sum of GAAP net loss before benefit from income taxes; total other expense (income); stock-based compensation expense; amortization of capitalized stock-based compensation related to software development; amortization of purchased intangible assets; integration and transaction costs; and exit costs, including restructuring costs; and “Non-GAAP Adjusted Operating Income Margin” as Non-GAAP Adjusted Operating Income as a percentage of total revenue. Management defines “Non-GAAP Adjusted Net Income” as the sum of GAAP net loss before stock-based compensation expense; amortization of capitalized stock-based compensation related to software development; amortization of purchased intangible assets; integration and transaction costs; exit costs, including restructuring costs, and any tax impact related to these preceding items; and an adjustment to the tax provision for the non-GAAP tax rate and “Non-GAAP Adjusted Net Income per Diluted Share” as Non-GAAP Adjusted Net Income divided by weighted average diluted shares outstanding. Management considers all of these non-GAAP financial measures to be important indicators of our operational strength and performance of our business and a good measure of our historical operating trends, in particular the extent to which ongoing operations impact our overall financial performance.
Management excludes or adjusts each of the items identified below from the applicable non-GAAP financial measure referenced above for the reasons set forth with respect to that excluded item:
| |
| • | Stock-based compensation expense and amortization of capitalized stock-based compensation related to software development — excluded because these are non-cash expenditures that management does not consider part of ongoing operating results when assessing the performance of our business, and also because the total amount of the expenditure is partially outside of our control because it is based on factors such as stock price, volatility, and interest rates, which may be unrelated to our performance during the period in which the expenses are incurred. |
| |
| • | Amortization of purchased intangible assets — purchased intangible assets are amortized over their estimated useful lives and generally cannot be changed or influenced by management after the acquisition. Accordingly, this item is not considered by management in making operating decisions. Management does not believe such charges accurately reflect the performance of our ongoing operations for the period in which such charges are incurred. |
| |
| • | Integration and transaction costs — Integration costs are the severance payments and retention bonuses for certain employees related to specific transactions. Transaction costs are non-recurring costs related to specific transactions. Accordingly, management believes that such expenses do not have a direct correlation to future business operations, and therefore, these costs are not considered by management in making operating decisions. Management does not believe such charges accurately reflect the performance of our ongoing operations for the period in which such charges are incurred. |
| |
| • | Exit costs, including restructuring costs — represents costs related to workforce reductions and to terminate certain lease or other contract agreements for strategic realignment purposes. Management does not believe such costs accurately reflect the performance of our ongoing operations for the period in which such costs are incurred. |
| |
| • | Non-GAAP tax rate — We use a non-GAAP tax rate of 40% to normalize the tax impact to our Non-GAAP Adjusted Net Income per Diluted Share based on the fact that a relatively small change in pre-tax GAAP income (loss) in any one period could result in a volatile GAAP effective tax rate. |
Supplemental Metrics and Definitions
|
| | | | | | | | | | | | | |
| | | | Fiscal Year 2015 | | Fiscal Year 2016 |
| | | | |
| | | | Q1 |
| Q2 |
| Q3 |
| Q4 |
| | Q1 |
|
| Client Base | | | | | | | | |
| Total Physicians on athenaCollector | | 47,062 |
| 49,176 |
| 53,129 |
| 55,277 |
| | 57,093 |
|
| Total Providers on athenaCollector | | 64,648 |
| 67,530 |
| 72,314 |
| 75,416 |
| | 78,158 |
|
| Total Physicians on athenaClinicals | | 19,796 |
| 20,923 |
| 23,741 |
| 24,867 |
| | 26,169 |
|
| Total Providers on athenaClinicals | | 26,166 |
| 27,641 |
| 31,071 |
| 32,684 |
| | 34,576 |
|
| Total Physicians on athenaCommunicator | | 33,578 |
| 35,248 |
| 38,670 |
| 40,635 |
| | 42,278 |
|
| Total Providers on athenaCommunicator | | 43,770 |
| 45,902 |
| 49,986 |
| 52,821 |
| | 55,244 |
|
| | | | | | | | | |
| Client Performance | | | | | | | | |
| Net Promoter Score | | | 42.3 |
| 40.5 |
| 39.9 |
| 40.3 |
| | 34.0 |
|
| Client Days in Accounts Receivable (“DAR”) | | 41.1 |
| 40.8 |
| 40.7 |
| 40.1 |
| | 41.3 |
|
| First Pass Resolution (“FPR”) Rate | | 93.7 | % | 94 | % | 93.8 | % | 94 | % | | 94.2 | % |
| Electronic Remittance Advice (“ERA”) Rate | | 83.2 | % | 82.9 | % | 82.3 | % | 84.2 | % | | 83.8 | % |
| Total Claims Submitted | | 32,809,734 |
| 35,002,061 |
| 35,826,192 |
| 40,191,950 |
| | 41,246,696 |
|
| Total Client Collections ($) | | 4,110,989,781 |
| 4,633,427,941 |
| 4,803,761,899 |
| 5,281,307,644 |
| | 5,203,424,281 |
|
| Total Working Days | | | 61 |
| 64 |
| 64 |
| 62 |
| | 62 |
|
| | | | | | | | | |
| Employees | | | | | | | | |
| Direct | | | 1,914 |
| 2,123 |
| 2,285 |
| 2,296 |
| | 2,310 |
|
| Selling & Marketing | | | 602 |
| 649 |
| 666 |
| 668 |
| | 652 |
|
| Research & Development | | 1,010 |
| 1,172 |
| 1,262 |
| 1,280 |
| | 1,355 |
|
| General & Administrative | | 351 |
| 380 |
| 407 |
| 424 |
| | 435 |
|
| Total Employees | | | 3,877 |
| 4,324 |
| 4,619 |
| 4,668 |
| | 4,752 |
|
| | | | | | | | | |
| Quota Carrying Sales Force | | | | | | | |
| Total Quota Carrying Sales Representatives | | 150 |
| 151 |
| 161 |
| 163 |
| | 170 |
|
|
| |
| Supplemental Metrics Definitions | |
| | |
| Client Base | |
| Total Physicians on athenaCollector | The number of physicians that have rendered a service which generated a medical claim that was billed during the last 91 days on the athenaCollector platform. Examples of physicians include Medical Doctors (“MDs”) and Doctors of Osteopathic Medicine (“DOs”). |
| Total Providers on athenaCollector | The number of providers, including physicians, that have rendered a service which generated a medical claim that was billed during the last 91 days on the athenaCollector platform. Examples of non-physician providers are Nurse Practitioners (“NPs”) and Registered Nurses (“RNs”). |
| Total Physicians on athenaClinicals | The number of physicians that have rendered a service through the athenaClinicals platform which generated a medical claim that was billed during the last 91 days on the athenaCollector platform. |
| Total Providers on athenaClinicals | The number of providers, including physicians, that have rendered a service through the athenaClinicals platform which generated a medical claim that was billed during the last 91 days on the athenaCollector platform. |
| Total Physicians on athenaCommunicator | The number of physicians that have rendered a service which generated a medical claim that was billed during the last 91 days on the athenaCollector platform and whose practice is actively using athenaCommunicator. |
| Total Providers on athenaCommunicator | The number of providers, including physicians, that have rendered a service which generated a medical claim that was billed during the last 91 days on the athenaCollector platform and whose practice is actively using athenaCommunicator. |
| | |
| Client Performance | |
| Net Promoter Score | The percentage of clients who chose 9 or 10 (defined as promoters) less the percentage of clients who chose 0 through 6 (defined as detractors) on a scale of 1 to 10 when asked if they would recommend athenahealth to a trusted friend or colleague. These responses are generated from a "client listening" survey that the Company conducts for its client base twice per year. |
| Client Days in Accounts Receivable (“DAR”) | The average number of days that it takes outstanding balances on claims to be resolved, e.g. paid, for clients on athenaCollector. Clients that have been live less than 90 days are excluded, as well as clients who are terminating services. |
| First Pass Resolution (“FPR”) Rate | Approximates the percentage of primary claims that are favorably adjudicated and closed after a single submission during the period. Currently, the FPR rate is calculated on a monthly basis, and certain practices are excluded (e.g. those that have been live for less than 90 days). |
| Electronic Remittance Advice (“ERA”) Rate | Remittance refers to the information about payments (a/k/a explanations of benefits) received from insurance companies during the period. The ERA rate reflects the percentage of total charges that were posted using electronic remittance. |
| Total Claims Submitted | The number of claims billed through athenaNet during the period. |
| Total Client Collections | The dollar value of collections posted on behalf of clients during the period. |
| Total Working Days | The total number of days during the quarter minus weekends and U.S. Post Office holidays. |
| | |
| Employees | |
| Direct | The total number of full time equivalent individuals (“FTEs”) employed by athenahealth to support its service operations as of quarter end. This team includes production systems, enrollment services, paper claim submission, claim resolution, clinical operations, professional services, account management, and client services. |
| Selling & Marketing | The total number of FTEs employed by athenahealth to support its sales and marketing efforts as of quarter end. This team includes sales representatives, business development staff and the marketing team. |
| Research & Development | The total number of FTEs employed by athenahealth to support its research and development efforts as of quarter end. This team includes product development and product management. |
| General & Administrative | The total number of FTEs employed by athenahealth to support its general and administrative functions as of quarter end. This team includes finance, human resources, compliance, learning and development, internal audit, corporate technology, recruiting, facilities, and legal. |
| Total Employees | The total number of FTEs employed by athenahealth as of quarter end. This number excludes interns and seasonal employees. |
| Total Quota Carrying Sales Representatives | The total number of athenahealth-branded services sales representatives who carry quota for net new annual recurring revenue as of quarter end. |
|
| |
| Corporate Scorecard Metrics Definitions |
| | |
| Stability | |
| Voluntary Turnover | The number of voluntary terminations within a quarter divided by the average of the starting headcount and ending headcount for the quarter. Voluntary turnover excludes employees on action plans or employees on counseling out plans. |
| Employee Engagement | Quarterly engagement survey results for employees.. Employee engagement results are reported in Q2 and Q4 only. |
| | |
| Performance | |
| athenaCollector Composite | athenaCollector Composite consists of Days in Accounts Receivable (the average number of days that it takes outstanding balances on claims to be resolved), Client Collection Rate (the percentage of charges that are not written off), and Time of Service Collection Rate (the percentage of patient responsibility collected at the time of service in the office). |
| athenaClinicals Composite | athenaClinicals Composite consists of PQRS Success (the percent of providers who avoid the Value Modifier penalty based on PQRS performance), Days Documents Open (days of work in the Clinicals inbox), and After Hours Physician Documentation (the percentage of physician encounter documentation that happens after clinical hours). |
| athenaCommunicator Composite | athenaCommunicator Composite consists of Portal Adoption Rate (the percentage of patients who have registered for the portal), Portal Engagement Rate (the percentage of patients who logged into the portal within 30 days before or after their appointments), and Annual Visit Rate (the percentage of patients contacted by a well-visit campaign who ultimately scheduled an appointment with the practice). |
| athenaCoordinator Composite | athenaCoordinator Composite consists of Coordinator Exchange Rate (the percentage of document exchanges, both inbound and outbound, sent electronically) and Coordinated Patient Rate (the percentage of time that key patient information, for both inbound and outbound transitions of care, is available at the next point of care). |
| Epocrates Composite | Epocrates Composite consists of 90 Day Active Physician Engagement (the percentage Epocrates physicians active on the mobile app or website in 9 of the 12 weeks in each quarter). |
| | |
| Satisfaction | |
| Net Promoter Score | Survey respondents from athenaOne survey (sample includes all clients live, surveyed on a bi-annual basis) are categorized as detractors (0-6 score for "likelihood to recommend"), passives (7-8), and promoters (9-10). The Net Promoter Score is calculated by subtracting the % of detractors from the % of promoters. |
| | |
| Financial | |
| Bookings | The annualized value of deals sold. |
| Non-GAAP Adjusted Operating Income | Total non-GAAP adjusted operating income. |