
1 9th Annual Investor Summit December 15, 2016

2 Welcome to our 9th Annual Investor Summit Dana Quattrochi Investor Relations
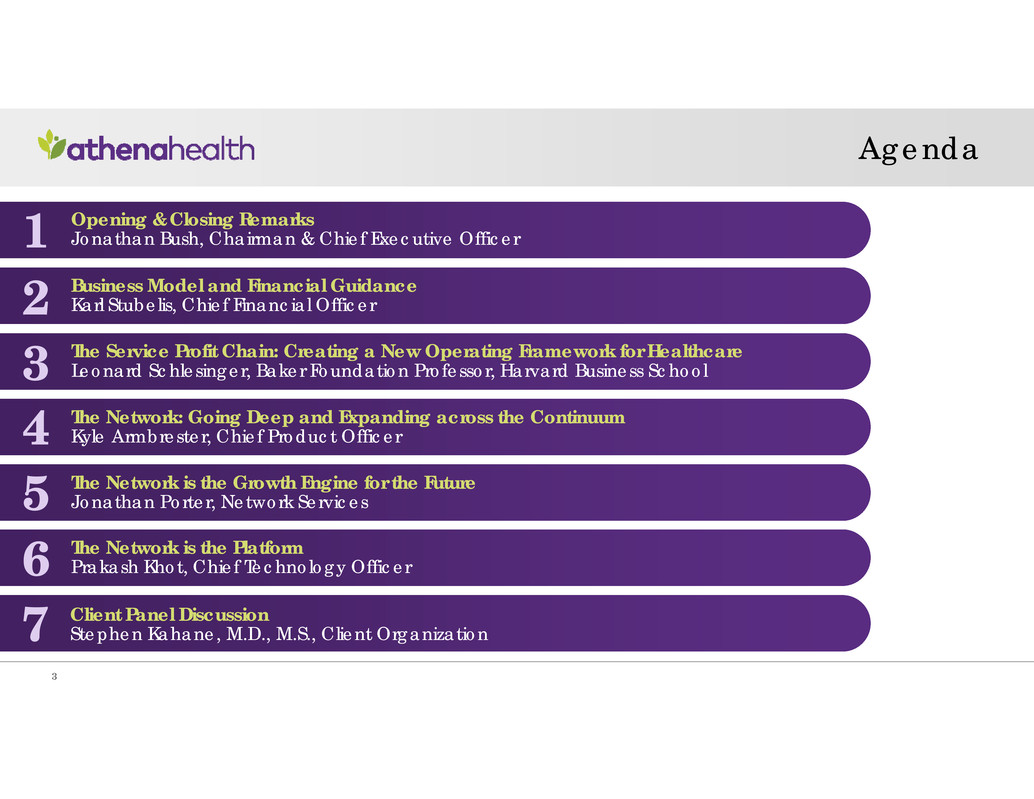
Agenda Opening & Closing Remarks Jonathan Bush, Chairman & Chief Executive Officer1 2 Business Model and Financial GuidanceKarl Stubelis, Chief Financial Officer 4 The Network: Going Deep and Expanding across the ContinuumKyle Armbrester, Chief Product Officer 5 The Network is the Growth Engine for the FutureJonathan Porter, Network Services 6 The Network is the PlatformPrakash Khot, Chief Technology Officer 7 Client Panel DiscussionStephen Kahane, M.D., M.S., Client Organization 3 The Service Profit Chain: Creating a New Operating Framework for HealthcareLeonard Schlesinger, Baker Foundation Professor, Harvard Business School 3

This presentation contains forward-looking statements, which are made pursuant to the safe harbor provisions of the Private Securities Litigation Reform Act of 1995, including statements reflecting athenahealth, Inc. (“athenahealth” or “we”) management’s expectations for: future financial and operational performance; expected growth, including total addressable market, expansion of the network and the related network effect, anticipated revenues, profitability, and bookings; market trends and business outlook (e.g., health care expenditures and the reduction of government mandates); the anticipated benefits of our service offerings and plans and timelines for developing and expanding those offerings (e.g., expansion and deepening of our services across the continuum of care); the anticipated benefits of our investments on our growth, profitability and cash flow; near- and long-term goals for our growth and profitability priorities; marketing and sales plans, strategies, and trends; and cultural, operational, and organizational goals and initiatives (e.g., support the full continuum of care, scale operations and general and administrative expenses, improve cost of bookings, help our clients grow their market share); as well as statements found under our reconciliation of Non-GAAP financial measures included within this presentation. Such statements do not constitute guarantees of future performance, are neither promises nor guarantees, and are subject to a variety of risks and uncertainties, many of which are out of our control, which could cause actual results to differ materially from those contemplated in these forward-looking statements. In particular, the risks and uncertainties include, among other things: our fluctuating operating results; our variable sales and implementation cycles; risks associated with our expectations regarding our ability to maintain profitability; the impact of increased sales and marketing and research and development expenditures as well as our ability to scale general and administrative costs, including whether increased expansion in revenues is attained and whether impact on margins and profitability is longer term than expected; changes in tax rates or exposure to additional tax liabilities; the highly competitive and rapidly changing industry in which we operate; and the evolving and complex governmental and regulatory compliance environment in which we and our clients operate. Existing and prospective investors are cautioned not to place undue reliance on these forward-looking statements, which speak only as of the date hereof. We undertake no obligation to update or revise the information contained in this presentation, whether as a result of new information, future events or circumstances, or otherwise. For additional disclosure regarding these and other risks faced by us, please see the disclosures contained in our public filings with the Securities and Exchange Commission, available on the Investors section of our website at http://www.athenahealth.com and on the SEC's website at http://www.sec.gov. Safe Harbor Statement 4
Use of Non-GAAP Financial Measures In our earnings releases, conference calls, slide presentations, or webcasts, we may use or discuss non-GAAP financial measures as defined by Regulation G. The GAAP financial measure most directly comparable to each non-GAAP financial measure used or discussed, and a reconciliation of the differences between each non-GAAP financial measure and the comparable GAAP financial measure, is available within this presentation and within our public filings with the Securities and Exchange Commission, available on the Investors section of our website at http://www.athenahealth.com. 5

7 Opening Remarks Jonathan Bush Chairman & CEO

8 “the network is the computer”

9 Year-end 2015 * Represents the number of unique patient records (claim or encounter) over the last 18 months 75K Providers on the network 74M Patient records 38M Patient records used* 124M Patient visits 4.3M Patients visited more than one athena provider via 54K connections 30K providers received patient records from athenaNet We traded patient records:

10 Year-to-date 20161 85K Providers on the network 83M Patient records 47M Patient records used2 132M Patient visits 4.9M Patients visited more than one athena provider via 122K Connections 55K providers received patient records from athenaNet We traded patient records: 13% 12% 24% 6% 14% 126% 83% 1athenahealth data as of Q3 2016 or the nine month period from Q1 2016 to Q3 2016 2Represents the number of unique patient records (claim or encounter) over the last 18 months

11 POPULATION HEALTH 2.0
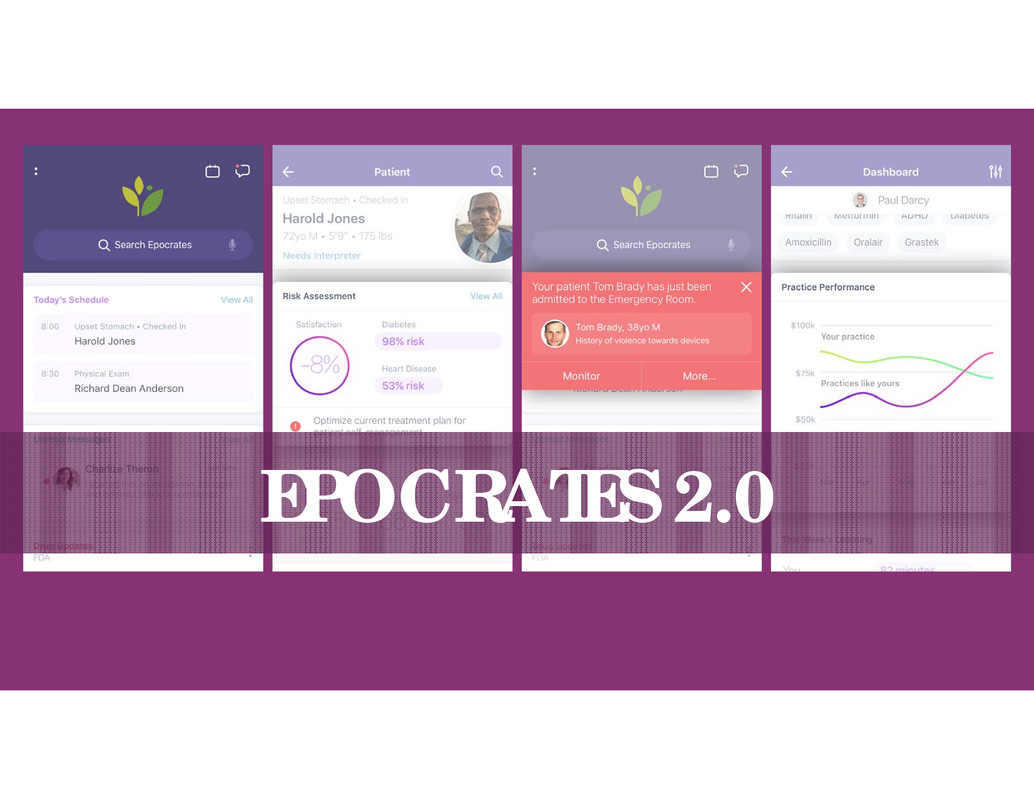
12 EPOCRATES 2.0
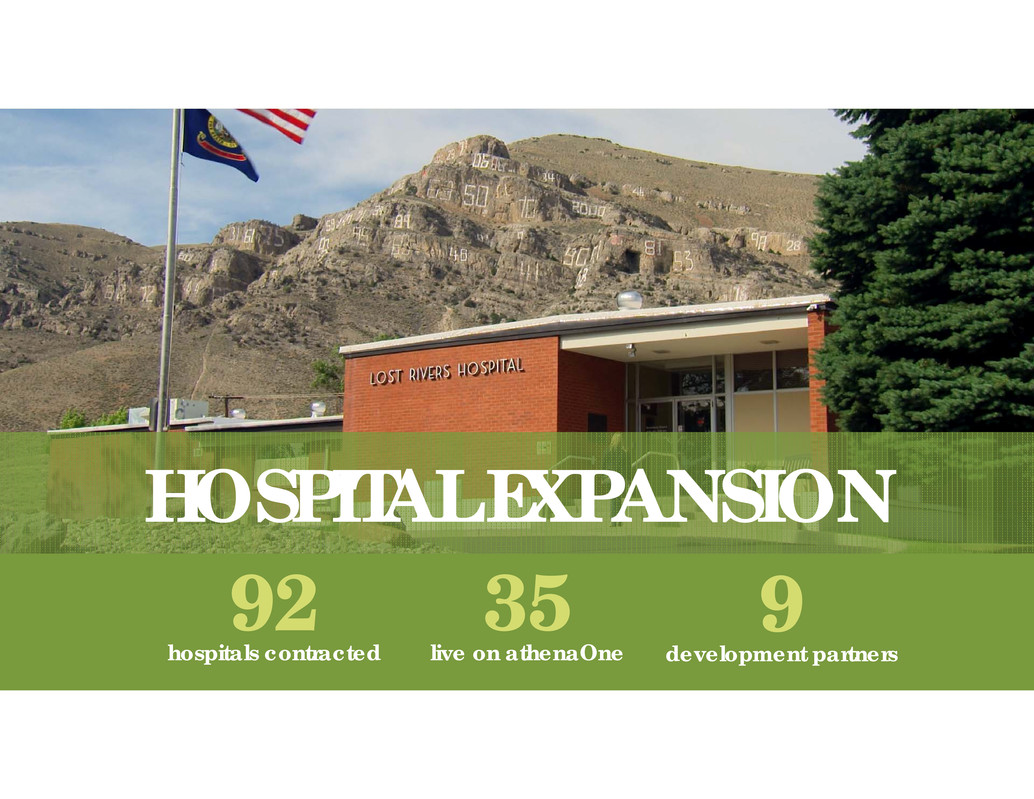
13 HOSPITAL EXPANSION 35 live on athenaOne 92 hospitals contracted 9 development partners
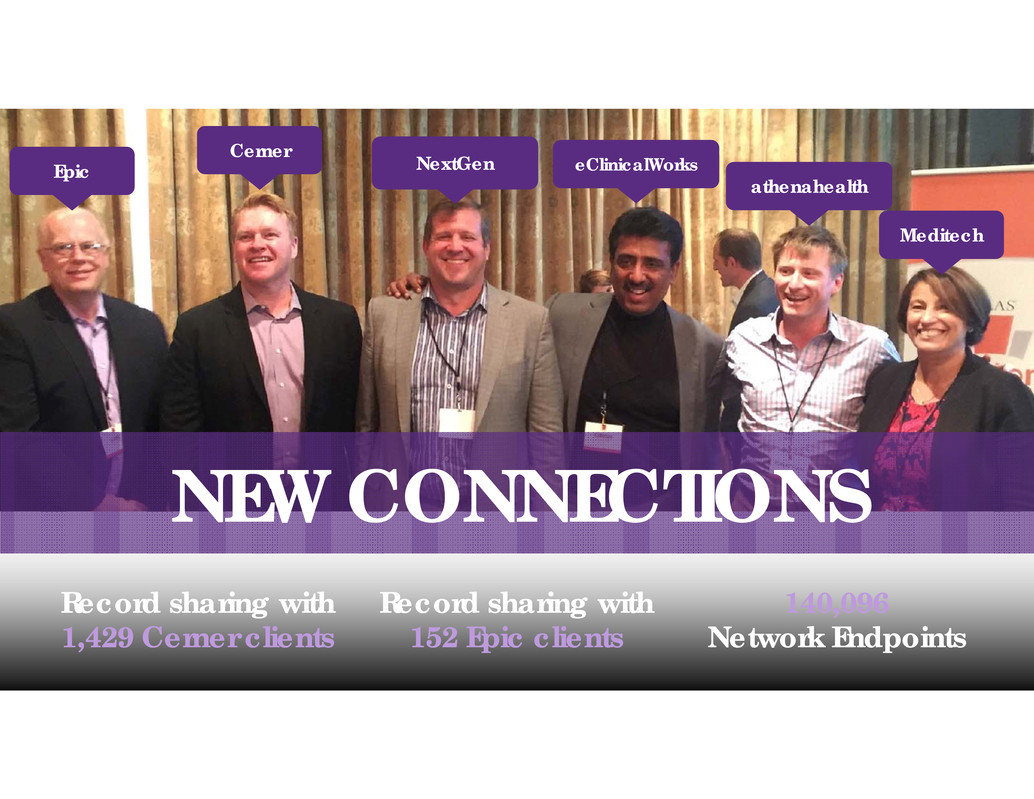
14 Epic Cerner NextGen eClinicalWorks athenahealth Meditech NEW CONNECTIONS Record sharing with 1,429 Cerner clients Record sharing with 152 Epic clients 140,096 Network Endpoints

15 NATIONAL AVERAGE 60% ATHENAHEALTH CLIENTS 93.6% Avoid PQRS Penalties NATIONAL AVERAGE 33% ATHENAHEALTH CLIENTS 98.2% Get Meaningful Use NATIONWIDE OF ALL ACOS 29% ATHENAHEALTH ACO CLIENTS 73% Get Shared Savings GOVERNMENT PROGRAMS
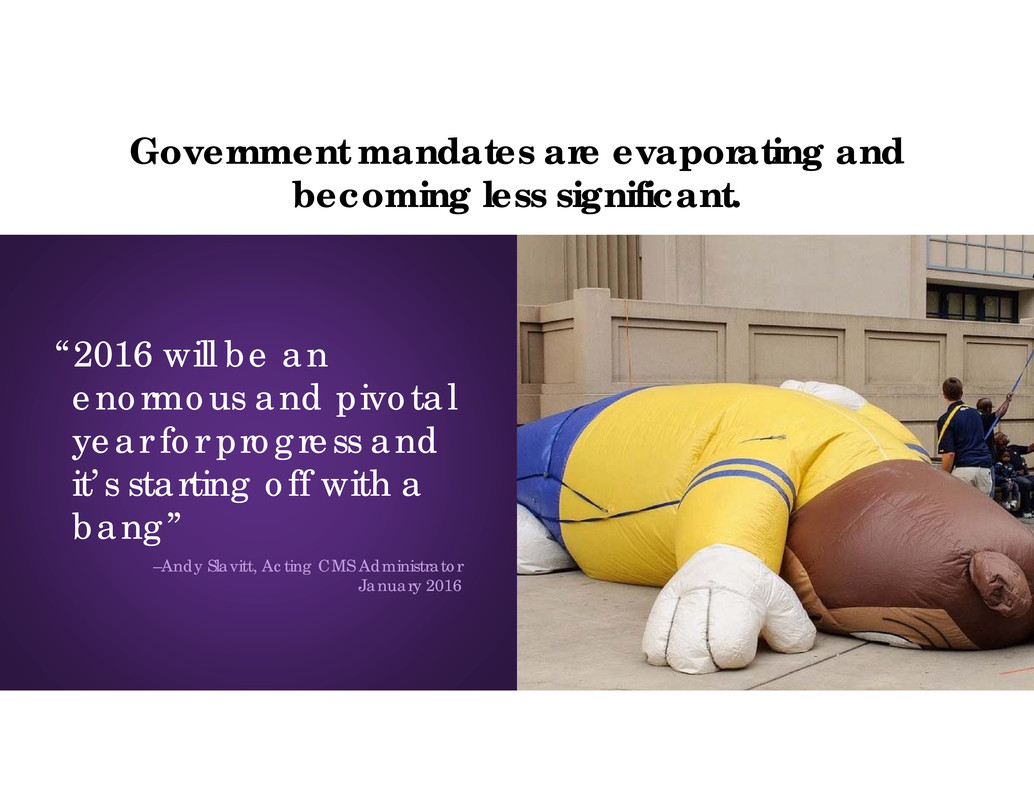
16 Government mandates are evaporating and becoming less significant. “2016 will be an enormous and pivotal year for progress and it’s starting off with a bang” –Andy Slavitt, Acting CMS Administrator January 2016

17 Government mandates are evaporating and becoming less significant.

18

19 We will help our clients grow their market share.2 In the absence of government mandates, we will focus on deepening our services.1 We will continue to create network-effect. 3

20 We take a lot of work off their plates… but we’ll need to take more in 2017. 0.8 FTE savings • Improve BPO quality • Reduce duplicate faxes • Real-time medication benefit checking • Auto-label documents • Improved scanning workflow • Improved EDI rate • Increase % of outbound orders that get a result • Auto-close certain lab results • Improve Rx Renewal workflows • Reduce number of physician authorizations required • Follow-up on unreadable faxes Client work athena work Client work athena work 2016 2017 1.8 FTE savings • 0.2 Front Office FTE savings • 0.5 Clinical Support FTE savings • 0.3 Billing Support FTE savings
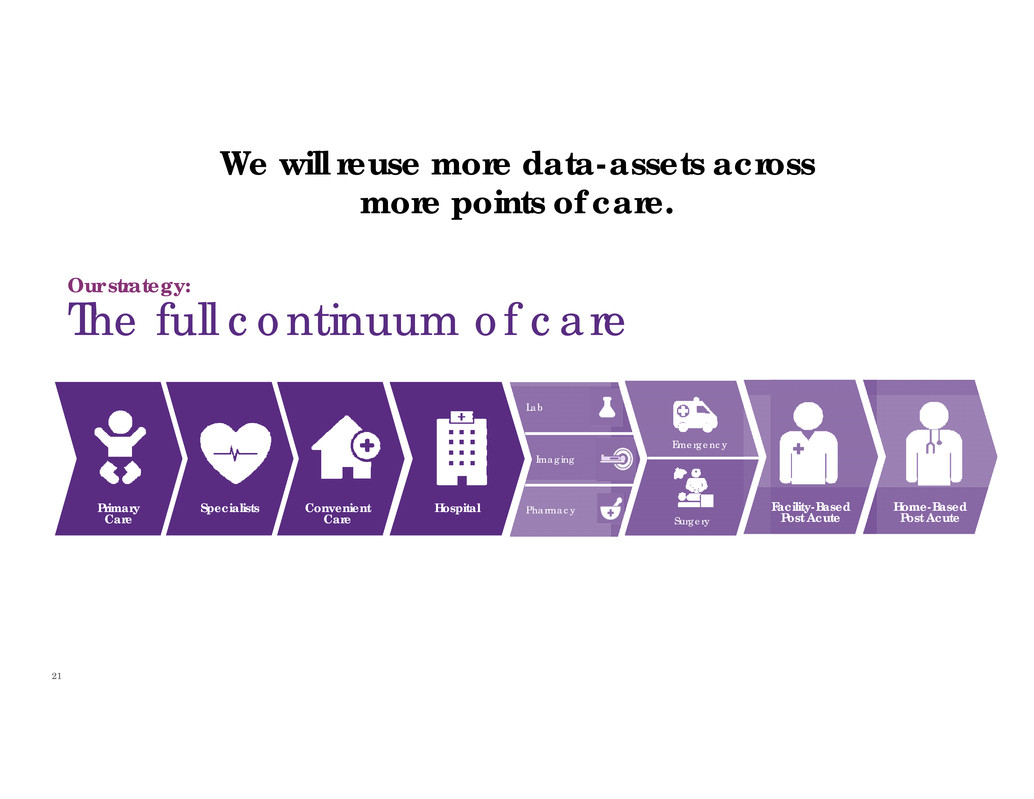
21 Our strategy: The full continuum of care Primary Care Specialists Convenient Care Hospital Lab Imaging Pharmacy Emergency Surgery Home-Based Post Acute Facility-Based Post Acute We will reuse more data-assets across more points of care.
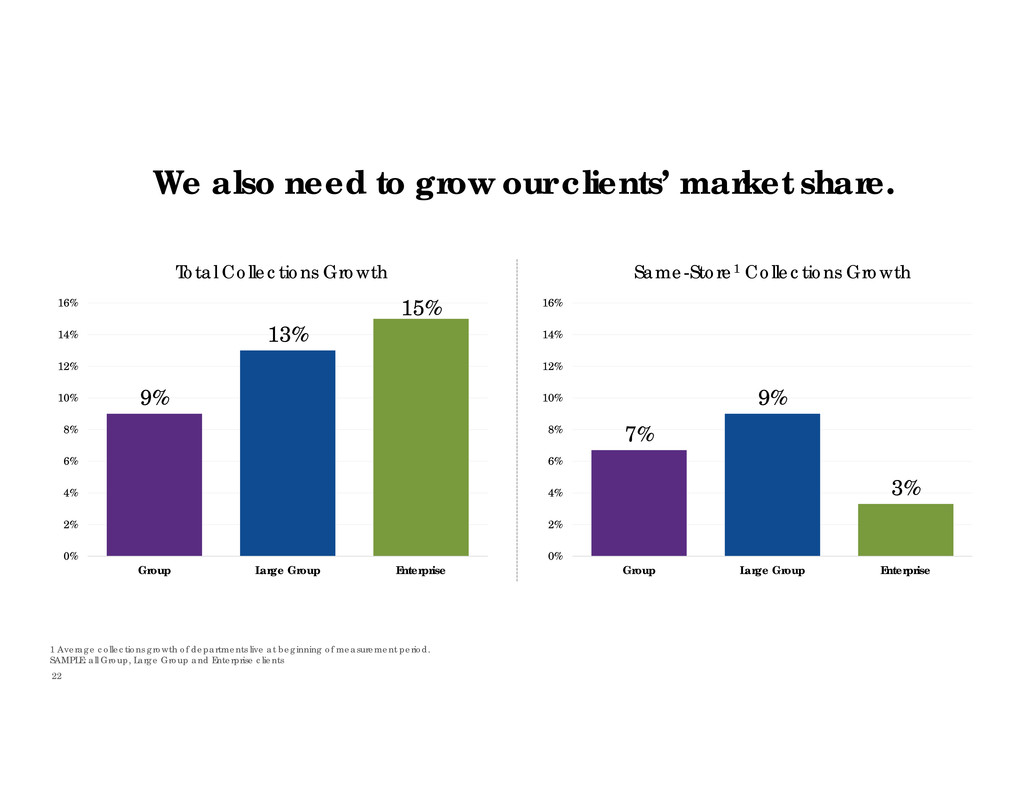
22 We also need to grow our clients’ market share. 9% 13% 15% 0% 2% 4% 6% 8% 10% 12% 14% 16% Group Large Group Enterprise Total Collections Growth 7% 9% 3% 0% 2% 4% 6% 8% 10% 12% 14% 16% Group Large Group Enterprise Same-Store1 Collections Growth 1 Average collections growth of departments live at beginning of measurement period. SAMPLE: all Group, Large Group and Enterprise clients
23 So we will go to the Cloud and find new patients.
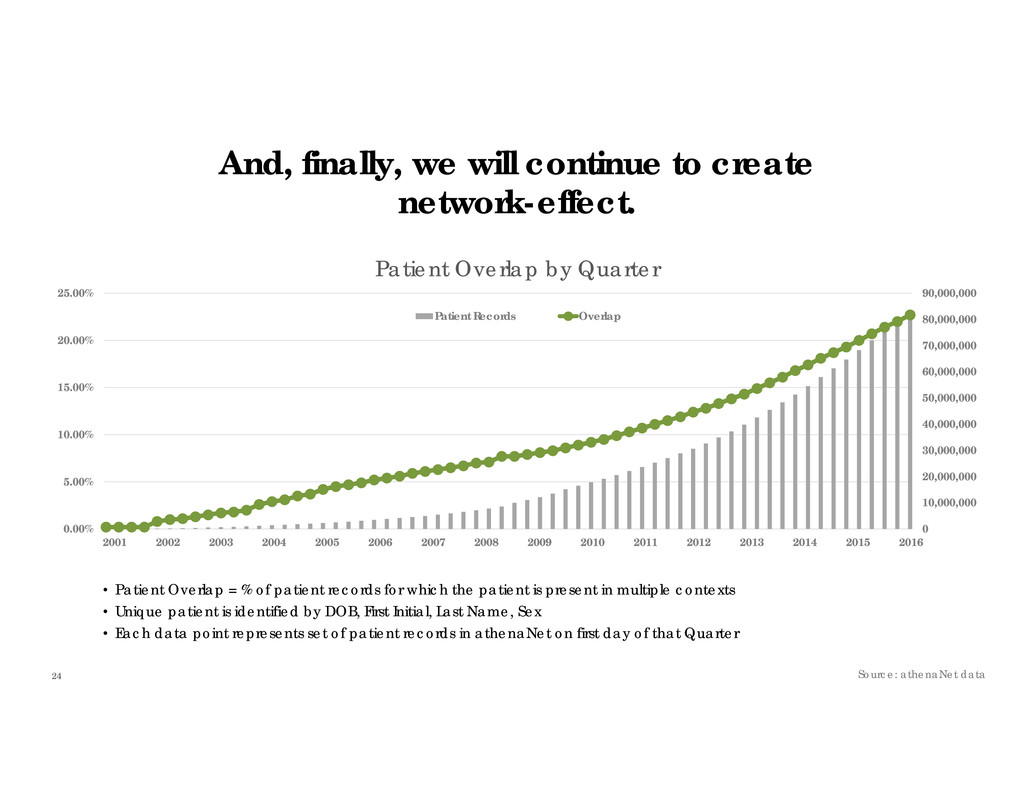
24 And, finally, we will continue to create network-effect. 0 10,000,000 20,000,000 30,000,000 40,000,000 50,000,000 60,000,000 70,000,000 80,000,000 90,000,000 0.00% 5.00% 10.00% 15.00% 20.00% 25.00% Patient Overlap by Quarter Patient Records Overlap • Patient Overlap = % of patient records for which the patient is present in multiple contexts • Unique patient is identified by DOB, First Initial, Last Name, Sex • Each data point represents set of patient records in athenaNet on first day of that Quarter Source: athenaNet data 2001 2002 2003 2004 2005 2006 2007 2008 2009 2010 2011 2012 2013 2014 2015 2016
25

27
28 $400M-$450M

29 Business Model and Financial Guidance Karl Stubelis Chief Financial Officer
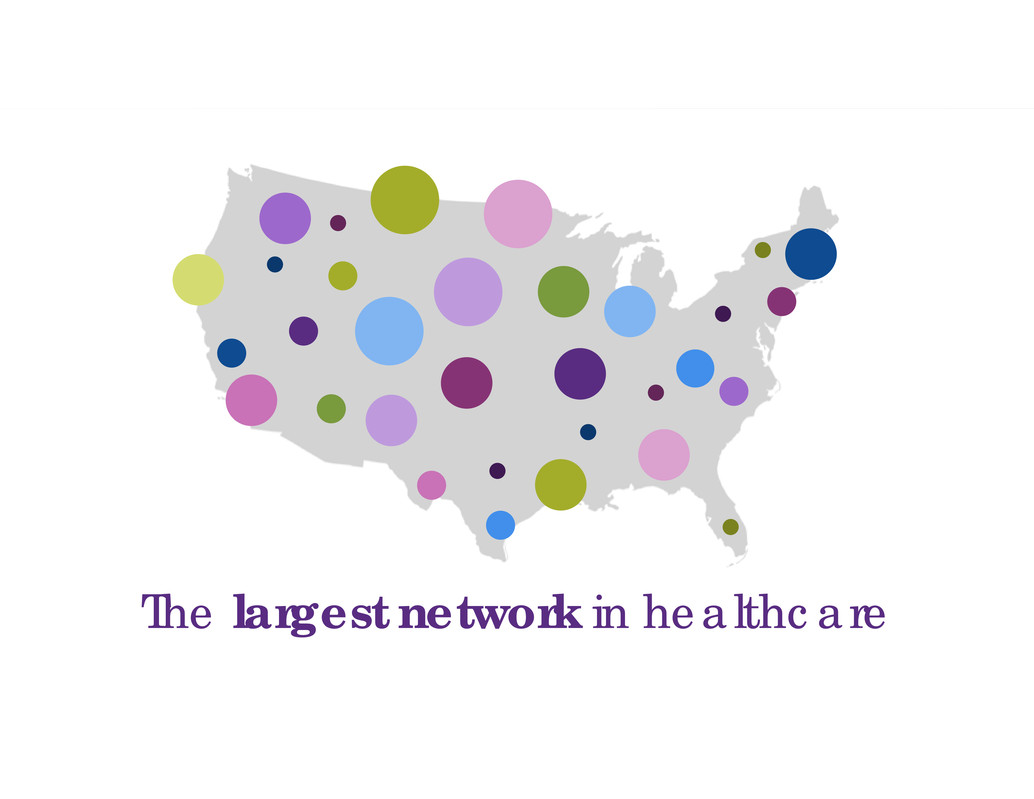
The largest network in healthcare

N E T W OR K Providers Connections Patients Claims 83.4M patient records 1 in 10 Americans seen by athenahealth providers each year 142M patient visits per year $22B collections posted per year 166M claims submitted per year 13M paper claims processed per year 85K total providers 22K primary care providers 323K active Epocrates MD users 5B+ electronic transactions per year 296K total interfaces 140K total endpoints on athenaNet Source: athenahealth data as of Q3 2016 or TTM (Q4 2015 – Q3 2016)
To build the information backbone that helps healthcare work as it should. To be healthcare providers’ most trusted service, helping them do well by doing the right thing. VISION MISSION
athenaNation • Implement athena core values • Complete DRI implementation at least at Sr. Manager and above • Complete our Agile transformation athenaNet • Weekly useful message to each user of our network (athenaNet Social Feed) • Live and breathe “Product Market Fit” • Launch at least one new adjacent market • Mainstream hospital services • Prove Network Services as an engine for athenaNet adoption We continue to focus our work on critical corporate goals during fiscal year 2017 33
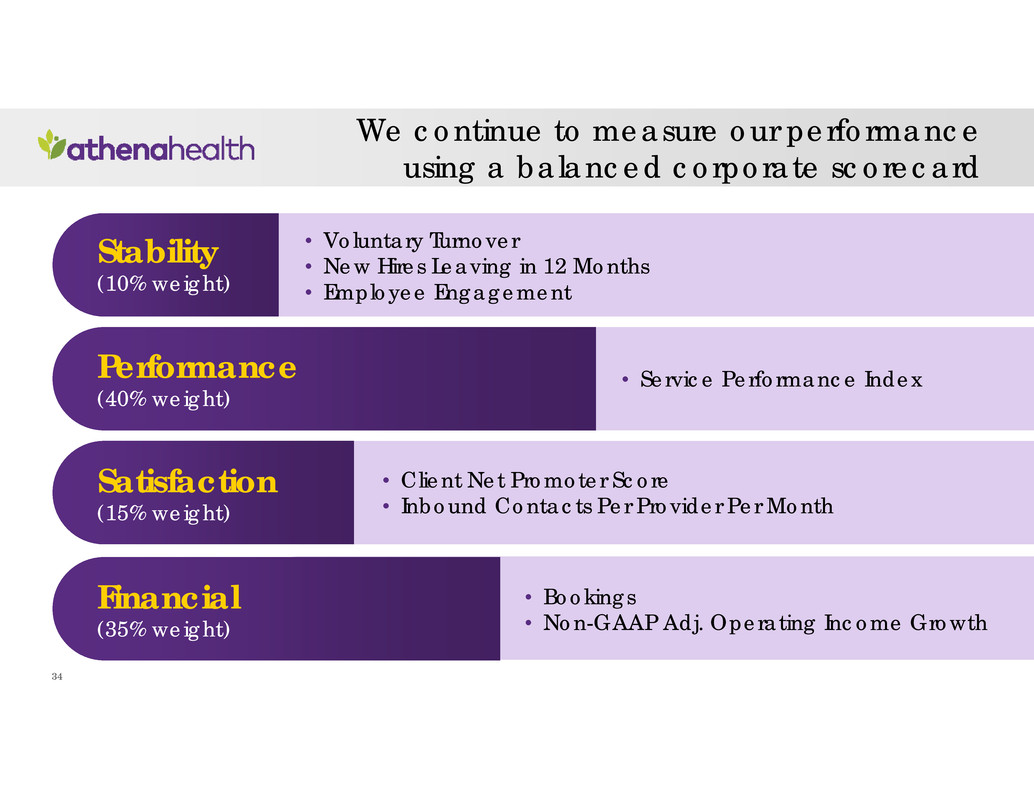
We continue to measure our performance using a balanced corporate scorecard • Bookings • Non-GAAP Adj. Operating Income Growth Financial (35% weight) Satisfaction (15% weight) Performance (40% weight) Stability (10% weight) • Client Net Promoter Score • Inbound Contacts Per Provider Per Month • Service Performance Index • Voluntary Turnover • New Hires Leaving in 12 Months • Employee Engagement 34
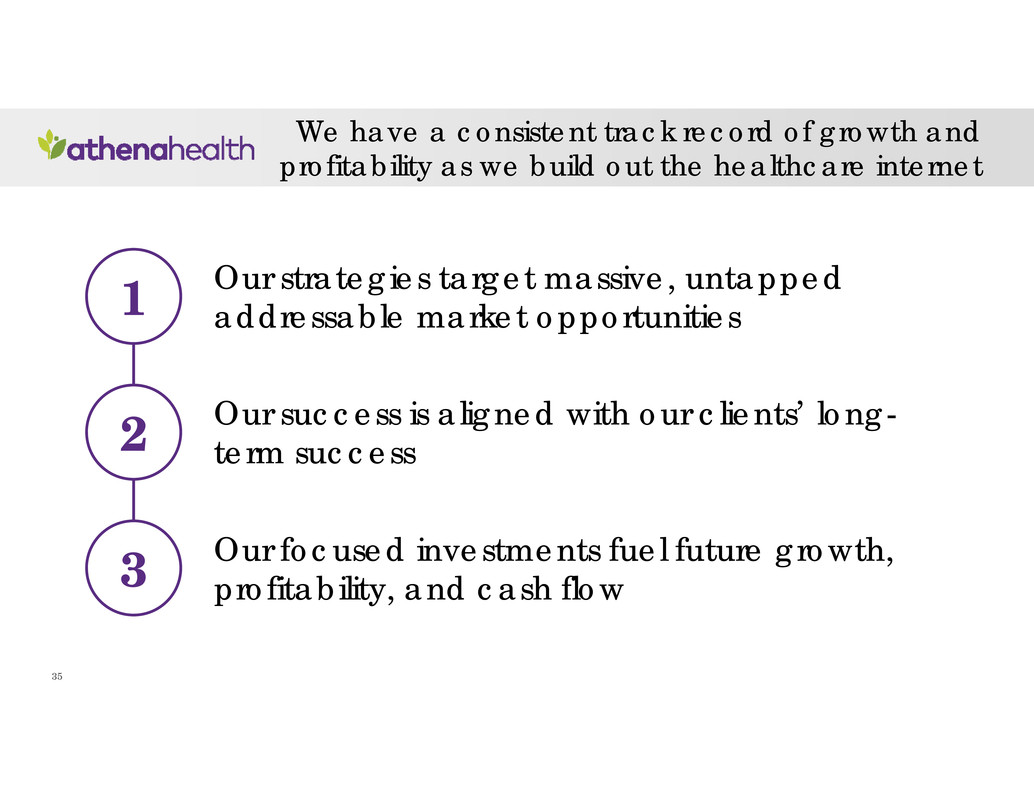
We have a consistent track record of growth and profitability as we build out the healthcare internet Our focused investments fuel future growth, profitability, and cash flow Our strategies target massive, untapped addressable market opportunities Our success is aligned with our clients’ long- term success 3 1 2 35

We have a consistent track record of growth and profitability as we build out the healthcare internet Our focused investments fuel future growth, profitability, and cash flow Our strategies target massive, untapped addressable market opportunities Our success is aligned with our clients’ long- term success 3 1 2 36
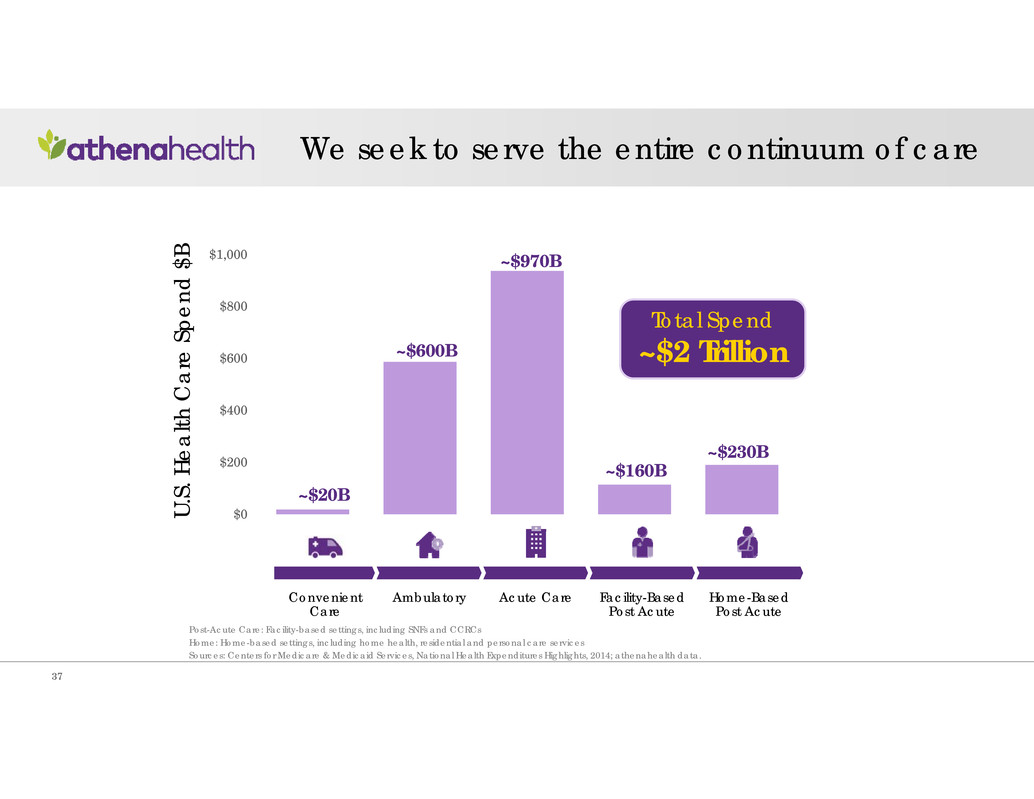
$0 $200 $400 $600 $800 $1,000 ~$20B ~$600B ~$970B ~$160B ~$230B U . S . H e a l t h C a r e S p e n d $ B Total Spend ~$2 Trillion Convenient Care Ambulatory Acute Care Facility-Based Post Acute Home-Based Post Acute We seek to serve the entire continuum of care Sources: Centers for Medicare & Medicaid Services, National Health Expenditures Highlights, 2014; athenahealth data. Home: Home-based settings, including home health, residential and personal care services Post-Acute Care: Facility-based settings, including SNFs and CCRCs 37

Roadmap to Support Full Continuum of Care Ambulatory Market $30-35 Billion1 Acute Care Services $30-50 Billion1 Facility-Based & Home- Based Post Acute $10-15 Billion2 athenaOne $70-$100 BILLION We believe our total addressable market is massive and growing 1 Calculated by multiplying athenahealth’s average billing rate of each service offering by ~$970B Hospital Expenditures and ~$600B Physician & Clinical Services, Centers for Medicare & Medicaid Services, National Health Expenditures Highlights, 2014. 2 Calculated by multiplying athenahealth’s average billing rate of each service offering by ~$160B Post-Acute Market Expenditures, Centers for Medicare & Medicaid Services, National Health Expenditures Highlights, 2014; athenahealth data. 2 Calculated by multiplying athenahealth’s average billing rate of each service offering by ~$230B Home Health Expenditures, Centers for Medicare & Medicaid Services, National Health Expenditures Highlights, 2014; athenahealth data. 38
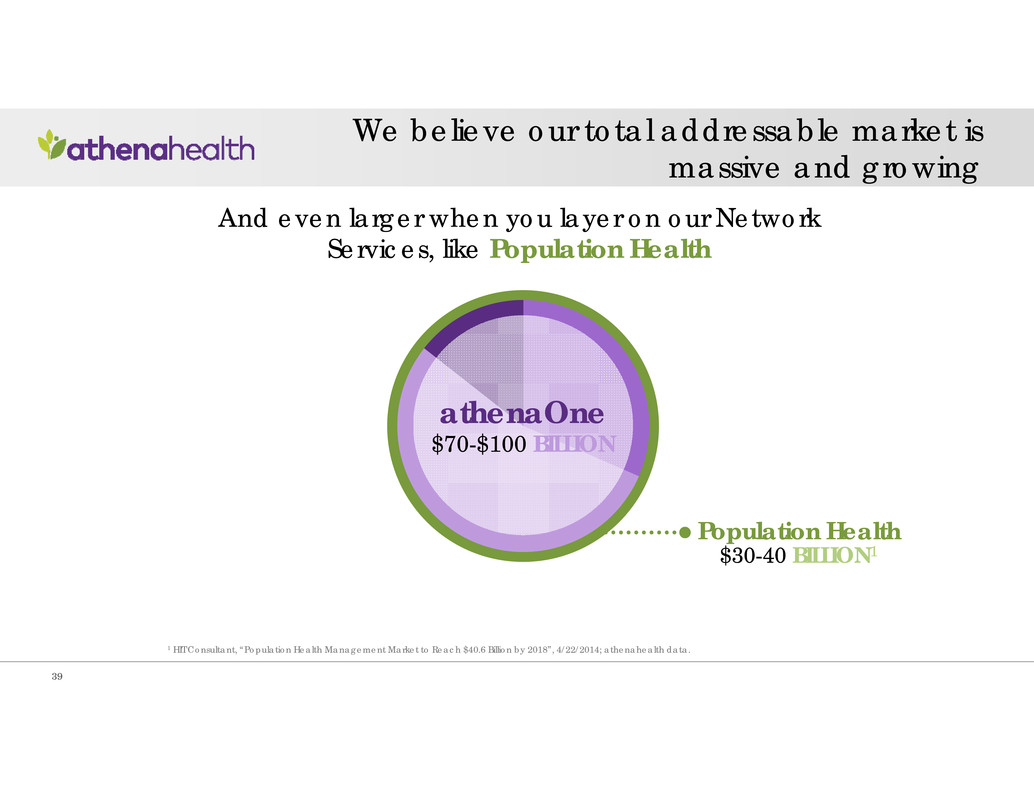
Population Health $30-40 BILLION1 And even larger when you layer on our Network Services, like Population Health athenaOne $70-$100 BILLION We believe our total addressable market is massive and growing 1 HIT Consultant, “Population Health Management Market to Reach $40.6 Billion by 2018”, 4/22/2014; athenahealth data. 39

We have a consistent track record of growth and profitability as we build out the healthcare internet Our focused investments fuel future growth, profitability, and cash flow Our strategies target massive, untapped addressable market opportunities Our success is aligned with our clients’ long- term success 3 1 2 40
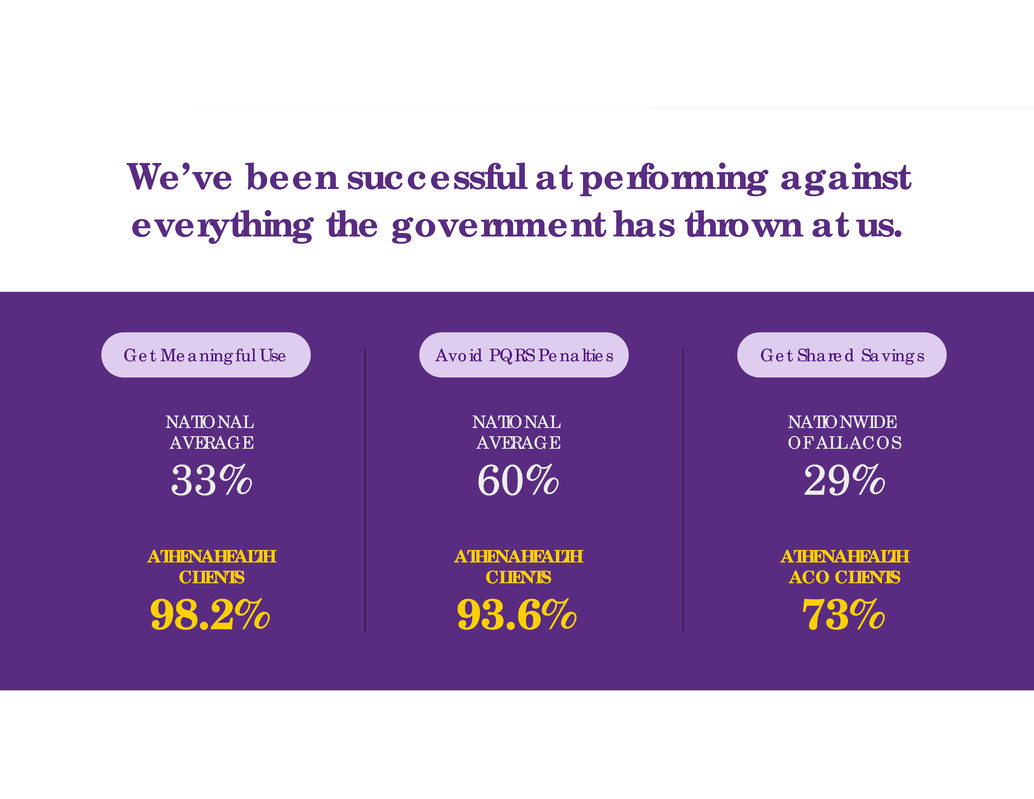
NATIONAL AVERAGE 60% ATHENAHEALTH CLIENTS 93.6% Avoid PQRS Penalties NATIONAL AVERAGE 33% ATHENAHEALTH CLIENTS 98.2% Get Meaningful Use NATIONWIDE OF ALL ACOS 29% ATHENAHEALTH ACO CLIENTS 73% Get Shared Savings We’ve been successful at performing against everything the government has thrown at us.

Post Meaningful Use, we co-source with our clients to reduce unnecessary work Total work athenahealth workClient work
We have a consistent track record of growth and profitability as we build out the healthcare internet Our focused investments fuel future growth, profitability, and cash flow Our strategies target massive, untapped addressable market opportunities Our success is aligned with our clients’ long- term success 3 1 2 44
Growth Cash FlowProfitability We remain focused on profitable growth and generating cash 45

FIRST, bookings values are estimated based on data provided by clients SECOND, bookings are reported net of any charge backs THIRD, timeline to convert bookings to revenue varies by sales segment and service offering FOURTH, we adjust pricing based on actual versus estimated performance on our network The sum of the expected annualized recurring revenue from athenahealth-branded services and the contracted value from Epocrates-branded services; net of any charge backs • Bookings exclude one-time fees (e.g., consulting, training, go- live support, implementation fees) • Contracts for athenahealth-branded services are typically one-year auto renewals • Contracts often include a contractual commitment to go live within six months or forfeit a modest deposit fee
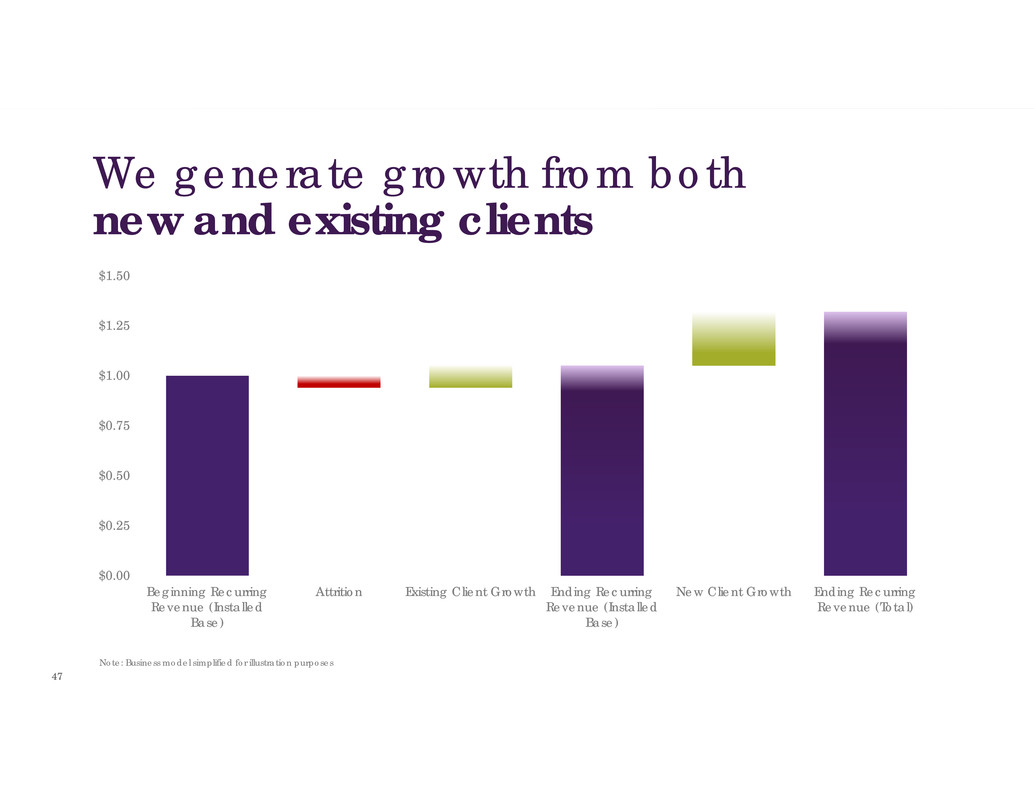
$0.00 $0.25 $0.50 $0.75 $1.00 $1.25 $1.50 Beginning Recurring Revenue (Installed Base) Attrition Existing Client Growth Ending Recurring Revenue (Installed Base) New Client Growth Ending Recurring Revenue (Total) Note: Business model simplified for illustration purposes We generate growth from both new and existing clients 47
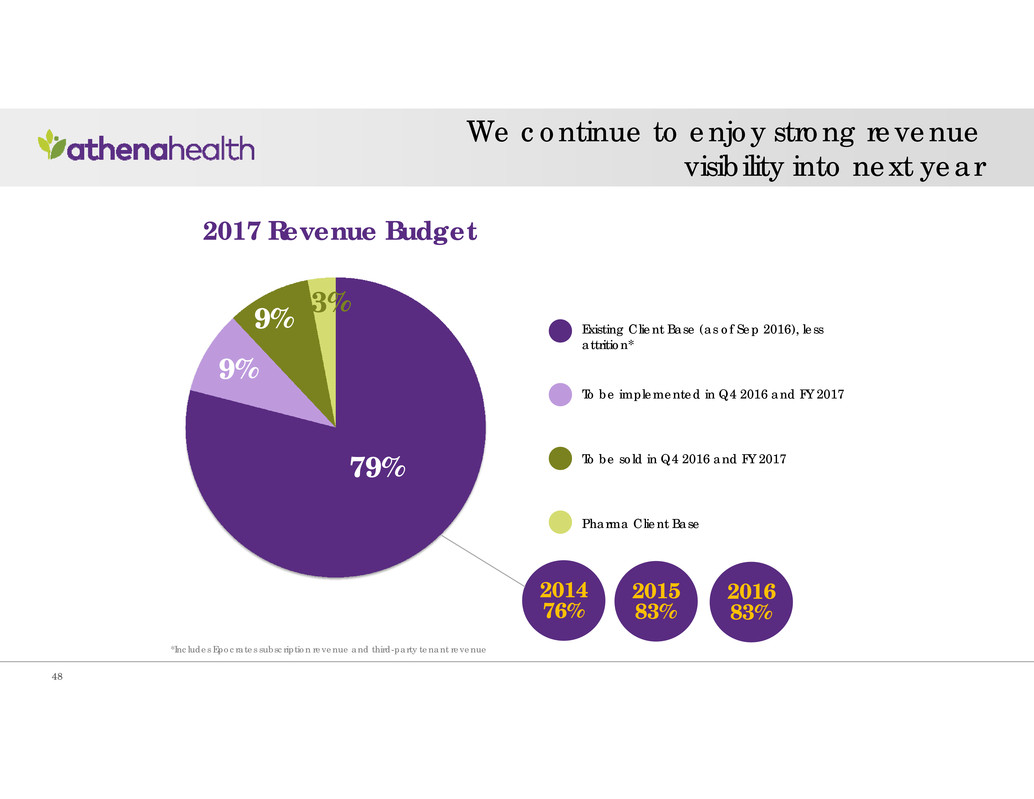
79% 9% 9% 3% Existing Client Base (as of Sep 2016), less attrition* To be implemented in Q4 2016 and FY 2017 To be sold in Q4 2016 and FY 2017 Pharma Client Base *Includes Epocrates subscription revenue and third-party tenant revenue 2017 Revenue Budget 2014 76% 2015 83% 2016 83% We continue to enjoy strong revenue visibility into next year 48

Ramp SIGNING GO-LIVE Jan Feb Mar Q1 Apr May Jun Q2 Jul Aug Sep Q3 Oct Nov Dec Q4 Jan Feb Mar Q1 ENTERPRISE Kick-off Ramp Full Revenue POPULATION HEALTH Kick-off Full Revenue GROUP Kick-off Ramp Full Revenue SMALL Kick-off Full RevenueRamp HOSPITAL Kick-off Ramp Full Revenue While bookings-to-revenue varies by segment, we continue to compress the process over time 49 Note: The implementation timelines and ramp periods illustrated above are directional and may vary by sales segment and service
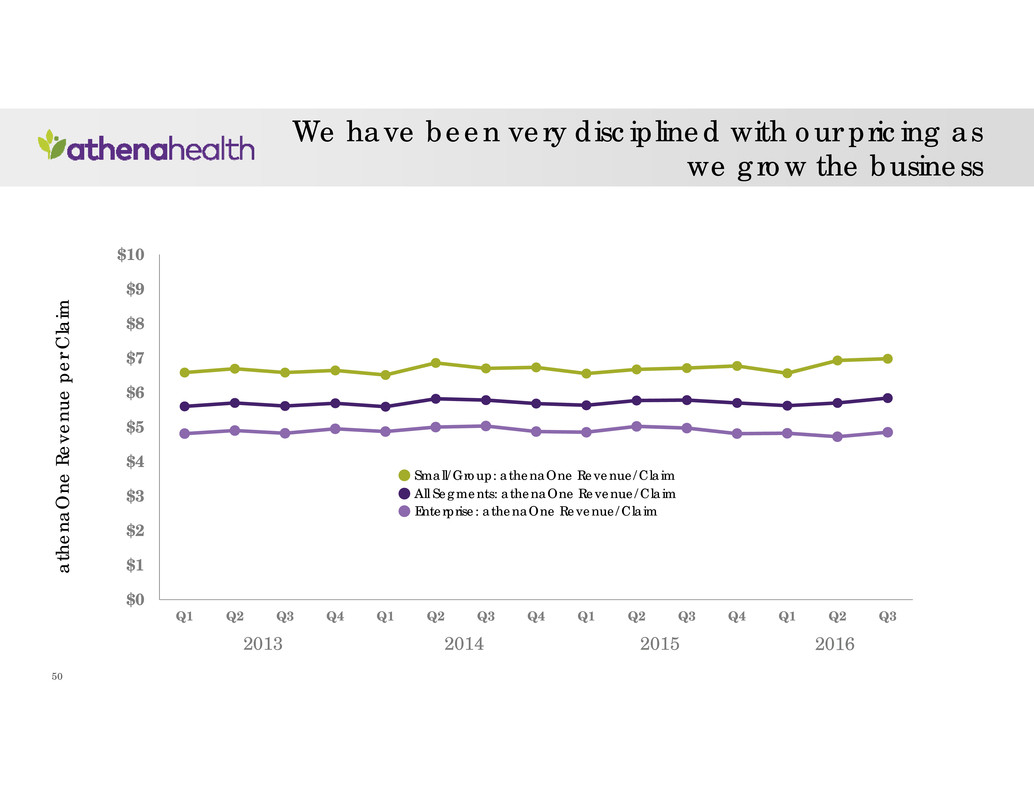
We have been very disciplined with our pricing as we grow the business Q1 Q2 Q3 Q4 Q1 Q2 Q3 Q4 Q1 Q2 Q3 Q4 Q1 Q2 Q3 $0 $1 $2 $3 $4 $5 $6 $7 $8 $9 $10 Small/Group: athenaOne Revenue/Claim All Segments: athenaOne Revenue/Claim Enterprise: athenaOne Revenue/Claim a t h e n a O n e R e v e n u e p e r C l a i m 2013 2014 2015 2016 50
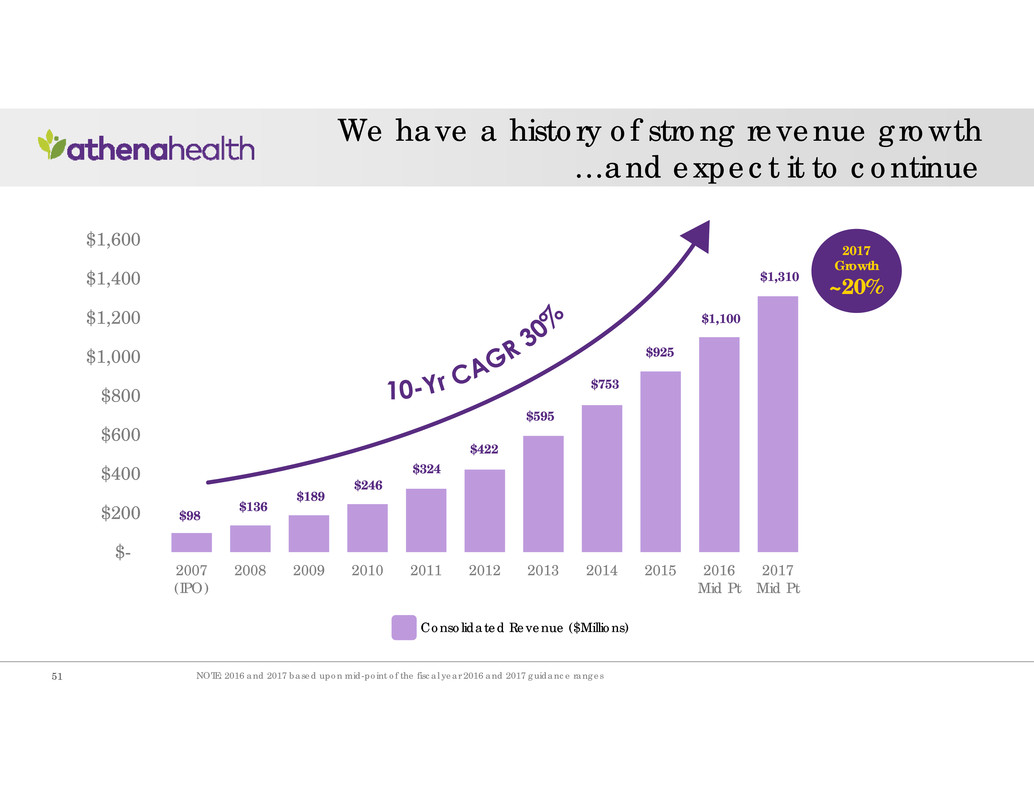
$98 $136 $189 $246 $324 $422 $595 $753 $925 $1,100 $1,310 $- $200 $400 $600 $800 $1,000 $1,200 $1,400 $1,600 2007 (IPO) 2008 2009 2010 2011 2012 2013 2014 2015 2016 Mid Pt 2017 Mid Pt Consolidated Revenue ($Millions) We have a history of strong revenue growth …and expect it to continue 2017 Growth ~20% NOTE: 2016 and 2017 based upon mid-point of the fiscal year 2016 and 2017 guidance ranges51

Our growth drivers are beginning to change as we expand across the continuum Covered Lives Pricing Framework Key Metric ProvidersathenaOne (Ambulatory) % of Collections Covered Livesathenahealth Population Health Per Member Per Month + Gain Share Discharge Bed DaysathenaOne (Hospital) % of Collections 2016 Revenue Forecast 2017 Revenue Budget ~2% ~4% athenaOne (Ambulatory) athenaOne (Hospital) Population Health All Other As of Q3 2016 ~85,000 ~3,800 ~2,000,000 52
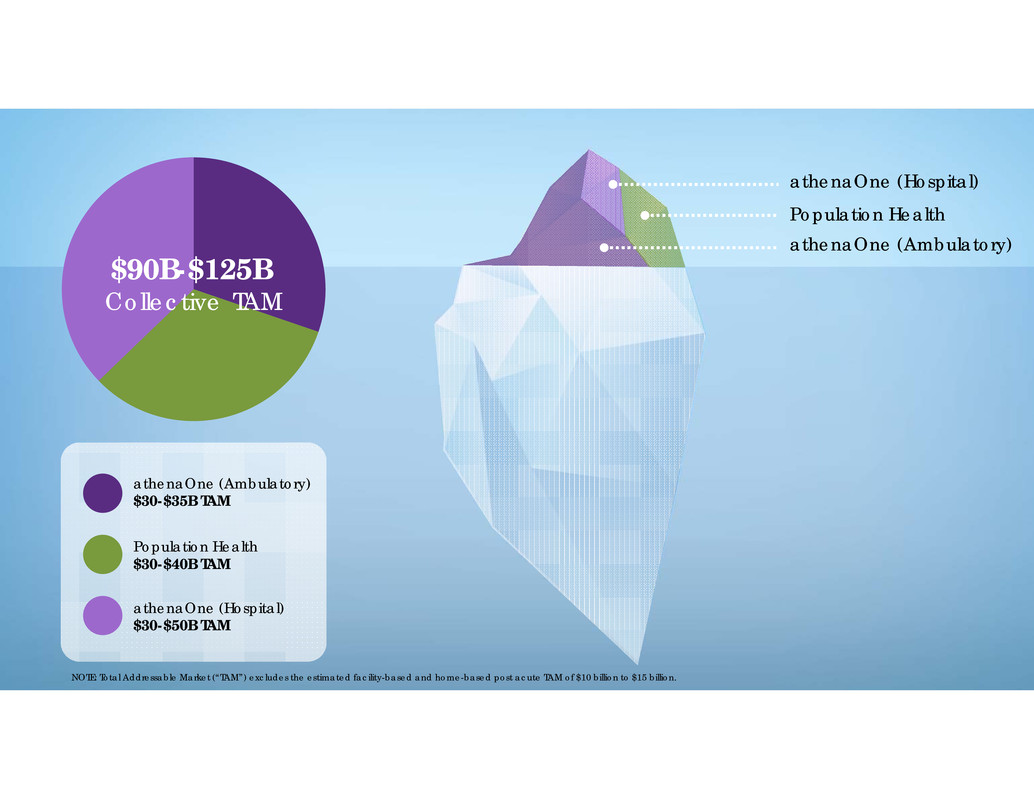
$90B-$125B Collective TAM athenaOne (Ambulatory) $30-$35B TAM Population Health $30-$40B TAM athenaOne (Hospital) $30-$50B TAM athenaOne (Ambulatory) Population Health athenaOne (Hospital) NOTE: Total Addressable Market (“TAM”) excludes the estimated facility-based and home-based post acute TAM of $10 billion to $15 billion.

Growth Cash FlowProfitability We remain focused on profitable growth and generating cash 54
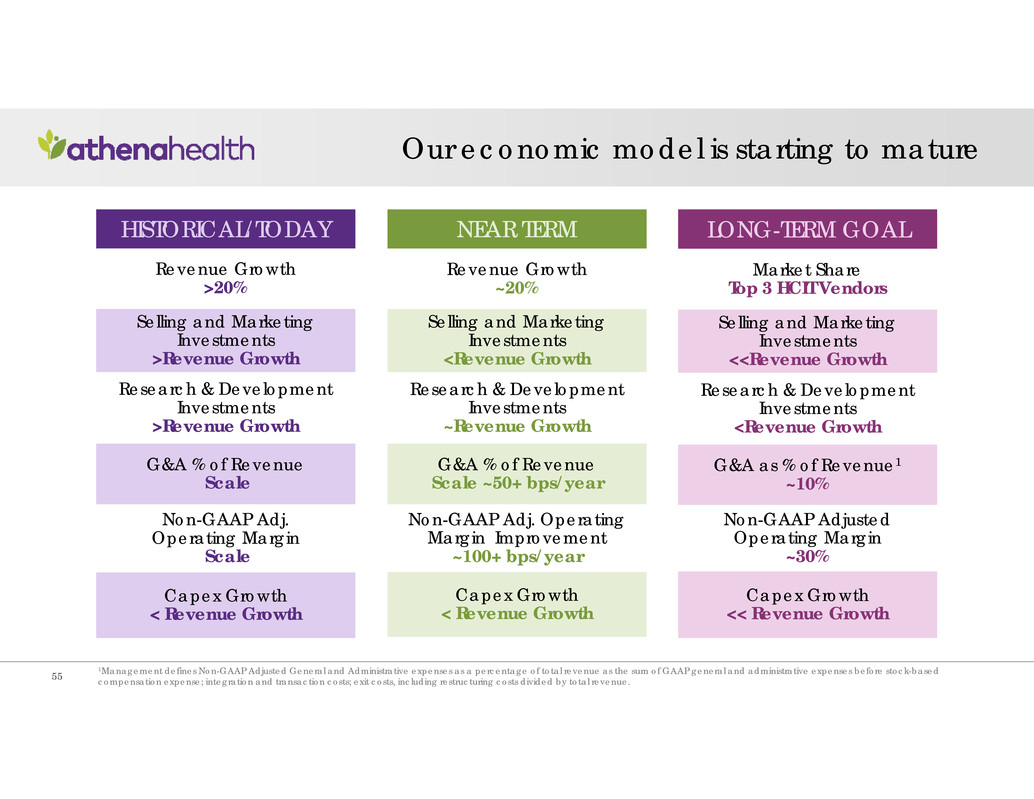
HISTORICAL/TODAY Revenue Growth >20% Selling and Marketing Investments >Revenue Growth Research & Development Investments >Revenue Growth G&A % of Revenue Scale Non-GAAP Adj. Operating Margin Scale Capex Growth < Revenue Growth NEAR TERM Revenue Growth ~20% Selling and Marketing Investments <Revenue Growth Research & Development Investments ~Revenue Growth G&A % of Revenue Scale ~50+ bps/year Non-GAAP Adj. Operating Margin Improvement ~100+ bps/year Capex Growth < Revenue Growth LONG-TERM GOAL Market Share Top 3 HCIT Vendors Selling and Marketing Investments <<Revenue Growth Research & Development Investments <Revenue Growth G&A as % of Revenue1 ~10% Non-GAAP Adjusted Operating Margin ~30% Capex Growth << Revenue Growth Our economic model is starting to mature 1Management defines Non-GAAP Adjusted General and Administrative expenses as a percentage of total revenue as the sum of GAAP general and administrative expenses before stock-based compensation expense; integration and transaction costs; exit costs, including restructuring costs divided by total revenue.55

-$25 $0 $25 $50 $75 $100 $125 $150 $175 $200 2011 2012 2013 2014 2015 Q1 - Q3 2016 GAAP Operating Income As a result, we expect profitability and cash flow to improve as we grow and scale Non-GAAP Adjusted Operating Income Cash Flow from Operating Activities $ M i l l i o n s 56

Unit Cost by issue reason by month Denominator Toggle: Cases vs. Providers Product Toggle Case volumes by reason Client Toggle Our massive data set allows us to instrument our business at unparalleled levels 57
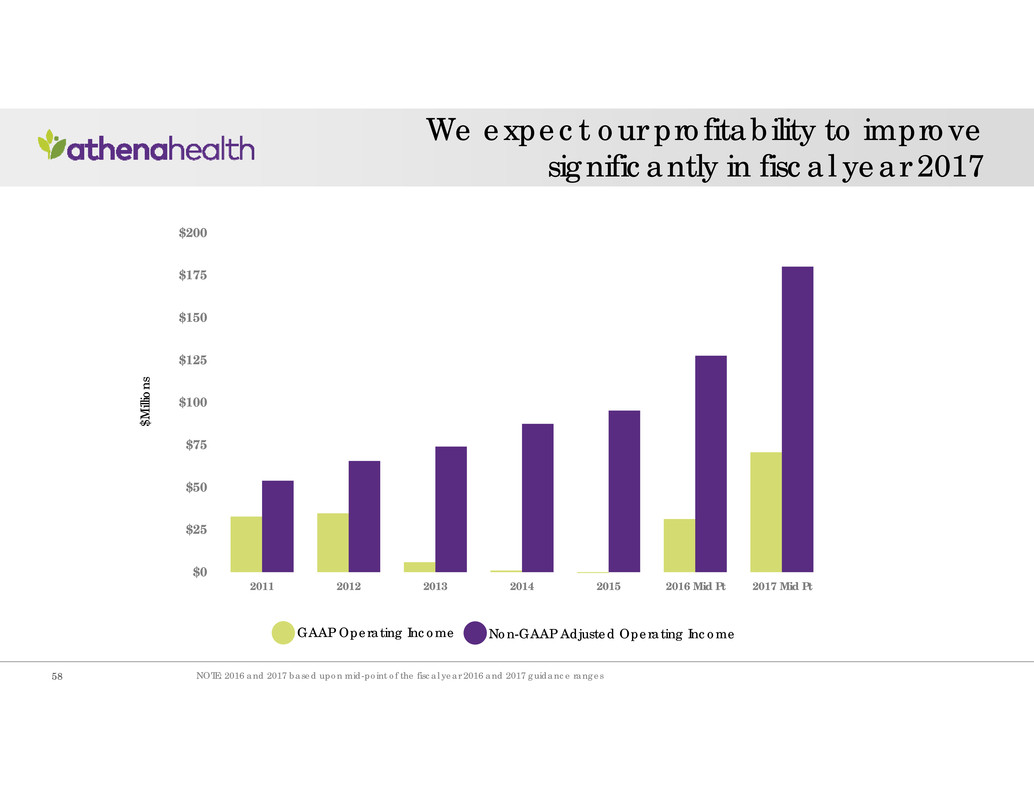
$0 $25 $50 $75 $100 $125 $150 $175 $200 2011 2012 2013 2014 2015 2016 Mid Pt 2017 Mid Pt Non-GAAP Adjusted Operating IncomeGAAP Operating Income We expect our profitability to improve significantly in fiscal year 2017 NOTE: 2016 and 2017 based upon mid-point of the fiscal year 2016 and 2017 guidance ranges $ M i l l i o n s 58
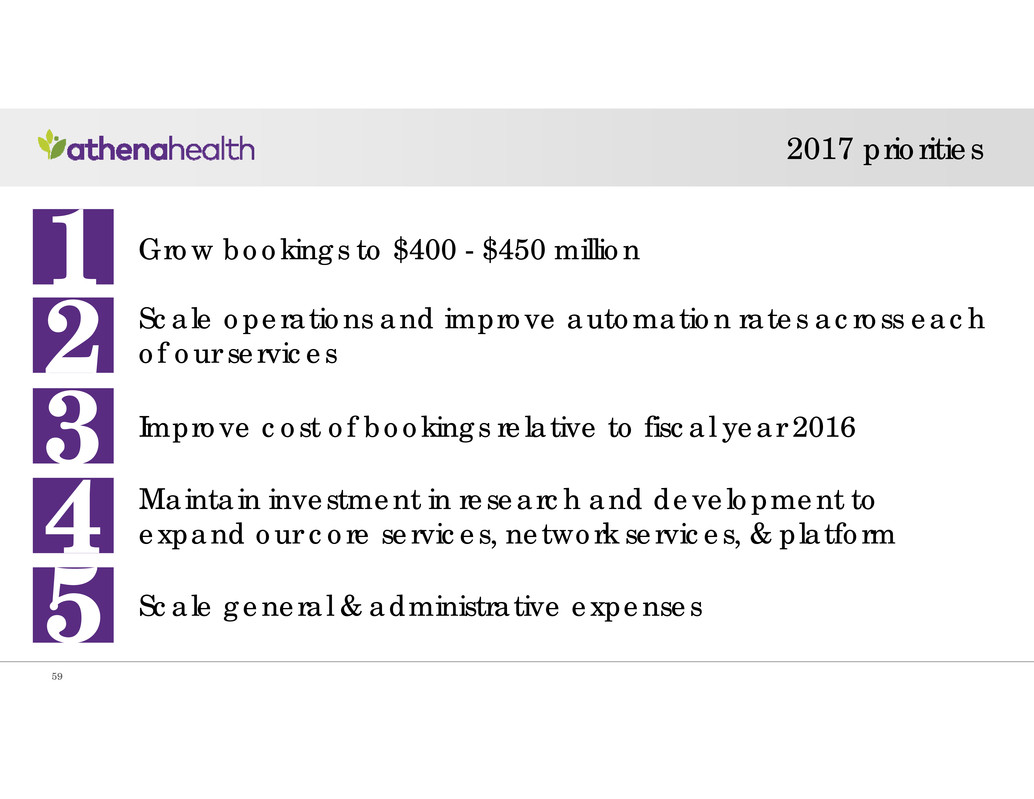
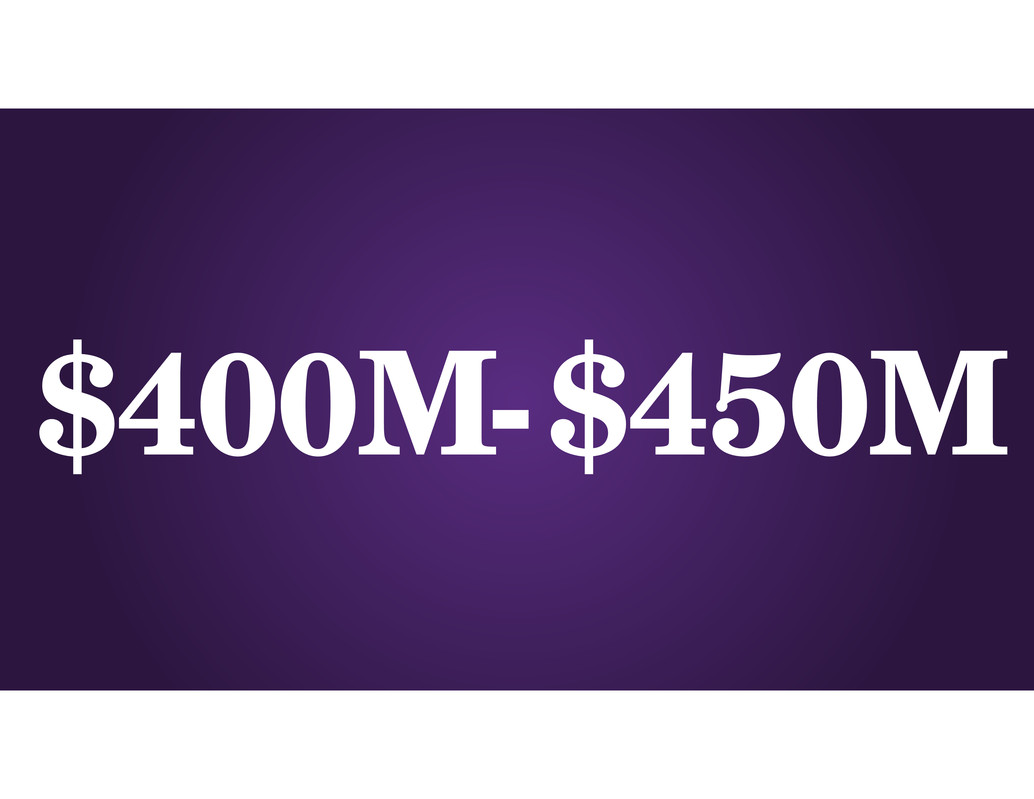
1 2 3 4 5 Grow bookings to $400 - $450 million Scale operations and improve automation rates across each of our services Improve cost of bookings relative to fiscal year 2016 Maintain investment in research and development to expand our core services, network services, & platform Scale general & administrative expenses 2017 priorities 59
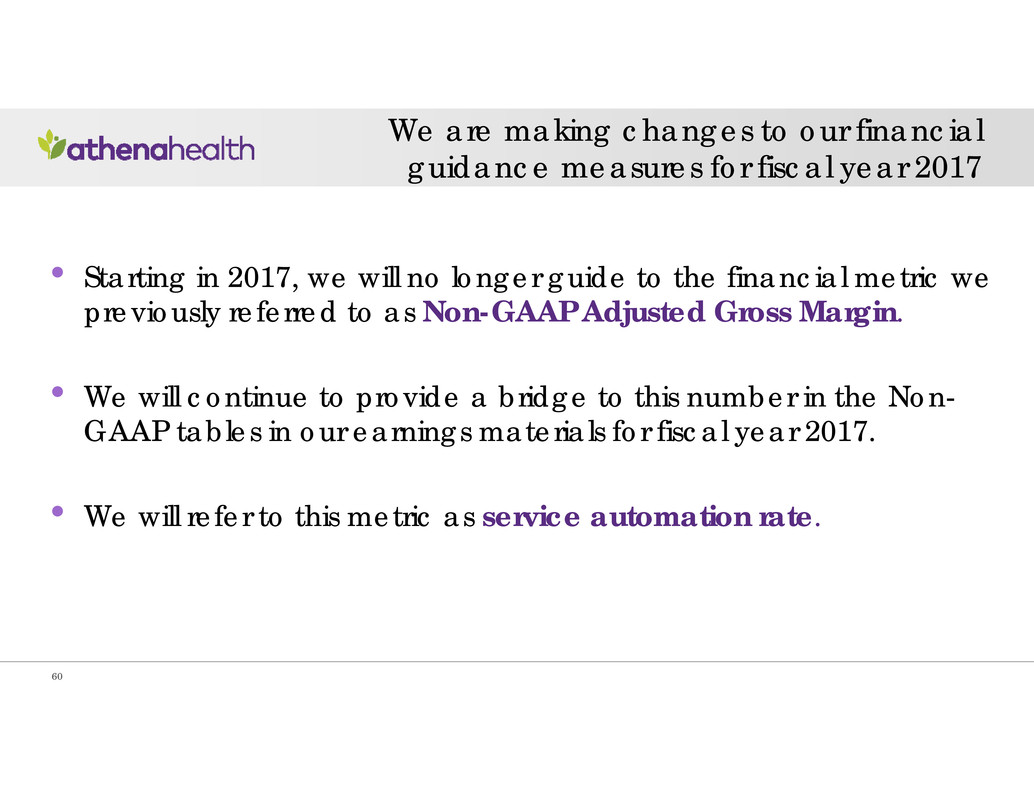
2 3 4 • Starting in 2017, we will no longer guide to the financial metric we previously referred to as Non-GAAP Adjusted Gross Margin. • We will continue to provide a bridge to this number in the Non- GAAP tables in our earnings materials for fiscal year 2017. • We will refer to this metric as service automation rate. We are making changes to our financial guidance measures for fiscal year 2017 60
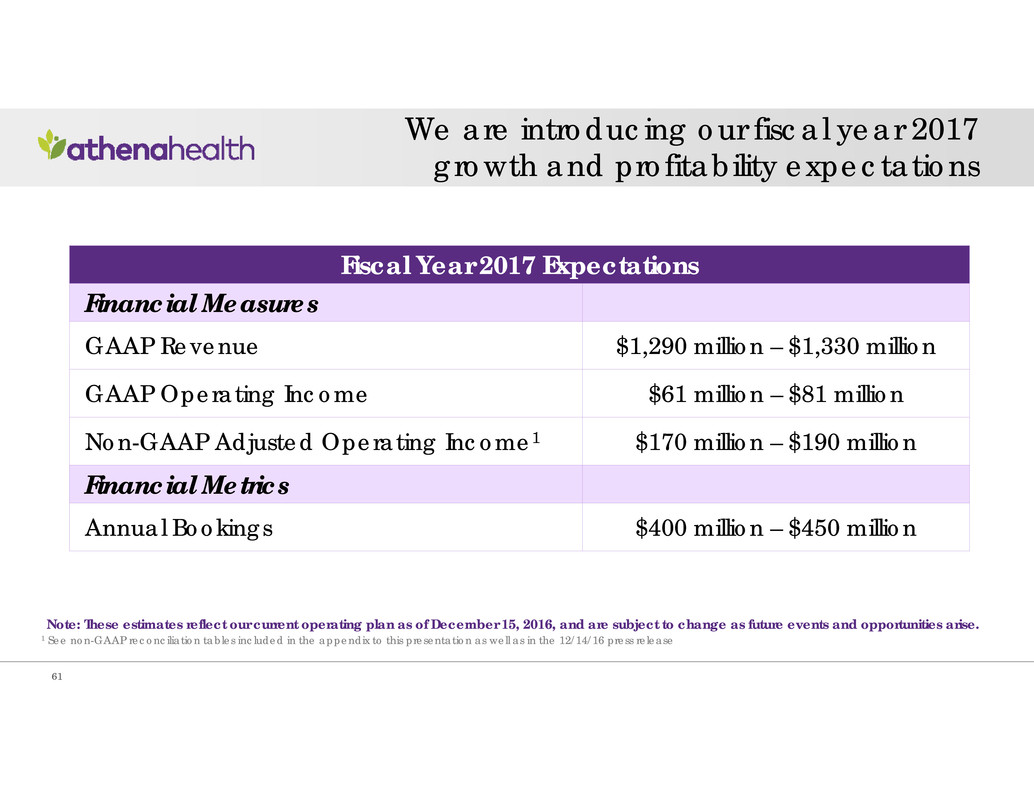
We are introducing our fiscal year 2017 growth and profitability expectations Fiscal Year 2017 Expectations Financial Measures GAAP Revenue $1,290 million – $1,330 million GAAP Operating Income $61 million – $81 million Non-GAAP Adjusted Operating Income1 $170 million – $190 million Financial Metrics Annual Bookings $400 million – $450 million 1 See non-GAAP reconciliation tables included in the appendix to this presentation as well as in the 12/14/16 press release Note: These estimates reflect our current operating plan as of December 15, 2016, and are subject to change as future events and opportunities arise. 61

62 The Service Profit Chain: Creating a New Framework for Healthcare Leonard Schlesinger, Baker Foundation Professor Harvard Business School
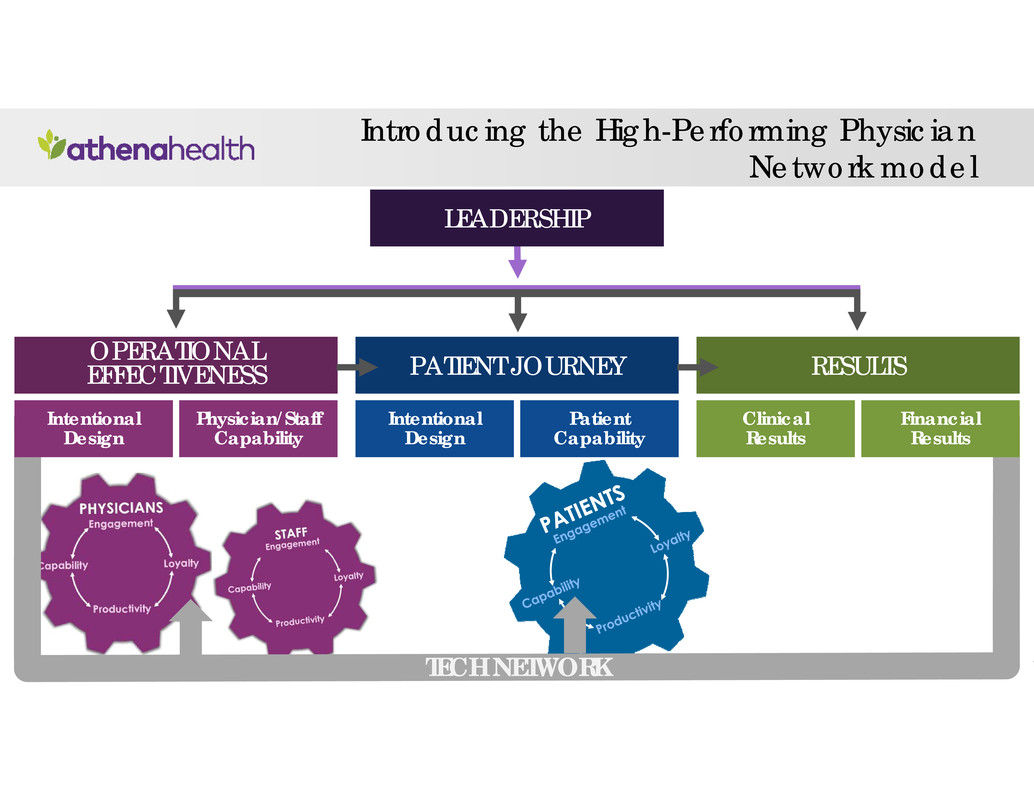
Introducing the High-Performing Physician Network model RESULTS Clinical Results Financial Results OPERATIONAL EFFECTIVENESS Intentional Design Physician/Staff Capability PATIENT JOURNEY Intentional Design Patient Capability TECH NETWORK LEADERSHIP
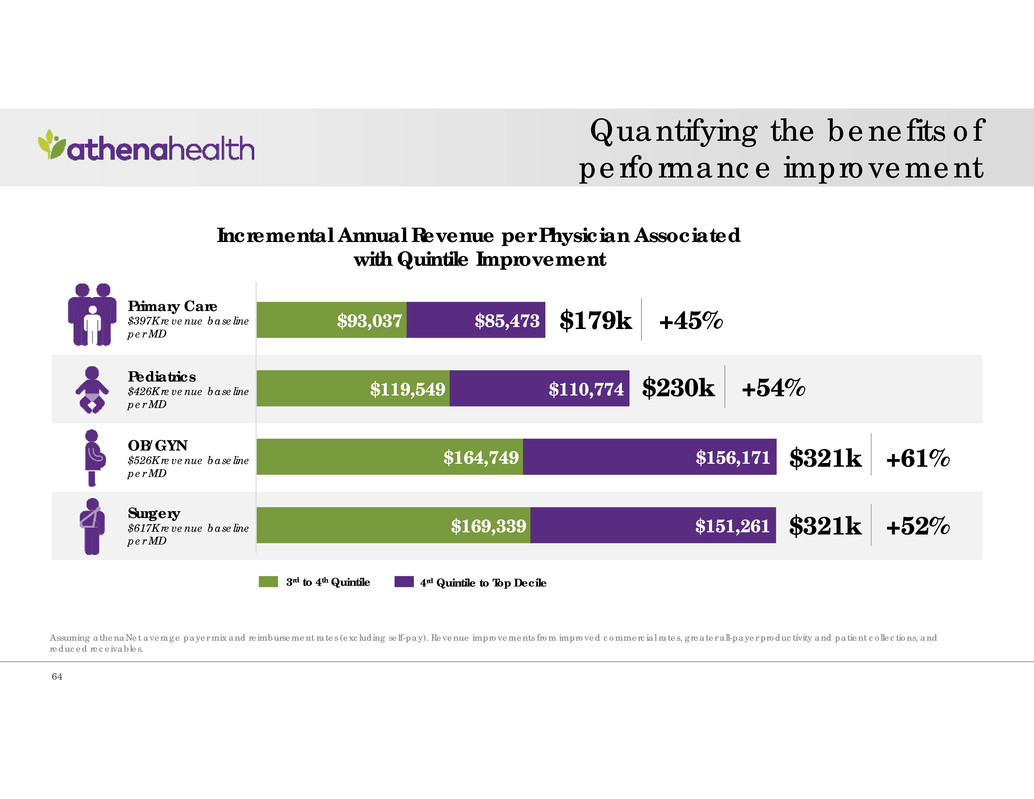
Quantifying the benefits of performance improvement 64 Primary Care $397K revenue baseline per MD Pediatrics $426K revenue baseline per MD OB/GYN $526K revenue baseline per MD Surgery $617K revenue baseline per MD 3rd to 4th Quintile 4rd Quintile to Top Decile Incremental Annual Revenue per Physician Associated with Quintile Improvement Assuming athenaNet average payer mix and reimbursement rates (excluding self-pay). Revenue improvements from improved commercial rates, greater all-payer productivity and patient collections, and reduced receivables. $93,037 $119,549 $164,749 $169,339 $85,473 $110,774 $156,171 $151,261 $321k $321k $230k $179k +45% +54% +61% +52%
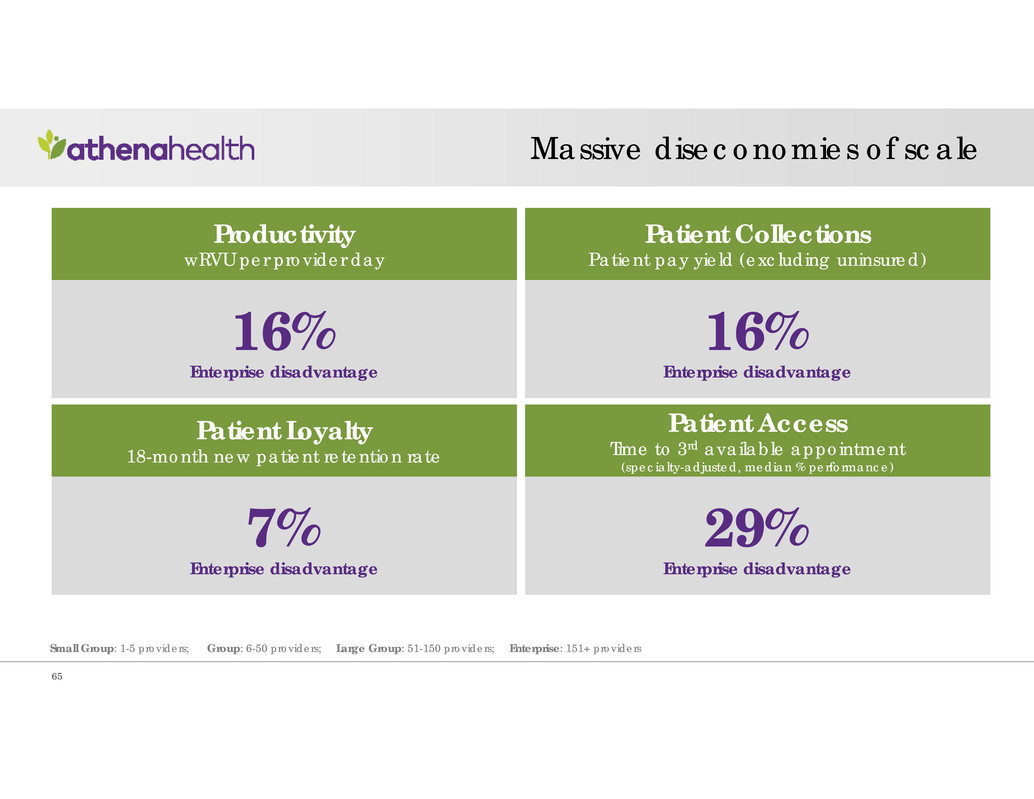
Massive diseconomies of scale 65 Small Group: 1-5 providers; Group: 6-50 providers; Large Group: 51-150 providers; Enterprise: 151+ providers Productivity wRVU per provider day 16% Enterprise disadvantage Patient Collections Patient pay yield (excluding uninsured) 16% Enterprise disadvantage Patient Access Time to 3rd available appointment (specialty-adjusted, median % performance) 29% Enterprise disadvantage Patient Loyalty 18-month new patient retention rate 7% Enterprise disadvantage

Large enterprises growing faster— but only through acquisition 66 Year-Over Year Collections Growth 9% 13% 15% 0% 2% 4% 6% 8% 10% 12% 14% 16% Group Large Group Enterprise Total Collections Growth 7% 9% 3% 0% 2% 4% 6% 8% 10% 12% 14% 16% Group Large Group Enterprise Same-Store1 Collections Growth 1 Average collections growth of departments live at beginning of measurement period. SAMPLE: all Group, Large Group and Enterprise clients
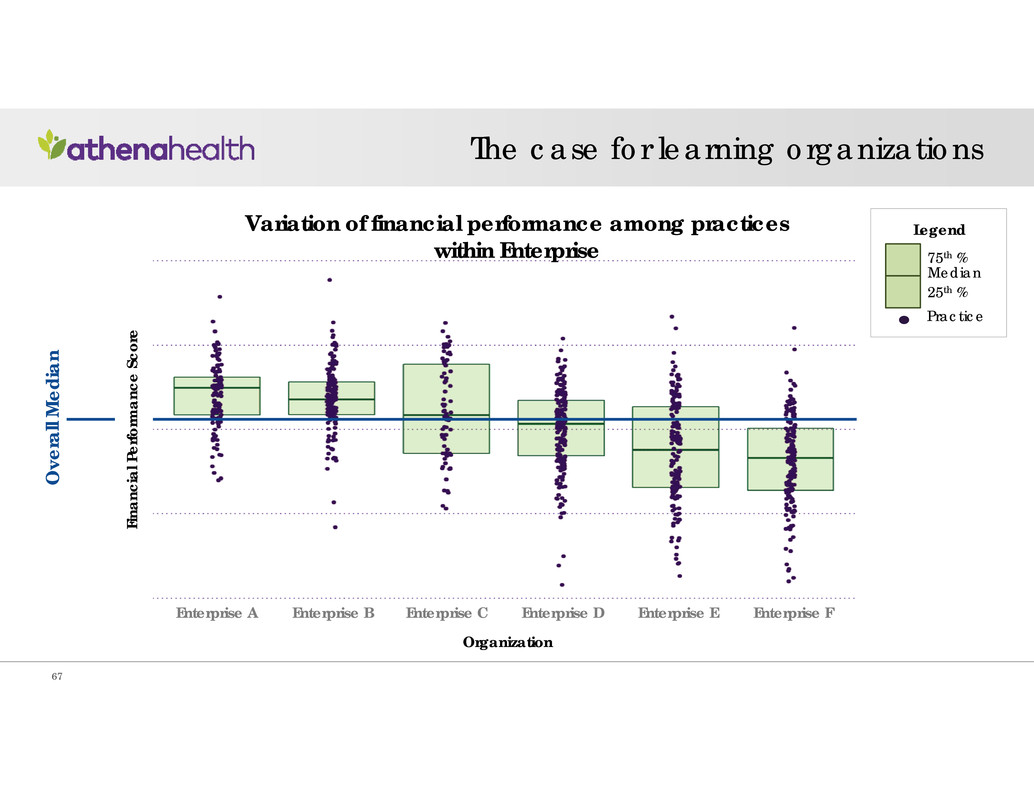
F i n a n c i a l P e r f o r m a n c e S c o r e O v e r a l l M e d i a n Organization Enterprise A Enterprise B Enterprise C Enterprise D Enterprise E Enterprise F The case for learning organizations 67 Variation of financial performance among practices within Enterprise 75th % Median 25th % Legend Practice

The value of improving patient collection stragglers 68 Variation of patient pay yield rate among practices within Enterprise P a t i e n t P a y Y i e l d Organization Enterprise A Enterprise B Enterprise C Enterprise D Enterprise E Enterprise F 75th % Median 25th % Legend Practice ¹Assumes all departments performing at below 75th percentile levels improve to the performance of the 75th percentile department within their enterprise Sample: Patient collections data from 6 enterprises on athenaNet from December 1, 2015 – November 30, 2016 Bringing low- performing departments up to the 75th percentile for Enterprise B would increase patient collections by 31%
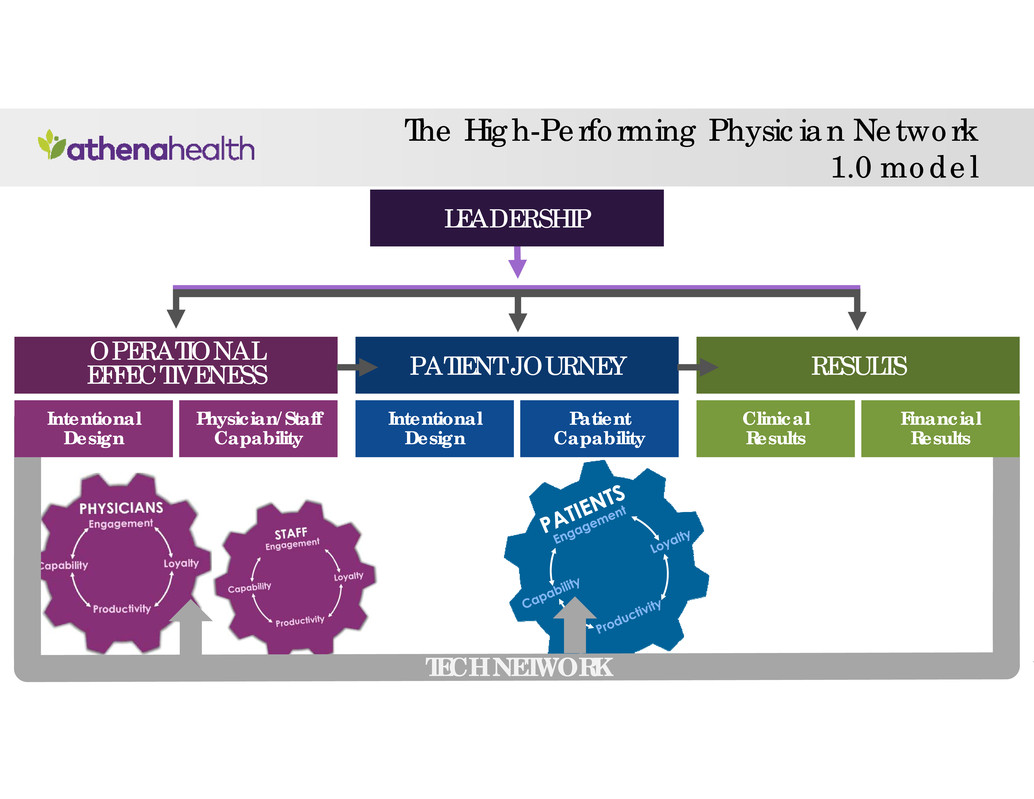
The High-Performing Physician Network 1.0 model RESULTS Clinical Results Financial Results OPERATIONAL EFFECTIVENESS Intentional Design Physician/Staff Capability PATIENT JOURNEY Intentional Design Patient Capability TECH NETWORK LEADERSHIP

70 The Network: Going Deep and Expanding Across the Continuum Kyle Armbrester Chief Product Officer

71 year in review
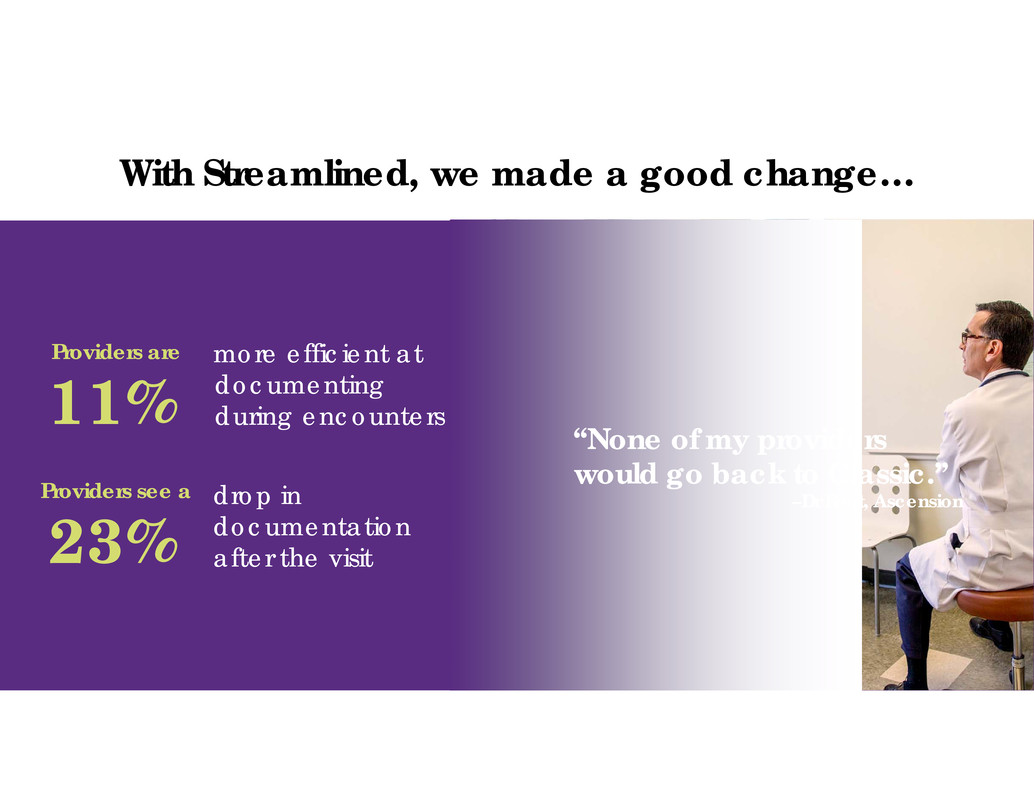
72 With Streamlined, we made a good change… “None of my providers would go back to Classic.” –Dr Root, Ascension Providers are 11% more efficient at documenting during encounters Providers see a 23% drop in documentation after the visit
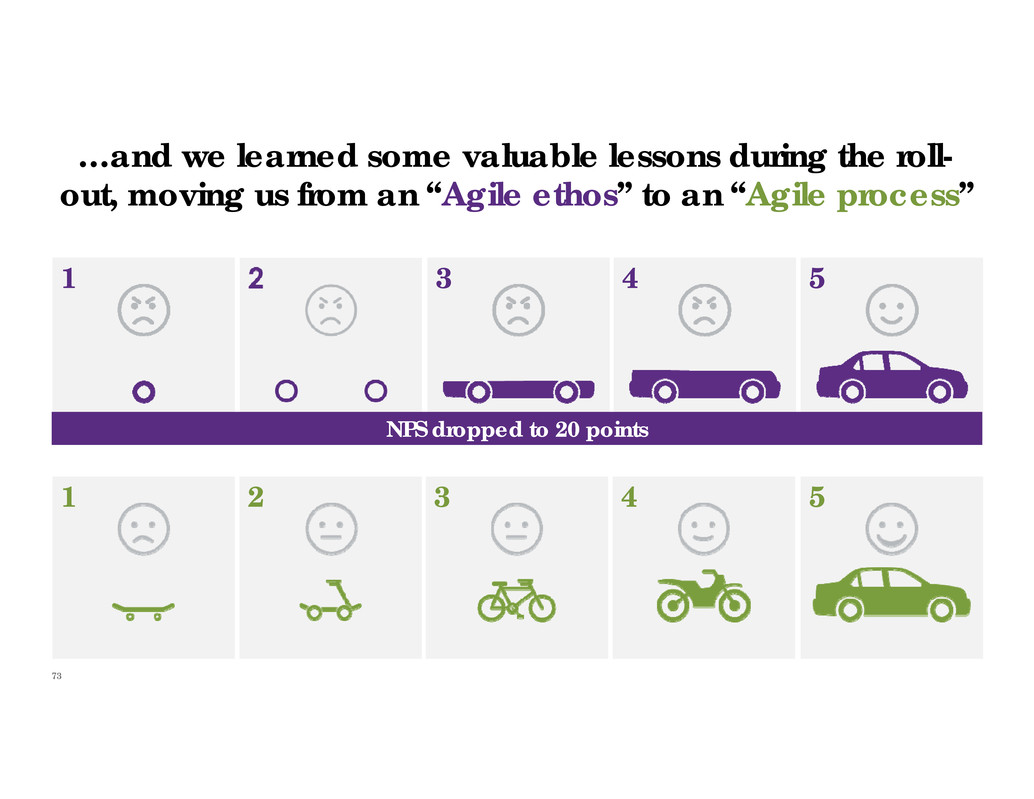
73 …and we learned some valuable lessons during the roll- out, moving us from an “Agile ethos” to an “Agile process” 1 2 3 4 5 1 3 4 5 NPS dropped to 20 points

74 We made notable progress in the hospital market in less than two years... “The University of Toledo Medical Center continues to work closely with our athena partners to further develop and refine a state of the art cloud based EMR with a focus on improving the physician, nurse, and learner experience, patient outcomes and reducing costs. We couldn’t be happier with the level of involvement and interaction the UT team has had with athena and look forward to the deployment of the system in the near future and ongoing optimization afterwards.” 35 live on athenaOne 92 hospitals contracted Already at 103% of our FY16 bookings goal Bryan Hinch, M.D. Chief Medical Officer University of Toledo Medical Center 256-bed Academic Medical Center
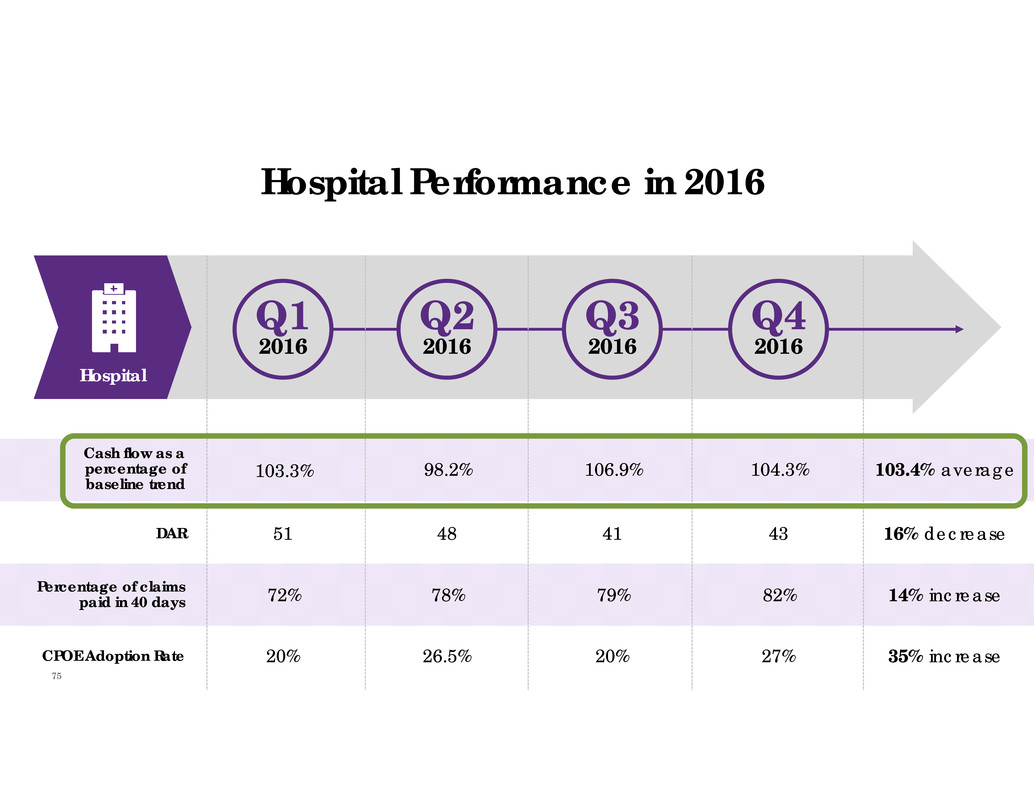
75 Hospital Performance in 2016 Cash flow as a percentage of baseline trend 103.3% 98.2% 106.9% 104.3% 103.4% average DAR 51 48 41 43 16% decrease Percentage of claims paid in 40 days 72% 78% 79% 82% 14% increase CPOE Adoption Rate 20% 26.5% 20% 27% 35% increase Hospital Q1 2016 Q2 2016 Q3 2016 Q4 2016

76 Government mandates are evaporating and becoming less significant “2016 will be an enormous and pivotal year for progress and it’s starting off with a bang” –Andy Slavitt, Acting CMS Administrator January 2016

77 what’s to come
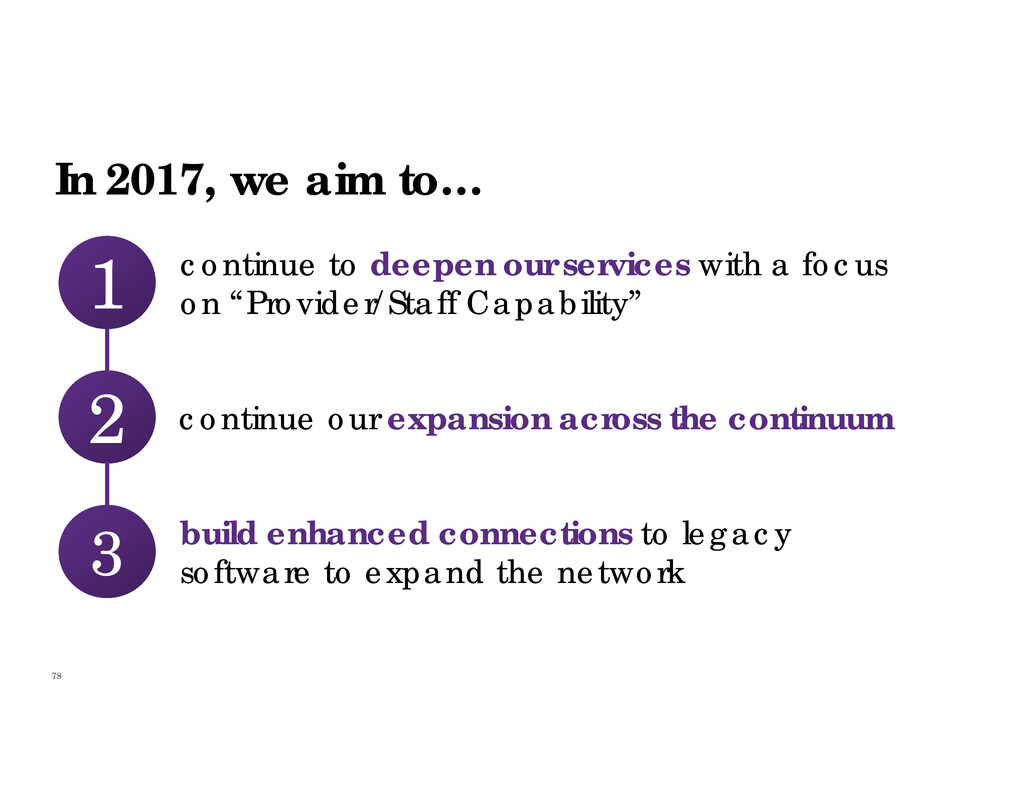
78 continue our expansion across the continuum2 continue to deepen our services with a focus on “Provider/Staff Capability”1 build enhanced connections to legacy software to expand the network3 In 2017, we aim to…
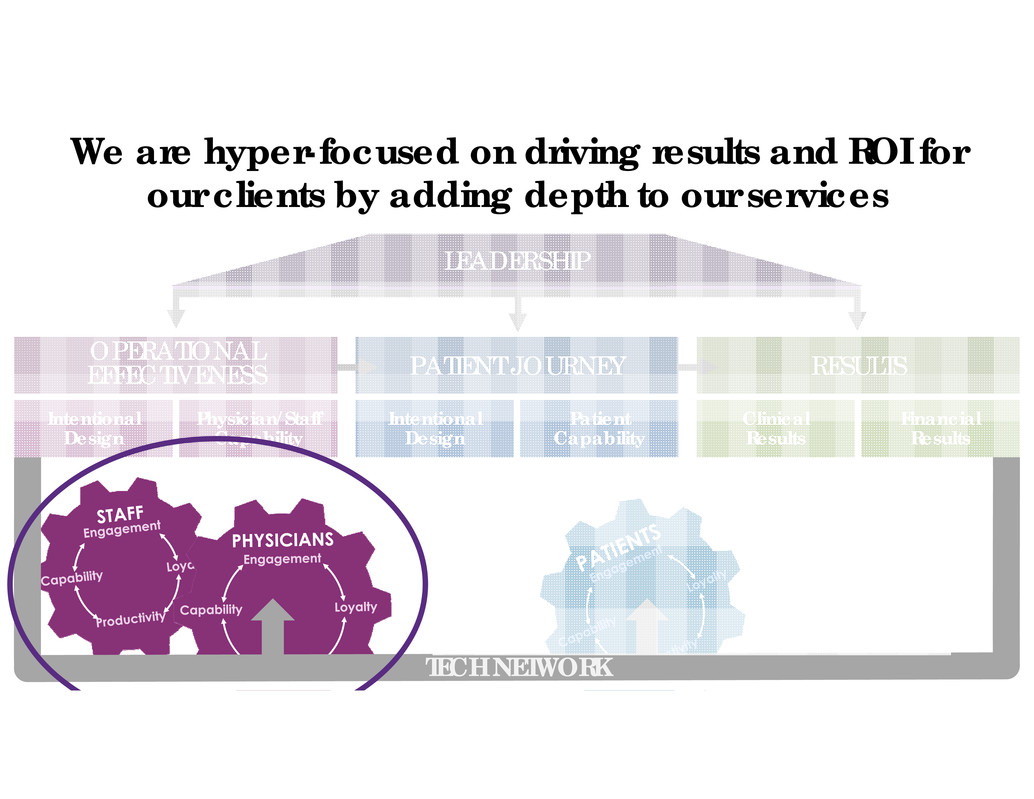
79 We are hyper-focused on driving results and ROI for our clients by adding depth to our services RESULTS Clinical Results Financial Results OPERATIONAL EFFECTIVENESS Intentional Design Physician/Staff Capability PATIENT JOURNEY Intentional Design Patient Capability TECH NETWORK LEADERSHIP
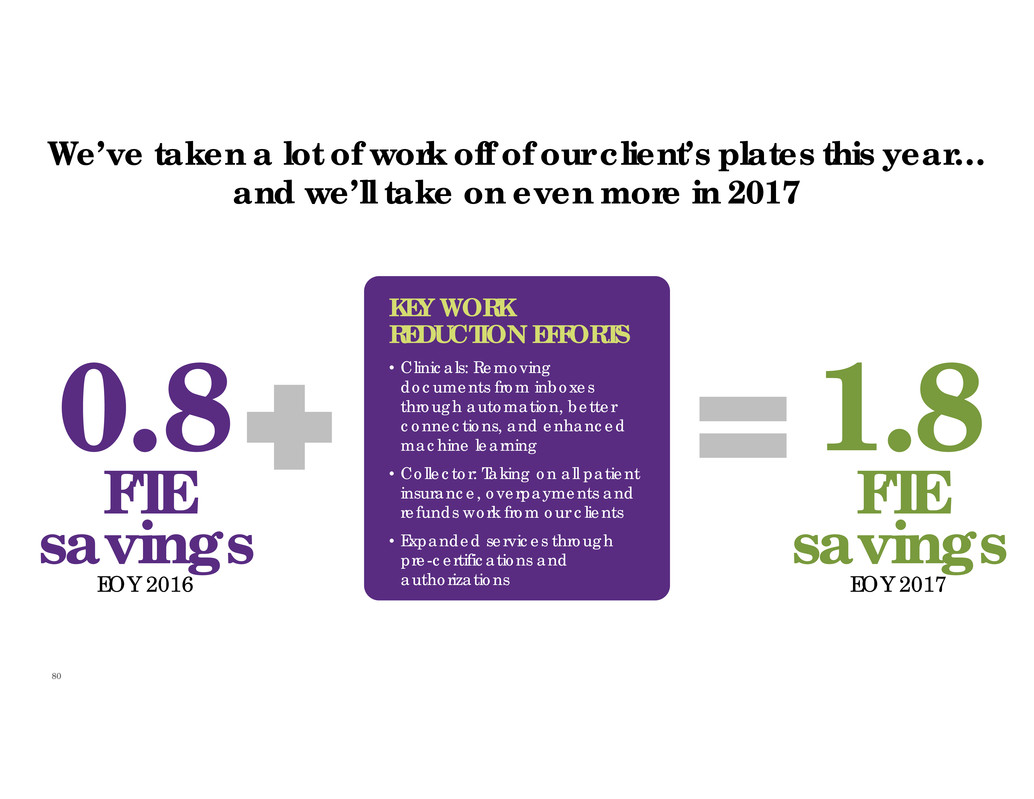
80 We’ve taken a lot of work off of our client’s plates this year… and we’ll take on even more in 2017 0.8 FTE savings EOY 2016 KEY WORK REDUCTION EFFORTS • Clinicals: Removing documents from inboxes through automation, better connections, and enhanced machine learning • Collector: Taking on all patient insurance, overpayments and refunds work from our clients • Expanded services through pre-certifications and authorizations 1.8 FTE savings EOY 2017
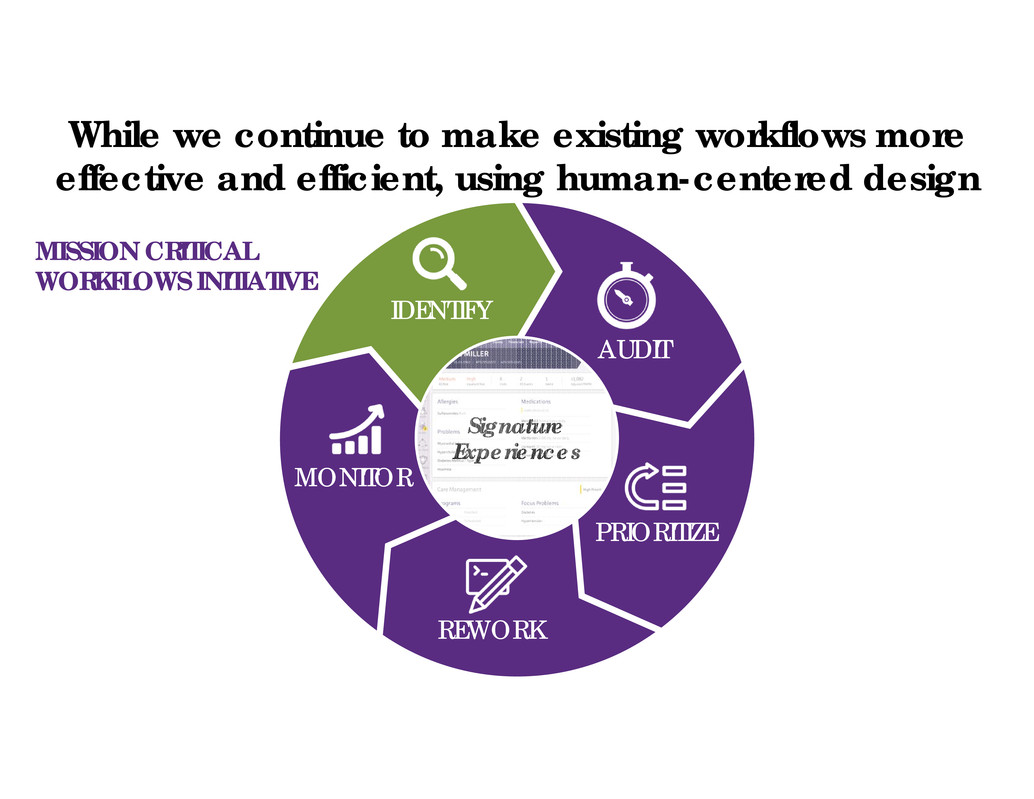
81 AUDIT PRIORITIZE REWORK MONITOR Signature Experiences While we continue to make existing workflows more effective and efficient, using human-centered design IDENTIFY MISSION CRITICAL WORKFLOWS INITIATIVE

82 continue our expansion across the continuum2 continue to deepen our services with a focus on “Provider/Staff Capability”1 build enhanced connections to legacy software to expand the network3 In 2017, we aim to…
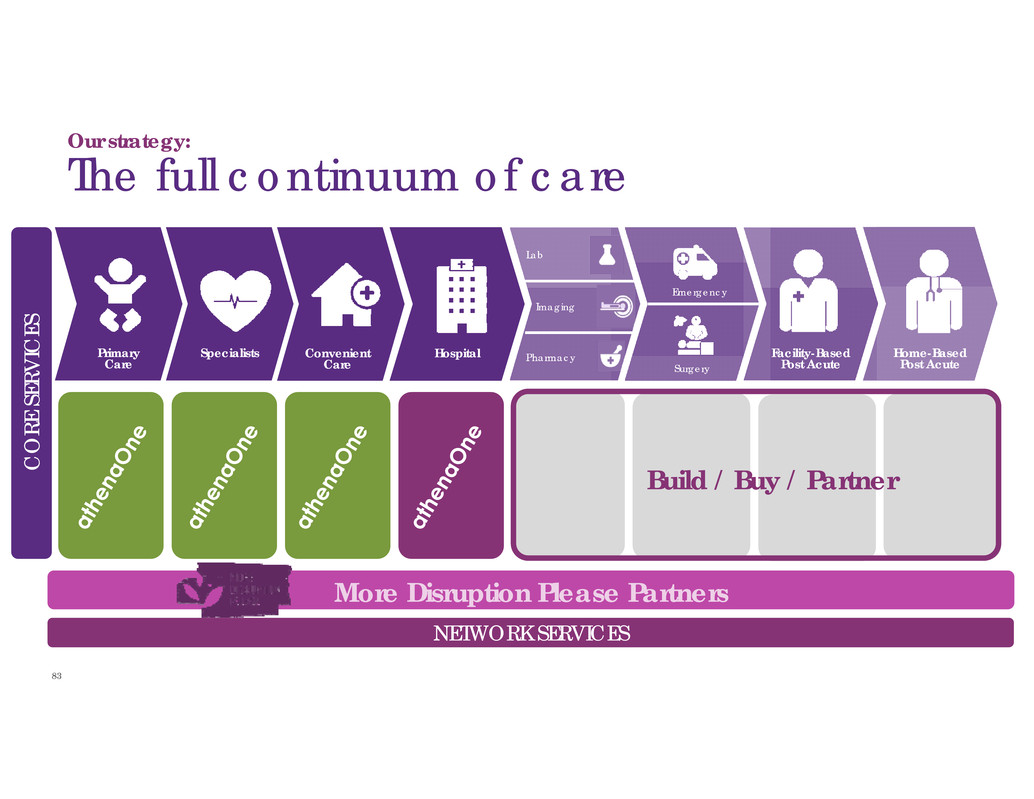
83 Our strategy: The full continuum of care Primary Care Specialists Convenient Care Hospital Lab Imaging Pharmacy Emergency Surgery Home-Based Post Acute Facility-Based Post Acute NETWORK SERVICES Build / Buy / Partner More Disruption Please Partners C O R E S E R V I C E S
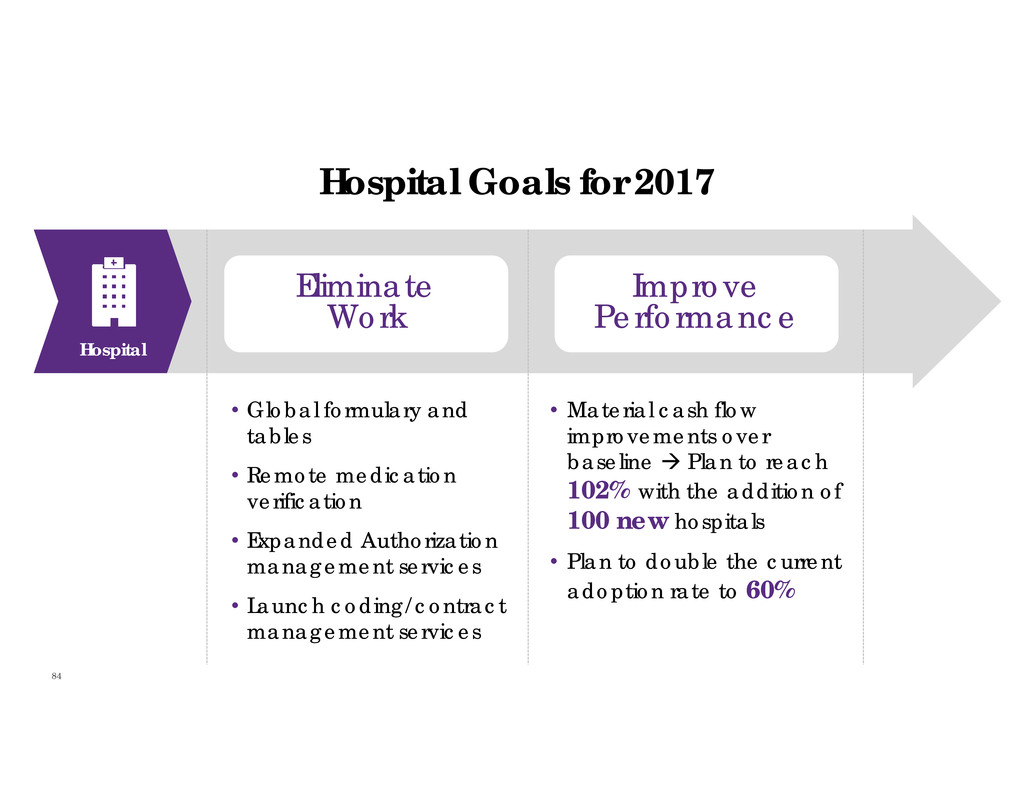
84 Hospital Eliminate Work Improve Performance • Global formulary and tables • Remote medication verification • Expanded Authorization management services • Launch coding/contract management services • Material cash flow improvements over baseline Plan to reach 102% with the addition of 100 new hospitals • Plan to double the current adoption rate to 60% Hospital Goals for 2017

Pharmacy Dining LabED Radiology Med-Surg Floor Surgery Physical Therapy Outpatient Services Labor & Delivery The hospital represents various ancillaries & specialties inside 4 walls • <$1B market but rapidly growing • Many still on paper T-sheets • 323 hospitals operate 387 freestanding EDs (76% growth since 2008) • Another 172 are independent Freestanding EDs Imaging Centers • $100B+ market, $1-3B TAM • Rising consolidation due to pressure from reimbursement cuts • 6,740 outpatient diagnosis imaging centers • Another 2,421 are independent Ambulatory Surgery Centers • $24B market, $1-1.5B TAM • 85% facilities still on paper • 6,300+ parent accounts • 12,500+ child sites in the U.S. Standalone Lab • $75B+ market, $1-3B TAM • Reimbursement shifts toward FFV are pressuring lab spend • >135,000 labs nationwide • 121,000 are in physician offices Continuing our Long History of Adjacency Expansion 85
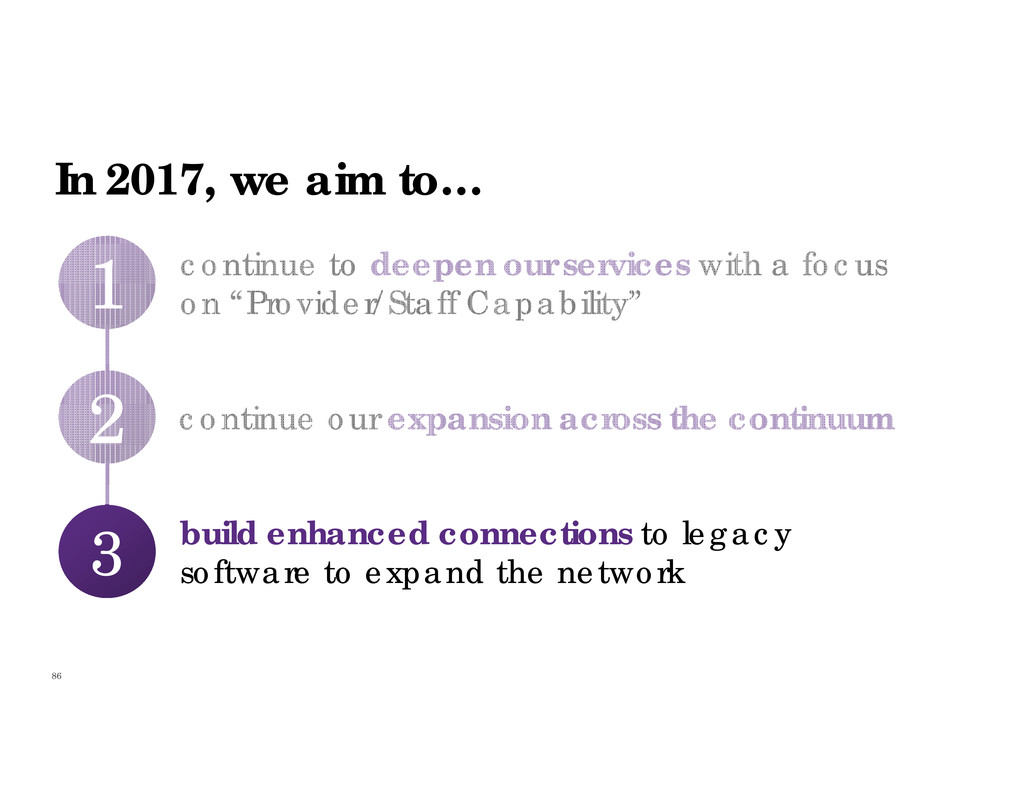
86 continue our expansion across the continuum2 continue to deepen our services with a focus on “Provider/Staff Capability”1 build enhanced connections to legacy software to expand the network3 In 2017, we aim to…

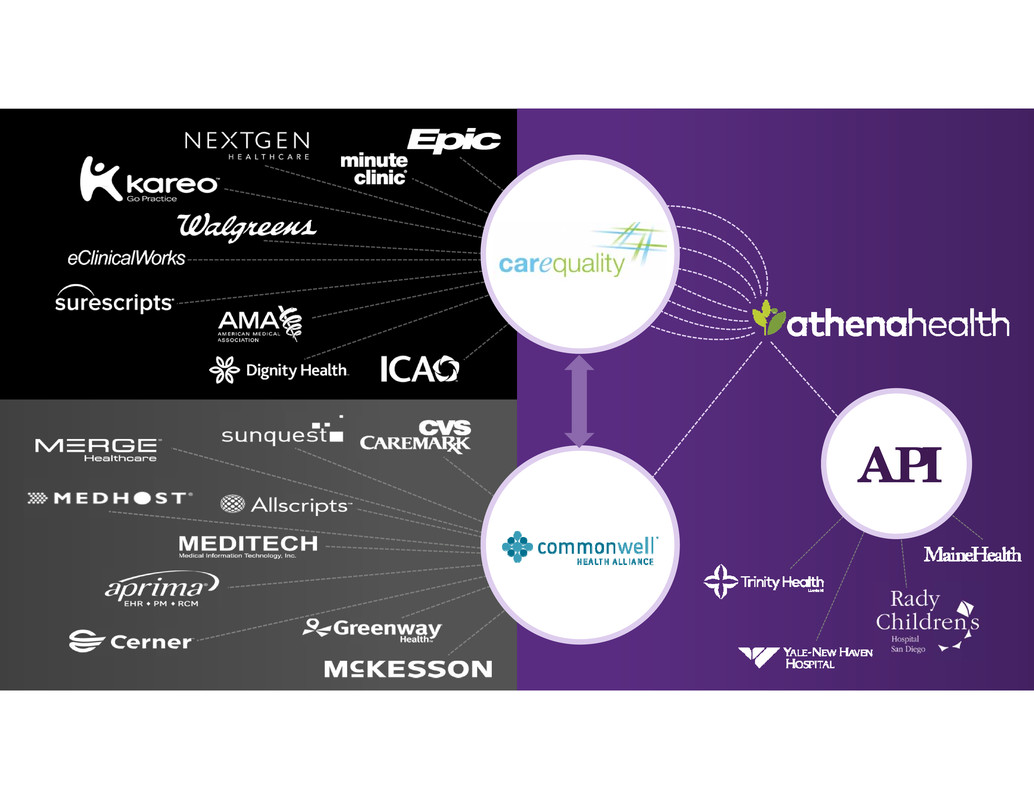
87 Note: 1) athena & Epic reported on organization level while Cerner is reported on a facility level; 2) Cerner numbers are self-reported; and 3) Cerner & Epic include ambulatory sites *Cerner end of year numbers are for February 2017. We are now managing coverage across the continuum and have grown coverage dramatically during 2016 Year Start Via Carequality Via CommonWell 311 2217 0 287 0 500 1000 1500 2000 2500 3000 Connected Clients Number of clients athena can query today for Patient Record Sharing Known Clients Number of known clients eligible for participation in Patient Record Sharing Number of known clients eligible for participation in Patient Record Sharing (on Streamlined)

88 Note: 1) athena & Epic reported on organization level while Cerner is reported on a facility level; 2) Cerner numbers are self-reported; and 3) Cerner & Epic include ambulatory sites *Cerner end of year numbers are for February 2017. We are now managing coverage across the continuum and have grown coverage dramatically during 2016 Connected Clients Number of clients athena can query today for Patient Record Sharing Known Clients Number of known clients eligible for participation in Patient Record Sharing Number of known clients eligible for participation in Patient Record Sharing (on Streamlined) Year Start Year End Via Carequality Via CommonWell 330 2853 152 1429 0 500 1000 1500 2000 2500 3000 311 2217 0 287
API

90 CLOSING THOUGHTS????? Harnessing our enhanced data accessibility into meaningful, action-oriented, network-enabled experiences

91 The Network is the Growth Engine for the Future Jonathan Porter Network Services
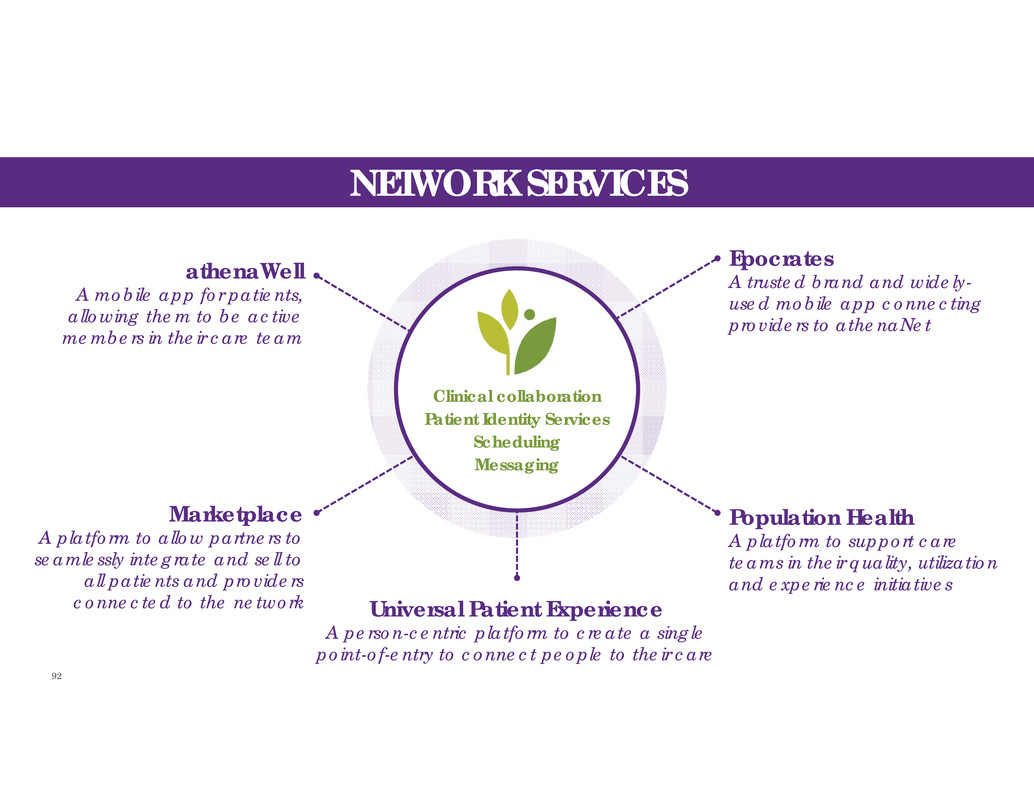
92 NETWORK SERVICES Epocrates A trusted brand and widely- used mobile app connecting providers to athenaNet Population Health A platform to support care teams in their quality, utilization and experience initiatives Universal Patient Experience A person-centric platform to create a single point-of-entry to connect people to their care athenaWell A mobile app for patients, allowing them to be active members in their care team Marketplace A platform to allow partners to seamlessly integrate and sell to all patients and providers connected to the network Clinical collaboration Patient Identity Services Scheduling Messaging

93
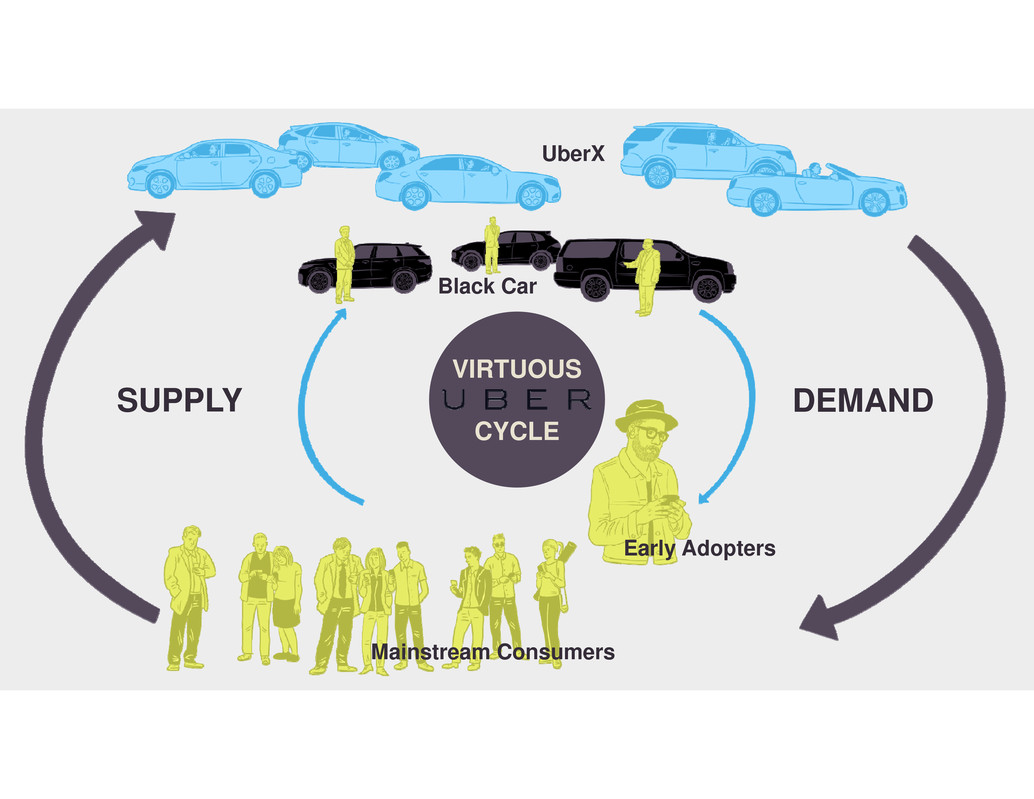
94 VIRTUOUS CYCLE DEMANDSUPPLY Black Car UberX Early Adopters Mainstream Consumers
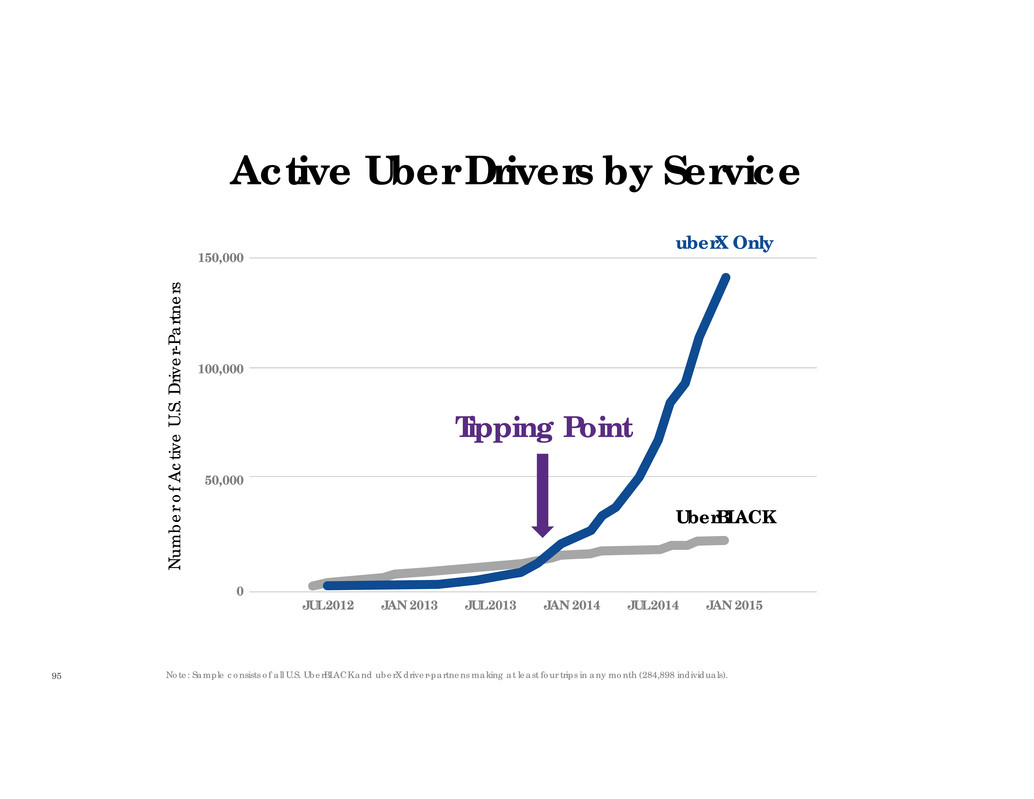
95 Note: Sample consists of all U.S. UberBLACK and uberX driver-partnens making at least four trips in any month (284,898 individuals). Active Uber Drivers by Service N u m b e r o f A c t i v e U . S . D r i v e r - P a r t n e r s 150,000 100,000 50,000 0 JUL 2012 JAN 2013 JUL 2013 JAN 2014 JUL 2014 JAN 2015 uberX Only UberBLACK Tipping Point

96 0 10,000,000 20,000,000 30,000,000 40,000,000 50,000,000 60,000,000 70,000,000 80,000,000 90,000,000 0.00% 5.00% 10.00% 15.00% 20.00% 25.00% Patient Overlap by Quarter Patient Records Overlap • Patient Overlap = % of patient records for which the patient is present in multiple contexts • Unique patient is identified by DOB, First Initial, Last Name, Sex • Each data point represents set of patient records in athenaNet on first day of that Quarter Patients shared across clients are reaching critical mass Source: athenaNet data 2001 2002 2003 2004 2005 2006 2007 2008 2009 2010 2011 2012 2013 2014 2015 2016
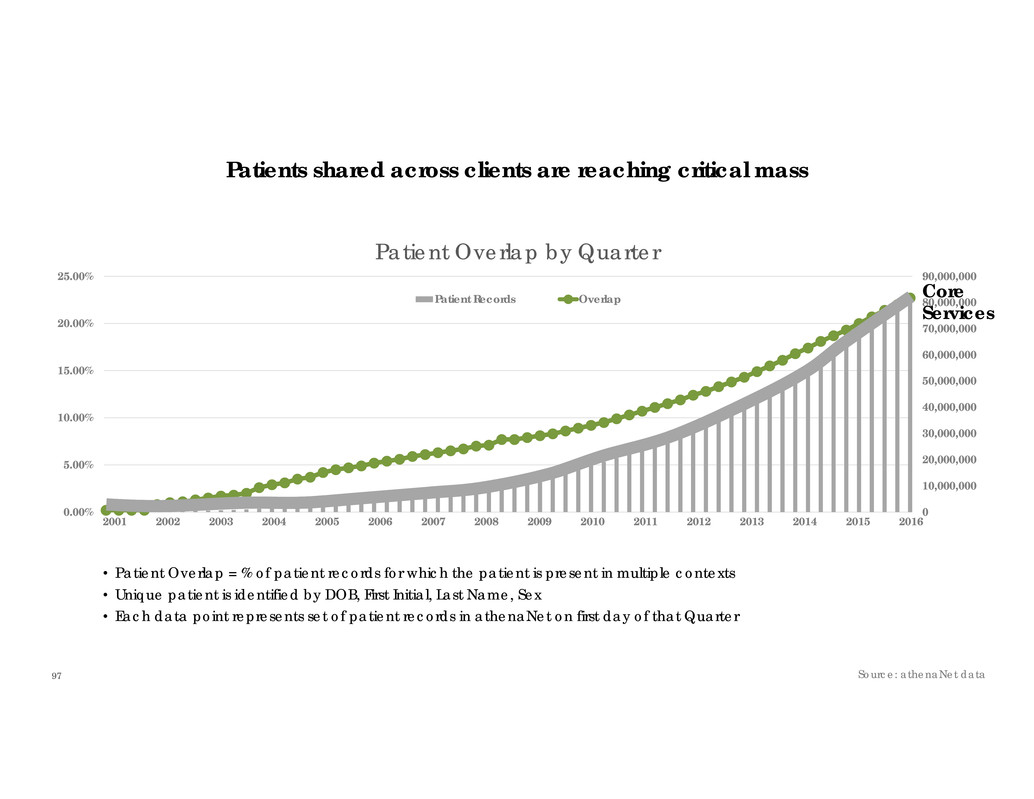
97 0 10,000,000 20,000,000 30,000,000 40,000,000 50,000,000 60,000,000 70,000,000 80,000,000 90,000,000 0.00% 5.00% 10.00% 15.00% 20.00% 25.00% Patient Overlap by Quarter Patient Records Overlap • Patient Overlap = % of patient records for which the patient is present in multiple contexts • Unique patient is identified by DOB, First Initial, Last Name, Sex • Each data point represents set of patient records in athenaNet on first day of that Quarter Patients shared across clients are reaching critical mass Source: athenaNet data 2001 2002 2003 2004 2005 2006 2007 2008 2009 2010 2011 2012 2013 2014 2015 2016 Core Services

98 Core Services 526.5K potential providers (Population health) 322.8K loosely connected providers (Epocrates) 85.5K providers on core services (athenaOne) Network Services TIME S I Z E O F T H E N E T W O R K Tipping Point 83.4M patient records on the network
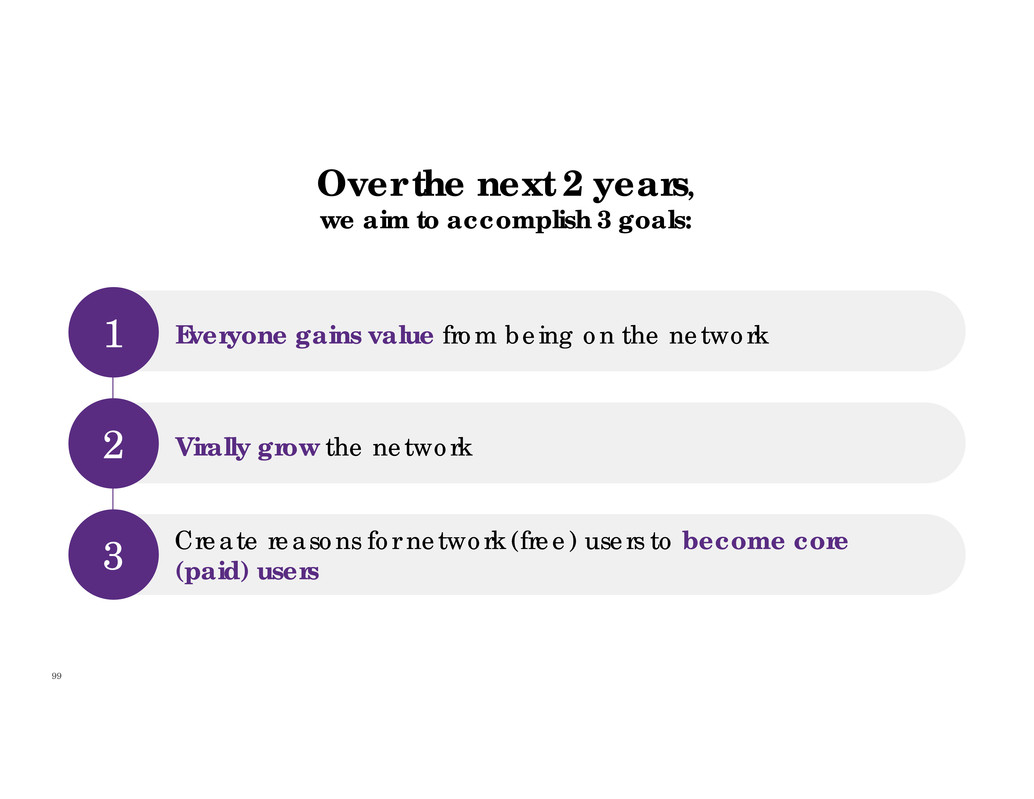
99 Over the next 2 years, we aim to accomplish 3 goals: Everyone gains value from being on the network Virally grow the network Create reasons for network (free) users to become core (paid) users 2 1 3

100 Everyone gains value from being on the network1
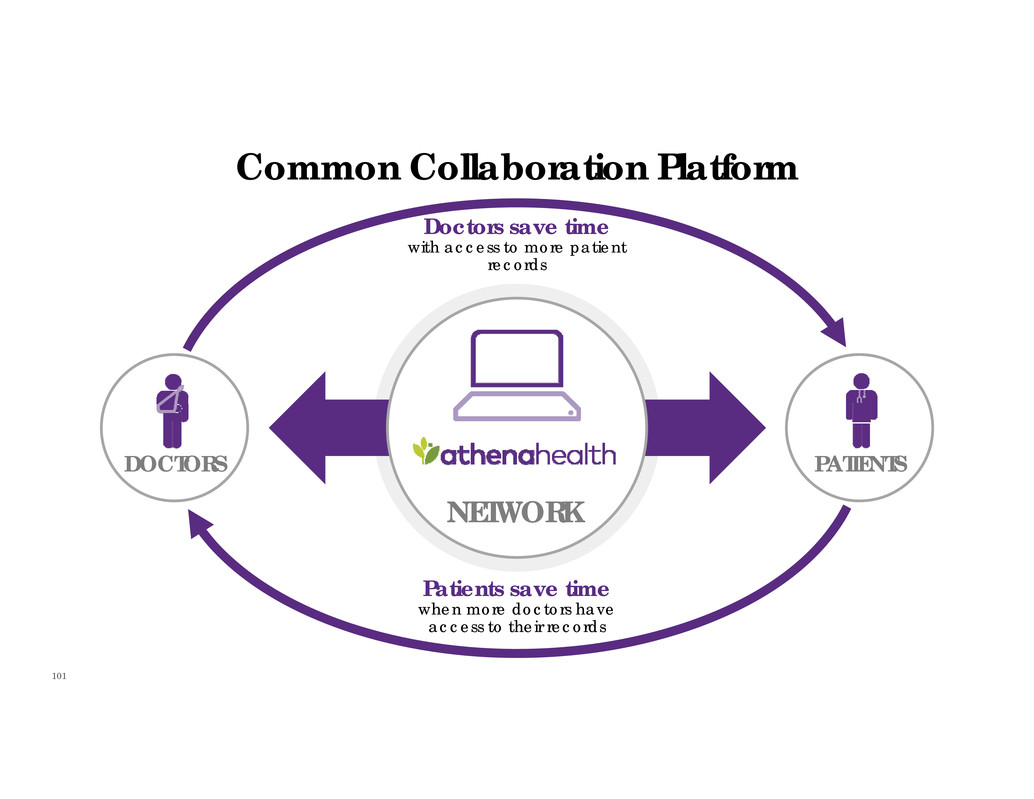
101 Common Collaboration Platform NETWORK PATIENTSDOCTORS Doctors save time with access to more patient records Patients save time when more doctors have access to their records
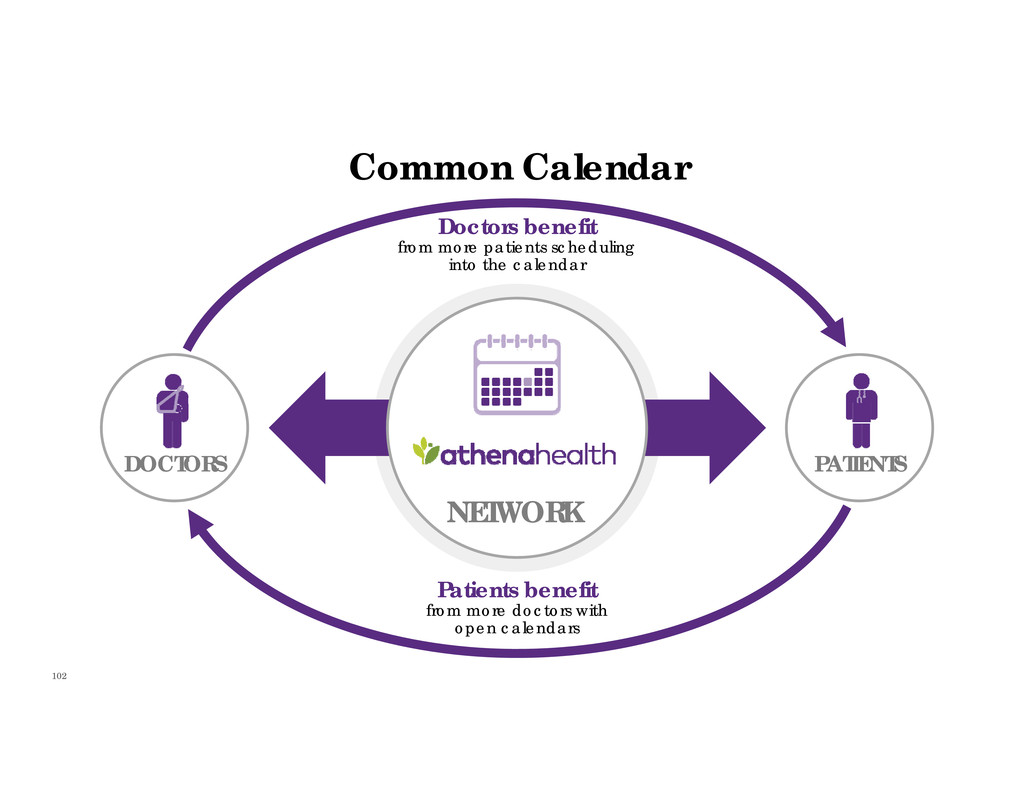
102 Common Calendar NETWORK PATIENTSDOCTORS Doctors benefit from more patients scheduling into the calendar Patients benefit from more doctors with open calendars

103 More Disruption Please NETWORK APPSDOCTORS Doctors benefit from a more diverse and specialized set of apps App providers benefit from more doctors on the network
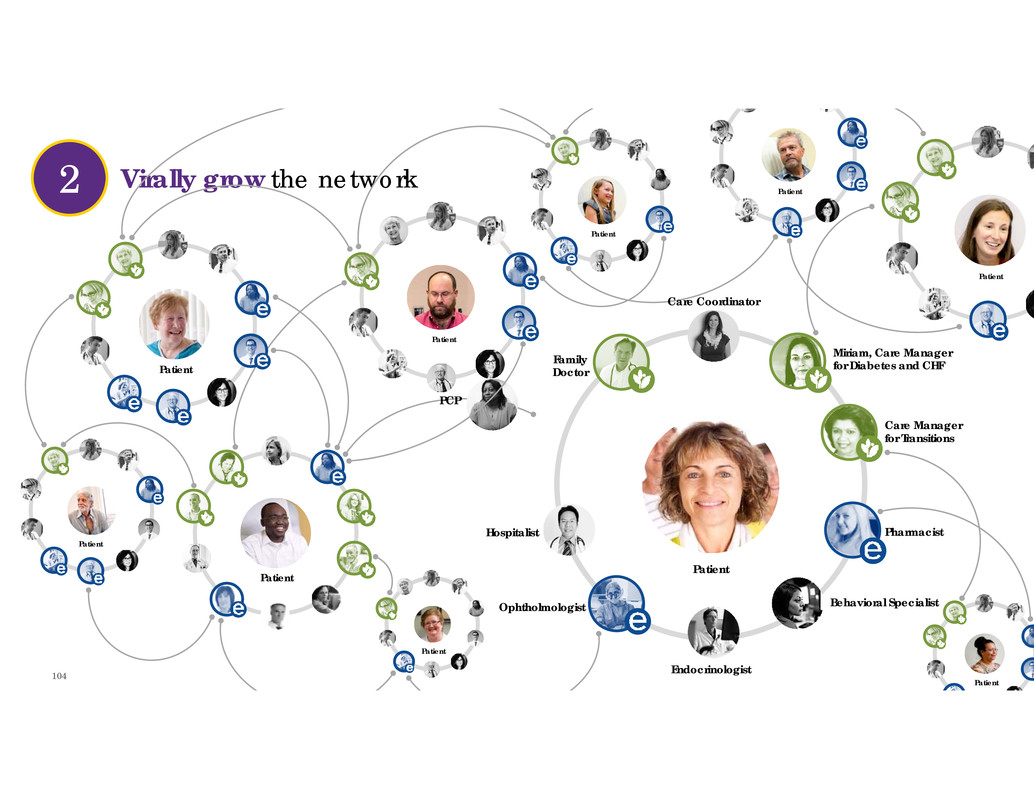
104 Virally grow the network Care Coordinator Family Doctor Hospitalist Ophtholmologist Endocrinologist Behavioral Specialist Pharmacist Care Manager for Transitions Patient Miriam, Care Manager for Diabetes and CHF 2 Patient Patient PCP Patient Patient Patient Patient Patient Patient Patient

105 Create reasons for network (free) users to become core (paid) users 3
106 The Network is the Platform Prakash Khot Chief Technology Officer

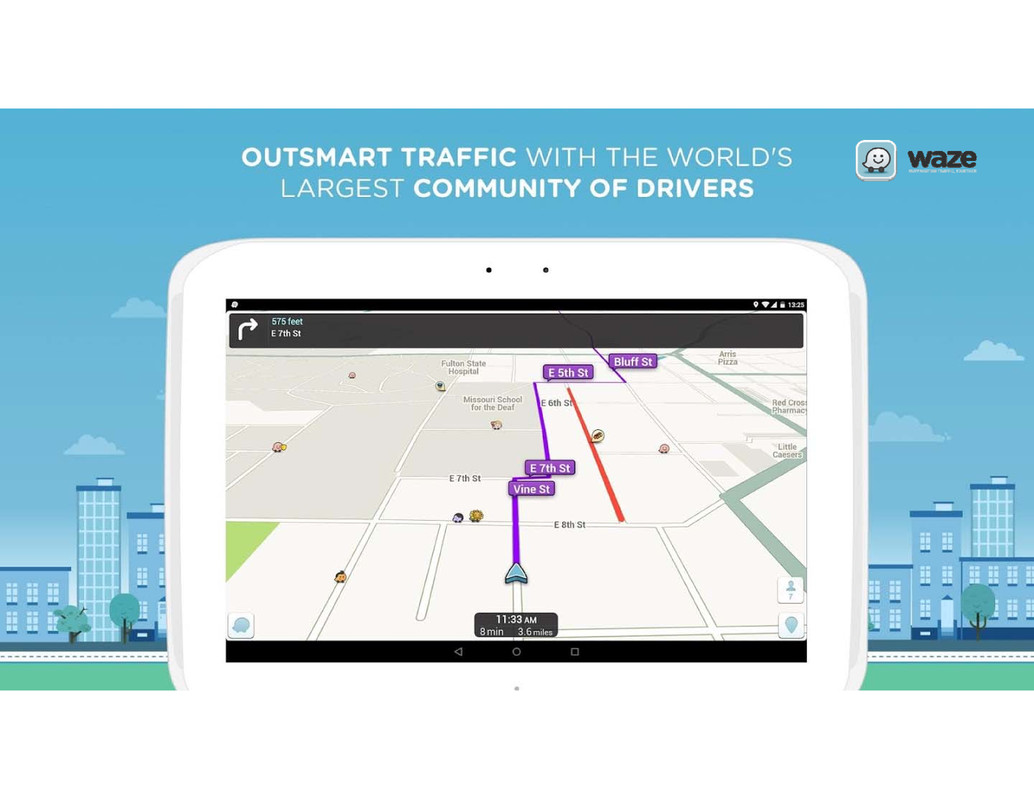
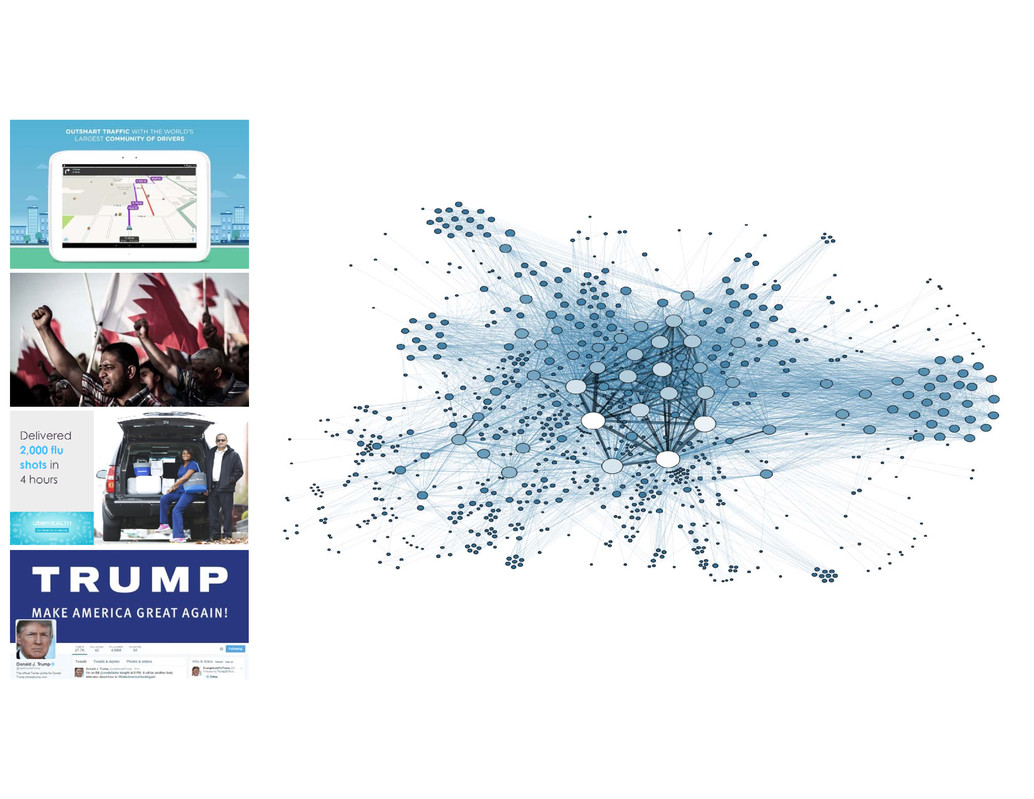
107 “Facebook is pretty much the GPS for this revolution. Without the street there’s no revolution, but add Facebook to the street and you get real potential.” Foetus Chief Technology Officer Tazrik: Tunisian street resistance network

108
109

110 Belfast? Show short video. Delivered 2,000 flu shots in 4 hours
111

112

113
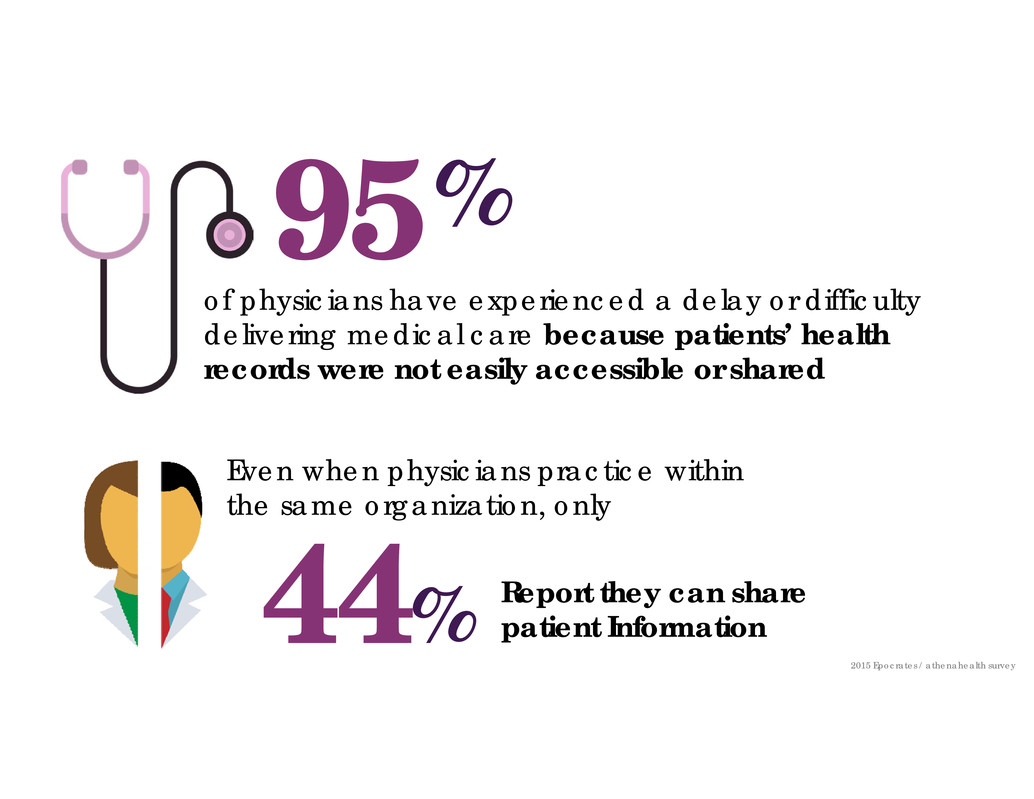
114 of physicians have experienced a delay or difficulty delivering medical care because patients’ health records were not easily accessible or shared 95% Report they can share patient Information44% Even when physicians practice within the same organization, only 2015 Epocrates / athenahealth survey

115 296K total interfaces 83.4M patient records 59K pharmacy endpoints 9% no-show rate $22B collections posted per year 142M patient visits per year 166M claims submitted per year 9K lab and imaging endpoints 5B+ electronic transactions per year Source: athenahealth data as of Q3 2016 or TTM (Q4 2015 – Q3 2016)

116 OUR VISION: Build the information backbone that makes healthcare work as it should.
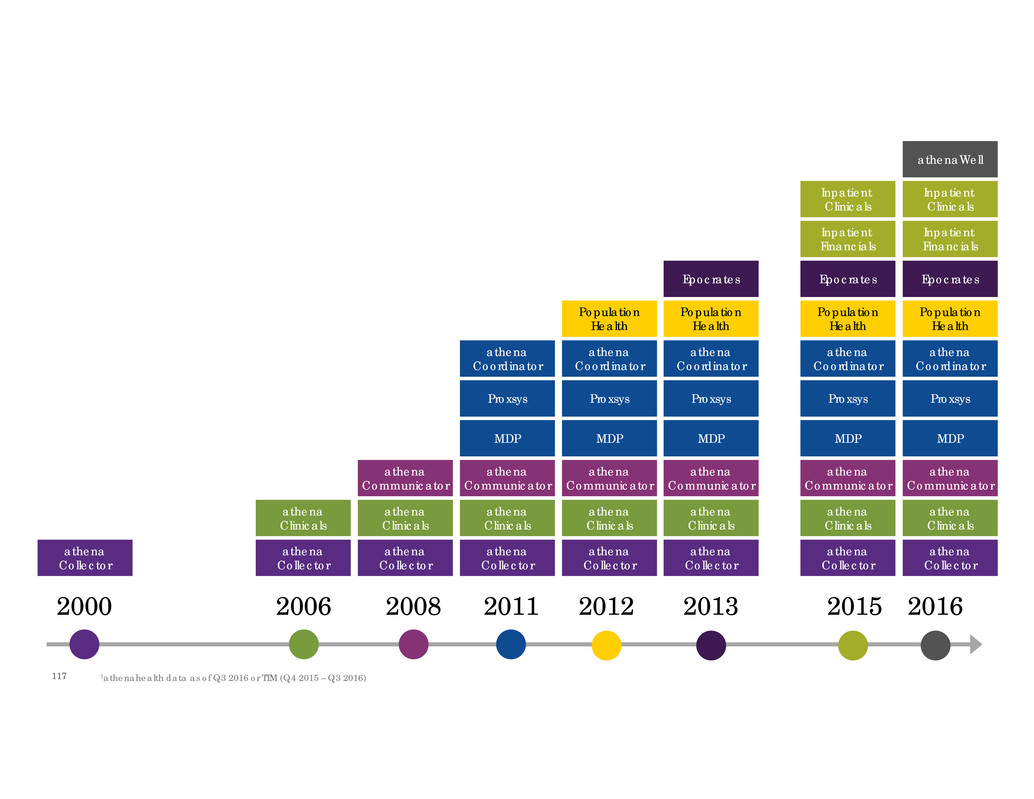
117 2000 20082006 2011 2012 2013 20162015 athena Collector athena Clinicals athena Communicator MDP Proxsys Population Health Epocrates athena Coordinator Inpatient Clinicals Inpatient Financials athena Collector athena Collector athena Collector athena Collector athena Collector athena Collector athena Collector athena Clinicals athena Clinicals athena Clinicals athena Clinicals athena Clinicals athena Clinicals athena Communicator athena Communicator athena Communicator athena Communicator athena Communicator MDP Proxsys athena Coordinator MDP Proxsys athena Coordinator MDP Proxsys athena Coordinator MDP Proxsys athena Coordinator Population Health Population Health Population Health Epocrates Epocrates Inpatient Clinicals Inpatient Financials athenaWell 1athenahealth data as of Q3 2016 or TTM (Q4 2015 – Q3 2016)

118 2000 20082006 2011 2012 2013 20162015 athena Collector athena Clinicals athena Communicator MDP Proxsys Population Health Epocrates athena Coordinator Inpatient Clinicals Inpatient Financials athena Collector athena Collector athena Collector athena Collector athena Collector athena Collector athena Collector athena Clinicals athena Clinicals athena Clinicals athena Clinicals athena Clinicals athena Clinicals athena Communicator athena Communicator athena Communicator athena Communicator athena Communicator MDP Proxsys athena Coordinator MDP Proxsys athena Coordinator MDP Proxsys athena Coordinator MDP Proxsys athena Coordinator Population Health Population Health Population Health Epocrates Epocrates Inpatient Clinicals Inpatient Financials athenaWell 2007 12K providers $2.7B collections 22.6M claims 6.5M patients 20161 85K providers $22B colle tions 166M claims 83.4M patients 1athenahealth data as of Q3 2016 or TTM (Q4 2015 – Q3 2016)

119

120
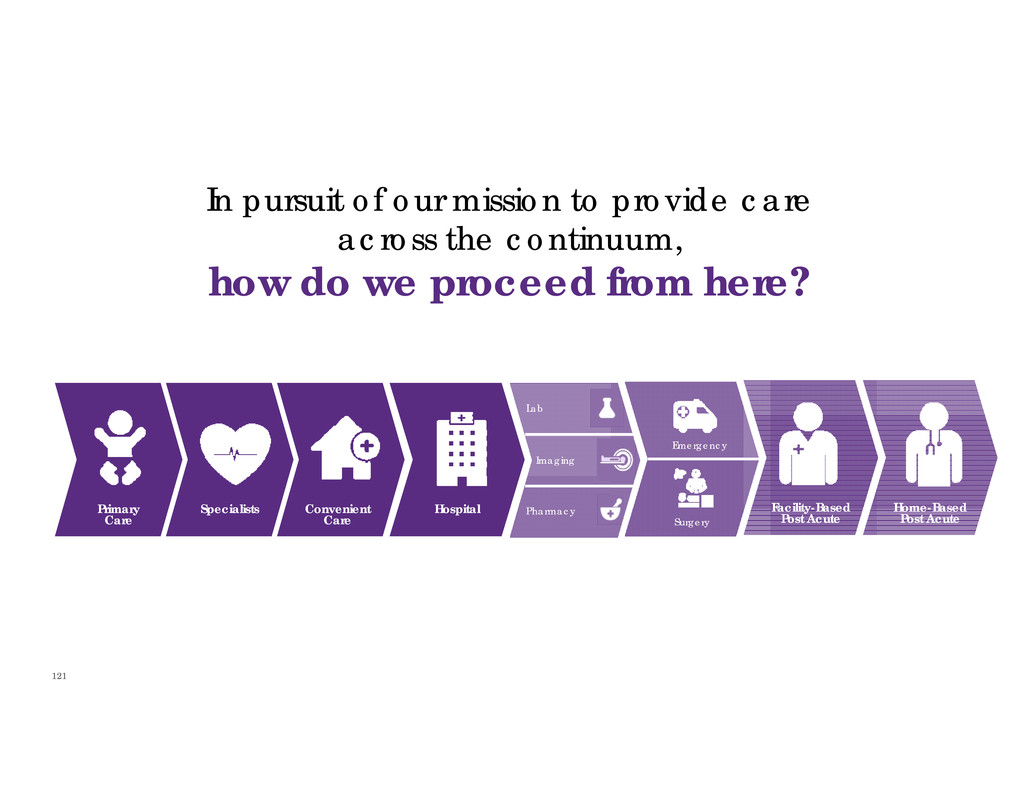
121 Primary Care Specialists Convenient Care Hospital Lab Imaging Pharmacy Emergency Surgery Home-Based Post Acute Facility-Based Post Acute In pursuit of our mission to provide care across the continuum, how do we proceed from here?
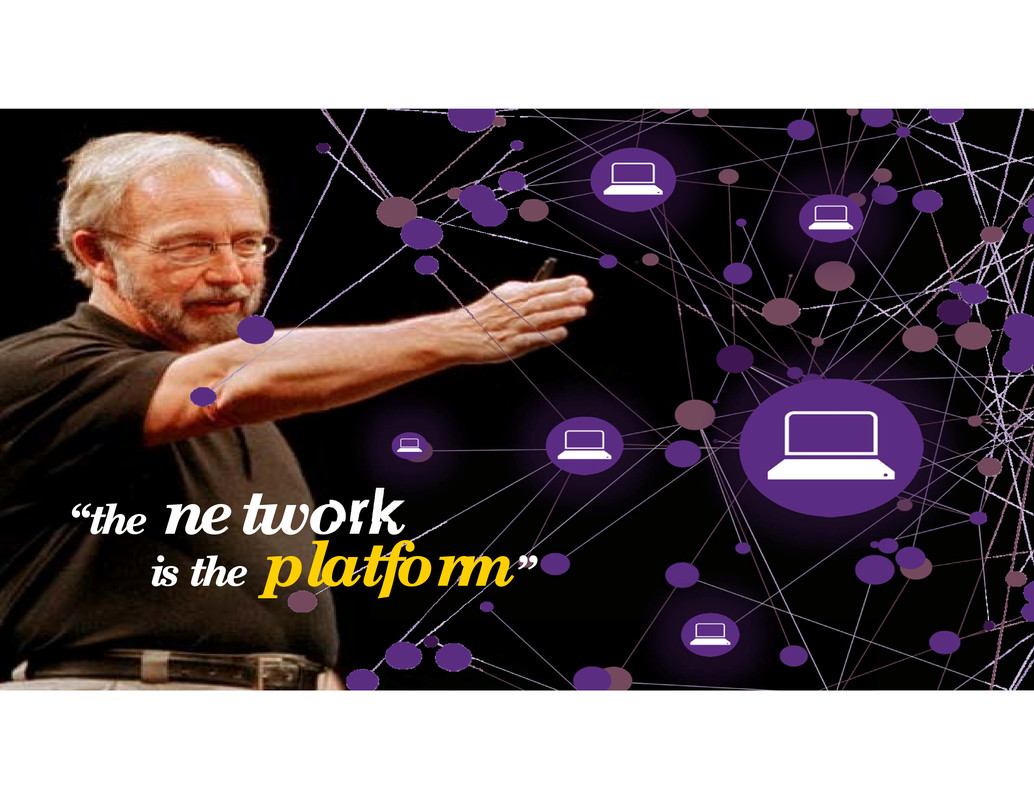
122 “the network is the platform”

123

124

125
126
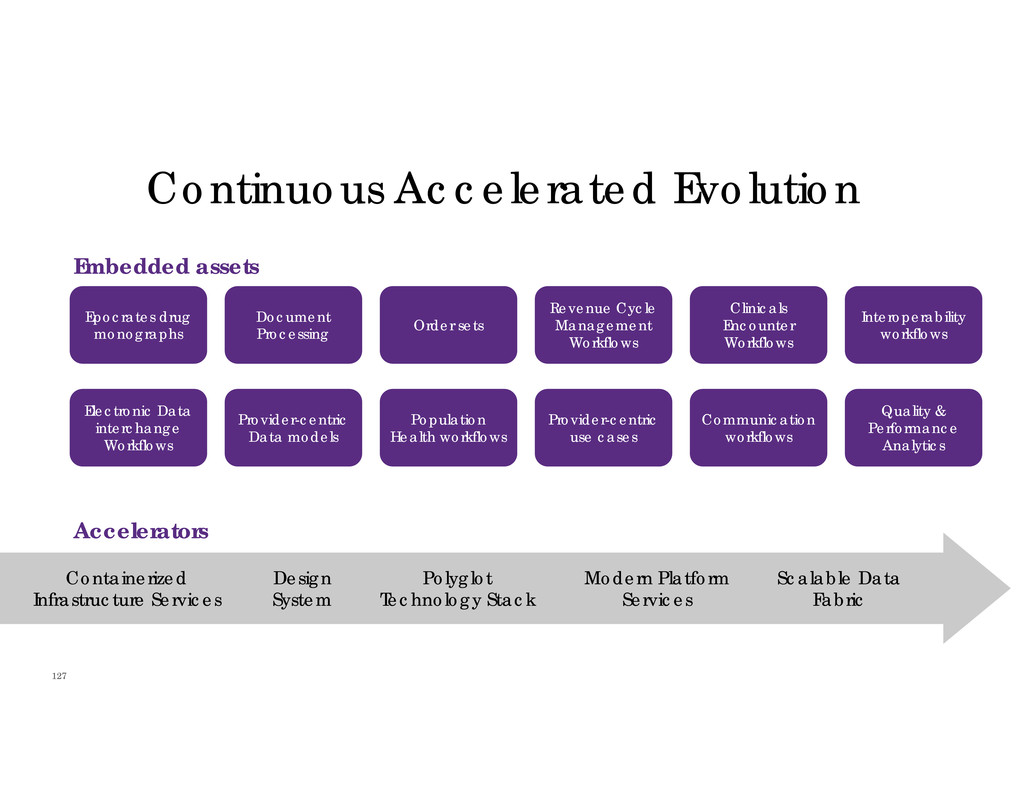
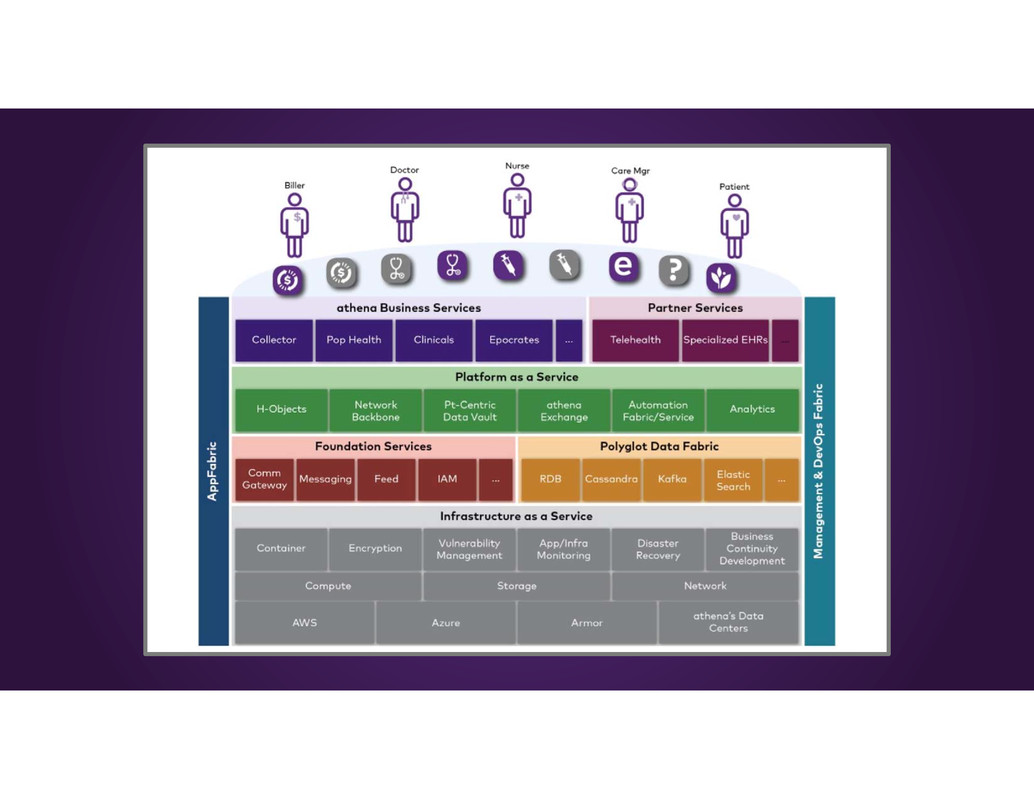
127 Embedded assets Continuous Accelerated Evolution Epocrates drug monographs Document Processing Order sets Revenue Cycle Management Workflows Electronic Data interchange Workflows Provider-centric Data models Population Health workflows Provider-centric use cases Clinicals Encounter Workflows Interoperability workflows Communication workflows Quality & Performance Analytics Accelerators Containerized Infrastructure Services Design System Polyglot Technology Stack Modern Platform Services Scalable Data Fabric

128

129 1 Migrate to microservices architecture 2 Adopt mobile and social, purpose-built apps 3 Adopt a progressive Agile culture and process 4 Complement private cloud with public cloud 5 Adoption of open source technologies to build new capabilities 6 Enable developers to adopt choice of programming languages and frameworks 7 Test-driven development 8 Adopt a container-based deployment architecture 9 Evolve towards a true bottoms- up product and R&D culture 10 Sustained investment in platform
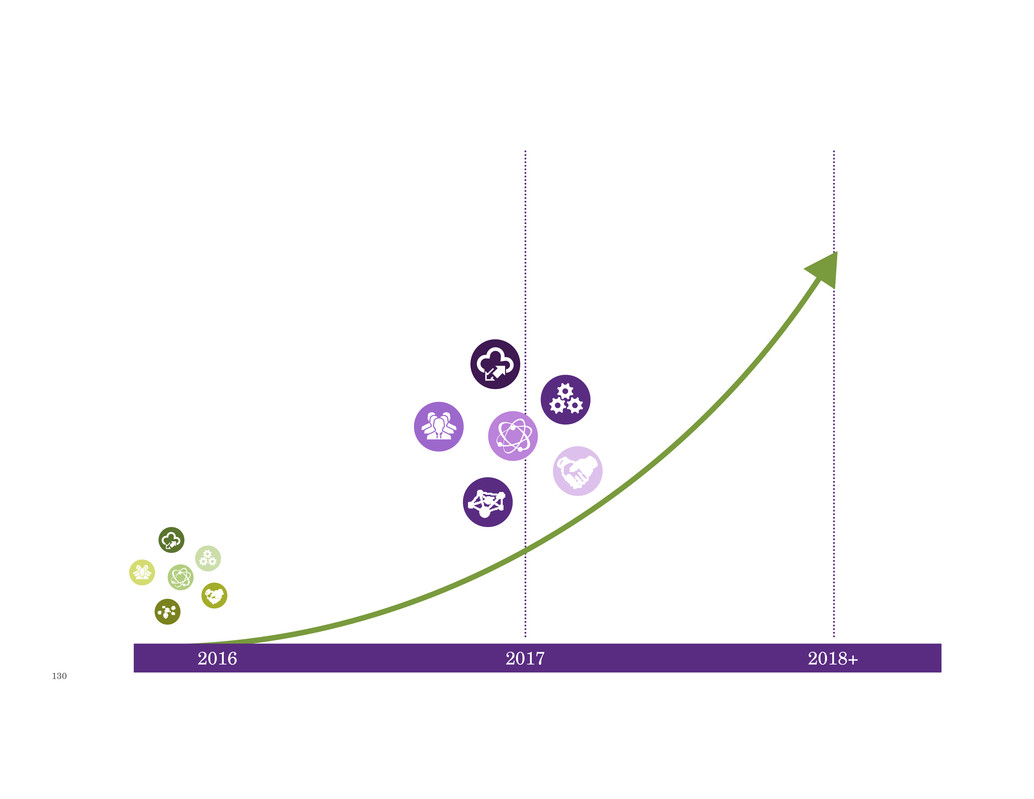
130 2016 2017 2018+

132 athenahealth Revolutionizing healthcare

Presentation Break

134 Client Panel Discussion Stephen Kahane, M.D., M.S. Client Organization

Client Panel Joseph Marchant Chief Executive Officer Bibb Medical Center Bryan Stiltz SVP, Physician Enterprise Adventist Health System Moderator Stephen Kahane, M.D., M.S., Client Organization Panelists Bruce Swartz SVP, Physician Integration Dignity Health Robert Brenner, M.D. SVP, Chief Physician Executive Valley Health System 135

Management Q&A
137 Closing Remarks Jonathan Bush Chairman & CEO
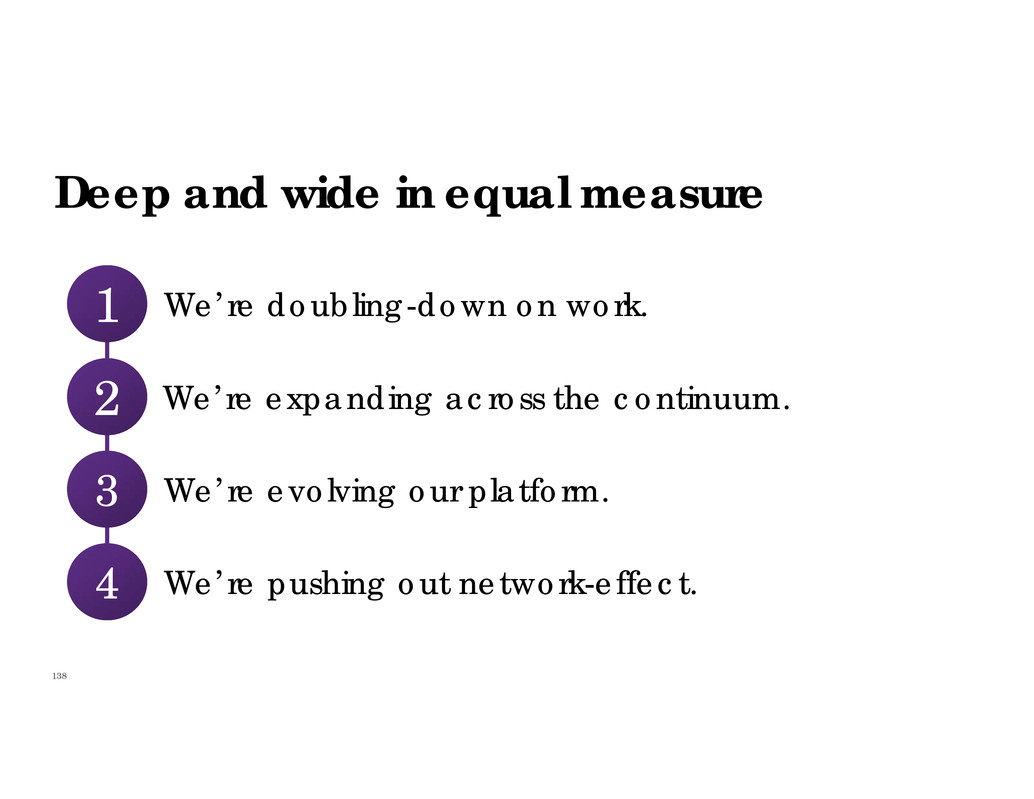
138 We’re expanding across the continuum.2 We’re doubling-down on work. 1 Deep and wide in equal measure We’re evolving our platform. 3 We’re pushing out network-effect.4

139

140 Who would have thought…

141 80 million landlines 101 million iPhone users

142 Source: 2016 STR, airbnb.com, hilton.com 769,000 ROOMS, 78 COUNTRIES 2.3 million ROOMS, 191COUNTRIES 95 YEARS TO BUILD 6 YEARS TO BUILD

143 US sales of apparel and accessories Source: ATLAS | Data: Cowen and Company Amazon Macy’s TJ Maxx Walmart Nordstrom $60 $50 $40 $30 $20 $10 $0 B I L L I O N S 2011 2012 2013 2014 2015 2016 2017 2018 2019 2020

144 Source: Citi Digital Strategy Team Time to reach 50 million users Telephone TV Internet Facebook Whatsapp 75 Years 13 Years 4 Years 3.5 Years 1.5 Years
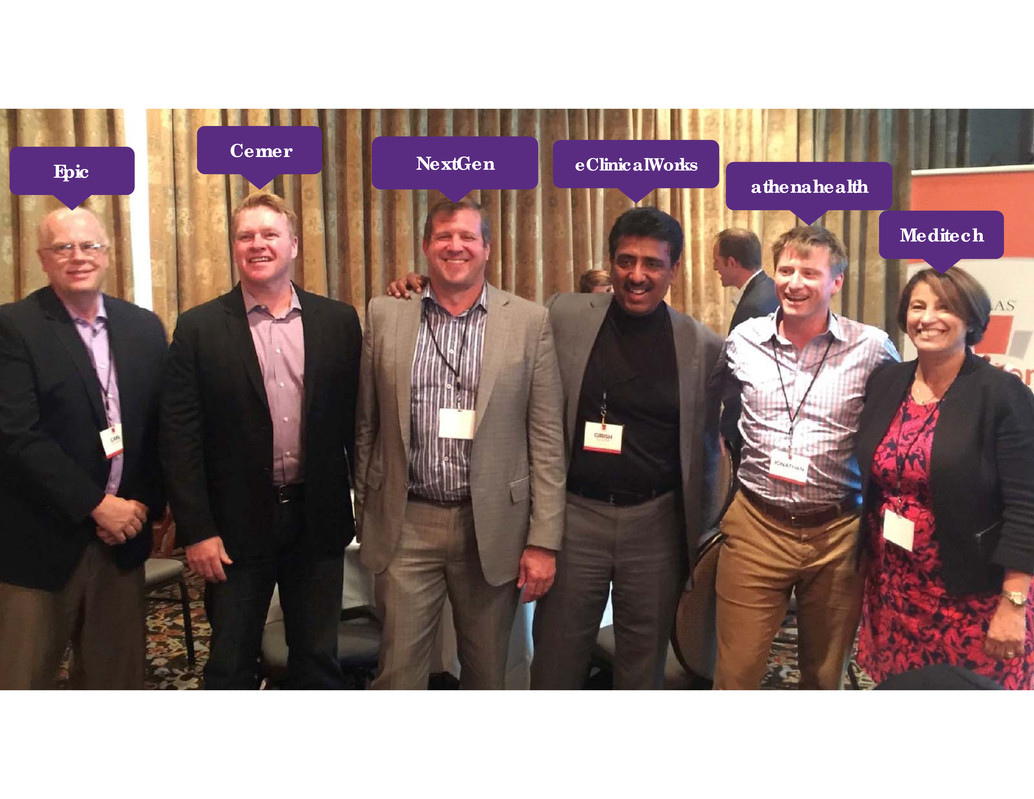
145 Epic Cerner NextGen eClinicalWorks athenahealth Meditech

146 Our rate of connection is growing at an accelerated pace. * Represents the number of unique patient records (claim or encounter) over the last 18 months 47M Patient records used* 24% 122K Connections 126% 55K providers received patient records from athenaNet 83%
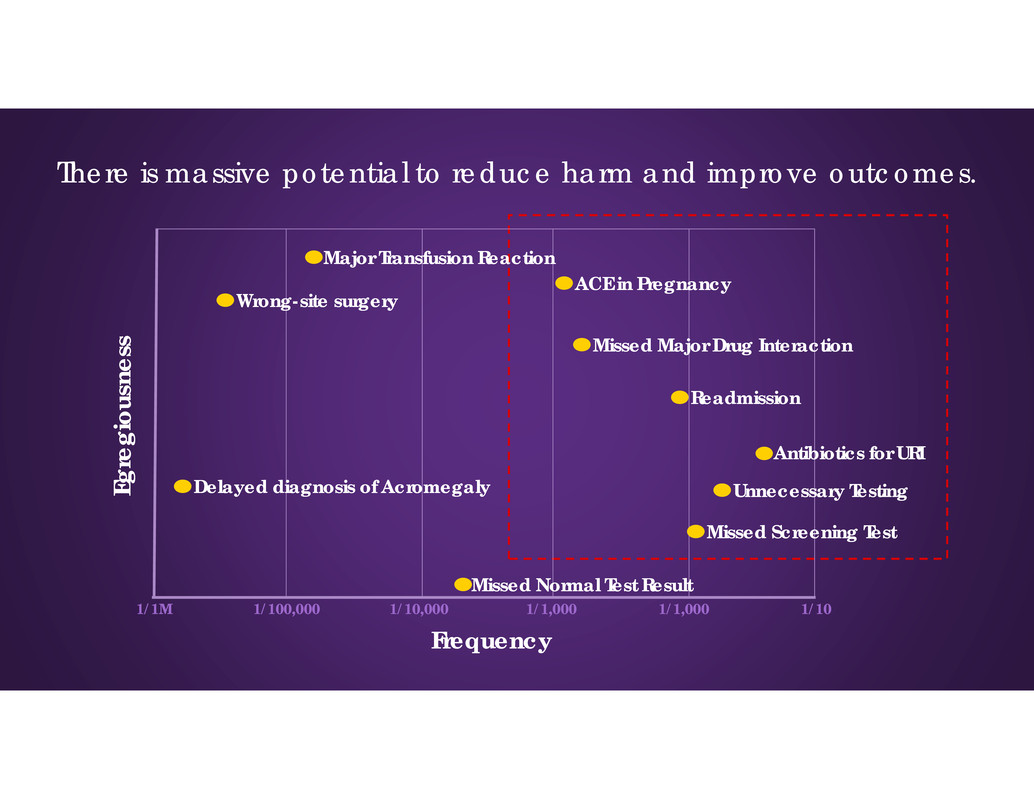
147 There is massive potential to reduce harm and improve outcomes. Readmission Frequency 1/1M 1/100,000 1/10,000 1/1,000 1/1,000 1/10 E g r e g i o u s n e s s Antibiotics for URI Unnecessary Testing Missed Screening Test Missed Major Drug Interaction ACE in Pregnancy Missed Normal Test Result Wrong-site surgery Major Transfusion Reaction Delayed diagnosis of Acromegaly

148

Please join us: • Lunch with Management • Nerve Center Tour
Thank You

Appendix
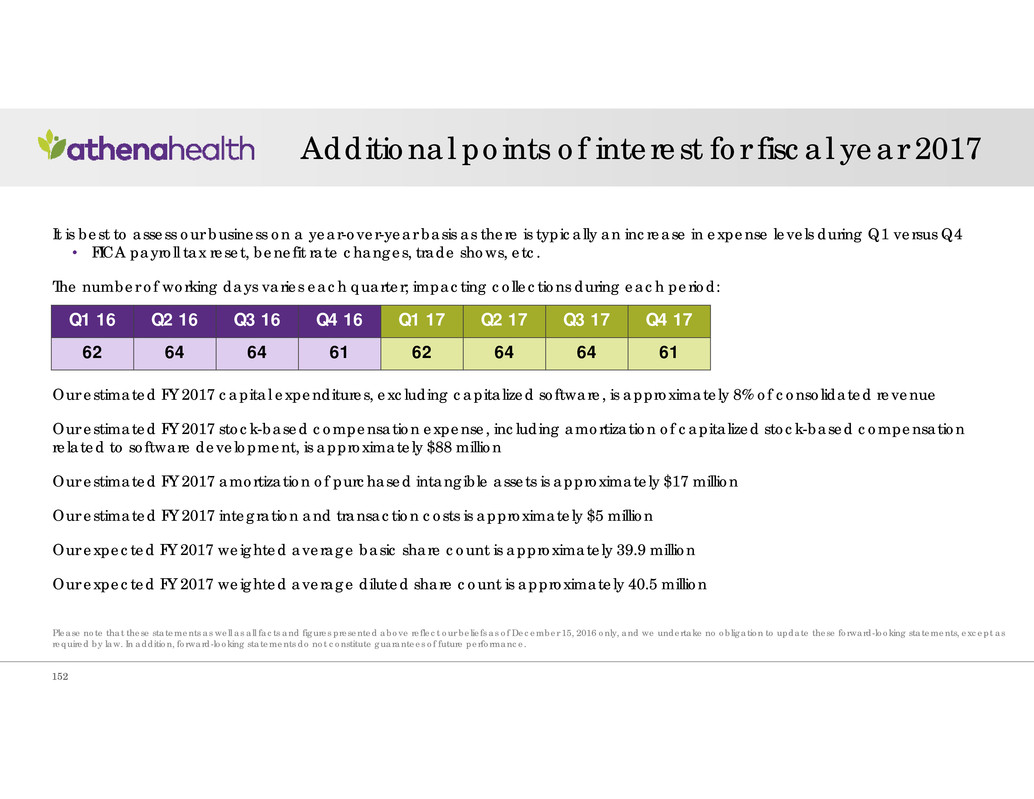
It is best to assess our business on a year-over-year basis as there is typically an increase in expense levels during Q1 versus Q4 • FICA payroll tax reset, benefit rate changes, trade shows, etc. The number of working days varies each quarter; impacting collections during each period: Our estimated FY 2017 capital expenditures, excluding capitalized software, is approximately 8% of consolidated revenue Our estimated FY 2017 stock-based compensation expense, including amortization of capitalized stock-based compensation related to software development, is approximately $88 million Our estimated FY 2017 amortization of purchased intangible assets is approximately $17 million Our estimated FY 2017 integration and transaction costs is approximately $5 million Our expected FY 2017 weighted average basic share count is approximately 39.9 million Our expected FY 2017 weighted average diluted share count is approximately 40.5 million Q1 16 Q2 16 Q3 16 Q4 16 Q1 17 Q2 17 Q3 17 Q4 17 62 64 64 61 62 64 64 61 Additional points of interest for fiscal year 2017 152 Please note that these statements as well as all facts and figures presented above reflect our beliefs as of December 15, 2016 only, and we undertake no obligation to update these forward-looking statements, except as required by law. In addition, forward-looking statements do not constitute guarantees of future performance.

Annual Bookings Annual Bookings is defined as the sum of the expected annualized recurring revenue from our athenahealth-branded services and the contracted value from our Epocrates-branded services; net of actual charge backs. Providers The number of providers, including physicians, that have rendered a service which generated a medical claim that was billed during the last 91 days on the athenaCollector platform. Examples of physicians include Medical Doctors and Doctors of Osteopathic Medicine. Examples of non-physician providers are Nurse Practitioners and Registered Nurses. Discharge Bed Days Discharge bed days is defined as the number of days a patient is hospitalized in an inpatient level of care during the quarter. The day of the admission, but not the day of discharge, is counted. If both admission and discharge occur on the same day, it is counted as one inpatient day. Covered Lives Covered lives on the network is defined as the quarterly average of the number of patients for which we have eligibility, claims, pharmacy or risk data in the Population Health platform, for a given client in a given month. Financial and other key metric definitions 153

2017 Guidance
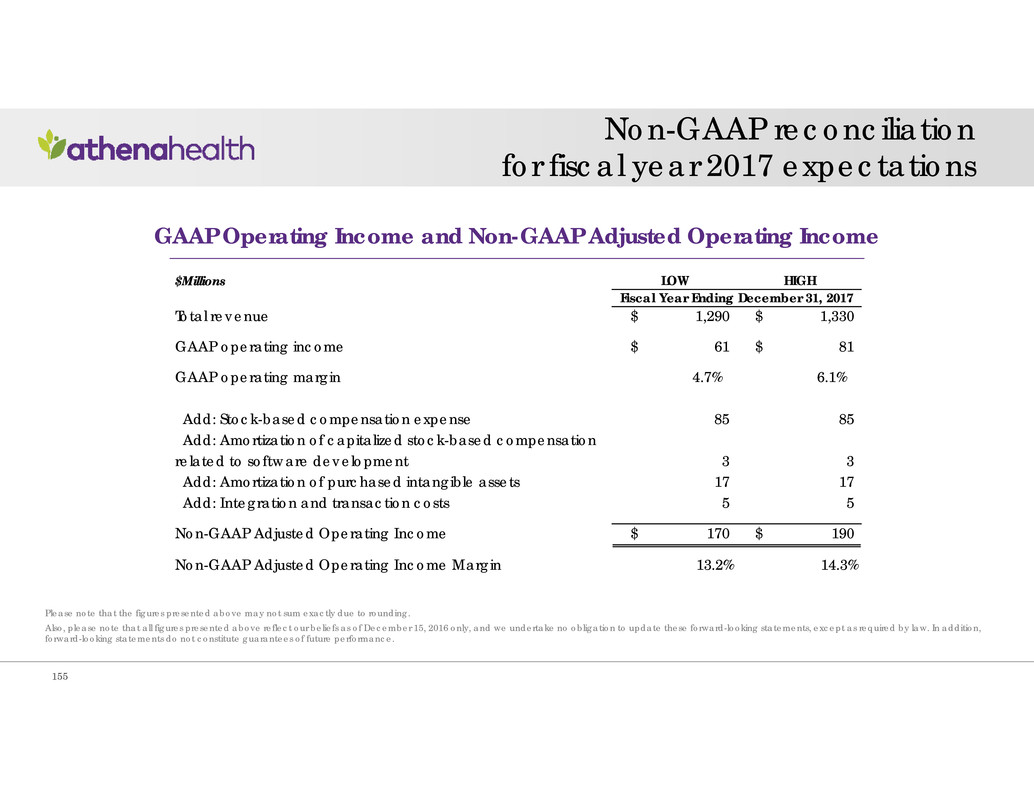
Non-GAAP reconciliation for fiscal year 2017 expectations Please note that the figures presented above may not sum exactly due to rounding. GAAP Operating Income and Non-GAAP Adjusted Operating Income $Millions LOW HIGH Total revenue 1,290$ 1,330$ GAAP operating income 61$ 81$ GAAP operating margin 4.7% 6.1% Add: Stock-based compensation expense 85 85 Add: Amortization of capitalized stock-based compensation related to software development 3 3 Add: Amortization of purchased intangible assets 17 17 Add: Integration and transaction costs 5 5 Non-GAAP Adjusted Operating Income 170$ 190$ Non-GAAP Adjusted Operating Income Margin 13.2% 14.3% Fiscal Year Ending December 31, 2017 155 Also, please note that all figures presented above reflect our beliefs as of December 15, 2016 only, and we undertake no obligation to update these forward-looking statements, except as required by law. In addition, forward-looking statements do not constitute guarantees of future performance.

156 9th Annual Investor Summit December 15, 2016


