Exhibit 99.2
September 2004 Company Fact Sheet
HORNBECK OFFSHORE SERVICES, INC. NYSE: HOS
Leading the New Generation |  | |
| www.HORNBECKOFFSHORE.COM |
Investor Considerations:
| • | Competitive Difference.Hornbeck’s multi-class fleet of 23 new generation offshore supply vessels (OSVs), the youngest fleet in the Gulf of Mexico (GoM), provides a competitive advantage in servicing the diverse needs of its client base, which has historically led to above industry-average utilization and dayrates. |
| • | Market Position. Hornbeck has the 2nd largest new generation OSV fleet in the GoM with an estimated 16% market share. While newbuild activity continues in the GoM, considering over 20 U.S.-flagged OSVs have recently left the GoM, Hornbeck is well-positioned in the higher-margin, new generation segment to take advantage of a tightening market. |
| • | Improving Trends. Signs of strengthening have recently emerged from the relatively weaker OSV conditions of the last 24 months, as average OSV utilization has continued to improve into the mid-90’s from an April 2004 trough in the low-70’s. |
| • | Stable Cash Flow Base.The Tug & Tank Barge segment provides significant financial support during soft OSV cycles. Indeed, after Hornbeck’s 5 new double-hulled barges are delivered, annualized cash flow from this segment is expected to cover 100% of company-wide fixed charges, including interest expense and drydocking-related expenditures. |
| • | Improving Balance Sheet & Liquidity.Net proceeds of $72mm from the March ‘04 IPO both strengthened the Company’s capital structure (reducing its net debt-to-cap ratio from 64% to 44%) and helped finance its current 5-barge construction program. Recently, Standard & Poor’s raised the Company’s senior unsecured credit rating to BB– from B+. |
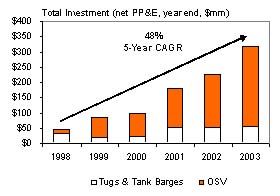
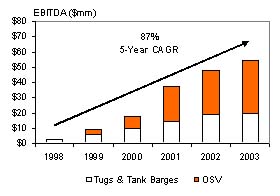
| • | 5-Year Track Record of Growth.Since 1998, Hornbeck has achieved compound annual growth rates (CAGRs) in total fleet investment (net PP&E) and corporate EBITDA of 48% and 87%, respectively. |
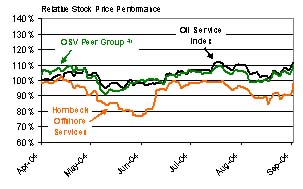
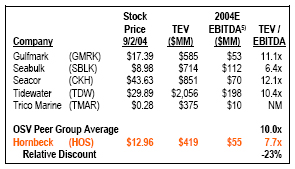
| • | Attractive Relative Valuation. Despite recent improvements in OSV market conditions and upwardly revised earnings guidance, Hornbeck’s stock price has under-performed both the OSV Peer Group and broader oil service index by 12%, and currently trades at 7.7x 2004E EBITDA versus a 10.0x OSV Peer Group average, a 23% discount. |
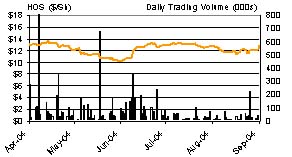
Price (Sep 2, 2004) | $12.96 | ||
Stock Data |
| ||
Fiscal Year-End: | December | ||
Symbol / Exchange: | HOS / NYSE | ||
52-Week Range: | $10.15-$13.75 | ||
Basic Common Shares O/S: | 20.8 mm | ||
Market Capitalization: | $270 mm | ||
Total Enterprise Value1): | $419 mm | ||
Average Daily Volume (L3M): | 62,000 | ||
Insider Ownership2): | 8.7 | % | |
Closely-Held Ownership3): | 42.5 | % | |
13F Institutional Ownership: | 37.4 | % | |
Financial Data (Data as of 6/30/04, unaudited) |
| ||
Total Cash: | $24 mm | ||
Total Debt: | $173 mm | ||
Total Stockholders’ Equity: | $190 mm | ||
Net Debt / Net Book Capitalization: | 44.0 | % | |
Book Value / Share: | $9.12 | ||
| Full 2004E | |||
Company Guidance | |||
EBITDA4): | $53-$56 mm | ||
EPS: | $0.34-$0.44 | ||
TEV / EBITDA1),5): | 7.7x | ||
P / E5): | 33.2x | ||
Segment Data |
| ||
| YTD ‘04 | |||
EBITDA Mix | |||
OSVs: | 63 | % | |
Tugs & Tank Barges: | 37 | % | |
Current Fleet6) | |||
No. of New Generation OSVs : | 23 | ||
No. of Tugs / Tank Barges: | 14 / 16 | ||
Barges Under Construction: | 5 | ||
Stock Price (Mar 2004 IPO - Present) |
| ||
 | |||
| 1) | Total Enterprise Value (TEV) is defined as current Market Capitalization plus Total Debt less Total Cash as of the last Form 10-Q filed with the SEC. |
| 2) | Represents executive officers and directors as disclosed in the last Proxy filed with the SEC. |
| 3) | Represents beneficial ownership of SCF IV LP, William Herbert Hunt Trust Estate and Cari Investment Company as disclosed in the last Proxy filed with the SEC. |
| 4) | EBITDA is a non-GAAP financial measure; see page 4 for GAAP reconciliation. |
| 5) | Based on midpoint of company guidance. |
| 6) | Excludes fast supply boat and coastwise tanker from vessel total. |
©2004 Hornbeck Offshore Services, Inc.
All Rights Reserved.
 Fact Sheet Fact Sheet | September 2004 |
COMPANY OVERVIEW
Hornbeck Offshore Services, Inc.(Hornbeck), a diversified marine service company headquartered in Covington, Louisiana, is a leading provider of technologically advanced, new generation offshore supply vessels primarily in the U.S. Gulf of Mexico and select international markets, and is a leading transporter of petroleum products through its fleet of ocean-going tugs and tank barges primarily in the northeastern U.S. and in Puerto Rico. Hornbeck currently owns and operates a fleet of 55 vessels, with five additional vessels under construction.
OFFSHORE SUPPLY VESSEL (UPSTREAM)
Market Presence. Since its inception in 1997, Hornbeck has completed three separate newbuild programs utilizing proprietary designs developed by its in-house team of naval architects and engineers to build 17 new generation OSVs. Combined with the mid-2003 purchase of six deepwater-capable vessels, Hornbeck has assembled the youngest, and second largest modern, U.S.-flagged OSV fleet in the Gulf of Mexico.
All OSVs are Not Created Equal. The OSV market is bifurcated between aging, conventional 180’ boats originally designed and constructed to service the shallow coastal shelf waters and a “new generation” of 200’+ vessels that service the larger and increasingly complex demands of the frontier deepwater, ultra-deepwater and deep-shelf projects. Over the last five years, utilization rates for new generation OSVs have averaged 94% versus conventional 180’ vessels that have averaged only about 50%. Reflecting the market’s different supply and demand fundamentals, average dayrates for new generation OSVs are typically double those of their 180’ forerunners.
Increasing Long-Term Demand. Deepwater activity has become a cornerstone of domestic GoM oil production, rising from less than 4% in 1990 to over 68% in 2002, per MMS. A global trend, deepwater spending worldwide over the next 5 years is projected by industry sources to rise 83% over the prior 5–year spending level, mainly reflecting that only 22% of the 341 deepwater fields discovered to-date have been developed.
Significant Operating Leverage.In 2003, OSV EBITDA accounted for over 64% of Hornbeck’s total. While the Company currently expects to meet or exceed its prior-year level in 2004, Hornbeck has considerable operating leverage to strengthening OSV demand. Management believes that its existing OSV fleet has the ability to double its current EBITDA levels in a peak scenario. Based on historical peak OSV utilization and dayrates, and holding its tank barge segment contribution constant with 2003 results, Hornbeck estimates that it could generate over $94 million in EBITDA with its existing fleet (prior to any contribution from its current barge newbuild program).
MISSION STATEMENT
Hornbeck’s mission is to be recognized as the energy industry’s marine transportation and service company of choice for its customers, employees and investors through innovative, high quality, value-added business solutions delivered with enthusiasm, integrity and professionalism and with the utmost regard for the safety of individuals and the protection of the environment.
TUGS & TANK BARGES (DOWNSTREAM)
In addition to its new generation OSVs, Hornbeck operates a fleet of 14 ocean-going tugs, 16 ocean-going tank barges and one coastwise tanker to transport petroleum products, primarily within the northeastern U.S. and Puerto Rico. The Tug & Tank Barge segment not only takes advantage of Hornbeck’s marine expertise, it provides geographic and revenue-source diversification while providing an additional value-added service to its core customers — integrated refiners and major oil and gas companies.
Improving Supply / Demand Fundamentals.Due to the Oil Pollution Act of 1990 (OPA’90) and its mandated vessel retirement schedule, an estimated 33% of the current U.S. single-hulled tank barge supply will be removed from service by 2005, with an additional 17% to be removed by 2010. Conversely, the U.S. Energy Information Agency estimates consumer demand for petroleum products along the East Coast will grow 1.7% per annum over the same period. While industry newbuild and retrofit programs are underway, Hornbeck believes that limited access to capital by privately held competitors, operational barriers to entry and rising steel prices will likely keep this retired capacity from being fully replaced.
While average dayrates for Hornbeck’s tank barges have steadily risen from about $8,500 in 1999 to over $11,000 to-date in 2004, there are reasons to believe long-term dayrates will continue to move higher still, as upward pressure is exerted from declining supply, stable demand and the premium necessary to attract new capital to build incremental double-hulled capacity.
Growth Initiative. Hornbeck has recently commenced a $102mm 2-year expansion program to construct 5 double-hulled tank barges (4 of which are already committed under long-term arrangements) scheduled to be delivered by the end of 2005. As a result, net of 3 of its barges to be retired under OPA’90 by 2005, Hornbeck’s fleet capacity is expected to grow 28% to 1.48 MMbbls, with 46% of its fleet double-hulled, up from 7% today.
Stable Cash Flow Base. Once its 5 new barges are fully in service, annualized cash flow from this segment is expected to potentially double, to a level covering 100% of Hornbeck’s company-wide fixed charges, including interest expense and drydocking-related expenditures.
| Page 2 | ©2004 Hornbeck Offshore Services, Inc. All Rights Reserved. |
| Fact Sheet | September 2004 | |||
ACHIEVING SIGNIFICANT GROWTH…
| Growth in Total Fleet Investment (1998-2003) | Growth in Total EBITDA1) (1998-2003) | |
 |  | |
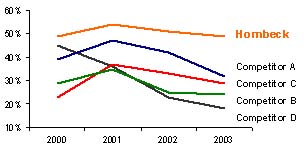
…WITH INDUSTRY LEADING RETURNS
| EBITDA Margin2) (2000-2003) | Return on Capital Employed3) (2000-2003) | |
 | 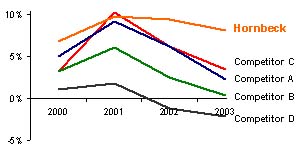 | |
ATTRACTIVE RELATIVE VALUATION
| Relative Stock Price Performance (IPO-Present) | Relative Valuation to OSV Peer Group | |
 |  | |
| 1) | EBITDA is a non-GAAP financial measure; see page 4 for GAAP reconciliation. |
| 2) | EBITDA margin is equal to EBITDA divided by period revenues. |
| 3) | Return on capital employed equal to tax-affected earnings (net income) before interest and taxes divided by average capital employed. |
| 4) | OSV Peer Group average Relative Stock Price Performance excludes TMAR. |
| 5) | 2004E EBITDA represents mean of Wall Street expectations as compiled by Thomson/First Call except for SBLK which reflects annualized first half 2004 results due to lack of analyst coverage. |
©2004 Hornbeck Offshore Services, Inc. All Rights Reserved. | Page 3 |
Hornbeck Offshore Services
Fact Sheet
Company Headquarters
103 Northpark Boulevard, Suite 300
Covington, LA 70433
United States of America
NYSE: HOS
(985) 727-2000
ir@hornbeckoffshore.com
www.HornbeckOffshore.com
Reader Advisory and Forward Looking Statements
This Fact Sheet is presented as a brief company overview for the information of investors, analysts and other parties with an interest in the Company. Hornbeck’s management hopes that this Fact Sheet will encourage analysts and investors to investigate more about the Company through its SEC filings, press releases and other public materials. This Fact Sheet does not constitute an offer to sell or a solicitation of an offer to buy any securities of the Company. This Fact Sheet contains forward-looking statements, including, in particular, statements about Hornbeck’s plans, strategies and prospects. These statements are based on the Company’s current assumptions, expectations and projections about future events, which are subject to a wide range of business risks. The Company encourages investors to review the information regarding the risks inherent to Hornbeck and its industry, as described in its Annual Report on Form 10-K for the year ended December 31, 2003, a copy of which is available free of charge over the Internet at the Securities and Exchange Commission’s website at http://www.sec.gov and at the Company’s website at www.hornbeckoffshore.com. This Fact Sheet does not purport to be all-inclusive or to contain all of the information that a reader may desire as to the structure or the affairs of the Company. Although the Company believes that the assumptions reflected in these forward-looking statements are reasonable, the Company can give no assurance that these assumptions will prove to be correct or that financial or market forecasts, savings or other benefits anticipated in the forward-looking statements will be achieved. Forward-looking statements are not guarantees of future performance and actual results may differ materially from those projected. The information contained in this Fact Sheet is only current as of its date and the Company undertakes no obligation to update this Fact Sheet.
Regulation G Reconciliation
This Fact Sheet contains references to the non-GAAP financial measure of Earnings (net income) before Interest, Taxes, Depreciation, and Amortization, or EBITDA. Reconciliations of this financial measure to the most directly comparable GAAP financial measure are provided in the table below. Management’s opinion regarding the usefulness of such measure to investors and a description of the ways in which management uses such measure can be found in the Company’s most recent Annual Report on Form 10-K filed with the Securities and Exchange Commission.
Reconciliation of EBITDA to Net Income (Loss) ($mm)
Year Ended December 31, | 1998 | 1999 | 2000 | 2001 | 2002 | 2003 | 2004E | Pro Forma Peak OSV | |||||||||||||||||||
Net income (loss) | $ | (1.4 | ) | $ | (1.7 | ) | $ | (4.5 | ) | $ | 7.0 | $ | 11.6 | $ | 11.2 | $ | 6.9-$8.8 | $ | 32.9 | ||||||||
Interest expense: | |||||||||||||||||||||||||||
Debt obligations | 1.2 | 5.3 | 8.2 | 13.7 | 16.2 | 18.5 | 18.5 | 18.5 | |||||||||||||||||||
Put warrants | 1.5 | 2.3 | 7.3 | 3.0 | — | — | — | — | |||||||||||||||||||
Income tax expense (benefit) | (0.2 | ) | 0.3 | 1.6 | 5.7 | 7.1 | 6.9 | 4.1-5.2 | 19.8 | ||||||||||||||||||
Depreciation and amortization | 1.3 | 3.1 | 5.2 | 7.7 | 12.3 | 17.6 | 23.5 | 23.5 | |||||||||||||||||||
EBITDA | $ | 2.4 | $ | 9.3 | $ | 17.7 | $ | 37.1 | $ | 47.3 | $ | 54.2 | $ | 53-$56 | $ | 94.7 | |||||||||||
©2004 Hornbeck Offshore Services, Inc.
All Rights Reserved.