STANTEC INC. 2011 FINANCIAL REVIEW
One Team. Integrated Solutions.
STN.TSX.NYSE

AT STANTEC, OUR FOCUS IS ON SUCCESSFULLY IMPLEMENTING OUR BUSINESS STRATEGY TO CONSISTENTLY DELIVER RESULTS FOR OUR CLIENTS, EMPLOYEES, AND SHAREHOLDERS.
From across North America and internationally, we provide our clients integrated design and consulting services in architecture, engineering, interior design, landscape architecture, urban planning, surveying, environmental sciences, economics, project management, and many other disciplines.
In simple terms, the world of Stantec is the water we drink, the routes we travel, the buildings we visit, the industries in which we work, and the neighborhoods we call home.
TABLE OF CONTENTS
4 Stantec At A Glance
8 2011 Financial Summary and Highlights
10 Message to Shareholders
12 Board of Directors
14 Locations
IBC Shareholder Information
Management’s Discussion and Analysis
M-1 Caution Regarding
Forward-Looking Statements
M-3 Executive Summary
M-4 Core Business and Strategy
M-9 Key Performance Drivers
and Capabilities
M-13 Results
M-45 Outlook
M-48 Critical Accounting Estimates,
Developments, and Measures
M-61 Risk Factors
M-72 Controls and Procedures
M-73 Corporate Governance
M-74 Subsequent Event
Consolidated Financial Statements
F-1 Management Report
F-2 Independent Auditors’
Report of Registered Public
Accounting Firm
F-3 Independent Auditors’ Report
on Internal Control Over
Financial Reporting
F-4 Consolidated Statements of
Financial Position
F-5 Consolidated Statements
of Income
F-6 Consolidated Statements
of Comprehensive Income
F-7 Consolidated Statements
of Shareholders’ Equity
F-8 Consolidated Statements
of Cash Flows
F-9 Notes to the Consolidated
Financial Statements
STANTEC INC. 3
STANTEC AT A GLANCE
VISION
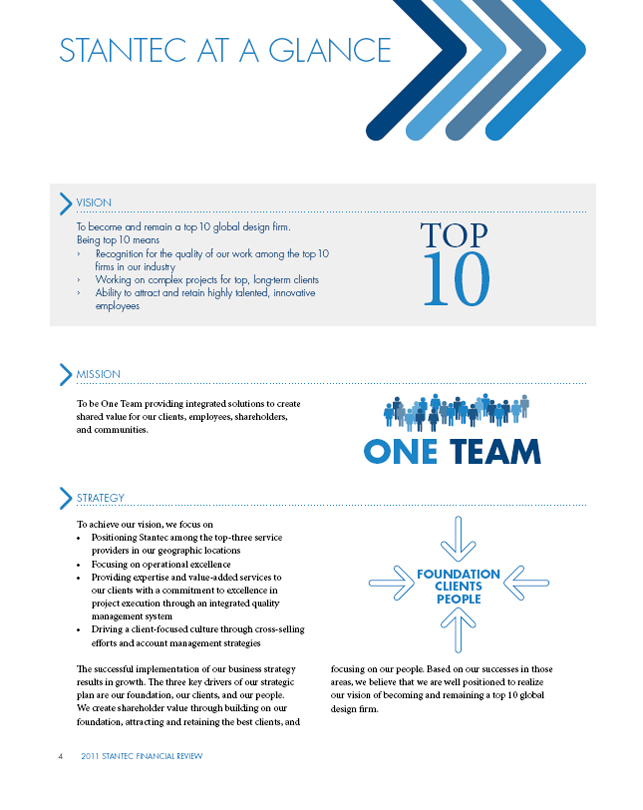
To become and remain a top 10 global design firm. Being top 10 means
Recognition for the quality of our work among the top 10 firms in our industry
Working on complex projects for top, long-term clients
Ability to attract and retain highly talented, innovative employees
10 TOP
MISSION
To be One Team providing integrated solutions to create shared value for our clients, employees, shareholders, and communities.
ONE TEAM
STRATEGY
To achieve our vision, we focus on
Positioning Stantec among the top-three service
providers in our geographic locations
Focusing on operational excellence
Providing expertise and value-added services to
our clients with a commitment to excellence in
project execution through an integrated quality
management system
Driving a client-focused culture through cross-selling
efforts and account management strategies
FOUNDATION CLIENTS PEOPLE
The successful implementation of our business strategy results in growth. The three key drivers of our strategic plan are our foundation, our clients, and our people. We create shareholder value through building on our foundation, attracting and retaining the best clients, and
focusing on our people. Based on our successes in those areas, we believe that we are well positioned to realize our vision of becoming and remaining a top 10 global design firm.
4 2011 STANTEC FINANCIAL REVIEW
SUSTAINABILITY
We are committed to being a leader and model of sustainability by doing business in a way that meets the needs of the present while contributing to an environmentally, socially, and economically sustainable future. This commitment is at the heart of how we operate and how we deliver solutions to our clients, and is vital to our long-term success in achieving our vision. In support of this commitment, we are now certified to the ISO 14001 environmental standard, which promotes the reduction of the organization’s environmental footprint and drives regulatory compliance.
BUSINESS MODEL
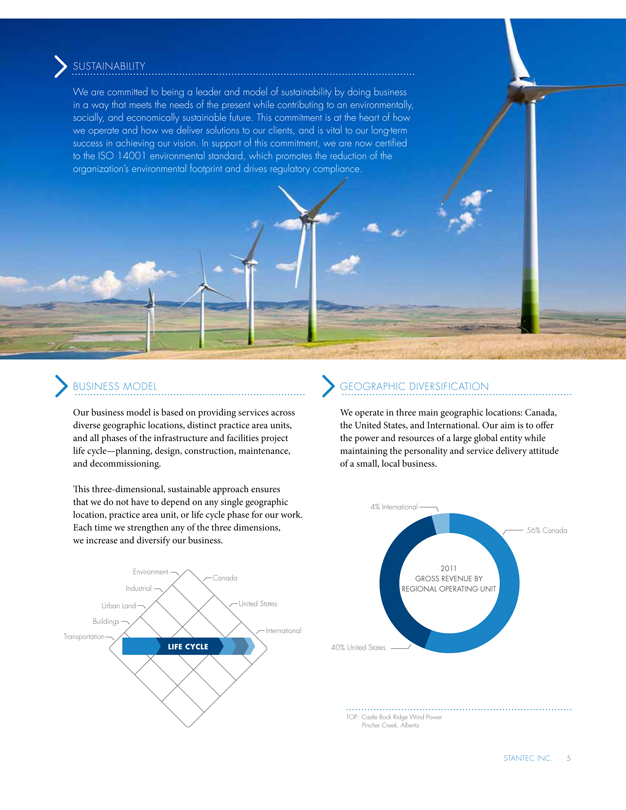
Our business model is based on providing services across diverse geographic locations, distinct practice area units, and all phases of the infrastructure and facilities project life cycle-planning, design, construction management, maintenance, and decommissioning.
This three-dimensional, sustainable approach ensures that we do not have to depend on any single geographic location, practice area unit, or life cycle phase for our work. Each time we strengthen any of the three dimensions, we increase and diversify our business.
GEOGRAPHIC DIVERSIFICATION
We operate in three main geographic locations: Canada, the United States, and International. Our aim is to offer the power and resources of a large global entity while maintaining the personality and service delivery attitude of a small, local business.
Environment
Industrial
Urban Land
Buildings
Transportation
Canada
United States
International
LIFE CYCLE
4% International
56% Canada
40% United States
2011 GROSS REVENUE BY
REGIONAL OPERATING UNIT
TOP: Castle Rock Ridge Wind Power
Pincher Creek, Alberta
STANTEC INC. 5
PRACTICE AREA UNIT SPECIALIZATION
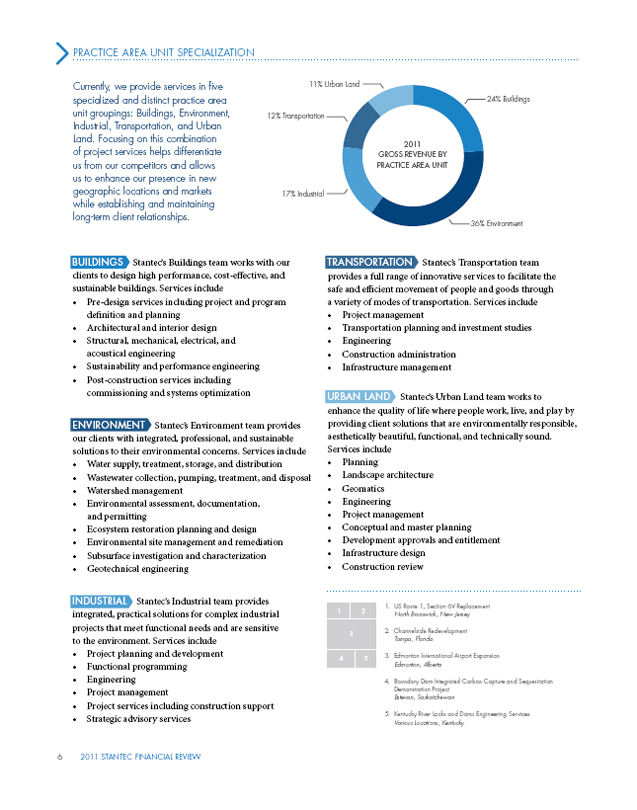
Currently, we provide services in five specialized and distinct practice area unit groupings: Buildings, Environment, Industrial, Transportation, and Urban Land. Focusing on this combination of project services helps differentiate us from our competitors and allows us to enhance our presence in new geographic locations and markets while establishing and maintaining long-term client relationships.
11% Urban Land
12% Transportation
17% Industrial
24% Buildings
36% Environment
2011 GROSS REVENUE BY PRACTICE AREA UNIT
BUILDINGS
Stantec’s Buildings team works with our clients to design high performance, cost-effective, and sustainable buildings. Services include
Pre-design services including project and program definition and planning
Architectural and interior design
Structural, mechanical, electrical, and acoustical engineering
Sustainability and performance engineering
Post-construction services including
commissioning and systems optimization
ENVIRONMENT
Stantec’s Environment team provides
our clients with integrated, professional, and sustainable
solutions to their environmental concerns. Services include
Water supply, treatment, storage, and distribution
Wastewater collection, pumping, treatment, and disposal
Watershed management
Environmental assessment, documentation,
and permitting
Ecosystem restoration planning and design
Environmental site management and remediation
Subsurface investigation and characterization
Geotechnical engineering
INDUSTRIAL Stantec’s Industrial team provides
integrated, practical solutions for complex industrial
projects that meet functional needs and are sensitive
to the environment. Services include
Project planning and development
Functional programming
Engineering
Project management
Project services including construction support
Strategic advisory services
TRANSPORTATION
Stantec’s Transportation team
provides a full range of innovative services to facilitate the
safe and efficient movement of people and goods through
a variety of modes of transportation. Services include
Project management
Transportation planning and investment studies
Engineering
Construction administration
Infrastructure management
URBAN LAND Stantec’s Urban Land team works to
enhance the quality of life where people work, live, and play by
providing client solutions that are environmentally responsible,
aesthetically beautiful, functional, and technically sound.
Services include
Planning
Landscape architecture
Geomatics
Engineering
Project management
Conceptual and master planning
Development approvals and entitlement
Infrastructure design
Construction review
1. US Route 1, Section 6V Replacement
North Brunswick, New Jersey
2. Channelside Redevelopment
Tampa, Florida
3. Edmonton International Airport Expansion
Edmonton, Alberta
4. Boundary Dam Integrated Carbon Capture and Sequestration
Demonstration Project
Estevan, Saskatchewan
5. Kentucky River Locks and Dams Engineering Services
Various Locations, Kentucky
2011 STANTEC FINANCIAL REVIEW
6

STANTEC INC. 7
2011
FINANCIAL SUMMARY
AND HIGHLIGHTS
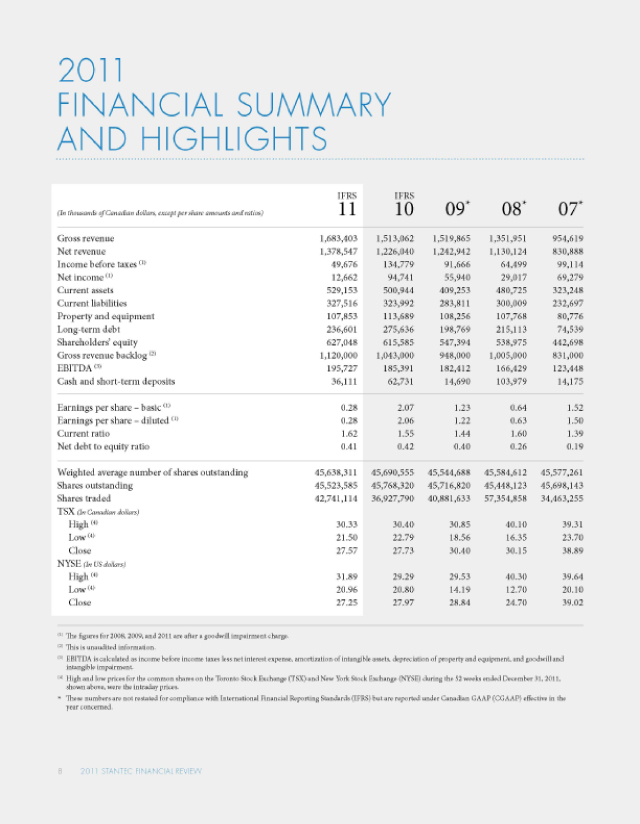
11IFRS 10IFRS 09* 08* 07*
(In thousands of Canadian dollars, except per share amounts and ratios)
Gross revenue 1,683,403 1,513,062 1,519,865 1,351,951 954,619
Net revenue 1,378,547 1,226,040 1,242,942 1,130,124 830,888
Income before taxes (1) 49,676 134,779 91,666 64,499 99,114
Net income (1) 12,662 94,741 55,940 29,017 69,279
Current assets 529,153 500,944 409,253 480,725 323,248
Current liabilities 327,516 323,992 283,811 300,009 232,697
Property and equipment 107,853 113,689 108,256 107,768 80,776
Long-term debt 236,601 275,636 198,769 215,113 74,539
Shareholders’ equity 627,048 615,585 547,394 538,975 442,698
Gross revenue backlog (2) 1,120,000 1,043,000 948,000 1,005,000 831,000
EBITDA (3) 195,727 185,391 182,412 166,429 123,448
Cash and short-term deposits 36,111 62,731 14,690 103,979 14,175
Earnings per share - basic (1) 0.28 2.07 1.23 0.64 1.52
Earnings per share - diluted (1) 0.28 2.06 1.22 0.63 1.50
Current ratio 1.62 1.55 1.44 1.60 1.39
Net debt to equity ratio 0.41 0.42 0.40 0.26 0.19
Weighted average number of shares outstanding 45,638,311 45,690,555 45,544,688 45,584,612 45,577,261
Shares outstanding 45,523,585 45,768,320 45,716,820 45,448,123 45,698,143
Shares traded 42,741,114 36,927,790 40,881,633 57,354,858 34,463,255
TSX (In Canadian dollars)
High (4) 30.33 30.40 30.85 40.10 39.31
Low (4) 21.50 22.79 18.56 16.35 23.70
Close 27.57 27.73 30.40 30.15 38.89
NYSE (In US dollars)
High (4) 31.89 29.29 29.53 40.30 39.64
Low (4) 20.96 20.80 14.19 12.70 20.10
Close 27.25 27.97 28.84 24.70 39.02
(1) The figures for 2008, 2009, and 2011 are after a goodwill impairment charge.
(2) is is unaudited information.
(3) EBITDA is calculated as income before income taxes less net interest expense, amortization of intangible assets, depreciation of property and equipment, and goodwill and intangible impairment.
(4) High and low prices for the common shares on the Toronto Stock Exchange (TSX) and New York Stock Exchange (NYSE) during the 52 weeks ended December 31, 2011, shown above, were the intraday prices.
* These numbers are not restated for compliance with International Financial Reporting Standards (IFRS) but are reported under Canadian GAAP (CGAAP) effective in the year concerned.
8 2011 STANTEC FINANCIAL REVIEW
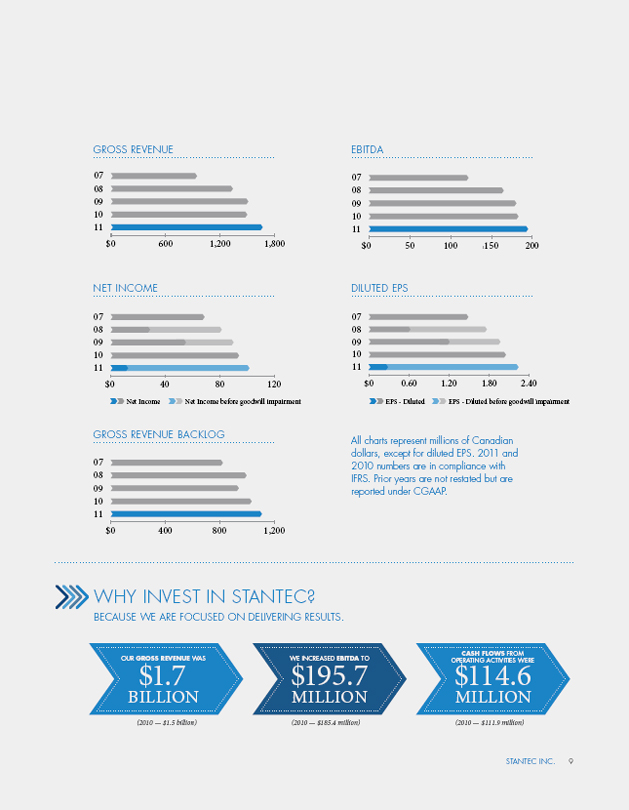
GROSS REVENUE
07 08 09 10 11
$0 600 1,200 1,800
EBITDA
07 08 09 10 11
$0 50 100 150 200
NET INCOME
07 08 09 10 11
$0 40 80 120
Net Income Net Income before goodwill impairment
DILUTED EPS
07 08 09 10 11
$0 0.60 1.20 1.80 2.40
EPS-Diluted EPS-Diluted before goodwill impairment
GROSS REVENUE BACKLOG
07 08 09 10 11 $0 400 800 1,200
All charts represent millions of Canadian dollars, except for diluted EPS. 2011 and 2010 numbers are in compliance with IFRS. Prior years are not restated but are reported under CGAAP.
WHY INVEST IN STANTEC?
BECAUSE WE ARE FOCUSED ON DELIVERING RESULTS.
OUR GROSS REVENUE WAS
$1.7 BILLION
(2010 - $1.5 billion)
WE INCREASED EBITDA TO
$195.7 MILLION
(2010 - $185.4 million)
CASH FLOWS FROM OPERATING ACTIVITIES WERE
$114.6 MILLION
(2010 - $111.9 million)
STANTEC INC. 9
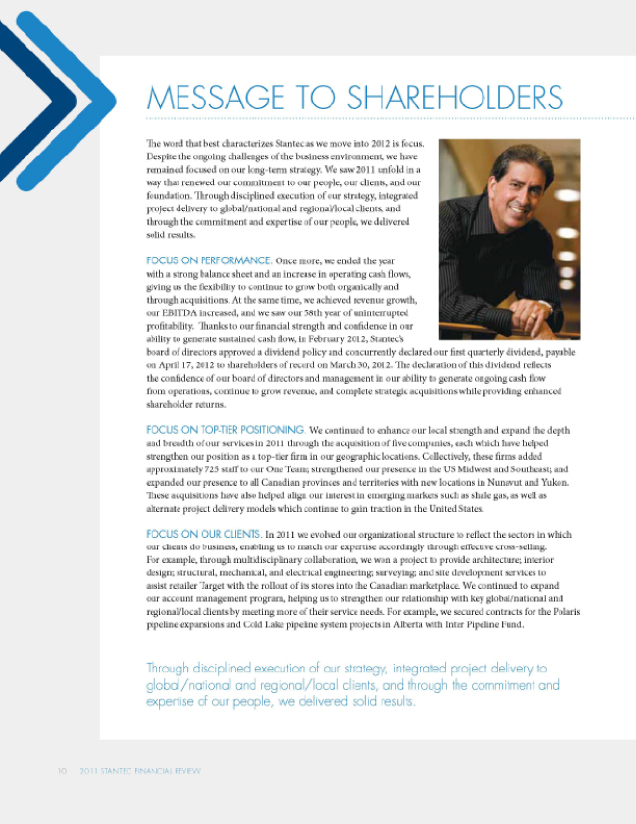
MESSAGE TO SHAREHOLDERS
The word that best characterizes Stantec as we move into 2012 is focus. Despite the ongoing challenges of the business environment, we have remained focused on our long-term strategy. We saw 2011 unfold in a way that renewed our commitment to our people, our clients, and our foundation. Through disciplined execution of our strategy, integrated project delivery to global/national and regional/local clients, and through the commitment and expertise of our people, we delivered solid results.
FOCUS ON PERFORMANCE. Once more, we ended the year with a strong balance sheet and an increase in operating cash flows, giving us the flexibility to continue to grow both organically and through acquisitions. At the same time, we achieved revenue growth, our EBITDA increased, and we saw our 58th year of uninterrupted profitability. Thanks to our financial strength and confidence in our ability to generate sustained cash flow, in February 2012, Stantec’s board of directors approved a dividend policy and concurrently declared our first quarterly dividend, payable on April 17, 2012 to shareholders of record on March 30, 2012. The declaration of this dividend reflects the confidence of our board of directors and management in our ability to generate ongoing cash flow from operations, continue to grow revenue, and complete strategic acquisitions while providing enhanced shareholder returns.
FOCUS ON TOP-TIER POSITIONING. We continued to enhance our local strength and expand the depth and breadth of our services in 2011 through the acquisition of five companies, each which have helped strengthen our position as a top-tier firm in our geographic locations. Collectively, these firms added approximately 725 staff to our One Team; strengthened our presence in the US Midwest and Southeast; and expanded our presence to all Canadian provinces and territories with new locations in Nunavut and Yukon. These acquisitions have also helped align our interest in emerging markets such as shale gas, as well as alternate project delivery models which continue to gain traction in the United States.
FOCUS ON OUR CLIENTS. In 2011 we evolved our organizational structure to reflect the sectors in which our clients do business, enabling us to match our expertise accordingly through effective cross-selling. For example, through multidisciplinary collaboration, we won a project to provide architecture; interior design; structural, mechanical, and electrical engineering; surveying; and site development services to assist retailer Target with the rollout of its stores into the Canadian marketplace. We continued to expand our account management program, helping us to strengthen our relationship with key global/national and regional/local clients by meeting more of their service needs. For example, we secured contracts for the Polaris pipeline expansions and Cold Lake pipeline system projects in Alberta with Inter Pipeline Fund. We also secured a long-term
Through disciplined execution of our strategy, integrated project delivery to global/national and regional/local clients, and through the commitment and expertise of our people, we delivered solid results.
10 2011 STANTEC FINANCIAL REVIEW
project with the US Department of Transportation to provide the Federal Highway Administration with technical services in the United States and Canada, established under the Strategic Highway Research Program.
FOCUS ON OPERATIONAL EXCELLENCE. Our core commitment to technical, project management, and client service excellence forms the foundation for the growth and diversity of our Company. Our formal integrated management system provides a disciplined and accountable framework for managing risks, quality outcomes, and regulatory compliance. This integrated management system has been implemented and registered to three internationally recognized ISO standards:
ISO 9001:2008 Quality Management Standard - aligns business processes with strategic objectives, provides a disciplined approach to managing risk, and promotes quality outcomes and management transparency
ISO 14001:2004 Environmental Management Standard - promotes the reduction of the organization’s environmental footprint and drives regulatory compliance
ISO/IEC 20000-1:2005 IT Service Management Standard - promotes the quality, consistency, reliability, and value of information technology services
Our integrated management system, in addition to our strong enterprise system, collectively help us to manage our operations effectively.
In 2011, and every year, we have our committed and hardworking employees to thank. By working together as One Team, they deliver high-quality, integrated, and well-managed projects to our clients and effectively manage our operations. Through their dedication, they help us to execute our long-term strategy and provide us with a reputation for excellence.
Our performance in 2011 was a testament to the strength of our business model, which enabled us to adjust our service delivery to meet the needs of our clients and those of a changing market. As we look to 2012, a year where we anticipate moderate economic recovery, we remain focused on the disciplined execution of our long-term strategy. We are confident that we are well positioned to continue to expand our business to meet our clients’ needs and to take advantage of market opportunities because of the agility of our business model.
In closing, we would like to thank our clients for entrusting us with their projects. The services we provide are essential to helping our clients improve the quality of life in communities across North America and around the world, and we are thankful to our clients for allowing us to work with them as One Team to achieve their project goals, which in turn contributes to our success.
On behalf of Stantec, thank you for your confidence in our strategic direction and for your continued support.
Bob Gomes, P.Eng.
President & CEO
STANTEC INC. 11
BOARD OF DIRECTORS
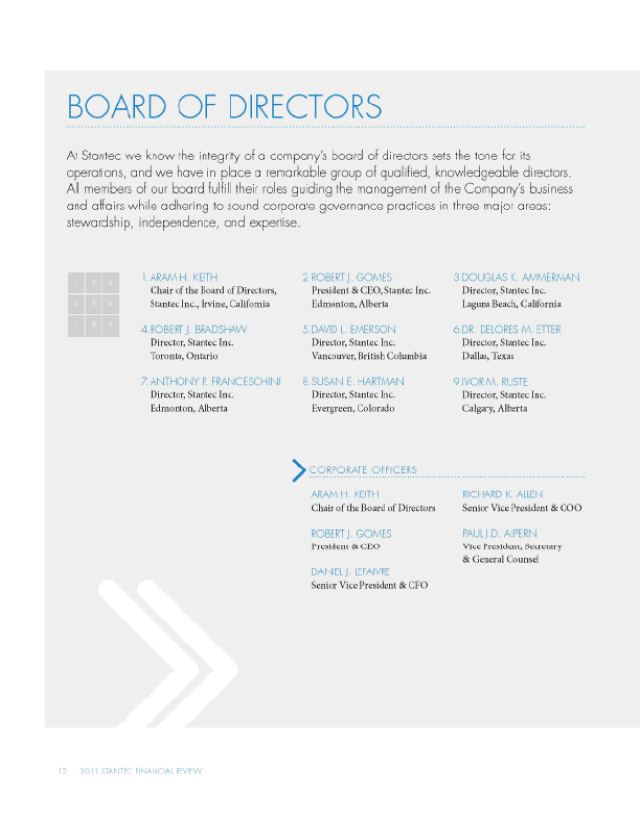
At Stantec we know the integrity of a company’s board of directors sets the tone for its operations, and we have in place a remarkable group of qualified, knowledgeable directors. All members of our board fulfill their roles guiding the management of the Company’s business and affairs while adhering to sound corporate governance practices in three major areas: stewardship, independence, and expertise.
1. ARAM H. KEITH
Chair of the Board of Directors, Stantec Inc., Irvine, California
2. ROBERT J. GOMES
President & CEO, Stantec Inc.
Edmonton, Alberta
3. DOUGLAS K. AMMERMAN
Director, Stantec Inc.
Laguna Beach, California
4. ROBERT J. BRADSHAW
Director, Stantec Inc.
Toronto, Ontario
5. DAVID L. EMERSON
Director, Stantec Inc.
Vancouver, British Columbia
6. DR. DELORES M. ETTER
Director, Stantec Inc.
Dallas, Texas
7. ANTHONY P. FRANCESCHINI
Director, Stantec Inc.
Edmonton, Alberta
8. SUSAN E. HARTMAN
Director, Stantec Inc.
Evergreen, Colorado
9. IVOR M. RUSTE
Director, Stantec Inc.
Calgary, Alberta
CORPORATE OFFICERS
ARAM H. KEITH
Chair of the Board of Directors
ROBERT J. GOMES
President & CEO
DANIEL J. LEFAIVRE
Senior Vice President & CFO
RICHARD K. ALLEN
Senior Vice President & COO
PAUL J.D. ALPERN
Vice President, Secretary & General Counsel
12. 2011 STANTEC FINANCIAL REVIEW

STANTEC INC. 13
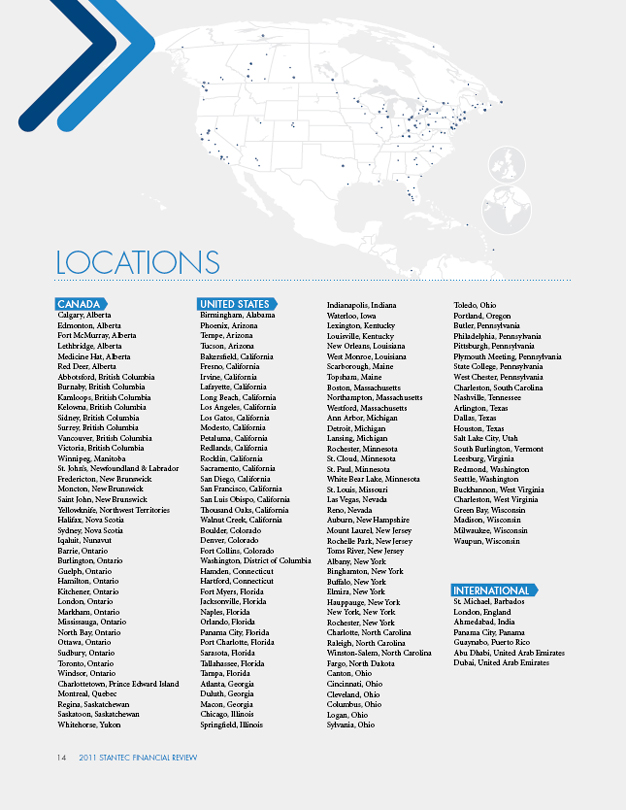
LOCATIONS
CANADA
Calgary, Alberta Edmonton, Alberta Fort McMurray, Alberta Lethbridge, Alberta Medicine Hat, Alberta Red Deer, Alberta Abbotsford, British Columbia Burnaby, British Columbia Kamloops, British Columbia Kelowna, British Columbia Sidney, British Columbia Surrey, British Columbia Vancouver, British Columbia Victoria, British Columbia Winnipeg, Manitoba St. John’s, Newfoundland & Labrador Fredericton, New Brunswick Moncton, New Brunswick Saint John, New Brunswick Yellowknife, Northwest Territories Halifax, Nova Scotia Sydney, Nova Scotia Iqaluit, Nunavut Barrie, Ontario Burlington, Ontario Guelph, Ontario Hamilton, Ontario Kitchener, Ontario London, Ontario Markham, Ontario Mississauga, Ontario North Bay, Ontario Ottawa, Ontario Sudbury, Ontario Toronto, Ontario Windsor, Ontario Charlottetown, Prince Edward Island Montreal, Quebec
Regina, Saskatchewan Saskatoon, Saskatchewan Whitehorse, Yukon
UNITED STATES
Birmingham, Alabama Phoenix, Arizona Tempe, Arizona Tucson, Arizona Bakersfield, California Fresno, California Irvine, California Lafayette, California Long Beach, California Los Angeles, California Los Gatos, California Modesto, California Petaluma, California Redlands, California Rocklin, California Sacramento, California San Diego, California San Francisco, California San Luis Obispo, California Thousand Oaks, California Walnut Creek, California Boulder, Colorado Denver, Colorado Fort Collins, Colorado Washington, District of Columbia Hamden, Connecticut Hartford, Connecticut Fort Myers, Florida Jacksonville, Florida Naples, Florida Orlando, Florida Panama City, Florida Port Charlotte, Florida Sarasota, Florida Tallahassee, Florida Tampa, Florida Atlanta, Georgia Duluth, Georgia Macon, Georgia Chicago, Illinois Springfield, Illinois
Indianapolis, Indiana Waterloo, Iowa Lexington, Kentucky Louisville, Kentucky New Orleans, Louisiana West Monroe, Louisiana Scarborough, Maine Topsham, Maine Boston, Massachusetts Northampton, Massachusetts Westford, Massachusetts Ann Arbor, Michigan Detroit, Michigan Lansing, Michigan Rochester, Minnesota St. Cloud, Minnesota St. Paul, Minnesota White Bear Lake, Minnesota St. Louis, Missouri Las Vegas, Nevada Reno, Nevada Auburn, New Hampshire Mount Laurel, New Jersey Rochelle Park, New Jersey Toms River, New Jersey Albany, New York Binghamton, New York Buffalo, New York Elmira, New York Hauppauge, New York New York, New York Rochester, New York Charlotte, North Carolina Raleigh, North Carolina Winston-Salem, North Carolina Fargo, North Dakota Canton, Ohio Cincinnati, Ohio Cleveland, Ohio Columbus, Ohio Logan, Ohio Sylvania, Ohio
Toledo, Ohio Portland, Oregon Butler, Pennsylvania Philadelphia, Pennsylvania Pittsburgh, Pennsylvania Plymouth Meeting, Pennsylvania State College, Pennsylvania West Chester, Pennsylvania Charleston, South Carolina Nashville, Tennessee Arlington, Texas Dallas, Texas Houston, Texas Salt Lake City, Utah South Burlington, Vermont Leesburg, Virginia Redmond, Washington Seattle, Washington Buckhannon, West Virginia Charleston, West Virginia Green Bay, Wisconsin Madison, Wisconsin Milwaukee, Wisconsin Waupun, Wisconsin
INTERNATIONAL
St. Michael, Barbados London, England Ahmedabad, India Panama City, Panama Guaynabo, Puerto Rico
Abu Dhabi, United Arab Emirates Dubai, United Arab Emirates
14. 2011 STANTEC FINANCIAL REVIEW
STANTEC INC.
MANAGEMENT’S DISCUSSION AND ANALYSIS
and
CONSOLIDATED FINANCIAL STATEMENTS
For the Years Ended December 31, 2011, and 2010
MANAGEMENT’S DISCUSSION AND ANALYSIS
February 23, 2012
This discussion and analysis of Stantec Inc.’s operations, financial position, and cash flows for the year ended December 31, 2011, dated February 23, 2012, should be read in conjunction with the Company’s 2011 audited consolidated financial statements and related notes for the year ended December 31, 2011. Our 2011 audited consolidated financial statements are prepared in accordance with International Financial Reporting Standards (IFRS) as issued by the International Accounting Standards Board (IASB). The impact of the transition to IFRS on our reported financial position, financial performance, and cash flows, including the nature and effect of significant changes in accounting policies from those used in our consolidated financial statements for the year ended December 31, 2010, are described in the Critical Accounting Estimates, Developments, and Measures section (under the Transition to IFRS subheading) of this Management’s Discussion and Analysis and in note 38 of our December 31, 2011, audited consolidated financial statements. Unless otherwise indicated, comparative figures in this Management’s Discussion and Analysis have been restated to give effect to these changes.
Unless otherwise indicated, all amounts shown below are in Canadian dollars. Additional information regarding the Company, including our Annual Information Form, is available on SEDAR at www.sedar.com and on EDGAR at www.sec.gov. Such additional information is not incorporated by reference and should not be deemed to be made part of this Management’s Discussion and Analysis.
CAUTION REGARDING FORWARD-LOOKING STATEMENTS
Our public communications often include written or verbal forward-looking statements within the meaning of the US Private Securities Litigation Reform Act and Canadian securities laws. Forward-looking statements are disclosures regarding possible events, conditions, or results of operations that are based on assumptions about future economic conditions or courses of action and include future-oriented financial information.
Statements of this type are contained in this report, including the discussion of our goals in the Core Business and Strategy section and of our annual and long-term targets and expectations for our regions and practice areas in the Results and Outlook sections, and may be contained in filings with securities regulators or in other communications. Forward-looking statements may involve, but are not limited to, comments with respect to our objectives for 2012 and beyond, our strategies or future actions, our targets, our expectations for our financial condition or share price, or the results of or outlook for our operations.
We provide forward-looking information for our business in the Core Business and Strategy section as well as the Results (under the Results of Operations—Gross and Net Revenue, and Liquidity and Capital Resources subheadings) and Outlook sections of this report in order to describe the management expectations and targets by which we measure our success and to assist our shareholders in understanding our financial position as at and for the periods ended on the dates presented in this report. Readers are cautioned that this information may not be appropriate for other purposes.
By their nature, forward-looking statements require us to make assumptions and are subject to inherent risks and uncertainties. There is a significant risk that predictions, forecasts, conclusions, projections, and other forward-looking statements will not prove to be accurate. We caution readers of this report not to place undue reliance on our forward-looking statements since a number of factors could cause actual future results, conditions, actions, or events to differ materially from the targets, expectations, estimates, or intentions expressed in these forward-looking statements.
MANAGEMENT’S DISCUSSION AND ANALYSIS
December 31, 2011
STANTEC INC.
M-1
Future outcomes relating to forward-looking statements may be influenced by many factors, including, but not limited to, the following material and known risks, each of which is further described in the Risk Factors section of this report.
| • | Economic downturns could have a negative impact on our business since our clients may curtail investment in infrastructure projects or experience difficulty paying for services performed. |
| • | The professional consulting services industry is highly competitive, which could have a negative impact on our profit margins and market share. |
| • | The nature of our business exposes us to potential liability claims and contract disputes, which may reduce our profits. |
| • | We may be unsuccessful in our goal of growing our business organically, which could lead to a reduction in our market share. |
| • | Changing markets may offer opportunities to provide services through alternate models. Failure to respond to these market demands may result in lost revenues. |
| • | At any given time, a significant portion of our revenue may be derived from a specific geographic region, industry, or sector. Consequently, our business could suffer materially if there were a downturn in that geographic region, industry, or sector. |
| • | Interruption to our systems and network infrastructure could adversely impact our ability to operate. |
| • | We bear the risk of cost overruns in a significant number of our contracts. We may experience reduced profits or, in some cases, losses, under these contracts if costs increase above our estimates. |
| • | Uncertainties associated with an acquisition may cause a loss of employees. |
| • | We may experience difficulties in integrating an acquired entity’s business into our existing operations and so may not realize the anticipated benefits of the acquisition. |
| • | Our backlog is subject to unexpected adjustments and cancellations and is, therefore, an uncertain indicator of future earnings. |
| • | To attain our goal of increasing the size and profitability of our operations, we may pursue and invest in business opportunities outside North America. Unfamiliarity with markets and political environments may impair our ability to increase international revenues. |
| • | Goodwill and intangible assets acquired from our acquisitions represent substantial portions of our total assets. If external market factors such as adverse stock market conditions and a decline in our share price or if our acquired businesses do not perform as expected, we may be required to write down the value of our goodwill and intangible assets, which could have a material adverse effect on earnings. |
| • | One of our primary competitive advantages is our reputation. If our reputation is damaged due to client dissatisfaction, our ability to win additional business may be materially damaged. |
| • | Our employees may face environmental, health, and safety risks and hazards in the workplace resulting in injury or lost time. |
MANAGEMENT’S DISCUSSION AND ANALYSIS
December 31, 2011
STANTEC INC.
M-2
Assumptions
In determining our forward-looking statements, we consider material factors including assumptions about the performance of the Canadian and US economies in 2012 and its effect on our business. The assumptions we made in determining the outlook for each of our practice areas, our annual targets, and our outlook for 2012 are listed in the Outlook section of this report.
The preceding list of factors is not exhaustive. Investors and the public should carefully consider these factors, other uncertainties, and potential events, as well as the inherent uncertainty of forward-looking statements, when relying on these statements to make decisions with respect to our Company. The forward-looking statements contained herein represent our expectations as of February 23, 2012, and, accordingly, are subject to change after such date. Except as may be required by law, we do not undertake to update any forward-looking statement, whether written or verbal, that may be made from time to time. In the case of the ranges of expected performance for fiscal year 2012, it is our current practice to evaluate and, where we deem appropriate, provide updates. However, subject to legal requirements, we may change this practice at any time at our sole discretion.
EXECUTIVE SUMMARY
Core Business and Strategy
| • | Our Company provides professional consulting services in planning, engineering, architecture, interior design, landscape architecture, surveying, project management, environmental sciences, and project economics for infrastructure and facilities projects. |
| • | Our goal is to become and remain a top 10 global design firm, and we focus on providing professional services in the infrastructure and facilities market principally on a fee-for-service basis. |
Key Performance Drivers and Capabilities
| • | Our performance drivers are our foundation, our clients, and our people. Our performance depends on our ability to create shareholder value through building on our foundation—which includes our risk profile, delivery model, services, systems, and processes to support successful project delivery and operational effectiveness— attracting and retaining the best clients, and focusing on our people. |
Results
| • | Continued growth and profitability. Our gross revenue grew 11.3% in 2011 as compared to 2010, and we achieved a 5.3% increase in our EBITDA, which is our net income before interest expense, income taxes, depreciation, amortization, and goodwill and intangible impairment (the terms gross revenue and EBITDA are defined in the Definition of Non-IFRS and Additional IFRS Measures in the Critical Accounting Estimates, Developments, and Measures section of this report). Excluding the impact of a $90.0 million non-cash goodwill impairment charge, net income increased 8.4% to $102.7 million compared to $94.7 million in 2010, and our diluted earnings per share increased 9.2% to $2.25 as compared to $2.06 in 2010. |
| • | Ongoing ability to adapt to challenging economic conditions.We achieved these positive results in a challenging economic environment and competitive landscape. In 2011, we continued to show strong operational performance, demonstrating our ability to adapt our business model to changing markets. |
| • | Growth through acquisition. Acquisitions completed in 2010 and 2011 contributed $183.2 million to the increase in our gross revenue from 2010 to 2011. We completed five acquisitions in 2011. |
MANAGEMENT’S DISCUSSION AND ANALYSIS
December 31, 2011
STANTEC INC.
M-3
| • | Strong balance sheet and liquidity. Our balance sheet remains solid. In 2011, we generated strong cash flows from operations, which we used for operations and acquisition growth. In 2011, we extended the maturity of our $350 million revolving credit facility to August 31, 2015. At December 31, 2011, $259.5 million of our credit facility was available for future acquisitions, working capital needs, and general corporate purposes. To gain additional financial flexibility in 2011, we issued $70 million of 4.332% senior secured notes, due May 10, 2016, and $55 million of 4.757% senior secured notes, due May 10, 2018. |
| • | Dividend policy. Stantec’s board of directors approved a dividend policy on February 15, 2012, and concurrently declared its first quarterly dividend. This reflects our financial strength and confidence in our ability to generate ongoing cash flow from operations, continue to grow revenue, and complete strategic acquisitions while providing enhanced shareholder returns. |
Outlook
| • | We believe that our overall outlook for 2012 is a moderate increase in organic gross revenue, with a targeted 2.0 to 3.0% increase compared to 2011, particularly in geographic locations and practice area units where we are a top-tier service provider. The outlook for each practice area unit in 2012 ranges from stable for our Buildings practice area unit, to stable to moderate organic growth for our Environment, Urban Land, and Transportation practice area units, to moderate organic growth for our Industrial practice area unit. |
Risks
| • | Various risk factors could cause our actual results to differ materially from those projected in the Outlook section and other forward-looking statements in this report. The material, known risks are described in the Risk Factors section of this report. Although the difficult economic environment appears to be slowly improving, related pressures, such as increased competition, margin compressions, project delays, and fiscal rebalancing, are not expected to subside immediately. Pressures and uncertainties related to economic recovery, volatility in the Canadian/US exchange rate, and public infrastructure funding may adversely impact our outlook for 2012. |
CORE BUSINESS AND STRATEGY
Our Company provides professional consulting services in planning, engineering, architecture, interior design, landscape architecture, surveying, project management, environmental sciences, and project economics for infrastructure and facilities projects. By integrating our expertise in these areas across North America and in other international locations, we are able to work as One Team to provide our clients with a vast number of project solutions. This integrated approach enables us to execute our “Global Expertise. Local Strength.” operating philosophy by maintaining a world-class level of expertise, which we supply to our clients through the strength of our local offices.
We focus on providing professional consulting services in the infrastructure and facilities market, principally on a fee-for-service basis, while participating in various models of alternative project delivery. By focusing on a multidisciplinary service delivery, we also support clients throughout the project life cycle—from the initial conceptualization and financial feasibility study to project completion and beyond.
MANAGEMENT’S DISCUSSION AND ANALYSIS
December 31, 2011
STANTEC INC.
M-4
Our goal is to become and remain a top 10 global design firm. In 2009, we developed a new 10-year strategic plan for achieving our goal. From 2010 to 2020, we intend to continue to increase the depth and breadth of our services. We are confident that we can do so because we have built a solid foundation—made up of a robust business strategy, workforce, organizational structure, and systems—to take us into the future. We will remain focused on servicing the North American market while gradually increasing our geographic reach in other markets that are best suited and receptive to our services as these services evolve and mature. Currently, international work outside of North America accounts for 4% of our business. By 2020, we aim to generate up to 10% of our revenue from our international work. During the year, we revised this target from 20% to 10% in light of the current uncertain global economy and our short-term focus on strengthening our presence in the United States.
Our strategy involves balancing organic and acquisition growth. We will continue to focus on organic growth by expanding our existing business through concentrating on cross-selling existing services to our clients, whether global/national or regional/local. Our One Team approach helps us to provide these integrated services to our clients, which—in turn—results in organic growth.
Our strategy for achieving our vision is by:
| • | Positioning ourselves among the top-three service providers in the geographic locations in which we operate |
| • | Focusing on operational excellence |
| • | Providing expertise and value-added services to our clients with a commitment to excellence in project execution through integrated quality management systems |
| • | Driving a client-focused culture through cross-selling efforts and account management strategies |
| • | Mitigating risk by taking on little or no construction risk and through project diversification among many clients and geographic regions through the use of a focused, three-dimensional business model |
Our business model is a key element of our strategy since it allows us to manage risk while continuing to increase our revenue and earnings through geographic diversification and practice area unit specialization and by providing design solutions in all five phases of the infrastructure and facilities project life cycle (planning, design, construction, maintenance, and decommissioning). Because of the diversity of our model, we are generally able to adapt to changes in market conditions, such as the current challenging economy, by offsetting decreased demand for services in one practice area unit with increased demand for services in another practice area unit.
Through our One Team approach to our business and service delivery, under the rules of IFRS we have one reportable segment—Consulting Services—which is an aggregate of our operating segments. Our operating segments are based on our regional geographic areas, and our chief operating decision maker (chief executive officer) assesses our Company’s performance based on financial information available from these geographic areas. In addition, we have practice area units that provide strategic direction, mentoring, and technical support to our operations across our geographic regions.
The following discussion outlines the three main components of our business model.
Geographic Diversification
During the first half of 2010, we operated in four main geographic regions in North America—Canada East, Canada West, the US East, and the US West—and had a few small offices in the Caribbean with a project presence in several other international locations. In the last half of the year, we expanded our international presence through acquisitions, adding offices in the United Kingdom, the United Arab Emirates, and India. To reflect this growth, in the beginning of 2011, we reorganized our operations into three main geographic regions: Canada, the United States, and International.
MANAGEMENT’S DISCUSSION AND ANALYSIS
December 31, 2011
STANTEC INC.
M-5
Our goal in each of our geographic locations is to position ourselves among the top three service providers. We realize this goal in our existing locations primarily by adding services through organic growth and strategic hiring, which is supplemented by acquisitions. Conversely, we achieve our target in new locations principally by acquiring and integrating firms that complement our organization, which is, in turn, supplemented by strategic hiring and organic growth.
Practice Area Unit Specialization
Currently, we provide services in five specialized and distinct practice area unit groupings: Buildings, Environment, Industrial, Transportation, and Urban Land. Focusing on this combination of project services helps differentiate us from our competitors and allows us to enhance our presence in new geographic locations and markets while establishing and maintaining long-term client relationships. Our strategy for strengthening this element of our business model is to expand the depth of our expertise in our current practice areas—a subset of our practice area units—and to selectively add complementary new practice areas to our operations.
In 2011, in order to enhance our focus on clients, we evolved our model to include 14 sectors in which our clients do business to match our expertise accordingly. The 14 sectors are: Airports & Aviation, Bridges, Commercial, Education/Institutional, Healthcare, Industrial Buildings & Facilities, Mining, Oil & Gas, Power & Energy, Roadways, Science & Technology, Transit/Rail, Urban Development, and Water. Clients within these sectors can benefit from the multidisciplinary services provided by multiple practice area units, meaning that Stantec’s One Team can provide integrated solutions to clients in these sectors.
Buildings. We provide architectural and engineering design and consulting services through two practice areas—Architecture and Buildings Engineering—to both private and public sector clients for a wide range of building types and market sectors across North America and internationally. Our core services include project and program definition; facilities planning; architectural and interior design; and structural, mechanical, electrical and acoustical engineering for both new construction and existing buildings. We also offer services in performance engineering and building operating systems, including analyses of exterior envelope, air quality, lighting, and energy efficiencies. Over the past few years, our Buildings practice area unit has also established an industry-wide reputation for leadership in sustainable and integrated design.
Our long-term goal is to become one of the world’s leading practices in the design of the built environment, and to be positioned as a leading firm worldwide for our expertise in our chosen market sectors, while building and maintaining a foundation of local operations that have stature and critical mass in their respective local communities. We believe the needs of aging infrastructure in North America and in our international locations will provide the Buildings practice area unit with growth opportunities that are consistent with the overall growth targets for the Company as a whole. In the short term, the buildings industry in North America is experiencing volatility, increased competition, and uncertainty in funding for public and private sector projects. Nevertheless, over the past year we have secured projects in our principal focus areas of healthcare and educational facility planning and design. Our outlook for 2012 assumes our ability to take advantage of our expanded geographic presence to pursue North American and international opportunities, and we believe we are well positioned to secure Public-Private Partnership (P3) opportunities, which continue to emerge in Canada and appear poised to emerge in the United States.
Environment. We provide solutions for water supply and wastewater treatment for communities and industry; planning and permitting infrastructure projects; ecosystem restorations; and soil-structure interaction evaluations through our Water, Environmental Services, and Geotechnical practice areas. Approximately one third of Environment’s revenue is derived from water supply, treatment, storage, transmission, and distribution; wastewater collection, pumping, treatment, and disposal; and watershed management. We derive the remaining
MANAGEMENT’S DISCUSSION AND ANALYSIS
December 31, 2011
STANTEC INC.
M-6
revenue from the provision of environmental services such as environmental assessments, documentation, and permitting; ecosystem restoration planning and design; environmental site management and remediation; subsurface investigation and characterization; and geotechnical engineering services. Half of our environmental services are provided to clients in the oil and gas, power, and mining sectors as part of regulatory and permitting activities. The other half of our environmental services’ revenue is derived from a range of other development activities in the communities and clients we service.
In 2012 and over the next five years, we will focus on strengthening our Environment practice area unit by continuing to expand its profile and market share throughout North America, primarily to clients in the mining, power, and oil and gas sectors. By 2020, we expect to be a top-tier firm in the water and environmental services sectors in North America. In the oil and gas sector, we aim to be a leading global firm in the environmental review, permitting, and licensing markets and a top-tier provider of liability management services to top energy firms worldwide.
Industrial. We provide consulting and design services to private, public, and government clients through five practice areas: Industrial Buildings & Facilities, Mining, Oil & Gas, Power, and Program & Project Management. Our core services include planning, functional programming, all aspects of engineering project management, and operational and construction support. We also provide specialty services in strategic management consulting and in the management of multibillion-dollar client programs through our Program & Project Management practice area.
In 2011, we experienced substantial growth in Mining, especially in potash. We also experienced growth in Oil & Gas, especially in pipeline terminals and system-assisted gravity drainage, and in Industrial Buildings & Facilities, where large transport and equipment dealers, manufacturers, and servicing companies—both public and private—renewed or constructed facilities. Efforts in Power secured new projects in the area of clean coal, landfill gas combustion, and the evolving business of the Smart Grid.
Over the next five years, we expect to grow organically and to complete acquisitions that complement our existing services in order to become a top-tier service provider in North America and to generate a greater portion of our Industrial revenues internationally. Our goal for 2020 is to develop several of our sectors into top 10 service providers in North America and earn up to 10% of our industrial revenues through international work.
Transportation. We provide transportation consulting and design services, which include project management, planning, engineering, construction administration, and infrastructure management. More specifically, we prepare transportation master plans for communities; conduct transportation investment studies; plan and design airport, transit, rail, and highway facilities; provide administration and support services for the construction of specific projects; and provide ongoing management planning for the upkeep of transportation facilities. In addition, we provide specialized services such as simulation modeling, evaluate the effectiveness of alternative transportation demand and supply management techniques, prepare investment-grade revenue studies for funding transportation projects, provide public consultation and environmental assessment skills to build broad public support for infrastructure plans, and design and implement integrated infrastructure/asset management systems for all types of transportation infrastructure.
Over the next five years, we expect this practice area unit to move from a top 20 position to a top 10 position in North America through continued development of a strong local presence in growing urban areas, which will be supplemented by expertise in specialty skills that, along with a focus on exemplary levels of client service, differentiate us from other local firms offering similar skill sets. For 2020, our goal is to have a top-five Transit/Rail sector, viable Airports & Aviation and Bridges sectors, and a well-diversified Roadways sector that is capable of competing for the largest and most complex projects in most major urban areas across North America.
MANAGEMENT’S DISCUSSION AND ANALYSIS
December 31, 2011
STANTEC INC.
M-7
Public funding is a key element in the growth opportunities in 2012 and beyond for the Transportation practice area unit, and increases in those funds is limited by budget deficit reduction efforts in most jurisdictions. The P3 and other alternative project delivery models are strong in Canada and, despite limitations on public funding, we expect to see increased opportunities in the United States in the next five years. We will continue to monitor developments in alternate project delivery and other funding mechanisms and focus on those geographic areas and subsets of transportation where funding is the most robust.
Urban Land. We provide planning, landscape architecture, geomatics, engineering, and project management solutions—in greenfield, brownfield, and urban developments—principally for land development, municipal, institutional, real estate, and retail and commercial clients through two practice areas: Urban Development and Geomatics. Our core services include, or relate to, conceptual and master planning, development approvals and entitlement, infrastructure design, landscape architecture, construction review, and a wide variety of surveying and geomatics services to support the residential, commercial, and retail land development industries, municipalities, and major colleges and universities.
The Canadian housing market continued to be relatively buoyant in 2011 and our Canadian Urban Land practice area unit is generally performing well. The US housing market was relatively stable in 2011 compared to 2010, and we believe the anticipated economic recovery in the United States will be slow while the Canadian market will remain robust, although growing at a less accelerated pace. Over the next 5 to 10 years, we aim to be a North American leader in providing integrated planning and urban design services as well as geospatial services (geographic information systems, scanning, survey geodetics, and remote sensing).
Life Cycle Solutions
The third element of our business model is the provision of professional services in all five phases of the project life cycle—planning, design, construction, maintenance, and decommissioning. This inclusive approach enables us to deliver services during periods of strong new capital project activity (i.e., design and construction) as well as during periods of lower new capital project expenditures (i.e., maintenance and rehabilitation). Beginning with the planning and design stages, we provide conceptual and detailed design services, conduct feasibility studies, and prepare plans and specifications. During the construction phase, we generally act as the owners’ representative, providing project management, surveying, and resident engineering services. We focus principally on fee-for-service type work and generally do not act as the contractor or take on construction risk. Following project completion, during the maintenance phase, we provide ongoing professional services for maintenance and rehabilitation projects in areas such as facilities and infrastructure management, facilities operations, and performance engineering. Finally, in the decommissioning phase, we provide solutions, recommendations, and remediation strategies for taking facilities out of active service.
Going forward, our strategy is to continue to expand the scope of services we provide in the initial planning stages and during maintenance, enabling us to establish longer-term relationships with clients throughout the project life cycle. Our three-dimensional business model allows us to provide services to many clients and for many projects, ensuring that we do not rely on a few large projects for our revenue and that no single client or project accounts for more than 5% of our business.
MANAGEMENT’S DISCUSSION AND ANALYSIS
December 31, 2011
STANTEC INC.
M-8
KEY PERFORMANCE DRIVERS AND CAPABILITIES
The three key drivers of our strategic plan are our foundation, our clients, and our people. Our performance depends on our ability to create shareholder value through building on our foundation, attracting and retaining the best clients, and focusing on our people. Based on our successes in those areas, we believe that we are well positioned to realize our goal of becoming and remaining a top 10 global design firm.
Foundation
Our foundation includes our risk profile, delivery model, services, systems, and processes to support successful project delivery and operational effectiveness. Some of the ways our Company focuses on these components are through improved communication and engagement within our balanced leadership model; strengthening resources and support for the One Team model in order to promote a quality management culture that is committed to excellence in project execution; and providing outstanding client service while building a culture of cross-selling and fostering organic growth. Some of the important key elements to our foundation are described below.
Operational excellence
To create our shareholder value, we focus strongly on operational excellence, a core component of the Stantec operating model. An example of one of the ways operational excellence is being deployed is the project management framework, which focuses on improving project planning capabilities and tools, and providing a disciplined commitment to quality assurance and peer review requirements. Operational excellence is also structured around operational organization and support, which includes developing more cost-effective methods in which to contract and provide services to our clients, and reporting and compliance, which focuses on providing external stakeholders with information relevant and timely for their decision-making purposes and to comply with applicable regulations. With regard to effective project management and execution, in 2008 we achieved registration with the International Organization for Standardization’s (ISO) 9001:2000 quality management standard, and in 2010, we updated this certification to the ISO 9001:2008 standard. ISO 9001:2008 is a globally recognized set of requirements for establishing effective quality management systems.
Financing
Our success also depends on our continuing ability to finance our growth plan. Adequate financing gives us the flexibility to acquire firms that are appropriate to our vision and complement our business model. Since we became publicly traded on the Toronto Stock Exchange (TSX) in 1994, we have increased our gross revenue at a compound annual rate of 18.9%. To fund such growth, we require cash generated from both internal and external sources. Historically, we have completed acquisitions using mostly cash and notes, while at opportune times raising additional funds through equity issuances to replenish our cash reserves, pay down debt, or strengthen our balance sheet. However, we have not made an equity offering since 2005, but instead have funded our growth with cash generated from our operations. In 2010, as part of our long-term financing strategy, we filed a short-form shelf prospectus with regulatory authorities in Canada and the United States, which allows us to issue, from time to time, up to $300 million in common shares until June 2012. In 2011, we extended the maturity of our existing $350 million revolving credit facility to August 31, 2015. This facility also gives us access to an additional $75 million, subject to approval from our lenders. At December 31, 2011, $259.5 million of the facility was available to fund future activities. In addition, in 2011, we issued $70 million of 4.332% secured notes due May 10, 2016, and $55 million of 4.757% senior secured notes due May 10, 2018, which was used to repay existing debt.
Growth opportunities and integration
Our current markets give us many opportunities to build toward our goal of becoming and remaining a top 10 global design firm. We believe that such growth is necessary in order to enhance the depth of our expertise,
MANAGEMENT’S DISCUSSION AND ANALYSIS
December 31, 2011
STANTEC INC.
M-9
broaden our services, increase our shareholder value, provide more opportunities for our employees, and leverage our information technology systems. Our strategy combines organic growth with the acquisition of firms that believe in our vision and want to be part of our dynamic Company. We are confident that we can continue to take advantage of acquisition opportunities because we operate in an industry sector that includes more than 100,000 firms, most of which are small. According toEngineering News-Record’s2011 report on the top 500 design firms, the largest engineering and architecture companies headquartered in the United States—our principal competitors—generate about US$80 billion in annual fees, approximately 25% of which they earn internationally. Currently, we have approximately a 2% share of these top 500 design firms’ annual fees.
The integration of acquired firms begins immediately following the acquisition closing date and generally takes between six months and two years to complete. It involves the implementation of our Company-wide information technology and financial management systems as well as provision of support services from our corporate and regional offices. This approach allows new staff to focus on their primary responsibility of continuing to serve clients with minimal interruption while taking advantage of our systems and expertise.
Our acquisition and integration program is managed by a dedicated acquisition team that supports, or is responsible for, the tasks of identifying and valuing acquisition candidates, undertaking and coordinating due diligence, negotiating and closing transactions, and integrating employees and systems following an acquisition. This team is complemented and enhanced by other operational staff as appropriate. We measure our success in integrating acquired employees through a post-integration survey and use the survey results to improve future integration activities. In addition, we measure our growth success by monitoring our year-over-year increase in gross revenue that is due to organic and acquisition growth.
Market presence
Key to our success is achieving a certain level of market presence in the geographic locations we serve. Our target is to be among the top three service providers in each of our geographic locations and practice areas. With this level of market presence, we are less likely to be affected by downturns in regional economies. Top-three positioning also gives us increased opportunities to work for the best clients, obtain the best projects, and attract and retain the best employees in a region, which is important for building or maintaining the staff needed to generate consistent performance and to support regional company infrastructure.
Stantec has a clear strength in the Canadian market: currently, we are the second-largest consulting firm in Canada and enjoy top-tier positioning in a majority of our locations and practices. In addition to this market presence, we are now realizing on our growing position in the United States and have taken strong steps to better position ourselves as a national firm. This means that in the next five years, we anticipate tripling the size of our US operations, which will make us a top-tier design firm in North America.
Clients
Another performance driver is our ability to attract and retain top clients. For us, the best clients are those with whom we have long-term relationships and for whom we provide multiple services and complete large and innovative projects. Currently, a majority of our business comes through repeat clients, and our 10 largest clients account for about 10% of our revenue. Our focus is to expand the number of top clients we serve through an account management program designed to increase organic growth by building on relationships with existing clients, and to reflect a stronger balance between global/national and regional/local clients.
Types of clients
Attracting and retaining the best clients relies on providing bundled services over a long period of time. These clients have predictable, sustainable, and profitable revenue streams, and through cross-selling, these clients quickly see the value of not only our Company, but also our people. We believe one of the most powerful ways to
MANAGEMENT’S DISCUSSION AND ANALYSIS
December 31, 2011
STANTEC INC.
M-10
develop a unified culture is through design assignments for global/national clients that require collaboration and coordination across the Company. Some of our acquired firms have brought a client portfolio with them that is global/national in nature. These global/national clients, with programs extending throughout North America and beyond, position Stantec well in our efforts to reflect balance in our client base.
Account Management and Marketing & Business Development
Finding and retaining clients is a key component of our success, and to meet this goal, we develop targeted marketing and business development plans for our top clients. This activity is completed on a geographic and practice area unit basis to identify our top regional/local clients, and on a sector basis for our global/national clients. By strategically ensuring that a quality client base is being created through setting well-defined goals and related action plans, we are able to maintain a focus on both our regional/local and global/national clients. We also continue to expand our account management program to our top regional/local accounts and consider alternate funding strategies to cultivate growth of our global/national accounts.
Based on our success in these areas, we believe that we are well positioned to continue to be one of the principal providers of professional design and consulting services in our geographic regions.
People
Our most important performance driver is our people. Our success depends on having qualified people. To that end, we concentrate on enhancing our health, safety, and environment program (HSE) to best-in-class, improving employee retention, and aligning our internal communications strategy to improve the delivery of our strategic plan to employee and stakeholder audiences.
Employees
Employees create the project solutions we deliver to clients. Consequently, to achieve our goal of becoming and remaining a top 10 global design firm, we must increase our workforce through a combination of organic hiring and acquisitions. One way we measure our success in this area is by total staff numbers. In 2011, our employee numbers increased to approximately 11,100 from 10,700 in 2010. At December 31, 2011, our workforce was made up of about 6,400 professionals, 3,500 technical staff, and 1,200 support personnel.
To attract and retain qualified people, we offer opportunities to be part of “One Team,” working on challenging multidiscipline projects with some of the most talented people in our industry. We are continually strengthening and supporting our people-oriented culture. For example, during 2011, we continued to deliver face-to-face on-demand project management training sessions and invest in health and safety initiatives, such as education and training for supervisors in health and safety rights and responsibilities. In addition, we continued to roll out the leadership development program we launched in 2008 to leaders throughout our regions. Looking forward to 2012, we will continue to assess and develop our leaders at all levels, from our vice presidents to front-line supervisors.
As well, in 2011, revisions were made to our Career Development and Performance Review process to put a greater emphasis on career management, and we are now developing well-defined leadership, knowledge, and project management career streams to support entrepreneurship, innovation, and project execution. Each career path is distinct and requires different skill sets and knowledge that will allow our employees to take responsibility for managing their careers. Training, coaching, and mentoring will continue to be key components in focusing on building both today’s and tomorrow’s team.
We provide a comprehensive, competitive benefits program that attracts and retains the right talent to achieve our operating and strategic goals. We have created an award-winning wellness culture that provides tools and support to help employees and their families improve their health and well-being.
MANAGEMENT’S DISCUSSION AND ANALYSIS
December 31, 2011
STANTEC INC.
M-11
To measure our success in attracting and retaining staff, we use tools such as employee surveys, 360-degree feedback, and exit interviews. The results of these performance metrics help us develop programs and initiatives for improving and maintaining staff engagement. We also track turnover rates for our staff through our business information system.
Our diversified portfolio approach to business generally enables us to redeploy a portion of our workforce when faced with changes in local, regional, or national economies or practice area demand. Although there will always be some areas where it will be difficult to find appropriate staff during certain periods, as we increase in size we become better able to address these issues by using staff from other parts of the Company, either through temporary relocation or work sharing. We are continually improving our ability to work on projects from multiple locations through standardized practices and systems, project collaboration, and web-based technology.
Leadership
Our ability to align the activities of our senior managers with our short- and long-term financial and strategic goals is also an important driver for our success. To this end, in addition to fixed salaries, we provide, on a discretionary basis, short- and long-term compensation designed to reward our senior managers (including our chief financial and chief operating officers, regional operating unit leaders, and practice area unit leaders) for their individual and corporate contributions to meeting our objectives. The short-term compensation consists of an annual employee cash bonus. The total amount available in the annual employee bonus pool is calculated as a percentage of our annual pre-tax, pre-bonus net income, which we believe directly ties the interests of our bonus-eligible employees, including our senior managers, to our financial performance. In determining the awards each year, we balance the managers’ overall contributions to our profitability Company-wide with the performance of their individual business unit, an approach that, in our view, creates a sense of shared responsibility for achieving outstanding business results and meeting our clients’ needs. In 2011, we implemented a restricted share unit incentive plan for our senior vice presidents through which they are granted annually, as part of their bonus, an allotment of restricted share units that they receive after two years as cash equal to the units’ market value. The market value of the units is based on the market value of our shares. We believe that this plan, by its nature, further invests our senior vice presidents in our longer term share performance.
As part of long-term compensation for our key staff, we grant options through our employee share option plan. In 2011, we improved our share option plan by tying the amount of share options available to be granted in a year to key performance metrics such as growth in earnings per share and net pre-tax, pre-bonus net income as a percentage of net revenue. Key staff may be granted options to purchase shares as part of their total compensation, which further aligns their interests with those of our shareholders and encourages them to stay employed with us over the long term. In making the decision to award options to an individual, our chief executive officer (CEO) and senior management team consider the individual’s ability to contribute to our long-term success, along with other factors.
Similarly, our CEO’s compensation package, which is governed by the terms of his employment agreement, includes a base salary; an annual bonus calculated as a percentage of our pre-tax, pre-bonus income; and a prescribed allotment of deferred share units. We require our CEO, senior vice presidents, chief operating officer, and chief financial officer to own a minimum number of shares, representing a specific percentage of their base salary, in the Company. We believe that deferred share units and minimum ownership requirements provide the appropriate incentives for our CEO to achieve a minimum growth rate in our share price, thereby aligning executive compensation with the interests of shareholders.
MANAGEMENT’S DISCUSSION AND ANALYSIS
December 31, 2011
STANTEC INC.
M-12
Since the results of our operations are dependent on the abilities and efforts of the members of our senior management team and other key personnel, our Corporate Governance and Compensation Committee and senior managers regularly review our succession planning measures for management.
RESULTS
Fourth Quarter Results
Our revenue growth in Q4 11 was solid compared to Q4 10. Gross revenue increased 12.6% to $432.0 million from $383.7 million, and our EBITDA increased 9.6% to $46.8 million from $42.7 million. Excluding the impact of a $90.0 million non-cash goodwill impairment charge, our net income increased 4.3% to $24.3 million from $23.3 million and our diluted earnings per share increased 3.9% to $0.53 from $0.51 when comparing Q4 11 to Q4 10 as further explained below.
The following table summarizes our key operating results for Q4 11 on a percentage of net revenue basis and the percentage increase in the dollar amount of these results compared to the same period last year:
| Quarter Ended December 31 | % of Net Revenue | % Increase (Decrease)* | % Increase (Decrease)* without Goodwill Impairment | |||||||||||||||||||||
|
|
|
|
|
| |||||||||||||||||||
| (In millions of Canadian dollars, except %) | 2011 | 2010 | 2011 | 2010 | 2011 vs. 2010 | 2011 vs. 2010 | ||||||||||||||||||
| ||||||||||||||||||||||||
Gross revenue** | 432.0 | 383.7 | 124.1% | 123.4% | 12.6% | 12.6% | ||||||||||||||||||
Net revenue** | 348.2 | 310.9 | 100.0% | 100.0% | 12.0% | 12.0% | ||||||||||||||||||
Direct payroll costs | 156.3 | 133.4 | 44.9% | 42.9% | 17.2% | 17.2% | ||||||||||||||||||
Gross margin ** | 191.9 | 177.5 | 55.1% | 57.1% | 8.1% | 8.1% | ||||||||||||||||||
Administrative and marketing expenses | 144.4 | 133.7 | 41.5% | 43.0% | 8.0% | 8.0% | ||||||||||||||||||
Depreciation of property and equipment | 7.4 | 7.1 | 2.1% | 2.3% | 4.2% | 4.2% | ||||||||||||||||||
Impairment of goodwill | 90.0 | - | 25.8% | 0.0% | n/m | n/m | ||||||||||||||||||
Amortization of intangible assets | 5.0 | 5.2 | 1.4% | 1.7% | (3.8% | ) | (3.8% | ) | ||||||||||||||||
Net interest expense | 2.2 | 2.3 | 0.6% | 0.7% | (4.3% | ) | (4.3% | ) | ||||||||||||||||
Other net finance expense | 0.7 | 0.6 | 0.3% | 0.2% | 16.7% | 16.7% | ||||||||||||||||||
Share of income from associates | (0.4 | ) | (0.4 | ) | (0.1% | ) | (0.1% | ) | 0.0% | 0.0% | ||||||||||||||
Foreign exchange loss | 0.4 | 0.4 | 0.1% | 0.1% | 0.0% | 0.0% | ||||||||||||||||||
Other expense | - | 0.5 | 0.0% | 0.2% | (100.0% | ) | (100.0% | ) | ||||||||||||||||
Income (loss) before income taxes | (57.8 | ) | 28.1 | (16.6% | ) | 9.0% | (305.7% | ) | 14.6% | |||||||||||||||
Income taxes | 7.9 | 4.8 | 2.3% | 1.5% | 64.6% | 64.6% | ||||||||||||||||||
Net (loss) income for the period | (65.7 | ) | 23.3 | (18.9% | ) | 7.5% | (382.0% | ) | 4.3% | |||||||||||||||
| ||||||||||||||||||||||||
| * | % increase (decrease) calculated based on the dollar change from the comparable period |
| ** | The terms gross and net revenue and gross margin are defined in the Definition of Additional IFRS Measures in the Critical Accounting Estimates, Developments, and Measures section of this report. |
n/m = not meaningful
| Gross Revenue | Q4 11 vs. Q4 10 | |||
| (In millions of Canadian dollars) | ||||
| ||||
Increase in gross revenue due to: | ||||
Acquisition growth | 38.4 | |||
Organic growth | 8.2 | |||
Impact of foreign exchange rates on revenue earned by foreign subsidiaries | 1.7 | |||
| ||||
Total net increase in gross revenue | 48.3 | |||
| ||||
MANAGEMENT’S DISCUSSION AND ANALYSIS
December 31, 2011
STANTEC INC.
M-13
As indicated in the tables above, during Q4 11, our gross revenue increased by $48.3 million, or 12.6%, to $432.0 million compared to $383.7 million for the same period in 2010. Approximately $38.4 million of this increase resulted from an increase in revenue from acquisitions completed in 2011 and 2010, $8.2 million resulted from organic growth, and $1.7 million was due to foreign exchange. The foreign exchange impact was due to the weakening of the Canadian dollar in Q4 11. During Q4 11, the average exchange rate for the Canadian dollar relative to the US dollar was US$0.98 compared to US$0.99 during Q4 10.
The following table summarizes the change in gross revenue by practice area unit in the fourth quarter of 2011 compared to the same period in 2010.
| Practice Area Unit Gross Revenue | Quarter Ended December 31 | |||||||||||||||||||||||
| (In millions of Canadian dollars) | 2011 | 2010 | Total Change | Change Due to Acquisitions | Change Due to Organic Growth | Change Due to Foreign Exchange | ||||||||||||||||||
| ||||||||||||||||||||||||
Buildings | 98.8 | 84.5 | 14.3 | 20.2 | (6.1 | ) | 0.2 | |||||||||||||||||
Environment | 156.7 | 150.2 | 6.5 | 1.2 | 4.5 | 0.8 | ||||||||||||||||||
Industrial | 78.2 | 63.0 | 15.2 | 7.8 | 7.0 | 0.4 | ||||||||||||||||||
Transportation | 48.4 | 47.3 | 1.1 | 1.8 | (1.0 | ) | 0.3 | |||||||||||||||||
Urban Land | 49.9 | 38.7 | 11.2 | 7.4 | 3.8 | - | ||||||||||||||||||
| ||||||||||||||||||||||||
Total Consulting Services | 432.0 | 383.7 | 48.3 | 38.4 | 8.2 | 1.7 | ||||||||||||||||||
| ||||||||||||||||||||||||
Note: Comparative figures have been restated due to a realignment of several practice components between our Buildings, Industrial, Transportation, and Urban Land practice area units.
Organic growth in Q4 11 was positive in all practice area units except for Buildings and a slight decline in Transportation. The Buildings decline was due to the softening markets in the United States, United Kingdom, and Dubai compared to the same period in 2010. The buildings industry experienced increased competition and reduced funding for private and public sector projects. Our organic growth in Q4 11 compared to Q4 10 was mainly due to growth in our Industrial practice area unit. Our Industrial practice had increased activity in the mining and oil and gas sectors, where we are experiencing growth in potash and where improved oil and gas prices are creating greater project opportunities.
Net income during Q4 11 was positively impacted by the increase in gross revenue and a reduction in our administrative and marketing expenses as a percentage of net revenue from 43.0% in Q4 10 to 41.5% in Q4 11. This decrease was primarily due to a decrease in administrative and marketing labor as a percentage of net revenue in Q4 11 compared to Q4 10. Staff time charged to marketing and administrative labor may fluctuate from quarter to quarter because it is influenced by the mix of projects in progress and being pursued during the period, as well as by acquisition integration activities. In Q4 10, we were in the process of integrating the eight acquisitions completed during the second half of 2010 compared to three in the second half of 2011. In the months following the completion of an acquisition, there is usually an increase in staff time charged to administration and marketing due to integration activities including the orientation of newly acquired staff. In addition, due to this increase in acquisition activity in the second half of 2010 compared to 2011, there were more restructuring costs expensed in Q4 10.
During the fourth quarter we conducted our annual goodwill impairment test. Market fluctuations caused our share price to decrease as at October 1, 2011, which adversely impacted our market capitalization. In addition, due to ongoing challenging economic conditions, the short-term performance of our US and International cash generating units (CGUs) was
MANAGEMENT’S DISCUSSION AND ANALYSIS
December 31, 2011
STANTEC INC.
M-14
weaker than expected. Considering these factors and their impact on the results of our goodwill impairment test, we concluded that, at October 1, 2011, goodwill was impaired as further described in Goodwill in the Results section below. As a result, net income during Q4 11 was negatively impacted by a $90.0 million non-cash goodwill impairment charge. In addition, our net income in Q4 11 was negatively impacted by a reduction in gross margin as a percentage of net revenue. Our gross margin percentage was 55.1% in Q4 11 compared to 57.1% in Q4 10. This decrease quarter over quarter was mainly due to a decrease in the gross margins for our Industrial and Buildings practice area units resulting from the mix of projects during the quarter, increased competition, and a softening of the buildings industry in the United States, United Kingdom, and Dubai. The nature of our business model, which is based on diversifying our operations across geographic regions, practice areas, and all phases of the infrastructure and facilities project life cycle, will continue to cause fluctuations in our gross margin percentage from period to period depending on the mix of projects during any quarter.
Overall Annual Performance
Highlights for 2011
| (In millions of Canadian dollars, except per share amounts) | 2011 | 2010 | $ Change | % Change | ||||||||||||
| ||||||||||||||||
Gross revenue | 1,683.4 | 1,513.1 | 170.3 | 11.3% | ||||||||||||
Net revenue | 1,378.5 | 1,226.0 | 152.5 | 12.4% | ||||||||||||
Net income(note 1) | 12.7 | 94.7 | (82.7 | ) | (87.3%) | |||||||||||
Earnings per share – basic(note 1) | 0.28 | 2.07 | (1.81 | ) | (87.4%) | |||||||||||
Earnings per share – diluted(note 1) | 0.28 | 2.06 | (1.80 | ) | (87.4%) | |||||||||||
EBITDA(note 2) | 195.7 | 185.4 | 10.3 | 5.3% | ||||||||||||
Cash flows from operating activities | 114.6 | 111.9 | 2.7 | n/m | ||||||||||||
Cash flows used in investing activities | (99.4 | ) | (128.2 | ) | 28.8 | n/m | ||||||||||
Cash flows from (used in) financing activities | (41.9 | ) | 65.9 | (107.8 | ) | n/m | ||||||||||
| ||||||||||||||||
n/m = not meaningful
note 1: Net income, basic earnings per share, and diluted earnings per share would have been $102.7 million, $2.25, and $2.25, respectively, without the $90 million goodwill impairment charge in 2011.
note 2: EBITDA is calculated as net income before income taxes plus net interest expense, amortization of intangible assets, depreciation of property and equipment, and goodwill and intangible impairment as further discussed in the Definition of Non-IFRS Measures in the Critical Accounting Estimates, Developments, and Measures section of this report.
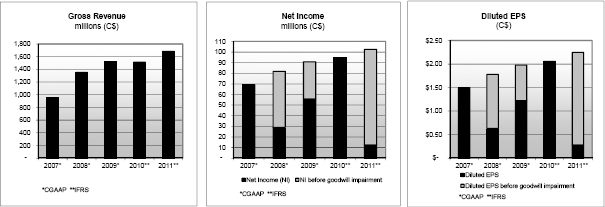
MANAGEMENT’S DISCUSSION AND ANALYSIS
December 31, 2011
STANTEC INC.
M-15
The following highlights our major financial achievements and strategic activities in 2011, as well as other factors that contributed to our financial performance and overall financial condition:
| • | Continued growth and profitability. The end of 2011 marked 58 years of uninterrupted profitability for our Company. In 2011, we achieved an 11.3% increase in gross revenue, a 12.4% increase in net revenue, and a 5.3% increase in EBITDA compared to 2010. |
In the fourth quarter of 2011, we conducted our annual goodwill impairment test. Market fluctuations caused our share price to decrease as at October 1, 2011, which adversely impacted our market capitalization. In addition, due to ongoing challenging economic conditions, the short-term performance of our US and International CGUs was weaker than expected. Considering these factors and their impact on the results of our goodwill impairment test, we concluded goodwill was impaired at October 1, 2011, and recorded a $90.0 million charge to income. The impairment charge decreased our diluted earnings per share by $1.97. The goodwill impairment charge is non-cash in nature and did not affect our liquidity, cash flows from operating activities, or compliance with our debt covenants and does not impact the operations of our business.
Excluding the impact of the goodwill impairment charge, our net income for 2011 would have been $102.7 million compared to $94.7 million in 2010. Our diluted earnings per share for 2011 would have been $2.25 compared to $2.06 in 2010. Our net income increase year over year was due to an 11.3% increase in gross revenue and a decrease in our administrative and marketing expenses as a percentage of net revenue from 41.7% to 41.0% due to less acquisition-related costs in the year. This was partially offset by a decrease in our gross margin from 56.1% to 55.4% due to the mixture of projects during the year, increased competition in our buildings and industrial markets, and continued softening of the United States, United Kingdom, and Dubai buildings industries. Excluding the impact of the goodwill impairment charge, our net income as a percentage of net revenue would have been 7.4% in 2011 compared to 7.7% in 2010, which demonstrates the relatively consistent performance of our operations despite the competitive market and challenging economic environment in 2011.
| • | Ongoing ability to adapt to challenging economic conditions.Our 2011 operating results were solid compared to our 2010 results, which we believe demonstrates our ability to adapt our business model to changing market conditions. Even with the slow recovery in Canada and the United States, we achieved organic revenue growth in Canada and internationally and growth through acquisitions in all our regions. We achieved positive organic revenue growth in our Industrial, Transportation, and Urban Land practice area units and acquisition growth in all our practice area units. Despite continued economic challenges, we believe that our continued focus on executing our business strategy in 2011 allowed us to achieve consistent results for our shareholders, clients, and employees. |
| • | Growth through acquisitions.Acquisitions completed in 2010 and 2011 contributed $183.2 million to the net increase in our gross revenue year over year. We completed five acquisitions in 2011. |
| • | Dividend policy. Subsequent to the year-end, on February 15, 2012, Stantec’s board of directors approved a dividend policy and concurrently declared its first quarterly dividend of $0.15 per share, payable on April 17, 2012, to shareholders of record on March 30, 2012. The declaration of this dividend reflects the confidence of our board of directors and management in our ability to generate ongoing cash flow from operations, continue to grow revenue, and complete strategic acquisitions while providing enhanced shareholder returns. |
MANAGEMENT’S DISCUSSION AND ANALYSIS
December 31, 2011
STANTEC INC.
M-16
| • | Strong balance sheet and liquidity.Our balance sheet remains solid. In 2011, our operating cash flows increased from $111.9 million in 2010 to $114.6 million in 2011. During the year, we extended the maturity date of our existing $350 million revolving credit facility to August 31, 2015. At December 31, 2011, $259.5 million of our revolving credit facility was available for future acquisitions, working capital needs, and general corporate purposes. To allow additional flexibility, in 2011, we issued $70.0 million of 4.332% senior secured notes due May 10, 2016, and $55.0 million of 4.757% senior secured notes due May 10, 2018. |
| • | Created an international region.With the addition of Anshen & Allen Architecture, Inc. and Burt Hill, Inc. in 2010, we expanded our international footprint to office locations in India, the United Kingdom, and the United Arab Emirates. As a result, we reorganized our management structure and created a new International region. |
| • | Leadership succession.As part of our continuing, strong succession plan, during 2011, Mr. Aram H. Keith succeeded Ron Triffo as chair of the Stantec Board of Directors. Mr. Keith has been a board member since 2005. He cofounded The Keith Companies, Inc. in 1983 and served as its chief executive officer and as a board member until its acquisition by Stantec in 2005. Mr. Keith received a bachelor of science degree in civil engineering from California State University at Fresno. Now retired, he serves on several nonprofit boards and is very active in various philanthropic endeavors. |
In addition, during 2011, Mr. Doug Ammerman and Dr. Delores Etter were appointed to Stantec’s Board of Directors. Mr. Ammerman brings nearly 40 years of fiscal and organizational leadership experience, including 30 years with KPMG where he served as a partner. Dr. Etter brings more than 35 years of technical leadership in both the academic and government sectors and in electrical and software engineering, including a tenure serving as the assistant secretary of the Navy for Research, Development, and Acquisition.
| • | Conversion to IFRS: We successfully completed the conversion of our financial processes and results to IFRS. Our 2011 audited consolidated financial statements have been prepared under IFRS along with our comparative figures as further discussed on pages M-51 to M-58 in this report. |
Results Compared to 2011 Targets
In our 2010 Management’s Discussion and Analysis, we established various ranges of expected performance for 2011.
The following table presents the results we achieved in 2011:
| Measure | 2011 Expected Range | Results Achieved | Results before Goodwill Impairment | |||||||||||||
| ||||||||||||||||
Gross margin as % of net revenue | Between 54.5 and 56.5% | 55.4 | % | ü | 55.4 | % | ü | |||||||||
Administrative and marketing expenses as % of net revenue | Between 41 and 43% | 41.0 | % | ü | 41.0 | % | ü | |||||||||
Net income as % of net revenue | At or above 6% | 0.9 | % | x | 7.4 | % | ü | |||||||||
Effective income tax rate | At or below 28.5% | 74.5 | % | x | 26.5 | % | ü | |||||||||
Return on equity(note 1) | At or above 14% | 1.9 | % | x | 15.5 | % | ü | |||||||||
Net debt to equity ratio(note 2) | At or below 0.5 to 1 | 0.41 | ü | 0.36 | ü | |||||||||||
| ||||||||||||||||
note 1: Return on equity is calculated as net income for the last four quarters divided by average shareholders’ equity over each of these quarters.
note 2: Net debt to equity ratio is calculated as long-term debt plus current portion of long-term debt and bank indebtedness less cash and short-term deposits, all divided by shareholders’ equity.
Return on equity and net debt to equity ratio are defined in the Definition of Non-IFRS Measures in the Critical Accounting Estimates, Developments, and Measures section of this Management’s Discussion and Analysis.
| ü | Met our target |
| x | Did not meet target |
MANAGEMENT’S DISCUSSION AND ANALYSIS
December 31, 2011
STANTEC INC.
M-17
In 2011, we met our targets, with the exception of income as a percentage of net revenue, effective income tax rate, and return on equity. Excluding the impact of the goodwill impairment charge referred to above, we would have met or exceeded all our targets.
Acquisitions
Consideration for acquisitions completed in 2011 was $62.5 million and $119.1 million in 2010. In 2011, we completed the following acquisitions:
| • | On February 11, 2011, we acquired the shares and business of QuadraTec, Inc. (QuadraTec), which added approximately 50 staff to our Company. With offices in Newfoundland and Labrador, QuadraTec provides mechanical, electrical, industrial, and communications engineering; energy management; design studies; and contract management services. The addition of QuadraTec’s services augments our existing environmental and geotechnical consulting practice in St. John’s and positions us to provide a more diverse range of consulting services throughout Newfoundland and Labrador. |
| • | On May 27, 2011, we acquired the shares and business of the Caltech Group (Caltech), which added approximately 200 staff to our Company. Headquartered in Calgary, Alberta, Caltech provides multidisciplinary engineering, procurement, and construction management services. The addition of Caltech’s services augments our existing oil and gas and power business throughout North America and well positions us to provide a more diverse range of consulting services in two growing markets. Caltech has extensive experience in the design of utility, electrical asset, and telecom facilities, which includes a wide range of client planning, engineering, consulting, and development services. |
| • | On September 2, 2011, we acquired all the shares and business of Bonestroo, Inc. and Bonestroo Services, LLC (Bonestroo), which added approximately 275 staff to our Company. Bonestroo is an engineering, planning, and environmental science firm with offices in Minnesota, Wisconsin, Illinois, Michigan, and North Dakota. The addition of Bonestroo enhances and augments our expertise with their specialty services in infrastructure planning, streets and utilities, water supply, water storage, water distribution, brownfield redevelopment, environmental planning, environmental management, environmental compliance, transportation engineering, traffic engineering, bridge design, water resources management, ice design, aquatics design, athletic fields, and sports courts design. |
| • | On October 1, 2011, we acquired all the shares and business of FSC Architects and Engineers (FSC), which added approximately 85 staff to our Company. FSC is an integrated architecture and engineering firm specializing in cold climate and remote location projects. The firm has offices in Yellowknife, Northwest Territories; Whitehorse, Yukon; Iqaluit, Nunavut; and Edmonton, Alberta. FSC is active in many sectors including airports, education, emergency services, healthcare, residential, and sports and leisure, and, therefore, primarily augments our Buildings practice area unit, with additional services in Transportation and Environment. |
MANAGEMENT’S DISCUSSION AND ANALYSIS
December 31, 2011
STANTEC INC.
M-18
| • | On October 28, 2011, we acquired all the shares and business of ENTRAN, Inc. (ENTRAN), which added approximately 115 staff to our Company. The acquisition of ENTRAN augments our Transportation practice area unit. ENTRAN has offices in Lexington, Kentucky; Louisville, Kentucky; Cincinnati, Ohio; Chicago, Illinois; Nashville, Tennessee; and Charleston, West Virginia. ENTRAN specializes in roadway and bridge design, transportation planning and traffic engineering, construction engineering services, and aviation services. |
During the year, we successfully completed the migration of these acquisitions to our financial enterprise systems.
Selected Annual Information
The following highlights trending of certain annual information:
| (In millions of Canadian dollars, except per share and share amounts) | IFRS 2011 | IFRS* 2010 | (CGAAP**) 2009 | |||||||||
| ||||||||||||
Gross revenue(note 1) | 1,683.4 | 1,513.1 | 1,519.9 | |||||||||
Net income(note 2) | 12.7 | 94.7 | 55.9 | |||||||||
Earnings per share – basic(note 2) | 0.28 | 2.07 | 1.23 | |||||||||
Earnings per share – diluted(note 2) | 0.28 | 2.06 | 1.22 | |||||||||
Cash dividends declared per common share | Nil | Nil | Nil | |||||||||
Total assets | 1,327.4 | 1,337.4 | 1,123.5 | |||||||||
Total long-term debt | 296.2 | 322.0 | 234.2 | |||||||||
Outstanding common shares – as at December 31 | 45,523,585 | 45,768,320 | 45,716,820 | |||||||||
Outstanding common shares – as at February 23, 2012 | 45,528,585 | |||||||||||
Outstanding share options – as at December 31 | 1,578,300 | 1,480,831 | 1,752,298 | |||||||||
Outstanding share options – as at February 23, 2012 | 1,570,800 | |||||||||||
| ||||||||||||
note 1: The term gross revenue is defined in the Definition of Additional IFRS Measures in the Critical Accounting Estimates, Developments, and Measures section of this Management’s Discussion and Analysis.
note 2: Net income, basic earnings per share, and diluted earnings per share would have been $102.7 million, $2.25, and $2.25, respectively, without the $90 million goodwill impairment charge in 2011.
| * | Restated for IFRS |
| ** | These numbers are not restated for compliance with IFRS but are reported under Canadian GAAP (CGAAP) effective in the year concerned. |
The 5 acquisitions completed in 2011 and the 10 acquisitions completed in 2010 contributed to our year-over-year growth in gross revenue from 2010 to 2011 and the growth—prior to the goodwill impairment charge—in net income, as well as in basic and diluted earnings per share. Our 2011 net income and diluted earnings per share were also positively impacted by a decrease in our administrative and marketing expenses as a percentage of net revenue due to less acquisition-related costs in the year compared to 2010. This was partially offset by a decrease in our gross margin from 56.1% in 2010 to 55.4% in 2011 due to the mixture of projects during the year, increased competitiveness in our buildings and industrial markets, and continued softening of the United States, United Kingdom, and Dubai buildings industries.
Our 2010 gross revenue remained stable compared to 2009 despite the challenging economic environment. Gross revenue was positively impacted by the 10 acquisitions completed in 2010 and 2 completed in 2009. This was offset by an organic retraction in gross revenue in our Environment and Industrial practice area units in 2010 compared to 2009. This retraction was mainly due to the general economic slowdown in 2009, especially in the United States, resulting in lower backlog and decreased project opportunities in 2010 and the start-up of environmental projects in 2010 being slower and more cautious than anticipated. Our net income and diluted earnings per share increased from 2009 to 2010 mainly because of our focus on managing our costs and
MANAGEMENT’S DISCUSSION AND ANALYSIS
December 31, 2011
STANTEC INC.
M-19
operating effectively in 2010, as well as fewer one-time costs such as severance payments and other costs associated with the downsizing of our operations compared to 2009. In addition, in 2010 our net income and diluted earnings per share were positively impacted by a $5.9 million after-tax gain on the sale of our 30% equity investments in Fugro Jacques Geosurveys Inc. and Fugro Jacques N.V.
Balance Sheet
Our total assets decreased by $10.0 million from 2010 to 2011. This decrease was mainly due to a $39.2 million decrease in goodwill. Goodwill decreased as the result of the $90.0 million impairment charge in the fourth quarter, offset by a $43.6 million increase from acquisitions in the year and a $7.1 million impact from foreign exchange. In addition, our total assets decreased due to a $26.6 million decrease in cash and short-term deposits since cash was being held at December 31, 2010, for the payment of notes from acquisitions that were paid in early January 2011 and a $5.8 million decrease in property and equipment mainly due to depreciation. These decreases to our total assets were partially offset by a $44.1 million increase in trade and other receivables and unbilled revenue mainly due to the timing of milestone billings and increased operating and acquisition activity, and an $8.4 million increase in other financial assets principally from an increase in investments held for self-insured liabilities. As well, there was a $4.5 million increase in income taxes recoverable, a $3.2 million increase in prepaid expenses, and a $2.7 million increase in deferred tax assets due to normal business activity. The carrying value of the assets and liabilities of our US subsidiaries on our consolidated statements of financial position was positively impacted by the weakening of the Canadian dollar from US$1.01 at December 31, 2010, to US$0.98 at December 31, 2011.
Our total assets increased by $213.9 million from 2009 to 2010. This increase was primarily due to a $48.0 million increase in cash and term deposits, a $48.0 million increase in trade and other receivables and unbilled revenue, and a $79.4 million increase in goodwill primarily as a result of growth from acquisitions. Cash and term deposits increased by $48.0 million because cash was being held for the payment of notes from acquisitions that were payable in early January 2011. These increases were partially offset by the carrying value of the assets and liabilities of our US subsidiaries on our consolidated statements of financial position being negatively impacted by the strengthening of the Canadian dollar from US$0.95 at December 31, 2009, to US$1.01 at December 31, 2010.
Our total liabilities decreased $21.5 million from 2010 to 2011 primarily due to a $17.1 million decrease in our long-term borrowings and an $8.7 million decrease in notes payable due to the notes from acquisitions paid during the year. In addition, our billings in excess of costs decreased by $7.3 million due to the timing of billings, income taxes payable decreased by $4.6 million due to the payment of income taxes payable assumed from acquisitions, and other financial liabilities decreased by $7.9 million mainly because of the payment of contingent consideration from past acquisitions. These decreases were partially offset by a $5.6 million increase in trade and other payables because of higher payroll accruals from an increase in staff numbers, a $6.8 million increase in deferred tax liabilities, a $2.0 million increase in provisions, and a $9.7 million increase in other liabilities due to an increase in lease inducement benefits and lease disadvantages assumed from acquisitions and to the introduction of restricted share units in 2011. Our total liabilities also increased due to the weakening of the Canadian dollar from December 31, 2010, as explained above.
MANAGEMENT’S DISCUSSION AND ANALYSIS
December 31, 2011
STANTEC INC.
M-20
Our total liabilities increased by $145.7 million from 2009 to 2010 primarily as a result of an $85.6 million increase in our revolving credit facility from $134.6 million to $220.2 million at December 31, 2010, due to additional borrowings for the 10 acquisitions completed in 2010 and compared to the 2 completed in 2009. In addition, our trade and other payables increased $19.1 million primarily due to higher payroll costs from an increase in staff numbers and trade and other payables assumed from acquired companies. Billings in excess of costs increased $4.7 million and income taxes payable increased by $4.6 million due to tax liabilities assumed from acquired companies. Our total liabilities also decreased due to the strengthening of the Canadian dollar from December 31, 2009, as explained above.
Discussion of Operations
Our Company operates in one reportable segment—Consulting Services. We provide knowledge-based solutions for infrastructure and facilities projects through value-added professional services principally under fee-for-service agreements with clients.
The following table summarizes our key operating results on a percentage of net revenue basis and the percentage increase in the dollar amount of these results from year to year:
|
| |||||||||||||||
| Percentage of Net Revenue with Goodwill Impairment | Percentage Increase (Decrease) * | Percentage Increase (Decrease) without Goodwill Impairment * | ||||||||||||||
|
| |||||||||||||||
| 2011 | 2010 | 2011 vs. 2010 | 2011 vs. 2010 | |||||||||||||
| ||||||||||||||||
Gross revenue | 122.1% | 123.4% | 11.3% | 11.3% | ||||||||||||
Net revenue | 100.0% | 100.0% | 12.4% | 12.4% | ||||||||||||
Direct payroll costs | 44.6% | 43.9% | 14.4% | 14.4% | ||||||||||||
Gross margin | 55.4% | 56.1% | 10.9% | 10.9% | ||||||||||||
Administrative and marketing expenses | 41.0% | 41.7% | 10.7% | 10.7% | ||||||||||||
Depreciation of property and equipment | 2.0% | 2.1% | 9.4% | 9.4% | ||||||||||||
Impairment of goodwill | 6.5% | 0.0% | n/m | n/m | ||||||||||||
Amortization of intangible assets | 1.3% | 1.4% | 6.4% | 6.4% | ||||||||||||
Net interest expense | 0.7% | 0.6% | 22.8% | 22.8% | ||||||||||||
Other net finance expense (income) | 0.3% | (0.1% | ) | n/m | n/m | |||||||||||
Share of income from associates | 0.0% | (0.2% | ) | (65.2% | ) | (65.2% | ) | |||||||||
Gain on sale of equity investments | 0.0% | (0.6% | ) | (100.0% | ) | (100.0% | ) | |||||||||
Foreign exchange loss (gain) | 0.0% | 0.1% | (50.0% | ) | (50.0% | ) | ||||||||||
Other (income) expense | (0.0% | ) | 0.1% | (100.0% | ) | (100.0% | ) | |||||||||
Income before income taxes(note 1) | 3.6% | 11.0% | (63.1% | ) | 3.6% | |||||||||||
Income taxes | 2.7% | 3.3% | (7.7% | ) | (7.7% | ) | ||||||||||
Net income(note 1) | 0.9% | 7.7% | (86.6% | ) | 8.4% | |||||||||||
| ||||||||||||||||
| * | % increase calculated based on the dollar change from the comparable period |
n/m = not meaningful
note 1: Net income before income taxes as a percentage of net revenue and net income as a percentage of net revenue would have been 10.1% and 7.4%, respectively, without the $90 million goodwill impairment charge in 2011.
MANAGEMENT’S DISCUSSION AND ANALYSIS
December 31, 2011
STANTEC INC.
M-21
Our gross revenue grew 11.3% and net revenue grew 12.4% in 2011 as compared to 2010. These increases were mainly due to acquisition growth in all our practice area units and organic growth in our Industrial, Transportation, and Urban Land practice area units as further explained in the Gross and Net Revenue section below. Excluding the impact of the goodwill impairment charge, our net income for 2011 increased by 8.4%. In 2011, administrative and marketing expenses, depreciation of property and equipment, and amortization of intangibles, as a percentage of net revenue, decreased compared to 2010 as further explained in their respective sections of this report.
Gross and Net Revenue
For definitions of gross and net revenue, refer to the Definition of Additional IFRS Measures in the Critical Accounting Estimates, Developments, and Measures section of this discussion and analysis. Revenue earned by acquired companies in the first 12 months following acquisition is reported as revenue from acquisitions and, thereafter, as organic growth.
All our practice area units generate a portion of their gross revenue in the United States. The value of the Canadian dollar averaged US$1.01 in 2011 compared to US$0.97 in 2010, representing a 4.1% increase. The strengthening of the Canadian dollar had a negative effect on the revenue reported in 2011 compared to 2010.
The following table summarizes the impact of acquisitions, organic growth, and foreign exchange on our gross and net revenue for 2011 compared to 2010.
| Gross Revenue | ||||
| (In millions of Canadian dollars) | 2011 vs. 2010 | |||
| ||||
Increase (decrease) due to: | ||||
Acquisition growth | 183.2 | |||
Organic growth | 9.7 | |||
Impact of foreign exchange rates on revenue earned by foreign subsidiaries | (22.6 | ) | ||
| ||||
Total net increase in gross revenue | 170.3 | |||
| ||||
| Net Revenue | ||||
| (In millions of Canadian dollars) | 2011 vs. 2010 | |||
| ||||
Increase (decrease) due to: | ||||
Acquisition growth | 146.9 | |||
Organic growth | 23.0 | �� | ||
Impact of foreign exchange rates on revenue earned by foreign subsidiaries | (17.4 | ) | ||
| ||||
Total net increase in net revenue | 152.5 | |||
| ||||
The net increase in gross revenue was $170.3 million for 2011 over 2010 due to a $183.2 increase in acquisition growth and a $9.7 million increase in organic growth, offset by a $22.6 million impact of foreign exchange. The increase in net revenue was $152.5 million for 2011 over 2010 due to a $146.9 million increase in acquisition growth and a $23.0 million increase in organic growth, offset by a $17.4 million impact of foreign exchange. The increase in acquisition gross and net revenue in 2011 compared to 2010 was due to the revenue earned in 2011 attributed to the acquisitions listed in the Revenue by Region and Revenue by Practice Area Unit sections below.
MANAGEMENT’S DISCUSSION AND ANALYSIS
December 31, 2011
STANTEC INC.
M-22
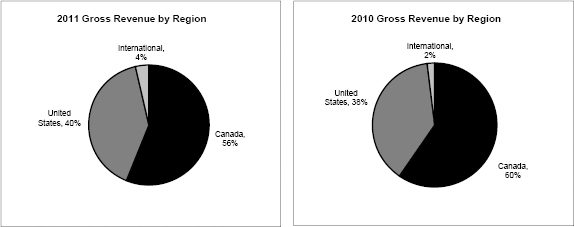
The following table summarizes the growth in gross revenue by region for 2011 compared to 2010:
| Gross Revenue by Region | ||||||||||||||||||||||||
| (in millions of Canadian dollars) | Year Ended Dec 31, 2011 | Year Ended Dec 31, 2010 | Total Change | Change Due to Acquisitions | Change Due to Organic Growth | Change Due to Foreign Exchange | ||||||||||||||||||
| ||||||||||||||||||||||||
Canada | 945.3 | 901.9 | 43.4 | 29.5 | 13.9 | n/a | ||||||||||||||||||
United States | 679.3 | 581.8 | 97.5 | 126.1 | (6.0 | ) | (22.6 | ) | ||||||||||||||||
International | 58.8 | 29.4 | 29.4 | 27.6 | 1.8 | - | ||||||||||||||||||
| ||||||||||||||||||||||||
Total | 1,683.4 | 1,513.1 | 170.3 | 183.2 | 9.7 | (22.6 | ) | |||||||||||||||||
| ||||||||||||||||||||||||
Revenue in all regions was positively impacted by the acquisitions completed in 2010 and 2011, offset by a negative impact due to the slower than anticipated economic recovery in the United States and the strengthening of the Canadian dollar against the US dollar in 2011 compared to 2010.
The following lists the acquisitions completed in 2010 and 2011 that impacted specific regions, year to date:
| • | Canada:Project Control Group Inc. (PCGI) (March 2010); TetrES Consultants Inc. (TetrES) (April 2010); QuadraTec, Inc. (QuadraTec) (February 2011); the Caltech Group (Caltech) (May 2011); and FSC Architects and Engineers (FSC) (October 2011) |
| • | United States: IEA Holdings, Inc. (IEA) (July 2010); WilsonMiller, Inc. (WilsonMiller) (July 2010); Natural Resources Consulting, Inc. (NRC) (July 2010); Communication Arts, Inc. (CommArts) (August 2010); Anshen & Allen Architecture, Inc. (Anshen + Allen) (September 2010); ECO:LOGIC Engineering (ECO:LOGIC) (September 2010); Street Smarts, Inc. and Data Smarts, LLC (Street Smarts) (October 2010); Burt Hill, Inc. (Burt Hill) (December 2010); Bonestroo, Inc. and Bonestroo Services, LLC (Bonestroo) (September 2011); and ENTRAN, Inc. (October 2011) |
| • | International: IEA (July 2010); Anshen + Allen (September 2010); WilsonMiller (July 2010); and Burt Hill (December 2010) |
Canada. Gross revenue in our Canadian operations increased by 4.8% in 2011 compared to 2010. Of the $43.4 million increase, $29.5 million was due to acquisitions, and $13.9 million was due to organic growth. The 1.5% organic growth was mainly due to increased activity in the oil and gas and mining sectors. Our outlook for our Canadian operations in 2012 is moderate growth compared to 2011 as described in the Outlook section below.
MANAGEMENT’S DISCUSSION AND ANALYSIS
December 31, 2011
STANTEC INC.
M-23
United States. Gross revenue in our US operations increased by 16.8% in 2011 compared to 2010. Of the $97.5 million increase, $126.1 million was due to acquisitions, offset by a $6.0 million retraction in organic revenue and a $22.6 million decline due to the impact of foreign exchange. The 1.0% retraction in organic growth in the United States for fiscal year 2011 was due to the slower than anticipated recovery of the US economy. Our outlook for our United States operations in 2012 is stable as described in the Outlook section below.
International. Gross revenue in our international operations grew by 100.0% in 2011 compared to 2010. Of the $29.4 million increase, $27.6 million was due to acquisition growth, and $1.8 million to organic growth. The 6.1% organic growth was mainly due to increased activity in the mining sector. Our outlook for our International operations in 2012 is stable to moderate growth as described in the Outlook section below.
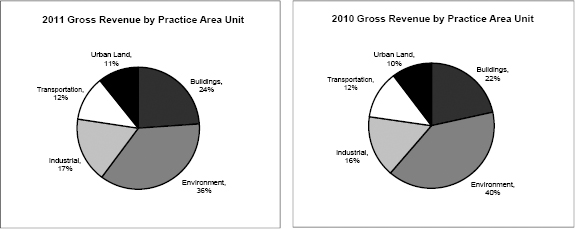
The following table summarizes our gross revenue by practice area unit for 2011 compared to 2010:
| Practice Area Unit Gross Revenue | ||||||||||||||||||||
| (In millions of Canadian dollars, except %) | 2011 | % of Consulting Services Gross Revenue | 2010 | % of Consulting Services Gross Revenue | % Change in Gross Revenue 2011 vs. 2010 | |||||||||||||||
| ||||||||||||||||||||
Buildings | 414.7 | 24.6% | 326.1 | 21.6% | 27.2% | |||||||||||||||
Environment | 604.8 | 35.9% | 601.9 | 39.8% | 0.5% | |||||||||||||||
Industrial | 287.2 | 17.1% | 241.3 | 15.9% | 19.0% | |||||||||||||||
Transportation | 197.8 | 11.8% | 187.7 | 12.4% | 5.4% | |||||||||||||||
Urban Land | 178.9 | 10.6% | 156.1 | 10.3% | 14.6% | |||||||||||||||
| ||||||||||||||||||||
Total | 1,683.4 | 100.0% | 1,513.1 | 100.0% | 11.3% | |||||||||||||||
| ||||||||||||||||||||
Note: Comparative figures have been restated due to a realignment of several practice components between our Buildings, Industrial, Transportation, and Urban Land practice area units.
As indicated above, our gross revenue was impacted by acquisitions, net organic growth, and the effect of foreign exchange rates on revenue earned by our foreign subsidiaries. The impact of these factors on gross revenue earned by practice area unit is summarized as follows:
MANAGEMENT’S DISCUSSION AND ANALYSIS
December 31, 2011
STANTEC INC.
M-24
Practice Area Unit Gross Revenue
| 2011 Compared to 2010 | ||||||||||||||||
| (In millions of Canadian dollars) | Total Change | Change Due to Acquisitions | Change Due to Organic Growth | Change Due to Foreign Exchange | ||||||||||||
| ||||||||||||||||
Buildings | 88.6 | 112.7 | (21.3 | ) | (2.8 | ) | ||||||||||
Environment | 2.9 | 21.2 | (7.4 | ) | (10.9 | ) | ||||||||||
Industrial | 45.9 | 20.8 | 27.3 | (2.2 | ) | |||||||||||
Transportation | 10.1 | 10.4 | 4.2 | (4.5 | ) | |||||||||||
Urban Land | 22.8 | 18.1 | 6.9 | (2.2 | ) | |||||||||||
| ||||||||||||||||
Total | 170.3 | 183.2 | 9.7 | (22.6 | ) | |||||||||||
| ||||||||||||||||
Note: Comparative figures have been restated due to a realignment of several practice components between our Buildings, Industrial, Transportation, and Urban Land practice area units.
The following summarizes the acquisitions completed in 2011 and 2010 that affected the acquisition growth of each of our practice area units during the year:
| • | Buildings: CommArts (August 2010); Anshen + Allen (September 2010); Burt Hill (December 2010); QuadraTec (February 2011); and FSC (October 2011) |
| • | Environment: TetrES (April 2010); WilsonMiller (July 2010); NRC (July 2010); ECO:LOGIC (September 2010); and Bonestroo (September 2011) |
| • | Industrial: PCGI (March 2010); IEA (July 2010); and Caltech (May 2011) |
| • | Transportation: WilsonMiller (July 2010); Street Smarts (October 2010); and ENTRAN, Inc. (October 2011) |
| • | Urban Land: WilsonMiller (July 2010) and Bonestroo (September 2011) |
Buildings.Gross revenue for our Buildings practice area unit increased by 27.2% from 2010 to 2011. Of the $88.6 million increase, $112.7 million was due to acquisitions, offset by a $21.3 million decline in organic growth and a $2.8 million impact of foreign exchange. Organic revenue retracted due to softening markets in the United States, United Kingdom, and Dubai markets; however, we continued to secure steady work in Canada and India.
The buildings industry in general has experienced increased competition and reduced funding for private and public sector projects. Nevertheless, despite the softening of the market, in 2011, we continued to secure projects in our key market sectors, which are healthcare/hospitals, education, commercial/retail, and airports. For example, in 2011 we were selected by the Government of Alberta to design a new $90 million healthcare center in High Prairie, Alberta. We were awarded this multidisciplinary project due to our recognized expertise in the design of healthcare facilities. Notwithstanding the slow recovery in the US economy, we were selected as part of a project team to provide consulting services for a complex, multidisciplinary project to redesign and repurpose a group of buildings for the Sacramento Municipal Utilities District in Sacramento, California. Looking beyond North America, we were selected to design the new Santiago Chile International Airport Terminal, winning this prestigious commission against global competition. Furthermore, we experienced notable success in securing projects in support of retailer Target’s entrance into the Canadian market, and our global reputation and expanded geographic presence enabled us to secure significant P3 projects, including 13 schools in Alberta that are being delivered as a P3 package.
In 2011, we acquired FSC, the leading architectural and engineering firm in Northern Canada, giving us a dominant position in this rapidly growing region. Also, during the year we integrated the North American
MANAGEMENT’S DISCUSSION AND ANALYSIS
December 31, 2011
STANTEC INC.
M-25
operations of Anshen + Allen and Burt Hill. The addition of these firms has significantly expanded our opportunities and, amongst other successes, resulted in us being selected for such projects as the design of a new 50,000-square-foot (4,645-square-metre) research facility at Carnegie Mellon University in Pittsburgh, Pennsylvania, that will include a new cleanroom facility with associated labs for materials characterization, biotechnology, and energy research.
We believe that the outlook for our Buildings practice area unit is stable for 2012. Our Buildings practice is ranked amongst the top building design practices in the industry and is well positioned to secure significant project opportunities in 2012, despite the overall uncertainty of the North American and global economy. Our combination of global expertise and local strength is in demand by major clients in our key market sectors. Our expanded geographic presence will enable us to continue to pursue a broad range of North American and international opportunities and we are well positioned to secure P3 opportunities, which continue to emerge in Canada, and which we believe are poised to emerge in the United States.
Environment.Gross revenue for our Environment practice area unit increased by 0.5% from 2010 to 2011. Of the $2.9 million increase, $21.2 million was due to acquisitions, offset by $7.4 million decline in organic growth and a $10.9 million impact of foreign exchange. The decline in organic growth year over year was in part due to a reduction in pass-through subconsultant costs during the first half of the year and to the reduction or postponement of work resulting from several high-profile industrial spills in 2010.
In 2011, the above factors were partially offset by a recovery in the mining, power, and oil and gas sectors. High oil prices encouraged increased activity in large-scale projects in the Canadian oil and gas sector and in shale gas development in the United States and Canada. For example, our Environmental Services group continued to strategically position our oil and gas services to win more front-end environmental assessment and compliance services. For instance, we are providing a variety of environmental compliance and regulatory support services to Talisman Energy in support of their oil and unconventional gas development efforts. Our services involve the development of a groundwater protection program, waste management program, and prevention and preparedness plans for Talisman’s sites in Pennsylvania, New York, and Texas. We also provided environmental compliance and regulatory support services to SWN Resources Canada, Inc. in support of their shale gas seismic exploration phase in Southern New Brunswick. Through cross-selling activities with our Industrial practice area unit, we are leading the preparation of the environmental assessment for the Mount Klappan Anthracite Coal Project in northwestern British Columbia. The team working on this project includes atmospheric, terrestrial, aquatic, human environment, Aboriginal engagement, and geomatics specialists. In 2011, our Environmental Services group also provided environmental assessment and permitting in support of several electrical transmission and distribution projects. For example, our AltaLink portfolio of work continues to be strong, with numerous electrical transmission projects assessed and permitted in Alberta.
In the water sector, new investment was relatively flat as municipalities dealt with budget constraints. However, there was still investment in existing facilities due to regulatory requirements and consent decrees that require water and sewage treatment plants to be upgraded and combined sewer overflow programs to continue. For example, we were awarded a project to provide conceptual, preliminary, and detailed design, construction, and post-construction services for the City of Winnipeg’s North End Water Pollution Control Center facilities rehabilitation in Winnipeg, Manitoba. Also, during 2011, we were awarded a project for wastewater facilities upgrades and expansion at Donner Summit Public Utility District in California. We continued to expand our water service offerings into other industrial water activities such as tailings pond treatment, flood control, water reuse, and water resource management projects. In 2011, the Environment practice area unit, as part of a multidisciplinary team, continued to work on more than 70 assignments related to facility assessments at 11 power plants in Tennessee, Kentucky, and Alabama for the Tennessee Valley Authority.
MANAGEMENT’S DISCUSSION AND ANALYSIS
December 31, 2011
STANTEC INC.
M-26
We believe that the outlook for our Environment practice area unit is stable to moderate organic growth in 2012. We expect to leverage our relationships with large clients to further expand into new geographic locations and service offerings. We believe that we are well positioned to secure opportunities resulting from a more stringent regulatory environment in the water sector. Regulatory requirements, which largely drive environmental spending by our energy sector clients, are also expected to increase. We also plan to continue focusing on cross-selling opportunities, mainly with our Industrial practice area unit in the oil and gas sector.
Industrial. Gross revenue for our Industrial practice area unit increased by 19.0% from 2010 to 2011. Of the $45.9 million increase in gross revenue in 2011, $20.8 million was due to acquisitions, and $27.3 million was due to organic growth, offset by a $2.2 million foreign exchange impact. The strong organic growth was mainly due to an increase in project activity, in particular in the mining and oil and gas sectors, which resulted in continued increases in staff levels and backlog. In the mining sector we experienced strong growth in potash, expanded our role and scope beyond our normal focus area of underground and related services, and continued to secure significant projects with the top global mining companies in the world. For example, during 2011, we continued our work on BHP Billiton’s Jansen potash mine project in Saskatchewan. Commodity prices, a key driver for this practice area unit, remained strong and spurred the capital spending plans of our private sector clients. A continuation of relatively high oil prices led to additional projects in the oil and gas sector as our clients are adding capacity for storage and distribution. For example, in 2011 we secured a significant new client—Inter Pipeline Fund—which resulted in work on the Polaris pipeline expansions and Cold Lake system projects in Alberta.
During 2011, our Industrial practice area unit continued to work on renewable energy projects, including wind power, solar power, smart grid initiatives, clean coal, and landfill gas combustion. During the year we provided engineering design services on the Berlin Power Biomass project in Berlin, New Hampshire. The Berlin biomass-energy project is expected to be one of the largest and most environmentally sound biomass-energy facilities in the United States. Our Industrial Buildings & Facilities practice area is also growing as large transport and equipment dealers, manufacturers, and servicing companies, public and private, are renewing or building facilities. Our Program & Project Management practice area is gaining momentum in the healthcare sector in the United States, especially in New York, Philadelphia, and the Carolinas.
We believe that the outlook for our Industrial practice area unit is moderate organic growth in 2012. Commodity prices are expected to remain strong, which we believe will encourage further capital spending by our private sector clients. We expect continued robust activity in the mining and oil and gas sectors, supported by our continued growth in other industrial sectors. We expect that our strong relationships with large global industrial clients will contribute to our further growth.
Transportation. Gross revenue for our Transportation practice area unit increased by 5.4% from 2010 to 2011. Of the $10.1 million increase in gross revenue in 2011, $10.4 million was due to acquisitions, and $4.2 million was due to organic growth, offset by a $4.5 million foreign exchange impact. The organic growth was the result of a steady supply of new projects during the year, in particular from a stable stream of projects in Canada and the United States, including roadway rehabilitation and ongoing bridge inspection projects, as well as a wide range of new and upgrade projects in the rail and transit sectors.
In 2011, we continued to secure projects with repeat clients due to our strong relationships and past performance. For example, we secured a long-term project with the US Department of Transportation to provide the Federal Highway Administration with technical services in the US and Canada. This project supports the development and maintenance of the long-term pavement performance program studies established under the Strategic Highway Research Program. In addition, we secured a significant project with a new client in the construction management arena—the Orange County Transportation Authority— for the construction of the Orangethorpe Avenue railroad grade separation. In 2011, we also continued to work on several large P3 projects in Canada. We continue to
MANAGEMENT’S DISCUSSION AND ANALYSIS
December 31, 2011
STANTEC INC.
M-27
seek further opportunities in the Canadian P3 market and see increased activities in the US design-build market as our design focus makes us a strong partner for our clients in this sector.
During the second quarter of 2011, the Safe, Accountable, Flexible, Efficient, Transportation Equity Act—A Legacy for Users (SAFETEA-LU) was extended for an additional six months, until March 31, 2012. This extension is expected to sustain the United States federal highway and transit spending at current levels. However, the lack of a long-term federal funding strategy is still holding back larger projects. The smaller, shorter-term, and maintenance-type projects are proceeding, although competition for these projects has increased. Nonetheless, we are well positioned to secure these smaller projects due to our relationships with municipal and local clients. For example, we were recently selected by the North Carolina Department of Transportation to conduct planning and engineering services to support pedestrian planning throughout the state.
We believe that the outlook for our Transportation practice area unit is stable to moderate organic growth for 2012. We expect our rail and transit groups to maintain their current activity levels during 2012. However, we remain cautious as decreasing tax revenues, efforts to reduce state and provincial deficits, and continued uncertainty in long-term funding may continue to cause delays in some planned transportation projects.
Urban Land.Gross revenue for our Urban Land practice area unit increased by 14.6% from 2010 to 2011. Of the $22.8 million increase in gross revenue in 2011, $18.1 million was due to acquisitions, and $6.9 million was due to organic growth, offset by a $2.2 million foreign exchange impact. In 2011, Canada accounted for approximately two thirds of our urban land business, with the remainder of the work being spread throughout a number of locations in the United States. The organic growth was mainly due to the stability in the residential market and our diversification into the nonresidential sector.
The Canadian housing market continued to be relatively buoyant in 2011, and our Canadian practice generally performed well. The US housing market was relatively stable in 2011 compared to 2010. In the United States, positive signs included land developers returning to the review of potential property purchases. However, a recovery is still complicated by foreclosures, credit issues, and unemployment rates, and there are concerns regarding ongoing economic challenges.
In 2011, we continued to pursue and take advantage of opportunities in both the residential and nonresidential markets in Canada and the United States, therefore demonstrating our ability to provide a variety of services to different segments in the urban land development market. In the residential market, for example, we provided project management, engineering design, transportation studies, land subdivision, surveying, and construction management for the Mahogany Stage 1 subdivision, a 400-hectare (1,000-acre) residential community in Calgary, Alberta. In some of our regions, our market is changing to include more medium- to higher-density development and redevelopment projects; therefore, we are tailoring our services to reflect this shift. We recently secured a high-density project in Waterloo, Ontario, where the site engineering services include reviewing municipal servicing capacities, resolving flood line and floodway constraints, addressing groundwater conditions, and the functional design of external traffic improvements in an urban environment. We continued to pursue nonresidential work in commercial, municipal, parks, and sports and recreation sectors to supplement our residential project backlog. For example, during the year, we provided surveying and site development services to assist retailer Target with the rollout of its stores into the Canadian marketplace. We also secured an assignment to provide landscape architecture, interpretive design, engineering, and environmental services for a new park and open space facilities at the Sydney Tar Ponds site, located on more than 90 hectares (225 acres) of former industrial property in Sydney, Nova Scotia. This project illustrates our ability to provide a multidisciplinary team drawing on expertise from several different locations.
We believe the outlook for our Urban Land practice area unit in 2012 is stable to moderate organic growth. The anticipated economic recovery in the United States is expected to be slow while the Canadian market will likely
MANAGEMENT’S DISCUSSION AND ANALYSIS
December 31, 2011
STANTEC INC.
M-28
remain reasonably steady. The acquisition of Bonestroo will augment our Urban Land municipal work in the Great Lakes region of the United States and positions us to take advantage of the growing opportunities in North Dakota. In 2012, we expect to continue diversifying our client base, building and leveraging our reputation with the public sector, and focusing on our multidisciplinary team approach.
Gross Margin
For a definition of gross margin, refer to the Definition of Additional IFRS Measures in the Critical Accounting Estimates, Developments, and Measures section below.Gross margin decreased to 55.4% in 2011 from 56.1% in 2010. Our gross margin for 2011 was within the anticipated range of 54.5 to 56.5% set out in our 2010 Financial Review. The decrease in our gross margin percentage was due to a decrease in the gross margins for the Buildings, Industrial, and Transportation practice area units, partially offset by an increase in the gross margins for Environment and Urban Land as further explained below.
The following table summarizes our gross margin percentages by practice area unit for 2011 and 2010.
| Gross Margin by Practice Area Unit | 2011 | 2010 | ||||||
| ||||||||
Buildings | 54.2% | 56.0% | ||||||
Environment | 58.3% | 58.2% | ||||||
Industrial | 49.9% | 51.5% | ||||||
Transportation | 54.1% | 54.3% | ||||||
Urban Land | 59.2% | 58.4% | ||||||
| ||||||||
Note: Comparative figures have been restated due to a realignment of several practice components between our Buildings, Industrial, Transportation, and Urban Land practice area units.
In general, fluctuations in the gross margin reported from year to year depend on the mix of projects in progress during any year and on our project execution. These fluctuations reflect the nature of our business model, which is based on diversifying our operations across geographic regions, practice area units, and all phases of the infrastructure and facilities project life cycle. In the Buildings practice area unit, in addition to project mix, the decrease in gross margin was a reflection of increased competition and the continued softening of the United States, United Kingdom, and Dubai buildings industries. The decrease in gross margin in the Industrial practice area unit was a reflection of increased competition and mix of projects.
The following table summarizes our gross margin percentages by region for 2011 and 2010.
| Gross Margin by Region | 2011 | 2010 | ||||||
| ||||||||
Canada | 56.8% | 58.0% | ||||||
United States | 53.6% | 53.1% | ||||||
International | 51.1% | 55.6% | ||||||
| ||||||||
The lower gross margin experienced in the United States compared to Canada was principally due to the mix of projects in progress, the competitive environment in the United States, and the lower margins generally experienced in US government projects especially in our Transportation practice area unit. Although slightly lower than our Canadian business, our gross margins in the United States continue to increase.
The reduction in gross margin in Canada was mainly due to competitive pressures in our Buildings practice area unit and revisions made to our estimated cost to complete on certain large projects in 2011, resulting in a
MANAGEMENT’S DISCUSSION AND ANALYSIS
December 31, 2011
STANTEC INC.
M-29
reduction in gross margin. The reduction in gross margin in our International region resulted from the mix of projects in progress and the addition of our United Arab Emirates operations, for which margins were lower than for our other international operations.
Administrative and Marketing Expenses
Our administrative and marketing expenses increased by $54.5 million from 2010 to 2011. As a percentage of net revenue, our administrative and marketing expenses were 41.0% in 2011 compared to 41.7% in 2010, falling within the low end of our expected range of 41 to 43%. Administrative and marketing expenses may fluctuate from year to year because of the amount of staff time charged to marketing and administrative labor, which is influenced by the mix of projects in progress and being pursued during the period, as well as by business development and acquisition integration activities. In the months following the completion of an acquisition, there is usually an increase in staff time charged to administration and marketing due to integration activities including the orientation of newly acquired staff. Our administrative and marketing expenses as a percentage of net revenue were lower in 2011 compared to 2010, due to our continued focus on managing our costs and operational efficiencies. In addition, the 10 acquisitions completed during 2010 compared to the 5 acquisitions completed in 2011 resulted in more integration, restructuring, and professional costs being expensed in 2010. This decrease in acquisition-related costs in 2011 was partially offset by an increase in marketing and business development labor as a percentage of net revenue, due to additional client management activities in the year.
Depreciation of Property and Equipment
Depreciation increased by $2.4 million in 2011 primarily due to the addition of property and equipment from acquisition growth in the latter half of 2010 and in 2011. Depreciation of property and equipment as a percentage of net revenue was stable at 2.0% in 2011 compared to 2.1% in 2010.
Goodwill
Effective the third quarter of 2011, we changed the date of our annual goodwill impairment test to October 1 from July 1. In accordance with our accounting policies as described in note 4 of our audited consolidated financial statements, we conduct a goodwill impairment test annually or more frequently if circumstances indicate that an impairment may occur or if a significant acquisition occurs between the annual impairment test date and December 31.
In 2010, we performed an impairment test as at January 1, 2010, as required on transition to IFRS. In addition, we performed an annual goodwill impairment test as at July 1, 2010. Due to the acquisitions completed in the third and fourth quarters of 2010, an impairment test was also performed as at December 31, 2010. Based on the results of these tests, we concluded that the recoverable amount of our CGUs exceeded their carrying amount and, therefore, goodwill was not impaired.
We allocate goodwill to our CGUs, which are also our operating segments. These CGUs are defined based on the smallest identifiable group of assets that generates cash inflows that are largely independent of the cash inflows from other assets or groups of assets. Other factors are considered, including how management monitors the entity’s operations. In 2010, we defined our CGUs as Canada East, Canada West, US East, and US West. As a Company we are constantly evolving and continue to expand and grow into different geographic locations. As we evolve, we regularly review our corporate and management structure to ensure our operations are organized into logical units, particularly for making operating decisions and assessing performance. If we determine our corporate and management structure should change, we accordingly review our definitions of CGUs and reportable segments. With our growth internationally in 2010 and resulting reorganization, we redefined our CGUs as Canada, the United States, and International effective January 1, 2011. We do not allocate or monitor goodwill to our practice area units.
MANAGEMENT’S DISCUSSION AND ANALYSIS
December 31, 2011
STANTEC INC.
M-30
In 2011, we operated effectively and ended the year with solid results. We performed our annual goodwill impairment test as at October 1, 2011. Market fluctuations caused our share price to decrease as at October 1, 2011, which adversely impacted our market capitalization. In addition, due to ongoing challenging economic conditions, the short-term performance of our US and International CGUs was weaker than expected. Considering these factors and their impact on the results of our goodwill impairment test, we concluded that at October 1, 2011, our goodwill was impaired and, in the fourth quarter, we recorded a $90.0 million non-cash goodwill impairment charge to income. We allocated $78.8 million of this charge to our US CGU and $11.2 million to our International CGU. After the goodwill impairment charge, at October 1, 2011, the goodwill allocated to our US CGU was reduced by 23.1% to $261.5 million, which was 52.1% of our consolidated goodwill balance, and the goodwill allocated to our International CGU was reduced to zero. This charge is non-cash in nature, does not affect our liquidity, cash flows from operating activities, or debt covenants, and does not impact the operations of our business. We continue to focus on long-term growth through efficient execution of our strategy. Despite the weaker-than-expected short-term performance of our US and International CGUs, our investments over the past five years have continued to strengthen our foundation and have positioned us to benefit from an improving economy. We will continue to deliver shareholder value by focusing on organic and acquisition growth.
Valuation techniques
In performing our goodwill impairment test, we compare the recoverable amount of our CGUs to their respective carrying amounts. If the carrying amount of a CGU is higher than its recoverable amount, an impairment charge is recorded as a reduction in the carrying amount of the goodwill on the consolidated statement of financial position and recognized as a non-cash impairment charge in income. We estimate the recoverable amount by using the fair value less costs to sell approach. It estimates fair value using market information and discounted after-tax cash flow projections, which is known as the income approach. The income approach uses a CGU’s projection of estimated operating results and discounted cash flows based on a discounted rate that reflects current market conditions. We use cash flow projections from financial forecasts approved by senior management covering a five-year period. For our October 1, 2011, impairment test, we discounted our CGUs’ cash flows using after-tax discount rates ranging from 9.6% to 17% (December 31, 2010 – 9.75% to 11.75%; July 1, 2010 – 9.7% to 11.5%; January 1, 2010 – 10% to 12%). To arrive at cash flow projections we use estimates of economic and market information as described in the Critical Accounting Estimates section under the Critical Accounting Estimates, Developments, and Measures heading below.
Sensitivity
The calculation of fair value less costs to sell for all of our CGUs is most sensitive to the following assumptions:
| • | Operating margins based on actual experience and management’s long-term projections |
| • | Discount rates reflecting investors’ expectations when discounting future cash flows to a present value taking into consideration market rates of return, capital structure, company size, and industry risk. This rate is further adjusted to reflect risks specific to the CGU for which future estimates of cash flows have not been adjusted. |
| • | Growth rate estimates based on actual experience and market analysis. Projections are extrapolated beyond five years using a growth rate that typically does not exceed 4.0%. |
At October 1, 2011, the recoverable amount of our Canadian CGU exceeded its carrying amount by a substantial amount. With regards to the assessment of fair value less costs to sell, we believe that no reasonably possible change in any of the above key assumptions would have caused the carrying amount of the Canadian CGU to materially exceed its recoverable amount.
MANAGEMENT’S DISCUSSION AND ANALYSIS
December 31, 2011
STANTEC INC.
M-31
Intangible Assets
The timing of completed acquisitions, the size of acquisitions, and the type of intangible assets acquired impact the amount of amortization of intangible assets in a period. Client relationships are amortized over estimated useful lives ranging from 10 to 15 years, whereas contract backlog is amortized over an estimated useful life of generally 1 to 3 years. Consequently, the impact of the amortization of contract backlog can be significant in the 4 to 12 quarters following an acquisition. Backlog is a non-IFRS measure further discussed in the Definition of Non-IFRS Measures in the Critical Accounting, Estimates, Developments, and Measures section below. As at December 31, 2011, $6.4 million of the $72.0 million in intangible assets related to backlog. Also included in intangible assets are purchased and internally generated computer software that is replaceable and not an integral part of related hardware. This computer software is amortized over estimated useful lives ranging from 2 to 7 years.
The following table summarizes amortization of identifiable intangible assets:
| Intangibles | ||||||||
| (In thousands of Canadian dollars) | 2011 | 2010 | ||||||
| ||||||||
Amortization of client relationships | 5,179 | 4,845 | ||||||
Amortization of backlog | 6,209 | 6,082 | ||||||
Software | 5,898 | 5,648 | ||||||
Other | 2,158 | 714 | ||||||
Lease disadvantage | (1,049 | ) | - | |||||
| ||||||||
Total amortization of intangible assets | 18,395 | 17,289 | ||||||
| ||||||||
The $1.1 million increase in the intangible assets amortization between 2010 and 2011 was mainly due to the amortization of customer relationship balances of QuadraTec, Caltech, and Burt Hill, as well as the amortization of the trade name of Anshen + Allen. During 2011, we added $18.6 million to intangible assets. Of the $18.6 million, $7.1 million was due to the addition of software and $11.5 million to acquisitions, mainly from QuadraTec, Caltech, FSC, and ENTRAN.
In accordance with our accounting policies, we review intangible assets at each reporting period to determine whether there is an indication of impairment. An asset may be impaired if there is objective evidence of impairment as a result of one or more events that has occurred after the initial recognition of the asset and that event has an impact on the estimated future cash flows of the asset. If an indication of impairment exists, the asset’s recoverable amount is estimated. If the carrying amount exceeds the recoverable amount (on a discounted basis), the asset value is written down to the recoverable amount. For further discussion of the methodology used in testing long-lived assets and intangibles for impairment, refer to the Critical Accounting Estimates section under the Critical Accounting Estimates, Developments, and Measures heading below.
On January 1, 2010, as required on transition to IFRS, we performed an impairment test on intangible assets. This review determined that the carrying amount of our intangible assets exceeded its recoverable amount and, as a result, we recorded a $3.8 million, non-cash impairment charge to retained earnings related to certain client relationships and a lease advantage. The impairment primarily reflected a decline in expected future cash flows from these clients and a reduction in the value of a favorable lease in our New York, New York, office. The remaining carrying value of these specific client relationships, following this impairment charge, was $5.1 million. The carrying value of the favorable lease was reduced to zero.
MANAGEMENT’S DISCUSSION AND ANALYSIS
December 31, 2011
STANTEC INC.
M-32
Based on our review of intangible assets at each reporting period since January 1, 2010, there have been no indications of impairment.
Net Interest Expense
During the year, we extended the maturity of our existing $350 million revolving credit facility to August 31, 2015, and renegotiated the interest rates. The facility allows us access to an additional $75 million under the same terms and conditions on approval from our lenders. Also during the year, we successfully issued $70 million of 4.332% senior secured notes due May 10, 2016, and $55 million of 4.757% senior secured notes due May 10, 2018, as further described below.
The $1.8 million increase in net interest expense in 2011 compared to 2010 was due to an increase in interest rates compared to 2010, mainly from the rates entered into for the issuance of our senior secured notes in the year. The increase in interest rates was partially offset by a decrease in long-term debt. At December 31, 2011, $207.5 million was outstanding on our revolving credit facility and senior secured notes compared to $220.2 million outstanding on our credit facility at December 31, 2010. As at December 31, 2011, $28.5 million of our credit facility was payable in US funds (US$28.0 million), and $55.0 million was payable in Canadian funds. Our average interest rate on our credit facility was 2.5% at December 31, 2011, compared to 2.97% at December 31, 2010. All of our $125 million in senior secured notes at December 31, 2011, are in Canadian funds. Our average interest rate on our secured notes was 4.52%.
Depending on the form under which the credit facility is accessed, rates of interest may vary between Canadian prime, US base rate, or LIBOR or bankers’ acceptance rates, plus specified basis points. The specified basis points may vary, depending on our level of consolidated debt to EBITDA, from 50 to 175 for Canadian prime and US base rate loans and from 150 to 275 for bankers’ acceptances, LIBOR loans, and letters of credit. (Debt to EBITDA is defined in the Definition of Non-IFRS Measures in the Critical Accounting Estimates, Developments, and Measures section of this report.) Prior to the extension, the basis points varied, depending on our level of consolidated debt to EBITDA, from 100 to 225 for Canadian prime and US base rate loans and from 200 to 325 for bankers’ acceptances, LIBOR loans, and letters of credit.
We minimize our exposure to floating rates of interest on our revolving credit facility, when appropriate, by entering into interest rate swap agreements. During 2008, we entered into an interest swap agreement that had the effect of converting the variable interest obligation associated with US$100 million of our credit facility, based on a LIBOR rate, into a fixed interest rate of 3.43%, plus an applicable basis points spread. The swap agreement ended September 3, 2010.
Based on our credit facility balance at December 31, 2011, we estimate that a 0.5% increase in interest rates, with all other variables held constant, would decrease our net income by approximately $0.4 million for the year, and decrease our basic earnings per share by approximately $0.01 for the year. A 0.5% decrease in interest rates would have an equal and opposite impact on our net income and basic earnings per share.
MANAGEMENT’S DISCUSSION AND ANALYSIS
December 31, 2011
STANTEC INC.
M-33
We have the flexibility to partially mitigate our exposure to interest rate changes by maintaining a mix of both fixed and floating rate debt. Our senior secured notes have fixed interest rates; therefore, interest rate fluctuations would have no impact on the senior secured notes interest payments.
Foreign Exchange Gains/Losses
We reported a foreign exchange loss of $0.5 million in 2011 compared to a $1.0 million loss in 2010. These foreign exchange gains and losses arose on the translation of the foreign-denominated assets and liabilities held in our Canadian companies and in our non-US-based foreign subsidiaries. We minimize our exposure to foreign exchange fluctuations by matching US-dollar assets with US-dollar liabilities and, when appropriate, by entering into forward contracts to buy or sell US dollars in exchange for Canadian dollars. The foreign exchange losses in 2011 and 2010 were due to the volatility of daily foreign exchange rates and the timing of the recognition and relief of foreign-denominated assets and liabilities. As at December 31, 2011, we had no foreign currency forward contract agreements.
During 2011, we also recorded a $5.8 million foreign exchange gain in our currency translation adjustments in other comprehensive income compared to an $18.6 million loss in 2010. These unrealized gains and losses arose when translating our foreign operations into Canadian dollars. We do not hedge for this foreign exchange translation risk. The gain recorded during 2011 was due to the weakening of the Canadian dollar from US$1.01 at December 31, 2010, to US$0.98 at December 31, 2011, and the loss recorded during 2010 was due to the strengthening of the Canadian dollar from US$0.95 at December 31, 2009, to US$1.01 at December 31, 2010.
We estimate that, due to a slight net exposure at December 31, 2011, a $0.01 increase or decrease in the US-dollar to Canadian-dollar exchange rate, with all other variables held constant, would have had an immaterial impact on our net income for the year.
Income Taxes
Our effective income tax rate for 2011 would have been 26.5% without the impact of the goodwill impairment charge of $90.0 million recorded in 2011. In 2010 our effective income tax rate was 29.7%. The 26.5% for 2011 met our target of at or below 28.5% set out in our 2010 Financial Review. The 2010 effective income tax rate was impacted by a reorganization of our corporate tax structure in January 2010. This reorganization resulted in a gain for tax purposes; however, this gain did not affect cash income taxes payable, since it was offset by previously recognized US income tax losses. The reorganization was part of a long-term strategy to make our corporate tax structure more efficient. Partially offsetting this increase in our effective income tax rate was the impact of the $7.2 million capital gain on the sale of our 30% equity investments in Fugro Jacques Geosurveys Inc. and Fugro Jacques N.V. (Fugro) in the third quarter of 2010.
Excluding the impact of the reorganization and the gain on the sale of equity investments, our effective tax rate for 2010 would have been 25.6%. The increase from 25.6% in 2010 to 26.5% in 2011 was due to additional income earned in our higher tax rate jurisdictions and a decrease in income from associated companies, which we receive on an after-tax basis.
MANAGEMENT’S DISCUSSION AND ANALYSIS
December 31, 2011
STANTEC INC.
M-34
Quarterly Trends
The following is a summary of our quarterly operating results for the last two fiscal years, all prepared in accordance with IFRS:
Quarterly Unaudited Financial Information
| (In millions of Canadian dollars, except per share amounts) | ||||||||||||||||||||||||||||||||
| 2011 | 2010 | |||||||||||||||||||||||||||||||
|
| |||||||||||||||||||||||||||||||
| Dec 31 | Sep 30 | Jun 30 | Mar 31 | Dec 31 | Sep 30 | Jun 30 | Mar 31 | |||||||||||||||||||||||||
| ||||||||||||||||||||||||||||||||
Gross revenue | 432.0 | 430.4 | 412.3 | 408.7 | 383.7 | 386.7 | 371.1 | 371.6 | ||||||||||||||||||||||||
Net revenue | 348.2 | 351.2 | 342.3 | 336.8 | 310.9 | 314.5 | 303.8 | 296.8 | ||||||||||||||||||||||||
Net income (loss) | (65.7 | ) | 28.9 | 25.7 | 23.8 | 23.3 | 31.3 | 23.8 | 16.3 | |||||||||||||||||||||||
EPS – basic | (1.45 | ) | 0.63 | 0.56 | 0.52 | 0.51 | 0.69 | 0.52 | 0.36 | |||||||||||||||||||||||
EPS – diluted | (1.45 | ) | 0.63 | 0.56 | 0.52 | 0.51 | 0.68 | 0.52 | 0.35 | |||||||||||||||||||||||
| ||||||||||||||||||||||||||||||||
The quarterly earnings per share on a basic and diluted basis are not additive and may not equal the annual earnings per share reported. This is due to the effect of shares issued or repurchased during the year on the weighted average number of shares. Diluted earnings per share on a quarterly and annual basis are also affected by the change in the market price of our shares, since we do not include in dilution options whose exercise price is not in the money.
The following items impact the comparability of our quarterly results:
Gross Revenue (In millions of Canadian dollars) | Q4 11 vs. Q4 10 | Q3 11 vs. Q3 10 | Q2 11 vs. Q2 10 | Q1 11 vs. Q1 10 | ||||||||||||
| ||||||||||||||||
Increase in gross revenue due to: | ||||||||||||||||
Acquisition growth | 38.4 | 44.9 | 51.6 | 48.3 | ||||||||||||
Increase (decrease) in organic growth | 8.2 | 7.1 | (1.8 | ) | (3.8 | ) | ||||||||||
Impact of foreign exchange rates on revenue earned by foreign subsidiaries | 1.7 | (8.3 | ) | (8.6 | ) | (7.4 | ) | |||||||||
| ||||||||||||||||
Total net increase in gross revenue | 48.3 | 43.7 | 41.2 | 37.1 | ||||||||||||
| ||||||||||||||||
During Q1 11, our gross revenue increased by $37.1 million, or 10.0%, to $408.7 million compared to $371.6 million for the same period in 2010. Approximately $48.3 million of this increase resulted from an increase in revenue from acquisitions completed in 2011 and 2010, offset by a $7.4 million foreign exchange impact—due to the strengthening of the Canadian dollar during Q1 11 compared to Q1 10—and a $3.8 million retraction in organic revenue. Net income for Q1 11 increased by $7.5 million, or 46.0%, from the same period in 2010, and diluted earnings per share for Q1 11 increased by $0.17, or 48.6%, compared to Q1 10. Net income during Q1 11 was positively impacted by the increase in gross and net revenue and an increase in gross margin as a percentage of net revenue from 55.5% in Q1 10 to 55.8% in Q1 11. Also, our income tax expense decreased by $6.5 million or 42.5% due to the tax impact of the reorganization of our corporate structure in Q1 10. Net income in Q1 11 was negatively impacted by an increase in our administrative and marketing expenses as a percentage of net revenue from 41.4% in Q1 10 to 42.2% in Q1 11. This increase was primarily due to the recognition of sublease revenue in Q1 10 and increased integration activities in Q1 11.
During Q2 11, our gross revenue increased by $41.2 million, or 11.1%, to $412.3 million compared to $371.1 million for the same period in 2010. Approximately $51.6 million of this increase resulted from acquisitions completed in 2011 and 2010, offset by an $8.6 million foreign exchange impact—due to the strengthening of the
MANAGEMENT’S DISCUSSION AND ANALYSIS
December 31, 2011
STANTEC INC.
M-35
Canadian dollar during Q2 11 compared to Q2 10—and a $1.8 million retraction in organic revenue. Net income for Q2 11 increased by $1.9 million, or 8.0%, from the same period in 2010, and diluted earnings per share for Q2 11 increased by $0.04, or 7.7%, compared to Q2 10. Net income during Q2 11 was positively impacted by the increase in gross and net revenue, and by a decrease in our administrative and marketing expenses as a percentage of net revenue from 40.8% in Q2 10 to 40.4% in Q2 11. Net income in Q2 11 was negatively impacted by a reduction of gross margin as a percentage of net revenue from 55.7% in Q2 10 to 55.1% in Q2 11. This decrease in gross margin mainly occurred in our Industrial and Buildings practice area units because of the mix of projects during the quarter. Net income in Q2 11 was also negatively impacted by an increase in amortization of intangible assets.
During Q3 11, our gross revenue increased by $43.7 million, or 11.3%, to $430.4 million compared to $386.7 million for the same period in 2010. Approximately $44.9 million of this increase resulted from acquisitions completed in 2011 and 2010, and $7.1 million resulted from organic growth. These increases were partially offset by an $8.3 million foreign exchange impact due to the strengthening of the Canadian dollar during Q3 11 as compared to Q3 10. Excluding the impact of a $5.9 million after-tax gain on sale of equity investments in Q3 10, net income increased 13.8% to $28.9 million in Q3 11 from $25.4 million in Q3 10, and diluted earnings per share increased 14.5% to $0.63 in Q3 11 from $0.55 in Q3 10. Including the impact of the gain on sale of equity investments, our net income decreased 7.7% to $28.9 million from $31.3 million, and diluted earnings per share decreased 7.4% to $0.63 from $0.68. Net income during Q3 11 was positively impacted by the increase in gross and net revenue, and by a decrease in our administrative and marketing expenses as a percentage of net revenue from 41.3% in Q3 10 to 40.0% in Q3 11. Net income in Q3 11 was negatively impacted by a reduction of gross margin as a percentage of net revenue from 56.2% in Q3 10 to 55.5% in Q3 11. This decrease in gross margin mainly occurred in our Buildings practice area unit because of increased competition, the continued softening of the industry, and revisions made to our estimated cost to complete on certain large projects.
During Q4 11, our gross revenue increased by $48.3 million, or 12.6%, to $432.0 million compared to $383.7 million for the same period in 2010. Approximately $38.4 million of this increase resulted from an increase in revenue from acquisitions completed in 2011 and 2010, and $8.2 million resulted from organic growth, and $1.7 million was due to foreign exchange. The foreign exchange impact was due to the weakening of the Canadian dollar during Q4 11. Excluding the impact of a $90.0 million non-cash goodwill impairment charge, net income for Q4 11 increased by $1.0 million, or 4.3%, from the same period in 2010, and diluted earnings per share for Q4 11 increased by $0.02, or 3.9%, compared to Q4 10. Including the impact of the $90.0 million goodwill impairment charge, net income for Q4 11 decreased by $89.0 million, from the same period in 2010, and diluted earnings per share for Q4 11 decreased by $1.96 compared to Q4 10. Net income during Q4 11 was positively impacted by the increase in gross revenue and a reduction in administrative and marketing labor as a percentage of net revenue from 43.0 % in Q4 10 to 41.5% in Q4 11. Staff time charged to marketing and administrative labor may fluctuate from quarter to quarter because it is influenced by the mix of projects in progress and being pursued during the period, as well as by acquisition integration activities. In Q4 10, we were in the process of integrating the eight acquisitions completed during the second half of 2010 compared to three in the second half of 2011. Apart from the goodwill impairment charge, net income was also negatively impacted by a reduction in gross margin as a percentage of net revenue. Our gross margin percentage was 55.1% in Q4 11 compared to 56.7% in Q4 10. This decrease quarter over quarter was mainly due to a decrease in the gross margins for our Industrial and Buildings practice area units resulting from the mix of projects during the quarter, increased competition, and a softening of the buildings industry in the United States, United Kingdom, and Dubai.
MANAGEMENT’S DISCUSSION AND ANALYSIS
December 31, 2011
STANTEC INC.
M-36
Liquidity and Capital Resources
The following table represents summarized working capital information as at December 31, 2011, compared to December 31, 2010:
| (In millions of Canadian dollars, except ratio) | Dec 31, 2011 | Dec 31, 2010 | Change | |||||||||
| ||||||||||||
Current assets | 529.2 | 500.9 | 28.3 | |||||||||
Current liabilities | (327.5 | ) | (324.0 | ) | (3.5 | ) | ||||||
Working capital(note 1) | 201.7 | 176.9 | 24.8 | |||||||||
Current ratio(note 1) | 1.62 | 1.55 | n/a | |||||||||
| ||||||||||||
note 1: Working capital is calculated by subtracting current liabilities from current assets. Current ratio is calculated by dividing current assets by current liabilities. Both terms are further discussed in the Definition of Non-IFRS Measures in the Critical Accounting Estimates, Developments, and Measures section of this report.
Our cash flows from (used in) operating, investing, and financing activities, as reflected in our consolidated statements of cash flows, are summarized in the following table:
| (In millions of Canadian dollars) | 2011 | 2010 | $ Change 2011 vs. 2010 | |||||||||
| ||||||||||||
Cash flows from operating activities | 114.6 | 111.9 | 2.7 | |||||||||
Cash flows used in investing activities | (99.4 | ) | (128.2 | ) | 28.8 | |||||||
Cash flows from (used in) financing activities | (41.9 | ) | 65.9 | (107.8 | ) | |||||||
| ||||||||||||
We are able to meet our liquidity needs through a variety of sources, including cash generated from operations, long- and short-term borrowings from our $350 million credit facility, senior secured notes, and the issuance of common shares. Our primary use of funds is for paying operational expenses, completing acquisitions, sustaining capital spending on property and equipment, and repaying long-term debt.
We believe that internally generated cash flows, supplemented by borrowings, if necessary, will be sufficient to cover our normal operating and capital expenditures. We also believe that the design of our business model, as explained in the Core Business and Strategy section of this report, reduces the impact of changing market conditions on our operating cash flows. Consequently, we do not anticipate any immediate need to access additional capital through the sale of our equity. However, under certain favorable market conditions, we would consider issuing common shares to facilitate acquisition growth or to reduce the utilized level on our credit facility.
We continue to manage our capital structure according to the internal guideline established in our 2010 Financial Review of maintaining a net debt to equity ratio of less than 0.5 to 1.0. Our net debt to equity ratio, a non-IFRS measure, is calculated as the sum of (1) long-term debt, including current portion, plus bank indebtedness, less cash, divided by (2) shareholders’ equity. At December 31, 2011, our net debt to equity ratio was 0.41 to 1.0 or 0.36 to 1.0 without the impact of the $90.0 million goodwill impairment charge. Going forward, there may be occasions when we exceed our target by completing opportune acquisitions that increase our debt level above the target for a period of time.
We continue to limit our exposure to credit risk by placing our cash and cash equivalents in and, when appropriate, by entering into derivative agreements with, high-quality credit institutions. Our investment held for self-insured liabilities includes bonds and equities, and we mitigate the risk associated with these bonds and equities to some extent through the overall quality and mix of our investment portfolio.
MANAGEMENT’S DISCUSSION AND ANALYSIS
December 31, 2011
STANTEC INC.
M-37
Working Capital
Our working capital (current assets less current liabilities) at the end of 2011 was $201.7 million compared to $176.9 million in 2010. Current assets increased by $28.3 million and current liabilities increased by $3.5 million. The increase in current assets was mainly due to a $44.1 million increase in trade and other receivables and unbilled revenue, mainly due to the timing of contracted milestone billing, increased operations and acquisition activity, and a $4.0 million increase in current other financial assets, mainly due to an increase in our investments held for self-insured liabilities. As well, there was a $4.5 million increase in income taxes recoverable and a $3.2 million increase in prepaid expenses due to normal operations. These increases were partially offset by a $26.6 million decrease in cash and short-term deposits because cash was being held at December 31, 2010, for the payment of notes from acquisitions that were paid in January 2011.
The $3.5 million increase in current liabilities from 2010 to 2011 was mainly due to a $13.2 million increase in the current portion of long-term debt because of notes payable from past acquisitions becoming due in 2012, a $5.6 million increase in trade and other payables because of higher payroll accruals from an increase in staff numbers, and a $1.9 million increase in current other liabilities. These increases were partially offset by a $7.3 million decrease in billings in excess of costs due to the timing of billings, a $4.6 million decrease in income taxes payable due to the payment of income taxes payable assumed from acquisitions, and $4.3 million decrease in current other financial liabilities because of the payment of contingent considerations related to past acquisitions.
In 2011, our current ratio increased to 1.62 from 1.55 in 2010 mainly due to the increase in trade and other receivables and unbilled revenue.
Cash Flows From Operating Activities
Our cash flows from operating activities were $114.6 million in 2011 compared to $111.9 million in 2010. Our cash flows from operating activities are impacted by the timing of payroll and acquisitions—in particular, the timing of payments of acquired trade and other payables, including employee annual bonuses. The $2.7 million increase in cash flows from operating activities for 2011 compared to 2010 was a result of the following:
| • | Our cash receipts from clients increased due to our acquisition and organic growth in 2011 |
| • | Our cash paid to suppliers was lower due to less trade and other payables assumed from the 5 acquisitions in 2011 compared to the 10 acquisitions in 2010 |
The above was partially offset by an increase in cash paid to employees due to the increase in staff numbers. As well, our investment in unbilled revenue and trade and other receivables increased to 92 days at December 31, 2011, from 86 days at December 31, 2010.
Cash Flows Used In Investing Activities
Our cash flows used in investing activities were $99.4 million in 2011 compared to $128.2 million in 2010. In 2011, we used $76.4 million for the 5 acquisitions completed during the year and for the payment of notes payable and contingent consideration due from prior acquisitions, as compared to using $106.4 million for the 10 acquisitions completed in 2010 and the payment of notes payable and contingent consideration from prior acquisitions. An increase in the proceeds received in 2011 over 2010 of $9.4 million on the disposition of investments and other assets assumed on acquisitions over the amounts realized in 2010 offsets the impact of the 2010 $10.0 million proceeds received from the sale of our 30% equity investments in Fugro Jacques Geosurveys Inc. and Fugro Jacques N.V. in 2010.
As a professional services organization, we are not capital intensive. In the past, we have made capital expenditures primarily for items such as leasehold improvements, computer equipment, furniture, and other office
MANAGEMENT’S DISCUSSION AND ANALYSIS
December 31, 2011
STANTEC INC.
M-38
and field equipment. Our cash outflows for property and equipment and software totaled $25.8 million in 2011 as compared to $29.0 million in 2010. One factor contributing to the higher spending on property and equipment in 2010 compared to 2011 was the enhancements to our information technology infrastructure and enterprise system. Our capital expenditures during 2011 were financed by cash flows from operations. We expect our total capital and software expenditures in 2012 to be in the range of $35 to $40 million excluding capital assets acquired from acquisitions. In 2012 we plan to continue to invest in enhancements to our business information systems to optimize and streamline our business processes and prepare for continued growth.
Cash Flows From (Used In) Financing Activities
Our cash flows used in financing activities were $41.9 million in 2011 compared to $65.9 million in cash flows generated from financing activities in 2010. Our cash flows used in financing activities increased $107.8 million compared to 2010. In 2011, we issued $125.0 million in senior debt and used these funds to repay a portion of our revolving credit facility. In addition, we reduced our net revolving credit facility by $23.7 million in 2011 compared to increasing the use of our facility in 2010 by $76.9 million. As at December 31, 2011, $259.5 million was available in the revolving credit facility for future activities. Our year-to-date use of funds for financing activities also increased due to repurchasing $11.1 million in shares for cancelation under our normal course issuer bid, as compared to $4.9 million for the same period last year.
During the year, we extended the maturity date of our existing $350 million revolving credit facility to August 31, 2015. This facility also allows us access to an additional $75 million under the same terms and conditions on approval from our lenders. Our credit facility is available for acquisitions, working capital needs, and general corporate purposes. Depending on the form under which the credit facility is accessed and certain financial covenant calculations, rates of interest may vary between Canadian prime, US base rate, or LIBOR or bankers’ acceptance rates, plus specified basis points. The specified basis points may vary, depending on our level of consolidated debt to EBITDA, from 50 to 175 for Canadian prime and US base rate loans and from 150 to 275 for bankers’ acceptances, LIBOR loans, and letters of credit.
On May 13, 2011, we issued $70 million of 4.332% senior secured notes due May 10, 2016, and $55 million of 4.757% senior secured notes due May 10, 2018. These amounts were recorded net of transaction costs of $1.1 million. The senior secured notes were issued pursuant to an indenture dated May 13, 2011, between Stantec Inc., as issuer, and BNY Trust Company of Canada, as trustee. The senior secured notes are ranked equally with our existing revolving credit facility. Interest on the senior secured notes is payable semi-annually in arrears on May 10 and November 10 each year commencing on November 10, 2011, until maturity or the earlier payment, redemption, or purchase in full of the senior secured notes. We may redeem the senior secured notes, in whole at any time or in part from time to time, at specified redemption prices and subject to certain conditions required by the indenture. As well, we may purchase our senior secured notes for cancellation at any time. The senior secured notes contain restrictive covenants. All of our assets are held as collateral under a general security agreement for the revolving credit facility and the senior secured notes.
We are subject to financial and operating covenants related to our credit facility and senior secured notes. Failure to meet the terms of one or more of these covenants may constitute a default, potentially resulting in accelerated repayment of our debt obligation. In particular, at each quarter-end, we must satisfy the following at any time: 1) our consolidated EBITDAR to debt service ratio must not be less than 1.25 to 1.0 for the revolving credit facility and senior secured notes and 2) our consolidated debt to EBITDA ratio must not exceed 2.5 to 1.0 for the revolving credit facility, and 2.75 to 1.0 for the senior secured notes, except in the case of a material acquisition, when our consolidated debt to EBITDA ratio must not exceed 3.0 to 1.0 for the revolving credit facility, and 3.25 to 1.0 for the senior secured notes, for a period of two complete quarters following the acquisition. These EBITDA and EBITDAR to debt service ratios are defined in the Definition of Non-IFRS Measures in the Critical Accounting
MANAGEMENT’S DISCUSSION AND ANALYSIS
December 31, 2011
STANTEC INC.
M-39
Estimates, Developments, and Measures section of this report. We were in compliance with all these covenants as at and throughout the period ended December 31, 2011.
In the fourth quarter of 2011, we amended our $350 million revolving credit facility to add a bid bond facility in the amount of $10 million. This facility also allows us to access an additional $5 million under the same terms and conditions upon approval from our lenders. This facility may be used for the issuance of bid bonds, performance guarantees, letters of credit, and documentary credits in an international currency. At December 31, 2011, $366,000 had been issued under this bid bond facility.
Shareholders’ Equity
Our shareholders’ equity increased by $11.4 million in 2011 and by $77.7 million in 2010. The following table summarizes the reasons for these increases:
| (In millions of Canadian dollars) | 2011 | 2010 | ||||||||
| ||||||||||
Beginning shareholders’ equity | 615.6 | 537.9 | ||||||||
| ||||||||||
Net income for the year | 12.7 | 94.7 | ||||||||
Currency translation adjustments | 5.7 | (18.6 | ) | |||||||
Unrealized (loss) gain on financial assets | (1.5 | ) | 1.6 | |||||||
Recognition of fair value of share-based compensation | 2.7 | 1.9 | ||||||||
Share options exercised for cash | 2.9 | 3.0 | ||||||||
Shares repurchased under normal course issuer bid | (11.1 | ) | (4.9 | ) | ||||||
| ||||||||||
Total change | 11.4 | 77.7 | ||||||||
| ||||||||||
Ending shareholders’ equity | 627.0 | 615.6 | ||||||||
| ||||||||||
The change arising on the translation of our foreign operations into Canadian dollars was a $5.7 million gain compared to an $18.6 million loss in 2010. The change in 2011 was due to the weakening of the Canadian dollar—from US$1.01 to US$0.98—during the year. In 2010, the Canadian dollar strengthened from US$0.95 to US$1.01 at the end of the year.
We hold investments for self-insured liabilities consisting of government and corporate bonds and equity securities. These investments are classified as available for sale and are stated at fair value with the unrecognized gain or loss recorded in other comprehensive income. The change in the fair value of these investments was a $1.5 million loss in 2011 and a $1.6 million gain in 2010.
From time to time, our board of directors grants share options as part of our incentive programs. In 2011, our board granted 410,000 share options to various officers and employees of the Company. These options vest equally over a three-year period and have a contractual life of seven years from the grant date. Share options exercised in 2011 generated $2.9 million in cash compared to generating $3.0 million in 2010.
Our normal course issuer bid on the TSX was renewed in 2011 and allows us to repurchase up to 2,287,592 of our common shares during the period of June 1, 2011, to May 31, 2012. We continue to believe that, from time to time, the market price of our common shares does not fully reflect the value of our business or future business prospects and that, at such times, outstanding common shares are an attractive, appropriate, and desirable use of available Company funds. In 2011, we purchased 459,600 common shares at an average price of $24.09 per
MANAGEMENT’S DISCUSSION AND ANALYSIS
December 31, 2011
STANTEC INC.
M-40
share for an aggregate price of $11.1 million. In 2010, we repurchased 198,300 at an average price of $24.64 per share for an aggregate price of $4.9 million.
Other
Outstanding Share Data
At December 31, 2011, there were 45,523,585 common shares and 1,578,300 share options outstanding. During the period of December 31, 2011, to February 23, 2012, no shares were repurchased under our normal course issuer bid, no share options were granted, 5,000 share options were exercised, no share options were forfeited, and 2,500 share options were cancelled. At February 23, 2012, there were 45,528,585 common shares and 1,570,800 share options outstanding.
Contractual Obligations
As part of our continuing operations, we enter into long-term contractual arrangements from time to time. The following table summarizes the contractual obligations due on our long-term debt, operating and finance lease commitments, purchase and service obligations, and other liabilities as of December 31, 2011:
| Contractual Obligations | Payment Due by Period | |||||||||||||||||||
| (In millions of Canadian dollars) | Total | Less than 1 Year | 1–3 Years | 4–5 Years | After 5 Years | |||||||||||||||
| ||||||||||||||||||||
Debt | 291.8 | 54.8 | 28.3 | 153.5 | 55.2 | |||||||||||||||
Interest on debt | 40.1 | 9.2 | 16.6 | 10.8 | 3.5 | |||||||||||||||
Operating leases | 448.0 | 79.5 | 136.5 | 104.3 | 127.7 | |||||||||||||||
Finance lease obligation | 5.3 | 5.0 | 0.2 | 0.1 | - | |||||||||||||||
Purchase and service obligations | 9.6 | 6.0 | 3.5 | 0.1 | - | |||||||||||||||
Other obligations | 8.0 | 0.6 | 2.0 | 0.1 | 5.3 | |||||||||||||||
| ||||||||||||||||||||
Total contractual obligations | 802.8 | 155.1 | 187.1 | 268.9 | 191.7 | |||||||||||||||
| ||||||||||||||||||||
For further information regarding the nature and repayment terms of our long-term debt and finance lease obligations, refer to the Cash Flows From Financing Activities section and notes 18 and 22 in our audited consolidated financial statements for the year ended December 31, 2011, incorporated by reference herein. Our operating lease commitments include obligations under office space rental agreements, and our purchase and service obligations include agreements to purchase future goods and services that are enforceable and legally binding. Our other liabilities include amounts payable under our deferred share unit plan and restricted share units and a commitment to purchase the non-controlling interests of The National Testing Laboratories Limited over a period ending in 2014. Failure to meet the terms of our operating lease commitments may constitute a default, potentially resulting in a lease termination payment, accelerated payments, or a penalty as detailed in each lease agreement.
Off-Balance Sheet Arrangements
As of December 31, 2011, we had off-balance sheet financial arrangements relating to letters of credit in the amount of $7.0 million that expire at various dates before January 2013. These letters of credit were issued in the normal course of operations, including the guarantee of certain office rental obligations. We also have a surety facility to facilitate, as part of the normal course of operations, the issuance of bonds for certain types of project work. As at December 31, 2011, $11.3 million in bonds were issued under this agreement. In the fourth quarter of 2011, we entered into a bid bond facility, which allows us to issue bid bonds, performance guarantees, letters of
MANAGEMENT’S DISCUSSION AND ANALYSIS
December 31, 2011
STANTEC INC.
M-41
credit, and documentary credits in an international currency. At December 31, 2011, $0.4 million was issued under this bid bond facility.
During 2009, we issued a guarantee up to a maximum of US$60.0 million for project work with the US federal government. If the guarantee is exercised, we have recourse to our insurers, subject to certain deductibles, policy terms, and limits, to recover claims costs and damages arising from errors or omissions in professional services. At December 31, 2011, $104,000 of this guarantee had been exercised, but we have not made any payments under this guarantee, and no amounts have been accrued in our audited consolidated financial statements with respect to the guarantee.
In the normal course of business, we also provide indemnifications and, in very limited circumstances, surety bonds. These are often standard contractual terms and are provided to counterparties in transactions such as purchase and sale contracts for assets or shares, service agreements, and leasing transactions. In addition, we indemnify our directors and officers against any and all claims or losses reasonably incurred in the performance of their service to the Company to the extent permitted by law. These indemnifications may require us to compensate the counterparty for costs incurred through various events. The terms of these indemnification agreements will vary based on the contract, the nature of which prevents us from making a reasonable estimate of the maximum potential amount that could be required to pay counterparties. Historically, we have not made any significant payments under such indemnifications, and no amounts have been accrued in our consolidated financial statements with respect to these guarantees.
Financial Instruments and Market Risk
Fair value.As at December 31, 2011, we value and record our financial instruments as follows:
| • | Cash and short-term deposits are classified as financial assets at fair value through profit and loss (FVPL) and are recorded at fair value, with realized and unrealized gains and losses reported in income. |
| • | Trade and other receivables are classified as receivables and are initially accounted for at fair value and subsequently adjusted for any allowance for doubtful accounts, with allowances reported in administrative and marketing expenses. |
| • | Investments held for self-insured liabilities, consisting of equity securities and bonds, are classified as financial assets available for sale and are recorded at fair value, with accumulated unrealized gains and losses reported in other comprehensive income until disposed of, at which time the realized gains and losses are recognized in income. Interest income is recorded in finance income, and dividends are recorded in other income. |
| • | Trade and other payables are classified as other financial liabilities and are recorded at fair value and subsequently recorded at amortized cost using the effective interest rate method (EIR), with realized gains and losses reported in income. The EIR method discounts estimated future cash payments or receipts through the expected life of a financial instrument, therefore calculating the amortized cost and subsequently allocating the interest income or expense over the life of the instrument. |
| • | Long-term debts, including non-interest-bearing debts, are classified as loans and borrowings and are initially recorded at fair value and subsequently recorded at amortized cost using the EIR method, with the EIR amortization and realized gains and losses reported in finance costs. |
| • | Derivatives are classified as financial assets and liabilities at FVPL and are accounted for at fair value, with unrealized and realized gains and losses reported in finance income, finance costs, or foreign exchange gains/losses. Derivatives are carried as other financial assets when the fair value is positive and as other financial liabilities when the fair value is negative. |
MANAGEMENT’S DISCUSSION AND ANALYSIS
December 31, 2011
STANTEC INC.
M-42
All financial assets are recognized initially at fair value plus directly attributable transaction costs except for financial assets at FVPL, for which transaction costs are expensed. Purchases or sales of financial assets are accounted for at trade dates. All financial liabilities are recognized initially at fair value and, in the case of loans and borrowings, net of directly attributable transaction costs.
Subsequent to initial recognition, the fair values of financial instruments are based on the bid prices in quoted active markets for financial assets and on the ask prices for financial liabilities. For financial instruments not traded in an active market, the fair value is determined using appropriate valuation techniques. Such techniques may include recent arm’s-length market transactions, reference to the current fair value of another instrument that is substantially the same, discounted cash flow analysis, or other valuation models. The fair values of cash and short-term deposits, trade and other receivables, and trade and other payables approximate their carrying amounts because of the short-term maturity of these instruments. The carrying amount of bank loans approximates their fair value because the applicable interest rate is based on variable reference rates. The carrying amounts of other financial assets and financial liabilities approximate their fair values.
Market risk.We are exposed to various market factors that can affect our performance, primarily with respect to currency and interest rates.
Currency. Our currency exchange rate risk results primarily from the following three factors:
| • | A significant portion of our revenue and expenses is generated or incurred in US dollars; therefore, we are exposed to fluctuations in exchange rates. To the extent that US-dollar revenues are greater than US-dollar expenses in a strengthening US-dollar environment, we expect to see a positive impact on our income from operations. Conversely, to the extent that US-dollar revenues are greater than US-dollar expenses in a weakening US-dollar environment, we expect to see a negative impact. This exchange rate risk primarily reflects, on an annual basis, the impact of fluctuating exchange rates on the net difference between total US-dollar professional revenue and US-dollar expenses. Other exchange rate risk arises from the revenue and expenses generated or incurred by subsidiaries located outside Canada and the United States. Our income from operations will be impacted by exchange rate fluctuations used in translating these revenues and expenses. We do not hedge for this foreign exchange translation risk. |
| • | Foreign exchange fluctuations may also arise on the translation of the balance sheet of (net investment in) our US-based subsidiaries or other foreign subsidiaries where the functional currency is different from the Canadian dollar, and are recorded in other comprehensive income. We do not hedge for this foreign exchange translation risk. |
| • | Foreign exchange gains or losses arise on the translation of foreign-denominated assets and liabilities (such as accounts receivable, accounts payable and accrued liabilities, and long-term debt) held in our Canadian operations and non-US-based foreign subsidiaries. We minimize our exposure to foreign exchange fluctuations on these items by matching US-dollar assets with US-dollar liabilities and, when appropriate, by entering into forward contracts to buy or sell US dollars in exchange for Canadian dollars. |
Although we may buy or sell US dollars in exchange for Canadian dollars in accordance with our foreign exchange risk mitigation strategy, on occasion we may have a net exposure to foreign exchange fluctuations because of the timing of the recognition and relief of foreign-denominated assets and liabilities. At December 31, 2011, due to a slight net exposure, a $0.01 increase or decrease in the exchange rates, with all other variables held constant, would have had an immaterial impact on our net income for the year.
Interest Rate.Changes in interest rates also present a risk to our performance. Our revolving credit facility carries a floating rate of interest. In addition, we are subject to interest rate pricing risk to the extent that our
MANAGEMENT’S DISCUSSION AND ANALYSIS
December 31, 2011
STANTEC INC.
M-43
investments held for self-insured liabilities contain fixed-rate government and corporate bonds. In 2008, we minimized our exposure to floating rates of interest by entering into an interest rate swap agreement until September 3, 2010, as explained in the Net Interest Expense section above. We estimate that, based on our loan balance at December 31, 2011, a 0.5% increase in interest rates, with all other variables held constant, would have impacted our basic earnings per share by approximately $0.01 for the year.
We have the flexibility to partially mitigate our exposure to interest rate changes by maintaining a mix of both fixed and floating debt. Our $125 million in senior secured notes have fixed interest rates until they are due—$70 million at 4.332% due on May 10, 2016, and $55 million at 4.757% due on May 10, 2018. Since these have fixed rates, interest rate fluctuations would have no impact on the senior secured notes interest payments.
Related-Party Transactions
We have subsidiaries that are 100% owned and are consolidated in our financial statements. We also have management agreements in place with several special purpose entities to provide various services, including architecture, engineering, planning, and project management. These management agreements provide us with control over the management and operation of these entities. We also receive a management fee generally equal to the net income of the entities and have an obligation regarding their liabilities and losses. Based on these facts and circumstances, management has concluded that we control these entities and, therefore, consolidated them in our consolidated financial statements. Transactions among subsidiaries and special purpose entities are entered into in the normal course of business and on an arm’s-length basis. Using the consolidated method of accounting, all intercompany balances are eliminated in full.
From time to time, we enter into transactions with associated companies and joint ventures. These transactions involve providing or receiving services and are entered into in the normal course of business and on an arm’s-length basis. Associated companies are entities over which we are able to exercise significant influence but not control. We use the equity method of accounting for our associated companies. Total sales to our associates were $8.0 million during 2011. Distributions paid by our associates were $1.2 million in 2011. At December 31, 2011, receivables from our associates were $2.4 million.
Joint ventures are accounted for using the proportionate consolidation method, which results in recording our pro rata share of the assets, liabilities, revenues, and expenses of each entity. Total sales to our joint ventures were $15.1 million during 2011. Distributions paid by our joint ventures during 2011 were $0.2 million. At December 31, 2011, receivables from our joint ventures were $5.0 million.
Key management personnel have authority and responsibility for planning, directing, and controlling the activities of our Company and include our chief executive officer, chief financial officer, chief operating officer, and senior vice presidents. Total compensation to key management personnel and directors recognized as an expense during 2011 was $11.4 million (at December 31, 2010, it was $10.3 million).
From time to time, we guarantee the obligation of a subsidiary or special purpose entity regarding lease agreements. In addition, from time to time, we guarantee a subsidiary or special purpose entity’s obligations to a third party pursuant to an acquisition agreement. Transactions with subsidiaries, special purpose entities, associated companies, and joint ventures are further described in notes 13 and 34 of our 2011 audited consolidated financial statements and are incorporated by reference herein.
MANAGEMENT’S DISCUSSION AND ANALYSIS
December 31, 2011
STANTEC INC.
M-44
OUTLOOK
The following table summarizes our expectations for the coming year:
| Measure | Expected Range | |
| ||
| Gross margin as % of net revenue | Between 54.5 and 56.5% | |
| Administrative and marketing expenses as % of net revenue | Between 41 and 43% | |
| Net income as % of net revenue | At or above 6% | |
| Effective income tax rate | At or below 28.5% | |
| Return on equity(note 1) | At or above 14% | |
| Net debt to EBITDA(note 2) | Below 2.5 | |
| ||
note 1: Return on equity is calculated as net income for the year divided by average shareholders’ equity over each of the last four quarters.
note 2: Net debt to EBITDA ratio is calculated as the sum of (1) long-term debt, including current portion, plus bank indebtedness, less cash and cash held in escrow, divided by (2) EBITDA, which is calculated as income before income taxes plus net interest expense, amortization of intangible assets, depreciation of property and equipment, and goodwill and intangible impairment. Net debt to EBITDA is a non-IFRS measure and is defined in the Definition of Non-IFRS Measures in the Critical Accounting Estimates, Developments, and Measures section of this report.
We changed our target of net debt to equity ratio, used in past years, to a net debt to EBITDA target since this new target is more relevant in monitoring our future capital structure and corresponds to a covenant in our revolving credit facility and senior secured notes.
Overall, fluctuations in our actual performance occur due to the particular client and project mix achieved as well as the number of acquisitions completed in a year. Some targets, such as net debt to EBITDA, could be impacted and potentially exceeded by completing an opportune larger acquisition that increases our debt level above our target for a period of time.
The infrastructure and facilities market is diverse, consisting of many technical disciplines, practice areas, sectors, and industries for both the private and public sectors. In our principal area of operation, North America, our addressable market is large and is estimated to generate approximately US$80 billion in design-related revenue. This market size is affected by capital spending plans of private sector clients, government allocations to infrastructure, and alternate delivery models. Additionally, our international footprint is gradually expanding and includes office locations in the Caribbean, Latin America, India, Qatar, the United Kingdom, and the United Arab Emirates, expanding our market reach.
In 2012, we expect the overall outlook for professional services in our key markets and practice areas in North America to gradually increase as the economy regains stability and strength and we continue to build a top-tier position in the United States. In addition, we expect that alternate project delivery, including P3s, will continue to be strong in Canada and may present emerging opportunities in the US market. Our overall outlook for our international operations is stable since we expect that geographic areas with a stronger economic forecast will compensate for those with a weaker forecast. We base these expectations on a variety of factors, including the material factors described below.
Canada
The outlook for our Canadian operations in 2012 is moderate growth compared to 2011. Economic expansion is proceeding modestly, although the expected demand is slower than anticipated. Household spending remains solid and business investment is robust, supported by a sustained improvement in credit conditions, along with relatively low financing rates. The fiscal situation of the federal and most provincial governments limits the likelihood of significant increases in public infrastructure funding in 2012. On the private side, activity is increasing in several sectors, though not all sectors have experienced a turnaround. This activity has spurred strong competitive pressures as many international players are now attracted to the Canadian marketplace. Real gross
MANAGEMENT’S DISCUSSION AND ANALYSIS
December 31, 2011
STANTEC INC.
M-45
domestic product (GDP) is projected to grow 2.0% in 2012, according to the Bank of Canada. The following factors are evidence for our Canadian outlook in areas that directly impact infrastructure spending:
| • | Real GDP is expected to rebound in Canada and the United States with demand from private business increasing and government funding expected to be essentially flat. At present, most economic indicators remain mixed, leaving some risk of decline, especially in the case that US or European economic conditions worsen. |
| • | The Bank of Canada’s overnight rate target is currently at 1.0% and is expected to gradually increase in line with modest growth or any mounting inflationary pressure. |
| • | The World Bank expects metal prices to decline moderately in 2012 due to a slowing demand from emerging markets as well as the commissioning of new supply, build-up as a result of recent high prices. |
| • | For energy prices, the Energy Information Administration projects a continued increase in 2012. This suggests that capital expenditure by resource firms will continue and that large capital projects will continue to move forward as firms manage spending in accordance with market risk. |
| • | The deep deficits of federal and provincial governments have forced a rebalancing of the books in some jurisdictions. These deficits are likely to affect public infrastructure spending, although both the impact and timing remain uncertain. |
| • | Strength in the Canadian dollar is working to slow growth and could continue to offset favorable developments in 2012. The Bank of Canada estimates a Canada/US exchange rate averaging $0.98, a slight decrease from the average exchange rate of $1.01 in 2011. |
| • | The public continues to be conscious of environmental issues, and governments continue to discuss climate change, although little movement is expected in the regulatory realm where economic issues remain in focus over the short term. Still, increased awareness has numerous impacts, including interest in pursuing sustainable design and development, improving water distribution and treatment, and reducing the ecological footprint of industrial activity. |
| • | The Canadian resource-based economy and limited political risk are attracting the attention from many US and international competitors. This increases competitive pressure, especially in the P3 market, and is expected to continue in 2012. |
| • | Housing prices in 2012 are expected to rise modestly. The Canadian Mortgage and Housing Corporation suggests that housing starts have been supported by low interest rates, but housing starts growth is expected to be regionally mixed in 2012. The 2012 forecast is 190,000 housing starts versus 193,950 in 2011. |
United States
The outlook for our United States operations in 2012 is stable compared to 2011. The US economy grew at a slower pace than expected in 2011 and continues to be restrained by the consolidation of household balance sheets and slow growth in employment. Government funding in infrastructure-related activities is expected to remain stable or modestly decline related to a rising deficit, continued slowness in the residential marketplace, and persistent high unemployment. On a positive note, alternative project delivery is emerging as a possible solution to US infrastructure funding issues, which means we could be well positioned to transfer our Canadian experience into this much larger US market. Still, the timing on when this emerges with adequate process transparency and a sufficient pipeline of projects remains uncertain. Overall, however, the United States remains a very large market and we expect our performance to improve gradually throughout the course of 2012. The
MANAGEMENT’S DISCUSSION AND ANALYSIS
December 31, 2011
STANTEC INC.
M-46
Congressional Budget Office projects real GDP growth of 2.0% in 2012. The following factors related to infrastructure support this outlook:
| • | Housing activity in the United States is expected to increase in 2012 with the seasonally adjusted annual rate recovering to 499,000 from 429,000 in 2011. In the most recent months, the architectural billings index from the American Institute of Architects shifted slightly above and below 50.0, suggesting mixed demand for design services. |
| • | According to the Congressional Budget Office, the US federal deficit, although starting to shrink, remains large by historical standards and is estimated to be 7.0% of GDP in 2012. States and municipalities are also experiencing fiscal revenue pressures. Adjustments to rebalance the books and reduce federal and state deficits may negatively impact public infrastructure spending, yet may also spur alternate project delivery. |
| • | A continuing weak US dollar may impact the balance of trade and deficit; however, if economic recovery ensues as predicted, a rising dollar may further increase spending pressures. |
| • | The upcoming presidential election in late 2012 may also divert attention to priorities outside of infrastructure, send federal funding to other areas, or create some legislative uncertainty, for example relating to the rollout of the healthcare bill. Short-term extensions of the long-term transportation legislation create some predictability for planned transportation projects, though a long-term sustainable strategy is still required. For healthcare, increased utilization by newly insured Americans is likely to create the need for rehabilitation or construction of healthcare-related infrastructure, though a dramatic political shift may alter this course. |
| • | Environmental issues continue to be a focus after several highly visible events in key resource sectors. Some regulatory and permitting changes for the energy industry are appearing and will drive environmental compliance and monitoring. The present focus on the economy and the distraction of the upcoming presidential election means that changes in climate change regulation are unlikely in 2012. This creates stability in some previously stalled sectors and forfeits opportunity in other sectors. |
| • | Strong commodity prices and the build-out toward energy independence mean the shale gas industry is likely to continue ramping up in 2012. This offers possibilities for organically growing our business, especially in the areas of environmental, site infrastructure design, and water treatment, though this busy market ensures our competitors are striving to do the same. |
International
The outlook for our international operations is stable compared to 2011. These operations currently comprise a small percentage of our business, with the majority falling within our Buildings practice area unit. We are also active in the international mining sector. We expect that strong performance in some geographic areas will compensate for weaker performance in other areas. The following factors support this outlook:
| • | Public and private sector spending has been impacted globally by the economic slowdown. In the United Kingdom, the government is embarking on broad spending cuts that have resulted in the delay of various projects and are likely to impact project opportunities in 2012. The World Bank forecast for the United Kingdom is a GDP growth of 0.6%. |
| • | For 2012, the World Bank forecasts GDP growth of 6.5% for India, 2.3% for the Middle East and North Africa region, and 3.6% for Latin America and the Caribbean region. |
MANAGEMENT’S DISCUSSION AND ANALYSIS
December 31, 2011
STANTEC INC.
M-47
Overall Outlook
We believe that our overall outlook for 2012 is a moderate increase in organic revenue, with a targeted 2.0% to 3.0% increase compared to 2011, focused in regions and practice areas where we are a top-tier service provider. The difficult economic environment of the past year appears to be slowly improving, though related pressures, such as increased competition, margin compressions, project delays, and fiscal rebalancing, are lingering. Due to the diversity of our operations, the mixture of our clients, and the flexibility of our organization, we believe that we will continue to operate our business efficiently, to adapt our business to changing economic conditions, and to position ourselves for growth in a very large infrastructure and facilities market.
The outlook for our Buildings practice area unit is stable, the outlooks for our Environment, Transportation, and Urban Land practice area units are stable to moderate organic growth, and the outlook for our Industrial practice area unit is moderate organic growth, as compared to 2011. Further discussion on the outlooks for each of our practice area units for 2012 can be found in the Results section of this Management Discussion and Analysis on pages M-25 to M-29.
Going forward, we target to achieve a long-term average annual compound growth rate for gross revenue of 15%, a target we have met or exceeded since our initial public offering in 1994. Continued growth allows us to enhance the depth of our expertise and broaden our service offerings, provide expanded opportunities for our employees, and leverage our integrated enterprise systems. Further maximizing the critical mass and maturity we have achieved in certain practice areas and geographic locations also enables us to increase our business with key clients and sell our services across local markets. Our ability to expand 15% annually depends on our strategic efforts to grow organically and the availability of acquisition opportunities. We do not expect to encounter constraints in locating available acquisition candidates, given our past success as well as the consolidation trend in our industry, where smaller firms desire to join larger, more stable organizations. At any one time, we are engaged in discussions with many firms. Since it is important to find an appropriate cultural fit and complementary services, the acquisition process can extend over months or even years. Due to economic difficulties over the past few years, the process continues to be impacted by discrepancies between the perceived values of firms given their current and projected future financial performance.
In establishing our budgets for 2012, we assumed that the Canadian dollar would remain stable compared to the US dollar throughout the year. As well, we assumed that the average interest rate would remain relatively stable in 2012 compared to 2011. In establishing our effective income tax rate, we consider the tax rates substantially enacted at December 31, 2011, for the countries in which we operate, primarily Canada and the United States. We expect to support our targeted level of growth using a combination of cash flows from operations and borrowings. Under certain market conditions, we will also consider issuing common shares.
CRITICAL ACCOUNTING ESTIMATES, DEVELOPMENTS, AND MEASURES
Critical Accounting Estimates
Our consolidated financial statements are prepared in accordance with IFRS, which require us to make various judgments, estimates, and assumptions. The notes to our December 31, 2011, consolidated financial statements outline our significant accounting estimates. The accounting estimates discussed below are considered particularly important because they require the most difficult, subjective, and complex management judgments. However, because of the uncertainties inherent in making assumptions and estimates regarding unknown future outcomes, future events may result in significant differences between estimates and actual results. We believe that each of our assumptions and estimates is appropriate to the circumstances and represents the most likely future outcome.
MANAGEMENT’S DISCUSSION AND ANALYSIS
December 31, 2011
STANTEC INC.
M-48
Unless otherwise specified in our discussion of specific critical accounting estimates, we expect no material changes in overall financial performance and financial statement line items to arise, either from reasonably likely changes in material assumptions underlying an estimate, or within a valid range of estimates from which the recorded estimate was selected. In addition, we are not aware of trends, commitments, events, or uncertainties that can reasonably be expected to materially affect the methodology or assumptions associated with our critical accounting estimates, subject to items identified in the Caution Regarding Forward-Looking Statements and Risk Factors sections of this discussion and analysis.
Revenue and Cost Recognition Estimates on Contracts.We account for our revenue in accordance with IAS 11, “Construction Contracts,” which requires estimates to be made for contract costs and revenues. Revenue from fixed-fee and variable-fee-with-ceiling contracts is recognized using the percentage of completion method based on the ratio of labor costs incurred to total estimated labor costs. Estimating total direct labor costs is subjective and requires the use of management’s best judgments based on the information available at that point in time. We also provide for estimated losses on incomplete contracts in the period in which such losses are determined. Changes in the estimates are reflected in the period in which they are made and would affect our revenue and unbilled revenue.
Allowance for Doubtful Accounts.We maintain an allowance for doubtful accounts for estimated losses resulting from the inability to collect on our trade receivables. We use estimates in arriving at our allowance for doubtful accounts that are based on the age of the outstanding receivables and on our historical collection and loss experience. Future collections of receivables that differ from our current estimates would affect the results of our operations in future periods as well as our trade receivables and administrative and marketing expenses.
Provision for Self-Insured Liabilities.We self-insure certain risks, including professional liability and automobile liability. The accrual for self-insured liabilities includes estimates of the costs of reported claims and is based on estimates of loss using management’s assumptions, including consideration of actuarial projections. These estimates of loss are derived from loss history that is then subjected to actuarial techniques in the determination of the proposed liability. Estimates of loss may vary from those used in the actuarial projections and may result in a larger loss than estimated. Any increase in loss would be recognized in the period in which the loss is determined and would increase our self-insured liability and reported expenses.
Share-Based Payment Transactions.We measure the cost of share-based payment transactions by reference to the fair value of the equity instruments at the date at which they are granted. Estimating fair value for share-based payment transactions requires determining the most appropriate valuation model, which is dependent on the terms and conditions of the grant. We have chosen the Black-Scholes option-pricing model for equity-settled and cash-settled share-based payment transactions. This estimate also requires determining the most appropriate inputs to the valuation model, including volatility in the price of our shares, risk-free interest rate, and expected hold period to exercise, as well as making assumptions about each of these inputs. The expected volatility is based on the historical volatility of our shares over a period commensurate with the expected term of the share option. The risk-free interest rate for the expected life of the options is based on the yield available on government bonds, with an approximate equivalent remaining term at the time of the grant. Historical data is used to estimate the expected life of the option. We also estimate our forfeiture rate for equity-settled transactions based on historical experience in order to determine the compensation expense arising from the share-based awards. Changes to the estimates are reflected in the period in which they are made and would affect our compensation expense, share capital, contributed surplus, and other liabilities. During 2011, we issued share options, deferred share units, and restricted share units. The restricted share unit plan is a new share-based cash-settled payment plan that we implemented during the first quarter of 2011.
MANAGEMENT’S DISCUSSION AND ANALYSIS
December 31, 2011
STANTEC INC.
M-49
Business Combinations.In a business combination, we may acquire the assets and assume certain liabilities of an acquired entity. Judgment is involved in determining the fair values assigned to the tangible and intangible assets (i.e., backlog, client relationships, and favorable and unfavorable leases) acquired and the liabilities assumed on the acquisition. The determination of these fair values involves a variety of assumptions, revenue growth rates, expected operating income, discount rates, and earning multiples. If our estimates or assumptions change prior to finalizing the fair value of assets acquired and liabilities assumed for a transaction, a revision to fair values may impact our net income in future periods. We are currently in the process of finalizing the fair value of assets acquired and liabilities assumed for Caltech, Bonestroo, FSC, and ENTRAN.
Contingent consideration resulting from business combinations is recorded at fair value at the acquisition date as part of the business combination, is based on discounted cash flows, and is subsequently remeasured to fair value at each reporting date. The key assumptions take into consideration the probability of meeting each performance target and the discount factor. At January 1, 2010, on transition to IFRS, we fair valued contingent consideration outstanding from past business combinations using an income approach, which increased our other financial liabilities by $5.9 million and decreased our retained earnings by $6.0 million (net of tax). In the fourth quarter of 2010, due to a change in the probability of meeting a performance target, we accrued additional contingent consideration of $0.5 million as an increase to other financial liabilities and a decrease to other income/expense. Changes to the accounting for business combinations as a result of our transition from Canadian GAAP to IFRS are further discussed in the Transition to IFRS section of this Management’s Discussion and Analysis.
Impairment of Non-Financial Assets.On October 1 of each year we conduct our annual goodwill test, or more frequently if circumstances indicate that an impairment may occur or if a significant acquisition occurs between the annual impairment date and December 31. We review our intangible assets at each reporting period to determine if there is an indication of impairment. If an indication exists, the recoverable amount is estimated and compared to the carrying amount.
The methodology we use to test for goodwill and intangible impairment includes significant judgments, estimates, and assumptions. Impairment exists when the carrying amount of an asset, CGU, or group of CGUs exceeds its recoverable amount, which is the higher of its fair value less costs to sell and its value in use. Fair value less costs to sell is based on available data from binding sales transactions in an arm’s-length transaction of similar assets or observable market prices less incremental costs for disposing of the asset. In the absence of such data, other valuation techniques can be used to estimate fair value less costs to sell. The value in use calculation is based on a discounted cash flow model. The cash flows are derived from budgets over an appropriate number of years and do not include restructuring activities that we are not yet committed to or significant future investments that will enhance the asset’s performance of the CGU or group of CGUs being tested. The recoverable amount, when based on a discount cash flow methodology, is most sensitive to the discount rate used as well as the expected future cash inflows and the growth rate used for extrapolation purposes. To arrive at cash flow projections, we use estimates of economic and market information over the projection period, including growth rates in revenues, estimates of future expected changes in operating margins, and cash expenditures. Other significant estimates and assumptions include future estimates of capital expenditures and changes in future working capital requirements. We believe that our methodology provides us with a reasonable basis for determining whether an impairment charge should be taken. Note 11 in our 2011 audited consolidated financial statements provides more detail about our goodwill impairment test.
MANAGEMENT’S DISCUSSION AND ANALYSIS
December 31, 2011
STANTEC INC.
M-50
We performed our annual goodwill impairment test as at October 1, 2011. Market fluctuations caused our share price to decrease as at October 1, 2011, which adversely impacted our market capitalization. In addition, due to ongoing challenging economic conditions, the short-term performance of our US and International CGUs was weaker than expected. Considering these factors and their impact on the results of our goodwill impairment test, we concluded goodwill was impaired at October 1, 2011, by $90.0 million. We allocated $78.8 million of this charge to the United States CGU and $11.2 million to the International CGU and this charge is reflected as a non-cash charge to income.
Although we reduced the carrying amount of goodwill, if market and economic conditions deteriorate or if continued volatility in the financial markets causes declines in our share price, increases our weighted-average cost of capital, or changes valuation multiples or other inputs to our goodwill assessment, our goodwill may require testing for impairment between our annual testing periods. In addition, it is possible that changes in the numerous variables associated with the judgments, assumptions, and estimates we made in assessing the fair value of our goodwill could cause our CGUs to be further impaired. These impairments are non-cash charges that could have a material adverse effect on our consolidated financial statements but would not have any adverse effect on our liquidity, cash flows from operating activities, or debt covenants and would not have an impact on future operations.
Fair Value of Financial Instruments.Where the fair value of financial assets and financial liabilities recorded in the consolidated statements of financial position cannot be derived from active markets, they are determined using valuation techniques including the discounted cash flow model. The inputs to these models are taken from observable markets where possible, but where this is not feasible, a degree of judgment is required in establishing fair values. The judgments include considerations of inputs such as liquidity risk, credit risk, and volatility. Changes in assumptions about these factors could affect the reported fair value of financial instruments and reported expenses and income.
Taxes.Uncertainties exist with respect to the interpretation of complex tax regulations and the amount and timing of deferred taxable income. Our income tax assets and liabilities are based on interpretations of income tax legislation across various jurisdictions in Canada and the United States. Our effective tax rate can change from year to year based on the mix of income among different jurisdictions, changes in tax laws in these jurisdictions, and changes in the estimated value of deferred tax assets and liabilities. Our income tax expense reflects an estimate of the cash taxes we expect to pay for the current year, as well as a provision for changes arising in the values of deferred tax assets and liabilities during the year. The tax value of these assets and liabilities is impacted by factors such as accounting estimates inherent in these balances, our expectations about future operating results, and previous tax audits and differing interpretations of tax regulations by the taxable entity and the responsible tax authorities. Such differences in interpretation may arise on a wide variety of issues depending on the conditions prevailing in the respective legal entity’s domicile. We assess the likelihood of recovering value from deferred tax assets, such as loss carryforwards, on a regular basis, as well as the deferred tax depreciation of capital assets, and adjust the tax provision accordingly.
Deferred tax assets are recognized for all unused tax losses to the extent that it is probable that taxable profit will be available against which the losses can be utilized. Significant management judgment is required to determine the amount of deferred tax assets that can be recognized, based on the likely timing and the level of future taxable profits together with future tax-planning strategies. If our estimates or assumptions change from those used in our current valuation, we may be required to recognize an adjustment in future periods that would increase or decrease our deferred income tax asset or liability and increase or decrease our income tax expense.
MANAGEMENT’S DISCUSSION AND ANALYSIS
December 31, 2011
STANTEC INC.
M-51
Accounting Developments
Recently Adopted
On transition to IFRS, we adopted the annual improvements to IFRS issued by the IASB in May 2010. The adoption of these amendments did not have an effect on our financial position or on the results of our operations.
Transition to IFRS
As required by the CICA, our 2011 consolidated financial statements, including comparative figures for the prior year, present our results and financial position in accordance with IFRS. Subject to certain transition elections, we consistently applied the same accounting policies in our opening IFRS statement of financial position at January 1, 2010, and throughout all periods presented, as if these policies had always been in effect. IFRS uses a conceptual framework similar to that used by Canadian GAAP, but there are differences in recognition, measurement, and disclosure. Whereas the adoption of IFRS did not have a material impact on our total operating, investing, or financing cash flows, it had an impact on our consolidated statements of financial position and consolidated statements of income as summarized below. For more details regarding the impact of IFRS on our 2011 consolidated financial results, refer to note 38 of our 2011 consolidated financial statements incorporated by reference herein.
As part of our conversion to IFRS, we assessed and concluded that IFRS had a minimal impact on our internal controls over financial reporting, disclosure controls and procedures, information technology systems, and business activities, including our budgeting and forecasting processes, debt covenants, key performance indicators, and compensation plans. For a summary of our conversion process, refer to our Management’s Discussion and Analysis for the year ended December 31, 2010, under the Accounting Developments, Canadian—Recent Accounting Pronouncements—International Financial Reporting Standards section.
a) IFRS 1 exemptions
Most adjustments required on the transition to IFRS were made retrospectively against opening retained earnings at January 1, 2010. IFRS 1, “First-Time Adoption of International Financial Reporting Standards,” provides entities adopting IFRS for the first time with a number of optional exemptions and, in certain areas, mandatory exceptions to the general requirement for full retrospective application of IFRS. We chose to apply the following elective exemptions:
| • | Business combinations. |
We chose the business combinations exemption in IFRS 1 not to apply IFRS 3, “Business Combinations,” retrospectively to past business combinations. Accordingly, we did not restate business combinations that took place prior to January 1, 2010. Any goodwill arising on business combinations before the transition date was not adjusted from the carrying amount previously determined under Canadian GAAP as a result of applying this exemption except as required under IFRS 1. We chose this exemption mainly because the high volume of our business combinations would have made the retrospective application a time-consuming and complex exercise.
| • | Fair value or revaluation as deemed cost. |
We elected to measure buildings, classified as property and equipment and investment property, at their fair values and to use that amount as their deemed cost at January 1, 2010. The costs of buildings were determined by reference to their fair values at January 1, 2010, by professional valuators on an existing-use basis. Our consolidated opening statement of financial position was not materially impacted by this election. We chose this election to avoid the retrospective componentization of our buildings.
MANAGEMENT’S DISCUSSION AND ANALYSIS
December 31, 2011
STANTEC INC.
M-52
| • | Cumulative currency translation adjustment. |
We elected to deem the cumulative currency translation difference for all our foreign operations to be zero at January 1, 2010, by transferring the balance at that date to retained earnings. As a result, our January 1, 2010, cumulative translation adjustment balance of $50.8 million was reclassified, increasing our accumulated other comprehensive income and decreasing our retained earnings accordingly. Therefore, this election had a net zero impact on our opening equity. We chose this election to avoid the time-consuming retrospective calculation of our cumulative translation adjustment since inception.
| • | Share-based payments. |
We elected not to apply IFRS 2, “Share-Based Payments,” to equity instruments granted on or before November 7, 2002, or granted after November 7, 2002, that vested before January 1, 2010. For cash-settled share-based payment transactions, called deferred share units, we elected not to apply IFRS 2 to liabilities that were settled before January 1, 2010. Our consolidated opening statement of financial position was not impacted by this election. We chose this election to avoid the time-consuming retrospective application of IFRS 2 to all equity instruments.
b) Impact of IFRS on our financial results
Summarized in the tables below is the impact of the changeover to IFRS on our opening equity at January 1, 2010, our net income for the fourth quarter ended December 31, 2010, and our net income for the year ended December 31, 2010. These results are based on IFRS issued and outstanding as of February 23, 2012.
January 1 and December 31, 2010, equity under IFRS
The impact of the changeover to IFRS on our opening equity at January 1, 2010, was a decrease in equity by $9.3 million from $547.4 million under Canadian GAAP to $538.1 million under IFRS. Our equity for the year ended December 31, 2010, decreased by $9.8 million from $625.5 million under Canadian GAAP to $615.7 million under IFRS. An explanation of the most significant differences between Canadian GAAP and IFRS that impacted our opening equity and December 31, 2010, equity are described in further detail in section c) Accounting Policies and Statement Presentation below.
Increase (Decrease) to Equity (In millions of Canadian dollars) | ||||||||||||
| ||||||||||||
| Standard | Balance Sheet Category | Description of Change | December 31, 2010 | January 1, 2010 | ||||||||
| ||||||||||||
IFRS 3 | Financial liabilities | Recognition of contingent consideration outstanding from past business combinations | (6.6 | ) | (6.0 | ) | ||||||
IAS 36 | Intangible assets | Recognition of intangible asset impairment | (1.0 | ) | (2.4 | ) | ||||||
IFRS 3 | Goodwill, Accounts Payable | Restructuring and acquisition-related costs | (1.7 | ) | - | |||||||
IAS 37 | Provisions | Derecognition of estimated future sublease revenue not virtually certain at January 1, 2010 | (0.4 | ) | (1.7 | ) | ||||||
Other | Other transitional adjustments | (0.1 | ) | 0.8 | ||||||||
| ||||||||||||
Total after-tax impact on equity | (9.8 | ) | (9.3 | ) | ||||||||
| ||||||||||||
MANAGEMENT’S DISCUSSION AND ANALYSIS
December 31, 2011
STANTEC INC.
M-53
December 31, 2010, net income under IFRS
Our net income for the three months ended December 31, 2010, decreased by $1.8 million from $25.1 million under Canadian GAAP to $23.3 million under IFRS. Our Q4 10 basic and diluted earnings per share decreased by $0.04 from $0.55 under Canadian GAAP to $0.51 under IFRS. Other comprehensive loss decreased by $0.1 million from a loss of $8.4 million under Canadian GAAP to a loss of $8.3 million under IFRS in Q4 10.
Our net income for the year ended December 31, 2010, increased by $1.1 million from $93.6 million under Canadian GAAP to $94.7 million under IFRS. Our basic earnings per share increased by $0.02 from $2.05 to $2.07 under IFRS, and our diluted earnings per share increased by $0.02 from $2.04 to $2.06 under IFRS. Other comprehensive loss for 2010 increased by $1.5 million from a loss of $15.6 million under Canadian GAAP to a loss of $17.1 million under IFRS. An explanation of the most significant differences between Canadian GAAP and IFRS that impacted our net income for the quarter and year ended December 31, 2010, are described in further detail in section c) Accounting Policies and Statement Presentation below.
Increase/(Decrease) to Net Income (After Tax) (In millions of Canadian dollars) | ||||||||||||
|
| |||||||||||
| Standard | Income Statement Category | Description of Change | Quarter ended December 31, 2010 | Year ended December 31, 2010 | ||||||||
| ||||||||||||
IFRS 3 | Administrative and marketing expenses | Restructuring and acquisition-related costs | (0.9) | (1.9) | ||||||||
IAS 39 | Other finance income | Reclassification of the unrealized gain on the interest rate swap | - | 1.5 | ||||||||
IAS 37 | Administrative and marketing expenses | Recognition of future sublease revenue that is virtually certain | 0.1 | 1.4 | ||||||||
IAS 36 | Amortization of intangible assets | Intangible asset impairment and amortization | - | 1.3 | ||||||||
Other | Other transitional adjustments | (1.0) | (1.2) | |||||||||
| ||||||||||||
Total after-tax impact on net income for the quarter and year ended December 31, 2010 | (1.8) | 1.1 | ||||||||||
| ||||||||||||
c) Accounting Policies and Statement Presentation
Summarized below are the key differences in our accounting policies between Canadian GAAP and IFRS that had the most significant impact on our consolidated opening statement of financial position and 2010 comparative financial statements. The following discussion also includes an analysis of how the IFRS changeover is expected to affect our future financial reporting.
| • | Presentation of Financial Statements (IAS 1) |
Under International Accounting Standard (IAS) 1, a complete set of financial statements should include a statement of financial position, a statement of comprehensive income, a statement of changes in equity, and a statement of cash flows, accounting policies, and explanatory notes. IAS 1 prescribes various formats and
MANAGEMENT’S DISCUSSION AND ANALYSIS
December 31, 2011
STANTEC INC.
M-54
requirements for statement presentation and disclosure. The adoption of IAS 1 resulted in several changes to the format of our financial statements, in expanded note disclosure, and in different classification and presentation of line items in our consolidated statements of financial position and consolidated statements of income.
We changed our current consolidated statements of equity and comprehensive income by moving all other comprehensive income items to new consolidated statements of comprehensive income. We reclassified certain statement of financial position line items into new categories, such as “investment property,” “provisions,” “financial assets,” and “financial liabilities.” We also reclassified bank charges from “administrative and marketing expenses” to “other net finance expense (income)” as well as the amortization of bonds and the realized gain on the sale of bonds from “other income” to “other net finance expense (income).” These reclassifications had a minimal impact on our debt covenants and key performance indicators.
| • | Business Combinations (IFRS 3) |
Under IFRS 3, postacquisition exit/restructuring costs such as lease exits and acquisition-related costs such as advisory, legal, accounting, valuation, and other professional or consulting fees are expensed as incurred. Under Canadian GAAP, if certain criteria are met, many of these costs are recognized as liabilities in the purchase price allocation and impact goodwill. Therefore, we were required to derecognize these liabilities existing at January 1, 2010, if they did not meet IFRS criteria. As a result, on transition to IFRS, our accrual for exit/restructuring activities decreased by $250,000, and our retained earnings increased by $177,000 (net of tax). We recognized exit/restructuring costs of $0.2 million (net of tax) in Q4 10 and $0.7 million (net of tax) during 2010 in administrative and marketing expenses because under IFRS they are expensed as incurred. Also, we recognized $0.7 million (net of tax) in Q4 10 and $1.2 million (net of tax) in 2010 in legal and audit costs associated with acquisitions.
In addition, under IFRS 3, an acquirer recognizes contingent consideration as part of the consideration on acquisition and measures it at the acquisition date fair value. The remeasurement of the liability at fair value each quarter-end impacts earnings until the liability is settled. Under Canadian GAAP, a liability for contingent consideration is generally recognized when the contingency is resolved and the consideration becomes payable and is recorded as an adjustment to goodwill. As part of our IFRS transition, we fair valued, using an income approach, and recorded contingent consideration outstanding at January 1, 2010, from past business combinations. As a result, our other financial liabilities increased and our retained earnings decreased by $6.0 million. Contingent consideration was recorded at a discounted amount due to its long-term nature. In addition, in Q4 10, due to a change in the probability of meeting a performance target, we adjusted the fair value of contingent consideration, thereby decreasing other income by $0.5 million.
Under Canadian GAAP, initial purchase price allocations are generally subsequently adjusted through goodwill on a prospective basis. Under IFRS, if the initial accounting for a business combination can only be determined provisionally, subsequent significant adjustments to the allocation are retrospectively recognized from the date of acquisition. These adjustments (i.e., measurement period adjustments) are only those that confirm facts and circumstances existing at the acquisition date and may occur up to 12 months from the acquisition date. During the first quarter of 2011, we had significant measurement period adjustments relating to 2010 acquisitions; therefore, these adjustments were retroactively applied to 2010, impacting various line items in our consolidated statements of financial position.
As a result of the difference between Canadian GAAP and IFRS in accounting for business combinations, in future periods we may record less goodwill and, depending on the size of acquisition, our administrative and marketing expenses may increase due to postacquisition exit/restructuring costs and acquisition-related costs. We may also experience a restatement of prior periods’ purchase price allocations depending on whether we have significant measurement period adjustments.
MANAGEMENT’S DISCUSSION AND ANALYSIS
December 31, 2011
STANTEC INC.
M-55
| • | Impairment of Assets (IAS 36) |
Under IAS 36, the impairment test for definite-lived intangible assets and long-lived assets is only one step. If the carrying amount exceeds the recoverable amount (on a discounted basis), the asset value is written down to the recoverable amount. Under Canadian GAAP, this test is a two-step process. In the first step, the carrying amount of an asset is compared to the expected undiscounted cash flows for the asset. If the carrying amount is more than the undiscounted cash flows, the fair value of the asset is determined. An impairment loss is recorded if the carrying amount is more than the fair value. In addition, unlike Canadian GAAP, IAS 36 requires, under certain circumstances, the reversal of impairment losses other than goodwill impairments.
Canadian GAAP also uses a two-step impairment testing approach for goodwill, whereas IFRS takes a one-step approach. Under IFRS, if the carrying amount of the CGU or group of CGUs exceeds the recoverable amount, an impairment loss is recognized. A CGU is the smallest group of assets that includes the asset and generates cash inflows that are largely independent of the cash inflows from other assets or groups of assets. The recoverable amount is the higher of the fair value less costs to sell and the value in use. We performed an impairment test as at January 1, 2010, on transition to IFRS as required by IFRS 1. In addition, we performed our annual goodwill impairment test as at July 1, 2010, in accordance with the IFRS methodology. Due to the acquisitions completed in the third and fourth quarters of 2010, an impairment test was also performed at December 31, 2010. Based on the results of these reviews, we concluded that the recoverable amount of our CGUs exceeded their carrying amount and, therefore, goodwill was not impaired.
On January 1, 2010, we also conducted an impairment test on intangible assets using IFRS methodology as required by IFRS 1. As a result of this review, we recorded a $2.4 million (net of tax) non-cash impairment charge to retained earnings and decreased our intangible assets by $3.8 million. The impairment primarily reflected a decline in expected future cash flows from certain clients and a reduction in the value of a favorable lease in our New York, New York, office. The remaining carrying amount of these specific client relationships following this impairment charge was $5.1 million. The carrying amount of the favorable lease was reduced to zero. Because we recorded the impairment on January 1, 2010, the intangible asset amortization decreased by $49,000 (net of tax) in Q4 10 and by $0.2 million (net of tax) in 2010. Under Canadian GAAP, in the first half of 2010, we also recorded a $1.1 million (net of tax) non-cash impairment charge to income related to the same client relationships and lease advantage. Therefore, we added this impairment charge back to income in our 2010 IFRS results since, under IFRS, we accounted for this impairment in our opening statement of financial position. Additional client relationships were impaired under IFRS compared to Canadian GAAP due to the difference in methodology for impairment testing.
Because of the requirement to test goodwill on acquisitions before the end of our fiscal year, and depending on the number of acquisitions we carry out in the latter half of the year, we may experience more frequent impairment testing of goodwill under IFRS.
| • | Sublease Revenue Recognition (IAS 37) |
Under IAS 37, an inflow of resources is recognized in the statement of financial position when it is virtually certain. Under Canadian GAAP, we establish lease exit liabilities when we cease to use office space under an operating lease arrangement. Included in the liability is the present value of the remaining lease payments offset by an estimate of future sublease revenue. Upon the adoption of IAS 37, we derecognized $2.6 million in future sublease revenue at January 1, 2010, since this revenue was not virtually certain at that date. As a result, our opening IFRS consolidated statement of financial position provision for lease exit liabilities increased by $2.6 million, and our retained earnings decreased by $1.7 million (net of tax). Administrative and marketing expenses decreased by $0.1 million (net of tax) in Q4 10 and by $1.4 million (net of tax) in 2010 because we recognized sublease revenues that became virtually certain.
MANAGEMENT’S DISCUSSION AND ANALYSIS
December 31, 2011
STANTEC INC.
M-56
In the future, we may experience a fluctuation in administrative and marketing expenses as a result of the timing of recognizing lease exit liabilities and sublease revenue.
| • | Hedge Accounting (IAS 39) |
As at December 31, 2009, we used the “shortcut” method to prove the effectiveness of our interest rate hedge as permitted by Canadian GAAP. Per IAS 39, the shortcut method is not permitted to be used to assess hedge effectiveness. As a result, we discontinued hedge accounting (for IFRS accounting purposes only) on January 1, 2010, and removed the $1.5 million loss (net of tax) in cumulative other comprehensive income, decreasing our retained earnings accordingly.
Our interest rate swap expired in 2010. As its fair value approached zero, we reclassified the resulting unrealized gain from other comprehensive income to finance income. As a result, our other comprehensive income decreased by $1.5 million (net of tax), and our finance income increased by $1.5 million (net of tax) in the first three quarters of 2010. Since the interest rate swap expired in September 2010, there was no impact on Q4 10.
Recent Accounting Pronouncements
The listing below includes issued standards and interpretations that we reasonably expect to be applicable at a future date and intend to adopt when they become effective. Unless otherwise noted, the effective date of each standard below is the first annual period beginning on or after January 1, 2013, with retrospective application required and early adoption permitted. Unless otherwise noted, we are currently considering the impact of adopting these standards and interpretations on our consolidated financial statements and cannot reasonably estimate the effect at this time.
Financial Instruments.In November 2009, the IASB issued IFRS 9, “Financial Instruments” (IFRS 9), as part of the first of three phases to replace IAS 39, “Financial Instruments: Recognition and Measurement” (IAS 39). The first phase addressed the classification and measurement of financial assets. IFRS 9 replaces the multiple classification and measurement models of IAS 39 with a single model that has only two classification categories: amortized cost and fair value.
In October 2010, the IASB reissued IFRS 9, incorporating new requirements on accounting for financial liabilities and carrying over from IAS 39 the requirements for derecognition of financial assets and financial liabilities and for classification and measurement of financial liabilities. The reissued IFRS 9 requires that the amount of change in the fair value of the financial liability that is attributable to changes in the credit risk of that liability be presented in other comprehensive income, instead of in profit and loss.
In December 2011, the IASB issued amendments to IFRS 9 (the amendments). The amendments result in a deferred effective date for IFRS 9, from annual periods beginning on or after January 1, 2013, to January 1, 2015, with early adoption still permitted. This deferral makes it possible for all phases of the replacement of IAS 39 to have the same mandatory effective date. The amendments provide relief in restating prior periods, requiring instead that entities provide disclosures to allow financial statement users to understand the initial impact of applying IFRS 9.
Financial Instruments: Presentation.In December 2011, the IASB issued amendments to IAS 32, “Financial Instruments: Presentation” (the amendments). The amendments clarify when an entity has a legally enforceable right to set off, as well as clarifying the application of offsetting criteria related to some settlement systems that may be considered the same as net settlement. The amendments to IAS 32 are applicable for annual periods beginning on or after January 1, 2014.
MANAGEMENT’S DISCUSSION AND ANALYSIS
December 31, 2011
STANTEC INC.
M-57
Financial Instruments: Disclosures.In October 2010, the IASB issued amendments to IFRS 7, “Financial Instruments: Disclosures” (the amendments). The amendments require additional qualitative and quantitative disclosure associated with the transfers of financial assets. Entities are required to apply the amendments for annual periods beginning on or after July 1, 2011. Early adoption is permitted. The new disclosure requirements are required to be applied prospectively. The adoption of the amendments is not expected to have a material impact on our consolidated financial statements.
In December 2011, the IASB issued further amendments to IFRS 7 related to the disclosures of offsetting financial assets and financial liabilities. These amendments require disclosure of information that will allow financial statement users to assess the impact of an entity’s netting arrangements, including rights of set-off associated with an entity’s recognized financial assets and liabilities, on the entity’s statement of financial position.
Consolidated Financial Statements.In May 2011, the IASB issued IFRS 10, “Consolidated Financial Statements” (IFRS 10), which replaces Standing Interpretations Committee (SIC)-12, “Consolidation—Special Purpose Entities,” and parts of IAS 27, “Consolidated and Separate Financial statements.” The new standard builds on existing principles by identifying the concept of control as the determining factor in whether an entity should be included in a company’s consolidated financial statements. The standard provides additional guidance to assist in the determination of control where it is difficult to assess.
Joint Arrangements.In May 2011, the IASB issued IFRS 11, “Joint Arrangements” (IFRS 11), to establish principles for financial reporting by parties to a joint arrangement. This standard supersedes IAS 31, “Interests in Joint Ventures” (IAS 31), and SIC-13, “Jointly Controlled Entities—Non-Monetary Contributions by Venturers.” Under IFRS 11, joint arrangements are classified as either joint operations or joint ventures; the classification of a joint arrangement focuses on the nature and substance of the rights and obligations of the arrangement. IFRS 11 requires that joint ventures be accounted for using the equity method, rather than proportionate consolidation.
Investments in Associates and Joint Ventures.In May 2011, the IASB amended IAS 28, “Investments in Associates and Joint Ventures” (IAS 28), previously IAS 28, “Investments in Associates.” The amended IAS 28 sets out the accounting for investments in associates and the requirements for application of the equity method when accounting for investments in associates and joint ventures.
Disclosure of Interests in Other Entities.In May 2011, the IASB issued IFRS 12, “Disclosure of Interests in Other Entities” (IFRS 12). IFRS 12 combines the disclosure requirements for an entity’s interests in subsidiaries, joint arrangements, associates, and structured entities into one comprehensive disclosure standard. Many of the disclosure requirements were previously included in IAS 27, IAS 28, IAS 31, and SIC-12 while others are new. IFRS 12 requires that an entity discloses the significant judgment and assumptions it has made in determining whether it controls an entity.
Fair Value Measurement.In May 2011, the IASB issued IFRS 13, “Fair Value Measurement” (IFRS 13). IFRS 13 provides guidance on how to measure fair value under IFRS when fair value is required or permitted by other standards. Fair value is defined as the price that would be received to sell an asset or paid to transfer a liability in an orderly transaction between market participants at the measurement date. IFRS 13 requires enhanced disclosure for fair value. IFRS 13 is applied prospectively for annual periods beginning on or after January 1, 2013, and comparative disclosures for prior periods are not required.
Presentation of Financial Statements.In June 2011, the IASB issued amendments to IAS 1, “Presentation of Financial Statements” (IAS 1), to improve the consistency and clarity of items presented in Other Comprehensive Income (OCI). The amendments require that items presented in OCI be grouped into two categories: items that
MANAGEMENT’S DISCUSSION AND ANALYSIS
December 31, 2011
STANTEC INC.
M-58
may be reclassified into profit or loss at a future date, and items that will never be reclassified into profit or loss. The amendments to IAS 1 are effective for annual periods beginning on or after July 1, 2012.
Employee Benefits.In June 2011, the IASB issued amendments to IAS 19 “Employee Benefits” (the amendments). Among other changes, the amendments impact the timing of the recognition of termination benefits. The revised standard requires termination benefits outside of a wider restructuring to be recognized only when the offer becomes legally binding and cannot be withdrawn. In the context of a wider restructuring, termination benefits are recognized at the same time as other restructuring costs.
Materiality
We determine whether or not information is “material” based on whether we believe that a reasonable investor’s decision to buy, sell, or hold securities in our Company would likely be influenced or changed if the information is omitted or misstated.
Definition of Additional IFRS Measures
IFRS mandates certain minimum line items for financial statements and requires presentation of additional line items, headings, and subtotals when such presentation is relevant to an understanding of a company’s financial position and performance. Because IFRS requires such additional GAAP measures, they are not non-IFRS financial measures but are considered additional IFRS measures. This Management Discussion and Analysis includes reference to and uses terms that are considered additional IFRS measures. We believe that these measures, defined here, are useful for providing investors with additional information to assist them in understanding components of our financial results.
Gross Revenue and Net Revenue. Our Company provides knowledge-based solutions for infrastructure and facilities projects through value-added professional services, principally under fee-for-service agreements with clients. In the course of providing services, we incur certain direct costs for subconsultants, equipment, and other expenditures that are recoverable directly from our clients. The revenue associated with these direct costs is included in our gross revenue. Since such direct costs and their associated revenue can vary significantly from contract to contract, changes in our gross revenue may not be indicative of our revenue trends. Accordingly, we also report net revenue, which is gross revenue less subconsultant and other direct expenses, and analyze our results in relation to net revenue rather than to gross revenue.
Gross Margin. We monitor our gross margin percentage levels to ensure that they are within an established acceptable range for the profitability of our operations. Gross margin is calculated as the difference of net revenue minus direct payroll costs. Direct payroll costs include the cost of salaries and related fringe benefits for labor hours that are directly associated with the completion of projects. Labor costs and related fringe benefits for labor hours that are not directly associated with the completion of projects are included in administrative and marketing expenses.
Definition of Non-IFRS Measures
This Management’s Discussion and Analysis includes references to and uses terms that are not specifically defined in IFRS and do not have any standardized meaning prescribed by IFRS. These non-IFRS measures may not be comparable to similar measures presented by other companies. We believe that these measures, defined here, are useful for providing investors with additional information to assist them in understanding components of our financial results.
Working Capital. We use working capital as a measure for assessing our overall liquidity. Working capital is calculated by subtracting current liabilities from current assets. There is no directly comparable IFRS measure for working capital.
Current Ratio. We also use current ratio as a measure for assessing our overall liquidity. Current ratio is calculated by dividing current assets by current liabilities. There is no directly comparable IFRS measure for current ratio.
Net Debt to Equity Ratio.As part of our overall assessment of our financial condition, we monitor our net debt to equity ratio to ensure that it is maintained within our established range. Our net debt to equity ratio is calculated as long-term debt, plus the current portion of long-term debt, plus bank indebtedness less cash and cash held in escrow, all divided by shareholders’ equity. There is no directly comparable IFRS measure for net debt to equity ratio.
MANAGEMENT’S DISCUSSION AND ANALYSIS
December 31, 2011
STANTEC INC.
M-59
Return on Equity. As part of our overall assessment of value added for shareholders, we monitor our return on equity. Return on equity is calculated as net income for the last four quarters divided by the average shareholders’ equity over each of the last four quarters. There is no directly comparable IFRS measure for return on equity.
Net Income before Goodwill Impairment.We add back goodwill impairment charges to net income since these charges are non-cash in nature and do not impact our operating results. We use this measure to evaluate our operating performance. There is no directly comparable IFRS measure for net income before goodwill impairment.
EBITDA. EBITDA represents net income before interest expense, income taxes, depreciation of property and equipment, amortization of intangible assets, and goodwill and intangible impairments. This measure is referenced in our credit facility as part of our debt covenants, and we use it as part of our overall assessment of our operating performance. It is defined as net income for such period, plus all amounts deducted in the calculation thereof on account of interest expense, income taxes, depreciation, amortization, goodwill and intangible impairments, or any minority interest. There is no directly comparable IFRS measure for EBITDA.
EBITDAR. This measure is referenced in our credit facility as part of our debt covenants. It is defined in the credit facility as an amount equal to EBITDA plus building rental obligations net of common area costs, taxes, charges, and levies. There is no directly comparable IFRS measure for EBITDAR.
Debt to EBITDA Ratio. This ratio is referenced in our credit facility agreement as part of our debt covenants. It is defined in the credit facility as the sum of permanent principal and interest payments in respect of the debt, plus building rental obligations net of common area costs, taxes, charges, and levies divided by EBITDA. There is no directly comparable IFRS measure for debt to EBITDA ratio.
Net Debt to EBITDA.As part of our assessment of our capital structure we monitor net debt to EBITDA. This measure is referenced in our credit facility as part of our debt covenants as well. It is defined as the sum of (1) long-term debt, including current portion, plus bank indebtedness, less cash and cash held in escrow, divided by (2) EBITDA, which is calculated as income before income taxes plus net interest expense, amortization of intangible assets, depreciation of property and equipment, and goodwill and intangible impairment. There is no directly comparable IFRS measure for net debt to EBITDA.
EBITDAR to Debt Service Ratio. This ratio is referenced in our credit facility agreement as part of our debt covenants. It is defined in the credit facility as EBITDAR divided by permanent principal and interest payments in respect of the debt, plus building rental obligations net of common area costs, taxes, charges, and levies. There is no directly comparable IFRS measure for EBITDAR to debt service ratio.
Backlog.As part of our assessment of our financial condition, we monitor our backlog. We define backlog as the total value of secured work that has not yet been completed that a) is assessed by management as having a high certainty of being performed by either the existence of an executed contract or work order specifying the job scope, value, and timing or b) has been awarded to us through an executed binding or non-binding letter of intent or agreement describing the general job scope, value, and timing. Management must be reasonably assured that the letter of intent or agreement will be finalized in the form of a formal contract. Backlog is not a recognized performance measure under IFRS and does not have any standardized meaning prescribed by IFRS. We believe
MANAGEMENT’S DISCUSSION AND ANALYSIS
December 31, 2011
STANTEC INC.
M-60
that backlog is a useful means of projecting activity in future periods. There is no directly comparable IFRS measure for backlog.
RISK FACTORS
Forward-looking statements
From time to time, management makes forward-looking statements. The following factors, among others, could cause our actual results to differ materially from those projected in our forward-looking statements:
| • | Global capital market activities |
| • | Fluctuations in interest rates or currency values |
| • | The effects of war or terrorist activities |
| • | The effects of disease or illness on local, national, or international economies |
| • | The effects of disruptions to public infrastructure such as transportation, communications, power, or water |
| • | Global economic or political conditions |
| • | Regulatory or statutory developments |
| • | The effects of competition in the geographic or business areas in which we operate |
| • | The actions of management |
| • | Technological changes |
Investors and the public should carefully consider these factors, other uncertainties, and potential events, as well as the inherent uncertainty of any projections, when relying on our forward-looking statements to make decisions with respect to Stantec. Except as may be required by law, we do not undertake to update any forward-looking statement, whether written or verbal, that may be made from time to time by the organization or on its behalf.
Risks
While management remains optimistic about our ability to successfully carry out our long-term objectives, like all professional infrastructure and facilities services firms, we are exposed to a number of risks and uncertainties. We have various strategies and practices to mitigate these risks and uncertainties as further discussed below. When appropriate, we realign our risk disclosures as part of our continuous monitoring and annual assessment of our risks. The most significant of these risks are listed below in order of seriousness—a combination of the impact on our Company and the probability of occurrence. Readers of this report should consider carefully the risks and uncertainties described below, together with all of the other information in this report. The risks and uncertainties described below are not the only ones we face. Additional risks and uncertainties that we are unaware of, or that we currently believe are not material, may also become important factors that adversely affect our business. If any of the following risks actually occurs, the effects described below in respect of each risk are not the only ones we face and our business, financial condition, results of operations, and future prospects could be materially and adversely affected in ways we do not currently anticipate.
Economic downturns could have a negative impact on our business since our clients may curtail investment in infrastructure projects or may experience difficulty paying for services performed.
Demand for the services we offer has been, and is expected to continue to be, subject to significant fluctuations due to a variety of factors beyond our control, including economic conditions. During economic downturns, the ability of both private and government entities to make expenditures may decline significantly, which could have a material adverse effect on our revenue and profitability. We cannot be certain that economic or political conditions
MANAGEMENT’S DISCUSSION AND ANALYSIS
December 31, 2011
STANTEC INC.
M-61
will generally be favorable or that there will not be significant fluctuations that adversely affect our industry as a whole or the key markets we target.
The professional consulting services industry is highly competitive, which could have a negative impact on our profit margins and market share.
We have numerous competitors for the services we offer in the markets we serve. The principal competitive factors include reputation, experience, breadth and quality of services, technical proficiency, local offices, fees, and service delivery. The number and identity of competitors vary widely with the type of service we provide. For small to medium-sized projects, we compete with many engineering, architecture, and other professional consulting firms. For larger projects, there are fewer but still many competitors, and many of these competitors have greater financial and other resources than we do. Although we compete with other large private and public companies in certain geographic locations, our primary competitors are small and midsized privately held regional firms in the United States, Canada, and internationally. Generally, competition places downward pressure on our contract prices and profit margins and, ultimately, operating income. However, such impact is difficult to quantify. Intense competition is expected to continue in these markets, presenting significant challenges to our ability to maintain strong growth rates and historical profit margins. If we are unable to meet these competitive challenges, we could lose market share to our competitors and experience an overall reduction in our profits. We may not be able to compete successfully with such competitors, and such competition could cause us to lose customers, increase expenditures, or reduce pricing, any of which could have a material adverse effect on our earnings and share price.
The nature of our business exposes us to potential liability claims and contract disputes, which may reduce our profits.
Our operations are subject to the risk of third-party claims in the normal course of business, some of which may be substantial. We have been and may in the future be named as a defendant in legal proceedings where parties may make a claim for damages or other remedies with respect to our projects or other matters. Any litigation resulting from our business operations could distract management’s attention from normal business operations, divert financial resources to the defense of such claims, or result in significant attorney fees and damage awards for which we may not be fully insured and which could harm our reputation. Any of these circumstances could adversely affect our profitability.
We may be unsuccessful in our goal of growing our business organically, which could lead to a reduction in our market share.
We may not be able to increase the size of our operations organically. As competition increases in our industry, we may not be able to secure major projects and attract additional qualified staff. Organic growth is also achieved by meeting client expectations through effective quality project delivery and by expanding services provided to our existing clients. If we are unable to effectively compete for projects, expand services to existing clients, and attract employees, we will have difficulty increasing our market share and share price and achieving our growth plan.
Changing markets may offer opportunities to provide services through alternate models. Failure to respond to these market demands may result in lost revenues.
Our business has historically followed a fee-for-service model. Some clients in select markets and practice areas are demanding new service delivery options, including P3s. Failure to respond to these market demands may result in clients awarding projects to our competitors, resulting in lost revenues.
MANAGEMENT’S DISCUSSION AND ANALYSIS
December 31, 2011
STANTEC INC.
M-62
At any given time, a significant portion of our revenue may be derived from a specific geographic region, industry, or sector. Consequently, our business could suffer materially if there were a downturn in that geographic region, industry, or sector.
Our three-dimensional business model mitigates risk by diversifying our operations across several geographic regions, practice area units, and all phases of the infrastructure and facilities project life cycle. If at any given time a significant portion of our revenue is derived from a specific geographic region, industry, or sector, our business may be impacted by a number of factors, which may include the following:
| • | Changes in employment levels and other general economic conditions |
| • | Changes in interest rates and in the availability, cost, and terms of financing |
| • | The impact of present or future environmental, zoning, or other laws and regulations |
| • | Changes in commodity prices |
| • | Changes in real estate tax rates and assessments and other operating expenses |
| • | Changes in levels of government infrastructure spending and fiscal policies |
| • | Natural or human-made disasters and other factors that are beyond our control |
If we are unable to adjust our workforce or service mix to a downturn in a geographic region, industry, or sector in a timely manner, it could have a material adverse effect on our overall business, including the results of our operations and liquidity.
It is important to note that we derive significant revenue from contracts with or through government agencies. Any disruption in government funding or in our relationship with those agencies could adversely affect our business, financial position, results of operations, and cash flows. We believe that the success and further development of our business depends, in part, on the continued funding of these government programs and on our ability to secure government work. However, governments may not have available resources to fund these programs or may not fund these programs even if they have available financial resources. Some of these government contracts are subject to renewal or extensions annually, so we cannot be assured of our continued work under these contracts in the future.
Interruption to our systems and network infrastructure could adversely impact our ability to operate.
We rely heavily on computer systems, communications technology, and related tools in order to operate properly. If we are unable to continually add software and hardware, effectively upgrade our systems and network infrastructure, maintain our key information technology personnel, and take other steps to improve the efficiency of and protect our systems, our service delivery and revenues could be interrupted or delayed. In addition, our computer and communications systems and operations could be damaged or interrupted by natural disasters, telecommunications failures, acts of war or terrorism, computer viruses, physical or electronic security breaches, cyber security breaches, or similar events. Any of these or other events could cause system interruptions, delay, and loss of critical data, could delay or prevent operations, and may adversely affect our operating results, liquidity, or financial position. The adverse financial impact of these events could include, for example, remediation costs, costs associated with increased protection, lost revenues, litigation costs, and reputational damage leading to lost clients.
We bear the risk of cost overruns in a significant number of our contracts. We may experience reduced profits or, in some cases, losses, under these contracts if costs increase above our estimates.
We conduct our business under various types of contractual arrangements, most of which are fee-for-service agreements. However, approximately 74% of the dollar value of our contracts in 2011 was based on a fixed-fee or
MANAGEMENT’S DISCUSSION AND ANALYSIS
December 31, 2011
STANTEC INC.
M-63
time-and-materials contract with an upset limit. Under fixed-fee contracts, we perform services at a stipulated price. Under time-and-materials contracts with not-to-exceed provisions, we are reimbursed for the number of labor hours expended at an established hourly rate, plus the cost of materials incurred, subject, however, to a stated maximum dollar amount for the services to be provided. In both of these types of contracts, we agree to provide services based on our estimate of the costs a particular project will involve. These estimates are established, in part, on cost and scheduling projections, which may prove to be inaccurate, or circumstances may arise, such as unanticipated technical problems, weaknesses in project management, difficulties in obtaining permits or approvals, changes in local laws, or delays beyond our ability to control, that make our projections inaccurate. The underestimation of costs for these types of contracts may cause us to incur losses or result in a project not being as profitable as we expect. In addition, projects that are not completed on schedule further reduce profitability because our staff must continue to work on them longer than anticipated, which may prevent staff from pursuing and working on new projects. Projects that are over budget or not on schedule may also lead to client dissatisfaction.
Uncertainties associated with an acquisition may cause a loss of employees.
The ability to attract and retain trained professionals is one of the key drivers of our business and results. Therefore, the success of an acquisition depends in part on our ability to retain key employees of the acquired firm. Competition for qualified staff can be intense. In addition, key employees may depart because of issues relating to the uncertainty and difficulty of the completion of the acquisition or integration or a desire not to remain with the combined company. Accordingly, we may be unable to retain key acquired employees to the extent projected at the time of acquisition.
We may experience difficulties in integrating an acquired entity’s business into our existing operations and so may not realize the anticipated benefits of the acquisition.
Our rationale for acquiring a firm is, in part, predicated on our ability to leverage the combined strengths of the two companies to increase our opportunities and revenue. Integrating an acquired firm’s operations and staff into our own is a complex endeavor, and we may not be able to complete the process rapidly or without encountering difficulties. Successful integration requires, among other things, the assimilation of the firm’s professional services, sales and marketing operations, and information and software systems, as well as the coordination of employee retention, hiring, and training operations. The diversion of management’s attention to the integration effort and any difficulties encountered in combining operations could adversely affect the combined company’s business and prevent it from realizing the anticipated improvement in professional service offerings, market penetration, profitability, and geographic presence that formed the foundation for the acquisition.
Our backlog is subject to unexpected adjustments and cancellations and is, therefore, an uncertain indicator of future earnings.
As of December 31, 2011, our backlog was approximately $1.1 billion. However, the revenue projected in our backlog is determined by the judgment of management and may not be realized or, if realized, may not result in profits. Projects may remain in our backlog for an extended period of time. In addition, project cancellations or scope adjustments may occur from time to time with respect to contracts reflected in our backlog. Backlog reductions can adversely affect the revenue and profits we actually receive from contracts reflected in our backlog. Finally, poor project or contract performance could also negatively impact our profits.
MANAGEMENT’S DISCUSSION AND ANALYSIS
December 31, 2011
STANTEC INC.
M-64
To attain our goal of increasing the size and profitability of our operations, we may pursue and invest in business opportunities outside of North America. Unfamiliarity with markets and political environments may impair our ability to increase international revenues.
Because of our international expansion strategy, we are now and will be increasingly subject to additional risks, including risks related to complying with a wide variety of local, national, and international laws; the difficulties and costs of staffing and managing international operations; changes in regulatory requirements; changes in exchange rates; multiple and possibly overlapping tax structures; and political and economic instability. In addition, we may face competition in other countries from companies that may have more experience with operations in such countries or with international operations generally.
Goodwill and intangible assets acquired from our acquisitions represent substantial portions of our total assets. If external market factors, such as adverse stock market conditions and a decline in our share price occur, or if our acquired businesses do not perform as expected, we may be required to write down the value of our goodwill and intangible assets, which could have a material adverse effect on earnings.
Goodwill and intangible assets represent approximately 43.8% of our total assets. When we acquire a consulting business, a significant portion of the purchase price for the acquisition is generally allocated to goodwill and identifiable intangible assets. The amount of the purchase price allocated to goodwill is determined by the excess of the purchase price paid by us to acquire the consulting business over the fair value of the net identifiable assets acquired. IFRS rules require that we review the carrying amount of goodwill and intangibles assets at each reporting date to determine if there are indicators of impairment. As well, under IFRS we are required to perform an annual impairment test of our goodwill. A deterioration in our share price and market capitalization, the operating results of such acquired businesses, or the failure of these businesses to meet our expectations may adversely affect the carrying amount of our goodwill and intangible assets and could result in an impairment of the goodwill or intangible assets associated with such businesses. As part of our annual review of goodwill for impairment, we consider the market capitalization and the actual performance of each of our cash-generating units compared to our expectations and update our future expectations for such cash-generating units. An impairment of goodwill or intangible assets would be recorded as a charge in our income statement, which could have a material effect on our earnings.
One of our primary competitive advantages is our reputation. If our reputation is damaged due to client dissatisfaction, our ability to win additional business may be materially damaged.
Although we serve many diverse clients and are not dependent on any one client or group of clients to sustain our business, our reputation for delivering effective and efficient solutions for complex projects is one of our most valuable business development assets. Damage to our reputation due to client dissatisfaction represents a significant risk to our ability to win additional business both from existing clients and from those with whom we may seek to work with in the future.
Our employees may face environmental, health, and safety risks and hazards in the workplace resulting in injury or lost time.
Our Health, Safety & Environment program is aimed at reducing risks to people, the environment, and our business; however, our employees are subject to environmental, health, and safety risks in the course of their employment. A number of these risks could result in personal injury, loss of life, or environmental and other damage to our property or the property of others. Alternatively, we could be exposed to civil and/or statutory liability arising from injuries or deaths because of inadequate health and safety policies and practices. We may become liable for damages arising from these events against which we cannot insure or may elect not to insure
MANAGEMENT’S DISCUSSION AND ANALYSIS
December 31, 2011
STANTEC INC.
M-65
because of high premium costs or other reasons. We also risk incurring additional costs on projects that have sustained environmental, health, and safety incidents because they may require additional time to complete or because employee time may be lost due to injury.
Because we report our results in Canadian dollars and a substantial portion of our revenue and expenses is recorded in US dollars, our results are subject to currency exchange risk.
Although we report our financial results in Canadian dollars, a substantial portion of our revenue and expenses is generated or incurred in US dollars. For the purposes of financial reporting under IFRS, revenue and expenses denominated in foreign currencies are translated into Canadian dollars at the average exchange rates prevailing during the year. We expect to continue to report our financial results in Canadian dollars in accordance with IFRS. Therefore, if the Canadian dollar were to strengthen relative to the US dollar and other currencies, the amount of net income from our non-Canadian-dollar-denominated business could decrease, which could have a material adverse effect on our business, financial condition, and results of operations.
The value of the Canadian dollar relative to the US dollar is subject to volatility. For example, the average exchange rates for the years ended December 31, 2011; December 31, 2010; and December 31, 2009, for C$1.00 were US$1.01, US$0.97, and US$0.88, respectively. Furthermore, this volatility may continue in the future, and, as discussed above, any increases in the strength of the Canadian dollar relative to the US dollar may have a negative impact on the results of our operations.
From time to time, we enter into forward contracts to manage risk associated with net operating assets outside our US operations denominated in US dollars (other than with respect to net operating assets that are owned by US subsidiaries). These derivative contracts, which are not accounted for as hedges, are marked to market, and any changes in the market value are recorded in income or expense when they occur. Consequently, we may not benefit from any weakening of the Canadian dollar relative to the US dollar.
We may be unsuccessful in our goal to increase the size and profitability of our operations by acquisitions, which could lead to a reduction in our market share and competitiveness as our industry consolidates.
We may not be able to locate suitable acquisitions or to consummate any such transactions on terms and conditions that are acceptable to us. As the professional services industry consolidates, suitable acquisition candidates are expected to become more difficult to locate and may only be available at prices or under terms that are less favorable than in the past. In addition, some of our competitors are much larger than us, have greater financial resources, and can better afford to pay a premium for potential acquisition candidates. If we are unable to effectively compete for or locate suitable acquisitions, we will have difficulty achieving our growth plan.
We may not be able to successfully manage our growth, which could lead to a decline in profitability.
As we continue to grow by acquisitions and organically, we may be faced with challenges of effectively and efficiently managing our growth. Expansion into new geographic regions, industry sectors, and project delivery styles requires changes in organizational structure, reporting lines, and leadership engagement. Any of these changes may interfere with the established processes for managing our business and could result in a decline in profitability.
MANAGEMENT’S DISCUSSION AND ANALYSIS
December 31, 2011
STANTEC INC.
M-66
We have pursued and may continue to pursue and invest in business opportunities that are not directly within our core competencies. These new business opportunities may require a disproportionate amount of management’s time to develop profitably and may not perform as expected.
Acquisitions may bring us into new practice areas and/or geographic locations and expose us to additional business risks that are different from those we have historically experienced. Consequently, we may depend in part on the knowledge and expertise of the professional service providers and management teams who we acquire in order to make these business opportunities profitable. New business opportunities frequently bring a learning curve that may require substantial management time and changes to our business systems that may create a distraction from our day-to-day business operations. If these business opportunities do not perform as anticipated or are not profitable, our earnings may be materially adversely affected and we may experience a partial or complete loss of our investment.
If we experience delays and/or defaults in customer payments, we could suffer liquidity problems or be unable to recover our expenditures.
Because of the nature of our contracts, at times we commit resources to projects prior to receiving payments from the customer in amounts sufficient to cover expenditures incurred. Delays in customer payments may require us to make a working capital investment. If a customer defaults in making payments on a project to which we have devoted significant resources, it could have a material negative effect on our liquidity as well as on the results of our operations. In our experience, clients who withhold payment have a higher tendency toward dissatisfaction with the services we provide and are more likely to bring claims against us.
We may have difficulty in attracting and retaining qualified staff, which may affect our reputation in the marketplace and restrict our ability to implement our business strategy.
We derive our revenue almost exclusively from services performed by our employees. Consequently, one of the key drivers of our business is our ability to attract and retain qualified staff. However, we may not be able to attract and retain the desired number of qualified staff over the short or long term. There is significant competition for staff with the skills necessary for providing our services from major and boutique consulting, engineering, public agency, research, and other professional services firms. Our inability to attract and retain qualified staff could impede our ability to secure and complete engagements, in which event we may lose market share and our revenue and profits could decline. In addition, if our employees were to leave our Company and become competitors of ours, we could lose other employees and some of our existing clients who have formed relationships with such former employees. We could also lose future clients to a former employee as a new competitor. In any of these events, we could lose revenue and our profitability could decline.
We may be unable to secure the additional capital required to fund our acquisition strategy, which could lead to a reduction in our market share and competitiveness.Furthermore, if we need to sell or issue additional common shares and/or incur additional debt to finance future acquisitions, our share ownership could be diluted and the results of our operations could be adversely affected.
In order to fund future acquisitions, we will need access to substantial amounts of capital. However, we may be unable to obtain the necessary capital to finance a successful acquisition program while meeting our other cash needs. If we are unable to obtain additional capital on acceptable terms, we may be required to reduce the scope of our anticipated expansion, which may negatively affect our future competitiveness and results of operations.
Using internally generated cash or taking on debt to complete acquisitions could substantially limit our operational and financial flexibility. The extent to which we will be able or willing to use our common shares for acquisitions
MANAGEMENT’S DISCUSSION AND ANALYSIS
December 31, 2011
STANTEC INC.
M-67
will depend on the market value of our shares from time to time and the willingness of potential sellers to accept our shares as full or partial payment. Where the consideration for an acquisition includes Stantec shares, in the event the acquired entity’s shareholders subsequently decide to dispose of Stantec shares following the acquisition, there could be an increased supply of our common shares on the market. If the supply of our common shares is significantly greater than the associated demand, the market price of our common shares may significantly decline and may not recover. We may also incur additional debt if we acquire another company, and this could increase our debt repayment obligations, which could have a negative impact on our future liquidity and profitability. During 2010, we filed a short-form prospectus with all provincial securities regulatory authorities in Canada and a corresponding base shelf registration statement with the SEC. Pursuant to the prospectus, we may issue up to $300 million in common shares during a 25-month period, effective May 6, 2010.
We have no assurance that existing debt financing will continue to be available from our current lenders or other financial institutions on similar terms.
Adverse weather conditions and natural or other disasters may delay or eliminate net revenue that otherwise would have been realized and, thus, adversely affect our profitability.
Our field activities are generally performed outdoors and may include professional surveying, resident engineering services, field data surveys and collection, archeology, geotechnical investigations and exploratory drilling, construction oversight and inspection, plant start-up and testing, and plant operations. Extreme weather conditions and natural or other disasters, such as earthquakes, fires, floods, influenza epidemics or pandemics, and similar events, may cause postponements in the initiation and/or completion of our field activities and may hinder the ability of our employees to arrive at work, which may result in a delay or elimination of revenue that otherwise would be recognized while certain costs continue to be incurred. Adverse weather conditions or disasters may also delay or eliminate the start and/or completion of various phases of work relating to other engineering services that commence concurrent with or subsequent to our field activities. Any delay in the completion of our services may require us to incur additional non-compensable costs, including overtime work, that are necessary to meet our clients’ schedules. Due to various factors, a delay in the commencement or completion of a project may also result in the cancellation of contracts, adversely affecting our net revenue and profitability.
Our share price has historically been subject to volatility. Accordingly, the price of our common shares may decrease in the future due to a number of Company and industry-specific or general economic factors.
Our share price has experienced volatility in the past and will likely be volatile in the future. For example, the intraday high and low prices for our common shares on the Toronto Stock Exchange (TSX) and New York Stock Exchange (NYSE) during the 52 weeks ended December 31, 2011, were $30.33 and $21.50, respectively, and US$31.89 and US$20.96, respectively.
The price of our common shares may fluctuate substantially in the future due to, among other things, the following factors: (1) the failure of our quarterly or annual operating results to meet expectations; (2) the reaction of markets and securities analysts to announcements and developments involving our Company; (3) adverse developments in the worldwide, Canadian, or US economies, the financial markets, or the engineering and consulting services market; (4) changes in interest rates; (5) announcements by key competitors; (6) additions or departures of key staff; (7) announcements of legal proceedings or regulatory matters; and/or (8) general volatility in the stock market.
MANAGEMENT’S DISCUSSION AND ANALYSIS
December 31, 2011
STANTEC INC.
M-68
The market prices of the publicly traded shares of many companies, including our Company, are often impacted by general market volatility. Accordingly, share prices can go up or down unrelated to the operating performance of such companies.
Uncertainties associated with an acquisition or merger or with Stantec as a new owner may cause an acquired entity to lose customers.
An acquired company’s customers may, in response to the announcement of the acquisition, delay or defer decisions concerning their use of the acquired company’s services because of uncertainties related to the consummation of the acquisition, including the possibility that the acquisition may not be completed if all the conditions of the transaction are not fulfilled. This circumstance could have an adverse effect on our revenue and profitability.
We could be exposed to civil and/or statutory liability to employees including claims arising from non-payment of wages, discrimination, and/or misclassification regarding overtime entitlements.
We are required to comply with state, provincial, and federal employment laws, as well as with internal policies and common law concerning the payment of wages, discrimination, employee classification, and treatment of employees generally. Failure to comply with any of these legal obligations could result in a material cost to the Company. If our human resource policies and practices, including employee training and supervision programs, are inadequate, we may face the additional risk of losing the support of our employee base, which could result in a failure to attract and retain key staff. We maintain insurance coverage for our operations, including employment practices liability insurance; however, it may not be sufficient to cover all liability that could arise.
Inadequate internal controls or disclosure controls may result in events that could adversely affect our business.
Inadequate internal controls or disclosure controls over financial reporting could result in material misstatements in our financial statements and related public disclosures. Inadequate controls could also result in system downtime, delayed processing, inappropriate decisions based on non-current internal financial information, fraud, or the inability to continue our business operations.
We may not be able to meet legal and regulatory requirements related to corporate governance, labor relations, industry standards, contracting practices, and the environment.
We are subject to a variety of regulations and standards and compliance with all such obligations could materially increase our costs. Our business model includes a variety of practice areas and jurisdictions, each with its own set of rules and regulations. In order to comply with increasingly complex laws and regulations, we may be required to increase the fees we charge to our clients. This could impact our ability to remain competitive.
Our insurance may not cover all claims for which we may be liable, and expenses related to insurance coverage may adversely impact our profitability.
Although we believe that we have made adequate arrangements for insuring against potential liability claims, these arrangements may be insufficient to cover a particular risk. When it is determined that we have liability, we may not be covered by insurance, or, if covered, the dollar amount of these liabilities may exceed our policy limits. Our professional liability coverage is on a “claims-made” basis, covering claims actually made during the period when the insurance policy is in effect. Even where insurance is maintained for such exposures, the policies have deductibles. Any liability not covered by our insurance, in excess of our insurance limits, or covered by insurance
MANAGEMENT’S DISCUSSION AND ANALYSIS
December 31, 2011
STANTEC INC.
M-69
but subject to a high deductible could result in a significant cost to us, which may reduce our profits and cash available for operations. Moreover, we may become subject to liability that cannot be insured against or against which we may choose not to insure because of high premium costs or for other reasons. Our expansion into new services or geographic areas could result in our failure to obtain coverage for these services or areas, or the coverage being offered may be at a higher cost than our current coverage. Due to the current insurance environment, including losses sustained by insurers in their investments, we may experience increases in our insurance premiums. We may not be able to pass these increases on to our clients in increased billing rates.
Reliance on key personnel who may be unable or unwilling to continue their employment may adversely impact our business.
Our operations are dependent on the abilities, experience, and efforts of senior management and other key personnel. If any of these individuals are unable or unwilling to continue their employment with us, and if we do not have a well-developed succession plan prior to their departure, our business, operations, and prospects may be materially adversely affected. The transition of key leadership positions may result in increased training costs as well as a loss of institutional knowledge, industry relationships, or expertise developed by the departing leader.
If fraud occurs and remains undetected, we may have a loss of assets or misstatement in our financial statements.
Fraud may occur and remain undetected, resulting in a loss of assets and/or misstatement in our financial statements and related public disclosures.
Workplace violence or mischief may result in claims and losses.
Aggrieved or disturbed employees may cause intentional damage to personnel or property, which may result in employee claims, damage to our reputation, and damage to physical assets.
Managing Our Risks
We have an Enterprise Risk Management Program that is overseen by our Audit and Risk Committee. At least annually, we perform a formal assessment of the key risks facing our Company. The assessment is performed using the Committee of Sponsoring Organizations of the Treadway Commission (COSO) Risk Assessment model. Risks and the corresponding mitigating factors are identified and assessed by our leadership.
Business Model and Differentiation
We mitigate our operating, market, and growth and acquisition integration risks through our business strategy and other measures. As a professional services firm, we focus on design. We typically do not take on construction risk or contribute equity in projects. We focus our business on two client types: regional/local and global/national. Having a local presence connects us to local clients and positions us through long-term relationships to understand their business, bid on their projects, and secure work with them. From this local base, we are also able to engage top-tier experts from anywhere across our Company in regional/local project delivery. For global/national clients, we assign account managers who understand these clients’ priorities in order to maintain strategic relationships and expand our opportunities.
Our three-dimensional business model based on geographic, practice area, and life cycle diversification reduces our dependency on any particular industry or economic sector for our income. To help reduce our susceptibility to industry-specific and regional economic cycles and to take advantage of economies of scale in the highly fragmented professional services industry, we intend to continue to diversify our business both in terms of
MANAGEMENT’S DISCUSSION AND ANALYSIS
December 31, 2011
STANTEC INC.
M-70
geographic presence and service offerings. Over the last several years we have completed numerous acquisitions, and we expect to continue to pursue selective acquisitions that will enable us to enhance our market penetration and increase and diversify our revenue base. We also differentiate our Company from competitors by entering into a diverse range of contracts with a variety of fee amounts. A broad project mix strengthens our brand identity and continues to ensure that we do not rely on a few large, single projects for our revenue and that no single client or project accounts for more than 5% of our overall business.
Investment in Employees
To address the risk of competition for qualified personnel, we offer a number of employment incentives, including training programs, access to an employee share ownership plan, and opportunities for professional development and enhancement, along with compensation plans that we believe to be competitive, flexible, and designed to reward top performance. During 2011, we continued to deliver face-to-face and on-demand project management training sessions, invest in health and safety initiatives, and roll out the leadership development program we launched in 2008 to emerging leaders throughout our Company. Looking forward to 2012, we will continue to assess and develop our leaders at all levels, from our vice presidents to front-line supervisors. As well, during 2011, revisions were made to our Career Development and Performance Review process to put a greater emphasis on career management, and we are now developing well-defined leadership, knowledge, and project management career streams to support entrepreneurship, innovation, and project execution. Each career path is distinct and requires different skill sets and knowledge that will allow our employees to take responsibility for managing their careers. Training, coaching, and mentoring will continue to be key components in focusing on building our teams.
Through our recruitment and promotion practices, we ensure that our senior management and key personnel have the expertise and experience in their respective fields necessary to successfully carry out our current activities and long-term growth objectives. Since our operations are dependent on the abilities and efforts of senior management and other key personnel, the Corporate Governance and Compensation Committee of our board of directors and our senior leaders regularly review succession planning measures for management. In addition, we believe that the short-term and long-term compensation structure of our key staff is aligned with our Company’s long-term strategy and goals.
Effective Processes and Systems
With regards to effective project management and execution, in 2008 we achieved registration with the International Organization for Standardization’s (ISO) 9001:2000 quality management standard, and in 2010, we updated this certification to the ISO 9001:2008 standard. ISO 9001:2008 is a globally recognized set of requirements for establishing effective quality management systems. We also have robust internal processes and programs to effectively identify, execute, and manage major projects.
From 2008 to 2011, we also achieved ISO/IEC 20000-1:2005 certification. This certification sets out the requirements for information technology services and infrastructure support using an internationally accepted service management framework of best practices. Our objective in obtaining and maintaining the ISO/IEC 20000-1:2005 certification is to ensure the quality, consistency, reliability, and value of information technology services that underpin our business operations. Also, we continue to invest in our disaster recovery plan and business continuity planning initiatives.
In support of Stantec’s sustainability policy and to promote compliance with applicable environmental regulation and reduce our environmental footprint, we developed and implemented a formal environmental management system. This system was recently audited and registered to the internationally recognized ISO 14001:2004 environmental management standard. Our ISO 14001:2004 registered environmental management system
MANAGEMENT’S DISCUSSION AND ANALYSIS
December 31, 2011
STANTEC INC.
M-71
requires leadership to establish environmental performance objectives such as the reduction of energy, resource use, and waste, and to formally report on those objectives within an accountable and transparent framework.
Our Internal Audit team evaluates risks and opportunities relating to fraud as part of its control evaluation program. Also, to mitigate the risk of fraud, we have various business conduct policies, including our Code of Ethics policy, Conflict of Interest policy, and Integrity policy. Our Integrity Management Committee continuously monitors our fraud risk environment and analyzes and implements mitigating tactics.
We maintain insurance coverage for our operations, including policies covering general liability, automobile liability, environmental liability, workers’ compensation and employers’ liability, directors’ and officers’ liability, and professional liability. We have a regulated captive insurance company to insure and fund the payment of any professional liability self-insured retentions related to claims arising after August 1, 2003. We, or our clients, also obtain project-specific insurance for certain projects from time to time. In addition, we invest resources in a Risk Management team that is dedicated to providing Company-wide support and guidance on risk avoidance practices and procedures. One of our practices is to carry out select client evaluations, including credit risk appraisals, before entering into contract agreements to reduce the risk of non-payment for our services.
Growth Management
To address the risk of being unsuccessful in integrating acquired companies, we have an acquisition and integration program managed by a dedicated acquisition team. The team supports, or is responsible for, the tasks of identifying and valuing acquisition candidates, undertaking and coordinating due diligence, negotiating and closing transactions, and integrating employees and systems immediately following an acquisition. A senior regional or practice leader is appointed for each acquisition to support the integration process. As we continue to expand internationally, we are developing a disciplined approach to operating outside North America, taking into account different accounting systems, legal structures, languages, and cultures. We also have a coordinated integration plan that involves the implementation of our Company-wide information technology and financial management systems as well as provision of support services from our corporate and regional offices.
We are able to meet our liquidity needs and expansion strategy through a variety of sources, including cash generated from operations, long- and short-term borrowings from our $350 million credit facility, senior secured notes, and the issuance of common shares.
CONTROLS AND PROCEDURES
Disclosure controls and procedures are designed to ensure that information we are required to disclose in reports filed with securities regulatory agencies is recorded, processed, summarized, and reported on a timely basis and is accumulated and communicated to management, including our CEO and CFO, as appropriate, to allow timely decisions regarding required disclosure.
Under the supervision and with the participation of management, including our CEO and CFO, we carried out an evaluation of the effectiveness of our disclosure controls and procedures as of December 31, 2011 (as defined in rules adopted by the SEC in the United States and as defined in Canada by National Instrument 52-109, Certification of Disclosure in Issuer’s Annual and Interim Filings). Based on this evaluation, our CEO and CFO concluded that the design and operation of our disclosure controls and procedures were effective.
Internal control over financial reporting is a process designed to provide reasonable assurance regarding the reliability of financial reporting and preparation of financial statements for external purposes in accordance with IFRS. A control system, no matter how well designed and operated, can provide only reasonable, not absolute,
MANAGEMENT’S DISCUSSION AND ANALYSIS
December 31, 2011
STANTEC INC.
M-72
assurance with respect to the reliability of our financial reporting and preparation of our financial statements. Accordingly, management, including our CEO and CFO, does not expect that our internal control over financial reporting will prevent or detect all errors and all fraud. Management’s Annual Report on Internal Control over Financial Reporting and the Independent Auditors’ Report on Internal Controls are included in our 2011 consolidated financial statements.
There has been no change in our internal control over financial reporting during the year ended December 31, 2011, that materially affected, or is reasonably likely to materially affect, our internal control over financial reporting.
We will continue to periodically review our disclosure controls and procedures and internal control over financial reporting and may make modifications from time to time as considered necessary or desirable.
CORPORATE GOVERNANCE
Disclosure Committee
In 2005, our Company established a Disclosure Committee, consisting of a cross section of management. The committee’s mandate is to provide ongoing review of Stantec’s continuous disclosure policy and to facilitate compliance with applicable legislative and regulatory reporting requirements.
Board of Directors
Stantec’s board of directors currently includes nine members, seven of whom are independent under Canadian securities laws and under the rules of the SEC and the NYSE and free from any interest or relationship that could materially interfere with their ability to act in the best interest of our Company and shareholders.
The board’s mandate is to supervise Stantec’s management with a view to the Company’s best interests. The board fulfills its mandate by:
| • | Overseeing the Company’s strategic planning process |
| • | Satisfying itself as to the integrity of the CEO and other executive officers |
| • | Ensuring that the Company has a policy in place for communicating effectively with shareholders, other stakeholders, and the public |
| • | Reviewing and monitoring the Company’s principal business risks as identified by management, along with the systems for managing such risks |
| • | Overseeing senior management succession planning, including the appointment, development, and monitoring of senior management |
| • | Ensuring that management maintains the integrity of the Company’s internal controls and management information systems |
In 2011, Stantec’s board included two committees: the Audit and Risk Committee and the Corporate Governance and Compensation Committee. Both committees are composed entirely of unrelated, independent directors.
Audit and Risk Committee
The Audit and Risk Committee monitors, evaluates, approves, and makes recommendations on matters affecting Stantec’s external audit, financial reporting, accounting control policies, and risk management matters. The chair of the committee provides regular reports at the Company’s board meetings. The board has determined that each of the Audit and Risk Committee’s members is financially literate and that the majority of the members are “financial experts” as such term is defined under the rules of the SEC and NYSE.
MANAGEMENT’S DISCUSSION AND ANALYSIS
December 31, 2011
STANTEC INC.
M-73
Corporate Governance and Compensation Committee
The Corporate Governance and Compensation Committee monitors, evaluates, approves, and makes recommendations on matters affecting governance and compensation. Governance matters include, but are not limited to, board size, nominations, orientation, education, and self-evaluation. Compensation matters include, but are not limited to, executive management compensation, performance review, and succession plans. The chair of the committee provides regular reports at the Company’s board meetings.
More information about Stantec’s corporate governance can be found on our website (www.stantec.com) and in the Management Information Circular for our May 10, 2012, annual meeting of shareholders. In addition, the following documents are posted on our website:
| • | Code of Ethics |
| • | Corporate Governance Guidelines |
| • | Audit and Risk Committee Terms of Reference |
| • | Corporate Governance and Compensation Committee Terms of Reference |
The above information is not and should not be deemed to be incorporated by reference herein. Copies of these documents will be made available in print form to any shareholder who requests them.
SUBSEQUENT EVENT
Subsequent to the year-end, on February 15, 2012, Stantec’s board of directors approved a dividend policy and concurrently declared its first quarterly dividend of $0.15 per share, payable on April 17, 2012, to shareholders of record on March 30, 2012. The declaration of this dividend reflects the confidence of our board of directors and management in our ability to generate ongoing cash flow from operations, continue to grow revenue, and complete strategic acquisitions while providing enhanced shareholder returns.
MANAGEMENT’S DISCUSSION AND ANALYSIS
December 31, 2011
STANTEC INC.
M-74