Exhibit 99.2
STANTEC INC.
MANAGEMENT’S DISCUSSION AND ANALYSIS
For the Years Ended December 31, 2012, and 2011
MANAGEMENT’S DISCUSSION AND ANALYSIS
February 20, 2013
This discussion and analysis of Stantec Inc.’s operations, financial position, and cash flows for the year ended December 31, 2012, dated February 20, 2013, should be read in conjunction with the Company’s 2012 audited consolidated financial statements and related notes for the year ended December 31, 2012. Our 2012 audited consolidated financial statements and related notes are prepared in accordance with International Financial Reporting Standards (IFRS) as issued by the International Accounting Standards Board (IASB). Unless otherwise indicated, all amounts shown below are in Canadian dollars. Additional information regarding the Company, including our Annual Information Form, is available on SEDAR at www.sedar.com and on EDGAR at www.sec.gov. Such additional information is not incorporated by reference unless otherwise specified, and should not be deemed to be made part of this Management’s Discussion and Analysis.
EXECUTIVE SUMMARY
Core Business and Strategy
| — | Our Company provides professional consulting services in planning, engineering, architecture, interior design, landscape architecture, surveying, project management, environmental sciences, and project economics for infrastructure and facilities projects. We focus on providing professional services in the infrastructure and facilities market, principally on a fee-for-service basis. |
| — | Our goal is to be a top 10 global design firm by increasing the depth and breadth of our services through organic and acquisition growth. |
| — | To achieve our goal we focus on the following: positioning ourselves among the top-tier service providers in the sectors and geographic locations in which we operate; driving a client-focused culture through cross-selling efforts and account management strategies; focusing on quality management; and expanding our capabilities and geographic reach through the acquisition and integration of firms that share our vision and culture. |
Key Performance Drivers and Capabilities
| — | Our performance is driven by our ability to achieve excellence by putting people first, developing strong, long-lasting relationships with each other and our clients, doing what is right, and being driven to achieve at every level. |
Results
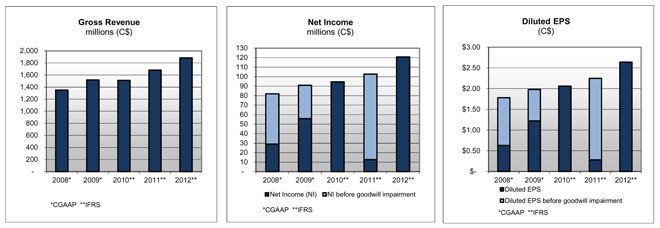
| — | Continued profitability and strong organic growth. Our gross revenue grew 11.9% in 2012 compared to 2011; 5.6% of this gross revenue growth was organic. We achieved a 12.9% increase in our EBITDA, which is our net income before interest expense, income taxes, depreciation, amortization, and goodwill and intangible impairment (the terms “gross revenue” and “EBITDA” are defined in Definition of Additional IFRS Measures and Definition of Non-IFRS Measures in the Critical Accounting Estimates, Developments, and Measures section of this report). Excluding the impact of a $90.0 million non-cash goodwill impairment charge in 2011, net income increased 17.7% to $120.9 million compared to $102.7 million in 2011, and our diluted earnings per share increased 17.3% to $2.64 compared to $2.25 in 2011. |
MANAGEMENT’S DISCUSSION AND ANALYSIS
December 31, 2012
STANTEC INC.
M-1
| — | Growth through acquisition. Acquisitions completed in 2011 and 2012 contributed $99.4 million to the net increase in our gross revenue in 2012 compared to 2011. We completed seven acquisitions in 2012 and five in 2011. |
| — | Strong balance sheet and liquidity.Our balance sheet remains solid. In 2012, we generated strong cash flows from operations, which we used for operations and acquisition growth. In 2012, we extended the maturity of our $350 million revolving credit facility to August 31, 2016. At December 31, 2012, $263.5 million of additional borrowings were available under our credit facility for future acquisitions, working capital needs, and general corporate purposes. |
| — | Dividend policy.On February 15, 2012, Stantec’s board of directors approved a dividend policy and declared a quarterly dividend. The board declared dividends for each of the remaining quarters in 2012. The declaration of these dividends reflects the confidence of our board of directors and management in our ability to generate ongoing cash flow from operations, continue to grow revenue, and complete strategic acquisitions while also providing enhanced shareholder returns. |
Outlook
| — | We believe that we will achieve a moderate increase in organic gross revenue, with a targeted 3.0 to 4.0% increase compared to 2012. We expect to achieve moderate growth in our Canadian and International operations and stable to moderate growth in the United States. The outlook in 2013 is stable for our Buildings and Transportation practice area units, stable to moderate organic growth for our Industrial practice area unit, and moderate organic growth for our Environment and Urban Land practice area units. |
Risks
| — | Various risk factors could cause our actual results to differ materially from those projected in the Outlook section and forward-looking statements of this report. The material, known risks are described in the Risk Factors section of this report. Although the global economic environment appears to be slowly improving, pressures—such as increased competition, project delays, and fiscal rebalancing—still exist. Pressures and uncertainties related to economic recovery, volatility in the Canadian/US exchange rate, volatility in energy and commodity prices, and public infrastructure funding may adversely impact our outlook for 2013. |
CORE BUSINESS AND STRATEGY
Core Business
Our Company provides professional consulting services in planning, engineering, architecture, interior design, landscape architecture, surveying, environmental sciences, project management, and project economics for infrastructure and facilities projects. By integrating our expertise in these areas across North America and international locations, we are able to provide our clients with a vast number of project solutions. We believe this integrated approach enables us to execute our operating philosophy by maintaining a world-class level of expertise, which we supply to our clients through the strength of our local offices.
MANAGEMENT’S DISCUSSION AND ANALYSIS
December 31, 2012
STANTEC INC.
M-2
We focus on providing professional consulting services in the infrastructure and facilities market, principally on a fee-for-service basis, while participating in various models of alternative project delivery. By focusing on multidisciplinary service delivery, we also support clients throughout the project life cycle—from the initial conceptualization and financial feasibility study to project completion and beyond.
Goal
Our goal is to be a top 10 global design firm. To realize our goal and implement our strategy, we plan on increasing the depth and breadth of our services through organic and acquisition growth, achieving a compound average growth rate of 15% for revenue and earnings per share while also providing dividend returns for our shareholders.
Strategy
To establish a clear plan for achieving our goal, we have a strategic planning process consisting of a three-year cycle between comprehensive strategic review years and interim planning years. In a comprehensive planning year, the long-range (five-year) plan is developed. In interim years, the planning cycle focuses on implementation and execution of the long-range plan. A comprehensive strategic review year in 2012 included a reassessment of our risk appetite with respect to strategic, operational, and financial objectives and an assessment of our market condition and trends.
As part of our strategy, we plan to leverage our collective, multidisciplinary expertise to achieve world-class, top-tier firm status while also maintaining the strength of our local positioning in the communities in which we work. We expect to remain focused on serving the North American market while gradually increasing our geographic reach in other markets suited and receptive to our services.
Our strategy is framed by four value statements that provide the principles governing our employees and the way we behave and make decisions: We Put People First, We Are Better Together, We Do What Is Right, and We Are Driven to Achieve. These value statements are further described in the Key Performance Drivers and Capabilities section of this report.
Our strategy involves balancing organic and acquisition growth. We will continue to focus on organic growth by expanding our existing business through concentrating on cross-selling existing services to our clients, whether global/national or regional/local. Our One Team approach helps us to provide these integrated services to our clients, which in turn results in organic growth.
We will seek to achieve our goal by executing the following strategies:
| — | Using the strength of our local positioning to bring our world-class expertise to the communities in which we live and work |
| — | Positioning ourselves among the top-tier service providers in the sectors and geographic locations in which we operate |
| — | Expanding our capabilities and geographic reach through the acquisition and integration of firms that share our vision and culture |
| — | Driving a client-focused culture through cross-selling efforts and account management strategies |
| — | Focusing on quality management and providing expertise and value-added services to our clients through integrated quality management systems |
| — | Mitigating risk by taking on little or no construction risk and by pursuing project and client diversification through the use of a three-dimensional business model |
MANAGEMENT’S DISCUSSION AND ANALYSIS
December 31, 2012
STANTEC INC.
M-3
Our business model is a key element of our strategy. We believe it allows us to manage risk while continuing to increase our revenue and earnings. This model enables us to operate across diverse geographies and tailor services through our practice area units to meet the needs of our clients across sectors in all five phases of the infrastructure and facilities project life cycle (planning, design, construction, maintenance, and decommissioning). Because of the diversity of our model, we are generally able to adapt to changes in market conditions by offsetting decreased demand for services in one practice area unit with increased demand for services in another.
Through our One Team approach to our business and service delivery, under the rules of IFRS, we have one reportable segment—Consulting Services—that is an aggregate of our operating segments. Our operating segments are based on our regional geographic areas, and our chief operating decision maker (chief executive officer) assesses our Company’s performance based on financial information available from these geographic areas. In addition, we have practice area unit leaders who provide strategic direction, mentoring, and technical support to operations across our geographic regions.
The following discussion outlines the three main components of our business model: geographic diversification, practice area unit specialization, and life cycle solutions.
Geographic Diversification
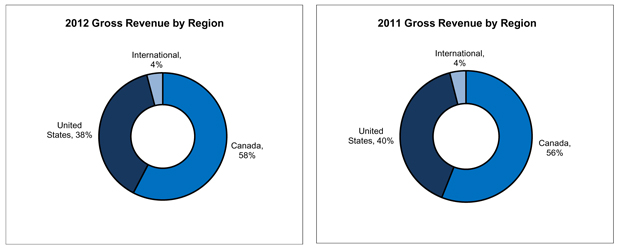
We organize our operations into three main geographic regions: Canada, the United States, and International. In 2012, we earned 58% of our gross revenue in Canada, 38% in the United States, and 4% Internationally. Our International offices are in the Caribbean, United Kingdom, Middle East, and India.
Our goal in each of our geographic locations is to position ourselves among the top-tier service providers. We seek to achieve this goal in our existing locations primarily by adding services through organic growth that is supplemented by acquisitions. Conversely, we seek to achieve our target in new locations principally by acquiring and integrating firms that complement our organization, and eventually supplement the new locations with organic growth.
Over the next five years, we expect that the majority of our revenue growth will come from within North America (Canada and the United States).
Canada.In western Canada, primary growth areas over the short term include significant multi-sector opportunities in Saskatchewan and Alberta, mainly driven by the resource sectors, and from the mining sector in British Columbia. Recent acquisitions in western Canada augmented our expertise in the midstream and growing nonconventional oil plays in Alberta, which provides us with a stronger competitive position in the oil and gas sector. In Ontario, we will focus on our areas of strength—healthcare, commercial, and education/institutional—and expect to increase our critical mass in Water and Transportation in the Greater Toronto Area. In Atlantic Canada, we will continue to focus on growing our Oil & Gas and Mining operations and expect to capitalize on related infrastructure, as well as buildings and facilities project opportunities where we have a significant local presence.
We believe that sustainable development in the North is important to the future of our Canadian practice. Infrastructure and industrial development continues in these areas due to resource development. Our current joint venture/partnerships with Aboriginal groups, communities, and governments throughout the North have given us a substantial local presence, and we believe this presence positions us well to capitalize on future growth opportunities.
MANAGEMENT’S DISCUSSION AND ANALYSIS
December 31, 2012
STANTEC INC.
M-4
United States.Throughout the United States, we expect continued modest growth in our Urban Land business, following several years of economic stress. The oil and gas industry is experiencing fast-paced growth. Over the past year, we have been positioning ourselves to take better advantage of opportunities, and we will continue to do so in the short term. While healthcare may have experienced a temporary slowdown, we expect that a continually aging population will create demand for additional healthcare facilities and services.
With the US election behind us, we expect to see some stability return to transportation and federal markets. Even though we may not see robust growth in these areas, we expect to continue to capture our share of the transportation market. The federal market is still a growth opportunity for our US operations, and we will continue to position ourselves for growth in this market.
In the US East, we expect to capitalize on our recent acquisitions—which added to the depth of most of our practice area units in 2012—over the next few years. In the US West, we will consider expanding our Urban Land, Buildings, and Water practices. In midwestern and central US, we anticipate capitalizing on developments in the energy sector. Within the next few years, we will also consider building our presence in the US South. Because our current presence in the United States is still emerging and developing, we have opportunities to expand not only geographically but also in the sectors in which our clients do business.
International. The majority of our revenue in our International operations relates to our Buildings and Urban Land practice area units and the mining sector. We anticipate that growth in the mining sector may fluctuate because of the cyclical nature of this business. To offset this trend, we will focus on reviewing opportunities for organic growth in the United Kingdom, India, and the Middle East, where we currently have a developing presence.
We expect to pursue very targeted and focused international expansion in areas where we have world-class capabilities and developing relationships. Consistent with our organic growth objectives in other regions, we anticipate introducing more of our services to our current range of clients.
Practice Area Unit Specialization
Currently, we provide services in five specialized and distinct practice area unit groupings: Buildings, Environment, Industrial, Transportation, and Urban Land. Focusing on this combination of project services helps differentiate us from our competitors and allows us to enhance our presence in new geographic locations and markets while establishing and maintaining long-term client relationships. Our strategy for strengthening the specialization component of our business model is to expand the depth of our expertise in our current practice areas—a subset of our practice area units—and to selectively add complementary practice areas to our operations.
In 2011, in order to enhance our focus on clients, our model evolved to begin focusing more on sectors in which our clients do business and to match our expertise accordingly. In 2012, we consolidated our focus to 12 sectors: Airports & Aviation, Commercial, Education/Institutional, Healthcare, Industrial Buildings & Facilities, Mining, Oil & Gas, Power & Energy, Roadways, Transit/Rail, Urban Development, and Water. Clients within these sectors will benefit from the multidisciplinary services provided by our practice areas; therefore, Stantec can better cross-sell services to provide integrated solutions. In 2013, we plan to continue our evolution from a practice-based to a sector-based organization.
MANAGEMENT’S DISCUSSION AND ANALYSIS
December 31, 2012
STANTEC INC.
M-5
Buildings. We provide architectural and engineering design and consulting services to both private and public sector clients for a wide range of building types and market sectors across North America and internationally through two practice areas—Architecture and Buildings Engineering. Our core services include project and program definition; facilities planning; architectural and interior design; and structural, mechanical, electrical, and acoustical engineering for both new construction and existing buildings. We also offer services in performance engineering and building operating systems, including analyses of exterior envelope, air quality, lighting, and energy efficiencies. Over the past few years, our Buildings practice area unit has established an industry-wide reputation for leadership in sustainable and integrated design. Principle sectors in which we secured projects in recent years include healthcare, commercial, and airports and aviation. We also secured projects in the educational facility planning and design areas. We believe we are well positioned to secure additional Public-Private Partnerships (P3) opportunities, which we have been successful in securing in Canada and which are becoming more prevalent in the United States.
Environment. We provide solutions for water supply and wastewater treatment for communities and industry; planning and permitting infrastructure projects; ecosystem restorations; and soil-structure interaction evaluations through our Water, Environmental Services, and Geotechnical Engineering practice areas. Approximately one-third of Environment’s revenue is derived from design of water supply, treatment, storage, transmission, and distribution; wastewater collection, pumping, treatment, and disposal; and watershed management. We derive the remaining revenue from the provision of environmental services such as environmental assessments, documentation, and permitting; ecosystem restoration planning and design; environmental site management and remediation; subsurface investigation and characterization; and geotechnical engineering services. Approximately half of our environmental services are provided to clients in the oil and gas, power, and mining sectors as part of regulatory and permitting activities. The other half of our environmental services revenue is derived from a range of other development activities in the communities and for the clients we service.
Industrial. We provide consulting and design services to private and public sector clients through five practice areas: Industrial Buildings & Facilities, Mining, Oil & Gas, Power, and Program & Project Management. Our core services include planning, functional programming, all aspects of engineering project management, and operational and construction support. We also provide specialty services in strategic management consulting and in the management of multibillion-dollar client programs through our Program & Project Management practice area. Our designs are developed using advanced programs and 3D models that enhance client deliverables. We have also extended our services to include Engineering, Procurement, and Construction Management (EPCM), in which we, as our clients’ agents, provide procurement and construction management support for their projects.
Transportation. We provide transportation consulting and design services, including project and construction management, planning, engineering, construction administration, and infrastructure management. More specifically, we prepare transportation master plans for communities; conduct transportation investment studies; plan and design airport, transit, rail, and highway facilities; provide administration and support services for the construction of specific projects; and provide ongoing management planning for the upkeep of transportation facilities. In addition, we provide specialized services such as simulation modeling, evaluation of the effectiveness of alternative transportation demand and supply management techniques, preparation of investment-grade revenue studies for funding transportation projects, provision of public consultation and environmental assessment skills to build broad public support for infrastructure plans, and design and implementation of integrated infrastructure/asset management systems for all types of transportation infrastructure.
MANAGEMENT’S DISCUSSION AND ANALYSIS
December 31, 2012
STANTEC INC.
M-6
Urban Land. We provide planning, landscape architecture, geomatics, engineering, and project management solutions in greenfield, brownfield, and urban and suburban developments, principally for land development, municipal, institutional, real estate, and retail and commercial clients through two practice areas: Urban Development and Geomatics. Our core services include, or relate to, conceptual and master planning, development approvals and entitlement, infrastructure design, landscape architecture, construction review, and a wide variety of surveying and geomatics services that support residential, commercial, and retail land development industries, municipalities, and major colleges and universities.
Life Cycle Solutions
The third element of our business model is the provision of professional services in all five phases of the project life cycle: planning, design, construction, maintenance, and decommissioning. This inclusive approach enables us to deliver services during periods of strong new capital project activity (i.e., design and construction) as well as during periods of lower new capital project expenditures (i.e., maintenance and rehabilitation). Beginning with the planning and design stages, we provide conceptual and detailed design services, conduct feasibility studies, and prepare plans and specifications. During the construction phase, we generally act as the owners’ representative and provide project management, construction management, surveying, and resident engineering services. We focus principally on fee-for-service work and generally do not act as the contractor or take on construction risk. During the maintenance phase that follows project completion, we provide ongoing professional services for maintenance and rehabilitation projects in areas such as facilities and infrastructure management, facilities operations, and performance engineering. Finally, in the decommissioning phase, we provide solutions, recommendations, and remediation strategies for taking facilities out of active service.
We will continue to expand the scope of services we provide in the initial planning stages and during maintenance. We believe this strategy will enable us to establish longer-term relationships with clients throughout the project life cycle. Our three-dimensional business model allows us to provide services to many clients and for many projects, ensuring that we do not rely on a few large projects for our revenue and that no single client or project accounts for more than 5% of our gross revenue.
KEY PERFORMANCE DRIVERS AND CAPABILITIES
Our key drivers are articulated through our value statements: We Put People First, We Are Better Together, We Do What Is Right, and We Are Driven to Achieve. We believe our actionable value statements best reflect what unites Stantec and compels our people to come to work and do their very best every day. Our performance depends on our ability to achieve excellence by putting people first, developing strong, long-lasting relationships with each other and our clients, doing what is right, and being driven to achieve at every level. Our value system provides a framework for the initiatives we will implement to drive our performance and obtain our overall goal to be a top 10 global design firm.
We Put People First
When we interact, we’re empowered with new ideas and opportunities for growth.
Putting people first drives our performance. An organizational environment that supports individual growth, ambition, and ideas is essential. We want our employees to succeed in whatever way they themselves define success, whether by accomplishing stimulating and challenging work or becoming leaders in their fields and in their communities. We are committed to supporting, fostering, and investing in individual success through a culture of opportunity, mentorship, and innovation.
MANAGEMENT’S DISCUSSION AND ANALYSIS
December 31, 2012
STANTEC INC.
M-7
Employees
To achieve our goal of being a top 10 global design firm by doing more work for our clients and expanding our client base, we must increase our workforce through a combination of organic hiring and acquisitions. One way to measure success in this area is to look at total staff numbers. In 2012, total employees increased to approximately 12,700 from 11,100 in 2011. At December 31, 2012, our workforce was made up of about 7,300 professionals, 4,000 technical staff, and 1,400 support personnel.
We strive to attract and retain the best employees in the field. This begins with providing a comprehensive, competitive benefits program. We continue to offer our award-winning wellness culture, providing tools and support to help employees and their families improve their health and well-being. In 2012, we combined Human Resources with Practice & Quality Management to form a new group called People + Practice. This ties our people strategy to business practices, project delivery, and client service. Also in 2012, we continued our commitment to promote an employee-focused culture through a wide range of initiatives, including the following:
| — | Project management “boot camp” training sessions |
| — | Health and safety initiatives, such as education and training for supervisors in health and safety rights and responsibilities |
| — | Leadership development programs |
| — | Career stream development |
We measure the success of our various initiatives through employee surveys, 360-degree feedback, and exit interviews. The results help us develop future programs and initiatives. In 2013, our People + Practice group will review the entire employee experience at Stantec, from the moment a graduate sees our booth at a college job fair right through to retirement.
Leadership
Our ability to align the activities of our senior managers with our short- and long-term financial and strategic goals is also an important driver for our success. In addition to fixed salaries, we provide short- and long-term compensation on a discretionary basis, designed to reward our senior managers (including our chief financial and chief operating officers, regional operating unit leaders, and practice area unit leaders) for their individual and corporate contributions to meeting our objectives. The short-term compensation consists of an annual employee cash bonus. The total amount available in the annual employee bonus pool is calculated as a percentage of our annual pre-tax, pre-bonus net income, which encourages our senior managers to achieve profitable business results. To determine the awards for the year, we evaluate each manager’s personal contributions to our Company-wide profitability and performance. In our view, this creates a sense of shared responsibility for achieving outstanding business results and meeting our clients’ needs.
For senior vice presidents, 25.0% of their annual bonus is granted as an allotment of restricted share units, which they receive after two years as cash equal to the units’ market value. The market value of the units is based on the market value of our shares. We believe this plan further invests our senior vice presidents in our long-term share performance.
MANAGEMENT’S DISCUSSION AND ANALYSIS
December 31, 2012
STANTEC INC.
M-8
As part of long-term compensation for key staff, we grant options through our employee share option plan. In 2012, the number of options available for issuance was tied to the achievement of two key performance metrics contained in our strategic plan: earnings per share and pre-tax, pre-bonus net income as a percentage of net revenue (the term “net revenue” is defined in Definition of Additional IFRS Measures and Definition of Non-IFRS Measures in the Critical Accounting Estimates, Developments, and Measures section of this report). Key staff may also be granted options to purchase shares as part of their total compensation, further aligning their interests with our shareholders’ and encouraging them to remain with us over the long term.
Similarly, our chief executive officer’s (CEO’s) compensation package, which is governed by the terms of his employment agreement, includes a base salary; an annual bonus calculated as a percentage of our pre-tax, pre-bonus income; and a prescribed allotment of deferred share units. Our CEO is not eligible to receive options. We require our CEO, chief operating officer, chief financial officer, and senior vice presidents to own a minimum number of shares in the Company. These shares represent a specific percentage of their base salary. We believe that restricted share units and the minimum ownership requirement provide the appropriate incentives for our CEO to achieve growth in our share price, thereby aligning executive compensation with the interests of shareholders.
We Are Better Together
Strong, long-lasting relationships are at the center of everything we do and directly impact our employees, clients, and project success.
The success of our business is driven by our ability to attract and retain top clients. For us, the best clients are those with whom we have long-term relationships and for whom we provide multiple services and innovative projects. Currently, a majority of our business comes through repeat clients, and our 10 largest clients account for about 10% of our revenue. Our focus is to expand the number of top clients we serve. To this end, we employ an account management program designed not only to increase organic growth by building on relationships with existing clients but also to reflect a balance between global/national and regional/local clients.
Types of Clients
Attracting and retaining the best clients depends on the ability to provide bundled services over a long period of time. These clients have predictable, sustainable, and profitable revenue streams, and through cross-selling, they quickly see the value of both our Company and our people. We believe that one powerful way to develop a unified culture is through design assignments—for global/national and local/regional clients—that require collaboration and coordination across the Company.
Account Management and Marketing & Business Development
Positioning Stantec for sustainable organic growth drives our account management system. To meet the goal of finding and retaining top clients, we develop targeted marketing and business development plans for these clients. This activity is completed on a geographic and practice area unit basis for regional/local clients and on a sector basis for global/national clients. By better understanding our top clients, we can increase our ability to provide services that enhance their success and, in turn, create organic growth for our Company.
MANAGEMENT’S DISCUSSION AND ANALYSIS
December 31, 2012
STANTEC INC.
M-9
Community Engagement
Our desire to support growth in local communities through the enhancement of knowledge, prosperity, health, and quality of life drives our community investment program and defines how we engage in the communities in which we live and work. We make decisions locally in every region, with local input and focus. We recognize that local staff best understand how to match our resources and unique capabilities with the priorities of their communities and how to provide support to the organizations that make a local difference. Corporately, we provide the framework that guides decision-making to ensure our community investments align with our organizational objectives and resonate with our employees and business leaders in the communities.
We Do What Is Right
Integrity guides every decision we make for our clients, our employees, and our community.
A company’s reputation centers on its integrity. The way we treat our people, our clients, and our neighbors reflects who we are, what we believe in, and how we do our work. Doing what is right means paying attention to the impact of every decision we make about how we do business and committing to ensuring quality management, being a leader in innovation, and developing a culture that is sustainable and forward-looking.
Quality Management
What drives quality management is the need to continually improve project execution, improve our forecasting ability, and facilitate more efficient resource management. We currently use a diverse range of tools, including our enterprise management system, to achieve project execution excellence, and we intend to continue to invest in these tools in 2013. One way quality management is implemented is through our project management framework, which focuses on improving project planning capabilities and tools and providing a disciplined commitment to quality assurance and peer review requirements.
We hold three International Organization for Standardization (ISO) certifications that, together, form our integrated management system. These three ISOs are ISO 9001:2008 quality management standard, ISO 14001:2004 environmental management standard, and ISO/EIC 200000-1:2005 IT service management standard. Our integrated management system clarifies expectations for project delivery and client service excellence and conveys the steps employees must take to achieve more consistent and successful project outcomes. We believe that benchmarking against internationally recognized management standards such as ISO provides transparent accountability that meets industry best practices.
Innovation
Organic growth is driven by the provision of new or significantly improved services to our clients. Effective research and development will keep us at the leading edge of new technology and emerging services while building relationships with academic and industrial partners.
Sustainability
We recognize that to achieve our goal of becoming a top 10 global design firm, we must be driven to create and foster a culture of sustainability within our Company and through the services we provide to our clients. We commit to doing what is right by demonstrating the values of social, economic, and environmental responsibility, and by fostering a culture of health and safety for all employees and stakeholders through the implementation of various programs. We are also committed to reducing our negative impact on the environment by progressing toward least-impact approaches to resource use, energy use, waste, and emissions (e.g., greenhouse gases, air pollutants, toxins) and continuing to track and report on our progress in our annual sustainability report and disclosure to the Carbon Disclosure Project (CDP).
MANAGEMENT’S DISCUSSION AND ANALYSIS
December 31, 2012
STANTEC INC.
M-10
In 2012, we added ISO 14001:2004 certification to our environmental management system in order to set targets, implement environmental performance improvements, monitor progress, and assess results within a recognized framework and accountability structure. In 2013, we will focus on meeting established targets to reduce the impact of significant environmental aspects including energy consumption, paper consumption, and disposal of waste—all of which collectively contribute to cost savings.
We Are Driven to Achieve
Achievement at every level begins and ends with a firm commitment to being the best we can be.
The need to capitalize on market opportunities and core strengths drives us to identify potential high-growth sectors, both for organic and acquisition growth, where we are well positioned and able to effectively manage risk.
Growth Opportunities
As part of our strategy, we have identified key potential high-growth sectors that we will focus on in 2013. Over the five-year plan, we intend to maintain our diversification strategy to ensure an appropriate balance within our sector mix. Highest-growth sectors are identified on an annual basis and provide focus for our initiatives.
Our approach to regional growth is to effectively service our existing regional and local clients, develop new relationships, and grow our reputation and business where opportunities exist. Achieving a high level of market presence in the geographic locations we serve is a key driver to our success. Our target is to be among the top-tier service providers in each of our geographic locations and sectors. With this level of market presence, we are less likely to be affected by downturns in regional economies. Top-tier positioning also gives us increased opportunities to work for the best clients, obtain the best projects, and attract and retain the best employees.
We believe we have strength in the Canadian market: currently, we enjoy top-tier positioning in a majority of our locations and practice area units. Additionally, our position in the United States is growing, and we have taken strong steps to better position ourselves as a national firm. As well, we have an emerging international presence, mainly in Buildings and Urban Land and in the mining sector, and we aim to grow organically by introducing more of our services to our current range of clients and to new clients.
Organic growth has been and continues to be a key driver to our success. To achieve growth, we continue to focus on leveraging client relationships through our sector approach, cross-selling our services, implementing account management programs, and pursuing strategic hires.
The need to respond quickly and effectively to an evolving market drives a strategic acquisition plan that positions us for both regional and sector growth. We will continue to take a proactive approach, targeting the “right-fit” firms in our highest-potential sectors and geographies while remaining open to new opportunities. In the mid-term, we anticipate that our International acquisition growth will occur as part of our acquisitions in North America.
MANAGEMENT’S DISCUSSION AND ANALYSIS
December 31, 2012
STANTEC INC.
M-11
Because we operate in an industry that includes more than 50,000 firms, most of which are small, we are confident that we can continue to take advantage of acquisition opportunities. According to internal analysis andEngineering News-Record’s 2012 report on the top 500 design firms, the largest engineering and architecture companies (our principal competitors) operating in the United States generate about US$95 billion in annual fees. Currently, we have approximately a 2% share of this.
The integration of acquired firms begins immediately following the acquisition closing date, generally takes between six months and two years to complete, and involves the implementation of our Company-wide information technology and financial management systems and the provision of support services from our corporate and regional offices. This approach allows new staff to focus on their primary responsibility of continuing to serve clients with minimal interruption and also allows them to take advantage of our systems and expertise.
We measure our success integrating acquired employees by using a post-integration survey and assessing the survey results to improve future integration activities. We also monitor leadership retention from acquisitions, key project submissions, key client pursuits, and teaming with existing practices. In addition, we measure our growth success by monitoring our year-over-year increase in gross revenue attributable to organic and acquisition growth.
Financing
Our continued ability to finance our growth plan supports our success. Adequate financing gives us the flexibility to acquire firms that are appropriate for our vision and complement our business model. Since we became publicly traded on the Toronto Stock Exchange (TSX) in 1994, we have increased our gross revenue at a compound annual rate of 18.5%. To fund such growth, we require cash generated from both internal and external sources. Historically, we have completed acquisitions using mostly cash and notes, while at opportune times, raised additional funds through equity issuances to replenish our cash reserves, pay down debt, and strengthen our balance sheet. We have not, however, issued equity since 2005; instead, we have funded our growth with cash generated from operations.
In 2012, we extended the maturity of our existing $350 million revolving credit facility to August 31, 2016. This facility also gives us access to additional funds, subject to approval from our lenders. In 2012, we increased the limit to these additional funds from $75 million to $150 million. At December 31, 2012, we had $263.5 million of additional borrowing available under the facility. In 2011, we issued $70 million of 4.332% secured notes due May 10, 2016, and $55 million of 4.757% senior secured notes due May 10, 2018, which were used to repay existing debt.
MANAGEMENT’S DISCUSSION AND ANALYSIS
December 31, 2012
STANTEC INC.
M-12
RESULTS
Overall Annual Performance
In 2012, we achieved strong growth and met or performed better than our expectations and targets. We completed seven acquisitions in the year and had strong organic revenue growth—mainly from our Industrial, Urban Land, and Environment practice area units—because of increased project activity in the oil and gas, mining, water, and urban development sectors. The following highlights other major financial achievements and strategic activities in 2012 that contributed to our financial performance and overall financial condition:
| — | Continued profitability. The end of 2012 marked 59 years of uninterrupted profitability for our Company. We ended the year with 11.9% growth in gross revenue, a 12.9% increase in net revenue, and a 12.9% increase in EBITDA compared to 2011. |
| — | Growth through acquisitions. Acquisitions completed in 2011 and 2012 contributed $99.4 million to the increase in our gross revenue in 2012 compared to 2011. |
| — | Strong organic growth. In 2012, we achieved strong organic revenue growth, with growth in every quarter, despite the mixed economic conditions in North America. Organic growth for gross revenue was 5.6% and for net revenue was 6.5% in 2012 compared to 2011. Organic growth was experienced in our Canadian and International operations and in our Environment, Industrial, Transportation, and Urban Land practice area units. |
| — | Strong balance sheet and liquidity. Our balance sheet remains solid. Operating cash flows increased from $114.6 million in 2011 to $180.5 million in 2012. During the year, we extended the maturity date of our existing $350 million revolving credit facility to August 31, 2016. As at December 31, 2012, $263.5 million of additional borrowing was available under our revolving credit facility for future acquisitions, working capital needs, and general corporate purposes. |
| — | Dividend policy. On February 15, 2012, Stantec’s board of directors approved a dividend policy and started declaring quarterly dividends in 2012. The declaration of these dividends reflects the confidence of our board of directors and management in our ability to generate ongoing cash flow from operations, continue to grow revenue, and complete strategic acquisitions while providing enhanced shareholder returns. |
MANAGEMENT’S DISCUSSION AND ANALYSIS
December 31, 2012
STANTEC INC.
M-13
| — | Board succession. In the fourth quarter of 2012, Mr. Robert Bradshaw stepped down from his position on our board of directors. Mr. Bradshaw had been associated with our Company since 1993 and was part of the team that took our Company public in 1994. He served as chairman of our board from 1994 to 1998 and has been a member and chair of our Corporate Governance and Compensation Committee and a member of the Audit and Risk Committee. On February 20, 2013, the board passed a resolution appointing Mr. Donald Lowry of Edmonton, Alberta, to our board. His appointment will be effective May 8, 2013. Mr. Lowry is currently the president and chief executive officer of EPCOR Utilities Inc., and will be stepping down from this role later this year. He is also the non-executive chair of Capital Power Corporation and Canadian Oil Sands Ltd., and a member of the board of directors of Hydrogenics Corporation. |
| — | Well positioned for continued growth. We believe we are well positioned in 2013 to take advantage of continued opportunities in Canada and an expected recovery in the US market. Acquisitions in 2012 expanded the depth and breadth of our expertise in the oil and gas industry, in particular in western Canada, and our Transportation expertise in the United States. In our three-year strategic planning process, 2012 was a comprehensive planning year: we planned for the future and reinforced our commitment to our goal of becoming a top 10 global design firm while achieving a compounded average growth rate of 15% for revenue and earnings. |
Selected Annual Information
The following table highlights trending of certain annual information:
(In millions of Canadian dollars, except per share and share amounts) | 2012 | 2012 vs. 2011 (%) | 2011 | 2011 vs. 2010 (%) | 2010 | |||||||||||||||
| ||||||||||||||||||||
Gross revenue(note 1) | 1,882.9 | 11.9% | 1,683.4 | 11.3% | 1,513.1 | |||||||||||||||
Net revenue(note 1) | 1,556.4 | 12.9% | 1,378.5 | 12.4% | 1,226.0 | |||||||||||||||
EBITDA(note 2) | 221.0 | 12.9% | 195.7 | 5.3% | 185.4 | |||||||||||||||
Net income(note 3) | 120.9 | n/m | 12.7 | (86.6%) | 94.7 | |||||||||||||||
Earnings per share – basic(note 3) | 2.64 | n/m | 0.28 | (86.5%) | 2.07 | |||||||||||||||
Earnings per share – diluted(note 3) | 2.64 | n/m | 0.28 | (86.4%) | 2.06 | |||||||||||||||
Cash dividends declared per common share | 0.60 | n/m | Nil | n/m | Nil | |||||||||||||||
Total assets | 1,468.6 | 10.6% | 1,327.4 | (0.7%) | 1,337.4 | |||||||||||||||
Total long-term debt | 299.3 | 1.0% | 296.2 | (8.0%) | 322.0 | |||||||||||||||
Cash flows | ||||||||||||||||||||
From operating activities | 180.5 | 114.6 | 111.9 | |||||||||||||||||
Used in investing activities | (143.3) | (99.4) | (128.2) | |||||||||||||||||
(Used in) From financing activities | (31.3) | (41.9) | 65.9 | |||||||||||||||||
Outstanding common shares as at | ||||||||||||||||||||
December 31 | 45,983,894 | 45,523,585 | 45,768,320 | |||||||||||||||||
February 20, 2013 | 46,040,991 | |||||||||||||||||||
Outstanding share options as at | ||||||||||||||||||||
December 31 | 1,475,823 | 1,578,300 | 1,480,831 | |||||||||||||||||
February 20, 2013 | 1,417,892 | |||||||||||||||||||
| ||||||||||||||||||||
n/m = not meaningful
note 1: The terms “gross revenue” and “net revenue” are defined in Definition of Additional IFRS Measures in the Critical Accounting Estimates, Developments, and Measures section (the “Definitions Section”) of this report.
note 2: EBITDA is calculated as net income before income taxes plus net interest expense, amortization of intangible assets, depreciation of property and equipment, and goodwill and intangible impairment as further discussed in the Definitions Section of this report.
note 3: Net income, basic earnings per share, and diluted earnings per share would have been $102.7 million, $2.25, and $2.25, respectively, without the $90 million goodwill impairment charge in 2011.
MANAGEMENT’S DISCUSSION AND ANALYSIS
December 31, 2012
STANTEC INC.
M-14
The seven acquisitions completed in 2012 and the five completed in 2011 contributed to our year-over-year growth in gross revenue and EBITDA and growth—prior to the goodwill impairment charge in 2011—in net income, as well as basic and diluted earnings per share. This acquisition growth was supplemented by stronger organic growth in 2012 than in 2011. As a result of organic growth, gross revenue increased 5.6% and net revenue increased 6.5%. Organic growth occurred in our Canadian and International operations—mainly in our Industrial, Urban Land, and Environment practice area units because of increased project activity in the oil and gas, mining, water, and urban development sectors.
Our 2012 EBITDA was impacted by a decrease in our gross margin—from 55.4% in 2011 to 55.0% in 2012—and the decrease in our administrative and marketing expenses as a percentage of net revenue—from 41.0% in 2011 to 40.7% in 2012. Our gross margin declined in 2012 because of the mix of projects during the year, significantly low margins for certain legacy client service agreements from acquisitions, and increased competition in our Transportation practice area unit, in particular in our Canadian market. In addition, during the year our revenue base grew in lower margin operations (Industrial and Transportation in the United States), resulting in an overall lower 2012 consolidated gross margin. Our administrative and marketing expenses declined in 2012 as a result of our continued focus on managing our costs and operational efficiencies. The growth in net income and basic and diluted earnings per share over 2011 was a result of the above-noted factors, excluding the impact of the goodwill impairment charge in 2011.
The growth in our gross revenue and EBITDA in 2011 compared to 2010 was a result of the five acquisitions completed in 2011 and the ten acquisitions completed in 2010. This growth in gross revenue and EBITDA contributed to the growth—prior to the goodwill impairment charge—in net income, as well as in basic and diluted earnings per share. Our 2011 EBITDA was impacted by a decrease in our gross margin from 56.1% in 2010 to 55.4% in 2011 and a decrease in our administrative and marketing expenses as a percentage of net revenue due to fewer acquisition-related costs compared to 2010. Our gross margin decline occurred because of the mix of projects during the year, increased competitiveness in our buildings and industrial markets, and continued softening of the United States, United Kingdom, and Dubai buildings industries. The growth in net income and basic and diluted earnings per share over 2010 was a result of the above-noted factors, excluding the impact of the goodwill impairment charge in 2011.
MANAGEMENT’S DISCUSSION AND ANALYSIS
December 31, 2012
STANTEC INC.
M-15
Results Compared to 2012 Targets
In our 2011 Management’s Discussion and Analysis, we established various ranges of expected performance for 2012.
The following table presents the results we achieved in 2012:
| Measure | 2012 Target Range | Results Achieved | ||||
| ||||||
Gross margin as % of net revenue | Between 54.5 and 56.5% | 55.0% ü | ||||
Administrative and marketing expenses as % of net revenue | Between 41 and 43% | 40.7% ü | ||||
Net income as % of net revenue | At or above 6% | 7.8% ü | ||||
Effective income tax rate | At or below 28.5% | 26.5% ü | ||||
Return on equity(notes 1 and 3) | At or above 14% | 18.0% ü | ||||
Net debt to EBITDA(notes 2 and 3) | Below 2.5 | 1.17 ü | ||||
| ||||||
note 1: Return on equity is calculated as net income for the last four quarters divided by average shareholders’ equity over each of these quarters.
note 2: Net debt to EBITDA is calculated as the sum of (1) long-term debt, including current portion, plus bank indebtedness, less cash and term deposits, divided by (2) EBITDA, which is calculated as income before income taxes plus net interest expense, amortization of intangible assets, depreciation of property and equipment, and goodwill and intangible impairment.
note 3: Return on equity and net debt to EBITDA are non-IFRS measures and are discussed in the Definition of Non-IFRS Measures in the Critical Accounting Estimates, Developments, and Measures section of this report.
ü Met or performed better than target
In 2012, we met or performed better than our targets.
Acquisitions
Consideration for acquisitions completed was $102.1 million in 2012 and $62.5 million in 2011. In 2012, we completed the following acquisitions:
| — | On May 18, 2012, we acquired PHB Group Inc. (PHB), which added approximately 35 staff to our Company. PHB’s architectural services complement our existing Buildings Engineering, Geotechnical Engineering, and Environmental Services practice areas in Newfoundland. |
| — | On May 25, 2012, we acquired ABMB Engineers, Inc. (ABMB), which added approximately 130 staff to our Company. The addition of ABMB will grow our Transportation practice area unit in the US Southeast while also providing a new presence for us in Mississippi. |
| — | On August 24, 2012, we acquired Cimarron Engineering Ltd. (Cimarron), adding approximately 290 staff to our Company. The addition of Cimarron will enhance our Oil & Gas and Power practices throughout North America. |
| — | On November 30, 2012, we acquired Corzo Castella Carballo Thompson Salman, P.A. (C3TS), which added approximately 150 staff to our Company. The firm’s capabilities will augment our multidiscipline engineering and environmental services in Florida and the southeastern United States. |
| — | On November 30, 2012, we acquired Architecture 2000 Inc., adding 23 staff to our Company. The addition of Architecture 2000 Inc. will augment our Canadian architecture presence and diversify our existing presence in Atlantic Canada. |
| — | On December 14, 2012, we acquired Greenhorne & O’Mara, Inc. (G&O), which added approximately 520 staff to our Company. The addition of G&O, a transportation, environment, and infrastructure and design firm, complements our existing presence in the US East and provides a new foothold in several states. |
| — | On December 14, 2012, we acquired Landmark Survey and Mapping, Inc. (LSM), which added 24 staff to our Company. The addition of LSM will bolster our emerging oil and gas presence in the US East. |
MANAGEMENT’S DISCUSSION AND ANALYSIS
December 31, 2012
STANTEC INC.
M-16
Balance Sheet
The following highlights the major changes to our assets, liabilities, and equity from December 31, 2011, to December 31, 2012:
| (In millions of Canadian dollars) | Dec 31, 2012 | Dec 31, 2011 | $ Change | % Change | ||||||||||||
| ||||||||||||||||
Total current assets | 589.2 | 529.2 | 60.0 | 11.3% | ||||||||||||
Property and equipment | 115.1 | 107.9 | 7.2 | 6.7% | ||||||||||||
Goodwill | 566.8 | 509.0 | 57.8 | 11.4% | ||||||||||||
Intangible assets | 85.7 | 72.0 | 13.7 | 19.0% | ||||||||||||
Other financial assets | 63.6 | 61.6 | 2.0 | 3.2% | ||||||||||||
All other assets | 48.2 | 47.7 | 0.5 | 1.0% | ||||||||||||
| ||||||||||||||||
Total assets | 1,468.6 | 1,327.4 | 141.2 | 10.6% | ||||||||||||
| ||||||||||||||||
Current portion of long-term debt | 42.9 | 59.6 | (16.7) | (28.0%) | ||||||||||||
Provisions | 14.9 | 16.4 | (1.5) | (9.1%) | ||||||||||||
Other liabilities | 8.7 | 5.2 | 3.5 | 67.3% | ||||||||||||
All other current liabilities | 278.7 | 246.3 | 32.4 | 13.2% | ||||||||||||
| ||||||||||||||||
Total current liabilities | 345.2 | 327.5 | 17.7 | 5.4% | ||||||||||||
Long-term debt | 256.4 | 236.6 | 19.8 | 8.4% | ||||||||||||
Provisions | 37.0 | 42.1 | (5.1) | (12.1%) | ||||||||||||
Other liabilities | 42.8 | 37.2 | 5.6 | 15.1% | ||||||||||||
All other liabilities | 60.0 | 56.8 | 3.2 | 5.6% | ||||||||||||
Equity | 727.2 | 627.2 | 100.0 | 15.9% | ||||||||||||
| ||||||||||||||||
Total liabilities and equity | 1,468.6 | 1,327.4 | 141.2 | 10.6% | ||||||||||||
| ||||||||||||||||
Refer to the Liquidity and Capital Resources section of this report for an explanation of the change in current assets and current liabilities.
Property and equipment increased because of additions from the seven acquisitions in the year and from normal operations. The increase in property and equipment was partly offset by depreciation. Goodwill and intangible assets increased as a result of additions from acquisitions. In addition, intangible assets increased because of the renewal of agreements for AutoCAD, Microsoft, and our enterprise management system software in the year. The increase in intangible assets was partly offset by amortization. Other financial assets increased because of an increase in investments held for self-insured liabilities.
In total, long-term debt increased by $3.1 million as a result of a $7.5 million increase in finance lease obligations related mainly to the renewal of software agreements in the year. This was partly offset by a $2.8 million reduction in the outstanding balance of our revolving credit facility and a $1.8 million reduction in the outstanding balance of our notes payable from acquisitions year over year. During the year, we paid $52.2 million in notes payable from prior acquisitions. This was partly offset by a $49.4 million increase in notes payable from acquisitions completed in the year. Total provisions decreased by $6.6 million, mainly because of a decrease in our provisions for claims and lease exits and onerous sublease contracts. Total other liabilities increased by $9.0 million, mainly because of a $5.4 million increase in lease inducement benefits and a $3.6 million increase in deferred and restricted share units payable in the year because additional units were issued and the fair value of existing units increased during the year.
MANAGEMENT’S DISCUSSION AND ANALYSIS
December 31, 2012
STANTEC INC.
M-17
Overall, the carrying amount of the assets and liabilities of our US subsidiaries on our consolidated balance sheets decreased due to the strengthening of the Canadian dollar from US$0.98 at December 31, 2011, to US$1.01 at December 31, 2012.
Discussion of Operations
Our Company operates in one reportable segment: Consulting Services. We provide knowledge-based solutions for infrastructure and facilities projects through value-added professional services, principally under fee-for-service agreements with clients.
The following table summarizes our key operating results on a percentage of net revenue basis and the percentage increase in the dollar amount of these results from year to year:
| Year Ended Dec 31 | ||||||||||||||||
| Percentage of Net Revenue with Goodwill Impairment | Percentage Increase (Decrease) * | Percentage | ||||||||||||||
|
| |||||||||||||||
| 2012 | 2011 | 2012 vs. 2011 | 2012 vs. 2011 | |||||||||||||
| ||||||||||||||||
Gross revenue | 121.0% | 122.1% | 11.9% | 11.9% | ||||||||||||
Net revenue | 100.0% | 100.0% | 12.9% | 12.9% | ||||||||||||
Direct payroll costs | 45.0% | 44.6% | 13.9% | 13.9% | ||||||||||||
Gross margin | 55.0% | 55.4% | 12.1% | 12.1% | ||||||||||||
Administrative and marketing expenses | 40.7% | 41.0% | 12.0% | 12.0% | ||||||||||||
Depreciation of property and equipment | 1.8% | 2.0% | 0.0% | 0.0% | ||||||||||||
Amortization of intangible assets | 1.3% | 1.3% | 8.7% | 8.7% | ||||||||||||
Impairment of goodwill | 0.0% | 6.5% | (100.0%) | n/m | ||||||||||||
Net interest expense | 0.6% | 0.7% | (10.3%) | (10.3%) | ||||||||||||
Other net finance expense | 0.1% | 0.3% | (3.6%) | (3.6%) | ||||||||||||
Share of income from associates | (0.1%) | 0.0% | 125.0% | 125.0% | ||||||||||||
Foreign exchange loss | 0.0% | 0.0% | (60.0%) | (60.0%) | ||||||||||||
Other expense (income) | 0.0% | 0.0% | n/m | n/m | ||||||||||||
Income before income taxes(note 1) | 10.6% | 3.6% | 231.0% | 17.8% | ||||||||||||
Income taxes | 2.8% | 2.7% | 17.8% | 17.8% | ||||||||||||
Net income(note 1) | 7.8% | 0.9% | n/m | 17.7% | ||||||||||||
| ||||||||||||||||
* % increase calculated based on the dollar change from the comparable period.
n/m = not meaningful
note 1: Net income before income taxes as a percentage of net revenue and net income as a percentage of net revenue would have been 10.1% and 7.4% respectively, without the $ 90 million goodwill impairment charge in 2011.
The percentage increase in gross and net revenue in 2012 compared to 2011 was due to acquisition growth and organic growth in all our practice area units, with the exception of Buildings, which experienced no organic growth (further explained in the Gross and Net Revenue section that follows). In 2012, administrative and marketing expenses, depreciation of property and equipment, and net interest expense, all as a percentage of net revenue, decreased compared to 2011 (further explained in the respective sections of this report). Excluding the impact of the goodwill impairment charge in 2011, our net income for 2012 increased by 17.7%.
MANAGEMENT’S DISCUSSION AND ANALYSIS
December 31, 2012
STANTEC INC.
M-18
Gross and Net Revenue
The following discussion includes forward-looking statements. For an outline of the material risks and assumptions associated with these statements, refer to Cautionary Note Regarding Forward-Looking Statements at the end of this report. For definitions of “gross revenue” and “net revenue,” refer to Definition of Additional IFRS Measures in the Critical Accounting Estimates, Developments, and Measures section of this report.
Revenue earned by acquired companies in the first 12 months following acquisition is reported as revenue from acquisitions and, thereafter, as organic growth.
Each practice area unit generates a portion of gross revenue in the United States. The value of the Canadian dollar averaged par to the US dollar in 2012 compared to US$1.01 in 2011, representing a 1.0% decrease. The weakening of the average Canadian dollar for the year had a positive effect on the revenue reported in 2012 compared to 2011.
The following tables summarize the impact of acquisition growth, organic growth, and foreign exchange on our gross and net revenue for 2012 compared to 2011.
| Gross Revenue | ||||
| (In millions of Canadian dollars) | 2012 vs. 2011 | |||
| ||||
Increase due to | ||||
Acquisition growth | 99.4 | |||
Organic growth | 93.7 | |||
Impact of foreign exchange rates on revenue earned by foreign subsidiaries | 6.4 | |||
| ||||
Total net increase in gross revenue | 199.5 | |||
| ||||
| Net Revenue | ||||
| (In millions of Canadian dollars) | 2012 vs. 2011 | |||
| ||||
Increase due to | ||||
Acquisition growth | 83.1 | |||
Organic growth | 89.7 | |||
Impact of foreign exchange rates on revenue earned by foreign subsidiaries | 5.1 | |||
| ||||
Total net increase in net revenue | 177.9 | |||
| ||||
MANAGEMENT’S DISCUSSION AND ANALYSIS
December 31, 2012
STANTEC INC.
M-19
The following table summarizes the growth in gross revenue by region:
Gross Revenue by Region
| (In millions of Canadian dollars) | Year Ended 2012 | Year Ended 2011 | Total Change | Change Due to Acquisitions | Change Due to Organic | Change Due to Foreign Exchange | ||||||||||||||||||
| ||||||||||||||||||||||||
Canada | 1,085.1 | 945.3 | 139.8 | 48.9 | 90.9 | n/a | ||||||||||||||||||
United States | 721.5 | 679.3 | 42.2 | 50.5 | (14.7) | 6.4 | ||||||||||||||||||
International | 76.3 | 58.8 | 17.5 | - | 17.5 | - | ||||||||||||||||||
| ||||||||||||||||||||||||
Total | 1,882.9 | 1,683.4 | 199.5 | 99.4 | 93.7 | 6.4 | ||||||||||||||||||
| ||||||||||||||||||||||||
n/a = not applicable
Total gross revenue was positively impacted by the acquisitions completed in 2011 and 2012, organic growth, and by the average Canadian dollar weakening against the US dollar in 2012 compared to 2011.
The following lists the acquisitions completed in 2011 and 2012 that impacted specific regions, during the year:
| — | Canada: QuadraTec, Inc. (QuadraTec) (February 2011); the Caltech Group (Caltech) (May 2011); FSC Architects and Engineers (FSC) (October 2011); PHB Group Inc. (PHB) (May 2012); Cimarron Engineering Ltd. (Cimarron) (August 2012); and Architecture 2000 Inc. (November 2012) |
| — | United States: Bonestroo, Inc. and Bonestroo Services, LLC (Bonestroo) (September 2011); ENTRAN, Inc. (ENTRAN) (October 2011); ABMB Engineers, Inc. (ABMB) (May 2012); Corzo Castella Carballo Thompson Salman, P.A. (C3TS) (November 2012); Greenhorne & O’Mara, Inc. (G&O) (December 2012); and Landmark Survey and Mapping, Inc. (LSM) (December 2012) |
Canada. Gross revenue in our Canadian operations increased by 14.8% in 2012 compared to 2011. This increase resulted from acquisition and organic growth. The 9.6% of the increase attributable to organic growth was mainly due to increased resource activity, such as in the oil and gas and mining sectors where we continue to provide environmental and industrial services to our clients. For example, in 2012, we secured a project to perform the environmental assessment for the 750-kilometre-diameter (466-mile-diameter) natural gas Coastal Gas Link pipeline from Dawson Creek to Kitimat, British Columbia. The resource activity for related infrastructure
MANAGEMENT’S DISCUSSION AND ANALYSIS
December 31, 2012
STANTEC INC.
M-20
investment in western Canada has also maintained momentum. For example, our Urban Land practice area unit continues to provide master planning for residential communities and design and landscape services for re-urbanization projects such as the City Center plan in Saskatoon, Saskatchewan.
Public sector work in 2012 was mixed in Canada. In some provinces, such as Ontario, the review of government budgets created uncertainty related to infrastructure spending, while other provinces are moving ahead with a regular flow of projects. Support continued for the public-private partnership (P3) model in Canada in 2012, and in most provinces, projects continued to be released, albeit at a slower rate with increased competition. For example, during the year, we secured a significant P3 project to design 12 new schools in Alberta. The P3 model will accelerate work on the schools being built across Alberta, resulting in completion two years sooner than conventional project delivery methods would have allowed.
We believe our Canadian operations will achieve moderate organic growth in 2013 as described in the Outlook section of this report.
United States. Gross revenue in our US operations increased by 6.2% in 2012 compared to 2011 due to acquisition growth and foreign exchange. Organic gross revenue retracted 2.2%, mainly in the eastern United States in our Environmental and Transportation practices. This was partly offset by strong growth in our Water practice and growth in our Mining practice in the western United States.
In the public sector, the presidential election in late 2012 increased uncertainty and caused some clients to suspend long-term programs pending clarity in funding infrastructure-related activities. The election also created some legislative uncertainty in 2012, including uncertainty about the rollout of environmental priorities and resource development. The passage of the transportation bill was positive; however, the bill does not provide long-term clarity for building and sustaining the quality of transportation infrastructure required into the future.
In the private sector, certain states, such as those supported by resource activity, strengthened more quickly in 2012, while other states, constrained by deep deficits, high unemployment, and lower tax receipts, remained challenged. In 2012, we maintained our position in the resource-related market. As the resource landscape is changing, our Industrial practice area unit is responding by supporting infrastructure development in the oil and gas sector, such as in midstream-related services, and in the power sector by assisting with retrofits.
We believe our United States operations will achieve stable to moderate organic growth in 2013 as described in the Outlook section of this report.
International. Gross revenue in our International operations grew by 29.8% in 2012 compared to 2011. The majority of our International operations relates to our Buildings and Urban Land practice area units and the mining sector. The increase in gross revenue was caused by organic growth in our urban development sector. We expect this growth to continue into 2013. For example, in the fourth quarter of 2012 we were awarded a project in Saudi Arabia for the master planning for and detailed design of 1200 units of housing and all the support facilities, including four schools, two retail villages, eight mosques, two bridges, and an extensive series of parks and amenities.
We believe our International operations will achieve moderate organic growth in 2013 as described in the Outlook section of this report.
MANAGEMENT’S DISCUSSION AND ANALYSIS
December 31, 2012
STANTEC INC.
M-21
The following table summarizes our gross revenue by practice area unit for 2012 compared to 2011:
|
| |||||||||||||||||||
Practice Area Unit Gross Revenue
| % of | % of | % Change | |||||||||||||||||
| Consulting | Consulting | in Gross | ||||||||||||||||||
| Services | Services | Revenue | ||||||||||||||||||
(In millions of Canadian dollars, except %) | 2012 | Gross Revenue | 2011 | Gross Revenue | 2012 vs. 2011 | |||||||||||||||
| ||||||||||||||||||||
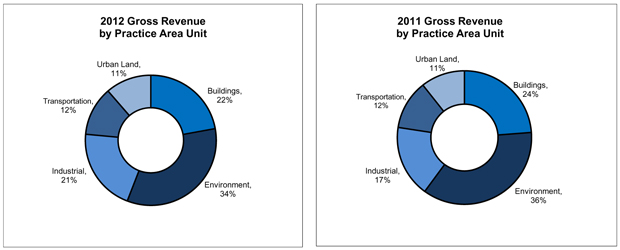
Buildings | 416.6 | 22.1% | 413.2 | 24.5% | 0.8% | |||||||||||||||
Environment | 635.3 | 33.8% | 604.8 | 35.9% | 5.0% | |||||||||||||||
Industrial | 388.2 | 20.6% | 289.4 | 17.2% | 34.1% | |||||||||||||||
Transportation | 229.3 | 12.2% | 199.2 | 11.9% | 15.1% | |||||||||||||||
Urban Land | 213.5 | 11.3% | 176.8 | 10.5% | 20.8% | |||||||||||||||
| ||||||||||||||||||||
Total | 1,882.9 | 100.0% | 1,683.4 | 100.0% | 11.9% | |||||||||||||||
| ||||||||||||||||||||
| Note: Comparative figures have been restated due to a realignment of several practice components between our Buildings, Industrial, Transportation, and Urban Land practice area units. | ||||||||||||||||||||
As indicated above, our gross revenue was impacted by acquisitions, organic growth, and the effect of foreign exchange rates on revenue earned by our foreign subsidiaries. The impact of these factors on gross revenue earned by practice area units is summarized as follows:
MANAGEMENT’S DISCUSSION AND ANALYSIS
December 31, 2012
STANTEC INC.
M-22
Practice Area Unit Gross Revenue
| 2012 Compared to 2011 | ||||||||||||||||
|
| |||||||||||||||
| (In millions of Canadian dollars) | Total Change | Change Due to Acquisitions | Change Due to Organic Growth | Change Due to Foreign Exchange | ||||||||||||
| ||||||||||||||||
Buildings | 3.4 | 13.4 | (11.7) | 1.7 | ||||||||||||
Environment | 30.5 | 4.0 | 24.0 | 2.5 | ||||||||||||
Industrial | 98.8 | 35.6 | 62.7 | 0.5 | ||||||||||||
Transportation | 30.1 | 27.7 | 1.1 | 1.3 | ||||||||||||
Urban Land | 36.7 | 18.7 | 17.6 | 0.4 | ||||||||||||
| ||||||||||||||||
Total | 199.5 | 99.4 | 93.7 | 6.4 | ||||||||||||
| ||||||||||||||||
| Note: Comparative figures have been restated due to a realignment of several practice components between our Buildings, Industrial, Transportation, and Urban Land practice area units. | ||||||||||||||||
The following summarizes the acquisitions completed in 2011 and 2012 that affected the acquisition growth of each practice area unit during the year:
| — | Buildings: QuadraTec (February 2011); FSC (October 2011); PHB (May 2012); C3TS (November 2012); and Architecture 2000 Inc. (November 2012) |
| — | Environment: Bonestroo (September 2011) and G&O (December 2012) |
| — | Industrial: Caltech (May 2011); Cimarron (August 2012); and LSM (December 2012) |
| — | Transportation: ENTRAN (October 2011); ABMB (May 2012); C3TS (November 2012); and G&O (December 2012) |
| — | Urban Land: Bonestroo (September 2011) and G&O (December 2012) |
Buildings. The Buildings practice area unit had 2.8% organic gross revenue retraction in 2012 compared to 2011. The organic revenue retraction was a result of the softening of the buildings market in 2012 and continued competition and pressure experienced in funding for private and public sector clients, particularly in the healthcare market.
In 2012, the relative strength of the Canadian market attracted US and international competition. This additional competition challenged all consulting firms to maintain market share and intensified pressure to provide more services for lower fees. We, however, continued to secure projects in our key market sectors: healthcare, education, and aviation. For example, in 2012, we secured the facilities programming work for a significant new science building at Memorial University in St. John’s, Newfoundland. In 2012, we continued to grow our commercial buildings practice. During the year, we were awarded three major retail development projects in British Columbia, and we continued to work on a cross-country retail program for Target.
Opportunities still existed for P3s in Canada even though funding constraints prevailed in the public sector throughout 2012. For example, during the year, we were selected to be the designers for one of the proponent teams competing for a P3 airport project in Canada. In the US, signs of interest in P3s were beginning to appear in response to public sector funding issues. In the private sector, renovations and expansions continue to move forward, in particular in specialist facilities such as the Taussig Cancer Institute at the Cleveland Clinic where we secured a commission to perform programming, architectural, and interior design services for a major expansion. Activity in our United Kingdom operations was negatively impacted by restraint on infrastructure spending.
MANAGEMENT’S DISCUSSION AND ANALYSIS
December 31, 2012
STANTEC INC.
M-23
We believe that the organic revenue growth for our Buildings practice area unit will remain stable in 2013. Our top-tier positioning and global expertise in healthcare, education, and aviation will enable us to continue to pursue a broad range of North American and international opportunities. We expect to continue to secure our market share of conventionally and alternatively funded projects and to be well positioned in the United States as clients adjust to implications of the healthcare bill. In the commercial sector, our national reach, local strength, and breadth of services positions us with major clients renovating or expanding their locations.
Environment. The Environment practice area unit had 4.0% organic gross revenue growth in 2012 compared to 2011. The organic revenue growth was due to the strength in the oil and gas and mining sectors and steady growth in our water and power practices.
In 2012, oil prices were above historic averages, and despite fluctuations in both oil and base metal prices during the year, this practice area unit was not materially impacted. International opportunities for the sale of natural gas and oil resulted in increased activity in large-scale projects in the Canadian oil and gas sector, especially in western Canada. The desire to access western Canadian ports for export of hydrocarbons to Asia and other destinations generated opportunities for interprovincial pipelines and associated marine facilities. For example, we continued with the overall technical coordination of the environmental assessment and emergency response planning for the 1,170-kilometre-long (727-mile-long) Northern Gateway Pipeline project proposed from Bruderheim, Alberta, to Kitimat, British Columbia. We also provided consulting services to two liquefied natural gas projects and associated port facilities in the same region. In the United States, we benefited from relationships with long-term clients. For example, in our geotechnical operations, we continue to work on projects for the Tennessee Valley Authority and the US Army Corps of Engineers.
In our water business, we experienced growth during 2012, despite new investments remaining relatively flat while municipalities dealt with budget constraints. In particular, we experienced growth in the United States because companies still invested in existing facilities due to regulatory requirements and consent decrees that required water and sewage treatment plants to be upgraded and sanitary sewer overflow and combined sewer overflow programs to continue. For example, during the year, we were awarded the multi-year Capacity Assurance Program for the City of Lexington, Kentucky. Clients also sought innovative ways to leverage or combine their available funding such as the Placer Regional Sewer Project (in Placer County, California) where we were awarded work to consolidate wastewater treatment from the Placer Sewer Maintenance District No.1, the City of Aubern, and the City of Lincoln. We expanded our water service offerings into other industrial water activities, such as tailings-pond treatment, flood control, water reuse, and water resource management, as well as in mining-related activities. In 2012, we secured a number of projects from repeat clients and saw an increased trend for design-build projects in the water sector. For example, during the fourth quarter we were awarded a project to provide engineering services in support of a Design-Build-Operate-Finance project for the construction of a new water treatment and wastewater treatment facility in Kananaskis Country, Alberta, an environmentally sensitive recreation area.
We believe our Environment practice area unit will achieve moderate organic revenue growth in 2013. We expect that our size, presence, and reputation in the environmental market will continue to increase our share of large long-term projects with national and international scope. By focusing on integrated service offerings, especially related to our Industrial practice area unit, and leveraging relationships with large clients, we believe we are well positioned to secure opportunities in the energy sector. In the water sector, we believe we are well positioned to secure projects resulting from a more stringent regulatory environment and expect that funding constraints will continue moving the market toward design-build delivery, which presents us with opportunities.
MANAGEMENT’S DISCUSSION AND ANALYSIS
December 31, 2012
STANTEC INC.
M-24
Industrial.The Industrial practice area unit had 21.7% organic gross revenue growth in 2012 compared to 2011. This strong organic revenue growth was the result of an increase in project activity related to energy, particularly in the oil and gas and mining sectors.
In the United States, the energy market was strong in 2012 in spite of challenges in the overall economy. The build-out of shale resources presented opportunities, for example in the provision of services to the pipelines sector, where we were awarded a 140-mile, 20-inch (225-kilometre, 51-centimetre) pipeline expansion project in Eagle Ford, Texas. In addition, we are providing construction management oversight and regulatory support for other projects in Eagle Ford. In Canada, the fluctuation in oil prices in 2012 did not impact our oil and gas business. Because our clients are planning for the long term and adding capacity for storage and distribution, we secured a number of additional projects in this sector.
Commodity prices, a key driver for this practice area unit, were strong in the first part of the year and spurred the capital spending plans of our private sector clients. Prices fell back later in the year, especially in some metals (e.g. nickel), causing certain clients to place projects on hold or to extend their capital expenditures over longer time frames. However, several of our largest mining projects continue to be funded. For example, we continue to work on the BHP Billiton’s Jansen potash mine project in Saskatchewan. In 2012, we also continued our strategy to build relationships with new clients, to diversify exposure to various commodities, and to grow into areas that support all aspects of infrastructure development. We also expanded services provided in our mining practice to include expertise beyond that related to underground mining.
Our Industrial Buildings and Facilities practice area is also growing in multiple areas, including large industrial facilities, transportation, equipment dealers, and servicing companies, where public and private clients are renewing or building new facilities. For example, during the fourth quarter, we secured a project to provide conceptual design, detailed design, finite element analysis, and construction management services for a full-size fast-response craft simulator for training personnel to safely escape from vehicles crashing into water. The success of this project has expanded the scope of safety-training craft. The scope was previously limited to helicopters.
We believe that our Industrial practice area unit will achieve stable to moderate organic revenue growth in 2013. We anticipate that weakness in the price of certain commodities in the mining sector will continue in 2013, which may result in some rebalancing of staff levels at the beginning of the year, but we anticipate that some of our larger projects—in particular, those relating to potash and copper—will not be affected. We anticipate that our clients in Industrial Buildings & Facilities and Power will continue with normal capital spending. As a result of long-term client relationships, current market opportunities, and recent acquisitions made in western Canada, we expect continued growth in our Oil and Gas business in 2013, particularly in pipelines.
Transportation. The Transportation practice area unit’s organic gross revenue was stable in 2012 compared to 2011. This was a result of our ability to secure projects from repeat clients because of our strong relationships and past performance.
MANAGEMENT’S DISCUSSION AND ANALYSIS
December 31, 2012
STANTEC INC.
M-25
Although the transportation market was uncertain in the United States in 2012 due to multiple short-term extensions to transportation funding until the mid-year approval of a surface transportation bill, we continued to secure local and regional projects with repeat clients. For example, during the year we secured repeat work with the North Carolina Department of Transportation for project studies for proposed improvements of a 13-mile (21-kilometre) section of NC 150 northeast of Charlotte, North Carolina. This large multi-year project involved staff from other practice area units since the study included the preparation of the National Environmental Policy Act environmental assessment, preliminary roadway design, traffic forecasting and analysis, and public consultation. Bridge inspections, rehabilitation, and maintenance also remain a stable element of our portfolio because of our long-term relationship with clients and our expertise in this area.
Stability in our Transportation practice area unit was achieved despite increased competition and a limited market due to government deficits. A softening market in 2012 was more evident in Canada than in the United States, particularly in western Canada. Nonetheless, 2012 had opportunities in the Canadian P3 market, and we saw increased activities in the US design-build market because our expertise and design focus makes us a strong partner for our clients in this sector. For example, we were part of a team selected for the 27-kilometre (17-mile) northeast expansion of Anthony Henday Drive, a six- and eight-lane divided ring road in Edmonton, Alberta. In the fourth quarter of 2012, we secured a design-build project in Louisville, Kentucky, to provide a cross-section of services to include roadways and bridge design, lighting, landscaping, permitting, and engineering services for a new Ohio river bridge and its system interchanges.
We believe organic revenue growth for our Transportation practice area unit will remain stable in 2013. We expect that P3 projects will continue to provide a potential stream of work in Canada and that a P3 market will continue developing in the United States, driven by state and provincial deficits limiting funds available for capital projects. We believe the US transportation bill, passed in the second quarter of 2012, will provide a stable level of funding for transportation spending over the next year; however, the lack of a long-term federal funding strategy may still hold back larger projects. We expect our recent acquisitions in the United States will add to our design-build capabilities as well as increase the depth and breadth of our relationships there, especially in Florida and the Mid-Atlantic. In addition, we assume we will continue to secure projects in 2013 from repeat clients because of our strong long-term relationships and past performance.
Urban Land.The Urban Land practice area unit had 10.0% organic gross revenue growth in 2012 compared to 2011. The organic growth year over year was the result of continued activity in certain geographic areas—particularly in Saudi Arabia—and growth in western Canada, as well as our efforts to diversify into the non-residential sector.
In 2012, Canada accounted for approximately 55% of our urban land business, with approximately 45% of the work in the United States and some early activity on projects outside of North America, especially in Saudi Arabia. During the year, the housing market continued to grow in western Canada while activity remained stable in eastern Canada. In 2012, the US housing market showed positive signs of recovery. Indicators such as foreclosures and distressed mortgages were at lower levels, and in many regions, median home prices are increasing. In Florida, and to a certain extent in California, markets showed signs of improvement. For example, during 2012, we were awarded a project in Sarasota, Florida, to provide design services—from initial site planning through to the construction phase services for 600 to 800 units to be built on 500 acres (202 hectares) that were added to the existing Country Club East Golf Course Community in Lakewood Ranch.
In 2012, we continued to pursue and take advantage of opportunities in both the residential and non-residential markets in Canada and the United States, demonstrating our ability to provide a variety of services to different segments in the urban land-development market, such as the commercial, municipal, parks, brownfield development, and sports and recreation sectors. For example, in the fourth quarter, we undertook the design of a
MANAGEMENT’S DISCUSSION AND ANALYSIS
December 31, 2012
STANTEC INC.
M-26
new 50-hectare (125-acre) community and regional park in downtown Sydney, Nova Scotia, on a former contaminated site. It will now feature a park with prominent gateways, waterfront access, greenway multi-use paths, recreation fields, outdoor performance areas, an adventure playground, three pedestrian bridges, and nearly 40 hectares (100 acres) of recreated wildlife habitat. In 2012, we saw the market changing to include more medium- to high-density development and redevelopment projects in some of our regions; therefore, we are positioning our services to reflect this shift.
We believe that our Urban Land practice area unit will achieve moderate organic revenue growth in 2013. We anticipate the Canadian market will soften, with stable activity in the western provinces. In the US, we expect the housing markets to gradually strengthen yet remain cautious until consistently positive activity appears in the economy overall and in the residential sector. In 2013, we expect to continue leveraging our global expertise to win projects internationally. We continue to focus on our multidisciplinary team approach, diversify our client base, and position our business for improving economic conditions.
Gross Margin
For a definition of “gross margin,” refer to Definition of Additional IFRS Measures in the Critical Accounting Estimates, Developments, and Measures section of this report. Gross margin decreased to 55.0% in 2012 from 55.4% in 2011. Our gross margin for 2012 was within the anticipated range of 54.5 to 56.5% set out in our 2011 Financial Review. The decrease in our gross margin percentage was due to a decrease in the gross margins for the Industrial and Transportation practice area units, partly offset by increases in our Buildings, Environment, and Urban Land practice area units as further explained below.
The following table summarizes our gross margin percentages by practice area unit:
| Gross Margin by Practice Area Unit | 2012 | 2011 | ||||||
| ||||||||
Buildings | 54.5% | 54.2% | ||||||
Environment | 58.7% | 58.3% | ||||||
Industrial | 48.3% | 49.9% | ||||||
Transportation | 53.2% | 54.0% | ||||||
Urban Land | 59.4% | 59.3% | ||||||
| ||||||||
| Note: Comparative figures have been restated due to a realignment of several practice components between our Buildings, Industrial, Transportation, and Urban Land practice area units. | ||||||||
In general, fluctuations in the gross margin reported from year to year depend on the mix of projects in progress during any year and on our project execution. These fluctuations reflect the nature of our business model, which is based on diversifying our operations across geographic locations, practice area units, and all phases of the infrastructure and facilities project life cycle.
In the Industrial practice area unit, the impact of growth in this lower-margin practice negatively impacted our 2012 consolidated gross margin. Certain legacy client service agreements from acquisitions have significantly low contracted margins. We started to improve these margins as agreements were renewed. Also, as these projects are completed, the impact of these legacy projects will decrease.
In the Transportation practice area unit, the gross margin was impacted by increased competition in Canada, project execution that resulted in revisions made to estimated costs to complete, and ongoing pursuits for design-build and P3 projects. During the pursuit phase of these types of projects, we perform work for reduced margins,
MANAGEMENT’S DISCUSSION AND ANALYSIS
December 31, 2012
STANTEC INC.
M-27
which are subsequently increased if our team is successful in securing the project. We also increased our US revenue base in 2012 compared to 2011, thereby negatively impacting our 2012 consolidated gross margin because the margins in the United States tend to be lower than those secured on projects in Canada.
The following table summarizes our gross margin percentages by region:
| Gross Margin by Region | 2012 | 2011 | ||||||
| ||||||||
Canada | 55.8% | 56.8% | ||||||
United States | 54.0% | 53.6% | ||||||
International | 51.5% | 51.1% | ||||||
| ||||||||
The reduction in the gross margin in Canada was mainly caused by the impact of a growing Industrial practice area unit at lower gross margins and lower margins recognized on major projects in our Transportation practice area unit.
The lower gross margin experienced in the United States compared to Canada was principally due to the mix of projects in progress, the competitive environment in the United States, and the lower margins generally experienced in US government projects, especially in our Transportation practice area unit. Although slightly lower than in our Canadian business, our gross margins in the United States continue to increase.
The increase in gross margin in our International region was a result of our securing higher-margin projects during the year. However, the gross margin in our International region is low compared to Canada because our international region was impacted by lower margins in our Buildings practice area unit; a significant portion of our International revenue is earned in this practice.
Administrative and Marketing Expenses
Our administrative and marketing expenses increased by $68.0 million from 2011 to 2012. As a percentage of net revenue, our administrative and marketing expenses decreased from 41.0% in 2011 to 40.7% in 2012, which was better than our expected range of 41 to 43%.
Administrative and marketing expenses may fluctuate from year to year because of the amount of staff time charged to marketing and administrative labor, which is influenced by the mix of projects in progress and being pursued during the period, as well as by business development and acquisition integration activities. Our administrative and marketing expenses as a percentage of net revenue were lower in 2012 compared to 2011 resulting from our continued focus on managing our costs and operational efficiencies—despite completing seven acquisitions in 2012 compared to five in 2011. In particular, occupancy costs as a percentage of net revenue were lower in 2012 compared to 2011, partly because of a decrease in exit liabilities and losses on sublease agreements compared to 2011. As well, marketing and business development labor costs were lower due to additional costs incurred in 2011 to establish our client management program.
Depreciation of Property and Equipment
Depreciation remained at $27.9 million year over year. As a percentage of net revenue, depreciation of property and equipment decreased to 1.8% in 2012 compared to 2.0% in 2011. Our additions to property and equipment and to software of $44.6 million in 2012 were slightly above the expected range of $35 to $40 million established at the beginning of the year because we entered into three-year agreements for various software such as Microsoft and AutoCAD.
MANAGEMENT’S DISCUSSION AND ANALYSIS
December 31, 2012
STANTEC INC.
M-28
Goodwill
In accordance with our accounting policies as described in note 4 of our audited consolidated financial statements, we conduct a goodwill impairment test annually as at October 1 or more frequently if circumstances indicate that an impairment may occur or if a significant acquisition occurs between the annual impairment test date and December 31.
We allocate goodwill to our cash generating units (CGUs), which are also our operating segments. These CGUs are defined based on the smallest identifiable group of assets that generates cash inflows that are largely independent of cash inflows from other assets or groups of assets. Other factors are considered, including how management monitors the entity’s operations. We defined our CGUs as Canada, the United States, and International. As a Company, we are constantly evolving and continue to expand into different geographic locations. As we evolve, we regularly review our corporate and management structure to ensure our operations are organized into logical units, particularly for making operating decisions and assessing performance. If we determine our corporate and management structure should change, we accordingly review our definitions of CGUs and reportable segments. We do not allocate or monitor goodwill to our practice area units.
On October 1, 2012, we performed our annual goodwill impairment test. Based on the results of this test, we concluded that the recoverable amount of our CGUs exceeded their carrying amount and, therefore, goodwill was not impaired.
In 2011, we operated effectively and ended the year with solid results. We performed our annual goodwill impairment test as at October 1, 2011. Market fluctuations caused our share price to decrease as at October 1, 2011, which adversely impacted our market capitalization. In addition, because of challenging economic conditions, the short-term performance of our US and International CGUs was weaker than expected. Considering these factors and their impact on the results of our goodwill impairment test, we concluded that at October 1, 2011, our goodwill was impaired, and in the fourth quarter, we recorded a $90.0 million non-cash goodwill impairment charge to income. This charge was non-cash in nature; did not affect our liquidity, cash flows from operating activities, or debt covenants; and did not impact the operations of our business.
Valuation techniques
In performing our goodwill impairment test, we compare the recoverable amount of our CGUs to their respective carrying amounts. If the carrying amount of a CGU is higher than its recoverable amount, an impairment charge is recorded as a reduction in the carrying amount of the goodwill on the consolidated statement of financial position and recognized as a non-cash impairment charge in income. We estimate the recoverable amount by using the fair value less costs to sell approach. It estimates fair value using market information and discounted after-tax cash flow projections, which is known as the income approach. The income approach uses a CGU’s projection of estimated operating results and discounted cash flows based on a discounted rate that reflects current market conditions. We use cash flow projections from financial forecasts approved by senior management covering a five-year period. For our October 1, 2012, impairment test, we discounted our CGUs’ cash flows using after-tax discount rates ranging from 10.0 to 12.0% (October 1, 2011, 9.6 to 17.0%). To arrive at cash flow projections, we use estimates of economic and market information as described in Critical Accounting Estimates in the Critical Accounting Estimates, Developments, and Measures section of this report.
MANAGEMENT’S DISCUSSION AND ANALYSIS
December 31, 2012
STANTEC INC.
M-29
Sensitivity
The calculation of fair value less costs to sell for all of our CGUs is most sensitive to the following assumptions:
| — | Operating margins based on actual experience and management’s long-term projections. |
| — | Discount rates, reflecting investors’ expectations when discounting future cash flows to a present value, that take into consideration market rates of return, capital structure, company size, and industry risk. This rate is further adjusted to reflect risks specific to the CGU for which future estimates of cash flows have not been adjusted. |
| — | Growth rate estimates based on actual experience and market analysis. Projections are extrapolated beyond five years using a growth rate that typically does not exceed 3.0%. |
At October 1, 2012, the recoverable amount of our Canadian and US CGUs exceeded the carrying amount. Regarding the assessment of fair value less costs to sell, we believe that no reasonably possible change in any of the above key assumptions would have caused the carrying amount of the Canadian or US CGU to materially exceed its recoverable amount.
Intangible Assets
The timing of completed acquisitions, the size of acquisitions, and the type of intangible assets acquired impact the amount of amortization of intangible assets in a period. Client relationships are amortized over estimated useful lives ranging from 10 to 15 years, whereas contract backlog is usually amortized over an estimated useful life of 1 to 4 years. Consequently, the impact of the amortization of contract backlog can be significant in the 4 to 16 quarters following an acquisition. Backlog is a non-IFRS measure further discussed in Definition of Non-IFRS Measures in the Critical Accounting Estimates, Developments, and Measures section of this report. As at December 31, 2012, $5.9 million of the $85.7 million in intangible assets related to backlog. Also included in intangible assets are purchased and internally generated computer software that is replaceable and not an integral part of related hardware. This computer software is amortized over estimated useful lives ranging from 3 to 7 years.
The following table summarizes the amortization of identifiable intangible assets:
Amortization of Intangibles
| (In thousands of Canadian dollars) | 2012 | 2011 | ||||||
| ||||||||
Client relationships | 6,431 | 5,179 | ||||||
Backlog(note) | 6,296 | 6,209 | ||||||
Software | 6,986 | 5,898 | ||||||
Other | 1,346 | 2,158 | ||||||
Lease disadvantage | (1,051) | (1,049) | ||||||
| ||||||||
Total amortization of intangible assets | 20,008 | 18,395 | ||||||
| ||||||||
note: Backlog is further discussed in the Definitions Section of this report.
MANAGEMENT’S DISCUSSION AND ANALYSIS
December 31, 2012
STANTEC INC.
M-30
The $1.6 million increase between 2011 and 2012 in intangible assets amortization was mainly due to the amortization of client relationship balances of Caltech, FSC, ENTRAN, and Cimarron, along with an increase in the amortization of software as a result of commencing amortization on the upgrade to our enterprise management system, which was put into use in the first quarter of 2012. These increases were partly offset by a decrease in amortization in 2012 compared to 2011 for other items, such as the Burt Hill and Jacques Whitford trade names. During 2012, we added $35.4 million to intangible assets: $14.8 million was mainly a result of the addition of software for our enterprise management system and Microsoft software, and $20.6 million was a result of acquisitions, mainly from PHB, ABMB, and Cimarron.
In accordance with our accounting policies, we review intangible assets at each reporting period to determine whether there is an indication of impairment. An asset may be impaired if there is objective evidence of impairment as a result of one or more events that has occurred after the initial recognition of the asset and that event has an impact on the estimated future cash flows of the asset. In determining indicators of impairment of intangible assets, we consider external sources of information such as prevailing economic and market conditions. We also consider internal sources of information such as the historical and expected financial performance of the intangible assets. If an indication of impairment exists, the asset’s recoverable amount is estimated. If the carrying amount exceeds the recoverable amount (on a discounted basis), the asset value is written down to the recoverable amount. For further discussion of the methodology used in testing long-lived assets and intangibles for impairment, refer to Critical Accounting Estimates in the Critical Accounting Estimates, Developments, and Measures section of this report.
Based on our review of intangible assets at each reporting period in 2011 and 2012, there have been no indications of impairment.
Net Interest Expense
Our net interest expense decreased $1.0 million in 2012 compared to 2011 due to a lower long-term debt balance and a decrease in interest rates. At December 31, 2012, $204.9 million was outstanding on our revolving credit facility and senior secured notes compared to $207.5 million outstanding at December 31, 2011. As at December 31, 2012, $65.7 million of our credit facility was payable in US funds (US$66.0 million) and $15.0 million was payable in Canadian funds. Our average interest rate on our credit facility was 1.60% at December 31, 2012, compared to 2.65% at December 31, 2011. All of our $125 million in senior secured notes at December 31, 2012, are in Canadian funds. Our average interest rate on our secured notes is 4.52%. The nature of our revolving credit facility and senior secured notes is further described in Liquidity and Capital Resources section of this report.
Based on our credit facility balance at December 31, 2012, we estimate that a 0.5% increase in interest rates, with all other variables held constant, would decrease our net income by approximately $0.3 million for the year and decrease our basic earnings per share by approximately $0.01 for the year. A 0.5% decrease in interest rates would have an equal and opposite impact on our net income and basic earnings per share.
MANAGEMENT’S DISCUSSION AND ANALYSIS
December 31, 2012
STANTEC INC.
M-31
We have the flexibility to partly mitigate our exposure to interest rate changes by maintaining a mix of both fixed and floating rate debt. Our senior secured notes have fixed interest rates; therefore, interest rate fluctuations would have no impact on the senior secured notes’ interest payments.
Foreign Exchange Gains/Losses
We reported a foreign exchange loss of $0.2 million in 2012 compared to a $0.5 million loss in 2011. These foreign exchange losses arose from the translation of the foreign-denominated assets and liabilities held in our Canadian companies and in our non-US-based foreign subsidiaries. We minimize our exposure to foreign exchange fluctuations by matching US-dollar assets with US-dollar liabilities and, when appropriate, by entering into forward contracts to buy or sell US dollars in exchange for Canadian dollars. The foreign exchange losses in 2012 and 2011 were due to the volatility of daily foreign exchange rates and the timing of the recognition and relief of foreign-denominated assets and liabilities. As at December 31, 2012, we had no foreign-currency forward-contract agreements.
We estimate that because of a slight net exposure at December 31, 2012, a $0.01 increase or decrease in the US-dollar to Canadian-dollar exchange rate, with all other variables held constant, would have had an immaterial impact on our net income for the year.
Income Taxes
Our effective tax rate of 26.5% in 2012 remained the same as for the year ended December 31, 2011 (without the impact of the goodwill impairment charge of $90.0 million recorded in 2011). The effective tax rate of 26.5% meets the target of at or below 28.5% set out in our 2011 Financial Review.
Fourth Quarter Results
Our revenue growth in Q4 12 was strong compared to Q4 11. Gross revenue increased 12.0% to $483.9 million from $432.0 million, and our EBITDA increased 20.3% to $56.3 million from $46.8 million. Excluding the impact of a $90.0 million non-cash goodwill impairment charge in 2011, our net income increased 28.0% to $31.1 million from $24.3 million, and our diluted earnings per share increased 26.4% to $0.67 from $0.53, when comparing Q4 12 to Q4 11.
MANAGEMENT’S DISCUSSION AND ANALYSIS
December 31, 2012
STANTEC INC.
M-32
The following table summarizes our key operating results for Q4 12 on a percentage of net revenue basis and the percentage increase in the dollar amount of these results compared to the same period last year:
| Quarter Ended December 31 | % of Net Revenue | % Increase (Decrease)* | % Increase (Decrease)* without Goodwill Impairment | |||||||||||||||||||||
| (In millions of Canadian dollars, except %) | 2012 | 2011 | 2012 | 2011 | 2012 vs. 2011 | 2012 vs. 2011 | ||||||||||||||||||
| ||||||||||||||||||||||||
| Gross revenue** | 483.9 | 432.0 | 123.8% | 124.1% | 12.0% | 12.0% | ||||||||||||||||||
| Net revenue** | 390.8 | 348.2 | 100.0% | 100.0% | 12.2% | 12.2% | ||||||||||||||||||
| Direct payroll costs | 171.6 | 156.3 | 43.9% | 44.9% | 9.8% | 9.8% | ||||||||||||||||||
| Gross margin ** | 219.2 | 191.9 | 56.1% | 55.1% | 14.2% | 14.2% | ||||||||||||||||||
| Administrative and marketing expenses | 162.8 | 144.4 | 41.6% | 41.5% | 12.7% | 12.7% | ||||||||||||||||||
| Depreciation of property and equipment | 7.7 | 7.4 | 2.0% | 2.1% | 4.1% | 4.1% | ||||||||||||||||||
| Impairment of goodwill | - | 90.0 | 0.0% | 25.8% | (100.0%) | n/m | ||||||||||||||||||
| Amortization of intangible assets | 5.3 | 5.0 | 1.4% | 1.4% | 6.0% | 6.0% | ||||||||||||||||||
| Net interest expense | 1.8 | 2.2 | 0.4% | 0.6% | (18.2%) | (18.2%) | ||||||||||||||||||
| Other net finance expense | 0.6 | 0.7 | 0.2% | 0.3% | (14.3%) | (14.3%) | ||||||||||||||||||
| Share of income from associates | (0.6) | (0.4) | (0.1%) | (0.1%) | 50.0% | 50.0% | ||||||||||||||||||
| Foreign exchange loss | 0.1 | 0.4 | 0.0% | 0.1% | (75.0%) | (75.0%) | ||||||||||||||||||
| Other expense (income) | - | - | 0.0% | 0.0% | n/m | n/m | ||||||||||||||||||
| Income (loss) before income taxes | 41.5 | (57.8) | 10.6% | (16.6%) | 171.8% | 28.9% | ||||||||||||||||||
| Income taxes | 10.4 | 7.9 | 2.6% | 2.3% | 31.6% | 31.6% | ||||||||||||||||||
| Net income (loss) for the period | 31.1 | (65.7) | 8.0% | (18.9%) | 147.3% | 28.0% | ||||||||||||||||||
| ||||||||||||||||||||||||
* % increase (decrease) calculated based on the dollar change from the comparable period.
** The terms gross and net revenue and gross margin are discussed in the Definitions Section of this report.
n/m = not meaningful
Gross Revenue
| (In millions of Canadian dollars) | Q4 12 vs. Q4 11 | |||
| ||||
| Increase in gross revenue due to | ||||
Acquisition growth | 31.4 | |||
Organic growth | 26.0 | |||
Impact of foreign exchange rates on revenue earned by foreign subsidiaries | (5.5) | |||
| ||||
| Total net increase in gross revenue | 51.9 | |||
| ||||
During Q4 12, our gross revenue increased by $51.9 million, or 12.0% compared to the same period in 2011 as a result of the impact of acquisitions completed in 2011 and 2012, and organic revenue growth. The strengthening of the Canadian dollar had a negative impact on reported revenue in Q4 12 compared to Q4 11. During Q4 12, the average exchange rate for the Canadian dollar was at par with the US dollar, compared to US$0.98 during Q4 11.
MANAGEMENT’S DISCUSSION AND ANALYSIS
December 31, 2012
STANTEC INC.
M-33
The following tables summarize the change in gross revenue by region and by practice area unit in the fourth quarter of 2012 compared to the same period in 2011:
Gross Revenue by Region
| (In millions of Canadian dollars) | Quarter Ended Dec 31, 2012 | Quarter Ended Dec 31, 2011 | Total Change | Change Due to Acquisitions | Change Due to Organic Growth | Change Due to Foreign Exchange | ||||||||||||||||||
| ||||||||||||||||||||||||
Canada | 291.2 | 240.0 | 51.2 | 21.8 | 29.4 | n/a | ||||||||||||||||||
United States | 173.4 | 177.6 | (4.2) | 9.6 | (8.3) | (5.5) | ||||||||||||||||||
International | 19.3 | 14.4 | 4.9 | - | 4.9 | - | ||||||||||||||||||
| ||||||||||||||||||||||||
Total | 483.9 | 432.0 | 51.9 | 31.4 | 26.0 | (5.5) | ||||||||||||||||||
| ||||||||||||||||||||||||
n/a = not applicable
Gross Revenue by
Practice Area Unit
| (In millions of Canadian dollars) | Quarter Ended Dec 31, 2012 | Quarter Ended Dec 31, 2011 | Total Change | Change Due to Acquisitions | Change Due to Organic Growth | Change Due to Foreign Exchange | ||||||||||||||||||
| ||||||||||||||||||||||||
Buildings | 95.4 | 98.8 | (3.4) | 2.1 | (4.2) | (1.3) | ||||||||||||||||||
Environment | 164.9 | 156.7 | 8.2 | - | 10.4 | (2.2) | ||||||||||||||||||
Industrial | 109.8 | 78.3 | 31.5 | 19.8 | 12.1 | (0.4) | ||||||||||||||||||
Transportation | 62.7 | 48.8 | 13.9 | 9.5 | 5.4 | (1.0) | ||||||||||||||||||
Urban Land | 51.1 | 49.4 | 1.7 | - | 2.3 | (0.6) | ||||||||||||||||||
| ||||||||||||||||||||||||
Total Consulting Services | 483.9 | 432.0 | 51.9 | 31.4 | 26.0 | (5.5) | ||||||||||||||||||
| ||||||||||||||||||||||||
Note: Comparative figures have been restated due to a realignment of several practice components between our Buildings, Industrial, Transportation, and Urban Land practice area units.
Organic revenue growth in Q4 12 was positive in all practice area units except Buildings. The Buildings practice area unit decline occurred because of the softening in the Buildings market compared to Q4 11. The Buildings industry has experienced continued competition and pressure in funding of private and public sector clients, in particular in the healthcare sector. Our organic growth in Q4 12 compared to Q4 11 occurred mainly because of growth in our Environment and Industrial practice area units. In Environment, we are experiencing continued growth in the water sector and increased project activity from the oil and gas sector compared to Q4 11. As well, an increasing market share in Canada and the US West associated with new pipelines and liquefied natural gas (LNG) terminals has facilitated increased organic growth. Our Industrial practice area unit also continues to grow because of increased project activity from the oil and gas sectors; however, during Q4 12, we saw signs of a softening mining sector. As a result of commodity price pressures, mining projects may be delayed or postponed, particularly those in Canada that are tied to the price of nickel; however, we continue to work on large potash and copper projects and on regulatory and permitting activities.
MANAGEMENT’S DISCUSSION AND ANALYSIS
December 31, 2012
STANTEC INC.
M-34
Net income during Q4 12 was positively impacted by an increase in gross revenue and an increase in our gross margin as a percentage of net revenue from 55.1% in Q4 11 to 56.1% in Q4 12. Our gross margin increased quarter over quarter in all of our regions, resulting from an increase in our Buildings and Environment practice area units as summarized in the tables below:
| Quarter Ended Dec 31 | ||||||||
| Gross Margin by Region | 2012 | 2011 | ||||||
| ||||||||
Canada | 57.2% | 56.6% | ||||||
United States | 55.1% | 54.0% | ||||||
International | 46.6% | 42.7% | ||||||
| ||||||||
| Quarter Ended Dec 31 | ||||||||
| Gross Margin by Practice Area Unit | 2012 | 2011 | ||||||
| ||||||||
Buildings | 56.1% | 52.3% | ||||||
Environment | 60.6% | 58.3% | ||||||
Industrial | 48.8% | 49.5% | ||||||
Transportation | 55.5% | 55.7% | ||||||
Urban Land | 60.0% | 59.8% | ||||||
| ||||||||
| Note: Comparative figures have been restated due to a realignment of several practice components between our Buildings, Industrial, Transportation, and Urban Land practice area units. | ||||||||
Buildings gross margin in Q4 12 was higher than the gross margin for Q4 11 as a result of the mix of projects during the quarter and the Q4 11 adjustments made to estimated cost to complete on certain large projects. Environment’s gross margin increased in Q4 12 compared to Q4 11 because of the mix of projects during the quarter largely associated with projects relating to permitting, mining, and oil and gas facilities. The nature of our business model—based on diversifying operations across geographic regions, practice area units, and all phases of the infrastructure and facilities project life cycle—will continue to cause fluctuations in our gross margin percentage from period to period, depending on the mix of projects during any given quarter.
Our administrative and marketing expense in Q4 12 remained relatively stable at 41.6% compared to 41.5% in Q4 11, despite an increase in acquisition activity in Q4 12 compared to Q4 11, demonstrating our continued focus on managing costs. We completed four acquisitions in Q4 12 compared to two acquisitions in Q4 11. In the months following the completion of an acquisition, there is usually an increase in staff time charged to administration and marketing because of integration activities, including the orientation of newly acquired staff.
The comparison of net income in Q4 12 to Q4 11 was impacted by a $90 million non-cash goodwill impairment charge in Q4 11, as further described in Goodwill in the Results section of this report. In 2012, we conducted our annual goodwill impairment test as at October 1, 2012, and based on the results of this test, management concluded that goodwill was not impaired.
MANAGEMENT’S DISCUSSION AND ANALYSIS
December 31, 2012
STANTEC INC.
M-35
Quarterly Trends
The following is a summary of our quarterly operating results for the last two fiscal years, all prepared in accordance with IFRS:
Quarterly Unaudited Financial Information
| (In millions of Canadian dollars, except per share amounts) | ||||||||||||||||||||||||||||||||
| 2012 | 2011 | |||||||||||||||||||||||||||||||
|
| |||||||||||||||||||||||||||||||
| Dec 31 | Sep 30 | Jun 30 | Mar 31 | Dec 31 | Sep 30 | Jun 30 | Mar 31 | |||||||||||||||||||||||||
| ||||||||||||||||||||||||||||||||
Gross revenue | 483.9 | 483.7 | 476.2 | 439.1 | 432.0 | 430.4 | 412.3 | 408.7 | ||||||||||||||||||||||||
Net revenue | 390.8 | 398.1 | 396.6 | 370.9 | 348.2 | 351.2 | 342.3 | 336.8 | ||||||||||||||||||||||||
Net income (loss) | 31.1 | 34.1 | 30.8 | 24.9 | (65.7) | 28.9 | 25.7 | 23.8 | ||||||||||||||||||||||||
EPS – basic | 0.68 | 0.74 | 0.67 | 0.55 | (1.45) | 0.63 | 0.56 | 0.52 | ||||||||||||||||||||||||
EPS – diluted | 0.67 | 0.74 | 0.67 | 0.55 | (1.45) | 0.63 | 0.56 | 0.52 | ||||||||||||||||||||||||
| ||||||||||||||||||||||||||||||||
The quarterly earnings per share on a basic and diluted basis are not additive and may not equal the annual earnings per share reported. This is due to the effect of shares issued or repurchased during the year on the weighted average number of shares. Diluted earnings per share on a quarterly and annual basis are also affected by the change in the market price of our shares since we do not include in dilution options when exercise price is not in the money.
The following items impact the comparability of our quarterly results:
Gross Revenue
(In millions of Canadian dollars) | Q4 12 vs. Q4 11 | Q3 12 vs. Q3 11 | Q2 12 vs. Q2 11 | Q1 12 vs. Q1 11 | ||||||||||||
| ||||||||||||||||
Increase in gross revenue due to | ||||||||||||||||
Acquisition growth | 31.4 | 25.1 | 22.9 | 20.0 | ||||||||||||
Organic growth | 26.0 | 26.2 | 33.7 | 7.8 | ||||||||||||
Impact of foreign exchange rates on revenue earned by foreign subsidiaries | (5.5) | 2.0 | 7.3 | 2.6 | ||||||||||||
| ||||||||||||||||
Total net increase in gross revenue | 51.9 | 53.3 | 63.9 | 30.4 | ||||||||||||
| ||||||||||||||||
During Q1 12, net income increased by $1.1 million, or 4.6%, from the same period in 2011, and diluted earnings per share for Q1 12 increased by $0.03, or 5.8%, compared to Q1 11. Net income for Q1 12 was positively impacted by an increase in revenue due to acquisitions completed in 2011 and organic growth because of increased activity in the mining and oil and gas sectors, partly offset by a slower-than-anticipated economic recovery in the United States. Compared to Q1 11, organic growth occurred in our Industrial and Urban Land practice area units. Net income was negatively impacted by a reduction of gross margin as a percentage of net revenue from 55.8% in Q1 11 to 54.4% in Q1 12. This decrease occurred mainly in our Buildings and Industrial practice area units and resulted from lower margins being recognized on a number of major projects, continued softening of the healthcare market, and the impact of certain legacy projects from acquisitions that had significantly low contracted margins. As our Industrial practice grows organically, the impact of this growth in a lower-margin practice negatively impacts the consolidated gross margin. Our results were positively impacted by a reduction of our administrative and marketing expenses as a percentage of net revenue—from 42.2% in Q1 11 to 41.5% in Q1 12—due to our continued focus on managing our costs and operational efficiencies.
MANAGEMENT’S DISCUSSION AND ANALYSIS
December 31, 2012
STANTEC INC.
M-36
During Q2 12, net income increased by $5.1 million, or 19.8%, from the same period in 2011, and diluted earnings per share for Q2 12 increased by $0.11, or 19.6%, compared to Q2 11. Net income for Q2 12 was positively impacted by an increase in revenue resulting from acquisitions completed in 2011 and 2012 and organic growth spurred by increased activity in the mining, oil and gas, and urban land sectors. Compared to Q2 11, we reported organic growth in all our practice areas units with the exception of Buildings. Net income was negatively impacted by a reduction of gross margin as a percentage of net revenue from 55.1% in Q2 11 to 54.3% in Q2 12. This decrease occurred in all our practice area units except Urban Land, mainly because of the mix of projects in progress during the quarter, lower margins being recognized on a number of major projects, continued softening of the buildings market, and the impact of certain legacy projects from acquisitions that had significantly low contracted margins. As our Industrial practice grows organically, the impact of this growth in a lower-margin practice negatively impacts the consolidated gross margin. Our results were positively impacted by a reduction of our administrative and marketing expenses as a percentage of net revenue—from 40.4% in Q2 11 to 40.0% in Q2 12—due to our continued focus on managing our costs and operational efficiencies.
During Q3 12, net income increased by $5.2 million, or 18.0%, from the same period in 2011, and diluted earnings per share for Q3 12 increased by $0.11, or 17.5%, compared to Q3 11. Net income for Q3 was positively impacted by an increase in revenue resulting from acquisitions completed in 2011 and 2012, and organic revenue grew because of increased activity in the mining, oil and gas, and the urban development sectors. Compared to Q3 11, we reported organic growth in all of our practice area units with the exception of Transportation and Buildings. Net income was negatively impacted by a reduction of gross margin from 55.5% in Q3 11 to 55.0% in Q3 12. The decrease occurred in our Industrial, Transportation, and Urban Land practice area units, while Environment remained stable and Buildings increased. The decreases in gross margins occurred because of the mix of projects in progress during the quarter and the impact of certain legacy projects from acquisitions that had significantly low contracted margins. As our Industrial practice grows organically, the impact of this growth in a lower-margin practice negatively impacts the consolidated gross margin. Our results were positively impacted by an improvement in our administrative and marketing expenses as a percentage of net revenue—from 40.0% in Q3 11 to 39.7% in Q3 12—due to our continued focus on managing our costs and operational efficiencies.
Liquidity and Capital Resources
We are able to meet our liquidity needs through a variety of sources, including cash generated from operations, long- and short-term borrowings from our $350 million credit facility, senior secured notes, and the issuance of common shares. Our primary use of funds is for paying operational expenses, completing acquisitions, sustaining capital spending on property and equipment and software, repaying long-term debt, and paying dividend distributions to shareholders.
We believe that internally generated cash flows, supplemented by borrowings, if necessary, will be sufficient to cover our normal operating and capital expenditures. We also believe that the design of our business model, explained in the Core Business and Strategy section of this report, reduces the impact of changing market conditions on our operating cash flows. Consequently, we do not anticipate any immediate need to access additional capital through the sale of our equity. However, under certain favorable market conditions, we would consider issuing common shares to facilitate acquisition growth or to reduce borrowings under our credit facility.
We continue to limit our exposure to credit risk by placing our cash and cash equivalents in—and, when appropriate, by entering into derivative agreements with—high-quality credit institutions. Our investments held for self-insured liabilities include bonds and equities, and to some extent, we mitigate the risk associated with these bonds and equities through the overall quality and mix of our investment portfolio.
MANAGEMENT’S DISCUSSION AND ANALYSIS
December 31, 2012
STANTEC INC.
M-37
Working Capital
The following table represents summarized working capital information as at December 31, 2012, compared to December 31, 2011:
| (In millions of Canadian dollars, except ratio) | 2012 | 2011 | $ Change | |||||||||
| ||||||||||||
Current assets | 589.2 | 529.2 | 60.0 | |||||||||
Current liabilities | (345.2) | (327.5) | (17.7) | |||||||||
Working capital(note 1) | 244.0 | 201.7 | 42.3 | |||||||||
Current ratio(note 2) | 1.71 | 1.62 | n/a | |||||||||
| ||||||||||||
note 1: Working capital is calculated by subtracting current liabilities from current assets. Term is further discussed in the Definitions Section of this report.
note 2: Current ratio is calculated by dividing current assets by current liabilities. Term is further discussed in the Definitions Section of this report.
Current assets increased mainly due to a $61.9 million increase in trade and other receivables and unbilled revenue. This increase resulted from our acquisition and organic growth in the year. Despite our growth in the year, investment in trade and other receivables and unbilled revenue decreased from 92 days at December 31, 2011, to 91 days at December 31, 2012. In addition, current assets increased because of a $5.6 million increase in cash and cash equivalents and a $4.1 million increase in other financial assets mainly because of an increase in investments held for self-insurance. These increases were partly offset by a $13.0 million decrease in income taxes recoverable due to tax refunds received in the year.
Current liabilities increased primarily from a $24.2 million increase in trade and other payables due mainly to the accrual of dividends payable and higher payroll accruals from an increase in staff numbers. As well, billings in excess of costs increased by $11.4 million and other liabilities increased by $3.4 million. These increases were partly offset by a $16.7 million decrease in the current portion of long-term debt resulting from the payment of notes from acquisitions, a $3.4 million decrease in other financial liabilities mainly because of the payment of accrued interest on notes payable from acquisitions, and a $1.5 million decrease in the current portion of provisions.
Our current ratio increased to 1.71 in 2012 from 1.62 in 2011, mainly due to the increase in trade and other receivables and unbilled revenue, and due to the reduction in the current portion of long-term debt.
Cash Flows
Our cash flows from (used in) operating, investing, and financing activities, as reflected in our consolidated statements of cash flows, are summarized in the following table:
| (In millions of Canadian dollars) | 2012 | 2011 | $ Change | |||||||||
| ||||||||||||
Cash flows from operating activities | 180.5 | 114.6 | 65.9 | |||||||||
Cash flows used in investing activities | (143.3) | (99.4) | (43.9) | |||||||||
Cash flows used in financing activities | (31.3) | (41.9) | 10.6 | |||||||||
| ||||||||||||
MANAGEMENT’S DISCUSSION AND ANALYSIS
December 31, 2012
STANTEC INC.
M-38
Cash Flows from Operating Activities
Cash flows from operating activities are impacted by the timing of payroll and acquisitions—in particular, the timing of payments of acquired trade and other payables, including employee annual bonuses. The $65.9 million increase in cash flows from operating activities for 2012 compared to 2011 was a result of the following:
| — | Cash receipts from clients increased as a result of acquisitions and organic growth. |
| — | Interest paid was lower due to a lower long-term debt balance, in particular notes payable, throughout the year compared to 2011 and lower interest rates in the last three quarters of 2012 compared to 2011. |
| — | Income tax paid in 2012 was lower because of a reduction in tax installments and lower payments of tax balances acquired from acquisitions. |
The above was partly offset by an increase in cash paid to suppliers and an increase in cash paid to employees resulting from an increase in the number of employees and bonuses paid.
Cash Flows Used in Investing Activities
Cash flows used in investing activities increased by $43.9 million in 2012 compared to 2011, mainly resulting from an increase in cash used for business acquisitions and the payment of notes issued in connection with prior acquisitions. In 2012, we used $102.0 million in cash for business acquisitions and the payment of notes payable compared to $76.4 million in 2011. There was a $6.0 million increase in the purchase of intangible assets and property and equipment. Other changes included a $4.2 million increase in investments held for self-insured liabilities and an $8.6 million decrease in cash inflows from the disposition of investments and other assets.
As a professional services organization, we are not capital intensive. In the past, we have made capital expenditures primarily for items such as leasehold improvements, computer equipment, furniture, and other office and field equipment. Our cash outflows for property and equipment and software totaled $31.7 million in 2012 compared to $25.8 million in 2011. Factors contributing to this higher spending in 2012 were the purchase of AutoCAD software and an increase in spending for office furniture and equipment. Our capital expenditures during 2012 were financed by cash flows from operations. We expect our total capital and software expenditures in 2013 to be in the range of $50 to $60 million, excluding capital assets acquired from acquisitions. In 2013, we plan to continue to invest in enhancements to our business information systems to optimize and streamline our business processes and prepare for continued growth.
Cash Flows Used in Financing Activities
Cash flows used in financing activities decreased $10.6 million in 2012 compared to 2011, mainly due to a net decrease in cash outflows of $12.0 million from our revolving credit facility compared to the net outflow from our revolving credit facility and senior secured notes in 2011. In addition, there were no cash outflows for the repurchase of shares for cancellation under our normal course issuer bid in 2012, while in 2011 we had $11.1 million. In 2012, we also had a $7.3 million increase in additional cash inflow from the issuance of shares for employees exercising their share options.
The above decreases in cash flows used in financing activities were partly offset by a $20.6 million increase in cash outflows for our first three dividend payments, which were paid on April 17, 2012; July 19, 2012; and October 18, 2012.
MANAGEMENT’S DISCUSSION AND ANALYSIS
December 31, 2012
STANTEC INC.
M-39
Capital Structure
We manage our capital structure according to our internal guideline of maintaining a net debt to EBITDA ratio of less than 2.5. Our net debt to EBITDA ratio, a non-IFRS measure, is calculated as the sum of (1) long-term debt, including current portion, plus bank indebtedness, less cash and cash equivalents, divided by (2) EBITDA, calculated as income before income taxes plus net interest expense, amortization of intangible assets, depreciation of property and equipment, and goodwill and intangible impairment. At December 31, 2012, our net debt to EBITDA ratio was 1.17. Going forward, there may be occasions when we exceed our target by completing opportune acquisitions that increase our debt level above the target for a period of time.
During the year, we extended the maturity of our existing $350 million revolving credit facility to August 31, 2016, and reduced our rates of borrowing. This facility allowed us access to an additional $75 million under the same terms and conditions on approval from our lenders. During the year, the limit to these additional funds was increased from $75 million to $150 million. Our credit facility is available for acquisitions, working capital needs, and general corporate purposes. Depending on the form under which the credit facility is accessed, and certain financial covenant calculations, rates of interest may vary between Canadian prime, US base rate, LIBOR, or bankers’ acceptance rates, plus specified basis points. The specified basis points may vary, depending on our level of consolidated debt to EBITDA—from 20 to 245 for Canadian prime and US base rate loans and from 120 to 245 for bankers’ acceptances, LIBOR loans, and letters of credit. Prior to the extension, the basis points varied, depending on our level of consolidated debt to EBITDA—from 50 to 175 for Canadian prime and US base rate loans and from 150 to 275 for bankers’ acceptances, LIBOR loans, and letters of credit. At December 31, 2012, $263.5 million was available in the revolving credit facility for future activities.
On May 13, 2011, we issued $70 million of 4.332% senior secured notes due May 10, 2016, and $55 million of 4.757% senior secured notes due May 10, 2018. These amounts were recorded net of transaction costs of $1.1 million. The senior secured notes were issued pursuant to an indenture dated May 13, 2011, between Stantec Inc., as issuer, and BNY Trust Company of Canada, as trustee and collateral agent. The senior secured notes are ranked equally with our existing revolving credit facility. Interest on the senior secured notes is payable semi-annually in arrears on May 10 and November 10 each year. We may redeem the senior secured notes, in whole at any time or in part from time to time, at specified redemption prices and subject to certain conditions required by the indenture. The senior secured notes contain restrictive covenants. All of our assets are held as collateral under a general security agreement for the revolving credit facility and the senior secured notes.
We are subject to financial and operating covenants related to our credit facility and senior secured notes. Failure to meet the terms of one or more of these covenants may constitute a default, potentially resulting in accelerated repayment of our debt obligation. In particular, at each quarter-end, we must satisfy the following at any time: 1) our consolidated EBITDAR (earnings before interest, taxes, depreciation, amortization, and restructuring or rent costs) to debt service ratio must not be less than 1.25 to 1.0 for the revolving credit facility and senior secured notes and 2) our consolidated debt to EBITDA ratio must not exceed 2.5 to 1.0 for the revolving credit facility and 2.75 to 1.0 for the senior secured notes, except in the case of a material acquisition, when our consolidated debt to EBITDA ratio must not exceed 3.0 to 1.0 for the revolving credit facility and 3.25 to 1.0 for the senior secured notes for a period of two complete quarters following the acquisition. “EBITDA” and “EBITDAR to debt service ratio” are defined in Definition of Non-IFRS Measures in the Critical Accounting Estimates, Developments, and Measures section of this report. We were in compliance with all these covenants as at and throughout the period ended December 31, 2012.
In 2011, we amended our $350 million revolving credit facility to add a bid bond facility in the amount of $10 million. This facility also allows us to access an additional $5 million under the same terms and conditions
MANAGEMENT’S DISCUSSION AND ANALYSIS
December 31, 2012
STANTEC INC.
M-40
upon approval from our lenders. This facility may be used for the issuance of bid bonds, performance guarantees, letters of credit, and documentary credits in international currencies. At December 31, 2012, $2.0 million had been issued under this bid bond facility.
Shareholders’ Equity
Our shareholders’ equity increased by $100.1 million in 2012 and by $11.4 million in 2011. The following table summarizes the reasons for these increases:
| (In millions of Canadian dollars) | 2012 | 2011 | ||||||
| ||||||||
Beginning shareholders’ equity | 627.0 | 615.6 | ||||||
| ||||||||
Net income for the year | 120.9 | 12.7 | ||||||
Currency translation adjustments | (8.2) | 5.7 | ||||||
Unrealized gain (loss) on financial assets | 1.9 | (1.5) | ||||||
Recognition of fair value of share-based compensation | 2.8 | 2.7 | ||||||
Share options exercised for cash | 10.2 | 2.9 | ||||||
Shares repurchased under normal course issuer bid | - | (11.1) | ||||||
Dividends declared | (27.5) | - | ||||||
| ||||||||
Total change | 100.1 | 11.4 | ||||||
| ||||||||
Ending shareholders’ equity | 727.1 | 627.0 | ||||||
| ||||||||
During 2012, we recorded an $8.2 million foreign exchange loss in our currency translation adjustments in other comprehensive income compared to a $5.7 million gain in 2011. These unrealized gains and losses arose when translating our foreign operations into Canadian dollars. We do not hedge for this foreign exchange translation risk. The loss recorded during 2012 was a result of the strengthening of the Canadian dollar from US$0.98 at December 31, 2011, to US$1.01 at December 31, 2012. The gain recorded during 2011 was due to the weakening of the Canadian dollar from US$1.01 at December 31, 2010, to US$0.98 at December 31, 2011.
We hold investments for self-insured liabilities consisting of government and corporate bonds and equity securities. These investments are classified as available for sale and are stated at fair value with the unrecognized gain or loss recorded in other comprehensive income. The change in the fair value of these investments was a $1.9 million gain in 2012 and a $1.5 million loss in 2011.
Our board of directors grants share options as part of our incentive programs. In 2012, our board granted 375,500 (in 2011, 410,000) share options to various officers and employees of the Company. These options vest equally over a three-year period and have a contractual life of seven years from the grant date. Share options exercised in 2012 generated $10.2 million in cash compared to $2.9 million in 2011.
Our normal course issuer bid on the TSX was renewed in 2012, allowing us to repurchase up to 1,372,282 of our common shares during the period of June 1, 2012, to May 31, 2013. We continue to believe that from time to time the market price of our common shares does not fully reflect the value of our business or future business prospects and that at such times outstanding common shares are an attractive, an appropriate, and a desirable use of available Company funds. In 2012, we did not repurchase any common shares. In 2011, we repurchased 459,600 common shares at an average price of $24.09 per share for an aggregate price of $11.1 million.
MANAGEMENT’S DISCUSSION AND ANALYSIS
December 31, 2012
STANTEC INC.
M-41
Other
Outstanding Share Data
At December 31, 2012, there were 45,983,894 common shares and 1,475,823 share options outstanding. From December 31, 2012, to February 20, 2013, no shares were repurchased under our normal course issuer bid, no share options were granted, 57,097 share options were exercised, and 834 share options were forfeited. At February 20, 2013, there were 46,040,991 common shares and 1,417,892 share options outstanding.
Contractual Obligations
As part of our continuing operations, we enter into long-term contractual arrangements from time to time. The following table summarizes the contractual obligations due on our long-term debt, operating and finance lease commitments, purchase and service obligations, and other liabilities as of December 31, 2012:
| Contractual Obligations | Payment Due by Period | |||||||||||||||||||
| (In millions of Canadian dollars) | Total | Less than 1 Year | 1–3 Years | 4–5 Years | After 5 Years | |||||||||||||||
| ||||||||||||||||||||
Debt | 287.3 | 38.4 | 42.0 | 151.0 | 55.9 | |||||||||||||||
Interest on debt | 33.0 | 8.9 | 15.4 | 7.2 | 1.5 | |||||||||||||||
Operating leases | 513.9 | 93.2 | 162.1 | 122.9 | 135.7 | |||||||||||||||
Finance lease obligation | 12.8 | 4.7 | 8.0 | 0.1 | - | |||||||||||||||
Purchase and service obligations | 23.3 | 7.7 | 12.0 | 3.6 | - | |||||||||||||||
Other obligations | 12.0 | 2.4 | 2.0 | 0.1 | 7.5 | |||||||||||||||
| ||||||||||||||||||||
Total contractual obligations | 882.3 | 155.3 | 241.5 | 284.9 | 200.6 | |||||||||||||||
| ||||||||||||||||||||
For further information regarding the nature and repayment terms of our long-term debt and finance lease obligations, refer to Cash Flows Used in Financing Activities section in this report and notes 18 and 22 in our audited consolidated financial statements for the year ended December 31, 2012, incorporated by reference herein. Our operating lease commitments include obligations under office space rental agreements, and our purchase and service obligations include agreements to purchase future goods and services that are enforceable and legally binding. Our other obligations include amounts payable under our deferred share unit plan and restricted share unit plan and a commitment to purchase the non-controlling interests of The National Testing Laboratories Limited over a period ending in 2014. Failure to meet the terms of our operating lease commitments may constitute a default, potentially resulting in a lease termination payment, accelerated payments, or a penalty as detailed in each lease agreement.
Off-Balance Sheet Arrangements
As of December 31, 2012, we had off-balance sheet financial arrangements relating to letters of credit in the amount of $5.9 million that expire at various dates before January 2014. These letters of credit were issued in the normal course of operations, including the guarantee of certain office rental obligations. We also have a surety facility to enable, as part of the normal course of operations, the issuance of bonds for certain types of project work. As at December 31, 2012, $11.1 million in bonds was issued under this agreement. In addition, we have a bid bond facility that allows us to issue bid bonds, performance guarantees, letters of credit, and documentary credits in international currencies. At December 31, 2012, $2.0 million was issued under this bid bond facility.
MANAGEMENT’S DISCUSSION AND ANALYSIS
December 31, 2012
STANTEC INC.
M-42
During 2009, we issued a guarantee up to a maximum of US$60.0 million for project work with the US federal government. If the guarantee is exercised, we have recourse to our insurers, subject to certain deductibles, policy terms, and limits, to recover claims costs and damages arising from errors or omissions in professional services. At December 31, 2012, $155,000 of this guarantee had been exercised, but we have not made any payments under this guarantee, and no amounts have been accrued in our audited consolidated financial statements with respect to the guarantee. This guarantee will expire on July 15, 2014.
In the normal course of business, we also provide indemnifications and, in very limited circumstances, surety bonds. These are often standard contractual terms and are provided to counterparties in transactions such as purchase and sale contracts for assets or shares, service agreements, and leasing transactions. In addition, we indemnify our directors and officers against any and all claims or losses reasonably incurred in the performance of their service to the Company to the extent permitted by law. These indemnifications may require us to compensate the counterparty for costs incurred through various events. The terms of these indemnification agreements will vary based on the contract, the nature of which prevents us from making a reasonable estimate of the maximum potential amount that could be required to pay counterparties. Historically, we have not made any significant payments under such indemnifications, and no amounts have been accrued in our consolidated financial statements with respect to these guarantees.
Financial Instruments and Market Risk
Fair value.As at December 31, 2012, we value and record our financial instruments as follows:
| — | Cash and cash equivalents are classified as financial assets at fair value through profit and loss (FVPL) and are recorded at fair value, with realized and unrealized gains and losses reported in income. |
| — | Trade and other receivables are classified as receivables and are initially accounted for at fair value and subsequently adjusted for any allowance for doubtful accounts, with allowances reported in administrative and marketing expenses. |
| — | Investments held for self-insured liabilities, consisting of equity securities and bonds, are classified as financial assets available for sale and are recorded at fair value, with accumulated unrealized gains and losses reported in other comprehensive income until disposed of, at which time the realized gains and losses are recognized in income for equity securities and in net finance income for bonds. Interest income is recorded in finance income, and dividends are recorded in other income. |
| — | Trade and other payables are classified as other financial liabilities and are recorded at fair value and subsequently recorded at amortized cost using the effective interest rate method (EIR), with realized gains and losses reported in income. The EIR method discounts estimated future cash payments or receipts through the expected life of a financial instrument, thereby calculating the amortized cost and subsequently allocating the interest income or expense over the life of the instrument. |
| — | Long-term debts, including non-interest-bearing debts, are classified as loans and borrowings and are initially recorded at fair value and subsequently recorded at amortized cost using the EIR method, with the EIR amortization and realized gains and losses reported in finance costs. |
All financial assets are recognized initially at fair value plus directly attributable transaction costs, except for financial assets at FVPL, for which transaction costs are expensed. Purchases or sales of financial assets are accounted for at trade dates. All financial liabilities are recognized initially at fair value and, in the case of loans and borrowings, net of directly attributable transaction costs.
MANAGEMENT’S DISCUSSION AND ANALYSIS
December 31, 2012
STANTEC INC.
M-43
Subsequent to initial recognition, the fair values of financial instruments are based on the bid prices in quoted active markets for financial assets and on the ask prices for financial liabilities. For financial instruments not traded in an active market, the fair value is determined using appropriate valuation techniques. Such techniques may include recent arm’s-length market transactions, reference to the current fair value of another instrument that is substantially the same, discounted cash flow analysis, or other valuation models. The fair values of cash and cash equivalents, trade and other receivables, and trade and other payables approximate their carrying amounts because of the short-term maturity of these instruments. The carrying amount of bank loans approximates their fair value because the applicable interest rate is based on variable reference rates. The carrying amounts of other financial assets and financial liabilities approximate their fair values.
Market risk.We are exposed to various market factors that can affect our performance, primarily with respect to currency and interest rates.
Currency. Our currency exchange rate risk results primarily from the following three factors:
| — | A significant portion of our revenue and expenses is generated or incurred in US dollars; therefore, we are exposed to fluctuations in exchange rates. To the extent that US-dollar revenues are greater than US-dollar expenses in a strengthening US-dollar environment, we expect to see a positive impact on our income from operations. Conversely, to the extent that US-dollar revenues are greater than US-dollar expenses in a weakening US-dollar environment, we expect to see a negative impact. This exchange rate risk primarily reflects, on an annual basis, the impact of fluctuating exchange rates on the net difference between total US-dollar professional revenue and US-dollar expenses. Other exchange rate risk arises from the revenue and expenses generated or incurred by subsidiaries located outside Canada and the United States. Our income from operations will be impacted by exchange rate fluctuations used in translating these revenues and expenses. We do not hedge for this foreign exchange translation risk. |
| — | Foreign exchange fluctuations may also arise on the translation of the balance sheet of (net investment in) our US-based subsidiaries or other foreign subsidiaries where the functional currency is different from the Canadian dollar, and are recorded in other comprehensive income. We do not hedge for this foreign exchange translation risk. |
| — | Foreign exchange gains or losses arise on the translation of foreign-denominated assets and liabilities (such as accounts receivable, accounts payable and accrued liabilities, and long-term debt) held in our Canadian operations and non-US-based foreign subsidiaries. We minimize our exposure to foreign exchange fluctuations on these items by matching US-dollar assets with US-dollar liabilities and, when appropriate, by entering into forward contracts to buy or sell US dollars in exchange for Canadian dollars. |
Although we may buy or sell US dollars in exchange for Canadian dollars in accordance with our foreign exchange risk mitigation strategy, on occasion we may have a net exposure to foreign exchange fluctuations because of the timing of the recognition and relief of foreign-denominated assets and liabilities. At December 31, 2012, due to a slight net exposure, a $0.01 increase or decrease in the exchange rates, with all other variables held constant, would have had an immaterial impact on our net income for the year.
Interest Rate.Changes in interest rates also present a risk to our performance. Our revolving credit facility carries a floating rate of interest. In addition, we are subject to interest rate pricing risk to the extent that our investments held for self-insured liabilities contain fixed-rate government and corporate bonds. We estimate that, based on our loan balance at December 31, 2012, a 0.5% increase in interest rates, with all other variables held constant, would have impacted our basic earnings per share by approximately $0.01 for the year.
MANAGEMENT’S DISCUSSION AND ANALYSIS
December 31, 2012
STANTEC INC.
M-44
We have the flexibility to partly mitigate our exposure to interest rate changes by maintaining a mix of both fixed and floating debt. Our $125 million in senior secured notes have fixed interest rates until they are due—$70 million at 4.332% due on May 10, 2016, and $55 million at 4.757% due on May 10, 2018. Since these have fixed rates, interest rate fluctuations would have no impact on the senior secured notes interest payments.
Related-Party Transactions
We have subsidiaries that are 100% owned and are consolidated in our financial statements. We also have management agreements in place with several special purpose entities to provide various services, including architecture, engineering, planning, and project management. These management agreements provide us with control over the management and operation of these entities. We also receive a management fee generally equal to the net income of the entities and have an obligation regarding their liabilities and losses. Based on these facts and circumstances, management has concluded that we control these entities and, therefore, has consolidated them in our consolidated financial statements. Transactions among subsidiaries and special purpose entities are entered into in the normal course of business and on an arm��s-length basis. Using the consolidated method of accounting, all intercompany balances are eliminated in full.
From time to time, we enter into transactions with associated companies and joint ventures. These transactions involve providing or receiving services and are entered into in the normal course of business and on an arm’s-length basis. Associated companies are entities over which we are able to exercise significant influence but not control. We use the equity method of accounting for our associated companies. Total sales to our associates were $15.6 million during 2012. Distributions paid by our associates were $0.6 million in 2012. At December 31, 2012, receivables from our associates were $3.1 million.
Joint ventures are accounted for using the proportionate consolidation method, which results in recording our pro rata share of the assets, liabilities, revenues, and expenses of each entity. Total sales to our joint ventures were $28.0 million during 2012. Distributions paid by our joint ventures during 2012 were $93,000. At December 31, 2012, receivables from our joint ventures were $3.9 million.
Key management personnel have authority and responsibility for planning, directing, and controlling the activities of our Company and include our chief executive officer, chief financial officer, chief operating officer, and senior vice presidents. Total compensation to key management personnel and directors recognized as an expense during 2012 was $13.9 million (2011-$11.4 million).
From time to time, we guarantee the obligations of subsidiaries or special purpose entities regarding lease agreements. In addition, from time to time, we guarantee subsidiaries or special purpose entities obligations to a third party pursuant to an acquisition agreement. Transactions with subsidiaries, special purpose entities, associated companies, and joint ventures are further described in notes 13, 14, and 32 of our 2012 audited consolidated financial statements and are incorporated by reference herein.
MANAGEMENT’S DISCUSSION AND ANALYSIS
December 31, 2012
STANTEC INC.
M-45
OUTLOOK
The following table summarizes our expectations for the coming year:
| Measure | Target Range | |
| ||
| Gross margin as % of net revenue | Between 54.5 and 56.5% | |
| Administrative and marketing expenses as % of net revenue | Between 41 and 43% | |
| Net income as % of net revenue | At or above 6% | |
| Effective income tax rate | At or below 28.5% | |
| Return on equity(note 1) | At or above 14% | |
| Net debt to EBITDA(note 2) | Below 2.5 | |
| ||
note 1: Return on equity is calculated as net income for the year divided by average shareholders’ equity over each of the last four quarters.
note 2: Net debt to EBITDA ratio is calculated as the sum of (1) long-term debt, including current portion, plus bank indebtedness, less cash and cash held in escrow, divided by (2) EBITDA, which is calculated as income before income taxes plus net interest expense, amortization of intangible assets, depreciation of property and equipment, and goodwill and intangible impairment. Net debt to EBITDA is a non-IFRS measure and is discussed in the Definitions Section of this report.
Overall, fluctuations in our actual performance occur because of the particular client and project mix achieved and the number of acquisitions completed in a year. Some targets, such as net debt to EBITDA, could be impacted and potentially exceeded by completing an opportune larger acquisition that increases our debt level above our target for a period of time.
The infrastructure and facilities market is diverse, consisting of many sectors and industries in both the public and private sectors. Clients within this market require services from multiple disciplines and areas of expertise for projects of varying complexities across the project life cycle. In North America, our principal area of operation, the addressable market is approximately US$95 billion based on design-related revenue; our market share is approximately 2%. Market size is affected by capital spending plans of private sector clients, by government allocations to infrastructure, and by the varying prevalence of alternative delivery models. Additionally, our footprint in the Caribbean, Latin America, India, the Middle East, and the United Kingdom is gradually expanding our market reach internationally.
In 2013, we expect the overall outlook for professional services in our key sectors in North America to gradually improve with more strength in the second half of the year, particularly in the United States as we continue to build a top-tier position. In addition, we expect that alternative project deliveries, including P3s, will continue to be strong in Canada and will present emerging opportunities in the US market. Our overall outlook for our International operations is moderate growth as we continue to build our experience and presence. We base our overall outlook on a variety of factors, including the material factors described below.
Canada
We believe that our Canadian operations will achieve moderate organic revenue growth in 2013. Economic conditions in Canada are strong with the economy faring well through the slow global economic recovery. However, the threat of a slowing housing market, sustained weakness in the United States, and global economic uncertainty pose significant risks to the Canadian economic outlook.
On the private side, resurgence of activity in the energy sector is primarily due to commodity prices remaining at relatively high historic levels. This has a positive spillover impact on other sectors, such as urban development, but has also prompted large international competitors to enter the Canadian marketplace. Considering the cost
MANAGEMENT’S DISCUSSION AND ANALYSIS
December 31, 2012
STANTEC INC.
M-46
pressure and labor constraints in particular disciplines, this may not prove to be a sustainable pace for developing the energy and resource sectors over the long term. Recently, the slowdown of the global economy and some emerging economic activity have also caused fluctuations in commodity prices.
On the public side, the fiscal situation of the federal and most provincial governments limits the likelihood of significant increases in public infrastructure funding in 2013. P3 activity has been stable; however, fewer projects are expected in 2013. We anticipate that a constrained public spending environment will persist.
Overall, real GDP is projected to grow 2.0% in 2013, according to the Bank of Canada. The following factors are evidence for our Canadian outlook in areas that directly impact infrastructure spending:
| — | Real GDP is expected to rebound in Canada with demand from private business increasing and government funding essentially flat. At present, most economic indicators remain mixed, leaving some risk of decline, especially if global conditions worsen. |
| — | The Bank of Canada overnight rate target is currently at 1.0% and is expected to remain steady. |
| — | The price depreciation in metals in the recent past contributes to the World Bank expectations that metal prices will increase marginally in 2013 from the low baselines in 2012. For energy prices, the Energy Information Administration projects a moderate decrease in 2013 due to an increasing global supply of crude oil, particularly from North America. Increasing supply in North America, along with relatively stable energy prices, suggests that capital expenditure by energy firms will continue in North America, while weakness in metals prices suggests that large capital projects for mining firms may slow as firms manage spending in accordance with market risk. |
| — | The fiscal positions of federal and provincial governments have forced a rebalancing of budgets. A review of priorities in some jurisdictions and general constraints on spending are likely to affect investment in public infrastructure, though both the impact and timing remain uncertain. |
| — | The Canadian dollar is expected to remain strong. The Bank of Canada estimates a Canada/US exchange rate average of $1.01, a slight increase from the average exchange rate of par we experienced in 2012. |
| — | The public continues to be conscious of environmental issues, and governments continue to discuss climate change, although little movement is expected in the regulatory realm while economic issues remain in focus over the short term. Still, increased awareness has numerous impacts, including interest in responsible resource development, pursuit of sustainable design, improvement of water distribution and treatment, and reduction of the ecological footprint from industrial activity. |
| — | Canada’s resource-based economy and its limited political risk are attracting the attention of many US and international competitors. This increases competitive pressure, especially in the P3 market, and this pressure is expected to continue in 2013. |
| — | According to the Bank of Canada, a slowdown in housing activity is predicted as rising household debt ratios are expected to pull the market down from historically high levels. The Canadian Mortgage and Housing Corporation suggests that housing starts will moderate in 2013 to 193,600 in total versus 213,700 in 2012, primarily caused by a decline in multi-family starts. Single-detached starts are forecasted to be stable, as supported by low interest rates and an improving employment situation. |
United States
We believe that our US operations will achieve stable to moderate organic revenue growth in 2013. Overall, sluggish employment growth, the slow-moving housing recovery, and weak federal, state, and municipal balance sheets and budgets are expected to continue to act as a drag on spending and economic expansion. While
MANAGEMENT’S DISCUSSION AND ANALYSIS
December 31, 2012
STANTEC INC.
M-47
growth is anticipated to remain low over the near term, supportive monetary policy and elevated levels of private sector spending should act to support a more optimistic US economic outlook in 2013 over that of 2012. On an additional positive note, alternative project delivery is emerging as a possible solution to US infrastructure funding issues. We expect to be well positioned to transfer our Canadian experience into the much larger US market. The timing for this opportunity, including adequate process transparency and a sufficient pipeline of projects, remains uncertain.
The United States remains a very large market and we expect our performance to improve gradually throughout the course of 2013. The Congressional Budget Office projects real GDP growth of 1.4% in 2013. The following factors related to infrastructure support this outlook:
| — | Housing activity in the United States is expected to increase in 2013 with the seasonally adjusted annual rate recovering to 932,000 from 744,000 in 2012. In recent months, the architectural billings index from the American Institute of Architects has shifted positively and has reported above 50.0 for over six consecutive months, suggesting improved demand for design services. |
| — | According to the Congressional Budget Office, the US deficit will remain slightly below 10% of GDP in 2013. At the US federal level, adjustments to rebalance the budget and develop a sustainable long-term plan for the deficit and debt may negatively impact public infrastructure spending. States and municipalities experiencing budget pressures are also seeking solutions, which may affect the infrastructure market through increased use of alternative project deliveries. |
| — | A continuing weak US dollar may impact the balance of trade and deficit; however, if economic recovery ensues as predicted, a rising US dollar value may further increase spending pressures. |
| — | The presidential election in late 2012 created the opportunity for more certainty in specific areas of infrastructure, such as those related to the healthcare bill where increased use of healthcare services by newly insured Americans is likely to create the need for rehabilitation or construction of healthcare-related infrastructure. However, the election also created some legislative uncertainty, for example, relating to the rollout of environmental priorities and resource development. In these areas, governmental priorities and regulation have yet to emerge and will affect opportunities in 2013. |
| — | The two-year transportation legislation passed last year creates some predictability for planned transportation projects in 2013, although a long-term sustainable transportation strategy is still required. |
| — | Environmental issues continue to be an area of focus, with key industrial projects receiving strong public attention. Regulatory and permitting changes for the energy industry will continue and will influence environmental compliance and monitoring. The current political focus on the general economy in the short term means that major changes, such as climate change regulation, are unlikely in 2013. This creates stability in some previously stalled sectors and delays opportunity in other sectors. |
| — | Strong energy prices and the build-out toward energy independence mean that the shale gas industry is likely to continue growing in 2013, particularly in liquids-rich areas. This offers possibilities for organically growing our business, especially in environmental services, site infrastructure design, transmission, and water treatment, although this busy market ensures our competitors are striving to do the same. |
International
We believe that our International operations will achieve moderate organic revenue growth in 2013. These operations currently comprise a small percentage of our business, with the majority falling within our Buildings practice area unit. We are also active in the mining and urban development sectors outside North America. We
MANAGEMENT’S DISCUSSION AND ANALYSIS
December 31, 2012
STANTEC INC.
M-48
anticipate that growth in the mining sector may fluctuate as a result of the cyclical nature of this business. To offset this trend, we expect to leverage our sectors of global expertise, such as healthcare, water, and urban development, into geographic areas where we currently have a developing presence. The following factors support this outlook:
| — | Public and private sector spending has been impacted globally by the economic slowdown. Strength in emerging markets is moderating and a majority of developed economies are sorting out structural reforms. |
| — | For 2013, the World Bank forecasts GDP growth of 6.1% for India, 3.4% for the Middle East, 3.5% for Latin America and Caribbean regions, and -0.1% for the Euro area. |
Overall Outlook
We believe that our overall outlook for 2013 is a moderate increase in organic revenue, with a targeted 3.0 to 4.0% increase compared to 2012, focused in regions and sectors where we are a top-tier service provider. The economic environment has been slowly improving, although negative pressures, such as increased competition, margin compression, project delays, and fiscal rebalancing, are lingering. Because of the diversity of our operations, the mix of our clients, and the flexibility of our organization, we believe that we will continue to operate our business efficiently, to adapt our business to changing economic conditions, and to position ourselves for growth in a very large infrastructure and facilities market.
The 2013 outlook for both our Buildings and Transportation practice area units is stable, the outlook for our Industrial practice area unit is stable to moderate organic growth, and the outlook for both our Environment and Urban Land practice area units is moderate organic growth, compared to 2012. Further discussion on the outlooks for each of our practice area units for 2013 can be found in Gross and Net Revenue in the Results section of this report.
Going forward, we are targeting a long-term average annual compound growth rate for gross revenue of 15%, a target we have met or exceeded since our initial public offering in 1994. Continued growth allows us to enhance the depth of our expertise and to broaden our service offerings, provide expanded opportunities for our employees, and leverage our integrated enterprise systems. Further maximizing the critical mass and maturity we have achieved in certain practice areas and geographic locations also enables us to increase our business with key clients and sell our services across local markets. Our ability to expand 15% annually depends on our strategic efforts to grow organically and the availability of acquisition opportunities. We do not expect to encounter constraints in locating available acquisition candidates, given our past success and the consolidation trend in our industry, where smaller firms desire to join larger, more stable organizations. At any particular time, we are engaged in discussions with many firms. Since it is important to find an appropriate cultural fit and complementary services that can provide an accretive transaction, the acquisition process can extend over months or even years.
In establishing our budgets for 2013, we assumed that compared to the US dollar the Canadian dollar would remain stable throughout the year. As well, we assumed that the average interest rate would remain relatively stable in 2013 compared to 2012. To establish our effective income tax rate, we considered the tax rates substantially enacted at December 31, 2012, for the countries in which we operate, primarily Canada and the United States. We expect to support our targeted level of growth using a combination of cash flows from operations and borrowings. Under certain market conditions, we will also consider issuing common shares.
MANAGEMENT’S DISCUSSION AND ANALYSIS
December 31, 2012
STANTEC INC.
M-49
CRITICAL ACCOUNTING ESTIMATES, DEVELOPMENTS, AND MEASURES
Critical Accounting Estimates
Our consolidated financial statements are prepared in accordance with IFRS, which require us to make various judgments, estimates, and assumptions. The notes to our December 31, 2012, consolidated financial statements outline our significant accounting estimates. The accounting estimates discussed below are considered particularly important because they require the most difficult, subjective, and complex management judgments. However, because of the uncertainties inherent in making assumptions and estimates regarding unknown future outcomes, future events may result in significant differences between estimates and actual results. We believe that each of our assumptions and estimates is appropriate to the circumstances and represents the most likely future outcome.
Unless otherwise specified in our discussion of specific critical accounting estimates, we expect no material changes in overall financial performance and financial statement line items to arise, either from reasonably likely changes in material assumptions underlying an estimate, or within a valid range of estimates from which the recorded estimate was selected. In addition, we are not aware of trends, commitments, events, or uncertainties that can reasonably be expected to materially affect the methodology or assumptions associated with our critical accounting estimates, subject to items identified in the Cautionary Note Regarding Forward-Looking Statements and Risk Factors sections of this report.
Revenue and Cost Recognition Estimates on Contracts.We account for our revenue in accordance with IAS 11, “Construction Contracts,” which requires estimates to be made for contract costs and revenues. Revenue from fixed-fee and variable-fee-with-ceiling contracts is recognized using the percentage of completion method based on the ratio of labor costs incurred to total estimated labor costs. Estimating total direct labor costs is subjective and requires the use of management’s best judgments based on the information available at that time. We also provide for estimated losses on incomplete contracts in the period in which such losses are determined. Changes in the estimates are reflected in the period in which they are made and would affect our revenue and unbilled revenue.
Allowance for Doubtful Accounts.We maintain an allowance for doubtful accounts for estimated losses resulting from the inability to collect on our trade receivables. To arrive at our allowance for doubtful accounts, we use estimates that are based on the age of the outstanding receivables and on our historical collection and loss experience. Future collections of receivables that differ from our current estimates would affect the results of our operations in future periods and our trade receivables and administrative and marketing expenses.
Provision for Self-Insured Liabilities.We self-insure certain risks, including professional liability and automobile liability. The accrual for self-insured liabilities includes estimates of the costs of reported claims and is based on estimates of loss using management’s assumptions, including consideration of actuarial projections. These estimates of loss are derived from loss history that is then subjected to actuarial techniques in the determination of the proposed liability. Estimates of loss may vary from those used in the actuarial projections and may result in a larger loss than estimated. Any increase in loss would be recognized in the period in which the loss is determined and would increase our self-insured liability and reported expenses.
Share-Based Payment Transactions.We measure the cost of share-based payment transactions by reference to the fair value of the equity instruments at the date at which they are granted. Estimating fair value for share-based payment transactions requires determining the most appropriate valuation model, which is dependent on the terms and conditions of the grant. We have chosen the Black-Scholes option-pricing model for equity-settled and cash-settled share-based payment transactions. This estimate also requires determining and making
MANAGEMENT’S DISCUSSION AND ANALYSIS
December 31, 2012
STANTEC INC.
M-50
assumptions about the most appropriate inputs to the valuation model, including volatility in the price of our shares, risk-free interest rate, and expected hold period to exercise. The expected volatility is based on the historical volatility of our shares over a period commensurate with the expected term of the share option. The risk-free interest rate for the expected life of the options is based on the yield available on government bonds, with an approximate equivalent remaining term at the time of the grant. Historical data is used to estimate the expected life of the option. We also estimate our forfeiture rate for equity-settled transactions based on historical experience in order to determine the compensation expense arising from the share-based awards. Changes to the estimates are reflected in the period in which they are made and would affect our administrative and marketing expense, share capital, contributed surplus, and other liabilities. During 2012, we issued share options, deferred share units, and restricted share units.
Business Combinations.In a business combination, we may acquire the assets and assume certain liabilities of an acquired entity. The estimate of fair values for these transactions involves judgment in determining the fair values assigned to the tangible and intangible assets (i.e., backlog, client relationships, and favorable and unfavorable leases) acquired and the liabilities assumed on the acquisition. The determination of these fair values involves a variety of assumptions including revenue growth rates, expected operating income, discount rates, and earning multiples. If our estimates or assumptions change prior to finalizing the fair value of assets acquired and liabilities assumed for a transaction, a revision to fair values may impact our net income in future periods. We are currently in the process of finalizing the fair value of assets acquired and liabilities assumed for PHB, ABMB, Cimarron, C3TS, Architecture 2000 Inc., G&O, and LSM acquisitions.
Impairment of Non-Financial Assets. On October 1 of each year, we conduct our annual goodwill impairment test. We conduct the test more frequently if circumstances indicate that an impairment may occur or if a significant acquisition occurs between the annual impairment date and December 31. We review our intangible assets at each reporting period to determine if there is an indication of impairment. If an indication exists, the recoverable amount is estimated and compared to the carrying amount.
The methodology we use to test for goodwill and intangible impairment includes significant judgments, estimates, and assumptions. Impairment exists when the carrying amount of an asset, CGU, or group of CGUs exceeds its recoverable amount, which is the higher of its fair value less costs to sell and its value in use. Fair value less costs to sell is based on available data from binding sales transactions in an arm’s-length transaction of similar assets or observable market prices less incremental costs for disposing of the asset. In the absence of such data, other valuation techniques can be used to estimate fair value less costs to sell. The value in use calculation is based on a discounted cash flow model. The cash flows are derived from budgets over an appropriate number of years and do not include restructuring activities that we are not yet committed to or significant future investments that will enhance the asset’s performance of the CGU or group of CGUs being tested. The recoverable amount, when based on a discount cash flow methodology, is most sensitive to the discount rate used as well as the expected future cash inflows and the growth rate used for extrapolation purposes. To arrive at cash flow projections, we use estimates of economic and market information over the projection period, including growth rates in revenues, estimates of future expected changes in operating margins, and cash expenditures. Other significant estimates and assumptions include future estimates of capital expenditures and changes in future working capital requirements. We believe that our methodology provides us with a reasonable basis for determining whether an impairment charge should be taken. Note 11 in our 2012 audited consolidated financial statements, which provides more detail about our goodwill impairment test, is incorporated by reference.
We performed our annual goodwill impairment test as at October 1, 2012. Based on the results of the test, management concluded that the recoverable amount of its CGUs exceeded their carrying amount and, therefore, goodwill was not impaired.
MANAGEMENT’S DISCUSSION AND ANALYSIS
December 31, 2012
STANTEC INC.
M-51
If market and economic conditions deteriorate or if volatility in the financial markets causes declines in our share price, increases our weighted-average cost of capital, or changes valuation multiples or other inputs to our goodwill assessment, our goodwill may require testing for impairment between our annual testing periods. In addition, it is possible that changes in the numerous variables associated with the judgments, assumptions, and estimates we made in assessing the fair value of our goodwill could cause our CGUs to be impaired. These impairments are non-cash charges that could have a material adverse effect on our consolidated financial statements but would not have any adverse effect on our liquidity, cash flows from operating activities, or debt covenants and would not have an impact on future operations.
Fair Value of Financial Instruments.Where the fair value of financial assets and financial liabilities recorded in the consolidated statements of financial position cannot be derived from active markets, it is determined using valuation techniques, including the discounted cash flow model. The inputs to these models are taken from observable markets, where possible, but where this is not feasible, judgments are required in establishing fair values. The judgments include considerations of inputs such as liquidity risk, credit risk, and volatility. Changes in assumptions about these factors could affect the reported fair value of financial instruments and reported expenses and income.
Taxes.Uncertainties exist with respect to the interpretation of complex tax regulations and the amount and timing of deferred taxable income. Our income tax assets and liabilities are based on interpretations of income tax legislation across various jurisdictions in Canada, the United States, and internationally. Our effective tax rate can change from year to year based on the mix of income among different jurisdictions, changes in tax laws in these jurisdictions, and changes in the estimated value of deferred tax assets and liabilities. Our income tax expense reflects an estimate of the cash taxes we expect to pay for the current year and a provision for changes arising in the values of deferred tax assets and liabilities during the year. The tax value of these assets and liabilities is impacted by factors such as accounting estimates inherent in these balances, our expectations about future operating results, and previous tax audits and differing interpretations of tax regulations by the taxable entity and the responsible tax authorities. Such differences in interpretation may arise on a wide variety of issues depending on the conditions prevailing in the respective legal entity’s domicile. On a regular basis, we assess the likelihood of recovering value from deferred tax assets, such as loss carryforwards, as well as from the deferred tax depreciation of capital assets, and we adjust the tax provision accordingly.
Deferred tax assets are recognized for all unused tax losses to the extent that it is probable that taxable profit will be available against which the losses can be used. Significant management judgment is required to determine the amount of deferred tax assets that can be recognized, based on the likely timing and the level of future taxable profits together with future tax-planning strategies. If our estimates or assumptions change from those used in our current valuation, we may be required to recognize an adjustment in future periods that would increase or decrease our deferred income tax asset or liability and increase or decrease our income tax expense.
Accounting Developments
Recently adopted
Effective January 1, 2012, we adopted “Disclosures–Transfers of Financial Assets (Amendments to IFRS 7)” issued by the IASB in October 2010. The adoption of these amendments has not had an effect on our consolidated financial statements.
MANAGEMENT’S DISCUSSION AND ANALYSIS
December 31, 2012
STANTEC INC.
M-52
Future adoptions
The listing below includes issued standards, amendments, and interpretations that we reasonably expect to be applicable at a future date and intend to adopt when they become effective. Unless otherwise noted, the effective date of each standard below is the first annual period beginning on or after January 1, 2013, with retrospective application required and early adoption permitted. Unless otherwise noted, we are currently considering the impact of adopting these standards and interpretations on our consolidated financial statements and cannot reasonably estimate the effect at this time.
Financial Instruments
In November 2009, the IASB issued IFRS 9, “Financial Instruments” (IFRS 9), as part of the first of three phases to replace IAS 39, “Financial Instruments: Recognition and Measurement” (IAS 39). The first phase addressed the classification and measurement of financial assets. IFRS 9 replaces the multiple classification and measurement models of IAS 39 with a single model that has only two classification categories: amortized cost and fair value.
In October 2010, the IASB reissued IFRS 9, incorporating new requirements on accounting for financial liabilities and carrying over from IAS 39 the requirements for derecognition of financial assets and financial liabilities and for classification and measurement of financial liabilities. The reissued IFRS 9 requires that the amount of change in the fair value of the financial liability that is attributable to changes in the credit risk of that liability be presented in other comprehensive income, instead of in profit and loss.
In December 2011, the IASB issued amendments to IFRS 9 (the amendments). The amendments result in a deferred effective date for IFRS 9, from annual periods beginning on or after January 1, 2013, to January 1, 2015, with early adoption still permitted. This deferral makes it possible for all phases of the replacement of IAS 39 to have the same mandatory effective date. The amendments provide relief in restating prior periods, requiring instead that entities provide disclosures to allow financial statement users to understand the initial impact of applying IFRS 9.
Financial Instruments: Presentation
In December 2011, the IASB issued amendments to IAS 32, “Financial Instruments: Presentation” (IAS 32) (the amendments). The amendments clarify when an entity has a legally enforceable right to set-off, as well as clarify the application of offsetting criteria related to some settlement systems that may be considered the same as net settlement. The amendments to IAS 32 are applicable for annual periods beginning on or after January 1, 2014.
Financial Instruments: Disclosures
In December 2011, the IASB issued amendments to IFRS 7, “Financial Instruments: Disclosure” (IFRS 7) related to the disclosures of offsetting financial assets and financial liabilities. These amendments require disclosure of information that will allow financial statement users to assess the impact of an entity’s netting arrangements, including rights of set-off associated with an entity’s recognized financial assets and liabilities, on the entity’s statement of financial position. In the same period, the IASB also amended IFRS 7 for transition disclosures required upon adoption of IFRS 9.
Consolidated Financial Statements
In May 2011, the IASB issued IFRS 10, “Consolidated Financial Statements,” which replaces Standing Interpretations Committee (SIC)–12, “Consolidation–Special Purpose Entities” (SIC–12), and parts of IAS 27, “Consolidated and Separate Financial Statements” (IAS 27). The new standard builds on existing principles by identifying the concept of control as the determining factor in whether an entity should be included in a company’s consolidated financial statements. The standard provides additional guidance to assist in the determination of control where it is difficult to assess. Based on a preliminary analysis, IFRS 10 is not expected to change the
MANAGEMENT’S DISCUSSION AND ANALYSIS
December 31, 2012
STANTEC INC.
M-53
consolidation conclusion for our current subsidiaries and special purpose entities. We are assessing the impact IFRS 10 will have on the accounting for our joint ventures and investments in associates and the impact on our financial position and performance.
Joint Arrangements and Investments in Associates and Joint Ventures
In May 2011, the IASB issued IFRS 11, “Joint Arrangements” (IFRS 11), to establish principles for financial reporting by parties to a joint arrangement. This standard supersedes IAS 31, “Interests in Joint Ventures” (IAS 31), and SIC-13, “Jointly Controlled Entities—Non-Monetary Contributions by Venturers.” Under IFRS 11, joint arrangements are classified as either joint operations or joint ventures; the classification of a joint arrangement focuses on the nature and substance of the rights and obligations of the arrangement. IFRS 11 requires that joint ventures be accounted for using the equity method rather than proportionate consolidation.
In May 2011, the IASB amended IAS 28, “Investments in Associates and Joint Ventures” (IAS 28), previously IAS 28, “Investments in Associates.” The amended IAS 28 sets out the accounting for investments in associates and the requirements for application of the equity method when accounting for investments in associates and joint ventures.
IFRS 11 and amended IAS 28 will lead to a change in accounting for our joint arrangements since proportionate consolidation is no longer allowed for joint ventures. We are currently assessing the categorization of our joint arrangements into joint operations and joint ventures and assessing the impact IFRS 11 and amended IAS 28 will have on our financial position and performance.
Disclosure of Interests in Other Entities
In May 2011, the IASB issued IFRS 12, “Disclosure of Interests in Other Entities” (IFRS 12). IFRS 12 combines the disclosure requirements for an entity’s interests in subsidiaries, joint arrangements, associates, and structured entities into one comprehensive disclosure standard. Many of the disclosure requirements were previously included in IAS 27, IAS 28, IAS 31, and SIC-12, while others are new. IFRS 12 requires that an entity disclose the significant judgment and assumptions it has made in determining whether it controls an entity.
In June 2012, the IASB issued “Consolidated Financial Statements, Joint Arrangements, and Disclosure of Interests in Other Entities: Transition Guidance (Amendments to IFRS 10, IFRS 11, and IFRS 12)” to provide clarification and transitional relief upon adoption of IFRSs 10, 11, and 12 by limiting the requirement to adjust comparative figures.
Fair Value Measurement
In May 2011, the IASB issued IFRS 13, “Fair Value Measurement” (IFRS 13). IFRS 13 provides guidance on how to measure fair value under IFRS when fair value is required or permitted by other standards. Fair value is defined as the price that would be received to sell an asset or paid to transfer a liability in an orderly transaction between market participants at the measurement date. IFRS 13 requires enhanced disclosure for fair value. IFRS 13 is applied prospectively for annual periods beginning on or after January 1, 2013, and comparative disclosures for prior periods are not required. Based on a preliminary analysis, this standard will not have a material impact on our financial position or performance. The new standard will result in additional disclosure.
Presentation of Financial Statements
In September 2011, the IASB issued amendments to IAS 1, “Presentation of Financial Statements” (IAS 1), to improve the consistency and clarity of items presented in other comprehensive income. The amendments require that items presented in other comprehensive income be grouped into two categories: 1) items that may be reclassified into profit or loss at a future date and 2) items that will never be reclassified into profit or loss. The
MANAGEMENT’S DISCUSSION AND ANALYSIS
December 31, 2012
STANTEC INC.
M-54
amendments to IAS 1 are effective for annual periods beginning on or after July 1, 2012. This amendment affects presentation only and has no impact on our financial position or performance.
Employee Benefits
In September 2011, the IASB issued amendments to IAS 19, “Employee Benefits” (the amendments). Among other changes, the amendments impact the timing of the recognition of termination benefits. The revised standard requires termination benefits outside of a wider restructuring to be recognized only when the offer becomes legally binding and cannot be withdrawn. In the context of a wider restructuring, termination benefits are recognized at the same time as other restructuring costs. Based on a preliminary analysis, this amendment will not have a material impact on our financial position or performance.
Annual Improvements to IFRSs
In May 2012, the IASB issued Annual Improvements (2009–2011 cycle) to make necessary but non-urgent amendments to the following IFRSs: IFRS 1, “First-time Adoption of IFRS”; IAS 1, “Presentation of Financial Statements”; IAS 16, “Property, Plant, and Equipment”; IAS 32, “Financial Instruments: Presentation”; and IAS 34, “Interim Financial Reporting.”
Materiality
We determine whether or not information is “material” based on whether we believe that a reasonable investor’s decision to buy, sell, or hold securities in our Company would likely be influenced or changed if the information was omitted or misstated.
Definition of Additional IFRS Measures
IFRS mandates certain minimum line items for financial statements and requires presentation of additional line items, headings, and subtotals when such presentation is relevant to an understanding of a company’s financial position and performance. Because IFRS requires such additional GAAP measures, the measures are not considered non-IFRS financial measures but are considered additional IFRS measures. This Management’s Discussion and Analysis includes reference to and uses terms that are considered additional IFRS measures. We believe that the measures defined here are useful for providing investors with additional information to assist them in understanding components of our financial results.
Gross Revenue and Net Revenue. Our Company provides knowledge-based solutions for infrastructure and facilities projects through value-added professional services, principally under fee-for-service agreements with clients. In the course of providing services, we incur certain direct costs for subconsultants, equipment, and other expenditures that are recoverable directly from our clients. The revenue associated with these direct costs is included in our gross revenue. Since such direct costs and their associated revenue can vary significantly from contract to contract, changes in our gross revenue may not be indicative of our revenue trends. Accordingly, we also report net revenue, which is gross revenue less subconsultant and other direct expenses, and analyze our results in relation to net revenue rather than to gross revenue.
Gross Margin. We monitor our gross margin percentage levels to ensure that they are within an established acceptable range for the profitability of our operations. Gross margin is calculated as net revenue minus direct payroll costs. Direct payroll costs include the cost of salaries and related fringe benefits for labor hours that are directly associated with the completion of projects. Labor costs and related fringe benefits for labor hours that are not directly associated with the completion of projects are included in administrative and marketing expenses.
MANAGEMENT’S DISCUSSION AND ANALYSIS
December 31, 2012
STANTEC INC.
M-55
Definition of Non-IFRS Measures
This Management’s Discussion and Analysis includes references to and uses terms that are not specifically defined in IFRS and do not have any standardized meaning prescribed by IFRS. These non-IFRS measures may not be comparable to similar measures presented by other companies. We believe that the measures defined here are useful for providing investors with additional information to assist them in understanding components of our financial results.
Working Capital. We use working capital as a measure for assessing overall liquidity. Working capital is calculated by subtracting current liabilities from current assets. There is no directly comparable IFRS measure for working capital.
Current Ratio. We use current ratio as a measure for assessing overall liquidity. Current ratio is calculated by dividing current assets by current liabilities. There is no directly comparable IFRS measure for current ratio.
Return on Equity. As part of our overall assessment of value added for shareholders, we monitor our return on equity. Return on equity is calculated as net income for the last four quarters divided by the average shareholders’ equity over each of the last four quarters. There is no directly comparable IFRS measure for return on equity.
EBITDA. EBITDA represents net income before interest expense, income taxes, depreciation of property and equipment, amortization of intangible assets, and goodwill and intangible impairments. This measure is referenced in our credit facility agreement as part of our debt covenants, and we use it as part of our overall assessment of our operating performance. It is defined as net income for the period, plus all amounts deducted in the calculation thereof on account of interest expense, income taxes, depreciation, amortization, goodwill and intangible impairments, or any minority interest. There is no directly comparable IFRS measure for EBITDA.
EBITDAR. This measure is referenced in our credit facility agreement as part of our debt covenants. It is defined as an amount equal to EBITDA, plus building rental obligations net of common area costs, taxes, charges, and levies. There is no directly comparable IFRS measure for EBITDAR.
Debt to EBITDA Ratio. This ratio is referenced in our credit facility agreement as part of our debt covenants. It is defined as the sum of permanent principal and interest payments in respect of the debt, plus building rental obligations net of common area costs, taxes, charges, and levies, divided by EBITDA. There is no directly comparable IFRS measure for debt to EBITDA ratio.
Net Debt to EBITDA.As part of our assessment of our capital structure, we monitor net debt to EBITDA. This measure is referenced in our credit facility agreement as part of our debt covenants. It is defined as the sum of (1) long-term debt, including current portion, plus bank indebtedness, less cash and cash held in escrow, divided by (2) EBITDA, which is calculated as income before income taxes, plus net interest expense, amortization of intangible assets, depreciation of property and equipment, and goodwill and intangible impairment. There is no directly comparable IFRS measure for net debt to EBITDA.
EBITDAR to Debt Service Ratio. This ratio is referenced in our credit facility agreement as part of our debt covenants. It is defined as EBITDAR, divided by permanent principal and interest payments in respect of the debt, plus building rental obligations net of common area costs, taxes, charges, and levies. There is no directly comparable IFRS measure for EBITDAR to debt service ratio.
Backlog.As part of our assessment of our financial condition, we monitor our backlog. We define backlog as the total value of secured work that has not yet been completed that a) is assessed by management as having a high
MANAGEMENT’S DISCUSSION AND ANALYSIS
December 31, 2012
STANTEC INC.
M-56
certainty of being performed by either the existence of an executed contract or work order specifying the job scope, value, and timing or b) has been awarded to us through an executed binding or non-binding letter of intent or agreement describing the general job scope, value, and timing. Management must be reasonably assured that the letter of intent or agreement will be finalized in the form of a formal contract. Backlog is not a recognized performance measure under IFRS and does not have any standardized meaning prescribed by IFRS. We believe that backlog is a useful means of projecting activity in future periods. There is no directly comparable IFRS measure for backlog.
RISK FACTORS
Risks
Enterprise Risk Management Program
To preserve and enhance stakeholder value, we approach the management of risk strategically through our Enterprise Risk Management (ERM) program. We have adopted the integrated framework designed by the Committee of Sponsoring Organizations of the Treadway Commission (COSO) for enterprise risk management which consists of eight stages of risk management. We have consolidated these eight risk components into four categories:
| — | Internal Environment/Objective Setting |
| — | Event Identification/Risk Assessment |
| — | Risk Response/Control Activities |
| — | Information/Communication and Monitoring |
Internal Environment/Objective Setting
Our internal environment includes the tone set by our board and management, and it establishes the basis for how risk is viewed and addressed by all of our employees. It also includes our risk management philosophy and risk appetite, integrity and ethical values, and the environment in which we operate. Within the context of Stantec’s goal and vision, our management establishes strategic objectives, selects tactics, and sets aligned objectives cascading through the enterprise. Our ERM framework is geared to achieving objectives in four categories:
| — | Strategic: high-level goals that align with and support our purpose |
| — | Operations: effective and efficient use of our resources |
| — | Reporting: reliability of reporting |
| — | Compliance: compliance with applicable laws and regulations |
MANAGEMENT’S DISCUSSION AND ANALYSIS
December 31, 2012
STANTEC INC.
M-57
Event Identification/Risk Assessment
Risks are analyzed, considering likelihood and impact, as a basis for determining how they should be managed. Under this model, risks are identified and assessed first for inherent risk (before giving consideration to risk mitigation), and second for residual risk (after giving consideration to risk mitigation). This view of residual risks allows our management to assess whether current risk management techniques are sufficient or if additional risk mitigation is required. We have sought to align the identification of our principal risks with our strategic planning process such that key initiatives of the Company are considered in light of our stated risk appetite, and are appropriately managed to ensure we are able to deliver value to our stakeholders.
Risk Response/Control Activities
Policies and procedures are established and implemented to help ensure the risk specific response (avoiding, accepting, reducing, or sharing) aligns with our risk tolerances and risk appetite.
Information/Communication and Monitoring
Relevant information is identified, captured and communicated in a form and time frame that enable people to carry out their responsibilities. Effective communication occurs in a broader sense, flowing down, across, and up the Company. Control activities are monitored and modifications are made as necessary. Monitoring is accomplished through ongoing management activities, separate evaluations, or both.
The Team
Our board of directors provides oversight and carries out its risk management mandate primarily through its Audit and Risk Committee. The Audit and Risk Committee’s oversight role is designed to ensure that management has developed appropriate methods for identifying, evaluating, mitigating, and reporting on the principal risks inherent to our business and strategic direction and, further, that our systems, policies, and practices are appropriate and address our principal risks. The Audit and Risk Committee is not involved in the day-to-day risk management activities; rather, it ensures that the Company has an appropriate risk management system which allows management to bring to the board’s attention the Company’s principal risks. Finally, the Audit and Risk Committee is responsible for reviewing the Company’s risk appetite, risk tolerance, and risk retention philosophy.
Within the Company, our CEO is directly accountable to the board of directors for all risk-taking activities and risk management practices, and is supported by the Company’s risk management team. While risk management owns the process of ERM, the responsibility for identification and mitigation of our principal risks rests with our executive leadership team (ELT) and support services team (SST). The Company’s Integrity Management team has the specific mandate of conducting fraud risk assessments for the Company’s operations; therefore, it serves a key control function for the Company.
Internal Audit also supports the Company’s overall risk management program by assisting the Audit and Risk Committee in the discharge of its responsibilities relating to financial controls and control deviations. Internal Audit is also responsible for conducting internal audits in a variety of areas of the Company. Internal Audit works closely with ERM to ensure that the Company’s principal risks have been appropriately identified. One goal of the ERM program is to continue to leverage the expertise of Internal Audit to design better control and monitoring activities.
MANAGEMENT’S DISCUSSION AND ANALYSIS
December 31, 2012
STANTEC INC.
M-58
Finally, our practice and quality management team plays a key role in conducting internal practice audits of one-third of our offices each year to assess compliance with the ISO 90001:2008 registered Quality Management System. In addition, the practice and quality management team, in collaboration with our major projects group, has recently started conducting more comprehensive audits of a sampling of our major projects where our exposure to risk is more significant. This team also plays a key role in monitoring our operational compliance with our risk mitigation strategies. The team provides valuable feedback to the ERM program by identifying emerging risks and/or areas for further improvement.
A key objective of the ERM’s 2012 review was to refine the list of identified risks and identify the core principal risks. While the risks identified in our 2011 Financial Review have not materially changed, the goal was to consolidate the previous list of identified risks under three key categories: Strategic Risks, Operational Risks, and Reporting/Compliance Risks. The consolidation of the list of identified risks was conducted in parallel with the development of the strategic plan and, therefore, involved all levels of management: the board, ELT, SST, and emerging leaders at Stantec. At the conclusion of the consultation process, 14 principal risks were identified which we believe are an appropriate summation of the risks that truly can have an impact on our operations. We believe this presentation of our risks is more focused and better articulates the principal risks that face our business.
While management remains optimistic about our ability to successfully carry out our long-term objectives, like all professional infrastructure and facilities services firms, we are exposed to a number of risks and uncertainties. We have various strategies and practices to mitigate these risks and uncertainties, as further discussed below. When appropriate, we realign our risk disclosures as part of our continuous monitoring and annual assessment of our risks. The most significant risks are listed below in order of seriousness—a combination of the impact on our Company and the probability of occurrence. Readers of this report should consider carefully the risks and uncertainties described below, together with all of the other information in this report. The risks and uncertainties described below are not the only ones we face. Additional risks and uncertainties that we are unaware of, or that we currently believe are not material, may also become important factors that adversely affect our business. If any of the following risks actually occurs, the effects described below in respect of each risk are not the only ones we face, and our business, financial condition, results of operations, and future prospects could be materially and adversely affected in ways we do not currently anticipate.
Strategic Risks
Strategic Positioning
We are focused on achieving a certain level of market presence in the geographic locations we serve, which, at this time, is principally North America. As such, we are exposed primarily to the economic conditions of the marketplaces within North America. During economic downturns in North America, the ability of both private and public government entities to fund expenditures may decline significantly, which could have a material adverse effect on revenue and profitability. If we are unable to adjust our workforce or service mix for a downturn in a particular region, industry, or sector in a timely manner, the downturn could have a material adverse effect on our overall business, including the results of operations and liquidity. We cannot be certain that the North American economic or political conditions will generally be favorable or that there will not be significant fluctuations that adversely affect our industry as a whole or the key markets we serve.
Sourcing/Executing/Integrating Acquisitions
We may not be able to locate suitable acquisitions or consummate acquisition transactions on terms and conditions that are acceptable to us. As the professional services industry consolidates, suitable acquisition candidates are expected to become more difficult to locate and may be available only at prices or under terms that are less favorable than in the past. For those companies we do acquire, we are faced with the complex task
MANAGEMENT’S DISCUSSION AND ANALYSIS
December 31, 2012
STANTEC INC.
M-59
of integrating the acquired firm’s operations into our own. Integrations can be time-consuming and may be challenging. The diversion of management’s attention to the integration effort and any difficulties encountered while combining operations could adversely affect the combined company’s business and prevent us from realizing the anticipated improvement in professional service offerings, market penetration, profitability, and geographic presence that formed the foundation of the acquisition. In addition, key employees of the acquired firm may depart because of issues relating to the uncertainty and difficulties in completing the acquisition/integration or a desire not to remain with the combined company. Accordingly, we may be unable to retain key acquired employees to the extent projected at the time of acquisition.
Organic Growth
We may not be able to increase the size of our operations organically. Organic growth is achieved by meeting client expectations through effective quality project delivery and by expanding services provided to existing and new clients. If we are unable to effectively compete for projects, expand services to existing and new clients, or attract qualified staff, we will have difficulty increasing market share and achieving growth plans. Organic growth is also affected by factors beyond our control, including economic conditions. During economic downturns, the ability of both private and public government entities to fund expenditures may decline significantly, which could have a material adverse effect on our ability to grow organically.
Operational Risks
Operational Effectiveness
Our clients depend on us to deliver projects on time, on budget, and at acceptable quality levels. For us to succeed, our internal processes must support effective professional practice standards, including strong project management tools, an appropriate insurance program, and a simple and effective manner to bill and collect from clients. If we fail to manage projects effectively, we may incur additional costs, which may in turn result in a project not being as profitable as we expect. In addition, projects that are not completed on schedule further reduce profitability because staff must continue to work on them longer than anticipated, which may prevent staff from pursuing and working on new projects. Projects that are over budget or not on schedule may also lead to client dissatisfaction. Further, because of the nature of our contracts, at times we commit resources to projects prior to receiving payments from the customer in amounts sufficient to cover expenditures incurred. Delays in billings and customer payments may require us to make a working capital investment. In our experience, clients who withhold payment have a higher tendency toward dissatisfaction with the services we provide and are more likely to bring claims against us.
Human Capital Management
(attracting, retaining, succession planning, resource management)
We derive revenue almost exclusively from services performed by our employees. Consequently, one key driver of our business is our ability to attract and retain qualified people. There is significant competition for people—from major and boutique consulting, engineering, public agency, research, and other professional services firms—with the skills necessary to provide our services. Our inability to attract and retain qualified staff could impede our ability to secure and complete engagements and maintain client relationships. Similarly, if key personnel are unable or unwilling to continue employment with us and we do not have a well-developed succession plan prior to their departure, our business, operations, and prospects may be adversely affected.
Major Project Delivery
As we continue to grow as a company, we are increasingly presented with the opportunity to work on larger, more complex projects. While our business has historically followed a fee-for-service model, some clients in select markets and practice areas are demanding bundled services for engineering, procurement, and construction (EPC), as well as P3s. Failure to respond to these market demands may result in clients awarding projects to our
MANAGEMENT’S DISCUSSION AND ANALYSIS
December 31, 2012
STANTEC INC.
M-60
competitors, resulting in lost revenue. For work which we choose to engage in that represents a departure from the fee-for-service model, poor project management may result in a higher probability of cost overruns and liabilities.
Business Continuity Planning
We rely heavily on computer systems, communications technology, and related tools to operate properly. If we are unable to continually add software and hardware, effectively upgrade our systems and network infrastructure, maintain key information technology personnel, and take other steps to improve the efficiency of and protect systems, our service delivery and revenues could be interrupted or delayed. In addition, computer and communications systems and operations could be damaged or interrupted by natural disasters, telecommunications failures, acts of war or terrorism, computer viruses, physical or electronic security breaches, cyber security breaches, or similar events. Any of these or other events could cause system interruptions, loss of critical data, delay or prevent operations, and may adversely affect our operating results, liquidity, or financial position. The adverse financial impact of these events could include remediation costs, costs associated with increased protection, lost revenues, litigation costs, and reputational damage leading to lost clients. As a corollary to IT disasters, if we fail to maintain clear crisis communication plans, effective emergency response plans, and effective pandemic response plans, we put our employees and clients at risk. Failure to quickly respond to a crisis could adversely affect our ability to start or complete work for clients, which in turn could lead to client dissatisfaction and claims.
Workplace Health, Safety & Environment
Our Health, Safety & Environment program is aimed at reducing risks to people, the environment, and our business; however, our employees are subject to environmental, health, and safety risks in the course of their employment. A number of these risks could result in personal injury, loss of life, or environmental and other damage to our property or the property of others. Alternatively, we could be exposed to civil and/or statutory liability arising from injuries or deaths because of inadequate health and safety policies and practices. We may become liable for damages arising from such events, against which we cannot insure or may elect not to insure because of high premium costs or other reasons. We also risk incurring additional costs on projects that have sustained environmental, health, and safety incidents because they may require additional time to complete or because employee time may be lost due to injury.
Reputational Harm
At Stantec, monitoring, assessing, and mitigating reputational harm is the responsibility of our executive leadership. Reputation management is about understanding the extent to which stakeholders believe the Company is meeting their expectations. Our stakeholders respond quickly to negative news about the Company, including situations where we fail to meet our commitments. From an investor perspective, these commitments are often measured by the Company’s ability to deliver on its operating and financial targets and revenue growth (e.g., gross margin as a percentage of net revenue, administrative and marketing expenses as a percentage of net revenue, net income as a percentage of net revenue, effective income tax rate, return on equity, and net debt to EBITDA ratio) and achieve other strategic objectives, such as acquiring strong organizations with strong operations to avoid the need to write down the value of our goodwill and intangible assets. To our employees, we make commitments to provide stimulating, challenging work that will assist them in becoming leaders in their fields and in their communities. If we fail to meet our commitments to our employees, we risk dissatisfaction, disengagement, and turnover. To our clients, we make commitments to do what is right within a framework committed to excellence, and if we fail to meet our commitments to them, we run the risk of eroding the client relationship, which could result in less repeat business and a poor reputation in the marketplace. Reputational harm is not a stand-alone risk exposure, but is often the outcome of or interdependent with numerous other risk events.
MANAGEMENT’S DISCUSSION AND ANALYSIS
December 31, 2012
STANTEC INC.
M-61
Reporting/Compliance Risk
Controls and Disclosure
Inadequate internal controls or disclosure controls over financial reporting could result in material misstatements in our financial statements and related public disclosures, which in turn could lead to a loss of market confidence and market value. Inadequate controls could also result in system downtime, delayed processing, inappropriate decisions based on non-current internal financial information, fraud, or the inability to continue our business operations.
Regulatory/Legal Risk
We are subject to a variety of regulations and standards. Compliance with any additional obligations could materially increase our costs. Our business model includes a variety of practice areas and jurisdictions, each with its own set of rules and regulations. To comply with increasingly complex laws and regulations, we may be required to increase the fees we charge to our clients. Non-compliance to these laws and regulations could have a significant impact on our results. Further, in the normal course of business, we are involved in various proceedings. Litigation and legal matters are subject to many uncertainties, and the outcome of an individual matter may not be predictable.
Availability of Capital
To deliver on our strategic plan, we will need access to substantial capital. However, we may be unable to obtain the necessary capital to finance a successful acquisition program while meeting our other cash needs. If we are unable to obtain additional capital on acceptable terms, we may be required to reduce the scope of our anticipated expansion, which may negatively affect our future competitiveness and results of operations. Using internally generated cash or taking on debt to complete acquisitions could substantially limit our operational and financial flexibility. We have no assurance that existing debt will continue to be available from our current lenders or other financial institutions on similar favorable terms.
Market Risk
Several capital market risks affect our business. Two key drivers that impact our business are currency risk and interest rate risk. Although we report financial results in Canadian dollars, a substantial portion of revenue and expenses is generated or incurred in non-Canadian dollars. Therefore, if the Canadian dollar were to strengthen relative to the US dollar and other currencies, the net income from our non-Canadian dollar business could decrease, which could have a material adverse effect on our business, financial condition, and results of operations. Changes in interest rates also present a risk to our performance. Our revolving credit facility carries a floating rate of interest, and we are also subject to interest rate pricing risk to the extent that our investments held for self-insured liabilities contain fixed-rate government and corporate bonds.
Tax Risk
Uncertainties exist with respect to the interpretation of complex tax regulations and the amount and timing of deferred taxable income. Stantec is also exposed to transfer pricing risk in the following areas: cross-border labor sharing and charging for services provided to external clients; provision of management services; and insurance and financing of operations. Stantec’s largest exposure is on the provision of these services between Canada and the United States.
MANAGEMENT’S DISCUSSION AND ANALYSIS
December 31, 2012
STANTEC INC.
M-62
Managing our Risks
Business Model
We mitigate our operating, market, growth, and acquisition integration risks through our business strategy and other measures. As a professional services firm, we focus on design. We typically do not take on construction risk or contribute equity in projects. We focus our business on two client types: regional/local and global/national. Having a local presence connects us to local clients and positions us through long-term relationships to understand their business, bid on their projects, and secure work with them. From this local base, we are also able to engage top-tier experts from anywhere across our Company in regional/local project delivery. For global/national clients, we assign account managers who understand these clients’ priorities so that we maintain strategic relationships and expand our opportunities.
Our three-dimensional business model—based on geographic, practice area unit, and life cycle diversification—reduces our dependency on any particular industry or economic sector. To help reduce our susceptibility to industry-specific and regional economic cycles and to take advantage of economies of scale in the highly fragmented professional services industry, we intend to continue diversifying our business in terms of both geographic presence and service offerings and focusing our organization around key client sectors. Over the last several years, we have completed numerous acquisitions, and we expect to continue to pursue selective acquisitions that will enable us to enhance our market penetration and increase and diversify our revenue base. We also differentiate our company from competitors by entering into both large and small contracts with a variety of fee amounts. A broad project mix strengthens our brand identity and continues to ensure that we do not rely on a few large projects for our revenue and that no one client or project accounts for more than 5% of our overall business.
People and Practice
In 2013, we combined Human Resources with Practice & Quality Management to form a new group called People + Practice. The group is responsible for promoting our purpose—to provide value to our clients and communities—and directly ties our people strategy to business practices, project delivery, and client service. By linking our people approach with our strategy, the People + Practice group elevates the strategic function of human capital management and allows us to effectively nurture a culture of excellence across the organization. We remained focused on addressing the risk of competition for qualified personnel by offering a number of employment incentives, including training programs, access to an employee share ownership plan, and opportunities for professional development and enhancement, along with compensation plans that we believe to be competitive, flexible, and designed to reward top performance.
In 2012, we focused on developing three primary career streams available to our professional and technical staff: business, practice, and project management. We will continue to enhance this program in 2013. We also focused on succession planning measures for key leadership and management positions. Looking forward to 2013, our goal is to develop a comprehensive, blended learning environment for our employees that combines experiential on-the-job training, coaching and mentorship, improved tools and practices, and external networks. We also plan to develop diversity and inclusion plans to foster a workplace that is supportive of the unique differences among our clients and employees.
Effective Processes and Systems
Regarding effective project management and execution, our integrated management system is certified to the ISO9001:2008 (Quality) and ISO14001:2004 (Environmental) standards. The integrated management system (IMS) provides clarity on expectations for project delivery and client service excellence. At the heart of the IMS is our 10-point project management (PM) framework that, along with the more detailed practice frameworks that exist in our practice areas, clearly conveys the steps employees must take to achieve a higher probability of more
MANAGEMENT’S DISCUSSION AND ANALYSIS
December 31, 2012
STANTEC INC.
M-63
consistent and successful project outcomes. In addition, the PM framework helps create a consistent culture throughout the organization around project execution and helps ensure that employees from every office are aligned with those principles. The adoption of regional operating unit improvement plans addresses specific corrective action, responsibilities, and deadlines for completion with the goal of improving PM framework compliance in specific offices and regions.
We maintain insurance coverage for our operations, including policies covering general liability, automobile liability, environmental liability, workers’ compensation and employers’ liability, directors’ and officers’ liability, and professional liability. We have a regulated captive insurance company to insure and fund the payment of any professional liability self-insured retentions related to claims arising after August 1, 2003. We, or our clients, also obtain project-specific insurance for certain projects when required. In addition, we invest resources in a Risk Management team that is dedicated to providing Company-wide support and guidance on risk avoidance practices and procedures. One of our practices is to carry out select client evaluations, including credit risk appraisals, before entering into contract agreements. This reduces the risk of non-payment for our services.
Growth Management
To address the risk of being unsuccessful when integrating acquired companies, we have an acquisition and integration program managed by a dedicated acquisition team. The team supports and is responsible for the tasks of identifying and valuing acquisition candidates, undertaking and coordinating due diligence, negotiating and closing transactions, and integrating employees and systems immediately following an acquisition. A senior regional or practice leader is appointed for each acquisition to support the integration process. As we continue to expand internationally, we are developing a disciplined approach to operating outside North America, taking into account different accounting systems, legal structures, languages, and cultures. We also have a coordinated integration plan that involves the implementation of our Company-wide information technology and financial management systems and the provision of support services from our corporate and regional offices. We are able to meet our liquidity needs and expansion strategy through a variety of sources, including cash generated from operations, long- and short-term borrowings from our $350 million credit facility, senior secured notes, and the issuance of common shares.
Executive Compensation
Our executive compensation philosophy is aligned with the risk mitigation strategies outlined above. We compensate our executives with a mix of fixed and at-risk compensation. Our annual bonus pool rewards the near-term performance contributions of our executives. The amount of the bonus pool is determined as a percentage of our pre-tax, pre-bonus net income, which encourages our executives to achieve profitable business results. They are rewarded for both increasing project revenue and managing those projects in a cost-effective manner. Our employee share option plan rewards long-term performance by aligning the interests of our executives with increased shareholder returns. Our share options vest over a three-year period to encourage long-term alignment with the interests of our shareholders.
In addition to our compensation programs, we have adopted share ownership requirements for our executives to further demonstrate their commitment to creating shareholder value. Further, our executives are prohibited from speculating in the securities of the Company or purchasing financial instruments that are designed to hedge or offset a decrease in value of equity securities of the Company. We are also committed to the principle that compensation paid to our executives on the basis of financial information that has since been restated should be returned. To that end, in 2012, our board of directors adopted an executive compensation claw-back policy.
MANAGEMENT’S DISCUSSION AND ANALYSIS
December 31, 2012
STANTEC INC.
M-64
CONTROLS AND PROCEDURES
Disclosure controls and procedures are designed to ensure that information we are required to disclose in reports filed with securities regulatory agencies is recorded, processed, summarized, and reported on a timely basis and is accumulated and communicated to management, including our CEO and CFO, as appropriate, to allow timely decisions regarding required disclosure.
Under the supervision and with the participation of management, including our CEO and CFO, we carried out an evaluation of the effectiveness of our disclosure controls and procedures as of December 31, 2012 (as defined in rules adopted by the SEC in the United States and as defined in Canada by National Instrument 52-109, Certification of Disclosure in Issuer’s Annual and Interim Filings). Based on this evaluation, our CEO and CFO concluded that the design and operation of our disclosure controls and procedures were effective.
Internal control over financial reporting is a process designed to provide reasonable assurance regarding the reliability of financial reporting and preparation of financial statements for external purposes in accordance with IFRS. A control system, no matter how well designed and operated, can provide only reasonable, not absolute, assurance with respect to the reliability of our financial reporting and preparation of our financial statements. Accordingly, management, including our CEO and CFO, does not expect that our internal control over financial reporting will prevent or detect all errors and all fraud. Management’s Annual Report on Internal Control over Financial Reporting and the Independent Auditors’ Report on Internal Controls are included in our 2012 consolidated financial statements.
There has been no change in our internal control over financial reporting during the year ended December 31, 2012, that materially affected, or is reasonably likely to materially affect, our internal control over financial reporting.
We will continue to periodically review our disclosure controls and procedures and internal control over financial reporting and may make modifications from time to time as considered necessary or desirable.
CORPORATE GOVERNANCE
Disclosure Committee
Stantec has a Disclosure Committee, consisting of a cross-section of management. The committee’s mandate is to provide ongoing review of Stantec’s continuous disclosure policy and to facilitate compliance with applicable legislative and regulatory reporting requirements.
Board of Directors
Stantec’s board of directors currently includes eight members, seven of whom are independent under Canadian securities laws and under the rules of the SEC and the NYSE and free from any interest or relationship that could materially interfere with their ability to act in the best interest of our Company and shareholders.
MANAGEMENT’S DISCUSSION AND ANALYSIS
December 31, 2012
STANTEC INC.
M-65
The board’s mandate is to supervise Stantec’s management with a view to the Company’s best interests. The board fulfills its mandate by
| — | Overseeing the Company’s strategic planning process |
| — | Satisfying itself as to the integrity of the CEO and other executive officers |
| — | Ensuring that the Company has a policy in place for communicating effectively with shareholders, other stakeholders, and the public |
| — | Reviewing and monitoring the Company’s principal business risks as identified by management, along with the systems for managing such risks |
| — | Overseeing senior management succession planning, including the appointment, development, and monitoring of senior management |
| — | Ensuring that management maintains the integrity of the Company’s internal controls and management information systems |
In 2012, Stantec’s board included two committees: the Audit and Risk Committee and the Corporate Governance and Compensation Committee. Both committees are composed entirely of unrelated, independent directors.
Audit and Risk Committee
The Audit and Risk Committee monitors, evaluates, approves, and makes recommendations on matters affecting Stantec’s external audit, financial reporting, accounting control policies, and risk management matters. The chair of the committee provides regular reports at the Company’s board meetings. The board has determined that each of the Audit and Risk Committee’s members is financially literate and that all of the members are “financial experts” as such term is defined under the rules of the SEC and NYSE.
Corporate Governance and Compensation Committee
The Corporate Governance and Compensation Committee monitors, evaluates, approves, and makes recommendations on matters affecting governance and compensation. Governance matters include, but are not limited to, board size, nominations, orientation, education, and self-evaluation. Compensation matters include, but are not limited to, executive management compensation, performance review, and succession plans. The chair of the committee provides regular reports at the Company’s board meetings.
More information about Stantec’s corporate governance can be found on our website (www.stantec.com) and in the Management Information Circular for our May 9, 2013, annual meeting of shareholders. In addition, the following documents are posted on our website:
| — | Code of Ethics |
| — | Corporate Governance Guidelines |
| — | Audit and Risk Committee Terms of Reference |
| — | Corporate Governance and Compensation Committee Terms of Reference |
The above information is not and should not be deemed to be incorporated by reference herein. Copies of these documents will be made available in print form to any shareholder who requests them.
MANAGEMENT’S DISCUSSION AND ANALYSIS
December 31, 2012
STANTEC INC.
M-66
SUBSEQUENT EVENT
On February 20, 2013, the Company declared a dividend of $0.165 per share, payable on April 18, 2013, to shareholders of record on March 29, 2013, an increase of 10% from last quarter.
CAUTIONARY NOTE REGARDING FORWARD-LOOKING STATEMENTS
Our public communications often include written or verbal “forward-looking statements” within the meaning of the US Private Securities Litigation Reform Act of 1995 and “forward-looking information” within the meaning of applicable Canadian securities laws (collectively, “forward-looking statements”). Forward-looking statements are disclosures regarding possible events, conditions, or results of operations that are based on assumptions about future economic conditions or courses of action and include future-oriented financial information.
Statements of this type are contained in this report, including the discussion of our goals in the Core Business and Strategy section and of our annual and long-term targets and expectations for our regions and practice area units in the Results and Outlook sections, and may be contained in filings with securities regulators or in other communications. Forward-looking statements may involve, but are not limited to, comments with respect to our objectives for 2013 and beyond, our strategies or future actions, our targets, our expectations for our financial condition or share price, or the results of or outlook for our operations.
We provide forward-looking information for our business in the Executive Summary (under Outlook), the Core Business and Strategy section and the Results (under Gross and Net Revenue, and Liquidity and Capital Resources subsections) and Outlook sections of this report to describe the management expectations and targets by which we measure our success and to assist our shareholders in understanding our financial position as at and for the periods ended on the dates presented in this report. Readers are cautioned that this information may not be appropriate for other purposes.
By their nature, forward-looking statements require us to make assumptions and are subject to inherent risks and uncertainties. There is a significant risk that predictions, forecasts, conclusions, projections, and other forward-looking statements will not prove to be accurate. We caution readers of this report not to place undue reliance on our forward-looking statements since a number of factors could cause actual future results, conditions, actions, or events to differ materially from the targets, expectations, estimates, or intentions expressed in these forward-looking statements.
The following factors, among others, could cause our actual results to differ materially from those projected in our forward-looking statements:
| — | Global capital market activities |
| — | Fluctuations in interest rates or currency values |
| — | The effects of war or terrorist activities |
| — | The effects of disease or illness on local, national, or international economies |
| — | The effects of disruptions to public infrastructure such as transportation, communications, power, or water |
| — | Global economic or political conditions |
| — | Regulatory or statutory developments |
| — | The effects of competition in the geographic or business areas in which we operate |
| — | The actions of management |
| — | Technological changes |
MANAGEMENT’S DISCUSSION AND ANALYSIS
December 31, 2012
STANTEC INC.
M-67
Many of these factors are beyond our control and have effects which are difficult to predict. Future outcomes relating to forward-looking statements may be influenced by these and other factors, including, but not limited to, material and known risks, which are further described in the Risk Factors section of this report.
Assumptions
In determining our forward-looking statements, we consider material factors including assumptions about the performance of the Canadian and US economies in 2013 and their effect on our business. The assumptions we made in determining the outlook for each of our practice area units, our geographic areas, our annual targets, and our outlook for 2013 are listed in the Outlook section of this report.
The preceding list of factors is not exhaustive. Investors and the public should carefully consider these factors, other uncertainties and potential events, and the inherent uncertainty of forward-looking statements when relying on these statements to make decisions with respect to our Company. The forward-looking statements contained herein represent our expectations as of February 20, 2013, and, accordingly, are subject to change after such date. Except as may be required by law, we do not undertake to update any forward-looking statement, whether written or verbal, that may be made from time to time. In the case of the ranges of expected performance for fiscal year 2013, it is our current practice to evaluate and, where we deem appropriate, provide updates. However, subject to legal requirements, we may change this practice at any time at our sole discretion.
MANAGEMENT’S DISCUSSION AND ANALYSIS
December 31, 2012
STANTEC INC.
M-68