Exhibit 15.3

| | | | | | | | | | | | | | |
| | | | |  |
| | | In the Strategic report | |  |
| | | | | | | | | | | | |
| | | Our new CEO discusses 2017 performance and our new long-term priorities | |  | | | | Measuring performance and managing risk | | | |
| | | > See pages 05–07 | | | | | > See pages 18–21 | | |
| | | | | | | | | | | | | |
| | | How we createlong-term value | | | | | | Innovation and Performance in each of our three businesses | | | | |
| | | > See pages 08–09 | | | | | > See pages 22–41 | | | |
| | | | | | | | | | | | | |
| | | Industry trends | | | | | | How our three businesses together contribute to our Trust priority | | | | |
| | | > See pages 10–11 | | | | | > See pages 42–51 | | | |
| | | | | | | | | | | | | |
| | | Our new long-term priorities: Innovation, Performance and Trust | | | | | | Financial review | | | | |
| | | > See pages 12–17 | | | | | > See pages 52–78 | | | |
| | | Cover image | | Cautionary statement | | |
| | | 30 years after developing the first HIV medicine, our research into treatment and prevention of HIV continues. We remain at the forefront of helping people living with HIV, driving innovation and working with communities all over the world. | | See the inside back cover of this document for the cautionary statement regarding forward- looking statements. | | |
| | | | |
| GSK Annual Report 2017 | | Strategic report | |  |
| | Governance and remuneration | | |
| | Financial statements | | |
| | Investor information | | |
| | | | | | |
Our financial performance in 2017a |
| | | |
| £30.2bn | | AER +8% CER +3% | | £6.7bn | | AER +51% CER +44% |
Group turnover | | | New product salesb | |
| | |
| | | |
| £4.1bn | | AER +57% CER +39% | | £8.6bn | | AER +12% CER +5% |
Total operating profit | | | Adjusted operating profit | |
| | |
| | | |
| 31.4p | | AER +67% CER +36% | | 111.8p | | AER +11% CER +4% |
Total earnings per share | | | Adjusted earnings per share | |
| | | | | | |
| | | |
| £6.9bn | | £3.4bn | | £3.9bn | | 80p |
Net cash flow from operating activities | | Free cash flow | | Dividends declared for 2017 | | 2017 dividend per share |
| | | | | | | | | | | | | | |
Strategic report | | | | Remuneration report | | | | Investor information |
At a glance Chairman’s statement CEO’s statement How we create long-term value Industry trends Our long-term priorities How we measure success How we manage risk Pharmaceuticals Vaccines Consumer Healthcare Trust Group financial review | | 02 04 05 08 10 12 18 20 22 30 36 42 52 | | | | Chairman’s annual statement | | 114 | | | | Quarterly trend Five year record Product development pipeline Product, competition and intellectual property Principal risks and uncertainties Share capital and control Dividends Financial calendar Annual General Meeting 2018 Tax information for shareholders Shareholder services and contacts US law and regulation Group companies Glossary of terms | | 244 248 251 254 257 267 269 269 270 270 272 274 276 287 |
| | | | | Annual report on remuneration | | 116 | | | | |
| | | | | 2017 Remuneration policy summary | | 142 | | | | |
| | | | | | | | | | | |
| | | | | Financial statements | | | | |
| | | | | Directors’ statement of | | | | | | |
| | | | | responsibilities | | 148 | | | | |
| | | | | Independent Auditor’s report | | 149 | | | | |
| | | | | Financial statements | | 158 | | | | |
| | | | | Notes to the financial statements | | 162 | | | | |
| | | | | Financial statements of | | | | | | |
| | | | | GlaxoSmithKline plc prepared | | | | | | |
| | | | | under UK GAAP | | 233 | | | | |
| | | | | | | | | | | | |
Governance | | | | | | | | |
| | | | | | | | | |
Chairman’s Governance statement | | 80 | | | | Footnotes a AER growth rates represent growth at actual exchange rates. We use a number of adjusted,non-IFRS, measures to report the performance of our business, as described on page 58, including Adjusted results, free cash flow and CER growth rates. These measures are used by management for planning and reporting purposes and may not be directly comparable with similarly described measures used by other companies. Adjusted results exclude a number of items and are presented as management believes that Adjusted results allow the key trends and factors driving that performance to be more easily and clearly identified by shareholders.Non-IFRS measures may be considered in addition to, but not as a substitute for or superior to, information presented in accordance with IFRS. A reconciliation of Total results to Adjusted results is set out on page 67. b As defined in 2015, new products are as follows: Pharmaceuticals:Relvar/Breo Ellipta, Incruse Ellipta, Anoro Ellipta, Arnuity Ellipta, Eperzan/Tanzeum, Nucala, Tivicay, Triumeq. Vaccines: Menveo, Bexsero, Shingrix. |
Our Board | | 82 | | | |
Our Corporate Executive Team | | 86 | | | |
Leadership and effectiveness | | 88 | | | |
Nominations Committee report | | 94 | | | |
Accountability | | 96 | | | |
Audit & Risk Committee report | | 96 | | | |
Relations with stakeholders | | 107 | | | |
Science Committee report | | 109 | | | |
Corporate Responsibility | | | | | |
Committee report | | 110 | | | |
| | |
| 02 | | |
GSK Annual Report 2017 | | |
| | |
| | |
GSK at a glance
|
Our purpose |
|
| To help people do more, feel better and live longer. |
|
Our goal |
|
| To be one of the world’s most innovative, best performing and trusted healthcare companies. |
|
Our strategy |
|
| Bring differentiated, high-quality and needed healthcare products to as many people as possible, with our three global businesses, scientific and technicalknow-how and talented people. |
|
Our values and expectations |
|
| Our values and expectations are at the heart of everything we do and form an important part of our culture. |
| | |
Our values | | Our expectations |
Patient focus | | Courage |
Transparency | | Accountability |
Respect | | Development |
Integrity | | Teamwork |
| | | | |
| | | | Three global businesses |
| | | |
| | | 
Immune system T-cells attacking a cancer cell |
| | | 
Herpes zoster virus of shingles |
| | | 
Novamin, a Key technology in Sensodyne Repair and Protect |
| | | | |
| GSK Annual Report 2017 | | Strategic report | | |
| | Governance and remuneration | | |
| | Financial statements | | |
| | Investor information | | |
| | |
| 04 | | |
GSK Annual Report 2017 | | |
| | |
| | |
Chairman’s statement
| | |
 | | “The Board believes the renewed focus on innovation will enable GSK to capitalise on the opportunities in our industry to drive long-term value for investors.” Philip Hampton Chairman |
I am pleased to report another year of good performance with sales and earnings growth, some important new product approvals and continued cash returns to shareholders in line with expectations.
Following Emma Walmsley’s appointment as CEO, from April 2017, the Board conducted a review of the company’s strategy with management in the context of the operating environment and industry dynamics in global healthcare. In July, Emma presented the new strategy to investors setting out long-term priorities under three main headings – Innovation, Performance and Trust. Our top priority is to improve performance in the pharmaceuticals business and to seek more growth from pharmaceuticals R&D. The Board believes the renewed focus on innovation will enable GSK to capitalise on the opportunities in our industry to drive long-term value for investors.
Early progress against the strategy has been encouraging and the Board is closely engaged with management on its delivery.
Capital allocation
The company now has a new capital allocation framework to help shape our strategic priorities. Improving our pipeline of new pharmaceutical products is our main priority and the company has the potential for a marked improvement in performance. We will also invest behind key products in our vaccines business which we expect to drive growth in the coming years. In addition, we may invest further in our Consumer joint venture if our partner Novartis decides to exercise their option to sell their interests to us. Dividends represent an allocation of capital and the Board is mindful of the value that many shareholders attach to dividends. Under our framework, any material acquisitions have a lower priority and would have to meet our strict returns criteria.
Cash generation remains a key focus for the Board and we were pleased to see increased free cash flow for the year. We approved a dividend of 80p per share for 2017 and expect the same for 2018.
I noted in my first letter to shareholders two years ago that cash dividends were in excess of free cash flow generation and that is still the case. The Board has, over time, established a policy of achieving cash dividend cover in the range 1.25x – 1.5x, since investment in growth opportunities should be funded at least in part by cash retentions in the business.
Culture
Central to ensuring long-term delivery against the strategy is developing a culture which rewards high performance but also seeks to build on the values of the company. The Board was pleased to see employees support this, with a marked increase in employee engagement scores. In the past, there have been some instances where our commercial practices have been disappointing, leading to regulatory intervention. The Board has focused on improving both the framework and the culture for our control environment.
Executive team
Following the announcement of Emma as our new CEO, the Board was involved with other top executive appointments. Dr Hal Barron, our new Chief Scientific Officer and President, R&D, has joined the Board. We have a new President, Global Pharmaceuticals, Luke Miels; and a new Chief Digital and Technology Officer, Karenann Terrell. The Board has taken a keen interest in the balance between external recruits, and the development of internal succession planning.
Financial reporting
The Board is mindful of the need to provide clear financial reports. In 2017 we reviewed aspects of our financial reporting framework and made changes to ensure we remain in line with both the latest regulatory requirements and best practice in the industry. Commercial structures and reporting requirements sometimes lead to more complexity in reporting than we would like but we make great efforts to simplify and clarify where possible.
Board changes during the year
We continue to bring in new skills and capabilities to the Board. During the year, we welcomed Dr Laurie Glimcher as an IndependentNon-Executive Director and Scientific and Medical Expert. At this year’s AGM, Professor Sir Roy Anderson, who joined the Board in 2007, will step-down. I thank Roy for his excellent contribution, both in his special areas of scientific knowledge, but also more broadly. Dr Patrick Vallance will also step down from the Board at the end of March and leave GSK to become the Chief Scientific Adviser to the UK Government. Patrick has been a fine leader and Board colleague. Sir Andrew Witty and Dr Moncef Slaoui both stepped down after long careers with the company. I thanked them both in my last letter.
The new Science Committee made good progress last year. This is crucial as we enter an important phase for the pipeline in our pharmaceutical and vaccines activities over the next 2 to 3 years. Dr Barron will be working closely with the Committee.
I would like to thank all of GSK’s employees and partners for their hard work throughout 2017 and our shareholders and customers for their continued support and look forward to a successful 2018.

Philip Hampton
Chairman
| | | | |
| GSK Annual Report 2017 | | Strategic report | | |
| | Governance and remuneration | | |
| | Financial statements | | |
| | Investor information | | |
CEO’s statement
| | |
 | | “Our ambition is to drive a high-performance culture, putting science at the heart of GSK, remaining true to our values and our purpose: to help people do more, feel better, live longer.” Emma Walmsley Chief Executive Officer |
| | | | |
| | | Our long-term priorities | | |
| | | |
| | | Innovation | | > See page 12 |
| | | |
| | | Performance | | > See page 14 |
| | | |
| | | Trust | | > See page 16 |
| | |
| | |
| | | | |
| | | Our three businesses |
| | | |
| | | Pharmaceuticals | | > See page 22 |
| | | |
| | | Vaccines | | > See page 30 |
| | | |
| | | Consumer Healthcare | | > See page 36 |
| | | |
I’m delighted to be introducing GSK’s 2017 Annual Report; my first as CEO.
Since starting in this role it has become increasingly clear to me that while the healthcare industry remains an attractive sector, it is entering a period of significant change bringing both challenges and opportunities. In addition, despite improved delivery in recent years, it is also clear there are several areas of the company that need to be strengthened.
That’s why, in July, I set out three long-term priorities which everyone in the company is focused on: Innovation, Performance and Trust. I believe these priorities enable us to focus on areas we can improve and allow us to respond more effectively to our operating environment. They will focus us on delivering improved performance and better returns for shareholders over both the short and long term, as well as a broader societal contribution.
2017 performance
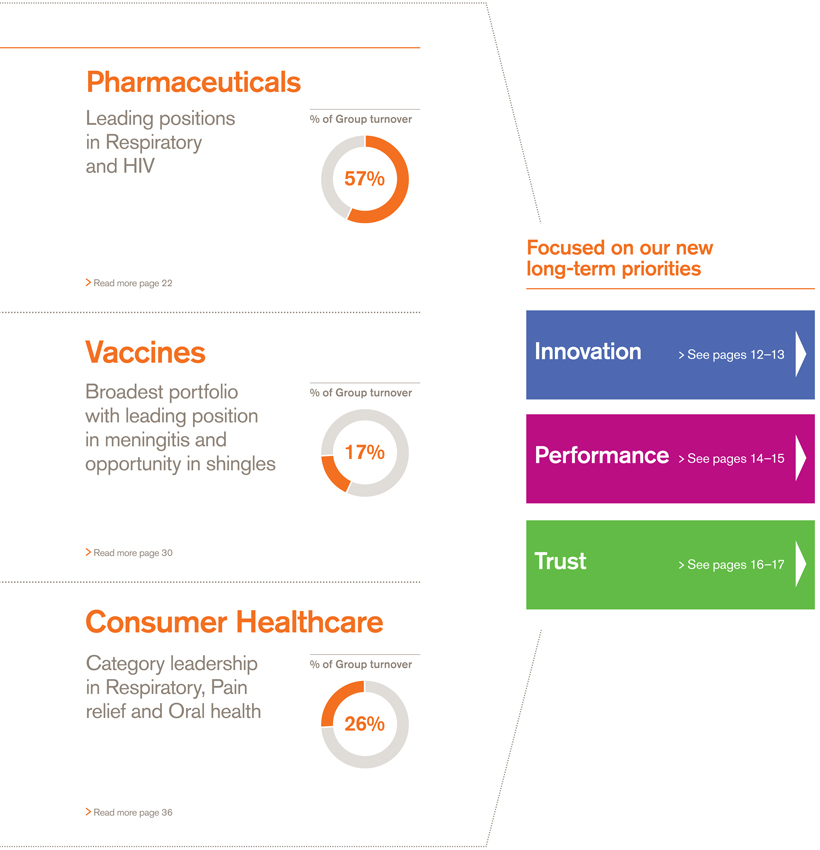
Group sales were £30.2 billion, up 8% at actual rates and 3% at constant exchange rates (CER), with growth across all three businesses. This is the first time Group sales have reached more than £30 billion in a year.
New Pharmaceutical and Vaccine product sales were £6.7 billion, with continued strong performances from our HIV medicines,Tivicay andTriumeq, ourEllipta portfolio and biologic medicine Nucala in Respiratory, and our meningitis vaccines.
The performance of these new products is a great demonstration of what we can achieve when our commercial organisation has clear focus.
Footnote
We use a number of adjusted,non-IFRS, measures to report performance, as described on page 58.
Consumer Healthcare sales were driven by our power brands which continued to outpace market growth. Sales from new GSK innovations represented approximately 13% of turnover.
Total earnings per share were 31.4p after accounting charges of £1.6 billion related to US tax reform, with Adjusted earnings per share up 11% AER, 4% CER to 111.8p.
Group Adjusted operating margin improved, reflecting effective management of costs and successful integrations of our new businesses in Vaccines and Consumer Healthcare.
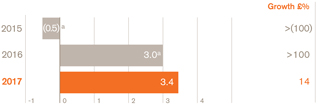
We have renewed our emphasis on cost and cash discipline and I was pleased to see our free cash flow for the year was £3.4 billion, an improvement of over £400 million on the previous year. We met our expectation of paying a dividend of 80 pence per share for 2017 and we expect to deliver the same for 2018.
Pipeline progress
Towards the end of 2017 we received approvals for three key new products:Shingrix, our new vaccine which represents a new standard for the prevention of shingles;Juluca, the first in a series of2-drug regimens for HIV which reduces the number of drugs patients take as they are now living longer with what is becoming a more chronic disease; andTrelegy Ellipta, which is the first once a day inhaler to combine three medicines in one device to treat chronic obstructive pulmonary disease (COPD).
Our focus in 2018 is to successfully launch these new products which bring significant benefits to patients, and to continue to maximise our current portfolio.
| | |
| 06 | | |
GSK Annual Report 2017 | | |
| | |
| | |
CEO’S statementcontinued
I have been clear that we need to strengthen our Pharmaceutical business and pipeline as this will ultimately drive sustainable, long-term growth for the company.
During 2017, we set out how we are refocusing our R&D organisation on four areas: two where we are a world leader – Respiratory and HIV; and two potential areas – Oncology and Immuno-inflammation. Our pipeline in these potential areas is innovative but early, and over the next 2 to 3 years we will continue to receive data from a number of key assets which will inform how we progress them.
New external appointments
I am delighted that we appointed Dr Hal Barron to be our Chief Scientific Officer and President, R&D. He joins us from Calico, an Alphabet-funded company, and before that spent many years at Roche and Genentech where he gained an exceptional reputation for leading highly productive R&D teams. I would like to thank Dr Patrick Vallance, our outgoing President of R&D, for his contribution over the last 12 years and for ensuring a smooth transition with Hal. I wish him well in his new role as the UK Government’s Chief Scientific Adviser, for which he is uniquely qualified.
Hal is one of three senior leaders we appointed to the executive team last year. Luke Miels joined as our new President, Pharmaceuticals and is responsible for driving performance in the commercial organisation and will work closely with Hal to ensure alignment with R&D. Karenann Terrell also joined us in a new role as Chief Digital and Technology Officer. Karenann joins at a time when the overlap between healthcare and technology has never been more apparent and potentially transformative. Her role is to ensure GSK is at the forefront of this exciting new opportunity.
We have made a number of other changes in our senior leadership through the year, promoting great internal talent and bringing in fresh expertise from outside the company.
Performance and values based culture
Our ambition is to drive a high-performance culture, putting science at the heart of GSK, remaining true to our values and our purpose: to help people do more, feel better, live longer. We have a long history in tackling some of the world’s biggest health challenges. Our commitment to improving global health and being a responsible business will continue under my leadership.
Corporate Executive Team
| | | | | | | | |
| | | |
| |  
1 2 | |  
3 4 | |   
5 6 7 |
| |  
8 9 | |  
10 11 | |  
12 13 | | |
| | | | |
| | 1. Emma Walmsley | | 5. Simon Dingemans | | 10. Karenann Terrell | | |
| | Chief Executive Officer | | Chief Financial Officer | | Chief Digital & Technology Officer | | |
| | 2. Dr Hal Barron | | 6. Nick Hirons | | 11. Claire Thomas | | |
| | Chief Scientific Officer and | | Senior Vice President, Global Ethics | | Senior Vice President, | | |
| | President, R&D | | and Compliance | | Human Resources | | |
| | 3. Roger Connor | | 7. Brian McNamara | | 12. Phil Thomson | | |
| | President, Global Manufacturing | | CEO, GSK Consumer Healthcare | | President, Global Affairs | | |
| | and Supply | | 8. Luke Miels | | 13. Dan Troy | | |
| | 4. Luc Debruyne | | President, Global Pharmaceuticals | | Senior Vice President | | |
| | President, Global Vaccines | | 9. David Redfern | | and General Counsel | | |
| | | | Chief Strategy Officer | | | | |
| | >See pages 86 to 87 | | | | | | |
| | | | | | | | |
| | | | |
| GSK Annual Report 2017 | | Strategic report | | |
| | Governance and remuneration | | |
| | Financial statements | | |
| | Investor information | | |
| | | | |
Our great people and their commitment are foundational for GSK’s culture. During the year, we conducted a new global employee survey, aligned to our priorities, and I was pleased to see a meaningful improvement in employee engagement scores, which are an important driver of performance. Outlook Given the momentum we are seeing in our new products and recent launches, the operating performance improvements we are driving and the benefit of US tax reform, we are increasingly confident in our ability to deliver our 2020 outlook of mid to high single digit growth in Adjusted EPS CAGR (2016–2020 at 2015 CER). While we could see generic competition toAdvair in the US in 2018 our guidance for the year reflects this. Aside fromAdvair we do not expect to face significant generic erosion in the US until themid-2020s. Finally, I want to say thank you to GSK employees, partners and customers for their work in 2017 and especially for their support to me in my first year as CEO. I very much look forward to working with them in 2018 and beyond to deliver our long-term priorities and improved performance for GSK. 
Emma Walmsley Chief Executive Officer | | Technology is revolutionising healthcare New frontiers of innovation, such as genomics, are creating major opportunities for us – and patients. |
| | The ability to apply new technology across our R&D activities is creating a major opportunity for GSK. Currently, across the industry almost 90% of medicines entering trials fail and never reach patients. In part this is because we have an incomplete understanding of the link between the biological target of a drug and human disease. Pursuing drug targets with human genetic evidence to support the indication is estimated to double the probability of developing safe and effective medicines, and improve research and development productivity. In recent years, approximately 60% of GSK’s new targets have been supported by human genetic evidence. It is also why GSK was one of the first companies to make a multi-million pound investment in UK Biobank to support the generation of new genetic sequencing data from half a million volunteers. The information generated from this ground-breaking health resource will provide vital insights that we hope will inform and support the development of transformative medicines. | | We are also maximising the huge amount of data within GSK by applying artificial intelligence and machine learning to allow us to identify patterns that would have been almost impossible to identify using traditional methods. We can now model the right patient population and where to find them for our clinical trials, reduce or eliminate the need for some studies, and in some cases predict outcomes in a virtual patient. It is allowing us to more effectively manage diversity within our clinical trials to align with population demographics by analysing our clinical trials from the last ten years. GSK is connecting and bringing to life patient data from genomics, wearable devices, social media and other emerging sources, ensuring we can leverage the opportunities presented by these. |
Footnote We use a number of adjusted, non-IFRS, measures to report performance, as described on page 58. | |  |
| | |
| 08 | | |
GSK Annual Report 2017 | | |
| | |
| | |
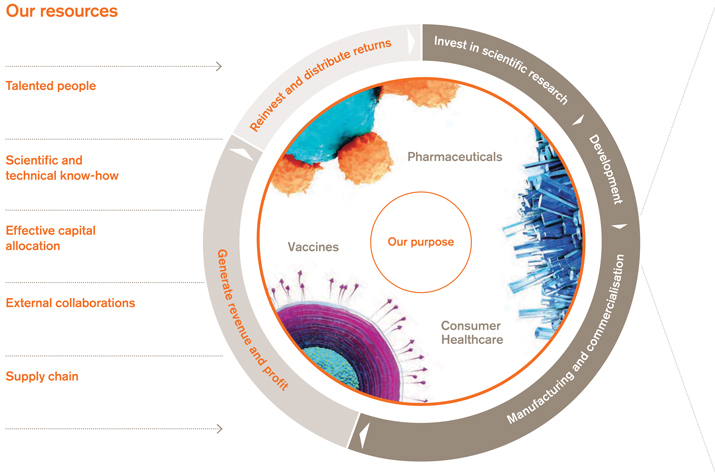
How we create long-term value

As ascience-led global healthcare company our three businesses have the common aim of improving health. On this page we describe the resources we rely on, how our business activities span the lifecycle of a product, and how we create long-term value for shareholders and society.
| | | | | | | | | | | | |
| | | | | | | |
| | | Our long-term priorities | | Our values | | | | Our expectations | | | | |
| | | Innovation Performance Trust | | Patient focus Transparency Respect Integrity | | | | Courage Accountability Development Teamwork | | | | |
| | | | | | | | | | | | | |
| | | | |
| GSK Annual Report 2017 | | Strategic report | | |
| | Governance and remuneration | | |
| | Financial statements | | |
| | Investor information | | |

| | |
| | |
| |
| | |
| | |
| | |
| |
| How we create value | | |
| |
Invest in scientific research | | |
| |
We invested £3.9 billion in research and development to bring new medicines, vaccines and consumer healthcare products to patients, payers and consumers. Strategic business development, including external partnerships and joint ventures, supports our in-house scientific research. | | |
| |
| |
| |
| |
| |
Generate revenue and profit | | |
We generate revenue by executing new product launches brilliantly and from the sales of our existing portfolios. Each of our three businesses now has an integrated strategy with one P&L, which enables us to drive competitive costs, margins and cash flow across the company. | | |
| |
| |
| |
| |
Reinvest and distribute returns | | |
As part of our capital allocation framework we reinvest in our three businesses and also provide returns to shareholders in the form of dividends. | | |
| |
| | | | | | |
| | | The value we create |
| | |
| | | For shareholders |
| | | We aim to deliver sustained industry-leading growth with competitive costs, margins and cash flow. We distribute capital to shareholders in the form of dividends. |
| | | | | | | |
| | | 31.4p | | | | 111.8p |
| | | Total earnings per share | | | | Adjusted earnings per share |
| | | | |
| | | | | | | |
| | | £3.9bn | | | | 80p |
| | | 2017 dividends declared | | | | 2017 dividend per share |
| | | | | | | | | | |
| | |
| | | For patients and consumers |
| | | We aim to bring our differentiated, high-quality and needed healthcare products to as many people as possible. |
| | | | | | |
| | | | | | | | | | | |
| | | 1.9bn | | | | 798m | | | | 6.2bn |
| | | Packs of medicine sold | | | | Vaccines sold | | | | Consumer Healthcare
products made |
| | | | | | |
| | |
| | | For employees and society |
| | | We want to run our company responsibly and ethically, and be a modern employer with strong employee engagement. We make a positive contribution to communities in which we operate through creating employment, working with suppliers and paying tax. |
| | |
| | | | | | | |
| | | 98,462 | | | | £1.34bn |
| | | Employees | | | | Cash tax paid |
| | | | |
| | | Footnote | | | | |
| | | We use a number of adjusted, non-IFRS, measures to report performance, as described on page 58. |
| | |
| | |
| 10 | | |
GSK Annual Report 2017 | | |
| | |
| | |
| | | | |
| GSK Annual Report 2017 | | Strategic report | | |
| | Governance and remuneration | | |
| | Financial statements | | |
| | Investor information | | |
| | |
12 | | |
GSK Annual Report 2017 | | |
| | |
| | |
Our long-term priorities

Innov
A strong patient and payer focused pipeline, with the most competitive claims and labels, and brilliant execution of our launches.
| | | | |
13 | | |
| GSK Annual Report 2017 | | Strategic report | |  |
| | Governance and remuneration | | |
| | Financial statements | | |
| | Investor information | | |

ation
| | | | |
Read more about Innovation | | |
| | | | |
| | | |
| Innovation in | | 
| | |
| Pharmaceuticals | | |
| | | |
> See pages 24–27 | | |
| | | | |
| | �� | |
| Innovation in | |
| | |
| Vaccines | | |
| | | |
> See pages 32–33 | | |
| | | | |
| | | |
| Innovation in | |
| | |
| Consumer Healthcare | | |
> See pages 38–39 | | |
| | |
14 | | |
GSK Annual Report 2017 | | |
| | |
| | |
Our long-term priorities

Perfor
Sustained industry-leading growth with competitive costs, margin and cash flow.
| | | | |
15 | | |
| | | | |
| GSK Annual Report 2017 | | Strategic report | |  |
| | Governance and remuneration | | |
| | Financial statements | | |
| | Investor information | | |

mance
| | | | |
Read more about Performance | | |
| | | | |
Performance in | | 
| | |
| Pharmaceuticals | | |
> See pages 28–29 | | |
| | | | |
Performance in | |
| | |
| Vaccines | | |
> See pages 34–35 | | |
| | | | |
Performance in | |
| | |
| Consumer Healthcare | | |
> See pages 40–41 | | |
| | | | |
| | 16 | | |
| | GSK Annual Report 2017 | | |
| | | | |
| | | | |
Our long-term priorities

Trust
Maximising our social impact, ensuring the reliable supply of our high-quality products to as many people as possible, and having highly engaged employees.
| | | | |
17 | | |
| | | | | |
| GSK Annual Report 2017 | | Strategic report | |  |
| | Governance and remuneration | | |
| | Financial statements | | |
| | Investor information | | |

| | | | | | | | |
Read about Trust across all three businesses |
| | | | | | | | |
Addressing global health through science > See pages 44–45 | |  | | | | Sustainable access to our high-quality products > See pages 46–47 | | |
| | | | | | | |
Modern employer > See pages 48–49 | | | | | | Ethical conduct and environmental sustainability > See pages 50–51 | | |
| | | | | | | | |
| | |
| 18 | | |
GSK Annual Report 2017 | | |
| | |
| | |
How we measure success

| | | | |
We have identified ten operating Key Performance Indicators (KPIs) to track progress against our new long-term priorities: | | |
Innovation | | Innovation sales, pipeline value and progress | | |
Performance | | Turnover, profit, cash flow, market share, top talent in key roles | | |
Trust | | Supply service levels, employee engagement, corporate reputation | | |
Here we provide performance data for the operating KPIs we are reporting externally. Due to commercial sensitivities, we are not planning to publish data for all operating KPIs. Pay for performance The Remuneration policy used to reward the performance of our executives includes measures linked to our KPIs (see pages 116, 120 and 122). | | |
| | | | | | |
| | | Group turnover | | | | |
| | | £30.2bn | | AER +8% | | |
| | | CER +3% | | |
| | | |
| | | 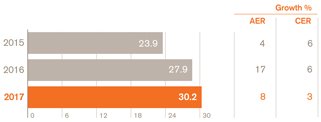 | | |
| | | How we performed Group turnover for the year increased 8% AER, 3% CER to £30.2 billion, with growth delivered by all three businesses. Pharmaceuticals sales were up 7% AER, 3% CER reflecting the continued strong growth of the new Respiratory and HIV products, partly offset by declines in older Respiratory products. Vaccines sales were up 12% AER, 6% CER, reflecting a strong performance from meningitis and influenza vaccines. Consumer Healthcare sales grew 8% AER, 2% CER reflecting a strong performance from power brands in the Pain and Oral health categories, partly offset by the impact of continued competitive pressures in the US allergy category and a broader market slowdown. | | |
| | | | | | |
| | | Operating profit and margin | | | | |
| | | | |
| | | Total £4.1bn | | | | |
| | | Adjustedc £8.6bn | | | | |
| | | | |
| | | 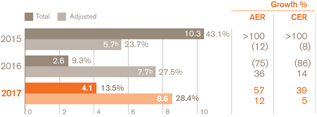
How we performed Total operating profit was £4.1 billion, 57% higher on an AER basis, 39% higher CER. Adjusted operating profit was £8.6 billion, 12% higher on a AER basis, 5% higher CER. The Adjusted operating margin of 28.4% was 0.9 percentage points higher than in 2016 and 0.4 percentage points higher on a CER basis. This reflected improved operating leverage driven by sales growth together with a more favourable mix and continued tight control of ongoing costs across all three businesses. Linked to remuneration | | | | |
| | | | |
| | | Earnings per share | | |
| | | |
| | | Total 31.4p | | |
| | | Adjustedc 111.8p | | |
| | | |
| | | 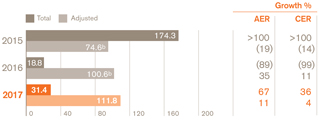
How we performed The increase in total earnings per share reflected the reduced impact of charges arising from the revaluations of the liabilities for contingent consideration and the put options associated with the Group’s HIV and Consumer Healthcare businesses, the benefit from Swiss tax reform and improved performance by the relevant businesses, partly offset by charges arising from US tax reform. Adjusted earnings per share of 111.8p was up 11% at AER, 4% CER in line with guidance provided in July 2017. | | |
| | | | |
| GSK Annual Report 2017 | | Strategic report | | |
| | Governance and remuneration | | |
| | Financial statements | | |
| | Investor information | | |

| | | | |
| | |
New product/innovation sales | | | | |
£6.7bn | | | | |
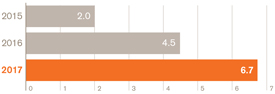 | | | | |
Definition | | | | |
| In 2015, we identified a series of New Pharmaceutical and Vaccine products that were expected to deliver at least £6 billion of revenues per annum on a CER basis by 2020. A full list of the products included in this definition is provided on page 60. | | | | |
| | |
How we performed Sales of New Pharmaceutical and Vaccine products were £6.7 billion, an increase of 51% at AER, 44% CER and represented approximately 30% of Pharmaceuticals and Vaccines turnover in the year. At 2015 exchange rates, the equivalent value of the 2017 sales was £5.7 billion. Linked to remuneration | | | | |
| | |
| | |
Free cash flow | | |
£3.4bn | | |
 | | |
Definition | | |
The calculation of free cash flow is described on page 58 and a reconciliation is provided on page 71. How we performed We have increased free cash flow by over £400 million after investing in the Priority Review Voucher and approximately £450 million into inventory, primarily to support the new launches. Linked to remuneration | | |
| | |
| | |
Dividends declared £3.9bn | | |
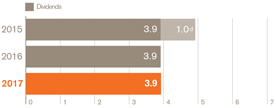 |
How we performed For both 2016 and 2017 we declared dividends to shareholders of 80p per share, giving a total return of £3.9 billion in each year. | | |
| | | | |
| | | | | |
| | |
| Employee engagement | | |
| 79% | | |
favourable responses to our global employee survey Description We now measure employee engagement twice annually by inviting all GSK employees to participate in a global employee survey. Our engagement KPI is based on favourable responses to four questions: pride in the company, feeling valued as an employee, having the opportunity to do meaningful and challenging work, and recommending GSK as a great place to work. In 2017, 83% of employees participated in our new survey; our engagement score was 79% and we have set this as the baseline for future improvement. The score represented a 10% increase from 2015 for three of the four questions directly comparable. | | |
Footnotes
| a | | Revised to include all contingent consideration payments. |
| b | | Adjusted results now exclude only significant legal charges per revised definition on page 58. Prior year figures have been revised. |
| c | | We use a number of adjusted,non-IFRS, measures to report the performance of our business, as described on page 58, including Adjusted results, free cash flow and CER growth rates.Non-IFRS measures may be considered in addition to, but not as a substitute for or superior to, information presented in accordance with IFRS. |
| d | | 2015 includes special dividend. |
| | |
| 20 | | |
GSK Annual Report 2017 | | |
| | |
| | |
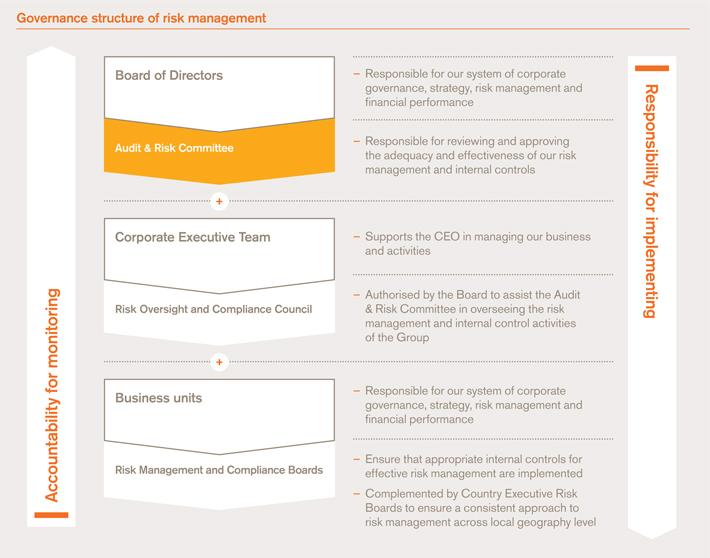
How we manage risk

Our principal risks are regularly reviewed by the CET. Below we list the principal risks managed across the Group in 2017, including our assessment of any change in the risk during the year due to macro events or mitigating GSK activities.
| | | | | | | | | | |
Risk description | | | | Assessment and mitigating activities | | | | Macro
environment | | GSK
exposure post mitigation |
| | | | | | | | |
Patient Safety Failure to appropriately collect, review, follow up, or report adverse events from all potential sources, and to act on any relevant findings in a timely manner. | | | | – The macro environment remained unchanged, with patient safety regulation and Good Pharmacovigilance Practices remaining consistent. – The GSK exposure level remained unchanged. The risk has been maintained at an appropriate level through continued strong oversight, by further developing our capabilities to detect safety issues, and by making key safety processes and standards simpler and more effective. | | | |  | |  |
| | | | | | | | |
Product Quality Failure to comply with current Good Manufacturing Practices or inadequate controls and governance of quality in the supply chain covering supplier standards, manufacturing and distribution of products. | | | | – The macro risk level remained unchanged, with continuing industry-level regulatory scrutiny of data integrity, drug shortages, and an expectation of timely communication of issues with authorities. – The GSK exposure level remained unchanged. The risk has been maintained at an appropriate level through our effective response to external inspections in 2017 and continuous improvement in data integrity programmes and our quality management system. | | | | | | |
| | | | | | | | |
Financial Controls & Reporting Failure to comply with current tax law or incurring significant losses due to treasury activities; failure to report accurate financial information in compliance with accounting standards and applicable legislation. | | | | – The macro risk level remained unchanged, due to no material increase in financial reporting requirements. – The GSK exposure level reduced due to our strong risk management and governance approach and further embedding of system changes, controls standardisation and process simplification. | | | | | |  |
| | | | | | | | |
Anti-bribery & Corruption (ABAC) Failure of GSK employees, complementary workers and third parties to comply with our ABAC principles and standards, as well as with all applicable legislation. | | | | – The macro risk level increased due to more stringent ABAC laws and a rise in enforcement by regulators. – The GSK exposure level remained unchanged as we enhanced our use of data to better inform business decisions, strengthened our management of ABAC risk in our third party network and introduced an improved ABAC standard further clarifying our stance on expected behaviours. Government investigations regarding our China and other business operations are ongoing (see page 230). | | | |  | | |
| | | | | | | | |
Commercial Practices Failure to engage in commercial activities that are consistent with the letter and spirit of the law, industry, or the Group’s requirements relating to marketing and communications about our medicines and associated therapeutic areas; appropriate interactions with healthcare professionals (HCPs) and patients; and legitimate and transparent transfer of value. | | | | – The macro risk level increased due to greater competitive pressure, increased regulatory enforcement and an expansion of digital marketing, where laws and regulations are still evolving. – The GSK exposure level remained unchanged as we continued to develop robust controls over mature commercial practices in order to apply appropriate oversight and assurance across markets. In 2017, as we increased digital capability across GSK, we enhanced our internal controls to mitigate risk. | | | | | | |
| | | | |
| GSK Annual Report 2017 | | Strategic report | | |
| | Governance and remuneration | | |
| | Financial statements | | |
| | Investor information | | |

| | | | | | | | | | | | |
Arrows key | | | | | | | | | | |
| | | | | | |
 | | Increased risk | |  | | No change to risk | |  | | Decreased risk | | |
| | | | | | | | | | | | | | |
Risk description | | | | | | Assessment and mitigating activities | | | | | | Macro
environment | | GSK
exposure post mitigation |
Research practices Failure to adequately conduct ethical and soundpre-clinical and clinical research. In addition, failure to engage in scientific activities that are consistent with the letter and spirit of the law, industry, or the Group’s requirements, and failure to secure adequate patent protection for GSK’s products. | | | | | | – The macro risk level remained unchanged despite evolving regulation, and continuing industry-level regulatory scrutiny of data integrity. – The GSK exposure level remained unchanged. The risk has been maintained at an appropriate level through our strengthened governance structure, which includes enterprise-wide management of risk and enables better information sharing, and an increased focus on IT systems, data and analytics. | | | | | |
| | 
|
| | | | | | | | | | | | | | | |
Third party oversight (TPO) Failure to maintain adequate governance and oversight over third-party relationships and failure of third parties to meet their contractual, regulatory, confidentiality or other obligations. | | | | | | – The macro environment has remained unchanged as the industry continues to be vigilant about third-party risks in global sourcing and supply, and consumer and investor expectations mature. – The GSK exposure level reduced following theroll-out of our TPO programme, which risk assessed over 95% of our third parties with whom we directly engage. This will enable us to identify and manage risks consistently and proportionately. Improvement plans are in place where required and the insights from the programme have informed sourcing processes to further mitigate risk. | | | | | |
| |
|
| | | | | | | | | | | | | | | |
Environment, health & safety and sustainability (EHS&S) Failure to manage environment, health and safety and sustainability risks in line with our objectives and policies and with relevant laws and regulations. | | | | | | – The macro risk level increased due to greater emphasis on the environment and antimicrobial resistance, increasing emerging market regulation, the potential impact of EU chemicals legislation and the greater use of third parties to develop pipeline assets. – The GSK exposure level remained unchanged due to continued execution of our enterprise strategy and our strengthening of EHS&S controls. | | | | | |
| |
|
| | | | | | | | | | | | | | | |
Information protection The risk to GSK business activities if information becomes disclosed to those not authorised to see it, or if information or systems fail to be available or are corrupted, typically because of cybersecurity threats, although accident or malicious insider action may be contributory causes. This also includes the risk of failure to collect, secure, and use personal information in accordance with data privacy laws. | | | | | | – The macro risk level continued to increase as the threat against the pharmaceutical business and industry generally became more sophisticated and targeted, as evidenced by the Wannacry and NotPetya global incidents, and new regulations were introduced, including the EU General Data Protection Regulation. – Despite this, the GSK exposure level remained unchanged due to further development of our programme to safeguard against cyber-attacks and protect critical information and systems, and our ability to balance the demands of regulation with our digital transformation, which involves increased data collection and analysis. | | | | | |
| |
|
| | | | | | | | | | | | | | | |
Supply chain & crisis management Failure to deliver a continuous supply of compliant finished products; inability to respond effectively to a crisis incident in a timely manner to recover and sustain critical operations, including key supply chains. | | | | | | – The macro risk level remained unchanged with ongoing stringent regulation, a continued US focus on contract manufacturers outside the US/EU, and increasing data integrity expectations. – The GSK exposure level reduced due to improved risk management of our supplier portfolio, progress in completing supply remediation programmes, and improvements to our crisis and continuity management framework. | | | | | |
| |
|
| > | For more information see pages 257 to 266 |
| > | See page 57 for our viability statement |

| | | | |
| 23 | | |
| | | | | |
| GSK Annual Report 2017 | | Strategic report | |  |
| | Governance and remuneration | |
| | Financial statements | |
| | Investor information | | |
Pharmaceuticals
Our Pharmaceuticals business has a broad portfolio of innovative and established medicines. We are focused on developing new medicines in respiratory, HIV, oncology andimmuno-inflammation, with discovery research exploring these and other areas.
| | | | | | | | |
Pharmaceuticals sales were up 7% AER, 3% CER, reflecting the continued strong growth ofNucala and ourEllipta portfolio in Respiratory, andTivicay andTriumeq in HIV. | | | | In 2017 we had two significant Pharmaceutical approvals:Trelegy Ellipta, which provides three medicines in a once a day, single inhaler to treat COPD; andJuluca, the first2-drug regimen, once-daily, single pill for HIV, which helps to reduce the amount of medicines patients need. Pharmaceuticals turnover | | | £m | |
| | | | Respiratory | | | 6,991 | |
| | | | HIV | | | 4,350 | |
| | | | Immuno-inflammation | | | 377 | |
| | | | Established Pharmaceuticals | | | 5,558 | |
| | | | Total | | | 17,276 | |
| | | | | | | | |
| | | | | | | | |
| | | | | | | | |

Footnote
We use a number of adjusted,non-IFRS,
measures to report performance, as
described on page 58.

Dave, oncology scientist, UK
We have joined forces with our partners to rapidly evolve the science of immuno-oncology, in one area we are working on increasing the ability of the body’s immune system to help detect and attack cancer cells.

Fran, cancer survivor and GSK employee
What’s next
| | | | |
Innovation in Pharmaceuticals > See pages 24–27 | | | 
| |
| | | | |
Performance in Pharmaceuticals > See pages 28–29 | | |
| |
| | | | |
We report on our Trust priority across all three businesses > See pages 42–51 | | |
| |
| | |
| 24 | | |
GSK Annual Report 2017 | | |
| | |
| | |
Pharmaceuticals
| | | | |
| Innovation | | Our priority is to strengthen our Pharmaceuticals business by focusing on fewer assets, improving the R&D and commercial interface, and with brilliant execution of launches. |
| | | | |
| | Our Pharmaceuticals business continues to grow and we are global leaders in Respiratory and HIV. In 2017, we had twobest-in-class medicines approved:Trelegy Ellipta, our once-daily triple therapy for chronic obstructive pulmonary disease (COPD) in a single inhaler; andJuluca, the firsttwo-drug regimen, once-daily, single pill for HIV. We also made important progress across our pipeline assets. Delivering best-in-class innovation We need to focus on medicines with the greatest potential, back them and stop other projects. Following a review of our drug development process, we are focusing on priority assets in two areas where we are world leaders – Respiratory and HIV – and two potential areas – Oncology andImmuno-inflammation. To ensure we have sufficient funding and resource for our priority areas and medicines – those where GSK can support more patients and strengthen our existing business over the long term – we terminated more than 60pre-clinical and clinical programmes. These included ending our collaboration with Janssen Biologics on sirukumab and starting the process of identifying a new owner for our rare disease gene therapy medicines. | | We have created a more integrated, competitive Pharmaceuticals business by significantly strengthening the existing partnership between R&D and commercial. We have made several significant leadership appointments including Hal Barron, Chief Scientific Officer and President of R&D, and Luke Miels, President, Global Pharmaceuticals. Both are highly respected leaders with a track record of bringing new medicines to market. Respiratory We have been a leader in respiratory medicine for nearly 50 years and remain at the forefront of scientific research in this area, offering innovative medicines aimed at treating patients’ symptoms and reducing the risk of their disease worsening. Trelegy Ellipta During the year, we gained US and European regulatory approval forTrelegy Ellipta, our new once-daily triple therapy for COPD in a single inhaler. This launch adds to our portfolio of once-daily, inhaled respiratory medicines – the broadest in our industry. We also achieved positive headline results from theTrelegy Ellipta phase III IMPACT study. The 10,000+ patient study found the once-daily triple therapy achieved significant reductions in moderate/severe exacerbations for COPD patients when compared with two other once-daily dual medicines from ourEllipta portfolio. We have submitted additional regulatory filings supported by the IMPACT data, with the aim of expanding the patient population forTrelegy Ellipta in COPD. We are also investigating the efficacy and safety ofTrelegy Ellipta in a phase III study (CAPTAIN) as a treatment for patients with asthma. |
| | | | |
| GSK Annual Report 2017 | | Strategic report | | |
| | Governance and remuneration | | |
| | Financial statements | | |
| | Investor information | | |
| | | | |
| | | Strategy in action | | |
| | “Scientific innovation is at the heart of GSK and is our highest priority as we build the next wave of growth for the company.” 
| | |
| | Dr Hal Barron Chief Scientific Officer and President, R&D | | |
Other respiratory assets
We continue to lead in respiratory biologics and believeNucala (mepolizumab) offers a highly competitive profile. We received FDA approval for an additional indication for mepolizumab, as the first targeted treatment for uncontrolled eosinophilic granulomatosis with polyangiitis (EGPA). We have also submitted a regulatory file for mepolizumab for the treatment of COPD.
Our other priority respiratory assets also target COPD and are in phase II trials: danirixin, afirst-in-class oral CXCR2 antagonist, and nemiralisib, a highly selectivefirst-in-class phosphatidylinositol3-kinase delta (PI3Kd) inhibitor.
HIV
We have a long-standing commitment to HIV and are investigating new paradigms for treatment, prevention and cure.
Dolutegravir is the number one core agent globally, and through the success ofTivicay andTriumeq, it offers important benefits for a wide range of patients. It can be used without the need for a booster, and showed superior efficacy in five different clinical studies. It is generally well tolerated and has a high barrier to resistance and few interactions with commonly used medications.
Today, due to advances in antiretroviral therapy (ART), people living with HIV have near normal life expectancies compared to the general population, but may spend decades on HIV treatment. Our innovative research into2-drug regimens (2DR) was initiated in response to physician and patient demand to reduce long-term ART exposure.
Juluca
In November, we received US FDA approval forJuluca, a once-daily, single pill 2DR regimen for HIV.Juluca combines dolutegravir with rilpivirine (Edurant, a Janssen medicine) and is a complete regimen for treating HIV in adults who are virologically suppressed and have no resistance. The SWORD studies of over 1,000 patients in phase III trials showedJuluca achievednon-inferior viral suppression compared with traditional3-drug regimens. Through the purchase and use of a Priority Review Voucher, we accelerated this approval in the US. Following our June 2017 submission to the European Medicines Agency (EMA) for regulatory approval, we expect a response in 2018.
Other HIV assets
Our 2DR clinical trial programme now consists of eight phase III clinical trials, two of which have completed (SWORD studies) and support approval ofJuluca, with four other studies due to report in 2018.
Dolutegravir and lamivudine is being investigated versus a traditional3-drug regimen for treatment-naive HIV patients in the GEMINI 1 & 2 studies, and in the TANGO trial for patients who have achieved viral suppression on a tenofovir alafenamide fumarate (TAF)-based regimen.
The long-acting 2DR of cabotegravir and rilpivirine, is being investigated for administration every four weeks in virally suppressed adults withHIV-1 infection (ATLAS and FLAIR). In addition, the ATLAS 2M study has started to investigate administration every two months.
We also have two phase III studies that began in 2017 to evaluate cabotegravir as a long-acting monotherapy in the prevention of HIV. These trials are being conducted through a public-private funding collaboration.
| | |
| 26 | | |
GSK Annual Report 2017 | | |
| | |
| | |
Pharmaceuticalscontinued
|
> Read more about our Pharmaceuticals pipeline on pages 251 to 252 |
Oncology
In Oncology, we are focused on delivering transformational therapies that can lengthen the lives of patients with cancer. In 2017, we made significant progress in our emerging portfolio of next generation therapies in the areas of immuno-oncology, cell therapy and epigenetics.
Our 2857916 monoclonal antibody against BCMA has the potential to target a number of tumour types, including relapsed and refractory multiple myeloma. Promising early results suggest a highly competitive profile compared with existing approved treatments for multiple myeloma. It has been granted European PRIME and FDA breakthrough status, potentially resulting in faster review by the regulatory authorities when it is filed.
We exercised our option to gain an exclusive global licence from Adaptimmune for 3377794, an investigational SPEART-cell receptor targetingNY-ESO-1, and were granted European PRIME and FDA breakthrough status. Another oncology therapy, 3359609, is the first investigational inducibleT-cell costimulator (ICOS) agonist antibody to enter human clinical trials. Both of these assets are in phase I/II trials.
Immuno-inflammation
Immuno-inflammatory diseases are relatively common, chronic and debilitating conditions, for which there remains significant unmet medical need. To discover the next breakthrough for immune-mediated diseases, we are focusing on transformational medicines that could potentially alter the course of inflammatory disease and induce sustainable remission.
We received approval in the US and EU for a new subcutaneous (SC) formulation ofBenlysta, our treatment for systemic lupus erythematosus, which enables either home or hospital administration of the medicine. We also received approval in Japan for the use ofBenlysta for the first time.
We have two phase IIimmuno-inflammation priority assets: 3196165, a monoclonal antibody which blocks the effect of anti-granulocyte-macrophage colony stimulating factor(GM-CSF), for rheumatoid arthritis and osteoarthritis, and 2982772, a receptor interactingprotein-1 (RIP1) kinase inhibitor for psoriasis, ulcerative colitis and rheumatoid arthritis.
Future pipeline optionality
Outside our core therapy areas, we have a number of other promising programmes, including two late-stage priority assets: oral daprodustat, in phase III trials for anaemia associated with chronic renal disease, and ananti-SAP therapy for amyloidosis, currently in phase II.
| | | | | | |
 | | Strengthening the R&D commercial interface 
| | | | Ensuring there is a strong partnership between our R&D and commercial functions is a priority for us. This will help ensure we deliver differentiated medicines with the most competitive profiles and robust evidence plans to compete effectively in today’s dynamic market. A single strategy across R&D and commercial will ensure alignment and focus across the business. We are simplifying our processes to eliminate complexity, and in parallel, strengthening our commercial and medical resource to drive performance. |
| | | | |
| GSK Annual Report 2017 | | Strategic report | | |
| | Governance and remuneration | | |
| | Financial statements | | |
| | Investor information | | |
| | | | |
|
| | Strategy in action “Digital technology will transform many aspects of how we develop new medicines and interact with our customers.” 
Karenann Terrell Chief Digital & Technology Officer | | |
Accelerating priority assets
We are improving the pace of our medicines development by enhancing ourspeed-to-clinical decision making through changes to our governance and by adapting the way we design and conduct our clinical trials.
To support this acceleration we established a new Board committee of global scientific experts, the Science Committee, to ensure that emerging scientific and medical knowledge is integrated into our strategic planning. In addition, a new Development Advisory Committee will provide the Board with strategic guidance on all aspects of our current and future development activity, with full consideration of emerging trends and alternative approaches. See page 109 for more information.
Our early research infrastructure – around 25 discovery performance units (DPUs) with their own project accountabilityand budgets – encourages a competitive dimension to proposed areas of discovery research and capital allocation.
New technology frontiers
Digital technology is having an impact on every part of our business and our goal is to harness these developments in data-rich, information-based medicine to accelerate our drug discovery and development, and drive our business forward.
Collaborations remain key to our innovation. During the year, we joined forces with two external companies to harness artificial intelligence (AI): Exscientia, a UK specialist in machine-learning; and Insilico Medicine, a US leader inAI-led drug discovery.
We alsoco-founded the private-public Accelerating Therapies for Opportunities in Medicine (ATOM) consortium, based in the US. This aims to cutpre-clinical cancer drug discovery from six years to just one, using supercomputers to analyse data from failed R&D programmes with the aimof finding patterns and vital clues to aid successful future development. We are also supporting the UK Biobank, a ground-breaking initiative to generate anonymised genetic sequence data from 50,000 volunteer participants to deliver insights into why some people are at greater risk of disease. In addition, we continue to work on the Open Targets programme, which supports an open access search engine that searches, evaluates and integrates biologic and genetic disease data.
| | |
| 28 | | |
GSK Annual Report 2017 | | |
| | |
| | |
Pharmaceuticalscontinued
| | |
| Performance | | Pharmaceuticals sales were up 7% AER, 3% CER, reflecting the continued strong growth of our new Respiratory and HIV products. |
2017 performance summary
Pharmaceuticals turnover in 2017 was £17,276 million, up 7% AER, 3% CER. In the US, total sales were £7,568 million, up 11% AER, 6% CER primarily driven by new Respiratory and HIV products. In Europe sales were £3,983 million, up 3% AER but down 3% CER, reflecting the continued transition of the Respiratory portfolio, generic competition toKivexaand the disposal of the Romanian distribution business. International sales were £5,725 million, up 6% AER and 4% CER.
Respiratory sales were up 7% AER, 3% CER to £6,991 million. New Respiratory products recorded combined sales of £1,930 million in 2017, more than offsetting the decline inSeretide/Advair.
HIV sales increased 22% AER, 16% CER to £4,350 million in the year. The growth was driven by continued increases in market share forTriumeq andTivicay, partly offset by the impact of generic competition toEpzicom/Kivexa, particularly affecting the European market.
Immuno-inflammation sales were £377 million, up 11% AER, 6% CER in the year.
Sales of Established Pharmaceuticals were £5,558 million, declining 2% AER,
5% CER, reflecting a three percentage point impact from recent divestments ofnon-core assets.
The Pharmaceuticals operating margin was 34.3%, up 0.2 percentage points AER but down 0.6 percentage points CER primarily reflecting increased R&D investment, including using a Priority Review Voucher in Q2 2017. The lower operating margin also reflected increased investment in new product support, as well as the continued impact of lower prices, particularly in Respiratory, partly offset by a more favourable product mix, primarily driven by the growth in HIV sales, and the continued cost reduction benefit of the Group’s Pharmaceuticals restructuring programme.
| | | | | | | | | | | | | | |
| | | | | | | | | | | | | | |
| | | | | Delivering world class capability 
| | Our ambitious commercial efforts are focused on driving the continuous growth of our priority brands in our largest markets, most notably the US. Our R&D teams continue to generate evidence from clinical trials to support the right patients for each medicine, as well as the differentiation of our brands. In 2017, strategic use of data and analytics has enabled us to optimise the role, engagement and training of our salesforce. This has helped make sure their knowledge of the disease, our strategy and the competitive environment have led to truly competitive customer engagement from day one of launch. | | For our asthma medicine,Relvar/Breo Ellipta, this focus on target customer groups helped this medicine become the first of our new Respiratory portfolio to be a £1 billion brand, helping over four million patients this year. | | | | |
| | | | | | | | | | | | | | |
| | | | |
| GSK Annual Report 2017 | | Strategic report | | |
| | Governance and remuneration | | |
| | Financial statements | | |
| | Investor information | | |
| | | | |
| | | Strategy in action “Strong sales of our new products show we can achieve great things when we are focused.” 
Luke Miels President, Global Pharmaceuticals | | |
2020 outlook
Over the five years to 2020 we expect a low single-digit CAGR for sales (at 2015 exchange rates) despite a higher level of divestments over the period than we originally expected. Strong performances from our new medicines together with disciplined cost management are expected to enable the business to achieve an operating margin in the low 30s percentage range in 2020 (at 2015 exchange rates) even if an automatically substitutable generic version ofAdvair is launched in the US.
Driving performance for profitable, sustainable growth
In 2017, we refocused our Pharmaceuticals business to make it stronger and more competitive in order to deliver improved, sustainable returns. Under the leadership of Luke Miels, we have simplified our commercial management structure and reshaped our operations. We are aggressively reallocating resources to those areas best able to deliver profitable sustainable growth and returns, with much more focus on new medicines and major markets.
The changes we are making will drive sharper prioritisation, a simpler portfolio, faster decision making, more effective capital allocation and a strong focus on execution.
In 2017, we began streamlining our Pharmaceuticals products portfolio by exiting from or divesting 90non-core brands and we are on track to reach our goal of about 20% fewer brands. This included announcing an end to the manufacture and sale of the type 2 diabetes therapyEperzan/Tanzeum which we now expect to end during 2018. In addition, we announced a strategic review of our cephalosporins antibiotics business with an option to sell.
We are restructuring our emerging markets business to improve growth, profitability and sustainability while continuing to ensure access for the patients that need our medicines. Simplifying the geographies, reducing organisational layers and simplifying our cost structures, including moving to an export model in some markets, will support faster, more aligned execution.
Creating a simpler, competitive supply chain
We are simplifying our manufacturing and supply chain to achieve competitive and sustainable performance – delivering strong results in the fundamentals of safety, quality and service, as well as improved financial performance. We are focused on fewer priorities, removing waste and making things simpler. Our current plans address productivity improvement, procurement savings and working with our supplier base to prioritise fewer, more strategic supplier relationships. We are on track to reduce our suppliers by approximately 30% – leveraging our scale and standardising specifications to use fewer bespoke materials and improving our cost of goods.
We continue to invest in our manufacturing network and advanced manufacturing technologies which have the potential to improve product quality while reducing material waste and lead times for new capacity. Our work with continuous processing is well advanced and, where deployed, could reduce cost of goods by up to 20% in the long term.
Digital transformation
Our goal is to apply digital technology that delivers truly competitive customer engagement to drive better performance.
Our investment in this area is underpinned by our appointment of Karenann Terrell as Chief Digital and Technology Officer, who joined in September 2017 to help drive a digital transformation programme across our three businesses.
Across the Pharmaceuticals business we are using new technologies to improve performance with an increased focus on improving the customer experience. This includes customer-centric integrated campaigns and personalised content to help healthcare professionals deliver better patient outcomes and to drive preference for our brands.
|
Footnote |
We use a number of adjusted,non-IFRS, measures to report performance, as described on page 58. |

| | | | |
| GSK Annual Report 2017 | | Strategic report | | |
| | Governance and remuneration | | |
| | Financial statements | | |
| | Investor information | | |
| | | | |

| | | | |
| |  | | |
| | Virginie, Laboratory Technician, | | |
| | Vaccines R&D | | |
| | Our new vaccineShingrix represents a significant advance in vaccine technology and has clinically demonstrated a strong and sustained immune response and effficacy against shingles and its painful complications. | | |
| | 
| | |
| | Alain, shingles sufferer and GSK employee | | |
| | | | |
| | | | |
| | | | |
| | | | |
| | | | |
| | | | |
| | | | |
| | | | |
| | | | |
Vaccines
Our Vaccines business has a broad portfolio and innovative pipeline of vaccines to help protect people throughout life. We deliver over two million vaccine doses per day to people living in over 160 countries.
Vaccines sales were up 12% AER, 6% CER, primarily driven by meningitis vaccines, withBexsero growing across all regions andMenveo in the US and Europe, and higher sales of influenza products, primarily in the US and Europe.
Footnote
We use a number of adjusted,non-IFRS,
measures to report performance, as
described on page 58.
During the year, we received US FDA approval forShingrix, our new vaccine which represents a new standard for the prevention of shingles.
| | | | |
| Vaccines turnover | | £m | |
Meningitis | | | 890 | |
Influenza | | | 488 | |
Shingles | | | 22 | |
Established Vaccines | | | 3,760 | |
Total | | | 5,160 | |
What’s next
| | | | |
Innovation in Vaccines > See pages 32–33 | | 
| | |
| | | | |
Performance in Vaccines > See pages 34–35 | |
| | |
| | | | |
We report on our Trust priority across all three businesses > See pages 42–51 | |
| | |
| | |
| 32 | | |
GSK Annual Report 2017 | | |
| | |
| | |
Vaccines
| | | | |
| Innovation | | Our advanced science and technology platform capability enables us to discover and develop vaccines that help protect people in over 160 countries from serious diseases. |
| | | | |
| | Our vaccines strategy is to bring differentiated, high-quality and needed vaccines to as many people as possible. We have global scale and are well positioned to take advantage of changing demographics. Vaccines are long-term assets without the volatility of patent cliffs, which provides opportunities to invest in life-cycle management and improve the competitive profile of our existing vaccines to better meet patient needs. We focus on finding new candidate vaccines to help protect people of all ages from disease and have a pipeline of 14 candidate vaccines currently in development. We believe that a core competitive advantage is our expertise in technology platforms which facilitates the development of more effective vaccines. Innovation in action In 2017, we received regulatory approval in the US and Canada forShingrix, with an efficacy of over 90%, which we believe provides a step change in the prevention of shingles. We anticipate it could driveone-third of Vaccines growth between 2015 and 2020. More than 90% of people over 50 are infected with the varicella zoster virus that causes shingles and one in three will develop shingles in their lifetime. | | Following approval by the US Food and Drug Administration (FDA) in October 2017, the competitive position ofShingrix has been further strengthened by recommendations from the US Centers for Disease Control and Prevention’s (CDC’s) Advisory Committee on Immunization Practices (ACIP) naming it as the preferred shingles vaccine for adults aged 50 and over. The recommendation includes revaccinating those who had previously received the competitor vaccine, meaning over 100 million people in the US will be eligible for theShingrixvaccine. In January 2018, we received a positive opinion from the European Medicines Agency’s (EMA’s) Committee for Medicinal Products for Human Use forShingrix. The results of regulatory filings forShingrix in Australia and Japan are also due in 2018. In addition, in December 2017 we announced new data confirming the safety and efficacy ofShingrix in immuno-compromised autologous haematopoietic stem cell transplant patients. Our commercial, manufacturing and R&D teams have worked closely together to ensure theShingrix launch is executed flawlessly. We are taking a staged approach to the global launch in order to manage the strong anticipated demand with reliable supply. |
| | | | | | |
| | | Breakthrough vaccine science 
| | | | Shingles is a painful and potentially serious condition.Shingrix was developed specifically to overcome theage-related decline in immunity and is the first shingles vaccine to combine anon-live antigen, to trigger a targeted immune response, with a specifically designed adjuvant system, AS01B, to make that response strong and sustained. This adjuvant is also used in our RTS,S vaccine for the prevention of malaria in children. |
| | | | |
| GSK Annual Report 2017 | | Strategic report | | |
| | Governance and remuneration | | |
| | Financial statements | | |
| | Investor information | | |
| | | | |
| | | |
| | | Strategy in action | | |
| | “With our global Vaccines R&D organisation, supported by unique technology platforms and talented people, we are developing vaccines to meet existing and emerging needs.” 
| | |
| | Emmanuel Hanon Senior Vice President, Head of R&D, Vaccines | | |
Delivering best-in-class innovation
We are aiming to develop assets which are best in class. Our investment in unique technology platforms, including adjuvants, is delivering a competitive advantage in targeting new, emerging and remaining medical needs.
Meningitis
Our focus is to maintain GSK’s meningococcal meningitis market leadership with both licensed and candidate vaccines. We aim to broaden the age range of our meningococcal vaccines in the US and demonstrate their impact in infants as well as meningococcal carriage in adolescents. In February 2018, we were granted Breakthrough Designation forBexsero in children aged 2 to 10 years. We are also working on new formulations, including a fully liquid presentation of our tetravalent vaccine for MenACWY,Menveo, which is expected to enter phase II clinical trials in 2018. The results from our phase III study of our booster forMenveo are expected in 2018. We are also committed to developing a single vaccine that tackles all five of the most common serogroups, A, B, C, W and Y.
Reflecting our active life-cycle management of our vaccines – where we strategically plan an asset’s commercial journey from its final clinical trials onwards – we continue to expand target populations and protection. In this way, we aim to extend patient benefits, increase use of our vaccines and be the leader in helping to prevent meningococcal disease.
In line with this approach, we are supporting an extensive study to examine if the meningococcal B vaccine reduces the spread of meningococcal bacteria in teenagers through ‘herd immunity’. This involves vaccinating 35,000 teenagers in South Australia, which has a high incidence of meningococcal B disease.
Other priority assets
Building on GSK’s existing respiratory leadership position through our Pharmaceuticals business, we have a number of candidate vaccines targeting respiratory diseases. These include our candidate vaccine for chronic obstructive pulmonary disease (COPD), which began a phase II proof of concept study in Europe in 2017. Other growth drivers in the respiratory portfolio are our respiratory syncytial virus (RSV) candidates, with different approaches tailored to each age group. We also have a research collaboration focused on tuberculosis, with our candidate vaccine currently in phase II trials.
We have developed the only malaria vaccine candidate to have received positive opinion from the European Medicines Agency (EMA) (see page 44).
New technology frontiers
We have new technologies, including adjuvant systems, structural vaccinology and synthetic vaccine platforms that are helping us move beyond observation and experimentation methods of vaccine development to create ‘vaccines by design’. These are made up of antigens, delivery systems and adjuvants that can help increase the immune system’s response to a vaccine.
GSK has been innovating in adjuvant systems for more than 25 years. Our unique approach has led to the development of several ‘adjuvant systems (AS) families’, which use a combination of adjuvants to achieve a better immune response and are fundamental to the next generation of our vaccines portfolio.
Our self-amplifying mRNA (SAM) technology uses the human body as a ‘factory’ to produce its own vaccines. SAM will not require traditional vaccine production methods, so could potentially enable us to produce vaccines more quickly and simply. We are in the early stages but data from a variety of animal models show SAM performs well.
External partnerships
Collaboration is central to our innovation. We have around 180 external scientific collaborations, with most of our 14 candidate vaccines being developed in partnership. Such collaborations enable our 2,000 Vaccines scientists at our global R&D centres, in the US, Belgium and Italy, to learn from other experts and stay close to emerging technologies. For example, we are involved in the phase II trial of an HIV vaccine with a group of NGOs and other pharmaceutical companies, led by the US National Institutes of Health.
|
> Read more about our Vaccines pipeline on page 253 |
| | |
| 34 | | |
GSK Annual Report 2017 | | |
| | |
| | |
Vaccinescontinued
| | | | |
Performance | �� | Demand for our world-leading meningitis portfolio contributed to a 12% AER, 6% CER increase in Vaccines sales. | | |
2017 performance summary
Vaccines sales grew 12% AER, 6% CER to £5,160 million, primarily driven by meningitis vaccines, withBexsero growing across all regions andMenveo in the US and Europe and higher sales of influenza products, primarily in the US and Europe.
Vaccines operating margin was 31.9%, up 0.8 percentage points AER and 1.3 percentage points higher on a CER basis. This was primarily driven by improved product mix, the benefit of a settlement for lost third-party supply volume, together with continued restructuring and integration benefits. This was partly offset by increased SG&A (selling, general and administration) resources to support business growth and new launches, increased supply chain costs and lower royalty income.
Meningitis
Meningitis sales grew 34% AER, 27% CER to £890 million.Bexsero sales growth of 43% AER, 34% CER was driven by new national immunisation programmes, private market sales and regional tenders in Europe, as well as growing demand in the US, together with strong private market sales in International.
Following 2017 launches in Argentina and Belgium,Bexsero is now available in 24 countries. The vaccine’s broad age indication provides competitive advantage in Europe, and in the US it offers the fastest series completion, with two doses administered in about one month.
Menveo sales grew 36% AER, 29% CER, primarily driven by the impact of favourableyear-on-year CDC stockpile movements, partly offset by supply constraints in International.
Influenza
Fluarix/FluLaval sales were up 18% AER, 12% CER to £488 million, reflecting strong sales execution, primarily in the US, and higher demand in Europe.
Shingles
Shingrix recorded initial sales to distributors of £22 million in the US after its FDA approval and favourable ACIP recommendations.
| | | | | | | | |
| | | | | | | | |
| | 
| | Over 22 million doses of our meningitis B vaccineBexsero have been distributed since its 2015 launch.Bexsero was developed using reverse vaccinology, which decodes the genome sequence of meningitis B and selects the most effective protein candidates for use in the vaccine.Bexsero is part of national immunisation programmes in the UK, Andorra, Ireland and Italy. In the US,Bexsero current market share represents approximately 70% in the adolescent market. | | | | |
| | | | | | | | |
| | | | |
| GSK Annual Report 2017 | | Strategic report | | |
| | Governance and remuneration | | |
| | Financial statements | | |
| | Investor information | | |
| | | | |
|
| | |
| | Strategy in action | | |
| | “We are focused on maintaining our leadership position in meningitis vaccines and executing ourShingrixlaunch flawlessly.” | | |
| | 
Luc Debruyne | | |
| | President, Global Vaccines | | |
Established Vaccines
Established Vaccines growth was driven by hepatitis vaccines, mainly due to a competitor supply shortage in the US and higher demand forBoostrix andRotarix. The launch ofCervarix in China, the first cervical cancer vaccine to be approved and launched in the country, also contributed towards growth as did favourableyear-on-year CDC stockpile movements forInfanrix andPediarix in the US. This growth was partly offset by increasing competitive pressures onInfanrix andPediarix in the US and Europe, and lowerSynflorix sales, driven by lower pricing in developing countries.
2020 outlook
Over the five years to 2020 we expect a mid to high single-digit CAGR for sales (at 2015 exchange rates). A strong launch ofShingrix is a key priority and we believe the vaccine could be one of our biggest growth drivers over the 2015 to 2020 period. We are still targeting an operating profit margin of at least 30% (at 2015 exchange rates) in 2020.
Driving performance for profitable, sustainable growth
During the year, we decided to discontinue a number of our commercially available vaccines within our Established Vaccines portfolio that are low in volume and where medical needs are met with other vaccines.
Creating a simpler, competitive supply chain
Our global Vaccines network includes 16 vaccine manufacturing sites in 11 countries. This international presence enables us to manufacture our vaccines with greater capacity, efficiency and flexibility. We aim to keep critical production stepsin-house wherever possible.
We continue to focus on removing complexity in our supply chain. Since 2015 we have reduced the number of different packs we have by 40%, increased our manufacturing flexibility, and simplified and standardised our product offerings to support our commercial strategy.
Process and analytical robustness
During 2017, process improvements and analytical robustness enabled us to produce more of ourBexsero vaccine more efficiently. This was due to a new pyrogen test, approved in several countries, which improved assay robustness and eliminated about 10% of failures. We have also demonstrated the feasibility of increasing the yields and reducing failure rates of two of the four antigen manufacturing processes. TheSynflorix process robustness programme (completed in 2016) continued to deliver good results in 2017, enabling us to manufacture product without any major losses.
Transaction savings
Excellent execution and acceleration of the Integration Implementation Plan across R&D, manufacturing, global support functions, commercial network and procurement helped our Vaccines business to deliver its £400 million Novartis integration savings target.
Footnote
We use a number of adjusted,non-IFRS, measures to report performance, as described on page 58.

| | | | |
| 37 | | |
| | | | | |
| GSK Annual Report 2017 | | Strategic report | | |
| | Governance and remuneration | |
| | Financial statements | |
| | Investor information | | |
Consumer Healthcare
Our Consumer Healthcare business develops and
markets consumer-preferred and expert-recommended
brands in oral health, pain relief, respiratory, nutrition/
gastro-intestinal and skin health.
Consumer Healthcare sales were up 8% AER, 2% CER. A strong performance by power brands across Wellness and Oral health was partly offset by competitive pressures in the US allergy category.
Sales from new GSK innovations (product introductions within the last three years on a rolling basis) represented approximately 13% of sales in the period. Some notable launches in 2017 were several line extensions forSensodyne, including next generationSensodyne Rapid Relief andSensodyne Deep Clean as well asVoltaren No Mess andparodontax. We launchedFlonase Sensimist in the US and continued the globalroll-out ofFlonase OTC(over-the-counter).
| | | | |
| Consumer Healthcare turnover | | | £m | |
Wellness | | | 4,001 | |
Oral health | | | 2,466 | |
Nutrition | | | 680 | |
Skin health | | | 603 | |
Total | | | 7,750 | |
Footnote
We use a number of adjusted,non-IFRS, measures to report performance, as described on page 58.


Darren, Principal Scientist,
Oral Health R&D, UK
OurNovaMin technology inSensodyne Repair & Protect seeks out and forms a protective layer over sensitive areas of the teeth, helping to relieve the pain of sensitive teeth.

Van, sensitive teeth sufferer
What’s next
| | | | |
Innovation in Consumer Healthcare > See pages 38–39 | | |
| |
| | | | |
Performance in Consumer Healthcare > See pages 40–41 | | |
| |
| | | | |
We report on our Trust priority across all three businesses > See pages 42–51 | | |
| |
| | |
| 38 | | |
GSK Annual Report 2017 | | |
| | |
| | |
Consumer Healthcare
| | | | |
| Innovation | | Our priorities are to execute brilliant product launches and to build a strong, differentiated pipeline ofconsumer-led, science-based innovations and claims. |
| | | | |
| | In 2017, we continued to demonstrate our ability to innovate within the consumer healthcare market, harnessing GSK’s scientific and technical expertise alongside deep consumer insights. The proportion of sales from innovations launched within the last three years was approximately 13%, which included several key 2017 launches. Deliveringbest-in-class innovation NewSensodyneRapid Relief, the latest premium extension of our £1 billionSensodyne brand, was launched successfully in more than 40 markets in 2017. Developed in our UK-based Oral health Innovation Hub, it has been designed to provide fast relief from tooth sensitivity and is supported by clinical studies. The active ingredient, stannous fluoride, seals the layer beneath the surface of the tooth enamel known as dentine, aided by a special polymer, which clinical data shows can result in relief from the pain of sensitivity within as little as 60 seconds. | | We also introducedSensodyne Deep Clean toothpaste in a number of markets, which provides a deep clean for sensitive teeth using small particle silica and delivers long-lasting freshness through novel coolant technology. A further key innovation launched in 2017 wasVoltaren No Mess, which has a cap that makes the product easier and less messy to apply, addressing one of the key consumer barriers to using a topical pain-reliever. The unique and innovative packaging was assessed extensively in our new consumer sensory testing laboratories.Roll-out continues in 2018. We launched ourparodontax brand – clinically proven to help prevent bleeding gums and gingivitis – for the first time in the US. |
| | | | | | | | | | |
| | | | | | | | | | |
| | | | Consumer insight-driven innovation | | NewENO Cooling antacid creates an instant cooling sensation when taken. Our scientists developed the formulation to create this cooling effect after research at our consumer sensory labs showed consumers believe that feeling cool internally helps soothe heartburn.ENO Cooling, which we have just launched in India, is one of manyconsumer-led innovations that have been created following research at our three consumer sensory facilities in India, the UK and the US. | | | | |
| | | |  | | | | | |
 | | | | | |
| | | | |
| GSK Annual Report 2017 | | Strategic report | | |
| | Governance and remuneration | | |
| | Financial statements | | |
| | Investor information | | |
| | | | |
| | | | | |
| | Strategy in action “We deliver differentiated products to consumers by combining consumer insights with scientific and technical excellence.” 
| | |
| | Richard Slater Head of R&D, GSK Consumer Healthcare | | |
We continued to see success in our switch programme withFlonase Sensimist successfully changing from a prescription-only medicine to anover-the-counter product in the US, enhancing our offering in the allergy market. We have also continued the globalroll-out ofFlonase, launching in several markets in 2017, including Canada, Spain and the Czech Republic. In switchingFlonase from prescription-only toover-the-counter, we recognised the growing consumer demand for greater personal control over healthcare.
Building industry-leading capabilities
We continued to invest in understanding and meeting consumers’ and retail customers’ needs by expanding our international network of consumer sensory and shopper science laboratories, with new labs opening in the UK and Singapore in 2017. Thesestate-of-the-art facilities differentiate GSK, with retailer feedback showing that our scientific approach to shopper insight and customer collaboration puts us ahead of our competitors.
Our integrated global innovation hubs,co-locating both R&D and commercial experts, continue to ensure that our innovation is both science-based andconsumer-led. The breadth of this network also keeps us in step with local and regional trends.
Emerging market opportunities
Emerging markets continue to be a key opportunity area for growth in Consumer Healthcare. We have increased our emerging market R&D investment and focus, in particular in our China and India-based innovation hubs, where we continue to identify local consumer and retailer insights to underpin our product development and marketing, ensuring that we remain locally relevant and competitive. In India, for example, we discovered that nearly half of all indigestion treatments use home remedies. Using this insight, we developed and launched a new variant of ourENO antacid, using the popular ajwain herb. This contributed to strong brand growth in 2017.
External innovation
We continue to look beyond GSK for additional innovation opportunities, and in 2017 saw a significant increase in the proportion of our pipeline coming from outside the company. We identified over 1,000 possible partnerships, formally reviewed more than 150 proposals and entered into more than 40 partnerships. This increased external focus, along with our strong internal science capabilities, ensures that we are able to develop and deliver a strong, competitive pipeline ofconsumer-led, science-based innovation.
| | | | | | | | | | | | | | | | | | |
| | | | | | | | | | | | | | | | | | |
| | | | | | | | | | Weather app boosts sales 
| | | | ATheraflu-sponsored weather app kept US consumers informed of local cold and flu levels – and boosted sales. The GSK brand teamed up with The Weather Channel to create theTheraflu cold and flu tracker, as part of the launch campaign forTherafluExpressMax caplets. Reflecting social media conversations, the app gave likely cold and flu levels in users’ areas, while advising them to treat symptoms withTheraflu. Almost 50 million unique visitors were exposed toTheraflu messaging via the tracker and the brand’s sponsorship of The Weather Channel. This sparked a significant rise in sales among app users during the peak flu season. | | | | |
| | | | | | | | | | | | | | | | | | |
| | |
| 40 | | |
GSK Annual Report 2017 | | |
| | |
| | |
Consumer Healthcarecontinued
| | | | |
| Performance | | Strong performance by our power brands across Wellness and Oral health helped drive growth. |
| | | | |
| | 2017 performance summary Consumer Healthcare sales grew 8% AER, 2% CER to £7,750 million. A strong performance by power brands across Wellness and Oral health was partly offset by competitive pressures in the US allergy category, impactingFlonase OTC as well as lower sales of tail brands across the Nutrition and Skin health categories. In addition, reported growth was impacted by the disposal of the Nigeria beverages business in Q3 2016 and the implementation of the Goods & Service Tax (GST) in India in July, the net effects of which were partly offset by the benefit of the comparison with the impact of demonetisation in India in Q4 2016. The divestment, GST and demonetisation combined to reduce overall Consumer Healthcare CER growth by approximately one percentage point. Sales from new GSK innovations (product introductions within the last three years on a rolling basis) represented approximately 13% of sales in the period. Some notable launches in 2017 were several line extensions forSensodyne, including next generationSensodyne Rapid Relief andSensodyne Deep Clean,as well asVoltaren No Messand parodontax. We also launchedFlonase Sensimist in the US and continued the globalroll-out ofFlonase OTC. | | On a category basis, sales in Wellness grew 7% AER, 2% CER to £4,001 million, reflecting a strong performance fromVoltaren and cold and flu seasonal products, partly offsetting a weaker performance from US allergy products. Oral health sales grew 11% AER, 6% CER to £2,466 million, withSensodyne sales continuing to drive performance. Nutrition sales grew 1% AER and declined 5% CER to £680 million, adversely impacted by the sale of the Nigeria beverages business and the implementation of GST, as well as continued competitive pressures fromHorlicks in India. Skin health sales grew 6% AER, but were flat at CER at £603 million. Consumer Healthcare operating margin was 17.7%, up 2.2 percentage points AER and 1.3 percentage points higher on a CER basis, reflecting tight control of costs, integration synergies principally in SG&A, partly offset by increased investment in power brands. 2020 outlook Over the five years to 2020 we expect a low to mid single-digit CAGR for sales (at 2015 exchange rates) and we expect an operating margin of 20+% in 2020 (at 2015 exchange rates). |
Footnote
We use a number of adjusted,non-IFRS,
measures to report performance, as
described on page 58.
| | | | |
| GSK Annual Report 2017 | | Strategic report | | |
| | Governance and remuneration | | |
| | Financial statements | | |
| | Investor information | | |
| | | | |
| | | Strategy in action “As the consumer healthcare market evolves, we are investing in digital capabilities and forming ground-breaking partnerships to continue to meet changing consumer needs.” 
Brian McNamara CEO, GSK Consumer Healthcare | | |
Driving performance for profitable sustainable growth
In 2017, we took significant steps to strengthen our performance now and in the longer term, by increasing our focus on our best performing brands and priority markets.
Power brands
Our strategy of focusing our resources on seven power brands and 12 regional core brands continued to deliver. Our power brands – includingSensodyne, Voltaren, Panadol andTheraflu – significantly outperformed the market, with high single digit growth.Sensodyne continued to drive performance, reporting growth of 12% AER, 8% CER, with strong market-beating delivery in all regions following the roll-out of next generationSensodyne Rapid Relief and the launch ofPronamel Strong & Bright.
Pain relief sales were up 10% AER, 4% CER, driven significantly byVoltaren which saw growth across the regions, benefiting from momentum in the12-hour variant, strongin-store and marketing activation, expansion of expert detailing and strong performances in International markets.
To concentrate on our best performers, we announced the divestment of some smaller nutrition brands, includingMaxiNutrition in the UK.
Digital transformation
We invested strongly in our digital transformation programme. This is intended to both boost sales – through data-driven marketing, newe-commerce sales channels and digitally powered innovations – and unlock efficiency savings by, for example, optimising how we generate and deploy digital content and extracting more value from our media mix.
To drive our digital transformation, in 2017 we appointed our first Consumer Healthcare Chief Digital Officer and established a Digital Advisory Board of external digital marketing, data ande-commerce experts. We also revised our core training programmes to build digital ande-commerce capabilities across our sales, marketing and general management teams.
Industry partnerships
Collaboration is core to all aspects of our innovation. In 2017, we signed a partnership with Google, to bring our digital advertising data platformin-house, enabling us to better target relevant content to consumers and drive efficiency in our marketing campaigns. We formed another partnership in 2017 with Alimama, the marketing and media arm of Chinese technology group Alibaba. This partnership helps us identify more potential consumers and gain deeper understanding of their online shopping behaviour so we can reach them with the right advertising at the appropriate time.
We continued to prioritise building relationships with healthcare professionals (HCPs), whose recommendations can be key in introducing new consumers to our brands. Seventy per cent of consumer trial ofSensodyne in the US, for example, is driven by dentist recommendation. In 2017, we deployed a new customer relationship management platform across 80 markets to our HCP field forces. This system upgrade enables us to have a more engaging and relevant science-based dialogue with HCPs.
Creating a simpler, competitive supply chain
We have continued to improve our consumer health supply chain, across quality, safety, service and cost. We have simplified our network and announced plans to exit three sites. Since 2015, we have streamlined the number of contract manufacturers (CMOs) we use by 24% to reduce complexity in our supply chain. Our supply chain has successfully supported strong growth of our higher-margin power brands through improvements across productivity, procurement and systems, ensuring robust and reliable supply.

| | | | |
| GSK Annual Report 2017 | | Strategic report | | |
| | Governance and remuneration | | |
| | Financial statements | | |
| | Investor information | | |
| | |
Earning Trust | | Here we detail the progress we have made on: addressing global health needs through our science, creating sustainable access to our high-quality products, and being a responsible business with modern employer practices. |
Creating long-term value
for all our stakeholders
Investors, patients and consumers, employees and communities rightly expect companies to consider their social, as well as financial, impact as they seek to create value over the long term. By investing in a balanced set of long-term priorities – Innovation, Performance and Trust – across each of our three businesses, we will deliver both financial returns and a broader contribution to society.
Focusing where we can have impact
We have a long history in tackling some of the world’s biggest health challenges. The biggest impact we can have is to use our scientific and technical know-how to address global health needs – like HIV and malaria – and support sustainable access to our high-quality products. We must also be a responsible business, with modern employer practices, to support our talented people to give their very best.
Later this year, we will launch a set of long-term commitments describing the actions we will be taking to demonstrate our continuing commitment to deliver societal value. With these, we will seek to establish clear, ambitious targets to drive impact and progress in three areas:
| – | Addressing global health needs through our science |
| – | Creating sustainable access to our high-quality products |
| – | Being a responsible business with modern employer practices |
We will also continue to seek transparent and trusted engagement with scientific and medical communities, address our environmental impact, and maintain the ethical standards to which we conduct our business.
This section reports progress in these areas during 2017. More detail is available in our Responsible Business Supplement available at www.gsk.com/responsibility.
| | | | | | | | | | | | | | |
| | |
| | | All three of our businesses contribute towards our Trust priority. |
| | | | | | |
| | | Pharmaceuticals | | | | | | Vaccines | | | | | | Consumer Healthcare |
| | | In 2017, our HIV drug, dolutegravir, was made available in Brazil as a first line treatment for people living with HIV who have never received treatment via the national health programme. It is also now available as first line treatment in Botswana. | | | | | | Our Vaccines business has developed the only malaria vaccine candidate to have received a positive scientific opinion from the European Medicines Agency and a recommendation for pilot implementation by the World Health Organization (WHO). | | | | | | In early 2018, our Consumer Healthcare business is launching afive-year partnership with Smile Train, to provide funding, support and expertise to help more children living with cleft lip or palate to lead a full and productive life. |
| | | 
| | | | | | 
| | | | | | 
|
| | |
| 44 | | |
GSK Annual Report 2017 | | |
| | |
| | |
Trustcontinued
| | | | |
| | | Addressing global health through science | | We are using our science and technology to tackle some of the biggest global health challenges while delivering leading scientific and medical engagement. |
We aim to use our science, and work collaboratively and transparently with partners and the scientific community, to develop new medicines, vaccines and consumer healthcare products where there is the greatest need.
Global health impact
The biggest contribution we can make to improve health globally is to focus on diseases impacting people around the world where we have specific scientific and technological expertise: respiratory, HIV, oncology,immuno-inflammation and vaccines. We also have an important role to play in tackling some of the biggest global health challenges, including malaria (see case study), tuberculosis (TB) and neglected tropical diseases (NTDs), where there is no commercial market.
In 2017, we created a Global Health Unit to drive an integrated approach across the business to innovate and deliver medicines and vaccines that tackle the biggest global health challenges, such as malaria and NTDs.
Our open lab in Tres Cantos, Spain supported seven new projects run by external scientists in 2017 (64 since it opened in 2010). During the year, the Tres Cantos facility supported the phase I clinical trials of a new candidate drug for TB, with phase II studies expected to begin in 2018. We also began late stagepre-clinical studies for a molecule with the potential to shorten TB treatment, with funding from the Bill & Melinda Gates Foundation.
In 2017, we received FDA approval forJuluca (see page 25), an important milestone in HIV care. It provides a new treatment option and could make a significant difference to people living with HIV as they receive life-long treatment for their chronic condition. Also in 2017, our HIV drug, dolutegravir, was made available in Brazil and Botswana, and has been added to the Essential Medicines List in Russia.
As part of our commitment to eliminate and control NTDs, GSK has donated nearlyeight billion albendazole tablets since 1999 to reach more than 850 million people with lymphatic filariasis (LF) or intestinal worms. In April 2017, Togo became the first African country to eliminate LF as a public health problem, with seven other countries doing so later that year.
| | | | | | | | | | | | |
| | | | | | | | | | | | | |
| | | | |
| Helping to
beat malaria 
|
| | Our Pharmaceuticals business is in the late stage development of tafenoquine, a single-dose treatment forP.vivax malaria, which is common in South Asia, the Horn of Africa and Latin America. If approved, it will be the first new treatment forP. vivax malaria in more than 60 years. Our Vaccines business has developed the only malaria vaccine candidate to have received a positive scientific opinion from the EMA and a recommendation for pilot implementation by the WHO. | | Following successful phase III trials in 2016, we are supporting plans for pilot malaria vaccine implementation programmes insub-Saharan Africa. We are proud to be working together with the WHO, PATH, the ministries of health in Kenya, Ghana and Malawi, and other stakeholders to ensure successful implementation of the pilot programmes. In parallel, GSK is preparing for the implementation of the phase IV programme and is starting manufacturing activities. GSK will donate the first 10 million doses of the RTS,S vaccine to support pilot programmes insub-Saharan Africa. | | |
| | | | | | | | |
| | | | | | | | | | |
| | | | |
| GSK Annual Report 2017 | | Strategic report | | |
| | Governance and remuneration | | |
| | Financial statements | | |
| | Investor information | | |
| | | | |
| | | | |
| | | Strategy in action | | |
| | “We have created a Global Health Unit to drive innovation and delivery of medicines and vaccines to tackle global health challenges, such as malaria.” | | |
| | 
| | |
| | Phil Thomson | | |
| | President, Global Affairs | | |
Preparing for future health threats
We are committed to preparing for global health threats and emergencies. We maintain reserve capacity to respond to a future influenza pandemic, and are collaborating on the development of a universal influenza vaccine candidate.
Fighting antibiotic resistance
The declining effectiveness of antibiotics, due to their extensive use and misuse, is becoming a major public health crisis.
It is important that we work with the pharmaceutical industry and governments to find creative ways to incentivise and reward new research and development in antibiotics and support ways to reduce resistance.
In early 2018, we were ranked number one out of the large pharmaceutical companies in the Access to Medicine Foundation’s first Anti-Microbial Resistance (AMR) Benchmark, which assessed 30 pharmaceuticals, generics and biotech company responses to AMR.
In our Pharmaceuticals pipeline, gepotidacin is the first in a new class of antibiotics and is expected to progress to phase III clinical research. Our vaccines also play a critical role in avoiding the need for antibiotics by preventing bacterial, viral and other infections.
To promote responsible antibiotics use, in 2017 we trained over 21,000 healthcare professionals (HCPs) in areas such as appropriate antibiotics use and prescribing guidelines.
Leading scientific and medical engagement
We believe it is important to have trusted and transparent engagement with the scientific and medical communities.
Transparency in clinical trial data
GSK is one of the few companies that publishes clinical study reports, whether positive or negative. By the end of 2017, 2,310 of these reports were publicly available on our clinical study register in addition to 6,305 result summaries from our trials. Reflecting our long-standing commitment to clinical trial transparency, during the year we ranked number one on the AllTrials Transparency Index.
We also share anonymised patient-level data for our interventional phaseI-IV clinical trials within six months of publication. By late 2017, we had listed more than 2,100 trials on the www.clinicalstudydatarequest.com platform for use by external researchers. Since we started this initiative in 2013, 108 research proposals requesting GSK data have been approved.
Sales and marketing practices
In 2013, we introduced a policy to stop paying HCPs to speak to other prescribers about our prescription medicines and vaccines. We believe our policy has improved transparency and trust, but feedback from scientific experts is that important scientific dialogue between GSK and them has reduced. This was not the intent of the policy. Transparent scientific dialogue and engagement with experts is in the interests of all those working to develop new medicines and improve care for patients.
To address this feedback, and having consulted with HCPs, we have decided to change our policy. We now allow fair market value payments to be made by GSK to expert researchers and HCPs to speak about the science behind our products, disease and clinical practice in a limited number of GSK sponsored,medical-led meetings.
We believe this change is in the best interest of patients as it helps effective, transparent scientific dialogue by allowing HCPs to share new science with each other. Our primary focus remains on internal medical experts speaking about our products and we will not pay HCPs to talk about our products outside of an approved,medical-led scientific workshop or symposium.
We have continued to strengthen our online resources andin-house medical capabilities to provide bespoke product information for HCPs. By using all of our existing channels, we increased our overall interactions with customers by 15% in 2017 with digital interactions growing by 50%.
GSK has eliminated the use of individual sales targets for our pharmaceutical and vaccines sales representatives. This change was implemented in the US in 2011, and expanded to all our markets globally in 2015. Today, our sales representatives are incentivised based on their selling competency and broader business performance.
| | |
| 46 | | |
GSK Annual Report 2017 | | |
| | |
| | |
Trustcontinued
| | | | |
| | | Sustainable access to our high-quality products | | We are expanding access to our high-quality medicines, vaccines and consumer healthcare products so that more people can benefit from their use. |
We are committed to widening access to our high-quality products. We do so through embedding our equitable pricing strategy, using innovative business models, and ensuring that our products adhere to high quality and safety standards.
Pricing
Our equitable pricing strategy for medicines and vaccines is based on the country, disease area, product type and patients’ ability to pay. Since 2010, we have capped the prices of our patented medicines in least developed countries at 25% of those in Western Europe, as long as manufacturing costs are covered.
More than 70% of our vaccine doses go to least developed, low and middle-income countries. Our lowest vaccine prices are offered to organisations such as Gavi, the Vaccine Alliance, which supports poorer countries. We are the only company committed to aten-year price freeze to support countries transitioning from Gavi financing.
In 2017, the World Intellectual Property Organization (WIPO) and the International Federation of Pharmaceutical Manufacturers and Associations (IFPMA) launched a new partnership calledPat-INFORMED to facilitate access to medicine patent information. GSK played an instrumental role in the development of this partnership which was catalysed by our 2016 commitment to make information about our patent portfolio freely available.
We also understand payer and patient concerns about affordability in developed markets. The prices of our new medicines and vaccines reflect our goal to work in the best interests of both patients and shareholders and to balance reward for innovation with access and affordability.
In the US, we negotiate with payers to gain favourable placement on formularies (lists of products covered by health insurers and pharmacy benefit managers). Patients generally have lowerout-of-pocket costs for medicines that have preferred treatment under a formulary. The GSK Patient Assistance Programme provided our prescribed medicines and vaccines to 126,419 patients in 2017.
| | | | | | | | | | |
| | | | | | | | | | |
| | | | | Reducing child mortality 
| | In 2013, we launched afive-year partnership with Save the Children with the aim of saving the lives of one million children in the poorest countries. As we approach the end of the five years, we have reached more than 2.7 million children in 41 countries with life-saving interventions. Through the partnership, we have also created and distributed a potentially life-saving medicine, chlorhexidine gel, that has benefited over 19,000 newborns. The next phase of the GSK and Save the Children partnership, which will continue to address child mortality, will launch in 2018. | | | | |
| | | | | | | | | | |
| | | | |
| GSK Annual Report 2017 | | Strategic report | | |
| | Governance and remuneration | | |
| | Financial statements | | |
| | Investor information | | |
| | | | |
| | | Strategy in action | | |
| | “Reliable supply is a daily priority across all three of our businesses.” | | |
| | 
| | |
| | Roger Connor President Global Manufacturing and Supply | | |
| | | | |
| | Our charitable giving in 2017 totalled £261.6 million (2016 – £210.2 million) | | |
| | 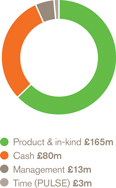
| | |
In Europe, we engage with governments and payers to balance access and affordability while working towards sustainable health systems that support ongoing innovation.
Partnerships to support access
We invest in communities around the world through product and cash donations. In 2017, our charitable giving totalled £262 million.
Since 2009, we have reinvested 20% of our profits from sales of pharmaceuticals and consumer healthcare products in least developed countries (LDCs) – £33 million in total – into strengthening local healthcare infrastructure. Our partnerships with Amref Health Africa, CARE International and Save the Children have helped train over 60,000 frontline health workers, helping us to exceed our goal of reaching 20 million people by 2020. Our new programmes in Botswana, Cameroon and Namibia are training frontline health workers beyond the LDCs.
Cleft surgery can cost from as little as $250, but if left untreated, children will struggle to eat, breathe and speak properly, leaving them isolated from communities and with ongoing health issues. In early 2018, our Consumer Healthcare business is launching afive-year partnership with Smile Train, to provide funding, support and expertise to help more children living with cleft lip or palate lead a full and productive life.
Our commitment to quality and safety
We follow a strict Quality Management System and comply with regulations on Good Manufacturing Practice. In 2017, 194 regulatory inspections were held at our manufacturing sites and, while the majority resulted in zero or only minor observations, we are committed to addressing issues raised in all inspections as part of our continuous improvement programme. Regulatory authorities have accepted our proposed plans for corrective actions.
We track risks to quality and safety standards through our global risk register. In 2017, we performed 273 audits on our own trials and those conducted for us by third parties. We enhanced our policy on management of human safety information for GSK products and trained all relevant staff to safeguard the people who take our products or are involved in our clinical research.
Reliability of supply
We make reliable supply a daily priority across all three of our businesses.
Significant improvements were achieved in our Pharmaceutical supply performance in 2017. These were instrumental in enabling growth in key therapy areas, as well as ensuring that the launch of new products went to plan. Improvements are the result of essential capability-building and infrastructure investments made in our supply chain to improve safety and quality, as well as a consistent focus on meeting patient and business needs through performance management.
Our supply performance in Vaccines continued to improve in 2017. We grew manufacturing output by 7% which underpinned our strong financial performance. We maintained our focus on safety and delivering all of our vaccines to our high quality standards; we also continued to invest in capacity, updating older facilities and building new capacity to support our long-term growth ambition.
Across the Consumer Healthcare supply chain, we have implemented new ways of working, including core business planning processes to improve our service levels. These have increased steadily and significantly through 2017 and benchmark well with FMCG competitors. All of our 2017 Consumer Healthcare product launches have been supplied on time and we continue to strive for higher targets for product supply, while maintaining our quality and safety standards.
| | |
| 48 | | |
GSK Annual Report 2017 | | |
| | |
| | |
Trustcontinued
| | | | |
Modern employer | | To attract and retain the best talent, we are committed to being a modern employer and to driving high levels of employee engagement. |
| | | | |
| | Our staff are more engaged when they are part of the conversation, so we have put a strong focus on holding open and inclusive conversations with each other, and encouraging our leaders and employees to share the ownership and delivery of our strategy. We are also focused on creating a safe and inclusive workplace where everyone at GSK can feel able and inspired to realise their potential. Engagement Senior leaders across GSK are playing a pivotal role in engaging our people behind our strategy, through initiatives such as our new Let’s Talk programme (see case study). In October 2017, 600 of our most senior leaders attended athree-day conference to deepen their understanding of our strategy and priorities and to develop effective tools to inspire their teams. Delivering performance through cultural change Our strong values and purpose are fundamental to the way we operate. Central to the development of our high-performance, values-based culture will be the alignment of our people behind our long-term business priorities. As part of our approach to evolving GSK’s culture, we have retained and reinforced our values while introducing four new expectations that guide the behaviour of our employees: Courage, Accountability, Development and Teamwork. | | Talent and development In 2017, we made a number of key appointments to our Corporate Executive Team, identified significant GSK roles, and supported the development of top talent. This included changing approximately 40% of our top 125 manager roles through promoting existing talent and hiring externally to bring fresh ideas and skills to leadership roles. We have also launched a new employee performance system. Individual objectives are now linked to our priorities on Innovation, Performance and Trust, and a newGSK-wide bonus system will reflect progress against the priorities and our overall business performance. This will encourage more regular, consistent performance and development conversations. In 2017, we trained around 3,300 people to support their promotion to first or second line leadership; in addition, more than 1,600 GSK leaders shared their knowledge and helped to improve colleagues’ performance through our coaching programmes. During the year, 434 graduates and postgraduates joined our Future Leaders and Esprit development programmes. GSK ranked third in The Guardian 300 UK Graduate Employers and made the top ten in The Times Top 100 Graduate Employers 2017. |
| | | | | | | | | | | | | | |
| | | | | | | | | | | | | | |
| | | | Engaging employees in our strategy 
| | Our strategic success relies on our ability to engage employees behind GSK’s long-term priorities. In 2017, more than 84,000 (83%) of our people took part in GSK’s global employee survey – our best ever response rate. Our employee engagement score was 79%, and we will be setting this as a baseline year for improvement. 76% of employees recommend GSK as a great place to work – up 12% since the previous survey – and 85% are proud to work for us. | | Survey questions aligned with our new priorities and the results are being discussed by leaders and employees to identify priority focus areas. From 2018, we plan to conduct the survey twice a year. Our new Let’s Talk programme encourages employees to discuss key issues and share views and ideas on strengthening GSK. Leaders across the business have hosted conversations with their teams on a range of topics. Feedback and insights are collated and shared with all employees and senior leaders to help shape our future organisation. | | | | |
| | | | | | | | | | | | | | |
| | | | |
| 49 | | |
| | | | | |
| GSK Annual Report 2017 | | Strategic report | | |
| | Governance and remuneration | |
| | Financial statements | |
| | Investor information | | |
| | | | |
| | | Strategy in action “For GSK, family-friendly policies are a key success factor to drive employee engagement.” 
Claire Thomas Senior Vice President, Human Resources | | |
| | | | | | | | | | | | | | |
Women in management (%) | | | |
| | | | 2014 | | | | 2015 | | | | 2016 | | | 2017 |
SVP/VP | | | 29 | | | | 29 | | | | 30 | | | 31 |
Director | | | 40 | | | | 40 | | | | 42 | | | 43 |
Manager | | | 45 | | | | 45 | | | | 46 | | | 47 |
Total | | | 42 | | | | 42 | | | | 43 | | | 44 |
Employees by gender (number) | | | |
| | | | | | | | Male | | | | Female | | | Total |
Board | | | | | | | 8 | | | | 5 | | | 13 |
Management* | | | | | | | 9,784 | | | | 7,825 | | | 17,609 |
Total | | | | | | | 55,139 | | | | 43,323 | | | 98,462 |
| * | | Management: senior managers as defined in the Companies Act 2006 (Strategic Report and Directors’ Report) Regulations 2013 which includes persons responsible for planning, directing or controlling the activities of the company, or a strategically significant part of the company, other than the Board, including directors or undertakings included in the consolidated accounts. |
A diverse and inclusive workplace
In 2017, the Hampton Alexander Review of FTSE 100 companies found GSK has the eighth-highest proportion of women on the Board at 41.7%, and is in line with the FTSE 100 average with 25.7% female representation among executive committee members and their direct reports. We are continuing to focus on improving this number over the coming years. Overall, the proportion of women in management roles at GSK is 44%.
Women made up half of our new graduates and Esprit participants, and 38% of our new apprentices in science, technology and engineering roles, where women have traditionally been under-represented.
We published data on our gender pay gap in the UK for the first time, following new legislation. Our gender pay gap for all permanentUK-based GSK employees is 2.81% (mean), outperforming the national average of 17.4%. We will continue to review pay equity at a global level during 2018.
Through our Accelerating Difference programme, we provided coaching and support for 209 high-performing female managers. Around 49% of those who began the programme in 2014 have been promoted (compared with 31% of women across GSK during the same period).
In the US, our diverse reverse mentoring provides leaders with the opportunity to learn from a more junior employee of a different background to help our leaders develop their inclusive leadership skills. In 2017, we had 105 mentoring pairs in place (up from 20 in 2016).
Seven nationalities are represented on our Board and executive committee. Seventy-eight nationalities make up our Future Leaders graduate programme and more than 60 people have completed our Emerging Leaders programme in Singapore to develop our Asia leadership pipeline.
Our global LGBT+ Council continued to engage people across GSK on LGBT+ issues. It is supported by our LGBT+ employee resource group, Spectrum, which now has over 900 employee members across 29 countries around the world.
In early 2018, we were ranked 21st in the UK Stonewall Workplace Equality Index of the top 100 most LGBT+ and inclusive employers in the UK for 2017.
We are committed to removing barriers, increasing understanding and ensuring that those with disabilities have the same opportunities. Our Disability Confidence Network employee resource group now has more than 250 employee members across 22 countries who support our Global Disability Council in driving change and promoting disability confidence.
Health and wellbeing
We are committed to providing health programmes and services to help our people lead healthy lives. In 2017, we made more than 75% of these programmes and services available in our top 24 countries, covering 85% of employees globally.
Our Partnership for Prevention programme offers over 119,000 employees and family members access to up to 40 preventive healthcare services, such as immunisations and cancer screening, at little or no extra cost. We expanded the programme into the Asia Pacific region in 2017 and prepared to extend it in Europe.
Our reportable injury and illness rate in 2017 was 0.23 per 100,000 hours worked, compared with 0.26 in 2016. This rate is comparable with other leading companies in our sector1 and has remained low for several years.
Flexible and life-friendly practices
For GSK, family-friendly policies are a key success factor to drive employee engagement. In 2017, in the US we increased maternity leave for mothers to up to 16 weeks, and introduced 8 weeks of paid parental leave for all parents, adoptive parents and partners to bond with their new baby. We also raised our commitment to family-friendly policies across our top 20 markets. For example, in Pakistan we revised our maternity policy for eligible employees to increase fully paid maternity leave from 84 to 120 days.
We are also seeking to improve work/life balance through a range of flexibility models across our markets. In the UK, we offer atax-free holiday programme, which enables employees to sacrifice part of their salary in exchange for up to ten days of extra holiday. In 2017, this programme had a 30% usage rate among eligible employees.
| | 1 | Based on benchmarking data from the Pharmaceutical Safety Group. |
| | |
| 50 | | |
GSK Annual Report 2017 | | |
| | |
| | |
Trust continued
| | | | |
Ethical conduct and environmental sustainability | | We aim to run our business ethically and in an environmentally sustainable way. |
| | | | |
Employees disciplined in 2017: breakdown of types of policy violation 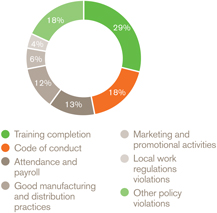
| | Ethical conduct We strive to build a values-based culture by training our people on the standards we expect, encouraging the reporting of any concerns and acting swiftly and transparently when issues occur. Living our Values We provide mandatory annual training on our values and Code of Conduct to help employees and complementary workers manage ethical dilemmas and put our values into practice at work. The Living our Values training emphasises our zero tolerance to bribery and corruption, highlights our commitment on issues such as product quality and data protection, and explains key risks. In 2017, 98% of employees and 91% of complementary workers completed the training. More than 86,300 people had additional training on anti-bribery and corruption to help them manage the specific risks inherent in their roles and responsibilities. We assess how well our values are embedded and have conducted around 260 values maturity assessments over the past two years. Reporting and investigating concerns A 2017 Speak Up campaign raised awareness of the multiple channels we offer for people within and outside GSK to voice concerns and ask questions through an independent third party – confidentially or anonymously if preferred. During the year, we received 2,679 reports (2,568 in 2016), with all being reviewed and 1,919 formal investigations initiated. We act when employees fail to adhere to our policies. In 2017, 3,200 employees were disciplined for policy violations (3,600 in 2016), including 935 for failing to complete our mandatory Living our Values and Anti-bribery and Corruption training on time. Some 1,801 employees received a documented warning (2,499 in 2016), 901 received verbal warnings (547 in 2016) and 233 were dismissed or agreed to leave voluntarily (221 in 2016). | | Working with third parties We expect all our suppliers and third parties to comply with our standards on ethics, labour rights, health and safety, and the environment. By the end of 2017, we had deployed theroll-out of our Third Party Oversight programme to 95% of our third parties. We expect the remainder to be completed by early 2018. Over 100,000 risk assessments of third parties have been conducted and over 5,000 improvements plans agreed since the programme began in 2015. Based on our initial risk assessment, over 4,200 third parties underwent extensive independent assessments. The standardised programme enables us to identify and manage third party risks more effectively, and is being embedded into the processes we use to engage with suppliers. We conducted 60 third party audits on health and safety, ethics, environment and labour rights, with a further 1,592 audits on quality processes. Where we identify unsatisfactory areas, we engage with third parties to develop improvement plans and track progress. If significant issues remain unresolved, we may suspend or terminate work with a third party. Human rights We are a signatory to the UN Global Compact and we are committed to upholding the Universal Declaration of Human Rights and the core labour standards set out by the International Labour Organization (ILO). In 2017, we expanded the information on our human rights expectations in our Living our Values training, particularly around labour rights in our supply chain. We also held a workshop with senior managers to build understanding of labour rights risks and to identify further team training requirements. We continued to monitor existing suppliers and screen new suppliers, included standardised labour rights clauses in third party contracts, and updated our supplier portal and human rights policy with more information on labour rights to support compliance. |
| | | | |
| 51 | | |
| | | | |
| GSK Annual Report 2017 | | Strategic report | |
| | Governance and remuneration | | |
| | Financial statements | | |
| | Investor information | | |
Environmental sustainability
We aim to minimise our environmental impact at every stage of the value chain, while extending access to our products to more people.
Carbon
Our overall carbon footprint is made up of Scope 1 and 2 emissions from our direct operations (18%), and Scope 3 emissions from our supply chain (49%) and from use of our products (33%).
In 2017, our operational emissions (Scope 1 and 2) were reduced by 2% compared with the previous year, as a result of our continuing focus on energy efficiency measures and purchasing renewable energy. Since our 2010 baseline, we have reduced annual carbon emissions from energy use by 25% saving a cumulative 1.9 million tonnes of CO2e.
Our Scope 3 emissions fell from 18.7 to 17.9 million tonnes of CO2e from 2015 to 2016;1 however, they were up 4% from our 2010 baseline year. This is a result of the Novartis integration in 2015 and increasing sales of our propellant-based inhalers. We engage with suppliers to drive improvement. For example we encourage suppliers to monitor and disclose performance through Ecodesk, an external resource which offers benchmarking information and helps them develop improvement plans.
We also have our own platform, GSK Supplier Exchange, to encourage suppliers to share best practices on sustainability and recognise outstanding performance through our annual Supplier Environmental Sustainability Awards.
The use of our products also has a significant impact on our Scope 3 emissions. The majority is from patient use of a propellant-based inhalerVentolin, where the propellant is a greenhouse gas released during use. Reducing the impact of the propellant is complex. We continue to research feasible solutions to this issue, including changing the way we manufacture, to reduce the amount of propellant used while maintaining efficacy and safety for patients.
GSK’s new generation of inhaler products, using ourEllipta device, were developed and launched as dry powder inhalers (DPIs) and do not release greenhouse gas emissions. In 2017, a certified assessment of our respiratory inhaler portfolio by the Carbon Trust showed that the lifecycle carbon footprint of our DPI is around 24 times lower than a propellant-based inhaler2 for one month’s treatment.
Water
We continue to seek ways to use less water in our own operations, in our supply chain and in the use of our products. We have reduced water use by 22% since 2010 but water use increased by 1% in 2017, driven by growth in our Vaccines business.
By the end of 2017, all of our Pharmaceutical and Consumer Healthcare manufacturing sites had completed water risk assessments in line with our water stewardship standard. These sites are now developing plans to address any risks that have been identified which may include working with local communities and other stakeholders. Our efforts to enhance water stewardship will prioritise sites in areas of water stress.
Waste
Since 2010, we have cut operational waste by 23%, producing 10% less hazardous waste and 29% lessnon-hazardous waste. However, progress towards our 2020 target has slowed and the amount of waste produced remained the same in 2017 as 2016. We have therefore increased our focus on reclaiming more waste through reuse, recycling and recovery.
Around 70% of our sites worldwide have achieved zero waste to landfill and just 4% of our 136,000 tonnes of operational waste ended up in landfill – 25% less than in 2016. Most (71%) was recycled or incinerated to recover energy.
Carbon emissions plus intensity ratios (as per regulations)
| | | | | | | | | | | | | | | | |
| ‘000 tonnes CO2ea | | 2014 | | | 2015b | | | 2016 | | | 2017 | |
Scope 1 emissions | | | 851 | | | | 885 | | | | 889 | | | | 865 | |
Scope 2 emissions | | | 745 | | | | 730 | | | | 700 | | | | 694 | |
Scope 3 emissions | | | 16,093 | | | | 18,690 | | | | 17,897 | | |
| Data available
May 2018 |
|
| | | | | | | | | | | | | | | | |
| Intensity ratios | | | 2014 | | | | 2015 | | | | 2016 | | | | 2017 | |
Scope 1 and 2 emissions/sales revenue (tonnes CO2e/£m) | | | 69.4 | | | | 67.5 | | | | 57.0 | | | | 51.6 | |
Scope 1 and 2/FTE (tonnes CO2e/FTE) | | | 16.3 | | | | 16.0 | | | | 16.0 | | | | 15.8 | |
| a | Carbon emissions are calculated according to the Greenhouse Gas Protocol: A Corporate Accounting and Reporting Standard (revised edition). | |
| b | Data included former Novartis sites’ emissions and headcount. |
| | 1 | Our most recently available Scope 3 data is from 2016. We will publish 2017 data online in late 2018. |
| | 2 | For one month’s treatment, a 120 dose propellant inhaler has a carbon footprint of 19kg CO2e per pack compared with a 30 dose once-dailyEllipta DPI - which has a carbon footprint of 0.8kg CO2e per pack |
| | | | |
| | |
| | 52 | | |
| | GSK Annual Report 2017 | | |
| | | | |
| | | | |
| | | | |
| GSK Annual Report 2017 | | Strategic report | | |
| | Governance and remuneration | | |
| | Financial statements | | |
| | Investor information | | |
Group financial review
| | | | |
 | | “We continued to make progress in delivering against our strategy and the financial goals we have set out in our financial architecture.” Simon Dingemans Chief Financial Officer |
| | |
| | |
| | | Viability statement Our viability statement sets out our assessment of the prospects of the Group over the next three years and is presented on page 57. |
| | | |
Footnote
We use a number of adjusted, non-IFRS, measures to report the performance of our business, as described on page 58, including Adjusted results, free cash flow and CER growth rates. Non-IFRS measures may be considered in addition to, but not as a substitute for or superior to, information presented in accordance with IFRS.
Our 2017 results reflect a continued focus on execution including driving growth from existing products and recent launches; controlling costs tightly to help build better operating leverage across the Group, while also investing behind our future growth drivers; and improving cash generation to increase our capacity to support both investment and the dividends we pay to our shareholders.
Financial architecture
We are using our financial architecture to ensure that the delivery of our strategic priorities of Innovation, Performance and Trust translate into clear financial goals that we can embed across the Group.
These goals are targeted at delivering stronger growth in sales through improved innovation across all three businesses, driving earnings per share faster than sales, through better operating leverage from tight cost control and continued financial efficiencies, and converting more of those earnings into cash which can either be reinvested in the business or returned to shareholders. Critically, these goals need to be delivered in the right way, consistent with our values and our objective of building trust in GSK.
We are using the architecture and its goals to help create a step-change in the alignment of our operations across three fully integrated businesses, including a new end-to-end emphasis on cost, cash and capital discipline.
Reporting framework
Our Reporting Framework is described in more detail on page 58. Following a detailed review, we made some changes in 2017. Core results were renamed Adjusted results and now include ordinary course legal charges.
Due to their magnitude, charges related to the impact of the US Tax Cuts and Jobs Act enacted in 2017 have been excluded from Adjusted results.
GSK continues to present both Total and Adjusted results in all tables and commentaries and has provided a reconciliation between the two on page 67.
Sales growth
All three of our businesses delivered growth in 2017.
Pharmaceuticals sales were up 7% AER,
3% CER, with growth from HIV products, ourEllipta portfolio andNucala more than offsetting the decline in sales ofSeretide/ Advair and Established Pharmaceuticals, as well as a 1% drag from divestments.
In Vaccines, we generated significant growth from our meningitis and flu portfolios, and benefited from increased demand for Established Vaccines. We finished the year with overall Vaccines sales up 12% AER, 6% CER.
Consumer Healthcare delivered growth of 8% AER, 2% CER, reflecting a strong performance from power brands in the Pain and Oral health categories, partly offset by the impact of continued competitive pressures in the US allergy category and a broader market slowdown across key categories. In addition, reported growth was impacted by the divestment of the Nigerian beverages business in 2016 and the implementation of the Goods & Service Tax in India during 2017.
Operating leverage
The Total operating margin was 13.5% of sales compared with 9.3% in 2016. The increased margin reflected primarily lower accounting charges related to the remeasurement of the liabilities for contingent consideration, put options and preferential dividends.
| | |
| 54 | | |
GSK Annual Report 2017 | | |
| | |
| | |
Group financial reviewcontinued
| | | | | | | | | | | | |
| | Capital allocation framework | | | | | | |
| | | | | | | | | | | | |
| | | | | | |
| | 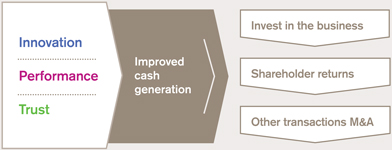
| | | | Key priorities for capital – Pharmaceuticals pipeline – Consumer Healthcare put option – Vaccines capacity – 80p per share dividend expected for 2018 – Focus on rebuilding free cash flow over time – Target 1.25x to 1.5x cover before returning dividend to growth – Strict discipline on returns | | | | | | |
| | | | | | | | | | | | |
| | | | | | | | | | | | |
The Adjusted operating margin of 28.4% was 0.9 percentage points higher than in 2016 and 0.4 percentage points higher on a CER basis. This reflected improved operating leverage driven by sales growth and a more favourable mix in all three businesses, together with the benefit to Vaccines of a settlement for lost third party supply volume and a favourableyear-on-year comparison to inventory adjustments in 2016. Tight control of ongoing costs across all three businesses also contributed, along with further benefits from restructuring and integration. These were partly offset by increases in R&D investment (including a charge of £106 million on the Priority Review Voucher utilised in HIV), as well as continuing price pressure, particularly in Respiratory, and supply chain investments.
Our work to maintain tight control of costs across the Group included supply chain efficiencies from a mixture of site closures, consolidating our manufacturing supplier base and simplifying our global distribution and logistics network. We are also further stepping up our focus on procurement through a new global organisation.
Financial efficiency
Financial efficiency remains a priority. Successfully refinancing maturing debt during 2017 allowed us to hold net financing costs relatively flat for the year.
We continue to focus on protecting our credit profile and funding flexibility.
US tax reform
The enactment of the US Tax Cuts and Jobs Act in December 2017 is expected to have a positive impact on the future after tax earnings of GSK’s US businesses. This is primarily due to the reduction in Federal corporation tax rates from 1 January 2018, which is expected to benefit the Group effective tax rate on Adjusted profits in 2018 by two to three percentage points. We intend to apply the flexibility and cash benefits these reforms will provide in accordance with our capital allocation framework.
The enactment of the new law has resulted in a number of additional charges in 2017, which reduced Total earnings by £1,630 million.
These charges represent management’s estimates of the impact of US tax reform on the Group based on the information currently available. As more information on the detailed application of the Act becomes available, the assumptions underlying these estimates could change, with consequent adjustments to the charges taken that could have a material impact on the results of the Group.
Earnings per share
Total EPS was 31.4p (2016 – 18.8p). The increase reflected primarily lower accounting charges related to the remeasurement of the liabilities for contingent consideration, put options and preferential dividends.
Adjusted EPS of 111.8p was up 11% AER,
4% CER, reflecting improved operating leverage that delivered earnings growth faster than sales growth.
Contingent consideration
At the end of 2017, GSK had liabilities for contingent consideration payments of £6.2 billion, of which £5.5 billion related to the estimated present value of future payments to Shionogi by ViiV Healthcare. The payments to Shionogi are calculated each quarter based on a high-teens percentage of the revenues of the relevant products, principally dolutegravir, with the discounted fair value of the total future payments reflecting the current expectations of total future sales of those products. Further details are provided in Note 39, ‘Contingent consideration liabilities’.
Free cash flow
Net cash inflow from operating activities was £6.9 billion and free cash flow for the Group was £3.4 billion, compared with £3.0 billion in 2016. The Sterling increase of 14% reflected the improved operating profit performance, a positive currency benefit and reduced cash spending on restructuring and capital expenditures, partly offset by increased working capital, mainly due to the building of inventory in advance of new product launches.
Net debt
Net debt at the end of 2017 amounted to £13.2 billion, £0.6 billion lower than at the end of 2016. The reduction was primarily attributable to improved free cash flow of £3.4 billion and disposal proceeds of £0.6 billion together with a translation benefit of £0.6 billion on the Sterling value ofnon-Sterling denominated debt, more than offsetting the cash dividends paid to shareholders in the year of £3.9 billion.
| | | | |
| GSK Annual Report 2017 | | Strategic report | | |
| | Governance and remuneration | | |
| | Financial statements | | |
| | Investor information | | |
Capital allocation framework
The priorities for the use of our capital remain as presented in July 2017. They are focused on three particular priorities: investing in the business, delivering cash returns to shareholders through dividends and potentially accessing strategic acquisitions that would strengthen the business, subject to them meeting a strict set of returns criteria. In establishing the first priority as investing in the business, we identified a primary focus on strengthening the Pharmaceuticals business and, in particular, its R&D pipeline. We also confirmed the attractiveness of accepting the Consumer Healthcare put option, should it be exercised, and continuing to expand capacity in key product lines across our Vaccines business.
To strengthen how we allocate capital and to ensure that we are allocating funding to where the most attractive returns are available, we have implemented a clearer framework and created a new board to govern the allocation of capital between our businesses.
We have expanded the use of cashflow-based return metrics beyond individual project assessments. Now that we have been able to create fully integrated business units for Pharmaceuticals, Vaccines and Consumer Healthcare, we have been able to apply a more consistent cash return on invested capital (CROIC) methodology to prioritise investment across the Group as a whole, so that we can compare the returns from each of the three integrated businesses as we allocate capital between them. We also regularly benchmark ourselves with peers relevant to each of our three businesses.
2018 guidance
We expect continued progress in 2018, including sales growth contributions from our new and recent product launches in HIV, Respiratory and Vaccines.
The expectation for 2018 Adjusted EPS growth is dependent on a number of factors including, in particular, uncertainties relating to the timing and extent of potential generic competition toAdvair in the US.
In the event that no substitutable generic version ofAdvair is introduced to the US market in 2018, the Group expects 2018 Adjusted EPS growth of4-7% at CER. This is based on an expected decline in 2018 in US Advair sales of20-25%.
In the event of amid-year introduction of a substitutable generic competitor toAdvairin the US, the Group expects full-year 2018 USAdvair sales of around £750 million at CER (US$1.30/£1), with Adjusted EPS flat to down 3% at CER.
Both scenarios reflect the benefit of US tax reform with an expected 2018 effective tax rate on Adjusted profits of19-20%.
We are not able to give guidance for Total results as we cannot reliably forecast certain material elements of our Total results such as the future fair value movements on contingent consideration and put options.
Returns to shareholders
For 2017, we maintained our ordinary dividend at 80p in line with the commitment we made to shareholders at the time we closed the Novartis transaction in early 2015.
GSK recognises the importance of dividends to shareholders and aims to distribute regular dividend payments that will be determined primarily with reference to the free cash flow generated by the business after funding the investment necessary to support the Group’s future growth.
The Board intends to maintain the dividend for 2018 at the current level of 80p per share, subject to any material change in the external environment or performance expectations. Over time, as free cash flow strengthens, we intend to build free cash flow cover of the annual dividend to a target range of1.25-1.50x, before returning the dividend to growth.
A fuller review of the financial results is set out on pages 56 to 78.

Simon Dingemans
Chief Financial Officer
| | | | |
| | Our approach to Brexit We have evaluated the impact of Brexit on our business operations, including our supply chain and quality oversight. Our priority is to maintain continuity of GSK’s supply of medicines, vaccines and health products to our patients and consumers in the UK and the EU. Uncertainty remains about the future relationship between the UK and the EU. As a result, we have agreed a risk-based approach to mitigation across the organisation. Implementation of our contingency plan has been underway since January 2018, with an immediate focus on our supply chains. This includes expanding our ability in the EU and the UK to conductre-testing and certification of medicines; transferring Marketing Authorisations registered in the UK to an EU entity; updating packaging and packaging leaflets; amending manufacturing and importation licences, and securing additional warehousing. We currently anticipate that the cost to implement these and other necessary changes could be up to £70 million over the next two to three years, with subsequent ongoing additional costs of approximately £50 million per year, including additional customs duties and transaction or administration costs. These charges represent our estimates of the impact of Brexit based on the information currently available. As more information on the changes to our business that will be required after Brexit becomes available, the assumptions underlying these estimates could change, with consequent adjustments, either up or down, to the additional costs we expect to incur. We will continue to adjust our plans and their expected financial impact as negotiations and regulations develop. Delivering these necessary but complex changes by March 2019 will be ambitious and potentially disruptive in the short term and we support efforts to secure a status quo transition period to minimise disruption. Over the longer term, we continue to believe that Brexit will not have a material impact on our business. | | |
| | |
| 56 | | |
GSK Annual Report 2017 | | |
| | |
| | |
Group financial reviewcontinued
Our approach to tax
We understand our responsibility to pay an appropriate amount of tax while being financially efficient and delivering a sustainable tax rate.
Footnote
We use a number of adjusted,non-IFRS, measures to report the performance of our business, as described on page 58.
We understand our responsibility to pay an appropriate amount of tax, and fully support efforts to ensure companies are appropriately transparent about how their tax affairs are managed. Tax is an important element of the economic contribution we bring to the countries in which we operate. We do not engage in artificial tax arrangements – those without business or commercial substance. We do not seek to avoid tax by the use of ‘tax havens’ or transactions we would not fully disclose to a tax authority. We have a zero tolerance approach to tax evasion and the facilitation of tax evasion.
We have a substantial business and employment presence in many countries around the globe and we pay a significant amount of tax, including corporation and other business taxes, as well as tax associated with our employees. At the same time, we have a responsibility to our shareholders to be financially efficient and deliver a sustainable tax rate. As part of this approach, we look to align our investment strategies to those countries where we already have substantial economic activity, and where government policies promote regimes which are attractive to business investment and R&D activity, and are transparent in their intent and available to all relevant tax payers. Examples include the UK Patent Box and Research and Development Expenditure Credit.
In 2017, the Group corporate tax charge was £1,356 million (2016 – £877 million) on profits of £3,525 million (2016 – £1,939 million) representing an effective tax rate of
38.5% (2016 – 45.2%). We made cash tax payments of £1,340 million in the year (2016 – £1,609 million). In addition to the taxes we pay on our profits, we pay duties, levies, transactional and employment taxes.
Our Adjusted tax rate for 2017 was 21.0% (2016 – 21.3%). Subject to any material changes in our product mix, or other material changes in tax regulations or laws in the countries in which we operate, and following the impact of US tax reform, the Group’s effective Adjusted tax rate for 2018 and the next several years is expected to be in the region of19-20%.
The Group’s Total tax rate of 38.5% (2016
– 45.2%) for 2017 was higher than the Adjusted tax rate as it was affected by the impact of US and Swiss tax reforms, as explained at Note 14, together with transaction-related charges arising on the Group’s put option liabilities.
The Total tax rate also reflected the reassessment of estimates of uncertain tax positions following the settlement of a number of open issues with tax authorities in various jurisdictions.
Tax risk is managed by a set of policies and procedures to ensure consistency and compliance with tax legislation. Our Audit
& Risk Committee and the Board are responsible for approving our tax policies and risk management approach.
We seek to maintain open, positive relationships with governments and tax authorities worldwide and we welcome constructive debate on taxation policy.
2017 has seen the enactment of significant reforms of tax laws in multiple jurisdictions. We expect there to be continued focus on tax reform in the future, driven by the OECD’s Base Erosion and Profit Shifting (‘BEPS’) project and European Commission initiatives such as fiscal state aid investigations. The outputs from the OECD BEPS projects clarified the important principle that tax should be paid on profits throughout the supply chain, where theprofit-making activity takes place.
GSK supports the BEPS proposals, in particular the implementation of the OECD’s recommendations on ‘Country by Country Reporting’, including the exchange of this data between tax authorities. This data, validated against existing information held on taxpayers, will support their ability to ensure multinational groups pay an appropriate amount of tax.
The detailed tax implications of Brexit are dependent on the outcome of negotiations between the UK and EU, and are therefore currently unknown. However, we continue to work closely with the ABPI and BIA to analyse the potential implications for the industry in order to highlight key focus areas for the Government as part of its Brexit negotiations. The direct tax implications, in particular, are expected to be limited for GSK while the indirect implications may be more significant, including potential customs duty costs and additional transaction or administrative costs associated with managing import and export obligations on the movement of goods between the UK and EU. Our approach to Brexit is set out on page 55.
Our approach to tax is set out in detail within the Public Policy positions section of our website. Further details about our corporate tax charges for the year are set out on page 177.
| | | | |
| GSK Annual Report 2017 | | Strategic report | | |
| | Governance and remuneration | | |
| | Financial statements | | |
| | Investor information | | |
Viability statement
In accordance with provision C.2.2 of the 2014 revision of the Code, GSK has assessed the prospects of the company over a longer period than the 12 months required by the ‘Going Concern’ provision. The Directors confirm that they have a reasonable expectation that GSK will continue to operate and meets its liabilities, as they fall due, over the next three years. The Directors’ assessment has been made with reference to GSK’s current position and prospects, our strategy, the Board’s risk appetite and GSK’s principal risks and how these are managed, as detailed on pages 20 and 21 in the Strategic report.
The Board reviews our internal controls and risk management policies and approves our governance structure and code of conduct. It also appraises and approves major financing, investment and licensing decisions, and evaluates and monitors the performance and prospects of GSK as a whole. The focus is largely on improving our long-term financial performance through delivery of our company and three business strategies and aligned Innovation, Performance and Trust priorities.
The Board reviews GSK’s strategy and makes significant capital investment decisions over a long term time horizon, based on a multi-year assessment of return on capital, the performance of the company and its three business units, and the market opportunity in the pharmaceutical, vaccines and consumer healthcare sectors. This approach is aligned to GSK’s model of achieving balanced growth by investing in high quality, innovative products for patients, consumers and healthcare providers. However, since many internal and external parameters become increasingly unpredictable over longer time horizons, GSK focuses its detailed,bottom-up Plan on a three year cycle. The Plan is reviewed at least annually by the Directors, who approve business forecasts showing expected financial impact. The Directors believe that a three year assessment period for the Viability statement is most appropriate as it aligns with the company’s well established business planning processes that balance the long term nature of investments in the pharmaceutical, vaccines and consumer healthcare sectors with an assessment of the period over which analysis of near term business performance is realistically visible.
The Plan has been stress tested in a series of robust operational and principal risk downside scenarios as part of the Board’s review on risk. The downside scenarios consider GSK’s cash flows, sustainability of dividends, funding strategy, insurance provision and recovery as well as other key financial ratios over the period. These metrics have been subject to sensitivity analysis, which involves flexing a number of the main assumptions underlying the forecasts both individually and in combination, along with mitigating actions that could realistically be taken to avoid or reduce the impact or occurrence of the underlying risk.
The following hypothetical downside scenarios have been evaluated:
| – | | Scenario 1: Business performance risks. These include key performance risks, including lower sales from new products; the possible impact of a generic alternative toSeretide/Advair in the US; intensifying competition in the HIV market; greater adverse impact from generic competition and other competitive launches to other GSK products, as well as possible supply and manufacturing challenges. |
| – | | Scenario 2: External and macroeconomic risks. This scenario reflects incremental risks to the business driven by outside factors such as more intense competition, increased pricing pressure in both the US and Europe as well as the potential impact of material negative changes in the macro-economic and healthcare environment. |
| – | | Scenario 3: Principal risks. This scenario includes a severe assessment of the potential loss impact from the Principal risks related to patient safety, product quality, supply chain continuity as well as anti-bribery and corruption and any consequent regulatory actions or fines, all of which could fundamentally threaten our operations. These risks are managed through mitigating activities described on pages 257 to 266. |
| – | | Scenario 4: Put option exercise. This scenario evaluates the additional funding requirements assuming the earliest potential exercise of the outstanding put options held by our partners in the HIV and Consumer Healthcare businesses. |
The three year review also makes certain assumptions about the normal level of capital recycling likely to occur and considers whether additional financing facilities will be required and the respective level of funding flexibility and headroom.
The results of this stress testing show that certain combinations of these hypothetical scenarios could increase funding demands on GSK and require mitigating changes to the Group’s funding strategy. However, in light of the liquidity available to the Group and based on this analysis, the Directors have a reasonable expectation that, even under the stress tests described above, the company will be able to continue in operation and meet its liabilities as they fall due over the three year period of assessment.
| | |
| 58 | | |
GSK Annual Report 2017 | | |
| | |
| | |
Group financial reviewcontinued
Reporting framework
Presentation of Group results
Our Group financial review discusses the operating and financial performance of the Group, its cash flows and financial position and our resources. We compare the results for each year primarily with the results of the preceding year.
We use a number of adjusted,non-IFRS, measures to report the performance of our business. These measures are used by management for planning and reporting purposes and in discussions with and presentations to investment analysts and rating agencies and may not be directly comparable with similarly described measures used by other companies.Non-IFRS measures may be considered in addition to, but not as a substitute for, or superior to, information presented in accordance with IFRS.
Total results
Total reported results represent the Group’s overall performance. However, these results can contain material unusual ornon-operational items that may obscure the key trends and factors determining the Group’s operational performance. As a result, we also report Adjusted results, which is anon-IFRS measure.
Adjusted results
As announced on 11 April 2017 in the ‘Change to financial reporting framework’ press release, from 2017, core results have been renamed Adjusted results and, instead of all legal charges and expenses, only significant legal charges and expenses are excluded in order to present Adjusted results. All other legal charges and expenses are included in Adjusted results. Significant legal charges and expenses are those arising from the settlement of litigation or a government investigation that are not in the normal course and materially larger than more regularly occurring individual matters. They also include certain major legacy legal matters. Any new significant legal matters excluded in order to present Adjusted results will be disclosed at the time.
As a result of the enactment of the US Tax Cuts and Jobs Act on 22 December 2017, GSK has recorded charges on initial application which reduced Total earnings by £1.6 billion, as set out on page 68. Due to their magnitude, GSK has reported these charges as Adjusting items in 2017 so that they do not obscure the key trends in the Group’s operational performance for the year.
Adjusted results now exclude the following items from Total results: amortisation and impairment of intangible assets (excluding computer software) and goodwill; major restructuring costs, including those costs following material acquisitions; significant legal charges (net of insurance recoveries) and expenses on the settlement of litigation and government investigations, transaction-related accounting adjustments for significant acquisitions, and other items, including disposals of associates, products and businesses and other operating income other than royalty income, together with the tax effects of all of these items and the impact of the enactment of the US Tax Cuts and Jobs Act in 2017.
GSK believes that Adjusted results are more representative of the performance of the Group’s operations and allow the key trends and factors driving that performance to be more easily and clearly identified by shareholders. The definition of Adjusted results, as set out above, also aligns the Group’s results with the majority of its peer companies and how they report earnings.
Reconciliations between Total and Adjusted results, as set out on page 67, including detailed breakdowns of the key adjusting items, are provided to shareholders to ensure full visibility and transparency as they assess the Group’s performance.
Contingent consideration
GSK has recognised a significant liability for contingent consideration (£6,172 million at 31 December 2017 on a fair value discounted basis) of which £5,542 million represented the estimated present value of future amounts payable to Shionogi relating to ViiV Healthcare, discounted at 8.5%. The payments to Shionogi are calculated based on the sales performance over the life of the relevant products, principally dolutegravir, as described on page 59. The effect of the required IFRS accounting treatment is that GSK recognises these fair value liabilities on the balance sheet, with remeasurement charges reflected immediately in other operating income. These charges are adjusted from Total results to present Adjusted results. GSK will make cash payments in the future to discharge this liability which will not be recorded in the profit and loss account and future earnings.
Free cash flow
From 2017, adjusted free cash flow is no longer being reported and the free cash flow definition has been amended to include all contingent consideration payments made during the period.
Free cash flow, which is anon-IFRS measure, is now defined as the net cash inflow from operating activities less capital expenditure, contingent consideration payments, net interest and dividends paid tonon-controlling interests plus proceeds from the sale of property, plant and equipment and dividends received from joint ventures and associates. It is used by management for planning and reporting purposes and in discussions with and presentations to investment analysts and rating agencies. Free cash flow growth is calculated on a reported basis. A reconciliation of net cash inflow from operations to free cash flow is presented on page 71.
Free cash flow conversion
Free cash flow conversion is free cash flow as a percentage of Total earnings.
Working capital conversion cycle
The working capital conversion cycle is calculated as the number of days sales outstanding plus days inventory outstanding, less days purchases outstanding.
CER and AER growth
In order to illustrate underlying performance, it is our practice to discuss the results in terms of constant exchange rate (CER) growth. This represents growth calculated as if the exchange rates used to determine the results of overseas companies in Sterling had remained unchanged from those used in the previous year. CER% represents growth at constant exchange rates. £% or AER% represents growth at actual exchange rates.
| | | | |
| GSK Annual Report 2017 | | Strategic report | | |
| | Governance and remuneration | | |
| | Financial statements | | |
| | Investor information | | |
Non-controlling interests in ViiV Healthcare
Trading profit allocations
Because ViiV Healthcare is a subsidiary of the Group, 100% of its operating results (turnover, operating profit, profit after tax) are included within the Group income statement and then a portion of the earnings is allocated to thenon-controlling interests owned by the other shareholders, in line with their respective equity shareholdings (Pfizer 11.7% and Shionogi 10%). Each of the shareholders, including GSK, is also entitled to preferential dividends determined by the performance of certain products that each shareholder contributed. As the relative performance of these products changes over time, the proportion of the overall earnings of ViiV Healthcare allocated to each shareholder will change. In particular, the increasing sales ofTivicay andTriumeq have a favourable impact on the proportion of the preferential dividends that is allocated to GSK. GSK was entitled to approximately 80% of the Adjusted earnings of ViiV Healthcare for 2017. Remeasurements of the liabilities for the preferential dividends allocated to Pfizer and Shionogi are included within Adjusting items as other operating income.
Acquisition-related arrangements
As part of the agreement reached to acquire Shionogi’s interest in the former Shionogi-ViiV Healthcare joint venture in 2012, ViiV Healthcare agreed to pay additional consideration to Shionogi contingent on the performance of the products being developed by that joint venture, principally dolutegravir. The liability for this contingent consideration was estimated and recognised in the Group’s balance sheet at the date of acquisition. Subsequent remeasurements are reflected within other operating income and within Adjusting items in the income statement.
Cash payments are made to Shionogi by ViiV Healthcare each quarter which reduce the balance sheet liability for the contingent consideration and as a result are not recorded in the income statement. In 2017, the total cash payments made to Shionogi in respect of the contingent consideration amounted to £671 million. The payments are calculated based on the sales performance of the relevant products in the previous quarter and are reflected in the cash flow statement partly in operating cash flows and partly within investing activities. The tax relief on these payments is reflected in the Group’s Adjusting items as part of the tax charge. The part of each payment relating to the original estimate of the fair value of the contingent consideration on the acquisition of the Shionogi-ViiV Healthcare joint venture in 2012 of £659 million is reported within investing activities in the cash flow statement and the part of each payment relating to the increase in the liability since the acquisition is reported within operating cash flows.
Movements in contingent consideration payable to Shionogi were as follows:
| | | | | | | | |
| | | 2017 £m | | | 2016 £m | |
Contingent consideration at beginning of the year | | | 5,304 | | | | 3,409 | |
| | |
Additions | | | – | | | | 154 | |
| | |
Remeasurement through income statement | | | 909 | | | | 2,162 | |
| | |
Cash payments: operating cash flows | | | (587) | | | | (351 | ) |
| | |
Cash payments: investing activities | | | (84) | | | | (66 | ) |
| | |
Other movements | | | – | | | | (4 | ) |
| | |
Contingent consideration at end of the year | | | 5,542 | | | | 5,304 | |
The additions in 2016 represented the recognition of the preferential dividends payable to Shionogi.
Of the contingent consideration payable (on apost-tax basis) to Shionogi at 31 December 2017, £724 million (31 December 2016 – £545 million) is expected to be paid within one year.
Exit rights
Pfizer may request an IPO of ViiV Healthcare at any time and if either GSK does not consent to such IPO or an offering is not completed within nine months, Pfizer could require GSK to acquire its shareholding. Under the original agreements, GSK had the unconditional right, so long as it made no subsequent distribution to its shareholders, to withhold its consent to the exercise of the Pfizer put options and, as a result, in accordance with IFRS, GSK did not recognise a liability for the put option on its balance sheet. In Q1 2016, GSK notified Pfizer that it had irrevocably given up this right and accordingly recognised the liability for the put option on the Group’s balance sheet at an initial value of £1,070 million. Consistent with this revised treatment, at the end of Q1 2016 GSK also recognised liabilities for the future preferential dividends anticipated to become payable to Pfizer and Shionogi on the Group’s balance sheet.
The closing balances of the liabilities related to Pfizer’s shareholding are as follows:
| | | | | | | | |
| | | 2017
£m | | | 2016
£m | |
Pfizer put option | | | 1,304 | | | | 1,319 | |
| | |
Pfizer preferential dividend | | | 17 | | | | 23 | |
Under the original agreements, Shionogi could also have requested GSK to acquire its shareholding in ViiV Healthcare in six month windows commencing in 2017, 2020 and 2022. GSK had the unconditional right, so long as it made no subsequent distribution to its shareholders, to withhold its consent to the exercise of the Shionogi put option and, as a result, GSK did not recognise a liability for the put option on its balance sheet. In Q1 2016, GSK notified Shionogi that it had irrevocably given up this right and accordingly recognised the liability for the put option on the Group’s balance sheet at an initial value of £926 million. In Q4 2016, Shionogi irrevocably agreed to waive its put option and as a result GSK derecognised the liability for this put option on the Group’s balance sheet directly to equity. The value of the liability was £1,244 million when it was derecognised.
GSK also has a call option over Shionogi’s shareholding in ViiV Healthcare, which under the original agreements was exercisable in six month windows commencing in 2027, 2030 and 2032. GSK has now irrevocably agreed to waive the first two exercise windows, but the last six month window in 2032 remains. As this call option is at fair value, it has no value for accounting purposes.
| | |
| 60 | | |
GSK Annual Report 2017 | | |
| | |
| | |
Group financial review continued
Group turnover
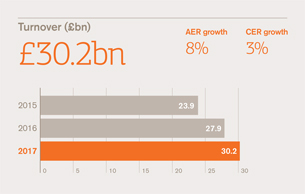
Group turnover
| | | | | | | | | | | | | | | | |
| | | 2017 £m | | | 2016 £m | | | Growth
£% | | | Growth
CER% | |
| | | | |
Pharmaceuticals | | | 17,276 | | | | 16,104 | | | | 7 | | | | 3 | |
| | | | |
Vaccines | | | 5,160 | | | | 4,592 | | | | 12 | | | | 6 | |
| | | | |
Consumer Healthcare | | | 7,750 | | | | 7,193 | | | | 8 | | | | 2 | |
| | | | |
Group turnover | | | 30,186 | | | | 27,889 | | | | 8 | | | | 3 | |
Group turnover for the year increased 8% AER, 3% CER to £30,186 million, with growth delivered by all three businesses.
Pharmaceuticals sales were up 7% AER, 3% CER, reflecting the continued strong growth of the new Respiratory and HIV products, partly offset by declines in older Respiratory products, includingSeretide/Advair and Established Pharmaceuticals, including the impact of recent divestments.
Vaccines sales were up 12% AER, 6% CER, reflecting a strong performance from Meningitis and Influenza vaccines and higher demand for Established Vaccines, as well as the benefit of favourableyear-on-year US CDC stockpile movements.
Consumer Healthcare sales grew 8% AER, 2% CER reflecting a strong performance from power brands in the Pain and Oral health categories, partly offset by the impact of continued competitive pressures in the US allergy category and a broader market slowdown in key categories. In addition, reported growth was impacted by the Nigerian beverages business divestment in Q3 2016 and the implementation of the Goods & Service Tax (GST) in India on 1 July 2017.
Group turnover by geographic region
| | | | | | | | | | | | | | | | |
| | | 2017 £m | | | 2016
(revised)
£m | | | Growth
£% | | | Growth
CER% | |
| | | | |
US | | | 11,263 | | | | 10,197 | | | | 10 | | | | 6 | |
| | | | |
Europe | | | 7,943 | | | | 7,476 | | | | 6 | | | | – | |
| | | | |
International | | | 10,980 | | | | 10,216 | | | | 7 | | | | 3 | |
| | | | |
| | | | 30,186 | | | | 27,889 | | | | 8 | | | | 3 | |
The US sales growth of 10% AER, 6% CER was driven by continued strong performances fromTriumeq andTivicay and growth in the Respiratory portfolio, together with strong performances in the US from Hepatitis and Meningitis vaccines. Europe sales grew 6% AER, but were flat at CER as growth fromTriumeq,Tivicay and Meningitis vaccines was offset by the decline in Established Pharmaceuticals, including the impact of the disposal of the Romanian distribution business in Q4 2016. Respiratory sales were up 5% AER, but flat at CER, as the decline inSeretide offset the growth in the new Respiratory products. In International, sales growth of 7% AER, 3% CER reflected strong growth inTriumeq,Tivicay and the Respiratory portfolio, with Established Pharmaceuticals flat, including the impact of divestments. Growth in Emerging Markets of 8% AER, 4% CER was also impacted by divestments. Sales from new Pharmaceutical and Vaccine products | |
| | | 2017
£m | | | 2016 £m | | | Growth
£% | | | Growth
CER% | |
| | | | |
| Respiratory | | | | | | | | | | | | | | | | |
| | | | |
Anoro Ellipta | | | 342 | | | | 201 | | | | 70 | | | | 63 | |
| | | | |
Arnuity Ellipta | | | 35 | | | | 15 | | | | >100 | | | | >100 | |
| | | | |
Incruse Ellipta | | | 201 | | | | 114 | | | | 76 | | | | 68 | |
| | | | |
Nucala | | | 344 | | | | 102 | | | | >100 | | | | >100 | |
| | | | |
Relvar/Breo Ellipta | | | 1,006 | | | | 620 | | | | 62 | | | | 55 | |
| | | | |
| CVMU | | | | | | | | | | | | | | | | |
| | | | |
Eperzan/Tanzeum | | | 87 | | | | 121 | | | | (28 | ) | | | (31 | ) |
| | | | |
| HIV | | | | | | | | | | | | | | | | |
| | | | |
Tivicay | | | 1,404 | | | | 953 | | | | 47 | | | | 40 | |
| | | | |
Triumeq | | | 2,461 | | | | 1,735 | | | | 42 | | | | 35 | |
| | | | |
| Pharmaceuticals | | | 5,880 | | | | 3,861 | | | | 52 | | | | 45 | |
| | | | |
Bexsero | | | 556 | | | | 390 | | | | 43 | | | | 34 | |
| | | | |
Menveo | | | 274 | | | | 202 | | | | 36 | | | | 29 | |
| | | | |
Shingrix | | | 22 | | | | – | | | | | | | | | |
| | | | |
| Vaccines | | | 852 | | | | 592 | | | | 44 | | | | 36 | |
| | | | |
| | | | 6,732 | | | | 4,453 | | | | 51 | | | | 44 | |
In 2015, GSK identified a series of New Pharmaceutical and Vaccine products that were expected to deliver at least £6 billion of revenues per annum on a CER basis by 2020. Those products are as set out above and do not includeTrelegy Ellipta andJuluca, which had initial sales in 2017 of £2 million and £5 million, respectively. The Group has previously announced its plans to withdrawTanzeum. At 2015 exchange rates the equivalent value of the 2017 sales was £5.7 billion.
Sales of New Pharmaceutical and Vaccine products were £6,732 million, grew £2,279 million in Sterling terms (51% AER, 44% CER) and represented approximately 30% of Pharmaceuticals and Vaccines turnover in the year.
| | | | |
| GSK Annual Report 2017 | | Strategic report | | |
| | Governance and remuneration | | |
| | Financial statements | | |
| | Investor information | | |
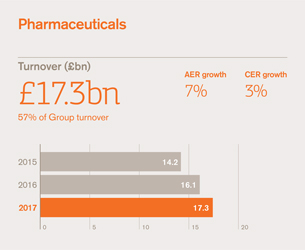
Pharmaceuticals turnover
| | | | | | | | | | | | | | | | |
| | | 2017
£m | | | 2016
£m | | | Growth
£% | | | Growth
CER% | |
| | | | |
Respiratory | | | 6,991 | | | | 6,510 | | | | 7 | | | | 3 | |
| | | | |
HIV | | | 4,350 | | | | 3,556 | | | | 22 | | | | 16 | |
| | | | |
Immuno-inflammation | | | 377 | | | | 340 | | | | 11 | | | | 6 | |
| | | | |
Established Pharmaceuticals | | | 5,558 | | | | 5,698 | | | | (2 | ) | | | (5 | ) |
| | | | |
| | | | 17,276 | | | | 16,104 | | | | 7 | | | | 3 | |
Pharmaceuticals turnover in 2017 was £17,276 million, up 7% AER, 3% CER. Respiratory sales grew 7% AER, 3% CER to £6,991 million, driven by theEllipta portfolio andNucala, while HIV sales were up 22% AER, 16% CER to £4,350 million, driven by increases in market share forTriumeq andTivicay. Sales of Established Pharmaceuticals declined 2% AER, 5% CER, reflecting a three percentage point impact of recent divestments. These divestments reduced overall Pharmaceuticals CER growth by one percentage point, most significantly impacting the contribution from Europe and Emerging Markets.
In the US, sales growth of 11% AER, 6% CER was driven by the HIV portfolio and new Respiratory products. Europe sales grew 3% AER but declined 3% CER, reflecting the continued transition of the Respiratory portfolio and generic competition toKivexa as well as the disposal of the Romanian distribution business during Q4 2016 which reduced growth by three percentage points. Reported International sales growth was impacted by the benefit to Q1 2016 of the accelerated sale of inventory under supply agreements to Novartis as well as the disposal of the thrombosis and anaesthesia businesses to Aspen in Q1 2017, which reduced reported growth in International by one percentage point and in Emerging Markets by two percentage points to 7% AER, 5% CER. Sales in Japan grew 6% AER, 3% CER.
Respiratory
Total Respiratory portfolio sales were up 7% AER, 3% CER, with the US up 8% AER, 3% CER, Europe up 5% AER but flat at CER and International up 9% AER, 5% CER. Growth of the new Respiratory products more than offset the decline inSeretide/Advair.
The new Respiratory products recorded combined sales of £1,930 million in 2017 with sales ofEllipta products up 67% AER, 59% CER driven by continued strong growth in the US and the ongoingroll-out across Europe and International. Sales ofNucala were £344 million, a Sterling increase of £242 million, and included sales of £236 million in the US.
The aggregate growth of theEllipta products was driven primarily by the contribution of the US, where sales were up 72% AER, 65% CER on the back of further market share gains. TotalRelvar/Breo Ellipta sales grew 62% AER, 55% CER to £1,006 million, with the US up 75% AER, 67% CER to £602 million.AnoroEllipta sales grew 70% AER, 63% CER to £342 million, also reflecting market share gains in the US. AllEllipta products,Breo,Anoro,Incruse and Arnuity, continued to grow market share in the US in the year.
Seretide/Advair sales declined 10% AER, 14% CER to £3,130 million. Sales in the US declined 12% AER, 16% CER (5% volume decline and a 11% negative impact of price), with payer rebate adjustments related to prior periods favourably impacting sales in the year. In Europe,Seretide sales were down 12% AER, 17% CER to £736 million (11% volume decline and a 6% negative impact of price), reflecting continued competition from generics and the transition of the Respiratory portfolio to newer products. In International, sales ofSeretide declined 5% AER, 8% CER to £784 million (6% volume decline and a 2% negative impact of price), also reflecting increased generic competition and the transition to the newer Respiratory products.
Pricing pressures also affected other older products withVentolin sales declining 2% AER, 6% CER to £767 million, including the negative impact of payer rebate adjustments related to prior periods in the US.Flixotide/Flovent sales were down 6% AER, 10% CER to £596 million, with the US down 15% AER, 18% CER.
The net impact of adjustments to payer rebates for prior periods across the US Respiratory portfolio was broadly neutral to reported US Respiratory sales.
| | |
| 62 | | |
GSK Annual Report 2017 | | |
| | |
| | |
Group financial reviewcontinued
HIV
HIV sales increased 22% AER, 16% CER to £4,350 million in the year, with the US up 26% AER, 21% CER, Europe up 10% AER,
3% CER and International up 33% AER, 26% CER. The growth in all three regions was driven by continued increases in market share forTriumeq andTivicay, partly offset by the impact of generic competition toEpzicom/Kivexa, particularly affecting the European market. The ongoing increase in patient numbers for bothTriumeqandTivicay resulted in sales of £2,461 million and £1,404 million, respectively, in the year.Juluca was approved in the US in November 2017, and recorded initial sales of £5 million.
Epzicom/Kivexa sales declined 59% AER, 61% CER to £234 million, reflecting the ongoing generic competition since Q3 2016.
Immuno-inflammation
Sales grew 11% AER, 6% CER in the year. The negative impact of the divestment of raxibacumab, which recorded strong sales in Q4 2016, was more than offset by the growth ofBenlysta, up 23% AER, 17% CER to £375 million, driven by a strong US performance.
Established Pharmaceuticals
Sales of Established Pharmaceuticals in 2017 were £5,558 million, declining 2% AER, 5% CER, impacted by the comparison with the accelerated sale of inventory under supply agreements to Novartis in Q1 2016 as well as the disposal of the thrombosis and anaesthesia businesses to Aspen in Q1 2017 and the disposal of the Romanian distribution business in Q4 2016. The impact of these disposals on the growth of the Established Pharmaceuticals portfolio was approximately three percentage points.
TheAvodart franchise declined 3% AER, 9% CER to £613 million primarily due to the loss of exclusivity in the US and Europe and the impact of favourable RAR adjustments in 2016.
Dermatology sales grew 16% AER, 11% CER to £456 million, reflecting improved supply in Emerging Markets and growth in Japan, whileAugmentin sales grew 4% AER, 2% CER to £587 million.
| | | | |
| GSK Annual Report 2017 | | Strategic report | | |
| | Governance and remuneration | | |
| | Financial statements | | |
| | Investor information | | |
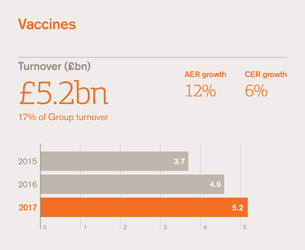
Vaccines turnover
| | | | | | | | | | | | | | | | |
| | | 2017 £m | | | 2016 £m | | | Growth £% | | | Growth CER% | |
| | | | |
Meningitis | | | 890 | | | | 662 | | | | 34 | | | | 27 | |
| | | | |
Influenza | | | 488 | | | | 414 | | | | 18 | | | | 12 | |
| | | | |
Shingles | | | 22 | | | | – | | | | | | | | | |
| | | | |
Established Vaccines | | | 3,760 | | | | 3,516 | | | | 7 | | | | 1 | |
| | | | |
| | | | 5,160 | | | | 4,592 | | | | 12 | | | | 6 | |
Vaccines turnover grew 12% AER, 6% CER to £5,160 million, primarily driven by Meningitis vaccines, withBexsero growing across all regions andMenveo growing in the US and Europe, and higher sales of influenza products, primarily in the US and Europe. Established Vaccines growth was driven by Hepatitis vaccines, mainly due to a competitor supply shortage in the US, higher demand forBoostrix andRotarix and the launch ofCervarix in China. Favourableyear-on-year CDC stockpile movements forInfanrix,Pediarix andMenveo in the US also contributed to growth. These were partly offset by increasing competitive pressures onInfanrix,Pediarix in the US and Europe, and lowerSynflorix sales, driven primarily by lower pricing in developing countries.
Meningitis
Meningitis sales grew 34% AER, 27% CER to £890 million.Bexsero sales growth of 43% AER, 34% CER was driven by new national immunisation programmes, private market sales and regional tenders in Europe, as well as growing demand and share gains in the US, together with strong private market sales in International.Menveo sales grew 36% AER, 29% CER, primarily driven by the impact of favourableyear-on-year CDC stockpile movements, partly offset by supply constraints in International.
Influenza
Fluarix/FluLaval sales were up 18% AER, 12% CER to £488 million, reflecting strong sales execution, primarily in the US, and higher demand in Europe.
Shingles
Shingrix recorded initial sales into the channel of £22 million in the US after its FDA approval and favourable ACIP recommendations.
Established Vaccines
Sales of the DTPa-containing vaccines (Infanrix, Pediarix andBoostrix) were up 5% AER, but flat at CER. Boostrix sales grew 19% AER, 13% CER, benefiting from higher demand across all regions.Infanrix,Pediarix sales were down 3% AER, 8% CER, mainly driven by increased competitive pressures in the US and Europe, together with a new market entrant in Europe, partly offset by favourableyear-on-year CDC stockpile movements in the US.
Hepatitis vaccines grew 15% AER, 10% CER to £693 million, benefiting from a competitor supply shortage and higher demand in the US, partly offset by the unfavourable impact of CDC stockpile movements in the US and supply constraints in Europe and International.
Rotarix was up 12% AER, 6% CER to £524 million, reflecting higher demand in Europe and International.
Synflorix sales were up 1% AER, but down 6% CER to £509 million, due to lower pricing in Emerging Markets partly offset by higher demand elsewhere in International.
Priorix/Priorix Tetra/Varilrix sales were flat at AER, but down 5% CER to £301 million, mainly due to supply constraints in International.
Cervarix sales increased by 65% AER, 57% CER to £134 million, driven by its recent launch in China.
| | |
| 64 | | |
GSK Annual Report 2017 | | |
| | |
| | |
Group financial reviewcontinued
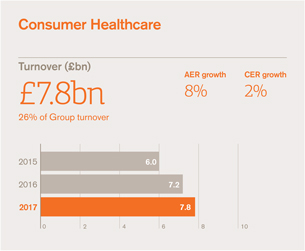
Consumer Healthcare turnover
| | | | | | | | | | | | | | | | |
| | | 2017 £m | | | 2016 £m | | | Growth £% | | | Growth CER% | |
| | | | |
Wellness | | | 4,001 | | | | 3,726 | | | | 7 | | | | 2 | |
| | | | |
Oral health | | | 2,466 | | | | 2,223 | | | | 11 | | | | 6 | |
| | | | |
Nutrition | | | 680 | | | | 674 | | | | 1 | | | | (5) | |
| | | | |
Skin health | | | 603 | | | | 570 | | | | 6 | | | | – | |
| | | | |
| | | | 7,750 | | | | 7,193 | | | | 8 | | | | 2 | |
| | | | | | | | | | | | | | | | |
| | | 2017 £m | | | 2016 (revised) £m | | | Growth £% | | | Growth CER% | |
| | | | |
US | | | 1,826 | | | | 1,761 | | | | 4 | | | | (1) | |
| | | | |
Europe | | | 2,360 | | | | 2,169 | | | | 9 | | | | 3 | |
| | | | |
International | | | 3,564 | | | | 3,263 | | | | 9 | | | | 4 | |
| | | | |
| | | | 7,750 | | | | 7,193 | | | | 8 | | | | 2 | |
Consumer Healthcare turnover was up 8% AER, 2% CER at £7,750 million, impacted by slower global growth in key categories. A strong performance by power brands across Wellness and Oral health was partly offset by competitive pressures in the US allergy category, impactingFlonase OTC, as well as lower sales of tail brands across the Nutrition and Skin health categories and a broader market slowdown in key categories. In addition, reported growth was impacted by the disposal of the Nigeria beverages business in Q3 2016 and the implementation of the Goods & Service Tax (GST) in India in July, the net effects of which were partly offset by the benefit of the comparison with the impact of demonetisation in India in Q4 2016. The divestment, GST and demonetisation combined to reduce overall Consumer Healthcare CER growth by approximately one percentage point.
Sales from new GSK innovations (product introductions within the last three years on a rolling basis) represented approximately 13% of sales in the period. Notable launches this year includedparodontax andFlonase Sensimist in the US, the continued global roll out ofFlonase OTC and several line extensions forSensodyne, including next generationSensodyne Rapid Relief andSensodyne Deep Clean.
Wellness
Wellness sales grew 7% AER, 2% CER to £4,001 million. This reflected a strong performance fromVoltaren and Cold & flu seasonal products, partly offset by a weaker performance from US allergy products.
Respiratory sales were up 7% AER, 2% CER as strong broadly-based growth fromTheraflu andOtrivin, particularly in Europe and International, was partly offset by competitive pressures in the US forFlonase OTC from private label products.
Pain relief sales were up 10% AER, 4% CER, driven significantly byVoltaren with growth across all regions, benefiting from momentum in the12-hour variant, strongin-store and marketing activation, expansion of expert detailing and strong performances in International markets.Panadol also grew strongly in Europe, benefiting from new advertising campaigns, and in International in low single digits.
Oral health
Oral health sales grew 11% AER, 6% CER to £2,466 million.Sensodyne continued to drive performance, reporting growth of 12% AER, 8% CER, with strong delivery in all regions following the roll out of next generationSensodyne Rapid Relief and the launch ofPronamel Strong & Bright. Sales ofparodontax continued to grow strongly, reflecting double-digit performances in Europe and International, driven by a brand reset and increases in dentist recommendations, as well as the US launch in the first quarter. Denture care grew inmid-single digits with double-digit growth in emerging markets partly offset by slower consumption growth in the US and Germany.
Nutrition
Nutrition sales grew 1% AER and declined 5% CER to £680 million, adversely impacted by the sale of the Nigeria beverages business in Q3 2016 and the implementation of GST on 1 July, as well as continued competitive pressures forHorlicks in India. The net impact of the divestment of the Nigeria beverages business, implementation of GST offset by the favourable comparison with the impact of demonetisation in the prior year reduced Nutrition CER growth by approximately six percentage points.
Skin health
Skin health sales grew 6% AER, but were flat at CER at £603 million, with low single-digit growth in the US, a slight decline within Europe and International flat.Fenistil sales grew strongly, with good performances in Central & Eastern Europe, Germany and the Middle East, following digital activation and new media campaigns.Physiogel andLamisil continued to be impacted by competitor activity, whilst Lip care sales grew inmid-single digits.
| | | | |
| GSK Annual Report 2017 | | Strategic report | | |
| | Governance and remuneration | | |
| | Financial statements | | |
| | Investor information | | |
Total results
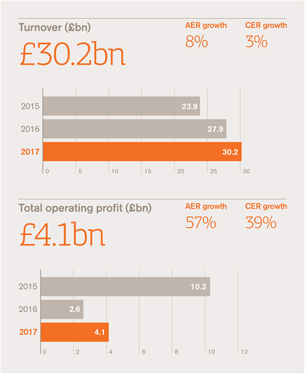
The total results of the Group are set out below.
| | | | | | | | | | | | | | | | | | | | | | | | |
| | | | | | 2017 | | | | | | 2016 | | | | | | Growth | |
| | | £m | | | % of turnover | | | £m | | | % of turnover | | | £% | | | CER% | |
| | | | | | |
Turnover | | | 30,186 | | | | 100 | | | | 27,889 | | | | 100 | | | | 8 | | | | 3 | |
| | | | | | |
Cost of sales | | | (10,342) | | | | (34.3 | ) | | | (9,290 | ) | | | (33.3 | ) | | | 11 | | | | 8 | |
| | | | | | |
Selling, general and administration | | | (9,672) | | | | (32.0 | ) | | | (9,366 | ) | | | (33.6 | ) | | | 3 | | | | (1 | ) |
| | | | | | |
Research and development | | | (4,476) | | | | (14.8 | ) | | | (3,628 | ) | | | (13.0 | ) | | | 23 | | | | 19 | |
| | | | | | |
Royalty income | | | 356 | | | | 1.1 | | | | 398 | | | | 1.4 | | | | (11 | ) | | | (13 | ) |
| | | | | | |
| Other operating income/(expense) | | | (1,965) | | | | (6.5 | ) | | | (3,405 | ) | | | (12.2 | ) | | | | | | | | |
| | | | | | |
Operating profit | | | 4,087 | | | | 13.5 | | | | 2,598 | | | | 9.3 | | | | 57 | | | | 39 | |
| | | | | | |
Net finance costs | | | (669) | | | | | | | | (664 | ) | | | | | | | | | | | | |
| | | | | | |
Profit on disposal of interest in associates | | | 94 | | | | | | | | – | | | | | | | | | | | | | |
| | | | | | |
Share of after tax profits of associates and joint ventures | | | 13 | | | | | | | | 5 | | | | | | | | | | | | | |
Profit before taxation | | | 3,525 | | | | | | | | 1,939 | | | | | | | | 82 | | | | 58 | |
| | | | | | |
Taxation | | | (1,356) | | | | | | | | (877 | ) | | | | | | | | | | | | |
| | | | | | |
Profit after taxation for the year | | | 2,169 | | | | | | | | 1,062 | | | | | | | | >100 | | | | 71 | |
| | | | | | |
Profit attributable to shareholders | | | 1,532 | | | | | | | | 912 | | | | | | | | | | | | | |
Earnings per share (p) | | | 31.4 | | | | | | | | 18.8 | | | | | | | | 67 | | | | 36 | |
| | | | | | |
| Earnings per ADS (US$) | | | 0.82 | | | | | | | | 0.51 | | | | | | | | | | | | | |
Cost of sales
Cost of sales as a percentage of turnover was 34.3%, up 1.0 percentage points in Sterling terms and up 1.4 percentage points in CER terms compared with 2016. This primarily reflected the phasing of costs of manufacturing restructuring programmes includingnon-cash write downs as a result of plant closures and the write down of assets related to the progressive withdrawal ofTanzeum, as well as continued adverse pricing pressure in Pharmaceuticals, primarily Respiratory, and additional supply chain investments. This was partly offset by a more favourable product mix across all three businesses, particularly in Pharmaceuticals, reflecting the impact of higher HIV sales, and in Vaccines, reflecting the benefit of a settlement for lost third party supply volume and a favourableyear-on-year comparison to inventory adjustments in 2016. There was also a continued contribution from integration and restructuring savings in all three businesses.
Selling, general and administration
SG&A costs were 32.0% of turnover, 1.5 percentage points lower than in 2016 in Sterling and CER terms. This primarily reflected lower restructuring costs and tight control of ongoing operating costs, particularly in Consumer Healthcare, as well as continued cost reductions in Pharmaceuticals, including the benefits of the Pharmaceuticals restructuring programme, and integration benefits in Vaccines and Consumer Healthcare. This was partly offset by an increased investment in promotional product support, particularly for new launches in Respiratory, HIV and Vaccines.
Research and development
R&D expenditure was £4,476 million (14.8% of turnover), 23% higher than in 2016 at AER and 19% higher at CER. This included charges of £106 million from the utilisation of the Priority Review Voucher in 2017 as well as increased investment in the progression of a number of mid and late-stage programmes. In addition, there were higher restructuring costs, primarily as a result of the provision for future clinical obligations as a result of the progressive withdrawal ofTanzeum and the decision to terminate the rights to sirukumab, and higher intangible asset impairments.
Royalty and other operating income/(expense)
Net other operating expense of £1,609 million (2016 – £3,007 million) primarily reflected lower accounting charges arising from there-measurement of the contingent consideration liabilities related to the former Shionogi-ViiV Healthcare joint venture and the acquisition of the former Novartis Vaccines business, the value attributable to the Consumer Healthcare Joint Venture put option and the liabilities for the Pfizer put option and Pfizer and Shionogi preferential dividends in ViiV Healthcare. The remeasurement charges of £2,185 million (2016 – £3,914 million) reflected updated trading forecasts and changes in exchange rate assumptions as well as the unwinding of the discount applied to these future liabilities of £1,001 million. They also included charges of £666 million arising from the positive impact of US tax reform on the valuation of the Consumer Healthcare and HIV businesses. These charges were partly offset by the gain of £250 million on the disposal of the anaesthesia business to Aspen and royalty income of £356 million (2016 – £398 million).
| | |
| 66 | | |
GSK Annual Report 2017 | | |
| | |
| | |
Group financial reviewcontinued
Total resultscontinued
Operating profit
Total operating profit was £4,087 million in 2017 compared with £2,598 million in 2016. The increase primarily reflected a reduced impact from accounting charges related to the remeasurement of the liabilities for contingent consideration, put options and preferential dividends. In addition operating profit benefited from an improved operating margin driven by sales growth across all three businesses, but particularly Vaccines, and a more favourable mix in all three businesses. In Vaccines, there was also a favourableyear-on-year comparison with inventory adjustments in 2016 and the benefit of aone-off settlement in cost of sales. Continued tight control of ongoing costs and benefits from restructuring and integration also contributed to improved margins in Vaccines and Consumer Healthcare, but in Pharmaceuticals, the benefits were offset by an overall increase in Pharmaceuticals R&D investment (including the impact of the Priority Review Voucher) together with continuing price pressure, particularly in Respiratory, and supply chain investments to support new products.
Net finance costs
| | | | | | | | |
| Finance income | | 2017 £m | | | 2016 £m | |
| | |
Interest and other income | | | 63 | | | | 70 | |
| | |
Fair value movements | | | 2 | | | | 2 | |
| | |
| | | | 65 | | | | 72 | |
| | |
Finance expense | | | | | | | | |
| | |
Interest expense | | | (720 | ) | | | (701 | ) |
| | |
Unwinding of discounts on liabilities | | | (16 | ) | | | (16 | ) |
| | |
Remeasurements and fair value movements | | | (4 | ) | | | (4 | ) |
| | |
Other finance expense | | | 6 | | | | (15 | ) |
| | |
| | | | (734 | ) | | | (736 | ) |
Profit on disposal of associates
The profit on disposal of associates was £94 million (2016 – £nil). This arose from the disposal of our entire shareholdings in two associates, River Vision Development Co. Ltd and JCR Pharmaceuticals Co Ltd.
Share of after tax profits of associates and joint ventures
The share of profits of associates and joint ventures was £13 million (2016 – £5 million).
Profit before taxation
Taking account of net finance costs, the profit on disposal of associates and the share of profit of associates, profit before taxation was £3,525 million compared with £1,939 million in 2016.
Taxation
| | | | | | | | |
| | | 2017
£m | | | 2016
£m | |
| | |
UK current year charge | | | 199 | | | | 241 | |
| | |
Rest of world current year charge | | | 1,928 | | | | 1,326 | |
| | |
Charge in respect of prior periods | | | (508 | ) | | | (149 | ) |
| | |
Total current taxation | | | 1,619 | | | | 1,418 | |
| | |
Total deferred taxation | | | (263 | ) | | | (541 | ) |
| | |
Taxation on total profits | | | 1,356 | | | | 877 | |
A tax charge of £1,356 million on Total profit represented an effective tax rate of 38.5% (2016 – 45.2%) and included a charge of £1,078 million arising from US tax reform as described in more detail on page 68. This was partly offset by a £483 million benefit from Swiss tax reform, arising from the revaluation of deferred tax liabilities on acquired Consumer Healthcare brands to reflect a reduction in the headline tax rate.
Non-controlling interests
The allocation of earnings tonon-controlling interests amounted to £637 million (2016 – £150 million), including thenon-controlling interest allocations of Consumer Healthcare profits of £415 million (2016 – £203 million) and the allocation of ViiV Healthcare profits, which increased to £187 million (2016 – £83 million loss) including the impact of changes in the proportions of preferential dividends due to each shareholder. The increase in allocation of ViiV Healthcare profits primarily reflected the impact of lower remeasurement charges and the increase in allocation of Consumer Healthcare profits reflected improved operating profits together with the benefit of Swiss tax reform in 2017.
Earnings per share
Total earnings per share were 31.4p, compared with 18.8p in 2016. The increase reflected the reduced impact of charges arising from the revaluations of the liabilities for contingent consideration and the put options associated with increases in the Sterling value of the Group’s HIV and Consumer Healthcare businesses, the benefit from Swiss tax reform and improved performances by the relevant businesses, partly offset by the charges arising from US tax reform.
Dividends
The Board declared four interim dividends resulting in a total dividend for the year of 80 pence, in line with the dividend declared for 2016. See Note 16 to the financial statements, ‘Dividends’.
| | | | |
| GSK Annual Report 2017 | | Strategic report | | |
| | Governance and remuneration | | |
| | Financial statements | | |
| | Investor information | | |
Adjusting items
| | | | | | | | | | | | | | | | | | | | | | | | | | | | | | | | |
| Adjusted results reconciliation 31 December 2017 | | Total
results
£m | | | Intangible
asset
amortisation
£m | | | Intangible
asset
impairment
£m | | | Major
restructuring
£m | | | Transaction
-related £m | | | Divestments,
significant
legal and
other items
£m | | | US tax
reform
£m | | | Adjusted
results
£m | |
Turnover | | | 30,186 | | | | | | | | | | | | | | | | | | | | | | | | | | | | 30,186 | |
| | | | | | | | |
Cost of sales | | | (10,342 | ) | | | 546 | | | | 400 | | | | 545 | | | | 80 | | | | – | | | | | | | | (8,771 | ) |
Gross profit | | | 19,844 | | | | 546 | | | | 400 | | | | 545 | | | | 80 | | | | – | | | | | | | | 21,415 | |
| | | | | | | | |
Selling, general and administration | | | (9,672 | ) | | | | | | | | | | | 248 | | | | | | | | 83 | | | | | | | | (9,341 | ) |
| | | | | | | | |
Research and development | | | (4,476 | ) | | | 45 | | | | 288 | | | | 263 | | | | | | | | 18 | | | | | | | | (3,862 | ) |
| | | | | | | | |
Royalty income | | | 356 | | | | | | | | | | | | | | | | | | | | | | | | | | | | 356 | |
| | | | | | | | |
Other operating income/(expense) | | | (1,965 | ) | | | | | | | | | | | | | | | 1,519 | | | | (220 | ) | | | 666 | | | | – | |
Operating profit | | | 4,087 | | | | 591 | | | | 688 | | | | 1,056 | | | | 1,599 | | | | (119 | ) | | | 666 | | | | 8,568 | |
| | | | | | | | |
Net finance costs | | | (669 | ) | | | | | | | | | | | 4 | | | | | | | | 8 | | | | | | | | (657 | ) |
| | | | | | | | |
Profit on disposal of associates | | | 94 | | | | | | | | | | | | | | | | | | | | (94 | ) | | | | | | | – | |
| | | | | | | | |
Share of after tax profits of associates and joint ventures | | | 13 | | | | | | | | | | | | | | | | | | | | | | | | | | | | 13 | |
Profit before taxation | | | 3,525 | | | | 591 | | | | 688 | | | | 1,060 | | | | 1,599 | | | | (205 | ) | | | 666 | | | | 7,924 | |
| | | | | | | | |
Taxation | | | (1,356 | ) | | | (134 | ) | | | (176 | ) | | | (209 | ) | | | (619 | ) | | | (251 | ) | | | 1,078 | | | | (1,667 | ) |
| | | | | | | | |
Tax rate | | | 38.5% | | | | | | | | | | | | | | | | | | | | | | | | | | | | 21.0% | |
Profit after taxation | | | 2,169 | | | | 457 | | | | 512 | | | | 851 | | | | 980 | | | | (456 | ) | | | 1,744 | | | | 6,257 | |
| | | | | | | | |
Profit attributable tonon-controlling interests | | | 637 | | | | | | | | | | | | | | | | 42 | | | | | | | | 114 | | | | 793 | |
| | | | | | | | |
Profit attributable to shareholders | | | 1,532 | | | | 457 | | | | 512 | | | | 851 | | | | 938 | | | | (456 | ) | | | 1,630 | | | | 5,464 | |
| | | | | | | | |
Earnings per share | | | 31.4p | | | | 9.4p | | | | 10.5p | | | | 17.4p | | | | 19.2p | | | | (9.4)p | | | | 33.3p | | | | 111.8p | |
| | | | | | | | |
Weighted average number of shares (millions) | | | 4,886 | | | | | | | | | | | | | | | | | | | | | | | | | | | | 4,886 | |
| | | | | | | | |
| Adjusted results reconciliation 31 December 2016 | | Total
results
£m | | | Intangible
asset
amortisation
£m | | | Intangible
asset
impairment
£m | | | Major
restructuring
£m | | | Transaction
-related £m | | | Divestments,
significant
legal and
other items
£m | | | Adjusted
results
(revised)
£m | | | | |
Turnover | | | 27,889 | | | | | | | | | | | | | | | | | | | | | | | | 27,889 | | | | | |
| | | | | | | | |
Cost of sales | | | (9,290 | ) | | | 547 | | | | 7 | | | | 297 | | | | 86 | | | | 2 | | | | (8,351 | ) | | | | |
Gross profit | | | 18,599 | | | | 547 | | | | 7 | | | | 297 | | | | 86 | | | | 2 | | | | 19,538 | | | | | |
| | | | | | | | |
Selling, general and administration | | | (9,366 | ) | | | | | | | | | | | 514 | | | | | | | | 55 | | | | (8,797 | ) | | | | |
| | | | | | | | |
Research and development | | | (3,628 | ) | | | 41 | | | | 13 | | | | 159 | | | | (81 | ) | | | 28 | | | | (3,468 | ) | | | | |
| | | | | | | | |
Royalty income | | | 398 | | | | | | | | | | | | | | | | | | | | | | | | 398 | | | | | |
| | | | | | | | |
Other operating income/(expense) | | | (3,405 | ) | | | | | | | | | | | | | | | 3,914 | | | | (509 | ) | | | - | | | | | |
Operating profit | | | 2,598 | | | | 588 | | | | 20 | | | | 970 | | | | 3,919 | | | | (424 | ) | | | 7,671 | | | | | |
| | | | | | | | |
Net finance costs | | | (664 | ) | | | | | | | | | | | 4 | | | | | | | | 8 | | | | (652 | ) | | | | |
| | | | | | | | |
Share of after tax profits of associates and joint ventures | | | 5 | | | | | | | | | | | | | | | | | | | | | | | | 5 | | | | | |
Profit before taxation | | | 1,939 | | | | 588 | | | | 20 | | | | 974 | | | | 3,919 | | | | (416 | ) | | | 7,024 | | | | | |
| | | | | | | | |
Taxation | | | (877 | ) | | | (130 | ) | | | (5 | ) | | | (217 | ) | | | (439 | ) | | | 170 | | | | (1,498 | ) | | | | |
| | | | | | | | |
Tax rate | | | 45.2% | | | | | | | | | | | | | | | | | | | | | | | | 21.3% | | | | | |
Profit after taxation | | | 1,062 | | | | 458 | | | | 15 | | | | 757 | | | | 3,480 | | | | (246 | ) | | | 5,526 | | | | | |
| | | | | | | | |
Profit attributable tonon-controlling interests | | | 150 | | | | | | | | | | | | | | | | 487 | | | | | | | | 637 | | | | | |
| | | | | | | | |
Profit attributable to shareholders | | | 912 | | | | 458 | | | | 15 | | | | 757 | | | | 2,993 | | | | (246 | ) | | | 4,889 | | | | | |
| | | | | | | | |
Earnings per share | | | 18.8p | | | | 9.4p | | | | 0.3p | | | | 15.6p | | | | 61.6p | | | | (5.1)p | | | | 100.6p | | | | | |
| | | | | | | | |
Weighted average number of shares (millions) | | | 4,860 | | | | | | | | | | | | | | | | | | | | | | | | 4,860 | | | | | |
| | |
| 68 | | |
GSK Annual Report 2017 | | |
| | |
| | |
Group financial reviewcontinued
Adjusting itemscontinued
Intangible asset amortisation and impairment
Intangible asset amortisation was £591 million, compared with £588 million in 2016. Intangible asset impairments of £688 million (2016 – £20 million) included impairments related to the progressive withdrawal ofTanzeum and a number of other commercial and R&D assets following the refocusing of the R&D pipeline during 2017. Both of the amortisation and impairment charges werenon-cash items.
Major restructuring and integration
Major restructuring and integration charges of £1,056 million have been incurred (2016 – £970 million).Non-cash charges were £525 million, primarily reflecting the write down of assets as a result of the decision to withdrawTanzeum and terminate rights to sirukumab arising from the establishment of the Group’s new business priorities, as well as the write down of assets related to reductions in the site network. Cash charges were £531 million (2016 – £704 million), including charges as a result of the decisions to withdrawTanzeum and terminate rights to sirukumab. Cash payments made were £555 million (2016 – £1,077 million), including the settlement of certain charges previously accrued, but also reflecting the deferral of some payments into 2018. Cash payments of approximately £0.5 billion are expected in 2018. The programme delivered incremental cost savings in 2017 of £0.7 billion, including £0.2 billion of currency benefits.
Charges for the combined restructuring and integration programme to date are £4.8 billion, of which cash charges are £3.5 billion. Cash payments of £3.1 billion have been made to date.Non-cash charges are £1.3 billion.
An extension to the existing combined programme was agreed by the Board in July 2017, with total cash charges of the combined programme now expected to be approximately £4.1 billion andnon-cash charges up to £1.6 billion. The programme has now delivered approximately £3.7 billion of annual savings, including a currency benefit of £0.4 billion. The extended programme is now expected to deliver by 2020 total annual savings of £4.0 billion on a constant currency basis, together with an estimated £0.4 billion of currency benefits on the basis of 2017 average exchange rates.
Transaction-related adjustments
Transaction-related adjustments resulted in a net charge of £1,599 million (2016 – £3,919 million). This primarily reflected accounting charges for there-measurement of the liability and the unwinding of the discounting effects on the contingent consideration related to the acquisition of the former Shionogi-ViiV Healthcare joint venture, the contingent consideration related to the acquisition of the former Novartis Vaccines business, and the value attributable to the Consumer Healthcare Joint Venture put option held by Novartis. These transaction-related adjustments exclude the impact on these liabilities arising from the implementation of the US Tax Cuts and Jobs Act in 2017 which is set out separately on this page.
| | | | | | | | |
| Charge/(credit) | | 2017
£m | | | 2016
£m | |
| | |
| Consumer Healthcare Joint Venture put option | | | 986 | | | | 1,133 | |
| | |
| Contingent consideration on former Shionogi-ViiV Healthcare Joint Venture (including Shionogi preferential dividends) | | | 556 | | | | 2,162 | |
| | |
| ViiV Healthcare put options and Pfizer preferential dividends | | | (126 | ) | | | 577 | |
| | |
| Contingent consideration on former Novartis Vaccines business | | | 101 | | | | 69 | |
| | |
| Other adjustments | | | 82 | | | | (22 | ) |
| | |
| Total transaction-related charges | | | 1,599 | | | | 3,919 | |
The aggregate impact of unwinding the discount on these future and potential liabilities was £1,001 million (2016 – £905 million), including £543 million on the Consumer Healthcare Joint Venture put option and £408 million on the contingent consideration related to the former Shionogi-ViiV Healthcare Joint Venture. The remaining charge of £598 million was driven by adjustments to trading forecasts and the impact of updated exchange rate assumptions on those forecasts for the relevant businesses as well as updated multiples used in the valuation of the Consumer Healthcare Joint Venture put option.
Contingent consideration cash payments which are made to Shionogi and other companies reduce the balance sheet liability and hence are not recorded in the income statement. Total contingent consideration cash payments in 2017 amounted to £685 million (2016 – £431 million). This included cash payments made by ViiV Healthcare to Shionogi in relation to its contingent consideration liability (including preferential dividends) which amounted to £671 million (2016 – £417 million).
An explanation of the accounting for thenon-controlling interests in ViiV Healthcare is set out on page 59.
The impact on profit after tax from transaction-related adjustments includes an accounting credit in respect of Swiss tax reform of £483 million, arising from the revaluation of deferred tax liabilities on acquired Consumer Healthcare brands to reflect a reduction in the headline Swiss tax rate.
Divestments and other items
Divestments and other items included the profit on disposal of the anaesthesia business to Aspen of £250 million, a number of other asset disposals, equity investment impairments and certain other adjusting items. Significant legal charges of £68 million (2016 – £62 million) included the benefit of the settlement of existing matters as well as provisions for ongoing litigation. Significant legal cash payments were £192 million (2016 – £102 million).
US tax reform
The enactment of the US Tax Cuts and Jobs Act has resulted in a number of additional charges in 2017, which reduced Total earnings by £1,630 million.
Firstly, increased valuations of the HIV and Consumer Healthcare businesses due to lower US tax rates resulted in an increase in the related liabilities for contingent consideration and the put options of £666 million.
Secondly, an additional tax charge of £1,078 million comprised a reduction in the value of US deferred tax assets held against future liabilities, such as pensions, and a current tax credit, together amounting to £730 million, as well as a charge of £348 million arising on the reserves of subsidiaries of US entities in the Group. The cash impact of this latter charge will be spread over eight years from 2018, with approximately 60% expected to be payable in years six to eight.
These charges were partly offset by an allocation tonon-controlling interests amounting to £114 million, as many of the adjustments related to ViiV Healthcare and the Consumer Healthcare Joint Venture.
These charges represent management’s estimates of the impact of US tax reform on the Group based on the information currently available. As further guidance from the US Treasury on implementation of the Act becomes available, particularly with regard to the repatriation tax provisions, the assumptions underlying these estimates could change. This could result in adjustments to the charges taken that could have a material impact on the results of the Group.
| | | | |
| GSK Annual Report 2017 | | Strategic report | | |
| | Governance and remuneration | | |
| | Financial statements | | |
| | Investor information | | |
Adjusted results
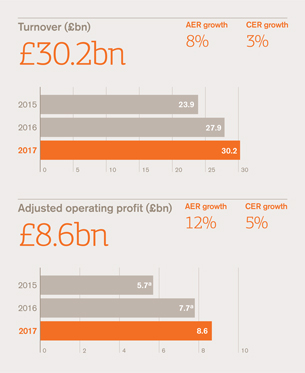
| a. | Adjusted results now exclude only significant legal charges per revised definition on page 58. Prior year figures have been revised. |
We use Adjusted results, which is anon-IFRS measure, among other metrics including total results and cash flow generation, to manage the performance of the Group.Non-IFRS measures may be considered in addition to, but not as a substitute for or superior to, information presented in accordance with IFRS. The definition of Adjusted results is set out on page 58.
Cost of sales
| | | | | | | | | | | | | | | | | | | | | | | | |
| | | | | | 2017 | | | | | | 2016 | | | | | | Growth | |
| | | | | | % of | | | | | | % of | | | | | | | |
| | | £m | | | turnover | | | £m | | | turnover | | | £% | | | CER% | |
Cost of sales | | | (8,771 | ) | | | (29.1 | ) | | | (8,351 | ) | | | (29.9 | ) | | | 5 | | | | 1 | |
Cost of sales as a percentage of turnover was 29.1%, down 0.9 percentage points in Sterling terms and down 0.5 percentage points in CER terms compared with 2016. This reflected a more favourable product mix across all three businesses, particularly in Pharmaceuticals, including the impact of higher HIV sales, as well as favourable product mix, the benefit of a settlement for lost third party supply volume and a favourableyear-on-year comparison to inventory adjustments in 2016 in Vaccines. There was also a further contribution from integration and restructuring savings in all three businesses, offset by continued adverse pricing pressure in Pharmaceuticals, primarily Respiratory, and additional supply chain investments.
Selling, general and administration
| | | | | | | | | | | | | | | | | | | | | | | | |
| | | | | | 2017 | | | | | | 2016
(revised) | | | | | | Growth | |
| | | | | | % of | | | | | | % of | | | | | | | |
| | | £m | | | turnover | | | £m | | | turnover | | | £% | | | CER% | |
Selling, general and administration | | | (9,341 | ) | | | (30.9 | ) | | | (8,797 | ) | | | (31.5 | ) | | | 6 | | | | 1 | |
SG&A costs were 30.9% of turnover, 0.6 percentage points lower in Sterling terms than in 2016 and 0.5 percentage points lower on a CER basis. This primarily reflected tight control of ongoing costs, particularly in Consumer Healthcare, continued cost reductions in Pharmaceuticals, including the benefits of the Pharmaceuticals restructuring programme, and integration benefits in Vaccines and Consumer Healthcare. This was partly offset by increased investment in promotional product support, particularly for new launches in Respiratory, HIV and Vaccines.
Research and development
| | | | | | | | | | | | | | | | | | | | | | | | |
| | | | | | 2017 | | | | | | 2016 | | | | | | Growth | |
| | | £m | | | % of
turnover | | | £m | | | % of
turnover | | | £% | | | CER% | |
Research and development | | | (3,862 | ) | | | (12.8 | ) | | | (3,468) | | | | (12.4 | ) | | | 11 | | | | 8 | |
R&D expenditure was £3,862 million (12.8% of turnover), 11% higher than 2016 at AER and 8% higher at CER. This included a charge of £106 million on the utilisation of the Priority Review Voucher in Q2 2017 as well as increased investment in the progression of a number of mid and late-stage programmes.
| | | | | | | | | | | | | | | | |
| | | 2017 | | | 2016
(revised) | | | | | | Growth | |
| | | £m | | | £m | | | £% | | | CER% | |
| | | | |
Discovery | | | 1,020 | | | | 821 | | | | 24 | | | | 21 | |
| | | | |
Development | | | 1,450 | | | | 1,249 | | | | 16 | | | | 13 | |
| | | | |
Facilities and central support functions | | | 536 | | | | 558 | | | | (4 | ) | | | (7) | |
| | | | |
Total Pharmaceuticals | | | 3,006 | | | | 2,628 | | | | 14 | | | | 11 | |
| | | | |
Vaccines R&D | | | 621 | | | | 597 | | | | 4 | | | | (2) | |
| | | | |
Consumer Healthcare R&D | | | 235 | | | | 243 | | | | (3 | ) | | | (7) | |
Research and development | | | 3,862 | | | | 3,468 | | | | 11 | | | | 8 | |
The growth in Development expenditure was driven by the progression of a number of mid and late-stage programmes in HIV, Respiratory and Anaemia, together with the utilisation of the Priority Review Voucher in Q2 2017. The continuing high growth in Discovery expenditure reflected further investment in the early stage Oncology portfolio.
Royalty income
Royalty income was £356 million (2016 – £398 million). The reduction was primarily due to the patent expiry ofCialis in Q4 2016 and acatch-up adjustment recorded in Q1 2016.
| | |
| 70 | | |
GSK Annual Report 2017 | | |
| | |
| | |
Group financial reviewcontinued
Adjusted resultscontinued
Adjusted operating profit
Adjusted operating profit was £8,568 million, 12% AER higher than in 2016 and 5% CER higher on a turnover increase of 3% CER. The Adjusted operating margin of 28.4% was 0.9 percentage points higher than in 2016 and 0.4 percentage points higher on a CER basis. This reflected improved operating leverage driven by sales growth and a more favourable mix in all three businesses, together with, in Vaccines, the benefit of a settlement for lost third party supply volume and a favourableyear-on-year comparison to inventory adjustments in 2016. There was also continued tight control of ongoing costs across all three businesses as well as benefits from restructuring and integration. This was partly offset by the charge of £106 million on the utilisation of the Priority Review Voucher in Q2 2017 as well as other increases in R&D investment, continuing price pressure, particularly in Respiratory, and supply chain investments.
Adjusted operating profit by business
| | | | | | | | | | | | | | | | | | | | | | | | |
| | | | | | 2017 | | | | | | 2016
(revised) | | | | | | Growth | |
| | | £m | | | Margin
% | | | £m | | | Margin
% | | | £% | | | CER% | |
| | | | | | |
Pharmaceuticals | | | 8,667 | | | | 50.2 | | | | 7,976 | | | | 49.5 | | | | 9 | | | | 3 | |
| | | | | | |
Pharmaceuticals R&D | | | (2,740 | ) | | | | | | | (2,488 | ) | | | | | | | 10 | | | | 7 | |
| | | | | | |
Pharmaceuticals | | | 5,927 | | | | 34.3 | | | | 5,488 | | | | 34.1 | | | | 8 | | | | 1 | |
| | | | | | |
Vaccines | | | 1,644 | | | | 31.9 | | | | 1,429 | | | | 31.1 | | | | 15 | | | | 11 | |
| | | | | | |
Consumer Healthcare | | | 1,373 | | | | 17.7 | | | | 1,116 | | | | 15.5 | | | | 23 | | | | 11 | |
| | | | | | |
| | | 8,944 | | | | 29.6 | | | | 8,033 | | | | 28.8 | | | | 11 | | | | 4 | |
| | | | | | |
Corporate & other unallocated costs | | | (376 | ) | | | | | | | (362 | ) | | | | | | | 4 | | | | (3 | ) |
| | | | | | |
Adjusted operating profit | | | 8,568 | | | | 28.4 | | | | 7,671 | | | | 27.5 | | | | 12 | | | | 5 | |
Pharmaceuticals
Pharmaceuticals operating profit was £5,927 million, 8% AER higher than in 2016 and 1% CER higher on a turnover increase of 3% CER. The operating margin of 34.3% was 0.2 percentage points higher than in 2016 on a Sterling basis but 0.6 percentage points down on a CER basis. This primarily reflected increased R&D investment, including the impact of the utilisation of the Priority Review Voucher in Q2 2017. The operating margin also reflected increased investment in new product support, as well as the continued impact of lower prices, particularly in Respiratory, and the broader transition of the Respiratory portfolio, partly offset by a more favourable product mix, primarily driven by the growth in HIV sales, and the continued cost reduction benefit of the Group’s Pharmaceuticals restructuring programme.
Vaccines
Vaccines operating profit was £1,644 million, 15% AER higher than in 2016 and 11% CER higher on a turnover increase of 6% CER. The operating margin of 31.9% was 0.8 percentage points higher than in 2016 on a Sterling basis and 1.3 percentage points higher on a CER basis. This was primarily driven by improved product mix, the benefit of a settlement for lost third party supply volume and a favourableyear-on-year comparison with inventory adjustments in 2016, together with continued restructuring and integration benefits. This was partly offset by increased SG&A resources to support business growth and new launches, increased supply chain costs and lower royalty income.
Consumer Healthcare
Consumer Healthcare operating profit was £1,373 million, 23% AER higher than in 2016 and 11% CER higher on a turnover increase of 2%. The operating margin of 17.7% was 2.2 percentage points higher than in 2016 and 1.3 percentage points higher on a CER basis, reflecting tight control of costs, integration synergies, principally in SG&A, partly offset by increased investment in power brands.
Net finance costs
| | | | | | | | |
| Finance income | | 2017
£m | | | 2016
£m | |
| | |
Interest and other income | | | 63 | | | | 70 | |
| | |
Fair value movements | | | 2 | | | | 2 | |
| | |
| | | | 65 | | | | 72 | |
| | |
Finance expense | | | | | | | | |
| | |
Interest expense | | | (720 | ) | | | (701) | |
| | |
Unwinding of discounts on liabilities | | | (4) | | | | (4) | |
| | |
Remeasurements and fair value movements | | | (4) | | | | (4) | |
| | |
Other finance expense | | | 6 | | | | (15) | |
| | | | (722 | ) | | | (724) | |
Share of after tax profits of associates and joint ventures
The share of profits of associates and joint ventures was £13 million (2016 – £5 million).
Adjusted profit before taxation
| | | | | | | | | | | | | | | | | | | | | | | | |
| | | | | | 2017 | | | | | | 2016
(revised) | | | | | | Growth | |
| | | £m | | | % of
turnover | | | £m | | | % of
turnover | | | £% | | | CER% | |
Adjusted profit before tax | | | 7,924 | | | | 26.3 | | | | 7,024 | | | | 25.2 | | | | 13 | | | | 5 | |
Taxation
Tax on Adjusted profit amounted to £1,667 million and represented an effective Adjusted tax rate of 21.0% (2016 - 21.3%).
Non-controlling interests
The allocation of Adjusted earnings tonon-controlling interests amounted to £793 million (2016 – £637 million), including thenon-controlling interest allocations of Consumer Healthcare profits of £344 million (2016 – £288 million) and the allocation of ViiV Healthcare profits, which increased to £414 million (2016 – £324 million) including the impact of changes in the proportions of preferential dividends due to each shareholder. The increase in allocation also reflected comparison with the reduction in the allocation tonon-controlling interests due to higher net losses in some of the Group’s other entities withnon-controlling interests in 2016.
Adjusted earnings per share
Adjusted EPS of 111.8p was up 11% AER, 4% CER compared with a 5% CER increase in Adjusted operating profit.
| | | | |
| GSK Annual Report 2017 | | Strategic report | | |
| | Governance and remuneration | | |
| | Financial statements | | |
| | Investor information | | |
Cash generation and conversion
A summary of the consolidated cash flow statement is set out below.
| | | | | | | | |
| | | 2017
£m | | | 2016
£m | |
| | |
Net cash inflow from operating activities | | | 6,918 | | | | 6,497 | |
| | |
Net cash outflow from investing activities | | | (1,443 | ) | | | (1,269 | ) |
| | |
Net cash outflow from financing activities | | | (6,380 | ) | | | (6,392 | ) |
| | |
Decrease in cash and bank overdrafts | | | (905 | ) | | | (1,164 | ) |
| | |
Cash and bank overdrafts at beginning of year | | | 4,605 | | | | 5,486 | |
| | |
Decrease in cash and bank overdrafts | | | (905 | ) | | | (1,164 | ) |
| | |
Exchange adjustments | | | (100 | ) | | | 283 | |
| | |
Cash and bank overdrafts at end of year | | | 3,600 | | | | 4,605 | |
| | |
Cash and bank overdrafts at end of year comprise: | | | | | | | | |
| | |
Cash and cash equivalents | | | 3,833 | | | | 4,897 | |
| | |
Overdrafts | | | (233 | ) | | | (292 | ) |
| | | | 3,600 | | | | 4,605 | |
The net cash inflow from operating activities for the year was £6,918 million (2016 – £6,497 million). The increase primarily reflected improved operating profit performance, as well as a positive currency benefit, partly offset by increased working capital reflecting the building of inventory in advance of new product launches, increased contingent consideration payments and legal settlements.
Total cash payments to Shionogi in relation to the ViiV Healthcare contingent consideration liability in the year were £671 million, of which £587 million was recognised in cash flows from operating activities and £84 million was recognised in contingent consideration paid within investing cash flows. These payments are deductible for tax purposes.
Capital expenditure and financial investment
Cash payments for tangible and intangible fixed assets amounted to £2,202 million (2016 – £2,352 million) and disposals realised £807 million (2016 – £453 million). Cash payments to acquire equity investments of £80 million (2016 – £96 million) were made and sales of equity investments realised £64 million (2016 – £683 million).
Free cash flow
Free cash flow is the amount of cash generated by the business after meeting our obligations for interest, tax and dividends paid tonon-controlling interests, and after capital expenditure on property, plant and equipment and intangible assets.
| | | | | | | | |
| | | 2017
£m | | | 2016
£m | |
| | |
Free cash inflow | | | 3,437 | | | | 3,014 | |
Free cash flow was £3,437 million for the year (2016 – £3,014 million). The increase primarily reflected improved operating profit performance, as well as a positive currency benefit and increases in returns and rebates, partly offset by increased working capital, reflecting seasonal factors and the building of inventory in advance of new product launches, increased contingent consideration payments, the purchase of the Priority Review Voucher, increased dividends tonon-controlling interests, including a catch up adjustment, and higher legal settlements. Free cash flow in 2016 was also impacted by the costs of acquiring the HIV Clinical assets from BMS for £221 million.
Reconciliation of net cash inflow from operating activities to free cash flow
A reconciliation of net cash inflow from operating activities, which is the closest equivalent IFRS measure to free cash flow, is shown below.
| | | | | | | | |
| | | 2017
£m | | | 2016 (revised) £m | |
| | |
Net cash inflow from operating activities | | | 6,918 | | | | 6,497 | |
| | |
Purchase of property, plant and equipment | | | (1,545 | ) | | | (1,543 | ) |
| | |
Purchase of intangible assets | | | (657 | ) | | | (809 | ) |
| | |
Proceeds from sale of property, plant and equipment | | | 281 | | | | 98 | |
| | |
Interest paid | | | (781 | ) | | | (732 | ) |
| | |
Interest received | | | 64 | | | | 68 | |
| | |
Dividends from associates and joint ventures | | | 6 | | | | 42 | |
| | |
Contingent consideration paid (reported in investing activities) | | | (91 | ) | | | (73 | ) |
| | |
Contribution fromnon-controlling interests | | | 21 | | | | – | |
| | |
Distributions tonon-controlling interests | | | (779 | ) | | | (534 | ) |
Free cash flow | | | 3,437 | | | | 3,014 | |
Future cash flow
Over the long term, we expect that future cash generated from operations will be sufficient to fund our operating and debt servicing costs, normal levels of capital expenditure, obligations under existing licensing agreements, expenditure arising from restructuring programmes and other routine outflows including tax, pension contributions and dividends, subject to the ‘Principal risks and uncertainties’ discussed on pages 257 to 266. We may from time to time have additional demands for finance, such as for acquisitions, including potentially acquiring increased ownership interests in the ViiV Healthcare and the Consumer Healthcare businesses where minority shareholders hold put options. We have access to multiple sources of liquidity from short and long-term capital markets and financial institutions for such needs, in addition to the cash flow from operations.
Investment appraisal and capital allocation
We have strengthened our framework for capital allocation, including the creation of a new board to govern the allocation of capital between our businesses. We utilise a consistent cash return on invested capital (CROIC) methodology to prioritise investment across the Group as a whole, so that we can more effectively compare the returns from each of the businesses as we allocate capital between them. We also consider the impact on EPS and our credit profile where relevant.
The discount rate used to perform financial analyses is decided internally, to allow determination of the extent to which investments cover our cost of capital. For individual investments the discount rate may be adjusted to take into account specific country, business or project risk.
Working capital
| | | | | | | | |
| | | 2017 | | | 2016 | |
| | |
Working capital percentage of turnover (%) | | | 22 | | | | 22 | |
| | |
Working capital conversion cycle (days) | | | 191 | | | | 193 | |
The reduction of two days in 2017 compared with 2016 was predominantly due to a beneficial impact from exchange of approximately seven days, partly offset by a build in inventory in advance of new product launches and an increase in trade receivables from higher sales.
| | |
| 72 | | |
GSK Annual Report 2017 | | |
| | |
| | |
Group financial reviewcontinued
Financial position and resources
| | | | | | | | |
| | | 2017 £m | | | 2016 £m | |
| | |
Assets | | | | | | | | |
| | |
Non-current assets | | | | | | | | |
| | |
Property, plant and equipment | | | 10,860 | | | | 10,808 | |
| | |
Goodwill | | | 5,734 | | | | 5,965 | |
| | |
Other intangible assets | | | 17,562 | | | | 18,776 | |
| | |
Investments in associates and joint ventures | | | 183 | | | | 263 | |
| | |
Other investments | | | 918 | | | | 985 | |
| | |
Deferred tax assets | | | 3,796 | | | | 4,374 | |
| | |
Derivative financial instruments | | | 8 | | | | – | |
| | |
Othernon-current assets | | | 1,413 | | | | 1,199 | |
Totalnon-current assets | | | 40,474 | | | | 42,370 | |
| | |
Current assets | | | | | | | | |
| | |
Inventories | | | 5,557 | | | | 5,102 | |
| | |
Current tax recoverable | | | 258 | | | | 226 | |
| | |
Trade and other receivables | | | 6,000 | | | | 6,026 | |
| | |
Derivative financial instruments | | | 68 | | | | 156 | |
| | |
Liquid investments | | | 78 | | | | 89 | |
| | |
Cash and cash equivalents | | | 3,833 | | | | 4,897 | |
| | |
Assets held for sale | | | 113 | | | | 215 | |
Total current assets | | | 15,907 | | | | 16,711 | |
Total assets | | | 56,381 | | | | 59,081 | |
| | |
Liabilities | | | | | | | | |
| | |
Current liabilities | | | | | | | | |
| | |
Short-term borrowings | | | (2,825 | ) | | | (4,129 | ) |
| | |
Contingent consideration liabilities | | | (1,076 | ) | | | (561 | ) |
| | |
Trade and other payables | | | (20,970 | ) | | | (11,964 | ) |
| | |
Derivative financial instruments | | | (74 | ) | | | (194 | ) |
| | |
Current tax payable | | | (995 | ) | | | (1,305 | ) |
| | |
Short-term provisions | | | (629 | ) | | | (848 | ) |
Total current liabilities | | | (26,569 | ) | | | (19,001 | ) |
| | |
Non-current liabilities | | | | | | | | |
| | |
Long-term borrowings | | | (14,264 | ) | | | (14,661 | ) |
| | |
Corporation tax payable | | | (411 | ) | | | – | |
| | |
Deferred tax liabilities | | | (1,396 | ) | | | (1,934 | ) |
| | |
Pensions and other post-employment benefits | | | (3,539 | ) | | | (4,090 | ) |
| | |
Other provisions | | | (636 | ) | | | (652 | ) |
| | |
Contingent consideration liabilities | | | (5,096 | ) | | | (5,335 | ) |
| | |
Othernon-current liabilities | | | (981 | ) | | | (8,445 | ) |
Totalnon-current liabilities | | | (26,323 | ) | | | (35,117 | ) |
Total liabilities | | | (52,892 | ) | | | (54,118 | ) |
Net assets | | | 3,489 | | | | 4,963 | |
| | |
Equity | | | | | | | | |
| | |
Share capital | | | 1,343 | | | | 1,342 | |
| | |
Share premium account | | | 3,019 | | | | 2,954 | |
| | |
Retained earnings | | | (6,477 | ) | | | (5,392 | ) |
| | |
Other reserves | | | 2,047 | | | | 2,220 | |
Shareholders’ equity | | | (68 | ) | | | 1,124 | |
Non-controlling interests | | | 3,557 | | | | 3,839 | |
| | |
Total equity | | | 3,489 | | | | 4,963 | |
Property, plant and equipment
Our business is science-based, technology-intensive and highly regulated by governmental authorities. We allocate significant financial resources to the renewal and maintenance of our property, plant and equipment to minimise risks of interruption to production and to ensure compliance with regulatory standards. A number of our processes use hazardous materials.
The total cost of our property, plant and equipment at 31 December 2017 was £21,719 million, with a net book value of £10,860 million. Of this, land and buildings represented £4,270 million, plant and equipment £4,132 million and assets in construction £2,458 million. In 2017, we invested £1,584 million in new property, plant and equipment. This was mainly related to a large number of projects for the renewal, improvement and expansion of facilities at various worldwide sites. Property is mainly held freehold. New investment is financed from our liquid resources. At 31 December 2017, we had contractual commitments for future capital expenditure of £584 million and operating lease commitments of £1,045 million. We believe that our property and plant facilities are adequate for our current needs.
We observe stringent procedures and use specialist skills to manage environmental risks from our activities. Environmental issues, sometimes dating from operations now modified or discontinued, are reported under ‘Environmental sustainability’ on page 61 and in Note 45 to the financial statements, ‘Legal proceedings’.
Goodwill
Goodwill decreased during the year to £5,734 million at 31 December 2017, from £5,965 million. The decrease primarily reflected the impact of exchange movements.
Other intangible assets
Other intangible assets include the cost of intangibles acquired from third parties and computer software. The net book value of other intangible assets as at 31 December 2017 was £17,562 million (2016 – £18,776 million). The decrease in 2017 reflected the impact of exchange movements and the amortisation and impairment of existing intangibles of £934 million and £680 million respectively, partly offset by the development costs capitalised during the year of £251 million and other additions of £454 million.
Investments in associates and joint ventures
We held investments in associates and joint ventures with a carrying value at 31 December 2017 of £183 million (2016 – £263 million). The market value at 31 December 2017 was £372 million (2016 – £502 million). The largest of these investments was in Innoviva Inc. which had a book value at 31 December 2017 of £147 million (2016 – £138 million). The market value at 31 December 2017 was £336 million. See Note 20 to the financial statements ‘Investments in associates and joint ventures’.
Other investments
We held other investments with a carrying value at 31 December 2017 of £918 million (2016 – £985 million). The decrease in the carrying value during the year was primarily due to the impact of exchange movements. The most significant of the investments held at 31 December 2017 was in Theravance Biopharma, Inc. which had a book value at 31 December 2017 of £199 million (2017 – £248 million). The other investments included equity stakes in companies with which we have research collaborations, which provide access to biotechnology developments of potential interest and interests in companies that arise from business divestments.
| | | | |
| GSK Annual Report 2017 | | Strategic report | | |
| | Governance and remuneration | | |
| | Financial statements | | |
| | Investor information | | |
Financial position and resourcescontinued
Derivative financial instruments: assets
We had current derivative financial instruments held at fair value of £68 million (2016 – £156 million) andnon-current derivative financial instruments held at fair value of £8 million (2016 – £nil). The majority of these financial instruments related to foreign exchange contracts both designated and not designated as accounting hedges.
Inventories
Inventory of £5,557 million increased from £5,102 million in 2016. The increase primarily reflected inventory build in advance of new product launches.
Trade and other receivables
Trade and other receivables of £6,000 million decreased from £6,026 million in 2016, primarily reflecting exchange movements partly offset by the impact of higher sales.
Deferred tax assets
Deferred tax assets of £3,796 million decreased from £4,374 million in 2016 primarily as a result of the revaluation of existing deferred tax assets to reflect the lower headline US tax rate following enactment of US tax reform, partly offset by an increase in deferred tax assets related to intra-Group profit on inventory.
Derivative financial instruments: liabilities
We held current derivative financial instruments at fair value of £74 million (2016 – £194 million). This primarily related to foreign exchange contracts both designated and not designated as accounting hedges.
Trade and other payables
Trade and other payables amounting to £20,970 million increased from £11,964 million in 2016, reflecting the reclassification of the Consumer Healthcare put option of £8,606 million fromnon-current liabilities. This relates to the present value of the estimated amount payable by us in the event of full exercise of Novartis’ right to require us to acquire its 36.5% shareholding in the Consumer Healthcare Joint Venture. As this option became exercisable from 2 March 2018, with payment likely to be due several months after exercise, it has been classified within current liabilities on the Group balance sheet. Further details are provided in Note 3, ‘Key accounting judgements and estimates’.
Provisions
We carried deferred tax provisions and other short-term andnon-current provisions of £2,661 million at 31 December 2017 (2016 – £3,434 million). The decrease in the year primarily reflected a reduction in the deferred tax provision as a result of Swiss tax reform. Other provisions at theyear-end include £186 million (2016 – £344 million) related to legal and other disputes and £504 million (2016 – £554 million) related to the major restructuring programme. Provision has been made for legal and other disputes, indemnified disposal liabilities, employee related liabilities and the costs of the restructuring programme to the extent that at the balance sheet date a legal or constructive obligation existed and could be reliably estimated.
Pensions and other post-employment benefits
We account for pension and other post-employment arrangements in accordance with IAS 19. The deficits, net of surpluses before allowing for deferred taxation were £1,505 million (2016 – £2,084 million) on pension arrangements and £1,496 million (2016 – £1,693 million) on unfunded post-employment liabilities. The decreases in the deficits were predominantly driven by special funding contributions to the UK and US schemes and significant UK asset gains partly offset by lower discount rates that we used to discount the value of the liabilities.
Othernon-current liabilities
Othernon-current liabilities amounted to £981 million at
31 December 2017 (2016 – £8,445 million). This decrease from 2016 reflects the reclassification of the Consumer Healthcare put option to current liabilities during the year.
Contingent consideration liabilities
Contingent consideration liabilities amounted to £6,172 million at
31 December 2017 (2016 – £5,896 million), of which £5,542 million (2016 – £5,304 million) represented the estimated present value of amounts payable to Shionogi relating to ViiV Healthcare and £584 million (2016 – £545 million) represented the estimated present value of contingent consideration payable to Novartis related to the Vaccines acquisition. The liability due to Shionogi included £216 million in respect of preferential dividends. The liability for preferential dividends due to Pfizer at 31 December 2017 was £17 million. An explanation of the accounting treatment of our interests in ViiV Healthcare is set out on page 59.
Net debt
| | | | | | | | |
| | | 2017
£m | | | 2016 £m | |
| | |
Cash, cash equivalents and liquid investments | | | 3,911 | | | | 4,986 | |
| | |
Borrowings – repayable within one year | | | (2,825 | ) | | | (4,129 | ) |
| | |
Borrowings – repayable after one year | | | (14,264 | ) | | | (14,661 | ) |
Net debt | | | (13,178 | ) | | | (13,804 | ) |
At 31 December 2017, net debt was £13.2 billion, compared with £13.8 billion at 31 December 2016, comprising gross debt of £17.1 billion and cash and liquid investments of £3.9 billion. The decrease in net debt primarily reflected the improved free cash flow of £3.4 billion, disposal proceeds of £0.6 billion, together with a £0.6 billion favourable exchange impact from the translation ofnon-Sterling denominated debt, which more than offset the cost of dividends paid to shareholders of £3.9 billion.
At 31 December 2017, our cash and liquid investments were held as follows:
| | | | | | | | |
| | | 2017
£m | | | 2016
£m | |
| | |
Bank balances and deposits | | | 1,715 | | | | 2,583 | |
| | |
US Treasury and Treasury repo only money market funds | | | 1,715 | | | | 2,248 | |
| | |
Liquidity funds | | | 403 | | | | 66 | |
| | |
Cash and cash equivalents | | | 3,833 | | | | 4,897 | |
| | |
Liquid investments – Government securities | | | 78 | | | | 89 | |
| | | | 3,911 | | | | 4,986 | |
Cash and liquid investments of £2.5 billion (2016 – £3.2 billion) were held centrally at 31 December 2017.
| | |
| 74 | | |
GSK Annual Report 2017 | | |
| | |
| | |
Group financial reviewcontinued
Financial position and resourcescontinued
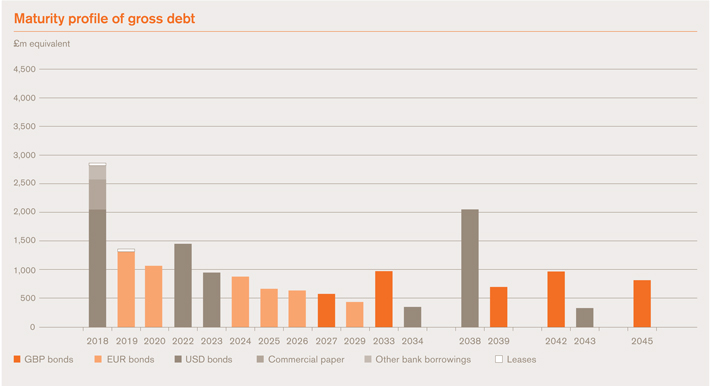
The analysis of cash and gross debt after the effects of hedging is as follows.
| | | | | | | | |
| | | 2017 £m | | | 2016 £m | |
| | |
Cash and liquid investments | | | 3,911 | | | | 4,986 | |
| | |
Gross debt – fixed | | | (16,229 | ) | | | (17,288 | ) |
| | |
– floating | | | (805 | ) | | | (1,496 | ) |
| | |
–non-interest bearing | | | (55 | ) | | | (6 | ) |
Net debt | | | (13,178 | ) | | | (13,804 | ) |
| | |
Movements in net debt | | | | | | | | |
| | | 2017 £m | | | 2016 £m | |
| | |
Net debt at beginning of year | | | (13,804 | ) | | | (10,727 | ) |
| | |
(Decrease)/increase in cash and bank overdrafts | | | (905 | ) | | | (1,164 | ) |
| | |
Increase in liquid investments | | | (4 | ) | | | – | |
| | |
Increase in long-term loans | | | (2,233 | ) | | | – | |
| | |
Net repayment of/(increase in) short-term loans | | | 3,200 | | | | (148 | ) |
| | |
Exchange movements | | | 585 | | | | (1,781 | ) |
| | |
Other movements | | | (17 | ) | | | 16 | |
| | |
Net debt at end of year | | | (13,178 | ) | | | (13,804 | ) |
Total equity
At 31 December 2017, total equity had decreased from £4,963 million at 31 December 2016 to £3,489 million. This primarily reflected the impact of the dividends paid exceeding the Total profit for the year offset by favourable exchange translation impact from the weaker Sterling rates. The Total profit for the year was impacted by the charge in respect of US tax reform.
A summary of the movements in equity is set out below.
| | | | | | | | |
| | | 2017 £m | | | 2016 £m | |
| | |
Total equity at beginning of year | | | 4,963 | | | | 8,878 | |
| | |
Total comprehensive income for the year | | | 2,882 | | | | 2,024 | |
| | |
Dividends to shareholders | | | (3,906 | ) | | | (4,850 | ) |
| | |
Ordinary shares issued | | | 56 | | | | 89 | |
| | |
Changes innon-controlling interests | | | (2 | ) | | | 32 | |
| | |
Recognition of liabilities withnon-controlling interests | | | – | | | | (2,172 | ) |
| | |
De-recognition of liabilities withnon-controlling interests | | | – | | | | 1,244 | |
| | |
Shares acquired by ESOP Trusts | | | (65 | ) | | | (74 | ) |
| | |
Share-based incentive plans | | | 333 | | | | 319 | |
| | |
Tax on share-based incentive plans | | | (4 | ) | | | 7 | |
| | |
Contributions fromnon-controlling interests | | | 21 | | | | – | |
| | |
Distributions tonon-controlling interests | | | (789 | ) | | | (534 | ) |
Total equity at end of year | | | 3,489 | | | | 4,963 | |
| | | | |
| GSK Annual Report 2017 | | Strategic report | | |
| | Governance and remuneration | | |
| | Financial statements | | |
| | Investor information | | |
Financial position and resourcescontinued
Share purchases
In 2017, the Employee Share Ownership Plan (ESOP) Trusts acquired £65 million of shares in GlaxoSmithKline plc (2016 – £74 million). Shares are held by the Trusts to satisfy future exercises of options and awards under the Group share option and award schemes. A proportion of the shares held by the Trusts are in respect of awards where the rules of the scheme require us to satisfy exercises through market purchases rather than the issue of new shares. The shares held by the Trusts are matched to options and awards granted.
At 31 December 2017, the ESOP Trusts held 66.7 million (2016 – 43 million) GSK shares against the future exercise of share options and share awards. The carrying value of £400 million (2016 – £286 million) has been deducted from other reserves. The market value of these shares was £882 million (2016 – £667 million).
During 2017, no shares were repurchased. At 31 December 2017, we held 414.6 million shares as Treasury shares (2016 – 458.2 million shares), at a cost of £5,800 million (2016 – £6,451 million), which has been deducted from retained earnings.
No ordinary shares were purchased in the period 1 January 2018 to 12 March 2018 and the company does not expect to make any ordinary share repurchases in the remainder of 2018.
Commitments and contingent liabilities
Financial commitments are summarised in Note 41 to the financial statements, ‘Commitments’. Other contingent liabilities and obligations in respect of short and long-term debt are set out in Note 32 to the financial statements, ‘Contingent liabilities’ and Note 31 to the financial statements, ‘Net debt’.
Amounts provided for pensions and post-retirement benefits are set out in Note 28 to the financial statements, ‘Pensions and other post-employment benefits’. Amounts provided for restructuring programmes and legal, environmental and other disputes are set out in Note 29 to the financial statements, ‘Other provisions’.
Contractual obligations and commitments
The following table sets out our contractual obligations and commitments at 31 December 2017 as they fall due for payment.
| | | | | | | | | | | | | | | | | | | | |
| | | Total £m | | | Under 1 yr
£m | | | 1-3 yrs
£m | | | 3-5 yrs
£m | | | 5 yrs+ £m | |
| | | | | |
Loans | | | 17,137 | | | | 2,802 | | | | 2,422 | | | | 1,499 | | | | 10,414 | |
| | | | | |
Interest on loans | | | 8,510 | | | | 555 | | | | 985 | | | | 956 | | | | 6,014 | |
| | | | | |
Finance lease obligations | | | 66 | | | | 23 | | | | 35 | | | | 3 | | | | 5 | |
| | | | | |
Finance lease charges | | | 12 | | | | 2 | | | | 3 | | | | 2 | | | | 5 | |
| | | | | |
Operating lease commitments | | | 1,045 | | | | 186 | | | | 271 | | | | 201 | | | | 387 | |
| | | | | |
Intangible assets | | | 5,254 | | | | 205 | | | | 546 | | | | 750 | | | | 3,753 | |
| | | | | |
Property, plant & equipment | | | 584 | | | | 527 | | | | 51 | | | | 6 | | | | – | |
| | | | | |
Investments | | | 107 | | | | 34 | | | | 47 | | | | 26 | | | | – | |
| | | | | |
Purchase commitments | | | 346 | | | | 284 | | | | 23 | | | | 17 | | | | 22 | |
| | | | | |
Pensions | | | 738 | | | | 123 | | | | 246 | | | | 246 | | | | 123 | |
| | | | | |
Other commitments | | | 38 | | | | 18 | | | | 20 | | | | – | | | | – | |
| | | | | |
Total | | | 33,837 | | | | 4,759 | | | | 4,649 | | | | 3,706 | | | | 20,723 | |
Commitments in respect of loans and future interest payable on loans are disclosed before taking into account the effect of derivatives.
We have entered into a number of research collaborations to develop new compounds with other pharmaceutical companies. The terms of these arrangements can include upfront fees, equity investments, loans and commitments to fund specified levels of research. In addition, we will often agree to make further payments if future ‘milestones’ are achieved.
As some of these agreements relate to compounds in the early stages of development, the potential obligation to make milestone payments will continue for a number of years if the compounds move successfully through the development process. Generally, the closer the product is to marketing approval, the greater the probability of success. The amounts shown above within intangible assets represent the maximum that would be paid if all milestones were achieved, and include £4.5 billion which relates to externalised projects in the discovery portfolio. There was a reduction in the commitments in 2017 due to amendments made to existing agreements and obligations which have ceased.
In 2016, we reached an agreement with the trustees of the UK pension schemes to make additional contributions, including in 2016, to assist in eliminating the pension deficit identified as part of the 31 December 2014 actuarial funding valuation. The table above includes this commitment but excludes the normal ongoing annual funding requirement in the UK of approximately £130 million. For further information on pension obligations, see Note 28 to the financial statements, ‘Pensions and other post-employment benefits’.
Contingent liabilities
The following table sets out contingent liabilities, comprising discounted bills, performance guarantees, letters of credit and other items arising in the normal course of business, and when they are expected to expire.
| | | | | | | | | | |
| | | Total
£m | | Under 1 yr
£m | | 1-3 yrs
£m | | 3-5 yrs
£m | | 5 yrs+
£m |
| | | | | |
| Guarantees | | 315 | | 151 | | 127 | | 31 | | 6 |
| | | | | |
| Other contingent liabilities | | 119 | | 17 | | 61 | | 3 | | 38 |
| | | | | |
| Total | | 434 | | 168 | | 188 | | 34 | | 44 |
In the normal course of business, we have provided various indemnification guarantees in respect of business disposals in which legal and other disputes have subsequently arisen. A provision is made where an outflow of resources is considered probable and a reliable estimate can be made of the likely outcome of the dispute and this is included in Note 29 to the financial statements, ‘Other provisions’.
We provide for the outcome of tax, legal and other disputes when an outflow of resources is considered probable and a reliable estimate of the outflow may be made. At 31 December 2017, other than for those disputes where provision has been made, it was not possible to make a reliable estimate of the potential outflow of funds that might be required to settle disputes where the possibility of there being an outflow was more than remote.
The ultimate liability for such matters may vary significantly from the amounts provided and is dependent upon the outcome of litigation proceedings and negotiations with the relevant tax authorities. This is discussed further in ‘Principal risks and uncertainties’ on pages 257 to 266 and Notes 14 and 45 to the financial statements, ‘Taxation’ and ‘Legal proceedings’.
| | |
| 76 | | |
GSK Annual Report 2017 | | |
| | |
| | |
Group financial reviewcontinued
Critical accounting policies
The consolidated financial statements are prepared in accordance with IFRS, as adopted for use in the European Union, and also with IFRS as issued by the IASB, following the accounting policies approved by the Board and described in Note 2 to the financial statements, ‘Accounting principles and policies’.
We are required to make estimates and assumptions that affect the amounts of assets, liabilities, revenue and expenses reported in the financial statements. Actual amounts and results could differ from those estimates.
The critical accounting policies relate to the following areas:
| – | | Legal and other disputes (Notes 29 and 45) |
| – | | Intangible asset impairments (Note 19) |
| – | | Business combinations (Note 38) |
| – | | Pensions and other post-employment benefits (Note 28). |
Information on the judgements and estimates made in these areas is given in Note 3 to the financial statements, ‘Key accounting judgements and estimates’.
Turnover
In respect of the Turnover accounting policy, our largest business is US Pharmaceuticals, and the US market has the most complex arrangements for rebates, discounts and allowances. The following briefly describes the nature of the arrangements in existence in our US Pharmaceuticals business:
| – | | We have arrangements with certain indirect customers whereby the customer is able to buy products from wholesalers at reduced prices. A chargeback represents the difference between the invoice price to the wholesaler and the indirect customer’s contractual discounted price. Accruals for estimating chargebacks are calculated based on the terms of each agreement, historical experience and product growth rates |
| – | | Customer rebates are offered to key managed care and Group Purchasing Organisations (GPO) and other direct and indirect customers. These arrangements require the customer to achieve certain performance targets relating to the value of product purchased, formulary status orpre-determined market shares relative to competitors. The accrual for customer rebates is estimated based on the specific terms in each agreement, historical experience and product growth rates |
| – | | The US Medicaid programme is a state-administered programme providing assistance to certain poor and vulnerable patients. In 1990, the Medicaid Drug Rebate Program was established to reduce State and Federal expenditure on prescription drugs. In 2010, the Patient Protection and Affordable Care Act became law. We participate by providing rebates to states. Accruals for Medicaid rebates are calculated based on the specific terms of the relevant regulations or the Patient Protection and Affordable Care Act |
| – | | Cash discounts are offered to customers to encourage prompt payment. These are accrued for at the time of invoicing and adjusted subsequently to reflect actual experience |
| – | | We record an accrual for estimated sales returns by applying historical experience of customer returns to the amounts invoiced, together with market related information such as stock levels at wholesalers, anticipated price increases and competitor activity. |
A reconciliation of gross turnover to net turnover for the US Pharmaceuticals business, including Puerto Rico, is as follows:
| | | | | | | | | | | | | | | | | | | | | | | | |
| | | 2017 | | | 2016 | | | 2015 | |
| | | £m | | | Margin
% | | | £m | | | Margin
% | | | £m | | | Margin
% | |
| | | | | | |
Gross turnover | | | 16,365 | | | | 100 | | | | 13,363 | | | | 100 | | | | 10,093 | | | | 100 | |
| | | | | | |
Market driven segments | | | (4,058 | ) | | | (25 | ) | | | (2,749 | ) | | | (21 | ) | | | (1,761 | ) | | | (17 | ) |
| | | | | | |
Government mandated and state programs | | | (3,938 | ) | | | (24 | ) | | | (3,070 | ) | | | (23 | ) | | | (2,357 | ) | | | (23 | ) |
| | | | | | |
Cash discounts | | | (330 | ) | | | (2 | ) | | | (261 | ) | | | (2 | ) | | | (192 | ) | | | (2 | ) |
| | | | | | |
Customer returns | | | (97 | ) | | | (1 | ) | | | (98 | ) | | | (1 | ) | | | (93 | ) | | | (1 | ) |
| | | | | | |
Prior year adjustments | | | 86 | | | | 1 | | | | 109 | | | | 1 | | | | 142 | | | | 1 | |
| | | | | | |
Other items | | | (460 | ) | | | (3 | ) | | | (457 | ) | | | (3 | ) | | | (298 | ) | | | (3 | ) |
| | | | | | |
Total deductions | | | (8,797 | ) | | | (54 | ) | | | (6,526 | ) | | | (49 | ) | | | (4,559 | ) | | | (45 | ) |
| | | | | | |
| Net turnover | | 7,568 | | | 46 | | | 6,837 | | | 51 | | | 5,534 | | | 55 | |
Market driven segments consist primarily of Managed Care and Medicare plans with which GSK negotiates contract pricing that is honoured via rebates and chargebacks. Mandated segments consist primarily of Medicaid and Federal Government programmes which receive government mandated pricing via rebates and chargebacks.
The increased deductions in the market driven segments of the gross turnover to net turnover reconciliation primarily reflected higher rebates and chargebacks on Respiratory products, and onAdvair in particular. During 2017,Advair accounted for 21% of US Pharmaceuticals turnover and approximately 40% of the total deduction for rebates and returns, and the Respiratory portfolio as a whole accounted for approximately 82% of the total deduction in the year.Advair continued to suffer pricing pressures in 2017 as the business sought to transition its Respiratory portfolio to newer products.
The balance sheet accruals for rebates, discounts, allowances and returns for the US Pharmaceuticals and Vaccines businesses are managed on a combined basis. At 31 December 2017, the total accrual amounted to £2,837 million (2016 – £2,218 million).
A monthly process is operated to monitor inventory levels at wholesalers for any abnormal movements. This process uses gross sales volumes, prescription volumes based on third party data sources and information received from key wholesalers. The aim of this is to maintain inventories at a consistent level from year to year based on the pattern of consumption.
On this basis, US Pharmaceuticals and Vaccines inventory levels at wholesalers and in other distribution channels at 31 December 2017 were estimated to amount to approximately four weeks of turnover. This calculation uses third party information, the accuracy of which cannot be totally verified, but is believed to be sufficiently reliable for this purpose.
| | | | |
| GSK Annual Report 2017 | | Strategic report | | |
| | Governance and remuneration | | |
| | Financial statements | | |
| | Investor information | | |
Critical accounting policiescontinued
Legal and other disputes
In respect of the accounting policy for Legal and other disputes, the following briefly describes the process by which we determine the level of provision that is necessary.
In accordance with the requirements of IAS 37, ‘Provisions, contingent liabilities and contingent assets’, we provide for anticipated settlement costs where an outflow of resources is considered probable and a reliable estimate may be made of the likely outcome of the dispute and legal and other expenses arising from claims against the Group. We may become involved in significant legal proceedings, in respect of which it is not possible to make a reliable estimate of the expected financial effect, if any, that could result from ultimate resolution of the proceedings. In these cases, appropriate disclosure about such cases would be included in the Annual Report, but no provision would be made.
This position could change over time and, therefore, there can be no assurance that any losses that result from the outcome of any legal proceedings will not exceed by a material amount the amount of the provisions reported in the Group’s financial statements.
Like many pharmaceutical companies, we are faced with various complex product liability, anti-trust and patent litigation, as well as investigations of its operations conducted by various governmental regulatory agencies. Throughout the year, the General Counsel of the Group, as head of the Group’s legal function, and the Senior Vice President and Head of Global Litigation for the Group, who is responsible for all litigation and government investigations, routinely brief the Chief Executive Officer, the Chief Financial Officer and the Board of Directors on the significant litigation pending against the Group and governmental investigations of the Group.
These meetings, as appropriate, detail the status of significant litigation and government investigations and review matters such as the number of claims notified to us, information on potential claims not yet notified, assessment of the validity of claims, progress made in settling claims, recent settlement levels and potential reimbursement by insurers.
The meetings also include an assessment of whether or not there is sufficient information available for us to be able to make a reliable estimate of the potential outcomes of the disputes. Often, external counsel assisting us with various litigation matters and investigations will also assist in the briefing of the Board and senior management. Following these discussions, for those matters where it is possible to make a reliable estimate of the amount of a provision, if any, that may be required, the level of provision for legal and other disputes is reviewed and adjusted as appropriate. These matters are discussed further in Note 45 to the financial statements, ‘Legal proceedings’.
Treasury policies
We report in Sterling and pay dividends out of Sterling cash flows. The role of Treasury is to monitor and manage the Group’s external and internal funding requirements and financial risks in support of our strategic objectives. GSK operates on a global basis, primarily through subsidiary companies, and we manage our capital to ensure that our subsidiaries are able to operate as going concerns and to optimise returns to shareholders through an appropriate balance of debt and equity. Treasury activities are governed by policies approved annually by the Board of Directors, and most recently on 20 July 2017. A Treasury Management Group (TMG) meeting, chaired by our Chief Financial Officer, takes place on a regular basis to review treasury activities. Its members receive management information relating to these activities.
Treasury operations
The objective of our Treasury activity is to minimise thepost-tax net cost of financial operations and reduce its volatility in order to benefit earnings and cash flows. We use a variety of financial instruments to finance our operations and derivative financial instruments to manage market risks from these operations. These derivatives, principally comprising interest rate swaps, foreign exchange forward contracts and swaps, are used to swap borrowings and liquid assets into currencies required for Group purposes and to manage exposure to financial risks from changes in foreign exchange rates and interest rates.
We do not hold or issue derivatives for speculative purposes and GSK’s Treasury policies specifically prohibit such activity. All transactions in financial instruments are undertaken to manage the risks arising from underlying business activities.
Capital management
Our financial strategy, implemented through the Group’s Financial architecture, supports GSK’s strategic priorities and it is regularly reviewed by the Board. We manage the capital structure of the Group through an appropriate mix of debt and equity.
GSK’s long-term credit rating with Standard and Poor’s is A+ (stable outlook) and with Moody’s Investor Services (‘Moody’s’) is A2 (stable outlook). Our short-term credit ratings areA-1 andP-1 with Standard and Poor’s and Moody’s respectively.
Liquidity risk management
Our policy is to borrow centrally in order to meet anticipated funding requirements. Our cash flow forecasts and funding requirements are monitored by the TMG on a regular basis. Our strategy is to diversify liquidity sources using a range of facilities and to maintain broad access to financial markets.
Each day, we sweep cash from a number of global subsidiaries to central Treasury accounts for liquidity management purposes.
Interest rate risk management
Our objective is to minimise the effective net interest cost and to balance the mix of debt at fixed and floating interest rates over time. The policy on interest rate risk management limits the amount of floating interest payments to a prescribed percentage of operating profit.
| | |
| 78 | | |
GSK Annual Report 2017 | | |
| | |
| | |
Group financial reviewcontinued
Treasury policiescontinued
Foreign exchange risk management
Foreign currency transaction exposures arising on external trade flows are not normally hedged. Foreign currency transaction exposures arising on internal trade flows are selectively hedged. Our objective is to minimise the exposure of overseas operating subsidiaries to transaction risk by matching local currency income with local currency costs where possible. GSK’s internal trading transactions are matched centrally and we manage inter-company payment terms to reduce foreign currency risk. Foreign currency cash flows can be hedged selectively under the management of Treasury and the TMG. These include hedges of the foreign exchange risk arising from acquisitions and disposals of assets. Where possible, we manage the cash surpluses or borrowing requirements of subsidiary companies centrally using forward contracts to hedge future repayments back into the originating currency.
In order to reduce foreign currency translation exposure, we seek to denominate borrowings in the currencies of our principal assets and cash flows. These are primarily denominated in US Dollars, Euros and Sterling. Borrowings can be swapped into other currencies as required.
Borrowings denominated in, or swapped into, foreign currencies that match investments in overseas Group assets may be treated as a hedge against the relevant assets. Forward contracts in major currencies are also used to reduce exposure to the Group’s investment in overseas Group assets. The TMG reviews the ratio of borrowings to assets for major currencies regularly.
Counterparty risk management
We set global counterparty limits for each of our banking and investment counterparties based on long-term credit ratings from Moody’s and Standard and Poor’s. Treasury’s usage of these limits is monitored daily by a Corporate Compliance Officer (CCO) who operates independently of Treasury. Any breach of these limits would be reported to the CFO immediately.
The CCO also monitors the credit rating of these counterparties and, when changes in ratings occur, notifies Treasury so that changes can be made to investment levels or to authority limits as appropriate.In addition, relationship banks and their credit ratings are reviewed regularly and a report is presented annually to the TMG for approval.
Strategic report
The Strategic report was approved by the Board of Directors on
12 March 2018 and signed on its behalf by:
Simon Dingemans
Chief Financial Officer
12 March 2018
| | | | |
| 79 | | |
| | | | | |
| GSK Annual Report 2017 | | Strategic report | | |
| | Governance and remuneration | |  |
| | Financial statements | | |
| | Investor information | | |
| | |
| 80 | | |
GSK Annual Report 2017 | | |
| | |
| | |
Chairman’s Governance statement

“Emma Walmsley and the CET plan to ensure that the company’s culture and values are consistent with our strategy and performance objectives.”
Dear Shareholder
I am pleased to present our Corporate Governance report for 2017.
Governance, strategy and long-term value creation
The Board remains committed to achieving the highest standards of corporate governance and integrity. Our governance structure operates from the Board across the Group and we believe it is critical in underpinning our ability to deliver our strategy to create long-term value and benefit for our shareholders and stakeholders. Our investors are also telling us that there has never been a greater need for companies to combine obligations to society with delivery of our financial performance.
The following pages set out details on the composition of our Board, its corporate governance arrangements, processes and activities during 2017, together with reports from each of the Board’s Committees, including the new Science Committee.
Last year we reported on the Board’s work on CEO and executive management succession. In 2017, the Board’s focus was in supporting Emma Walmsley’s transition into her new role and conducting a detailed review of the company’s strategy with management.
CEO transition
In the period before she formally took up the reins as CEO in April, Emma was working on how she would evolve the company’s strategy with support and guidance from the Board. She met with each Board director to solicit their views on the company, as well as meeting with employees at all levels of the business, external advisers and commentators to gain a wide view. She shaped her thinking with the Board as it evolved. OurNon-Executive Directors were fully engaged in this process. Emma utilised the diverse expertise around the boardroom table to test and shape the detail of her proposals. In particular, the Board and its Committees provided Emma and the management team with continuous feedback and challenge. This review culminated in a discussion at a joint strategy meeting with the full Corporate Executive Team (CET) in June at which the proposed Innovation, Performance and Trust priorities were scrutinised ahead of Board approval in July.
Emma and the CET then laid out at the Investor Update in July, how Innovation, Performance and Trust would provide a platform for growth from 2020 and beyond. She alsore-affirmed the commitment to the three-business structure, subject to certain conditions which would continue to be reviewed periodically. This commitment was tested by the Board at the joint strategy session in June. In terms of continuing Board oversight of the Innovation, Performance and Trust priorities, all Board papers have beenre-shaped to align with the new business priorities. In addition, the CEO’s report includes Innovation, Performance and Trust performance indicators. Our annual strategy meetings will enable the Board to consider the progress and effectiveness of our business priorities in delivering long-term value to investors.
| | | | |
| 81 | | |
| | | | | |
| GSK Annual Report 2017 | | Strategic report | | |
| | Governance and remuneration | | |
| | Financial statements | | |
| | Investor information | | |
Aligning strategy and culture
A healthy culture is a vital tool in unlocking and protecting value and the biggest driver of our culture is the leadership of our company. Emma Walmsley and the CET plan to ensure that the company’s culture and values are consistent with our strategy and performance objectives. When the Board reviewed her proposed strategy, culture featured heavily in the discussions. The Board approved a move to a high-performance, values-based culture where the new expectations of Courage, Accountability, Development and Teamwork guide employee behavior. The Board received a report on management’s commitments and initiatives as a modern employer.
The CET held a leadership conference in October for the company’s top 600 leaders, which I and otherNon-Executive Directors attended. This was critical to transfer ownership of our strategy and culture to our leaders and on into the company. We are now measuring progress in implementingour priorities and monitoring aspects of our culture twice a year through anall-employee survey. This survey measures engagement, progress on our Innovation, Performance and Trust priorities, our values and expectations. Emma reports progress to the Board regularly on culture.
Further details on the company’s commitment to being a modern employer and driving high levels of employee engagement as part of our Trust agenda are set out on pages 48 and 49 of the Strategic report.
Board evaluation
This was an appropriate time in the Board’s evolution to carry out an external Board evaluation and the CEO, our Senior IndependentNon-Executive Director and I therefore chose to appoint a new external Board evaluator for this review to bring a fresh perspective. Details of the externally facilitated review and its conclusions are set out on pages 92 to 93.
Corporate Governance reform
The Board has taken a close interest in the UK Government’s development of a package of legislative and best practice measures and supports initiatives that raise the bar on corporate governance practices and effectiveness.
As part of this reform drive, the Financial Reporting Council (FRC) has recently consulted on its proposals for a revised UK Corporate Governance Code. We have submitted our views. I am pleased to note that the FRC has included new measures to encourage companies to take steps to align their strategy and culture and promote effective engagement with their workforce and wider stakeholders, issues that I have described earlier in relation to the approach of our own Board.
The Government’s corporate governance reform legislation and the new Code are expected to be effective from 2019 financial years. I look forward to providing an update on how our arrangements measure up to these new requirements in next year’s report.
UK Corporate Governance Code
compliance
I am pleased to report that we were in full compliance with the requirements of the FRC’s UK Corporate Governance Code (Code) and a copy of the Code is available on www.frc.org.uk.
I commend this report to all of our shareholders.

Philip Hampton
Chairman
12 March 2018
| | |
| 82 | | |
GSK Annual Report 2017 | | |
| | |
| | |
Our Board
| | |
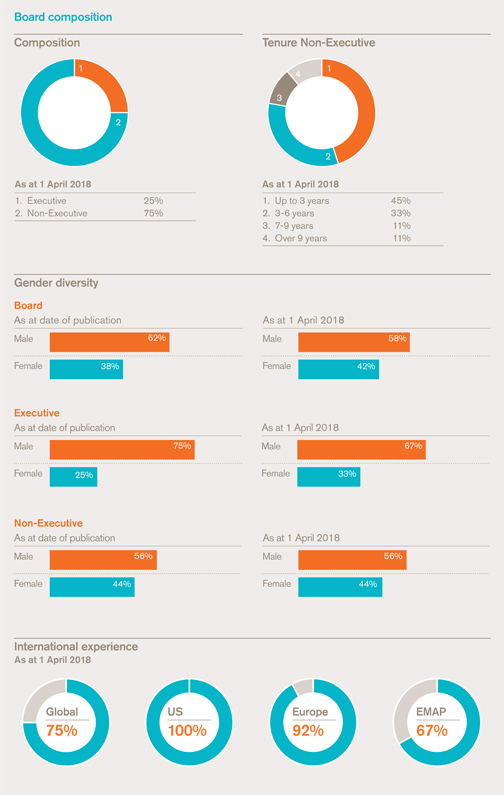
| | 
Philip Hampton 64 Non-Executive Chairman 
Nationality British Appointed 1 January 2015. Deputy Chairman from 1 April 2015 andNon-Executive Chairman from 7 May 2015 Skills and experience Prior to joining GSK, Philip chaired major FTSE 100 companies, including The Royal Bank of Scotland Group plc and J Sainsbury plc. He has also served as Group Finance Director at Lloyds TSB Group, BT Group plc, BG Group plc, British Gas plc and British Steel plc. Philip was previously appointed an Executive Director of Lazards and aNon-Executive Director of RMC Group Plc and Belgacom SA. Until 2009, he was Chairman of UK Financial Investments Limited, which manages the UK Government’s shareholdings in banks. External appointments Philip is the Senior Independent Director of Anglo American Plc, Chairman of its Remuneration Committee and a member of its Audit Committee. Philip is also Chair of the Hampton-Alexander Review on FTSE Women Leaders, an independent review on improving gender balance in FTSE leadership. |
| | | | |
| GSK Annual Report 2017 | | Strategic report | | |
| | Governance and remuneration | | |
| | Financial statements | | |
| | Investor information | | |
| | | | |

Emma Walmsley48
Chief Executive Officer
Nationality
British
Appointed
1 January 2017. Chief Executive Officer from 1 April 2017
Skills and experience
Emma joined GSK in 2010 with responsibility for Consumer Healthcare, Europe and was subsequently appointed President of GlaxoSmithKline Consumer Healthcare in October 2011. She has been a member of GSK’s Corporate Executive Team since 2011 and was appointed CEO of GSK Consumer Healthcare, a joint venture between GSK and Novartis, from its creation in March 2015 until her appointment as GSK CEO Designate in September 2016. Emma joined the GSK Board on 1 January 2017 and succeeded Sir Andrew Witty as GSK CEO on 1 April 2017.
Prior to joining GSK, Emma worked with L’Oreal for 17 years where she held a variety of marketing and general management roles in Paris, London and New York. From 2007, she was based in Shanghai as General Manager, Consumer Products for L’Oreal China. Emma was aNon-Executive Director of Diageo plc from 1 January to 21 September 2016. She holds an MA in Classics and Modern Languages from Oxford University.
External appointments
None

Simon Dingemans54
Chief Financial Officer
Nationality
British
Appointed
4 January 2011. Chief Financial Officer from 1 April 2011
Skills and experience
Prior to joining GSK, Simon had over 25 years of experience in investment banking at SG Warburg and Goldman Sachs. Simon advised GSK for over a decade before his appointment and was closely involved in a number of GSK’s key strategic projects. Simon was previously Chairman of the 100 Group of Finance Directors.
External appointments
None

Dr Hal Barron55
Chief Scientific Officer and
President, R&D
Nationality
American
Appointed
1 January 2018
Skills and experience
Hal was President R&D at Calico LLC (California Life Company), an Alphabet-funded company that uses advanced technologies to increase understanding of lifespan biology. Prior to joining Calico, Hal was Executive Vice President, Head of Global Product Development, and Chief Medical Officer of Roche, responsible for all the products in the combined portfolio of Roche and Genentech. At Genentech, he was Senior Vice President of Development and Chief Medical Officer.
Hal was aNon-Executive Director and Chair of The Science & Technology Committee at Juno Therapeutics, Inc
External appointments
Hal is Associate Adjunct Professor, Epidemiology & Biostatistics, University of California, San Francisco.

Dr Patrick Vallance58
Outgoing President, R&D
Nationality
British
Appointed
1 January 2017
Skills and experience
Patrick joined GSK in 2006 as Head of Drug Discovery and was subsequently appointed Senior Vice President, Medicines Discovery and Development. He has been a member of GSK’s Corporate Executive Team since 2010 and was appointed President, R&D in January 2012. Patrick joined the GSK Board on 1 January 2017.
Prior to joining GSK, Patrick was a clinical academic and, as Professor of Medicine, led the Division of Medicine at University College London. He has over 20 years’ experience of research clinical medicine, general internal medicine, cardiovascular medicine and clinical pharmacology. He was elected to the Academy of Medical Sciences in 1999. Patrick was previously aNon-Executive Director of UK Biobank Limited and Genome Research Limited.
External appointments
Patrick stepped down as President, R&D at the end of 2017 and will step down as an Executive Director with effect from 31 March 2018 to become the UK Government’s Chief Scientific Adviser and Head of the Government’s Office for Science.
| | | | | | | | |
Key |

| | | | Committee Chair | | 
| | Nominations |
| | | | | | | 
| | Audit & Risk |
| | | | | | | 
| | Remuneration |
| | | | | | | 
| | Science |
| | | | | | | 
| | Corporate Responsibility |
| | |
| 84 | | |
GSK Annual Report 2017 | | |
| | |
| | |
Our Boardcontinued

Manvinder Singh (Vindi)
Banga63
Senior Independent
Non-Executive Director

Nationality
Indian
Appointed
1 September 2015 and as Senior IndependentNon-Executive Director from 5 May 2016
Skills and experience
Prior to joining GSK, Vindi spent 33 years at Unilever plc, where his last role (amongst several senior positions) was President of the Global Foods, Home and Personal Care businesses, and he was a member of the Unilever Executive Board. Vindi sat on the Prime Minister of India’s Council of Trade & Industry from 2004 to 2014, and was on the Board of Governors of the Indian Institute of Management (IIM), Ahmedabad. Vindi is also the recipient of the Padma Bhushan, one of India’s highest civilian honours. Between 2015 and 2016, Vindi was aNon-Executive Director of Thomson Reuters Corp and a member of its HR committee. Vindi was also previously Chairman of the Supervisory Board of Mauser Group.
External appointments
Vindi is a Partner at private equity investment firm Clayton Dubilier & Rice. He is also Chairman of Kalle GmbH, Senior Independent Director of Marks & Spencer Group plc, a member of its Nomination Committee and Chairman of its Remuneration Committee. Vindi is aNon-Executive Director of the Confederation of British Industry (CBI), a Director of High Ridge Brands Co, a member of the Holdingham International Advisory Board and Chair of the Board of Trustees of Marie Curie. He is also on the Governing Board of the Indian School of Business (ISB), Hyderabad, and is a member of the Indo UK CEO Forum.

Professor Sir Roy
Anderson70
IndependentNon-Executive
Director & Scientific and
Medical Expert

Nationality
British
Appointed
1 October 2007
Skills and experience
Professor Sir Roy is a world-renowned medical scientist with advanced knowledge of infectious disease epidemiology, and is currently Professor of Infectious Disease in the Faculty of Medicine, Imperial College, London. He is a Fellow of the Royal Society, the Academy of Medical Sciences and the Royal Statistical Society. He is an Honorary Fellow of the Institute of Actuaries and a Foreign Associate Member of the National Academy of Medicine at the US National Academy of Sciences and the French Academy of Sciences. Professor Sir Roy brings scientific expertise to the Board’s deliberations.
External appointments
Professor Sir Roy is a member of the Holdingham International Advisory Board and a member of the Science Advisory Board of the Natural History Museum, London. He is also a member of the Vaccine International Advisory Board (VACCIAB) of AJ Pharma Holding Sdn. Bhd in Malaysia, the International Alzheimer’s Consortium at Harvard University, Boston, Chairman of the Scientific Advisory Board of the Netherlands Centre for One Health (NCOH) and Chairman of Oriole Global Health Ltd.

Dr Vivienne Cox58
IndependentNon-Executive
Director

Nationality
British
Appointed
1 July 2016
Skills and experience
Vivienne has wide experience of business gained in the energy, natural resources and publishing sectors. She also has a deep understanding of regulatory and government relationships. She worked for BP plc for 28 years, in Britain and continental Europe, in posts including Executive Vice President and Chief Executive of BP’s gas, power and renewable business and its alternative energy unit. Vivienne was previously aNon-Executive Director of BG Group plc and Rio Tinto plc and Lead Independent Director at the UK Government’s Department for International Development. Vivienne was appointed Commander of the Order of the British Empire in the 2016 New Year Honours for services to the UK Economy and Sustainability.
External appointments
Vivienne is Senior Independent Director of Pearson plc, aNon-Executive Director of Stena AB and Chairman of the Supervisory Board of Vallourec, a supplier to the energy industry.

Lynn Elsenhans61
IndependentNon-Executive
Director

Nationality
American
Appointed
1 July 2012
Skills and experience
Lynn has a wealth of experience of running a global business and significant knowledge of the global markets in which GSK operates. She served as Chair, President and Chief Executive Officer of Sunoco Inc from 2009 to 2012. Prior to joining Sunoco in 2008 as President and Chief Executive Officer, Lynn worked for Royal Dutch Shell, which she joined in 1980, and where she held a number of senior roles, including Executive Vice President, Global Manufacturing from 2005 to 2008. Lynn was previously aNon-Executive Director of Flowserve Corporation and The First Tee of Greater Houston.
External appointments
Lynn is aNon-Executive Director of Baker Hughes, a GE company, and Chair of its Audit Committee, and a Director of the Texas Medical Center. She is also a Trustee of the United Way of Greater Houston.
| | | | |
| 85 | | |
| | | | | |
| GSK Annual Report 2017 | | Strategic report | | |
| | Governance and remuneration | | |
| | Financial statements | | |
| | Investor information | | |
| | | | | | | | |

Dr Laurie Glimcher66 IndependentNon-Executive Director & Scientific and Medical Expert | | 
Dr Jesse Goodman66 IndependentNon-Executive Director & Scientific and Medical Expert | | 
Judy Lewent69 IndependentNon-Executive Director | | 
Urs Rohner58 IndependentNon-Executive Director |

| | 
| | 
| | 
|
Nationality | | Nationality | | Nationality | | Nationality |
American | | American | | American | | Swiss |
Appointed | | Appointed | | Appointed | | Appointed |
1 September 2017 | | 1 January 2016 | | 1 April 2011 | | 1 January 2015 |
Skills and experience Laurie is currently Professor of Medicine at Harvard Medical School and is CEO, President and an Attending Physician at the Dana-Farber Cancer Institute. In addition to a number of senior leadership positions held at both Harvard Medical School and Harvard School of Public Health, Laurie has also served as Stephen and Suzanne Weiss Dean and Professor of Medicine at Weill Cornell Medical College and as an Attending Physician at the New York Presbyterian Hospital/Weill Cornell Medical Center. Laurie stepped down from the Board of Bristol-Myers Squibb Co (BMS) in 2017 after serving for 20 years on its Board. Laurie brings scientific and public health expertise to the Board’s deliberations. External appointments Laurie is a member of the US National Academy of Sciences and the National Academy of Medicine. She is a member of the Scientific Steering Committee of the Parker Institute for Cancer Immunotherapy and aNon-Executive Director of the Waters Corporation, where she also serves on its Corporate Governance Committee. In addition, Laurie isco-founder and Chair of the Scientific Advisory Board of Quentis Therapeutics Inc and a Scientific Advisory Board member of Repare Therapeutics Inc and the American Asthma Foundation. | | Skills and experience Jesse previously served in senior leadership positions at the US Food and Drug Administration (FDA), including most recently as the FDA’s Chief Scientist and previously as Deputy Commissioner for Science and Public Health and as Director of the Center for Biologics Evaluation and Research (CBER). Jesse played a leadership role in developing the FDA’s Regulatory Science and Medical Countermeasures Initiatives and has worked collaboratively with industry, academia, government and global public health and regulatory partners to prepare for and respond to major public health threats, including emerging infectious diseases, disasters and terrorism. He led the FDA’s response to West Nile Virus and to the 2009 H1N1 influenza pandemic and served on the Senior Leadership Team for the 2010 White House Medical Countermeasure Review. Jesse brings scientific and public health expertise to the Board’s deliberations. External appointments Jesse, currently Professor of Medicine at Georgetown University, directs the Georgetown University Center on Medical Product Access, Safety and Stewardship (COMPASS) and is an active clinician who serves as Attending Physician in Infectious Diseases. He also serves as President and Member of the Board of the United States Pharmacopeia (USP) and as a member of the Regulatory Working Group of the Coalition for Epidemic Preparedness Innovations (CEPI). | | Skills and experience Judy has extensive knowledge of the global pharmaceutical industry and of corporate finance, having joined Merck & Co in 1980 and then served as its Chief Financial Officer from 1990 to 2007 when she retired. Judy previously served as aNon-Executive Director of Dell Inc, Quaker Oats Company and Motorola Inc. The Board has determined that Judy has recent and relevant financial experience, and agreed that she has the appropriate qualifications and background to be an audit committee financial expert. External appointments Judy is aNon-Executive Director of Thermo Fisher Scientific Inc and Motorola Solutions Inc. She is also a Trustee of the Rockefeller Family Trust, a life member of the Massachusetts Institute of Technology Corporation, a member of the American Academy of Arts and Sciences and a member of the Business Advisory Board of twoXAR. | | Skills and experience Urs has a broad range of business and legal experience having served as Chairman on a number of Boards, most recently for Credit Suisse, a world-leading financial services company. Prior to joining Credit Suisse in 2004, Urs served as Chairman of the Executive Board and CEO of ProSieben and ProSiebenSat.1 Media AG. This followed a number of years in private practice at major law firms in Switzerland and the US, having been admitted to the bars of the canton of Zurich in Switzerland in 1986 and the state of New York in the US in 1990. External appointments Urs is currently Chairman of the Board of Credit Suisse Group AG and of its Chairman’s and Governance Committee. He is also Chairman and member of the Board of Trustees of Credit Suisse Research Institute and Credit Suisse Foundation. Urs was appointed Vice-Chairman of the Governing Board of the Swiss Bankers Association in 2015. |
| | | | | Key |
| | | | | Committee Chair | | Nominations Audit & Risk Remuneration Science Corporate Responsibility |
| | |
| 86 | | |
GSK Annual Report 2017 | | |
| | |
| | |
Our Corporate Executive Team

| | | | | | |
| | | |
| | | | | | |
| | 1. | | Emma Walmsley | | |
| | | | Chief Executive Officer | | |
| | 2. | | Simon Dingemans | | |
| | | | Chief Financial Officer | | |
| | 3. | | Dr Hal Barron | | |
| | | | Chief Scientific Officer | | |
| | | | and President, R&D | | |
| | 4. | | Dr Patrick Vallance | | |
| | | | Outgoing President, R&D | | |
| | > | | For biographical details, | | |
| | | | see page 83. | | |
| | Abbas Hussain was a member of CET before leaving the company on 31 July 2017. | | |
| | | | | | |

Roger Connor
President, Global Manufacturing & Supply
Roger joined CET in 2012 and was appointed President, Global Manufacturing & Supply in 2013, after working for a year as President Designate. Prior to this, he was Vice President, Office of the CEO and Corporate Strategy. Roger joined GSK in 1998 from AstraZeneca.
He was appointed to the Board of GSK Consumer Healthcare, our joint venture with Novartis, in April 2017.
Roger holds a degree in Mechanical and Manufacturing Engineering from Queen’s University Belfast and a Masters in Manufacturing Leadership from Cambridge University.
He is a Chartered Accountant.

Nick Hirons
Senior Vice President, Global Ethics
and Compliance
Nick was appointed to CET in 2014 as Senior Vice President, Global Ethics and Compliance, responsible for compliance, risk management, corporate security and investigations.
Nick joined GSK in 1994 as an International Auditor. He was later Head of Audit & Assurance, where he combined five audit functions into an independent team with a common risk-based methodology. In 2013, Nick relocated to China to establish a governance model for our China business that created a consistent approach to compliance.
Nick is a fellow of the Chartered Institute of Management Accountants.

Luc Debruyne
President, Global Vaccines
Luc joined CET in 2016 as President, Global Vaccines, a role he has held since 2013. He joined GSK in 1991 as a commercial strategy director in R&D, before leading the European Commercial Centre of Excellence. In 2006, Luc became General Manager in the Netherlands and then in 2010 Senior Vice President and General Manager in Italy. In 2012, he was appointed Senior Vice President, Pharma Europe, prior to his current role. Luc is a member of the International Federation of Pharmaceutical Manufacturers & Associations Vaccines CEO Roundtable and the Management Committee of the Belgian Federation of Enterprises.
He holds a Master’s degree in Physical Education from University of Leuven.

Brian McNamara
CEO, GSK Consumer Healthcare
Brian joined CET in 2016, when he was appointed CEO, GSK Consumer Healthcare. He joined GSK in 2015 as Head of Europe and Americas for GSK Consumer Healthcare, following the creation of a joint venture between GSK and Novartis. Previously, he was head of Novartis’s OTC division. Brian began his career at Procter and Gamble.
He is Chairman of the World Self-Medication Industry Association.
He earned an undergraduate degree in Electrical Engineering from Union College in New York and an MBA in Finance from the University of Cincinnati.
| | | | |
| 87 | | |
| | | | | |
| GSK Annual Report 2017 | | Strategic report | | |
| | Governance and remuneration | | |
| | Financial statements | | |
| | Investor information | | |

Luke Miels
President, Global Pharmaceuticals
Luke joined GSK and CET in September 2017 as President, Global Pharmaceuticals responsible for our commercial portfolio of medicines and vaccines.
Previously, he worked for AstraZeneca as Executive Vice President of their European business and, prior to that, Executive Vice President of Global Product and Portfolio Strategy, Global Medical Affairs and Corporate Affairs. Before then, he held roles of increasing seniority at Roche and Sanofi-Aventis.
He holds a Bachelor of Science degree in Biology from Flinders University in Adelaide and an MBA from the Macquarie University, Sydney.

David Redfern
Chief Strategy Officer
David joined CET as Chief Strategy Officer in 2008 and is responsible for corporate development and strategic planning. Previously, he was Senior Vice President, Northern Europe with responsibility for GSK’s pharmaceutical businesses in that region and, prior to that, was Senior Vice President for Central and Eastern Europe. David joined GSK in 1994.
He was appointed Chairman of the Board of ViiV Healthcare Limited in 2011 and aNon-Executive Director of the Aspen Pharmacare Holdings Limited Board in 2015.
David has a Bachelor of Science degree from Bristol University in the UK and is a Chartered Accountant.

Karenann Terrell
Chief Digital & Technology Officer
Karenann joined GSK and CET in September 2017 as Chief Digital & Technology Officer, responsible for our technology, digital, data and analytics strategy.
Previously, she worked for Walmart as Chief Information Officer. Prior to this, she was at Baxter International, where she was Chief Information Officer, and before that Daimler Chrysler Corporation. Karenann began her career in General Motors.
Karenann is a member of the board of trustees for the New York Hall of Science and in 2017 she became aNon-Executive Director of Pluralsight LLC.
She earned graduate and post-graduate degrees in Electrical Engineering from Kettering and Purdue Universities respectively.

Claire Thomas
Senior Vice President, Human Resources
Claire was appointed to CET as Senior Vice President, Human Resources in 2008.
Claire joined the company in 1996 as Senior Manager, Human Resources, Sales and Marketing Group, UK Pharmaceuticals before becoming Director of Human Resources for UK
Pharmaceuticals in 1997. She was appointed Senior Vice President, Human Resources, Pharmaceuticals Europe in 2001, and Senior Vice President, Human Resources, Pharmaceuticals International in 2006.
Prior to GSK, she worked for Ford Motor Company, holding various positions in Human Resources.
Claire has a Bachelor of Science degree in Economics, Management and Industrial Relations from the University of Wales.

Phil Thomson
President, Global Affairs
Phil joined CET in 2011. He was appointed President, Global Affairs in April 2017, with specific responsibilities for the Group’s strategic approach to Reputation, Corporate Responsibility, Global Health, China and Britain’s withdrawal from the European Union. He is responsible for our engagement with investors, media, government, key global community partners and employees.
Previously, he was Senior Vice President, Communications and Government Affairs. He joined GSK as a commercial trainee in 1996.
Phil is Chairman of The Whitehall & Industry Group and a Board Member of the China-Britain Business Council.
He earned his degree in English, History and Russian Studies from Durham University.

Dan Troy
Senior Vice President & General Counsel
Dan joined GSK and CET as Senior Vice President & General Counsel in 2008.
He was previously a Partner at the Washington law firm Sidley Austin LLP, where he principally represented pharmaceutical companies and trade associations on matters related to the US Food and Drug Administration (FDA) and government regulations. Dan was formerly Chief Counsel for the FDA.
Dan holds a B.S. in Industrial and Labor Relations from Cornell University and a J.D. from Columbia University School of Law. He chairs the US Chamber of Commerce Litigation Center and is a member of the American Law Institute.
It was announced in January 2018 that Dan Troy will leave GSK at a later date in 2018 when his role relocates to the UK.
| | |
| 88 | | |
GSK Annual Report 2017 | | |
| | |
| | |
Corporate Governancecontinued
Leadership and effectiveness
Corporate governance framework
The Board has established a corporate governance framework with clearly defined responsibilities and accountabilities. The framework is designed to safeguard and enhance long-term shareholder value and to provide a platform to realise the Group’s strategy through GSK’s new Innovation, Performance and Trust priorities. Our internal control and risk management arrangements, described on pages 20 to 21 and 105 and 106, are an integral part of GSK’s governance framework.
For the Board to operate effectively and to give full consideration to key matters, Board Committees have been established as set out below.
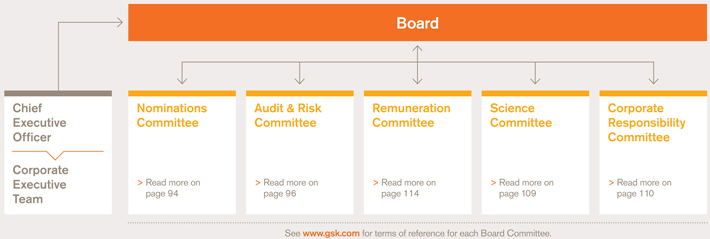
Scheduled Board and Committee attendance during 2017
| | | | | | | | | | | | | | | | | | | | | | | | | | | | | | | | | | | | |
| | | | | Board | | | | | Nominations | | | | | Audit & Risk | | | | | Remuneration | | | | | Science | | | | | Corporate
Responsibility | |
| Total number of scheduled meetings | | | | | 6 | | | | | | 6 | | | | | | 6 | | | | | | 5 | | | | | | 4 | | | | | | 4 | |
Members | | | | | Attended | | | | | | Attended | | | | | | Attended | | | | | | Attended | | | | | | Attended | | | | | | Attended | |
| Philip Hampton | | | | | 6 | | | | | | 6 | | | | | | | | | | | | | | | | | | | | | | | | | |
| Emma Walmsley | | | | | 6 | | | | | | | | | | | | | | | | | | | | | | | | | | | | | | | |
| Simon Dingemans | | | | | 6 | | | | | | | | | | | | | | | | | | | | | | | | | | | | | | | |
| Dr Patrick Vallance | | | | | 6 | | | | | | | | | | | | | | | | | | | | | | | | | | | | | | | |
| Professor Sir Roy Anderson | | | | | 6 | | | | | | 6 | | | | | | | | | | | | | | | | | | 4 | | | | | | 4 | |
| Vindi Banga | | | | | 6 | | | | | | 6 | | | | | | 6 | | | | | | 5 | | | | | | | | | | | | | |
| Dr Vivienne Cox | | | | | 5 | | | | | | | | | | | | | | | | | | 4 | | | | | | | | | | | | 4 | |
| Lynn Elsenhans | | | | | 6 | | | | | | 6 | | | | | | 6 | | | | | | | | | | | | | | | | | | 4 | |
| Dr Laurie Glimcher | | | | | | | | | | | | | | | | | | | | | | | | | | | | | | | | | | | | |
| Appointed on 1 September 2017 | | | | | 2 (2) | | | | | | | | | | | | 2 (2) | | | | | | | | | | | | 2 (2) | | | | | | | |
| Dr Jesse Goodman | | | | | 6 | | | | | | | | | | | | | | | | | | | | | | | | 4 | | | | | | 3 | |
| Judy Lewent | | | | | 6 | | | | | | 6 | | | | | | 6 | | | | | | 5 | | | | | | 4 | | | | | | | |
| Urs Rohner | | | | | 6 | | | | | | | | | | | | | | | | | | 5 | | | | | | | | | | | | | |
| Sir Andrew Witty | | | | | | | | | | | | | | | | | | | | | | | | | | | | | | | | | | | | |
| Retired on 31 March 2017 | | | | | 2 (2) | | | | | | | | | | | | | | | | | | | | | | | | | | | | | | | |
| Dr Moncef Slaoui | | | | | | | | | | | | | | | | | | | | | | | | | | | | | | | | | | | | |
| Retired on 31 March 2017 | | | | | 2 (2) | | | | | | | | | | | | | | | | | | | | | | | | | | | | | | | |
| Total number ofad-hoc meetings | | | | | 10 | | | | | | 1 | | | | | | 4 | | | | | | 7 | | | | | | 0 | | | | | | 0 | |
For Directors who served for part of the year, the numbers in brackets denote the number of meetings the Directors were eligible to attend.
| | |
| > | | See the Committee Reports for other attendees at Committee meetings, such as the Chairman, CEO and other Executive Directors, and the work of the Committees during the year. These reports are included later in the Corporate Governance Report. |
| | | | |
| 89 | | |
| | | | | |
| GSK Annual Report 2017 | | Strategic report | | |
| | Governance and remuneration | | |
| | Financial statements | | |
| | Investor information | | |
2017 Board programme
The Board is responsible for the long-term success of the company and has the authority, and is accountable to shareholders, for ensuring that the Group is appropriately managed and achieves the strategic objectives it sets. In the performance of these duties, it has regard to the interests of other key stakeholders and is cognisant of the potential impact of the decisions it makes. The Board discharges those responsibilities through an annual programme of meetings and during the year it focused on a number of specific areas outlined in the table, in line with its new long-term priorities of Innovation, Performance and Trust.
In addition, during the year the CEO met withNon-Executive Directors to discuss various matters, including the evolution of her thinking on the company’s strategy, succession planning and the ongoing SFO investigation.
| | | | | | | | |
Areas of focus | | | | | | | Long-term priorities link | |
Strategy | | The Board’s oversight of the execution of our strategy included: | |
| | | |
| | – | | Receiving and discussing reports from our principal three businesses, Pharma, Vaccines and Consumer | | | 
| |
| | | |
| | – | | Briefings on products. In particular, the Board was keen to oversee launch plans for theShingrix vaccine,Trelegy Ellipta andNucala products. It also reviewed the background to the withdrawal ofTanzeum | | | | |
| | | |
| | – | | A joint Board and Corporate Executive Committee strategy day was held to discuss the new Innovation, Performance and Trust priorities against external landscape changes, business performance, competitors and governance arrangements | | | | |
| | | |
| | – | | The evolution of our approach and changes to medical engagement with key external experts | | | | |
| | | |
| | – | | Conducting a deep dive on the Group’s business strategy in China | | |  | |
| | | |
| | | – | | Receiving and discussing reports on our pensions, insurance, tax and treasury strategies. | | |  | |
Performance | | The Board’s focus on performance included: | | | | |
| | | |
| | – | | Setting the new CEO’s objectives | | | | |
| | | |
| | – | | Setting, reviewing and agreeing the annual budget and forward looking three year plan | | | | |
| | | |
| | – | | Receiving reports from the CEO on our principal three businesses | | | | |
| | | |
| | – | | Scrutinising the Group’s financial performance | | | | |
| | | |
| | – | | Reviewing Brexit impacts and planning arrangements | | | | |
| | | |
| | | – | | Reviewing progress of the pipeline. | | | | |
Governance | | The Board’s approach to discharging its corporate governance duties included: | | | | |
| | | |
| | – | | Receiving reports from Board Committees | | |  | |
| | | |
| | – | | Approving the 2016 Annual Report | | | | |
| | | |
| | – | | Reviewing AGM preparation and approving the 2017 Notice of AGM | | | | |
| | | |
| | – | | Considering observations and agreeing actions from the internal evaluation of the Board’s performance | | | | |
| | | |
| | – | | Receiving reports on corporate governance and regulatory developments | | | | |
| | | |
| | – | | Undertaking training on GSK’s Code of Conduct | | | | |
| | | |
| | | – | | Approving the appointment of a new Chief Scientific Officer and President, R&D and a newNon-Executive Director and Scientific & Medical Expert. | | | | |
Cultural transformation | | The Head of HR briefed the Board on: | | | | |
| | | |
| | – | | Aligning GSK’s culture and values to support our strategy and long-term priorities. | | | | |
| | | | | | |
| Link to long-term priorities | | |
 Innovation Innovation
| |  Performance Performance
| | Trust | | |
| | |
| 90 | | |
GSK Annual Report 2017 | | |
| | |
| | |
Corporate Governance: Leadership and effectivenesscontinued
Key Board roles and responsibilities
| | |
Leadership Chairman Philip Hampton – Leads and manages the business of the Board – Provides direction and focus – Ensures clear structure for effective operation of the Board and its Committees – Sets Board agenda and ensures sufficient time is allocated to promote effective debate to support sound decision making – Ensures the Board receives precise, timely and clear information – Meets with eachNon-Executive Director on an annual basis to discuss individual contributions and performance, together with training and development needs – Shares peer feedback that is provided as part of the Board evaluation process – Meets with all theNon-Executive Directors independently of the Executive Directors – Leads discussions with shareholders to whom he is responsible for the Group’s performance. The Chairman’s role description is available onwww.gsk.com Chief Executive Officer Emma Walmsley – Is responsible for the management of the Group and its three businesses – Develops the Group’s strategic direction for consideration and approval by the Board – Implements the agreed strategy – Is supported by members of the Corporate Executive Team. The Chief Executive Officer’s role description is available onwww.gsk.com | | Independent oversight and rigorous challenge Non-Executive Directors – Provide a strong independent element to the Board – Constructively support and challenge management and scrutinise their performance in meeting agreed deliverables – Shape proposals on strategy and management – Each has a letter of appointment setting out the terms and conditions of their directorship – Devote such time as is necessary to the proper performance of their duties – Are expected to attend all meetings required. Independence statement The Board considers all of itsNon-Executive Directors who are identified on pages 84 to 85 to be independent. This includes Professor Sir Roy Anderson, with tenure of more than nine years. They each demonstrate an appropriate degree of independence in character and judgement and are free from any business or other relationship which could materially interfere with the exercise of their judgement. The independence and commitment of Professor Sir Roy Anderson and Judy Lewent, who have served on the Board for over six years, has been subjected to a rigorous review. Senior IndependentNon-Executive Director Vindi Banga – Acts as a sounding board for the Chairman and a trusted intermediary for other Directors – Together with theNon-Executive Directors, leads the annual review of the Chairman’s performance, taking into account views of the Executive Directors – Discusses the results of the Chairman’s effectiveness review with the Chairman – Leads the search and appointment process and recommendation to the Board of a new Chairman – Acts as an additional point of contact for shareholders –In doing so, maintains an understanding of the issues and concerns of major shareholders through briefings from the Investor Relations team and the Company Secretary. The Senior IndependentNon-Executive Director’s role description is available onwww.gsk.com |
| | |
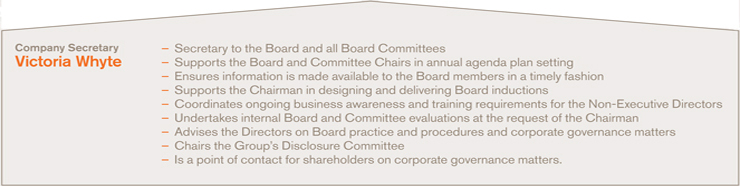 |
| | | | |
| 91 | | |
| | | | | |
| GSK Annual Report 2017 | | Strategic report | | |
| | Governance and remuneration | | |
| | Financial statements | | |
| | Investor information | | |
Board induction and development
The Company Secretary assists the Chairman in designing and facilitating individual induction programmes for new Directors. They are designed with the purpose of orientating and familiarising new Directors with our industry, organisation, governance and our strategy and Innovation, Performance and Trust priorities.
Each new Director receives a general induction. A personalised induction is then devised which is individually tailored to each new Director’s background, education, experience and role.
New Corporate Executive Team (CET) members meet with Board members as part of their induction, and to ensure the Board maintains its connections with the CET.
During 2017, Dr Laurie Glimcher, a newUS-based Science and Medical Expert, and in January 2018, Dr Hal Barron, a highly experienced R&D leader, joined the Board. Their customised induction programmes are summarised below.
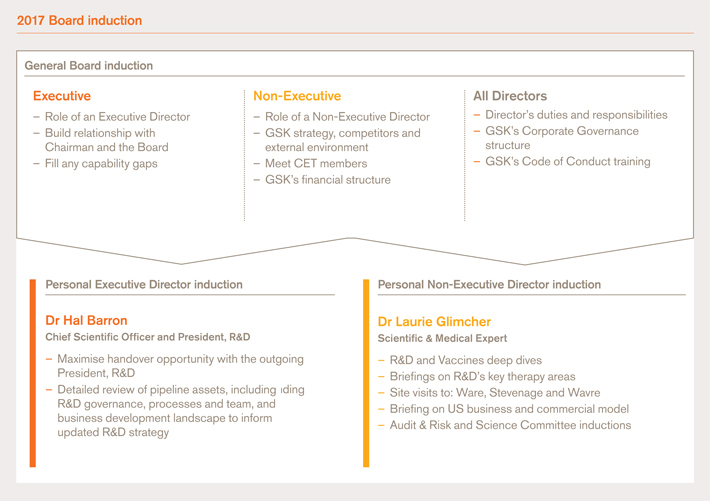
Board, business and key stakeholder awareness
To ensure that ourNon-Executive Directors develop and maintain a greater insight and understanding of the business and key stakeholders they:
| – | | are invited to attend internal management meetings, including meetings of the CET |
| – | | meet employees informally during visits to the Group’s operations and at receptions held with staff around Board meetings |
| – | | receive monthly investor relations and stakeholder reports to maintain awareness of investor and stakeholder views |
| – | | measure progress in implementing our Innovation, Performance and Trust business priorities and evolving our culture through anall-employee survey undertaken every six months and through reports on the regular conversations the CET has directly with the workforce through the Let’s Talk programme. |
Training
The Chairman meets with each Director annually on aone-to-one basis to discuss his or her ongoing training and development requirements. The Board is kept up to date on legal, regulatory and governance matters through regular papers and briefings from the Company Secretary and presentations by internal and external advisers.
During 2017, the Board members undertook training on GSK’s Code of Conduct.
| | |
| 92 | | |
GSK Annual Report 2017 | | |
| | |
| | |
|
| Corporate Governance: Leadership and effectivenesscontinued |
|
2017 External evaluation of the Board
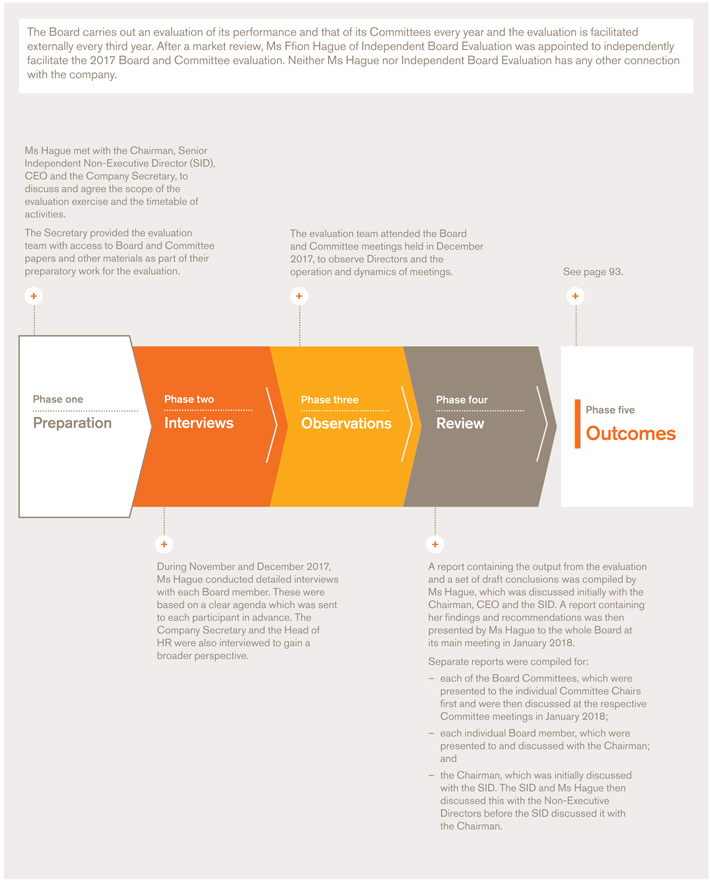
| | | | |
| 93 | | |
| | | | | |
| GSK Annual Report 2017 | | Strategic report | | |
| | Governance and remuneration | | |
| | Financial statements | | |
| | Investor information | | |
2017 External evaluation of the Boardcontinued
2017 Board review feedback and outcomes
Ms Hague’s report had noted the context in which her 2017 Board evaluation has been conducted, where there has recently been significant change to the composition of the Board, which is still settling down, including:
| – | | a new Chairman appointed in May 2015; |
| – | | the new CEO starting her role in April 2017; |
| – | | five other members joining the Board within the past three years, some of whom, though experienced in their field, did not have previous UK listed company experience; and |
| – | | welcoming Dr Barron to the Board in January 2018. |
Due to the timing of the review, on this occasion the review team only took input from Board members. In this context, Board members expressed a broad range of views and, as the Board settles down, some issues were identified as the focus for an action plan over the coming year. The Board is strongly supportive of the new CEO. It was pleased with the ongoing work to strengthen the focus on science with the new Chief Scientific Officer and President, R&D,Non-Executive Scientific and Medical Experts and the creation of the Science Committee which is in its formative stages.
In response to the report, Board members are highly engaged and committed to the best interests of the company and feel that the Board’s work is underpinned by the mechanisms it has established to support its operations. The Board takes governance very seriously and has chosen to work further on the following areas:
| – | | A review of R&D strategy following the appointment of the new Chief Scientific Officer and President, R&D. |
| – | | Enhancing the Board’s focus and decision making by agreeing its clear priorities to focus on each year. |
| – | | Succession planning at senior executive and Board level. |
| – | | Building Board relationships and culture in line with the CEO’s culture work across the Group. |
2017 Board performance
Progress against the conclusions of the 2016 Board evaluation review, internally facilitated by our Company Secretary, is set out below.
| | |
Areas of focus for 2017 | | Progress/Achievements |
– Create more opportunities for deeper strategic discussions, particularly on the evolution of the pharmaceuticals industry, the competitive landscape, therapy areas and GSK culture and performance. | | During the year, the Board considered a detailed review of the company’s strategy with management in the context of the operating environment, the company’s culture and industry dynamics in global healthcare. |
– Identify ways to further improve the Board’s decision making. | | All papers submitted to the Board have been streamlined andre-shaped to align with the new Innovation, Performance and Trust long-term business priorities to allow continuing oversight and more focused decision-making. |
– Further increase Board oversight of science and innovation in collaboration with the new Science Committee. | | Good progress was made in establishing the Science Committee, further details of which can be found in the Science Committee report on page 109. |
– Consider how data from the new IT systems can contribute to greater understanding and hence help evolve the business strategy. | | Reporting to the Board has been enhanced in this area within a new Innovation, Performance and Trust long-term business priorities framework and dashboards aiding the Board’s oversight of the company’s key performance indicators. |
| | |
| 94 | | |
GSK Annual Report 2017 | | |
| | |
| | |
Corporate Governance: Leadership and effectivenesscontinued
Nominations Committee report
| | | | | | | | |
| | | | 
| | Philip Hampton Nominations Commitee Chair | | |
| | | | | | |
| | | | Role | | |
| | | The Committee reviews and recommends to the Board: | |
| | | – The structure, size and composition of the Board and the appointment of Directors, members to the Board Committees and the CET | | |
| | | – Succession to the Board and the CET. | | |
| | | | |
| Membership | | | | |
Committee members | | | Committee member since | |
| Philip Hampton Chair from 27 January 2015 | | | 27 January 2015 | |
Professor Sir Roy Anderson | | | 1 October 2012 | |
Vindi Banga | | | 1 January 2016 | |
Lynn Elsenhans | | | 27 January 2015 | |
Judy Lewent | | | 8 May 2014 | |
Urs Rohner | | | 1 January 2017 | |
> Details of the Committee members’ skills and experience are given in their biographies under ‘Our Board’ on pages 84 to 85. See page 88 for Committee member attendance levels.
The Company Secretary is Secretary to the Committee and attends all meetings. Other attendees at Committee meetings may include:
| | | | | | | | |
Attendees | | Regular
attendee | | | Attends as
required | |
Chief Executive Officer | | |  | | | | | |
Head of Human Resources | | | | | | | | |
Appropriate external advisers | | | | | | | | |
Advisory services
During the year, Korn Ferry and Egon Zehnder provided recruitment consultancy services to the Committee, in addition to recruitment and HR services which they provide to the company. They are both signatories to the Voluntary Code of Conduct for Executive search firms on gender diversity and best practice.
Dear Shareholder
The Committee has worked over the last few years to refresh the Board and replace retiring directors. Following the CEO transition, Emma Walmsley has established Innovation, Performance and Trust as the long-term priorities for the business and the Committee’s focus has turned to supporting the CEO in establishing the team she needs to lead the company for the opportunities and challenges ahead.
Executive management succession
When Dr Patrick Vallance, President, R&D informed the Board of his intention to become the UK Government’s Chief Scientific Adviser and Head of the Government’s Office for Science, the Committee engaged Korn Ferry, who had previously conducted a proactive desktop talent mapping exercise for R&D executives. The Committee, with full participation of the otherNon-Executive Directors, compiled a profile for the next leader of R&D. The profile contained a brief of the requirements and the desired skill set that a potential successor to Patrick would need. The brief was drafted to emphasise the importance the CEO and the Committee placed on identifying and recruiting a world-renowned R&D leader with a strong track record of developing R&D organisational capabilities and significant new medicines. On reviewing the profile, the Committee decided that it needed to look externally for such talent.
Korn Ferry then initiated global searches against this agreed profile across the pharmaceuticals industry. Given the importance of this search, the Committee sought a second opinion from Egon Zehnder, who are also experts in the field of executive search. This yielded a pool of candidates which was reduced to a shortlist of several potential candidates. These shortlisted candidates met and were subsequently interviewed by the company’s designated Scientific and Medical Experts (SME), the Audit & Risk Committee Chair and the Chairman, and their feedback on each candidate was compiled. The Committee received the CEO’s analysis of the candidates and a separate analysis by the Head of HR.
The process culminated with the Committee meeting to agree a recommendation to the Board that proposed the appointment of Dr Hal Barron as Chief Scientific Officer and President, R&D. The recommendation received unanimous Board approval. On 8 November 2017, it was announced that Hal would join the Board as an Executive Director with effect from 1 January 2018. Patrick stepped down as President R&D at the end of 2017 and will resign as an Executive Director and CET member from 31 March 2018. The Board was pleased that Hal’s appointment demonstrated the company’s continued ability to attract world class talent to the organisation. As one of the world’s foremost R&D leaders, Hal possesses an exceptional track record of developing significant new medicines at Roche and Genentech, while recently at Calico building a research organisation that uses cutting-edge technologies in drug discovery and development.
In my Committee report last year, we reported that Mr Luke Miels had been recruited from AstraZeneca, where he was Executive Vice President of its European business, to succeed Abbas Hussain as President, Global Pharmaceuticals. Luke subsequently joined GSK and the CET on 1 September 2017. Luke and Hal had previously worked together at Roche, and their appointments complete the top team for our Global Pharmaceuticals business.
| | | | |
| GSK Annual Report 2017 | | Strategic report | | |
| | Governance and remuneration | | |
| | Financial statements | | |
| | Investor information | | |
Nominations Committee reportcontinued
Finally, in terms of senior executive appointments, Ms Karenann Terrell was appointed, with the support of Korn Ferry, to the CET in September 2017 as GSK’s first Chief Digital & Technology Officer. She has a company-wide remit to transform how new technologies are used to improve performance across the Group. Karenann’s previous role was Chief Information Officer for Walmart, where she led a multi-year effort to transform Walmart in the use of data, analytics and digital engagement with its customers.
These senior executive appointments underscore the immediate areas of focus for our new CEO since taking up her appointment, as she continues to build her senior leadership team to drive the Innovation, Performance and Trust agenda.
NewNon-Executive Director appointment
During the year, Korn Ferry also assisted the Committee with a search for an additional SMENon-Executive Director to further enhance the Board’s scientific capabilities, strengthen the Board’s scientific perspective and to join the new Science Committee. After interviewing suitable SME candidates, the Committee recommended Dr Laurie Glimcher to the Board as a potentialNon-Executive Director and SME. The Board subsequently approved Dr Glimcher’s appointment to the Board with effect from 1 September 2017. Laurie brings a wealth of expertise in scientific and medical innovation and public health which will be invaluable in assisting the Board’s focus on delivering its long-term Innovation, Performance and Trust priorities. She was also appointed a member of the Science and Audit & Risk Committees.
Board composition and diversity
We have sought to balance the composition of the Board and its Committees over time.
Longer serving Directors maintain an understanding of the Group and the sector, whilst newer appointees bring fresh external perspectives and insights.
OurNon-Executive Directors have experience of a wide range of industries and backgrounds, including the pharmaceuticals industry and R&D, vaccines, consumer products and healthcare, medical research and academia, insurance and financial services, as well as complex organisations with global reach. Importantly, the majority of our Board have a scientific or mathematical background which means they are more attuned to the fundamentals of the industry in which we operate.
GSK is committed to equal opportunities for all our employees at all levels of the organisation and the Board is committed to encouraging a diverse and inclusive culture led by the CET.
A key requirement of an effective board is that it comprises a range and balance of skills, experience, knowledge, gender and independence, with individuals that are prepared to challenge each other and work as a team. This needs to be backed by a diversity of personal attributes, including character, intellect, sound judgement, honesty and courage.
The Committee is responsible for developing measurable objectives to support the implementation of the Board’s diversity policy, which is to meet the measurable targets set out in:
| – | | the Parker Review Commission’s report ‘Beyond One by ‘21’ published in October 2017 to increase ethnic diversity appointments on the boards of FTSE 100 companies; and |
| – | | the Hampton-Alexander Review’s report, which I worked on with the late Dame Helen Alexander, published in 2016 to increase the number of women in senior leadership positions in all FTSE 350 companies. |
We are currently meeting the Parker Report’s recommendation of at least one board director of colour by 2021.
At this point, I wish to personally acknowledge how much I and everyone involved in the work of the Hampton-Alexander Review will miss Dame Helen, who sadly passed away in August last year. She was an outstanding leader who believed that women could and should be able to contribute far more to business than has ever been acknowledged. The Review team and I will continue the work in her memory.
The Committee was pleased at the progress made towards our female Board representation and combined Corporate Executive Team (CET) and Direct Reports targets of at least 33% by 2020. GSK ranked 8th in the FTSE 100. A summary of our standing in the Hampton-Alexander Review’s 2017 FTSE Women Leaders report is reproduced below:
| | | | |
| | | Female Representation as at 30 June 2017 |
2017 Report Female
Representation Metrics | | Board | | Combined Executive
Committee and Direct
Reports |
| 2020 FTSE 100 target | | 33.0% | | 33.0% |
| GSK | | 41.7% (ranked 8th
in FTSE 100) | | 25.7% |
| FTSE 100 average | | 27.7% | | 25.2% |
| FTSE 100 highest | | 44.4% | | 47% |
We currently have:
| – | | 38% women on our Board (2016 - 31%), which will rise to 41.7% on 1 April 2018 after Dr Patrick Vallance has stepped down from the Board and left the company; and |
| – | | 21% women on our CET (2016 - 14%). |
Going forward, closing the gap between the Board and CET gender representation and further increasing the pipeline of female direct reports to the CET to achieve our 2020 target is an area of focus. In support of this approach, GSK has various actions to enhance our development pipeline; including the Accelerating Difference programme, Women’s Leadership Initiative and the Accelerating Transitions coaching programme for those joining orre-joining the company after an extended time of absence.
The representation of women in management positions is illustrated on page 49 as part of the gender diversity of GSK’s global workforce and alongside initiatives to promote diversity and inclusion throughout the organisation.
Committee evaluation
The Committee’s annual evaluation exercise was externally facilitated by Ms Ffion Hague of Independent Board Evaluation and concluded that the Committee continued to operate effectively. It was agreed that the Committee’s effectiveness could be further improved by:
| – | | refining the approach to long-term succession planning around key additional skills and capability needs of the Board; and |
| – | | improving the dialogue with the full Board on evolving areas of focus for the Committee. |
Philip Hampton
Nominations Committee Chair
12 March 2018
| | |
| 96 | | |
GSK Annual Report 2017 | | |
| | |
| | |
Accountability
Audit & Risk Committee report
| | | | | | | | | | |
| | | | | | 
| | Judy Lewent Audit & Risk Committee Chair | | |
| | | | |
| | | | Role |
| | | | The Committee reviews and is responsible for: |
| | | | – financial and internal reporting processes – the integrity of the financial statements, including the Annual Report and quarterly results announcements – the system of internal controls – identification and management of risks and external and internal audit processes – initiating audit tenders, the selection and appointment of external auditors, setting their remuneration and exercising oversight of their work. |
| | |
Membership | | |
Committee members | | Committee member since |
| Judy Lewent Chair from 1 January 2013 | | 1 April 2011 |
| Vindi Banga | | 1 January 2016 |
| Lynn Elsenhans | | 1 January 2014 |
| Dr Laurie Glimcher | | 1 September 2017 |
> Details of the Committee members’ financial, accounting or scientific experience and expertise are given in their biographies under ‘Our Board’ on pages 84 to 85. See page 88 for Committee member attendance levels.
The Company Secretary is Secretary to the Committee and attends all meetings. The entire Board is invited to attend the Committee meetings and other attendees include:
| | | | |
Attendee | | Regular
attendee | | Attends as
required |
| General Counsel | | ✓ | | |
| Financial Controller | | ✓ | | |
| Head of Audit & Assurance | | ✓ | | |
| Head of Global Ethics and Compliance | | ✓ | | |
| Chief Medical Officer | | ✓ | | |
| Chief Product Quality Officer | | | | ✓ |
| External auditors | | ✓ | | |
In accordance with the Financial Reporting Council’s UK Corporate Governance Code, the Board has determined that Judy Lewent has recent and relevant financial experience. The Board has also agreed that she has the appropriate qualifications and background to be an audit committee financial expert as defined by the Sarbanes-Oxley Act of 2002, and has determined that she is independent within the meaning of the Securities Exchange Act of 1934, as amended.
The Committee has, as a whole, competence relevant to the sector in which the company operates.
Dear Shareholder
In the following pages of this report, we aim to share insights into the activities undertaken or overseen by the Audit & Risk Committee (the Committee) during the year. The Committee has worked largely to a recurring and structured programme of activities. I devise this programme with the Company Secretary and agree its content with management and the external auditors at the start of each year. It is then adapted as appropriate as the year progresses.
Overseeing a smooth audit transition process was an important focus for the Committee during the year. This exercise, together with details of the Committee’s continued scrutiny of further enhancements and simplifications to our internal controls, risk management and financial reporting systems and processes, are covered below.
External auditors
Last year, we advised shareholders that after the conclusion of a competitive audit contract tender, the Board appointed the Committee’s preferred choice of Deloitte LLP (Deloitte) as the company’s new auditors from GSK’s 2018 financial year onwards. The Committee has overseen the significant activity necessary to transition from PricewaterhouseCoopers LLP (PwC) to Deloitte. This initially required Deloitte to achieve independence in the first half of the year before they could observe PwC’s work as statutory auditors during the 2017year-end audit. The Committee has received regular reports on the audit transition and I met regularly with the lead audit partners from PwC and Deloitte to discuss progress.
I was pleased to hear more of the new perspectives that Deloitte will bring to the audit when they presented their audit scoping at the end of 2017. This included the significant opportunities that data analytics can bring. A full report on the audit transition arrangements is given on pages 103 to 104.
I would like to thank the PwC team for their professionalism in continuing to deliver a high-quality audit, particularly against the backdrop of the transition. Both audit firms have cooperated to make the transition a smooth one with minimal disruption to the business. I look forward to reporting to shareholders on Deloitte’s first audit in GSK’s 2018 Annual Report.
Internal framework for control and risk management developments
This is a core focus for the Committee. In 2017, the following developments in the business units and across the enterprise helped strengthen our culture of compliance and risk management.
| – | | GSK Values & Expectations: These are a high priority for the Committee. During the year, it oversaw progress driven by Global Ethics & Compliance (GEC) to embed and measure the effectiveness of our values and further integrate these values into existing control processes. For example, the Third-Party Oversight framework was updated to require third parties to confirm adherence to our values and the third-party Code of Conduct. GSK’s values and Speak Up programme elements were also included into the General Manager (GM) certification process where the company’s GMs confirm their adherence to our Internal Control Framework. During 2017, GEC has continued to deploy the Leader Led discussion programme on GSK’s values and ‘right first time’ culture and ethical decision making workshops. |
| | | | |
| GSK Annual Report 2017 | | Strategic report | | |
| | Governance and remuneration | | |
| | Financial statements | | |
| | Investor information | | |
Audit & Risk Committee reportcontinued
| – | | Values Maturity Assessments & Values Assessment Reviews: The Committee learned how the outcomes from Values Maturity Assessments (VMAs) performed in 2016 had been used to target assessments in specific areas during 2017. The implementation of business unit specific action plans to address the areas for improvement identified by the VMAs was overseen by our local Risk Management & Compliance Boards. The VMA insights highlighted that overall Patient Focus and Integrity are the values with which our employees feel most affinity and are well embedded. During 2017, a positive shift in perception relating to our values of Transparency and Respect for People was noted as a result of the Audit & Assurance team’s Values Assessment Reviews that assess how well our values are embedded in the organisation. |
| – | | The revised GSK Employee Survey: In 2017, more than 84,000 of our people took part in GSK’s employee engagement survey, whose purpose and outcomes are discussed on page 48 of our Strategic report. |
| – | | Written standards & controls: During 2017, work has continued to harmonise and simplify written standards across several parts of the enterprise; recognising that improved accessibility and clarity around written standards is an enabler to improved risk management and informed decision making. |
| – | | Training & communication: Our GEC function has continued to focus on personal development, including: |
| | – | | Ethics and Compliance Academy: In 2017, GEC ran aface-to-face Ethics and Compliance Academy and launched a Virtual Academy to enable more flexible participation. The first Virtual Academy was held at the end of 2017 and will be held each quarter. There are currently over 350 certified ethics and compliance professionals since the inception of the Academy in 2015. |
| | – | | Living our Values: In April 2017, Part 1 of an enterprise-wide ‘Living our Values’ training was issued to a population of over 100,000 employees and complementary workers. The training included scenarios which explored our values and their application to the company’s ways of working, including the awareness of our Enterprise Risks and Speak Up arrangements. Part 2 focused on several critical risks, including Privacy and Anti-bribery & Corruption (ABAC). Mandatory training on ABAC and the US Corporate Integrity Agreement (CIA) was also completed by targeted areas of our workforce, depending on the role they performed. |
Monitoring
Monitoring is a key element of our Internal Control Framework. It serves as a continuous source of insights that inform improvements in the control environment and there was significant focus by each of our businesses in this area during 2017.
Compliance activities
| – | | SEC settlement: The Committee continues to review and consider updates to the US Securities and Exchange Commission (SEC), as agreed under the settlement made with the SEC in 2016. Our compliance with the terms of the settlement is on track with a final report due for submission to the SEC in the summer of 2018. |
| – | | CIA: The Committee also has oversight of the company’s responsibilities under the CIA entered into with the Office of Inspector General (OIG) of the US Department of Health and Human Services in 2012. Last year, the Group reported to the OIG on commercial practices within Global Pharmaceuticals. Affirmative obligations under the CIA expired in 2017, but the Group is waiting for official closure once the OIG completes the review of the Group’s final CIA Annual Report. The CIA required the Group to ensure sufficient internal controls to mitigate risks associated with commercial practices involving US pharmaceutical products and interactions with US healthcare professionals. The Group received positive feedback from the OIG, and, consequently, received a release 6 months earlier than the original 5 1⁄2 year term of the CIA, although commitments with certain US states regarding salesforce compensation extend into 2019. During 2017, the Committee continued to receive quarterly CIA assurance updates from the Head of GEC. |
| – | | Responding to issues: During 2017, an integrated investigations process was developed by GEC, HR and Legal to clarify accountabilities, further safeguard reporters using our Speak Up channels and deliver improved outcomes and decisions. These improvements have helped to accelerate the steps taken to substantiate an allegation and investigate it to a resolution, as well as delivering enhancements in engagement with key stakeholders and individuals who raise issues. Further details on reporting and investigating concerns in GSK are set out on page 50 of our Strategic report. |
| – | | Enterprise risk framework and strategies: During the year, the Committee considered GSK’s Enterprise Risks and the strategies to address them. These reviews were undertaken through: |
| | – | | Annual unit risk and assurance update reports. |
| | – | | Enterprise Risk strategy papers for each of our most significant risks. |
| | – | | Annual risk reviews contained in the Risk Management and Internal Control Report, which is presented by the Head of GEC. |
| | |
| 98 | | |
GSK Annual Report 2017 | | |
| | |
| | |
Corporate Governance: Accountabilitycontinued
Audit & Risk Committee reportContinued
As part of its review, the Committee assesses whether the key Enterprise Risks affecting the unit are being managed and mitigated in a proportionate way. The Committee examines whether it is satisfied with the control environment, its operation and effectiveness and whether refinements that management propose to ensure the environment remains fit for purpose are appropriate. It also assesses the commitment of the unit’s leadership to maintaining a strong controls culture.
The Committee noted that progress has been made in delivering the enablers to drive an even stronger top down risk management approach for GSK’s Enterprise Risks to provide greater consistency in risk management and drive efficiencies. This included a common list of Enterprise Risks andsub-risks to be assessed by each unit and a single list of business activities against which these risks can be mapped.
| – | | Third Party Oversight programme: The Committee was pleased to note that by the end of December 2017, over 96,000 assessments across 217 countries had been completed since the Third-Party Oversight (TPO) programme had commenced in 2015, with a further 9,500 assessments currently in progress. The assessments have resulted in the issue of approximately 5,500 Corrective and Preventative Actions designed to improve our third-party engagements. The TPO framework continues to evolve so that it is more efficient and easier to use and is currently being embedded in GSK’s ‘Making It Easier’ Buying Goods & Services programme. Further details on working with third parties was set out on page 50 of our Strategic report. |
| – | | Enhanced Privacy compliance capability: The Privacy Centre of Excellence (CoE) is delivering a change programme to improve and sustainably manage GSK’s data privacy compliance, whilst also complying with the EU General Data Protection Regulations (GDPR) that come into effect in May 2018. During 2017, the CoE made good progress defining a privacy risk framework to enable GSK to design proportionate controls, prioritise deployment, and make effective decisions about risk. Whilst the programme’s purpose is to increase privacy maturity globally, the CoE’s remediation efforts are focused initially on our European operations to mitigate the highest near-term risk created by the GDPR. However, further remediation is expected to be delivered by December 2018, at which point GSK’s enhanced privacy operating model will have been deployed globally. |
Financial Reporting – framework enhancements
The Committee continued to improve the clarity of GSK’s external financial reporting by reviewing the company’s financial reporting framework. The Committee made recommendations to the Board which it approved for adoption in early 2017. These changes further improved the way that GSK reports and explains its adjusted results and adjusting items in line with European Securities and Markets Authority and SEC requirements. In addition, two changes were made to the company’s use of Adjusted Performance Measures to further improve the clarity of our financial reporting. Finally, our free cash flow calculation was adjusted to include all contingent consideration payments.
Global reporting system platforms
The Committee was pleased to oversee the continued progress being made in moving towards more standardised, global systems which support ourend-to-end processes. The last significant deployments under this multi-year programme will have been completed by early 2019, with the focus moving to capturing the benefits that these new standardised systems and processes can generate for GSK.
My role
Finally, my role as Chair of the Committee continues to be busy and varied. During the year, I had significant interactions with key senior executives and our auditors, and attended a range of management meetings.
The Committee and I have worked closely with Emma Walmsley, GSK’s new CEO, as she set her new business priorities of Innovation, Performance and Trust. The Committee has monitored, and will continue to monitor, the evolution of GSK’s culture as the company sharpens its business performance to ensure performance is delivered appropriately.
Vindi Banga and I are also members of the Remuneration Committee, which allows us to provide input on the Committee’s review of the Group’s performance and oversight on any risk factors relevant to remuneration matters.
Committee evaluation
The Committee’s annual evaluation exercise was externally facilitated by Ms Ffion Hague of Independent Board Evaluation. Her report was largely positive and confirmed that the Committee covered the ground in detail. After consideration of her report, the Committee concluded that it continued to operate effectively but agreed to implement further performance improvements by reviewing:
| – | | the format of papers in terms of their accessibility and considering how to increase the focus of the Committee’s time in meetings, allowing more opportunity for review and discussion; and |
| – | | with the Nominations Committee, the succession planning for Board and Committee members with financial experience. |
Judy Lewent
Audit & Risk Committee Chair
12 March 2018
| | | | |
| GSK Annual Report 2017 | | Strategic report | | |
| | Governance and remuneration | | |
| | Financial statements | | |
| | Investor information | | |
What the Committee did during 2017
| | | | |
Areas of Committee focus | | Items discussed | | Frequency |
Financial reporting | | – Reviewed integrity of draft financial statements, appropriateness of accounting policies and going concern assumptions | | 
|
| | – Considered approval process for confirming and recommending to the Board that the 2016 Annual Report is fair, balanced and understandable | | |
| | – Reviewed and recommended to the Board approval of the 2016 Annual Report and Form20-F | | |
| | – Reviewed and approved Directors’ expenses | | |
| | – Reviewed and recommended approval of quarterly and preliminary results announcements and dividends | |  |
| | – Reviewed significant issues in relation to the quarterly and preliminary results | | |
| | – Considered evolving market practice on the Viability Statement requirements | | |
| | – Reviewed and recommended inclusion of the Viability Statement for the 2016 Annual Report | | |
| | – Reviewed accounting developments and their impacts and key accounting issues. | |  |
External auditors | | – Received external auditors’ transition updates from management | | 
|
| | – Reviewed and approvedaudit/non-audit expenditure incurred during 2016 | | |
| | – Considered the auditors’ report on the 2016 annual results | | |
| | – Performed evidence-based assessment of external auditors and the effectiveness of 2016 external audit | | |
| | – Considered qualifications, expertise and independence of the external auditors | | |
| | – Recommended to the Board there-appointment of the external auditors and for the Committee to agree auditors’ remuneration | | |
| | – Approved the 2017 audit plan and audit fee proposal and set performance expectations for auditors | | |
| | – Considered initial results of 2017 external audit. | | |
Global internal control & compliance | | – Reviewed assurance reports from Global Pharmaceuticals, Vaccines, Consumer Healthcare, R&D, GMS and ViiV Healthcare | |
|
| | – Reviewed GSK’s internal control framework | | |
| | – Confirmed compliance with Sarbanes-Oxley Act | | |
| | – Reviewed Audit & Assurance work during 2016 and approved the planned work for 2017 | | |
| | – Undertook Corporate Integrity Agreement (CIA) training | | |
| | – Received and reviewed CIA compliance and assurance reports | | |
| | – Reviewed reports on the Operational Excellence programme | | |
| | – Reviewed the implementation of new systems for Group Support Functions | | |
| | – Received litigation reports and updates | | |
| | – Received reports on ongoing investigations and on ABAC issues. | | |
Risk | | – Reviewed risk management framework compliance | |
|
| | – Reviewed the risk elements of Group treasury, pensions, risk and insurance and tax policies | | |
| | – Received status reports on the following Enterprise Risks: ABAC, EHSS, Information Protection, Patient Safety, Privacy, Product Quality, Research Practices and Third Party Oversight | | |
| | – Received terrorism and cyber security risk assessment update | | |
| | – Received updates on the implications of Brexit | | |
| | – Received Risk Oversight and Compliance Council meeting updates | | |
| | – Considered emerging risks. | | |
Governance and other matters | | – Confirmed compliance with UK Corporate Governance Code | |
|
| | – Reviewed the Committee’s terms of reference and confirmed that they had been adhered to during 2017 | | |
| | – Received corporate governance updates | | |
| | – Reviewed the Committee’s performance and effectiveness | | |
| | – Reviewed and approved the Group’s approach to the Modern Slavery Act 2016 | | |
| | – Met privately and separately with the Heads of Global Ethics & Compliance and Audit & Assurance | | |
| | – Met privately with the external auditors at the end of each meeting as required | | |
| | – Approved the publication of the Group’s Tax strategy. | | |
| | | | | | | | | | |
Committee Activity Key | | Annually | | Quarterly | | Periodically | | Standing | | |
| | |
| 100 | | |
GSK Annual Report 2017 | | |
| | |
| | |
Corporate Governance: Accountabilitycontinued
Significant issues relating to the financial statements
In considering the quarterly financial results announcements and the financial results contained in the 2017 Annual Report, the Committee reviewed the significant issues and judgements made by management in determining those results. The Committee reviewed papers prepared by management setting out the key areas of risk, the actions undertaken to quantify the effects of the relevant issues and the judgements made by management on the appropriate accounting required to address those issues in the financial statements.
The significant issues considered in relation to the financial statements for the year ended 31 December 2017 are set out in the following table, together with a summary of the financial outcomes where appropriate. In addition, the Committee and the external auditors have discussed the significant issues addressed by the Committee during the year and the areas of particular audit focus, as described in the Independent Auditors’ Report on pages 149 to 157.
| | |
Significant issues considered by the Committee in relation to the financial statements | | How the issue was addressed by the Committee |
| |
| Going concern basis for the preparation of the financial statements | | The Committee considered the outcome of management’s half-yearly reviews of current and forecast net debt positions and the various financing facilities and options available to the Group. Following a review of the risk and potential impact of unforeseen events, the Committee confirmed that the application of the going concern basis for the preparation of the financial statements continued to be appropriate. |
| |
| Revenue recognition, including returns and rebates (RAR) accruals | | The Committee reviewed management’s approach to the timing of recognition of revenue and accruals for customer returns and rebates. The US Pharmaceuticals and Vaccines accrual for returns and rebates was £2.8 billion at 31 December 2017 and the Committee reviewed the basis on which the accrual had been made and concurred with management’s judgements on the amounts involved. A fuller description of the process operated in the US Pharmaceuticals and Vaccines business in determining the level of accrual necessary is set out in ‘Critical accounting policies’ on page 76. |
| |
| Provisions for legal matters, including investigations into the Group’s commercial practices | | The Committee received detailed reports on actual and potential litigation from both internal and external legal counsel, together with a number of detailed updates on investigations into the Group’s commercial practices. Management outlined the levels of provision and corresponding disclosure considered necessary in respect of potential adverse litigation outcomes and also those areas where it was not yet possible to determine if a provision was necessary, or its amount. At 31 December 2017, the provision for legal matters was £0.2 billion, as set out in Note 29 to the financial statements, ‘Other provisions’. |
| |
| Provisions for uncertain tax positions | | The Committee considered current tax disputes and areas of potential risk and concurred with management’s judgement on the levels of tax contingencies required. At 31 December 2017, a tax payable liability of £1.4 billion, including provisions for uncertain tax positions, was recognised on the Group’s balance sheet. |
| |
| Impairments of intangible assets | | The Committee reviewed management’s process for reviewing and testing goodwill and other intangible assets for potential impairment. The Committee accepted management’s judgements on the intangible assets that required writing down and the resulting impairment charge of £680 million in 2017. See Note 19 to the financial statements, ‘Other intangible assets’ for more details. |
| |
| Valuation of contingent consideration in relation to ViiV Healthcare | | The Committee considered management’s judgement that following the further improved sales performance ofTivicay andTriumeq it was necessary to increase the liability to pay contingent consideration for the acquisition of the former Shionogi-ViiV Healthcare joint venture. At 31 December 2017, the Group’s balance sheet included a contingent consideration liability of £5.5 billion in relation to ViiV Healthcare. See Note 39 to the financial statements, ‘Contingent consideration liabilities’ for more details. |
| |
| Consumer Healthcare put option | | The Committee considered management’s judgement on the valuation of the liability of £8.6 billion recognised in respect of Novartis’ put option over its shareholding in the Consumer Healthcare Joint Venture. This included a review of the impact of unwinding the discounting of the liability and the decrease in the liability caused by the significant strengthening of Sterling in the latter part of the year. |
| |
| ViiV Healthcare put option | | The Committee reviewed and agreed the accounting for the Pfizer put option and concurred with management’s judgement on the valuation of the put option of £1.3 billion at 31 December 2017. |
| | | | |
| 101 | | |
| | | | | |
| GSK Annual Report 2017 | | Strategic report | | |
| | Governance and remuneration | | |
| | Financial statements | | |
| | Investor information | | |
Auditors’ appointment
|
|
External auditors PricewaterhouseCoopers LLP (PwC) has been the auditor of the company and the Group since the inception of each in 2000. Its performance has been reviewed annually and audit partner rotation requirements have been observed. GSK conducted an external audit tender in 2016 with a view to replacing PwC from our 2018 financial year onwards. As disclosed in last year’s report, PwC was not invited to participate in this audit tender process to comply with audit firm rotation requirements. The audit tender process was completed in December 2016 when the Board announced that it had appointed Deloitte LLP (Deloitte) as GSK’s new external auditors with effect from 1 January 2018. Effectiveness and quality of external audit process The Committee is committed to ensuring on an ongoing basis that GSK receives a high quality and effective audit from its external auditors. The effectiveness of PwC’s performance and the quality of the external audit process during 2017 was formally evaluated by the Committee in early 2018 against criteria which it agreed, in conjunction with management, in early 2017. The Committee has undertaken a number of activities during the year to satisfy itself of PwC’s continuous external audit quality and effectiveness, particularly in a year of audit firm transition from PwC to Deloitte. These activities and their timelines are set out below: |

| | | | |
| Matters addressed: | | Matters addressed: | | Matters addressed: |
– effectiveness of PwC against expectations set in 2016 was reviewed – an appropriate level of challenge/scepticism exhibited by PwC in its work was considered – PwC’s independence, appropriate level of qualifications, expertise and resources was reviewed – a report on PwC’s audit of GSK’s 2015 Annual Report by the Financial Reporting Council’s Audit Quality Team was reviewed – once satisfied on these matters, there-appointment of PwC at the next AGM in May to perform the 2017 audit was recommended to the Board – performance expectations of PwC as auditors for 2017 audit were agreed. | | – shareholders approved resolutions to appoint PwC and to authorise the Committee to determine their remuneration – 2017 audit plan was reviewed and agreed – PwC’s quality control procedures were considered – 2017 statutory audit fee was agreed and set – management feedback on 2016 audit process through a survey was received covering: – robustness of audit process – quality of delivery, people and service. | | – effectiveness of PwC against expectations set in March 2017 were reviewed – an appropriate level of challenge/scepticism exhibited by PwC in their work was considered – PwC’s letter of resignation to be received – Deloitte’s independence, appropriate level of qualifications, expertise and resources was reviewed – appointment of Deloitte to fill the vacancy to be recommended to the Board to approve – 2018 audit plan was reviewed and agreed – performance expectations of Deloitte as auditors for 2018 audit were agreed – the appointment of Deloitte at the next AGM in May to perform the 2018 audit was recommended to the Board – budget fornon-audit services (below 50% of audit fee) for 2018 was agreed. |

| | |
| 102 | | |
GSK Annual Report 2017 | | |
| | |
| | |
Corporate Governance: Accountabilitycontinued
Auditors’ appointmentcontinued
The detailed criteria the Committee used for judging the effectiveness of PwC as the external auditors and its overriding responsibility to deliver a smooth-running, thorough and efficiently executed audit for 2017 are set out below:
Performance expectations for GSK’s external auditors
| | |
Specific auditor responsibilities | | – Discuss audit approach and areas of focus in advance and early engagement on understanding the implications of the new operating model |
| | – Ensure Sarbanes-Oxley Act scope and additional procedures are discussed and endorsed by management and communicated in a timely basis within GSK and PwC |
| | – Avoid surprises through timely reporting of issues at all levels within the company |
| | – Ensure clarity of roles and responsibilities between local PwC and GSK Finance Services |
| | – Respond to any issues raised by management on a timely basis |
| | – Meet agreed deadlines |
| | – Provide continuity and succession planning of key staff members of PwC |
| | – Provide sufficient time for management to consider draft auditors’ reports and respond to requests and queries |
| | | – Ensure consistent communication between local and central audit teams. |
Wider auditor responsibilities | | – Provide timelyup-to-date knowledge of technical and governance issues, including evolving market practice on the viability statement requirements, European Securities and Markets Authority and Securities and Exchange Commission (SEC) guidelines and new IFRS standards IFRS 15 and IFRS 16 |
| | – Serve as an industry resource, communicating best practice trends in reporting and integrated reporting |
| | – Adhere to all independence policies (GSK’s, Financial Reporting Council’s 2016 Revised Ethical Standard and applicable SEC standards); |
| | – Deliver a focused and consistent audit approach globally that reflects local risks and materiality |
| | – Liaise with Audit & Assurance to avoid duplication of work and Global Ethics and Compliance to ensure a common understanding of audit outcomes |
| | – Provide consistency of advice at all levels |
| | | – Ultimately, provide a high quality service to the Board, be scrupulous in their scrutiny of the Group and act with utmost integrity. |
Specific audit firm transition responsibilities | | – Contribute to a seamless, effective and efficient auditor transition to Deloitte that includes the following actions: |
| | – Provide access to all relevant information in respect of the audit of GlaxoSmithKline plc and its subsidiaries in relation to the audit of the Group’s consolidated accounts |
| |
| | – Provide information concerning GSK obtained during the course of providingnon-audit services, where this constitutes relevant information for the audit of the Group’s consolidated accounts |
| | – Provide factual/evidenced based oral or written explanation in a timely manner to aid Deloitte’s understanding of audit working papers |
| | – Agree practical: |
| | – terms of interaction to establish an appropriate environment/forum |
| | – arrangements for providing access to information, including the format, mechanism and response time |
| | – Liaise with Deloitte to enable their observation of audit activities once independent |
| | – Provide sufficient analysis of the hours spent in the provision of relevant information |
| | – Complete any additionalad-hoc handover expectations agreed during the year. |
Competition and Markets Authority compliance statement: The Committee considers that, during 2017, the company has complied with the mandatory audit processes and audit committee responsibility provisions of the Competition and Markets Authority Statutory Audit Services Order 2014. Pages 96 to 104 of this report describes the work of the Committee in discharging these responsibilities.
Non-audit services
The Sarbanes-Oxley Act of 2002 prohibits the engagement of the external auditor for the provision of certain services such as legal, actuarial, internal audit outsourcing or financial information systems design. Where the external auditor is permitted to providenon-audit services (such as audit-related, tax and other services), the Committee ensures that auditor objectivity and independence are safeguarded by a policy requiringpre-approval by the Committee for such services. There were no contractual or similar obligations restricting the Group’s choice of external auditor.
The following core policy guidelines on engaging the external auditor to providenon-audit services are observed:
| – | | ensuring allnon-audit services over £50,000 are put out to competitive tender with financial service providers other than the external auditor, in line with the Group’s procurement process, unless the skills and experience of the external auditor make them the only suitable supplier of thenon-audit service under consideration; |
| – | | ensuring adequate safeguards are in place so that the objectivity and independence of the Group audit are not threatened or compromised; and |
| – | | ensuring that the total fee levels do not exceed 50% of the annual audit fee, except in special circumstances where there would be a clear advantage in the company’s auditor undertaking such additional work. |
The existing policy was reviewed and revised by the Committee in December 2016 to ensure compliance with the Financial Reporting Council’s (FRC) 2016 Revised Ethical Standard and the EU Audit Regulation (new regulations). The new policy, which was implemented across the Group from the beginning 2017, contains the following three policy guidelines:
Fee cap: GSK’s existing policy cap of 50% of the annual audit fee cap was retained in the new policy. This is more stringent than the FRC’s new fees cap set at 70% of the average fees for the preceding three year period.
| | | | |
| GSK Annual Report 2017 | | Strategic report | | |
| | Governance and remuneration | | |
| | Financial statements | | |
| | Investor information | | |
Non-audit servicescontinued
Prohibitions: GSK’s new policy includes a ‘black list’ of prohibitednon-audit services in the new regulations.
Pre-approval: The category-widepre-approval process was updated to reflect the restrictions in the FRC’s 2016 Guidance on Audit Committees, so that allnon-audit services:
| – | | over £50,000 arepre-approved by the Committee Chairman and CFO as delegated by the Committee; |
| – | | between £25,000 and £50,000 arepre-approved by the Group Financial Controller; and |
| – | | under £25,000 are approved by a designate of the Group Financial Controller. |
As part of the external audit firm transition arrangements described below, Deloitte has been subject to the restrictions of this policy since it started its required period of independence from 1 July 2017 in advance of taking on the statutory audit of the Group’s 2018 financial statements from 1 January 2018.
Fees paid to the company’s auditors and its associates are set out below. Further details are given in Note 8 to the financial statements, ‘Operating profit’.
Where possible, other accounting firms are engaged to undertakenon-audit services.
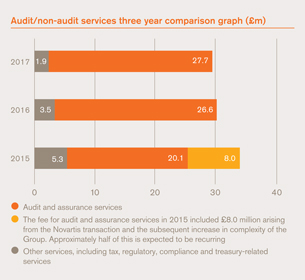
Auditors’ transition
This has been a significant activity for the Committee during the year. The Committee has exercised its oversight responsibilities to manage the transition period between PwC and Deloitte and for the Committee to satisfy itself that there is a smooth handover of audit responsibilities from one to the other. The Committee’s specific audit transition performance expectations for PwC are set out on page 101.
The Committee has received detailed transition papers at each scheduled meeting. To begin with, a primary focus was to oversee the steps needed for Deloitte to achieve independence by 1 July 2017 so that the firm could commence their audit planning activities.
This has involved scrutinising Deloitte’s plan to achieve independence, together with progress made in overseeing the termination ofnon-audit services that would be prohibited when Deloitte takes up the role of auditor. For example, this included Deloitte stepping down from its role as the Remuneration Committee’s advisers before the end of June 2017.
Since independence has been achieved:
| – | | Deloitte has been formally observing PwC’s work and its 2017 audit |
| – | | The prospective lead audit partner and his support have been invited to attend all Committee meetings |
| – | | The Committee Chair has held a number of meetings with the lead partner. |
Throughout the year, to enhance their understanding of GSK, the Deloitte audit team has engaged extensively with various GSK business stakeholders with a primary focus on the Finance and IT communities. They have also begun to engage with priority local market entities that have been identified as representing higher transition complexity, given local regulatory requirements, and with entities covered by the Group audit. These local introductions will progress throughout 2018.
Deloitte has held a series of regional academies toon-board their local teams and communicate the audit vision and approach to all their local partners. Deloitte has also centrally coordinated introductory meetings between senior finance managers and Deloitte partners in every location where statutory audit is required.
Deloitte has, and will continue to take part in the key PwC clearance meetings and targeted PwC walkthroughs to leverage its own work from existing PwC procedures. The Deloitte team have performed their initial audit scoping and risk assessment, designed a detailed audit plan and compiled an initial insights report which it presented to the Committee in December 2017.
PwC will resign after the firm has concluded the 2017 external audit process and the Committee will recommend to the Board that Deloitte be appointed to fill the casual vacancy. Shareholders will be invited to appoint Deloitte as GSK’s new statutory auditors at the 2018 AGM. PwC’s audit partner will make himself available at the AGM to answer shareholder questions on the 2017 Annual Report.
The transition process has been thorough with minimal disruption to GSK’s business.
| | |
| 104 | | |
GSK Annual Report 2017 | | |
| | |
| | |
Corporate Governance: Accountabilitycontinued
Auditors’ transitioncontinued
| | | | |
| | 2017 External Audit Firm Transition Process Key phases | | |
| | 
| | |
| | |
| | Key steps | | |
| | 
| | |
| | | | | | |
| | Key tasks | | |
| | | | | | |
| | – Achieving independence | | – Completing full risk assessment and scoping | | |
| | | |
| | – Building understanding of the GSK organisation structure and business units – Undertaking appropriate audit team selection andon-boarding – Agreeing process for data extraction tools – Agreeing collaboration terms with PwC. | | – Implementing audit analytics tools – Deepening understanding of business and processes – Walking through processes and assessing design of controls – On-boarding of global teams and communicating of audit approach – In-country market introductions – Assessing and concluding on key historic accounting judgements – Observing PwC interim review process – Agreeing terms of engagement. | | |
Fair, balanced and understandable assessment
One of the key compliance requirements of a group’s financial statements is for the Annual Report to be fair, balanced and understandable. The coordination and review of Group-wide contributions into the Annual Report follows a well-established and documented process, which is performed in parallel with the formal process undertaken by the external auditors.
The Committee received a summary of the approach taken by management in the preparation of GSK’s 2017 Annual Report to ensure that it met the requirements of the Financial Reporting Council’s 2016 UK Corporate Governance Code. This enabled the Committee, and then the Board, to confirm that GSK’s 2017 Annual Report taken as a whole is fair, balanced and understandable and provides the information necessary for shareholders to assess the company’s position and performance, business model and strategy.
Code of Conduct and reporting lines
We also have a number of well-established policies, including a Code of Conduct, which are available on the Governance section of our website, and confidential Speak Up reporting lines for the reporting and investigation of unlawful conduct. An updated version of the Code of Conduct was last published in April 2017.
| | | | |
| 105 | | |
| | | | | |
| GSK Annual Report 2017 | | Strategic report | | |
| | Governance and remuneration | | |
| | Financial statements | | |
| | Investor information | | |
Internal control framework
The Board recognises its obligation to present a fair, balanced and understandable assessment of GSK’s current position and prospects. The Board is accountable for evaluating and approving the effectiveness of the internal controls, including financial, operational and compliance controls, and the risk management processes operated by GSK.
The Internal Control Framework (the Framework) is a comprehensive enterprise-wide risk management model and the means by which GSK ensures the reliability of financial reporting and compliance with laws and regulations. The Framework supports the continuous process of the Board’s identification, evaluation and management of GSK’s Principal Risks, as required by the Financial Reporting Council’s (FRC’s) UK Corporate Governance Code (UK Code), and is designed to enable GSK to achieve its business objectives.
| | | | |
| | |
| | The Framework 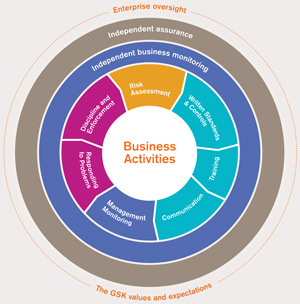
| | |
A fit for purpose Framework, in conjunction with our corporate values, behaviours and Speak Up processes, ensures that the risks associated with GSK’s business activities are actively and effectively controlled in line with our agreed risk appetite. The Framework provides reasonable, but not absolute, assurance against material misstatement or loss.
GSK’sRisk Oversight and Compliance Council (ROCC) is a team of senior leaders. It is mandated by the Board to assist the Committee in overseeing risk management and internal control activities. It also provides the business units with a framework for risk management and upward escalation of significant risks. Each business unit is governed by aRisk Management & Compliance Board (RMCB) which reports to the ROCC. The business unit RMCBs are responsible for promoting the local ‘tone from the top’ and risk culture, as well as ensuring effective oversight of internal controls and risk management processes.
Risk owners, who are members of senior management, are assigned for each Principal Risk. Each risk owner is accountable for the management of their respective Principal Risk and for reporting on the risk management strategy to the ROCC and the Committee at least once every two years. The ROCC and the RMCBs are assisted by Global Ethics and Compliance (GEC), which is responsible for advancing risk management across the enterprise and for the development of working practices that are risk based and ethically sound. GEC actively promotes ethical behaviours within the organisation. It seeks to establish a framework in which all of its employees can operate in accordance with GSK Values and comply with applicable laws and regulations.
TheAudit & Assurance division (A&A), in line with an assurance plan agreed by the Committee, provides independent assurance to senior management and the Board on the effectiveness of risk management across GSK. This assurance helps senior management and the Board to meet its oversight and advisory responsibilities in fulfilling GSK’s strategic objectives and building trust with patients and other stakeholders. A&A has a dual reporting line into the Chief Financial Officer and the Committee.
The Committee receives regular reports from business units, Principal Risk owners, GEC and A&A on areas of significant risk to GSK and on related internal controls. These reports provide an assessment on the internal control environment within each Principal Risk area, including enhancements to strengthen the control environment. Following the consideration of these reports, the Committee concludes on the effectiveness of the internal control environment and reports to the Board annually. In accordance with the UK Code provisions, the Committee, on the Board’s behalf, has conducted a robust assessment of the Group’s Principal Risks. This includes the consideration of the nature and extent of risk it is willing to take in achieving the Group’s strategic objectives.
| | |
| 106 | | |
GSK Annual Report 2017 | | |
| | |
| | |
Corporate Governance: Accountabilitycontinued
Internal control frameworkcontinued
The Board, through the Committee, has maintained oversight to ensure the effectiveness of the internal control environment and risk management processes in operation across GSK for the whole year, and up to the date of the approval of this Annual Report.
The Board’s review focuses on the company and its subsidiaries but does not extend to material associated undertakings, joint ventures or other investments, although it considers the risk of the company’s participation in these activities. There are established procedures and controls in place to identify entities whose results must be consolidated with the Group’s results. We believe the process followed by the Board, through the Committee, in reviewing regularly the system of internal controls and risk management processes is in accordance with the Guidance on Risk Management, Internal Control and Related Financial and Business Reporting issued by the FRC.
Further information on GSK’s risk management approach is provided in the ‘How we manage risk’ section of the Strategic report on pages 20 to 21. Our management of each Principal Risk is explained in ‘Principal risks and uncertainties’ on pages 257 to 266. The Group’s viability is discussed in the Group financial review section of the Strategic report on page 57.
| | | | |
| 107 | | |
| | | | | |
| GSK Annual Report 2017 | | Strategic report | | |
| | Governance and remuneration | | |
| | Financial statements | | |
| | Investor information | | |
Relations with stakeholders
Engagement activities
In the performance of its duties and as the company seeks to build on its Trust priority, the Board listens to the views of shareholders and other key stakeholders, including our patients, consumers, customers and employees, and is cognisant of the potential impacts of decisions it makes.
Our principal Board Committees have delegated powers that enables a morein-depth assessment of the impacts of the company’s engagement with stakeholders. It also provides a means of identifying emerging stakeholder-related issues that can be brought the attention of the Board, which in turn enables us to further invest in activities to build trust.
All shareholders
We try to engage with shareholders in several ways. This includes regular communications, the AGM and other investor relations activities. We announce our results on a quarterly basis and our annual results are included in our Annual Report. All shareholders receive an Annual Summary which advises them that our Annual Report and Notice of our Annual General Meeting are available.
Our major shareholders
During the year, after publication of our quarterly results Emma Walmsley and Simon Dingemans gave presentations to institutional investors, analysts and the media by webcast teleconference. In July, Emma Walmsley and her senior team held an investor update event with the same audience at which she shared her Innovation, Performance and Trust long-term priorities and which concluded with anin-depth Q&A session.
Emma and Simon maintain a continual and active dialogue with institutional shareholders on performance, plans and objectives through a programme of regular meetings. During the year, they held a total of 87 individual meetings with major shareholders and they have hosted a total of 25 group meetings with major shareholders and potential major shareholders.
Philip Hampton also meets with major shareholders to hear their views and discuss issues of mutual importance. He then communicates their views to the rest of the Board. During the year, he held over 15 individual meetings with major shareholders on a range of issues. Our Senior IndependentNon-Executive Director (SID) and our otherNon-Executive Directors are available to meet with major shareholders.
On an ongoing basis, our Investor Relations department, with offices in London and Philadelphia, acts as a focal point for communication with investors. The Company Secretary acts a focal point for communications on corporate governance matters.
| | | | | | |
| | Annual Governance event | | |
| | | |
| | A cornerstone of our investor calendar is the annual governance event that we hold with institutional shareholders, key investment industry bodies and influential proxy advisory firms. This year’s event was held in December 2017 at the Francis Crick Institute in London and was hosted by the Chairman, our SID, and our Committee Chairs. We valued prior engagement with and input from the Investor Forum and their members in helping shape the agenda for the event. The Chairman shared updates on key areas of focus for the Board including: – Overview of business performance for 2017 – Board and CET Succession – skills, capabilities and diversity – New CEO – Oversight of new business priorities: – Innovation, Performance and Trust – Capital Allocation | | – Aligning culture and strategy – Board stewardship and stakeholder relationships – Brexit. Lynn Elsenhans, Dr Jesse Goodman, Judy Lewent and Urs Rohner provided an overview of the work of their respective Board Committees undertaken during the year. Finally, Vindi Banga, our SID, provided his insights and perspectives on Board dynamics and the role and contribution of theNon-Executive Directors in challenging and shaping the Group’s strategy and business model. Listening to the views of our shareholders and receiving their feedback during this event held in the run up to the corporate reporting and AGM season, helps the Board to understand shareholders’ views. | | |
| | |
| 108 | | |
GSK Annual Report 2017 | | |
| | |
| | |
Corporate Governance: Relations with stakeholderscontinued
Engagement activitiescontinued
Our retail shareholders
The Company Secretary acts a focal point for retail investors and manages key relationships with the company’s registrars, Equiniti in the UK and The Bank of New York Mellon, who administer our ADR programme in the US.
Our people
The Board is fully supportive of the Group’s commitment to being a progressive, modern employer to attract and retain the best talent and drive high levels of employee engagement. In 2017, a key transformation priority for Emma Walmsley and her CET was to evolve the culture of the company to enhance business performance. Our strategic success relies on our ability to engage our employees behind the delivery of the company’s Innovation, Performance and Trust long-term priorities. This was discussed at some length by the Board, as well as at athree-day conference in October 2017 attended by 600 senior leaders.
| | | | |
| | Annual General Meeting | | |
| | All shareholders are invited to attend our Annual General Meeting, which this year will be held in May at the QEII, London. Our 2017 AGM had a good level of attendance and engagement by shareholders. All our proposed resolutions were approved by shareholders. The level of support ranged from 93% to 99%. It provides an opportunity to put questions to our Board and the Chairs of each of our Board Committees during the formal AGM proceedings, while providing shareholders the chance to meet informally with our Board directors who will make themselves available before the meeting. | | |
| | | | |
| | Employee engagement enhancements | | |
| | |
| | To help enhance our existing employee consultation activities, the Board supported management’s introduction and roll out of the following engagement activities from 2017 into 2018: | | |
| | |
| | 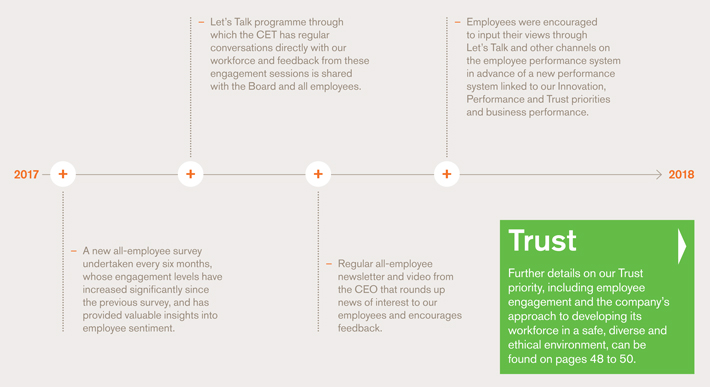 | | |
| | | | |
| 109 | | |
| | | | | |
| GSK Annual Report 2017 | | Strategic report | | |
| | Governance and remuneration | | |
| | Financial statements | | |
| | Investor information | | |
Science Committee report
| | | | | | | | | | | | | | |
| | | | | | | 
| | Dr Jesse Goodman Science Committee Chair | | |
| | | | | | | |
| | | | | | | | | | |
| | | | | | Role | | | | |
| | | | | | The Committee: | | | | |
| | | | | | – undertakes periodic reviews of R&D strategy and progress | | | | |
| | | | | | – assesses the overall performance, including relevant financial metrics, effectiveness and competitiveness of R&D | | | | |
| | | | | | – helps identify critical emerging trends in science and medicine and their potential impact on the company | | | | |
| | | | | | – undertakes periodic reviews of the company’s scientific capability and talent | | | | |
| | | | | | – reviews the scientific opportunity in specific large scale investments or business transactions | | | | |
| | | | | | – reviews the output of the Group’s science advisory boards. | | | | |
| | | | Membership | | | | | | |
| | | | Committee members | | Committee member since | | | | |
| | | | | Dr Jesse Goodman Chair from 1 January 2017 | | 1 January 2017 | | | | |
| | | | | Professor Sir Roy Anderson | | 1 January 2017 | | | | |
| | | | | Dr Laurie Glimcher | | 1 September 2017 | | | | |
| | | | | Judy Lewent | | 1 January 2017 | | | | |
| | | | > Details of the Committee members’ skills and experience are given in their biographies under ‘Our Board’ on pages 84 to 85. See page 88 for Committee member attendance levels. | | |
| | | | The Company Secretary is Secretary to the Committee and attends all meetings. Other attendees at Committee meetings may include: | | |
| | | | | Attendee | | Regular
attendee | | Attends as
required | | | | |
| | | | | Company Chairman | | ✓ | | | | | | |
| | | | | Chief Scientific Officer and President,
R&D | | ✓ | | | | | | |
| | | | | President, Global Vaccines | | ✓ | | | | | | |
| | | | | Independent senior external scientific adviser(s) | | ✓ | | | | |
| | | | | Chief Financial Officer | | ✓ | | | | |
| | | | | Other company executives | | ✓ | | | | |
| | | | | | | |
| | | | | | | | | | | | | | | |
| | | | | | | | | | | | | | | |
Dear Shareholder
I am pleased to present this first report of the Science Committee (the Committee), which was established by the main Board to consider our science, pipeline and R&D capital allocation priorities. The Committee’s core role throughout the first year of its operation has been to provide assurance to the Board on the quality, competitiveness and integrity of R&D. To discharge this role effectively requires a Committee to be composed of members with strong scientific capabilities. I am therefore pleased to be joined on the Committee by fellow Scientific and Medical Experts, Professor Sir Roy Anderson and Dr Laurie Glimcher, who, together with Judy Lewent, each have a background in life sciences from either a specialist or commercial perspective.
What the Committee did during 2017
During 2017, the Committee focused on establishing its role and remit and considered the following matters:
| – | | R&D’s Pharmaceutical Strategy, Performance and Transformation Programme |
| – | | Review of vaccines strategy and science |
| – | | Medical Healthcare Trends |
| – | | Anti-Microbial Resistance. |
An overarching focus of the Committee’s work has been its appraisal of the R&D transformation proposals and associated funding requirements prepared by our new CEO, Emma Walmsley and President, R&D, Dr Patrick Vallance. The Committee shared its feedback with management for incorporation into the proposals and was pleased to note the key milestones below to date:
| – | | Driving focus and prioritisation: Core therapy areas have been refocused. |
| – | | Enhancing pipeline governance: The Committee noted the effect of the changes to strengthen portfolio governance, creating greater robustness of financial, commercial and strategic review following the introduction of a new Portfolio Strategy Committee to guide and challenge this work. |
| – | | Improving Development: Significant progress has been made in creating the roadmap for improving the company’s overall capability in Development. In 2017, ‘quick wins’ included talent development, team optimisation and acceleration planning, in partnership with the commercial organisation. |
Committee Evaluation
The first annual evaluation of the Committee was externally facilitated by Ms Ffion Hague of Independent Board Evaluation and concluded that the Committee was establishing itself, formalising its structure and ways of working, including how to continue its oversight of R&D.
Next steps
The Committee is looking forward to working with Hal. It will oversee the development of his plans to further reinvigorate R&D and accelerate the discovery and development of transformational new medicines.
Finally, I would like to thank Dr Patrick Vallance, who steps down from the Board at the end of March, for his significant contribution in helping to establish the Committee, devising its remit and helping me develop a programme of activities as a basis for the Committee’s deliberations. I wish him well for the future.
Dr Jesse Goodman
Science Committee Chair
12 March 2018
| | |
| 110 | | |
GSK Annual Report 2017 | | |
| | |
| | |
Corporate Governancecontinued
Corporate Responsibility Committee report
| | |
 | | Lynn Elsenhans Corporate Responsibility Committee Chair |
| | | | | | |
| | | | Role | | |
| | | |
| | | | The Committee reviews: | | |
| | | |
| | | | – external issues that have the potential for serious impact upon GSK’s business and reputation | | |
| | | |
| | | | – oversight of stakeholder views and engagement | | |
| | | |
| | | | – annual governance oversight of progress against GSK’s Responsible Business Commitments. | | |
| | | | | | | | | | |
Membership The membership of the Committee and appointment dates are set out below: | |
| Committee members | | | | | | Committee member since | |
| Lynn ElsenhansChair from 8 May 2015 | | | 1 October 2012 | |
| Professor Sir Roy Anderson | | | | | | 1 May 2016 | |
| Dr Vivienne Cox | | | | | | 1 July 2016 | |
| Dr Jesse Goodman | | | | | | 1 May 2016 | |
> Details of the Committee members’ skills and experience are given in their biographies under ‘Our Board’ on pages 84 to 85. See page 88 for Committee member attendance levels. The Company Secretary is Secretary to the Committee and attends all meetings. Other attendees at Committee meetings may include: | |
| Attendee | | | | | | Regular attendee | |
| Attends as
required |
|
| Chief Executive Officer | | | | |  | | | |
| Company Chairman | | | | | | | | |
| General Counsel | | | | | | | | |
| President, Global Affairs | | | | | | | | |
| Chief Scientific Officer and President, R&D | | | | | | | | |
| President, GMS | | | | | | | | |
| President, Global Pharmaceuticals | | | | | | | | |
| President, Global Vaccines | | | | | | | | |
| CEO, GSK Consumer Healthcare | | | | | | | | |
| Head of Human Resources | | | | | | | | |
| SVP, Corporate Affairs | | | | | | | | |
| Head of Global Corporate Responsibility | | | | | | | | |
| Other Executives | | | | | | | | |
Independent external corporate
responsibility adviser | | | | | | | | |
Dear Shareholder
The Corporate Responsibility Committee (the Committee) acts as custodian of the policies and practices that define and safeguard the reputation of the company. As Chair of the Committee I continue, together with my fellow Committee members, to challenge and shape the company’s responsible business agenda. Committee members bring a wide range of sector experience, insight and stakeholder perspectives to help provide oversight on these topics. This helps the Board monitor the company’s work to engage effectively with its key stakeholders and to assess if the company is operating in a way that seeks to meet the high expectations of GSK as a global healthcare company that delivers long-term value for both shareholders and society.
The work of the Committee has again focused on topics that are material to the company’s mission, strategy and values. During 2017, much of the Committee’s focus has been on reviewing the company’s proposals for future responsible business activity in support of the company’s new long-term priority of Trust. The Committee has also provided oversight of management’s work to review and refocus GSK’s activity in support of global health moving forward.
The Committee pays close attention to the evolving views and expectations of the company’s broad range of key stakeholders and a regular report on stakeholder developments is reviewed and discussed at each meeting. This year the Committee also received an external report and held a discussion on the trends and stakeholder expectations that are likely to influence trust in the company over the long-term. The Committee and the Remuneration Committee were interested to review the preparation of the company’s gender pay gap disclosures set out on page 49.
Since the Committee’s membership was refreshed inmid-2016, I have been impressed with the way in which Roy, Jesse and Vivienne have exercised their knowledge and understanding of the issues under discussion, which has brought new challenge and oversight to the Committee and will stand us in good stead in 2018 as the company further evolves its responsible business agenda. I was also pleased to invite Roger Connor, President, GMS, who has company responsibility for Product Quality as well as Environment, Health, Safety and Sustainability, to attend the Committee on a regular basis as the Committee continues to increase its focus in these vital areas of the company’s operations.
This year we have continued to enjoy positive engagement with investors on our responsible business approach and performance, in particular where there are opportunities to enhance investment value, create business opportunities and mitigate risk, alongside creating social value.
The company is well positioned in 2018 to evolve its Responsible Business Commitments to a new set of focused activity that will support the delivery of Trust as one of GSK’s long-term business priorities.
Lynn Elsenhans
Corporate Responsibility Committee Chair
12 March 2018
| | | | |
| GSK Annual Report 2017 | | Strategic report | | |
| | Governance and remuneration | | |
| | Financial statements | | |
| | Investor information | | |
Corporate Responsibility Committee reportcontinued
Main responsibilities
The main responsibilities of the Committee are set out on page 110.
The Committee has a rolling agenda and receives reports from members of the CET and senior managers to ensure that progress in meeting our Responsible Business Commitments within four areas of focus is reviewed on an annual basis as follows:
| – | | Health for all: innovating to address currently unmet health needs; improving access to our products, irrespective of where people live or their ability to pay; and controlling or eliminating diseases affecting the world’s most vulnerable people. |
| – | | Our behaviour: Putting the interests of patients and consumers first, driven by our values in everything we do and backed by robust policies and strong compliance processes. |
| – | | Our people: Enabling our people to thrive and develop as individuals to deliver our mission. |
| – | | Our planet: Growing our business while reducing our environmental impact across the value chain. |
In addition, at each meeting the Committee considers an analysis by management of engagement with and expectations of the company’s key stakeholders which may have a bearing on the company’s reputation and the delivery of its responsible business agenda. The Committee also reviews and approves the Responsible Business Supplement which is available for reference on www.gsk.com/responsibility.
Work of the Committee in 2018
In 2018, the Committee will continue to seek to understand how management is responding to the expectations of external stakeholders and will seek to align its agendas to the activities that support the company’s long-term priority of Trust.
Independent External Corporate Responsibility Adviser
To support the Committee in ensuring that we give sufficient consideration to the views of key stakeholders at each meeting, in May 2013, Sophia Tickell was appointed as an independent external adviser to the Committee, a position that she had previously held until July 2011. Ms Tickell has extensive experience in the pharmaceuticals industry in improving health systems’ productivity, sustainability in energy supply and distribution, climate change policy and short-termism in financial markets.
She is theco-founder and Director of Meteos, from where she directs the Pharma Futures Series, which aims to align better societal and shareholder value. She holds a number of other board and advisory roles.
Ms Tickell attended meetings of the Committee and provided independent advice and guidance on corporate responsibility matters to both the Committee Chair and the CEO.
Committee evaluation
The Committee’s annual evaluation exercise was externally facilitated by Ms Ffion Hague of Independent Board Evaluation and concluded that the Committee continued to operate effectively.
| | |
| 112 | | |
GSK Annual Report 2017 | | |
| | |
| | |
Corporate Governancecontinued
Directors
Our Directors’ powers are determined by UK legislation and our Articles of Association, which contain rules about the appointment and replacement of Directors. They provide that Directors may be appointed by an ordinary resolution of the members, or by a resolution of the Directors, provided that, if appointed by the Board, the Director retires at the AGM following the appointment.
Our Articles also provide that Directors should normally be subject tore-election at the AGM at intervals of three years or annually if they have held office for a continuous period of nine years or more. The Board agreed in 2011 that all Directors who wish to continue as members of the Board should seekre-election annually in accordance with the UK Corporate Governance Code.
A Director may cease to be a Director if he or she:
| – | | ceases to be a Director by virtue of the Companies Act or the Articles |
| – | | suffers mental or physical ill health and the Board resolves that he or she shall cease to be a Director |
| – | | has missed Directors’ meetings for a continuous period of six months without permission and the Board resolves that he or she shall cease to be a Director |
| – | | is prohibited from being a Director by law |
| – | | resigns, or offers to resign and the Board accepts that offer |
| – | | is required to resign by the Board. |
Directors’ conflicts of interest
All Directors have a duty under the Companies Act 2006 to avoid a situation in which they have, or could have, a direct or indirect conflict of interest or possible conflict with the company. Our Articles provide a general power for the Board to authorise such conflicts.
The Nominations Committee has been authorised by the Board to grant and regularly review any potential or actual conflict authorisations, which are recorded by the Company Secretary and noted by the Board. Directors are not counted in the quorum for the authorisation of their own actual or potential conflicts.
On an ongoing basis, the Directors are responsible for informing the Company Secretary of any new actual or potential conflicts that may arise or if there are any changes in circumstances that may affect an authorisation previously given. Even when provided with authorisation, a Director is not absolved from his or her statutory duty to promote the success of the company. If an actual conflict arises post-authorisation, the Board may choose to exclude the Director from receipt of the relevant information and participation in the debate, or suspend the Director from the Board, or, as a last resort, require the Director to resign.
The Nominations Committee reviewed the register of potential conflict authorisations in January 2018 and reported to the Board that the conflicts had been appropriately authorised and that the process for authorisation continues to operate effectively. Except as described in Note 35 to the financial statements, ‘Related party transactions’, during or at the end of the financial year no Director or Person Closely Associated had any material interest in any contract of significance with a Group company.
Independent advice
The company has an agreed procedure for Directors to take independent legal and/or financial advice at the company’s expense where they deem it necessary.
Indemnification of Directors
Qualifying third party indemnity provisions (as defined in the Companies Act 2006) are in force for the benefit of Directors and former Directors who held office during 2017 and up to the signing of the Annual Report.
Change of control and essential contracts
We do not have contracts or other arrangements which individually are fundamental to the ability of the business to operate effectively, nor is the company party to any material agreements that would take effect, be altered, or terminate upon a change of control following a takeover bid. We do not have agreements with any Director that would provide compensation for loss of office or employment resulting from a takeover, except that provisions of the company’s share plans may cause options and awards granted under such plans to vest on a takeover. Details of the termination provisions in the Executive Directors’ service contracts are given in the full version of the company’s 2017 Remuneration policy report which is available at www.gsk.com in the Investors section.
Directors’ Report
For the purposes of the UK Companies Act 2006, the Directors’ Report of GlaxoSmithKline plc for the year ended 31 December 2017 comprises pages 79 to 112 of the Corporate Governance Report, the Directors’ statements of responsibilities on pages 148 and 233 and pages 257 to 286 of Investor Information. The Strategic report sets out those matters required to be disclosed in the Directors’ Report which are considered to be of strategic importance:
| – | | risk management objectives and policies (pages 20, 21 and 77 to 78) |
| – | | likely future developments of the company (Strategic report) |
| – | | research and development activities (pages 23 to 41) |
| – | | diversity and inclusion (page 49) |
| – | | provision of information to, and consultation with, employees (page 48) |
| – | | carbon emissions (page 51) |
The following information is also incorporated into the Directors’ Report:
| | |
| | | Location in Annual Report |
| |
| Interest capitalised | | Financial statements, Notes 17 and 19 |
| |
| Publication of unaudited financial information | | Group financial review, page 52 |
| |
| Details of any long-term incentive schemes | | Remuneration report |
| |
| Waiver of emoluments by a Director | | Not applicable |
| |
| Waiver of future emoluments by a Director | | Not applicable |
| |
| Nonpre-emptive issues of equity for cash | | Not applicable |
| |
Nonpre-emptive issues of equity for cash by
any unlisted major subsidiary undertaking | | Not applicable |
| |
Parent company participation in a placing by
a listed subsidiary | | Not applicable |
| |
Provision of services by a controlling
shareholder | | Not applicable |
| |
| Shareholder waiver of dividends | | Financial statements, Notes 15 and 43 |
| |
| Shareholder waiver of future dividends | | Financial statements, Notes 15 and 43 |
| |
| Agreements with controlling shareholders | | Not applicable |
The Directors’ Report has been drawn up and presented in accordance with and in reliance upon English company law and the liabilities of the Directors in connection with that report shall be subject to the limitations and restrictions provided by such law.
The Directors’ Report was approved by the Board of Directors on 12 March 2018 and signed on its behalf by:
Philip Hampton
Chairman
12 March 2018
| | | | |
113 | | |
| | | | | |
| GSK Annual Report 2017 | | Strategic report | | |
| | Governance and remuneration | |  |
| | Financial statements | | |
| | Investor information | | |
| | |
| | |
| 114 | | |
GSK Annual Report 2017 | | |
| | |
| | |
Remuneration report
Chairman’s annual statement

The decisions which the Remuneration Committee has taken this year have been aligned with our Remuneration policy, which received overwhelming shareholder support at our AGM in 2017.
Dear Shareholder
On behalf of the Board, I am pleased to present to you our Remuneration report for 2017. This includes my annual statement, our Annual report on remuneration and a summary of our Remuneration policy which was approved at our AGM in 2017, with 95.2% of shareholders voting in favour.
The Annual report on remuneration and this annual statement will be subject to an advisory vote at our AGM on 3 May 2018.
Context for Executive remuneration at GSK
2017 has seen GSK perform well. Sales grew across each of our three businesses – Pharmaceuticals, Vaccines and Consumer Healthcare – with continued good momentum in our new products, driven by strong performances fromTivicayandTriumeq in HIV, the inhaledElliptaportfolio andNucala in Respiratory and meningitis vaccines. We have also seen three key approvals:Shingrix vaccine for shingles;Trelegy Ellipta, a once-daily single inhaler triple therapy for COPD; andJuluca (dolutegravir and rilpivirine), the first2-drug regimen, once-daily, single pill for HIV. GSK has demonstrated continued cost controls throughout the year and improved free cash flow. We also achieved earnings growth and delivered Adjusted EPS growth in line with our guidance. Total EPS also increased. Finally, returns to shareholders through the dividend were in line with expectations.
Remuneration outcomes for 2017
All awards in relation to 2017 were made in accordance with the approved Remuneration policy. The key decisions made by the Remuneration Committee (the Committee) were as follows:
| – | | The bonus outcomes for the Executive Directors were determined by reference to performance against thepre-agreed financial measure, as well as the Committee’s assessment of their individual levels of performance. GSK achieved performance in excess of the relevant financial target for the year. In conjunction with assessment of individual performance, this has resulted in bonus payments being made above target, but below maximum opportunities. Further details of the bonus outcomes for the year are provided on page 120. |
| – | | Vesting of the 2015 Performance Share Plan (PSP) awards and the matching awards under the Deferred Annual Bonus Plan (DABP) were based on thepre-agreed measures of R&D new product performance, adjusted free cash flow and relative TSR, each with an equal weighting. Performance was measured over the three years to 31 December 2017. The threshold levels for the TSR and cash flow measures were exceeded, and the maximum level was achieved for the R&D new products measure, resulting in an overall vesting level of 69%. Further details of the vesting outcome for the 2015 PSP and DABP matching awards are provided on page 122. |
2018 Remuneration
The Committee reviewed the Executive Director salaries for 2018. Both Emma Walmsley’s and Simon Dingemans’ salaries increased from 1 January 2018 by 2.5%, in line with increases for the broader employee population. It remains the Committee’s intention to keep Ms Walmsley’s package under review in coming years subject to her development and performance in the role.
| | | | |
| 115 | | |
| | | | | |
| GSK Annual Report 2017 | | Strategic report | | |
| | Governance and remuneration | | |
| | Financial statements | | |
| | Investor information | | |
Board changes
In November 2017, Dr Patrick Vallance announced that he would leave the company to become the UK Government’s Chief Scientific Adviser and Head of the Government’s Office for Science. Dr Vallance is a voluntary leaver and therefore will not receive any severance payment when he leaves the company at the end of March 2018. Dr Vallance will continue to receive his base salary, set in 2017, until he leaves GSK. He was also eligible to receive a bonus for 2017 based on a combination of business and individual performance. He will not receive any bonus for the portion of 2018 for which he is employed and any PSP and DABP matching awards which have not already vested prior to his departure will lapse when he leaves. He was not eligible to receive an LTI award in 2018.
In November 2017, we announced the appointment of Dr Hal Barron to the role of Chief Scientific Officer and President, R&D from 1 January 2018. Dr Barron is one of the world’s foremost R&D leaders and has spent most of his career working in the USA. Dr Barron’s package is fully in line with the Remuneration policy approved by shareholders in 2017. His base salary is $1.7 million and his incentive opportunities are in line with the approved Remuneration policy. In aggregate, his total compensation is within the competitive range seen among our global pharmaceutical peer group. No“buy-out” awards were made.
Sir Andrew Witty stepped down as CEO and retired from GSK by mutual agreement in March 2017 and Dr Moncef Slaoui stepped down from the Board in March and retired from GSK by mutual agreement in June 2017. The agreed termination arrangements in both cases were set out in last year’s report. In both cases, the arrangements were executed in line with the approach described last year and, accordingly, this year’s Remuneration report provides further details of the final amounts paid.
Looking ahead
The R&D new products measure for our LTI plans was implemented to recognise the importance of R&D to future business growth. It will continue to be relevant for our LTI performance through 2020. It rewards not only the performance of our R&D organisation but also successful commercialisation. While launch excellence remains important, the Committee considers that there are other means to incentivise commercial success across the Group. The Committee will therefore be working during 2018 to design a new LTI measure based on the R&D pipeline which will replace the R&D new products measure from the 2019 LTI awards. We look forward to sharing more details of the new Innovation measure as this year progresses.
Governance developments
The Committee has taken a close interest in legislative and best practice developments around Director pay policy and supports initiatives that raise the bar in this area.
As a modern employer, the company takes its responsibilities under the new gender pay regulations very seriously. The Committee and the Corporate Responsibility Committee were interested to review the preparation of the company’s gender pay disclosures set out on page 49.
The UK Government has announced a package of measures on executive pay, including secondary legislation requiring publication of pay ratios between companies’ CEOs and the average of their UK employees. The Committee supports these further enhancements in transparency for shareholders and other interested stakeholders and will include this information in our report once the methodology for calculating the ratio is finalised in new regulations.
The Financial Reporting Council (FRC) has recently consulted on broadening the role of remuneration committees and other proposed measures on pay, as part of its wide-ranging review of the UK Corporate Governance Code (the revised Code). The Committee has included its views on these matters in the company’s response to the consultation on the revised Code.
The Committee has reviewed its current practices against the Government and FRC’s measures and is well-placed to comply with them. I look forward to providing an update on these issues in next year’s report.
AGM
Finally, I would like to thank shareholders for their ongoing input and engagement and I welcome all shareholders’ feedback on this report. We look forward to receiving your support for our Annual report on remuneration at our AGM on 3 May 2018.
Urs Rohner
Remuneration Committee Chairman
12 March 2018
| | |
| 116 | | |
GSK Annual Report 2017 | | |
| | |
| | |
Annual report on remuneration
2017 at a glance
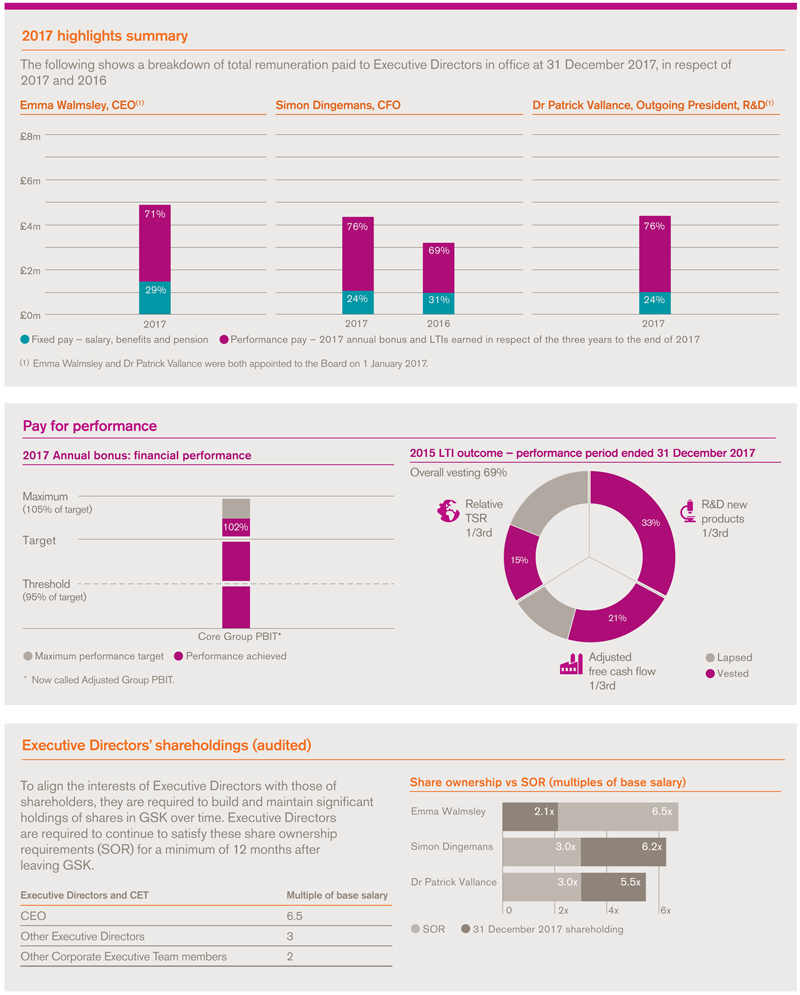
| | | | |
| 117 | | |
| | | | | |
| GSK Annual Report 2017 | | Strategic report | | |
| | Governance and remuneration | | |
| | Financial statements | | |
| | Investor information | | |
Total remuneration for 2017 (audited)
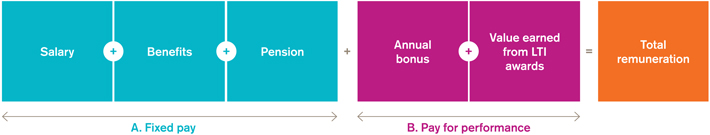
The total remuneration for 2017 for each Executive Director is set out in the table below:
| | | | | | | | | | | | | | | | | | | | | | | | | | | | | | | | | | | | | | | | | | | | | | | | | | | | |
| | | | | | | | Emma Walmsley,(1)
CEO | | | | | Sir Andrew Witty,(1)(5)
(Former CEO) | | | | | Simon Dingemans,(7)
CFO | | | | | Dr Patrick Vallance,
Outgoing President,
R&D | | | Dr Moncef Slaoui,(5)
(Former Chairman,
Global Vaccines) | |
| | | | | | | | 2017 £000 | | | 2016
£000 | | | | | Jan-Mar
2017 £000 | | | 2016
£000 | | | | | 2017 £000 | | | 2016 £000 | | | | | 2017 £000 | | | 2016
£000 | | | Jan-Mar
2017 $000 | | | 2016
$000 | |
A. Fixed pay | | | | | | | | | | | | | | | | | | | | | | | | | | | | | | | | | | | | | | | | | | | | | | | | | | |
| | | | | | | | | | | | | | | |
| Salary | | > See page 118 | | | | | (2)965 | | | – | | | | | 279 | | | 1,115 | | | | | 754 | | | 736 | | | | | 780 | | | – | | | 311 | | | 1,242 | |
| | | | | | | | | | | | | | | |
| Benefits | | > See page 118 | | | | | 266 | | | – | | | | | 92 | | | 124 | | | | | 142 | | | 92 | | | | | 102 | | | – | | | 232 | | | 495 | |
| | | | | | | | | | | | | | | |
| Pension | | > See page 119 | | | | | 195 | | | – | | | | | – | | | 520 | | | | | 151 | | | 147 | | | | | 156 | | | – | | | 101 | | | 875 | |
| | | | | | | | | | | | | | | |
| Other(6) | | | | | | | – | | | – | | | | | 344 | | | – | | | | | – | | | – | | | | | – | | | – | | | 260 | | | – | |
| | | | | | | | | | | | | | |
| Total fixed pay | | | | | 1,426 | | | – | | | | | 715 | | | 1,759 | | | | | 1,047 | | | 975 | | | | | 1,038 | | | – | | | 904 | | | 2,612 | |
| | | | | | | | | | | | | | | | | | | | | | | | | | | | | | | | | | | | | | | | |
B. Pay for performance | | | | | | | | | | | | | | | | | | | | | | | | | | | | | | | | | | | | | | | | | | | | | | | | | | |
| 2017 Annual bonus(3) > See pages 120 and 121 | | | | | 1,540 | | | – | | | | | – | | | 2,167 | | | | | 1,090 | | | 915 | | | | | 1,127 | | | – | | | – | | | 1,726 | |
| | | | | | | | | | | | | | |
| Vesting of LTI awards: | | | | | | | | | | | | | | | | | | | | | | | | | | | | | | | | | | | | | | | |
| | | | | | | | | | | | | | |
| DABP matching awards(4) | | | | | 112 | | | – | | | | | – | | | 361 | | | | | 156 | | | 119 | | | | | 182 | | | – | | | – | | | 293 | |
| | | | | | | | | | | | | | | |
| PSP(4) | | > See page 122 | | | | | 1,805 | | | – | | | | | – | | | 2,543 | | | | | 2,012 | | | 1,119 | | | | | 2,041 | | | – | | | – | | | 1,812 | |
| | | | | | | | | | | | | | |
| Total pay for performance | | | | | 3,457 | | | – | | | | | – | | | 5,071 | | | | | 3,258 | | | 2,153 | | | | | 3,350 | | | – | | | – | | | 3,831 | |
| | | | | | | | | | | | | | | | | | | | | | | | | | | | | | | | | | | | | | | | |
| | | | | | | | | | | | | | | |
| A+B = Total remuneration | | | | | 4,883 | | | – | | | | | 715 | | | 6,830 | | | | | 4,305 | | | 3,128 | | | | | 4,388 | | | – | | | 904 | | | 6,443 | |
Notes:
| (1) | Emma Walmsley was appointed to the Board with effect from 1 January 2017, and succeeded Sir Andrew Witty as CEO on 1 April 2017. Sir Andrew stepped down as CEO, and retired from the Board, on 31 March 2017. |
| (2) | Emma Walmsley’s salary as CEO Designate between 1 January and 31 March 2017 was £850,000. Ms Walmsley’s salary then increased from 1 April 2017 to £1,003,000 when she succeeded Sir Andrew Witty as CEO. |
| (3) | Details of Deferred Annual Bonus Plan (DABP) (bonus deferrals) are set out on page 129. From 2017, no matching awards will be made under the DABP. |
| (4) | Further details in respect of the vesting of DABP (matching awards) and Performance Share Plan (PSP) awards for the three-year period to 31 December 2017 are provided on page 122. |
| (5) | The PSP and DABP awards for Sir Andrew Witty and Dr Moncef Slaoui granted in 2015 have not yet vested. These awards will vest following theone-year anniversary of their termination in accordance with the terms of the Executive Financial Recoupment Policy. For Sir Andrew, awards will vest after 31 March 2018 and for Dr Slaoui, after 30 June 2018. In addition to this delayed vesting, the PSP awards for both have atwo-year holding period from the point of normal vesting. |
| (6) | As disclosed in the 2016 Annual Report on page 136, Sir Andrew Witty and Dr Moncef Slaoui left GSK by mutual agreement, neither received any termination payments and any outstanding incentive awards were treated in accordance with the 2014 Remuneration policy approved by shareholders. Under those terms, Sir Andrew and Dr Slaoui received paymentspro-rated for the proportion of the financial year worked in lieu of performance related bonus payments. Thepro-rated amounts paid for the three months to 31 March 2017 were £343,520 and $260,340 respectively. |
| (7) | Simon Dingemans’ vested PSP shares will be subject to atwo-year holding period. |
| (8) | The Committee may in specific circumstances, and in line with stated principles, apply clawback/malus, as it determines appropriate. Following due consideration by the Committee, there has been no recovery of sums paid (clawback) or reduction of outstanding awards or vesting levels (malus) applied during 2017 in respect of any of the Executive Directors. |
| | |
| 118 | | |
GSK Annual Report 2017 | | |
| | |
| | |
Annual report on remunerationcontinued
Total remuneration for 2017 (audited)continued
The following sections provide details of each element of ‘Total remuneration’, including how the Committee implemented the approved Remuneration policy in 2017.
Comparator groups for pay and TSR
The Committee used two pay comparator groups for all roles when considering executive pay for 2017. The primary group used for each Executive Director was as follows:
| | | | | | | | | | |
| | | UK cross-industry comparator group | | | | Global pharmaceutical comparator group |
| | | | | |
Emma Walmsley Simon Dingemans | | AstraZeneca BHP Billiton BP British American Tobacco Diageo | | Reckitt Benckiser Rio Tinto Royal Dutch Shell Unilever Vodafone | | Dr Patrick Vallance | | France Sanofi Switzerland Novartis Roche Holdings UK AstraZeneca | | US AbbVie(1) Amgen(1) Bristol-Myers Squibb Eli Lilly Johnson & Johnson Merck & Co Pfizer |
| (1) | AbbVie and Amgen are included for remuneration benchmarking, but are not included in the TSR comparator group. |
When reviewing the CEO’s remuneration, the Committee also references pay for a group of leading European companies whose selection is based on their size and complexity.
Fixed pay (audited)
Salary
The table below sets out the base salaries of the Executive Directors over the last two years. As disclosed last year, the salary increases made in 2017 were aligned with those provided to the wider workforce. Details of salary levels for 2018 are provided on page 140.
| | | | | | | | | | | | |
| | | % | | | Base salary | |
| | | change | | | 2017 | | | 2016 | |
| | | |
Emma Walmsley | | | | | | | | | | | | |
(1 January to 31 March) | | | n/a | | | | £850,000 | | | | – | |
| | | |
Emma Walmsley | | | | | | | | | | | | |
(1 April to 31 December) | | | n/a | | | | £1,003,000 | | | | – | |
| | | |
| Sir Andrew Witty | | | 0% | | | | £1,114,500 | | | | £1,114,500 | |
| | | |
| Simon Dingemans | | | 2.5% | | | | £754,000 | | | | £735,600 | |
| | | |
| Dr Patrick Vallance | | | n/a | | | | £780,000 | | | | – | |
| | | |
| Dr Moncef Slaoui | | | 0% | | | | $1,242,100 | | | | $1,242,100 | |
Benefits
The table opposite shows a breakdown of the grossed up cash value of the benefits received by the Executive Directors in 2017 and 2016 which included:
| – | Employee benefits:all employee share plans, healthcare, car allowance, personal financial advice and life assurance/death in service cover. |
| – | Travel expenses: car, travel and spouse/partner costs associated with accompanying the Executive Director on GSK business, which are deemed to be taxable benefits for the individual. |
| – | Other benefits: expenses incurred in the ordinary course of business, which are deemed to be taxable benefits for the individual and, as such, have been included in the table. |
| | | | | | | | |
| | | 2017 benefits
£000 | | | 2016 benefits
£000 | |
| | |
| Emma Walmsley | | | | | | | | |
| | |
Employee benefits | | | 60 | | | | – | |
| | |
Travel | | | 146 | | | | – | |
| | |
Other benefits | | | 60 | | | | – | |
| | |
Total | | | 266 | | | | – | |
| | |
| Sir Andrew Witty | | | | | | | | |
| | |
Employee benefits | | | 18 | | | | 63 | |
| | |
Travel | | | 6 | | | | 23 | |
| | |
Other benefits | | | 68 | | | | 38 | |
| | |
Total | | | 92 | | | | 124 | |
| | |
| Simon Dingemans | | | | | | | | |
| | |
Employee benefits | | | 53 | | | | 30 | |
| | |
Travel | | | 64 | | | | 38 | |
| | |
Other benefits | | | 25 | | | | 24 | |
| | |
Total | | | 142 | | | | 92 | |
| | |
| Dr Patrick Vallance | | | | | | | | |
| | |
Employee benefits | | | 48 | | | | – | |
| | |
Travel | | | 46 | | | | – | |
| | |
Other benefits | | | 8 | | | | – | |
| | |
Total | | | 102 | | | | – | |
| | |
| Dr Moncef Slaoui | | | $000 | | | | $000 | |
| | |
Employee benefits | | | 85 | | | | 158 | |
| | |
Travel | | | 10 | | | | 34 | |
| | |
Other benefits(1) | | | 137 | | | | 303 | |
| | |
Total | | | 232 | | | | 495 | |
| (1) | For Dr Moncef Slaoui, other benefits include UK accommodation of $57,578 in 2017 (2016 – $247,875). |
| | | | |
| 119 | | |
| | | | | |
| GSK Annual Report 2017 | | Strategic report | | |
| | Governance and remuneration | | |
| | Financial statements | | |
| | Investor information | | |
Fixed pay (audited)continued
Pensions
| | | | |
Executive Director | | Pension plan type | | Member since |
Emma Walmsley | | 20% of base salary and matching contributions on the first £33,333 of salary(1) | | 2010 |
| | | 20% of base salary in lieu of pension on salary in excess of £33,333(2). | | |
Sir Andrew Witty | | UK defined benefit | | 1991 |
Simon Dingemans | | 20% of base salary in lieu of pension(3) | | – |
Dr Patrick Vallance | | 20% of base salary in lieu of pension(3) | | – |
Dr Moncef Slaoui | | US and Belgian plans(4) | | 1988 |
| (1) | As a member of the defined contribution plan, Emma Walmsley is eligible to receive a matching award of up to 5% on the first £33,333 of her salary in accordance with the terms of the plan. |
| (2) | Emma Walmsley receives a cash payment in lieu of pension of 20% of base salary in excess of £33,333 in line with GSK’s defined contribution pension plan rates. |
| (3) | Simon Dingemans and Dr Patrick Vallance receive a cash payment in lieu of pension of 20% of base salary in line with GSK’s defined contribution pension plan rates. |
| (4) | Since becoming a member of these plans, Dr Moncef Slaoui built up pensionable service in the Belgian Plan, and in the US Cash Balance and Supplemental Pension Plans. Annual employer cash contributions were made to the 401(k) Plan and Executive Supplemental Savings Plan (ESSP). His current pension entitlement is a product of his service and progression within GSK. |
The following table shows the breakdown of the pension values set out on page 117.
| | | | | | | | | | | | | | | | | | | | | | | | | | | | | | | | | | | | | | | | | | | | | | |
| | | Emma Walmsley | | | | | Sir Andrew Witty | | | | | Simon Dingemans | | | | | Dr Patrick Vallance | | | Dr Moncef Slaoui | |
| | | | | | | | | | | | | | | | | | | | | | |
| Pension remuneration values(1) | | 2017 £000 | | | 2016 £000 | | | | | Jan-Mar 2017 £000 | | | 2016 £000 | | | | | 2017 £000 | | | 2016 £000 | | | | | 2017 £000 | | | 2016 £000 | | | Jan-Mar 2017 $000 | | | 2016 $000 | |
| | | | | | | | | | | | | | | | | | | | |
UK defined benefit | | | – | | | | – | | | | | | – | | | | 520 | | | | | | – | | | | – | | | | | | – | | | | – | | | | – | | | | – | |
| | | | | | | | | | | | | |
US defined benefit | | | – | | | | – | | | | | | – | | | | – | | | | | | – | | | | – | | | | | | – | | | | – | | | | 7 | | | | 742 | |
| | | | | | | | | | | | | |
UK defined contribution | | | 9 | | | | – | | | | | | – | | | | – | | | | | | – | | | | – | | | | | | – | | | | – | | | | – | | | | – | |
| | | | | | | | | | | | | |
Belgian defined benefit(2) | | | – | | | | – | | | | | | – | | | | – | | | | | | – | | | | – | | | | | | – | | | | – | | | | – | | | | 10 | |
| | | | | | | | | | | | | |
Employer cash contributions | | | 186 | | | | – | | | | | | – | | | | – | | | | | | 151 | | | | 147 | | | | | | 156 | | | | – | | | | 94 | | | | 123 | |
| | | | | | | | | | | | | | | | | | | | |
Total pension remuneration value | | | 195 | | | | – | | | | | | – | | | | 520 | | | | | | 151 | | | | 147 | | | | | | 156 | | | | – | | | | 101 | | | | 875 | |
| | | | | | | | | | | | | | | | | | | | |
| (1) | The pension remuneration figures have been calculated in accordance with the methodology set out in The Large andMedium-sized Companies and Group (Accounts and Reports) (Amendment) Regulations 2013 (Remuneration Regulations). In calculating the defined benefit pension values for 2017, for Sir Andrew Witty and Dr Slaoui the difference between the accrued pension as at 31 March 2017 and the accrued pension as at 31 December 2016 increased by inflation (1% for UK defined benefit, 2.2% for US defined benefit, 2.2% for Belgian defined benefit) has been multiplied by 20. |
| (2) | Amounts have been translated from Euros into US Dollars using an exchange rate of 1.11 for 2016. |
Further details regarding the 2017 pension values for defined benefit plan participants are set out in the table below.
| | | | | | | | | | |
| | | | | | Accrued pension | | | | |
| | | | | | | |
| Sir Andrew Witty(1) | | 31 March 2017 £ (p.a.) | | | 31 Dec 2016 £ (p.a.) | | | | Pension remuneration
value for 2017 (£000) |
| | | | | | | | |
UK – Funded | | | 72,261 | | | 71,591 | | | | – |
UK – Unfunded | | | 670,739 | | | 670,500 | | | | – |
| | | | | | | | |
Total | | | 743,000 | | | 742,091 | | | | – |
| | | | | | | | |
| | | | | | | | | | |
| | | | | | Accrued pension | | | | |
| | | | | | | |
| Dr Moncef Slaoui(1) | | 31 March 2017 $ (p.a.) | | | 31 Dec 2016 $ (p.a.) | | | | Pension remuneration value for 2017 ($ 000) |
| | | | | | | | |
US – Funded | | | 15,844 | | | 15,434 | | | | 7 |
US – Unfunded | | | 427,686 | | | 439,393 | | | | – |
Belgium – Funded(2) | | | 105,655 | | | 103,230 | | | | – |
| | | | | | | | |
Total | | | 549,185 | | | 558,057 | | | | 7 |
| | | | | | | | |
| (1) | The pensions figures are disclosed for both Sir Andrew Witty and for Dr Moncef Slaoui, who are members of defined benefit plans. |
| | The table shows the accrued benefit (i.e. the annual pension accrued to date). The pension remuneration in 2017 is calculated as the increase in the accrued benefit, adjusted for inflation and a multiplier (to reflect the fact that the benefit will be received for a number of years). Where a movement is negative in the year, no value is shown. |
| (2) | Amounts have been translated from Euros into US Dollars using an exchange rate of 1.13 for 2017 and 1.11 for 2016. |
| | |
| 120 | | |
GSK Annual Report 2017 | | |
| | |
| | |
Annual report on remunerationcontinued
Pay for performance (audited)
Annual bonus

* Renamed Adjusted Group PBIT.
2017 performance against targets
For 2017, the financial measures and weightings were as follows:
| | | | | | | | | | | | | | | | |
| | | Weighting | | | | | | | | | 2017 performance | |
| | | | |
| | | | |
| Performance measure | | Executive Directors | | | 2017 target(1) | | | Outcome | | | Positioning
against target | |
Core Group PBIT (now called Adjusted Group PBIT) | | | 70% | | | | £8,126m | | | | £8,322m | | | | 102% | |
Individual objectives | | | 30% | | | | | | | | | | | | | |
| (1) | Threshold and maximum performance targets were set at 95% and 105% of Target respectively. |
| (2) | The Core Group PBIT target and outcome for the purposes of the Annual bonus calculation differs from Core Group PBIT, disclosed elsewhere in this Annual Report, primarily because both the target and outcome numbers are calculated applying GSK budget exchange rates and not actual exchange rates. |
The following table shows actual bonuses earned compared to opportunity for 2017:
| | | | | | | | | | | | | | | | | | | | | | | | | | | | |
| | | | | | 2017 bonus opportunity | | | 2017 bonus outcome | |
| | | | | | | | | % of salary | | | | | | | | | | | | | |
| Bonus | | 2017 Base salary £ | | | Target
(% of salary) | | | Maximum (% of salary) | | | Financial
performance
(% of salary) | | | Individual
objectives
(% of salary) | | | Total 2017 bonus
(% of salary) | | | Total 2017
bonus £000 | |
Emma Walmsley | | | 1,003,000 | | | | | | | | | | | | 98 | | | | 55.5 | | | | 153.5 | | | | 1,540 | |
Simon Dingemans | | | 754,000 | | | | 100 | | | | 200 | | | | 98 | | | | 46.5 | | | | 144.5 | | | | 1,090 | |
Dr Patrick Vallance | | | 780,000 | | | | | | | | | | | | 98 | | | | 46.5 | | | | 144.5 | | | | 1,127 | |
| (1) | As Sir Andrew Witty and Dr Moncef Slaoui ceased to be Executive Directors during the year, in accordance with the Remuneration policy they received apro-rata payment for 2017 in lieu of a variable bonus opportunity. The Committee set role specific objectives for them for this period. As the two individuals ceased to be Executive Directors before the 2017 Remuneration policy was approved, the target bonus opportunities were as set out in the policy approved by shareholders in 2014 (i.e. 125% of salary for Sir Andrew and 85% of salary for Dr Slaoui). These contractual payments are shown under other in the table on page 117. |
The table below provides more detail on delivery against the Core Group PBIT target, now called Adjusted Group PBIT:
| | |
Financial performance |
Core Group PBIT (Adjusted Group PBIT) | | – Group turnover was £30.2 billion, an 8% increase AER and 3% CER |
| | – Adjusted operating profit £8,568 million, 5% higher on a CER basis, and 12% higher AER |
| | – The Adjusted operating margin of 28.4% was 0.9 percentage points higher than in 2016 and 0.4 percentage points higher on a CER basis. This reflected improved operating leverage driven by sales growth and a more favourable mix in all three businesses. The margin also benefited from continued tight control of ongoing costs across all three businesses as well as restructuring and integration benefits in the Vaccines and Consumer Healthcare businesses, partly offset by continued pricing pressures, particularly in respiratory, and investments in R&D and the supply chain. |
| | | | |
| GSK Annual Report 2017 | | Strategic report | | |
| | Governance and remuneration | | |
| | Financial statements | | |
| | Investor information | | |
Pay for performance (audited)continued
The following table summarises performance against the scorecard of individual objectives agreed by the Committee for each Executive Director:
| | |
| | | Individual objectives |
| |
| Emma Walmsley | | – Successful induction and transition from Sir Andrew Witty. |
| |
| | – Delivered a strong overall financial performance for the Group in 2017. |
| |
| | – Strong performance from new product sales: £6.7 billion, +51% AER, 44% CER (on track to deliver £6 billion in new product sales on a CER basis by 2018, 2017 sales £5.7 billion at CER) |
| |
| | – Building a top Corporate Executive Team with outstanding new hires in R&D, Pharma Commercial and Digital and Technology. 40% of top 125 roles are new hires or internal promotions. |
| |
| | – Successfully completed strategic review of the Pharma business in key areas such as portfolio, footprint, operating model. Implementation ongoing. |
| |
| | – Significant pipeline reprioritisation and new R&D portfolio governance process across R&D and commercial. |
| |
| | – New5-year Pharmaceuticals supply chain-strategy to reduce complexity and improve productivity whilst maintaining compliance. |
| |
| | – Innovation, Performance and Trust priorities and KPIs defined, communicated and used as basis for all employee objectives and business performance management. |
| |
| | – Improving cash and cost discipline, with newly established capital allocation process and integrated business P&L and cash flow management. |
| |
| | – New employee Expectations and incentive system launched as key enablers of culture change. |
| |
| | – Significant improvements in reliability and quality supply for our Pharma and Consumer Health businesses. |
| |
| | – GSK ranked #1 in Access to vaccines Index and Anti-Microbial Resistance Benchmark. |
| |
| | | – 10 per cent improvement in comparable employee engagement score since 2015. |
| |
| Simon Dingemans | | – Delivered strong financial leadership for the Group in 2017. |
| |
| | – Improved cash flow generation. Improved cash and cost discipline, with newly established capital allocation process and integrated business P&L and cash flow management. |
| |
| | – Restructuring and synergy programmes delivered combined benefits of £3.7 billion in 2017 (£3.3 billion at CER). |
| |
| | – Developed capital allocation framework to support the strategy, including business development requirements. |
| |
| | – Strong support to the new CEO. |
| |
| | | – Appointment of the new Chief Digital and Technology Officer. |
| |
| Dr Patrick Vallance | | – Strong performance from new product sales: £6.7 billion, +51% AER, 44% CER, including strong performances fromTivicayandTriumeq in HIV, inhaledEllipta portfolio andNucala in Respiratory. |
| |
| | – Two key approvals from pharmaceuticals pipeline included: |
| |
| | – Trelegy Ellipta once daily single inhaler triple therapy for COPD; |
| |
| | – Juluca first2-drug regimen, once-daily, single pill for HIV. |
| |
| | – Continued strong delivery by the R&D organisation across the R&D pipeline. |
| |
| | – Completed R&D performance review leading to significant pipeline reprioritisation and operational changes in the areas of diagnosis and early implementation. |
| |
| | | – Strengthened R&D partnership with Commercial Pharmaceuticals. Particular attention paid to pipeline prioritisation. |
Malus and clawback policy
For details of our policy on malus/clawback, please refer to the 2017 Remuneration policy report on page 140 of the 2016 Annual Report, available at www.gsk.com in the Investors section.
From 1 January 2015 in respect of each financial year, the Committee decided to disclose whether it (or the Recoupment Committee) has exercised malus or clawback.
Disclosure is only made when the matter has been the subject of public reports of misconduct, where it has been fully resolved, where it is legally permissible to disclose and where it can be made without unduly prejudicing the company and therefore shareholders.
In line with these disclosure guidelines, neither the Committee (nor the Recoupment Committee) exercised malus or clawback during 2017.
Other policies
For details of our policies on recruitment remuneration, loss of office and termination payments, please refer to the 2017 Remuneration policy report on pages 137 to 146 of the 2016 Annual Report, available at www.gsk.com in the Investors section.
| | |
| 122 | | |
GSK Annual Report 2017 | | |
| | |
| | |
Annual report on remunerationcontinued
Pay for performance (audited)continued
Value earned from long-term incentives (LTIs)
The following tables set out the performance achieved by management against the targets set for the company’s LTI plans and also includes an update on performance of outstanding awards.
In line with the Committee’s agreed principles, for each measure applicable to the 2015 LTI awards, actual performance against targets is reviewed and adjustments made as appropriate to reflect the impact of the Novartis transaction on the business and to ensure that the vesting outcome reflects genuine underlying business performance. Further details on any adjustments made will be provided at the time of vesting.
2015 awards with a performance period ended 31 December 2017
The Committee reviewed the performance of the PSP and DABP matching awards granted to Executive Directors against the targets set. The performance achieved in the three years to 31 December 2017 and the vesting levels are set out in the table below.
| | | | | | | | | | | | | | | | |
| | | | | | | | | Outcome and vesting level |
Performance measures
and relative weighting | | Performance targets | | | | Outcome | | % of maximum | | % of award |
R&D new product
performance
(1/3rd) | | R&D new product sales performance measures aggregate three-year sales for new products launched in the three-year performance period and the preceding two years,i.e. 2013-17. | | | | £ 11.27bn | | 100 | | 33 |

| | | | Original target | | Adjusted target | | % vesting | | | | | | | | |
| | | | | | | | | | |
| | Maximum | | £7.58bn | | £7.91bn | | 100% | | | | | | | | |
| | | | | £6.89bn | | £7.19bn | | 75% | | | | | | | | |
| | | | | £6.54bn | | £6.83bn | | 50% | | | | | | | | |
| | | Threshold | | £6.20bn | | £6.47bn | | 25% | | | | | | | | |
| | | | | | | | | | |
| | | | | | | | | | | | | | | | | |
Adjusted free
cash flow (AFCF)
performance | | In line with the company’s agreed principles, the AFCF figures included adjustments for a number of material distorting items, including legal settlements, exchange rate movements and special pension contributions. | | | | £12.47bn | | 63 | | 21 |
| (1/3rd) | | | | | | Target(1) | | % vesting | | | | | | | | |
| | | | | | | | | | |
 | | Maximum | | | | £13.6bn | | 100% | | | | | | | | |
| | | | | | £13.0bn | | 75% | | | | | | | | |
| | | | | | | £11.8bn | | 50% | | | | | | | | |
| | | Threshold | | | | £11.5bn | | 25% | | | | | | | | |
| | | | | | | | | | |
| | (1) AFCF target was set and announced following the close of the Novartis transaction in 2015. The target was not adjusted. | | | | | | | | |
| | | | | | | | | | | | | | | | | |
Relative TSR performance
(1/3rd)

| | | | TSR ranking within comparator group(1) | | % vesting | | | | Ranked 5th | | 44 | | 15 |
| | | | | | | | | | |
| | Maximum | | 1st, 2nd, 3rd | | | | 100% | | | | | | | | |
| | | | 4th | | | | 72% | | | | | | | | |
| | | | 5th | | | | 44% | | | | | | | | |
| | | Threshold(2) | | Median | | | | 30% | | | | | | | | |
| | | | | 6th to 10th | | | | 0% | | | | | | | | |
| | | | | | | | | | |
| | (1) TSR comparator group: AstraZeneca, Bristol-Myers Squibb, Eli Lilly, GSK, Johnson & Johnson, Merck & Co, Novartis, Pfizer, Roche Holdings and Sanofi. | | | | | | | | |
| | (2) The vesting schedule is based on delivering 30% vesting for median performance. In a comparator group of ten companies, median falls between two companies. | | | | | | | | |
| | | | | | | | | | | | | | | | |
Total vesting in respect of 2015 awards | | 69% |
| | | | |
| GSK Annual Report 2017 | | Strategic report | | |
| | Governance and remuneration | | |
| | Financial statements | | |
| | Investor information | | |
Pay for performance (audited)continued
Historical vesting for GSK’s LTIs
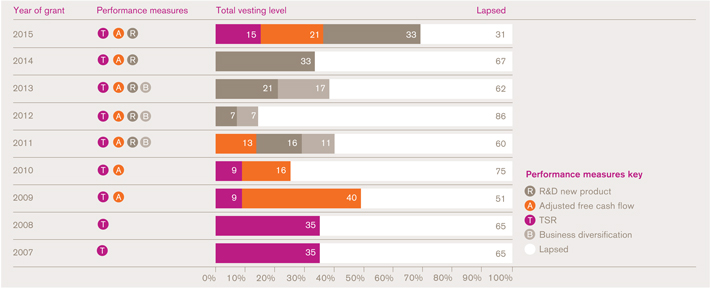
Update on performance of ongoing LTI awards
The Committee also reviewed the performance of the PSP and DABP matching awards granted to Executive Directors in 2016 and 2017. The following charts provide an estimate of the vesting levels taking into account performance to 31 December 2017.
Actual vesting levels will only be determined based on performance over the full three-year performance periods. The indications below should therefore not be regarded as predictions of the final vesting levels.
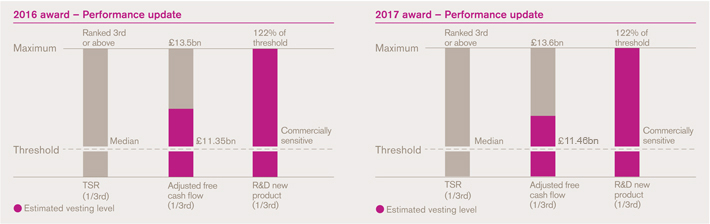
For threshold performance, 25% of each award will vest in respect of R&D new product and AFCF measures and 30% for the TSR element. The TSR comparator group remains unchanged from that shown on page 118 in respect of the 2015 awards.
The adjusted free cash flow target for the 2016 award has been revised to reflect additional investments in key R&D projects and in the Priority Review Voucher for the Juluca launch in the U.S.; please refer to pages 25 and 54 of the Annual Report. The Committee intends to disclose targets in full following the end of the performance period, in the 2018 Annual report on remuneration.
2017 LTI awards
The levels of participation in the DABP in respect of 2016 bonus deferrals are shown in the table below. The table details the last matching award in 2017 showing the maximum vesting potential in respect of 2016 bonuses. The table also shows the PSP award details for 2017.
| | | | | | | | | | | | | | |
| | | DABP matching awards | | | | PSP awards |
| | | 2016
% of total bonus
deferred | | 2017 Number of
shares | | 2017
Face value
of award(1) | | | | 2017
Award level as %
of base salary | | 2017 Number of shares | | 2017
Face value
of award(2) |
| Emma Walmsley | | 50% | | 31,945 shares | | £0.504m | | | | 550% | | 356,939 shares | | £5.5m |
| Sir Andrew Witty | | 25% | | – | | – | | | | – | | – | | – |
| Simon Dingemans | | 50% | | 29,022 shares | | £0.458m | | | | 400% | | 195,147 shares | | £3m |
| Dr Patrick Vallance | | 50% | | 21,632 shares | | £0.341m | | | | 500% | | 252,345 shares | | £3.9m |
| Dr Moncef Slaoui | | 25% | | – | | – | | | | – | | – | | – |
| (1) | The face value of the DABP awards have been calculated based on a share price of £15.77, being the closing price on 14 February 2017. |
| (2) | The face value of the PSP awards have been calculated based on a share price of £15.455, being the closing price on 26 July 2017. |
| (3) | The performance period for the 2017 awards is from 1 January 2017 to 31 December 2019. |
| | |
| 124 | | |
GSK Annual Report 2017 | | |
| | |
| | |
Annual report on remunerationcontinued
CEO pay comparison
2017 CEO total remuneration positioning
Performance graph
The following graph sets out the performance of the company relative to the FTSE 100 index and to the pharmaceutical performance comparator group for the nine-year period to 31 December 2017. These indices were selected for comparison purposes as they reflect both the primary index of which GSK is a constituent and the industry in which it operates.
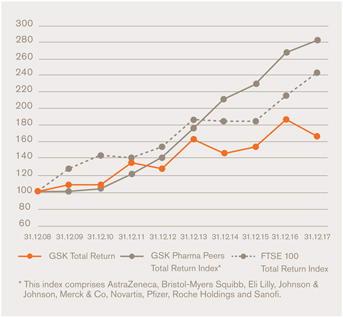
Historic CEO remuneration
| | | | | | | | | | | | | | | | | | |
| | | 2017 | | 2016 | | 2015 | | 2014 | | 2013 | | 2012 | | 2011 | | 2010 | | 2009 |
| | | £000 | | £000 | | £000 | | £000 | | £000 | | £000 | | £000 | | £000 | | £000 |
Single figure of
remuneration | | 4,883 | | 6,830 | | 6,661 | | 3,902 | | 7,207 | | 4,386 | | 6,807 | | 4,562 | | 5,790 |
Annual bonus
award(1)
(% of maximum) | | 77% | | 97% | | 100% | | 42% | | 88% | | 44% | | 100% | | 59% | | 100% |
Vesting of LTI
awards
(% of maximum) | | 69% | | 33% | | 38% | | 14% | | 31% | | 24% | | 70% | | 35% | | 35% |
| (1) | 2009 and 2010 bonus includes amounts paid under the Operational Efficiency Bonus in place for those years. The overall maximum bonus receivable was still subject to a limit of 200% of base salary. |
Percentage change in remuneration of CEO
| | | | | | | | | | |
| | | | | | | | | | | UK |
| | | | | | | GSK CEO | | | | Employees |
| | | 2017 | | 2016 | | | | | | |
| | | £000 | | £000 | | % change | | | | % change |
| CEO | | Emma Walmsley | | Sir Andrew Witty | | | | | | |
| Salary | | 1,003 | | 1,115 | | (10)% | | | | 2.5% |
| Benefits | | 266 | | 124 | | 114% | | | | 0% |
| Annual bonus | | 1,540 | | 2,167 | | (29)% | | | | (4)% |
For the wider UK employee population, the salary increase includes the annual salary review as well as any additional changes in the year, e.g. on promotion. UK employee benefits are unchanged on the previous year as there have been no changes to our benefit policies or levels. It does not reflect any changes to the level of benefits an individual may have received as a result of a change in role, e.g. promotion. The UK population was considered to be the most relevant comparison as it most closely reflects the economic environment encountered by the CEO.
CEO ratio
The Committee intends to disclose pay ratios between GSK’s CEO and the average of its UK employees in the Annual Report once the methodology for calculating the ratio is finalised by legislation.
| | | | |
| 125 | | |
| | | | | |
| GSK Annual Report 2017 | | Strategic report | | |
| | Governance and remuneration | | |
| | Financial statements | | |
| | Investor information | | |
Additional remuneration disclosures
Relative importance of spend on pay
The table shows total employee pay and the Group’s dividends paid to shareholders.
| | | | |
| | | 2017 | | 2016 |
| | | £m | | £m |
| Total employee pay | | 9,122 | | 8,212 |
| Dividends | | 3,906 | | 4,850 |
The figures in the table above, which reflect payments made during each year and the impact of movements in exchange rates, are as set out on pages 174 and 180. However, dividends declared in respect of 2017 were £3,911 million (2016 – £3,897 million) an increase of 0.4%, excluding the special dividend of £969 million declared in 2015 and paid in 2016. The company does not expect to make any ordinary share repurchases in 2018.
Total employee pay is based on 99,349 employees, the average number of people employed during 2017 (2016 – 99,827).
Service contracts
The table below sets out the relevant dates of the Executive Directors’ service contracts, which are available for review at the company’s registered office during office hours and on gsk.com. Each Executive Director’s service contract contains a12-month notice period, as set out in our Remuneration policy.
| | | | | | |
| | | Date of contract | | Effective date | | Expiry date |
| Emma Walmsley | | 29.03.17 | | 01.04.17 | | 30.06.34 |
| Simon Dingemans | | 08.09.10 | | 04.01.11 | | 30.04.28 |
| Dr Patrick Vallance | | 19.12.16 | | 01.01.17 | | 31.03.25 |
| Dr Hal Barron | | 16.12.17 | | 01.01.18 | | 31.12.24 |
Shareholder votes on remuneration matters
The table below provides details of the shareholder votes for the most recent resolutions in respect of the Annual remuneration and Remuneration policy reports.
| | | | | | | | |
| 2017 AGM | | Total votes
cast (billion) | | Total votes
for (%) | | Total votes
against (%) | | Votes
withheld
(million) |
| Remuneration report | | 3.5 | | 96.39 | | 3.61 | | 67 |
| Remuneration policy | | 3.4 | | 95.23 | | 4.77 | | 66 |
External appointments for Executive Directors
No Executive Directors held remunerated external appointments during 2017. Dr Hal Barron was a director of Juno Therapeutics, Inc. He retained the fees he received for that role.
Payments to past Directors (audited)
None
Payments for loss of office (audited)
None.
Remuneration governance
Role of the Committee
The role of the Committee is to set the company’s remuneration policy so that GSK is able to recruit, retain and motivate its executives.
The Remuneration policy is regularly reviewed to ensure that it is consistent with the company’s scale and scope of operations, supports the business strategy and growth plans and helps drive the creation of shareholder value.
Terms of reference
The Committee’s full terms of reference are available on the company’s website. The terms of reference are reviewed at least annually and were last revised in January 2018 to reflect best practice and corporate governance developments.
Governance
The Board considers all of the members of the Committee to be independentNon-Executive Directors in accordance with the UK Corporate Governance Code.
Membership
The members of the Committee, together with their appointment dates, are set out below:
| | |
| Committee members | | Committee member since |
| Urs Rohner | | 1 January 2015 |
| Chair | | (Chair since 7 May 2015) |
| Vindi Banga | | 1 January 2016 |
| Dr Vivienne Cox | | 1 January 2017 |
| Judy Lewent | | 1 January 2013 |
Committee meetings usually include a closed session, during which only members of the Committee are present. Other individuals may also be invited to attend Committee meetings during the year. Executives and other Committee attendees are not involved in any decisions, and are not present at any discussions regarding their own remuneration.
Details of the Committee members’ skills and experience are given in their biographies under ‘Our Board’ on pages 82 to 85. See page 88 for Committee member attendance levels.
| | |
| 126 | | |
GSK Annual Report 2017 | | |
| | |
| | |
Annual report on remunerationcontinued
Remuneration governancecontinued
The Company Secretary is Secretary to the Committee and attends all meetings. Other attendees at the Committee include:
Committee attendees
Judy Lewent and Vindi Banga, as members of the Audit & Risk and Remuneration Committees, provide input on the Audit & Risk Committee’s review of the Group’s performance and oversight of any risk factors relevant to remuneration decisions.
Adviser to the Committee
The company undertook a tender process during 2017 and appointed Willis Towers Watson as independent adviser to the Committee with effect from 1 July 2017. The Committee Chairman agrees the protocols under which Willis Towers Watson provides advice and the Committee is satisfied that such advice has been objective and independent.
Willis Towers Watson is a member of the Remuneration Consultants’ Group and, as such, voluntarily operates under the code of conduct in relation to executive remuneration consulting in the UK. The code of conduct can be found at www.remunerationconsultantsgroup.com.
Deloitte provided independent commentary on matters under consideration by the Committee and updates on market practice and legislative requirements for part of 2017, prior to Willis Towers Watson’s appointment, and their fees for advice during that period were £78,330. Fees were charged on a time and materials basis. Deloitte also provided other consulting, tax and assurance services to GSK during the year. However, the Committee is satisfied that this did not compromise Deloitte’s independence.
Willis Towers Watson’s fees for advice provided during 2017 were $64,571. Willis Towers Watson provided additional market data to the Committee.
Committee evaluation
The Committee’s annual evaluation was externally facilitated by Ffion Hague of Independent Board Evaluation. It was concluded that the Committee continued to operate effectively. In terms of enhancements to the Committee’s work, it was agreed that Board members would be provided with more detailed updates on matters being considered by the Committee.
What the Committee did during 2017
| | | | |
| Areas of Committee focus | | | | Items discussed |
| | |
Remuneration policy The Committee sets the broad structure for the Remuneration policy and determines the remuneration of the Executive Directors, the Chairman and other corporate officers for Board approval. | | | | – Proposed Remuneration policy for 2017 – Engagement with shareholders – Shareholder feedback on proposed Remuneration policy |
| | |
Salary review The Committee periodically reviews and considers the remuneration environment of Executive Directors and CET, approving annual amendments as necessary. | | | | – Remuneration environment (including wider employee trends) – Executive Director and CET benchmarking, competitiveness and GSK comparator groups – Executive Director and CET salary recommendations and increases for 2018 – Setting remuneration for Dr Hal Barron |
| | |
Annual bonus The Committee is responsible for setting specific performance measures for the Annual bonus. | | | | – CEO, Executive Director and CET 2016 bonus recommendations and 2017 bonus objectives – R&D annual bonus target metric |
| | |
LTI plans The Committee is responsible for approving LTI plan rule changes, grants, assessments of performance, and the vesting of LTI awards for the Executive Directors, CET and below. | | | | – Review of Deferred Annual Bonus Plan and Performance Share Plan rules – LTI performance outcomes and vesting of LTI awards for CET and below – LTI grants for CET and below |
| | |
Governance and other areas of focus The Committee adheres to a robust remuneration governance framework, ensuring alignment between internal actions and external reporting/ compliance requirements. | | | | – Committee evaluation process – 2016 Remuneration report – Remuneration considerations for 2017 – AGM and Remuneration report feedback, the external remuneration environment and performance target disclosure for incentives plans – Chairman’s fees – 2017 Remuneration report disclosures – Remuneration Committee external adviser tender process – Gender pay group reporting |
| | | | |
| 127 | | |
| | | | | |
| GSK Annual Report 2017 | | Strategic report | | |
| | Governance and remuneration | | |
| | Financial statements | | |
| | Investor information | | |
2017Non-Executive Directors’ fees
Chairman and otherNon-Executive Directors
The company aims to provide the Chairman and otherNon-Executive Directors with fees that are competitive with those paid by other companies of equivalent size and complexity, subject to the limits contained in GSK’s Articles of Association.
Chairman’s fees
The Chairman, Philip Hampton, is paid a fee of £700,000 per annum, of which he has elected to take 25% in GSK shares. The Chairman’s fees were reviewed during the year but were not changed.
Non-Executive Directors’ fees
Non-Executive Director fees were reviewed during the year following the last increase in January 2013. It was agreed to increase the supplemental fees for the Chairs of the Remuneration and Corporate Responsibility Committees from £20,000 to £30,000 from January 2017. The Chair of the new Science Committee also receives a supplementary fee of £30,000. All other fees remain unchanged. A minimum of 25% of fees will continue to be delivered as shares or ADS deferred until theNon-Executive Director steps down from the Board.
TheNon-Executive Directors’ fees that applied during 2017 are set out in the table below:
| | |
| | | Per annum |
| Standard annual fee | | £85,000 |
| |
| Supplemental fees | | |
| Chair of the Audit & Risk Committee | | £80,000 |
| Senior Independent Director | | £30,000 |
| Scientific/Medical Experts | | |
| Chairs of the Remuneration, Corporate | | |
| Responsibility and Science Committees | | |
Non-Executive Director undertaking intercontinental
travel to meetings | | £7,500 per meeting |
The audited table below sets out the value of fees and benefits received by theNon-Executive Directors in the form of cash and shares or ADS. Further details of theNon-Executive Directors’ share allocation plan are set out on page 128.Non-Executive Directors’ fees that are paid in a currency other than GBP are converted using an average exchange rate that is reviewed from time to time.
| | | | | | | | | | | | | | | | | | | | | | | | | | | | |
| | 2017 | | | | | | | 2016(5) | |
Non-Executive Directors’ emoluments (000) (audited) | | Fixed fees | | | | | | | | | | | | | | Fixed fees | | | | | | | | |
| | Cash | | Shares/ADS | | Benefits | | | Total pay | | | | | | Cash | | Shares/ADS | | Benefits | | | Total pay | |
| Professor Sir Roy Anderson | | £92 | | £31 | | £9 | | | £132 | | | | | | £92 | | £31 | | £7 | | | £130 | |
| Vindi Banga | | – | | £123 | | £8 | | | £131 | | | | | | – | | £112 | | £8 | | | £120 | |
| Dr Vivienne Cox | | £69 | | £23 | | £14 | | | £106 | | | | | | £32 | | £11 | | £5 | | | £48 | |
| Lynn Elsenhans | | £15 | | £137 | | £70 | | | £222 | | | | | | £14 | | £128 | | £44 | | | £186 | |
| Dr Laurie Glimcher(1) | | – | | $69 | | $32 | | | $101 | | | | | | – | | – | | – | | | – | |
| Dr Jesse Goodman | | $216 | | $72 | | $140 | | | $428 | | | | | | $165 | | $55 | | $187 | | | $407 | |
| Philip Hampton | | £525 | | £175 | | £20 | | | £720 | | | | | | £525 | | £175 | | £13 | | | £713 | |
| Judy Lewent | | $239 | | $80 | | $157 | | | $476 | | | | | | $239 | | $80 | | $177 | | | $496 | |
| Urs Rohner | | £92 | | £31 | | £16 | | | £139 | | | | | | £84 | | £28 | | £21 | | | £133 | |
| | | | | | | | | |
| Former directors: | | | | | | | | | | | | | | | | | | | | | | | |
| Dr Stephanie Burns(2) | | – | | – | | – | | | – | | | | | | $51 | | $27 | | $16 | | | $94 | |
| Stacey Cartwright(3) | | – | | – | | £5 | | | £5 | | | | | | £69 | | £23 | | £5 | | | £97 | |
| Sir Deryck Maughan(2) | | – | | – | | – | | | – | | | | | | $28 | | $55 | | $44 | | | $127 | |
| Dr Daniel Podolsky(2) | | – | | – | | – | | | – | | | | | | $56 | | $50 | | $63 | | | $169 | |
| Jing Ulrich(4) | | – | | – | | – | | | – | | | | | | – | | – | | £3 | | | £3 | |
| Hans Wijers(2) | | – | | – | | £6 | | | £6 | | | | | | £32 | | £5 | | £7 | | | £44 | |
| (1) | Dr Laurie Glimcher was appointed to the Board with effect from 1 September 2017. |
| (2) | Dr Stephanie Burns, Sir Deryck Maughan, Dr Daniel Podolsky and Hans Wijers all retired from the Board on 5 May 2016. |
| (3) | Stacey Cartwright retired from the Board on 31 December 2016. |
| (4) | Jing Ulrich retired from the Board on 7 May 2015. |
| (5) | The 2016 figures have been restated to remove the tax gross up on the flights of NonUK-Domiciled Directors for travel to UK Board meetings, reflecting the fact that tax was not due on those flights in the 2016/17 income tax year. At the time of publishing the 2016 Annual Report, it was believed that income tax would be due. |
| | |
| 128 | | |
GSK Annual Report 2017 | | |
| | |
| | |
Annual report on remunerationcontinued
Directors’ interests in shares (audited)
The interests of the Directors of the company in office during 2017 and their persons closely associated (PCA) are shown in the tables below.
| | | | | | | | | | | | | | | | | | | | | | | | | | | | | | | | | | | | | | | | |
| | | | | | | | | | | | | | Total share plan interests as at 31 December 2017 or date of retirement | |
| | | Total directors’ interests as at | | | | | | | | Shares/ADS | | | | | | | | | | | | | | Options | |
| | | 2 March
2018 | | | 31 December 2017 or date of retirement | | | 1 January 2017 | | | | | (a)Unvested and
not subject to
performance | | | Unvested and
subject to
performance | | | | | (a)Unvested and
not subject to
performance | | | Unvested and
subject to
performance | | | Vested but not exercised | | | Exercised in the year | |
| | | | | | | | | | | |
Executive Directors | | | | | | | | | | | | | | | | | | | | | | | | | | | | | | | | | | | | | | | | |
| | | | | | | | | | | |
Shares | | | | | | | | | | | | | | | | | | | | | | | | | | | | | | | | | | | | | | | | |
| Emma Walmsley (a,b,c,d,h) | | 280,742 | | | 147,665 | | | 110,588 | | | | | – | | | 782,759 | | | | | 75,959 | | | 75,959 | | | 137,040 | | | 19,814 | |
| Sir Andrew Witty (a,b,c,f,h) | | | | | 1,090,556 | | | 1,034,521 | | | | | 90,802 | | | 1,007,883 | | | | | 111,859 | | | 76,618 | | | – | | | 90,907 | |
| Simon Dingemans (a,b,c,d,f,h) | | 525,870 | | | 329,298 | | | 263,245 | | | | | – | | | 658,209 | | | | | 88,297 | | | 87,575 | | | – | | | 30,169 | |
| Dr Patrick Vallance (a,b,c,d,f,h) | | 413,952 | | | 303,733 | | | 299,677 | | | | | – | | | 756,538 | | | | | 75,980 | | | 75,092 | | | – | | | 35,817 | |
| Dr Moncef Slaoui | | | | | 28,475 | | | 28,473 | | | | | – | | | – | | | | | – | | | – | | | – | | | – | |
| | | | | | | | | | | |
ADS | | | | | | | | | | | | | | | | | | | | | | | | | | | | | | | | | | | | | | | | |
| Dr Hal Barron(i) | | 1,644 | | | | | | | | | | | | | | | | | | | | | | | | | | | | | |
| Dr Moncef Slaoui (a,c,e,g,h) | | | | | 234,548 | | | 295,974 | | | | | 118,567 | | | 356,422 | | | | | – | | | – | | | 3,300 | | | – | |
| | | | | | | | | | | | | | Share allocation plan forNon-Executive Directors | |
| | | Total directors’ interests as at | | | | | Number of shares or ADS | |
| | | 2 March
2018 | | | 31 December
2017 or date of
retirement | | | 1 January
2017 or date of
appointment | | | | | Dividends
reinvested
after year end | | | 31 December
2017 | | | | | Paid out | | | Dividends
reinvested
during the
year | | | Allocated & elected | | | 31 December
2016 | |
| | | | | | | | | | | |
| Non-Executive Directors | | | | | | | | | | | | | | | | | | | | | | | | | | | | | | | | | | | | | | | | |
| Shares (j) | | | | | | | | | | | | | | | | | | | | | | | | | | | | | | | |
| Professor Sir Roy Anderson | | 31,654 | | | 29,306 | | | 25,499 | | | | | 1,785 | | | 29,306 | | | | | – | | | 1,850 | | | 1,957 | | | 25,499 | |
| Vindi Banga | | 53,831 | | | 50,802 | | | 42,705 | | | | | 779 | | | 15,602 | | | | | – | | | 271 | | | 7,826 | | | 7,505 | |
| Dr Vivienne Cox | | 2,295 | | | 1,804 | | | 323 | | | | | 75 | | | 1,804 | | | | | – | | | 4 | | | 1,477 | | | 323 | |
| Philip Hampton | | 42,452 | | | 37,398 | | | 25,279 | | | | | 1,631 | | | 30,480 | | | | | – | | | 924 | | | 11,195 | | | 18,361 | |
| Urs Rohner | | 6,455 | | | 5,592 | | | 3,488 | | | | | 301 | | | 5,591 | | | | | – | | | 187 | | | 1,916 | | | 3,488 | |
| Stacey Cartwright | | | | | – | | | – | | | | | – | | | – | | | | | 9,510 | | | – | | | – | | | 9,510 | |
| | | | | | | | | | | |
| ADS (j) | | | | | | | | | | | | | | | | | | | | | | | | | | | | | | | |
| Lynn Elsenhans | | 27,273 | | | 24,399 | | | 18,205 | | | | | 1,224 | | | 23,398 | | | | | – | | | 1,177 | | | 5,016 | | | 17,205 | |
| Dr Laurie Glimcher | | 1,873 | | | 350 | | | – | | | | | 5 | | | 350 | | | | | – | | | – | | | 350 | | | – | |
| Dr Jesse Goodman | | 3,236 | | | 2,610 | | | – | | | | | 89 | | | 2,610 | | | | | – | | | – | | | 2,610 | | | – | |
| Judy Lewent | | 22,828 | | | 21,630 | | | 19,052 | | | | | 609 | | | 11,463 | | | | | – | | | 626 | | | 1,951 | | | 8,886 | |
| Dr Daniel Podolsky | | | | | | | | | | | | | – | | | – | | | | | 42,020 | | | 3,047 | | | – | | | 38,973 | |
| a) | Unvested options not subject to performance of 75,959 for Emma Walmsley represent bonus deferrals. |
Unvested shares not subject to performance of 90,802 for Sir Andrew Witty represent 25% of the shares awarded at the end of the three-year performance periods for the 2013 and 2014 PSP grants, together with subsequentre-invested dividends. These shares are subject to furthertwo-year holding periods. Sir Andrew’s unvested options not subject to performance of 111,859 represent bonus deferrals of 110,971 and Share Save options of 888.
Unvested options not subject to performance of 88,297 for Simon Dingemans represent bonus deferrals of 87,575 and Share Save options of 722.
Unvested options not subject to performance of 75,980 for Dr Patrick Vallance represent bonus deferrals of 75,092 and Share Save options of 888.
Unvested ADS not subject to performance of 118,567 for Dr Moncef Slaoui represent bonus deferrals of 46,425, deferrals under the PSP plan of 67,302 and Share Value Plan awards for his PCA of 4,830.
| b) | Total Directors’ interests includes shares purchased through the GlaxoSmithKline Share Reward Plan. During 2017, Emma Walmsley, Simon Dingemans and Dr Patrick Vallance were each awarded 97 shares under the plan. The total number of shares held within the plan are as follows: |
| | | | | | | | |
| Share Reward Plan (Shares) | | 2 March 2018 | | | | 31 December 2017 | | 1 January 2017 |
| Emma Walmsley | | 1,274 | | | | 1,219 | | 972 |
| Sir Andrew Witty | | – | | | | – | | 3,541 |
| Simon Dingemans | | 1,703 | | | | 1,642 | | 1,375 |
| Dr Patrick Vallance | | 3,348 | | | | 3,263 | | 2,917 |
Dr Hal Barron is not and Dr Moncef Slaoui was not eligible to participate in the Share Reward Plan, as this is only open to UK employees.
| | | | |
| GSK Annual Report 2017 | | Strategic report | | |
| | Governance and remuneration | | |
| | Financial statements | | |
| | Investor information | | |
Directors’ interests in shares (audited)continued
| c) | Total directors’ interests includes options over shares or ADS resulting from the deferral of bonus (and the subsequentre-investment of dividends) under the DABP. The totals shown in the table below include bonus deferrals, but exclude any unvested matching awards which are subject to ongoing performance criteria. The amounts represent the gross share and ADS balances prior to the sale of any shares or ADS to satisfy tax liabilities. |
| | | | | | | | | | | | | | |
Deferred Annual Bonus Plan (Bonus deferrals) | | | | | | | 2 March 2018 | | | 31 December 2017 or date of retirement | | | 1 January 2017 | |
| Emma Walmsley | | Shares | | | 123,451 | | | 75,959 | | 55,377 | |
| Sir Andrew Witty | | Shares | | | | | | 110,971 | | 142,752 | |
| Simon Dingemans | | Shares | | | 113,066 | | | 87,575 | | 76,811 | |
| Dr Patrick Vallance | | Shares | | | 98,955 | | | 75,092 | | 76,601 | |
| Dr Moncef Slaoui | | ADS | | | | | | 46,425 | | 56,646 | |
| d) | Total directors’ interests at 2 March 2018 includes any shares or ADS which vested due to performance being met under elements of the DABP and PSP (2015-2017 awards), less those sold to satisfy tax liabilities on the vested amounts (see pages 132 to 137 for further details). |
| e) | For Dr Moncef Slaoui, total directors’ interests includes ADS purchased within the 401(k) Plan and the US Executive Supplemental Savings Plan (ESSP), and ADS awarded to Dr Slaoui’s PCA under the Share Value Plan (SVP). The relevant balances are as follows: |
| | | | | | | | | | | | |
Dr Moncef Slaoui (ADS) | | | | | 2 March 2018 | | | 31 March 2017 | | | 1 January 2017 | |
| US Retirement Savings Plans | | | | | | | 18,268 | | 16,452 | |
| Share Value Plan | | | | | | | 4,830 | | 7,130 | |
As an Executive Director, Dr Slaoui was not eligible to receive awards under the SVP. The SVP awards shown above reflect the holdings of Dr Slaoui’s PCA, who is also an employee of GSK. The awards are subject to three-year vesting periods and vesting is contingent on continued employment within GSK. Any gains which arose on vesting are not included in Dr Slaoui’s total remuneration figures. Dr Slaoui’s total share plan interests also include PSP awards held by his PCA. These awards are subject to performance criteria relevant to employees below the CET.
For Sir Andrew Witty, Simon Dingemans and Dr Patrick Vallance, the unvested options not subject to performance include holdings of 888,722 and 888 respectively in the Share Save Plan, in which Sir Andrew participated and Simon and Patrick participate on the same terms as all other employees. Simon Dingemans was granted 248 options under the plan on 30 November 2017.
| g) | The ADS vested but unexercised options totalling 3,300 for Dr Moncef Slaoui represent the ADS options held by his PCA. |
| | |
| 130 | | |
GSK Annual Report 2017 | | |
| | |
| | |
Annual report on remunerationcontinued
Directors’ interests in shares (audited)continued
| h) | The following table sets out details of options (includingnil-cost options under the DABP) exercised during 2017 by Executive Directors. Dr Moncef Slaoui did not exercise any options during the year. |
| | | | | | | | | | | | |
| Type of award | | Date of grant | | Number of shares under option | | Date of exercise | | Grant price | | Market price at exercise | | Gain on exercise (000) |
| Emma Walmsley | | | | | | | | | | | | |
DABP – deferral | | 12.02.14 | | 14,860 | | 16.02.17 | | – | | £16.35 | | £243 |
DABP – matching | | 12.02.14 | | 4,954 | | 16.02.17 | | – | | £16.35 | | £81 |
| | | | | 19,814 | | | | | | | | £324 |
| | | | | | |
| Sir Andrew Witty | | | | | | | | | | | | |
Share Save | | 29.10.15 | | 419 | | 05.05.17 | | £10.13 | | £15.88 | | £2 |
DABP – deferral | | 12.02.14 | | 67,867 | | 16.02.17 | | – | | £16.34 | | £1,109 |
DABP – matching | | 12.02.14 | | 22,621 | | 16.02.17 | | – | | £16.34 | | £370 |
| | | | | 90,907 | | | | | | | | £1,481 |
| | | | | | |
| Simon Dingemans | | | | | | | | | | | | |
Share Save | | 29.10.14 | | 238 | | 01.12.17 | | £11.31 | | £12.90 | | – |
DABP – deferral | | 12.02.14 | | 22,448 | | 16.02.17 | | – | | £16.39 | | £368 |
DABP – matching | | 12.02.14 | | 7,483 | | 16.02.17 | | – | | £16.39 | | £123 |
| | | | | 30,169 | | | | | | | | £491 |
| | | | | | |
| Dr Patrick Vallance | | | | | | | | | | | | |
DABP – deferral | | 12.02.14 | | 26,863 | | 16.02.17 | | – | | £16.36 | | £440 |
DABP – matching | | 12.02.14 | | 8,954 | | 16.02.17 | | – | | £16.36 | | £146 |
| | | | | 35,817 | | | | | | | | £586 |
In respect of options under the Share Save Plan, the remuneration receivable by an Executive Director is calculated on the date that the options first vest. The remuneration is the difference between the amount the Executive Director is required to pay to buy the shares and the total value of the shares on the vesting date. If the Executive Director chooses not to exercise the options on the vesting date, any subsequent increase or decrease in the amount realised will be due to movements in the share price between the vesting date and the date of exercise. This increase or decrease in value is the result of an investment decision by the Executive Director and, as such, is not recorded as remuneration.
In respect ofnil-cost options under the DABP, the bonus which is deferred by the Director is recorded as remuneration (under Annual bonus) for the year to which it relates. The gain recorded on exercise of thenil-cost option comprises this remuneration, the total of the amounts received inre-invested dividends prior to vesting and the gains or losses resulting from movements in the share price between the dates of grant and exercise for the initial bonus amount deferred and the dates of dividend reinvestment and exercise for there-invested dividends.
For the matching element of the DABP, the remuneration of the Executive Director is recorded in the year that the performance period ends and represents the number of vested shares multiplied by the price at vesting. The gain recorded on exercise of thenil-cost option comprises the total of this remuneration and the gain or loss resulting from the movement in the share price between vesting and exercise.
For Emma Walmsley:
| | – | The gain of £242,961 recorded following the exercise of the 14,860nil-cost options relating to the deferral of bonus earned in respect of 2013 comprises remuneration of £205,315 recorded in 2013 as Annual bonus and a net gain of £37,646 relating to there-investment of dividends prior to vesting and movements in the share price between grant and dividendre-investment dates and the exercise date. |
| | – | The gain of £80,998 recorded following the exercise of the 4,954nil-cost options relating to the DABP matching award comprises remuneration of £79,016 recorded in 2016 in relation to the DABP (see page 132) and an investment gain of £1,982 relating to the movement in the share price between the vesting and exercise dates. |
For Sir Andrew Witty:
| | – | A gain of £2,409 resulted from the exercise of 419 options granted under the Share Save Plan. The number of shares was reduced from 888 to 419 as Sir Andrew retired on 31 March 2017, part of the way through the Share Save contract. |
| | – | The gain of £1,108,947 recorded following the exercise of the 67,867nil-cost options relating to the deferral of bonus earned in respect of 2013 comprises remuneration of £937,500 recorded in 2013 as Annual bonus and a net gain of £171,447 relating to there-investment of dividends prior to vesting and movements in the share price between grant and dividendre-investment dates and the exercise date. |
| | – | The gain of £369,521 recorded following the exercise of the 22,621nil-cost options relating to the DABP matching award comprises remuneration of £360,805 recorded in 2016 in relation to the DABP (see page 132) and an investment gain of £8,716 relating to the movement in the share price between the vesting and exercise dates. |
| | | | |
| GSK Annual Report 2017 | | Strategic report | | |
| | Governance and remuneration | | |
| | Financial statements | | |
| | Investor information | | |
Directors’ interests in shares (audited)continued
For Simon Dingemans:
| | – | A gain of £378 resulted from the exercise of 216 options granted under the Share Save Plan. |
| | – | The gain of £367,923 recorded following the exercise of the 22,448nil-cost options relating to the deferral of bonus earned in respect of 2013 comprises remuneration of £310,139 recorded in 2013 as Annual bonus and a net gain of £57,784 relating to there-investment of dividends prior to vesting and movements in the share price between grant and dividendre-investment dates and the exercise date. |
| | – | The gain of £122,646 recorded following the exercise of the 7,483nil-cost options relating to the DABP matching award comprises remuneration of £119,354 recorded in 2016 in relation to the DABP (see page 133) and an investment gain of £3,292 relating to the movement in the share price between the vesting and exercise dates. |
For Dr Patrick Vallance:
| | – | The gain of £439,479 recorded following the exercise of the 26,863nil-cost options relating to the deferral of bonus earned in respect of 2013 comprises remuneration of £371,130 recorded in 2013 as Annual bonus and a net gain of £68,349 relating to there-investment of dividends prior to vesting and movements in the share price between grant and dividendre-investment dates and the exercise date. |
| | – | The gain of £146,461 recorded following the exercise of the 8,954nil-cost options relating to the DABP matching award comprises remuneration of £142,816 recorded in 2016 in relation to the DABP (see page 133) and an investment gain of £3,645 relating to the movement in the share price between the vesting and exercise dates. |
| i) | Dr Hal Barron was appointed to the Board from 1 January 2018. |
| j) | ForNon-Executive Directors, total interests include shares or ADS received as part or all of their fees under theNon-Executive Directors’ Share Allocation Plan. Note that dividends received on shares or ADS under the plan during 2017 and January 2018 were converted into shares or ADS as at 7 February 2018. |
| | |
| 132 | | |
GSK Annual Report 2017 | | |
| | |
| | |
Annual report on remunerationcontinued
Directors’ interests in shares (audited)continued
Deferred Annual Bonus Plan matching awards
The following tables provide details for each Executive Director in office during 2017 in respect of DABP matching awards. Market price at grant and at vesting represent the closing share prices from the business day prior to those dates.
| | | | | | | | | | | | | | | | |
Emma Walmsley – Shares | | | | | | | | Performance period | |
| | 2014-2016 | | | 2015-2017 | | | 2016-2018 | | | 2017-2019 | |
Market price at grant | | | £16.43 | | | | £15.20 | | | | £13.59 | | | | £15.77 | |
| | | | |
Unvested at 31 December 2016 | | | 14,682 | | | | 11,706 | | | | 28,989 | | | | – | |
| | | | |
Granted | | | – | | | | – | | | | – | | | | 31,945 | |
Face value at grant (000) | | | – | | | | – | | | | – | | | | £504 | |
Dividends reinvested | | | 178 | | | | 600 | | | | 1,485 | | | | 1,234 | |
| | | | |
Vested | | | (4,954 | ) | | | – | | | | – | | | | – | |
| | | | |
Lapsed | | | (9,906 | ) | | | – | | | | – | | | | – | |
Unvested at 31 December 2017 | | | – | | | | 12,306 | | | | 30,474 | | | | 33,179 | |
Dividends reinvested | | | | | | | 176 | | | | 435 | | | | 474 | |
| | | | |
Vested | | | | | | | (8,614 | ) | | | – | | | | – | |
| | | | |
Lapsed | | | | | | | (3,868 | ) | | | – | | | | – | |
Unvested at 2 March 2018 | | | | | | | – | | | | 30,909 | | | | 33,653 | |
Vested shares | | | | | | | | | | | | | | | | |
Number of shares | | | 4,954 | | | | 8,614 | | | | | | | | | |
| | | | |
Market price at vesting | | | £15.95 | | | | £13.00 | | | | | | | | | |
| | | | |
Gain: | | | (000) | | | | (000) | | | | | | | | | |
Remuneration for 2016 | | | £79 | | | | – | | | | | | | | | |
| | | | |
Remuneration for 2017 | | | – | | | | £112 | | | | | | | | | |
| | | |
Sir Andrew Witty – Shares | | | | | Performance period | | | | |
| | 2014-2016 | | | 2015-2017 | | | 2016-2018 | | | | |
Market price at grant | | | £16.43 | | | | £15.20 | | | | £13.59 | | | | | |
| | | | |
Unvested at 31 December 2016 | | | 67,052 | | | | 33,606 | | | | 42,094 | | | | | |
| | | | |
Dividends reinvested | | | 814 | | | | 1,721 | | | | 2,156 | | | | | |
| | | | |
Vested | | | (22,621 | ) | | | – | | | | – | | | | | |
| | | | |
Lapsed | | | (45,245 | ) | | | – | | | | – | | | | | |
Unvested at 31 December 2017 | | | – | | | | 35,327 | | | | 44,250 | | | | | |
Dividends reinvested | | | – | | | | 504 | | | | 632 | | | | | |
Unvested at 2 March 2018 | | | – | | | | 35,831 | | | | 44,882 | | | | | |
Vested shares | | | | | | | | | | | | | | | | |
Number of shares | | | 22,621 | | | | | | | | | | | | | |
| | | | |
Market price at vesting | | | £15.95 | | | | | | | | | | | | | |
| | | | |
Gain: | | | (000) | | | | | | | | | | | | | |
Remuneration for 2016 | | | £361 | | | | | | | | | | | | | |
| | | | |
| GSK Annual Report 2017 | | Strategic report | | |
| | Governance and remuneration | | |
| | Financial statements | | |
| | Investor information | | |
Directors’ interests in shares (audited)continued
Deferred Annual Bonus Plan matching awardscontinued
| | | | | | | | | | | | | | | | |
Simon Dingemans – Shares | | | | | | | | Performance period | |
| | 2014-2016 | | | 2015-2017 | | | 2016-2018 | | | 2017-2019 | |
Market price at grant | | | £16.43 | | | | £15.20 | | | | £13.59 | | | | £15.77 | |
| | | | |
Unvested at 31 December 2016 | | | 22,179 | | | | 16,350 | | | | 38,282 | | | | – | |
| | | | |
Granted | | | – | | | | – | | | | – | | | | 29,022 | |
Face value at grant (000) | | | – | | | | – | | | | – | | | | £458 | |
Dividends reinvested | | | 269 | | | | 838 | | | | 1,961 | | | | 1,121 | |
| | | | |
Vested | | | (7,483 | ) | | | – | | | | – | | | | – | |
| | | | |
Lapsed | | | (14,965 | ) | | | – | | | | – | | | | – | |
Unvested at 31 December 2017 | | | – | | | | 17,188 | | | | 40,243 | | | | 30,143 | |
Dividends reinvested | | | | | | | 245 | | | | 575 | | | | 430 | |
| | | | |
Vested | | | | | | | (12,030 | ) | | | – | | | | – | |
| | | | |
Lapsed | | | | | | | (5,403 | ) | | | – | | | | – | |
Unvested at 2 March 2018 | | | | | | | – | | | | 40,818 | | | | 30,573 | |
| | | | |
Vested shares | | | | | | | | | | | | | | | | |
Number of shares | | | 7,483 | | | | 12,030 | | | | | | | | | |
| | | | |
Market price at vesting | | | £15.95 | | | | £13.00 | | | | | | | | | |
| | | | |
Gain: | | | (000) | | | | (000) | | | | | | | | | |
Remuneration for 2016 | | | £119 | | | | – | | | | | | | | | |
| | | | |
Remuneration for 2017 | | | – | | | | £156 | | | | | | | | | |
| | | |
Dr Patrick Vallance – Shares | | | | | | | | Performance period | |
| | 2014-2016 | | | 2015-2017 | | | 2016-2018 | | | 2017-2019 | |
Market price at grant | | | £16.43 | | | | £15.20 | | | | £13.59 | | | | £15.77 | |
| | | | |
Unvested at 31 December 2016 | | | 26,541 | | | | 19,058 | | | | 31,002 | | | | – | |
| | | | |
Granted | | | – | | | | – | | | | – | | | | 21,632 | |
Face value at grant (000) | | | – | | | | – | | | | – | | | | £341 | |
Dividends reinvested | | | 322 | | | | 976 | | | | 1,588 | | | | 836 | |
| | | | |
Vested | | | (8,954 | ) | | | – | | | | – | | | | – | |
| | | | |
Lapsed | | | (17,909 | ) | | | – | | | | – | | | | – | |
Unvested at 31 December 2017 | | | – | | | | 20,034 | | | | 32,590 | | | | 22,468 | |
Dividends reinvested | | | | | | | 286 | | | | 465 | | | | 321 | |
| | | | |
Vested | | | | | | | (14,022 | ) | | | – | | | | – | |
| | | | |
Lapsed | | | | | | | (6,298 | ) | | | – | | | | – | |
Unvested at 2 March 2018 | | | | | | | – | | | | 33,055 | | | | 22,789 | |
| | | | |
Vested shares | | | | | | | | | | | | | | | | |
Number of shares | | | 8,954 | | | | 14,022 | | | | | | | | | |
| | | | |
Market price at vesting | | | £15.95 | | | | £13.00 | | | | | | | | | |
| | | | |
Gain: | | | (000) | | | | (000) | | | | | | | | | |
Remuneration for 2016 | | | £143 | | | | – | | | | | | | | | |
| | | | |
Remuneration for 2017 | | | – | | | | £182 | | | | | | | | | |
| | |
| 134 | | |
GSK Annual Report 2017 | | |
| | |
| | |
Annual report on remunerationcontinued
Directors’ interests in shares (audited)continued
Deferred Annual Bonus Plan matching awardscontinued
| | | | | | |
Dr Moncef Slaoui – ADS | | | | Performance period |
| | |
| | 2014-2016 | | 2015-2017 | | 2016-2018 |
| Market price at grant | | $54.17 | | $46.25 | | $39.13 |
| | | |
| Unvested at 31 December 2016 | | 21,394 | | 13,322 | | 21,930 |
| | | |
| Dividends reinvested | | 251 | | 662 | | 1,089 |
| | | |
| Vested | | (7,215) | | – | | – |
| | | |
| Lapsed | | (14,430) | | – | | – |
| Unvested at 31 December 2017 | | – | | 13,984 | | 23,019 |
| Dividends reinvested | | – | | 193 | | 318 |
| Unvested at 2 March 2018 | | – | | 14,177 | | 23,337 |
| | | |
| Vested ADS | | | | | | |
| Number of ADS | | 7,215 | | | | |
| | | |
| Market price at vesting | | $40.57 | | | | |
| | | |
| Gain: | | (000) | | | | |
| Remuneration for 2016 | | $293 | | | | |
| | | | | |
| | | | |
| GSK Annual Report 2017 | | Strategic report | | |
| | Governance and remuneration | | |
| | Financial statements | | |
| | Investor information | | |
| | | | |
Directors’ interests in shares (audited)continued
Performance Share Plan awards
The following tables provide details for each Executive Director in office during 2017 in respect of PSP awards. Market price at grant and at vesting represent the closing share prices on those dates.
| | | | | | | | | | | | | | | | | | | | | | | | |
Emma Walmsley – Shares | | | | | | | | | | | | | | Performance period | |
| | | | |
| | 2014-2016 | | | 2015-2017 | | | 2015-2017 | | | 2016-2018 | | | 2017-2019 | | | 2018-2020 | |
Market price at grant | | £16.43 | | | £15.20 | | | £14.01 | | | £13.59 | | | £15.46 | | | £12.91 | |
| | | | | | |
| Unvested at 31 December 2016 | | 121,203 | | | 124,275 | | | 64,415 | | | 212,155 | | | – | | | – | |
| | | | | | |
| Granted | | – | | | – | | | – | | | – | | | 356,939 | | | – | |
| Face value at grant (000) | | – | | | – | | | – | | | – | | | 5,518 | | | – | |
| Dividends reinvested | | 1,471 | | | 6,367 | | | 3,300 | | | 10,869 | | | 4,440 | | | – | |
| | | | | | |
| Vested | | (40,888) | | | – | | | – | | | – | | | – | | | – | |
| | | | | | |
| Lapsed | | (81,786) | | | – | | | – | | | – | | | – | | | – | |
| Unvested at 31 December 2017 | | – | | | 130,642 | | | 67,715 | | | 223,024 | | | 361,379 | | | – | |
Granted | | | | | – | | | – | | | – | | | – | | | 437,997 | |
| Face value at grant (000) | | | | | – | | | – | | | – | | | – | | | £5,655 | |
| Dividends reinvested | | | | | 1,865 | | | 967 | | | 3,185 | | | 5,160 | | | – | |
| | | | | | |
Vested | | | | | | | (91,430 | ) | | | (47,391) | | | | – | | | | – | | | | – | |
| | | | | | |
Lapsed | | | | | | | (41,077 | ) | | | (21,291) | | | | – | | | | – | | | | – | |
| Unvested at 2 March 2018 | | | | | – | | | – | | | 226,209 | | | 366,539 | | | 437,997 | |
| | | | | | |
| Vested shares: | | | | | | | | | | | | | | | | | | |
| | | | | | | | | | | | | | |
Number of shares | | 40,888 | | | 91,430 | | | 47,391 | | | | | | | | | | |
| | | | | | |
| Market price at vesting | | £16.17 | | | £13.00 | | | £13.00 | | | Total | | | | | | | |
| | | | | | |
| Gain: | | (000) | | | (000) | | | (000) | | | (000) | | | | | | | |
| | | | | | | | | | | | |
| Remuneration for 2016 | | £661 | | | – | | | – | | | £661 | | | | | | | |
| | | | | | |
| Remuneration for 2017 | | – | | | £1,189 | | | £616 | | | £1,805 | | | | | | | |
| | | | | | | | | | |
| | | | | |
Sir Andrew Witty – Shares | | | | | Performance period | | | | | | | | | | |
| | | | | | | | | | | | | | | | |
| | 2014-2016 | | | 2015-2017 | | | 2016-2018 | | | | | | | | | | |
| | | | | | | | | | | | | | |
Market price at grant | | £16.43 | | | £15.20 | | | £13.59 | | | | | | | | | | |
| | | | | | |
| Unvested at 31 December 2016 | | 466,222 | | | 478,034 | | | 517,767 | | | | | | | | | | |
| | | | | | |
| Dividends reinvested | | 5,656 | | | 24,492 | | | 26,527 | | | | | | | | | | |
| | | | | | |
| Vested | | (157,279) | | | – | | | – | | | | | | | | | | |
| | | | | | |
| Lapsed | | (314,599) | | | – | | | – | | | | | | | | | | |
| | | | | | | | | | | | | | |
| Unvested at 31 December 2017 | | – | | | 502,526 | | | 544,294 | | | | | | | | | | |
| | | | | | | | | | | | | | |
Dividends reinvested | | | | | 7,175 | | | 7,772 | | | | | | | | | | |
| | | | | | | | | | | | | | |
| Unvested at 2 March 2018 | | | | | 509,701 | | | 552,066 | | | | | | | | | | |
| | | | | | | | | | | | | | |
| | | | | | |
| Vested shares: | | | | | | | | | | | | | | | | | | |
| | | | | | | | | | | | | | | | | | | | | | |
| Number of shares | | 157,279 | | | | | | | | | | | | | | | | |
| | | | | | |
| Market price at vesting | | £16.17 | | | | | | | | | | | | | | | | |
| | | | | | |
| Gain: | | (000) | | | | | | | | | | | | | | | | |
| Remuneration for 2016 | | £2,543 | | | | | | | | | | | | | | | | |
| | | | | | | | | | | | | | | | | | | | | | |
| | |
| 136 | | |
GSK Annual Report 2017 | | |
| | |
| | |
Annual report on remunerationcontinued
Directors’ interests in shares (audited)continued
Performance Share Plan awardscontinued
| | | | | | | | | | |
Simon Dingemans – Shares | | | | | | Performance period |
| | 2014-2016 | | 2015-2017 | | 2016-2018 | | 2017-2019 | | 2018-2020 |
| Market price at grant | | £16.43 | | £15.20 | | £13.59 | | £15.46 | | £12.91 |
Unvested at 31 December 2016 | | 205,161 | | 210,358 | | 227,827 | | – | | – |
Granted | | – | | – | | – | | 195,147 | | – |
Face value at grant (000) | | – | | – | | – | | £3,017 | | – |
Dividends reinvested | | 2,489 | | 10,778 | | 11,672 | | 2,427 | | – |
Vested | | (69,210) | | – | | – | | – | | – |
Lapsed | | (138,440) | | – | | – | | – | | – |
| Unvested at 31 December 2017 | | – | | 221,136 | | 239,499 | | 197,574 | | – |
| Granted | | | | – | | – | | – | | 239,442 |
Face value at grant (000) | | | | – | | – | | – | | £3,091 |
Dividends reinvested | | | | 3,158 | | 3,420 | | 2,821 | | – |
Vested | | | | (154,763) | | – | | – | | – |
Lapsed | | | | (69,531) | | – | | – | | – |
| Unvested at 2 March 2018 | | | | – | | 242,919 | | 200,395 | | 239,442 |
Vested shares: | | | | | | | | | | |
Number of shares | | 69,210 | | 154,763 | | | | | | |
Market price at vesting | | £16.17 | | £13.00 | | | | | | |
Gain: | | (000) | | (000) | | | | | | |
Remuneration for 2016 | | £1,119 | | – | | | | | | |
Remuneration for 2017 | | – | | £2,012 | | | | | | |
| | |
Dr Patrick Vallance – Shares | | Performance period | | |
| | 2014-2016 | | 2015-2017 | | 2016-2018 | | 2017-2019 | | |
| Market price at grant | | £16.53 | | £15.20 | | £13.59 | | £15.46 | | |
Unvested at 31 December 2016 | | 208,105 | | 213,377 | | 263,258 | | – | | |
Granted | | – | | – | | – | | 252,345 | | |
Face value at grant (000) | | – | | – | | – | | £3,901 | | |
Dividends reinvested | | 2,525 | | 10,932 | | 13,488 | | 3,139 | | |
Vested | | (70,203) | | – | | – | | – | | |
Lapsed | | (140,427) | | – | | – | | – | | |
| Unvested at 31 December 2017 | | – | | 224,309 | | 276,746 | | 255,484 | | |
| Dividends reinvested | | | | 3,203 | | 3,952 | | 3,648 | | |
Vested | | | | (156,984) | | – | | – | | |
Lapsed | | | | (70,528) | | – | | – | | |
| Unvested at 2 March 2018 | | | | – | | 280,698 | | 259,132 | | |
| | | | | |
Vested shares: | | | | | | | | | | |
Number of shares | | 70,203 | | 156,984 | | | | | | |
Market price at vesting | | £16.17 | | £13.00 | | | | | | |
| | | | | |
Gain: | | (000) | | (000) | | | | | | |
Remuneration for 2016 | | £1,135 | | – | | | | | | |
Remuneration for 2017 | | – | | £2,041 | | | | | | |
| | | | |
| GSK Annual Report 2017 | | Strategic report | | |
| | Governance and remuneration | | |
| | Financial statements | | |
| | Investor information | | |
Directors’ interests in shares (audited)continued
Performance Share Plan awardscontinued
| | | | | | |
Dr Moncef Slaoui – ADS | | Performance period |
| | 2014-2016 | | 2015-2017 | | 2016-2018 |
| Market price at grant | | $54.17 | | $46.25 | | $39.13 |
Unvested at 31 December 2016 | | 131,350 | | 145,747 | | 166,901 |
Dividends reinvested | | 1,539 | | 7,239 | | 8,290 |
Vested | | (44,292) | | – | | – |
Lapsed | | (88,597) | | – | | – |
| Unvested at 31 December 2017 | | – | | 152,986 | | 175,191 |
| Dividends reinvested | | – | | 2,115 | | 2,421 |
| Unvested at 2 March 2018 | | – | | 155,101 | | 177,612 |
Vested ADS | | | | | | |
| Number of ADS | | 44,292 | | | | |
Market price at vesting | | $40.92 | | | | |
Gain: | | (000) | | | | |
Remuneration for 2016 | | $1,812 | | | | |
Remuneration for 2017 | | – | | | | |
Dr Hal Barron was appointed to the Board from 1 January 2018. The following table provides details of PSP awards granted to him on 14 February 2018:
| | |
Dr Hal Barron – Granted ADS | | Performance period |
| | 2018-2020 |
Number of ADS | | 233,132 |
Market price at grant | | $36.46 |
Face value at grant (000) | | $8,500 |
Unvested at 2 March 2018 | | 233,132 |
| | |
| 138 | | |
GSK Annual Report 2017 | | |
| | |
| | |
Annual report on remunerationcontinued
Directors and Senior Management
Further information is provided on compensation and interests of Directors and Senior Management as a group (‘the group’). For this purpose, the group is defined as theNon-Executive and Executive Directors, other members of the CET and the Company Secretary. For the financial year 2017, the following table sets out aggregate remuneration for the group for the periods during which they served in that capacity.
| | |
Remuneration for 2017 | | (£) |
| |
| Total compensation paid | | 26,230,342 |
| |
| Aggregate increase in accrued pension benefits (net of inflation) | | 1,048,611 |
| |
| Aggregate payments to defined contribution schemes | | 397,722 |
During 2017, members of the group (and one PCA who is also an employee of GSK) were awarded shares and ADS under the company’s various executive share plans, as set out in the table below.
| | | | | | | | | | |
| | | Awards | | | | Dividend reinvestment awards |
Awarded during 2017 | | Shares | | ADS | | | | Shares | | ADS |
Deferred Annual Bonus Plan | | 206,177 | | 21,220 | | | | 25,978 | | 2,675 |
Performance Share Plan | | 1,322,859 | | 225,442 | | | | 179,820 | | 24,792 |
Deferred Investment Awards(a)(b) | | – | | – | | | | 5,674 | | 1,306 |
| | | | | |
| Share Value Plan(b) | | 11,060 | | – | | | | – | | – |
At 2 March 2018, the group and their PCAs had the following interests in shares and ADS of the company. Interests awarded under the
various executive share plans are described in Note 43 to the financial statements, ‘Employee share schemes’ on page 225. |
Interests at 2 March 2018 | | Shares | | ADS | | | | | | |
Owned | | 1,396,375 | | 273,511 | | | | | | |
Unexercised options | | 164,680 | | 12,270 | | | | | | |
Deferred Annual Bonus Plan | | 978,751 | | 93,450 | | | | | | |
Performance Share Plan | | 4,772,105 | | 816,020 | | | | | | |
Deferred Investment Awards(a)(b) | | 143,018 | | 6,322 | | | | | | |
Share Value Plan(b) | | 30,699 | | 20,206 | | | | | | |
| (a) | Notional shares and ADS. |
| (b) | Executive Directors are not eligible to receive Deferred Investment Awards or participate in the Share Value Plan. |
| | | | |
| 139 | | |
| | | | | |
| GSK Annual Report 2017 | | Strategic report | | |
| | Governance and remuneration | | |
| | Financial statements | | |
| | Investor information | | |
Other share plans and dilution limits
All-employee share plans
The Executive Directors participate in variousall-employee share plans, including Share Save and Share Reward, HM Revenue & Customs approved plans.
Participants of the Share Save Plan may save up to £250 a month from their net salaries for a fixed term of three years and at the end of the savings period they have the option to buy GSK shares at a discount of up to 20% of the market price set at the launch of each savings contract.
Participants of the Share Reward Plan contribute up to £125 a month from their gross salaries to purchase GSK shares and the company matches the number of GSK shares bought each month.
| | | | |
| | | Monthly saving |
| | | Share Save (£) | | Share Reward (£) |
Emma Walmsley | | – | | 125 |
Simon Dingemans | | 225 | | 125 |
Dr Patrick Vallance | | 250 | | 125 |
Dilution limits
All awards are made under plans which incorporate dilution limits consistent with the guidelines published by the Investment Association. These limits are 10% in any rollingten-year period for all plans and 5% in any rollingten-year period for executive share plans. Estimated dilution from existing awards made over the last ten years up to 31 December 2017 is as follows:
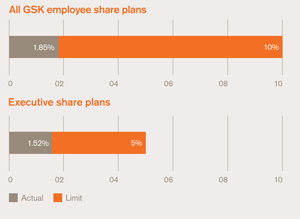
| | |
| 140 | | |
GSK Annual Report 2017 | | |
| | |
| | |
Annual report on remunerationcontinued
Implementation of Remuneration policy for 2018
Salary
The Committee determined the following salary increases taking into account the average increase for the wider workforce:
| | | | |
| | | 2018 | | % change |
| Wider workforce (1) | | – | | 2.5 |
| Emma Walmsley | | £1,028,100 | | 2.5 |
| Simon Dingemans | | £772,800 | | 2.5 |
| Dr Patrick Vallance | | £780,000 | | 0 |
| Dr Hal Barron | | $1,700,000 | | N/A |
| (1) | Based on the average increased budget for employees below the level of CET in the UK. |
Benefits
No significant changes to the provision of benefits are proposed for 2018. For full details of the policy in relation to benefits, please refer to the details in the Investors section 2017 Remuneration policy report on pages 137 to 146 of the 2016 Annual Report, available at www.gsk.com.
Pension
The table below provides an overview of the pension arrangements for each ongoing Executive Director in 2018. Details of Dr Hal Barron’s pension arrangements are set out on page 141.
| | |
| | | Pension contribution |
| Emma Walmsley (1) | | 20% of base salary and matching contributions |
| Simon Dingemans | | 20% of base salary in lieu of pension |
| (1) | As a member of the defined contribution plan, is eligible to receive matching contributions of up to 5% on the first £33,333 of her salary in accordance with the terms of the plan (i.e. £1,667). |
Annual bonus
No significant changes to the operation of the Annual Bonus plan, in accordance with the shareholder approved 2017 Remuneration policy, are proposed for 2018.
| | | | |
| | | Target | | Maximum |
| | |
| Emma Walmsley | | | | |
| | |
| Simon Dingemans | | 100% | | 200% |
| | |
| Dr Hal Barron | | | | |
The financial measure is Adjusted Group PBIT (previously Core Group PBIT). Inevitably, targets linked directly to the financial and strategic plan are commercially sensitive. The Committee does not consider it appropriate to disclose annual bonus targets during the year as it may result in competitive harm. However, details of the performance targets will be disclosed on a retrospective basis in the 2018 Annual Report.
Long Term Incentive plans
Deferred Annual Bonus Plan (DABP) awards
The table below provides details of the mandatory deferral in the DABP in respect of 2017 Annual bonus payments and associated awards granted.
| | | | |
| | | % of total bonus
deferred into shares | | 2018 DABP award
(number shares) |
| Emma Walmsley | | 50 | | 58,889 |
| Simon Dingemans | | 50 | | 41,674 |
| Dr Patrick Vallance | | 50 | | 43,111 |
Performance Share Plan (PSP) awards
The table below provides details of awards granted under the PSP:
| | | | |
| | | 2018 PSP award (% of salary) | | 2018 PSP award
(number shares) |
| Emma Walmsley | | 550 | | 437,997 |
| Simon Dingemans | | 400 | | 239,442 |
| Dr Hal Barron (1) | | 500 | | 233,132 |
Performance measures
The metrics for the PSP awards remain unchanged. The 2018 awards will continue to be based on three equally weighted measures:
| – | | R&D new product performance; |
| – | | adjusted free cash flow; and |
TSR will continue to be measured against global pharmaceutical peers. As in prior years, targets for R&D new products are commercially sensitive at the time of grant. However, the Committee intends to disclose targets in full following the end of the performance period.
In addition, the Committee will continue to provide shareholders with interim performance updates for this element over the course of the performance period.
The adjusted free cash flow targets will be disclosed to shareholders on a prospective basis at the time of grant, and will thereafter be reported in the 2018 Annual Report on remuneration.
| | | | |
| GSK Annual Report 2017 | | Strategic report | | |
| | Governance and remuneration | | |
| | Financial statements | | |
| | Investor information | | |
| | | | |
Implementation of Remuneration policy for 2018continued
Termination arrangements for Dr Patrick Vallance
As announced in 2017, Dr Patrick Vallance will leave the Board on 31 March 2018.
As Dr Vallance is a voluntary leaver, he will not receive any severance payment when he leaves the company. Salary, bonus and outstanding incentive awards will be treated in accordance with the shareholder approved 2017 Remuneration policy.
Full disclosure of all payments made upon cessation will be included in the 2018 Annual report on remuneration.
| | |
| Remuneration element | | Summary of treatment |
| Annual bonus | | Will not receive any bonus for 2018. |
| PSP and DABP | | Will not be granted PSP awards in 2018 but will defer 50% of 2017 bonus into DABP. |
| Outstanding PSP and DABP matching awards | | Any awards not vested prior to Dr Vallance’s departure will lapse when he leaves GSK. |
| DABP deferred bonus awards | | Awards in respect of bonuses deferred in respect of 2017 and prior years will vest at the normal vesting dates. |
In addition to the above, Dr Vallance will be required to maintain a shareholding equal to his respective share ownership requirement for at least 12 months after leaving the company.
Remuneration arrangements for new Executive Director
Dr Hal Barron joined GSK as Chief Scientific Officer and President, R&D on 1 January 2018, and is an Executive Director. A summary of his remuneration is set out below:
| | | | |
| | | US$ | | Notes |
| Base salary | | $1,700,000 | | The comparator group for pay for the top R&D position is the global pharmaceutical comparator group. |
| Annual bonus | | $1,700,000 | | Theon-target bonus would be 100% with a maximum of 200% as for the outgoing President, R&D. |
| Award of LTIs | | $4,250,000 | | This assumes an expected value of 50% of an award of performance shares under the company’s 2017 Performance Share Plan at a 5x multiple of base salary as for the outgoing President, R&D. |
| Share Ownership Requirement (SOR) | | 300% of base salary | | This is in line with GSK’s 2017 Remuneration policy. |
| Pension | | | | Pension is in line with GSK’s 2017 Remuneration policy and arrangements for other executives based in the US. |
| Benefits | | | | Benefits will be in line with GSK’s 2017 Remuneration policy. |
| | |
| 142 | | |
GSK Annual Report 2017 | | |
| | |
| | |
2017 Remuneration policy summary
Executive Director remuneration policy
The company’s Remuneration policy was approved on 4 May 2017 at GSK’s Annual General Meeting. The full policy is available at www.gsk.com in the Investors section. The following is a summary of this policy.
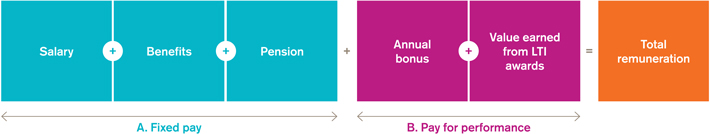
| | | | | | |
Salary | | To provide a core reward for the role. Set at a level appropriate to secure and retain high calibre individuals needed to deliver the Group’s strategic priorities. |
| | | | |
| Operation | | Opportunity | | Performance measures |
| Individual’s role, experience and performance and independently sourced data for relevant comparator groups considered when determining salary levels. | | There is no formal maximum limit and, ordinarily, salary increases will be broadly in line with the average increases for the wider GSK workforce. However, increases may be higher to reflect a change in the scope of the individual’s role, responsibilities or experience. Salary adjustments may also reflect wider market conditions in the geography in which the individual operates. Details of current salary levels are set out in the Annual report on remuneration on pages 118 and 140. | | The overall performance of the individual is a key consideration when determining salary increases. |
| | | | | | |
Benefits | | Levels are set to recruit and retain high calibre individuals to execute the business strategy. |
| | | | |
| Operation | | Opportunity | | Performance measures |
| Executive Directors are generally eligible to receive benefits in line with the policy for other employees which may vary by location. These include travel allowances (including spouse/partner travel), healthcare, life assurance/death in service (where not provided as part of the individual’s pension arrangements), personal financial advice and contractual post-retirement benefits. | | There is no formal maximum limit as benefits costs can fluctuate depending on changes in provider cost and individual circumstances. Details of current benefits and costs are set out in the Annual report on remuneration on page 118. | | None. |
| | | | | | |
Pension | | Pension arrangements provide a competitive level of retirement income. |
| | | | | | |
| Operation | | Opportunity | | Performance measures |
Pension arrangements are structured in accordance with the plans operated in the country in which the individual is likely to retire. Where the individual chooses not to become a member of the pension plan, cash in lieu of the relevant pension contribution is paid instead. New Executive Directors in the UK will be entitled either to join the defined contribution pension plan or to receive a cash payment in lieu of pension contribution. Where an individual is a member of a GSK legacy defined benefit plan, a defined contribution plan or an alternative pension plan arrangement and is subsequently appointed to the Board, he or she may remain a member of that plan. | | The policy for all current Executive Directors and new external recruits is: | | None. |
| | UK: | | – 20% of salary contribution to defined contribution plan and further 5% in matched contributions subject to any relevant cap and in line with implementation principles for other members of the plan; or – 20% of salary cash payment in lieu of pension contribution. | | |
| | US: | | Eligible for the same benefits as other US senior executives: – Cash Balance Pension Plan and Supplemental Cash Balance Pension Plan, including Executive Pension Credit, provide maximum contribution of 38% of base salary across all pension plans. – GSK 401(k) plan (formerly the US Retirement Savings Plan) and the Executive Supplemental Savings Plan with core contributions of 2% of salary and bonus and matched contributions of 4% of salary and bonus. | | |
| | | | |
| GSK Annual Report 2017 | | Strategic report | | |
| | Governance and remuneration | | |
| | Financial statements | | |
| | Investor information | | |
Executive Director remuneration policy summarycontinued
| | |
Annual bonus | | To incentivise and recognise execution of the business strategy on an annual basis. Rewards the achievement of stretching annual financial and strategic business targets and delivery of personal objectives. |
| | | | |
| Operation | | Opportunity | | Performance measures |
Financial, operational and business targets are set at the start of the year by the Committee and bonus levels are determined by the Committee based on performance against those targets. Individual objectives are set at the start of the year by the Committee and performance against objectives is assessed by the Committee. Executive Directors are required to defer 50% of any bonus earned into shares, or ADS as appropriate, for three years. Deferred shares vest at the end of the three years. | | The maximum bonus opportunity for Executive Directors is 200% of salary. For threshold performance, the bonuspay-out will be nil. For target performance, the bonus payout will be 50% of the maximum opportunity. | | Based on a combination of financial targets and individual/strategic performance objectives, with the majority of the bonus assessed against the financial measures. The weighting between different measures will be determined each year according to business priorities. |
| | |
LTI awards | | To incentivise and recognise delivery of the longer term business priorities, financial growth and increases in shareholder value compared to other pharmaceutical companies. To provide alignment with shareholder interests, a retention element, to encourage long-term shareholding and discourage excessive risk taking. |
| | | | | | |
| PSP | | | | |
| Operation | | Opportunity | | Performance measures |
Conditional awards are made annually with vesting dependent on the achievement of performance conditions over three years and are subject to an additionaltwo-year holding period. The Committee may adjust the formulaic vesting outcome (either up or down) to ensure that the overall outcome reflects underlying business performance over the vesting period. | | The normal maximum award limits that may be granted under the PSP to an individual in any one year are set out in the table below: | | Based on a combination of financial, share price related and strategic performance conditions which are aligned to the company’s strategic plan. Up to 30% of awards will vest at threshold performance. |
| | | | % of salary | |
| | | |
| | CEO | | 650 | |
| | | |
| | CFO | | 400 | | |
| | | | |
| | Other Executive Directors | | 500 | | |
| | | | |
| | | | | | | |
| | | | |
| DABP (current) | | | | |
| Operation | | | | |
For bonus payments from 2018 onwards, Executive Directors are required to defer 50% of any bonus earned into shares for three years. | | | | |
| | | | |
| DABP (legacy, pre 2018) | | | | |
| Operation | | Opportunity | | Performance measures |
| For bonus payments until 2017, Executive Directors were required to defer 25% of any bonus earned into shares for three years. They could also voluntarily defer up to an additional 25% of any bonus earned. | | These deferred shares were matched up to a maximum of 1:1 subject to the achievement of performance conditions over three years. Matching awards were conditional shares ornil-cost options and eligible for dividend equivalents. | | Outstanding matching awards are subject to the same measures as awards made under the PSP in any given year. |
| | | | | |
| | | | | | |
| | Share Ownership Requirements (SOR) | | |
| | To align the interests of Executive Directors with those of shareholders, they are required to build and maintain significant holdings of shares in GSK over time. The SOR requirement for the CEO is 650% of salary, and the SOR requirement for other Executive Directors is 300% of salary. | | Executive Directors are required to continue to satisfy these requirements for a minimum of 12 months following retirement from GSK. | | |
| > | For details of our policy on clawback/malus, recruitment remuneration, loss of office and termination payments, please refer to the full 2017 Remuneration policy report on pages 138 to 146 of the 2016 Annual Report, available at www.gsk.com in the Investors section. |
| | |
| 144 | | |
GSK Annual Report 2017 | | |
| | |
| | |
2017 Remuneration policy summarycontinued
Scenarios for future total remuneration
The charts opposite provide illustrations of the future total remuneration for each of the Executive Directors in respect of the remuneration opportunity granted to each of them in 2018 under the policy. A range of potential outcomes is provided for each Executive Director and the underlying assumptions are set out below.
All scenarios:
| – | | 2018 base salary has been used. |
| – | | 2017 benefits and pension figures have been used for the CEO, CFO and the outgoing President, R&D, i.e. based on actual amounts received in 2017 in respect of the ongoing policy. As the new Chief Scientific Officer and President, R&D was not in role during 2017, the benefits value for this role is based on the value of benefits (excluding Other benefits and Travel) and including pension contribution based on policy. |
| – | | The amounts shown under value of PSP awards are based on the relevant multiples for 2017. They do not include amounts in respect of dividends reinvested and do not factor in changes to share price over the vesting period. |
Fixed:
| – | | None of the pay for performance (Annual bonus and PSP) would be payable. |
Expected:
| – | | For the Annual bonus, it is assumed that target performance is achieved. |
| – | | For the PSP awards, threshold levels of vesting are assumed. |
Maximum:
| – | | It is assumed that the Annual bonus would be payable at the maximum level and that the awards under the PSP would vest in full. |
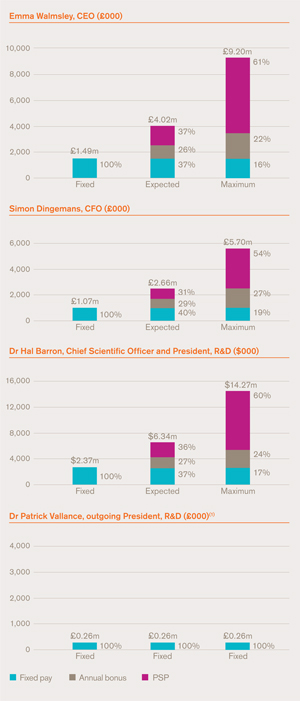
| (1) | Outgoing President, R&D, will leave GSK on 31 March 2018 and is not eligible for bonus or PSP award for 2018. The figures represent his actual remuneration for January through March 2018. |
| | | | |
| 145 | | |
| | | | | |
| GSK Annual Report 2017 | | Strategic report | | |
| | Governance and remuneration | | |
| | Financial statements | | |
| | Investor information | | |
Non-Executive Director Remuneration policy
The company’s Remuneration policy forNon-Executive Directors, set out below, was approved on 4 May 2017 at GSK’s Annual General Meeting.
| | | | |
| | |
Chairman’s fees | | To provide an inclusive flat rate fee that is competitive with those paid by other companies of equivalent size and complexity subject to the limits contained in GSK’s Articles of Association. |
| | | | |
| Operation | | Opportunity | | Performance measures |
The Committee is responsible for evaluating and making recommendations to the Board on the fees payable to the Chairman. The Chairman does not participate in discussions in respect of his fees. Fees can be paid in a combination of cash and/or GSK shares or ADS via theNon-Executive Directors’ Share Allocation Plan. | | There is no formal maximum. However, fees are reviewed annually and set by reference to a review of the Chairman’s performance and independently sourced market data. Details of current fees are set out in the Annual report on remuneration on page 127. | | None |
| | | | |
| Operation | | Opportunity | | Performance measures |
The Chairman and CEO are responsible for evaluating and making recommendations to the Board on the fees payable to the company’sNon-Executive Directors. A minimum of 25% is delivered in the form of GSK shares or ADS, using theNon-Executive Directors’ Share Allocation Plan which delivers the shares or ADS to theNon-Executive Director following retirement from the Board. | | As with the Chairman, fees are reviewed annually and set by reference to independently sourced data. Details of current fees are set out in the Annual report on remuneration on page 127. | | None |
| | | | |
| | |
Supplemental fees | | To compensateNon-Executive Directors (other than the Chairman) for taking on additional Board responsibilities or undertaking intercontinental travel. |
| | | | |
| Operation | | Opportunity | | Performance measures |
Additional fees for Committee Chairmen, the Senior IndependentNon-Executive Director, Science and Medical Experts and intercontinental travel. | | Details of supplemental fees are set out in the Annual report on remuneration on page 127. | | None |
| | | | |
| | |
Benefits | | To facilitate execution of responsibilities and duties required by the role. |
| | | | |
| Operation | | Opportunity | | Performance measures |
Travel and subsistence costs forNon-Executive Directors are incurred in the normal course of business in relation to meetings on Board and Committee matters and otherGSK-hosted events. For overseas-basedNon-Executive Directors, this includes travel to meetings in the UK. In the event it is necessary for business purposes, whilst not normal practice,Non-Executive Directors may be accompanied by their spouse or partner to these meetings or events. The costs associated with the above are all met by the company and, in some instances, they are deemed to be taxable and therefore treated as benefits for theNon-Executive Director. | | There is no formal maximum limit as benefit costs can fluctuate depending on changes in provider costs and individual circumstances. Details of current benefits and costs are set out in the Annual report on remuneration on page 127. | | None |
| | |
| 146 | | |
GSK Annual Report 2017 | | |
| | |
| | |
Remuneration policy summarycontinued
Operation and scope of Remuneration policy
The Remuneration policy (Policy) is set out on pages 138 to 146 of the 2016 Annual Report and it is intended that the Policy for GSK’s Executive andNon-Executive Directors will operate for a period of three years from the date of approval at the company’s Annual General Meeting on 4 May 2017.
The Committee wrote the Policy principally in relation to the remuneration arrangements for the Executive Directors, whilst taking into account the possible recruitment of a replacement or an additional Executive Director during the operation of the Policy. The Committee intends the Policy to operate for the period set out above in its entirety. However, it may after due consideration seek to change the Policy during this period, but only if it believes it is appropriate to do so for the long-term success of the company, after consultation with shareholders and having sought shareholder approval at a general meeting.
The Committee reserves the right to make any remuneration payments and/or payments for loss of office (including exercising any discretions available to it in connection with such payments) notwithstanding that they are not in line with the Policy where the terms of the payment were agreed:
(i) before the AGM on 7 May 2014 (the date the company’s first shareholder-approved Directors’ remuneration policy came into effect);
(ii) before the Policy came into effect, provided that the terms of the payment were consistent with the shareholder-approved Remuneration policy in force at the time they were agreed; or
(iii) at a time when the relevant individual was not a Director of the company and, in the opinion of the Committee, the payment was not in consideration for the individual becoming a Director of the company. For these purposes ‘payments’ includes the Committee satisfying awards of variable remuneration and, in relation to an award over shares or ADS, the terms of the payment are ‘agreed’ at the time the award is granted.
Performance Share Plan and Deferred Annual Bonus Plan awards are subject to the terms of the relevant plan rules under which the award has been granted. The Committee may adjust or amend awards only in accordance with the provisions of the plan rules. This includes making adjustments to reflectone-off corporate events, such as a change in the company’s capital structure.
The Committee may also make minor amendments to the Policy (for regulatory, exchange control, tax or administrative purposes or to take account of a change in legislation) without obtaining shareholder approval for such amendments.
Statement of consideration of shareholder views
The Committee engages in regular dialogue with shareholders and holds annual meetings with GSK’s largest investors to discuss and take feedback on its Remuneration policy and governance matters.
The annual meeting was held in December 2017, at which Urs Rohner, the Committee Chairman, shared updates on remuneration matters in the last 12 months and proposals for 2018 onwards.
Basis of preparation
The Annual report on remuneration has been prepared in accordance with the Companies Act 2006 and The Large andMedium-sized Companies and Groups (Accounts and Reports) (Amendment) Regulations 2013 (the Regulations). In accordance with the Regulations, the following parts of the Annual report on remuneration are subject to audit: total remuneration figures for Executive Directors including further details for each element of remuneration (salary, benefits, pension, Annual bonus and long-term incentive awards);Non-Executive Directors’ fees and emoluments received in the year; Directors’ interests in shares, including interests in GSK share plans; payments to past Directors; payments for loss of office; and share ownership requirements and holdings, for which the opinion thereon is expressed on page 156. The remaining sections of the Directors’ Remuneration Report are not subject to audit nor are the pages referred to from within the audited sections.
The Annual report on remuneration has been approved by the Board of Directors and signed on its behalf by:
Urs Rohner
Remuneration Committee Chairman
12 March 2018
| | | | |
147 | | |
GSK Annual Report 2017 | | Strategic report | | |
| | | Governance and remuneration | | |
| | Financial statements | | |
| | | Investor information | | |
| | | | | |
| | |
| 148 | | |
GSK Annual Report 2017 | | |
| | |
| | |
Directors’ statement of responsibilities
The Directors are responsible for preparing the Annual Report, the Remuneration report and the Group financial statements in accordance with applicable law and regulations.
UK company law requires the Directors to prepare financial statements for each financial year. Under that law the Directors are required to prepare the Group financial statements in accordance with International Financial Reporting Standards (IFRS) as adopted by the European Union. In preparing the Group financial statements, the Directors have also elected to comply with IFRS as issued by the International Accounting Standards Board (IASB). Under company law the Directors must not approve the Group financial statements unless they are satisfied that they give a true and fair view of the state of affairs of the Group and its profit or loss for that period.
In preparing those financial statements, the Directors are required to:
| – | | select suitable accounting policies and then apply them consistently; |
| – | | make judgements and accounting estimates that are reasonable and prudent; |
| – | | state that the Group financial statements comply with IFRS as adopted by the European Union and IFRS as issued by the IASB, subject to any material departures disclosed and explained in the Group financial statements; and |
| – | | prepare the financial statements on a going concern basis unless it is inappropriate to presume that the Group will continue in business. |
The Directors are responsible for keeping adequate accounting records that are sufficient to show and explain the company’s transactions and disclose with reasonable accuracy at any time the financial position of the Group and to enable them to ensure that the Group financial statements and the Remuneration report comply with the Companies Act 2006 and Article 4 of the IAS Regulation. They are also responsible for safeguarding the assets of the Group and hence for taking reasonable steps for the prevention and detection of fraud and other irregularities.
The Group financial statements for the year ended 31 December 2017, comprising principal statements and supporting notes, are set out in the ‘Financial statements’ on pages 158 to 232 of this report. The responsibilities of the auditors in relation to the Group financial statements are set out in the Independent Auditors’ report on pages 149 to 157.
The Group financial statements for the year ended 31 December 2017 are included in the Annual Report, which is published in printed form and made available on our website. The Directors are responsible for the maintenance and integrity of the Annual Report on our website in accordance with UK legislation governing the preparation and dissemination of financial statements. Access to the website is available from outside the UK, where comparable legislation may be different.
Each of the current Directors, whose names and functions are listed in the Corporate Governance section of the Annual Report 2017 confirms that, to the best of his or her knowledge:
| – | | the Group financial statements, which have been prepared in accordance with IFRS as adopted by the EU and IFRS as issued by the IASB, give a true and fair view of the assets, liabilities, financial position and profit of the Group; and |
| – | | the Strategic report and risk sections of the Annual Report, which represent the management report, include a fair review of the development and performance of the business and the position of the Group, together with a description of the principal risks and uncertainties that it faces. |
Disclosure of information to auditors
The Directors in office at the date of this Annual Report have each confirmed that:
| – | | so far as he or she is aware, there is no relevant audit information of which the company’s auditors are unaware; and |
| – | | he or she has taken all the steps that he or she ought to have taken as a Director to make himself or herself aware of any relevant audit information and to establish that the company’s auditors are aware of that information. |
This confirmation is given and should be interpreted in accordance with the provisions of section 418 of the Companies Act 2006.
Going concern basis
Pages 53 to 78 contain information on the performance of the Group, its financial position, cash flows, net debt position and borrowing facilities. Further information, including Treasury risk management policies, exposures to market and credit risk and hedging activities, is given in Note 42 to the financial statements, ‘Financial instruments and related disclosures’. Having assessed the principal risks and other matters considered in connection with the viability statement, the Directors considered it appropriate to adopt the going concern basis of accounting in preparing the financial statements.
Internal control
The Board, through the Audit & Risk Committee, has reviewed the assessment of risks and the internal control framework that operates in GSK and has considered the effectiveness of the system of internal control in operation in the Group for the year covered by this Annual Report and up to the date of its approval by the Board of Directors.
The UK Corporate Governance Code
The Board considers that GlaxoSmithKline plc applies the principles and complies with the provisions of the UK Corporate Governance Code maintained by the Financial Reporting Council, as described in the Corporate Governance section on pages 79 to 112. The Board further considers that the Annual Report, taken as a whole, is fair, balanced and understandable, and provides the information necessary for shareholders to assess the Group’s position and performance, business model and strategy.
As required by the Financial Conduct Authority’s Listing Rules, the auditors have considered the Directors’ statement of compliance in relation to those points of the UK Corporate Governance Code which are specified for their review.
Annual Report
The Annual Report for the year ended 31 December 2017, comprising the Report of the Directors, the Remuneration report, the Financial statements and additional information for investors, has been approved by the Board of Directors and signed on its behalf by
Philip Hampton
Chairman
12 March 2018
| | | | |
| 149 | | |
| | | | | |
| GSK Annual Report 2017 | | Strategic report | | |
| | Governance and remuneration | | |
| | Financial statements | | |
| | Investor information | | |
Independent Auditors’ report
to the members of GlaxoSmithKline plc
Report on the Group financial statements
Our opinion
In our opinion, GlaxoSmithKline plc’s Group financial statements (the “financial statements”):
| – | | give a true and fair view of the state of the Group’s affairs at 31 December 2017 and of its profit and cash flows for the year then ended; |
| – | | have been properly prepared in accordance with International Financial Reporting Standards (“IFRSs”) as adopted by the European Union; and |
| – | | have been prepared in accordance with the requirements of the Companies Act 2006 and Article 4 of the IAS Regulation. |
We have audited the financial statements, included within the Annual Report, which comprise: the consolidated balance sheet at 31 December 2017; the consolidated income statement and consolidated statement of comprehensive income for the year then ended; the consolidated cash flow statement for the year then ended; the consolidated statement of changes in equity for the year then ended; and the notes to the financial statements, which include a description of the significant accounting policies.
Our opinion is consistent with our reporting to the Audit & Risk Committee.
Separate opinion in relation to IFRSs as issued by the IASB
As explained in Note 1 to the financial statements, the Group, in addition to applying IFRSs as adopted by the European Union, has also applied IFRSs as issued by the International Accounting Standards Board (IASB).
In our opinion, the Group financial statements have been properly prepared in accordance with IFRSs as issued by the IASB.
Basis for opinion
We conducted our audit in accordance with International Standards on Auditing (UK) (“ISAs (UK)”) and applicable law. Our responsibilities under ISAs (UK) are further described in the auditors’ responsibilities for the audit of the financial statements section of our report. We believe that the audit evidence we have obtained is sufficient and appropriate to provide a basis for our opinion.
Independence
We remained independent of the Group in accordance with the ethical requirements that are relevant to our audit of the financial statements in the UK, which includes the FRC’s Ethical Standard, as applicable to listed public interest entities, and we have fulfilled our other ethical responsibilities in accordance with these requirements.
To the best of our knowledge and belief, we declare thatnon-audit services prohibited by the FRC’s Ethical Standard were not provided to the Group.
Other than those disclosed in Note 8 to the financial statements, we have provided nonon-audit services to the Group in the period from 1 January 2017 to 31 December 2017.
Our audit approach
Overview
Materiality
| – | | Overall Group materiality: £290 million (2016 – £260 million), based on 4% of profit before tax, adding back certain items. |
Audit scope
| – | | Our audit included full scope audits of 18 reporting components with specific audit procedures performed at a further 49 reporting components. |
| – | | Taken together, the components at which audit work was performed accounted for 70% of consolidated revenue, 74% of consolidated profit before tax and 78% of profit before tax adjusted for certain items used to determine our materiality and covered all components that individually contributed more than 2% of revenue, profit before tax and profit before tax adjusted for certain items used to determine our materiality. |
Areas of focus
| – | | Rebates, discounts, allowances and returns in the US Pharmaceuticals and Vaccines business |
| – | | Carrying value of goodwill and intangible assets |
| – | | Acquisition-related liabilities |
| – | | Uncertain tax positions, transfer pricing and the impact of US tax reform |
| – | | Investigations into the Group’s commercial operations |
The scope of our audit
As part of designing our audit, we determined materiality and assessed the risks of material misstatement in the financial statements. In particular, we looked at where the directors made subjective judgements, for example in respect of significant accounting estimates that involved making assumptions and considering future events that are inherently uncertain.
We gained an understanding of the legal and regulatory framework applicable to the Group and the industry in which it operates and considered the risk of acts by the Group which were contrary to applicable laws and regulations, including fraud. We designed audit procedures at Group and significant component levels to respond to the risk, recognising that the risk of not detecting a material misstatement due to fraud is higher than the risk of not detecting one resulting from error, as fraud may involve deliberate concealment by, for example, forgery or intentional misrepresentations or through collusion. We designed audit procedures that focused on laws and regulations that could give rise to a material misstatement in the event ofnon-compliance particularly relating to, but not limited to, defence of products, pricing and practices legislation, taxation and anti-bribery and corruption legislation. Our tests included, but were not limited to, enquiries of management, review of related work performed by component audit teams, review of relevant Internal Audit reports and discussions within-house legal counsel supplemented by review of external legal counsel correspondence and in certain cases by discussions with external legal counsel. We also inspected underlying support and calculations and assessed and tested the design and operating effectiveness of related controls. There are inherent limitations in the audit procedures described above as the further removednon-compliance with laws and regulations is from the events and transactions reflected in the financial statements, the less likely we would become aware of it.
As in all of our audits, we also addressed the risk of management override of internal controls, including evaluating whether there was evidence of bias by the directors that represented a risk of material misstatement due to fraud, and the risk of fraud in revenue recognition. Procedures designed and executed to address these risks included use of data enabled auditing techniques to test journal entries and post-close adjustments, testing and evaluating management’s key accounting estimates for reasonableness and consistency, undertakingcut-off procedures to verify propercut-off of revenue and expenses and testing the existence and accuracy of revenue transactions. In addition, we incorporate an element of unpredictability into our audit work each year.
| | |
| 150 | | |
GSK Annual Report 2017 | | |
| | |
| | |
Independent Auditors’ reportcontinued
Report on the Group financial statementscontinued
Key audit matters
Key audit matters are those matters that, in the auditors’ professional judgement, were of most significance in the audit of the financial statements of the current period and include the most significant assessed risks of material misstatement (whether or not due to fraud) identified by the auditors, including those which had the greatest effect on: the overall audit strategy; the allocation of resources in the audit; and directing the efforts of the engagement team. These matters, and any comments we make on the results of our procedures thereon, were addressed in the context of our audit of the financial statements as a whole, and in forming our opinion thereon, and we do not provide a separate opinion on these matters. This is not a complete list of all risks identified by our audit.
| | |
| Key audit matter | | How our audit addressed the key audit matter |
Rebates, discounts, allowances and returns in the US Pharmaceuticals and Vaccines business Refer to Notes 3 and 27 in the Group financial statements. | | We obtained management’s calculations for accruals under applicable schemes and validated the assumptions used by reference to the Group’s stated commercial policies, the terms of the applicable contracts, third party data related to patient enrolment in US government funded benefit schemes and historical levels of product returns. We compared the assumptions to contracted prices, historical rebates, discounts, allowances and returns levels (where relevant) and to current payment trends. We also considered the historical accuracy of the Group’s estimates in previous years and the impact of competitive pricing pressures and greater discounting in the US market more generally. We formed an independent expectation of the largest elements of the accrual at 31 December 2017 using third party data and compared this expectation to the actual accrual recognised by the Group. Based on the procedures performed, we did not identify any material differences between our independent expectations and the accrual. |
The Group makes sales to various customers in the US that fall under certain commercial and government mandated contracts and reimbursement arrangements, of which the most significant are Medicaid and Medicare. The Group also provides a right of return to its customers for certain products. These arrangements result in deductions to gross sales in arriving at turnover and give rise to obligations for the Group to provide customers with rebates, discounts, allowances and the right of return, which for unsettled amounts are recognised as an accrual. We focused on this area because rebates, discounts, allowances and returns arrangements are complex and because establishing an appropriate accrual requires significant judgement and estimation by the directors. This judgement is particularly complex in a US healthcare environment in which competitive pricing pressure and product discounting are increasingly prevalent. The directors have determined an accrual of £2,837 million to be necessary at 31 December 2017 (2016 – £2,218 million). | |
| | |
Carrying value of goodwill and intangible assets Refer to Notes 3, 18 and 19 in the Group financial statements. | | Deploying our valuations specialists, we obtained the Group’s impairment analyses and tested the reasonableness of key assumptions, including profit and cash flow growth or decline, terminal values, the impact of the expiry of patents, potential product obsolescence and the selection of discount rates. We challenged management to substantiate its assumptions, including comparing relevant assumptions to industry and economic forecasts. Further, we verified the integrity of supporting calculations and we corroborated certain information with third party sources, including expectations of performance of certain assets and components of the business. We obtained and evaluated management’s sensitivity analyses to ascertain the impact of changes in key assumptions and we performed our own independent sensitivity calculations to quantify the downside changes to management’s models required to result in impairment. As a result of our work, we determined that the carrying values of goodwill and intangible assets are appropriate in the context of the Group financial statements taken as a whole. |
The Group has £16.5 billion of intangible assets (31 December 2016 – £17.8 billion), comprising significant licences, patents and acquired trademarks (excluding computer software). In addition, the Group has £5.7 billion of goodwill at 31 December 2017 (2016 – £6.0 billion). The carrying values of goodwill and intangible assets will be recovered through future cash flows and there is a risk that the assets will be impaired if these cash flows do not meet the Group’s expectations. The impairment reviews performed by the Group contained a number of significant judgements and estimates including revenue growth, the success of new product launches, genericisation of existing products following patent expiry, profit margins, cash conversion, terminal values and discount rate. Changes in these assumptions could lead to an impairment to the carrying value of intangible assets and goodwill. We focused on intangible assets acquired through historical acquisitions, as these are the most significant individually and in aggregate, and a number have indefinite lives, including the most significant of the intangible assets acquired from Novartis in 2015. The Group has also recognised goodwill from a number of its acquisitions, including the three-part transaction with Novartis. | |
| | | | |
| GSK Annual Report 2017 | | Strategic report | | |
| | Governance and remuneration | | |
| | Financial statements | | |
| | Investor information | | |
| | | | |
Report on the Group financial statementscontinued
| | |
| Key audit matter | | How our audit addressed the key audit matter |
Acquisition-related liabilities Refer to Notes 3, 27, 38, 39 and 42 in the Group financial statements | | We deployed our valuations specialists to evaluate certain key assumptions, including growth projections and discount rates as well as the integrity and mechanical accuracy of each of management’s valuation models. This evaluation included look-back tests to assess the historical accuracy of the Group’s forecasts and assumptions and performing sensitivity analysis over these key assumptions to determine if they could have a significant impact on the value recorded. Certain procedures are specific to individual liabilities and included the following: – Consumer Healthcare put option: The redemption value (to be agreed between GSK and Novartis) is estimated by GSK based on a multiple of Consumer Healthcare’s profit. We verified the integrity of the model and compared certain key assumptions including exchange rates and multiples to third party sources. GSK obtained valuations from third party banks to support its estimate, which we obtained and considered. As part of our work, we compared the earnings forecast approved by the Consumer Healthcare board of directors and used by management in its model to actual earnings in 2017 and understood the reasons for changes. We also considered the appropriateness of the assumed exercise date and considered the impact of different exercise dates on the discounted redemption value of the option; – ViiV Healthcare contingent consideration: We compared the projections for the Group’s dolutegravir products to third party expectations of growth and considered the potential upside and downside impact of products launched and expected to be launched by the Group’s competitors; and – ViiV Healthcare put option: Certain assumptions related to forecast revenue from dolutegravir products used in the valuation of this liability are consistent with the ViiV Healthcare contingent consideration valuation. For other components of the valuation, we considered the appropriateness of the assumptions made about forecast growth rates and margins by reference to historical performance and to board approved budgets and third party forecast data. Each of these three acquisition-related liabilities is subject to significant estimation uncertainty and the range of possible outcomes is very broad. However, based on our procedures performed, we are comfortable that the value of each liability at 31 December 2017 is reasonable in the context of the Group financial statements taken as a whole and reflects management’s best estimates at this time. We reviewed the disclosures about each acquisition-related liability, including management’s commentary about estimation uncertainty and the range of alternative outcomes. We are satisfied that these disclosures are appropriate. |
In recent years, the Group has completed a number of significant transactions, including: – The three-part transaction with Novartis in 2015; – The establishment of ViiV Healthcare in 2009; and – The acquisition by ViiV Healthcare of the remaining 50% interest in the Shionogi-ViiV Healthcare joint venture in 2012. Each of these transactions resulted in the recognition and measurement of material acquisition-related liabilities, which necessitate significant management judgement at each balance sheet date. The most significant of the acquisition-related liabilities are outlined below: – Consumer Healthcare put option: The Group recorded a liability for the present value of the expected redemption price of a written put option over Novartis’non-controlling interest in Consumer Healthcare. At 31 December 2017, this liability had a carrying value of £8,606 million (2016 – £7,420 million); – ViiV Healthcare contingent consideration: On acquisition of the remaining 50% interest in the Shionogi-ViiV Healthcare joint venture in 2012, £659 million was recorded as contingent consideration. This represented the fair value of the expected payments to be made to Shionogi, contingent on future sales of dolutegravir products. The liability is required to bere-measured to its fair value at each reporting date. Since initial recognition, it has increased in response to actual and future sales significantly exceeding original expectations. At 31 December 2017, the liability was £5,542 million (2016 – £5,304 million); and – ViiV Healthcare put option: In 2009, Pfizer was granted a written put option by the Group that enables it to put itsnon-controlling interest back to the Group in the future. At 31 December 2017, the liability in respect of Pfizer’s written put option had a carrying value of £1,304 million (2016 – £1,319 million). In addition to these liabilities, the Group has recorded certain other acquisition-related liabilities at 31 December 2017, including £584 million in relation to contingent consideration payable on the acquisition of Novartis’ Vaccines business in 2015. We have focused on this area as the carrying value of each of the financial liabilities is material and is determined by management judgements and estimates, including projections of future sales of products, the potential impact of competitor products and the delivery of anticipated synergies. In addition, each valuation is sensitive to changes in other assumptions, including discount rates and tax rates, and US tax reform has therefore had a significant impact on the valuations in 2017. | |
| | |
| 152 | | |
GSK Annual Report 2017 | | |
| | |
| | |
Independent Auditors’ reportcontinued
Report on the Group financial statementscontinued
| | |
| Key audit matter | | How our audit addressed the key audit matter |
Uncertain tax positions, transfer pricing and the impact of US tax reform Refer to Notes 3 and 14 in the Group financial statements. The Group operates in a complex multinational tax environment and there are open tax and transfer pricing matters with UK and overseas tax authorities. In addition, from time to time the Group enters into commercial transactions with complicated accounting and tax consequences. Judgement is required in assessing the level of provisions required in respect of uncertain tax positions. At 31 December 2017, the Group has recorded provisions of £1,175 million in respect of uncertain tax positions (2016 – £1,892 million). There have also been a number of changes in tax law in the US and Switzerland that have resulted in a material impact on the Group’s current and deferred tax balances at 31 December 2017. The most significant impact has been in respect of the US Tax Cuts and Jobs Act which was substantively enacted beforeyear-end. In aggregate, the total adjusting item to account for the impact amounts to £1,078 million in the tax line. The main changes include a reduction in the corporate tax rate that should be applied to deferred taxation balances and the introduction of a toll tax for the deemed repatriation of certain deferred foreign earnings. Some of the changes are complex and there are a number of areas of uncertainty relating both to the manner in which the law will apply and to the accounting in certain areas. | | In conjunction with our UK, US, international tax and transfer pricing specialists, we evaluated and challenged management’s judgements in respect of estimates of tax exposures and contingencies in order to assess the adequacy of the Group’s tax provisions. This included obtaining and evaluating certain third party tax advice that the Group has obtained to assess the appropriateness of any assumptions used. In understanding and evaluating management’s judgements, we considered the status of recent and current tax authority audits and enquiries, the outturn of previous claims, judgemental positions taken in tax returns and current year estimates and developments in the tax environment. We noted that the assumptions and judgements that are required to formulate the provisions mean that the range of possible outcomes is broad. However, based on the evidence obtained, we considered the level of provisioning and related disclosure to be acceptable in the context of the Group financial statements taken as a whole. Deploying our US tax specialists, we evaluated the key judgements, assumptions and interpretations used by management to assess the impact of US tax reform. We have undertaken procedures to validate the material corporate tax rate change adjustments to current and deferred tax balances. With respect to the £348 million toll tax charge for the deemed repatriation of foreign earnings of subsidiaries of US entities in the Group, we have evaluated the documentation prepared by management and assessed the underlying calculations together with advice from third party advisors, undertaken procedures to validate key inputs underpinning the estimated charge and confirmed that the liability is appropriately presented in the Group’s balance sheet. Given the complexity and uncertainty relating to US tax reform, we expect that there will betrue-ups and updates to the estimates as further guidance is issued. However, we are satisfied that the accounting positions taken by the Group at 31 December 2017 represent management’s best estimate of the impact of US tax reform at this time. |
| |
| |
| | |
Litigation Refer to Notes 3, 29 and 45 in the Group financial statements. The pharmaceuticals industry is heavily regulated which increases inherent litigation risk. The Group is engaged in a number of legal actions, including product liability, anti-trust and related private litigation, of which the most significant are disclosed in Notes 29 and 45. We focused on this area as the eventual outcome of claims is uncertain and the positions taken by the directors are based on the application of material judgement and estimation. Accordingly, unexpected adverse outcomes could significantly impact the Group’s reported profit and balance sheet position. At 31 December 2017, the Group held provisions of £186 million in respect of legal actions (2016 – £344 million). There has been a significant reduction in the provision as a result of the Group settling its largest individual cases relating toPaxil. Nevertheless, we have continued to focus on this area given the possibility of adverse outcomes. | | We discussed the status of significant known actual and potential litigation within-house legal counsel. We obtained and substantively tested evidence to support the decisions and rationale for provisions held or the decisions not to record provisions, including correspondence with external legal counsel. We also monitored and considered external information sources to identify potential legal actions. We developed an independent expectation of the litigation provisions based on product litigation history and other available evidence to challenge the valuation and completeness of the provisions recognised by the Group. This included obtaining confirmations from external legal counsel to confirm our understanding of settled and outstanding litigation and asserted claims. We also evaluated significant adjustments to legal provisions recorded during the year. As disclosed in Notes 29 and 45 to the Group financial statements, the eventual outcome of legal proceedings is dependent on the outcome of future events and the position taken by the Group is inherently judgemental. We found in the context of the Group financial statements taken as a whole that the judgements made by management were reasonable and the disclosures made in respect of these provisions and contingent liabilities were appropriate. |
| |
| |
| | | | |
| 153 | | |
| | | | | |
| GSK Annual Report 2017 | | Strategic report | | |
| | Governance and remuneration | | |
| | Financial statements | | |
| | Investor information | | |
Report on the Group financial statementscontinued
| | |
Key audit matter | | How our audit addressed the key audit matter |
Finance transformation The Group continues to rationalise and simplify its finance processes including theroll-out of an enterprise-wide resource planning system (ERP) and migrations of accounting services toin-house business service centres (BSCs) and to third party business process outsourcing locations (BPOs). The number of market migrations onto the central ERP system in 2017 was lower than 2016. However, as a number of markets migrating in 2017 pose particular complexity due to their position in the Group’s supply chain, we have continued to focus on this area. These changes represent a financial reporting risk while migrations are happening as controls and processes that have been established and embedded over a number of years are updated and migrated into a new environment. There is an increased risk of breakdown in internal financial controls during the transition and an increased risk of inaccurate or incomplete migration of financial data, which would in turn increase risk of material misstatements to the Group financial statements. | | We centrally managed the work performed by component audit teams at BPOs and BSCs, which consisted of controls and substantive testing, and we conducted oversight visits to key BSC and BPO sites in Group audit scope (namely India, Malaysia, Romania, the US and the UK) to direct the work performed. We evaluated the design and tested the operating effectiveness of key automated and manual controls both before and after the migration into the centralised processing environment, including IT general controls and controls in respect of data migration between ERP systems. We also substantively tested the accuracy and completeness of data migration into the new ERP along with the controls over this process. |
| |
| | |
Investigations into the Group’s commercial operations Refer to Notes 3, 29 and 45 in the Group financial statements. The Group remains subject to an ongoing investigation into its commercial operations by the SFO in the UK. At 31 December 2017, the Group concluded that it does not have sufficient clarity on the likely timing of the completion of this investigation nor is it able to make a sufficiently reliable estimate of any fine or penalty that the SFO might impose on the Group on completion of its investigation. As a result, the Group has stated in Note 45 that it is unable to recognise a provision for its estimate of the eventual outcome. In addition, the Group continues to carry out its own investigations in a number of markets to ascertain whether inappropriate commercial operations may have taken place. We focused on the following risks, which might have a material impact on the Group’s financial statements: – That a fine and penalty might be forthcoming in respect of ongoing investigation into the Group’s commercial operations by the SFO, which could give rise to the need for a material provision; and – That inappropriate activities have occurred, which could also give rise to material fines or penalties or result in asset impairments. | | We met with the directors, management andin-house legal counsel and we spoke with the Group’s external advisors to assess the risk of occurrence of inappropriate activities, the status of ongoing investigations and the potential for further fines and penalties. This included understanding and evaluating the Group’s internal investigations processes, which assess risks and allegations reported through various channels including whistle-blowing hotlines. We also evaluated the ongoing enhancements and changes that have been made to other control processes and business practices in recent years. Deploying our forensic specialists, we assessed the scope and findings of the investigative work performed by the Group as well as the risk assessment exercise that management has performed into third party interaction and engagement more broadly. We used the output of this assessment to instruct component teams (including certain markets not otherwise included in Group audit scope) to undertake risk-focused audit procedures to address the audit risk that the Group financial statements might be materially misstated due to the potential financial implications of alleged illegal acts. In respect of the SFO investigation, we independently circularised and spoke with external legal counsel engaged by the Group to obtain its views about the status of the investigation and to ascertain the reasonableness of management’s assertions in respect of the likely outcome and the related disclosures in the Group financial statements. We were satisfied with the Group’s provisioning decisions at 31 December 2017 in the context of the Group financial statements taken as a whole and with the adequacy of the disclosures given the status of investigations. |
| |
| |
| | |
| 154 | | |
GSK Annual Report 2017 | | |
| | |
| | |
Independent Auditors’ reportcontinued
Report on the Group financial statementscontinued
How we tailored the audit scope
We tailored the scope of our audit to ensure that we performed enough work to be able to give an opinion on the financial statements as a whole, taking into account the structure of the Group, the accounting processes and controls and the industry in which it operates.
The Group financial statements are a consolidation of over 500 reporting components. We identified 18 reporting components that, in our view, required an audit of their complete financial information due to their size or risk characteristics. This excludes 13 central adjustment entities audited at a Group level. Specific audit procedures over significant balances and transactions were performed at a further 49 reporting components to give appropriate coverage of all material balances. Where these reporting components are supported by shared financial service centres, these centres were also included in Group audit scope. None of the reporting components not included in our Group audit scope individually contributed more than 2% to consolidated revenue, profit before tax or profit before tax adjusted for certain items used to determine our materiality.
Where the work was performed by component auditors, we determined the level of involvement we needed to have in the audit work at those reporting component units. As a result, 10 overseas components were visited by senior members of the Group audit team, including each of the Group’s financially significant components in the US (which are visited at least annually) as well as Japan, India, Switzerland, Italy, Brazil, Korea, Germany and Belgium. In addition, we visited six of the overseas shared service centres supporting reporting components in Group audit scope. For those components in Group audit scope where a site visit was not undertaken, our involvement included regular dialogue with our component teams and review of component auditor work papers.
Further specific audit procedures over central functions, the Group consolidation and areas of significant judgement (including taxation, goodwill, intangible assets, treasury, post-retirement benefits and the elimination of unrealised intercompany profit in inventory) were directly led by the Group audit team.
Taken together, the territories and functions where we performed our audit work accounted for 70% of consolidated revenue, 74% of consolidated profit before tax and 78% of profit before tax adjusted for certain items used to determine our materiality. This was before considering the contribution to our audit evidence from performing audit work at the divisional and Group levels, including testing of monitoring controls and disaggregated analytical review procedures, which covers a significant portion of the Group’s smaller and lower risk components that were not directly included in our Group audit scope. In addition, we obtained indirect audit evidence over certainout-of-scope components through the procedures we undertook at the Group’s shared service centres, encompassing BPOs and BSCs, and over centralised IT infrastructure where these processes are standardised.
| | | | |
| GSK Annual Report 2017 | | Strategic report | | |
| | Governance and remuneration | | |
| | Financial statements | | |
| | Investor information | | |
Report on the Group financial statementscontinued
Materiality
The scope of our audit was influenced by our application of materiality. We set certain quantitative thresholds for materiality. These, together with qualitative considerations, helped us to determine the scope of our audit and the nature, timing and extent of our audit procedures on the individual financial statement line items and disclosures and in evaluating the effect of misstatements, both individually and in aggregate on the financial statements as a whole.
Based on our professional judgement, we determined materiality for the financial statements as a whole as follows:
| | |
Overall group materiality | | £290 million (2016 – £260 million). |
How we determined it | | 4% of profit before tax, adding back certain items including there-measurement charges for Shionogi-ViiV Healthcare contingent consideration (£556 million) and Vaccines contingent consideration (£101 million), there-measurement charges for the Consumer Healthcare put option liability (£986 million), the ViiV put optionre-measurement credit (£126 million), there-measurement of acquisition related liabilities as a result of US tax reform (£666 million), major restructuring costs (£1,060 million), significant legal costs (£68 million) and impairment of intangible assets (£688 million) and deducting net income relating to the gain on disposal of assets (£314 million). |
Rationale for benchmark applied | | The Group’s principal measure of earnings comprises adjusted results, which adds back to statutory results a number of items of income and expenditure including those detailed above. Management uses this measure as it believes that it eliminates material unusual ornon-operational items that may obscure the key trends and factors determining the Group’s operational performance. We took this measure into account in determining our materiality, except that we did not adjust profit before tax to add back amortisation of intangible assets and certain other smaller adjusting items as in our view these are recurring items which do not introduce volatility to the Group’s earnings. |
For each component in the scope of our Group audit, we allocated a materiality that is less than our overall Group materiality. The range of materiality allocated across components was between £15 million and £154 million. Certain components were audited to a local statutory audit materiality that was also less than our overall Group materiality.
We agreed with the Audit & Risk Committee that we would report to it misstatements identified during our audit above £10 million (2016 – £10 million) as well as misstatements below that amount that, in our view, warranted reporting for qualitative reasons.
Going concern
In accordance with ISAs (UK) we report as follows:
| | |
Reporting obligation | | Outcome |
We are required to report if we have anything material to add or draw attention to in respect of the directors’ statement in the financial statements about whether the directors considered it appropriate to adopt the going concern basis of accounting in preparing the financial statements and the directors’ identification of any material uncertainties to the Group’s ability to continue as a going concern over a period of at least twelve months from the date of approval of the financial statements. | | We have nothing material to add or to draw attention to. However, because not all future events or conditions can be predicted, this statement is not a guarantee as to the Group’s ability to continue as a going concern. |
We are required to report if the directors’ statement relating to going concern in accordance with Listing Rule 9.8.6R(3) is materially inconsistent with our knowledge obtained in the audit. | | We have nothing to report. |
| | |
| 156 | | |
GSK Annual Report 2017 | | |
| | |
| | |
Independent Auditors’ reportcontinued
Reporting on other information
Reporting on other information
The other information comprises all of the information in the Annual Report other than the financial statements and our auditors’ report thereon. The directors are responsible for the other information. Our opinion on the financial statements does not cover the other information and, accordingly, we do not express an audit opinion or, except to the extent otherwise explicitly stated in this report, any form of assurance thereon.
In connection with our audit of the financial statements, our responsibility is to read the other information and, in doing so, consider whether the other information is materially inconsistent with the financial statements or our knowledge obtained in the audit, or otherwise appears to be materially misstated. If we identify an apparent material inconsistency or material misstatement, we are required to perform procedures to conclude whether there is a material misstatement of the financial statements or a material misstatement of the other information. If, based on the work we have performed, we conclude that there is a material misstatement of this other information, we are required to report that fact. We have nothing to report based on these responsibilities.
With respect to the Strategic Report and Directors’ Report, we also considered whether the disclosures required by the UK Companies Act 2006 have been included.
Based on the responsibilities described above and our work undertaken in the course of the audit, the Companies Act 2006, (CA06), ISAs (UK) and the Listing Rules of the Financial Conduct Authority (FCA) require us also to report certain opinions and matters as described below (required by ISAs (UK) unless otherwise stated).
Strategic Report and Directors’ Report
In our opinion, based on the work undertaken in the course of the audit, the information given in the Strategic Report and Directors’ Report for the year ended 31 December 2017 is consistent with the financial statements and has been prepared in accordance with applicable legal requirements. (CA06)
In light of the knowledge and understanding of the Group and its environment obtained in the course of the audit, we did not identify any material misstatements in the Strategic Report and Directors’ Report. (CA06)
The directors’ assessment of the prospects of the Group and of the principal risks that would threaten the solvency or liquidity of the Group
We have nothing material to add or draw attention to regarding:
– The directors’ confirmation on page 105 of the Annual Report that they have carried out a robust assessment of the principal risks facing the Group, including those that would threaten its business model, future performance, solvency or liquidity;
– The disclosures in the Annual Report that describe those risks and explain how they are being managed or mitigated; and
– The directors’ explanation on page 57 of the Annual Report as to how they have assessed the prospects of the Group, over what period they have done so and why they consider that period to be appropriate, and their statement as to whether they have a reasonable expectation that the Group will be able to continue in operation and meet its liabilities as they fall due over the period of their assessment, including any related disclosures drawing attention to any necessary qualifications or assumptions.
We have nothing to report having performed a review of the directors’ statement that they have carried out a robust assessment of the principal risks facing the Group and statement in relation to the longer-term viability of the Group. Our review was substantially less in scope than an audit and only consisted of making inquiries and considering the directors’ process supporting their statements; checking that the statements are in alignment with the relevant provisions of the UK Corporate Governance Code (the “Code”); and considering whether the statements are consistent with the knowledge and understanding of the Group its environment obtained in the course of the audit. (Listing Rules)
Other Code provisions
We have nothing to report in respect of our responsibility to report when:
– The statement given by the directors, on page 104, that they consider the Annual Report taken as a whole to be fair, balanced and understandable, and provides the information necessary for the members to assess the Group’s position and performance, business model and strategy is materially inconsistent with our knowledge of the Group obtained in the course of performing our audit;
– The section of the Annual Report on pages 99 to 106 describing the work of the Audit & Risk Committee does not appropriately address matters communicated by us to the Audit & Risk Committee; and
– The directors’ statement relating to the parent company’s compliance with the Code does not properly disclose a departure from a relevant provision of the Code specified, under the Listing Rules, for review by the auditors.
| | | | |
| 157 | | |
| | | | | |
| GSK Annual Report 2017 | | Strategic report | | |
| | Governance and remuneration | | |
| | Financial statements | | |
| | Investor information | | |
Responsibilities for the financial statements and the audit
Responsibilities of the directors for the financial statements
As explained more fully in the directors’ statement of responsibilities set out on page 148, the directors are responsible for the preparation of the financial statements in accordance with the applicable framework and for being satisfied that they give a true and fair view. The directors are also responsible for such internal control as they determine is necessary to enable the preparation of financial statements that are free from material misstatement, whether due to fraud or error.
In preparing the financial statements, the directors are responsible for assessing the Group’s ability to continue as a going concern, disclosing as applicable, matters related to going concern and using the going concern basis of accounting unless the directors either intend to liquidate the Group or to cease operations or have no realistic alternative but to do so.
Auditors’ responsibilities for the audit of the financial statements
Our objectives are to obtain reasonable assurance about whether the financial statements as a whole are free from material misstatement, whether due to fraud or error, and to issue an auditors’ report that includes our opinion. Reasonable assurance is a high level of assurance, but is not a guarantee that an audit conducted in accordance with ISAs (UK) will always detect a material misstatement when it exists. Misstatements can arise from fraud or error and are considered material if, individually or in the aggregate, they could reasonably be expected to influence the economic decisions of users taken on the basis of these financial statements.
A further description of our responsibilities for the audit of the financial statements is located on the FRC’s website at: www.frc.org. uk/auditorsresponsibilities. This description forms part of our auditors’ report.
Use of this report
This report, including the opinions, has been prepared for and only for the parent Company’s members as a body in accordance with Chapter 3 of Part 16 of the Companies Act 2006 and for no other purpose. We do not, in giving these opinions, accept or assume responsibility for any other purpose or to any other person to whom this report is shown or into whose hands it may come save where expressly agreed by our prior consent in writing.
Companies Act 2006 exception reporting
Under the Companies Act 2006 we are required to report to you if, in our opinion:
– we have not received all the information and explanations we require for our audit; or
– certain disclosures of directors’ remuneration specified by law are not made.
We have no exceptions to report arising from this responsibility.
Appointment
We have audited the Group since its inception in 2000 and our legacy firms were previously auditors to certain of the Group’s legacy components since at least 1974 (which is as far back as records can be obtained). The period of total uninterrupted engagement is at least 44 years, covering, as a minimum, the years ended 31 December 1974 to 31 December 2017. The year ended 31 December 2017 is the final year of engagement following the Group’s decision to rotate the external audit.
Other matters
We have reported separately on the parent company financial statements of GlaxoSmithKline plc for the year ended 31 December 2017.
The parent company has passed a resolution in accordance with section 506 of the Companies Act that the senior statutory auditor’s name should not be stated.
PricewaterhouseCoopers LLP
Chartered Accountants and Statutory Auditors
London
12 March 2018
| | |
| 158 | | |
GSK Annual Report 2017 | | |
| | |
| | |
Consolidated income statement
for the year ended 31 December 2017
| | | | | | | | | | | | | | | | |
| | | | | | 2017 | | | 2016 | | | 2015 | |
| | | Notes | | | £m | | | £m | | | £m | |
| Turnover | | 6 | | | 30,186 | | | 27,889 | | | 23,923 | |
| | | | |
| Cost of sales | | | | | (10,342) | | | (9,290) | | | (8,853) | |
| | | | |
| Gross profit | | | | | 19,844 | | | 18,599 | | | 15,070 | |
| | | | |
| Selling, general and administration | | | | | (9,672) | | | (9,366) | | | (9,232) | |
| | | | |
| Research and development | | | | | (4,476) | | | (3,628) | | | (3,560) | |
| | | | |
| Royalty income | | | | | 356 | | | 398 | | | 329 | |
| | | | |
| Other operating income/(expense) | | 7 | | | (1,965) | | | (3,405) | | | 7,715 | |
| | | | |
Operating profit | | | 8 | | | | 4,087 | | | | 2,598 | | | | 10,322 | |
| | | | |
| Finance income | | 11 | | | 65 | | | 72 | | | 104 | |
| | | | |
| Finance expense | | 12 | | | (734) | | | (736) | | | (757) | |
| | | | |
| Profit on disposal of interest in associates | | | | | 94 | | | – | | | 843 | |
| | | | |
| Share of after tax profits of associates and joint ventures | | 13 | | | 13 | | | 5 | | | 14 | |
| | | | |
Profit before taxation | | | | | | | 3,525 | | | | 1,939 | | | | 10,526 | |
| | | | |
| Taxation | | 14 | | | (1,356) | | | (877) | | | (2,154) | |
| | | | |
| Profit after taxation for the year | | | | | 2,169 | | | 1,062 | | | 8,372 | |
| | | | |
| Profit/(loss) attributable tonon-controlling interests | | | | | 637 | | | 150 | | | (50) | |
| | | | |
| Profit attributable to shareholders | | | | | 1,532 | | | 912 | | | 8,422 | |
| | | | | | 2,169 | | | 1,062 | | | 8,372 | |
Basic earnings per share (pence) | | | 15 | | | | 31.4p | | | | 18.8p | | | | 174.3p | |
| | | | |
| Diluted earnings per share (pence) | | 15 | | | 31.0p | | | 18.6p | | | 172.3p | |
|
Consolidated statement of comprehensive income for the year ended 31 December 2017 | |
| | | | | | 2017 | | | 2016 | | | 2015 | |
| | | | | | £m | | | £m | | | £m | |
| | | | |
| Profit for the year | | | | | 2,169 | | | 1,062 | | | 8,372 | |
| | | | |
| Items that may be subsequently reclassified to income statement: | | | | | | | | | | | | |
| | | | |
| Exchange movements on overseas net assets and net investment hedges | | 34 | | | 462 | | | 646 | | | (618) | |
| | | | |
| Reclassification of exchange on liquidation or disposal of overseas subsidiaries | | 34 | | | 109 | | | – | | | – | |
| | | | |
| Fair value movements onavailable-for-sale investments | | | | | (14) | | | 251 | | | 416 | |
| | | | |
| Deferred tax on fair value movements onavailable-for-sale investments | | | | | 47 | | | – | | | (91) | |
| | | | |
| Reclassification of fair value movements onavailable-for-sale investments | | | | | (42) | | | (245) | | | (346) | |
| | | | |
| Deferred tax reversed on reclassification ofavailable-for-sale investments | | | | | (18) | | | 51 | | | 36 | |
| | | | |
| Fair value movements on cash flow hedges | | | | | (10) | | | 2 | | | 2 | |
| | | | |
| Deferred tax on fair value movements on cash flow hedges | | | | | – | | | 2 | | | – | |
| | | | |
| Reclassification of cash flow hedges to income statement | | | | | – | | | 1 | | | 2 | |
| | | | |
| Share of other comprehensive expense of associates and joint ventures | | | | | – | | | – | | | (77) | |
| | | | | | 534 | | | 708 | | | (676) | |
| | | | |
| Items that will not be reclassified to income statement: | | | | | | | | | | | | |
| | | | |
| Exchange movements on overseas net assets ofnon-controlling interests | | 34 | | | (149) | | | 603 | | | 8 | |
| | | | |
| Remeasurement gains/(losses) on defined benefit plans | | | | | 549 | | | (475) | | | 261 | |
| | | | |
| Tax on remeasurement of defined benefit plans | | | | | (221) | | | 126 | | | (80) | |
| | | | | | 179 | | | 254 | | | 189 | |
| Other comprehensive income/(expense) for the year | | 34 | | | 713 | | | 962 | | | (487) | |
| Total comprehensive income for the year | | | | | 2,882 | | | 2,024 | | | 7,885 | |
| | | | |
| Total comprehensive income for the year attributable to: | | | | | | | | | | | | |
| | | | |
| Shareholders | | | | | 2,394 | | | 1,271 | | | 7,927 | |
| | | | |
| Non-controlling interests | | | | | 488 | | | 753 | | | (42) | |
| Total comprehensive income for the year | | | | | 2,882 | | | 2,024 | | | 7,885 | |
| | | | |
| 159 | | |
| | | | | |
| GSK Annual Report 2017 | | Strategic report | | |
| | Governance and remuneration | | |
| | Financial statements | | |
| | Investor information | | |
Consolidated balance sheet
as at 31 December 2017
| | | | | | |
| | | | | 2017 | | 2016 |
| | | Notes | | £m | | £m |
| Non-current assets | | | | | | |
| | | |
| Property, plant and equipment | | 17 | | 10,860 | | 10,808 |
| | | |
| Goodwill | | 18 | | 5,734 | | 5,965 |
| | | |
| Other intangible assets | | 19 | | 17,562 | | 18,776 |
| | | |
| Investments in associates and joint ventures | | 20 | | 183 | | 263 |
| | | |
| Other investments | | 21 | | 918 | | 985 |
| | | |
| Deferred tax assets | | 14 | | 3,796 | | 4,374 |
| | | |
| Derivative financial instruments | | 42 | | 8 | | – |
| | | |
| Othernon-current assets | | 22 | | 1,413 | | 1,199 |
| Totalnon-current assets | | | | 40,474 | | 42,370 |
| | | |
| Current assets | | | | | | |
| | | |
| Inventories | | 23 | | 5,557 | | 5,102 |
| | | |
| Current tax recoverable | | 14 | | 258 | | 226 |
| | | |
| Trade and other receivables | | 24 | | 6,000 | | 6,026 |
| | | |
| Derivative financial instruments | | 42 | | 68 | | 156 |
| | | |
| Liquid investments | | 31 | | 78 | | 89 |
| | | |
| Cash and cash equivalents | | 25 | | 3,833 | | 4,897 |
| | | |
| Assets held for sale | | 26 | | 113 | | 215 |
| Total current assets | | | | 15,907 | | 16,711 |
| Total assets | | | | 56,381 | | 59,081 |
| | | |
| Current liabilities | | | | | | |
| | | |
| Short-term borrowings | | 31 | | (2,825) | | (4,129) |
| | | |
| Contingent consideration liabilities | | 39 | | (1,076) | | (561) |
| | | |
| Trade and other payables | | 27 | | (20,970) | | (11,964) |
| | | |
| Derivative financial instruments | | 42 | | (74) | | (194) |
| | | |
| Current tax payable | | 14 | | (995) | | (1,305) |
| | | |
| Short-term provisions | | 29 | | (629) | | (848) |
| Total current liabilities | | | | (26,569) | | (19,001) |
| | | |
| Non-current liabilities | | | | | | |
| | | |
| Long-term borrowings | | 31 | | (14,264) | | (14,661) |
| | | |
| Corporation tax payable | | 14 | | (411) | | – |
| | | |
| Deferred tax liabilities | | 14 | | (1,396) | | (1,934) |
| | | |
| Pensions and other post-employment benefits | | 28 | | (3,539) | | (4,090) |
| | | |
| Other provisions | | 29 | | (636) | | (652) |
| | | |
| Contingent consideration liabilities | | 39 | | (5,096) | | (5,335) |
| | | |
| Othernon-current liabilities | | 30 | | (981) | | (8,445) |
| Totalnon-current liabilities | | | | (26,323) | | (35,117) |
| Total liabilities | | | | (52,892) | | (54,118) |
| Net assets | | | | 3,489 | | 4,963 |
| | | |
| Equity | | | | | | |
| | | |
| Share capital | | 33 | | 1,343 | | 1,342 |
| | | |
| Share premium account | | 33 | | 3,019 | | 2,954 |
| | | |
| Retained earnings | | 34 | | (6,477) | | (5,392) |
| | | |
| Other reserves | | 34 | | 2,047 | | 2,220 |
| Shareholders’ equity | | | | (68) | | 1,124 |
| Non-controlling interests | | | | 3,557 | | 3,839 |
| Total equity | | | | 3,489 | | 4,963 |
The financial statements on pages 158 to 232 were approved by the Board on 12 March 2018 and signed on its behalf by
Philip Hampton
Chairman
| | |
| 160 | | |
GSK Annual Report 2017 | | |
| | |
| | |
Consolidated statement of changes in equity
for the year ended 31 December 2017
| | | | | | | | | | | | | | | | | | | | | | | | | | | | |
| | | | | | | | | | | | Shareholders’ equity | | | | | | | |
| | | Share | | | Share | | | Retained | | | Other | | | | | | Non-controlling | | | Total | |
| | | capital | | | premium | | | earnings | | | reserves | | | Total | | | interests | | | equity | |
| | | £m | | | £m | | | £m | | | £m | | | £m | | | £m | | | £m | |
At 1 January 2015 | | | 1,339 | | | | 2,759 | | | | (2,074 | ) | | | 2,239 | | | | 4,263 | | | | 673 | | | | 4,936 | |
| | | | | | | |
Profit/(loss) for the year | | | – | | | | – | | | | 8,422 | | | | – | | | | 8,422 | | | | (50 | ) | | | 8,372 | |
| | | | | | | |
Other comprehensive (expense)/income for the year | | | – | | | | – | | | | (520 | ) | | | 25 | | | | (495 | ) | | | 8 | | | | (487 | ) |
Total comprehensive income/(expense) for the year | | | – | | | | – | | | | 7,902 | | | | 25 | | | | 7,927 | | | | (42 | ) | | | 7,885 | |
| | | | | | | |
Distributions tonon-controlling interests | | | – | | | | – | | | | – | | | | – | | | | – | | | | (237 | ) | | | (237 | ) |
| | | | | | | |
Dividends to shareholders | | | – | | | | – | | | | (3,874 | ) | | | – | | | | (3,874 | ) | | | – | | | | (3,874 | ) |
| | | | | | | |
Gains on transfer of net assets into Consumer Healthcare Joint Venture | | | – | | | | – | | | | 2,891 | | | | – | | | | 2,891 | | | | – | | | | 2,891 | |
| | | | | | | |
Consumer Healthcare Joint Venture put option | | | – | | | | – | | | | (6,204 | ) | | | – | | | | (6,204 | ) | | | – | | | | (6,204 | ) |
| | | | | | | |
Changes innon-controlling interests | | | – | | | | – | | | | – | | | | – | | | | – | | | | 3,370 | | | | 3,370 | |
| | | | | | | |
Loss on transfer of equity investment to investment in associate | | | – | | | | – | | | | (229 | ) | | | – | | | | (229 | ) | | | – | | | | (229 | ) |
| | | | | | | |
Ordinary Shares issued | | | 1 | | | | 72 | | | | – | | | | – | | | | 73 | | | | – | | | | 73 | |
| | | | | | | |
Ordinary Shares acquired by ESOP Trusts | | | – | | | | – | | | | – | | | | (99 | ) | | | (99 | ) | | | – | | | | (99 | ) |
| | | | | | | |
Write-down of shares held by ESOP Trusts | | | – | | | | – | | | | (175 | ) | | | 175 | | | | – | | | | – | | | | – | |
| | | | | | | |
Share-based incentive plans | | | – | | | | – | | | | 356 | | | | – | | | | 356 | | | | – | | | | 356 | |
| | | | | | | |
Tax on share-based incentive plans | | | – | | | | – | | | | 10 | | | | – | | | | 10 | | | | – | | | | 10 | |
At 31 December 2015 | | | 1,340 | | | | 2,831 | | | | (1,397 | ) | | | 2,340 | | | | 5,114 | | | | 3,764 | | | | 8,878 | |
| | | | | | | |
Profit for the year | | | – | | | | – | | | | 912 | | | | – | | | | 912 | | | | 150 | | | | 1,062 | |
| | | | | | | |
Other comprehensive income for the year | | | – | | | | – | | | | 284 | | | | 75 | | | | 359 | | | | 603 | | | | 962 | |
Total comprehensive income for the year | | | – | | | | – | | | | 1,196 | | | | 75 | | | | 1,271 | | | | 753 | | | | 2,024 | |
| | | | | | | |
Distributions tonon-controlling interests | | | – | | | | – | | | | – | | | | – | | | | – | | | | (534 | ) | | | (534 | ) |
| | | | | | | |
Dividends to shareholders | | | – | | | | – | | | | (4,850 | ) | | | – | | | | (4,850 | ) | | | – | | | | (4,850 | ) |
| | | | | | | |
Recognition of liabilities withnon-controlling interests | | | – | | | | – | | | | (2,013 | ) | | | – | | | | (2,013 | ) | | | (159 | ) | | | (2,172 | ) |
| | | | | | | |
De-recognition of liabilities withnon-controlling interests | | | – | | | | – | | | | 1,244 | | | | – | | | | 1,244 | | | | – | | | | 1,244 | |
| | | | | | | |
Changes innon-controlling interests | | | – | | | | – | | | | 17 | | | | – | | | | 17 | | | | 15 | | | | 32 | |
| | | | | | | |
Ordinary Shares issued | | | 2 | | | | 87 | | | | – | | | | – | | | | 89 | | | | – | | | | 89 | |
| | | | | | | |
Ordinary Shares acquired by ESOP Trusts | | | – | | | | 36 | | | | 466 | | | | (576 | ) | | | (74 | ) | | | – | | | | (74 | ) |
| | | | | | | |
Write-down of shares held by ESOP Trusts | | | – | | | | – | | | | (381 | ) | | | 381 | | | | – | | | | – | | | | – | |
| | | | | | | |
Share-based incentive plans | | | – | | | | – | | | | 319 | | | | – | | | | 319 | | | | – | | | | 319 | |
| | | | | | | |
Tax on share-based incentive plans | | | – | | | | – | | | | 7 | | | | – | | | | 7 | | | | – | | | | 7 | |
At 31 December 2016 | | | 1,342 | | | | 2,954 | | | | (5,392 | ) | | | 2,220 | | | | 1,124 | | | | 3,839 | | | | 4,963 | |
| | | | | | | |
Profit for the year | | | – | | | | – | | | | 1,532 | | | | – | | | | 1,532 | | | | 637 | | | | 2,169 | |
| | | | | | | |
Other comprehensive income for the year | | | – | | | | – | | | | 899 | | | | (37 | ) | | | 862 | | | | (149 | ) | | | 713 | |
Total comprehensive income for the year | | | – | | | | – | | | | 2,431 | | | | (37 | ) | | | 2,394 | | | | 488 | | | | 2,882 | |
| | | | | | | |
Distributions tonon-controlling interests | | | – | | | | – | | | | – | | | | – | | | | – | | | | (789 | ) | | | (789 | ) |
| | | | | | | |
Contribution fromnon-controlling interests | | | – | | | | – | | | | – | | | | – | | | | – | | | | 21 | | | | 21 | |
| | | | | | | |
Dividends to shareholders | | | – | | | | – | | | | (3,906 | ) | | | – | | | | (3,906 | ) | | | – | | | | (3,906 | ) |
| | | | | | | |
Changes innon-controlling interests | | | – | | | | – | | | | – | | | | – | | | | – | | | | (2 | ) | | | (2 | ) |
| | | | | | | |
Ordinary Shares issued | | | 1 | | | | 55 | | | | – | | | | – | | | | 56 | | | | – | | | | 56 | |
| | | | | | | |
Ordinary Shares acquired by ESOP Trusts | | | – | | | | 10 | | | | 581 | | | | (656 | ) | | | (65 | ) | | | – | | | | (65 | ) |
| | | | | | | |
Write-down of shares held by ESOP Trusts | | | – | | | | – | | | | (520 | ) | | | 520 | | | | – | | | | – | | | | – | |
| | | | | | | |
Share-based incentive plans | | | – | | | | – | | | | 333 | | | | – | | | | 333 | | | | – | | | | 333 | |
| | | | | | | |
Tax on share-based incentive plans | | | – | | | | – | | | | (4 | ) | | | – | | | | (4 | ) | | | – | | | | (4 | ) |
At 31 December 2017 | | | 1,343 | | | | 3,019 | | | | (6,477 | ) | | | 2,047 | | | | (68 | ) | | | 3,557 | | | | 3,489 | |
| | | | |
| 161 | | |
| | | | | |
| GSK Annual Report 2017 | | Strategic report | | |
| | Governance and remuneration | | |
| | Financial statements | | |
| | Investor information | | |
Consolidated cash flow statement
for the year ended 31 December 2017
| | | | | | | | | | | | | | | | |
| | | | | | 2017 | | | 2016 | | | 2015 | |
| | | Notes | | | £m | | | £m | | | £m | |
Cash flow from operating activities | | | | | | | | | | | | | | | | |
| | | | |
Profit after taxation for the year | | | | | | | 2,169 | | | | 1,062 | | | | 8,372 | |
| | | | |
Adjustments reconciling profit after tax to operating cash flows | | | 36 | | | | 6,089 | | | | 7,044 | | | | (3,741 | ) |
| | | | |
Cash generated from operations | | | | | | | 8,258 | | | | 8,106 | | | | 4,631 | |
| | | | |
Taxation paid | | | | | | | (1,340 | ) | | | (1,609 | ) | | | (2,062 | ) |
Net cash inflow from operating activities | | | | | | | 6,918 | | | | 6,497 | | | | 2,569 | |
| | | | |
Cash flow from investing activities | | | | | | | | | | | | | | | | |
| | | | |
Purchase of property, plant and equipment | | | | | | | (1,545 | ) | | | (1,543 | ) | | | (1,380 | ) |
| | | | |
Proceeds from sale of property, plant and equipment | | | | | | | 281 | | | | 98 | | | | 72 | |
| | | | |
Purchase of intangible assets | | | | | | | (657 | ) | | | (809 | ) | | | (521 | ) |
| | | | |
Proceeds from sale of intangible assets | | | | | | | 48 | | | | 283 | | | | 236 | |
| | | | |
Purchase of equity investments | | | | | | | (80 | ) | | | (96 | ) | | | (82 | ) |
| | | | |
Proceeds from sale of equity investments | | | | | | | 64 | | | | 683 | | | | 357 | |
| | | | |
Contingent consideration paid | | | | | | | (91 | ) | | | (73 | ) | | | (338 | ) |
| | | | |
Purchase of businesses, net of cash acquired | | | 38 | | | | – | | | | 17 | | | | (3,203 | ) |
| | | | |
Disposal of businesses | | | 38 | | | | 282 | | | | 72 | | | | 10,246 | |
| | | | |
Investments in associates and joint ventures | | | 20 | | | | (15 | ) | | | (11 | ) | | | (16 | ) |
| | | | |
Proceeds from disposal of subsidiary and interest in associate | | | | | | | 196 | | | | – | | | | 564 | |
| | | | |
Decrease/(increase) in liquid investments | | | | | | | 4 | | | | – | | | | (2 | ) |
| | | | |
Interest received | | | | | | | 64 | | | | 68 | | | | 99 | |
| | | | |
Dividends from associates, joint ventures and equity investments | | | | | | | 6 | | | | 42 | | | | 5 | |
Net cash (outflow)/inflow from investing activities | | | | | | | (1,443 | ) | | | (1,269 | ) | | | 6,037 | |
| | | | |
Cash flow from financing activities | | | | | | | | | | | | | | | | |
| | | | |
Shares acquired by ESOP Trusts | | | | | | | (65 | ) | | | (74 | ) | | | (99 | ) |
| | | | |
Issue of share capital | | | 33 | | | | 56 | | | | 89 | | | | 73 | |
| | | | |
Purchase ofnon-controlling interests | | | | | | | (29 | ) | | | – | | | | – | |
| | | | |
Increase in long-term loans | | | | | | | 2,233 | | | | – | | | | – | |
| | | | |
(Repayment of)/Increase in short-term loans | | | | | | | (3,200 | ) | | | 148 | | | | (2,412 | ) |
| | | | |
Net repayment of obligations under finance leases | | | | | | | (23 | ) | | | (18 | ) | | | (25 | ) |
| | | | |
Interest paid | | | | | | | (781 | ) | | | (732 | ) | | | (762 | ) |
| | | | |
Dividends paid to shareholders | | | | | | | (3,906 | ) | | | (4,850 | ) | | | (3,874 | ) |
| | | | |
Distributions tonon-controlling interests | | | | | | | (779 | ) | | | (534 | ) | | | (237 | ) |
| | | | |
Contributions fromnon-controlling interests | | | | | | | 21 | | | | – | | | | – | |
| | | | |
Other financing cash flows | | | | | | | 93 | | | | (421 | ) | | | 233 | |
Net cash outflow from financing activities | | | | | | | (6,380 | ) | | | (6,392 | ) | | | (7,103 | ) |
| | | | | |
| | | | | | | | | | | | | | | | |
(Decrease)/increase in cash and bank overdrafts | | | 37 | | | | (905 | ) | | | (1,164 | ) | | | 1,503 | |
| | | | |
Cash and bank overdrafts at beginning of year | | | | | | | 4,605 | | | | 5,486 | | | | 4,028 | |
| | | | |
Exchange adjustments | | | | | | | (100 | ) | | | 283 | | | | (45 | ) |
| | | | |
(Decrease)/increase in cash and bank overdrafts | | | | | | | (905 | ) | | | (1,164 | ) | | | 1,503 | |
Cash and bank overdrafts at end of year | | | | | | | 3,600 | | | | 4,605 | | | | 5,486 | |
| | | | |
Cash and bank overdrafts at end of year comprise: | | | | | | | | | | | | | | | | |
| | | | |
Cash and cash equivalents | | | | | | | 3,833 | | | | 4,897 | | | | 5,830 | |
| | | | |
Overdrafts | | | | | | | (233 | ) | | | (292 | ) | | | (344 | ) |
| | | | | | | | 3,600 | | | | 4,605 | | | | 5,486 | |
| | |
| 162 | | |
GSK Annual Report 2017 | | |
| | |
| | |
Notes to the financial statements
1. Presentation of the financial statements
Description of business
GSK is a major global healthcare group which is engaged in the creation and discovery, development, manufacture and marketing of pharmaceutical products, vaccines,over-the-counter (OTC) medicines and health-related consumer products. GSK’s principal pharmaceutical products include medicines in the following therapeutic areas: respiratory, HIV, immuno-inflammation, anti-virals, central nervous system, cardiovascular and urogenital, metabolic, anti-bacterials, dermatology and rare diseases.
Compliance with applicable law and IFRS
The financial statements have been prepared in accordance with the Companies Act 2006, Article 4 of the IAS Regulation and International Financial Reporting Standards (IFRS) and related interpretations, as adopted by the European Union.
The financial statements are also in compliance with IFRS as issued by the International Accounting Standards Board.
Composition of financial statements
The consolidated financial statements are drawn up in Sterling, the functional currency of GlaxoSmithKline plc, and in accordance with IFRS accounting presentation. The financial statements comprise:
| – | | Consolidated income statement |
| – | | Consolidated statement of comprehensive income |
| – | | Consolidated balance sheet |
| – | | Consolidated statement of changes in equity |
| – | | Consolidated cash flow statement |
| – | | Notes to the financial statements. |
Composition of the Group
A list of the subsidiaries and associates which, in the opinion of the Directors, principally affected the amount of profit or net assets of the Group is given in Note 44, ‘Principal Group companies’.
Accounting principles and policies
The financial statements have been prepared using the historical cost convention modified by the revaluation of certain items, as stated in the accounting policies, and on a going concern basis.
The financial statements have been prepared in accordance with the Group’s accounting policies approved by the Board and described in Note 2, ‘Accounting principles and policies’. Information on the application of these accounting policies, including areas of estimation and judgement is given in Note 3, ‘Key accounting judgements and estimates’.
The preparation of the financial statements in conformity with generally accepted accounting principles requires management to make estimates and assumptions that affect the reported amounts of assets and liabilities and disclosure of contingent assets and liabilities at the date of the financial statements and the reported amounts of revenues and expenses during the reporting period. Actual results could differ from those estimates.
Implementation of new accounting standards and interpretations
An agenda decision by the IFRS Interpretations Committee in September 2017 clarified that charges for interest on tax should be reported within finance expense and certain penalties on tax settlements should be reported within administrative expenses. Previously GSK had reported these charges within the overall tax charge in the income statement or other comprehensive income, as appropriate.
GSK has adopted the revised basis of reporting in 2017 and, as a result of a number of settlements during the year, has recorded credits for interest on tax for 2017 of £24 million in finance expense. There were no material charges for penalties on settlements during 2017 that required adjustment.
Accrued interest payable on tax at 31 December 2017 was £52 million, and this is included within trade and other payables on the Group balance sheet. The impact on prior years was not material and so prior year amounts have not been restated.
Financial period
These financial statements cover the financial year from 1 January to 31 December 2017, with comparative figures for the financial years from 1 January to 31 December 2016 and, where appropriate, from 1 January to 31 December 2015.
Parent company financial statements
The financial statements of the parent company, GlaxoSmithKline plc, have been prepared in accordance with UK GAAP and with UK accounting presentation. The company balance sheet is presented on page 239 and the accounting policies are given on page 240.
2. Accounting principles and policies
Consolidation
The consolidated financial statements include:
| – | | the assets and liabilities, and the results and cash flows, of the company and its subsidiaries, including ESOP Trusts |
| – | | the Group’s share of the results and net assets of associates and joint ventures |
| – | | the Group’s share of assets, liabilities, revenue and expenses of joint operations. |
The financial statements of entities consolidated are made up to 31 December each year.
Entities over which the Group has the power to direct the relevant activities so as to affect the returns to the Group, generally through control over the financial and operating policies, are accounted for as subsidiaries.
Where the Group has the ability to exercise joint control over, and rights to the net assets of, entities, the entities are accounted for as joint ventures. Where the Group has the ability to exercise joint control over an arrangement, but has rights to specified assets and obligations for specified liabilities of the arrangement, the arrangement is accounted for as a joint operation. Where the Group has the ability to exercise significant influence over entities, they are accounted for as associates. The results and assets and liabilities of associates and joint ventures are incorporated into the consolidated financial statements using the equity method of accounting. The Group’s rights to assets, liabilities, revenue and expenses of joint operations are included in the consolidated financial statements in accordance with those rights and obligations.
Interests acquired in entities are consolidated from the date the Group acquires control and interests sold arede-consolidated from the date control ceases.
| | | | |
| 163 | | |
| | | | | |
| GSK Annual Report 2017 | | Strategic report | | |
| | Governance and remuneration | | |
| | Financial statements | | |
| | Investor information | | |
2. Accounting principles and policiescontinued
Transactions and balances between subsidiaries are eliminated and no profit before tax is taken on sales between subsidiaries until the products are sold to customers outside the Group. The relevant proportion of profits on transactions with joint ventures, joint operations and associates is also deferred until the products are sold to third parties. Transactions withnon-controlling interests are recorded directly in equity. Deferred tax relief on unrealised intraGroup profit is accounted for only to the extent that it is considered recoverable.
Business combinations
Business combinations are accounted for using the acquisition accounting method. Identifiable assets, liabilities and contingent liabilities acquired are measured at fair value at acquisition date. The consideration transferred is measured at fair value and includes the fair value of any contingent consideration. Where the consideration transferred, together with thenon-controlling interest, exceeds the fair value of the net assets, liabilities and contingent liabilities acquired, the excess is recorded as goodwill. The costs of acquisition are charged to the income statement in the period in which they are incurred.
Goodwill is capitalised as a separate item in the case of subsidiaries and as part of the cost of investment in the case of joint ventures and associates. Goodwill is denominated in the currency of the operation acquired.
Where the cost of acquisition is below the fair value of the net assets acquired, the difference is recognised directly in the income statement.
Where not all of the equity of a subsidiary is acquired thenon-controlling interest is recognised either at fair value or at thenon-controlling interest’s share of the net assets of the subsidiary, on acase-by-case basis. Changes in the Group’s ownership percentage of subsidiaries are accounted for within equity.
Foreign currency translation
Foreign currency transactions are booked in the functional currency of the Group company at the exchange rate ruling on the date of transaction. Foreign currency monetary assets and liabilities are retranslated into the functional currency at rates of exchange ruling at the balance sheet date. Exchange differences are included in the income statement.
On consolidation, assets and liabilities, including related goodwill, of overseas subsidiaries, associates and joint ventures, are translated into Sterling at rates of exchange ruling at the balance sheet date. The results and cash flows of overseas subsidiaries, associates and joint ventures are translated into Sterling using average rates of exchange.
Exchange adjustments arising when the opening net assets and the profits for the year retained by overseas subsidiaries, associates and joint ventures are translated into Sterling, less exchange differences arising on related foreign currency borrowings which hedge the Group’s net investment in these operations, are taken to a separate component of equity.
When translating into Sterling the assets, liabilities, results and cash flows of overseas subsidiaries, associates and joint ventures which are reported in currencies of hyper-inflationary economies, adjustments are made where material to reflect current price levels. Any loss on net monetary assets is charged to the consolidated income statement.
Revenue
Revenue is recognised in the income statement when goods or services are supplied or made available to external customers against orders received, title and risk of loss is passed to the customer, reliable estimates can be made of relevant deductions and all relevant obligations have been fulfilled, such that the earnings process is regarded as being complete.
Turnover represents net invoice value after the deduction of discounts and allowances given and accruals for estimated future rebates and returns. The methodology and assumptions used to estimate rebates and returns are monitored and adjusted regularly in the light of contractual and legal obligations, historical trends, past experience and projected market conditions. Market conditions are evaluated using wholesaler and other third-party analyses, market research data and internally generated information. Value added tax and other sales taxes are excluded from revenue.
Where the Groupco-promotes a product and the counterparty records the sale, the Group records its share of revenue asco-promotion income within turnover. The nature ofco-promotion activities is such that the Group records no costs of sales. Pharmaceutical turnover includesco-promotion revenue of £16 million (2016 – £9 million; 2015 – £14 million). In addition, initial or event-based milestone income (excluding royalty income) arising on development or marketing collaborations of the Group’s compounds or products with other parties is recognised in turnover. No such income is included in turnover for all the periods presented.
Royalty income is recognised on an accruals basis in accordance with the terms of the relevant licensing agreements.
Expenditure
Expenditure is recognised in respect of goods and services received when supplied in accordance with contractual terms. Provision is made when an obligation exists for a future liability in respect of a past event and where the amount of the obligation can be reliably estimated. Manufacturingstart-up costs between validation and the achievement of normal production are expensed as incurred. Advertising and promotion expenditure is charged to the income statement as incurred. Shipment costs on inter-company transfers are charged to cost of sales; distribution costs on sales to customers are included in selling, general and administrative expenditure.
Restructuring costs are recognised and provided for, where appropriate, in respect of the direct expenditure of a business reorganisation where the plans are sufficiently detailed and well advanced, and where appropriate communication to those affected has been undertaken.
| | |
| 164 | | |
GSK Annual Report 2017 | | |
| | |
| | |
Notes to the financial statementscontinued
2. Accounting principles and policiescontinued
Research and development
Research and development expenditure is charged to the income statement in the period in which it is incurred. Development expenditure is capitalised when the criteria for recognising an asset are met, usually when a regulatory filing has been made in a major market and approval is considered highly probable. Property, plant and equipment used for research and development is capitalised and depreciated in accordance with the Group’s policy.
Environmental expenditure
Environmental expenditure related to existing conditions resulting from past or current operations and from which no current or future benefit is discernible is charged to the income statement. The Group recognises its liability on asite-by-site basis when it can be reliably estimated. This liability includes the Group’s portion of the total costs and also a portion of other potentially responsible parties’ costs when it is probable that they will not be able to satisfy their respective shares of theclean-up obligation. Recoveries of reimbursements are recorded as assets when virtually certain.
Legal and other disputes
Provision is made for the anticipated settlement costs of legal or other disputes against the Group where an outflow of resources is considered probable and a reliable estimate can be made of the likely outcome. In addition, provision is made for legal or other expenses arising from claims received or other disputes. In respect of product liability claims related to certain products, there is sufficient history of claims made and settlements to enable management to make a reliable estimate of the provision required to cover unasserted claims. In certain cases, an incurred but not reported (IBNR) actuarial technique is used to determine this estimate.
The Group may become involved in legal proceedings, in respect of which it is not possible to make a reliable estimate of the expected financial effect, if any, that could result from ultimate resolution of the proceedings. In these cases, appropriate disclosure about such cases would be included but no provision would be made. Costs associated with claims made by the Group against third parties are charged to the income statement as they are incurred.
Pensions and other post-employment benefits
The costs of providing pensions under defined benefit schemes are calculated using the projected unit credit method and spread over the period during which benefit is expected to be derived from the employees’ services, consistent with the advice of qualified actuaries. Pension obligations are measured as the present value of estimated future cash flows discounted at rates reflecting the yields of high quality corporate bonds. Pension scheme assets are measured at fair value at the balance sheet date.
The costs of other post-employment liabilities are calculated in a similar way to defined benefit pension schemes and spread over the period during which benefit is expected to be derived from the employees’ services, in accordance with the advice of qualified actuaries.
Actuarial gains and losses and the effect of changes in actuarial assumptions, are recognised in the statement of comprehensive income in the year in which they arise.
The Group’s contributions to defined contribution plans are charged to the income statement as incurred.
Employee share plans
Incentives in the form of shares are provided to employees under share option and share award schemes.
The fair values of these options and awards are calculated at their grant dates using a Black-Scholes option pricing model and charged to the income statement over the relevant vesting periods.
The Group provides finance to ESOP Trusts to purchase company shares to meet the obligation to provide shares when employees exercise their options or awards. Costs of running the ESOP Trusts are charged to the income statement. Shares held by the ESOP Trusts are deducted from other reserves. A transfer is made between other reserves and retained earnings over the vesting periods of the related share options or awards to reflect the ultimate proceeds receivable from employees on exercise.
Property, plant and equipment
Property, plant and equipment (PP&E) is stated at the cost of purchase or construction, less provisions for depreciation and impairment. Financing costs are capitalised within the cost of qualifying assets in construction.
Depreciation is calculated to write off the cost less residual value of PP&E, excluding freehold land, using the straight-line basis over the expected useful life. Residual values and lives are reviewed, and where appropriate adjusted annually. The normal expected useful lives of the major categories of PP&E are:
| | |
| Freehold buildings | | 20 to 50 years |
| Leasehold land and buildings | | Lease term or 20 to 50 years |
| Plant and machinery | | 10 to 20 years |
| Equipment and vehicles | | 3 to 10 years |
On disposal of PP&E, the cost and related accumulated depreciation and impairments are removed from the financial statements and the net amount, less any proceeds, is taken to the income statement.
Leases
Leasing agreements which transfer to the Group substantially all the benefits and risks of ownership of an asset are treated as finance leases, as if the asset had been purchased outright. The assets are included in PP&E or computer software and the capital elements of the leasing commitments are shown as obligations under finance leases. Assets held under finance leases are depreciated on a basis consistent with similar owned assets or the lease term, if shorter. The interest element of the lease rental is included in the income statement. All other leases are operating leases and the rental costs are charged to the income statement on a straight-line basis over the lease term.
Goodwill
Goodwill is stated at cost less impairments. Goodwill is deemed to have an indefinite useful life and is tested for impairment at least annually.
Where the fair value of the interest acquired in an entity’s assets, liabilities and contingent liabilities exceeds the consideration paid, this excess is recognised immediately as a gain in the income statement.
| | | | |
| 165 | | |
| | | | | |
| GSK Annual Report 2017 | | Strategic report | | |
| | Governance and remuneration | | |
| | Financial statements | | |
| | Investor information | | |
2. Accounting principles and policiescontinued
Other intangible assets
Intangible assets are stated at cost less provisions for amortisation and impairments.
Licences, patents,know-how and marketing rights separately acquired or acquired as part of a business combination are amortised over their estimated useful lives, generally not exceeding 20 years, using the straight-line basis, from the time they are available for use. The estimated useful lives for determining the amortisation charge take into account patent lives, where applicable, as well as the value obtained from periods ofnon-exclusivity. Asset lives are reviewed, and where appropriate adjusted, annually. Contingent milestone payments are recognised at the point that the contingent event becomes probable. Any development costs incurred by the Group and associated with acquired licences, patents,know-how or marketing rights are written off to the income statement when incurred, unless the criteria for recognition of an internally generated intangible asset are met, usually when a regulatory filing has been made in a major market and approval is considered highly probable.
Acquired brands are valued independently as part of the fair value of businesses acquired from third parties where the brand has a value which is substantial and long term and where the brands either are contractual or legal in nature or can be sold separately from the rest of the businesses acquired. Brands are amortised over their estimated useful lives of up to 20 years, except where it is considered that the useful economic life is indefinite.
The costs of acquiring and developing computer software for internal use and internet sites for external use are capitalised as intangible fixed assets where the software or site supports a significant business system and the expenditure leads to the creation of a durable asset. ERP systems software is amortised over seven to ten years and other computer software over three to five years.
Impairment ofnon-current assets
The carrying values of allnon-current assets are reviewed for impairment, either on a stand-alone basis or as part of a larger cash generating unit, when there is an indication that the assets might be impaired. Additionally, goodwill, intangible assets with indefinite useful lives and intangible assets which are not yet available for use are tested for impairment annually. Any provision for impairment is charged to the income statement in the year concerned.
Impairments of goodwill are not reversed. Impairment losses on othernon-current assets are only reversed if there has been a change in estimates used to determine recoverable amounts and only to the extent that the revised recoverable amounts do not exceed the carrying values that would have existed, net of depreciation or amortisation, had no impairments been recognised.
Investments in associates, joint ventures and joint operations
Investments in associates and joint ventures are carried in the consolidated balance sheet at the Group’s share of their net assets at date of acquisition and of their post-acquisition retained profits or losses together with any goodwill arising on the acquisition. The Group recognises its rights to assets, liabilities, revenue and expenses of joint operations.
Available-for-sale investments
Liquid investments and other investments are classified asavailable-for-sale investments and are initially recorded at fair value plus transaction costs and then remeasured at subsequent reporting dates to fair value. Unrealised gains and losses onavailable-for-sale investments are recognised directly in other comprehensive income. Impairments arising from the significant or prolonged decline in fair value of an equity investment reduce the carrying amount of the asset directly and are charged to the income statement.
On disposal or impairment of the investments, any gains and losses that have been deferred in other comprehensive income are reclassified to the income statement. Dividends on equity investments are recognised in the income statement when the Group’s right to receive payment is established. Equity investments are recorded innon-current assets unless they are expected to be sold within one year.
Purchases and sales of equity investments are accounted for on the trade date and purchases and sales of otheravailable-for-sale investments are accounted for on settlement date.
Inventories
Inventories are included in the financial statements at the lower of cost (including raw materials, direct labour, other direct costs and related production overheads) and net realisable value. Cost is generally determined on a first in, first out basis.Pre-launch inventory is held as an asset when there is a high probability of regulatory approval for the product. Before that point a provision is made against the carrying value to its recoverable amount; the provision is then reversed at the point when a high probability of regulatory approval is determined.
Trade receivables
Trade receivables are carried at original invoice amount less any provisions for doubtful debts. Provisions are made where there is evidence of a risk ofnon-payment, taking into account ageing, previous experience and general economic conditions. When a trade receivable is determined to be uncollectable it is written off, firstly against any provision available and then to the income statement.
Subsequent recoveries of amounts previously provided for are credited to the income statement. Long-term receivables are discounted where the effect is material.
Borrowings
All borrowings are initially recorded at the amount of proceeds received, net of transaction costs. Borrowings are subsequently carried at amortised cost, with the difference between the proceeds, net of transaction costs, and the amount due on redemption being recognised as a charge to the income statement over the period of the relevant borrowing.
| | |
| 166 | | |
GSK Annual Report 2017 | | |
| | |
| | |
Notes to the financial statementscontinued
2. Accounting principles and policiescontinued
Taxation
Current tax is provided at the amounts expected to be paid applying tax rates that have been enacted or substantively enacted by the balance sheet date.
Deferred tax is provided in full, on temporary differences arising between the tax bases of assets and liabilities and their carrying amounts in the financial statements. Deferred tax assets are recognised to the extent that it is probable that future taxable profits will be available against which the temporary differences can be utilised. Deferred tax is provided on temporary differences arising on investments in subsidiaries, associates and joint ventures, except where the timing of the reversal of the temporary difference can be controlled and it is probable that the temporary difference will not reverse in the foreseeable future. Deferred tax is provided using rates of tax that have been enacted or substantively enacted by the balance sheet date.
Derivative financial instruments and hedging
Derivative financial instruments are used to manage exposure to market risks. The principal derivative instruments used by GSK are foreign currency swaps, interest rate swaps, foreign exchange forward contracts and options. The Group does not hold or issue derivative financial instruments for trading or speculative purposes.
Derivative financial instruments are classified asheld-for-trading and are carried in the balance sheet at fair value. Derivatives designated as hedging instruments are classified on inception as cash flow hedges, net investment hedges or fair value hedges.
Changes in the fair value of derivatives designated as cash flow hedges are recognised in other comprehensive income to the extent that the hedges are effective. Ineffective portions are recognised in profit or loss immediately. Amounts deferred in other comprehensive income are reclassified to the income statement when the hedged item affects profit or loss.
Net investment hedges are accounted for in a similar way to cash flow hedges.
Changes in the fair value of derivatives designated as fair value hedges are recorded in the income statement, together with the changes in the fair value of the hedged asset or liability.
Changes in the fair value of any derivative instruments that do not qualify for hedge accounting are recognised immediately in the income statement.
Discounting
Where the time value of money is material, balances are discounted to current values using appropriate discount rates. The unwinding of the discounts is recorded in finance income and finance expense.
3. Key accounting judgements and estimates
In preparing the financial statements, management is required to make judgements about when or how items should be recognised in the financial statements and estimates and assumptions that affect the amounts of assets, liabilities, revenue and expenses reported in the financial statements. Actual amounts and results could differ from those estimates. The following are considered to be the key accounting judgements and estimates made.
Turnover
Reported Group turnover for 2017 was £30,186 million (2016 – £27,889 million).
Gross turnover is reduced by rebates, discounts, allowances and product returns given or expected to be given, which vary by product arrangements and buying groups. These arrangements with purchasing organisations are dependent upon the submission of claims some time after the initial recognition of the sale. Accruals are made at the time of sale for the estimated rebates, discounts or allowances payable or returns to be made, based on available market information and historical experience.
Because the amounts are estimated they may not fully reflect the final outcome, and the amounts are subject to change dependent upon, amongst other things, the types of buying group and product sales mix.
The level of accrual for rebates and returns is reviewed and adjusted regularly in the light of contractual and legal obligations, historical trends, past experience and projected market conditions. Market conditions are evaluated using wholesaler and other third-party analyses, market research data and internally generated information.
Future events could cause the assumptions on which the accruals are based to change, which could affect the future results of the Group.
Taxation
The tax charge for the year was £1,356 million (2016 – £877 million). At December 2017, current tax payable was £995 million (2016 – £1,305 million),non-current corporation tax payable was £411 million (2016 – £nil), current tax recoverable was £258 million (2016 – £226 million), deferred tax liabilities were £1,396 million (2016 – £1,934 million) and deferred tax assets were £3,796 million (2016 – £4,374 million).
Deferred tax assets are recognised when the judgement is made that it is probable that future taxable profits will be available against which the temporary differences can be utilised, based on management’s assumptions relating to the amounts and timing of future taxable profits. Factors affecting the tax charge in future years, in particular, US tax reform, are set out in Note 14, ‘Taxation’. A 1% change in the Group’s effective tax rate in 2017 would have changed the Total tax charge for the year by approximately £35 million.
The Group has open tax issues with a number of revenue authorities. Where management makes a judgement that an outflow of funds is probable and a reliable estimate of the outcome of the dispute can be made, provision is made for the best estimate of the liability. In estimating any such liability GSK applies a risk-based approach which takes into account, as appropriate, the probability that the Group would be able to obtain compensatory adjustments under international tax treaties. These estimates take into account the specific circumstances of each dispute and relevant external advice, are inherently judgemental and could change substantially over time as each dispute progresses and new facts emerge.
| | | | |
| GSK Annual Report 2017 | | Strategic report | | |
| | Governance and remuneration | | |
| | Financial statements | | |
| | Investor information | | |
| | | | |
3. Key accounting judgements and estimatescontinued
GSK continues to believe that it has made adequate provision for the liabilities likely to arise from open assessments. At 31 December 2017, the Group had recognised provisions of £1,175 million in respect of uncertain tax positions (2016 – £1,892 million). Where open issues exist the ultimate liability for such matters may vary from the amounts provided and is dependent upon the outcome of negotiations with the relevant tax authorities or, if necessary, litigation proceedings.
Legal and other disputes
Legal costs for the year were £166 million (2016 – £162 million). At 31 December 2017 provisions for legal and other disputes amounted to £186 million (2016 – £344 million).
The Group provides for anticipated settlement costs where management makes a judgement that an outflow of resources is probable and a reliable estimate can be made of the likely outcome of the dispute and legal and other expenses arising from claims against the Group. The estimated provisions take into account the specific circumstances of each dispute and relevant external advice, are inherently judgemental and could change substantially over time as each dispute progresses and new facts emerge. Details of the status and various uncertainties involved in the significant unresolved disputes are set out in Note 45, ‘Legal proceedings’.
The company’s Directors, having taken legal advice, have established provisions after taking into account the relevant facts and circumstances of each matter and in accordance with accounting requirements. In respect of product liability claims related to certain products there is sufficient history of claims made and settlements to enable management to make a reliable estimate of the provision required to cover unasserted claims. The Group may become involved in legal proceedings, in respect of which it is not possible to make a reliable estimate of the expected financial effect, if any, that could result from ultimate resolution of the proceedings. In these cases, appropriate disclosure about such cases would be provided, but no provision would be made and no contingent liability can be quantified.
The ultimate liability for legal claims may vary from the amounts provided and is dependent upon the outcome of litigation proceedings, investigations and possible settlement negotiations. The position could change over time and, therefore, there can be no assurance that any losses that result from the outcome of any legal proceedings will not exceed the amount of the provisions reported in the Group’s financial statements by a material amount.
Intangible asset impairments
At 31 December 2017, intangible assets were £17,562 million (2016 – £18,776 million).
Impairment tests on intangible assets are undertaken if events occur which call into question the carrying values of the assets. In addition, intangible assets with indefinite useful lives, or which are not yet available for use, are subject to annual impairment tests.
Valuations for impairment tests are based on established market multiples or risk-adjusted future cash flows over the estimated useful life of the asset, where limited, discounted using appropriate discount rates as set out in Note 19, ‘Other intangible assets’.
The assumptions relating to future cash flows, estimated useful lives and discount rates are based on business forecasts and are therefore inherently judgemental. Future events could cause the assumptions used in these impairment tests to change with a consequent adverse effect on the future results of the Group.
Contingent consideration and put option liabilities
The 2017 income statement charge for contingent consideration and put option liabilities was £2,134 million (2016 – £3,991 million).
At 31 December 2017, the liability for contingent consideration amounted to £6,172 million (2016 – £5,896 million). Of this amount, £5,542 million (2016 – £5,304 million) related to the acquisition of the former Shionogi-ViiV Healthcare joint venture in 2012 and £584 million (2016 – £545 million) related to the acquisition of the Vaccines business from Novartis in 2016.
Any contingent consideration included in the consideration payable for a business combination is recorded at fair value at the date of acquisition. These fair values are generally based on risk-adjusted future cash flows discounted using appropriatepost-tax discount rates. The fair values are reviewed on a regular basis, at least annually, and any changes are reflected in the income statement. See Note 39, ‘Contingent consideration liabilities’.
During 2015, the Group granted a put option to Novartis in respect of Novartis’ shareholding in the Consumer Healthcare Joint Venture. In certain circumstances, Novartis has the right to require GSK to acquire its 36.5% shareholding in the Consumer Healthcare Joint Venture at a market-based valuation. This right is exercisable in certain windows from 2018 to 2035 and may be exercised either in respect of Novartis’ entire shareholding or in up to four instalments. GSK has recognised a financial liability of £8,606 million at 31 December 2017 (2016 – £7,420 million). This represents the present value of the redemption value estimated by GSK in the event of full exercise of the right by Novartis and is calculated by applying relevant public company multiples, with no premium or discount, to forecast future profits in accordance with the shareholder agreements. Sensitivity analysis is given in Note 27, ‘Trade and other payables’.
Pfizer may request an IPO of ViiV Healthcare at any time and if either GSK does not consent to such IPO or an offering is not completed within nine months, Pfizer could require GSK to acquire its shareholding. A liability for the put option was recognised on the Group’s balance sheet during 2016 at an initial value of £1,070 million. GSK also recognised liabilities for the future preferential dividends anticipated to become payable to Pfizer and Shionogi on the Group’s balance sheet during 2016. The liability for the Pfizer put option, which is derived from an internal valuation of the ViiV Healthcare business, utilising both discounted forecast future cash flow and multiples-based methodologies amounted to £1,304 million at 31 December 2017 (2016 – £1,319 million). Sensitivity analysis is also given in Note 27, ‘Trade and other payables’.
| | |
| 168 | | |
GSK Annual Report 2017 | | |
| | |
| | |
Notes to the financial statementscontinued
3. Key accounting judgements and estimatescontinued
Pensions and other post-employment benefits
The costs of providing pensions and other post-employment benefits are assessed on the basis of assumptions selected by management. These assumptions include future earnings and pension increases, discount rates, expected long-term rates of return on assets and mortality rates, and are disclosed in Note 28, ‘Pensions and other post-employment benefits’. Where a surplus on a defined benefit scheme arises, or there is potential for a surplus to arise from committed future contributions, the rights of the Trustees to prevent the Group obtaining a refund of that surplus in the future are considered in determining whether it is necessary to restrict the amount of the surplus that is recognised.
Discount rates are derived from AA rated corporate bond yields except in countries where there is no deep market in corporate bonds where government bond yields are used. A sensitivity analysis is provided in Note 28, ‘Pensions and other post-employment benefits’, but a 0.25% reduction in the discount rate would lead to an increase in the net pension deficit of approximately £800 million and an increase in the annual pension cost of approximately £29 million. The selection of different assumptions could affect the future results of the Group.
4. New accounting requirements
The following new and amended accounting standards have been issued by the IASB and are likely to affect future Annual Reports.
IFRS 15 ‘Revenue from contracts with customers’ was issued in May 2014 and has been implemented by the Group from 1 January 2018. The Standard provides a single, principles-based approach to the recognition of revenue from all contracts with customers. It focuses on the identification of performance obligations in a contract and requires revenue to be recognised when or as those performance obligations are satisfied.
The new Standard is not expected to have a material impact on the amount or timing of recognition of reported revenue. In its financial statements for 2018, GSK will adopt IFRS 15 applying the modified retrospective approach, with a cumulative adjustment to decrease equity at 1 January 2018 by approximately £4 million. In accordance with the requirements of the Standard where the modified retrospective approach is adopted, prior year results will not be restated.
IFRS 9 ‘Financial instruments’ was issued in its final form in July 2014 and has been implemented by the Group from 1 January 2018. The Standard replaces the majority of IAS 39 and covers the classification, measurement andde-recognition of financial assets and financial liabilities, introduces a new impairment model for financial assets based on expected losses rather than incurred losses and provides a new hedge accounting model.
The new Standard is not expected to have a material impact on reported results. In its financial statements for 2018, GSK will adopt IFRS 9 retrospectively, but with certain permitted exceptions. As a result, prior year results will not be restated, but there will be a cumulative adjustment to decrease equity at 1 January 2018 by approximately £11 million.
IFRS 16 ‘Leases’ was issued in January 2016 and will be implemented by the Group from 1 January 2019. The Standard will replace IAS 17 ‘Leases’ and will require lease liabilities and ‘right of use’ assets to be recognised on the balance sheet for almost all leases. This is expected to result in a significant increase in both assets and liabilities recognised. The costs of operating leases currently included within operating costs will be split and the financing element of the charge will be reported within finance expense. Finance lease obligations at 31 December 2017 are set out in Note 31, ‘Net debt’ and the undiscounted commitments undernon-cancellable operating leases are set out in Note 41, ‘Commitments’.
The Group is assessing the potential impact of IFRS 16.
IFRIC 23 ‘Uncertainty over income tax treatments’ was issued in June 2017 and will be implemented by the Group from 1 January 2019. The Interpretation clarifies that if it is considered probable that a tax authority will accept an uncertain tax treatment, the tax charge should be calculated on that basis. If it is not considered probable, the effect of the uncertainty should be estimated and reflected in the tax charge. In assessing the uncertainty, it is assumed that the tax authority will have full knowledge of all information related to the matter.
The Group is continuing to assess the potential impact of the new Interpretation.
5. Exchange rates
The Group uses the average of exchange rates prevailing during the period to translate the results and cash flows of overseas subsidiaries, joint ventures and associates into Sterling and period end rates to translate the net assets of those entities. The currencies which most influence these translations and the relevant exchange rates were as follows:
| | | | | | |
| | | 2017 | | 2016 | | 2015 |
| Average rates: | | | | | | |
| US$/£ | | 1.30 | | 1.36 | | 1.53 |
| Euro/£ | | 1.15 | | 1.23 | | 1.37 |
| Yen/£ | | 145 | | 149 | | 185 |
| | | |
| Period end rates: | | | | | | |
| US$/£ | | 1.35 | | 1.24 | | 1.47 |
| Euro/£ | | 1.13 | | 1.17 | | 1.36 |
| Yen/£ | | 152 | | 144 | | 177 |
| | | | |
| 169 | | |
| | | | | |
| GSK Annual Report 2017 | | Strategic report | | |
| | Governance and remuneration | | |
| | Financial statements | | |
| | Investor information | | |
6. Segment information
Operating segments are reported based on the financial information provided to the Chief Executive Officer and the responsibilities of the Corporate Executive Team (CET). GSK reports results under four segments: Pharmaceuticals; Pharmaceuticals R&D; Vaccines and Consumer Healthcare, and individual members of the CET are responsible for each segment.
The Group’s management reporting process allocates intra-Group profit on a product sale to the market in which that sale is recorded, and the profit analyses below have been presented on that basis.
As explained on page 58, from 1 January 2017 only significant legal charges have been excluded from segment profit and reported within other reconciling items between segment profit and operating profit. Segment profits for 2016 and 2015 have been revised onto a comparable basis.
Corporate and other unallocated turnover and costs included the results of several Vaccines and Consumer Healthcare products which were held for sale in a number of markets in order to meet anti-trust approval requirements in 2015, together with the costs of corporate functions.
| | | | | | |
| Turnover by segment | | 2017 £m | | 2016 £m | | 2015 £m |
Pharmaceuticals | | 17,276 | | 16,104 | | 14,157 |
Vaccines | | 5,160 | | 4,592 | | 3,656 |
Consumer Healthcare | | 7,750 | | 7,193 | | 6,038 |
Segment turnover | | 30,186 | | 27,889 | | 23,851 |
Corporate and other unallocated turnover | | – | | – | | 72 |
| | | |
| | | 30,186 | | 27,889 | | 23,923 |
| | | | | | | |
| Pharmaceuticals turnover by therapeutic area | | 2017 £m | | 2016 £m | | 2015 £m |
Respiratory | | 6,991 | | 6,510 | | 5,741 |
HIV | | 4,350 | | 3,556 | | 2,322 |
Immuno-inflammation | | 377 | | 340 | | 263 |
Established Pharmaceuticals | | 5,558 | | 5,698 | | 5,831 |
| | | 17,276 | | 16,104 | | 14,157 |
|
| During 2017, the US operations of the Pharmaceuticals and Vaccines businesses made sales to three wholesalers of approximately £2,449 million (2016 – £2,139 million; 2015 – £1,574 million), £3,043 million (2016 – £2,691 million; 2015 – £2,471 million) and £2,356 million (2016 – £2,129 million; 2015 – £1,602 million) respectively, after allocating final-customer discounts to the wholesalers. |
| | | | | | | |
| Vaccines turnover by category | | 2017 £m | | 2016 £m | | 2015 £m |
Meningitis | | 890 | | 662 | | 326 |
Influenza | | 488 | | 414 | | 268 |
Shingles | | 22 | | – | | – |
Established Vaccines | | 3,760 | | 3,516 | | 3,062 |
| | | 5,160 | | 4,592 | | 3,656 |
| | | | | | | |
| Consumer Healthcare turnover by category | | 2017 £m | | 2016 £m | | 2015 £m |
Wellness | | 4,001 | | 3,726 | | 2,970 |
Oral care | | 2,466 | | 2,223 | | 1,875 |
Nutrition | | 680 | | 674 | | 684 |
Skin health | | 603 | | 570 | | 509 |
| | | 7,750 | | 7,193 | | 6,038 |
| | |
| 170 | | |
GSK Annual Report 2017 | | |
| | |
| | |
Notes to the financial statementscontinued
6. Segment informationcontinued
| | | | | | | | | | | | |
| Segment profit | | 2017 £m | | | 2016
(revised)
£m | | | 2015
(revised)
£m | |
| | | |
Pharmaceuticals | | | 8,667 | | | | 7,976 | | | | 6,449 | |
| | | |
Pharmaceuticals R&D | | | (2,740 | ) | | | (2,488 | ) | | | (2,168 | ) |
| | | |
Pharmaceuticals, including R&D | | | 5,927 | | | | 5,488 | | | | 4,281 | |
| | | |
Vaccines | | | 1,644 | | | | 1,429 | | | | 958 | |
| | | |
Consumer Healthcare | | | 1,373 | | | | 1,116 | | | | 684 | |
| | | |
Segment profit | | | 8,944 | | | | 8,033 | | | | 5,923 | |
| | | |
Corporate and other unallocated costs | | | (376 | ) | | | (362 | ) | | | (264 | ) |
| | | |
Other reconciling items between segment profit and operating profit | | | (4,481 | ) | | | (5,073 | ) | | | 4,663 | |
| | | |
Operating profit | | | 4,087 | | | | 2,598 | | | | 10,322 | |
| | | |
Finance income | | | 65 | | | | 72 | | | | 104 | |
| | | |
Finance costs | | | (734 | ) | | | (736 | ) | | | (757 | ) |
| | | |
Profit on disposal of interest in associates | | | 94 | | | | – | | | | 843 | |
| | | |
Share of after tax profits of associates and joint ventures | | | 13 | | | | 5 | | | | 14 | |
| | | |
Profit before taxation | | | 3,525 | | | | 1,939 | | | | 10,526 | |
| | | |
Taxation | | | (1,356 | ) | | | (877 | ) | | | (2,154 | ) |
| | | |
Profit after taxation for the year | | | 2,169 | | | | 1,062 | | | | 8,372 | |
Other reconciling items between segment profit and operating profit comprise items not specifically allocated to segment profit. These include impairment and amortisation of intangible assets, major restructuring charges, significant legal charges and expenses on the settlement of litigation and government investigations, disposals of businesses, products and associates, certain other items related to major acquisition and disposal activity and thepre-tax impact of the enactment of the US Tax Cuts and Jobs Act.
| | | | | | | | | | | | |
| | | | | | | | | | |
| Depreciation and amortisation by segment | | 2017
£m | | | 2016 £m | | | 2015 £m | |
| | | |
Pharmaceuticals | | | 551 | | | | 440 | | | | 303 | |
| | | |
Pharmaceuticals R&D | | | 96 | | | | 211 | | | | 238 | |
| | | |
Pharmaceuticals, including R&D | | | 647 | | | | 651 | | | | 541 | |
| | | |
Vaccines | | | 405 | | | | 315 | | | | 253 | |
| | | |
Consumer Healthcare | | | 135 | | | | 126 | | | | 140 | |
| | | |
Segment depreciation and amortisation | | | 1,187 | | | | 1,092 | | | | 934 | |
| | | |
Corporate and other unallocated depreciation and amortisation | | | 144 | | | | 94 | | | | 145 | |
| | | |
Other reconciling items between segment depreciation and amortisation and
total depreciation and amortisation | | | 591 | | | | 588 | | | | 551 | |
| | | |
Total depreciation and amortisation | | | 1,922 | | | | 1,774 | | | | 1,630 | |
| | | | |
| 171 | | |
| | | | | |
| GSK Annual Report 2017 | | Strategic report | | |
| | Governance and remuneration | | |
| | Financial statements | | |
| | Investor information | | |
6. Segment informationcontinued
| | | | | | | | | | | | |
| PP&E, intangible asset and goodwill impairment by segment | | 2017 £m | | | 2016 £m | | | 2015 £m | |
| | | |
Pharmaceuticals | | | 38 | | | | 29 | | | | 57 | |
| | | |
Pharmaceuticals R&D | | | 10 | | | | 88 | | | | 105 | |
| | | |
Pharmaceuticals, including R&D | | | 48 | | | | 117 | | | | 162 | |
| | | |
Vaccines | | | 13 | | | | 34 | | | | 17 | |
| | | |
Consumer Healthcare | | | 10 | | | | 46 | | | | 5 | |
| | | |
Segment impairment | | | 71 | | | | 197 | | | | 184 | |
| | | |
Corporate and other unallocated impairment | | | 3 | | | | 24 | | | | 18 | |
| | | |
Other reconciling items between segment impairment and total impairment | | | 995 | | | | 68 | | | | 385 | |
| | | |
Total impairment | | | 1,069 | | | | 289 | | | | 587 | |
|
| The other reconciling items between segment impairment and total impairment included £229 million related to the progressive withdrawal ofTanzeum. | |
| | | |
| | | | | | | | | | | | |
| PP&E and intangible asset impairment reversals by segment | | 2017 £m | | | 2016 £m | | | 2015
£m | |
| | | |
Pharmaceuticals | | | (13) | | | | (15 | ) | | | (8 | ) |
| | | |
Pharmaceuticals R&D | | | (2) | | | | (10 | ) | | | (10 | ) |
| | | |
Pharmaceuticals, including R&D | | | (15) | | | | (25 | ) | | | (18 | ) |
| | | |
Vaccines | | | – | | | | (19 | ) | | | – | |
| | | |
Consumer Healthcare | | | (1) | | | | (8 | ) | | | (4 | ) |
| | | |
Segment impairment reversals | | | (16) | | | | (52 | ) | | | (22 | ) |
| | | |
Corporate and other unallocated impairment reversals | | | – | | | | (26 | ) | | | (2 | ) |
| | | |
Other reconciling items between segment impairment reversals and total impairment reversals | | | (36) | | | | (9 | ) | | | – | |
| | | |
Total impairment reversals | | | (52) | | | | (87 | ) | | | (24 | ) |
| | | |
| | | | | | | | | | | | |
| Net assets by segment | | 2017 £m | | | 2016 £m | | | | |
| | | |
Pharmaceuticals | | | 2,017 | | | | 3,225 | | | | | |
| | | |
Pharmaceuticals R&D | | | 522 | | | | 572 | | | | | |
| | | |
Pharmaceuticals, including R&D | | | 2,539 | | | | 3,797 | | | | | |
| | | |
Vaccines | | | 9,707 | | | | 9,676 | | | | | |
| | | |
Consumer Healthcare | | | 2,003 | | | | 3,721 | | | | | |
| | | |
Segment net operating assets | | | 14,249 | | | | 17,194 | | | | | |
| | | |
Corporate and other unallocated net operating assets | | | 868 | | | | (228 | ) | | | | |
| | | |
Net operating assets | | | 15,117 | | | | 16,966 | | | | | |
| | | |
Net debt | | | (13,178) | | | | (13,804 | ) | | | | |
| | | |
Investments in associates and joint ventures | | | 183 | | | | 263 | | | | | |
| | | |
Derivative financial instruments | | | 2 | | | | (38 | ) | | | | |
| | | |
Current and deferred taxation | | | 1,252 | | | | 1,361 | | | | | |
| | | |
Assets held for sale | | | 113 | | | | 215 | | | | | |
| | | |
Net assets | | | 3,489 | | | | 4,963 | | | | | |
The Pharmaceuticals segment includes the Shionogi-ViiV Healthcare contingent consideration liability of £5,542 million (2016 – £5,304 million) and the Pfizer put option of £1,304 million (2016 – £1,319 million). The Consumer Healthcare segment includes the put option liability of £8,606 million (2016 – £7,420 million).
| | |
| 172 | | |
GSK Annual Report 2017 | | |
| | |
| | |
Notes to the financial statementscontinued
6. Segment informationcontinued
Geographical information
The UK is regarded as being the Group’s country of domicile.
| | | | | | | | | | | | |
| Turnover by location of customer | | 2017 £m | | | 2016 £m | | | 2015 £m | |
| | | |
UK | | | 940 | | | | 1,056 | | | | 1,102 | |
| | | |
US | | | 11,263 | | | | 10,197 | | | | 8,222 | |
| | | |
International | | | 17,983 | | | | 16,636 | | | | 14,599 | |
| | | |
External turnover | | | 30,186 | | | | 27,889 | | | | 23,923 | |
| | | |
| | | | | | | | | | | | |
| Non-current assets by location of subsidiary | | 2017 £m | | | 2016 £m | | | | |
| | | |
UK | | | 6,824 | | | | 7,060 | | | | | |
| | | |
US | | | 6,841 | | | | 7,802 | | | | | |
| | | |
International | | | 20,901 | | | | 21,234 | | | | | |
| | | |
Non-current assets | | | 34,566 | | | | 36,096 | | | | | |
|
Non-current assets by location excludes amounts relating to other investments, deferred tax assets, derivative financial instruments, pension assets, amounts receivable under insurance contracts and certain othernon-current receivables. | |
|
7. Other operating income/(expense) | |
| | | 2017 £m | | | 2016 £m | | | 2015 £m | |
| | | |
Impairment of equity investments | | | (30 | ) | | | (47 | ) | | | (263 | ) |
| | | |
Disposal of equity investments | | | 37 | | | | 254 | | | | 342 | |
| | | |
Disposal of businesses and assets | | | 195 | | | | 283 | | | | 9,661 | |
| | | |
Fair value remeasurements on contingent consideration recognised in business combinations | | | (1,012 | ) | | | (2,205 | ) | | | (1,965 | ) |
| | | |
Remeasurement of ViiV Healthcare put option liabilities and preferential dividends | | | 13 | | | | (577 | ) | | | – | |
| | | |
Remeasurement of Consumer Healthcare put option liability | | | (1,186 | ) | | | (1,133 | ) | | | (83 | ) |
| | | |
Fair value adjustments on derivative financial instruments | | | 9 | | | | (3 | ) | | | 2 | |
| | | |
Other income/(expense) | | | 9 | | | | 23 | | | | 21 | |
| | | |
| | | | (1,965 | ) | | | (3,405 | ) | | | 7,715 | |
Disposal of businesses and assets in 2017 included a profit of £250 million on the disposal of the anaesthesia business to Aspen. Disposals in 2016 included milestone income of £152 million in relation to the divestment of ofatumumab and a number of other smaller divestments and in 2015 included the disposal of the Oncology business to Novartis for £9,228 million and an initial £200 million for the divestment of ofatumumab.
Fair value remeasurements on contingent consideration recognised in business combinations included £909 million related to the acquisition of the former Shionogi-ViiV Healthcare joint venture and £53 million payable to Novartis related to the Vaccines acquisition.
The fair value remeasurements on contingent consideration, the remeasurement of ViiV Healthcare put option liabilities and preferential dividends and the remeasurement of Consumer Healthcare put option liability include the additional charge arising from US tax reform of £666 million.
| | | | |
| 173 | | |
| | | | | |
| GSK Annual Report 2017 | | Strategic report | | |
| | Governance and remuneration | | |
| | Financial statements | | |
| | Investor information | | |
8. Operating profit
| | | | | | | | | | | | |
| The following items have been included in operating profit: | | 2017
£m | | | 2016
£m | | | 2015
£m | |
| | | |
Employee costs (Note 9) | | | 9,122 | | | | 8,212 | | | | 8,030 | |
| | | |
Advertising | | | 1,351 | | | | 1,265 | | | | 1,059 | |
| | | |
Distribution costs | | | 405 | | | | 395 | | | | 376 | |
| | | |
Depreciation of property, plant and equipment | | | 988 | | | | 978 | | | | 892 | |
| | | |
Impairment of property, plant and equipment, net of reversals | | | 327 | | | | 180 | | | | 346 | |
| | | |
Amortisation of intangible assets | | | 934 | | | | 796 | | | | 738 | |
| | | |
Impairment of intangible assets, net of reversals | | | 690 | | | | 22 | | | | 217 | |
| | | |
Net foreign exchange losses | | | 215 | | | | 53 | | | | 47 | |
| | | |
Inventories: | | | | | | | | | | | | |
| | | |
Cost of inventories included in cost of sales | | | 8,526 | | | | 8,093 | | | | 7,602 | |
| | | |
Write-down of inventories | | | 701 | | | | 533 | | | | 488 | |
| | | |
Reversal of prior year write-down of inventories | | | (352 | ) | | | (145 | ) | | | (65 | ) |
| | | |
Operating lease rentals: | | | | | | | | | | | | |
| | | |
Minimum lease payments | | | 110 | | | | 91 | | | | 101 | |
| | | |
Contingent rents | | | 4 | | | | 4 | | | | 8 | |
| | | |
Sub-lease payments | | | 5 | | | | 4 | | | | 7 | |
| | | |
Fees payable to the company’s auditor and its associates in relation to the Group (see below) | | | 29.2 | | | | 29.7 | | | | 33.1 | |
|
The reversals of prior year write-downs of inventories principally arise from the reassessment of usage or demand expectations prior to inventory expiration. Net foreign exchange losses include a net loss of £109 million (2016 – £nil; 2015 – £nil) of exchange arising on the reclassification of exchange on liquidation or disposal of overseas subsidiaries. Included within operating profit are major restructuring charges of £1,056 million (2016 – £970 million; 2015 – £1,891 million), see Note 10, ‘Major restructuring costs’. | |
| Fees payable to the company’s auditor and its associates: | | 2017
£m | | | 2016
£m | | | 2015
£m | |
| | | |
Audit of parent company and consolidated financial statements | | | 7.0 | | | | 5.8 | | | | 7.5 | |
| | | |
Audit of the company’s subsidiaries | | | 16.2 | | | | 16.4 | | | | 16.3 | |
| | | |
Attestation under s.404 of Sarbanes-Oxley Act 2002 | | | 4.5 | | | | 4.4 | | | | 4.3 | |
| | | |
Audit and audit-related services | | | 27.7 | | | | 26.6 | | | | 28.1 | |
| | | |
Taxation compliance | | | 0.2 | | | | 0.2 | | | | 0.3 | |
| | | |
Taxation advice | | | 0.1 | | | | 1.8 | | | | 3.2 | |
| | | |
Other assurance services | | | 1.0 | | | | 0.3 | | | | 1.1 | |
| | | |
All other services | | | 0.2 | | | | 0.8 | | | | 0.4 | |
| | | |
| | | | 29.2 | | | | 29.7 | | | | 33.1 | |
|
The other assurance services provided by the auditor relate to agreed upon procedures and other assurance services outside of statutory audit requirements. All other services provided by the auditor primarily related to advisory services for the year ended 31 December 2017. In addition to the above, fees paid in respect of the GSK pension schemes were: | |
| | | 2017
£m | | | 2016
£m | | | 2015
£m | |
| | | |
Audit | | | 0.3 | | | | 0.4 | | | | 0.3 | |
| | | |
Other services | | | 0.1 | | | | – | | | | – | |
| | |
| 174 | | |
GSK Annual Report 2017 | | |
| | |
| | |
Notes to the financial statementscontinued
9. Employee costs
| | | | | | |
| | | 2017 | | 2016 | | 2015 |
| | | £m | | £m | | £m |
Wages and salaries | | 7,116 | | 6,391 | | 6,132 |
Social security costs | | 802 | | 733 | | 633 |
Pension and other post-employment costs, including augmentations (Note 28) | | 616 | | 541 | | 467 |
Cost of share-based incentive plans | | 347 | | 338 | | 349 |
Severance and other costs from integration and restructuring activities | | 241 | | 209 | | 449 |
| | | |
| | | 9,122 | | 8,212 | | 8,030 |
The increase in wages and salaries included the impact of movements in exchange rates. The Group provides benefits to employees, commensurate with local practice in individual countries, including, in some markets, healthcare insurance, subsidised car schemes and personal life assurance. |
The cost of share-based incentive plans is analysed as follows: |
| | | 2017 | | 2016 | | 2015 |
| | | £m | | £m | | £m |
Share Value Plan | | 276 | | 271 | | 307 |
Performance Share Plan | | 47 | | 39 | | 26 |
Share option plans | | 4 | | 4 | | 4 |
Cash settled and other plans | | 20 | | 24 | | 12 |
| | | |
| | | 347 | | 338 | | 349 |
The average monthly number of persons employed by the Group (including Directors) during the year was: |
| | | 2017 | | 2016 | | 2015 |
| | | Number | | Number | | Number |
Manufacturing | | 38,632 | | 38,611 | | 37,025 |
Selling, general and administration | | 49,141 | | 49,961 | | 52,121 |
Research and development | | 11,576 | | 11,255 | | 12,046 |
| | | |
| | | 99,349 | | 99,827 | | 101,192 |
The average monthly number of Group employees excludes temporary and contract staff. The numbers of Group employees at the end of each financial year are given in the financial record on page 250. The monthly average number of persons employed by GlaxoSmithKline plc in 2017 was nil (2016 – nil). |
The compensation of the Directors and Senior Management (members of the CET) in aggregate, was as follows: |
| | | 2017 | | 2016 | | 2015 |
| | | £m | | £m | | £m |
Wages and salaries | | 26 | | 25 | | 23 |
Social security costs | | 4 | | 4 | | 2 |
Pension and other post-employment costs | | 3 | | 2 | | 3 |
Cost of share-based incentive plans | | 22 | | 15 | | 18 |
| | | |
| | | 55 | | 46 | | 46 |
| | | | |
| 175 | | |
| | | | | |
| GSK Annual Report 2017 | | Strategic report | | |
| | Governance and remuneration | | |
| | Financial statements | | |
| | Investor information | | |
10. Major restructuring costs
Major restructuring costs charged in arriving at operating profit include restructuring costs arising under the Major Change programme initiated in 2013, under the Pharmaceuticals Restructuring Programme announced in October 2014, following the Novartis transaction completed in 2015 and the CEO Strategic Initiatives Programme announced in July 2017.
The total restructuring costs of £1,056 million in 2017 were incurred in the following areas:
| – | | Restructuring of the R&D organisation, predominantly in the United Kingdom and North America. |
| – | | Projects to simplify or eliminate processes leading to staff reductions in support functions. |
| – | | Restructuring of the Pharmaceuticals commercial operating model and supply chain leading to staff reductions in sales force and administration. |
| – | | Transformation of the manufacturing and Vaccines businesses to deliver a step change in quality, cost and productivity. |
The costs charged to operating profit under these programmes were as follows:
| | | | | | |
| | | 2017 | | 2016 | | 2015 |
| | | £m | | £m | | £m |
Increase in provision for major restructuring programmes (see Note 29) | | 259 | | 163 | | 718 |
Amount of provision reversed unused (see Note 29) | | (43) | | (140) | | (44) |
Impairment losses recognised | | 278 | | 158 | | 419 |
Othernon-cash charges | | 247 | | 108 | | 51 |
Other cash costs | | 315 | | 681 | | 747 |
| | | |
| | | 1,056 | | 970 | | 1,891 |
Provision reversals of £43 million (2016 – £140 million; 2015 – £44 million) reflected the release of legacy support function and Novartis integration provisions. Asset impairments of £278 million (2016 – £158 million; 2015 – £419 million) and othernon-cash charges totalling £247 million (2016 – £108 million; 2015 – £51 million) arenon-cash items, principally fixed asset write downs across support functions, manufacturing and research facilities and accelerated depreciation where asset lives in R&D and manufacturing have been shortened as a result of the major restructuring programme. All other charges have been or will be settled in cash and include the termination of leases, site closure costs, consultancy and project management fees. |
|
| 11. Finance income |
| | | 2017 | | 2016 | | 2015 |
| | | £m | | £m | | £m |
Interest income arising from: | | | | | | |
cash and cash equivalents | | 60 | | 67 | | 71 |
available-for-sale investments | | 2 | | 1 | | 1 |
derivatives at fair value through profit or loss | | – | | – | | 24 |
loans and receivables | | 1 | | 2 | | 3 |
Fair value adjustments on derivatives at fair value through profit or loss | | 2 | | 2 | | 5 |
| | | |
| | | 65 | | 72 | | 104 |
All derivatives accounted for at fair value through profit or loss other than designated and effective hedging instruments (see Note 42, ‘Financial instruments and related disclosures’) are classified asheld-for-trading financial instruments under IAS 39.
| | |
| 176 | | |
GSK Annual Report 2017 | | |
| | |
| | |
Notes to the financial statementscontinued
12. Finance expense
| | | | | | |
| | | 2017 | | 2016 | | 2015 |
| | | £m | | £m | | £m |
Interest expense arising on: | | | | | | |
financial liabilities at amortised cost | | (698) | | (671) | | (655) |
derivatives at fair value through profit or loss | | (22) | | (30) | | (64) |
Fair value movements on other derivatives at fair value through profit or loss | | (4) | | (3) | | (6) |
Reclassification of cash flow hedge from other comprehensive income | | – | | (1) | | (2) |
Unwinding of discounts on provisions | | (16) | | (16) | | (16) |
Other finance expense | | 6 | | (15) | | (14) |
| | | |
| | | (734) | | (736) | | (757) |
All derivatives accounted for at fair value through profit or loss, other than designated and effective hedging instruments (see Note 42, ‘Financial instruments and related disclosures’), are classified asheld-for-trading financial instruments under IAS 39. Interest expense arising on derivatives at fair value through profit or loss relates to swap interest expense. Other finance expense includes a £24 million credit for interest relating to income taxes (see Note 1, ‘Presentation of the financial statements’). The amounts for 2016 and 2015 were not material and so comparatives have not been restated. |
13. Associates and joint ventures |
The Group’s share of after tax profits and losses of associates and joint ventures is set out below: |
| | | 2017 | | 2016 | | 2015 |
| | | £m | | £m | | £m |
Share of after tax profits of associates | | 16 | | 9 | | 16 |
Share of after tax losses of joint ventures | | (3) | | (4) | | (2) |
| | | 13 | | 5 | | 14 |
At 31 December 2017, the Group held one significant associate, Innoviva, Inc. |
Summarised income statement information in respect of Innoviva is set out below for the periods in which the Group accounted for its investment in Innoviva as an associate. The Group’s 2017 share of after tax profits of associates and other comprehensive income includes a profit of £18 million and other comprehensive income of £nil in respect of Innoviva. |
| | | | | | | Since |
| | | | | | | 1 September |
| | | 2017 | | 2016 | | 2015 |
| | | £m | | £m | | £m |
Turnover | | 165 | | 98 | | 20 |
Profit after taxation | | 103 | | 44 | | 4 |
Other comprehensive income | | – | | – | | – |
Total comprehensive income | | 103 | | 44 | | 4 |
The results of Innoviva included in the summarised income statement information above represent the estimated earnings of Innoviva in the relevant periods. Innoviva’s turnover is from royalty income from GSK in relation toRelvar/Breo Ellipta, Anoro Ellipta and Trelegy Ellipta sales. |
Aggregated financial information in respect of GSK’s share of other associated undertakings and joint ventures is set out below: |
| | | 2017 | | 2016 | | 2015 |
| | | £m | | £m | | £m |
Share of turnover | | 252 | | 133 | | 188 |
Share of after tax (losses)/profits | | (5) | | (1) | | 12 |
Share of other comprehensive income | | – | | – | | 25 |
Share of total comprehensive (expense)/income | | (5) | | (1) | | 37 |
The Group’s sales to associates and joint ventures were £41 million in 2017 (2016 – £43 million; 2015 – £41 million). |
| | | | |
| 177 | | |
| | | | | |
| GSK Annual Report 2017 | | Strategic report | | |
| | Governance and remuneration | | |
| | Financial statements | | |
| | Investor information | | |
14. Taxation
The Group’s tax charge is the sum of the total current and deferred tax expense.
| | | | | | | | | | | | |
| Taxation charge based on profits for the year | | | | | | | | 2017 £m | | 2016
£m | | 2015
£m |
| UK current year charge | | | | | | | | 199 | | 241 | | 156 |
Rest of World current year charge | | | | | | | | 1,928 | | 1,326 | | 2,924 |
Credit in respect of prior periods | | | | | | | | (508) | | (149) | | (508) |
Total current taxation | | | | | | | | 1,619 | | 1,418 | | 2,572 |
Total deferred taxation | | | | | | | | (263) | | (541) | | (418) |
| Total tax | | | | | | | | 1,356 | | 877 | | 2,154 |
In 2017, GSK made payments of £212 million in UK corporation tax to HMRC. These amounts are for UK corporation tax only, and do not include the various other business taxes borne in the UK by GSK each year. |
The deferred tax credit in 2017 reflected the revaluation of existing deferred tax liabilities to reflect a lower Swiss tax rate applicable following Swiss tax reform, and an increase in deferred tax assets related to intra-Group profit on inventory. The impact of these items was partly offset by the revaluation of existing deferred tax assets to reflect the lower headline US tax rate following enactment of US tax reform. In comparison to 2017, the 2016 and 2015 net deferred tax credits were impacted to a greater extent by remeasurements of the contingent consideration in relation to the former Shionogi-ViiV Healthcare joint venture. In 2015, the credit also included the unwind of deferred tax liabilities on the disposal of the Group’s Oncology business to Novartis. |
The following table reconciles the tax charge calculated at the UK statutory rate on the Group profit before tax with the actual tax charge for the year. |
| Reconciliation of taxation on Group profits | | 2017 £m | | 2017 % | | 2016
£m | | 2016 % | | 2015
£m | | 2015 % |
Profit before tax | | 3,525 | | | | 1,939 | | | | 10,526 | | |
UK statutory rate of taxation | | 679 | | 19.25 | | 388 | | 20.0 | | 2,131 | | 20.25 |
Differences in overseas taxation rates | | 635 | | 18.0 | | 593 | | 30.6 | | 1,035 | | 9.8 |
Benefit of intellectual property incentives | | (458) | | (13.0) | | (321) | | (16.5) | | (286) | | (2.7) |
R&D credits | | (75) | | (2.1) | | (93) | | (4.8) | | (38) | | (0.4) |
Remeasurement ofnon-taxable put option liabilities | | 227 | | 6.4 | | 340 | | 17.5 | | 17 | | 0.2 |
Losses not recognised/(previously unrecognised losses) | | 28 | | 0.8 | | (15) | | (0.8) | | 31 | | 0.3 |
Permanent differences on disposals and acquisitions | | 4 | | 0.1 | | (21) | | (1.1) | | (248) | | (2.4) |
Other permanent differences | | 196 | | 5.6 | | 97 | | 5.0 | | 58 | | 0.6 |
Reassessment of prior year estimates in respect of current and deferred taxes | | (475) | | (13.5) | | (116) | | (6.0) | | (578) | | (5.5) |
US and Swiss tax reform | | 595 | | 16.9 | | | | | | | | |
Tax on unremitted earnings | | – | | – | | 25 | | 1.3 | | 32 | | 0.3 |
| Tax charge/tax rate | | 1,356 | | 38.5 | | 877 | | 45.2 | | 2,154 | | 20.5 |
GSK has a substantial business presence in many countries around the globe. The impact of differences in overseas taxation rates arose from profits being earned in countries with tax rates higher than the UK statutory rate, the most significant of which in 2017 were the US, Belgium, and India. |
The adverse impact was partly offset by the increased benefit of intellectual property incentives such as the UK Patent Box and Belgian Patent Income Deduction regimes. Such regimes provide a reduced rate of corporate income tax on profits earned from qualifying patents. |
The Group’s 2017 tax rate of 38.5% has been influenced by the impact of US and Swiss tax reforms, together with transaction-related charges arising on the Group’s put option liabilities in relation to ViiV Healthcare and the Consumer Healthcare Joint Venture and the reassessment of estimates of uncertain tax positions following the settlement of a number of open issues with tax authorities in various jurisdictions. |
Included within Other permanent differences is a £34 million charge that arises following the enactment of Belgium tax reform during 2017. |
Future tax charges, and therefore the Group’s effective tax rate, may be affected by factors such as acquisitions, disposals, restructurings, the location of research and development activity, tax regime reforms and resolution of open matters as we continue to bring our tax affairs up to date around the world. |
| | |
| 178 | | |
GSK Annual Report 2017 | | |
| | |
| | |
Notes to the financial statementscontinued
14. Taxationcontinued
| | | | | | |
| Tax on items charged to equity and statement of comprehensive income | | 2017 £m | | 2016 £m | | 2015
£m |
| Current taxation | | | | | | |
Share-based payments | | – | | 7 | | 22 |
Defined benefit plans | | 26 | | 32 | | 30 |
| | | |
| | | 26 | | 39 | | 52 |
Deferred taxation | | | | | | |
Share-based payments | | (4) | | – | | (12) |
Defined benefit plans | | (247) | | 94 | | (110) |
Exchange movements | | – | | – | | – |
Fair value movements on cash flow hedges | | – | | 2 | | – |
Fair value movements onavailable-for-sale investments | | 29 | | 51 | | (55) |
| | | (222) | | 147 | | (177) |
| Total (charge)/credit to equity and statement of comprehensive income | | (196) | | 186 | | (125) |
All of the above items have been charged to the statement of comprehensive income except for tax on share based payments. |
Following enactment of US and Belgian tax reform, the Group has recognised deferred tax charges of £27 million and £25 million respectively to equity and the statement of comprehensive income. Both amounts are included within the £222 million net deferred tax charge presented above. |
International tax reform |
| The Group’s tax charge has been influenced by the impact of international tax reform enacted during the year. The US Tax Cuts and Jobs Act (‘the Act’) is expected to have a positive impact on the future after tax earnings of GSK’s US businesses. However, enactment of the new law in 2017 has resulted in a number ofnon-recurring charges. In addition, enactment of Swiss tax reform during 2017 resulted in anon-recurring tax credit arising from the revaluation of deferred tax liabilities relating to certain Consumer Healthcare brands, acquired from Novartis in 2015, to reflect a reduction in the headline Swiss tax rate. |
The charges associated with US tax reform are based on the information currently available. As further guidance from the US Treasury on implementation of the Act becomes available, particularly with regard to the repatriation tax provisions, the assumptions underlying these estimates could change. This could result in adjustments to the charges taken that could have a material impact on the results of the Group. |
The impact of tax reform on profits attributable to shareholders in 2017 is set out below. |
| | | | | Swiss tax | | US tax |
| | | | | reform | | reform |
| | | | | £m | | £m |
| Other operating expenses | | | | – | | (666) |
Current tax | | | | – | | (273) |
Deferred tax | | | | 483 | | (805) |
Impact on profit after taxation for the year | | | | 483 | | (1,744) |
Profit attributable tonon-controlling interests | | | | 176 | | (114) |
Profit attributable to shareholders | | | | 307 | | (1,630) |
The valuations of the HIV and Consumer Healthcare businesses have increased due to lower US tax rates. This has resulted in an increase in the related liabilities for contingent consideration and the put options and hence an additional operating cost of £666 million. The current tax charge in respect of US tax reform relates primarily to the introduction of a repatriation tax on the accumulated reserves ofnon-US subsidiaries of US entities in the Group, the cash impact of which will be spread over eight years from 2018 onwards. The deferred tax charge relates primarily to the revaluation of existing balance sheet tax assets held against future liabilities, such as pensions. |
The tax charge associated with US tax reform was partly offset by an allocation tonon-controlling interests amounting to £114 million, as many of the adjustments related to ViiV Healthcare and the Consumer Healthcare Joint Venture. The tax credit associated with Swiss tax reform was similarly offset with a £176 million charge due to an allocation tonon-controlling interests related to the Consumer Healthcare Joint Venture. The impact on the tax charge arising from US tax reform was as follows: |
| | | Current tax | | Deferred tax | | Total |
| | | £m | | £m | | £m |
Revaluation of assets and liabilities | | 75 | | (805) | | (730) |
Repatriation tax | | (348) | | – | | (348) |
| | | (273) | | (805) | | (1,078) |
The Group also incurred a charge of £34 million following the enactment of Belgian tax reform during 2017, predominantly relating to the revaluation of existing deferred tax assets. |
Continued focus on tax reform is expected in 2018 and future years driven by the OECD’s Base Erosion and Profit Shifting (“BEPS”) project and European Commission initiatives including fiscal state aid investigations. Together with domestic initiatives around the world these may result in significant changes to established tax principles and an increase in tax authority disputes. In turn, this could adversely affect GSK’s effective tax rate or could result in higher cash tax liabilities. |
| | | | |
| 179 | | |
| | | | | |
| GSK Annual Report 2017 | | Strategic report | | |
| | Governance and remuneration | | |
| | Financial statements | | |
| | Investor information | | |
14. Taxation continued
Issues relating to taxation
The integrated nature of the Group’s worldwide operations involves significant investment in research and strategic manufacture at a limited number of locations, with consequential cross-border supply routes into numerousend-markets. In line with current OECD guidelines the Group base our transfer pricing policy on the ‘arm’s length’ principle. However, different tax authorities may seek to attribute further profit to activities being undertaken in their jurisdiction, potentially resulting in double taxation. The Group also has open items in several jurisdictions concerning such matters as the deductibility of particular expenses and the tax treatment of certain business transactions. GSK applies a risk-based approach to determine the transactions most likely to be subject to challenge and the probability that the Group would be able to obtain compensatory adjustments under international tax treaties.
The calculation of the Group’s total tax charge therefore necessarily involves a degree of estimation and judgment in respect of certain items whose tax treatment cannot be finally determined until resolution has been reached with the relevant tax authority or, as appropriate, through a formal legal process. At 31 December 2017 the Group had recognised provisions of £1,175 million in respect of such uncertain tax positions (2016 – £1,892 million). The decrease in recognised provisions during 2017 was driven by the reassessment of estimates and the utilisation of provisions for uncertain tax positions following the settlement of a number of open issues with tax authorities in various jurisdictions. The transfer of accrued interest payable on tax balances to ‘Other payables’ and the foreign exchange impact of revaluing overseas exposures also contributed to the reduction in recognised provisions. Whilst the ultimate liability for such matters may vary from the amounts provided and is dependent upon the outcome of agreements with the relevant tax authorities, or litigation where appropriate, the Group continues to believe that it has made appropriate provision for periods which are open and not yet agreed by the tax authorities. We do not currently anticipate any material changes to the amounts provided for transfer pricing or tax contingencies during the next 12 months.
A provision for deferred tax liabilities of £209 million (2016 – £205 million) has been made in respect of withholding taxation that would arise on the distribution of profits by certain overseas subsidiaries. Whilst the aggregate amount of unremitted profits at the balance sheet date was approximately £17 billion (2016 – £18 billion), the majority of these unremitted profits would not be subject to tax (including withholding tax) on repatriation, as UK legislation relating to company distributions provides for exemption from tax for most overseas profits, subject to certain exceptions. In prior years, a temporary difference arose on the accumulated reserves ofnon-US subsidiaries of US entities in the Group. As the timing of reversal of this temporary difference could be controlled and was not considered probable in the foreseeable future, deferred tax had not been provided. However, as a result of the US Tax Cuts and Jobs Act, the temporary difference reversed and the Group recorded aone-off repatriation tax charge of £348 million. Accordingly, the unremitted profits on which deferred tax has not been provided is now £nil (2016 – £1.7 billion).
Movement in deferred tax assets and liabilities
| | | | | | | | | | | | | | | | | | | | | | | | | | | | | | | | | | | | |
| | | | | | | | | | | | | | | Pensions & | | | | | | Share | | | Other | | | | |
| | | Accelerated | | | | | | | | | | | | other post | | | | | | option | | | net | | | | |
| | | capital | | | Intangible | | | Contingent | | | Intra-Group | | | employment | | | Tax | | | and award | | | temporary | | | | |
| | | allowances | | | assets | | | consideration | | | profit | | | benefits | | | losses | | | schemes | | | differences | | | Total | |
| | | £m | | | £m | | | £m | | | £m | | | £m | | | £m | | | £m | | | £m | | | £m | |
| | | | | | | | | |
At 1 January 2017 | | | (377 | ) | | | (2,324 | ) | | | 1,138 | | | | 1,054 | | | | 1,262 | | | | 227 | | | | 110 | | | | 1,350 | | | | 2,440 | |
| | | | | | | | | |
Exchange adjustments | | | (7 | ) | | | 75 | | | | – | | | | (58 | ) | | | (48 | ) | | | (5 | ) | | | (4 | ) | | | (18 | ) | | | (65 | ) |
| | | | | | | | | |
Credit/(charge) to income statement | | | 62 | | | | 330 | | | | (52 | ) | | | 256 | | | | 3 | | | | 59 | | | | (1 | ) | | | (88 | ) | | | 569 | |
| | | | | | | | | |
Credit/(charge) to income statement associated with US tax reform | | | 5 | | | | 116 | | | | (218 | ) | | | (235 | ) | | | (210 | ) | | | (20 | ) | | | (27 | ) | | | (216 | ) | | | (805 | ) |
| | | | | | | | | |
Credit to income statement associated with Swiss tax reform | | | – | | | | 483 | | | | – | | | | – | | | | – | | | | – | | | | – | | | | – | | | | 483 | |
| | | | | | | | | |
(Charge)/credit to statement of comprehensive income and equity | | | – | | | | – | | | | – | | | | – | | | | (247 | ) | | | – | | | | (4 | ) | | | 29 | | | | (222 | ) |
At 31 December 2017 | | | (317 | ) | | | (1,320 | ) | | | 868 | | | | 1,017 | | | | 760 | | | | 261 | | | | 74 | | | | 1,057 | | | | 2,400 | |
The net deferred tax credit of £247 million to the income statement included a £483 million credit associated with Swiss tax reform and a £569 million credit in relation to the origination and reversal of temporary differences. These credits were partly offset by a £805 million charge in relation to US tax reform. The net credit to the income statement of £247 million included a £16 million charge related to R&D incentives recognised within Operating profit (and not the taxation charge) in the income statement.
Deferred tax liabilities provided in relation to intangible assets predominately relate to temporary differences arising on assets and liabilities acquired as part of historic business combinations. The Group continues to recognise deferred tax assets on future obligations in respect of contingent consideration amounts payable to minority shareholders. These payments are tax deductible at the point in time at which payment is made.
A deferred tax asset is recognised on intra-Group profits arising on inter-company inventory which are eliminated within the consolidated financial statements. As intra-Group profits are not eliminated from the individual entities’ tax returns a temporary difference arises that will reverse at the point in time inventory is sold externally. The deferred tax asset recognised on tax losses of £261 million related to trading losses. In 2016, £173 million related to trading losses and £54 million related to capital losses. Other net temporary differences included accrued expenses for which a tax deduction is only available on a paid basis, such as rebates.
Deferred tax assets and liabilities are recognised on the balance sheet as follows:
| | | | | | | | |
| | | 2017
£m | | | 2016
£m | |
Deferred tax assets | | | 3,796 | | | | 4,374 | |
| | |
Deferred tax liabilities | | | (1,396 | ) | | | (1,934 | ) |
| | |
| | | | 2,400 | | | | 2,440 | |
| | |
| 180 | | |
GSK Annual Report 2017 | | |
| | |
| | |
Notes to the financial statementscontinued
14. Taxationcontinued
Deferred tax assets are recognised on US foreign tax credits only where it is possible that future taxable profits will be available. The gross amount of foreign tax credits on which deferred tax has not been recognised was £721 million at 31 December 2017.
Deferred tax assets are recognised where it is probable that future taxable profit will be available to utilise losses. Unrecognised tax losses are as follows:
| | | | | | | | |
| | | | | 2017 | | | | 2016 |
| | | | | Unrecognised | | | | Unrecognised |
| | | | | deferred tax | | | | deferred tax |
| | | Tax losses | | asset | | Tax losses | | asset |
| Unrecognised tax losses | | £m | | £m | | £m | | £m |
Trading losses expiring: | | | | | | | | |
| | | | |
Within 10 years | | 802 | | 187 | | 786 | | 255 |
| | | | |
More than 10 years | | 872 | | 99 | | 842 | | 131 |
| | | | |
Available indefinitely | | 86 | | 14 | | 95 | | 15 |
At 31 December | | 1,760 | | 300 | | 1,723 | | 401 |
| | | | |
Capital losses | | 1,924 | | 372 | | 2,320 | | 396 |
At 31 December | | 1,924 | | 372 | | 2,320 | | 396 |
| | | | | | | | |
15. Earnings per share |
| | | | | 2017 | | 2016 | | 2015 |
| | | | | pence | | pence | | pence |
Basic earnings per share | | | | 31.4 | | 18.8 | | 174.3 |
Diluted earnings per share | | | | 31.0 | | 18.6 | | 172.3 |
Basic earnings per share has been calculated by dividing the profit attributable to shareholders by the weighted average number of shares in issue during the period after deducting shares held by the ESOP Trusts and Treasury shares. The trustees have waived their rights to dividends on the shares held by the ESOP Trusts. Diluted earnings per share has been calculated after adjusting the weighted average number of shares used in the basic calculation to assume the conversion of all potentially dilutive shares. A potentially dilutive share forms part of the employee share schemes where its exercise price is below the average market price of GSK shares during the period and any performance conditions attaching to the scheme have been met at the balance sheet date. The numbers of shares used in calculating basic and diluted earnings per share are reconciled below. |
| Weighted average number of shares in issue | | | | 2017 millions | | 2016 millions | | 2015 millions |
Basic | | | | 4,886 | | 4,860 | | 4,831 |
Dilution for share options and awards | | | | 55 | | 49 | | 57 |
Diluted | | | | 4,941 | | 4,909 | | 4,888 |
16. Dividends
| | | | | | | | | | | | | | | | | | | | | | | | | | | | | | |
| | | | | | | | 2017 | | | | | | | | 2016 | | | | | | | | 2015 | |
| | | | | Dividend | | | Total | | | | | Dividend | | | Total | | | | | Dividend | | | Total | |
| | | | | per share | | | dividend | | | | | per share | | | dividend | | | | | per share | | | dividend | |
| | | Paid/payable | | (pence) | | | £m | | | Paid | | (pence) | | | £m | | | Paid | | (pence) | | | £m | |
First interim | | 13 July 2017 | | | 19 | | | | 928 | | | 14 July 2016 | | | 19 | | | | 923 | | | 9 July 2015 | | | 19 | | | | 920 | |
| | | | | | | | | |
Second interim | | 12 October 2017 | | | 19 | | | | 929 | | | 13 October 2016 | | | 19 | | | | 925 | | | 1 October 2015 | | | 19 | | | | 919 | |
| | | | | | | | | |
Third interim | | 11 January 2018 | | | 19 | | | | 929 | | | 12 January 2017 | | | 19 | | | | 925 | | | 14 January 2016 | | | 19 | | | | 919 | |
| | | | | | | | | |
Fourth interim | | 12 April 2018 | | | 23 | | | | 1,125 | | | 13 April 2017 | | | 23 | | | | 1,124 | | | 14 April 2016 | | | 23 | | | | 1,114 | |
Total | | | | | 80 | | | | 3,911 | | | | | | 80 | | | | 3,897 | | | | | | 80 | | | | 3,872 | |
Special dividend | | | | | | | | | | | | | | | | | | | | | | 14 April 2016 | | | 20 | | | | 969 | |
Under IFRS interim dividends are only recognised in the financial statements when paid and not when declared. GSK normally pays a dividend two quarters after the quarter to which it relates and one quarter after it is declared. The 2017 financial statements recognise those dividends paid in 2017, namely the third and fourth interim dividends for 2016, and the first and second interim dividends for 2017.
The amounts recognised in each year were as follows:
| | | | | | |
| | | 2017 £m | | 2016 £m | | 2015 £m |
| | | |
Dividends to shareholders | | 3,906 | | 4,850 | | 3,874 |
| | | | |
| GSK Annual Report 2017 | | Strategic report | | |
| | Governance and remuneration | | |
| | Financial statements | | |
| | Investor information | | |
| | | | |
17. Property, plant and equipment
| | | | | | | | | | | | | | | | |
| | | | | | Plant, | | | | | | | |
| | | Land and | | | equipment | | | Assets in | | | | |
| | | buildings | | | and vehicles | | | construction | | | Total | |
| | | £m | | | £m | | | £m | | | £m | |
Cost at 1 January 2016 | | | 7,305 | | | | 10,775 | | | | 2,670 | | | | 20,750 | |
| | | | |
Exchange adjustments | | | 956 | | | | 1,100 | | | | 271 | | | | 2,327 | |
| | | | |
Other additions | | | 117 | | | | 384 | | | | 1,043 | | | | 1,544 | |
| | | | |
Capitalised borrowing costs | | | – | | | | – | | | | 30 | | | | 30 | |
| | | | |
Disposals and write-offs | | | (349 | ) | | | (1,422 | ) | | | (53 | ) | | | (1,824 | ) |
| | | | |
Reclassifications | | | 110 | | | | 512 | | | | (761 | ) | | | (139 | ) |
| | | | |
Transfer to assets held for sale | | | (378 | ) | | | (114 | ) | | | (32 | ) | | | (524 | ) |
Cost at 31 December 2016 | | | 7,761 | | | | 11,235 | | | | 3,168 | | | | 22,164 | |
| | | | |
Exchange adjustments | | | (127 | ) | | | (62 | ) | | | (45 | ) | | | (234 | ) |
| | | | |
Other additions | | | 69 | | | | 296 | | | | 1,219 | | | | 1,584 | |
| | | | |
Capitalised borrowing costs | | | – | | | | – | | | | 30 | | | | 30 | |
| | | | |
Disposals and write-offs | | | (376 | ) | | | (685 | ) | | | (31 | ) | | | (1,092 | ) |
| | | | |
Reclassifications | | | 602 | | | | 1,186 | | | | (1,826 | ) | | | (38 | ) |
| | | | |
Transfer to assets held for sale | | | (462 | ) | | | (219 | ) | | | (14 | ) | | | (695 | ) |
Cost at 31 December 2017 | | | 7,467 | | | | 11,751 | | | | 2,501 | | | | 21,719 | |
Depreciation at 1 January 2016 | | | (2,914 | ) | | | (7,415 | ) | | | – | | | | (10,329 | ) |
| | | | |
Exchange adjustments | | | (377 | ) | | | (717 | ) | | | – | | | | (1,094 | ) |
| | | | |
Charge for the year | | | (338 | ) | | | (640 | ) | | | – | | | | (978 | ) |
| | | | |
Disposals and write-offs | | | 205 | | | | 1,270 | | | | – | | | | 1,475 | |
| | | | |
Transfer to assets held for sale | | | 165 | | | | 92 | | | | – | | | | 257 | |
Depreciation at 31 December 2016 | | | (3,259 | ) | | | (7,410 | ) | | | – | | | | (10,669 | ) |
| | | | |
Exchange adjustments | | | 50 | | | | 110 | | | | – | | | | 160 | |
| | | | |
Charge for the year | | | (299 | ) | | | (689 | ) | | | – | | | | (988 | ) |
| | | | |
Disposals and write-offs | | | 158 | | | | 539 | | | | – | | | | 697 | |
| | | | |
Transfer to assets held for sale | | | 314 | | | | 190 | | | | – | | | | 504 | |
Depreciation at 31 December 2017 | | | (3,036 | ) | | | (7,260 | ) | | | – | | | | (10,296 | ) |
| | | | |
Impairment at 1 January 2016 | | | (274 | ) | | | (373 | ) | | | (106 | ) | | | (753 | ) |
| | | | |
Exchange adjustments | | | (45 | ) | | | (37 | ) | | | (11 | ) | | | (93 | ) |
| | | | |
Disposals and write-offs | | | 91 | | | | 135 | | | | 35 | | | | 261 | |
| | | | |
Impairment losses | | | (135 | ) | | | (117 | ) | | | (6 | ) | | | (258 | ) |
| | | | |
Reversal of impairments | | | 38 | | | | 38 | | | | 2 | | | | 78 | |
| | | | |
Transfer to assets held for sale | | | 46 | | | | 10 | | | | 22 | | | | 78 | |
Impairment at 31 December 2016 | | | (279 | ) | | | (344 | ) | | | (64 | ) | | | (687 | ) |
| | | | |
Exchange adjustments | | | 8 | | | | 2 | | | | (2 | ) | | | 8 | |
| | | | |
Disposals and write-offs | | | 210 | | | | 104 | | | | 28 | | | | 342 | |
| | | | |
Impairment losses | | | (194 | ) | | | (138 | ) | | | (17 | ) | | | (349 | ) |
| | | | |
Reversal of impairments | | | 7 | | | | 9 | | | | 1 | | | | 17 | |
| | | | |
Transfer to assets held for sale | | | 87 | | | | 8 | | | | 11 | | | | 106 | |
Impairment at 31 December 2017 | | | (161 | ) | | | (359 | ) | | | (43 | ) | | | (563 | ) |
Total depreciation and impairment at 31 December 2016 | | | (3,538 | ) | | | (7,754 | ) | | | (64 | ) | | | (11,356 | ) |
| | | | |
Total depreciation and impairment at 31 December 2017 | | | (3,197 | ) | | | (7,619 | ) | | | (43 | ) | | | (10,859 | ) |
Net book value at 1 January 2016 | | | 4,117 | | | | 2,987 | | | | 2,564 | | | | 9,668 | |
Net book value at 31 December 2016 | | | 4,223 | | | | 3,481 | | | | 3,104 | | | | 10,808 | |
Net book value at 31 December 2017 | | | 4,270 | | | | 4,132 | | | | 2,458 | | | | 10,860 | |
The weighted average interest rate for capitalised borrowing costs in the year was 4% (2016 – 3.8%). Disposals and write-offs in the year include a number of assets with nil net book value that are no longer in use in the business.
| | |
| 182 | | |
GSK Annual Report 2017 | | |
| | |
| | |
Notes to the financial statementscontinued
17. Property, plant and equipmentcontinued
The net book value at 31 December 2017 of the Group’s land and buildings comprised freehold properties £3,896 million (2016 – £3,887 million), properties with leases of 50 years or more £338 million (2016 – £294 million) and properties with leases of less than 50 years £36 million (2016 – £42 million).
Included in land and buildings at 31 December 2017 were leased assets with a cost of £630 million (2016 – £590 million), accumulated depreciation of £255 million (2016 – £253 million), impairment of £nil (2016 – £1 million) and a net book value of £375 million (2016 – £336 million). Included in plant, equipment and vehicles at 31 December 2017 were leased assets with a cost of £18 million (2016 – £44 million), accumulated depreciation of £4 million (2016 – £15 million), impairment of £1 million (2016 – £nil) and a net book value of £13 million (2016 – £29 million). Some lease agreements include renewal or purchase options or escalation clauses.
The impairment losses principally arose from decisions to rationalise facilities and are calculated based on either fair value less costs of disposal or value in use. The fair value less costs of disposal valuation methodology uses significant inputs which are not based on observable market data, and therefore this valuation technique is classified as level 3 of the fair value hierarchy. These calculations determine the net present value of the projected risk-adjusted,post-tax cash flows of the relevant asset or cash generating unit, applying a discount rate of the Grouppost-tax weighted average cost of capital (WACC) of 7%, adjusted where appropriate for relevant specific risks. For value in use calculations, where an impairment is indicated and apre-tax cash flow calculation is expected to give a materially different result, the test would be reperformed usingpre-tax cash flows and apre-tax discount rate. The Group WACC is equivalent to apre-tax discount rate of approximately 9%. The net impairment losses have been charged to cost of sales £198 million (2016 – £45 million), R&D £93 million (2016 – £15 million) and SG&A £36 million (2016 – £120 million), and included £278 million (2016 – £151 million) arising from the major restructuring programmes.
Reversals of impairment arose from subsequent reviews of the impaired assets where the conditions which gave rise to the original impairments were deemed no longer to apply. All of the reversals have been credited to cost of sales.
The carrying value at 31 December 2017 of assets for which impairments have been charged or reversed in the year was £33 million (2016 – £171 million).
During 2017, £38 million (2016 – £139 million) of computer software was reclassified from assets in construction to intangible assets on becoming ready for use.
18. Goodwill
| | | | | | | | |
| | | 2017 | | | 2016 | |
| | | £m | | | £m | |
Cost at 1 January | | | 5,965 | | | | 5,162 | |
| | |
Exchange adjustments | | | (228 | ) | | | 814 | |
| | |
Additions through business combinations (Note 38) | | | – | | | | 7 | |
| | |
Transfer to assets held for sale | | | (3 | ) | | | (18 | ) |
| | |
Cost at 31 December | | | 5,734 | | | | 5,965 | |
| | |
Net book value at 1 January | | | 5,965 | | | | 5,162 | |
| | |
Net book value at 31 December | | | 5,734 | | | | 5,965 | |
| | |
| Goodwill is allocated to the Group’s segments as follows: | | | | | | |
| | | 2017
£m | | | 2016
£m | |
Pharmaceuticals | | | 3,172 | | | | 3,288 | |
| | |
Vaccines | | | 1,302 | | | | 1,353 | |
| | |
Consumer Healthcare | | | 1,260 | | | | 1,324 | |
| | |
Net book value at 31 December | | | 5,734 | | | | 5,965 | |
| | | | |
| GSK Annual Report 2017 | | Strategic report | | |
| | Governance and remuneration | | |
| | Financial statements | | |
| | Investor information | | |
| | | | |
18. Goodwillcontinued
The recoverable amounts of the cash generating units are assessed using a fair value less costs of disposal model. Fair value less costs of disposal is calculated using a discounted cash flow approach, with apost-tax discount rate applied to the projected risk-adjustedpost-tax cash flows and terminal value.
The discount rate used is based on the Group WACC of 7%, as most cash generating units have integrated operations across large parts of the Group. The discount rate is adjusted where appropriate for specific country or currency risks. The valuation methodology uses significant inputs which are not based on observable market data, therefore this valuation technique is classified as level 3 in the fair value hierarchy.
Details relating to the discounted cash flow models used in the impairment tests of the Pharmaceuticals, Vaccines and Consumer Healthcare cash generating units are as follows:
| | | | | | |
Valuation basis | | Fair value less costs of disposal |
Key assumptions | | Sales growth rates Profit margins Terminal growth rate Discount rate Taxation rate |
Determination of assumptions | | Growth rates are internal forecasts based on both internal and external market information. Margins reflect past experience, adjusted for expected changes. Terminal growth rates based on management’s estimate of future long-term average growth rates. Discount rates based on Group WACC, adjusted where appropriate. Taxation rates based on appropriate rates for each region. |
Period of specific projected cash flows | | Five years |
| | |
| Terminal growth rate and discount rate | | Terminal growth rate | | Discount rate |
| | |
| | | |
| | | Pharmaceuticals | | 1% p.a. | | 7% |
| | | Vaccines | | 2% p.a. | | 7% |
| | | Consumer Healthcare | | 2% p.a. | | 7% |
The terminal growth rates do not exceed the long-term projected growth rates for the relevant markets, reflect the impact of future generic competition and take account of new product launches.
In each case the valuations indicated sufficient headroom such that a reasonably possible change to key assumptions is unlikely to result in an impairment of the related goodwill. Goodwill is monitored at the segmental level.
The Pharmaceuticals cash generating unit comprises a collection of smaller cash generating units including assets with indefinite lives with a carrying value of £228 million (2016 – £211 million). The Consumer Healthcare cash generating unit also comprises a collection of smaller cash generating units including brands with indefinite lives with a carrying value of £8.51 billion (2016 – £9.03 billion).
Details of indefinite life brands are given in Note 19, ‘Other intangible assets’.
| | |
| 184 | | |
GSK Annual Report 2017 | | |
| | |
| | |
Notes to the financial statementscontinued
19. Other intangible assets
| | | | | | | | | | | | | | | | | | | | |
| | | Computer
software
£m | | | Licences, patents, etc.
£m | | | Amortised brands £m | | | Indefinite life brands £m | | | Total £m | |
Cost at 1 January 2016 | | | 2,028 | | | | 13,394 | | | | 387 | | | | 8,074 | | | | 23,883 | |
| | | | | |
Exchange adjustments | | | 137 | | | | 1,139 | | | | 20 | | | | 1,320 | | | | 2,616 | |
| | | | | |
Capitalised development costs | | | – | | | | 219 | | | | 21 | | | | – | | | | 240 | |
| | | | | |
Capitalised borrowing costs | | | 4 | | | | – | | | | – | | | | – | | | | 4 | |
| | | | | |
Additions through business combinations | | | – | | | | 102 | | | | – | | | | – | | | | 102 | |
| | | | | |
Other additions | | | 238 | | | | 349 | | | | – | | | | – | | | | 587 | |
| | | | | |
Disposals and asset write-offs | | | (389 | ) | | | (21 | ) | | | (1 | ) | | | (7 | ) | | | (418 | ) |
| | | | | |
Transfer to assets held for sale | | | (1 | ) | | | (39 | ) | | | – | | | | (12 | ) | | | (52 | ) |
| | | | | |
Reclassifications | | | 139 | | | | – | | | | – | | | | – | | | | 139 | |
Cost at 31 December 2016 | | | 2,156 | | | | 15,143 | | | | 427 | | | | 9,375 | | | | 27,101 | |
| | | | | |
Exchange adjustments | | | (37 | ) | | | (215 | ) | | | (4 | ) | | | (272 | ) | | | (528 | ) |
| | | | | |
Capitalised development costs | | | – | | | | 251 | | | | – | | | | – | | | | 251 | |
| | | | | |
Capitalised borrowing costs | | | 2 | | | | 3 | | | | – | | | | – | | | | 5 | |
| | | | | |
Other additions | | | 233 | | | | 221 | | | | – | | | | – | | | | 454 | |
| | | | | |
Disposals and asset write-offs | | | (217 | ) | | | (38 | ) | | | – | | | | – | | | | (255 | ) |
| | | | | |
Transfer to assets held for sale | | | (1 | ) | | | (90 | ) | | | – | | | | (44 | ) | | | (135 | ) |
| | | | | |
Reclassifications | | | 38 | | | | – | | | | 66 | | | | (66 | ) | | | 38 | |
Cost at 31 December 2017 | | | 2,174 | | | | 15,275 | | | | 489 | | | | 8,993 | | | | 26,931 | |
| | | | | |
Amortisation at 1 January 2016 | | | (1,294 | ) | | | (4,030 | ) | | | (133 | ) | | | – | | | | (5,457 | ) |
| | | | | |
Exchange adjustments | | | (92 | ) | | | (410 | ) | | | (5 | ) | | | – | | | | (507 | ) |
| | | | | |
Charge for the year | | | (152 | ) | | | (553 | ) | | | (91 | ) | | | – | | | | (796 | ) |
| | | | | |
Disposals and asset write-offs | | | 353 | | | | – | | | | 5 | | | | – | | | | 358 | |
| | | | | |
Transfer to assets held for sale | | | 1 | | | | 10 | | | | – | | | | – | | | | 11 | |
Amortisation at 31 December 2016 | | | (1,184 | ) | | | (4,983 | ) | | | (224 | ) | | | – | | | | (6,391 | ) |
| | | | | |
Exchange adjustments | | | 25 | | | | 141 | | | | – | | | | – | | | | 166 | |
| | | | | |
Charge for the year | | | (163 | ) | | | (761 | ) | | | (10 | ) | | | – | | | | (934 | ) |
| | | | | |
Disposals and asset write-offs | | | 210 | | | | 25 | | | | – | | | | – | | | | 235 | |
| | | | | |
Transfer to assets held for sale | | | 1 | | | | 25 | | | | – | | | | – | | | | 26 | |
Amortisation at 31 December 2017 | | | (1,111 | ) | | | (5,553 | ) | | | (234 | ) | | | – | | | | (6,898 | ) |
| | | | | |
Impairment at 1 January 2016 | | | (39 | ) | | | (1,439 | ) | | | (154 | ) | | | (122 | ) | | | (1,754 | ) |
| | | | | |
Exchange adjustments | | | (3 | ) | | | (266 | ) | | | – | | | | (3 | ) | | | (272 | ) |
| | | | | |
Impairment losses | | | (2 | ) | | | (15 | ) | | | – | | | | (5 | ) | | | (22 | ) |
| | | | | |
Disposals and asset write-offs | | | 35 | | | | 40 | | | | 11 | | | | – | | | | 86 | |
| | | | | |
Transfer to assets held for sale | | | – | | | | 28 | | | | – | | | | – | | | | 28 | |
Impairment at 31 December 2016 | | | (9 | ) | | | (1,652 | ) | | | (143 | ) | | | (130 | ) | | | (1,934 | ) |
| | | | | |
Exchange adjustments | | | – | | | | 110 | | | | – | | | | 3 | | | | 113 | |
| | | | | |
Impairment losses | | | (2 | ) | | | (546 | ) | | | – | | | | (132 | ) | | | (680 | ) |
| | | | | |
Disposals and asset write-offs | | | 2 | | | | 5 | | | | – | | | | – | | | | 7 | |
| | | | | |
Transfer to assets held for sale | | | – | | | | 19 | | | | – | | | | 4 | | | | 23 | |
Impairment at 31 December 2017 | | | (9 | ) | | | (2,064 | ) | | | (143 | ) | | | (255 | ) | | | (2,471 | ) |
| | | | | |
Total amortisation and impairment at 31 December 2016 | | | (1,193 | ) | | | (6,635 | ) | | | (367 | ) | | | (130 | ) | | | (8,325 | ) |
| | | | | |
Total amortisation and impairment at 31 December 2017 | | | (1,120 | ) | | | (7,617 | ) | | | (377 | ) | | | (255 | ) | | | (9,369 | ) |
| | | | | |
Net book value at 1 January 2016 | | | 695 | | | | 7,925 | | | | 100 | | | | 7,952 | | | | 16,672 | |
| | | | | |
Net book value at 31 December 2016 | | | 963 | | | | 8,508 | | | | 60 | | | | 9,245 | | | | 18,776 | |
| | | | | |
Net book value at 31 December 2017 | | | 1,054 | | | | 7,658 | | | | 112 | | | | 8,738 | | | | 17,562 | |
The weighted average interest rate for capitalised borrowing costs in the year was 4% (2016 – 3.8%).
The net book value of computer software included £669 million (2016 – £620 million) of internally generated costs.
The charge for impairments in the year included £229 million related to the progressive withdrawal of the pharmaceutical product,Tanzeum, which was fully impaired. The carrying value at 31 December 2017 of intangible assets, for which impairments have been charged or reversed in the year, following those impairments or reversals, was £300 million (2016 – £116 million).
The patent expiry dates of the Group’s most significant assets, where relevant, are set out on pages 254 and 255.
| | | | |
| GSK Annual Report 2017 | | Strategic report | | |
| | Governance and remuneration | | |
| | Financial statements | | |
| | Investor information | | |
| | | | |
19. Other intangible assetscontinued
Amortisation and impairment losses, net of reversals, have been charged in the income statement as follows:
| | | | | | | | | | | | | | | | |
| | | Amortisation | | | Net impairment losses | |
| | | 2017
£m | | | 2016
£m | | | 2017
£m | | | 2016
£m | |
| | | | |
Cost of sales | | | 578 | | | | 582 | | | | 400 | | | | 7 | |
| | | | |
Selling, general and administration | | | 116 | | | | 95 | | | | 2 | | | | 2 | |
| | | | |
Research and development | | | 240 | | | | 119 | | | | 278 | | | | 13 | |
| | | | 934 | | | | 796 | | | | 680 | | | | 22 | |
Licences, patents, etc. includes a large number of acquired licences, patents,know-how agreements and marketing rights, which are either marketed or in use, or still in development. Note 38, ‘Acquisitions and disposals’ gives details of additions through business combinations in the year. The book values of the largest individual items are as follows:
| | | | | | | | |
| | | 2017
£m | | | 2016
£m | |
Meningitis portfolio | | | 2,450 | | | | 2,511 | |
| | |
dolutegravir | | | 1,389 | | | | 1,487 | |
| | |
Benlysta | | | 965 | | | | 1,019 | |
| | |
Fluarix/FluLaval | | | 321 | | | | 380 | |
| | |
HIV assets acquired from BMS | | | 277 | | | | 277 | |
| | |
Selzentry | | | 162 | | | | 188 | |
| | |
Okairos technology platform | | | 202 | | | | 173 | |
| | |
Others | | | 1,892 | | | | 2,473 | |
| | | | 7,658 | | | | 8,508 | |
The Meningitis portfolio includesMenveo,Bexsero and Men ABCWY.
Indefinite life brands comprise a portfolio of Consumer Healthcare products primarily acquired with the acquisitions of Sterling Winthrop, Inc. in 1994, Block Drug Company, Inc. in 2001, CNS, Inc. in 2006 and the Novartis Consumer Healthcare business in 2015, together with a number of pharmaceutical brands from the acquisition of Stiefel Laboratories, Inc. in 2009. The book values of the major brands are as follows:
| | | | | | | | |
| | | 2017
£m | | | 2016
£m | |
| | |
Voltaren | | | 2,716 | | | | 2,847 | |
| | |
Otrivin | | | 1,380 | | | | 1,447 | |
| | |
Fenistil | | | 648 | | | | 680 | |
| | |
Theraflu | | | 441 | | | | 462 | |
| | |
Panadol | | | 386 | | | | 354 | |
| | |
Sensodyne | | | 265 | | | | 243 | |
| | |
Lamisil | | | 289 | | | | 304 | |
| | |
Breathe Right | | | 236 | | | | 199 | |
| | |
Stiefel trade name | | | 228 | | | | 211 | |
| | |
Excedrin | | | 185 | | | | 194 | |
| | |
Physiogel | | | 166 | | | | 166 | |
| | |
Polident | | | 112 | | | | 103 | |
| | |
Others | | | 1,686 | | | | 2,035 | |
| | | | 8,738 | | | | 9,245 | |
Each of these brands is considered to have an indefinite life, given the strength and durability of the brand and the level of marketing support. The brands are in relatively similar stable and profitable market sectors, with similar risk profiles, and their size, diversification and market shares mean that the risk of market-related factors causing a reduction in the lives of the brands is considered to be relatively low. The Group is not aware of any material legal, regulatory, contractual, competitive, economic or other factors which could limit their useful lives. Accordingly, they are not amortised.
Each brand is tested annually for impairment and other amortised intangible assets are tested when indicators of impairment arise. This testing applies a fair value less costs of disposal methodology, generally usingpost-tax cash flow forecasts with a terminal value calculation and a discount rate equal to the Grouppost-tax WACC of 7%, adjusted where appropriate for specific country and currency risks. This valuation methodology uses significant inputs which are not based on observable market data, and therefore this valuation technique is classified as level 3 of the fair value hierarchy. The main assumptions include future sales price and volume growth, product contribution, the future expenditure required to maintain the product’s marketability and registration in the relevant jurisdictions and exchange rates. These assumptions are based on past experience and are reviewed as part of management’s budgeting and strategic planning cycle for changes in market conditions and sales erosion through competition. The terminal growth rates applied of between nil% and 5% are management’s estimates of future long-term average growth rates of the relevant markets. In each case the valuations indicate sufficient headroom such that a reasonably possible change to key assumptions is unlikely to result in an impairment of these intangible assets.
| | |
| 186 | | |
GSK Annual Report 2017 | | |
| | |
| | |
Notes to the financial statementscontinued
20. Investments in associates and joint ventures
| | | | | | | | | | | | | | | | | | | | | | | | |
| | | Joint
ventures
£m | | | Associates
£m | | | 2017
Total
£m | | | Joint
ventures
£m | | | Associates
£m | | | 2016
Total
£m | |
At 1 January | | | 19 | | | | 244 | | | | 263 | | | | 20 | | | | 187 | | | | 207 | |
| | | | | | |
Exchange adjustments | | | (2 | ) | | | (10 | ) | | | (12 | ) | | | 4 | | | | 41 | | | | 45 | |
| | | | | | |
Additions | | | – | | | | 15 | | | | 15 | | | | 3 | | | | 8 | | | | 11 | |
| | | | | | |
Disposals | | | – | | | | (92 | ) | | | (92 | ) | | | – | | | | – | | | | – | |
| | | | | | |
Distributions received | | | (1 | ) | | | (1 | ) | | | (2 | ) | | | (2 | ) | | | (1 | ) | | | (3 | ) |
| | | | | | |
Other movements | | | – | | | | (2 | ) | | | (2 | ) | | | (2 | ) | | | – | | | | (2 | ) |
| | | | | | |
(Loss)/profit after tax recognised in the consolidated income statement | | | (3 | ) | | | 16 | | | | 13 | | | | (4 | ) | | | 9 | | | | 5 | |
At 31 December | | | 13 | | | | 170 | | | | 183 | | | | 19 | | | | 244 | | | | 263 | |
The Group held one significant associate at 31 December 2017, Innoviva, Inc. At 31 December 2017, the Group owned 32 million shares or 31.4% of Innoviva, which is a biopharmaceutical company listed on NASDAQ. Innoviva partnered with GSK in the development of the long acting beta agonist vilanterol and currently receives royalty income from sales of products that contain this component, namelyRelvar/Breo Ellipta,Anoro Ellipta andTrelegy Ellipta. The remaining 85% of the economic interest in these royalties will be due to Theravance Biopharma Inc., a company spun out of Innoviva in 2014, in which the Group holds 17.8% of the common stock. The investment in Innoviva had a market value of £336 million at 31 December 2017 (2016 – £278 million).
In 2017, the Group divested its shareholdings in two associates, see Note 38, ‘Acquisitions and disposals’.
Summarised balance sheet information, based on results information, in respect of Innoviva is set out below:
| | | | | | | | |
| | | At 31 December
2017
£m | | | At 31 December
2016
£m | |
Non-current assets | | | 124 | | | | 146 | |
| | |
Current assets | | | 148 | | | | 160 | |
| | |
Current liabilities | | | (26 | ) | | | (16 | ) |
| | |
Non-current liabilities | | | (426 | ) | | | (575 | ) |
| | |
Net liabilities | | | (180 | ) | | | (285 | ) |
| | |
| | | | | | | | |
| | | 2017
£m | | | 2016
£m | |
Interest in associated undertaking | | | (57 | ) | | | (84 | ) |
| | |
Goodwill | | | 86 | | | | 84 | |
| | |
Fair value and other adjustments | | | 118 | | | | 138 | |
| | |
Carrying value at 31 December | | | 147 | | | | 138 | |
| | | | |
| 187 | | |
| | | | | |
| GSK Annual Report 2017 | | Strategic report | | |
| | Governance and remuneration | | |
| | Financial statements | | |
| | Investor information | | |
21. Other investments
| | | | | | | | |
| | | 2017
£m | | | 2016
£m | |
At 1 January | | | 985 | | | | 1,255 | |
| | |
Exchange adjustments | | | (64 | ) | | | 211 | |
| | |
Additions | | | 80 | | | | 96 | |
| | |
Net fair value movements | | | 11 | | | | 130 | |
| | |
Impairment losses | | | (30 | ) | | | (24 | ) |
| | |
Disposals | | | (64 | ) | | | (683 | ) |
At 31 December | | | 918 | | | | 985 | |
Other investments comprisenon-current equity investments which areavailable-for-sale investments recorded at fair value at each balance sheet date. For investments traded in an active market, the fair value is determined by reference to the relevant stock exchange quoted bid price. For other investments, the fair value is estimated by management with reference to relevant available information, including the current market value of similar instruments and discounted cash flows of the underlying net assets. Other investments include listed investments of £535 million (2016 – £580 million). The most significant of the investments held at 31 December 2017 was in Theravance Biopharma, Inc. in which the Group holds 17.8% of the common stock. This investment had a fair value at 31 December 2017 of £199 million (2016 – £248 million). The other investments include equity stakes in companies with which GSK has research collaborations and in companies which provide access to biotechnology developments of potential interest.
On disposal of investments, fair value movements are reclassified from equity to the income statement based on average cost for shares acquired at different times.
The impairment losses recorded above have been recognised in the income statement for the year within Other operating income, together with amounts reclassified from the fair value reserve on recognition of the impairments. These impairments initially result from prolonged or significant declines in the fair value of the equity investments below acquisition cost, subsequent to which any further declines in fair value are immediately taken to the income statement.
The carrying value at 31 December of Other investments which have been impaired is as follows:
| | | | | | | | |
| | | 2017
£m | | | 2016
£m | |
Original cost | | | 475 | | | | 515 | |
| | |
Cumulative impairments recognised in the income statement | | | (283 | ) | | | (314 | ) |
| | |
Subsequent fair value increases | | | 210 | | | | 282 | |
Carrying value at 31 December | | | 402 | | | | 483 | |
22. Othernon-current assets
| | | | | | | | |
| | | 2017
£m | | | 2016
£m | |
Amounts receivable under insurance contracts | | | 648 | | | | 602 | |
| | |
Pension schemes in surplus | | | 538 | | | | 313 | |
| | |
Other receivables | | | 227 | | | | 284 | |
| | | | 1,413 | | | | 1,199 | |
23. Inventories
| | | | | | | | |
| | | 2017
£m | | | 2016
£m | |
Raw materials and consumables | | | 1,193 | | | | 1,068 | |
| | |
Work in progress | | | 2,381 | | | | 2,299 | |
| | |
Finished goods | | | 1,983 | | | | 1,735 | |
| | | | 5,557 | | | | 5,102 | |
| | |
| 188 | | |
GSK Annual Report 2017 | | |
| | |
| | |
Notes to the financial statementscontinued
24. Trade and other receivables
| | | | | | | | |
| | | 2017
£m | | | 2016
£m | |
Trade receivables, net of provision for bad and doubtful debts | | | 4,672 | | | | 4,615 | |
| | |
Accrued income | | | 21 | | | | 64 | |
| | |
Other prepayments | | | 308 | | | | 335 | |
| | |
Interest receivable | | | 10 | | | | 11 | |
| | |
Employee loans and advances | | | 19 | | | | 17 | |
| | |
Other receivables | | | 970 | | | | 984 | |
| | | | 6,000 | | | | 6,026 | |
Trade receivables included £11 million (2016 – £9 million) due from associates and joint ventures. Other receivables included £7 million (2016 – £7 million) due from associates and joint ventures.
| | | | | | | | |
Bad and doubtful debt provision | | 2017
£m | | | 2016
£m | |
At 1 January | | | 207 | | | | 167 | |
| | |
Exchange adjustments | | | (4 | ) | | | 23 | |
| | |
Charge for the year | | | 31 | | | | 77 | |
| | |
Subsequent recoveries of amounts provided for | | | (79 | ) | | | (59 | ) |
| | |
Utilised | | | (15 | ) | | | (1 | ) |
At 31 December | | | 140 | | | | 207 | |
25. Cash and cash equivalents
| | | | | | | | |
| | | 2017
£m | | | 2016
£m | |
Cash at bank and in hand | | | 826 | | | | 1,462 | |
| | |
Short-term deposits | | | 3,007 | | | | 3,435 | |
| | | | 3,833 | | | | 4,897 | |
26. Assets held for sale
| | | | | | | | |
| | | 2017
£m | | | 2016
£m | |
Property, plant and equipment | | | 57 | | | | 184 | |
| | |
Goodwill | | | – | | | | 13 | |
| | |
Other intangibles | | | 49 | | | | 12 | |
| | |
Inventory | | | 7 | | | | 7 | |
| | |
Other | | | – | | | | (1 | ) |
| | | | 113 | | | | 215 | |
Included within Assets held for sale is £31 million of intangible impairments, £10 million PP&E impairments, £21 million intangible impairment reversals and £15 million PP&E impairment reversals.
Non-current assets and disposal groups are transferred to assets held for sale when it is expected that their carrying amounts will be recovered principally through disposal and a sale is considered highly probable. They are held at the lower of carrying amount and fair value less costs to sell.
Included within Assets held for sale are assets which were written down to fair value less costs to sell of £63 million (2016 – £79 million). The valuation methodology uses significant inputs which are not based on observable market data, therefore, this valuation is classified as level 3 in the fair value hierarchy.
| | | | |
| 189 | | |
| | | | | |
| GSK Annual Report 2017 | | Strategic report | | |
| | Governance and remuneration | | |
| | Financial statements | | |
| | Investor information | | |
27. Trade and other payables
| | | | |
| | | 2017 £m | | 2016 £m |
Trade payables | | 3,528 | | 3,596 |
| | |
| Wages and salaries | | 1,228 | | 1,236 |
| | |
| Social security | | 166 | | 120 |
| | |
| Consumer Healthcare put option | | 8,606 | | – |
| | |
| ViiV Healthcare put option | | 1,304 | | 1,319 |
| | |
| Other payables | | 363 | | 447 |
| | |
| Deferred income | | 240 | | 158 |
| | |
| Customer return and rebate accruals | | 3,463 | | 2,778 |
| | |
| Other accruals | | 2,072 | | 2,310 |
| | |
| | | 20,970 | | 11,964 |
Trade and other payables included £53 million (2016 – £36 million) due to associates and joint ventures. Customer return and rebate accruals are provided for by the Group at the point of sale in respect of the estimated rebates, discounts or allowances payable to customers, and included £2,837 million (2016 – £2,218 million) in respect of US Pharmaceuticals and Vaccines, as more fully described in the Group financial review on page 76. Accruals are made at the time of sale but the actual amounts paid are based on claims made some time after the initial recognition of the sale. As the amounts are estimated, they may not fully reflect the final outcome and are subject to change dependent upon, amongst other things, the types of buying group and product sales mix. The level of accrual is reviewed and adjusted quarterly in light of historical experience of actual rebates, discounts or allowances given and returns made and any changes in arrangements. Future events could cause the assumptions on which the accruals are based to change, which could affect the future results of the Group. The Consumer Healthcare put option liability relates to the ability of Novartis to put its shares in the Consumer Healthcare Joint Venture to GSK at certain points in the future. As this option became exercisable from 2 March 2018, with payment likely to be due several months after exercise, it has been classified within current liabilities. The liability is recorded at the present value of the estimated redemption value, applying a discount rate of 7%, calculated by applying an average of relevant public company multiples approach with no premium or discount, based on the forecast profits and earnings of the Consumer Healthcare Joint Venture, which forms part of GSK’s Consumer Healthcare segment. The remeasurement charge in the year was £1,186 million, including the impact of US tax reform (2016 – £1,133 million), see Note 7, ‘Other operating income/(expense)’. The table below shows on an indicative basis the income statement and balance sheet sensitivity to reasonably possible changes in key assumptions. |
Increase/(decrease) in financial liability and loss/(gain) in Income statement | | 2017
£m | | |
10% increase in sales forecasts or sales multiple applied | | 850 | | |
| | |
| 10% decrease in sales forecasts or sales multiple applied | | (850) | | |
| | |
| 10 cent appreciation of US Dollar | | 88 | | |
| | |
| 10 cent depreciation of US Dollar | | (76) | | |
| | |
| 10 cent appreciation of Euro | | 303 | | |
| | |
| 10 cent depreciation of Euro | | (254) | | |
Pfizer’s put option over its shareholding in ViiV Healthcare was recognised during 2016 and is currently exercisable. The table below shows
on an indicative basis the income statement and balance sheet sensitivity of the Pfizer put option to reasonably possible changes in key
assumptions. |
Increase/(decrease) in financial liability and loss/(gain) in Income statement | | 2017
£m | | |
10% increase in sales forecasts | | 150 | | |
| | |
| 10% decrease in sales forecasts | | (149) | | |
| | |
| 10 cent appreciation of US Dollar | | 76 | | |
| | |
| 10 cent depreciation of US Dollar | | (66) | | |
| | |
| 10 cent appreciation of Euro | | 44 | | |
| | |
| 10 cent depreciation of Euro | | (37) | | |
An explanation of the accounting for ViiV Healthcare is set out on page 59.
| | |
| 190 | | |
GSK Annual Report 2017 | | |
| | |
| | |
Notes to the financial statementscontinued
28. Pensions and other post-employment benefits
| | | | | | |
Pension and other post-employment costs | | 2017
£m | | 2016
£m | | 2015
£m |
UK pension schemes | | 198 | | 205 | | 177 |
| | | |
| US pension schemes | | 113 | | 106 | | 96 |
| | | |
| Other overseas pension schemes | | 218 | | 140 | | 135 |
| | | |
| Unfunded post-retirement healthcare schemes | | 87 | | 90 | | 59 |
| | | |
| | | 616 | | 541 | | 467 |
| Analysed as: | | | | | | |
| | | |
| Funded defined benefit/hybrid pension schemes | | 335 | | 304 | | 291 |
| | | |
| Unfunded defined benefit pension schemes | | 55 | | 43 | | 36 |
| | | |
| Unfunded post-retirement healthcare schemes | | 87 | | 90 | | 59 |
Defined benefit schemes | | 477 | | 437 | | 386 |
| | | |
| Defined contribution pension schemes | | 139 | | 104 | | 81 |
| | | |
| | | 616 | | 541 | | 467 |
The costs of the defined benefit pension and post-retirement healthcare schemes are charged in the income statement as follows:
| | | | | | |
| | | 2017
£m | | 2016
£m | | 2015
£m |
Cost of sales | | 162 | | 135 | | 127 |
| | | |
| Selling, general and administration | | 238 | | 221 | | 194 |
| | | |
| Research and development | | 77 | | 81 | | 65 |
| | | |
| | | 477 | | 437 | | 386 |
GSK entities operate pension arrangements which cover the Group’s material obligations to provide pensions to retired employees. These arrangements have been developed in accordance with local practices in the countries concerned. Pension benefits can be provided by state schemes; by defined contribution schemes, whereby retirement benefits are determined by the value of funds arising from contributions paid in respect of each employee; or by defined benefit schemes, whereby retirement benefits are based on employee pensionable remuneration and length of service.
Pension costs of defined benefit schemes for accounting purposes have been calculated using the projected unit method. In certain countries pension benefits are provided on an unfunded basis, some administered by trustee companies. Formal, independent, actuarial valuations of the Group’s main plans are undertaken regularly, normally at least every three years.
Actuarial movements in the year are recognised through the statement of comprehensive income. Discount rates are derived from AA rated corporate bond yields except in countries where there is no deep market in corporate bonds where government bond yields are used. Discount rates are selected to reflect the term of the expected benefit payments. Projected inflation rate and pension increases are long-term predictions based on the yield gap between long-term index-linked and fixed interest Gilts. In the UK, mortality rates are determined by adjusting the SAPS S2 standard mortality tables to reflect recent scheme experience. These rates are then projected to reflect improvements in life expectancy in line with the CMI 2016 projections with a long-term rate of improvement of 1.25% per year for both males and females. In the US, mortality rates are calculated using the RP2014 white collar table adjusted to reflect recent experience. These rates are projected usingMP-2017 to allow for future improvements in life expectancy.
| | | | |
| 191 | | |
| | | | | |
| GSK Annual Report 2017 | | Strategic report | | |
| | Governance and remuneration | | |
| | Financial statements | | |
| | Investor information | | |
28. Pensions and other post-employment benefitscontinued
The average life expectancy assumed now for an individual at the age of 60 and projected to apply in 2037 for an individual then at the age of 60 is as follows:
| | | | | | | | |
| | | | | UK | | | | US |
| | |
| | | Male
Years | | Female
Years | | Male
Years | | Female
Years |
Current | | 27.5 | | 29.5 | | 26.9 | | 28.6 |
| | | | |
| Projected for 2037 | | 29.1 | | 31.1 | | 28.6 | | 30.3 |
The assets of funded schemes are generally held in separately administered trusts, either as specific assets or as a proportion of a general fund, or are insurance contracts. Assets are invested in different classes in order to maintain a balance between risk and return. Investments are diversified to limit the financial effect of the failure of any individual investment. The Group reviewed the investment strategy of the UK plans in 2011 and the asset allocation for the UK plans has been adjusted to approximately 55% return seeking assets and 45% liability matching assets. In 2013, the target asset allocation of the US plans was also updated to 55% return seeking assets and 45% liability matching assets.
The Pension Plans are exposed to risk that arises because the estimated market value of the Plans’ assets might decline, the investment returns might reduce, or the estimated value of the Plans’ liabilities might increase.
In line with the agreed mix of return seeking assets to generate future returns and liability matching assets to better match future pension obligations, the Group has defined an overall long-term investment strategy for the Plans, with investments across a broad range of assets. The main market risks within the asset and hedging portfolio are against credit risk, interest rates, long-term inflation, equities, property, and bank counterparty risk.
The Plan liabilities are a series of future cash flows with relatively long duration. On an IAS 19R basis, these cash flows are sensitive to changes in the expected long-term inflation rate and the discount rate (AA corporate bond yield curve) where an increase in long-term inflation corresponds with an increase in the liabilities, and an increase in the discount rate corresponds with a decrease in the liabilities.
In the UK the defined benefit pension schemes operated for the benefit of former Glaxo Wellcome employees and former SmithKline Beecham employees remain separate. These schemes were closed to new entrants in 2001 and subsequent UK employees are entitled to join a defined contribution scheme. In the US the former Glaxo Wellcome and SmithKline Beecham defined benefit schemes were merged during 2001. In addition, the Group operates a number of post-retirement healthcare schemes, the principal one of which is in the US.
The Group has applied the following financial assumptions in assessing the defined benefit liabilities:
| | | | | | | | | | | | | | | | | | |
| | | | | | | UK | | | | | | US | | | | Rest of World |
| | | 2017
% pa | | 2016
% pa | | 2015
% pa | | 2017
% pa | | 2016
% pa | | 2015
% pa | | 2017
% pa | | 2016
% pa | | 2015
% pa |
Rate of increase of future earnings | | 2.00 | | 2.00 | | 2.00 | | 4.00 | | 4.00 | | 4.00 | | 2.80 | | 2.70 | | 2.70 |
| | | | | | | | | |
| Discount rate | | 2.50 | | 2.70 | | 3.80 | | 3.60 | | 3.90 | | 4.20 | | 1.60 | | 1.60 | | 2.20 |
| | | | | | | | | |
| Expected pension increases | | 3.20 | | 3.20 | | 3.10 | | n/a | | n/a | | n/a | | 2.20 | | 2.10 | | 2.00 |
| | | | | | | | | |
| Cash balance credit/conversion rate | | n/a | | n/a | | n/a | | 2.90 | | 3.20 | | 3.20 | | 0.30 | | 0.30 | | 0.60 |
| | | | | | | | | |
| Inflation rate | | 3.20 | | 3.20 | | 3.10 | | 2.25 | | 2.25 | | 2.25 | | 1.70 | | 1.50 | | 1.40 |
| | |
| 192 | | |
GSK Annual Report 2017 | | |
| | |
| | |
Notes to the financial statementscontinued
28. Pensions and other post-employment benefitscontinued
The amounts recorded in the income statement and statement of comprehensive income for the three years ended 31 December 2017 in relation to the defined benefit pension and post-retirement healthcare schemes were as follows:
| | | | | | | | | | | | | | | | | | | | |
| | | | | | | | | | | | Pensions | | | Post-retirement
benefits | |
2017 | | UK
£m | | | US
£m | | | Rest of World
£m | | | Group £m | | | Group £m | |
Amounts charged to operating profit | | | | | | | | | | | | | | | |
| | | | | |
| Current service cost | | 79 | | | 70 | | | 131 | | | 280 | | | 30 | |
| | | | | |
| Past service cost | | 37 | | | – | | | – | | | 37 | | | (2) | |
| | | | | |
| Net interest cost | | 7 | | | 31 | | | 16 | | | 54 | | | 59 | |
| | | | | |
| Expenses | | 7 | | | 12 | | | – | | | 19 | | | – | |
| | | | | |
| | | 130 | | | 113 | | | 147 | | | 390 | | | 87 | |
Remeasurement gains/(losses) recorded in the statement of
comprehensive income | | | 259 | | | | 240 | | | | (14) | | | | 485 | | | | 64 | |
| | | | | | | | | | | | Pensions | | | Post-retirement
benefits | |
2016 | | UK
£m | | | US
£m | | | Rest of World
£m | | | Group £m | | | Group £m | |
Amounts charged to operating profit | | | | | | | | | | | | | | | |
| | | | | |
| Current service cost | | 70 | | | 66 | | | 110 | | | 246 | | | 31 | |
| | | | | |
| Past service cost | | 52 | | | 1 | | | 1 | | | 54 | | | 3 | |
| | | | | |
| Net interest cost | | 9 | | | 27 | | | 20 | | | 56 | | | 56 | |
| | | | | |
| Gains from settlements | | – | | | – | | | (28) | | | (28) | | | – | |
| | | | | |
| Expenses | | 7 | | | 12 | | | – | | | 19 | | | – | |
| | | | | |
| | | 138 | | | 106 | | | 103 | | | 347 | | | 90 | |
Remeasurement losses recorded in the statement of
comprehensive income | | | (165 | ) | | | (27 | ) | | | (224) | | | | (416) | | | | (59) | |
| | | | | | | | | | | | Pensions | | | Post-retirement
benefits | |
2015 | | UK
£m | | | US
£m | | | Rest of World
£m | | | Group
£m | | | Group £m | |
Amounts charged to operating profit | | | | | | | | | | | | | | | |
| | | | | |
| Current service cost | | 77 | | | 67 | | | 110 | | | 254 | | | 22 | |
| | | | | |
| Past service cost/(credit) | | 25 | | | 2 | | | (10) | | | 17 | | | (8) | |
| | | | | |
| Net interest cost | | 14 | | | 22 | | | 13 | | | 49 | | | 52 | |
| | | | | |
| Losses/(gains) from settlements | | – | | | 1 | | | (9) | | | (8) | | | (7) | |
| | | | | |
| Expenses | | 7 | | | 4 | | | 4 | | | 15 | | | – | |
| | | | | |
| | | 123 | | | 96 | | | 108 | | | 327 | | | 59 | |
Remeasurement gains/(losses) recorded in the statement of
comprehensive income | | | 82 | | | | (30 | ) | | | 147 | | | | 199 | | | | 62 | |
The amounts included within past service costs include £37 million (2016 – £52 million; 2015 – £25 million) of augmentation costs of which £18 million is arising from major restructuring programmes (see Note 29, ‘Other provisions’).
| | | | |
| GSK Annual Report 2017 | | Strategic report | | |
| | Governance and remuneration | | |
| | Financial statements | | |
| | Investor information | | |
| | | | |
28. Pensions and other post-employment benefitscontinued
A summarised balance sheet presentation of the Group defined benefit pension schemes and other post-retirement benefits is set out in the table below:
| | | | | | | | | | | | | | | | | | |
| | | | | | | | 2017 £m | | | 2016 £m | | | 2015 £m | |
Recognised in Othernon-current assets: | | | | | | | | | | | | | |
| | | |
Pension schemes in surplus | | | | 538 | | | | 313 | | | | 258 | |
| | | |
Recognised in Pensions and other post-employment benefits: | | | | | | | | | | | | | |
| | | |
Pension schemes in deficit | | | | (2,043 | ) | | | (2,397 | ) | | | (1,842 | ) |
| | | |
Post-retirement benefits | | | | (1,496 | ) | | | (1,693 | ) | | | (1,387 | ) |
| | | | | | |
| | | | | | | | | | (3,539 | ) | | | (4,090 | ) | | | (3,229 | ) |
The fair values of the assets and liabilities of the UK and US defined benefit pension schemes, together with aggregated data for other defined benefit pension schemes in the Group are as follows: | |
At 31 December 2017 | | UK £m | | | US £m | | | Rest of World
£m | | | Group £m | |
| | | | | |
Equities: | | – listed | | | 4,902 | | | | 1,448 | | | | 544 | | | | 6,894 | |
| | | | | |
| | – unlisted | | | – | | | | – | | | | 13 | | | | 13 | |
| | | | | |
Multi-asset funds | | | | | 2,517 | | | | – | | | | – | | | | 2,517 | |
| | | | | |
Property: | | – unlisted | | | 352 | | | | 209 | | | | 32 | | | | 593 | |
| | | | | |
Corporate bonds: | | – listed | | | 297 | | | | 820 | | | | 103 | | | | 1,220 | |
| | | | | |
| | – unlisted | | | 326 | | | | – | | | | 20 | | | | 346 | |
| | | | | |
Government bonds: | | – listed | | | 5,127 | | | | 239 | | | | 762 | | | | 6,128 | |
| | | | | |
Insurance contracts | | | | | 849 | | | | – | | | | 707 | | | | 1,556 | |
| | | | | |
Other assets | | | | | (1,216 | ) | | | 158 | | | | 71 | | | | (987 | ) |
| | | | | |
Fair value of assets | | | | | 13,154 | | | | 2,874 | | | | 2,252 | | | | 18,280 | |
| | | | |
Present value of scheme obligations | | | (13,101 | ) | | | (3,445 | ) | | | (3,239 | ) | | | (19,785 | ) |
| | | | | | |
Net surplus/(obligation) | | | | | 53 | | | | (571 | ) | | | (987 | ) | | | (1,505 | ) |
| | | | |
Included in Othernon-current assets | | | 470 | | | | – | | | | 68 | | | | 538 | |
| | | | |
Included in Pensions and other post-employment benefits | | | (417 | ) | | | (571 | ) | | | (1,055 | ) | | | (2,043 | ) |
| | | | | |
| | | | | | 53 | | | | (571 | ) | | | (987 | ) | | | (1,505 | ) |
| | | | |
Actual return on plan assets | | | 893 | | | | 394 | | | | 82 | | | | 1,369 | |
The multi-asset funds comprise investments in pooled investment vehicles that are invested across a range of asset classes, increasing diversification within the growth portfolio. The index-linked gilts held as part of the UK repo programme are included in government bonds. The related loan is included within ‘Other assets’ at a value of £(773) million (2016 – £(1,698) million; 2015 – £(2,215) million). | |
At 31 December 2016 | | UK £m | | | US £m | | | Rest of World
£m | | | Group £m | |
| | | | | |
Equities: | | – listed | | | 5,357 | | | | 1,358 | | | | 486 | | | | 7,201 | |
| | | | | |
| | – unlisted | | | – | | | | – | | | | 14 | | | | 14 | |
| | | | | |
Multi-asset funds | | | | | 1,545 | | | | – | | | | – | | | | 1,545 | |
| | | | | |
Property: | | – unlisted | | | 314 | | | | 216 | | | | 28 | | | | 558 | |
| | | | | |
Corporate bonds: | | – listed | | | 292 | | | | 213 | | | | 96 | | | | 601 | |
| | | | | |
| | – unlisted | | | 321 | | | | – | | | | 24 | | | | 345 | |
| | | | | |
Government bonds: | | – listed | | | 6,165 | | | | 815 | | | | 739 | | | | 7,719 | |
| | | | | |
Insurance contracts | | | | | 856 | | | | – | | | | 637 | | | | 1,493 | |
| | | | | |
Other assets | | | | | (2,267 | ) | | | 288 | | | | 73 | | | | (1,906 | ) |
| | | | | |
Fair value of assets | | | | | 12,583 | | | | 2,890 | | | | 2,097 | | | | 17,570 | |
| | | | |
Present value of scheme obligations | | | (12,884 | ) | | | (3,752 | ) | | | (3,018 | ) | | | (19,654 | ) |
| | | | | | |
Net obligation | | | | | (301 | ) | | | (862 | ) | | | (921 | ) | | | (2,084 | ) |
| | | | |
Included in Othernon-current assets | | | 276 | | | | – | | | | 37 | | | | 313 | |
| | | | |
Included in Pensions and other post-employment benefits | | | (577 | ) | | | (862 | ) | | | (958 | ) | | | (2,397 | ) |
| | | | | |
| | | | | | (301 | ) | | | (862 | ) | | | (921 | ) | | | (2,084 | ) |
| | | | |
Actual return on plan assets | | | 2,473 | | | | 153 | | | | 99 | | | | 2,725 | |
| | |
| 194 | | |
GSK Annual Report 2017 | | |
| | |
| | |
Notes to the financial statementscontinued
28. Pensions and other post-employment benefitscontinued
| | | | | | | | | | | | | | | | |
At 31 December 2015 | | UK £m | | | US £m | | | Rest of World
£m | | | Group £m |
| | | | | |
Equities: | | – listed | | | 5,187 | | | | 1,235 | | | | 355 | | | 6,777 |
| | | | | |
| | – unlisted | | | – | | | | – | | | | 1 | | | 1 |
| | | | | |
Multi-asset funds | | | | | 481 | | | | – | | | | – | | | 481 |
| | | | | |
Property: | | – unlisted | | | 302 | | | | 175 | | | | 8 | | | 485 |
| | | | | |
Corporate bonds: | | – listed | | | 251 | | | | 727 | | | | 76 | | | 1,054 |
| | | | | |
| | – unlisted | | | 232 | | | | – | | | | 2 | | | 234 |
| | | | | |
Government bonds: | | – listed | | | 5,687 | | | | 184 | | | | 664 | | | 6,535 |
| | | | | |
Insurance contracts | | | | | 755 | | | | – | | | | 439 | | | 1,194 |
| | | | | |
Other assets | | | | | (2,611 | ) | | | 180 | | | | 205 | | | (2,226) |
| | | | | |
Fair value of assets | | | | | 10,284 | | | | 2,501 | | | | 1,750 | | | 14,535 |
| | | | |
Present value of scheme obligations | | | (10,601 | ) | | | (3,134 | ) | | | (2,384 | ) | | (16,119) |
| | | | | | |
Net obligation | | | | | (317 | ) | | | (633 | ) | | | (634 | ) | | (1,584) |
| | | | |
Included in Othernon-current assets | | | 232 | | | | – | | | | 26 | | | 258 |
| | | | |
Included in Pensions and other post-employment benefits | | | (549 | ) | | | (633 | ) | | | (660 | ) | | (1,842) |
| | | | | |
| | | | | | (317 | ) | | | (633 | ) | | | (634 | ) | | (1,584) |
| | | | |
Actual return on plan assets | | | (17 | ) | | | (30 | ) | | | 23 | | | (24) |
| | | | | | | | | | | | | | | | | | | | |
| | | | | | | | | | | | Pensions | | | Post-retirement
benefits | |
Movements in fair values of assets | | UK £m | | | US £m | | | Rest of World
£m | | | Group £m | | | Group £m | |
Assets at 1 January 2015 | | | 10,551 | | | | 2,531 | | | | 1,529 | | | | 14,611 | | | | – | |
| | | | | |
Exchange adjustments | | | – | | | | 147 | | | | (52 | ) | | | 95 | | | | – | |
| | | | | |
Additions through business combinations | | | – | | | | – | | | | 233 | | | | 233 | | | | – | |
| | | | | |
Interest income | | | 374 | | | | 95 | | | | 33 | | | | 502 | | | | – | |
| | | | | |
Expenses | | | (7 | ) | | | (4 | ) | | | (4 | ) | | | (15 | ) | | | – | |
| | | | | |
Settlements and curtailments | | | – | | | | – | | | | (16 | ) | | | (16 | ) | | | – | |
| | | | | |
Remeasurement | | | (391 | ) | | | (125 | ) | | | (10 | ) | | | (526 | ) | | | – | |
| | | | | |
Employer contributions | | | 164 | | | | 132 | | | | 112 | | | | 408 | | | | 82 | |
| | | | | |
Scheme participants’ contributions | | | 4 | | | | – | | | | 14 | | | | 18 | | | | 14 | |
| | | | | |
Benefits paid | | | (411 | ) | | | (275 | ) | | | (89 | ) | | | (775 | ) | | | (96 | ) |
| | | | | |
Assets at 31 December 2015 | | | 10,284 | | | | 2,501 | | | | 1,750 | | | | 14,535 | | | | – | |
| | | | | |
Exchange adjustments | | | – | | | | 459 | | | | 305 | | | | 764 | | | | – | |
| | | | | |
Interest income | | | 385 | | | | 108 | | | | 37 | | | | 530 | | | | – | |
| | | | | |
Expenses | | | (7 | ) | | | (12 | ) | | | – | | | | (19 | ) | | | – | |
| | | | | |
Settlements and curtailments | | | – | | | | – | | | | (110 | ) | | | (110 | ) | | | – | |
| | | | | |
Remeasurement | | | 2,088 | | | | 45 | | | | 62 | | | | 2,195 | | | | – | |
| | | | | |
Employer contributions | | | 319 | | | | 31 | | | | 131 | | | | 481 | | | | 91 | |
| | | | | |
Scheme participants’ contributions | | | 4 | | | | – | | | | 14 | | | | 18 | | | | 17 | |
| | | | | |
Benefits paid | | | (490 | ) | | | (242 | ) | | | (92 | ) | | | (824 | ) | | | (108 | ) |
| | | | | |
Assets at 31 December 2016 | | | 12,583 | | | | 2,890 | | | | 2,097 | | | | 17,570 | | | | – | |
| | | | | |
Exchange adjustments | | | – | | | | (244 | ) | | | 24 | | | | (220 | ) | | | – | |
| | | | | |
Interest income | | | 333 | | | | 104 | | | | 33 | | | | 470 | | | | – | |
| | | | | |
Expenses | | | (7 | ) | | | (12 | ) | | | – | | | | (19 | ) | | | – | |
| | | | | |
Settlements and curtailments | | | – | | | | – | | | | (4 | ) | | | (4 | ) | | | – | |
| | | | | |
Remeasurement | | | 560 | | | | 290 | | | | 49 | | | | 899 | | | | – | |
| | | | | |
Employer contributions | | | 225 | | | | 103 | | | | 116 | | | | 444 | | | | 101 | |
| | | | | |
Scheme participants’ contributions | | | 4 | | | | – | | | | 17 | | | �� | 21 | | | | 17 | |
| | | | | |
Benefits paid | | | (544 | ) | | | (257 | ) | | | (80 | ) | | | (881 | ) | | | (118 | ) |
| | | | | |
Assets at 31 December 2017 | | | 13,154 | | | | 2,874 | | | | 2,252 | | | | 18,280 | | | | – | |
During 2017, the Group made special funding contributions to the UK pension schemes totalling £136 million (2016 – £191 million; 2015 – £85 million) and £78 million (2016 – £nil; 2015 – £111 million) to the US scheme. In 2016, GSK reached an agreement with the trustees of the UK pension schemes to make additional contributions to eliminate the pension deficit identified at the 31 December 2014 actuarial funding valuation. Based on the funding agreements following the 2014 valuation, the additional contributions to eliminate the pension deficit are expected to be £123 million in 2018. The contributions were based on a government bond yield curve approach to selecting the discount rate; the rate chosen included an allowance for expected investment returns which reflected the asset mix of the schemes.
Employer contributions for 2018, including special funding contributions, are estimated to be approximately £360 million in respect of defined benefit pension schemes and £90 million in respect of post-retirement benefits.
| | | | |
| GSK Annual Report 2017 | | Strategic report | | |
| | Governance and remuneration | | |
| | Financial statements | | |
| | Investor information | | |
| | | | |
28. Pensions and other post-employment benefitscontinued
| | | | | | | | | | | | | | | | | | | | |
| | | | | | | | | | | | Pensions | | | Post-retirement
benefits | |
| Movements in defined benefit obligations | | UK £m | | | US £m | | | Rest of World
£m | | | Group £m | | | Group £m | |
| | | | | |
Obligations at 1 January 2015 | | | (10,991 | ) | | | (3,133 | ) | | | (2,176 | ) | | | (16,300 | ) | | | (1,397 | ) |
| | | | | |
Exchange adjustments | | | – | | | | (184 | ) | | | 78 | | | | (106 | ) | | | (64 | ) |
| | | | | |
Additions through business combinations | | | – | | | | – | | | | (397 | ) | | | (397 | ) | | | (11 | ) |
| | | | | |
Service cost | | | (77 | ) | | | (67 | ) | | | (110 | ) | | | (254 | ) | | | (22 | ) |
| | | | | |
Past service cost | | | (25 | ) | | | (2 | ) | | | 10 | | | | (17 | ) | | | 8 | |
| | | | | |
Interest cost | | | (388 | ) | | | (117 | ) | | | (46 | ) | | | (551 | ) | | | (52 | ) |
| | | | | |
Settlements and curtailments | | | – | | | | (1 | ) | | | 25 | | | | 24 | | | | 7 | |
| | | | | |
Remeasurement | | | 473 | | | | 95 | | | | 157 | | | | 725 | | | | 62 | |
| | | | | |
Scheme participants’ contributions | | | (4 | ) | | | – | | | | (14 | ) | | | (18 | ) | | | (14 | ) |
| | | | | |
Benefits paid | | | 411 | | | | 275 | | | | 89 | | | | 775 | | | | 96 | |
| | | | | | |
Obligations at 31 December 2015 | | | (10,601 | ) | | | (3,134 | ) | | | (2,384 | ) | | | (16,119 | ) | | | (1,387 | ) |
| | | | | |
Exchange adjustments | | | – | | | | (586 | ) | | | (396 | ) | | | (982 | ) | | | (248 | ) |
| | | | | |
Service cost | | | (70 | ) | | | (66 | ) | | | (110 | ) | | | (246 | ) | | | (31 | ) |
| | | | | |
Past service cost | | | (52 | ) | | | (1 | ) | | | (1 | ) | | | (54 | ) | | | (3 | ) |
| | | | | |
Interest cost | | | (394 | ) | | | (135 | ) | | | (57 | ) | | | (586 | ) | | | (56 | ) |
| | | | | |
Settlements and curtailments | | | – | | | | – | | | | 138 | | | | 138 | | | | – | |
| | | | | |
Remeasurement | | | (2,253 | ) | | | (72 | ) | | | (286 | ) | | | (2,611 | ) | | | (59 | ) |
| | | | | |
Scheme participants’ contributions | | | (4 | ) | | | – | | | | (14 | ) | | | (18 | ) | | | (17 | ) |
| | | | | |
Benefits paid | | | 490 | | | | 242 | | | | 92 | | | | 824 | | | | 108 | |
| | | | | | |
Obligations at 31 December 2016 | | | (12,884 | ) | | | (3,752 | ) | | | (3,018 | ) | | | (19,654 | ) | | | (1,693 | ) |
| | | | | |
Exchange adjustments | | | – | | | | 305 | | | | (45 | ) | | | 260 | | | | 119 | |
| | | | | |
Service cost | | | (79 | ) | | | (70 | ) | | | (131 | ) | | | (280 | ) | | | (30 | ) |
| | | | | |
Past service cost | | | (37 | ) | | | – | | | | – | | | | (37 | ) | | | 2 | |
| | | | | |
Interest cost | | | (340 | ) | | | (135 | ) | | | (49 | ) | | | (524 | ) | | | (59 | ) |
| | | | | |
Settlements and curtailments | | | – | | | | – | | | | 4 | | | | 4 | | | | – | |
| | | | | |
Remeasurement | | | (301 | ) | | | (50 | ) | | | (63 | ) | | | (414 | ) | | | 64 | |
| | | | | |
Scheme participants’ contributions | | | (4 | ) | | | – | | | | (17 | ) | | | (21 | ) | | | (17 | ) |
| | | | | |
Benefits paid | | | 544 | | | | 257 | | | | 80 | | | | 881 | | | | 118 | |
| | | | | | |
Obligations at 31 December 2017 | | | (13,101 | ) | | | (3,445 | ) | | | (3,239 | ) | | | (19,785 | ) | | | (1,496 | ) |
The defined benefit pension obligation is analysed as follows:
| | | | | | | | | | | | |
| | | 2017 £m | | | 2016 £m | | | 2015 £m | |
| | | |
Funded | | | (19,052 | ) | | | (18,974 | ) | | | (15,552 | ) |
| | | |
Unfunded | | | (733 | ) | | | (680 | ) | | | (567 | ) |
| | | | |
| | | | (19,785 | ) | | | (19,654 | ) | | | (16,119 | ) |
The liability for the US post-retirement healthcare scheme has been assessed using the same assumptions as for the US pension scheme, together with the assumption for future medical inflation of 6.75% (2016 – 7%), grading down to 5.0% in 2025 and thereafter. At
31 December 2017, the US post-retirement healthcare scheme obligation was £1,254 million (2016 – £1,463 million; 2015 – £1,208 million).
Post-retirement benefits are unfunded.
| | |
| 196 | | |
GSK Annual Report 2017 | | |
| | |
| | |
Notes to the financial statementscontinued
28. Pensions and other post-employment benefitscontinued
The movement in the net defined benefit liability is as follows:
| | | | | | |
| | | 2017 £m | | 2016 £m | | 2015 £m |
| At 1 January | | (2,084) | | (1,584) | | (1,689) |
| | | |
| Exchange adjustments | | 40 | | (218) | | (11) |
| | | |
| Additions through business combinations | | – | | – | | (164) |
| | | |
| Service cost | | (280) | | (246) | | (254) |
| | | |
| Past service cost | | (37) | | (54) | | (17) |
| | | |
| Interest cost | | (54) | | (56) | | (49) |
| | | |
| Settlements and curtailments | | – | | 28 | | 8 |
| | | |
| Remeasurements: | | | | | | |
| | | |
| Return on plan assets, excluding amounts included in interest | | 899 | | 2,195 | | (526) |
| | | |
| Gain from change in demographic assumptions | | 209 | | 85 | | 120 |
| | | |
| (Loss)/gain from change in financial assumptions | | (555) | | (2,770) | | 362 |
| | | |
| Experience (losses)/gains | | (68) | | 74 | | 243 |
| | | |
| Employer contributions | | 444 | | 481 | | 408 |
| | | |
| Expenses/other movements | | (19) | | (19) | | (15) |
| | | |
| At 31 December | | (1,505) | | (2,084) | | (1,584) |
|
The remeasurements included within post-retirement benefits are detailed below: |
| | | 2017
£m | | 2016
£m | | 2015
£m |
| Gain from change in demographic assumptions | | 47 | | – | | 15 |
| | | |
| (Loss)/gain from change in financial assumptions | | (1) | | (81) | | 59 |
| | | |
| Experience gains/(losses) | | 18 | | 22 | | (12) |
| | | |
| | | 64 | | (59) | | 62 |
| | | | |
| 197 | | |
| | | | | |
| GSK Annual Report 2017 | | Strategic report | | |
| | Governance and remuneration | | |
| | Financial statements | | |
| | Investor information | | |
28. Pensions and other post-employment benefitscontinued
The defined benefit pension obligation analysed by membership category is as follows:
| | | | | | |
| | | 2017 £m | | 2016 £m | | 2015 £m |
| Active | | 4,611 | | 4,576 | | 5,510 |
| | | |
| Retired | | 9,805 | | 9,574 | | 7,969 |
| | | |
| Deferred | | 5,369 | | 5,504 | | 4,231 |
| | | |
| | | 19,785 | | 19,654 | | 17,710 |
The post-retirement benefit obligation analysed by membership category is as follows: |
| | | 2017 £m | | 2016 £m | | 2015 £m |
| Active | | 514 | | 594 | | 499 |
| | | |
| Retired | | 981 | | 1,099 | | 887 |
| | | |
| Deferred | | 1 | | – | | 1 |
| | | |
| | | 1,496 | | 1,693 | | 1,387 |
The weighted average duration of the defined benefit obligation is as follows: |
| | | 2017
years | | 2016
years | | 2015
years |
| Pension benefits | | 16 | | 16 | | 16 |
| | | |
| Post-retirement benefits | | 11 | | 12 | | 12 |
Sensitivity analysis
Effect of changes in assumptions used on the benefit obligations and on the 2018 annual defined benefit pension and post retirement costs.
| | |
| | | £m |
| |
| A 0.25% decrease in discount rate would have the following approximate effect: | | |
| |
| Increase in annual pension cost | | 29 |
| |
| Decrease in annual post-retirement benefits cost | | (1) |
| |
| Increase in pension obligation | | 800 |
| |
| Increase in post-retirement benefits obligation | | 41 |
| |
| A one year increase in life expectancy would have the following approximate effect: | | |
| |
| Increase in annual pension cost | | 20 |
| |
| Increase in annual post-retirement benefits cost | | 2 |
| |
| Increase in pension obligation | | 608 |
| |
| Increase in post-retirement benefits obligation | | 39 |
| |
| A 1% increase in the rate of future healthcare inflation would have the following approximate effect: | | |
| |
| Increase in annual post-retirement benefits cost | | 2 |
| |
| Increase in post-retirement benefits obligation | | 68 |
| |
| A 0.25% increase in inflation would have the following approximate effect: | | |
| |
| Increase in annual pension cost | | 19 |
| |
| Increase in pension obligation | | 502 |
| | |
| 198 | | |
GSK Annual Report 2017 | | |
| | |
| | |
Notes to the financial statementscontinued
29. Other provisions
| | | | | | | | | | | | | | | | | | | | |
| | | Legal
and other
disputes
£m | | | Major
restructuring
programmes
£m | | | Employee
related
provisions
£m | | | Other
provisions
£m | | | Total
£m | |
| At 1 January 2017 | | 344 | | | 554 | | | 306 | | | 296 | | | 1,500 | |
| | | | | |
Exchange adjustments | | | (29 | ) | | | (16 | ) | | | (8 | ) | | | (6 | ) | | | (59 | ) |
| | | | | |
| Charge for the year | | 173 | | | 259 | | | 50 | | | 69 | | | 551 | |
| | | | | |
Reversed unused | | | (7 | ) | | | (43 | ) | | | (3 | ) | | | (36 | ) | | | (89 | ) |
| | | | | |
| Unwinding of discount | | 2 | | | 4 | | | – | | | 10 | | | 16 | |
| | | | | |
Utilised | | | (288 | ) | | | (233 | ) | | | (41 | ) | | | (67 | ) | | | (629 | ) |
| | | | | |
Reclassifications and other movements | | | (9 | ) | | | (3 | ) | | | – | | | | 5 | | | | (7 | ) |
| | | | | |
Transfer to Pension obligations | | | – | | | | (18 | ) | | | – | | | | – | | | | (18 | ) |
| At 31 December 2017 | | 186 | | | 504 | | | 304 | | | 271 | | | 1,265 | |
| | | | | |
| To be settled within one year | | 138 | | | 292 | | | 90 | | | 109 | | | 629 | |
| | | | | |
| To be settled after one year | | 48 | | | 212 | | | 214 | | | 162 | | | 636 | |
At 31 December 2017 | | | 186 | | | | 504 | | | | 304 | | | | 271 | | | | 1,265 | |
Legal and other disputes
The Group is involved in a substantial number of legal and other disputes, including notification of possible claims, as set out in Note 45 ‘Legal proceedings’. Provisions for legal and other disputes include amounts relating to product liability, anti-trust, government investigations, contract terminations, self insurance and environmentalclean-up.
The charge for the year of £166 million (net of reversals and estimated insurance recoveries) primarily related to provisions for product liability cases regarding Paxil and other products, commercial disputes and various other government investigations.
The discount on the provisions increased by £2 million in 2017 (2016 – increased by £1 million). The discount was calculated using risk-adjusted projected cash flows and risk-free rates of return.
In respect of product liability claims related to certain products, there is sufficient history of claims made and settlements to enable management to make a reliable estimate of the provision required to cover unasserted claims. The ultimate liability for such matters may vary from the amounts provided and is dependent upon the outcome of litigation proceedings, investigations and possible settlement negotiations.
It is in the nature of the Group’s business that a number of these matters may be the subject of negotiation and litigation over many years. Litigation proceedings, including the various appeal procedures, often take many years to reach resolution, andout-of-court settlement discussions can also often be protracted.
The Group is in potential settlement discussions in a number of the disputes for which amounts have been provided and, based on its current assessment of the progress of these disputes, estimates that £138 million of the amount provided at 31 December 2017 will be settled within one year. At 31 December 2017, it was expected that £nil million (2016 – £nil) of the provision made for legal and other disputes will be reimbursed by third party insurers. For a discussion of legal issues, see Note 45, ‘Legal proceedings’.
Major restructuring programmes
In 2013, the Group initiated the Major Change restructuring programme focused on opportunities to simplify supply chain processes, build the Group’s capabilities in manufacturing and R&D and restructure the European Pharmaceuticals business.
The Pharmaceuticals restructuring programme, announced in October 2014, has been focused on rescaling commercial operations, global support functions and certain R&D/manufacturing operations across Pharmaceuticals. In addition, an integration restructuring programme was initiated in 2015, following the completion of the Novartis transaction, and the CEO Strategic Initiatives Programme was announced in July 2017. All of these restructuring and integration programmes are now reported together as one combined major restructuring programme.
Provisions for staff severance payments are made when management has made a formal decision to eliminate certain positions and this has been communicated to the groups of employees affected and appropriate consultation procedures completed, where appropriate. No provision is made for staff severance payments that are made immediately.
Pension augmentations arising from staff redundancies of £18 million (2016 – £23 million) have been charged during the year and then transferred to the pension obligations provision as shown in Note 28, ‘Pensions and other post-employment benefits’. Asset write-downs have been recognised as impairments of property, plant and equipment in Note 17, ‘Property, plant and equipment’. The majority of the amounts provided are expected to be utilised in the next two years.
Employee related provisions
Employee related provisions include obligations for certain medical benefits to disabled employees and their spouses in the US. At
31 December 2017, the provision for these benefits amounted to £108 million (2016 – £135 million). Other employee benefits reflect a variety of provisions for severance costs, jubilee awards and other long-service benefits.
Other provisions
Included in other provisions are insurance provisions of £6 million (2016 – £40 million), onerous property lease provisions of £38 million (2016 – £39 million) and a number of other provisions including vehicle insurance and regulatory matters.
| | | | |
| 199 | | |
| | | | | |
| GSK Annual Report 2017 | | Strategic report | | |
| | Governance and remuneration | | |
| | Financial statements | | |
| | Investor information | | |
30. Other non-current liabilities
| | | | | | | | | | |
| | | | | 2017 £m | | | 2016 £m | |
Accruals and deferred income | | | | 104 | | | 66 | |
| | | |
| Consumer Healthcare put option liability | | | | – | | | 7,420 | |
| | | |
| Other payables | | | | 877 | | | 959 | |
| | | |
| | | | | 981 | | | 8,445 | |
| | | |
| | | | | | | | | | | |
| | | |
31. Net debt | | | | | | | | | | |
| | | Listing exchange | | 2017 £m | | | 2016 £m | |
Current assets: | | | | | | | | |
| | | |
| Liquid investments | | | | 78 | | | 89 | |
| | | |
| Cash and cash equivalents | | | | 3,833 | | | 4,897 | |
| | | |
| | | | | 3,911 | | | 4,986 | |
Short-term borrowings: | | | | | | | | |
| | | |
Commercial paper | | | | | (529 | ) | | | (1,094 | ) |
| | | |
Bank loans and overdrafts | | | | | (236 | ) | | | (332 | ) |
| | | |
Obligations under finance leases | | | | | (23 | ) | | | (23 | ) |
| | | |
1.50% US$ US Medium Term Note 2017 | | New York Stock Exchange | | | – | | | | (1,612 | ) |
| | | |
5.625%€ European Medium Term Note 2017 | | London Stock Exchange | | | – | | | | (1,068 | ) |
| | | |
5.65% US$ US Medium Term Note 2018 | | New York Stock Exchange | | | (2,037 | ) | | | – | |
| | | |
| | | | | | (2,825 | ) | | | (4,129 | ) |
Long-term borrowings: | | | | | | | | | | |
| | | |
5.65% US$ US Medium Term Note 2018 | | New York Stock Exchange | | | – | | | | (2,216 | ) |
| | | |
0.625%€ European Medium Term Note 2019 | | London Stock Exchange | | | (1,324 | ) | | | (1,276 | ) |
| | | |
0%€ European Medium Term Note 2020 | | London Stock Exchange | | | (1,060 | ) | | | – | |
| | | |
2.85% US$ US Medium Term Note 2022 | | New York Stock Exchange | | | (1,474 | ) | | | (1,603 | ) |
| | | |
2.8% US$ US Medium Term Note 2023 | | New York Stock Exchange | | | (919 | ) | | | (999 | ) |
| | | |
1.375%€ European Medium Term Note 2024 | | London Stock Exchange | | | (876 | ) | | | (845 | ) |
| | | |
4.00%€ European Medium Term Note 2025 | | London Stock Exchange | | | (659 | ) | | | (635 | ) |
| | | |
1%€ European Medium Term Note 2026 | | London Stock Exchange | | | (617 | ) | | | – | |
| | | |
3.375% £ European Medium Term Note 2027 | | London Stock Exchange | | | (593 | ) | | | (593 | ) |
| | | |
1.375%€ European Medium Term Note 2029 | | London Stock Exchange | | | (439 | ) | | | – | |
| | | |
5.25% £ European Medium Term Note 2033 | | London Stock Exchange | | | (986 | ) | | | (986 | ) |
| | | |
5.375% US$ US Medium Term Note 2034 | | London Stock Exchange | | | (368 | ) | | | (401 | ) |
| | | |
6.375% US$ US Medium Term Note 2038 | | New York Stock Exchange | | | (2,021 | ) | | | (2,199 | ) |
| | | |
6.375% £ European Medium Term Note 2039 | | London Stock Exchange | | | (695 | ) | | | (695 | ) |
| | | |
5.25% £ European Medium Term Note 2042 | | London Stock Exchange | | | (989 | ) | | | (988 | ) |
| | | |
4.2% US$ US Medium Term Note 2043 | | New York Stock Exchange | | | (363 | ) | | | (395 | ) |
| | | |
4.25% £ European Medium Term Note 2045 | | London Stock Exchange | | | (789 | ) | | | (789 | ) |
| | | |
Obligations under finance leases | | | | | (43 | ) | | | (41 | ) |
| | | |
Other long term borrowings | | | | | (49 | ) | | | – | |
| | | |
| | | | | | (14,264 | ) | | | (14,661 | ) |
| | | |
Net debt | | | | | (13,178 | ) | | | (13,804 | ) |
| | |
| 200 | | |
GSK Annual Report 2017 | | |
| | |
| | |
Notes to the financial statementscontinued
31. Net debtcontinued
Current assets
Liquid investments are classified as available-for-sale investments. At 31 December 2017, they included US Treasury Notes and other government bonds. The effective interest rate on liquid investments at 31 December 2017 was approximately 1.0% (2016 – approximately 0.7%). Liquid investment balances at 31 December 2017 earning interest at floating rates amount to £78 million (2016 – £89 million). Liquid investment balances at 31 December 2017 earning interest at fixed rates amount to £nil million (2016 – £nil).
The effective interest rate on cash and cash equivalents at 31 December 2017 was approximately 1.3% (2016 – approximately 1.3%). Cash and cash equivalents at 31 December 2017 earning interest at floating and fixed rates amount to £3,832 million and £1 million respectively (2016 – £4,584 million and £3 million).
GSK’s policy regarding the credit quality of cash and cash equivalents is referred to in Note 42, ‘Financial instruments and related disclosures’.
Short-term borrowings
GSK has a $10 billion (£7.4 billion) US commercial paper programme, of which $0.7 billion (£0.5 billion) was in issue at 31 December 2017 (2016 – $1.4 billion (£1.1 billion)). GSK also has £1.9 billion five year committed facilities and $2.5 billion (£1.9 billion) of 364 day committed facilities. The five-year committed facilities were agreed in September 2015 and were extended by one year to 2021 in September 2016. The 364 day committed facilities were agreed in August 2017. Liquid investments, cash and cash equivalents were as shown in the table on page 199.
The weighted average interest rate on commercial paper borrowings at 31 December 2017 was 1.53% (2016 – 0.88%).
The weighted average interest rate on current bank loans and overdrafts at 31 December 2017 was 4.65% (2016 – 3.47%).
The average effective pre-swap interest rate of notes classified as short term at 31 December 2017 was 5.92% (2016 – 3.18%).
Long-term borrowings
At the year-end, GSK had long-term borrowings of £14.3 billion (2016 – £14.7 billion) of which £10.3 billion (2016 – £11.1 billion) falls due in more than five years. The average effective pre-swap interest rate of all notes in issue at 31 December 2017 was approximately 3.6% (2016 – approximately 4.1%).
Long-term borrowings repayable after five years carry interest at effective rates between 1.07% and 6.66%, with repayment dates ranging from 2023 to 2045.
Pledged assets
The Group held pledged investments in US Treasury Notes with a par value of $105 million (£78 million), (2016 – $105 million (£85 million)) as security against irrevocable letters of credit issued on the Group’s behalf in respect of the Group’s self-insurance activity. Provisions in respect of self-insurance are included within the provisions for legal and other disputes discussed in Note 29, ‘Other provisions’. In addition, £20 million (2016 – £23 million) of assets included in Note 22, ‘Other non-current assets’, which do not form part of Net debt, were pledged as collateral against future rental payments under operating lease arrangements entered into by Human Genome Sciences, Inc. prior to its acquisition by the Group.
Finance lease obligations
| | | | |
| | | 2017
£m | | 2016
£m |
| Rental payments due within one year | | 25 | | 25 |
| | |
| Rental payments due between one and two years | | 29 | | 23 |
| | |
| Rental payments due between two and three years | | 9 | | 12 |
| | |
| Rental payments due between three and four years | | 3 | | 7 |
| | |
| Rental payments due between four and five years | | 2 | | – |
| | |
| Rental payments due after five years | | 10 | | – |
| | |
| Total future rental payments | | 78 | | 67 |
| | |
| Future finance charges | | (12) | | (3) |
| | |
| Total finance lease obligations | | 66 | | 64 |
32. Contingent liabilities
At 31 December 2017, contingent liabilities, comprising guarantees, discounted bills and other items arising in the normal course of business, amounted to £434 million (2016 – £281 million). At 31 December 2017, £2 million (2016 – £1 million) of financial assets were pledged as collateral for contingent liabilities. Provision is made for the outcome of tax, legal and other disputes where it is both probable that the Group will suffer an outflow of funds and it is possible to make a reliable estimate of that outflow. At 31 December 2017, other than for those disputes where provision has been made, it was not possible to make a reliable estimate of the potential outflow of funds that might be required to settle disputes where the possibility of there being an outflow was more than remote. Descriptions of the significant tax, legal and other disputes to which the Group is a party are set out in Note 14, ‘Taxation’ and Note 45, ‘Legal proceedings’.
| | | | |
| 201 | | |
| | | | | |
| GSK Annual Report 2017 | | Strategic report | | |
| | Governance and remuneration | | |
| | Financial statements | | |
| | Investor information | | |
33. Share capital and share premium account
| | | | | | | | | | | | |
| | | Ordinary Shares of 25p each | | | Share premium | |
| | | Number | | | £m | | | £m | |
Share capital authorised | | | | | | | | | |
| | | |
| At 31 December 2015 | | 10,000,000,000 | | | 2,500 | | | | |
| | | |
| At 31 December 2016 | | 10,000,000,000 | | | 2,500 | | | | |
| | | |
| At 31 December 2017 | | 10,000,000,000 | | | 2,500 | | | | |
Share capital issued and fully paid | | | | | | | | | |
| | | |
| At 1 January 2015 | | 5,355,297,232 | | | 1,339 | | | 2,759 | |
| | | |
| Issued under employee share schemes | | 6,010,415 | | | 1 | | | 72 | |
At 31 December 2015 | | 5,361,307,647 | | | 1,340 | | | 2,831 | |
| | | |
| Issued under employee share schemes | | 7,008,415 | | | 2 | | | 87 | |
| | | |
| Ordinary shares acquired by ESOP Trusts | | – | | | – | | | 36 | |
At 31 December 2016 | | 5,368,316,062 | | | 1,342 | | | 2,954 | |
| | | |
| Issued under employee share schemes | | 4,237,758 | | | 1 | | | 55 | |
| | | |
| Ordinary shares acquired by ESOP Trusts | | – | | | – | | | 10 | |
| | | |
| At 31 December 2017 | | 5,372,553,820 | | | 1,343 | | | 3,019 | |
| | | |
| | | | | | | | | | | | |
| | | 31 December 2017 000 | | | 31 December 2016
000 | |
| Number of shares issuable under employee share schemes | | 38,647 | | | | | | 71,382 | |
| Number of unissued shares not under option | | 4,588,799 | | | | | | 4,560,302 | |
At 31 December 2017, of the issued share capital, 66,696,677 shares were held in the ESOP Trusts, 414,605,950 shares were held as Treasury shares and 4,891,251,193 shares were in free issue. All issued shares are fully paid. The nominal, carrying and market values of the shares held in the ESOP Trusts are disclosed in Note 43, ‘Employee share schemes’.
| | |
| 202 | | |
GSK Annual Report 2017 | | |
| | |
| | |
Notes to the financial statementscontinued
34. Movements in equity
Retained earnings and other reserves amounted to £(4,430) million at 31 December 2017 (2016 – £(3,172) million; 2015 – £943 million) of which £334 million (2016 – £329 million; 2015 – £283 million) relates to joint ventures and associated undertakings. The cumulative translation exchange in equity is as follows:
| | | | | | | | | | | | | | | | |
| | | Net translation exchange included in: | | | | |
| | | Retained
earnings
£m | | | Fair value
reserve
£m | | | Non-
controlling
interests
£m | | | Total
translation
exchange
£m | |
At 1 January 2015 | | | (137 | ) | | | 4 | | | | (117 | ) | | | (250 | ) |
| | | | |
Exchange movements on overseas net assets | | | (624 | ) | | | 6 | | | | 8 | | | | (610 | ) |
| | | | |
At 31 December 2015 | | | (761 | ) | | | 10 | | | | (109 | ) | | | (860 | ) |
| | | | |
Exchange movements on overseas net assets | | | 633 | | | | 13 | | | | 603 | | | | 1,249 | |
| | | | |
At 31 December 2016 | | | (128 | ) | | | 23 | | | | 494 | | | | 389 | |
| | | | |
Exchange movements on overseas net assets | | | 462 | | | | – | | | | (149 | ) | | | 313 | |
| | | | |
Reclassification of exchange on liquidation or disposal of overseas subsidiaries | | | 109 | | | | – | | | | – | | | | 109 | |
At 31 December 2017 | | | 443 | | | | 23 | | | | 345 | | | | 811 | |
|
The analysis of other comprehensive income by equity category is as follows: | |
| 2017 | | Retained
earnings
£m | | | Other
reserves
£m | | | Non-
controlling
interests
£m | | | Total £m | |
| | | | |
Items that may be subsequently reclassified to income statement: | | | | | | | | | | | | | | | | |
| | | | |
Exchange movements on overseas net assets and net investment hedges | | | 462 | | | | – | | | | – | | | | 462 | |
| | | | |
Reclassification of exchange on liquidation or disposal of overseas subsidiaries | | | 109 | | | | – | | | | – | | | | 109 | |
| | | | |
Fair value movements on available-for-sale investments | | | – | | | | (14 | ) | | | – | | | | (14 | ) |
| | | | |
Reclassification of fair value movements on available-for-sale investments | | | – | | | | (42 | ) | | | – | | | | (42 | ) |
| | | | |
Deferred tax on fair value movements on available-for-sale investments | | | – | | | | 47 | | | | – | | | | 47 | |
| | | | |
Deferred tax reversed on reclassification of available for sale investments | | | – | | | | (18 | ) | | | – | | | | (18 | ) |
| | | | |
Fair value movements on cash flow hedges | | | – | | | | (10 | ) | | | – | | | | (10 | ) |
| | | | |
Items that will not be reclassified to income statement: | | | | | | | | | | | | | | | | |
| | | | |
Exchange movements on overseas net assets of non-controlling interests | | | – | | | | – | | | | (149 | ) | | | (149 | ) |
| | | | |
Remeasurement gains on defined benefit plans | | | 549 | | | | – | | | | – | | | | 549 | |
| | | | |
Tax on remeasurement gains in defined benefit plans | | | (221 | ) | | | – | | | | – | | | | (221 | ) |
Other comprehensive income/(expense) for the year | | | 899 | | | | (37 | ) | | | (149 | ) | | | 713 | |
| | | | |
| 2016 | | Retained
earnings
£m | | | Other
reserves
£m | | | Non-
controlling
interests
£m | | | Total £m | |
| | | | |
Items that may be subsequently reclassified to income statement: | | | | | | | | | | | | | | | | |
| | | | |
Exchange movements on overseas net assets and net investment hedges | | | 633 | | | | 13 | | | | – | | | | 646 | |
| | | | |
Fair value movements on available-for-sale investments | | | – | | | | 251 | | | | – | | | | 251 | |
| | | | |
Reclassification of fair value movements on available-for-sale investments | | | – | | | | (245 | ) | | | – | | | | (245 | ) |
| | | | |
Deferred tax reversed on reclassification of available-for-sale investments | | | – | | | | 51 | | | | – | | | | 51 | |
| | | | |
Reclassification of cash flow hedges to income statement | | | – | | | | 1 | | | | – | | | | 1 | |
| | | | |
Fair value movements on cash flow hedges | | | – | | | | 2 | | | | – | | | | 2 | |
| | | | |
Deferred tax on fair value movements on cash flow hedges | | | – | | | | 2 | | | | – | | | | 2 | |
| | | | |
Items that will not be reclassified to income statement: | | | | | | | | | | | | | | | | |
| | | | |
Exchange movements on overseas net assets of non-controlling interests | | | – | | | | – | | | | 603 | | | | 603 | |
| | | | |
Remeasurement losses on defined benefit plans | | | (475 | ) | | | – | | | | – | | | | (475 | ) |
| | | | |
Tax on remeasurement losses in defined benefit plans | | | 126 | | | | – | | | | – | | | | 126 | |
Other comprehensive income for the year | | | 284 | | | | 75 | | | | 603 | | | | 962 | |
| | | | |
| GSK Annual Report 2017 | | Strategic report | | |
| | Governance and remuneration | | |
| | Financial statements | | |
| | Investor information | | |
34. Movements in equitycontinued
| | | | | | | | | | | | | | | | | | | | |
| 2015 | | | | | Retained
earnings
£m | | | Other
reserves £m | | | Non-
controlling
interests
£m | | | Total
£m | |
Items that may be subsequently reclassified to income statement: | | | | | | | | | | | | | | | | | | | | |
| | | | | |
Exchange movements on overseas net assets and net investment hedges | | | | | | | (624 | ) | | | 6 | | | | – | | | | (618 | ) |
| | | | | |
Fair value movements on available-for-sale investments | | | | | | | – | | | | 416 | | | | – | | | | 416 | |
| | | | | |
Deferred tax on fair value movements on available-for-sale investments | | | | | | | – | | | | (91 | ) | | | – | | | | (91 | ) |
| | | | | |
Reclassification of fair value movements on available-for-sale investments | | | | | | | – | | | | (346 | ) | | | – | | | | (346 | ) |
| | | | | |
Deferred tax reversed on reclassification of available-for-sale investments | | | | | | | – | | | | 36 | | | | – | | | | 36 | |
| | | | | |
Reclassification of cash flow hedges to income statement | | | | | | | – | | | | 2 | | | | – | | | | 2 | |
| | | | | |
Fair value movements on cash flow hedges | | | | | | | – | | | | 2 | | | | – | | | | 2 | |
| | | | | |
Share of other comprehensive expense of associates and joint ventures | | | | | | | (77 | ) | | | – | | | | – | | | | (77 | ) |
| | | | | |
Items that will not be reclassified to income statement: | | | | | | | | | | | | | | | | | | | | |
| | | | | |
Exchange movements on overseas net assets of non-controlling interests | | | | | | | – | | | | – | | | | 8 | | | | 8 | |
| | | | | |
Remeasurement gains on defined benefit plans | | | | | | | 261 | | | | – | | | | – | | | | 261 | |
| | | | | |
Tax on remeasurement gains in defined benefit plans | | | | | | | (80 | ) | | | – | | | | – | | | | (80 | ) |
Other comprehensive (expense)/income for the year | | | | | | | (520 | ) | | | 25 | | | | 8 | | | | (487 | ) |
|
The analysis of other reserves is as follows: | |
| | | ESOP Trust
shares £m | | | Fair value
reserve
£m | | | Cash flow
hedge reserve
£m | | | Other
reserves
£m | | | Total £m | |
| | | | | |
At 1 January 2015 | | | (151 | ) | | | 274 | | | | (13 | ) | | | 2,129 | | | | 2,239 | |
| | | | | |
Transferred to income and expense in the year on disposals | | | – | | | | (356 | ) | | | 2 | | | | – | | | | (354 | ) |
| | | | | |
Transferred to income and expense in the year on impairments | | | – | | | | 10 | | | | – | | | | – | | | | 10 | |
| | | | | |
Net fair value movement in the year | | | – | | | | 367 | | | | 2 | | | | – | | | | 369 | |
| | | | | |
Ordinary shares acquired by ESOP Trusts | | | (99 | ) | | | – | | | | – | | | | – | | | | (99 | ) |
| | | | | |
Write-down of shares held by ESOP Trusts | | | 175 | | | | – | | | | – | | | | – | | | | 175 | |
| | | | | |
At 31 December 2015 | | | (75 | ) | | | 295 | | | | (9 | ) | | | 2,129 | | | | 2,340 | |
| | | | | |
Transferred to income and expense in the year on disposals | | | (16 | ) | | | (268 | ) | | | – | | | | – | | | | (284 | ) |
| | | | | |
Transferred to income and expense in the year on impairments | | | – | | | | 23 | | | | – | | | | – | | | | 23 | |
| | | | | |
Net fair value movement in the year | | | – | | | | 330 | | | | 6 | | | | – | | | | 336 | |
| | | | | |
Ordinary shares acquired by ESOP Trusts | | | (576 | ) | | | – | | | | – | | | | – | | | | (576 | ) |
| | | | | |
Write-down of shares held by ESOP Trusts | | | 381 | | | | – | | | | – | | | | – | | | | 381 | |
| | | | | |
At 31 December 2016 | | | (286 | ) | | | 380 | | | | (3 | ) | | | 2,129 | | | | 2,220 | |
| | | | | |
Transferred to income and expense in the year on disposals | | | 22 | | | | (42 | ) | | | – | | | | – | | | | (20 | ) |
| | | | | |
Transferred to income and expense in the year on impairments | | | – | | | | – | | | | – | | | | – | | | | – | |
| | | | | |
Net fair value movement in the year | | | – | | | | (9 | ) | | | (8 | ) | | | – | | | | (17 | ) |
| | | | | |
Ordinary shares acquired by ESOP Trusts | | | (656 | ) | | | – | | | | – | | | | – | | | | (656 | ) |
| | | | | |
Write-down of shares held by ESOP Trusts | | | 520 | | | | – | | | | – | | | | – | | | | 520 | |
At 31 December 2017 | | | (400 | ) | | | 329 | | | | (11 | ) | | | 2,129 | | | | 2,047 | |
Other reserves include various non-distributable merger and pre-merger reserves amounting to £1,849 million at 31 December 2017 (2016 – £1,849 million; 2015 – £1,849 million). Other reserves also include the capital redemption reserve created as a result of the share buy-back programme amounting to £280 million at 31 December 2017 (2016 – £280 million; 2015 – £280 million).
| | |
| 204 | | |
GSK Annual Report 2017 | | |
| | |
| | |
Notes to the financial statementscontinued
35. Related party transactions
At 31 December 2017, GSK owned 32 million shares or 31.4% of Innoviva Inc. which is a biopharmaceutical company listed on NASDAQ. GSK began recognising Innoviva as an associate on 1 September 2015. The royalties due from GSK to Innoviva in the year were £173 million (2016 – £108 million). At 31 December 2017, the balance payable by GSK to Innoviva was £53 million (2016 – £36 million).
At 31 December 2017, GSK held a 50% interest in Japan Vaccine Co. Ltd (JVC) through its subsidiary GlaxoSmithKline K.K. This joint venture with Daiichi Sankyo Co., Ltd is primarily responsible for the development and marketing of certain prophylactic vaccines in Japan. During 2017, GSK sold £41 million (2016 – £43 million) of its vaccine products into the joint venture. At 31 December 2017, the trading balance due to GSK from JVC was £11 million (2016 – £9 million) and the balance payable by GSK to JVC was £nil million (2016 – £nil). Loans of £7 million to JVC, £7 million to Medicxi Ventures I LP and £8 million to Index Ventures Life VI (Jersey) LP remained due to GSK at 31 December 2017.
The aggregate compensation of the Directors and CET is given in Note 9, ‘Employee costs’.
36. Adjustments reconciling profit after tax to operating cash flows
| | | | | | | | | | | | |
| | | 2017 £m | | | 2016 £m | | | 2015 £m | |
Profit after tax | | | 2,169 | | | | 1,062 | | | | 8,372 | |
| | | |
Tax on profits | | | 1,356 | | | | 877 | | | | 2,154 | |
| | | |
Share of after tax profits of associates and joint ventures | | | (13 | ) | | | (5 | ) | | | (14 | ) |
| | | |
Finance expense net of finance income | | | 669 | | | | 664 | | | | 653 | |
| | | |
Depreciation | | | 988 | | | | 978 | | | | 892 | |
| | | |
Amortisation of intangible assets | | | 934 | | | | 796 | | | | 738 | |
| | | |
Impairment and assets written off | | | 1,061 | | | | 226 | | | | 822 | |
| | | |
Profit on sale of businesses | | | (157 | ) | | | (5 | ) | | | (9,308 | ) |
| | | |
Profit on sale of intangible assets | | | (46 | ) | | | (178 | ) | | | (349 | ) |
| | | |
Profit on sale of investments in associates | | | (94 | ) | | | – | | | | (843 | ) |
| | | |
Profit on sale of equity investments | | | (37 | ) | | | (254 | ) | | | (342 | ) |
| | | |
Changes in working capital: | | | | | | | | | | | | |
| | | |
(Increase)/decrease in inventories | | | (461 | ) | | | 70 | | | | (111 | ) |
| | | |
(Increase)/decrease in trade receivables | | | (287 | ) | | | (188 | ) | | | 98 | |
| | | |
Increase in trade payables | | | 11 | | | | 96 | �� | | | 40 | |
| | | |
Decrease/(increase) in other receivables | | | 74 | | | | 381 | | | | (593 | ) |
| | | |
Contingent consideration paid (see Note 39) | | | (594 | ) | | | (358 | ) | | | (121 | ) |
| | | |
Other non-cash increase in contingent consideration liabilities | | | 961 | | | | 2,281 | | | | 1,986 | |
| | | |
Increase in other payables | | | 1,741 | | | | 1,989 | | | | 276 | |
| | | |
(Decrease)/increase in pension and other provisions | | | (255 | ) | | | (621 | ) | | | 100 | |
| | | |
Share-based incentive plans | | | 333 | | | | 319 | | | | 368 | |
| | | |
Fair value adjustments | | | – | | | | (3 | ) | | | – | |
| | | |
Other | | | (95 | ) | | | (21 | ) | | | (187 | ) |
| | | | |
| | | | 6,089 | | | | 7,044 | | | | (3,741 | ) |
| | | |
Cash generated from operations | | | 8,258 | | | | 8,106 | | | | 4,631 | |
| | | | |
| 205 | | |
| | | | | |
| GSK Annual Report 2017 | | Strategic report | | |
| | Governance and remuneration | | |
| | Financial statements | | |
| | Investor information | | |
37. Reconciliation of net cash flow to movement in net debt
| | | | | | | | | | | | |
| | | 2017 £m | | | 2016 £m | | | 2015 £m | |
Net debt at beginning of year | | | (13,804 | ) | | | (10,727 | ) | | | (14,377 | ) |
| | | |
(Decrease)/increase in cash and bank overdrafts | | | (905 | ) | | | (1,164 | ) | | | 1,503 | |
| | | |
(Decrease)/increase in liquid investments | | | (4 | ) | | | – | | | | 2 | |
| | | |
Net increase in long-term loans | | | (2,233 | ) | | | – | | | | – | |
| | | |
Net repayment of/(increase in) short-term loans | | | 3,200 | | | | (148 | ) | | | 2,412 | |
| | | |
Net repayment of obligations under finance leases | | | 23 | | | | 18 | | | | 25 | |
| | | |
Exchange adjustments | | | 585 | | | | (1,781 | ) | | | (268 | ) |
| | | |
Other non-cash movements | | | (40 | ) | | | (2 | ) | | | (24 | ) |
Movement in net debt | | | 626 | | | | (3,077 | ) | | | 3,650 | |
| | | |
Net debt at end of year | | | (13,178 | ) | | | (13,804 | ) | | | (10,727 | ) |
| | | | | | | | | | | | | | | | | | | | | | | | | | | | | | |
| Analysis of changes in net debt | | At 1 January
2017 £m | | | Exchange
£m | | | Other
£m | | | Profit
and loss
£m | | | Reclass-
ifications
£m | | | Disposals
£m | | | Cash flow
£m | | | At 31 December
2017 £m |
Liquid investments | | | 89 | | | | (7 | ) | | | – | | | | – | | | | – | | | | – | | | | (4 | ) | | 78 |
| | | | | | | | |
Cash and cash equivalents | | | 4,897 | | | | (106 | ) | | | – | | | | – | | | | – | | | | (6 | ) | | | (952 | ) | | 3,833 |
| | | | | | | | |
Overdrafts | | | (292 | ) | | | 6 | | | | – | | | | – | | | | – | | | | – | | | | 53 | | | (233) |
| | | | | | | | | |
| | | | 4,605 | | | | (100 | ) | | | – | | | | – | | | | – | | | | (6 | ) | | | (899 | ) | | 3,600 |
| | | | | | | | |
Debt due within one year: | | | | | | | | | | | | | | | | | | | | | | | | | | | | | | |
| | | | | | | | |
Commercial paper | | | (1,094 | ) | | | 37 | | | | – | | | | – | | | | – | | | | – | | | | 528 | | | (529) |
| | | | | | | | |
European and US Medium Term Notes | | | (2,680 | ) | | | 121 | | | | – | | | | – | | | | (2,114 | ) | | | – | | | | 2,636 | | | (2,037) |
| | | | | | | | |
Other | | | (63 | ) | | | 2 | | | | (5 | ) | | | – | | | | (19 | ) | | | – | | | | 59 | | | (26) |
| | | | | | | | | |
| | | | (3,837 | ) | | | 160 | | | | (5 | ) | | | – | | | | (2,133 | ) | | | – | | | | 3,223 | | | (2,592) |
| | | | | | | | |
Debt due after one year: | | | | | | | | | | | | | | | | | | | | | | | | | | | | | | |
| | | | | | | | |
European and US Medium Term Notes | | | (14,620 | ) | | | 530 | | | | 4 | | | | (16 | ) | | | 2,114 | | | | – | | | | (2,233 | ) | | (14,221) |
| | | | | | | | |
Other | | | (41 | ) | | | 2 | | | | (23 | ) | | | – | | | | 19 | | | | – | | | | – | | | (43) |
| | | | (14,661 | ) | | | 532 | | | | (19 | ) | | | (16 | ) | | | 2,133 | | | | – | | | | (2,233 | ) | | (14,264) |
| | | | | | | | |
Net debt | | | (13,804 | ) | | | 585 | | | | (24 | ) | | | (16 | ) | | | – | | | | (6 | ) | | | 87 | | | (13,178) |
| | | | | | | | |
Analysis of changes in liabilities from financing activities | | | | | | | | | | | | | | | | | | | | | | | | | | | | | | |
| | | | | | | | |
Debt due within one year | | | (3,837 | ) | | | 160 | | | | (5 | ) | | | – | | | | (2,133 | ) | | | – | | | | 3,223 | | | (2,592) |
| | | | | | | | |
Debt due after one year | | | (14,661 | ) | | | 532 | | | | (19 | ) | | | (16 | ) | | | 2,133 | | | | – | | | | (2,233 | ) | | (14,264) |
| | | | | | | | |
Hedge of borrowings: | | | | | | | | | | | | | | | | | | | | | | | | | | | | | | |
| | | | | | | | |
Derivative financial instruments | | | (38 | ) | | | – | | | | 37 | | | | 5 | | | | – | | | | – | | | | (2 | ) | | 2 |
| | | | | | | | |
Other financing items | | | – | | | | 91 | | | | – | | | | – | | | | – | | | | – | | | | (91 | ) | | – |
| | | | | | | | |
Interest payable | | | (158 | ) | | | 4 | | | | 1 | | | | (731 | ) | | | (100 | ) | | | – | | | | 781 | | | (203) |
Total liabilities from financing activities | | | (18,694 | ) | | | 787 | | | | 14 | | | | (742 | ) | | | (100 | ) | | | – | | | | 1,678 | | | (17,057) |
For further information on significant changes in net debt see Note 31, ‘Net debt’.
| | |
| 206 | | |
GSK Annual Report 2017 | | |
| | |
| | |
Notes to the financial statementscontinued
38. Acquisitions and disposals
Details of the acquisition and disposal of significant subsidiaries and associates, joint ventures and other businesses are given below:
2017
Business acquisitions
There were no business acquisitions during 2017.
Business disposals
GSK made a number of small business disposals during the year for a net cash consideration of £342 million, including contingent consideration receivable of £86 million. The profit on disposal was determined as follows:
| | | | |
| | | Total
£m | |
Consideration including currency forwards and purchase adjustments | | | 342 | |
| |
Net assets sold: | | | | |
| |
Goodwill | | | (16 | ) |
| |
Intangible assets | | | (21 | ) |
| |
Property, plant and equipment | | | (18 | ) |
| |
Inventory | | | (11 | ) |
| |
Cash and cash equivalents | | | (6 | ) |
| |
Other net assets | | | (5 | ) |
| | | (77 | ) |
| |
Transaction costs | | | (8 | ) |
| |
Reclassification of exchange from other comprehensive income | | | (100 | ) |
Profit on disposal | | | 157 | |
Investment in associates and joint ventures
During the year, GSK made cash investments of £15 million into associates and joint ventures. In addition, GSK sold its holdings in two associates for £198 million in cash.
| | | | |
| | | Total
£m | |
Cash consideration | | | 198 | |
| |
Net book value of shares | | | (92 | ) |
| |
Reclassification of exchange from other comprehensive income | | | (7 | ) |
| |
Transaction costs | | | (5 | ) |
Profit on disposal | | | 94 | |
Cash flows
| | | | | | | | | | | | |
| | | Business disposals £m | | | Associates and JV investments £m | | | Associates
and JV
disposals
£m | |
Cash consideration | | | 256 | | | | (15 | ) | | | 198 | |
| | | |
Net deferred consideration received | | | 39 | | | | – | | | | – | |
| | | |
Cash and cash equivalents divested | | | (6 | ) | | | – | | | | – | |
| | | |
Transaction costs paid | | | (7 | ) | | | – | | | | (2 | ) |
Cash inflow | | | 282 | | | | (15 | ) | | | 196 | |
2016
Business acquisitions
GSK completed two small business acquisitions during 2016.
Cash consideration of £24 million was paid in the year to acquire the HIV R&D preclinical and discovery stage portfolio from Bristol Myers Squibb. Further consideration, contingent on commercial milestones and future sales performance, may be due, and an initial estimate of £40 million was recognised for this contingent consideration. Intangible assets acquired were valued at £57 million and goodwill of £7 million was recognised.
GSK formed Galvani Bioelectronics Limited during the year and acquired intangible assets of £45 million and cash and cash equivalents of £41 million from Verily Life Sciences LLC in return for a 45% shareholding in Galvani Bioelectronics. The fair value of this shareholding was £47 million, and GSK also recognised a credit of £39 million in non-controlling interests representing Verily’s share of the net assets it contributed.
Business disposals
GSK also made a number of small business disposals in the year for net cash consideration of £72 million. In addition, deferred consideration receivable of £43 million was recognised.
| | | | |
| GSK Annual Report 2017 | | Strategic report | | |
| | Governance and remuneration | | |
| | Financial statements | | |
| | Investor information | | |
38. Acquisitions and disposalscontinued
Cash flows
| | | | | | | | |
| | | Business
acquisitions
£m | | | Business
disposals
£m | |
Cash consideration (paid)/received after purchase adjustments | | | (24 | ) | | | 72 | |
| | |
Cash and cash equivalents acquired | | | 41 | | | | – | |
Cash inflow | | | 17 | | | | 72 | |
In addition, GSK made cash investments of £11 million into associates and joint ventures.
2015
Business acquisitions
Novartis Consumer Healthcare and Vaccines businesses
The three-part inter-conditional transaction with Novartis AG involving the Consumer Healthcare, Vaccines and Oncology businesses completed on 2 March 2015.
GSK and Novartis have contributed their respective Consumer Healthcare businesses into a Consumer Healthcare Joint Venture in a non-cash transaction. GSK has an equity interest of 63.5% and majority control of the Joint Venture. In addition, GSK has acquired Novartis’ global Vaccines business (excluding influenza vaccines) for an initial cash consideration of $5.25 billion (£3.417 billion) with contingent consideration representing subsequent potential milestone payments of up to $1.8 billion (£1.2 billion) arising on the achievement of specified development targets and ongoing royalties based on the future sales performance of certain products, and so the total amount payable is unlimited. The first milestone of $450 million (£300 million) was paid on 26 March 2015.
Other business acquisitions
In addition, GSK completed one smaller Vaccines business acquisition for cash consideration of £120 million, net of cash acquired, and the fair value of existing investments of £15 million. This represented goodwill of £22 million and intangible assets of £124 million less other net liabilities of £11 million.
The fair values of the assets acquired in business combinations, including goodwill, are set out in the table below.
| | | | | | | | | | | | |
| | | Novartis
Consumer
Healthcare
business
£m | | | Novartis
Vaccines
business
£m | | | Other
£m | |
Net assets acquired: | | | | | | | | | | | | |
| | | |
Intangible assets | | | 6,003 | | | | 2,680 | | | | 124 | |
| | | |
Property, plant and equipment | | | 249 | | | | 434 | | | | 1 | |
| | | |
Inventory | | | 257 | | | | 347 | | | | – | |
| | | |
Trade and other receivables | | | 400 | | | | 162 | | | | 2 | |
| | | |
Other assets including cash and cash equivalents | | | 304 | | | | 283 | | | | 19 | |
| | | |
Trade and other payables | | | (402 | ) | | | (107 | ) | | | (3 | ) |
| | | |
Deferred tax liabilities | | | (1,154 | ) | | | (78 | ) | | | (26 | ) |
| | | |
Other liabilities | | | (165 | ) | | | (299 | ) | | | – | |
| | | 5,492 | | | | 3,422 | | | | 117 | |
| | | |
Non-controlling interest | | | (2,150 | ) | | | (19 | ) | | | – | |
| | | |
Goodwill | | | 774 | | | | 576 | | | | 22 | |
| | | | 4,116 | | | | 3,979 | | | | 139 | |
| | | |
Consideration settled by shares in GSK Consumer Healthcare Holdings | | | 4,116 | | | | – | | | | – | |
| | | |
Cash consideration paid after purchase adjustments | | | – | | | | 3,461 | | | | 124 | |
| | | |
Fair value of equity investment disposal | | | – | | | | – | | | | 15 | |
| | | |
Contingent consideration | | | – | | | | 594 | | | | – | |
| | | |
Deferred tax on contingent consideration | | | – | | | | (52 | ) | | | – | |
| | | |
Loss on settlement of pre-existing relationships | | | – | | | | (24 | ) | | | – | |
Total consideration | | | 4,116 | | | | 3,979 | | | | 139 | |
| | |
| 208 | | |
GSK Annual Report 2017 | | |
| | |
| | |
Notes to the financial statementscontinued
38. Acquisitions and disposalscontinued
The non-controlling interest in the Consumer Healthcare Joint Venture, calculated applying the full goodwill method, represents Novartis’ share of the net assets it contributed to the Joint Venture together with attributable goodwill.
The goodwill in the businesses acquired represents the potential for further synergies arising from combining the acquired businesses with GSK’s existing businesses together with the value of the workforce acquired. The majority of the goodwill recognised is not expected to be deductible for tax purposes.
Total transaction costs recognised in 2014 and 2015 for the acquisitions from Novartis amounted to £102 million.
Between 2 March 2015 and 31 December 2015, turnover of £1,941 million arising from the Novartis Consumer Healthcare and Vaccines businesses was included in Group turnover. If the businesses had been acquired at the beginning of the year, it is estimated that Group turnover in 2015 would have been approximately £320 million higher. These businesses have been integrated into the Group’s existing activities and it is not practical to identify the impact on the Group profit in the period.
Business disposals
Oncology
GSK has divested its marketed Oncology business, related R&D activities and rights to its AKT inhibitor and also granted commercialisation partner rights for future oncology products to Novartis for consideration of $16 billion (£10,395 million) before purchase adjustments.
Other business disposals
GSK also made a number of small business disposals in the period for net cash consideration of £309 million. Profit on disposal of the businesses has been determined as follows:
| | | | | | | | |
| | | Oncology
£m | | | Other
£m | |
Cash consideration including currency forwards and purchase adjustments | | | 10,060 | | | | 309 | |
Net assets sold: | | | | | | | | |
| | |
Goodwill | | | (497 | ) | | | (14 | ) |
| | |
Intangible assets | | | (516 | ) | | | (107 | ) |
| | |
Property, plant and equipment | | | – | | | | (25 | ) |
| | |
Inventory | | | – | | | | (51 | ) |
| | |
Cash | | | – | | | | (5 | ) |
| | |
Other net assets | | | – | | | | (6 | ) |
| | | (1,013 | ) | | | (208 | ) |
| | |
Loss on currency forwards booked in 2014 | | | 299 | | | | – | |
| | |
Disposal costs | | | (118 | ) | | | (21 | ) |
Profit on disposal | | | 9,228 | | | | 80 | |
Associates and joint ventures
During the year, GSK made cash investments of £16 million into associates and joint ventures. In addition, in March 2015, GSK sold half of its shareholding in Aspen, representing 6.2% of the issued share capital of the company, for £571 million in cash. As a result of the sale, the Group was no longer considered to have the ability to exert significant influence over Aspen and the Group’s remaining investment was transferred from Investments in associates to Other investments.
| | | | |
| | | £m | |
Cash consideration | | | 571 | |
| |
Net book value of shares | | | (143 | ) |
| |
Reclassification of exchange from other comprehensive income | | | (30 | ) |
| |
Transaction fees | | | (7 | ) |
| |
Other items | | | (5 | ) |
Profit on disposal | | | 386 | |
| | | | | | | | | | | | | | | | |
| Cash flows | | Business
acquisitions
£m | | | Business
disposals
£m | | | Associates and
JV disposals
£m | | | Total
£m | |
Cash consideration (paid)/received after purchase adjustments | | | (3,585 | ) | | | 10,369 | | | | 571 | | | | 7,355 | |
| | | | |
Cash and cash equivalents acquired/(divested) | | | 404 | | | | (5 | ) | | | – | | | | 399 | |
| | | | |
Deferred cash proceeds | | | – | | | | (38 | ) | | | – | | | | (38 | ) |
| | | | |
Contingent consideration paid | | | (338 | ) | | | – | | | | – | | | | (338 | ) |
| | | | |
Transaction costs and other | | | (22 | ) | | | (80 | ) | | | (7 | ) | | | (109 | ) |
Cash (outflow)/inflow | | | (3,541 | ) | | | 10,246 | | | | 564 | | | | 7,269 | |
| | | | |
| 209 | | |
| | | | | |
| GSK Annual Report 2017 | | Strategic report | | |
| | Governance and remuneration | | |
| | Financial statements | | |
| | Investor information | | |
39. Contingent consideration liabilities
The consideration for certain acquisitions includes amounts contingent on future events such as development milestones or sales performance. The Group has provided for the fair value of this contingent consideration as follows:
| | | | | | | | | | | | | | | | |
| | | Shionogi-
ViiV
Healthcare
£m | | | Novartis
Vaccines
£m | | | Other
£m | | | Total
£m | |
At 1 January 2015 | | | 1,684 | | | | – | | | | 40 | | | | 1,724 | |
| | | | |
Additions through business combinations | | | – | | | | 594 | | | | – | | | | 594 | |
| | | | |
Remeasurement through income statement | | | 1,874 | | | | 111 | | | | 1 | | | | 1,986 | |
| | | | |
Cash payments: operating cash flows | | | (121 | ) | | | – | | | | – | | | | (121 | ) |
| | | | |
Cash payments: investing activities | | | (38 | ) | | | (300 | ) | | | – | | | | (338 | ) |
| | | | |
Other movements | | | 10 | | | | – | | | | – | | | | 10 | |
At 31 December 2015 | | | 3,409 | | | | 405 | | | | 41 | | | | 3,855 | |
| | | | |
Additions through business combinations | | | 154 | | | | – | | | | 40 | | | | 194 | |
| | | | |
Remeasurement through income statement | | | 2,162 | | | | 152 | | | | (33 | ) | | | 2,281 | |
| | | | |
Cash payments: operating cash flows | | | (351 | ) | | | (5 | ) | | | (2 | ) | | | (358 | ) |
| | | | |
Cash payments: investing activities | | | (66 | ) | | | (7 | ) | | | – | | | | (73 | ) |
| | | | |
Other movements | | | (4 | ) | | | – | | | | 1 | | | | (3 | ) |
At 31 December 2016 | | | 5,304 | | | | 545 | | | | 47 | | | | 5,896 | |
| | | | |
Remeasurement through income statement | | | 909 | | | | 53 | | | | (1 | ) | | | 961 | |
| | | | |
Cash payments: operating cash flows | | | (587 | ) | | | (7 | ) | | | – | | | | (594 | ) |
| | | | |
Cash payments: investing activities | | | (84 | ) | | | (7 | ) | | | – | | | | (91 | ) |
At 31 December 2017 | | | 5,542 | | | | 584 | | | | 46 | | | | 6,172 | |
Of the contingent consideration payable at 31 December 2017, £1,076 million (2016 – £561 million) is expected to be paid within one year. The contingent consideration payable in respect of the Novartis Vaccines business included a sales milestone of $450 million which was settled in January 2018.
The consideration payable for the acquisition of the Shionogi-ViiV Healthcare joint venture and the Novartis Vaccines business is expected to be paid over a number of years. As a result, the total estimated liabilities are discounted to their present values, shown above. The Shionogi-ViiV Healthcare contingent consideration liability is discounted at 8.5% and the Novartis Vaccines contingent consideration liability is discounted partly at 8% and partly at 9%.
The Shionogi-ViiV Healthcare contingent consideration liability is calculated based on the forecast sales performance of specified products, principally dolutegravir, over the life of those products.
The table below shows on an indicative basis the income statement and balance sheet sensitivity to reasonably possible changes in key inputs to the valuations of the contingent consideration liabilities.
| | | | | | |
| Increase/(decrease) in financial liability and loss/(gain) in Income statement | | Shionogi-
ViiV Healthcare
£m | | | Novartis
Vaccines £m |
10% increase in sales forecasts | | | 535 | | | 56 |
| | |
10% decrease in sales forecasts | | | (535 | ) | | (55) |
| | |
1% increase in discount rate | | | (228 | ) | | (18) |
| | |
1% decrease in discount rate | | | 245 | | | 20 |
| | |
5% increase in probability of milestone success | | | | | | 6 |
| | |
5% decrease in probability of milestone success | | | | | | (6) |
| | |
10 cent appreciation of US Dollar | | | 329 | | | 17 |
| | |
10 cent depreciation of US Dollar | | | (284 | ) | | (15) |
| | |
10 cent appreciation of Euro | | | 95 | | | 25 |
| | |
10 cent depreciation of Euro | | | (80 | ) | | (21) |
An explanation of the accounting for ViiV Healthcare is set out on page 59.
| | |
| 210 | | |
GSK Annual Report 2017 | | |
| | |
| | |
Notes to the financial statementscontinued
40. Non-controlling interests
The Group has two subgroups that have material non-controlling interests, ViiV Healthcare Limited and its subsidiaries and GSK Consumer Healthcare Holdings Limited and its subsidiaries. Summarised financial information in respect of the ViiV Healthcare group and GSK Consumer Healthcare Joint Venture is set out below:
ViiV Healthcare
| | | | | | | | | | | | |
| | | 2017
£m | | | 2016
£m | | | 2015
£m | |
Turnover | | | 4,269 | | | | 3,527 | | | | 2,330 | |
| | | |
Profit/(loss) after taxation | | | 825 | | | | (1,249 | ) | | | (1,426 | ) |
| | | |
Other comprehensive income | | | 20 | | | | 36 | | | | 7 | |
Total comprehensive income/(expense) | | | 845 | | | | (1,213 | ) | | | (1,419 | ) |
| | | |
| | | | | | | | | | | | |
| | | 2017
£m | | | 2016
£m | | | | |
Non-current assets | | | 2,736 | | | | 3,064 | | | | | |
Current assets | | | 2,533 | | | | 2,357 | | | | | |
Total assets | | | 5,269 | | | | 5,421 | | | | | |
| | | |
Current liabilities | | | (2,409 | ) | | | (1,977 | ) | | | | |
| | | |
Non-current liabilities | | | (8,011 | ) | | | (7,983 | ) | | | | |
Total liabilities | | | (10,420 | ) | | | (9,960 | ) | | | | |
Net liabilities | | | (5,151 | ) | | | (4,539 | ) | | | | |
| | | |
| | | | | | | | | | | | |
| | | 2017
£m | | | 2016
£m | | | 2015
£m | |
Net cash inflow from operating activities | | | 2,132 | | | | 1,750 | | | | 1,097 | |
| | | |
Net cash outflow from investing activities | | | (207 | ) | | | (326 | ) | | | (63 | ) |
| | | |
Net cash outflow from financing activities | | | (1,820 | ) | | | (1,023 | ) | | | (814 | ) |
Increase in cash and bank overdrafts in the year | | | 105 | | | | 401 | | | | 220 | |
The above financial information relates to the ViiV Healthcare group on a stand-alone basis, before the impact of Group-related adjustments, primarily related to the recognition of preferential dividends. The profit after taxation of £825 million (2016 – loss after taxation of £1,249 million; 2015 – loss after taxation of £1,426 million) is stated after charging preferential dividends payable to GSK, Shionogi and Pfizer and after a charge of £909 million (2016 – £2,186 million; 2015 – £1,874 million) for remeasurement of the contingent consideration payable for the acquisition of the former Shionogi-ViiV Healthcare joint venture. This consideration is expected to be paid over a number of years.
The following amounts attributable to the ViiV Healthcare group are included in GSK’s Consolidated statement of comprehensive income, Consolidated statement of changes in equity and Consolidated balance sheet:
| | | | | | | | | | | | |
| | | 2017
£m | | | 2016
£m | | | 2015
£m | |
Total comprehensive income/(expense) for the year attributable to non-controlling interests | | | 187 | | | | (83 | ) | | | (143 | ) |
| | | |
Dividends paid to non-controlling interests | | | 316 | | | | 152 | | | | 163 | |
| | | |
Non-controlling interests in the Consolidated balance sheet | | | (476 | ) | | | (353 | ) | | | | |
| | | | |
| GSK Annual Report 2017 | | Strategic report | | |
| | Governance and remuneration | | |
| | Financial statements | | |
| | Investor information | | |
| | | | |
40. Non-controlling interestscontinued
Consumer Healthcare Joint Venture
| | | | | | | | | | | | |
| | | 2017
£m | | | 2016
£m | | | 2015
£m | |
Turnover | | | 7,003 | | | | 6,530 | | | | 4,627 | |
| | | |
Profit/(loss) after taxation | | | 1,211 | | | | 660 | | | | (39 | ) |
| | | |
Other comprehensive income | | | (387 | ) | | | 1,640 | | | | 72 | |
Total comprehensive income | | | 824 | | | | 2,300 | | | | 33 | |
| | | |
| | | | | | | | | | | | |
| | | 2017 £m | | | 2016
£m | | | | |
Non-current assets | | | 12,771 | | | | 13,315 | | | | | |
| | | |
Current assets | | | 3,282 | | | | 3,996 | | | | | |
Total assets | | | 16,053 | | | | 17,311 | | | | | |
| | | |
Current liabilities | | | (2,675 | ) | | | (3,060 | ) | | | | |
| | | |
Non-current liabilities | | | (1,537 | ) | | | (2,062 | ) | | | | |
Total liabilities | | | (4,212 | ) | | | (5,122 | ) | | | | |
Net assets | | | 11,841 | | | | 12,189 | | | | | |
| | | |
| | | | | | | | | | | | |
| | | 2017
£m | | | 2016
£m | | | 2015
£m | |
Net cash inflow from operating activities | | | 883 | | | | 1,496 | | | | 277 | |
| | | |
Net cash inflow/(outflow) from investing activities | | | 270 | | | | (537 | ) | | | (691 | ) |
| | | |
Net cash outflow from financing activities | | | (1,194 | ) | | | (980 | ) | | | (42 | ) |
Decrease in cash and bank overdrafts in the year | | | (41 | ) | | | (21 | ) | | | (456 | ) |
The above financial information relates to the Consumer Healthcare Joint Venture on a stand-alone basis, before the impact of Group-related adjustments but after major restructuring charges.
The following amounts attributable to the Consumer Healthcare Joint Venture are included in GSK’s Consolidated statement of comprehensive income, Consolidated statement of changes in equity and Consolidated balance sheet:
| | | | | | | | | | | | |
| | | 2017
£m | | | 2016
£m | | | 2015
£m | |
Total comprehensive income for the year attributable to non-controlling interests | | | 296 | | | | 730 | | | | 14 | |
| | | |
Dividends paid to non-controlling interests | | | 420 | | | | 346 | | | | – | |
| | | |
Non-controlling interests in the Consolidated balance sheet | | | 3,631 | | | | 3,755 | | | | | |
| | |
| 212 | | |
GSK Annual Report 2017 | | |
| | |
| | |
Notes to the financial statementscontinued
41. Commitments
| | | | | | | | |
| Contractual obligations and commitments | | 2017
£m | | | 2016
£m | |
Contracted for but not provided in the financial statements: | | | | | | | | |
| | |
Intangible assets | | | 5,254 | | | | 7,199 | |
| | |
Property, plant and equipment | | | 584 | | | | 496 | |
| | |
Investments | | | 107 | | | | 166 | |
| | |
Purchase commitments | | | 346 | | | | 52 | |
| | |
Pensions | | | 738 | | | | 874 | |
| | |
Other commitments | | | 38 | | | | 143 | |
| | |
Interest on loans | | | 8,510 | | | | 9,410 | |
| | |
Finance lease charges | | | 12 | | | | 3 | |
| | | | 15,589 | | | | 18,343 | |
The commitments related to intangible assets include milestone payments, which are dependent on successful clinical development or on meeting specified sales targets, and which represent the maximum that would be paid if all milestones, however unlikely, are achieved. The amounts are not risk-adjusted or discounted. The decrease in intangible commitments in 2017 is attributable to amendments made to the agreement with Adaptimmune Therapeutics plc and reduction in commitments to third parties such as Ionis Pharmaceuticals, Inc.
In 2016, GSK reached an agreement with the trustees of the UK pension schemes to make additional contributions to eliminate the pension deficit identified at the 31 December 2014 actuarial funding valuation. A payment of £123 million is due in 2018 and each subsequent year up to, and including 2023. The table above includes this commitment, but excludes the normal ongoing annual funding requirement in the UK of approximately £130 million.
The Group also has other commitments which principally relate to revenue payments to be made under licences and other alliances.
Commitments in respect of future interest payable on loans are disclosed before taking into account the effect of interest rate swaps.
Commitments under non-cancellable operating leases are disclosed below. £117 million (2016 – £186 million) is provided against these commitments on the Group’s balance sheet.
| | | | | | | | |
| Commitments under non-cancellable operating leases | | 2017
£m | | | 2016
£m | |
Rental payments due within one year | | | 186 | | | | 153 | |
| | |
Rental payments due between one and two years | | | 149 | | | | 129 | |
| | |
Rental payments due between two and three years | | | 122 | | | | 94 | |
| | |
Rental payments due between three and four years | | | 107 | | | | 74 | |
| | |
Rental payments due between four and five years | | | 94 | | | | 66 | |
| | |
Rental payments due after five years | | | 387 | | | | 324 | |
Total commitments under non-cancellable operating leases | | | 1,045 | | | | 840 | |
| | | | |
| 213 | | |
| | | | | |
| GSK Annual Report 2017 | | Strategic report | | |
| | Governance and remuneration | | |
| | Financial statements | | |
| | Investor information | | |
42. Financial instruments and related disclosures
GSK uses a variety of financial instruments to finance its operations and derivative financial instruments to manage market risks from these operations. These derivatives, principally comprising interest rate swaps, foreign exchange forward contracts and swaps, are used to swap borrowings and liquid assets into currencies required for Group purposes and to manage exposure to financial risks from changes in foreign exchange rates and interest rates.
GSK does not hold or issue derivatives for speculative purposes and GSK’s Treasury policies specifically prohibit such activity. All transactions in financial instruments are undertaken to manage the risks arising from underlying business activities.
Capital management
GSK’s financial strategy supports the Group’s strategic priorities and is regularly reviewed by the Board. GSK manages the capital structure of the Group through an appropriate mix of debt and equity.
The capital structure of the Group consists of net debt of £13.2 billion (see Note 31, ‘Net debt’) and total equity, including that provided by non-controlling interests, of £3.5 billion (see ‘Consolidated statement of changes in equity’ on page 160). Total capital, including that provided by non-controlling interests, is £16.7 billion.
Our long-term credit rating with Standard and Poor’s is A+ (stable outlook) and with Moody’s Investor Services (‘Moody’s’) it is A2 (stable outlook). The Group’s short-term credit ratings are A-1 and P-1 with Standard and Poor’s and Moody’s respectively.
Liquidity risk management
GSK’s policy is to borrow centrally in order to meet anticipated funding requirements. The strategy is to diversify liquidity sources using a range of facilities and to maintain broad access to financial markets.
At 31 December 2017, GSK had £2.8 billion of borrowings repayable within one year and held £3.9 billion of cash and cash equivalents and liquid investments of which £2.5 billion was held centrally. GSK has access to short-term finance under a $10 billion (£7.4 billion) US commercial paper programme; $0.7 billion (£0.5 billion) was in issue at 31 December 2017 (2016 – $1.4 billion). GSK also has £1.9 billion five year committed facilities and $2.5 billion (£1.9 billion) of 364 day committed facilities. The five-year committed facilities were agreed in September 2015 and were extended by one year to 2021 in September 2016. The 364 day committed facilities were agreed in August 2017. These facilities were undrawn at 31 December 2017. GSK considers this level of committed facilities to be adequate, given current liquidity requirements.
GSK has a £15 billion European Medium Term Note programme and at 31 December 2017, £9.0 billion of notes were in issue under this programme. The Group also had $9.7 billion (£7.2 billion) of notes in issue at 31 December 2017 under a US shelf registration. GSK’s borrowings mature at dates between 2018 and 2045.
The put options owned by minority interest partners in ViiV Healthcare and the Consumer Healthcare JV business are both now exercisable. In reviewing liquidity requirements GSK considers that sufficient financing options are available should the put options be exercised.
Market risk
Interest rate risk management
GSK’s objective is to minimise the effective net interest cost and to balance the mix of debt at fixed and floating interest rates over time. The policy on interest rate risk management limits the amount of floating interest payments to a prescribed percentage of operating profit.
Foreign exchange risk management
Foreign currency transaction exposures arising on external trade flows are not normally hedged. Foreign currency transaction exposures arising on internal trade flows are selectively hedged. The Group’s objective is to minimise the exposure of overseas operating subsidiaries to transaction risk by matching local currency income with local currency costs where possible. GSK’s internal trading transactions are matched centrally and inter-company payment terms are managed to reduce foreign currency risk. Foreign currency cash flows can be hedged selectively including hedges of the foreign exchange risk arising from acquisitions and disposals of assets. Where possible, GSK manages the cash surpluses or borrowing requirements of subsidiary companies centrally using forward contracts to hedge future repayments back into the originating currency.
In order to reduce foreign currency translation exposure, the Group seeks to denominate borrowings in the currencies of our principal assets and cash flows. These are primarily denominated in US Dollars, Euros and Sterling. Borrowings can be swapped into other currencies as required.
Borrowings denominated in, or swapped into, foreign currencies that match investments in overseas Group assets may be treated as a hedge against the relevant assets. Forward contracts in major currencies are also used to reduce exposure to the Group’s investment in overseas assets (see ‘Net investment hedges’ section of this note for further details).
| | |
| 214 | | |
GSK Annual Report 2017 | | |
| | |
| | |
Notes to the financial statementscontinued
42. Financial instruments and related disclosurescontinued
Credit risk
The Group considers its maximum credit risk at 31 December 2017 to be £9,988 million (31 December 2016 – £11,002 million) which is the total of the Group’s financial assets with the exception of ‘Other investments’ (comprising equity investments) which bear equity risk rather than credit risk. See page 216 for details on the Group’s total financial assets. At 31 December 2017, GSK’s greatest concentrations of credit risk were £0.5 billion with Citibank (A/A1) and £0.5 billion with one US wholesaler (BBB+/Baa2) (2016 – £0.9 billion with Citibank (A/A1)).
Treasury-related credit risk
GSK sets global counterparty limits for each of GSK’s banking and investment counterparties based on long-term credit ratings from Moody’s and Standard and Poor’s. Usage of these limits is monitored daily.
GSK actively manages its exposure to credit risk, reducing surplus cash balances wherever possible. This is part of GSK’s strategy to regionalise cash management and to concentrate cash centrally as much as possible. The table below sets out the credit exposure to counterparties by rating for liquid investments, cash and cash equivalents and derivatives. The gross asset position on each derivative contract is considered for the purpose of this table, although, under ISDA agreements, the amount at risk is the net position with each counterparty. Table (e) on page 220 sets out the Group’s financial assets and liabilities on an offset basis.
At 31 December 2017, £45 million of cash is categorised as held with unrated or sub-investment grade rated counterparties (lower then BBB-/Baa3) of which £32 million is cash in transit. The remaining exposure is concentrated in overseas banks used for local cash management or investment purposes, including £7 million in Nigeria held with United Bank for Africa, Zenith Bank and Stanbic IBTC Bank and First Bank of Nigeria and £2 million with BTV in Austria. Of the £80 million of bank balances and deposits held with BBB/Baa rated counterparties, £27 million was held with BBB-/Baa3 rated counterparties, including balances or deposits of £17 million with HDFC Bank in India and £10 million with State Bank of India. These banks are used for local investment purposes.
| | | | | | | | | | | | | | | | | | | | | | | | |
2017 | | AAA/Aaa
£m | | | AA/Aa
£m | | | A/A
£m | | | BBB/Baa
£m | | | BB+/Ba1
and below
/unrated £m | | | Total
£m | |
| | | | | | |
Bank balances and deposits | | | – | | | | 423 | | | | 1,167 | | | | 80 | | | | 45 | | | | 1,715 | |
| | | | | | |
US Treasury and Treasury repo only money market funds | | | 1,715 | | | | – | | | | – | | | | – | | | | – | | | | 1,715 | |
| | | | | | |
Liquidity funds | | | 403 | | | | – | | | | – | | | | – | | | | – | | | | 403 | |
| | | | | | |
Government securities | | | – | | | | 77 | | | | – | | | | 1 | | | | – | | | | 78 | |
| | | | | | |
3rd party financial derivatives | | | – | | | | 26 | | | | 42 | | | | – | | | | – | | | | 68 | |
| | | | | | |
Total | | | 2,118 | | | | 526 | | | | 1,209 | | | | 81 | | | | 45 | | | | 3,979 | |
| | | | | | |
2016 | | AAA/Aaa
£m | | | AA/Aa
£m | | | A/A £m | | | BBB/Baa
£m | | | BB+/Ba1 and below /unrated £m | | | Total £m | |
| | | | | | |
Bank balances and deposits | | | – | | | | 542 | | | | 1,560 | | | | 388 | | | | 93 | | | | 2,583 | |
| | | | | | |
US Treasury and Treasury repo only money market funds | | | 2,248 | | | | – | | | | – | | | | – | | | | – | | | | 2,248 | |
| | | | | | |
Liquidity funds | | | 66 | | | | – | | | | – | | | | – | | | | – | | | | 66 | |
| | | | | | |
Government securities | | | – | | | | 85 | | | | – | | | | 4 | | | | – | | | | 89 | |
| | | | | | |
3rd party financial derivatives | | | – | | | | 70 | | | | 86 | | | | – | | | | – | | | | 156 | |
| | | | | | |
Total | | | 2,314 | | | | 697 | | | | 1,646 | | | | 392 | | | | 93 | | | | 5,142 | |
Credit ratings are assigned by Standard and Poor’s and Moody’s respectively. Where the opinions of the two rating agencies differ, GSK assigns the lower rating of the two to the counterparty. Where local rating agency or Fitch data is the only source available, the ratings are converted to global ratings equivalent to those of Standard and Poor’s or Moody’s using published conversion tables.
| | | | |
| GSK Annual Report 2017 | | Strategic report | | |
| | Governance and remuneration | | |
| | Financial statements | | |
| | Investor information | | |
| | | | |
42. Financial instruments and related disclosurescontinued
GSK’s centrally managed cash reserves amounted to £2.5 billion at 31 December 2017, all available within three months. This includes £1.7 billion centrally managed cash held by ViiV Healthcare, a 78.3% owned subsidiary. The Group has invested centrally managed liquid assets in bank deposits, Aaa/AAA rated US Treasury and Treasury repo only money market funds and Aaa/AAA rated liquidity funds.
Wholesale and retail credit risk
Outside the US, no customer accounts for more than 5% of the Group’s trade receivables balance.
In the US, in line with other pharmaceutical companies, the Group sells its products through a small number of wholesalers in addition to hospitals, pharmacies, physicians and other groups. Sales to the three largest wholesalers amounted to approximately 83% of the sales of the US Pharmaceuticals and Vaccines businesses in 2017. At 31 December 2017, the Group had trade receivables due from these three wholesalers totalling £1,265 million (2016 – £1,323 million). The Group is exposed to a concentration of credit risk in respect of these wholesalers such that, if one or more of them encounters financial difficulty, it could materially and adversely affect the Group’s financial results.
The Group’s credit risk monitoring activities relating to these wholesalers include a review of their quarterly financial information and Standard & Poor’s credit ratings, development of GSK internal risk ratings, and establishment and periodic review of credit limits. However, the Group believes there is no further credit risk provision required in excess of the normal provision for bad and doubtful debts (see Note 24, ‘Trade and other receivables’).
Fair value of financial assets and liabilities
The table on page 216 presents the carrying amounts and the fair values of the Group’s financial assets and liabilities at 31 December 2017 and 31 December 2016.
The fair values of the financial assets and liabilities are included at the price that would be received to sell an asset or paid to transfer a liability in an orderly transaction between market participants at the measurement date.
The following methods and assumptions were used to estimate the fair values:
| – | | Cash and cash equivalents – approximates to the carrying amount |
| – | | Liquid investments – based on quoted market prices or calculated based on observable inputs in the case of marketable securities; based on principal amounts in the case of non-marketable securities because of their short repricing periods |
| – | | Other investments – equity investments traded in an active market determined by reference to the relevant stock exchange quoted bid price; other equity investments determined by reference to the current market value of similar instruments or by reference to the discounted cash flows of the underlying net assets |
| – | | Short-term loans, overdrafts and commercial paper – approximates to the carrying amount because of the short maturity of these instruments |
| – | | Long-term loans – based on quoted market prices in the case of European and US Medium term notes and other fixed rate borrowings (a Level 1 fair value measurement); approximates to the carrying amount in the case of floating rate bank loans and other loans |
| – | | Contingent consideration for business acquisitions – based on present values of expected future cash flows |
| – | | Interest rate swaps, foreign exchange forward contracts, swaps and options – based on the present value of contractual cash flows or option valuation models using market sourced data (exchange rates or interest rates) at the balance sheet date |
| – | | Receivables and payables, including put options – approximates to the carrying amount |
| – | | Company-owned life insurance policies – based on cash surrender value |
| – | | Lease obligations – approximates to the carrying amount. |
Fair value of investments in GSK shares
At 31 December 2017, the Employee Share Ownership Plan (ESOP) Trusts held GSK shares with a carrying value of £400 million (2016 – £286 million) and a fair value of £882 million (2016 – £667 million) based on quoted market price. The shares are held by the ESOP Trusts to satisfy future exercises of options and awards under employee incentive schemes. In 2017, the carrying value, which is the lower of cost or expected proceeds, of these shares has been recognised as a deduction from other reserves. At 31 December 2017, GSK held Treasury shares at a cost of £5,800 million (2016 – £6,451 million) which has been deducted from retained earnings.
| | |
| 216 | | |
GSK Annual Report 2017 | | |
| | |
| | |
Notes to the financial statementscontinued
42. Financial instruments and related disclosurescontinued
| | | | | | | | | | | | | | | | | | | | |
| | | | | | | 2017 | | | 2016 | |
| | | Notes | | | | Carrying
value £m | | | Fair value £m | | | Carrying
value £m | | | Fair value £m | |
| | | | | | |
Available-for-sale investments: | | | | | | | | | | | | | | | | | | | | |
| | | | | | |
Liquid investments (Government bonds) | | a | | | | | 78 | | | | 78 | | | | 89 | | | | 89 | |
| | | | | | |
Other investments | | a | | | | | 918 | | | | 918 | | | | 985 | | | | 985 | |
| | | | | | |
Loans and receivables: | | | | | | | | | | | | | | | | | | | | |
| | | | | | |
Cash and cash equivalents | | | | | | | 3,833 | | | | 3,833 | | | | 4,897 | | | | 4,897 | |
| | | | | | |
Trade and other receivables and Other non-current assets in scope of IAS 39 | | b | | | | | 5,495 | | | | 5,495 | | | | 5,499 | | | | 5,499 | |
| | | | | | |
Financial assets at fair value through profit or loss: | | | | | | | | | | | | | | | | | | | | |
| | | | | | |
Trade and other receivables and Other non-current assets in scope of IAS 39 | | a,b | | | | | 506 | | | | 506 | | | | 361 | | | | 361 | |
| | | | | | |
Derivatives designated as at fair value through profit or loss | | a,d,e | | | | | 5 | | | | 5 | | | | 23 | | | | 23 | |
| | | | | | |
Derivatives classified as held for trading under IAS 39 | | a,d,e | | | | | 71 | | | | 71 | | | | 133 | | | | 133 | |
| | | | | | |
Total financial assets | | | | | | | 10,906 | | | | 10,906 | | | | 11,987 | | | | 11,987 | |
| | | | | | |
Financial liabilities measured at amortised cost: | | | | | | | | | | | | | | | | | | | | |
| | | | | | |
Borrowings excluding obligations under finance leases: | | | | | | | | | | | | | | | | | | | | |
| | | | | | |
– bonds in a designated hedging relationship | | d | | | | | (4,315 | ) | | | (4,405 | ) | | | (3,189 | ) | | | (3,335 | ) |
| | | | | | |
– other bonds | | | | | | | (11,894 | ) | | | (14,743 | ) | | | (14,111 | ) | | | (16,996 | ) |
| | | | | | |
– bank loans and overdrafts | | | | | | | (236 | ) | | | (236 | ) | | | (332 | ) | | | (332 | ) |
| | | | | | |
– commercial paper | | | | | | | (529 | ) | | | (529 | ) | | | (1,094 | ) | | | (1,094 | ) |
| | | | | | |
– other borrowings | | | | | | | (49 | ) | | | (49 | ) | | | – | | | | – | |
| | | | | | |
Total borrowings excluding obligations under finance leases | | f | | | | | (17,023 | ) | | | (19,962 | ) | | | (18,726 | ) | | | (21,757 | ) |
| | | | | | |
Obligations under finance leases | | | | | | | (66 | ) | | | (66 | ) | | | (64 | ) | | | (64 | ) |
| | | | | | |
Total borrowings | | | | | | | (17,089 | ) | | | (20,028 | ) | | | (18,790 | ) | | | (21,821 | ) |
| | | | | | |
Trade and other payables, Other provisions and certain
Other non-current liabilities in scope of IAS 39 | | c | | | | | (20,325 | ) | | | (20,325 | ) | | | (18,713 | ) | | | (18,713 | ) |
| | | | | | | | | | | | | | | | | | | | |
| | | | | | |
Financial liabilities at fair value through profit or loss: | | | | | | | | | | | | | | | | | | | | |
| | | | | | |
Contingent consideration liabilities | | a,c | | | | | (6,172 | ) | | | (6,172 | ) | | | (5,896 | ) | | | (5,896 | ) |
| | | | | | |
Derivatives designated as at fair value through profit or loss | | a,d,e | | | | | (26 | ) | | | (26 | ) | | | (92 | ) | | | (92 | ) |
| | | | | | |
Derivatives classified as held for trading under IAS 39 | | a,d,e | | | | | (48 | ) | | | (48 | ) | | | (102 | ) | | | (102 | ) |
| | | | | | |
Total financial liabilities | | | | | | | (43,660 | ) | | | (46,599 | ) | | | (43,593 | ) | | | (46,624 | ) |
| | | | | | |
Net financial assets and financial liabilities | | | | | | | (32,754 | ) | | | (35,693 | ) | | | (31,606 | ) | | | (34,637 | ) |
The valuation methodology used to measure fair value in the above table is described and categorised on page 215. Trade and other receivables, Other non-current assets, Trade and other payables, Other provisions, Other non-current liabilities and Contingent consideration liabilities are reconciled to the relevant Notes on page 218.
| | | | |
| GSK Annual Report 2017 | | Strategic report | | |
| | Governance and remuneration | | |
| | Financial statements | | |
| | Investor information | | |
42. Financial instruments and related disclosurescontinued
(a) Financial instruments held at fair value
The following tables categorise the Group’s financial assets and liabilities held at fair value by the valuation methodology applied in determining their fair value. Where possible, quoted prices in active markets are used (Level 1). Where such prices are not available, the asset or liability is classified as Level 2, provided all significant inputs to the valuation model used are based on observable market data. If one or more of the significant inputs to the valuation model is not based on observable market data, the instrument is classified as Level 3. Other investments classified as Level 3 in the tables below comprise equity investments in unlisted entities with which the Group has entered into research collaborations and also investments in emerging life science companies.
| | | | | | | | | | |
| | | Level 1 | | Level 2 | | Level 3 | | Total | |
| At 31 December 2017 | | £m | | £m | | £m | | £m | |
Financial assets at fair value | | | | | | | | | |
Available–for–sale financial assets: | | | | | | | | | |
Liquid investments | | 77 | | 1 | | – | | 78 | |
Other investments | | 535 | | – | | 383 | | 918 | |
Other non-current assets | | – | | – | | 38 | | 38 | |
Financial assets at fair value through profit or loss: | | | | | | | | | |
Other non-current assets | | – | | 382 | | 44 | | 426 | |
Trade and other receivables | | – | | – | | 42 | | 42 | |
Derivatives designated as at fair value through profit or loss | | – | | 5 | | – | | 5 | |
Derivatives classified as held for trading under IAS 39 | | – | | 62 | | 9 | | 71 | |
| | | | |
| | | 612 | | 450 | | 516 | | 1,578 | |
Financial liabilities at fair value | | | | | | | | | |
Financial liabilities at fair value through profit or loss: | | | | | | | | | |
Contingent consideration liabilities | | – | | – | | (6,172) | | (6,172) | |
Derivatives designated as at fair value through profit or loss | | – | | (26) | | – | | (26) | |
Derivatives classified as held for trading under IAS 39 | | – | | (47) | | (1) | | (48) | |
| | | – | | (73) | | (6,173) | | (6,246) | |
| | | | |
| | | Level 1 | | Level 2 | | Level 3 | | Total | |
| At 31 December 2016 | | £m | | £m | | £m | | £m | |
Financial assets at fair value | | | | | | | | | |
Available–for–sale financial assets: | | | | | | | | | |
Liquid investments | | 84 | | 5 | | – | | 89 | |
Other investments | | 580 | | – | | 405 | | 985 | |
Other non-current assets | | – | | – | | 6 | | 6 | |
Financial assets at fair value through profit or loss: | | | | | | | | | |
Other non-current assets | | – | | 355 | | – | | 355 | |
Derivatives designated as at fair value through profit or loss | | – | | 23 | | – | | 23 | |
Derivatives classified as held for trading under IAS 39 | | – | | 133 | | – | | 133 | |
| | | 664 | | 516 | | 411 | | 1,591 | |
Financial liabilities at fair value | | | | | | | | | |
Financial liabilities at fair value through profit or loss: | | | | | | | | | |
Contingent consideration liabilities | | – | | – | | (5,896) | | (5,896) | |
Derivatives designated as at fair value through profit or loss | | – | | (92) | | – | | (92) | |
Derivatives classified as held for trading under IAS 39 | | – | | (101) | | (1) | | (102) | |
| | | – | | (193) | | (5,897) | | (6,090) | |
Movements in the year for financial instruments measured using Level 3 valuation methods are presented below: | | | | |
| | | | | | | 2017 | | 2016 | |
| | | | | | | £m | | £m | |
| At 1 January | | | | | | (5,486) | | (3,582) | |
Net losses recognised in the income statement | | | | | | (970) | | (2,283) | |
Net gains recognised in other comprehensive income | | | | | | 22 | | 29 | |
Contingent consideration for businesses divested/acquired during the year | | | | | | 80 | | (194) | |
Payment of contingent consideration liabilities | | | | | | 685 | | 431 | |
Additions | | | | | | 117 | | 81 | |
Disposals | | | | | | (52) | | (15) | |
Transfers from Level 3 | | | | | | (24) | | (11) | |
Exchange | | | | | | (29) | | 58 | |
| At 31 December | | | | | | (5,657) | | (5,486) | |
| | |
| 218 | | |
GSK Annual Report 2017 | | |
| | |
| | |
Notes to the financial statements continued
42. Financial instruments and related disclosurescontinued
The net losses of £970 million (2016 – £2,283 million) attributable to Level 3 financial instruments which were recognised in the income statement were all attributable to financial instruments which were held at the end of the year. Losses of £971 million (2016 – £2,283 million) were reported in Other operating income and income of £1 million (2016 – £nil) was recorded in Finance income. £909 million (2016 – £2,162 million) arose from remeasurement of the contingent consideration payable for the acquisition of the former Shionogi-ViiV Healthcare joint venture and £53 million (2016 – £152 million) arose from remeasurement of the contingent consideration payable on the acquisition in 2015 of the Novartis Vaccines business. Net gains of £22 million (2016 – £29 million) attributable to Level 3 financial instruments reported in Other comprehensive income as Fair value movements on available-for-sale investments included net losses of £6 million (2016 – net gains of £21 million) in respect of financial instruments held at the end of the year.
Financial liabilities measured using Level 3 valuation methods at 31 December included £5,542 million (2016 – £5,304 million) in respect of contingent consideration payable for the acquisition in 2012 of the former Shionogi-ViiV Healthcare joint venture. This consideration is expected to be paid over a number of years and will vary in line with the future performance of specified products and movements in certain foreign currencies. They also included £584 million (2016 – £545 million) in respect of contingent consideration for the acquisition in 2015 of the Novartis Vaccines business. This consideration is expected to be paid over a number of years and will vary in line with the future performance of specified products, the achievement of certain milestone targets and movements in certain foreign currencies. Sensitivity analysis on these balances is provided in Note 39, ‘Contingent consideration liabilities’.
(b) Trade and other receivables and Other non-current assets in scope of IAS 39
The following table reconciles financial instruments within Trade and other receivables and Other non-current assets which fall within the scope of IAS 39 to the relevant balance sheet amounts. The financial assets are predominantly non-interest earning. Financial instruments within the Other non-current assets balance include company-owned life insurance policies. Non-financial instruments include tax receivables, pension surplus balances and prepayments, which are outside the scope of IAS 39.
| | | | | | | | | | | | | | | | | | | | |
| | | | | | | | | | | 2017 | | | | | | | | | | 2016 |
| | | At fair value | | | | | | Non- | | | | At fair value | | | | | | Non- | | |
| | | through | | Loans and | | Financial | | financial | | | | through | | Loans and | | Financial | | financial | | |
| | | profit or loss | | receivables | | instruments | | instruments | | Total | | profit or loss | | receivables | | instruments | | instruments | | Total |
| | | £m | | £m | | £m | | £m | | £m | | £m | | £m | | £m | | £m | | £m |
| Trade and other receivables | | | | | | | | | | | | | | | | | | | | |
(Note 24) | | 42 | | 5,148 | | 5,190 | | 810 | | 6,000 | | – | | 5,135 | | 5,135 | | 891 | | 6,026 |
Other non-current assets | | | | | | | | | | | | | | | | | | | | |
(Note 22) | | 464 | | 347 | | 811 | | 602 | | 1,413 | | 361 | | 364 | | 725 | | 474 | | 1,199 |
| | | 506 | | 5,495 | | 6,001 | | 1,412 | | 7,413 | | 361 | | 5,499 | | 5,860 | | 1,365 | | 7,225 |
The following table shows the ageing of such financial assets which are past due and for which no provision for bad or doubtful debts has been made: |
| | | | | | | | | | | | | | | | | | | 2017 £m | | 2016
£m |
| Past due by 1–30 days | | | | | | | | | | | | | | | | | | 142 | | 137 |
Past due by 31–90 days | | | | | | | | | | | | | | | | | | 70 | | 178 |
Past due by 91–180 days | | | | | | | | | | | | | | | | | | 64 | | 55 |
Past due by 181–365 days | | | | | | | | | | | | | | | | | | 27 | | 53 |
Past due by more than 365 days | | | | | | | | | | | | | | | | | | 108 | | 98 |
| | | | | | | | | | | | | | | | | | | 411 | | 521 |
(c) Trade and other payables, Other provisions, Other non-current liabilities and Contingent consideration liabilities in scope of IAS 39 |
The following table reconciles financial instruments within Trade and other payables, Other provisions, Other non-current liabilities and Contingent consideration liabilities which fall within the scope of IAS 39 to the relevant balance sheet amounts. The financial liabilities are predominantly non-interest bearing. Accrued wages and salaries are included within financial liabilities. Non-financial instruments includes payments on account, tax and social security payables and provisions which do not arise from contractual obligations to deliver cash or another financial asset, which are outside the scope of IAS 39. |
| | | | | | | | | | | 2017 | | | | | | | | | | 2016 |
| | | At fair value | | | | | | | | | | At fair value | | | | | | | | |
| | | through | | Other | | Financial | | Non-financial | | | | through | | Other | | Financial | | Non-financial | | |
| | | profit or loss | | liabilities | | instruments | | instruments | | Total | | profit or loss | | liabilities | | instruments | | instruments | | Total |
| | | £m | | £m | | £m | | £m | | £m | | £m | | £m | | £m | | £m | | £m |
| Trade and other payables | | | | | | | | | | | | | | | | | | | | |
(Note 27) | | – | | (20,129) | | (20,129) | | (841) | | (20,970) | | – | | (11,041) | | (11,041) | | (923) | | (11,964) |
Other provisions | | | | | | | | | | | | | | | | | | | | |
(Note 29) | | – | | (117) | | (117) | | (1,148) | | (1,265) | | – | | (113) | | (113) | | (1,387) | | (1,500) |
Other non-current liabilities | | | | | | | | | | | | | | | | | | | | |
(Note 30) | | – | | (79) | | (79) | | (902) | | (981) | | – | | (7,559) | | (7,559) | | (886) | | (8,445) |
Contingent consideration
liabilities (Note 39) | | (6,172) | | – | | (6,172) | | – | | (6,172) | | (5,896) | | – | | (5,896) | | – | | (5,896) |
| | | (6,172) | | (20,325) | | (26,497) | | (2,891) | | (29,388) | | (5,896) | | (18,713) | | (24,609) | | (3,196) | | (27,805) |
| | | | |
| 219 | | |
| | | | | |
| GSK Annual Report 2017 | | Strategic report | | |
| | Governance and remuneration | | |
| | Financial statements | | |
| | Investor information | | |
42. Financial instruments and related disclosurescontinued
(d) Derivative financial instruments and hedging programmes
The following table sets out the fair values of derivatives held by GSK. All the derivative liabilities and £68 million (2016 – £156 million) of the derivative assets have a maturity of less than one year.
| | | | | | | | |
| | | | | 2017 Fair value | | | | 2016
Fair value |
| | | Assets £m | | Liabilities
£m | | Assets
£m | | Liabilities
£m |
| Net investment hedges – Foreign exchange contracts | | | | | | | | |
| | | | |
| (principal amount – £6,333 million (2016 – £5,362 million)) | | 5 | | (25) | | 18 | | (92) |
| | | | |
| Cash flow hedges – Foreign exchange contracts | | | | | | | | |
| | | | |
| (principal amount – £38 million (2016 – £170 million)) | | – | | (1) | | 5 | | – |
| Derivatives designated as at fair value through profit or loss | | 5 | | (26) | | 23 | | (92) |
| | | | |
| Foreign exchange contracts | | | | | | | | |
| | | | |
| (principal amount – £14,449 million (2016 – £14,943 million)) | | 62 | | (47) | | 133 | | (99) |
| | | | |
| Embedded and other derivatives | | 9 | | (1) | | – | | (3) |
| Derivatives classified as held for trading under IAS 39 | | 71 | | (48) | | 133 | | (102) |
| Total derivative instruments | | 76 | | (74) | | 156 | | (194) |
Foreign exchange contracts classified as held for trading under IAS 39
The principal amount on foreign exchange contracts is the absolute total of outstanding positions at the balance sheet date. The Group’s foreign exchange contracts are for periods of 12 months or less. At 31 December 2017, the Group held outstanding foreign exchange contracts with a net asset fair value of £15 million (£62 million asset less £47 million liability). At 31 December 2016, the fair value was £34 million net asset (£133 million asset less £99 million liability).
The overall decrease in the net asset fair value has been due to the weakening of Sterling against the Euro in 2017 and the strengthening of Sterling against the US Dollar which has impacted on the portion of the hedging portfolio that is not in a designated accounting hedge. Fair value movements are taken to the income statement in the period to offset the exchange gains and losses on the related underlying balances.
Fair value hedges
At 31 December 2017, the Group had no designated fair value hedges.
Net investment hedges
During the year, certain foreign exchange contracts were designated as net investment hedges in respect of the foreign currency translation risk arising on consolidation of the Group’s net investment in its European (Euro) foreign operations as shown in the table above.
The carrying value of bonds on page 216 includes £4,315 million (2016 – £3,189 million) that are designated as hedging instruments in net investment hedges.
Cash flow hedges
During 2017, the Group entered into forward foreign exchange contracts which have been designated as cash flow hedges. These are hedging the foreign exchange exposure arising on Euro denominated coupon payments relating to notes issued under the Group’s European Medium Term Note programme and a number of highly probable forecast transactions denominated in US Dollars.
In addition, the Group carries a balance in reserves that arose from pre-hedging fluctuations in long-term interest rates when pricing bonds issued in prior years. The balance is reclassified to finance costs over the life of these bonds.
| | |
| 220 | | |
GSK Annual Report 2017 | | |
| | |
| | |
Notes to the financial statementscontinued
42. Financial instruments and related disclosurescontinued
(e) Offsetting of financial assets and liabilities
Financial assets and liabilities are offset and the net amount reported in the balance sheet where there is a legally enforceable right to offset the recognised amounts, and there is an intention to settle on a net basis or realise the asset and settle the liability simultaneously. There are also arrangements that do not meet the criteria for offsetting but still allow for the related amounts to be offset in certain circumstances, such as bankruptcy or the termination of a contract.
The following tables set out the financial assets and liabilities that are offset, or subject to enforceable master netting arrangements and other similar agreements but not offset, as at 31 December 2017 and 31 December 2016. The column ‘Net amount’ shows the impact on the Group’s balance sheet if all offset rights were exercised.
| | | | | | | | | | | | | | | | | | |
| At 31 December 2017 | | Gross
financial
assets/
(liabilities) £m | | | Financial
(liabilities)/
assets offset £m | | | Net financial
assets/
(liabilities) £m | | | Related
amounts not
offset £m | | | Net amount
£m |
| Financial assets | | | | | | | | | | | | | | |
| | | | | |
Trade and other receivables | | | 5,191 | | | | (1 | ) | | | 5,190 | | | | (31 | ) | | 5,159 |
| | | | | |
Derivative financial instruments | | | 76 | | | | – | | | | 76 | | | | (64 | ) | | 12 |
| | | | | |
Financial liabilities | | | | | | | | | | | | | | | | | | |
| | | | | |
Trade and other payables | | | (20,130 | ) | | | 1 | | | | (20,129 | ) | | | 31 | | | (20,098) |
| | | | | |
Derivative financial instruments | | | (74 | ) | | | – | | | | (74 | ) | | | 64 | | | (10) |
| | | | | | | | | | | | | | | | | | |
| At 31 December 2016 | |
| Gross
financial
assets/
(liabilities)
£m |
| |
| Financial
(liabilities)/
assets
offset
£m |
| |
| Net financial
assets/
(liabilities)
£m |
| |
| Related
amounts not
offset
£m |
| | Net balance £m |
Financial assets | | | | | | | | | | | | | | | | | | |
| | | | | |
Trade and other receivables | | | 5,136 | | | | (1 | ) | | | 5,135 | | | | (29 | ) | | 5,106 |
| | | | | |
Derivative financial instruments | | | 156 | | | | – | | | | 156 | | | | (117 | ) | | 39 |
| | | | | |
Financial liabilities | | | | | | | | | | | | | | | | | | |
| | | | | |
Trade and other payables | | | (11,042 | ) | | | 1 | | | | (11,041 | ) | | | 29 | | | (11,012) |
| | | | | |
Derivative financial instruments | | | (194 | ) | | | – | | | | (194 | ) | | | 117 | | | (77) |
Amounts which do not meet the criteria for offsetting on the balance sheet but could be settled net in certain circumstances principally relate to derivative transactions under ISDA (International Swaps and Derivatives Association) agreements where each party has the option to settle amounts on a net basis in the event of default of the other party. As there is presently not a legally enforceable right of offset, these amounts have not been offset in the balance sheet, but have been presented separately in the table above.
| | | | |
| 221 | | |
| | | | | |
| GSK Annual Report 2017 | | Strategic report | | |
| | Governance and remuneration | | |
| | Financial statements | | |
| | Investor information | | |
42. Financial instruments and related disclosurescontinued
(f) Debt interest rate repricing table
The following table sets out the exposure of the Group to interest rates on debt, including commercial paper. The maturity analysis of fixed rate debt is stated by contractual maturity and of floating rate debt by interest rate repricing dates. For the purpose of this table, debt is defined as all classes of borrowings other than obligations under finance leases.
| | | | |
| | | 2017 | | 2016 |
| | | Total debt £m | | Total £m |
| Floating and fixed rate debt less than one year | | (2,802) | | (4,106) |
| | |
| Between one and two years | | (1,340) | | (2,216) |
| | |
| Between two and three years | | (1,076) | | (1,277) |
| | |
| Between three and four years | | (16) | | – |
| | |
| Between four and five years | | (1,475) | | – |
| | |
| Between five and ten years | | (3,664) | | (4,082) |
| | |
| Greater than ten years | | (6,650) | | (7,045) |
| Total | | (17,023) | | (18,726) |
| Original issuance profile: | | | | |
| | |
| Fixed rate interest | | (16,209) | | (17,342) |
| | |
| Floating rate interest | | (765) | | (1,381) |
| | |
| Total interest bearing | | (16,974) | | (18,723) |
| | |
| Non-interest bearing | | (49) | | (3) |
| | |
| | | (17,023) | | (18,726) |
(g) Sensitivity analysis The tables below illustrate the estimated impact on the income statement and equity as a result of hypothetical market movements in foreign exchange and interest rates in relation to the Group’s financial instruments. The range of variables chosen for the sensitivity analysis reflects management’s view of changes which are reasonably possible over a one-year period. Foreign exchange sensitivity The Group operates internationally and is primarily exposed to foreign exchange risk in relation to Sterling against movements in US Dollar, Euro and Japanese Yen. Foreign exchange risk arises from the translation of financial assets and liabilities which are not in the functional currency of the entity that holds them. Based on the Group’s net financial assets and liabilities as at 31 December, a weakening and strengthening of Sterling against these currencies, with all other variables held constant, is illustrated in the tables below. The tables exclude financial instruments that expose the Group to foreign exchange risk where this risk is fully hedged with another financial instrument. |
| | | 2017 | | 2016 |
| Income statement impact of non-functional currency foreign exchange exposures | | Increase/(decrease) in
income £m | | Increase/(decrease) in
income £m |
| 10 cent appreciation of the US Dollar | | 76 | | 77 |
| 10 cent appreciation of the Euro | | (5) | | 18 |
| | |
| 10 yen appreciation of the Yen | | 9 | | 1 |
| | |
| | | | | |
| | | 2017 | | 2016 |
| Income statement impact of non-functional currency foreign exchange exposures | | Increase/(decrease) in
income £m | | Increase/(decrease) in
income £m |
| 10 cent depreciation of the US Dollar | | (66) | | (66) |
| 10 cent depreciation of the Euro | | 4 | | (16) |
| | |
| 10 yen depreciation of the Yen | | (8) | | (1) |
| | |
| 222 | | |
GSK Annual Report 2017 | | |
| | |
| | |
Notes to the financial statementscontinued
42. Financial instruments and related disclosurescontinued
The equity impact, shown below, for foreign exchange sensitivity relates to derivative and non-derivative financial instruments hedging the Group’s net investments in its European (Euro) foreign operations and cash flow hedges of its foreign exchange exposure arising on Euro denominated coupon payments relating to notes issued under the Group’s European Medium Term Note programme and a number of highly probable forecast transactions denominated in US Dollar.
| | | | |
| | | 2017 | | 2016 |
| Equity impact of non-functional currency foreign exchange exposures | | Increase/(decrease) in equity £m | | Increase/(decrease) in equity £m |
| 10 cent appreciation of the US Dollar | | 1 | | 11 |
| | |
| 10 cent appreciation of the Euro | | (1,028) | | (795) |
| | |
| | | | | |
| | | 2017 | | 2016 |
| Equity impact of non-functional currency foreign exchange exposures | | Increase/(decrease) in equity £m | | Increase/(decrease) in equity £m |
| 10 cent depreciation of the US Dollar | | (1) | | (10) |
| | |
| 10 cent depreciation of the Euro | | 861 | | 670 |
The tables below present the Group’s sensitivity to a weakening and strengthening of Sterling against the relevant currency based on the composition of net debt as shown in Note 31 adjusted for the effects of foreign exchange derivatives that are not part of net debt but affect future foreign currency cash flows.
| | | | |
| | | 2017 | | 2016 |
| Impact of foreign exchange movements on net debt | | (Increase)/decrease
in net debt £m | | (Increase)/decrease
in net debt £m |
| 10 cent appreciation of the US Dollar | | (637) | | (746) |
| | |
| 10 cent appreciation of the Euro | | 197 | | 190 |
| | |
| 10 yen appreciation of the Yen | | (4) | | (11) |
| | |
| | | | | |
| | | 2017 | | 2016 |
| Impact of foreign exchange movements on net debt | | (Increase)/decrease in net debt £m | | (Increase)/decrease in net debt £m |
| 10 cent depreciation of the US Dollar | | 549 | | 634 |
| | |
| 10 cent depreciation of the Euro | | (165) | | (160) |
| | |
| 10 yen depreciation of the Yen | | 4 | | 10 |
Interest rate sensitivity
The Group is exposed to interest rate risk on its outstanding borrowings and investments where any changes in interest rates will affect future cash flows or the fair values of financial instruments.
The majority of debt is issued at fixed interest rates and changes in the floating rates of interest do not significantly affect the Group’s net interest charge, although the majority of cash and liquid investments earn floating rates of interest.
The table below hypothetically shows the Group’s sensitivity to changes in interest rates in relation to Sterling, US Dollar and Euro floating rate financial assets and liabilities. If the interest rates applicable to floating rate financial assets and liabilities were to have increased by 1% (100 basis points), and assuming other variables had remained constant, it is estimated that the Group’s finance income for 2017 would have increased by approximately £5 million (2016 – £3 million increase). A 1% (100 basis points) movement in interest rates is not deemed to have a material effect on equity.
| | | | |
| | | 2017 | | 2016 |
| Income statement impact of interest rate movements | | Increase/(decrease) in income £m | | Increase/(decrease) in income £m |
| 1% (100 basis points) increase in Sterling interest rates | | 24 | | 3 |
| | |
| 1% (100 basis points) increase in US Dollar interest rates | | (24) | | (3) |
| | |
| 1% (100 basis points) increase in Euro interest rates | | 5 | | 3 |
| | | | |
| 223 | | |
| | | | | |
| GSK Annual Report 2017 | | Strategic report | | |
| | Governance and remuneration | | |
| | Financial statements | | |
| | Investor information | | |
42. Financial instruments and related disclosurescontinued
(h) Contractual cash flows for non-derivative financial liabilities and derivative instruments
The following tables provides an analysis of the anticipated contractual cash flows including interest payable for the Group’s non-derivative financial liabilities on an undiscounted basis. The Group did not use interest rate swaps to manage its interest rate risk. For the purpose of this table, debt is defined as all classes of borrowings except for obligations under finance leases. Interest is calculated based on debt held at 31 December without taking account of future issuance. Floating rate interest is estimated using the prevailing interest rate at the balance sheet date. Cash flows in foreign currencies are translated using spot rates at 31 December. Contractual cash flows in respect of operating lease vacant space provisions are excluded from the table below as they are included in the Commitments under non-cancellable operating leases table in Note 41, ‘Commitments’.
| | | | | | | | | | | | |
| At 31 December 2017 | | Debt £m | | Interest on debt £m | | Obligations
under finance
leases £m | | Finance charge on obligations under
finance leases £m | | Trade payables and
other liabilities not
in net debt £m | | Total £m |
| Due in less than one year | | (2,802) | | (555) | | (23) | | (2) | | (21,521) | | (24,903) |
| | | | | | |
| Between one and two years | | (1,344) | | (497) | | (27) | | (2) | | (853) | | (2,723) |
| | | | | | |
| Between two and three years | | (1,078) | | (488) | | (8) | | (1) | | (813) | | (2,388) |
| | | | | | |
| Between three and four years | | (16) | | (488) | | (2) | | (1) | | (784) | | (1,291) |
| | | | | | |
| Between four and five years | | (1,483) | | (468) | | (1) | | (1) | | (752) | | (2,705) |
| | | | | | |
| Between five and ten years | | (3,694) | | (2,018) | | (5) | | (5) | | (3,609) | | (9,331) |
| | | | | | |
| Greater than ten years | | (6,720) | | (3,996) | | – | | – | | (1,471) | | (12,187) |
| Gross contractual cash flows | | (17,137) | | (8,510) | | (66) | | (12) | | (29,803) | | (55,528) |
| | | | | | |
| At 31 December 2016 | | Debt £m | | Interest on debt £m | | Obligations under finance leases £m | | Finance charge on obligations under finance
leases £m | | Trade payables and other liabilities not in net debt £m | | Total £m |
| Due in less than one year | | (4,108) | | (705) | | (23) | | (2) | | (11,621) | | (16,459) |
| | | | | | |
| Between one and two years | | (2,218) | | (566) | | (22) | | (1) | | (8,784) | | (11,591) |
| | | | | | |
| Between two and three years | | (1,282) | | (503) | | (12) | | – | | (961) | | (2,758) |
| | | | | | |
| Between three and four years | | – | | (496) | | (7) | | – | | (786) | | (1,289) |
| | | | | | |
| Between four and five years | | – | | (496) | | – | | – | | (705) | | (1,201) |
| | | | | | |
| Between five and ten years | | (4,117) | | (2,122) | | – | | – | | (3,474) | | (9,713) |
| | | | | | |
| Greater than ten years | | (7,124) | | (4,522) | | – | | – | | (3,135) | | (14,781) |
| Gross contractual cash flows | | (18,849) | | (9,410) | | (64) | | (3) | | (29,466) | | (57,792) |
The increase in contractual cash flows for non-derivative financial liabilities due in less than one year of £8.4 billion and the decrease in cash flows due between one and two years of £8.9 billion principally reflect the move of the Consumer Healthcare put option into amounts due in less than one year. This option relates to the ability of Novartis to put its shares in the Consumer Healthcare Joint Venture to GSK at certain points commencing on 2 March 2018 with payment likely to be due several months after exercise. See Note 27 ‘Trade and other payables’ for further information on the Consumer Healthcare put option.
Anticipated contractual cash flows for the repayment of debt and debt interest have decreased by £2.6 billion over the year due to a reduction in the issuance of commercial paper and favourable exchange rate movements on US Dollar denominated debt.
The table below provides an analysis of the anticipated contractual cash flows for the Group’s derivative instruments excluding embedded derivatives and equity options, which are not material, using undiscounted cash flows. Cash flows in foreign currencies are translated using spot rates at 31 December. The gross cash flows of foreign exchange contracts are presented for the purpose of this table although, in practice, the Group uses standard settlement arrangements to reduce its liquidity requirements on these instruments.
The amounts receivable and payable in less than one year have decreased compared with 31 December 2016 as a result of reduced hedging of the US commercial paper programme.
| | | | | | | | |
| | | | | 2017 | | | | 2016 |
| | | Receivables
£m | | Payables
£m | | Receivables
£m | | Payables £m |
| Due in less than one year | | 20,319 | | (20,326) | | 21,266 | | (21,303) |
| | | | |
| Between one and two years | | – | | – | | 20 | | (20) |
| | | | |
| Gross contractual cash flows | | 20,319 | | (20,326) | | 21,286 | | (21,323) |
| | |
| 224 | | |
GSK Annual Report 2017 | | |
| | |
| | |
Notes to the financial statementscontinued
43. Employee share schemes
GSK operates several employee share schemes, including the Share Value Plan, whereby awards are granted to employees to acquire shares or ADS in GlaxoSmithKline plc at no cost after a three year vesting period and the Performance Share Plan, whereby awards are granted to employees to acquire shares or ADS in GlaxoSmithKline plc at no cost, subject to the achievement by the Group of specified performance targets. The granting of these restricted share awards has replaced the granting of options to employees as the cost of the schemes more readily equates to the potential gain to be made by the employee. The Group also operates savings related share option schemes, whereby options are granted to employees to acquire shares in GlaxoSmithKline plc at a discounted price.
Grants of restricted share awards are normally exercisable at the end of the three year vesting or performance period. Awards are normally granted to employees to acquire shares or ADS in GlaxoSmithKline plc but in some circumstances may be settled in cash. Grants under savings-related share option schemes are normally exercisable after three years’ saving. In accordance with UK practice, the majority of options under the savings-related share option schemes are granted at a price 20% below the market price ruling at the date of grant. Options under historical share option schemes were granted at the market price ruling at the date of grant.
The total charge for share-based incentive plans in 2017 was £347 million (2016 – £338 million; 2015 – £349 million). Of this amount, £276 million (2016 – £271 million; 2015 – £307 million) arose from the Share Value Plan. See Note 9, ‘Employee Costs’ for further details.
GlaxoSmithKline share award schemes
Share Value Plan
Under the Share Value Plan, share awards are granted to certain employees at no cost. The awards vest after two and a half to three years and there are no performance criteria attached. The fair value of these awards is determined based on the closing share price on the day of grant, after deducting the expected future dividend yield of 4.8% (2016 – 4.5%; 2015 – 5.7%) over the duration of the award.
| | | | | | | | |
Number of shares and ADS issuable | | Shares
Number (000) | | Weighted fair value | | ADS Number (000) | | Weighted
fair value |
At 1 January 2015 | | 32,912 | | | | 21,227 | | |
| | | | |
Awards granted | | 13,019 | | £11.57 | | 7,198 | | $35.66 |
| | | | |
Awards exercised | | (11,476) | | | | (8,878) | | |
| | | | |
Awards cancelled | | (1,878) | | | | (2,027) | | |
At 31 December 2015 | | 32,577 | | | | 17,520 | | |
| | | | |
Awards granted | | 12,983 | | £14.97 | | 6,589 | | $39.18 |
| | | | |
Awards exercised | | (11,198) | | | | (6,214) | | |
| | | | |
Awards cancelled | | (1,507) | | | | (812) | | |
At 31 December 2016 | | 32,855 | | | | 17,083 | | |
| | | | |
Awards granted | | 13,018 | | £13.68 | | 6,610 | | $35.63 |
| | | | |
Awards exercised | | (10,596) | | | | (5,674) | | |
| | | | |
Awards cancelled | | (1,352) | | | | (627) | | |
At 31 December 2017 | | 33,925 | | | | 17,392 | | |
Performance Share Plan
Under the Performance Share Plan, share awards are granted to Directors and senior executives at no cost. The percentage of each award that vests is based upon the performance of the Group over a defined measurement period with dividends reinvested during the same period. For awards granted from 2015, the performance conditions are based on three equally weighted measures over a three year performance period. These are adjusted free cash flow, TSR and R&D new product performance.
The fair value of the awards is determined based on the closing share price on the day of grant. For TSR performance elements, this is adjusted by the likelihood of that condition being met, as assessed at the time of grant.
During 2017, awards were made of 3.9 million shares at a weighted fair value of £11.09 and 1.0 million ADS at a weighted fair value of $32.85. At 31 December 2017, there were outstanding awards over 12.9 million shares and 3.2 million ADS.
| | | | |
| GSK Annual Report 2017 | | Strategic report | | |
| | Governance and remuneration | | |
| | Financial statements | | |
| | Investor information | | |
43. Employee share schemescontinued
Share options and savings-related options
For the purposes of valuing savings-related options to arrive at the share based payment charge, a Black-Scholes option pricing model has been used. The assumptions used in the model are as follows:
| | | | | | |
| | | 2017 Grant | | 2016 Grant | | 2015 Grant |
Risk-free interest rate | | 0.54% | | 0.32% | | 0.88% |
| | | |
| Dividend yield | | 5.9% | | 4.9% | | 6.5% |
| | | |
| Volatility | | 23% | | 23% | | 21% |
| | | |
| Expected life | | 3 years | | 3 years | | 3 years |
| | | |
| Savings-related options grant price (including 20% discount) | | £10.86 | | £12.95 | | £10.14 |
| | | | | | | | | | | | | | | | | | | | | | | | |
| Options outstanding | | Share option schemes – shares | | | Share option schemes – ADS | | | Savings-related share option schemes | |
| | | Number
000 | | | Weighted exercise price | | | Number
000 | | | Weighted exercise price | | | Number
000 | | | Weighted exercise price | |
| | | | | | |
| At 31 December 2017 | | 3,600 | | | £11.86 | | | 3,277 | | | $39.62 | | | 6,852 | | | £10.77 | |
| | | | | | |
Range of exercise prices on options outstanding at year end | | | £11.47 | | | | – £12.21 | | | | $33.42 | | | | – $48.66 | | | | £10.13 | | | | – £12.95 | |
| | | | | | |
Weighted average market price on exercise during year | | | | | | | £16.07 | | | | | | | | $41.50 | | | | | | | | £14.28 | |
| | | | | | |
| Weighted average remaining contractual life | | | | | 1.4 years | | | | | | 1.0 years | | | | | | 2.1 years | |
Options over 2.0 million shares were granted during the year under the savings-related share option scheme at a weighted average fair value of £2.08. At 31 December 2017, 6.7 million of the savings-related share options were not exercisable. All of the other share options and ADS options are currently exercisable and all will expire if not exercised on or before 22 July 2020.
There has been no change in the effective exercise price of any outstanding options during the year.
Employee Share Ownership Plan Trusts
The Group sponsors Employee Share Ownership Plan (ESOP) Trusts to acquire and hold shares in GlaxoSmithKline plc to satisfy awards made under employee incentive plans and options granted under employee share option schemes. The trustees of the ESOP Trusts purchase shares with finance provided by the Group by way of loans or contributions. In 2017, Treasury shares with a carrying value of £610 million were purchased by the US ESOP Trust to satisfy future awards. The costs of running the ESOP Trusts are charged to the income statement. Shares held by the ESOP Trusts are deducted from other reserves and amortised down to the value of proceeds, if any, receivable from employees on exercise by a transfer to retained earnings. The trustees have waived their rights to dividends on the shares held by the ESOP Trusts.
| | | | |
Shares held for share award schemes | | 2017 | | 2016 |
| | |
| Number of shares (000) | | 66,558 | | 42,571 |
| | | | |
| | | £m | | £m |
Nominal value | | 17 | | 11 |
| | |
| Carrying value | | 399 | | 285 |
| | |
| Market value | | 880 | | 665 |
| | | | |
Shares held for share option schemes | | 2017 | | 2016 |
Number of shares (000) | | 139 | | 139 |
| | | | |
| | | £m | | £m |
| Nominal value | | – | | – |
| | |
| Carrying value | | 1 | | 1 |
| | |
| Market value | | 2 | | 2 |
| | |
| 226 | | |
GSK Annual Report 2017 | | |
| | |
| | |
Notes to the financial statementscontinued
44. Principal Group companies
The following represent the principal subsidiaries and their countries of incorporation of the Group at 31 December 2017. The equity share capital of these entities is wholly owned by the Group except where its percentage interest is shown otherwise. All companies are incorporated in their principal country of operation except where stated.
England
Glaxo Group Limited
Glaxo Operations UK Limited
GlaxoSmithKline Capital plc
GlaxoSmithKline Consumer Healthcare Holdings Limited (63.5%)
GlaxoSmithKline Consumer Healthcare (UK) Trading Limited (63.5%)
GlaxoSmithKline Export Limited
GlaxoSmithKline Finance plc
GlaxoSmithKline Holdings Limited *
GlaxoSmithKline Research & Development Limited
GlaxoSmithKline Services Unlimited *
GlaxoSmithKline UK Limited
Setfirst Limited
SmithKline Beecham Limited
ViiV Healthcare Limited (78.3%)
ViiV Healthcare UK Limited (78.3%)
US
Block Drug Company, Inc. (63.5%)
Corixa Corporation
GlaxoSmithKline Capital Inc.
GlaxoSmithKline Consumer Healthcare, L.P. (55.9%)
GlaxoSmithKline Holdings (Americas) Inc.
GlaxoSmithKline LLC
Human Genome Sciences, Inc.
GSK Consumer Health, Inc. (formerly Novartis Consumer Health, Inc.) (63.5%)
S.R. One, Limited
Stiefel Laboratories, Inc.
ViiV Healthcare Company (78.3%)
Europe
GlaxoSmithKline Biologicals SA (Belgium)
GlaxoSmithKline Pharmaceuticals SA (Belgium)
GlaxoSmithKline Biologicals S.A.S. (France)
GlaxoSmithKline Sante Grand Public SAS (France) (63.5%)
Laboratoire GlaxoSmithKline (France)
ViiV Healthcare SAS (France) (78.3%)
GlaxoSmithKline Consumer Healthcare GmbH & Co. KG
(Germany) (63.5%)
GlaxoSmithKline GmbH & Co. KG (Germany)
GSK Vaccines GmbH (Germany)
GlaxoSmithKline Consumer Healthcare S.p.A. (Italy) (63.5%)
GlaxoSmithKline S.p.A. (Italy)
GSK Vaccines S.r.l. (Italy)
GlaxoSmithKline B.V. (Netherlands)
GlaxoSmithKline Consumer Healthcare Sp.z.o.o. (Poland) (63.5%)
GlaxoSmithKline Pharmaceuticals S.A. (Poland)
GSK Services Sp z o.o. (Poland)
GlaxoSmithKline Trading Services Limited (Republic of Ireland) (i)
GlaxoSmithKline Healthcare AO (Russia) (63.5%)
GlaxoSmithKline S.A. (Spain)
Laboratorios ViiV Healthcare, S.L. (Spain) (78.3%)
Novartis Consumer Health S.A. (Switzerland) (63.5%)
Others
GlaxoSmithKline Argentina S.A. (Argentina)
GlaxoSmithKline Australia Pty Ltd (Australia)
GlaxoSmithKline Consumer Healthcare Australia Pty Ltd (Australia) (63.5%)
GlaxoSmithKline Brasil Limitada (Brazil)
GlaxoSmithKline Consumer Healthcare Inc. (Canada) (63.5%)
GlaxoSmithKline Inc. (Canada)
ID Biomedical Corporation of Quebec (Canada)
GlaxoSmithKline Limited (China (Hong Kong))
Sino-American Tianjin Smith Kline & French Laboratories Ltd (China) (34.9%)
GlaxoSmithKline Consumer Healthcare Limited (India) (72.5%)
GlaxoSmithKline Pharmaceuticals Limited (India) (75%)
GlaxoSmithKline Consumer Healthcare Japan K.K. (Japan) (63.5%)
GlaxoSmithKline K.K. (Japan)
ViiV Healthcare Kabushiki Kaisha (Japan) (78.3%)
GlaxoSmithKline Pakistan Limited (Pakistan) (82.6%)
Glaxo Wellcome Manufacturing Pte Ltd. (Singapore)
GlaxoSmithKline Korea Limited (Republic of Korea)
GlaxoSmithKline llaclari Sanayi ve Ticaret A.S. (Turkey)
| (i) | Exempt from the provisions of section 347 and 348 of the Companies Act 2014 (Ireland), in accordance with the exemptions noted in Section 357 of that Act. Further subsidiaries, as disclosed on pages 276 to 286, are exempt from these provisions as they are also consolidated in the group financial statements. |
| * | Directly held wholly owned subsidiary of GlaxoSmithKline plc. |
The subsidiaries and associates listed above principally affect the figures in the Group’s financial statements. Each of GlaxoSmithKline Capital Inc., GlaxoSmithKline Capital plc and GlaxoSmithKline LLC, is a wholly-owned finance subsidiary of the company, and the company has fully and unconditionally guaranteed the securities issued by each of GlaxoSmithKline Capital Inc., GlaxoSmithKline Capital plc and GlaxoSmithKline LLC.
See pages 276 to 286 for a complete list of subsidiary undertakings, associates and joint ventures, which form part of these financial statements.
| | | | |
| 227 | | |
| | | | | |
| GSK Annual Report 2017 | | Strategic report | | |
| | Governance and remuneration | | |
| | Financial statements | | |
| | Investor information | | |
45. Legal proceedings
The Group is involved in significant legal and administrative proceedings, principally product liability, intellectual property, tax, anti-trust and governmental investigations, as well as related private litigation. The most significant of these matters, other than tax matters, are described below. The Group makes provision for these proceedings on a regular basis as summarised in Note 2, ‘Accounting principles and policies’ and Note 29, ‘Other provisions’.
The Group may become involved in significant legal proceedings in respect of which it is not possible to make a reliable estimate of the expected financial effect, if any, that could result from ultimate resolution of the proceedings. In these cases, appropriate disclosures about such cases would be included in this note, but no provision would be made for the cases.
With respect to each of the legal proceedings described below, other than those for which a provision has been made, the Group is unable to make a reliable estimate of the expected financial effect at this stage. The Group does not believe that information about the amount sought by the plaintiffs, if that is known, would be meaningful with respect to those legal proceedings. This is due to a number of factors, including, but not limited to, the stage of proceedings, the entitlement of parties to appeal a decision and clarity as to theories of liability, damages and governing law.
Legal expenses incurred and provisions related to legal claims are charged to selling, general and administration costs. Provisions are made, after taking appropriate legal and other specialist advice, where an outflow of resources is considered probable and a reliable estimate can be made of the likely outcome of the dispute. For certain product liability claims, the Group will make a provision where there is sufficient history of claims made and settlements to enable management to make a reliable estimate of the provision required to cover unasserted claims. At 31 December 2017, the Group’s aggregate provision for legal and other disputes (not including tax matters described in Note 14, ‘Taxation’) was £186 million. The ultimate liability for legal claims may vary from the amounts provided and is dependent upon the outcome of litigation proceedings, investigations and possible settlement negotiations.
The Group’s position could change over time, and, therefore, there can be no assurance that any losses that result from the outcome of any legal proceedings will not exceed by a material amount the amount of the provisions reported in the Group’s financial statements. If this were to happen, it could have a material adverse impact on the results of operations of the Group in the reporting period in which the judgements are incurred or the settlements entered into.
Intellectual property
Intellectual property claims include challenges to the validity and enforceability of the Group’s patents on various products or processes as well as assertions of non-infringement of those patents. A loss in any of these cases could result in loss of patent protection for the product at issue. The consequences of any such loss could be a significant decrease in sales of that product and could materially affect future results of operations for the Group.
FloventHFA
On 15 February 2017, the Group received a Paragraph IV certification from Teva forFlovent HFA. This was the first Paragraph IV certification the Group had received from a generic pharmaceutical company seeking to make an AB rated version ofFlovent HFA. Three patents are at issue. Teva alleged that its generic version ofFlovent did not infringe two patents directed to actuation indicators (metered dose) listed in the Orange Book. Teva also alleged that U.S. Patent No. 6,743, 413 (‘413 patent’) which claims a method of treatment with a formulation containing an active medication and a propellant known as 134a, substantially free of surfactant, and its use in the hydrofluoroalkane (HFA) metered dose inhalers forFlovent is not valid. After reviewing the Teva complaint, the Group did not sue Teva under the ‘413 patent and asked the FDA to remove the ‘413 patent from the Orange Book. Teva produced evidence showing that it did not infringe the dose counter patents. On 20 June 2017, the Group withdrew the case against Teva.
Bexsero/Men B vaccines
Following its acquisition of the Novartis Vaccines business, the Group took over patent litigation originally filed by Novartis against Pfizer, Inc. (Pfizer) in the UK, Italy and the United States related to meningococcal B (Men B) vaccines. In various cases, Novartis had alleged that European patents owned by Pfizer were not infringed by the Group’s vaccine,Bexsero and were invalid. Novartis had also filed suit against Pfizer for patent infringement, alleging that Pfizer’s sale of its vaccine,Trumenba, infringes Novartis’ patents related to Men B vaccines. Pfizer had filed suit against the Group in the UK seeking to invalidate six UK patents owned by the Group that have relevance toTrumenba and in Canada for infringement of a patent coveringTrumenba. On 24 April 2017, the Group and Pfizer entered into a confidential global settlement resolving all matters that permits each company to manufacture and sell their respective Men B vaccines.
| | |
| 228 | | |
GSK Annual Report 2017 | | |
| | |
| | |
Notes to the financial statementscontinued
45. Legal proceedingscontinued
Dolutegravir/Tivicay/Triumeq
In September and October, 2017, ViiV Healthcare received patent challenge letters under the Hatch-Waxman Act from Lupin, Mylan, Cipla and Dr. Reddy’s Labs forTriumeq, and from Cipla, Dr. Reddy’s, Apotex and Sandoz forTivicay andTriumeq. ViiV Healthcare lists two patents for dolutegravir, the active ingredient inTivicay and one of the active ingredients inTriumeq, in the FDA Orange Book. One patent, covering the molecule dolutegravir, expires on 5 October 2027. A second patent, claiming a certain crystal form of dolutegravir, expires on 8 December 2029. All the letters challenged only the patent for the crystal form. Some generic companies alleged that the crystal form patent is not valid. Others challenged validity and asserted that their proposed product would not infringe the crystal form patent. On 7 February 2017, ViiV Healthcare filed patent infringement suits against all the generic companies in the US District Court for the District of Delaware. Additionally, ViiV Healthcare also filed suit against certain of the generic companies in the US District Court for the District of New Jersey, and the US District Court for the District of West Virginia. No trial date has yet been set.
On 7 February 2018, ViiV Healthcare filed patent infringement litigation against Gilead Sciences Inc. (Gilead) over bictegravir in the US District Court for the District of Delaware (US Patent No. 8,129,385) and the Canadian Federal Court (Canadian Patent No. 2,606,282). ViiV Healthcare alleges that Gilead’s triple combination HIV drug containing the HIV integrase inhibitor bictegravir infringes ViiV Healthcare’s patent covering dolutegravir and other compounds that include dolutegravir’s unique chemical scaffold. In both the US and Canada, ViiV Healthcare seeks financial redress rather than injunctive relief. No trial date has yet been set.
Kivexa
Between Q1 2017 and Q1 2018, ViiV Healthcare reached confidential agreements with each of Vale Pharmaceuticals, Lupin, Sandoz, STADA and Zentiva to settle various challenges to the validity of the Supplementary Protection Certificate (‘SPC’) for the patent covering the combination of lamivudine and abacavir forKivexa and certain counterclaims brought by ViiV Healthcare for infringement of that SPC. These settlements brought an end to litigation and arbitration proceedings between ViiV Healthcare and Lupin in Germany and Portugal, between ViiV Healthcare and STADA in Germany and Italy, between ViiV Healthcare and Sandoz in Austria, Germany, Portugal, Spain and Sweden, between ViiV Healthcare and Vale Pharmaceuticals in Portugal, and between ViiV Healthcare and Zentiva in Portugal.
DOC Generici filed an action in September 2016 in the Court of Rome seeking a declaration that the Italian SPC coveringKivexa was invalid because it is based upon the invalid lamivudine and abacavir combination patent. ViiV Healthcare has counterclaimed for infringement of the Italian SPC. The trial in this action is to be heard in Q3 2018.
In June 2017, Biogaran commenced proceedings in France seeking revocation of the French SPC coveringKivexa. No trial date has been set for this action.
In Portugal, ViiV Healthcare initiated arbitration proceedings against Farmoz under the SPC coveringKivexa. Farmoz had filed for marketing approval for a generic version ofKivexa. No arbitration date has yet been scheduled in this action.
In February 2017, Kyowa Pharmaceuticals filed a nullity action relating toKivexa in Japan. Oral hearing of the trial was held at the Japan Patent Office on 30 January 2018. The decision of the Japan Patent Office is expected in 2018.
Lexiva
The US patent coveringLexiva expired on 24 December 2017 and the product has paediatric exclusivity until 24 June 2018. Pursuant to a settlement of a litigation and confidential licence agreement, Mylan is presently selling a generic version ofLexiva in the US.
Product liability
Pre-clinical and clinical trials are conducted during the development of potential products to determine the safety and efficacy of products for use by humans following approval by regulatory bodies.
Notwithstanding these efforts, when drugs and vaccines are introduced into the marketplace, unanticipated safety issues may become, or be claimed by some to be, evident. The Group is currently a defendant in a number of product liability lawsuits related to the Group’s Pharmaceutical, Vaccine and Consumer Healthcare products. The Group has been able to make a reliable estimate of the expected financial effect of the matters discussed in this category and has included a provision, as appropriate, for the matters below in the provision for legal and other disputes. Matters for which the Group has made a provision are also noted in Note 29, ‘Other provisions.
| | | | |
| 229 | | |
| | | | | |
| GSK Annual Report 2017 | | Strategic report | | |
| | Governance and remuneration | | |
| | Financial statements | | |
| | Investor information | | |
45. Legal proceedings continued
Avandia
The Group has been named in product liability lawsuits on behalf of individuals asserting personal injury claims arising out of the use ofAvandia. Economic loss actions have also been filed seeking restitution and penalties under consumer protection and other laws. The federal cases filed against the Group are part of a multi-district litigation proceeding pending in the US District Court for the Eastern District of Pennsylvania (the ‘MDL Court’). Cases have also been filed in a number of state courts. In addition, the County of Santa Clara, California, has brought an action on behalf of California residents which is pending in the MDL Court, alleging violations of California’s False Advertising Act and seeking restitution, damages, and civil penalties.
As of February 2018, there are five remaining personal injury cases on appeal from summary judgement decisions in favour of the Group (one in federal court in Pennsylvania and four in California state court).
There were four purported class actions in the US seeking economic damages on behalf of third party payers asserting claims under the Racketeer Influenced and Corrupt Organizations Act (RICO) and consumer protection laws. Two plaintiffs voluntarily dismissed their actions. On 7 December 2017, the MDL Court granted the Group’s motion for summary judgement on the two remaining plaintiffs’ claims. Plaintiffs have filed an appeal of the decision in the US Court of Appeals for the Third Circuit, and a briefing schedule has been set.
In the Santa Clara County action, the Group filed a motion for summary judgement on the basis of pre-emption and also is seeking partial summary judgement on the County’s restitution claim. On 7 December 2017, the MDL Court granted the Group’s motion. The County’s claims for civil penalties remain pending before the MDL Court.
There are 13 purported class actions in Canada, two of which are active. In the two active cases, class certification hearings were held. In the Ontario action, the proceedings were adjourned. On 7 December 2017, the Nova Scotia court issued an Order certifying a nationwide class of all users ofAvandia. The Group has filed an appeal of that class certification decision.
Seroxat/Paxiland Paxil CR
The Group has received numerous lawsuits and claims alleging that use ofPaxil (paroxetine) has caused a variety of injuries. Most of these lawsuits contain one or more of the following allegations: (i) that use ofPaxil during pregnancy caused congenital malformations, persistent pulmonary hypertension or autism; (ii) thatPaxil treatment caused patients to commit suicidal or violent acts; and (iii) that the Group failed to warn that patients could experience certain symptoms on discontinuingPaxil treatment.
– Pregnancy
The Group has reached agreements to settle the majority of the US claims relating to the use ofPaxil during pregnancy as of February 2018, but a number of claims related to use during pregnancy are still pending in various courts in the US. Of these remaining lawsuits, there are three cases still pending in state court in California and one in federal court in California. There is one case in state court in Kentucky, one in state court in Oklahoma, and one lawsuit joining the claims of eight plaintiffs in state court in Illinois. Other matters have been dismissed without payment.
The Singh action in Alberta, Canada, a proposed national class action, seeks to certify a class relating to birth defects generally. The Group is awaiting a hearing on the motion in Singh to certify the case as a class action. Another Canadian class action, Jensen, alleging claims ofPaxil (and other SSRI) use and autism was filed in Saskatchewan in January 2017. On 27 March 2017, court approval was received for the settlement of Bartram, a third class action suit in British Columbia.
– Acts of violence
As of February 2018, there were six pending claims or cases concerning allegations that patients who took paroxetine orPaxil committed or attempted to commit suicide or acts of violence: five claims or cases are in the US and one case is in Canada. One of the US cases, Dolin, involving the suicide of a man who allegedly took generic paroxetine manufactured by Mylan, resulted in a $3 million verdict for the plaintiff. The Group has appealed the verdict to the US Court of Appeals for the Seventh Circuit.
| | |
| 230 | | |
GSK Annual Report 2017 | | |
| | |
| | |
Notes to the financial statementscontinued
45. Legal proceedingscontinued
– Discontinuation
In the UK, a long-pending group action alleges thatSeroxat caused severe discontinuation symptoms. In 2010, the Legal Services Commission (“LSC”) withdrew public funding from hundreds of claimants, causing termination of most claims. In 2015, the Legal Aid Agency (formerly the LSC) discharged the public funding certificate following a 2013 recommendation of its Special Cases Review Panel that these cases have poor prospects of success. However, more recently, Fortitude Law was engaged with the purpose of resurrecting theSeroxat group action, and obtained third-party funding for the experts and the 103 remaining claimants. The Group asked the court to require the third-party funder to provide security for the litigation costs in the event plaintiffs lose. On 8 December 2017, the High Court ruled in favour of the Group on its application for an order that the claimants’ litigation funder give security for costs for a sum in excess of the total funding it had committed to the case. The trial of the action is scheduled to commence in May 2019.
Zofran
Plaintiffs allege that their children suffered birth defects as a result of the mothers’ ingestion ofZofran and/or generic ondansetron for pregnancy-related nausea and vomiting. Plaintiffs assert that the Group soldZofran knowing it was unsafe for pregnant women, failed to warn of the risks, and illegally marketedZofran “off-label” for use by pregnant women. As of February 2018, the Group is a defendant in 420 personal injury lawsuits in the US. 406 of the cases are part of a multi-district litigation proceeding (MDL) in the District of Massachusetts.
The MDL cases are in discovery. The MDL continues with monthly status conferences where issues such as the sufficiency of the pleadings and the scope of discovery will be addressed. The Group continues to seek the dismissal of individual cases as appropriate.
The Brown case pending in Oregon is in discovery and is scheduled for trial in October 2018. The remaining nine state court cases in the US, eight of which are in California, are still in their early days. The Group is also a defendant in four proposed class actions in Canada. There has been no significant activity in 2017 in the Canadian class actions.
Sales and marketing and regulation
The Group’s marketing and promotion of its Pharmaceutical and Vaccine products are the subject of certain governmental investigations and private lawsuits brought by litigants under various theories of law. The Group has been able to make a reliable estimate of the expected financial effect of the matters discussed in this category, and has included a provision for such matters in the provision for legal and other disputes, except as noted below.
Matters for which the Group has made a provision are also noted in Note 29, ‘Other provisions’.
SEC/DOJ and SFO Anti-corruption enquiries
On 27 May 2014, the UK Serious Fraud Office (SFO) began a formal criminal investigation into the Group’s commercial operations in a number of countries, including China. The Group is co-operating with and responding to these requests. The SFO inquiry followed investigations initiated by China’s Ministry of Public Security in June 2013 (the “China Investigations”) which resulted in a ruling in 2014 that, according to Chinese law, GSK China Investment Co. Ltd. (“GSKCI”) had offered money or property to non-government personnel in order to obtain improper commercial gains and GSKCI being found guilty of bribing non-government personnel.
On 30 September 2016, the Group reached a global resolution with the US Securities and Exchange Commission (SEC) regarding the SEC’s investigation under the US Foreign Corrupt Practices Act (FCPA) into the Group’s commercial practices in countries outside of the US, including China. As part of the resolution, the Group agreed to pay a civil penalty of $20 million to the US Government. The US Department of Justice (DOJ) confirmed that it had concluded its investigation into the Group’s commercial practices and would take no action against the Group. As part of the resolution with the SEC, the Group agreed to certain undertakings, including a period of self-monitoring and reporting. The Group’s obligations under that resolution continue through 30 September 2018.
In the course of its current inquiry, the SFO has requested additional information from the Group regarding third party advisers engaged by the company in the course of the China Investigations. The SEC and DOJ are also investigating these matters following the Group’s reporting of the SFO’s inquiries. The Group is co-operating and responding to these requests.
The Group is unable to make a reliable estimate of the expected financial effect of these investigations, and no provision has been made for them.
US Vaccines subpoena
On 25 February 2016, the Group received a subpoena from the US Attorney’s Office for the Southern District of New York requesting documents relating to the Group’s Vaccines business. The Group is responding to the subpoena. The Group is unable to make a reliable estimate of the expected financial effect of this matter, and no provision has been made for it.
US subpoena relating to Imitrexand Amerge
On 7 March 2016, the Group received a subpoena from the US Attorney’s Office for the Southern District of New York requesting documents relating to the Group’s US contracts forImitrex andAmerge. The Group has completed its response to the subpoena. The Group is unable to make a reliable estimate of the expected financial effect of this matter, and no provision has been made for it.
| | | | |
| GSK Annual Report 2017 | | Strategic report | | |
| | Governance and remuneration | | |
| | Financial statements | | |
| | Investor information | | |
45. Legal proceedingscontinued
Average wholesale price
The Attorney General in Illinois filed suit against the Group and a number of other pharmaceutical companies claiming damages and restitution due to average wholesale price (AWP) and/or wholesale acquisition cost (WAC) price reporting for pharmaceutical products covered by the state’s Medicaid programmes. The case alleges that the Group reported or caused to be reported false AWP and WAC prices, which, in turn, allegedly caused the state Medicaid agency to reimburse providers more money for covered medicines than the agency intended. The state has sought recovery on behalf of itself as payer and on behalf of in-state patients as consumers. The case is ongoing, and no trial date has yet been set as to the Group.
Cidra third-party payer litigation
On 25 July 2013, a number of major US healthcare insurers filed suit against the Group in the Philadelphia, Pennsylvania County Court of Common Pleas seeking compensation for reimbursements they made for medicines manufactured at the Group’s former Cidra plant in Puerto Rico. These insurers claim that the Group knowingly and illegally marketed and sold adulterated drugs manufactured under conditions non-compliant with cGMP (current good manufacturing practices) and that they, as third-party insurers, were unlawfully induced to pay for them. The suit alleges both US federal and various state law causes of action. The Court denied the Group’s motion to dismiss and discovery is scheduled to be completed in 2018, with the case to be scheduled for trial sometime in late 2018.
Anti-trust/competition
Certain governmental actions and private lawsuits have been brought against the Group alleging violation of competition or anti-trust laws. The Group has been able to make a reliable estimate of the expected financial effect of the matters discussed in this category and has included a provision for such matters in the provision for legal and other disputes, except as noted below. Matters for which the Group has made a provision are also noted in Note 29, ‘Other provisions’.
UK Competition and Markets Authority investigation
On 12 February 2016, the UK Competition and Markets Authority (CMA) issued a decision fining the Group and two other pharmaceutical companies for infringement of the Competition Act. The CMA imposed a fine of £37.6 million on the Group, as well as fines totaling £7.4 million against the other companies. This relates to agreements to settle patent disputes between the Group and potential suppliers of generic paroxetine formulations, entered between 2001 and 2003. The Group terminated the agreements at issue in 2004. The Group believes it has strong grounds for its appeal of the CMA’s finding to the Competition Appeal Tribunal (CAT) in order to overturn the fine or substantially reduce it. The appeal concluded in April 2017. The CAT delivered its initial judgement on the appeal on 8 March 2018 referring all the principle points at issue to the Court of Justice of the EU for a preliminary ruling. The matter will then return to the CAT for final judgement. No provision has been made for this matter.
Lamictal
Purported classes of direct and indirect purchasers filed suit in the US District Court for the District of New Jersey alleging that the Group and Teva Pharmaceuticals unlawfully conspired to delay generic competition forLamictal, resulting in overcharges to the purchasers, by entering into an allegedly anti-competitive reverse payment settlement to resolve patent infringement litigation. A separate count accuses the Group of monopolising the market.
On 26 June 2015, the Court of Appeals reversed the trial court’s decision to dismiss the case and remanded the action back to the trial court. On 18 May 2016, the trial court denied the indirect purchaser class plaintiffs’ motion for reconsideration. As a result, the indirect purchaser class representatives have agreed to a settlement to exit the case and resolve their remaining claims. Terms of the settlement are confidential. The case will continue to move forward with document production and witness depositions with regard to the claims of the direct purchasers.
Wellbutrin XL
Plaintiffs claimed anti-trust injury related to allegedly sham patent litigation filed by Biovail against generic companies pursuing ANDAs for genericWellbutrin XL. Plaintiffs alleged that a conspiracy to delay generic approval existed between Biovail and the Group, but the US District Court granted summary judgement in favour of the Group on those claims. The sole remaining claims in the matter relate to plaintiffs’ allegations that the Group entered into an anti-competitive reverse payment settlement to resolve the patent infringement litigation. The District Court granted summary judgement in favour of the Group on all claims. On 9 August 2017, the US Court of Appeals for the Third Circuit Court affirmed the trial court’s dismissal of plaintiffs’ case on summary judgement. On 31 August 2017, plaintiffs filed a motion for a rehearing en banc before the Third Circuit which was denied on 20 September 2017. Plaintiffs did not file a petition for certiorari asking the United States Supreme Court to review the decision, so the dismissal of the action is now final.
Commercial and corporate
The Group is a defendant in certain cases which allege violation of US federal securities and ERISA laws. The Group has been able to make a reliable estimate of the expected financial effect of the matters discussed in this category and has included a provision for such matters in the provision for legal and other disputes. Matters for which the Group has made a provision are also noted in Note 29, ‘Other provisions’.
| | |
| 232 | | |
GSK Annual Report 2017 | | |
| | |
| | |
Notes to the financial statementscontinued
45. Legal proceedingscontinued
Securities/ERISA class actions – Stiefel
On 12 December 2011, the US Securities and Exchange Commission (SEC) filed a formal complaint against Stiefel Laboratories, Inc. and Charles Stiefel in the US District Court for the District of Florida alleging that Stiefel and its principals violated federal securities laws by inducing Stiefel employees to sell their shares in the employee stock plan back to the company at a greatly undervalued price and without disclosing to employees that the company was about to be sold to the Group. The case was stayed while several private actions brought by former Stiefel employees proceeded through the courts, but was returned to active status in early summer 2015. It is unclear when the case ultimately will be scheduled for trial.
In addition to the SEC case, one private matter (the “Martinolich” case) remains. It is also pending in federal district court in Florida, but has been stayed pending the trial of the SEC matter. The allegations in the Martinolich case largely track those in the SEC matter: plaintiff, a former Stiefel employee, alleges that Stiefel and its officers and directors violated the US Employee Retirement Income Security Act (ERISA) and federal and state securities laws by inducing Stiefel employees to sell their shares in the employee stock plan back to Stiefel at a greatly undervalued price and without disclosing to employees that Stiefel was about to be sold to the Group.
Environmental matters
The Group has been notified of its potential responsibility relating to past operations and its past waste disposal practices at certain sites, primarily in the US. Some of these matters are the subject of litigation, including proceedings initiated by the US federal or state governments for waste disposal, site remediation costs and tort actions brought by private parties.
The Group has been advised that it may be a responsible party at approximately 19 sites, of which 10 appear on the National Priority List created by the Comprehensive Environmental Response Compensation and Liability Act (Superfund). These proceedings seek to require the operators of hazardous waste facilities, transporters of waste to the sites and generators of hazardous waste disposed of at the sites to clean up the sites or to reimburse the US Government for cleanup costs. In most instances, the Group is involved as an alleged generator of hazardous waste.
Although Superfund provides that the defendants are jointly and severally liable for cleanup costs, these proceedings are frequently resolved on the basis of the nature and quantity of waste disposed of by the generator at the site. The Group’s proportionate liability for cleanup costs has been substantially determined for 18 of the sites referred to above.
The Group’s potential liability varies greatly from site to site. The cost of investigation, study and remediation at such sites could, over time, be significant. The Group has made a provision for these matters, as noted in Note 29, ‘Other provisions’.
| | | | |
| 233 | | |
| | | | | |
| GSK Annual Report 2017 | | Strategic report | | |
| | Governance and remuneration | | |
| | Financial statements | | |
| | Investor information | | |
Financial statements of GlaxoSmithKline plc
prepared under UK GAAP (including FRS 101 ‘Reduced Disclosure Framework’)
Directors’ statements of responsibilities in relation
to the company’s financial statements
The Directors are responsible for preparing the parent company, GlaxoSmithKline plc, financial statements and the Remuneration report in accordance with applicable law and regulations.
UK company law requires the Directors to prepare financial statements for each financial year. Under that law the Directors have elected to prepare the parent company financial statements in accordance with United Kingdom Accounting Standards and applicable law (United Kingdom Generally Accepted Accounting Practice). Under company law the Directors must not approve the parent company financial statements unless they are satisfied that they give a true and fair view of the state of affairs of the parent company and its profit or loss for that period.
In preparing those financial statements, the Directors are required to:
| – | | select suitable accounting policies and then apply them consistently; |
| – | | make judgements and accounting estimates that are reasonable and prudent; |
| – | | state with regard to the parent company financial statements that applicable UK Accounting Standards have been followed, subject to any material departures disclosed and explained in the parent company financial statements; and |
| – | | prepare the financial statements on a going concern basis unless it is inappropriate to presume that the parent company will continue in business. |
The Directors are responsible for keeping adequate accounting records that are sufficient to show and explain the company’s transactions and disclose with reasonable accuracy at any time the financial position of the company and to enable them to ensure that the parent company financial statements and Remuneration report (on pages 113 to 141) comply with the Companies Act 2006. They are also responsible for safeguarding the assets of the company and hence for taking reasonable steps for the prevention and detection of fraud and other irregularities.
The parent company financial statements for the year ended 31 December 2017, comprising the balance sheet for the year ended 31 December 2017 and supporting notes, are set out on pages 239 to 242 of this report.
The responsibilities of the auditors in relation to the parent company financial statements are set out in the Independent Auditors’ report on pages 234 to 238.
The financial statements for the year ended 31 December 2017 are included in the Annual Report, which is published in printed form and made available on our website. The Directors are responsible for the maintenance and integrity of the Annual Report on our website in accordance with UK legislation governing the preparation and dissemination of financial statements. Access to the website is available from outside the UK, where comparable legislation may be different.
The Strategic Report and risk sections of the Annual Report, which represent the management report, include a fair review of the development and performance of the business and the position of the company and the Group taken as a whole, together with a description of the principal risks and uncertainties that it faces.
Disclosure of information to auditors
The Directors in office at the date of this Annual Report have each confirmed that:
| – | | so far as he or she is aware, there is no relevant audit information of which the company’s auditors are unaware; and |
| – | | he or she has taken all the steps that he or she ought to have taken as a Director to make himself or herself aware of any relevant audit information and to establish that the company’s auditors are aware of that information. |
This confirmation is given and should be interpreted in accordance with the provisions of section 418 of the Companies Act 2006.
Going concern basis
Having assessed the principal risks and other matters considered in connection with the viability statement, the Directors considered it appropriate to adopt the going concern basis of accounting in preparing the financial statements.
The UK Corporate Governance Code
The Board considers that GlaxoSmithKline plc applies the principles and complies with the provisions of the UK Corporate Governance Code maintained by the Financial Reporting Council, as described in the Corporate Governance section on pages 79 to 112. The Board further considers that the Annual Report, taken as a whole, is fair, balanced and understandable, and provides the information necessary for shareholders to assess the Group’s position and performance, business model and strategy.
As required by the Financial Conduct Authority’s Listing Rules, the auditors have considered the Directors’ statement of compliance in relation to those points of the UK Corporate Governance Code which are specified for their review.
Philip Hampton
Chairman
12 March 2018
| | |
| 234 | | |
GSK Annual Report 2017 | | |
| | |
| | |
Independent Auditors’ report
to the members of GlaxoSmithKline plc
Report on the parent company financial statements
Our Opinion
In our opinion, GlaxoSmithKline plc’s parent company financial statements (the “financial statements”):
| – | | give a true and fair view of the state of the parent company’s affairs at 31 December 2017; |
| – | | have been properly prepared in accordance with United Kingdom Generally Accepted Accounting Practice (United Kingdom Accounting Standards, comprising FRS 101 “Reduced Disclosure Framework”, and applicable law); and |
| – | | have been prepared in accordance with the requirements of the Companies Act 2006. |
We have audited the financial statements, included within the Annual Report, which comprise: the Company balance sheet at 31 December 2017; the Company statement of changes in equity for the year then ended; and the notes to the financial statements, which include a description of the significant accounting policies.
Our opinion is consistent with our reporting to the Audit & Risk Committee.
Basis for opinion
We conducted our audit in accordance with International Standards on Auditing (UK) (“ISAs (UK)”) and applicable law. Our responsibilities under ISAs (UK) are further described in the Auditors’ responsibilities for the audit of the financial statements section of our report. We believe that the audit evidence we have obtained is sufficient and appropriate to provide a basis for our opinion.
Independence
We remained independent of the Group in accordance with the ethical requirements that are relevant to our audit of the financial statements in the UK, which includes the FRC’s Ethical Standard, as applicable to listed public interest entities, and we have fulfilled our other ethical responsibilities in accordance with these requirements.
To the best of our knowledge and belief, we declare that non-audit services prohibited by the FRC’s Ethical Standard were not provided to the Group or to the parent company.
Other than those disclosed in Note 8 to the Group financial statements, we have provided no non-audit services to the Group and to its subsidiaries in the period from 1 January 2017 to 31 December 2017.
Our audit approach
Overview
Materiality
| – | | Overall materiality: £70 million (2016 – £70 million), based on 1% of total assets capped at an allocation of Group materiality. |
Scope
| – | | The parent company is a single entity and operates in one location. |
Areas of focus
| – | | Carrying value of investments in subsidiaries |
| – | | Vaccines contingent consideration liability. |
The scope of our audit
As part of designing our audit, we determined materiality and assessed the risks of material misstatement in the financial statements. In particular, we looked at where the directors made subjective judgements, for example in respect of significant accounting estimates that involved making assumptions and considering future events that are inherently uncertain.
We gained an understanding of the legal and regulatory framework applicable to the Company and the pharmaceutical industry in which it operates, and considered the risk of acts by the Company which were contrary to applicable laws and regulations, including fraud. We designed audit procedures to respond to the risk, recognising that the risk of not detecting a material misstatement due to fraud is higher than the risk of not detecting one resulting from error, as fraud may involve deliberate concealment by, for example, forgery or intentional misrepresentations, or through collusion. We focused on laws and regulations that could give rise to a material misstatement in the Company financial statements in the event of non-compliance including, but not limited to, the Companies Act 2006, UK Listing Rules and UK taxation legalisation. Our tests included, but were not limited to, the review of the financial statement disclosures to underlying supporting documentation, review of correspondence with legal advisors, enquiries of management and review of Internal Audit reports in so far as they related to the financial statements. There are inherent limitations in the audit procedures described above and the further removed non-compliance with laws and regulations is from the events and transactions reflected in the financial statements, the less likely we would become aware of it.
We did not identify any key audit matters relating to irregularities, including fraud. As in all of our audits, we also addressed the risk of management override of internal controls, including testing journals and evaluating whether there was evidence of bias by the directors that represented a risk of material misstatement due to fraud.
| | | | |
| GSK Annual Report 2017 | | Strategic report | | |
| | Governance and remuneration | | |
| | Financial statements | | |
| | Investor information | | |
Report on the parent company financial statements continued
Key audit matters
Key audit matters are those matters that, in the auditors’ professional judgement, were of most significance in the audit of the financial statements of the current period and include the most significant assessed risks of material misstatement (whether or not due to fraud) identified by the auditors, including those which had the greatest effect on: the overall audit strategy; the allocation of resources in the audit; and directing the efforts of the engagement team. These matters, and any comments we make on the results of our procedures thereon, were addressed in the context of our audit of the financial statements as a whole, and in forming our opinion thereon, and we do not provide a separate opinion on these matters. This is not a complete list of all risks identified by our audit.
| | | | |
| Key audit matter | | | | How our audit addressed the key audit matter |
Carrying value of investments in subsidiaries Refer to Note F in the parent company financial statements The parent company holds fixed asset investments comprising investments in subsidiaries of £20,275 million at 31 December 2017 (2016 – £20,236 million). Investments in subsidiaries are accounted for at cost less impairment in the Company balance sheet at 31 December 2017. Investments are tested for impairment if impairment indicators exist. If such indicators exist, the recoverable amounts of the investments in subsidiaries are estimated in order to determine the extent of the impairment loss, if any. Any such impairment loss is recognised in the income statement. Management judgement is required in the area of impairment testing, particularly in determining whether any impairment triggers have arisen that trigger the need for an impairment review and in assessing whether the carrying value of an asset can be supported by the recoverable amount which is determined by reference to the Group’s market capitalisation and the valuations implied by other acquisition-related liabilities. | | | | We evaluated management’s assumption whether any indicators of impairment existed by comparing the net assets of the subsidiaries at 31 December 2017 with the parent company’s investment carrying values. For those investments where the net assets were lower than the carrying values, we considered their recoverable value by reference to the Group’s market capitalisation at 31 December 2017 and the valuations implied by other models, including valuation models prepared for the acquisition-related liabilities and for goodwill impairment review purposes, all of which were subject to audit procedures as part of our Group audit. As a result of our work, we agreed with management that the carrying values of the investments held by the parent company are supportable in the context of the parent company financial statements taken as a whole. |
Vaccines contingent consideration liability Refer to Note H and J in the parent company financial statements. On acquisition of the Vaccines business from Novartis in 2015, the parent company recognised a contingent consideration liability which represents certain future milestone and royalty payments. The liability includes milestone payments for acquired products reaching set revenue and development targets. The liability is required to be re-measured to its fair value at each reporting date based on latest forecast and expectations of the probability of successful product launches. The value of the liability at 31 December 2017 was £584 million (2016 – £545 million). The carrying value of the liability is based on assumptions such as forecast cash flows, discount rates, taxation rates and the probability of certain vaccines achieving development milestones. | | | | We deployed our valuation specialists to consider the reasonableness of management’s assumptions including growth projections and probability of success as well as the integrity and accuracy of management’s model. We compared sales forecasts to independent market analysis and to board approved long range forecasts. We also verified that the projections are consistent with those used in other estimates, including intangible asset impairment models. We considered the appropriateness of management’s judgements about the probability of achieving the milestones in relation to development progress and quantified how sensitive the liability is to different assumptions around the probability of success. Where the probability of success changed in 2017, we verified that this was driven by a comparative change in the stage of development of the vaccine. The liability is subject to significant estimation uncertainty. However, based on our procedures performed, we are comfortable that the value of the liability at 31 December 2017 is reasonable in the context of the parent company financial statements taken as a whole and reflects management’s best estimate at this time. We reviewed the disclosures about the liability included in the Group financial statements. We are satisfied that these disclosures are appropriate. |
| | |
| 236 | | |
GSK Annual Report 2017 | | |
| | |
| | |
Independent Auditors’ report to the members
of GlaxoSmithKline plccontinued
Report on the parent company financial statementscontinued
How we tailored the audit scope
We tailored the scope of our audit to ensure that we performed enough work to be able to give an opinion on the financial statements as a whole, taking into account the structure of the parent company, the accounting processes and controls and the industry in which it operates.
Materiality
The scope of our audit was influenced by our application of materiality. We set certain quantitative thresholds for materiality. These, together with qualitative considerations, helped us to determine the scope of our audit and the nature, timing and extent of our audit procedures on the individual financial statement line items and disclosures and in evaluating the effect of misstatements, both individually and in aggregate on the financial statements as a whole.
Based on our professional judgement, we determined materiality for the financial statements as a whole as follows:
| | |
Overall group materiality | | £70 million (2016 – £70 million). |
| |
How we determined it | | 1% of total assets capped at an allocation of Group materiality. |
| |
| Rationale for benchmark applied | | The parent company holds the Group’s investments and is not in itself profit-oriented. The strength of the balance sheet is the key measure of financial health that is important to shareholders since the primary concern for the parent company is the payment of dividends. Using a benchmark of total assets is therefore most appropriate. This has been capped at £70 million following an allocation of Group audit materiality since the parent company is a component for the Group audit. |
We agreed with the Audit & Risk Committee that we would report to it misstatements identified during our audit above £10 million (2016 – £10 million) as well as misstatements below that amount that, in our view, warranted reporting for qualitative reasons.
Going concern
In accordance with ISAs (UK) we report as follows:
| | | | |
Reporting obligation | | | | Outcome |
We are required to report if we have anything material to add or draw attention to in respect of the directors’ statement in the financial statements about whether the directors considered it appropriate to adopt the going concern basis of accounting in preparing the financial statements and the directors’ identification of any material uncertainties to the parent company’s ability to continue as a going concern over a period of at least twelve months from the date of approval of the financial statements. | | | | We have nothing material to add or to draw attention to. However, because not all future events or conditions can be predicted, this statement is not a guarantee as to the parent Company’s ability to continue as a going concern. |
We are required to report if the directors’ statement relating to going concern in accordance with Listing Rule 9.8.6R(3) is materially inconsistent with our knowledge obtained in the audit. | | | | We have nothing to report. |
| | | | |
| 237 | | |
| | | | | |
| GSK Annual Report 2017 | | Strategic report | | |
| | Governance and remuneration | | |
| | Financial statements | | |
| | Investor information | | |
Reporting on other information
The other information comprises all of the information in the Annual Report other than the financial statements and our auditors’ report thereon. The directors are responsible for the other information. Our opinion on the financial statements does not cover the other information and, accordingly, we do not express an audit opinion or, except to the extent otherwise explicitly stated in this report, any form of assurance thereon.
In connection with our audit of the financial statements, our responsibility is to read the other information and, in doing so, consider whether the other information is materially inconsistent with the financial statements or our knowledge obtained in the audit, or otherwise appears to be materially misstated. If we identify an apparent material inconsistency or material misstatement, we are required to perform procedures to conclude whether there is a material misstatement of the financial statements or a material misstatement of the other information. If, based on the work we have performed, we conclude that there is a material misstatement of this other information, we are required to report that fact. We have nothing to report based on these responsibilities.
With respect to the Strategic Report and Directors’ Report, we also considered whether the disclosures required by the UK Companies Act 2006 have been included.
Based on the responsibilities described above and our work undertaken in the course of the audit, the Companies Act 2006, (CA06), ISAs (UK) and the Listing Rules of the Financial Conduct Authority (FCA) require us also to report certain opinions and matters as described below (required by ISAs (UK) unless otherwise stated).
Strategic Report and Directors’ Report
In our opinion, based on the work undertaken in the course of the audit, the information given in the Strategic Report and Directors’ Report for the year ended 31 December 2017 is consistent with the financial statements and has been prepared in accordance with applicable legal requirements. (CA06)
In light of the knowledge and understanding of the parent company and its environment obtained in the course of the audit, we did not identify any material misstatements in the Strategic Report and Directors’ Report. (CA06)
The directors’ assessment of the prospects of the parent company and of the principal risks that would threaten the solvency or liquidity of the parent company
We have nothing material to add or draw attention to regarding:
| – | | The directors’ confirmation on page 105 of the Annual Report that they have carried out a robust assessment of the principal risks facing the parent company, including those that would threaten its business model, future performance, solvency or liquidity; |
| – | | The disclosures in the Annual Report that describe those risks and explain how they are being managed or mitigated; and |
| – | | The directors’ explanation on page 57 of the Annual Report as to how they have assessed the prospects of the parent company, over what period they have done so and why they consider that period to be appropriate, and their statement as to whether they have a reasonable expectation that the parent company will be able to continue in operation and meet its liabilities as they fall due over the period of their assessment, including any related disclosures drawing attention to any necessary qualifications or assumptions. |
We have nothing to report having performed a review of the directors’ statement that they have carried out a robust assessment of the principal risks facing the parent company and statement in relation to the longer-term viability of the parent company. Our review was substantially less in scope than an audit and only consisted of making inquiries and considering the directors’ process supporting their statements; checking that the statements are in alignment with the relevant provisions of the UK Corporate Governance Code (the “Code”); and considering whether the statements are consistent with the knowledge and understanding of the parent company and its environment obtained in the course of the audit. (Listing Rules)
Other Code provisions
We have nothing to report in respect of our responsibility to report when:
| – | | The statement given by the directors, on page 104, that they consider the Annual Report taken as a whole to be fair, balanced and understandable, and provides the information necessary for the members to assess the parent company’s position and performance, business model and strategy is materially inconsistent with our knowledge of the parent company obtained in the course of performing our audit; |
| – | | The section of the Annual Report on pages 99 to 106 describing the work of the Audit & Risk Committee does not appropriately address matters communicated by us to the Audit Risk Committee; and |
| – | | The directors’ statement relating to the parent company’s compliance with the Code does not properly disclose a departure from a relevant provision of the Code specified, under the Listing Rules, for review by the auditors. |
Directors’ Remuneration
In our opinion, the part of the Directors’ Remuneration Report to be audited has been properly prepared in accordance with the Companies Act 2006. (CA06)
| | |
| 238 | | |
GSK Annual Report 2017 | | |
| | |
| | |
Independent Auditors’ report to the members
of GlaxoSmithKline plccontinued
Responsibilities for the financial statements and the audit
Responsibilities of the directors for the financial statements
As explained more fully in the directors’ statement of responsibilities set out on page 233, the directors are responsible for the preparation of the financial statements in accordance with the applicable framework and for being satisfied that they give a true and fair view. The directors are also responsible for such internal control as they determine is necessary to enable the preparation of financial statements that are free from material misstatement, whether due to fraud or error.
In preparing the financial statements, the directors are responsible for assessing the parent company’s ability to continue as a going concern, disclosing as applicable, matters related to going concern and using the going concern basis of accounting unless the directors either intend to liquidate the parent company or to cease operations or have no realistic alternative but to do so.
Auditors’ responsibilities for the audit of the financial statements
Our objectives are to obtain reasonable assurance about whether the financial statements as a whole are free from material misstatement, whether due to fraud or error, and to issue an auditors’ report that includes our opinion. Reasonable assurance is a high level of assurance, but is not a guarantee that an audit conducted in accordance with ISAs (UK) will always detect a material misstatement when it exists. Misstatements can arise from fraud or error and are considered material if, individually or in the aggregate, they could reasonably be expected to influence the economic decisions of users taken on the basis of these financial statements.
A further description of our responsibilities for the audit of the financial statements is located on the FRC’s website at: www.frc.org.uk/ auditorsresponsibilities. This description forms part of our auditors’ report.
Use of this report
This report, including the opinions, has been prepared for and only for the parent company’s members as a body in accordance with Chapter 3 of Part 16 of the Companies Act 2006 and for no other purpose. We do not, in giving these opinions, accept or assume responsibility for any other purpose or to any other person to whom this report is shown or into whose hands it may come save where expressly agreed by our prior consent in writing.
Companies Act 2006 exception reporting
Under the Companies Act 2006 we are required to report to you if, in our opinion:
| – | | we have not received all the information and explanations we require for our audit; or |
| – | | adequate accounting records have not been kept by the parent company, or returns adequate for our audit have not been received from branches not visited by us; or |
| – | | certain disclosures of directors’ remuneration specified by law are not made; or |
| – | | the financial statements and the part of the Directors’ Remuneration Report to be audited are not in agreement with the accounting records and returns. |
We have no exceptions to report arising from this responsibility.
Appointment
We have audited the financial statements of the parent company since the year ended 31 December 2000 following the parent company’s inception. The period of total uninterrupted engagement is 18 years, covering the years ended 31 December 2000 to 31 December 2017. The year ended 31 December 2017 is our final year of engagement following the Company’s decision to rotate the external audit.
Other matters
We have reported separately on the Group financial statements of GlaxoSmithKline plc for the year ended 31 December 2017.
The parent company has passed a resolution in accordance with section 506 of the Companies Act that the senior statutory auditor’s name should not be stated.
PricewaterhouseCoopers LLP
Chartered Accountants and Statutory Auditors
London
12 March 2018
| | | | |
| 239 | | |
| | | | | |
| GSK Annual Report 2017 | | Strategic report | | |
| | Governance and remuneration | | |
| | Financial statements | | |
| | Investor information | | |
Company balance sheet –
UK GAAP(including FRS 101 ‘Reduced Disclosure Framework’) as at 31 December 2017
| | | | | | | | | | | | | | | | | | | | |
| | | Notes | | | 2017 £m | | | 2017 £m | | | 2016 £m | | | 2016 £m | |
Fixed assets – investments | | | F | | | | | | | | 20,275 | | | | | | | | 20,236 | |
| | | | | |
Current assets: | | | | | | | | | | | | | | | | | | | | |
| | | | | |
Trade and other receivables | | | G | | | | | | | | 8,715 | | | | | | | | 2,128 | |
| | | | | |
Cash at bank | | | | | | | | | | | 15 | | | | | | | | 12 | |
Total current assets | | | | | | | | | | | 8,730 | | | | | | | | 2,140 | |
Bank overdrafts | | | | | | | | | | | (15 | ) | | | | | | | (10 | ) |
| | | | | |
Trade and other payables | | | H | | | | | | | | (837 | ) | | | | | | | (555 | ) |
Total current liabilities | | | | | | | | | | | (852 | ) | | | | | | | (565 | ) |
Net current assets | | | | | | | | | | | 7,878 | | | | | | | | 1,575 | |
| | | | | |
Total assets less current liabilities | | | | | | | | | | | 28,153 | | | | | | | | 21,811 | |
Provisions for liabilities | | | I | | | | | | | | (27 | ) | | | | | | | (23 | ) |
Other non-current liabilities | | | J | | | | | | | | (238 | ) | | | | | | | (534 | ) |
Net assets | | | | | | | | | | | 27,888 | | | | | | | | 21,254 | |
| | | | | |
Capital and reserves | | | | | | | | | | | | | | | | | | | | |
| | | | | |
Share capital | | | K | | | | | | | | 1,343 | | | | | | | | 1,342 | |
| | | | | |
Share premium account | | | K | | | | | | | | 3,019 | | | | | | | | 2,954 | |
| | | | | |
Other reserves | | | | | | | | | | | 1,420 | | | | | | | | 1,420 | |
| | | | | |
Retained earnings: | | | | | | | | | | | | | | | | | | | | |
| | | | | |
At 1 January | | | | | | | 15,538 | | | | | | | | 20,033 | | | | | |
| | | | | |
Profit/(loss) for the year | | | | | | | 9,893 | | | | | | | | (111) | | | | | |
| | | | | |
Other changes in retained earnings | | | | | | | (3,325) | | | | | | | | (4,384) | | | | | |
| | | | | | | | | | | | | | | | | | | | |
| | | | | |
| | | L | | | | | | | | 22,106 | | | | | | | | 15,538 | |
| | | | | | |
Equity shareholders’ funds | | | | | | | | | | | 27,888 | | | | | | | | 21,254 | |
The financial statements on pages 239 to 242 were approved by the Board on 12 March 2018 and signed on its behalf by
Philip Hampton
Chairman
GlaxoSmithKline plc
Registered number: 3888792
Company statement of changes in equity
for the year ended 31 December 2017
| | | | | | | | | | | | | | | | | | | | |
| | | Share
capital
£m | | | Share premium account £m | | | Other
reserves
£m | | | Retained
earnings
£m | | | Total
equity
£m | |
| | | | | |
At 1 January 2016 | | | 1,340 | | | | 2,831 | | | | 1,420 | | | | 20,033 | | | | 25,624 | |
| | | | | |
Loss attributable to shareholders | | | – | | | | – | | | | – | | | | (111 | ) | | | (111 | ) |
| | | | | |
Dividends to shareholders | | | – | | | | – | | | | – | | | | (4,850 | ) | | | (4,850 | ) |
| | | | | |
Shares issued under employee share schemes | | | 2 | | | | 87 | | | | – | | | | – | | | | 89 | |
| | | | | |
Treasury shares transferred to the ESOP Trust | | | – | | | | 36 | | | | – | | | | 466 | | | | 502 | |
| | | | | |
At 31 December 2016 | | | 1,342 | | | | 2,954 | | | | 1,420 | | | | 15,538 | | | | 21,254 | |
| | | | | |
Profit attributable to shareholders | | | – | | | | – | | | | – | | | | 9,893 | | | | 9,893 | |
| | | | | |
Dividends to shareholders | | | – | | | | – | | | | – | | | | (3,906 | ) | | | (3,906 | ) |
| | | | | |
Shares issued under employee share schemes | | | 1 | | | | 55 | | | | – | | | | – | | | | 56 | |
| | | | | |
Treasury shares transferred to the ESOP Trust | | | – | | | | 10 | | | | – | | | | 581 | | | | 591 | |
| | | | | | |
At 31 December 2017 | | | 1,343 | | | | 3,019 | | | | 1,420 | | | | 22,106 | | | | 27,888 | |
| | |
| 240 | | |
GSK Annual Report 2017 | | |
| | |
| | |
Notes to the company balance sheet – UK GAAP
(including FRS 101 ‘Reduced Disclosure Framework’)
A) Presentation of the financial statements
Description of business
GlaxoSmithKline plc is the parent company of GSK, a major global healthcare group which is engaged in the creation and discovery, development, manufacture and marketing of pharmaceutical products, including vaccines, over-the-counter (OTC) medicines and health-related consumer products.
Preparation of financial statements
The financial statements, which are prepared using the historical cost convention (as modified to include the revaluation of certain financial instruments) and on a going concern basis, are prepared in accordance with Financial Reporting Standard 101 ‘Reduced Disclosure Framework’ and with UK accounting presentation and the Companies Act 2006 as at 31 December 2017, with comparative figures as at 31 December 2016.
As permitted by section 408 of the Companies Act 2006, the income statement of the company is not presented in this Annual Report.
The company is included in the Group financial statements of GlaxoSmithKline plc, which are publicly available.
The following exemptions from the requirements of IFRS have been applied in the preparation of these financial statements, in accordance with FRS 101:
| – | | Paragraphs 45(b) and 46 to 52 of IFRS 2, ‘Share-based payment’ |
| – | | IFRS 7, ‘Financial Instruments - Disclosures’ |
| – | | Paragraphs 91-99 of IFRS 13, ‘Fair value measurement’ |
| – | | Paragraph 38 of IAS 1, ‘Presentation of financial statements’ comparative information requirements in respect of paragraph 79(a) (iv) of IAS 1 |
| – | | Paragraphs 10(d), 10(f), 16, 38(A), 38 (B to D), 40 (A to D), 111 and 134 to 136 of IAS 1, ‘Presentation of financial statements’ |
| – | | IAS 7, ‘Statement of cash flows’ |
| – | | Paragraph 30 and 31 of IAS 8, ‘Accounting policies, changes in accounting estimates and errors’ |
| – | | Paragraph 17 of IAS 24, ‘Related party disclosures’ and the further requirement in IAS 24 to disclose related party transactions entered into between two or more members of a Group. |
Accounting convention and standards
The balance sheet has been prepared using the historical cost convention and complies with applicable UK accounting standards.
Accounting principles and policies
The preparation of the balance sheet in conformity with generally accepted accounting principles requires management to make estimates and assumptions that affect the reported amounts of assets and liabilities and disclosure of contingent assets and liabilities at the date of the balance sheet. Actual amounts could differ from those estimates.
The balance sheet has been prepared in accordance with the company’s accounting policies approved by the Board and described in Note B. These policies have been consistently applied, unless otherwise stated.
B) Accounting policies
Foreign currency transactions
Foreign currency transactions are recorded at the exchange rate ruling on the date of transaction. Foreign currency assets and liabilities are translated at rates of exchange ruling at the balance sheet date.
Dividends paid and received
Dividends paid and received are included in the financial statements in the period in which the related dividends are actually paid or received.
Expenditure
Expenditure is recognised in respect of goods and services received when supplied in accordance with contractual terms. Provision is made when an obligation exists for a future liability in respect of a past event and where the amount of the obligation can be reliably estimated.
Investments in subsidiary companies
Investments in subsidiary companies are held at cost less any provision for impairment and also adjusted for movements in contingent consideration.
Impairment of investments
The carrying value of investments are reviewed for impairment when there is an indication that the investment might be impaired. Any provision resulting from an impairment review is charged to the income statement in the year concerned.
Share based payments
The issuance by the company to its subsidiaries of a grant over the company’s shares, represents additional capital contributions by the company in its subsidiaries. An additional investment in subsidiaries results in a corresponding increase in shareholders’ equity. The additional capital contribution is based on the fair value of the grant issued, allocated over the underlying grant’s vesting period.
Taxation
Current tax is provided at the amounts expected to be paid applying tax rates that have been enacted or substantively enacted by the balance sheet date.
Deferred tax is provided in full, using the liability method, on temporary differences arising between the tax bases of assets and liabilities and their carrying amounts in the financial statements. Deferred tax assets are only recognised to the extent that they are considered recoverable against future taxable profits.
Deferred tax is measured at the average tax rates that are expected to apply in the periods in which the temporary differences are expected to be realised or settled. Deferred tax liabilities and assets are not discounted.
Financial guarantees
Liabilities relating to guarantees issued by the company on behalf of its subsidiaries are initially recognised at fair value and amortised over the life of the guarantee.
Legal and other disputes
The company provides for anticipated settlement costs where an outflow of resources is considered probable and a reliable estimate may be made of the likely outcome of the dispute and legal and other expenses arising from claims against the company. At 31 December 2017 provisions for legal and other disputes amounted to £27 million (2016 – £23 million).
| | | | |
| 241 | | |
| | | | | |
| GSK Annual Report 2017 | | Strategic report | | |
| | Governance and remuneration | | |
| | Financial statements | | |
| | Investor information | | |
C) Key accounting judgements and estimates
Legal and other disputes
The company provides for anticipated settlement costs where management makes a judgement that an outflow of resources is probable and a reliable estimate can be made of the likely outcome of the dispute and legal and other expenses arising from claims against the company. The estimated provisions take into account the specific circumstances of each dispute and relevant external advice, are inherently judgemental and could change substantially over time as each dispute progresses and new facts emerge.
The company’s Directors, having taken legal advice, have established provisions after taking into account the relevant facts and circumstances of each matter and in accordance with accounting requirements. At 31 December 2017 provisions for legal and other disputes amounted to £27 million (2016 – £23 million).
The ultimate liability for legal claims may vary from the amounts provided and is dependent upon the outcome of litigation proceedings, investigations and possible settlement negotiations. The position could change over time and, therefore, there can be no assurance that any losses that result from the outcome of any legal proceedings will not exceed the amount of the provisions reported in the company’s financial statements by a material amount.
D) Operating profit
A fee of £12,053 (2016 – £12,053) relating to the audit of the company has been charged in operating profit.
E) Dividends
The directors declared four interim dividends resulting in a dividend for the year of 80 pence, in line with the dividend for 2016. For further details, see Note 16 to the Group financial statements, ‘Dividends’.
F) Fixed assets – investments
| | | | | | | | |
| | | 2017
£m | | | 2016
£m | |
| | |
Shares in GlaxoSmithKline Services Unlimited | | | 613 | | | | 613 | |
| | |
Shares in GlaxoSmithKline Holdings (One) Limited | | | 18 | | | | 18 | |
| | |
Shares in GlaxoSmithKline Holdings Limited | | | 17,888 | | | | 17,888 | |
| | |
| Shares in GlaxoSmithKline Mercury Limited | | 33 | | | 33 | |
| | |
| | | 18,552 | | | | 18,552 | |
| | |
Capital contribution relating to share based payments | | | 1,139 | | | | 1,139 | |
| | |
| Contribution relating to contingent consideration | | 584 | | | 545 | |
| | | 20,275 | | | 20,236 | |
| | |
G) Trade and other receivables | | | | | | | | |
| | | 2017
£m | | | 2016
£m | |
| | |
Amounts due within one year: | | | | | | | | |
| | |
UK Corporation tax recoverable | | | 31 | | | | 201 | |
| | |
Other receivables | | | 1 | | | | 4 | |
| | |
Amounts owed by Group undertakings | | | 8,299 | | | | 1,478 | |
| | |
| | | 8,331 | | | | 1,683 | |
| | |
Amounts due after more than one year: | | | | | | | | |
| | |
| Amounts owed by Group undertakings | | 384 | | | 445 | |
| | | 8,715 | | | 2,128 | |
| | |
H) Trade and other payables | | | | | | | | |
| | | 2017
£m | | | 2016
£m | |
| | |
Amounts due within one year: | | | | | | | | |
| | |
Other creditors | | | 438 | | | | 514 | |
| | |
| Contingent consideration payable | | 346 | | | 11 | |
| | |
| Amounts owed to Group undertakings | | 53 | | | 30 | |
| | | 837 | | | 555 | |
The company has guaranteed debt issued by its subsidiary companies from two of which it receives fees. In aggregate, the company has outstanding guarantees over £16.7 billion of debt instruments (2016 – £18.4 billion). The amounts due from the subsidiary company in relation to these guarantee fees will be recovered over the life of the bonds and are disclosed within ‘Trade and other receivables’ (see Note G).
| | |
| 242 | | |
GSK Annual Report 2017 | | |
| | |
| | |
Notes to the company balance sheet – UK GAAP
(including FRS 101 ‘Reduced Disclosure Framework’) continued
I) Provisions for liabilities
| | | | | | | | |
| | | 2017
£m | | | 2016
£m | |
At 1 January | | | 23 | | | | 40 | |
| | |
Exchange adjustments | | | (3 | ) | | | 13 | |
| | |
Charge for the year | | | 52 | | | | 78 | |
| | |
Utilised | | | (45 | ) | | | (108 | ) |
At 31 December | | | 27 | | | | 23 | |
The provisions relate to a number of legal and other disputes in which the company is currently involved.
J) Other non-current liabilities
| | | | | | | | |
| | | 2017
£m | | | 2016
£m | |
| | |
Contingent consideration payable | | | 238 | | | | 534 | |
| | |
| | | | 238 | | | | 534 | |
The contingent consideration relates to the amount payable for the acquisition in 2015 of the Novartis Vaccines portfolio. The current year liability is included within ‘Trade and other payables’.
K) Share capital and share premium account
| | | | | | | | | | | | |
| | | Ordinary Shares of 25p each | | | Share premium account | |
| | | Number | | | £m | | | £m | |
Share capital authorised | | | | | | | | | | | | |
| | | |
At 31 December 2016 | | | 10,000,000,000 | | | | 2,500 | | | | | |
| | | |
At 31 December 2017 | | | 10,000,000,000 | | | | 2,500 | | | | | |
Share capital issued and fully paid | | | | | | | | | | | | |
| | | |
At 1 January 2016 | | | 5,361,307,647 | | | | 1,340 | | | | 2,831 | |
| | | |
Issued under employee share schemes | | | 7,008,415 | | | | 2 | | | | 87 | |
| | | |
Treasury shares transferred to the ESOP Trust | | | – | | | | – | | | | 36 | |
At 31 December 2016 | | | 5,368,316,062 | | | | 1,342 | | | | 2,954 | |
| | | |
Issued under employee share schemes | | | 4,237,758 | | | | 1 | | | | 55 | |
| | | |
Treasury shares transferred to the ESOP Trust | | | – | | | | – | | | | 10 | |
At 31 December 2017 | | | 5,372,553,820 | | | | 1,343 | | | | 3,019 | |
| | | |
| | | | | | | | | | | | |
| | | 31 December
2017
000 | | | | | | 31 December
2016
000 | |
Number of shares issuable under employee share schemes | | | 38,647 | | | | | | | | 71,382 | |
Number of unissued shares not under option | | | 4,588,799 | | | | | | | | 4,560,302 | |
At 31 December 2017, of the issued share capital, 66,696,677 shares were held in the ESOP Trusts, 414,605,950 shares were held as Treasury shares and 4,891,251,193 shares were in free issue. All issued shares are fully paid. The nominal, carrying and market values of the shares held in the ESOP Trusts are disclosed in Note 43, ‘Employee share schemes’.
L) Retained earnings
The profit of GlaxoSmithKline plc for the year was £9,893 million (2016 – £111 million loss), which after dividends of £3,906 million (2016 – £4,850 million), gave a retained profit of £5,987 million (2016 – £4,961 million loss). No Treasury shares were purchased in the year (2016 – £nil). After the effect of the £581 million Treasury shares transferred to a subsidiary company (2016 – £466 million), retained earnings at 31 December 2017 stood at £22,106 million (2016 – £15,538 million), of which £4,096 million was unrealised (2016 – £4,096 million). In addition, the £10 billion dividend received by the company during 2017 will not be distributable until after the 2017 Annual Report is filed during April 2018.
M) Group companies
See pages 276 to 286 for a complete list of subsidiaries, associates and joint ventures, which forms part of these financial statements.
| | | | |
243 | | |
| GSK Annual Report 2017 | | Strategic report | | |
| | | Governance and remuneration | | |
| | | Financial statements | | |
| | | Investor information | | |
| | |
| | |
| 244 | | |
GSK Annual Report 2017 | | |
| | |
| | |
Financial record
Quarterly trend
An unaudited analysis of the Group results is provided by quarter in Sterling for the financial year 2017.
Income statement – Total
| | | | | | | | | | | | | | | | | | | | | | | | | | | | | | | | |
| | | | | | 12 months 2017 | | | | | | Q4 2017 | |
| | | | | | | | | | | | Reported | | | | | | | | | | | | Reported | |
| | | | | | £m | | | £% | | | CER% | | | | | | £m | | | £% | | | CER% | |
| | | | | | | | |
Turnover | | | | | | | | | | | | | | | | | | | | | | | | | | | | | | | | |
| | | | | | | | |
Pharmaceuticals | | | | | | | 17,276 | | | | 7 | | | | 3 | | | | | | | | 4,540 | | | | (1 | ) | | | 3 | |
| | | | | | | | |
Vaccines | | | | | | | 5,160 | | | | 12 | | | | 6 | | | | | | | | 1,208 | | | | 6 | | | | 9 | |
| | | | | | | | |
Consumer Healthcare | | | | | | | 7,750 | | | | 8 | | | | 2 | | | | | | | | 1,891 | | | | 1 | | | | 4 | |
| | | | | | | | |
Total turnover | | | | | | | 30,186 | | | | 8 | | | | 3 | | | | | | | | 7,639 | | | | 1 | | | | 4 | |
| | | | | | | | |
Cost of sales | | | | | | | (10,342 | ) | | | 11 | | | | 8 | | | | | | | | (2,558 | ) | | | 2 | | | | 4 | |
| | | | | | | | |
Selling, general and administration | | | | | | | (9,672 | ) | | | 3 | | | | (1 | ) | | | | | | | (2,533 | ) | | | (7 | ) | | | (3 | ) |
| | | | | | | | |
Research and development | | | | | | | (4,476 | ) | | | 23 | | | | 19 | | | | | | | | (1,209 | ) | | | 21 | | | | 24 | |
| | | | | | | | |
Royalty income | | | | | | | 356 | | | | (11 | ) | | | (13 | ) | | | | | | | 69 | | | | (41 | ) | | | (39 | ) |
| | | | | | | | |
Other operating income/(expense) | | | | | | | (1,965 | ) | | | | | | | | | | | | | | | (896 | ) | | | | | | | | |
| | | | | | | | |
Operating profit/(loss) | | | | | | | 4,087 | | | | 57 | | | | 39 | | | | | | | | 512 | | | | (14 | ) | | | (4 | ) |
| | | | | | | | |
Net finance costs | | | | | | | (669 | ) | | | | | | | | | | | | | | | (138 | ) | | | | | | | | |
| | | | | | | | |
Profit on disposal of associates | | | | | | | 94 | | | | | | | | | | | | | | | | 66 | | | | | | | | | |
| | | | | | | | |
Share of after tax profits/(losses) of associates and joint ventures | | | | | | | 13 | | | | | | | | | | | | | | | | 2 | | | | | | | | | |
| | | | | | | | |
Profit/(loss) before taxation | | | | | | | 3,525 | | | | 82 | | | | 58 | | | | | | | | 442 | | | | 4 | | | | 17 | |
| | | | | | | | |
Taxation | | | | | | | (1,356 | ) | | | | | | | | | | | | | | | (805 | ) | | | | | | | | |
| | | | | | | | |
Tax rate % | | | | | | | 38.5 | % | | | | | | | | | | | | | | | >100 | % | | | | | | | | |
| | | | | | | | | |
Profit/(loss) after taxation for the period | | | | | | | 2,169 | | | | >100 | | | | 71 | | | | | | | | (363 | ) | | | >(100 | ) | | | >(100 | ) |
| | | | | | | | |
Profit attributable to non-controlling interests | | | | | | | 637 | | | | | | | | | | | | | | | | 183 | | | | | | | | | |
| | | | | | | | |
Profit/(loss) attributable to shareholders | | | | | | | 1,532 | | | | | | | | | | | | | | | | (546 | ) | | | | | | | | |
| | | | | | | | |
Basic earnings/(loss) per share (pence) | | | | | | | 31.4 | p | | | 67 | | | | 36 | | | | | | | | (11.2 | )p | | | >(100 | ) | | | >(100 | ) |
| | | | | | | | |
Diluted earnings/(loss) per share (pence) | | | | | | | 31.0 | p | | | | | | | | | | | | | | | (11.2 | )p | | | | | | | | |
| | | | | | | | |
Income statement – Adjusted | | | | | | | | | | | | | | | | | | | | | | | | | | | | | | | | |
| | | | | | | | |
Total turnover | | | | | | | 30,186 | | | | 8 | | | | 3 | | | | | | | | 7,639 | | | | 1 | | | | 4 | |
| | | | | | | | |
Cost of sales | | | | | | | (8,771 | ) | | | 5 | | | | 1 | | | | | | | | (2,258 | ) | | | 3 | | | | 5 | |
| | | | | | | | |
Selling, general and administration | | | | | | | (9,341 | ) | | | 6 | | | | 1 | | | | | | | | (2,420 | ) | | | (2 | ) | | | 2 | |
| | | | | | | | |
Research and development | | | | | | | (3,862 | ) | | | 11 | | | | 8 | | | | | | | | (992 | ) | | | (2 | ) | | | – | |
| | | | | | | | |
Royalty income | | | | | | | 356 | | | | (11 | ) | | | (13 | ) | | | | | | | 69 | | | | (41 | ) | | | (39 | ) |
| | | | | | | | |
Operating profit | | | | | | | 8,568 | | | | 12 | | | | 5 | | | | | | | | 2,038 | | | | 1 | | | | 5 | |
| | | | | | | | |
Net finance costs | | | | | | | (657 | ) | | | | | | | | | | | | | | | (135 | ) | | | | | | | | |
| | | | | | | | |
Share of after tax profits/(losses) of associates and joint ventures | | | | | | | 13 | | | | | | | | | | | | | | | | 2 | | | | | | | | | |
| | | | | | | | |
Profit before taxation | | | | | | | 7,924 | | | | 13 | | | | 5 | | | | | | | | 1,905 | | | | 3 | | | | 7 | |
| | | | | | | | |
Taxation | | | | | | | (1,667 | ) | | | | | | | | | | | | | | | (381 | ) | | | | | | | | |
| | | | | | | | |
Tax rate % | | | | | | | 21.0 | % | | | | | | | | | | | | | | | 20.0 | % | | | | | | | | |
| | | | | | | | |
Profit after taxation for the period | | | | | | | 6,257 | | | | 13 | | | | 6 | | | | | | | | 1,524 | | | | 5 | | | | 9 | |
| | | | | | | | |
Profit attributable to non-controlling interests | | | | | | | 793 | | | | | | | | | | | | | | | | 192 | | | | | | | | | |
| | | | | | | | |
Profit attributable to shareholders | | | | | | | 5,464 | | | | | | | | | | | | | | | | 1,332 | | | | | | | | | |
| | | | | | | | |
Adjusted earnings per share (pence) | | | | | | | 111.8 | p | | | 11 | | | | 4 | | | | | | | | 27.2 | p | | | 7 | | | | 11 | |
| > | The calculation of Adjusted results is described on page 58. |
| | | | |
| 245 | | |
| | | | | |
| GSK Annual Report 2017 | | Strategic report | | |
| | Governance and remuneration | | |
| | Financial statements | | |
| | Investor information | | |
Quarterly trendcontinued
| | | | | | | | | | | | | | | | | | | | | | | | | | | | | | | | | | | | | | | | | | |
Q3 2017 | | | | | | Q2 2017 | | | | | | Q1 2017 | |
| | | | | | | Reported | | | | | | | | | | | | Reported | | | | | | | | | | | | Reported | |
£m | | | £% | | | CER% | | | | | | £m | | | £% | | | CER% | | | | | | £m | | | £% | | | CER% | |
| | | | | | | | | | |
| | 4,190 | | | | 3 | | | | 2 | | | | | | | | 4,357 | | | | 12 | | | | 3 | | | | | | | | 4,189 | | | | 17 | | | | 4 | |
| | | | | | | | | | |
| | 1,689 | | | | 5 | | | | – | | | | | | | | 1,111 | | | | 16 | | | | 5 | | | | | | | | 1,152 | | | | 31 | | | | 16 | |
| | | | | | | | | | |
| | 1,964 | | | | 5 | | | | 2 | | | | | | | | 1,852 | | | | 10 | | | | – | | | | | | | | 2,043 | | | | 16 | | | | 2 | |
| | | | | | | | | | |
| | 7,843 | | | | 4 | | | | 2 | | | | | | | | 7,320 | | | | 12 | | | | 3 | | | | | | | | 7,384 | | | | 19 | | | | 5 | |
| | | | | | | | | | |
| | (2,652 | ) | | | 5 | | | | 3 | | | | | | | | (2,619 | ) | | | 23 | | | | 16 | | | | | | | | (2,513 | ) | | | 18 | | | | 8 | |
| | | | | | | | | | |
| | (2,308 | ) | | | 1 | | | | (2 | ) | | | | | | | (2,379 | ) | | | 9 | | | | – | | | | | | | | (2,452 | ) | | | 12 | | | | (1 | ) |
| | | | | | | | | | |
| | (1,047 | ) | | | 14 | | | | 11 | | | | | | | | (1,260 | ) | | | 42 | | | | 34 | | | | | | | | (960 | ) | | | 18 | | | | 7 | |
| | | | | | | | | | |
| | 107 | | | | – | | | | (3 | ) | | | | | | | 98 | | | | 18 | | | | 12 | | | | | | | | 82 | | | | (10 | ) | | | (15 | ) |
| | | | | | | | | | |
| | (66 | ) | | | | | | | | | | | | | | | (1,180 | ) | | | | | | | | | | | | | | | 177 | | | | | | | | | |
| | | | | | | | | | |
| | 1,877 | | | | 31 | | | | 27 | | | | | | | | (20 | ) | | | 87 | | | | (45 | ) | | | | | | | 1,718 | | | | >100 | | | | 100 | |
| | | | | | | | | | |
| | (181 | ) | | | | | | | | | | | | | | | (177 | ) | | | | | | | | | | | | | | | (173 | ) | | | | | | | | |
| | | | | | | | | | |
| | 8 | | | | | | | | | | | | | | | | 20 | | | | | | | | | | | | | | | | – | | | | | | | | | |
| | | | | | | | | | |
| | 7 | | | | | | | | | | | | | | | | (1 | ) | | | | | | | | | | | | | | | 5 | | | | | | | | | |
| | | | | | | | | | |
| | 1,711 | | | | 34 | | | | 30 | | | | | | | | (178 | ) | | | 44 | | | | (18 | ) | | | | | | | 1,550 | | | | >100 | | | | >100 | |
| | | | | | | | | | |
| | (316 | ) | | | | | | | | | | | | | | | 92 | | | | | | | | | | | | | | | | (327 | ) | | | | | | | | |
| | | | | | | | | | |
| | 18.5 | % | | | | | | | | | | | | | | | 51.7 | % | | | | | | | | | | | | | | | 21.1 | % | | | | | | | | |
| | | | | | | | | | |
| | 1,395 | | | | 58 | | | | 53 | | | | | | | | (86 | ) | | | 83 | | | | 50 | | | | | | | | 1,223 | | | | >100 | | | | >100 | |
| | | | | | | | | | |
| | 183 | | | | | | | | | | | | | | | | 94 | | | | | | | | | | | | | | | | 177 | | | | | | | | | |
| | | | | | | | | | |
| | 1,212 | | | | | | | | | | | | | | | | (180 | ) | | | | | | | | | | | | | | | 1,046 | | | | | | | | | |
| | | | | | | | | | |
| | 24.8 | p | | | 49 | | | | 46 | | | | | | | | (3.7 | )p | | | 59 | | | | 29 | | | | | | | | 21.4 | p | | | >100 | | | | >100 | |
| | | | | | | | | | |
| | 24.6 | p | | | | | | | | | | | | | | | (3.7 | )p | | | | | | | | | | | | | | | 21.3 | p | | | | | | | | |
| | | | | | | | | | |
| | | | | | | | | | | | | | | | | | | | | | | | | | | | | | | | | | | | | | | | | | | |
| | | | | | | | | | |
| | 7,843 | | | | 4 | | | | 2 | | | | | | | | 7,320 | | | | 12 | | | | 3 | | | | | | | | 7,384 | | | | 19 | | | | 5 | |
| | | | | | | | | | |
| | (2,304 | ) | | | 1 | | | | (2 | ) | | | | | | | (1,988 | ) | | | 3 | | | | (2 | ) | | | | | | | (2,221 | ) | | | 15 | | | | 5 | |
| | | | | | | | | | |
| | (2,280 | ) | | | 4 | | | | 2 | | | | | | | | (2,294 | ) | | | 11 | | | | 2 | | | | | | | | (2,347 | ) | | | 13 | | | | – | |
| | | | | | | | | | |
| | (898 | ) | | | 3 | | | | 1 | | | | | | | | (1,053 | ) | | | 32 | | | | 24 | | | | | | | | (919 | ) | | | 19 | | | | 8 | |
| | | | | | | | | | |
| | 107 | | | | – | | | | (3 | ) | | | | | | | 98 | | | | 18 | | | | 12 | | | | | | | | 82 | | | | (10 | ) | | | (15 | ) |
| | | | | | | | | | |
| | 2,468 | | | | 7 | | | | 5 | | | | | | | | 2,083 | | | | 14 | | | | – | | | | | | | | 1,979 | | | | 30 | | | | 9 | |
| | | | | | | | | | |
| | (177 | ) | | | | | | | | | | | | | | | (176 | ) | | | | | | | | | | | | | | | (169 | ) | | | | | | | | |
| | | | | | | | | | |
| | 7 | | | | | | | | | | | | | | | | (1 | ) | | | | | | | | | | | | | | | 5 | | | | | | | | | |
| | | | | | | | | | |
| | 2,298 | | | | 7 | | | | 5 | | | | | | | | 1,906 | | | | 15 | | | | – | | | | | | | | 1,815 | | | | 33 | | | | 11 | |
| | | | | | | | | | |
| | (482 | ) | | | | | | | | | | | | | | | (405 | ) | | | | | | | | | | | | | | | (399 | ) | | | | | | | | |
| | | | | | | | | | |
| | 21.0 | % | | | | | | | | | | | | | | | 21.2 | % | | | | | | | | | | | | | | | 22.0 | % | | | | | | | | |
| | | | | | | | | | |
| | 1,816 | | | | 7 | | | | 4 | | | | | | | | 1,501 | | | | 15 | | | | – | | | | | | | | 1,416 | | | | 32 | | | | 10 | |
| | | | | | | | | | |
| | 228 | | | | | | | | | | | | | | | | 174 | | | | | | | | | | | | | | | | 199 | | | | | | | | | |
| | | | | | | | | | |
| | 1,588 | | | | | | | | | | | | | | | | 1,327 | | | | | | | | | | | | | | | | 1,217 | | | | | | | | | |
| | | | | | | | | | |
| | 32.5 | p | | | 3 | | | | – | | | | | | | | 27.2 | p | | | 12 | | | | (2 | ) | | | | | | | 25.0 | p | | | 31 | | | | 9 | |
| | |
| 246 | | |
GSK Annual Report 2017 | | |
| | |
| | |
Financial recordcontinued
Pharmaceutical turnover by therapeutic area 2017
| | | | | | | | | | | | | | | | | | | | | | | | | | | | | | | | | | | | | | | | | | | | | | | | | | | | | | | | | | |
| | | Total | | | | | | US | | | | | | Europe | | | | | | International | |
| | | 2017 | | |
| 2016
(revised) |
| | | | | | | Growth | | | | | | 2017 | | | | | | | | Growth | | | | | | 2017 | | | | | | | | Growth | | | | | | 2017 | | | | | | | | Growth | |
| Therapeutic area/major products | | | £m | | | | £m | | | | £% | | | | CER% | | | | | | £m | | | | £% | | | | CER% | | | | | | £m | | | | £% | | | | CER% | | | | | | £m | | | | £% | | | | CER% | |
Respiratory | | | 6,991 | | | | 6,510 | | | | 7 | | | | 3 | | | | | | 3,556 | | | | 8 | | | | 3 | | | | | | 1,458 | | | | 5 | | | | – | | | | | | 1,977 | | | | 9 | | | | 5 | |
| Anoro Ellipta | | | 342 | | | | 201 | | | | 70 | | | | 63 | | | | | | 234 | | | | 68 | | | | 61 | | | | | | 69 | | | | 77 | | | | 67 | | | | | | 39 | | | | 70 | | | | 65 | |
| Arnuity Ellipta | | | 35 | | | | 15 | | | | >100 | | | | >100 | | | | | | 32 | | | | >100 | | | | >100 | | | | | | – | | | | – | | | | – | | | | | | 3 | | | | >100 | | | | >100 | |
| Avamys/Veramyst | | | 281 | | | | 277 | | | | 1 | | | | (4 | ) | | | | | 1 | | | | (96 | ) | | | (96 | ) | | | | | 76 | | | | 3 | | | | (3 | ) | | | | | 204 | | | | 15 | | | | 9 | |
| Flixotide/Flovent | | | 596 | | | | 637 | | | | (6 | ) | | | (10 | ) | | | | | 323 | | | | (15 | ) | | | (18 | ) | | | | | 95 | | | | 1 | | | | (5 | ) | | | | | 178 | | | | 8 | | | | 5 | |
| Incruse Ellipta | | | 201 | | | | 114 | | | | 76 | | | | 68 | | | | | | 134 | | | | 56 | | | | 49 | | | | | | 51 | | | | >100 | | | | >100 | | | | | | 16 | | | | >100 | | | | >100 | |
| Nucala | | | 344 | | | | 102 | | | | >100 | | | | >100 | | | | | | 236 | | | | >100 | | | | >100 | | | | | | 70 | | | | >100 | | | | >100 | | | | | | 38 | | | | >100 | | | | >100 | |
| Relvar/Breo Ellipta | | | 1,006 | | | | 620 | | | | 62 | | | | 55 | | | | | | 602 | | | | 75 | | | | 67 | | | | | | 202 | | | | 44 | | | | 36 | | | | | | 202 | | | | 49 | | | | 42 | |
| Seretide/Advair | | | 3,130 | | | | 3,485 | | | | (10 | ) | | | (14 | ) | | | | | 1,610 | | | | (12 | ) | | | (16 | ) | | | | | 736 | | | | (12 | ) | | | (17 | ) | | | | | 784 | | | | (5 | ) | | | (8 | ) |
| Trelegy Ellipta | | | 2 | | | | – | | | | – | | | | – | | | | | | 2 | | | | – | | | | – | | | | | | – | | | | – | | | | – | | | | | | – | | | | – | | | | – | |
| Ventolin | | | 767 | | | | 785 | | | | (2 | ) | | | (6 | ) | | | | | 380 | | | | (10 | ) | | | (14 | ) | | | | | 132 | | | | 4 | | | | (2 | ) | | | | | 255 | | | | 8 | | | | 5 | |
Other | | | 287 | | | | 274 | | | | 5 | | | | 3 | | | | | | 2 | | | | >(100 | ) | | | 3 | | | | | | 27 | | | | (4 | ) | | | (4 | ) | | | | | 258 | | | | 4 | | | | 3 | |
HIV | | | 4,350 | | | | 3,556 | | | | 22 | | | | 16 | | | | | | 2,697 | | | | 26 | | | | 21 | | | | | | 1,114 | | | | 10 | | | | 3 | | | | | | 539 | | | | 33 | | | | 26 | |
| Epzicom/Kivexa | | | 234 | | | | 568 | | | | (59 | ) | | | (61 | ) | | | | | 27 | | | | (86 | ) | | | (87 | ) | | | | | 114 | | | | (54 | ) | | | (57 | ) | | | | | 93 | | | | (22 | ) | | | (25 | ) |
| Juluca | | | 5 | | | | – | | | | – | | | | – | | | | | | 5 | | | | – | | | | – | | | | | | – | | | | – | | | | – | | | | | | – | | | | – | | | | – | |
| Selzentry | | | 128 | | | | 125 | | | | 2 | | | | (2 | ) | | | | | 66 | | | | – | | | | (5 | ) | | | | | 42 | | | | 1 | | | | (4 | ) | | | | | 20 | | | | 15 | | | | 11 | |
| Tivicay | | | 1,404 | | | | 953 | | | | 47 | | | | 40 | | | | | | 923 | | | | 44 | | | | 38 | | | | | | 315 | | | | 39 | | | | 30 | | | | | | 166 | | | | 95 | | | | 88 | |
| Triumeq | | | 2,461 | | | | 1,735 | | | | 42 | | | | 35 | | | | | | 1,632 | | | | 40 | | | | 34 | | | | | | 606 | | | | 39 | | | | 31 | | | | | | 223 | | | | 66 | | | | 58 | |
Other | | | 118 | | | | 175 | | | | (32 | ) | | | (37 | ) | | | | | 44 | | | | (28 | ) | | | (31 | ) | | | | | 37 | | | | (41 | ) | | | (44 | ) | | | | | 37 | | | | (28 | ) | | | (35 | ) |
Immuno-inflammation | | | 377 | | | | 340 | | | | 11 | | | | 6 | | | | | | 339 | | | | 9 | | | | 5 | | | | | | 27 | | | | 29 | | | | 24 | | | | | | 11 | | | | 37 | | | | – | |
| Benlysta | | | 375 | | | | 306 | | | | 23 | | | | 17 | | | | | | 338 | | | | 22 | | | | 17 | | | | | | 27 | | | | 29 | | | | 19 | | | | | | 10 | | | | 26 | | | | 26 | |
Other | | | 2 | | | | 34 | | | | (95 | ) | | | (99 | ) | | | | | 1 | | | | (98 | ) | | | (96 | ) | | | | | – | | | | – | | | | – | | | | | | 1 | | | | – | | | | – | |
Established pharmaceuticals | | | 5,558 | | | | 5,698 | | | | (2 | ) | | | (5 | ) | | | | | 976 | | | | (10 | ) | | | (14 | ) | | | | | 1,384 | | | | (5 | ) | | | (11 | ) | | | | | 3,198 | | | | 2 | | | | – | |
| Dermatology | | | 456 | | | | 393 | | | | 16 | | | | 11 | | | | | | 7 | | | | (56 | ) | | | (56 | ) | | | | | 162 | | | | 11 | | | | 5 | | | | | | 287 | | | | 24 | | | | 20 | |
| Augmentin | | | 587 | | | | 563 | | | | 4 | | | | 2 | | | | | | – | | | | – | | | | – | | | | | | 182 | | | | 3 | | | | (4 | ) | | | | | 405 | | | | 5 | | | | 5 | |
| Avodart | | | 613 | | | | 635 | | | | (3 | ) | | | (9 | ) | | | | | 15 | | | | (79 | ) | | | (79 | ) | | | | | 297 | | | | (6 | ) | | | (12 | ) | | | | | 301 | | | | 21 | | | | 16 | |
| Coreg | | | 134 | | | | 131 | | | | 2 | | | | (2 | ) | | | | | 134 | | | | 2 | | | | (2 | ) | | | | | – | | | | – | | | | – | | | | | | – | | | | – | | | | – | |
| Eperzan/Tanzeum | | | 87 | | | | 121 | | | | (28 | ) | | | (31 | ) | | | | | 83 | | | | (30 | ) | | | (32 | ) | | | | | 3 | | | | – | | | | – | | | | | | 1 | | | | >(100 | ) | | | (100 | ) |
| Imigran/Imitrex | | | 168 | | | | 177 | | | | (5 | ) | | | (8 | ) | | | | | 77 | | | | (9 | ) | | | (12 | ) | | | | | 65 | | | | 5 | | | | – | | | | | | 26 | | | | (13 | ) | | | (17 | ) |
| Lamictal | | | 650 | | | | 614 | | | | 6 | | | | 1 | | | | | | 332 | | | | 6 | | | | 1 | | | | | | 107 | | | | 1 | | | | (5 | ) | | | | | 211 | | | | 8 | | | | 5 | |
| Requip | | | 110 | | | | 116 | | | | (5 | ) | | | (9 | ) | | | | | 12 | | | | (8 | ) | | | (15 | ) | | | | | 29 | | | | (3 | ) | | | (13 | ) | | | | | 69 | | | | (5 | ) | | | (5 | ) |
| Serevent | | | 96 | | | | 96 | | | | – | | | | (4 | ) | | | | | 52 | | | | 6 | | | | 2 | | | | | | 33 | | | | (6 | ) | | | (11 | ) | | | | | 11 | | | | (8 | ) | | | (8 | ) |
| Seroxat/Paxil | | | 184 | | | | 206 | | | | (11 | ) | | | (14 | ) | | | | | – | | | | – | | | | – | | | | | | 39 | | | | (3 | ) | | | (8 | ) | | | | | 145 | | | | (4 | ) | | | (7 | ) |
| Valtrex | | | 128 | | | | 118 | | | | 8 | | | | 3 | | | | | | 20 | | | | 25 | | | | 19 | | | | | | 29 | | | | 16 | | | | 12 | | | | | | 79 | | | | 3 | | | | (3 | ) |
| Zeffix | | | 89 | | | | 111 | | | | (20 | ) | | | (22 | ) | | | | | 1 | | | | (50 | ) | | | (50 | ) | | | | | 6 | | | | (14 | ) | | | (29 | ) | | | | | 82 | | | | (20 | ) | | | (21 | ) |
| Other | | | 2,256 | | | | 2,417 | | | | (7 | ) | | | (8 | ) | | | | | 243 | | | | (7 | ) | | | (11 | ) | | | | | 432 | | | | (16 | ) | | | (21 | ) | | | | | 1,581 | | | | (4 | ) | | | (4 | ) |
Pharmaceuticals | | | 17,276 | | | | 16,104 | | | | 7 | | | | 3 | | | | | | 7,568 | | | | 11 | | | | 6 | | | | | | 3,983 | | | | 3 | | | | (3 | ) | | | | | 5,725 | | | | 6 | | | | 4 | |
| | | | | | | | | | | | | | | | | | | | | | | | | | | | | | | | | | | | | | | | | | | | | | | | | | | | | | | | | | |
Vaccines turnover 2017 | | | | | | | | | | | | | | | | | | | | | | | | | | | | | | | | | | | | | | | |
| | | Total | | | | | | US | | | | | | Europe | | | | | | International | |
| | | 2017 | | |
| 2016
(revised) |
| | | | | | | Growth | | | | | | 2017 | | | | | | | | Growth | | | | | | 2017 | | | | | | | | Growth | | | | | | 2017 | | | | | | | | Growth | |
| Major products | | | £m | | | | £m | | | | £% | | | | CER% | | | | | | £m | | | | £% | | | | CER% | | | | | | £m | | | | £% | | | | CER% | | | | | | £m | | | | £% | | | | CER% | |
Meningitis | | | 890 | | | | 662 | | | | 34 | | | | 27 | | | | | | 339 | | | | 40 | | | | 34 | | | | | | 391 | | | | 40 | | | | 31 | | | | | | 160 | | | | 15 | | | | 6 | |
| Bexsero | | | 556 | | | | 390 | | | | 43 | | | | 34 | | | | | | 152 | | | | 25 | | | | 20 | | | | | | 342 | | | | 45 | | | | 36 | | | | | | 62 | | | | 94 | | | | 75 | |
| Menveo | | | 274 | | | | 202 | | | | 36 | | | | 29 | | | | | | 187 | | | | 55 | | | | 48 | | | | | | 34 | | | | 26 | | | | 19 | | | | | | 53 | | | | (2 | ) | | | (7 | ) |
Other | | | 60 | | | | 70 | | | | (14 | ) | | | (20 | ) | | | | | – | | | | – | | | | – | | | | | | 15 | | | | (12 | ) | | | (18 | ) | | | | | 45 | | | | (15 | ) | | | (21 | ) |
Influenza | | | 488 | | | | 414 | | | | 18 | | | | 12 | | | | | | 361 | | | | 15 | | | | 10 | | | | | | 49 | | | | 53 | | | | 44 | | | | | | 78 | | | | 16 | | | | 9 | |
Fluarix, FluLaval | | | 488 | | | | 414 | | | | 18 | | | | 12 | | | | | | 361 | | | | 15 | | | | 10 | | | | | | 49 | | | | 53 | | | | 44 | | | | | | 78 | | | | 16 | | | | 9 | |
Shingles | | | 22 | | | | – | | | | – | | | | – | | | | | | 22 | | | | – | | | | – | | | | | | – | | | | – | | | | – | | | | | | – | | | | – | | | | – | |
Shingrix | | | 22 | | | | – | | | | – | | | | – | | | | | | 22 | | | | – | | | | – | | | | | | – | | | | – | | | | – | | | | | | – | | | | – | | | | – | |
Established vaccines | | | 3,760 | | | | 3,516 | | | | 7 | | | | 1 | | | | | | 1,147 | | | | 10 | | | | 5 | | | | | | 1,160 | | | | 4 | | | | (2 | ) | | | | | 1,453 | | | | 7 | | | | 1 | |
| Infanrix, Pediarix | | | 743 | | | | 769 | | | | (3 | ) | | | (8 | ) | | | | | 330 | | | | (2 | ) | | | (7 | ) | | | | | 315 | | | | (6 | ) | | | (11 | ) | | | | | 98 | | | | 2 | | | | (4 | ) |
| Boostrix | | | 560 | | | | 470 | | | | 19 | | | | 13 | | | | | | 262 | | | | 10 | | | | 5 | | | | | | 185 | | | | 33 | | | | 24 | | | | | | 113 | | | | 22 | | | | 14 | |
| Hepatitis | | | 693 | | | | 602 | | | | 15 | | | | 10 | | | | | | 379 | | | | 29 | | | | 23 | | | | | | 201 | | | | 2 | | | | (4 | ) | | | | | 113 | | | | 2 | | | | (2 | ) |
| Rotarix | | | 524 | | | | 469 | | | | 12 | | | | 6 | | | | | | 132 | | | | 2 | | | | (2 | ) | | | | | 95 | | | | 27 | | | | 19 | | | | | | 297 | | | | 12 | | | | 6 | |
| Synflorix | | | 509 | | | | 504 | | | | 1 | | | | (6 | ) | | | | | – | | | | – | | | | – | | | | | | 67 | | | | (1 | ) | | | (7 | ) | | | | | 442 | | | | 1 | | | | (5 | ) |
| Priorix, Priorix Tetra, Varilrix | | | 301 | | | | 300 | | | | – | | | | (5 | ) | | | | | – | | | | – | | | | – | | | | | | 164 | | | | 8 | | | | 1 | | | | | | 137 | | | | (8 | ) | | | (12 | ) |
| Cervarix | | | 134 | | | | 81 | | | | 65 | | | | 57 | | | | | | – | | | | – | | | | – | | | | | | 29 | | | | (12 | ) | | | (18 | ) | | | | | 105 | | | | >100 | | | | >100 | |
Other | | | 296 | | | | 321 | | | | (8 | ) | | | (13 | ) | | | | | 44 | | | | 8 | | | | – | | | | | | 104 | | | | (7 | ) | | | (11 | ) | | | | | 148 | | | | (12 | ) | | | (17 | ) |
Vaccines | | | 5,160 | | | | 4,592 | | | | 12 | | | | 6 | | | | | | 1,869 | | | | 17 | | | | 12 | | | | | | 1,600 | | | | 12 | | | | 6 | | | | | | 1,691 | | | | 8 | | | | 1 | |
£% represents growth at actual exchange rates. CER% represents growth at constant exchange rates.
| | | | |
| 247 | | |
| | | | | |
| GSK Annual Report 2017 | | Strategic report | | |
| | Governance and remuneration | | |
| | Financial statements | | |
| | Investor information | | |
Pharmaceutical turnover by therapeutic area 2016
| | | | | | | | | | | | | | | | | | | | | | | | | | | | | | | | | | | | | | | | | | | | | | | | | | | | | | | | | | |
| | | Total | | | | | | US | | | | | | Europe | | | | | | International | |
| | | 2016 | | | 2015
(revised) | | | | | | Growth | | | | | 2016 | | | | | | Growth | | | | | 2016 | | | | | | Growth | | | | | 2016 | | | | | | Growth | |
Therapeutic area/major products | | | £m | | | | £m | | | | £% | | | | CER% | | | | | | £m | | | | £% | | | | CER% | | | | | | £m | | | | £% | | | | CER% | | | | | | £m | | | | £% | | | | CER% | |
Respiratory | | | 6,510 | | | | 5,741 | | | | 13 | | | | 2 | | | | | | 3,306 | | | | 20 | | | | 7 | | | | | | 1,383 | | | | (2 | ) | | | (10 | ) | | | | | 1,821 | | | | 16 | | | | 3 | |
Anoro Ellipta | | | 201 | | | | 79 | | | | >100 | | | | >100 | | | | | | 139 | | | | >100 | | | | >100 | | | | | | 39 | | | | >100 | | | | >100 | | | | | | 23 | | | | >100 | | | | >100 | |
Arnuity Ellipta | | | 15 | | | | 3 | | | | >100 | | | | >100 | | | | | | 14 | | | | >100 | | | | >100 | | | | | | – | | | | – | | | | – | | | | | | 1 | | | | >100 | | | | (100 | ) |
Avamys/Veramyst | | | 277 | | | | 229 | | | | 21 | | | | 8 | | | | | | 25 | | | | – | | | | (12 | ) | | | | | 74 | | | | 12 | | | | 2 | | | | | | 178 | | | | 29 | | | | 15 | |
Flixotide/Flovent | | | 637 | | | | 623 | | | | 2 | | | | (8 | ) | | | | | 378 | | | | – | | | | (11 | ) | | | | | 94 | | | | 2 | | | | (8 | ) | | | | | 165 | | | | 9 | | | | – | |
Incruse Ellipta | | | 114 | | | | 14 | | | | >100 | | | | >100 | | | | | | 86 | | | | >100 | | | | >100 | | | | | | 23 | | | | >100 | | | | >100 | | | | | | 5 | | | | >100 | | | | >100 | |
Nucala | | | 102 | | | | 1 | | | | >100 | | | | >100 | | | | | | 71 | | | | >100 | | | | >100 | | | | | | 23 | | | | >100 | | | | >100 | | | | | | 8 | | | | – | | | | – | |
Relvar/Breo Ellipta | | | 620 | | | | 257 | | | | >100 | | | | >100 | | | | | | 344 | | | | >100 | | | | >100 | | | | | | 140 | | | | 75 | | | | 60 | | | | | | 136 | | | | 97 | | | | 67 | |
Seretide/Advair | | | 3,485 | | | | 3,681 | | | | (5 | ) | | | (15 | ) | | | | | 1,829 | | | | (2 | ) | | | (13 | ) | | | | | 835 | | | | (18 | ) | | | (24 | ) | | | | | 821 | | | | 2 | | | | (7 | ) |
Ventolin | | | 785 | | | | 620 | | | | 27 | | | | 15 | | | | | | 421 | | | | 38 | | | | 23 | | | | | | 127 | | | | 9 | | | | 1 | | | | | | 237 | | | | 19 | | | | 12 | |
Other | | | 274 | | | | 234 | | | | 17 | | | | (1 | ) | | | | | (1 | ) | | | 34 | | | | (100 | ) | | | | | 28 | | | | 5 | | | | (3 | ) | | | | | 247 | | | | 19 | | | | (2 | ) |
HIV | | | 3,556 | | | | 2,322 | | | | 53 | | | | 37 | | | | | | 2,132 | | | | 64 | | | | 46 | | | | | | 1,017 | | | | 42 | | | | 29 | | | | | | 407 | | | | 34 | | | | 21 | |
Epzicom/Kivexa | | | 568 | | | | 698 | | | | (19 | ) | | | (27 | ) | | | | | 195 | | | | (23 | ) | | | (32 | ) | | | | | 251 | | | | (17 | ) | | | (25 | ) | | | | | 122 | | | | (13 | ) | | | (21 | ) |
Selzentry | | | 125 | | | | 124 | | | | 1 | | | | (9 | ) | | | | | 65 | | | | 10 | | | | (2 | ) | | | | | 41 | | | | (14 | ) | | | (22 | ) | | | | | 19 | | | | 11 | | | | 4 | |
Tivicay | | | 953 | | | | 588 | | | | 62 | | | | 45 | | | | | | 635 | | | | 65 | | | | 46 | | | | | | 228 | | | | 55 | | | | 40 | | | | | | 90 | | | | 62 | | | | 47 | |
Triumeq | | | 1,735 | | | | 730 | | | | >100 | | | | >100 | | | | | | 1,159 | | | | >100 | | | | >100 | | | | | | 434 | | | | >100 | | | | >100 | | | | | | 142 | | | | >100 | | | | >100 | |
Other | | | 175 | | | | 182 | | | | (4 | ) | | | (12 | ) | | | | | 78 | | | | (19 | ) | | | (28 | ) | | | | | 63 | | | | 50 | | | | 36 | | | | | | 34 | | | | (23 | ) | | | (24 | ) |
Immuno-inflammation | | | 340 | | | | 263 | | | | 29 | | | | 15 | | | | | | 311 | | | | 29 | | | | 14 | | | | | | 21 | | | | 40 | | | | 27 | | | | | | 8 | | | | 33 | | | | 17 | |
Benlysta | | | 306 | | | | 230 | | | | 33 | | | | 19 | | | | | | 277 | | | | 33 | | | | 18 | | | | | | 21 | | | | 40 | | | | 20 | | | | | | 8 | | | | 33 | | | | 33 | |
Other | | | 34 | | | | 33 | | | | 3 | | | | (9 | ) | | | | | 34 | | | | 3 | | | | (9 | ) | | | | | – | | | | – | | | | – | | | | | | – | | | | – | | | | – | |
Established pharmaceuticals | | | 5,698 | | | | 5,831 | | | | (2 | ) | | | (11 | ) | | | | | 1,088 | | | | (12 | ) | | | (21 | ) | | | | | 1,463 | | | | 4 | | | | (5 | ) | | | | | 3,147 | | | | (1 | ) | | | (9 | ) |
Dermatology | | | 393 | | | | 412 | | | | (5 | ) | | | (12 | ) | | | | | 16 | | | | (61 | ) | | | (63 | ) | | | | | 146 | | | | 6 | | | | (2 | ) | | | | | 231 | | | | (1 | ) | | | (9 | ) |
Augmentin | | | 563 | | | | 528 | | | | 7 | | | | – | | | | | | – | | | | – | | | | – | | | | | | 177 | | | | 4 | | | | (5 | ) | | | | | 386 | | | | 8 | | | | 2 | |
Avodart | | | 635 | | | | 657 | | | | (3 | ) | | | (14 | ) | | | | | 70 | | | | (58 | ) | | | (63 | ) | | | | | 317 | | | | 25 | | | | 13 | | | | | | 248 | | | | 5 | | | | (8 | ) |
Coreg | | | 131 | | | | 123 | | | | 7 | | | | (5 | ) | | | | | 131 | | | | 7 | | | | (5 | ) | | | | | – | | | | – | | | | – | | | | | | – | | | | – | | | | – | |
Eperzan/Tanzeum | | | 121 | | | | 41 | | | | >100 | | | | >100 | | | | | | 118 | | | | >100 | | | | >100 | | | | | | 3 | | | | >100 | | | | 100 | | | | | | – | | | | – | | | | – | |
Imigran/Imitrex | | | 177 | | | | 160 | | | | 11 | | | | 3 | | | | | | 85 | | | | 12 | | | | 8 | | | | | | 62 | | | | 11 | | | | 4 | | | | | | 30 | | | | 7 | | | | (11 | ) |
Lamictal | | | 614 | | | | 531 | | | | 16 | | | | 5 | | | | | | 313 | | | | 18 | | | | 5 | | | | | | 106 | | | | 10 | | | | 1 | | | | | | 195 | | | | 15 | | | | 9 | |
Requip | | | 116 | | | | 93 | | | | 25 | | | | 8 | | | | | | 13 | | | | >100 | | | | >100 | | | | | | 30 | | | | 3 | | | | (7 | ) | | | | | 73 | | | | 24 | | | | 3 | |
Serevent | | | 96 | | | | 93 | | | | 3 | | | | (6 | ) | | | | | 49 | | | | 14 | | | �� | – | | | | | | 35 | | | | (3 | ) | | | (11 | ) | | | | | 12 | | | | (14 | ) | | | (14 | ) |
Seroxat/Paxil | | | 206 | | | | 165 | | | | 25 | | | | 10 | | | | | | 15 | | | | >(100 | ) | | | (100 | ) | | | | | 40 | | | | 14 | | | | 6 | | | | | | 151 | | | | 6 | | | | (8 | ) |
Valtrex | | | 118 | | | | 165 | | | | (28 | ) | | | (37 | ) | | | | | 16 | | | | (20 | ) | | | (30 | ) | | | | | 25 | | | | 4 | | | | (4 | ) | | | | | 77 | | | | (36 | ) | | | (45 | ) |
Zeffix | | | 111 | | | | 134 | | | | (17 | ) | | | (24 | ) | | | | | 2 | | | | – | | | | – | | | | | | 7 | | | | – | | | | (14 | ) | | | | | 102 | | | | (18 | ) | | | (25 | ) |
Other | | | 2,417 | | | | 2,729 | | | | (11 | ) | | | (19 | ) | | | | | 260 | | | | (45 | ) | | | (51 | ) | | | | | 515 | | | | (9 | ) | | | (17 | ) | | | | | 1,642 | | | | (3 | ) | | | (10 | ) |
Pharmaceuticals | | | 16,104 | | | | 14,157 | | | | 14 | | | | 3 | | | | | | 6,837 | | | | 24 | | | | 10 | | | | | | 3,884 | | | | 9 | | | | – | | | | | | 5,383 | | | | 6 | | | | (3 | ) |
| | | | | | | | | | | | | | | | | | | | | | | | | | | | | | | | | | | | | | | | | | | | | | | | | | | | | | | | | | |
| Vaccines turnover 2016 | |
| | | | | | | | | | | | | | | Total | | | | | | | | | | | | | | US | | | | | | | | | | | | | | Europe | | | | | | | | | | International | |
| | | 2016 | | |
| 2015
(revised) |
| | | | | | | Growth | | | | | | 2016 | | | | | | | | Growth | | | | | | 2016 | | | | | | | | Growth | | | | | | 2016 | | | | | | | | Growth | |
Major products | | | £m | | | | £m | | | | £% | | | | CER% | | | | | | £m | | | | £% | | | | CER% | | | | | | £m | | | | £% | | | | CER% | | | | | | £m | | | | £% | | | | CER% | |
Meningitis | | | 662 | | | | 326 | | | | >100 | | | | 86 | | | | | | 243 | | | | >100 | | | | 85 | | | | | | 280 | | | | >100 | | | | 87 | | | | | | 139 | | | | 74 | | | | 69 | |
Bexsero | | | 390 | | | | 115 | | | | >100 | | | | >100 | | | | | | 122 | | | | >100 | | | | >100 | | | | | | 236 | | | | >100 | | | | >100 | | | | | | 32 | | | | >100 | | | | >100 | |
Menveo | | | 202 | | | | 160 | | | | 26 | | | | 16 | | | | | | 121 | | | | 22 | | | | 8 | | | | | | 27 | | | | (25 | ) | | | (31 | ) | | | | | 54 | | | | >100 | | | | >100 | |
Other | | | 70 | | | | 51 | | | | 37 | | | | 29 | | | | | | – | | | | – | | | | – | | | | | | 17 | | | | 13 | | | | – | | | | | | 53 | | | | 44 | | | | 39 | |
Influenza | | | 414 | | | | 268 | | | | 54 | | | | 38 | | | | | | 315 | | | | 60 | | | | 42 | | | | | | 32 | | | | 39 | | | | 26 | | | | | | 67 | | | | 40 | | | | 31 | |
Fluarix, FluLaval | | | 414 | | | | 268 | | | | 54 | | | | 38 | | | | | | 315 | | | | 60 | | | | 42 | | | | | | 32 | | | | 39 | | | | 26 | | | | | | 67 | | | | 40 | | | | 31 | |
Established vaccines | | | 3,516 | | | | 3,062 | | | | 15 | | | | 4 | | | | | | 1,041 | | | | 10 | | | | (2 | ) | | | | | 1,111 | | | | 19 | | | | 8 | | | | | | 1,364 | | | | 16 | | | | 5 | |
Infanrix, Pediarix | | | 769 | | | | 733 | | | | 5 | | | | (5 | ) | | | | | 338 | | | | 26 | | | | 12 | | | | | | 335 | | | | 1 | | | | (8 | ) | | | | | 96 | | | | (27 | ) | | | (31 | ) |
Boostrix | | | 470 | | | | 358 | | | | 31 | | | | 18 | | | | | | 238 | | | | 14 | | | | 1 | | | | | | 139 | | | | 58 | | | | 43 | | | | | | 93 | | | | 52 | | | | 39 | |
Hepatitis | | | 602 | | | | 540 | | | | 11 | | | | 1 | | | | | | 294 | | | | 8 | | | | (4 | ) | | | | | 197 | | | | 28 | | | | 17 | | | | | | 111 | | | | (2 | ) | | | (8 | ) |
Rotarix | | | 469 | | | | 417 | | | | 12 | | | | 1 | | | | | | 129 | | | | (7 | ) | | | (17 | ) | | | | | 75 | | | | 17 | | | | 8 | | | | | | 265 | | | | 24 | | | | 10 | |
Synflorix | | | 504 | | | | 381 | | | | 32 | | | | 19 | | | | | | – | | | | – | | | | – | | | | | | 68 | | | | 74 | | | | 59 | | | | | | 436 | | | | 27 | | | | 15 | |
Priorix, Priorix Tetra, Varilrix | | | 300 | | | | 260 | | | | 15 | | | | 5 | | | | | | – | | | | – | | | | – | | | | | | 152 | | | | 12 | | | | – | | | | | | 148 | | | | 19 | | | | 9 | |
Cervarix | | | 81 | | | | 88 | | | | (8 | ) | | | (14 | ) | | | | | 1 | | | | (67 | ) | | | (67 | ) | | | | | 33 | | | | (11 | ) | | | (22 | ) | | | | | 47 | | | | (2 | ) | | | (4 | ) |
Other | | | 321 | | | | 285 | | | | 13 | | | | 1 | | | | | | 41 | | | | (21 | ) | | | (27 | ) | | | | | 112 | | | | 29 | | | | 22 | | | | | | 168 | | | | 21 | | | | 4 | |
Vaccines | | | 4,592 | | | | 3,656 | | | | 26 | | | | 14 | | | | | | 1,599 | | | | 27 | | | | 13 | | | | | | 1,423 | | | | 30 | | | | 18 | | | | | | 1,570 | | | | 21 | | | | 10 | |
£% represents growth at actual exchange rates. CER% represents growth at constant exchange rates.
| | |
| 248 | | |
GSK Annual Report 2017 | | |
| | |
| | |
Financial recordcontinued
Five year record
A record of financial performance is provided, analysed in accordance with current reporting practice. The information included in the Five year record is prepared in accordance with IFRS as adopted by the European Union and also with IFRS as issued by the International Accounting Standards Board.
Comparative information for 2013 is also reported including the effect of the divestments completed in 2013.
| | | | | | | | | | |
| Group turnover by geographic region | | 2017 £m | | 2016 (revised) £m | | 2015 (revised) £m | | 2014 (revised) £m | | 2013 (revised) £m |
| US | | 11,263 | | 10,197 | | 8,222 | | 7,409 | | 8,695 |
| | | | | |
| Europe | | 7,943 | | 7,476 | | 6,435 | | 6,284 | | 6,670 |
| | | | | |
| International | | 10,980 | | 10,216 | | 9,266 | | 9,313 | | 10,237 |
| | | | | |
| | | 30,186 | | 27,889 | | 23,923 | | 23,006 | | 25,602 |
| Divestments | | – | | – | | – | | – | | 903 |
| Total turnover including divestments | | 30,186 | | 27,889 | | 23,923 | | 23,006 | | 26,505 |
| | | | | | | | | | | |
| Group turnover by segment | | 2017 £m | | 2016 £m | | 2015 £m | | 2014 £m | | 2013 £m |
| Pharmaceuticals | | 17,276 | | 16,104 | | 14,157 | | 15,438 | | 17,359 |
| | | | | |
| Vaccines | | 5,160 | | 4,592 | | 3,656 | | 3,159 | | 3,384 |
| | | | | |
| Consumer Healthcare | | 7,750 | | 7,193 | | 6,038 | | 4,322 | | 4,713 |
| Segment turnover | | 30,186 | | 27,889 | | 23,851 | | 22,919 | | 25,456 |
| | | | | |
| Corporate and other unallocated turnover | | – | | – | | 72 | | 87 | | 146 |
| | | 30,186 | | 27,889 | | 23,923 | | 23,006 | | 25,602 |
| Divestments completed in 2013 | | – | | – | | – | | – | | 903 |
| | | 30,186 | | 27,889 | | 23,923 | | 23,006 | | 26,505 |
| | | | | | | | | | | |
| Pharmaceuticals turnover | | | | | | | | | | |
| Respiratory | | 6,991 | | 6,510 | | 5,741 | | 6,168 | | 7,259 |
| | | | | |
| HIV | | 4,350 | | 3,556 | | 2,322 | | 1,498 | | 1,386 |
| | | | | |
| Immuno-inflammation | | 377 | | 340 | | 263 | | 214 | | 161 |
| | | | | |
| Established Pharmaceuticals | | 5,558 | | 5,698 | | 5,831 | | 7,558 | | 8,553 |
| | | 17,276 | | 16,104 | | 14,157 | | 15,438 | | 17,359 |
| | | | | | | | | | | |
| Vaccines turnover | | | | | | | | | | |
| Meningitis | | 890 | | 662 | | 326 | | – | | – |
| | | | | |
| Influenza | | 488 | | 414 | | 268 | | 215 | | 251 |
| | | | | |
| Shingles | | 22 | | – | | – | | – | | – |
| | | | | |
| Established Vaccines | | 3,760 | | 3,516 | | 3,062 | | 2,944 | | 3,133 |
| | | 5,160 | | 4,592 | | 3,656 | | 3,159 | | 3,384 |
| | | | | |
| | | | | | | | | | | |
| Consumer Healthcare turnover | | | | | | | | | | |
| Wellness | | 4,001 | | 3,726 | | 2,970 | | 1,565 | | 1,807 |
| | | | | |
| Oral care | | 2,466 | | 2,223 | | 1,875 | | 1,806 | | 1,892 |
| | | | | |
| Nutrition | | 680 | | 674 | | 684 | | 633 | | 628 |
| | | | | |
| Skin health | | 603 | | 570 | | 509 | | 318 | | 386 |
| | | 7,750 | | 7,193 | | 6,038 | | 4,322 | | 4,713 |
| | | | |
| 249 | | |
| | | | | |
| GSK Annual Report 2017 | | Strategic report | | |
| | Governance and remuneration | | |
| | Financial statements | | |
| | Investor information | | |
Five year recordcontinued
| | | | | | | | | | |
| Financial results – Total | | 2017 £m | | 2016 £m | | 2015 £m | | 2014 £m | | 2013 £m |
| Turnover | | 30,186 | | 27,889 | | 23,923 | | 23,006 | | 26,505 |
| Operating profit | | 4,087 | | 2,598 | | 10,322 | | 3,597 | | 7,028 |
| Profit before taxation | | 3,525 | | 1,939 | | 10,526 | | 2,968 | | 6,647 |
| Profit after taxation | | 2,169 | | 1,062 | | 8,372 | | 2,831 | | 5,628 |
| | | | | |
| | | pence | | pence | | pence | | pence | | pence |
| Basic earnings per share | | 31.4 | | 18.8 | | 174.3 | | 57.3 | | 112.5 |
| Diluted earnings per share | | 31.0 | | 18.6 | | 172.3 | | 56.7 | | 110.5 |
| | | | | |
| | | 2017 millions | | 2016 millions | | 2015 millions | | 2014 millions | | 2013 millions |
| | | | | |
| Weighted average number of shares in issue: | | | | | | | | | | |
| Basic | | 4,886 | | 4,860 | | 4,831 | | 4,808 | | 4,831 |
| Diluted | | 4,941 | | 4,909 | | 4,888 | | 4,865 | | 4,919 |
| | | | | |
| | | | | | | | | | | |
| Financial results – Adjusted | | 2017 £m | | 2016 (revised) £m | | 2015 (revised) £m | | 2014 (revised) £m | | 2013 (revised) £m |
| Turnover | | 30,186 | | 27,889 | | 23,923 | | 23,006 | | 25,602 |
| Operating profit | | 8,568 | | 7,671 | | 5,659 | | 6,456 | | 7,724 |
| Profit before taxation | | 7,924 | | 7,024 | | 5,021 | | 5,840 | | 7,075 |
| Profit after taxation | | 6,257 | | 5,526 | | 4,045 | | 4,675 | | 5,443 |
| | | | | |
| | | | | | | | | | | |
| | | pence | | pence | | pence | | pence | | pence |
| Adjusted earnings per share | | 111.8 | | 100.6 | | 74.6 | | 92.7 | | 107.5 |
| | | | | |
| | | | | | | | | | | |
| | | % | | % | | % | | % | | % |
| Return on capital employed | | 83.4 | | 28.0 | | 152.4 | | 46.6 | | 91.4 |
Return on capital employed is calculated as total profit before taxation as a percentage of average net assets over the year.
| | |
| 250 | | |
GSK Annual Report 2017 | | |
| | |
| | |
Financial recordcontinued
Five year recordcontinued
| | | | | | | | | | | | | | |
| Balance sheet | | | | | | 2017 £m | | 2016 £m | | 2015 £m | | 2014 £m | | 2013 £m |
| Non-current assets | | | | | | 40,474 | | 42,370 | | 36,859 | | 25,973 | | 26,859 |
| | | | | | | |
| Current assets | | | | | | 15,907 | | 16,711 | | 16,587 | | 15,059 | | 15,732 |
| Total assets | | | | | | 56,381 | | 59,081 | | 53,446 | | 41,032 | | 42,591 |
| | | | | | | |
| Current liabilities | | | | | | (26,569) | | (19,001) | | (13,417) | | (13,676) | | (14,182) |
| | | | | | | |
| Non-current liabilities | | | | | | (26,323) | | (35,117) | | (31,151) | | (22,420) | | (20,597) |
| Total liabilities | | | | | | (52,892) | | (54,118) | | (44,568) | | (36,096) | | (34,779) |
| | | | | | | |
| Net assets | | | | | | 3,489 | | 4,963 | | 8,878 | | 4,936 | | 7,812 |
| | | | | | | |
| Shareholders’ equity | | | | | | (68) | | 1,124 | | 5,114 | | 4,263 | | 6,997 |
| | | | | | | |
| Non-controlling interests | | | | | | 3,557 | | 3,839 | | 3,764 | | 673 | | 815 |
| Total equity | | | | | | 3,489 | | 4,963 | | 8,878 | | 4,936 | | 7,812 |
| | | | | | | |
| Number of employees | | | | | | | | | | | | | | |
| | | | | | | |
| | | | | | | 2017 | | 2016 | | 2015 | | 2014 | | 2013 |
| US | | | | | | 14,526 | | 14,491 | | 14,696 | | 16,579 | | 16,530 |
| | | | | | | |
| Europe | | | | | | 43,002 | | 42,330 | | 43,538 | | 37,899 | | 38,367 |
| | | | | | | |
| International | | | | | | 40,934 | | 42,479 | | 43,021 | | 43,443 | | 44,554 |
| | | | | | | 98,462 | | 99,300 | | 101,255 | | 97,921 | | 99,451 |
| | | | | | | |
| Manufacturing | | | | | | 38,245 | | 38,372 | | 38,855 | | 32,171 | | 31,502 |
| | | | | | | |
| Selling | | | | | | 37,374 | | 38,158 | | 39,549 | | 42,785 | | 45,397 |
| | | | | | | |
| Administration | | | | | | 11,307 | | 11,244 | | 11,140 | | 10,630 | | 10,232 |
| | | | | | | |
| Research and development | | | | | | 11,536 | | 11,526 | | 11,711 | | 12,335 | | 12,320 |
| | | | | | | 98,462 | | 99,300 | | 101,255 | | 97,921 | | 99,451 |
The geographic distribution of employees in the table above is based on the location of GSK’s subsidiary companies. The number of employees is the number of permanent employed staff at the end of the financial period. It excludes those employees who are employed and managed by GSK on a contract basis. Exchange rates As a guide to holders of ADS, the following tables set out, for the periods indicated, information on the exchange rate of US Dollars for Sterling as reported by the Bank of England (4pm buying rate). The average rate for the year is calculated as the average of the 4pm buying rates for each day of the year. |
| | | | | | | 2017 | | 2016 | | 2015 | | 2014 | | 2013 |
| Average | | | | | | 1.29 | | 1.35 | | 1.53 | | 1.65 | | 1.56 |
| | | | | | | |
| | | 2018 | | 2018 | | 2018 | | 2017 | | 2017 | | 2017 | | 2017 |
| | | Mar | | Feb | | Jan | | Dec | | Nov | | Oct | | Sep |
| High | | 1.38 | | 1.42 | | 1.43 | | 1.35 | | 1.35 | | 1.33 | | 1.36 |
| | | | | | | |
| Low | | 1.37 | | 1.38 | | 1.35 | | 1.33 | | 1.31 | | 1.31 | | 1.30 |
The 4pm buying rate on 2 March 2018 was £1= US$1.38.
| | | | |
| 251 | | |
| | | | | |
| GSK Annual Report 2017 | | Strategic report | | |
| | Governance and remuneration | |
| | Financial statements | |
| | Investor information | | |
Pipeline, products and competition
Pharmaceuticals and Vaccines product development pipeline
| | | | | | | | | | |
| | | | | |
| Key | | † | | In-licence or other alliance relationship with third party | | | | MAA | | Marketing Authorisation Application (Europe) |
| | ^ | | ViiV Healthcare, a global specialist HIV company with | | | | NDA | | New Drug Application (US) |
| | | | GSK, Pfizer, Inc. and Shionogi Limited as shareholders, | | | | Phase I | | Evaluation of clinical pharmacology, usually conducted |
| | | | is responsible for developing and delivering HIV medicines. | | | | | | in volunteers |
| | 1 | | Option-based alliance with Ionis Pharmaceuticals, Inc. | | | | Phase II | | Determination of dose and initial evaluation of efficacy, |
| | S | | Month of first submission | | | | | | conducted in a small number of patients |
| | A | | Month of first regulatory approval (for MAA, this is the first | | | | Phase III | | Large comparative study (compound versus placebo |
| | | | EU approval letter) | | | | | | and/or established treatment) in patients to establish |
| | BLA | | Biological Licence Application | | | | | | clinical benefit and safety |
| | | | | | | | | | |
| | | | | | | | | | |
MAA and NDA/BLA regulatory review milestones shown in the table below are those that have been achieved. Future filing dates are not included in this list.
| | | | | | | | | | | | | | |
| | | | | | | |
| Achieved regulatory
review milestones |
|
| | | | | | | | | | |
| Compound | | Type | | Indication | | Phase | | | MAA | | | | NDA/BLA | |
HIV^ and Infectious Diseases | | | | | | | | | | |
dolutegravir + rilpivirine† | | HIV integrase strand transfer inhibitor + non-nucleoside reverse transcriptase inhibitor (NNRTI) | | HIV infection – (virologically suppressed patients) | | Approved | | | S: May 17 | | | | A: Nov17 | |
| tafenoquine† | | 8-aminoquinoline | | plasmodium vivax malaria | | Submitted | | | | | | | S: Nov17 | |
| Dectova (zanamivir) i.v.† | | neuraminidase inhibitor (i.v.) | | influenza | | Submitted | | | S: Nov 17 | | | | | |
| dolutegravir + lamivudine | | HIV integrase strand transfer inhibitor + nucleoside reverse transcriptase inhibitor (NRTI) | | HIV infection | | III | | | | | | | | |
| fostemsavir | | HIV attachment inhibitor | | HIV infection | | III | | | | | | | | |
| cabotegravir | | HIV integrase strand transfer inhibitor (long-acting) | | HIV pre-exposure prophylaxis | | III | | | | | | | | |
cabotegravir + rilpivirine† | | HIV integrase strand transfer inhibitor + non-nucleoside reverse transcriptase inhibitor (NNRTI) (long-acting regimen) | | HIV infection | | III | | | | | | | | |
gepotidacin (2140944) | | type 2 topoisomerase inhibitor | | bacterial infections | | II | | | | | | | | |
| 32288361 | | HBV antisense oligonucleotide | | hepatitis B | | II | | | | | | | | |
| 33894041 | | HBV LICA antisense oligonucleotide | | hepatitis B | | II | | | | | | | | |
| CCI15106† | | viral replication inhibitor (nucleoside) | | viral exacerbations of COPD | | I | | | | | | | | |
| 3640254 | | HIV maturation inhibitor | | HIV infection | | I | | | | | | | | |
| 3036656† | | leucyl t-RNA synthetase inhibitor | | tuberculosis | | I | | | | | | | | |
| Respiratory | | | | | | | | | | | | | | |
mepolizumab | | interleukin 5 (IL5) monoclonal antibody | | eosinophilic granulomatosis with polyangiitis | | Approved | | | | | | | A:Dec17 | |
Trelegy (fluticasone furoate + vilanterol† + umeclidinium) | | glucocorticoid agonist + long-acting beta2 agonist + muscarinic acetylcholine antagonist | | chronic obstructive pulmonary disease (COPD) | | Approved | | | A:Nov17 | | | | A:Sep17 | |
| mepolizumab | | interleukin 5 (IL5) monoclonal antibody | | COPD | | Submitted | | | | | | | S:Nov17 | |
fluticasone furoate + vilanterol† + umeclidinium | | glucocorticoid agonist + long-acting beta2 agonist + muscarinic acetylcholine antagonist | | asthma | | III | | | | | | | | |
| mepolizumab | | interleukin 5 (IL5) monoclonal antibody | | hypereosinophilic syndrome | | III | | | | | | | | |
| mepolizumab | | interleukin 5 (IL5) monoclonal antibody | | nasal polyposis | | III | | | | | | | | |
| nemiralisib | | phosphatidylinositol 3-kinase delta (PI3Kd) inhibitor | | COPD (acute and chronic) | | II | | | | | | | | |
| danirixin | | chemokine (C-X-C Motif) receptor 2 (CXCR2) antagonist (oral) | | COPD | | II | | | | | | | | |
| 2586881† | | recombinant human angiotensin converting enzyme 2 (rhACE2) | | acute lung injury | | II | | | | | | | | |
| 2862277 | | tumour necrosis factor receptor-1 (TNFR1) domain antibody | | acute lung injury | | II | | | | | | | | |
| 2245035 | | toll-like receptor 7 (TLR7) agonist | | asthma | | II | | | | | | | | |
| nemiralisib | | phosphatidylinositol 3-kinase delta (PI3Kd) inhibitor | | activated PI3K delta syndrome | | II | | | | | | | | |
| 3772847† | | interleukin 33r (IL33r) monoclonal antibody | | severe asthma | | II | | | | | | | | |
| 2586881† | | recombinant human angiotensin converting enzyme 2 (rhACE2) | | pulmonary arterial hypertension | | I | | | | | | | | |
| | |
| 252 | | |
GSK Annual Report 2017 | | |
| | |
| | |
Pipeline, products and competitioncontinued
Pharmaceuticals and Vaccines product development pipelinecontinued
| | | | | | | | | | |
| | | | | | | | | Achieved regulatory review milestones |
| | | | | | | | |
| Compound | | Type | | Indication | | Phase | | MAA | | NDA/BLA |
| Respiratorycontinued |
3008348 | | alpha V beta 6 integrin antagonist | | idiopathic pulmonary fibrosis | | I | | | | |
| nemiralisib | | phosphatidylinositol 3-kinase delta (PI3Kd) inhibitor | | bronchiectasis | | I | | | | |
| 2292767 | | phosphatidylinositol 3-kinase delta (PI3Kd) inhibitor | | COPD | | I | | | | |
| 3511294 | | interleukin 5 (IL5) long-acting monoclonal antibody | | asthma | | I | | | | |
| Oncology |
| 3377794† | | NY-ESO-1 autologous engineered TCR-T cells (engineered TCR) | | sarcoma, multiple myeloma, non-small cell lung cancer, melanoma and ovarian cancer | | II | | | | |
| 2857916† | | B-cell maturation antigen antibody drug conjugate | | multiple myeloma | | II | | | | |
| 525762 | | BET family bromodomain inhibitor | | solid tumours and haematological malignancies | | I | | | | |
| 3174998† | | OX40 agonist monoclonal antibody | | solid tumours and haematological malignancies | | I | | | | |
| 3326595 | | protein arginine methyltransferase 5 (PRMT5) inhibitor | | cancer | | I | | | | |
| 3359609 | | induced T-cell costimulator (ICOS) agonist antibody | | cancer | | I | | | | |
1795091 | | toll-like receptor 4 (TLR4) agonist | | cancer | | I | | | | |
| 2636771 | | phosphatidylinositol 3-kinase (PI3K) beta inhibitor | | castration resistant prostate cancer | | I | | | | |
| Immuno-inflammation |
| Benlysta | | B lymphocyte stimulator monoclonal antibody (s.c.) | | systemic lupus erythematosus | | Approved | | A: Nov17 | | A: Jul17 |
| 3196165† | | granulocyte macrophage colony-stimulating factor monoclonal antibody | | osteoarthritis | | II | | | | |
| 3196165† | | granulocyte macrophage colony-stimulating factor monoclonal antibody | | rheumatoid arthritis | | II | | | | |
| Benlysta + Rituxan | | B lymphocyte stimulator monoclonal antibody (s.c.) + cluster of differentiation 20 (CD20) monoclonal antibody (i.v.) | | Sjogren’s syndrome | | II | | | | |
| 2982772 | | receptor-interacting protein 1 (RIP1) kinase inhibitor | | psoriasis | | II | | | | |
| 2982772 | | receptor-interacting protein 1 (RIP1) kinase inhibitor | | rheumatoid arthritis | | II | | | | |
| 2330811 | | oncostatin M (OSM) monoclonal antibody | | systemic sclerosis | | II | | | | |
| 2982772 | | receptor-interacting protein 1 (RIP1) kinase inhibitor | | ulcerative colitis | | II | | | | |
| 2831781† | | lymphocyte activation gene 3 (LAG3) protein monoclonal antibody | | autoimmune disease | | I | | | | |
| 2983559 | | receptor-interacting protein 2 (RIP2) kinase inhibitor | | inflammatory bowel diseases | | I | | | | |
| 3335065 | | Kynurenine 3-monooxygenase inhibitor | | acute pancreatitis | | I | | | | |
| Future pipeline optionality |
| daprodustat (1278863) | | prolyl hydroxylase inhibitor (oral) | | anaemia associated with chronic renal disease | | III | | | | |
dezamizumab (2398852)† + 2315698† | | serum amyloid P component (SAP) monoclonal antibody + SAP depleter (CPHPC) | | amyloidosis | | II | | | | |
| oxytocin (inhaled)† | | oxytocin | | postpartum hemorrhage | | II | | | | |
| tapinarof (2894512)† | | non-steroidal anti-inflammatory (topical) | | atopic dermatitis | | II | | | | |
| tapinarof (2894512)† | | non-steroidal anti-inflammatory (topical) | | psoriasis | | II | | | | |
| 2881078 | | selective androgen receptor modulator | | muscle wasting | | I | | | | |
Following a strategic review in 2017, assets from the Rare Diseases Unit are no longer included in the pipeline table with the future ownership of these assets in consideration.
| | | | |
| 253 | | |
| | | | | |
| GSK Annual Report 2017 | | Strategic report | | |
| | Governance and remuneration | | |
| | Financial statements | | |
| | Investor information | | |
Pharmaceuticals and Vaccines product development pipelinecontinued
| | | | | | | | | | |
| | | | | | | | | Achieved regulatory review milestones |
| | | | | | | | |
| Compound | | Type | | Indication | | Phase | | MAA | | NDA/BLA |
| Vaccines |
Shingrix† (Zoster Vaccine) | | recombinant | | Herpes Zoster prophylaxis | | Approved (US) Submitted (EU) | | S: Nov 16 | | A: Oct 17 |
| Rotavirus | | live attenuated, PCV (Porcine circovirus) free | | Rotavirus prophylaxis | | III | | | | |
| MMR | | live attenuated | | measles, mumps, rubella prophylaxis | | III (US) | | | | |
| Ebola† | | recombinant viral vector | | Ebola haemorrhagic fever prophylaxis | | II | | | | |
| S. pneumoniae next generation† | | recombinant – conjugated | | Streptococcus pneumoniae disease prophylaxis | | II | | | | |
| COPD | | recombinant | | reduction of the frequency of moderate and severe acute exacerbations in COPD patients by targeting non-typeable Haemophilus influenzae and Moraxella catarrhalis | | II | | | | |
| Hepatitis C† | | heterologous recombinant viral vectors | | hepatitis C virus prophylaxis: prevention of establishment of chronic infection | | II | | | | |
| Malaria next generation† | | recombinant | | malaria prophylaxis (Plasmodium falciparum) | | II | | | | |
| Men ABCWY | | recombinant – conjugated | | meningococcal A,B,C,W and Y disease prophylaxis in adolescents | | II | | | | |
| Shigella† | | conjugated and outer membrane | | Shigella diarrhea prophylaxis | | II | | | | |
| Tuberculosis† | | recombinant | | tuberculosis prophylaxis | | II | | | | |
| RSV | | replication-defective recombinant viral vector | | respiratory syncytial virus prophylaxis in paediatric population | | II | | | | |
| Flu universal† | | universal inactivated influenza vaccine | | Flu infection prophylaxis with broad protection over multiple seasons | | I/II | | | | |
| HIV† | | recombinant proteins | | HIV infection prophylaxis | | II | | | | |
Brand names appearing in italics are trade marks owned by or licensed to the GSK group of companies, with the exception ofRituxan owned by Biogen MA Inc.
| | |
| 254 | | |
GSK Annual Report 2017 | | |
| | |
| | |
Pipeline, products and competitioncontinued
Pharmaceuticals products, competition and intellectual property
| | | | | | | | | | |
Products | | Compounds | | Indication(s) | | Major
competitor brands | | Patent expiry dates3 |
| | | | | US | | EU |
Respiratory | | | | | | | | | | |
Anoro Ellipta | | umeclidinium bromide/ vilanterol trifenatate | | COPD | | Respimat, Stiolto
Utibron/Ultibro
Breezhaler,
Duaklir Genuair
Bevespi | | 2027
(NCE)
2027-2030
(device/
formulation) | | 2029
(NCE)
2022-2025
(device/
formulation) |
| | | |
| Arnuity Ellipta | | fluticasone furoate | | asthma | | Qvar, Pulmicort
Asmanex, Alvesco | | 2021
(NCE)
2027-2030
(device/
formulation) | | NA |
| | | |
| Avamys/Veramyst | | fluticasone furoate | | rhinitis | | Nasonex | | 20212 | | 2023 |
| | | |
| Flixotide/Flovent | | fluticasone propionate | | asthma/COPD | | Qvar, Singulair | | expired
(Diskus device)
2018-20261
(HFA-device) | | expired
(Diskus device)
expired
(HFA-device) |
| | | |
| Incruse Ellipta | | umeclidinium bromide | | COPD | | Spiriva Handihaler/ Respimat, Eklira Genuair Seebri Breezhaler | | 2027
(NCE)
2027-2030
(device/
formulation) | | 2029
(NCE)
2022-2025
(device/
formulation) |
| | | |
| Nucala | | mepolizumab | | severe eosinophilic asthma, EGPA | | Xolair, Cinqair, Fasenra | | expired4 | | 20204 |
| | | |
| Relvar/Breo Ellipta | | fluticasone furoate/
vilanterol trifenatate | | asthma/COPD | | Symbicort, Foster, Flutiform, Dulera | | 2025
(NCE)
2027-2030
(device/
formulation) | | 2027
(NCE)
2022-2025
(device/
formulation) |
| | | |
| Seretide/Advair | | salmeterol xinafoate/ fluticasone propionate | | asthma/COPD | | Symbicort, Foster, Flutiform, Dulera | | expired
(Diskus device)
2018-2026
(HFA-device) | | expired
(Diskus device)
expired
(HFA-device) |
| | | |
| Serevent | | salmeterol xinafoate | | asthma/COPD | | Foradil, Striverdi, Respimat, Onbrez Breezhaler | | expired
(Diskus device) | | expired
(Diskus device)
2021
(HFA-device) |
| | | |
| Trelegy Ellipta | | fluticasone furoate/
vilanterol trifenatate umeclidinium bromide | | COPD | | Trimbow | | 2027
(NCE)
2027-2030
(device/
formulation) | | 2029
(NCE)
2022-2025
(device/
formulation) |
| | | |
| Ventolin HFA | | albuterol sulphate | | asthma/COPD | | generic companies | | 2018-2026
(HFA-device) | | expired
(HFA-device) |
| | | |
| Anti-virals | | | | | | | | | | |
Valtrex | | valaciclovir | | genital herpes, coldsores, shingles | | Famvir | | expired | | expired |
| | | |
| Central nervous system | | | | | | | | |
Lamictal | | lamotrigine | | epilepsy, bipolar disorder | | Keppra, Dilantin | | expired | | expired |
| | | |
| Imigran/Imitrex | | sumatriptan | | migraine | | Zomig, Maxalt, Relpax | | expired | | expired |
| | | |
| Seroxat/Paxil | | paroxetine | | depression, various anxiety
disorders | | Effexor, Cymbalta,
Lexapro | | expired | | expired |
| | | |
| Cardiovascular and urogenital | | | | | | |
Avodart | | dutasteride | | benign prostatic hyperplasia | | Proscar, Flomax, | | expired | | expired |
| | | | | | finasteride | | | | |
| | | |
| Coreg CR | | carvedilol phosphate | | mild-to-severe heart failure,
hypertension, left ventricular
dysfunction post MI | | Toprol XL | | 20262
(formulation) | | NA |
| | | |
| Anti-bacterials | | | | | | | | | | |
Augmentin | | amoxicillin/clavulanate potassium | | common bacterial
infections | | generic products | | NA | | expired |
| | | |
| 1 | See Note 45 to the financial statements, ‘Legal proceedings’. |
| 2 | Generic competition commenced in 2017. |
| 3 | Includes Supplementary Protection Certificates which were granted in multiple countries in EU and patent term extensions granted in the US. |
| 4 | Data exclusivity expires 2025 (EU) and 2027 (US). |
| | | | |
| 255 | | |
| | | | | |
| GSK Annual Report 2017 | | Strategic report | | |
| | Governance and remuneration | | |
| | Financial statements | | |
| | Investor information | | |
Pharmaceutical products, competition and intellectual propertycontinued
| | | | | | | | | | |
| Products | | Compounds | | Indication(s) | | Major competitor brands | | Patent expiry dates3 |
| | | | | US | | EU |
Rare diseases | | | | | | | | | | |
| Volibris | | ambrisentan | | pulmonary hypertension | | Tracleer, Revatio | | NA | | 2020 |
| | | |
Immuno-inflammation | | | | | | | | | | |
| Benlysta, Benlysta SC | | belimumab | | systemic lupus erythematosus | | | | 2025 | | 2026 |
| | | |
HIV | | | | | | | | | | |
| Epzicom/Kivexa | | lamivudine and abacavir | | HIV/AIDS | | Truvada, Atripla
Descovy, Genvoya
Odefsey | | expired | | 20191,2
(combination) |
| | | |
| Juluca | | dolutegravir, rilpivitine | | HIV/AIDS | | Genvoya, Odefsey
Descovy, Atripla | | 2027
(NCE) | | 2029
(NCE) |
| | | |
| Lexiva/Telzir | | fosamprenavir | | HIV/AIDS | | Prezista, Kaletra,
Reyataz | | expired | | 2019
(NCE) |
| | | |
| Selzentry/Celsentri | | maraviroc | | HIV/AIDS | | Isentress, Intelence,
Prezista | | 2021
(NCE) | | 2022
(NCE) |
| | | |
| Tivicay | | dolutegravir | | HIV/AIDS | | Isentress, Prezista
Reyataz, Kaletra,
Biktarvy | | 20271
(NCE) | | 2029
(NCE) |
| | | |
| Triumeq | | dolutegravir, lamivudine
and abacavir | | HIV/AIDS | | Atripla, Descovy,
Odefsey, Genvoya,
Biktarvy | | 2027
(NCE) | | 2029
(NCE) |
| | | |
Vaccines products, competition and intellectual property | | | | |
| Products | | Compounds | | Indication(s) | | Major competitor brands | | Patent expiry dates3 |
| | | | | US | | EU |
| Bexsero | | meningococcal group-B
vaccine | | Meningitis group B prevention | | Trumenba | | 2027 | | 2028 |
| | | |
| Boostrix | | diphtheria, tetanus, acellular pertussis | | diphtheria, tetanus, acellular Pertussis booster vaccination | | Adacel | | expired | | expired |
| | | |
| Infanrix Hexa/Pediarix | | diphtheria, tetanus, pertussis, polio, hepatitis B, Haemophilus influenzae type B (EU) | | Prophylaxis against diphtheria, tetanus, pertussis, polio,
hepatitis B, Haemophilus
influenzae type B (EU) | | Pentacel, Pediacel,
Pentaxim, Pentavac,
Hexaxim, Hexyon
Vaxelis | | 2018 | | expired |
| | | |
| Cervarix | | HPV 16 & 18 virus like
particles (VLPs), AS04
adjuvant (MPL + aluminium
hydroxide) | | human papilloma virus
type 16 and 18 | | Gardasil (Silgard) | | 2020 | | 2020 |
| | | |
| Fluarix Tetra | | split inactivated influenza
antigens (2 virus subtypes A
and 2 subtype B) | | seasonal influenza prophylaxis | | Intenza, Flumist QIV,
Vaxigrip QIV,
Fluzone QIV,
Fluzone High Dose | | 2022 | | 2022 |
| | | |
| FluLaval | | split inactivated influenza
antigens (2 virus subtypes A
and 2 subtype B) | | seasonal influenza prophylaxis | | Vaxigrip, Mutagrip,
Fluzone, Influvac,
Aggripal, Fluad,
Intenza, Flumist | | 2022 | | 2022 |
| | | |
| Menveo | | meningococcal group A, C, W- 135 and Y conjugate vaccine | | Meningitis group A, C, W-135 and Y prophylaxis | | Nimenrix, Menactra | | 2025 | | 2025 |
| | | |
| Prepandrix | | derived split inactivated
influenza virus antigen,
AS03 adjuvant | | pandemic H5N1 influenza prophylaxis | | Aflunov, Vepacel | | – | | 2026 |
| | | |
| Priorix, Priorix Tetraa,b | | live attenuated measles, mumps, | | measles, mumps, rubella and | | MMR II (M-M-RVaxPro) | | 20194 | | expired |
| Varilrixb | | rubella and varicella vaccine | | chickenpox prophylaxis | | Proquad, Varivax | | | | |
| | | |
| Rotarix | | Human rotavirus RIX4414 strain | | Rotavirus prophylaxis | | Rotateq | | – | | 2020 |
| | | |
| Synflorix | | conjugated pneumococcal
polysaccharide | | Prophylaxis against invasive disease, pneumonia,
acute otitis media | | Prevenar (Prevnar) | | NA | | 2024 |
| | | |
| Shingrix | | zoster vaccine
recombinant, adjuvanted | | herpes zoster
(shingles) | | Zostavax | | 2026 | | 2026 |
| | | |
| 1 | See Note 45 to the financial statements, ‘Legal proceedings’. |
| 2 | Generic competition commenced in many markets during 2016. |
| 3 | Includes Supplementary Protection Certificates which were granted in multiple countries in EU and patent term extensions granted in the US. |
| 4 | Refers toPriorix andPriorix Tetra, as all patents onVarilrix have expired. |
| a | Related compounds/indications are measles, mumps and rubella vaccine/prophylaxis |
| b | Related compound is varicella vaccine |
| | |
| 256 | | |
GSK Annual Report 2017 | | |
| | |
| | |
Pipeline, products and competitioncontinued
Consumer Healthcare products and competition
| | | | | | | | |
| Brand | | Products | | Application | | Markets | | Competition |
| Wellness | | | | | | | | |
| Respiratory | | | | | | | | |
| Otrivin | | nasal spray | | nasal decongestant | | Germany, Poland, Russia, Sweden, Ukraine | | Afrin, Merck Nasivin, Merck |
| Theraflu | | tablets and syrups | | cold and flu relief | | Russia, Poland, Ukraine, US | | Tylenol Cold & Flu, Johnson & Johnson Mucinex, Reckitt Benckiser Lemsip, Reckitt Benckiser |
| Flonase | | nasal spray | | allergy relief | | US | | Claritin, Bayer, Nasacort, Sanofi |
| Flixonase, Piriton | | nasal spray, tablets | | allergy relief | | UK, Ireland | | Benadryl, Johnson & Johnson |
| Nicorette (US), | | lozenges, gum and trans-dermal | | treatment of nicotine withdrawal | | global | | Nicorette, Johnson & Johnson |
NicoDerm, Nicotinell (ex. Australia) | | patches | | as an aid to smoking reduction and cessation | | | | NiQuitin, Perrigo |
| | | | |
| Pain relief | | | | | | | | |
Panadol and Panadol Cold & Flu | | tablets, caplets, infant syrup drops | | paracetamol-based treatment for headache, joint pain, fever, cold symptoms | | global (except US) | | Advil, Pfizer Aspirin, Bayer Tylenol, Johnson & Johnson |
| Voltaren | | topical gel | | non-steroidal, diclofenac based anti-inflammatory | | global (except US) | | Advil, Pfizer Aspirin, Bayer Tylenol, Johnson & Johnson |
| Other | | | | | | | | |
| ENO | | effervescent | | immediate relief antacid | | global (except US) | | Estomazil, Hypermarca Gelusil, Pfizer |
| Tums | | chewable tablets | | immediate relief antacid | | US | | Alka-Seltzer, Bayer Gaviscon, Reckitt Benckiser Rolaids, Sanofi |
| Oral health | | | | | | | | |
| Sensodyne, Pronamel | | toothpastes, toothbrushes, mouth rinse | | relief of dentinal hypersensitivity.Pronamel additionally protects against acid erosion | | global | | Colgate Sensitive Pro-Relief, Colgate-Palmolive Elmex, Colgate-Palmolive Oral B, Procter & Gamble |
parodontax/ Corsodyl | | toothpaste, medicated mouthwash, gel and spray | | helps prevent bleeding gums, treats and prevents gingivitis | | Germany, Ireland Italy, United Kingdom | | Colgate Total Gum Health, Colgate-Palmolive Yunnan Baiyao, State Enterprise (China) |
Polident, Poligrip, Corega | | denture adhesive, denture cleanser | | improve retention and comfort of dentures, cleans dentures | | global | | Fixodent and Kukident, Procter & Gamble, Steradent, Reckitt Benckiser |
| Aquafresh | | toothpastes, toothbrushes mouthwashes | | aids prevention of dental cavities, maintains healthy teeth, gums and fresh breath | | global | | Colgate, Colgate-Palmolive Crest, Procter & Gamble Oral-B, Procter & Gamble |
| Skin health | | | | | | | | |
Zovirax Abreva | | topical cream and non-medicated patch | | lip care to treat and prevent the onset of cold sores | | global | | Compeed, Johnson & Johnson Carmex, Carma Labs Blistex, Blistex Incorporated retail own label |
| Nutrition | | | | | | | | |
| Horlicks | | malted drinks and foods | | nutritional beverages & food | | Indian sub-continent, United Kingdom, Ireland | | Bournvita, Mondelez Complan, Heinz |
| | | | |
| 257 | | |
| | | | | |
| GSK Annual Report 2017 | | Strategic report | | |
| | Governance and remuneration | | |
| | Financial statements | | |
| | Investor information | | |
Principal risks and uncertainties
The principal risks discussed below are the risks and uncertainties relevant to our business, financial condition and results of operations that may affect our performance and ability to achieve our objectives. The risks below are those that we believe could cause our actual results to differ materially from expected and historical results.
We must adapt to and comply with a broad range of laws and regulations. These requirements apply to research and development, manufacturing, testing, approval, distribution, sales and marketing of Pharmaceutical, Vaccine and Consumer Healthcare products and affect not only the cost of product development but also the time required to reach the market and the likelihood of doing so successfully.
Moreover, as rules and regulations change, and governmental interpretation of those rules and regulations evolves, the nature of a particular risk may change. Changes to certain regulatory regimes may be substantial. Any change in, and any failure to comply with, applicable law and regulations could materially and adversely affect our financial results.
Similarly, our global business exposes us to litigation and government investigations, including but not limited to product liability litigation, patent and antitrust litigation and sales and marketing litigation. Litigation and government investigations, including related provisions we may make for unfavourable outcomes and increases in related costs such as insurance premiums, could materially and adversely affect our financial results.
More detail on the status and various uncertainties involved in our significant unresolved disputes and potential litigation is set out in Note 45, ‘Legal proceedings,’ on pages 227 to 232.
UK regulations require a discussion of the mitigating activities a company takes to address principal risks and uncertainties. A summary of the activities that the Group takes to manage each of our principal risks accompanies the description of each principal risk below. The principal risks and uncertainties are not listed in order of significance.
Patient safety
Risk definition
Failure to appropriately collect, review, follow up, or report adverse events from all potential sources, and to act on any relevant findings in a timely manner.
Risk impact
The risk impact has the potential to compromise our ability to conduct robust safety signal detection and interpretation and to ensure that appropriate decisions are taken with respect to the risk/ benefit profile of our products, including the completeness and accuracy of product labels and the pursuit of additional studies/ analyses, as appropriate. This could lead to potential harm to patients, reputational damage, product liability claims or other litigation, governmental investigation, regulatory action such as fines, penalties or loss of product authorisation.
Context
Pre-clinical and clinical trials are conducted during the development of investigational Pharmaceutical, Vaccine and Consumer Healthcare products to determine the safety and efficacy of the products for use by humans. Notwithstanding the efforts we make to determine the safety of our products through appropriate pre-clinical and clinical trials, unanticipated side effects may become evident only when products are widely introduced into the marketplace. Questions about the safety of our products may be raised not only by our ongoing safety surveillance and post-marketing studies but also by governmental agencies and third parties that may analyse publicly available clinical trial results.
The Group is currently a defendant in a number of product liability lawsuits, including class actions, that involve significant claims for damages related to our products. Litigation, particularly in the US, is inherently unpredictable. Class actions that seek to sweep together all persons who take our products increase the potential liability. Claims for pain and suffering and punitive damages are frequently asserted in product liability actions and, if allowed, can represent potentially open-ended exposure and thus, could materially and adversely affect the Group’s financial results.
Mitigating activities
The Chief Medical Officer (CMO), who is also the Medical Officer for Pharmaceuticals, is responsible for medical governance under a global policy. Under that policy, safeguarding human subjects in our clinical trials and patients who take our products is of paramount importance, and the CMO has the authoritative role for evaluating and addressing matters of human safety.
Individual Medical Officers within the Pharmaceutical, Vaccines and Consumer Healthcare businesses and our substantial Safety and Pharmacovigilance organisation keep track of any adverse issues reported for our products during the course of clinical studies. Once a Group product is approved for marketing, we have an extensive post-marketing surveillance and signal detection system. Information on possible side effects of products is received from several sources including unsolicited reports from healthcare professionals (HCPs) and patients, regulatory authorities, medical and scientific literature, traditional media and social media. It is our policy that employees are required to report immediately any issues relating to the safety or quality of our products. Each of our country managers is responsible for monitoring, exception tracking and training that helps assure the collection of safety information and reporting the information to the relevant central safety department, in accordance with policy and legal requirements.
Information that changes the risk/benefit profile of one of our products will result in certain actions to characterise, communicate and minimise the risk. Proposed actions are discussed with regulatory authorities and can include modifying the prescribing information, communications to physicians and other healthcare providers, restrictions on product prescribing/availability to help assure safe use, and sometimes carrying out further clinical trials. In certain cases, it may be appropriate to stop clinical trials or to withdraw the medicine from the market.
Our Global Safety Board (GSB), comprising senior physicians and representatives of supporting functions, is an integral component of the system. The GSB (including subsidiary boards dedicated to Consumer Healthcare products and Vaccines) reviews the safety of investigational and our marketed products and has the authority to stop a clinical trial if continued conduct of such trial is not ethically or scientifically justified in light of information that has emerged since the start of the trial.
In addition to the medical governance framework as described above, we use several mechanisms to foster the early evaluation, mitigation, and resolution of disputes as they arise and of potential claims even before they occur. The goal of the programmes is to create a culture of early identification and evaluation of risks and claims (actual or potential), in order to minimise liability and litigation.
| | |
| 258 | | |
GSK Annual Report 2017 | | |
| | |
| | |
Principal risks and uncertaintiescontinued
Product quality
Risk definition
Failure to comply with current Good Manufacturing Practices (cGMP) or inadequate controls and governance of quality in the supply chain covering supplier standards, manufacturing and distribution of products.
Risk impact
A failure to ensure product quality could have far reaching implications in terms of patient and consumer safety resulting in product launch delays, supply interruptions and product recalls. This would have the potential to do damage to our reputation, as well as result in other regulatory, legal and financial consequences.
Context
Patients, consumers and HCPs trust the quality of our products. Product quality may be influenced by many factors including product and process understanding, consistency of manufacturing components, compliance with GMP, accuracy of labelling, reliability of the external supply chain, and the embodiment of an overarching quality culture. The internal and external environment continues to evolve as new products and new legislation are introduced. Critically, we are addressing the impact of Brexit on our supply chain management and quality oversight between the UK and the EU and are developing and deploying appropriate contingency plans to avoid interruption of supply to patients.
Mitigating activities
We have developed and implemented a single Pharmaceutical Quality System (PQS) that defines the quality standards and systems for our businesses associated with Pharmaceuticals, Vaccines and Consumer Healthcare products and clinical trial materials. This system has a broad scope and is applicable throughout the product lifecycle from R&D to mature commercial supply.
There is no single external quality standard or system that governs the detailed global regulatory expectations for the quality of medicinal products. Requirements are often complex and fragmented across national and regional boundaries. Consequently, we have adopted the internationally recognised principles from the ‘ICH Q10: Pharmaceutical Quality Systems’ framework as the basis for the GSK PQS.
This is an industry standard which incorporates quality concepts throughout the product lifecycle. The GSK PQS is augmented by a consolidation of the numerous regulatory requirements defined by markets across the world, which assures that it meets external expectations for product quality in the markets supplied. The PQS is routinely updated to ensure that it keeps pace with the evolving external regulatory environment and with new scientific understanding of our products and processes. As part of our drive to continually improve the operational deployment of our PQS, we are making our policies and procedures simpler to understand and implement, as well as adopting innovative tools to give a more user-friendly experience.
An extensive global network of quality and compliance professionals is aligned with each business unit to provide oversight and assist with the delivery of quality performance and operational compliance, from site level to senior management level. Management oversight of those activities is accomplished through a hierarchy of Quality Councils and through an independent Chief Product Quality Officer and Global Product Quality Office. We provide the Corporate Executive Team & Risk Oversight and Compliance Council with an integrated assessment of Regulated Quality (GxP) performance. The defined key performance indicators cover manufacturing practice, clinical practice, pharmacovigilance practice, regulatory practice, drug safety assessment, and animal welfare.
We have implemented a risk-based approach to assessing and managing third party suppliers that provide materials which are used in finished products. Contract manufacturers making our products are expected to comply with GSK standards and are regularly audited to provide assurance that standards are met.
All staff members are regularly trained to ensure that cGMP standards and behaviours based on our values are followed. Additionally, advocacy and communication programmes are routinely deployed to ensure consistent messages are conveyed across the organisation, whether they originate from changes in regulation, learnings from inspections, or regulatory submissions. There is a continued emphasis on the value of quality performance metrics to facilitate improvement and foster a culture of ‘right first time’.
Financial controls and reporting
Risk definition
Failure to comply with current tax laws or incurring significant losses due to treasury activities; failure to report accurate financial information in compliance with accounting standards and applicable legislation.
Risk impact
Non-compliance with existing or new financial reporting and disclosure requirements, or changes to the recognition of income and expenses, could expose us to litigation and regulatory action and could materially and adversely affect our financial results. Changes in tax laws or in their application with respect to matters such as transfer pricing, foreign dividends, controlled companies, R&D tax credits, taxation of intellectual property or a restriction in tax relief allowed on the interest on debt funding, could impact our effective tax rate. Significant losses may arise from inconsistent application of treasury policies, transactional or settlement errors, or counterparty defaults.
Any changes in the substance or application of the governing tax laws, failure to comply with such tax laws or significant losses due to treasury activities could materially and adversely affect our financial results.
Context
The Group is required by the laws of various jurisdictions to disclose publicly its financial results and events that could materially affect the financial results of the Group. Regulators routinely review the financial statements of listed companies for compliance with new, revised or existing accounting and regulatory requirements. The Group believes that it complies with the appropriate regulatory requirements concerning our financial statements and disclosure of material information including any transactions relating to business restructuring such as acquisitions and divestitures. However, should we be subject to an investigation into potential non-compliance with accounting and disclosure requirements, this may lead to restatements of previously reported results and significant penalties.
| | | | |
| 259 | | |
| | | | | |
| GSK Annual Report 2017 | | Strategic report | | |
| | Governance and remuneration | | |
| | Financial statements | | |
| | Investor information | | |
Financial controls and reportingcontinued
Our Treasury group deals in high value transactions, mostly foreign exchange and cash management transactions, on a daily basis. These transactions involve market volatility and counterparty risk. The Group’s effective tax rate reflects rates of tax in the jurisdictions in which the Group operates that are both higher and lower than the UK rate and takes into account regimes that encourage innovation and investment in science by providing tax incentives which, if changed, could affect the Group’s tax rate. In addition, the worldwide nature of our operations means that our intellectual property, R&D and manufacturing operations are centred in a number of key locations. A consequence of this is that our cross-border supply routes, necessary to ensure supplies of medicines into numerous end markets, can be complex and result in conflicting claims from tax authorities as to the profits to be taxed in individual countries. Tax legislation itself is also complex and differs across the countries in which we operate. As such, tax risk can also arise due to differences in the interpretation of such legislation. The tax charge included in our financial statements is our best estimate of tax liability pending audits by tax authorities.
We expect there to be continued focus on tax reform in 2018 and future years driven by the Organisation for Economic Cooperation & Development’s Base Erosion and Profit Shifting project and European Commission initiatives including the use of fiscal state aid investigations. Together with domestic initiatives around the world, these may result in significant changes to established tax principles and an increase in tax authority disputes. These, regardless of their merit or outcomes, can be costly, divert management attention and may adversely impact our reputation and relationship with key stakeholders.
Mitigating activities
We maintain a control environment designed to identify material errors in financial reporting and disclosure. The design and operating effectiveness of key financial reporting controls are regularly tested by management and via Independent Business Monitoring. This provides us with the assurance that controls over key financial reporting and disclosure processes have operated effectively. A minimum standard control set has been implemented, whereby all Finance personnel, irrespective of size or geographical location, are required to apply and ensure they are monitored. Our Global Finance Risk Management and Controls Centre of Excellence provides extra support to large Group organisations undergoing transformation such as system deployment or significant business transformation. We have also added operational resources to ensure processes and controls are maintained during business transformation, the upgrade of our financial systems and processes. Additional risk mitigation has been introduced by amending the programme timelines of system upgrades.
We keep up-to-date with the latest developments in financial reporting requirements by working with our external auditors and legal advisors.
There is shared accountability for financial results across our businesses. Financial results are reviewed and approved by regional management and then reviewed with the Financial Controller and the Chief Financial Officer (CFO). This allows our Financial Controller and our CFO to assess the evolution of the business over time, and to evaluate performance to plan. Significant judgments are reviewed and confirmed by senior management. Business reorganisations and newly acquired activities are integrated into risk assessments and appropriate controls and reviews are applied.
The Disclosure Committee reporting to the Board, reviews the Group’s quarterly results and Annual Report and determines throughout the year, in consultation with its legal advisors, whether it is necessary to disclose publicly information about the Group through Stock Exchange announcements. The Treasury Management Group meets on a regular basis to seek to ensure that liquidity, interest rate, counterparty, foreign currency transaction and foreign currency translation risks are all managed in line with the conservative approach as detailed in the associated risk strategies and policies which have been adopted by the Board.
Counterparty exposure is subject to defined limits approved by the Board for both credit rating and individual counterparties. Oversight of Treasury’s role in managing counterparty risk in line with agreed policy is performed by a Corporate Compliance Officer, who operates independently of Treasury. Further details on mitigation of Treasury risks can be found on pages 213 and 214, Note 42, ‘Financial instruments and related disclosures’. Tax risk is managed through robust internal policies, processes, training and compliance programmes to ensure we have alignment across our business and meet our tax obligations. We seek to maintain open, positive relationships with governments and tax authorities worldwide and we welcome constructive debate on taxation policy. We monitor government debate on tax policy in our key jurisdictions to deal proactively with any potential future changes in tax law. We engage advisors and legal counsel to confirm the implications for our business of tax legislation such as the recently enacted US Tax Cuts and Jobs Act. Where appropriate we are active in providing relevant business input to tax policy makers. Significant decisions are submitted for consideration to the Tax Governance Board which meets quarterly and comprises senior personnel from across the GSK’s Finance division.
Our tax affairs are managed on a global basis through a co-ordinated team of tax professionals led by the Global Head of Tax who works closely with the business. They are suitably qualified for the roles they perform and we support their training needs in order that they continue to be able to provide up to date technical advice. We submit tax returns according to statutory time limits and engage with tax authorities to seek to ensure our tax affairs are current, entering arrangements such as Continuous Audit Programmes and Advance Pricing Agreements where appropriate. These agreements provide long-term certainty for both tax authorities and for us over the tax treatment of our business. In exceptional cases where matters cannot be settled by agreement with tax authorities, we may have to resolve disputes through formal appeals or other proceedings.
| | |
| 260 | | |
GSK Annual Report 2017 | | |
| | |
| | |
Principal risks and uncertaintiescontinued
Anti-bribery and corruption
Risk definition
Failure of GSK employees, consultants and third parties to comply with our Anti-bribery & corruption (ABAC) principles and standards, as well as with all applicable legislation.
Risk impact
Failure to mitigate this risk could expose the Group and associated persons to governmental investigation, regulatory action and civil and criminal liability and may compromise the Group’s ability to supply its products under certain government contracts. In addition to legal penalties, a failure to prevent bribery through complying with ABAC legislation and regulations could have substantial implications for the reputation of the company, the credibility of senior leaders, and an erosion of investor confidence in our governance and risk management.
Context
We are exposed to bribery and corruption risk through our global business operations. In some markets, the government structure and the rule of law are less developed, and this has a bearing on our bribery and corruption risk exposure. In addition to the global nature of our business, the healthcare sector by its very nature maintains relationships with government bodies, is highly competitive and subject to regulation. This increases the instances where we are exposed to activities and interactions with bribery and corruption risk.
The Group has been subject to a number of ABAC inquiries. We reached a resolution with the US authorities in 2016 regarding their ABAC inquiry, following which we are subject to a self-monitoring arrangement until September 2018. Government investigations regarding our China and other business operations are ongoing. These investigations are discussed further in Note 45, ‘Legal proceedings’.
Mitigating activities
Our Code of Conduct, values and behaviours and commitment to zero tolerance are integral to how we mitigate this risk. In light of the complexity and geographic breadth of this risk, we constantly evolve our oversight of activities and data, reinforce to our workforce clear expectations regarding acceptable behaviours, and maintain regular communications between the centre and local markets.
We have an enterprise-wide ABAC programme designed to ensure compliance with our ABAC policies and mitigate the risk of bribery and corruption. It builds on our values and business standards to form a comprehensive and practical approach to compliance, and is flexible to the evolving nature of our business.
Our ABAC programme is built on best in class principles and is subject to ongoing review and development. It provides us with the basis from which we seek to manage the risk from top down and bottom up. For example, the programme comprises top-level commitment from the Board of Directors and leadership and a global risk assessment to enable targeted intervention and compliance monitoring activities. The programme is underpinned by a global ABAC policy and written standards that address commercial and other practices that give rise to ABAC risk and ongoing training and communications. In addition, the programme mandates enhanced controls over interactions with government officials and during business development transactions. We provide mandatory periodic ABAC training to our staff and relevant third parties in accordance with their roles, responsibilities and the risks they face.
Programme governance is provided by the ABAC Governance Board which includes representation from key functional areas and business units. We have a dedicated ABAC team responsible for the implementation and evolution of the programme in response to developments in the internal and external environment. This is complemented with independent oversight and assurance undertaken by the Audit & Assurance and Independent Business Monitoring teams.
We continually benchmark our ABAC programme against other large multinational companies and use external expertise to drive improvements in the programme.
| | | | |
| 261 | | |
| | | | | |
| GSK Annual Report 2017 | | Strategic report | | |
| | Governance and remuneration | | |
| | Financial statements | | |
| | Investor information | | |
Commercial practices
Risk definition
Failure to engage in commercial activities that are consistent with the letter and spirit of legal, industry, or the Group’s requirements relating to marketing and communications about our medicines and associated therapeutic areas; appropriate interactions with HCPs and patients; and legitimate and transparent transfer of value.
Risk impact
Failure to manage risks related to commercial practices could materially and adversely affect our ability to grow a diversified global business and deliver more products of value for patients and consumers. Failure to comply with applicable laws, rules and regulations may result in governmental investigation, regulatory action and legal proceedings brought against the Group by governmental and private plaintiffs which could result in government sanctions, and criminal and/or financial penalties. Failure to provide accurate and complete information related to our products may result in incomplete awareness of the risk/benefit profile of our products and possibly suboptimal treatment of patients and consumers.
Any practices that are found to be misaligned with our values could also result in reputational harm and dilute trust established with external stakeholders.
Context
We operate on a global basis in an industry that is both highly competitive and highly regulated. Our competitors may make significant product innovations and technical advances and may intensify price competition. In light of this competitive environment, continued development of commercially viable new products and the development of additional uses for existing products that reflect insights which help ensure those products address the needs of patients/consumers, HCPs, and payers are critical to achieve our strategic objectives.
As do other pharmaceutical, vaccine and consumer companies, we face downward price pressure in major markets, declining emerging market growth, and negative foreign exchange impact.
Developing new Pharmaceutical, Vaccine and Consumer Healthcare products is a costly, lengthy and an uncertain process. A product candidate may fail at any stage, including after significant economic and human resources have been invested. Our competitors’ products or pricing strategies or any failure on our part to develop commercially successful products, or to develop additional uses for existing products, could materially and adversely affect our ability to achieve our strategic objectives.
We are committed to the ethical and responsible commercialisation of our products to support our mission to improve the quality of human life by enabling people to do more, feel better, and live longer. To accomplish this mission, we engage the healthcare community in various ways to provide important information about our medicines. Promotion of approved products seeks to ensure that HCPs globally have access to information they need, that patients and consumers have access to the information and products they need and that products are prescribed, recommended or used in a manner that provides the maximum healthcare benefit to patients and consumers. We are committed to communicating information related to our approved products in a responsible, legal, and ethical manner.
Mitigating activities
Our strategic objectives are designed to ensure we achieve our mission of helping people do more, feel better and live longer. We continue to strive for new product launches that are competitive and resourced effectively. We also strive to have a healthy proportion of the Group’s sales ratio attributable to new product or innovation sales.
This innovation helps us defray the effect, for example, of downward price pressure in major markets, declining emerging market growth and negative foreign exchange impact. Establishing new products that are priced to balance expectations of patients and consumers, HCPs, payers, shareholders, and the community enables us to maintain a strong global business and remain relevant to the needs of patients and consumers. Our values and behaviours provide a guide for how we lead and make decisions. We constantly strive to do the right thing and deliver quality products and ensure supply is sustained to meet customer needs and demand requirements, seeking to ensure our actions reflect our values, behaviours and the mission of our company.
We have taken action to enhance and improve standards and procedures for promotional interactions including an increased focus on digital marketing, based on our values of transparency, respect, integrity and patient focus. We have policies and standards governing promotional activities undertaken by us or on our behalf. All of these activities we conduct worldwide must conform to high ethical, regulatory, and industry standards. Where local standards differ from global standards, the more stringent of the two applies. We have harmonised policies and procedures to guide above country commercial practices processes as well as clarified applicable standards for operations in the various markets in which we operate. Each business unit has adopted the Internal Control Framework to support the assessment and management of its risks. Commercial practices activities have appropriate monitoring programmes and oversight from both business unit Risk Management and Compliance Boards and Country Executive Boards that manage risks across in-country business activities. Where in the past we have fallen below our own or any other regulatory or industry standards, we have sought to improve both the framework and culture for our compliance processes.
All promotional materials and activities must be reviewed and approved according to our policies and standards, and conducted in accordance with local laws and regulations, to seek to ensure that these materials and activities fairly represent the products or services of the Group. When necessary, we have disciplined (up to and including termination) employees who have engaged in misconduct and have broadened our ability to claw back remuneration from senior management in the event of misconduct.
We have evolved our commercial operating model, embedding industry leading changes in the compensation model for sales professionals and their managers who interact with HCPs. These changes eliminated rewards based on individual sales or market share of prescription products in individuals’ territories in favour of rewards based on the quality of the individuals’ interactions with HCPs. We now allow fair market value payments to be made by GSK to expert researchers and practitioners to speak about the science behind our products, disease and clinical practice in a limited number of GSK sponsored, medical-led meetings.
| | |
| 262 | | |
GSK Annual Report 2017 | | |
| | |
| | |
Principal risks and uncertaintiescontinued
Research practices
Risk definition
Failure to adequately conduct ethical and sound preclinical and clinical research. In addition, failure to engage in scientific activities that are consistent with the letter and spirit of the law, industry, or the Group’s requirements, and failure to secure adequate patent protection for GSK’s products.
Risk impact
The impacts of the risk include harm to human subjects, reputational damage, failure to obtain the necessary regulatory approvals for our products, governmental investigation, legal proceedings brought against the Group by governmental and private plaintiffs (product liability suits and claims for damages), loss of revenue due to inadequate patent protection or inability to supply GSK products, and regulatory action such as fines, penalties, or loss of product authorisation. Any of these consequences could materially and adversely affect our financial results and cause loss of trust from our customers and patients.
Context
Research relating to animals can raise ethical concerns. While we attempt to address this proactively, animal studies remain a vital part of our research. In many cases, they are the only method that can be used to investigate the effects of a potential new medicine in a living body before it is tested in humans, and they are generally mandated by regulators and ethically imperative. Animal research can provide critical information about the causes of diseases and how they develop. Nonetheless, we are continually seeking ways in which we can minimise our use of animals in research, whilst complying with regulatory requirements.
Clinical trials in healthy volunteers and patients are used to assess and demonstrate an investigational product’s efficacy and safety or further evaluate the product once it has been approved for marketing. We also work with human biological samples. These samples are fundamental to the discovery, development and safety monitoring of our products.
The integrity of our data is essential to success in all stages of the research data lifecycle: design, generation, recording and management, analysis, reporting and storage and retrieval. Our research data is governed by legislation and regulatory requirements. Research data and supporting documents are core components at various stages of pipeline progression decision-making and form the content of regulatory submissions. Poor data integrity can compromise our research efforts and negatively impact company reputation.
There are innate complexities and interdependencies required for regulatory filings, particularly given our global research and development footprint. Continually changing and increasingly stringent submission requirements continue to increase the complexity of worldwide product registration.
Scientific engagement (SE), defined as the interaction and exchange of information between GSK and external communities to advance scientific and medical understanding, including the appropriate development and use of our products, is an essential part of scientific discourse. Such non-promotional engagement with external stakeholder groups is vital to GSK’s mission and necessary for scientific and medical advance. SE activities are essential but present legal, regulatory, and reputational risk if the sharing of data, invited media coverage or payments to HCPs have, or are perceived to have, promotional intent.
A wide variety of biological materials are used by GSK in discovery, research and development phases. Through the Convention on Biological Diversity (CBD) and the Nagoya Protocol, the international community has established a global framework regulating access to, and use of, genetic resources of non-human origin in R&D. We support the principles of access and benefit sharing to genetic resources as outlined in the CBD and the Nagoya Protocol, recognising the importance of appropriate, effective and proportionate implementation measures at national and regional levels.
In addition, any loss of patent protection in a market for GSK’s products developed through our R&D, including reducing the availability or scope of patent rights or compulsory licensing (in which a government forces a manufacturer to license its patents for specific products to a competitor), could materially and adversely affect our financial results in that market. Absence of adequate patent or data exclusivity protection, which could lead to, for example, competition from manufacturers of generic pharmaceutical products, could limit the opportunity to rely on such markets for future sales growth for our products, which could also materially and adversely impact our financial results. Following expiration of certain intellectual property rights, a generic manufacturer may lawfully produce a generic version of a product, and generic drug manufacturers have also exhibited a readiness to market generic versions of many of our most important products prior to the expiration of our patents. Introduction of generic products typically leads to a rapid and dramatic loss of sales and reduces our revenues and margins for our proprietary products. Moreover, in the US, it has become common for patent infringement actions to prompt claims that anti-trust laws have been violated during the prosecution of the patent or during litigation involving the defence of that patent.
| | | | |
| 263 | | |
| | | | | |
| GSK Annual Report 2017 | | Strategic report | | |
| | Governance and remuneration | | |
| | Financial statements | | |
| | Investor information | | |
Research practicescontinued
Mitigating activities
We have an established Office of Animal Welfare, Ethics and Strategy (OAWES), led by the Chief of Animal Welfare, Ethics and Strategy, that ensures the humane and responsible care of animals and increases the knowledge and application of non-animal alternatives. The OAWES provides a framework of animal welfare governance, promotes application of 3Rs (replacement, refinement and reduction of animals in research), conducts quality assessments and develops and deploys strategies on animal model reproducibility and translatability.
The Chief Medical Officer oversees the following enterprise Medical Governance Boards:
| – | | The Human Subject Research Board is in place to provide oversight for the management of clinical trials sponsored and supported by us to ensure they conform to ethical, medical and scientific standards. |
| – | | The Data Disclosure Board provides oversight for disclosure of our sponsored and supported clinical trials. We make information available on our clinical studies, including summaries of the results – whether positive or negative. We were the first company to publish clinical study reports that form the basis of submissions to regulatory agencies and we have publicly posted more than 2,300 clinical study reports in addition to more than 6,300 study result summaries. Detailed and appropriately protected patient-level data from approximately 2,000 clinical studies can be requested and accessed through clinicalstudysatarequest.com.. |
| – | | Specific accountability and authorisation for SE is overseen by the Scientific Engagement and Promotional Practices Board. This Board is responsible for oversight of applicable policies and seeking to ensure the highest level of integrity and continuous development of SE. |
We have a Global Human Biological Samples Management (HBSM) governance framework in place to oversee the ethical and lawful acquisition and management of human biological samples. Our global HBSM network champions HBSM activities and provides an experienced group to support internal sample custodians on best practice.
It remains an important priority to enhance our data integrity controls. Data Integrity Committees are in place to provide oversight and a Data Integrity Quality Assurance team conducts assessments to provide independent business monitoring of our internal controls for R&D activities.
The Chief Regulatory Officer chairs the Regulatory Governance Board which serves as the global regulatory risk management and compliance board, promoting compliance with regulatory requirements and procedures and oversees Group-wide written standards for cross business regulatory processes.
We established an Access and Benefit Sharing Centre of Excellence to oversee applicable requirements and enforcement measures for the acquisition and use of genetic material of non-human origin in scope of the Nagoya Protocol.
R&D maintains and controls pre-publication procedures to guard against public disclosure in advance of filing patent applications. In addition, because loss of patent protection can occur due to lack of data integrity in preparing patent application data and information, legal experts collaborate with R&D to support the review process for new patent applications.
The Research Practices risk is now aligned with a new Enterprise framework that seeks to ensure strengthened governance across the R&D businesses in Pharmaceuticals, Vaccines and Consumer Healthcare. Under the leadership of the Chief Research Practices Officer, management of the risk takes a pragmatic approach to information sharing, streamlining risk identification and escalation while ensuring ownership stays at the business unit level and allows for a proportional risk treatment.
| | |
| 264 | | |
GSK Annual Report 2017 | | |
| | |
| | |
Principal risks and uncertaintiescontinued
Third party oversight risk
Risk definition
Failure to maintain adequate governance and oversight over third party relationships and failure of third parties to meet their contractual, regulatory, confidentiality or other obligations.
Risk impact
Failure to adequately manage third party relationships could result in business disruption and exposure to risks ranging from sub-optimal contractual terms and conditions, to severe business and legal sanctions and/or significant reputational damage. Any of these consequences could materially and adversely affect our business operations and financial results.
Context
Third parties are critical to our business delivery and are an integral part of the solution to meeting our business objectives. We rely on third parties, including suppliers, advisors, distributors, individual contractors, licensees, and other pharmaceutical and biotechnology collaboration partners for discovery, manufacture, and marketing of our products and for supporting other important business processes.
These business relationships present a material risk. For example, we share critical and sensitive information such as marketing plans, clinical data, and employee data with specific third parties who are conducting the relevant outsourced business activities. Inadequate protection or misuse of this information by third parties could have significant business impact. Similarly, we use distributors and agents in a range of activities such as promotion and tendering which have inherent risks such as inappropriate promotion or corruption. Insufficient internal compliance and controls by the distributors could affect our reputation. These risks are further increased by the complexities of working with large numbers of third parties across a diverse geographical spread.
Mitigating activities
Each business unit leadership team retains ultimate accountability for managing third party interactions and risks. When working with third parties, our employees are expected to manage external interactions and commitments responsibly. This expectation is embedded in our values and Code of Conduct. It is our responsibility that all activities carried out on our behalf are performed safely and in compliance with applicable laws and our values, standards and Code of Conduct.
To guide and enforce our global principles for interactions with third parties we have in place a policy framework applicable to buying goods and services, managing our external spend, paying and working with our third parties. This policy framework applies to all employees and complementary workers worldwide. The framework is complemented by technical and local standards designed to ensure alignment with the nature of third party interactions, such as good manufacturing practice and adherence to local laws and regulations. Independent Business Monitoring of key financial and operational controls is in place and is supplemented by periodic checks from the company’s independent Audit & Assurance function.
Continuous monitoring and performance of third parties is enhanced through the Third Party Oversight Programme managed through the Global Ethics and Compliance organisation. The programme takes an enterprise-wide view of third party related risks, has strengthened risk assessment, contractual terms and due diligence efforts on third parties and improved the overall management of our third party risks through the lifecycle of the third party engagement.
Environment, health & safety and sustainability
Risk definition
Failure to manage environment, health & safety and sustainability (EHS&S) risks in line with our objectives and policies and with relevant laws and regulations.
Risk impact
Failure to manage EHS&S risks could lead to significant harm to people, the environment and communities in which we operate, fines, failure to meet stakeholder expectations and regulatory requirements, litigation or regulatory action, and damage to the Group’s reputation, which could materially and adversely affect our financial results.
Context
We are subject to health, safety and environmental laws of various jurisdictions. These laws impose duties to protect people, the environment, and the communities in which we operate, as well as potential obligations to remediate contaminated sites. We have also been identified as a potentially responsible party under the US Comprehensive Environmental Response Compensation and Liability Act at a number of sites for remediation costs relating to our use or ownership of such sites in the US. Failure to manage these environmental risks properly could result in litigation, regulatory action and additional remedial costs that may materially and adversely affect our financial results. See Note 45 to the financial statements, ‘Legal proceedings’, for a discussion of the environmental related proceedings in which we are involved. We routinely accrue amounts related to our liabilities for such matters.
Mitigating activities
The Corporate Executive Team (CET) is responsible for EHS&S governance under a global policy. Under that policy, the CET seeks to ensure there is a control framework in place to manage the risks, impacts and legal compliance issues that relate to EHS&S and for assigning responsibility to senior managers for providing and maintaining those controls. Individual managers seek to ensure that the EHS&S control framework is effective and well implemented in their respective business area and that it is fully compliant with all applicable laws and regulations, adequately resourced, maintained, communicated, and monitored. Additionally, each employee is personally responsible for ensuring that all applicable local standard operating procedures are followed by them and expected to take responsibility for EHS&S matters.
Our risk-based, proactive approach is articulated in our refreshed Global EHS&S standard which supports our EHS&S policy and our objective to discover, develop, manufacture, supply and sell our products without harming people or the environment. In addition to the design and provision of safe facilities, plant and equipment, we operate rigorous procedures that help us eliminate hazards where practicable and protect employees’ health and well-being. Through our continuing efforts to improve environmental sustainability we have reduced our value chain carbon intensity per pack, water consumption and waste generation. We actively manage our environmental remediation obligations and seek to ensure practices are environmentally sustainable and compliant. Our EHS&S performance results are shared externally each year in our Responsible Business Supplement.
| | | | |
| 265 | | |
| | | | | |
| GSK Annual Report 2017 | | Strategic report | | |
| | Governance and remuneration | | |
| | Financial statements | | |
| | Investor information | | |
Information protection
Risk definition
The risk to GSK business activities if information becomes disclosed to those not authorised to see it, or if information or systems fail to be available or are corrupted, typically because of cybersecurity threats, although accident or malicious insider action may be contributory causes.
This also includes the risk of failure to collect, secure, and use personal information in accordance with data privacy laws.
Risk impact
Failure to adequately protect critical and sensitive systems and information may result in loss of commercial or strategic advantage and could materially affect our ongoing business operations, such as scientific research, clinical trials and manufacturing and supply chain activities. Failure to comply with data privacy laws could lead to adverse impact on individuals (for example financial loss, distress or prejudice). In both cases, damage to our reputation, litigation, or other business disruption including regulatory sanction could occur, which could materially and adversely affect our financial results.
Context
We rely on critical and sensitive systems and data, such as corporate strategic plans, intellectual property, manufacturing systems and trade secrets. There is the potential that our computer systems or information may be exposed to misuse or unauthorised disclosure.
We believe that the cyber security incidents that we have experienced to date have not resulted in significant disruptions to our operations, and have not had a significant adverse effect on our results of operations, or on third parties. However, as the threats evolve we cannot provide assurance that our significant efforts in protecting and monitoring our systems and information will always be successful in preventing compromise or disruption in future.
All parts of our business process personal information. The use of this information is critical to our operations and innovation, including the development and sale of our products, as well as management of our employees.
New and evolving laws and regulations, such as the European Union General Data Protection Regulation (GDPR), are likely to bring increased scrutiny of our data management.
Mitigating activities
We have a global information protection policy and accompanying information technology standards and processes that are supported through a dedicated team and programme of activity. Our Information Protection function provides strategy, direction, and oversight, including active monitoring of cyber security, while enhancing our global information security capabilities, through an ongoing programme of investment that is in its fifth year.
We assess changes in our information protection risk environment through briefings by government agencies, subscription to commercial threat intelligence services and knowledge sharing with other pharmaceutical businesses and cross-industry bodies. Such changes are regularly reviewed by our Executive team and our Board and suitable adjustments agreed.
We aim to apply industry best practices as part of our information security policies, processes and technologies and invest in strategies that are commensurate with the changing nature of the security threat landscape. This will include suitable levels of cyber-risk insurance cover in future.
Nevertheless, cyber threats are growing and evolving. They increasingly involve highly-resourced threat actors such as nation-states and organised criminals. Combined with the size and complexity of our IT systems and those of our supply chain partners (including outsourced operations), this means that our systems and information have been and are expected to continue to be, the subject of cyber-attacks of various types.
We are enhancing our approach to data privacy compliance, in part to comply with the new EU General Data Protection Regulation (GDPR), by deploying an enterprise-wide privacy programme, launched in 2017 and scheduled for deployment in 2018.
This will involve greater standardisation and additional expert resources to support the business. New standards and controls will enable us to better to address data privacy at the outset of any business process. These changes also prepare us for the introduction of GDPR in May 2018.
All employees are required to complete training on privacy and the appropriate handling and maintaining of personal information. Programme governance is provided by the Privacy Governance Board, which includes representation from key functional areas. We have a dedicated Privacy team, responsible for the implementation and evolution of the programme in response to developments in the internal and external environment.
| | |
| 266 | | |
GSK Annual Report 2017 | | |
| | |
| | |
Principal risks and uncertaintiescontinued
Supply continuity and crisis management
Risk definition
Failure to deliver a continuous supply of compliant finished product; inability to respond effectively to a crisis incident in a timely manner to recover and sustain critical operations, including key supply chains.
Risk impact
We recognise that failure to supply our products can adversely impact consumers and patients who rely on them. A material interruption of supply or exclusion from healthcare programmes could expose us to litigation or regulatory action and financial penalties that could adversely affect the Group’s financial results. The Group’s international operations, and those of its partners, expose our workforce, facilities, operations and information technology to potential disruption from natural events (e.g. storm or earthquake), man-made events (e.g. civil unrest, terrorism), and global emergencies (e.g. Ebola outbreak, Flu pandemic). It is important that we have robust crisis management and recovery plans in place to manage such events.
Context
Our supply chain operations are subject to review and approval by various regulatory agencies that effectively provide our licence to operate. Failure by our manufacturing and distribution facilities or by suppliers of key services and materials could lead to litigation or regulatory action such as product recalls and seizures, interruption of supply, delays in the approval of new products, and suspension of manufacturing operations pending resolution of manufacturing or logistics issues.
We rely on materials and services provided by third party suppliers to make our products, including active pharmaceutical ingredients (API), antigens, intermediates, commodities, and components for the manufacture and packaging of Pharmaceutical, Vaccine and Consumer Healthcare products. Some of the third party services procured, such as services provided by contract manufacturing and clinical research organisations to support development of key products, are important to ensure continuous operation of our businesses.
Although we undertake risk mitigation we recognise that certain events could nevertheless still result in delays or service interruptions. We use effective crisis management and business continuity planning to provide for the health and safety of our people and to minimise impact to us, by maintaining functional operations following a natural or man-made disaster, or a public health emergency.
Mitigating activities
Our supply chain model is designed to ensure the supply, quality and security of our products globally, as far as possible. We closely monitor, through the Supply Chain Governance Committees, the inventory status and delivery of our products with the aim to ensure that customers have the Pharmaceutical, Vaccines and Consumer Healthcare products they need. Improved links between commercial forecasting and manufacturing made possible by our core commercial cycle should, over time, reduce the risk associated with demand fluctuations and any impact on our ability to supply or the cost of write-offs where products exceed their expiry date. Each node of the supply chain is periodically reviewed to ensure adequate safety stock, while balancing working capital in our end-to-end supply chain. Particular attention is placed on mitigating supply risks associated with medically critical and high-revenue products.
We routinely monitor the compliance of manufacturing external suppliers to identify and manage risks in our supply base. Where practical, we minimise our dependence on single sources of supply for critical items. Where alternative sourcing arrangements are not possible, our inventory strategy aims to protect the supply chain from unanticipated disruption.
We continue to implement anti-counterfeit systems such as product serialisation in accordance with emerging supply chain requirements around the world.
A corporate policy requires each business unit and functional area head to ensure effective crisis management and business continuity plans are in place that include authorised response and recovery strategies, key areas of responsibility and clear communication routes, before any business disruption occurs.
Corporate Security supports the business by: coordinating crisis management and business continuity training; facilitating simulation exercises; assessing our preparedness and recovery capability; and providing assurance oversight of our central repository of plans supporting our critical business processes. Each business unit has a governance board which performs risk oversight and monitoring including identifying new and emerging threats. We have a coordinated approach to evaluate and manage the implications for our business arising from Brexit. Our approach to Brexit is set out on page 55.
These activities help ensure an appropriate level of readiness and response capability is maintained. We also develop and maintain partnerships with external bodies like the Business Continuity Institute and the UN International Strategy for Disaster Risk Reduction, which helps improve our business continuity initiatives in disaster-prone areas and supports the development of community resilience to disasters.
| | | | |
| 267 | | |
| | | | | |
| GSK Annual Report 2017 | | Strategic report | | |
| | Governance and remuneration | | |
| | Financial statements | | |
| | Investor information | | |
Shareholder information
Share capital and control
Details of our issued share capital and the number of shares held in Treasury as at 31 December 2017 can be found in Note 33 to the financial statements, ‘Share capital and share premium account’.
Our Ordinary Shares are listed on the London Stock Exchange and are also quoted on the New York Stock Exchange (NYSE) in the form of American Depositary Shares (ADS). Each ADS represents two Ordinary Shares. For details of listed debt and where it is listed refer to Note 31 to the financial statements, ‘Net debt’.
Holders of Ordinary Shares and ADS are entitled to receive dividends (when declared), the company’s Annual Report, to attend and speak at general meetings of the company, to appoint proxies and to exercise voting rights.
There are no restrictions on the transfer, or limitations on the holding, of Ordinary Shares and ADS and no requirements to obtain approval prior to any transfers. No Ordinary Shares or ADS carry any special rights with regard to control of the company and there are no restrictions on voting rights. Major shareholders have the same voting rights per share as all other shareholders. There are no known arrangements under which financial rights are held by a person other than the holder of the shares and no known agreements on restrictions on share transfers or on voting rights.
Shares acquired through the Group’s employee share plans rank equally with the other shares in issue and have no special rights. The trustees of our Employee Share Ownership Plan trusts have waived their rights to dividends on shares held by those trusts.
Exchange controls and other limitations affecting security holders
Other than certain economic sanctions, which may be in force from time to time, there are currently no applicable laws, decrees or regulations in force in the UK restricting the import or export of capital or affecting the remittance of dividends or other payments to holders of the company’s shares who are non-residents of the UK. Similarly, other than certain economic sanctions which may be in force from time to time, there are no limitations relating only to non-residents of the UK under English law or the company’s Articles of Association on the right to be a holder of, and to vote in respect of, the company’s shares.
Interests in voting rights
Other than as stated below, as far as we are aware, there are no persons with significant direct or indirect holdings in the company. Information provided to the company pursuant to the Financial Conduct Authority’s (FCA) Disclosure Guidance and Transparency Rules (DTRs) is published on a Regulatory Information Service and on the company’s website, www.gsk.com.
The company had received notifications in accordance with the FCA’s DTRs of the following notifiable interests in the voting rights in the company’s issued share capital:
| | | | | | | | | | | | | | | | |
| | | 31 December 2017 | | | | | | 2 March 2018 | |
| | | No. of shares | | | *Percentage
of issued
capital (%) | | | No. of shares | | | *Percentage
of issued
capital (%) | |
BlackRock, Inc | | | 348,457,982 | | | | 7.03 | | | | 338,195,351 | | | | 6.82 | |
| * | Percentage of Ordinary shares in issue, excluding Treasury shares. |
We have not acquired or disposed of any interests in our own shares during the period under review, with the exception of those transferred from Treasury to satisfy awards under the Group’s employee share plans.
Share buy-back programme
The Board has been authorised to issue and allot Ordinary Shares under Article 9 of the company’s Articles of Association. The power under Article 9 and the authority for the company to make purchases of its own shares are subject to shareholder authorities which are sought on an annual basis at our Annual General Meeting (AGM). Any shares purchased by the company may be cancelled or held as Treasury shares or used for satisfying share options and grants under Group employee share plans.
Our programme covers purchases of shares for cancellation or to be held as Treasury shares, in accordance with the authority renewed by shareholders at the AGM in May 2017, when the company was authorised to purchase a maximum of just under 492 million shares. Details of shares purchased, those cancelled, those held as Treasury shares and those subsequently transferred from Treasury to satisfy awards under the Group’s employee share plans are disclosed in Note 33 to the financial statements, ‘Share capital and share premium account’.
In determining specific share repurchase levels, the company considers the development of free cash flow during the year. Given the impact of the sustained strength of Sterling on free cash flow, the company suspended its share repurchase programme during 2014. No shares were purchased during the financial years ended 2015, 2016 or 2017.
The company confirms that it does not currently intend to make any market purchases in 2018. The company will review the potential for future share buy-backs during 2019 in line with its usual annual cycle and subject to return and ratings criteria.
Market capitalisation
The market capitalisation, based on shares in issue excluding Treasury shares, of GSK at 31 December 2017 was £65.57 billion. At that date, GSK was the sixth largest company by market capitalisation in the FTSE index.
Share price
| | | | | | | | | | | | |
| | | 2017
£ | | | 2016
£ | | | 2015
£ | |
At 1 January | | | 15.62 | | | | 13.73 | | | | 13.76 | |
At 31 December | | | 13.23 | | | | 15.62 | | | | 13.73 | |
(Decrease)/increase | | | (15.3 | )% | | | 13.8 | % | | | (0.2 | )% |
High during the year | | | 17.22 | | | | 17.23 | | | | 16.42 | |
Low during the year | | | 12.76 | | | | 13.44 | | | | 12.38 | |
The table above sets out the middle market closing prices. The company’s share price decreased by 15.3% in 2017. This compares with an increase in the FTSE 100 index of 7.6% during the year. The share price on 2 March 2018 was £12.90.
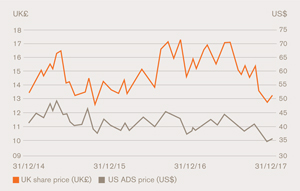
| | |
| 268 | | |
GSK Annual Report 2017 | | |
| | |
| | |
Shareholder informationcontinued
Share capital and controlcontinued
Nature of trading market
The following tables set out, for the periods indicated, the high and low middle market closing quotations in pence for the shares on the London Stock Exchange, and the high and low closing prices in US dollars for the ADS on the NYSE.
| | | | | | | | | | | | | | | | |
| | | Ordinary Shares | | | ADS | |
| | | Pence per share | | | US dollars per share | |
| | | High | | | Low | | | High | | | Low | |
| | | | |
March 2018* | | | 1304 | | | | 1290 | | | | 36.22 | | | | 35.97 | |
| | | | |
February 2018 | | | 1325 | | | | 1243 | | | | 37.70 | | | | 35.49 | |
| | | | |
January 2018 | | | 1364 | | | | 1320 | | | | 39.04 | | | | 36.40 | |
| | | | |
December 2017 | | | 1323 | | | | 1276 | | | | 35.58 | | | | 34.66 | |
| | | | |
November 2017 | | | 1363 | | | | 1280 | | | | 36.48 | | | | 34.81 | |
| | | | |
October 2017 | | | 1536 | | | | 1358 | | | | 41.10 | | | | 36.23 | |
| | | | |
September 2017 | | | 1533 | | | | 1452 | | | | 40.65 | | | | 39.89 | |
| | | | |
Quarter ended 31 December 2017 | | | 1536 | | | | 1276 | | | | 41.10 | | | | 34.66 | |
| | | | |
Quarter ended 30 September 2017 | | | 1630 | | | | 1452 | | | | 42.77 | | | | 38.68 | |
| | | | |
Quarter ended 30 June 2017 | | | 1722 | | | | 1550 | | | | 44.37 | | | | 40.68 | |
| | | | |
Quarter ended 31 March 2017 | | | 1691 | | | | 1520 | | | | 42.73 | | | | 38.72 | |
| | | | |
Quarter ended 31 December 2016 | | | 1723 | | | | 1459 | | | | 43.44 | | | | 37.39 | |
| | | | |
Quarter ended 30 September 2016 | | | 1712 | | | | 1592 | | | | 45.49 | | | | 42.50 | |
| | | | |
Quarter ended 30 June 2016 | | | 1605 | | | | 1388 | | | | 43.47 | | | | 40.04 | |
| | | | |
Quarter ended 31 March 2016 | | | 1439 | | | | 1345 | | | | 42.05 | | | | 38.54 | |
| | | | |
Year ended 31 December 2017 | | | 1722 | | | | 1276 | | | | 44.37 | | | | 34.66 | |
| | | | |
Year ended 31 December 2016 | | | 1723 | | | | 1345 | | | | 45.49 | | | | 37.39 | |
| | | | |
Year ended 31 December 2015 | | | 1642 | | | | 1238 | | | | 48.81 | | | | 37.56 | |
| | | | |
Year ended 31 December 2014 | | | 1691 | | | | 1324 | | | | 56.66 | | | | 41.30 | |
| | | | |
Year ended 31 December 2013 | | | 1782 | | | | 1359 | | | | 53.68 | | | | 43.93 | |
* to 2 March 2018 | | | | | | | | | | | | |
Analysis of shareholdings at 31 December 2017 | |
| | | Number of | | | % of total | | | % of total | | | Number of | |
| | | accounts | | | accounts | | | shares | | | shares | |
| | | | |
Holding of shares | | | | | | | | | | | | | | | | |
| | | | |
Up to 1,000 | | | 81,508 | | | | 71.27 | | | | 0.53 | | | | 28,558,492 | |
| | | | |
1,001 to 5,000 | | | 25,832 | | | | 22.59 | | | | 1.04 | | | | 55,701,236 | |
| | | | |
5,001 to 100,000 | | | 5,909 | | | | 5.17 | | | | 1.64 | | | | 88,042,723 | |
| | | | |
100,001 to 1,000,000 | | | 758 | | | | 0.66 | | | | 4.92 | | | | 264,426,210 | |
| | | | |
Over 1,000,000 | | | 362 | | | | 0.31 | | | | 91.87 | | | | 4,935,825,159 | |
| | | | |
| | | | 114,369 | | | | 100.00 | | | | 100.00 | | | | 5,372,553,820 | |
| | | | |
Held by | | | | | | | | | | | | | | | | |
| | | | |
Nominee companies | | | 5,417 | | | | 4.74 | | | | 63.60 | | | | 3,416,723,552 | |
| | | | |
Investment and trust companies | | | 21 | | | | 0.02 | | | | 0.08 | | | | 4,444,309 | |
| | | | |
Insurance companies | | | 4 | | | | 0.00 | | | | 0.00 | | | | 1,894 | |
| | | | |
Individuals and other corporate bodies | | | 108,925 | | | | 95.24 | | | | 11.25 | | | | 604,455,960 | |
| | | | |
BNY (Nominees) Limited | | | 1 | | | | 0.00 | | | | 17.35 | | | | 932,322,155 | |
| | | | |
Held as Treasury shares by GlaxoSmithKline | | | 1 | | | | 0.00 | | | | 7.72 | | | | 414,605,950 | |
BNY Mellon is the Depositary for the company’s ADS, which are listed on the NYSE. Ordinary Shares representing the company’s ADS programme, which is managed by the Depositary, are registered in the name of BNY (Nominees) Limited. At 2 March 2018, BNY (Nominees) Limited held 931,975,461 Ordinary Shares representing 18.79% of the issued share capital (excluding Treasury shares) at that date.
At 2 March 2018, the number of holders of Ordinary Shares in the US was 1,007 with holdings of 1,093,635 Ordinary Shares, and the number of registered holders of ADS was 465,987,730 with holdings of 22,275 ADS. Certain of these Ordinary Shares and ADS were held by brokers or other nominees. As a result, the number of holders of record or registered holders in the US is not representative of the number of beneficial holders or of the residence of beneficial holders.
| | | | |
| 269 | | |
| | | | | |
| GSK Annual Report 2017 | | Strategic report | | |
| | Governance and remuneration | | |
| | Financial statements | | |
| | Investor information | | |
Dividends
The company pays dividends quarterly and continues to return cash to shareholders through its dividend policy. Dividends remain an essential component of total shareholder return and GSK recognises the importance of dividends to shareholders. The company aims to distribute regular dividend payments that will be determined primarily with reference to the free cash flow generated by the business after funding the investment necessary to support the Group’s future growth.
The Board intends to maintain the dividend for 2018 at the current level of 80p per share, subject to any material change in the external environment or performance expectations. Over time, as free cash flow strengthens, it intends to build free cash flow cover of the annual dividend to a target range of 1.25-1.50x, before returning the dividend to growth. Details of the dividends declared, the amounts and the payment dates are given in Note 16 to the financial statements, ‘Dividends’.
Dividends per share
The table below sets out the dividend per share and per ADS for the last five years. The dividend per ADS is translated into US dollars at applicable exchange rates.
| | | | | | | | | | |
| Year | | Dividend | | pence | | | US$ | |
| | | |
2017 | | | | | 80 | | | | –1 | |
| | | |
2016 | | | | | 80 | | | | 2.00 | |
| | | |
2015 | | Special* | | | 20 | | | | 0.57 | |
| | | |
2015 | | | | | 80 | | | | 2.37 | |
| | | |
2014 | | | | | 80 | | | | 2.59 | |
| | | |
2013 | | | | | 78 | | | | 2.47 | |
| 1 | The Q4 2017 interim ordinary dividend receivable by ADS holders will be calculated based on the exchange rate on 12 April 2018. An annual fee of $0.02 per ADS (or $0.005 per ADS per quarter) will be charged by the Depository. The cumulative dividend receivable by ADS holders for Q1, Q2 and Q3 2017 was $1.51. |
| * | The 2015 special dividend related to the return of part of the net cash proceeds from the Novartis transaction completed in March 2015. This was paid with the fourth quarter ordinary dividend for 2015. |
Dividend calendar
| | | | | | |
| Quarter | | Ex-dividend date | | Record date | | Payment date |
| | | |
Q4 2017 | | 22 February 2018 | | 23 February 2018 | | 12 April 2018 |
| | | |
Q1 2018 | | 10 May 2018 | | 11 May 2018 | | 12 July 2018 |
| | | |
Q2 2018 | | 9 August 2018 | | 10 August 2018 | | 11 October 2018 |
| | | |
Q3 2018 | | 15 November 2018 | | 16 November 2018 | | 10 January 2019 |
Financial calendar
| | |
| Event | | Date |
Quarter 1 Results announcement | | April 2018 |
| |
Annual General Meeting | | May 2018 |
| |
Quarter 2 Results announcement | | July 2018 |
| |
Quarter 3 Results announcement | | October 2018 |
| |
Preliminary/Quarter 4 Results announcement | | February 2019 |
| |
Annual Report publication | | February/March 2019 |
| |
Annual Report distribution | | March 2019 |
Information about the company, including the share price, is available on our website at www.gsk.com. Information made available on the website does not constitute part of this Annual Report.
Results announcements
Results announcements are issued to the London Stock Exchange and are available on its news service. They are also sent to the US Securities and Exchange Commission and the NYSE, issued to the media and made available on our website.
Financial reports
The company publishes an Annual Report which is made available on our website from the date of publication. Shareholders may elect to receive the Annual Report by contacting the registrar. Alternatively, shareholders may elect to receive notification by email of the publication of financial reports by registering on www.shareview.co.uk.
Copies of previous financial reports are available on our website. Printed copies can be obtained from our registrar in the UK (see page 272 for the contact details).
| | |
| 270 | | |
GSK Annual Report 2017 | | |
| | |
| | |
Shareholder informationcontinued
Annual General Meeting 2018
2.30pm (UK time) on 3 May 2018
The Queen Elizabeth II Centre, Broad Sanctuary, Westminster, London SW1P 3EE.
The AGM is the company’s principal forum for communication with private shareholders. In addition to the formal business, there will be a presentation by the CEO on the performance of the Group and its future development. There will be an opportunity for questions to be asked to the Board. Chairmen of the Board’s Committees will take questions relating to those Committees.
Investors holding shares through a nominee service should arrange with that nominee service to be appointed as a proxy in respect of their shareholding in order to attend and vote at the meeting.
ADS holders wishing to attend the meeting should contact BNY Mellon, as Depositary, to request a proxy appointment. This will enable them to attend and vote on the business to be transacted. ADS holders may instruct BNY Mellon as to the way in which the shares represented by their ADS should be voted by completing and returning the voting card provided by the Depositary.
Documents on display
The Articles of Association of the company and Directors’ service contracts or, where applicable, letters of appointment between Directors and the company or any of its subsidiaries (and any side letters relating to severance terms and pension arrangements) are available for inspection at the company’s registered office and will be made available for inspection at the AGM.
Tax information for shareholders
A summary of certain UK tax and US federal income tax consequences for holders of shares and ADS who are citizens of the UK or the US is set out below. It is not a complete analysis of all the possible tax consequences of the purchase, ownership or sale of these securities. It is intended only as a general guide. Holders are advised to consult their advisers with respect to the tax consequences of the purchase, ownership or sale of their shares or ADS and the consequences under state and local tax laws in the US and the implications of the current UK/US tax conventions.
US holders of ADS generally will be treated as the owners of the underlying shares for the purposes of the current US/UK double taxation conventions relating to income and gains (Income Tax Convention), estate and gift taxes (Estate and Gift Tax Convention), and for purposes of the Internal Revenue Code of 1986, as amended (the Code).
UK shareholders
This summary only applies to a UK resident shareholder that holds shares as capital assets.
Taxation of dividends
For UK tax years from 2016/17 UK resident individuals are entitled to a dividend tax allowance of up to £5,000, so that the first £5,000 of dividends received in a tax year will be free of tax. This allowance will reduce to £2,000 from the 2018/19 UK tax year onwards. Dividends in excess of this allowance will be taxed at 7.5% for basic rate taxpayers, 32.5% for higher rate taxpayers and 38.1% for additional rate taxpayers.
UK resident shareholders that are corporation taxpayers should note that dividends payable on ordinary shares are generally entitled to exemption from corporation tax.
Taxation of capital gains
UK resident shareholders may be liable for UK tax on gains on the disposal of shares or ADS.
For disposals by individuals from the 2016/17 UK tax year onwards, a taxable capital gain accruing on a disposal of shares or ADS will be taxed at 10% for basic rate taxpayers, or 20% if, after all allowable deductions, the individual’s taxable income for the year exceeds the basic rate income tax limit. Note this is following the use of any exceptions available to the individual taxpayer such as the annual exempt amount.
Corporation taxpayers may be entitled to an indexation allowance which applies to reduce capital gains to the extent that such gains arise due to inflation. Indexation allowance may reduce a chargeable gain but will not create an allowable loss. For assets acquired on or before 1 January 2018, legislation in the Finance Bill (No. 2) 2017-19 freezes the level of indexation allowance that is given in calculating a company’s chargeable gains at the value that would apply to the disposal of an asset in December 2017. For assets acquired from 1 January 2018 onwards, legislation in the Finance Bill (No. 2) 2017-19 removes any indexation allowance on disposal.
Inheritance tax
Individual (UK-domiciled or otherwise) shareholders may be liable to UK inheritance tax on the transfer of shares or ADS. Tax may be charged on the amount by which the value of the shareholder’s estate is reduced as a result of any transfer by way of lifetime gift or other disposal at less than full market value. In the case of a bequest on death, tax may be charged on the value of the shares at the date of the shareholder’s death. If such a gift or other disposal were subject to both UK inheritance tax and US estate or gift tax, the Estate and Gift Tax Convention would generally provide for tax paid in the US to be credited against tax payable in the UK.
| | | | |
| 271 | | |
| | | | | |
| GSK Annual Report 2017 | | Strategic report | | |
| | Governance and remuneration | | |
| | Financial statements | | |
| | Investor information | | |
Tax information for shareholderscontinued
Stamp duty and stamp duty reserve tax
UK stamp duty and/or stamp duty reserve tax (SDRT) will, subject to certain exemptions, be payable on the transfer of shares at a rate of 0.5% (rounded up to the nearest £5 in the case of stamp duty) of the consideration for the transfer. Notwithstanding this, provided that an instrument is executed in pursuance of the agreement that gave rise to the charge to SDRT and that instrument is stamped within six years of the agreement (including being stamped as exempt) any SDRT charge should be cancelled and any SDRT which has already been paid will be repaid.
US shareholders
This summary only applies to a shareholder (who is a citizen or resident of the US or a domestic corporation or a person that is otherwise subject to US federal income tax on a net income basis in respect of the shares or ADS) that holds shares or ADS as capital assets, is not resident in the UK for UK tax purposes and does not hold shares for the purposes of a trade, profession or vocation that is carried on in the UK through a branch or agency.
The summary also does not address the tax treatment of holders that are subject to special tax rules, such as banks, tax-exempt entities, insurance companies, dealers in securities or currencies, persons that hold shares or ADS as part of an integrated investment (including a ‘straddle’) comprised of a share or ADS and one or more other positions, and persons that own (directly or indirectly) 10% or more of the voting stock of the company, nor does it address tax treatment that may be applicable as a result of international income tax treaties.
Taxation of dividends
The gross amount of dividends received is treated as foreign source dividend income for US tax purposes. It is not eligible for the dividend received deduction allowed to US corporations. Dividends on ADS are payable in US dollars; dividends on shares are payable in Sterling. Dividends paid in Sterling will be included in income in the US dollar amount calculated by reference to the exchange rate on the day the dividends are received by the holder. Subject to certain exceptions for short-term or hedged positions, an individual eligible US holder will be subject to US taxation at a maximum rate of 23.8% in respect of qualified dividends. A qualified dividend as defined by the US Internal Revenue Service (IRS) is a dividend that meets the following criteria:
| 1. | Must be issued by a US corporation, a corporation incorporated in a US possession, or a corporation that is eligible for the benefits of a comprehensive income tax treaty deemed satisfactory, as published by the IRS. |
| 2. | The dividends are not listed with the IRS as dividends that do not qualify. |
| 3. | The required dividend holding period has been met. The shares must have been owned by you for more than 60 days of the ‘holding period’ – which is defined as the 121-day period that begins 60 days before the ex-dividend date, or the day in which the stock trades without the dividend priced in. For example, if a stock’s ex-dividend date is 1 October, the shares must be held for more than 60 days in the period between 2 August and 30 November of that year in order to count as a qualified dividend. |
Dividends that are not qualified are subject to taxation at the US federal graduated tax rates, at a maximum rate of 40.8%. Some types of dividends are automatically excluded from being qualified dividends, even if they meet the other requirements. These include (but are not limited to):
| 1. | Capital gains distributions |
| 2. | Dividends on bank deposits |
| 3. | Dividends held by a corporation in an Employee Stock Ownership Plan (ESOP) |
| 4. | Dividends paid by tax-exempt corporations |
US state and local tax rates on qualified and non-qualified dividends may vary and would be assessed in addition to the federal tax rates communicated above.
Taxation of capital gains
Generally, US holders will not be subject to UK capital gains tax, but will be subject to US tax on capital gains realised on the sale or other disposal of shares or ADS. Such gains will be long-term capital gains (subject to reduced rates of taxation for individual holders) if the shares or ADS were held for more than one year, from the date the shares were vested/released. Short-term capital gains can be subject to taxation of rates of up to 40.8%, whereas long-term capital gains may be subject to rates of up to 23.8%. State and local tax rates on capital gains may also apply.
Information reporting and backup withholding
Dividends and payments of the proceeds on a sale of shares or ADS, paid within the US or through certain US-related financial intermediaries are subject to information reporting and may be subject to backup withholding unless the US holder is a corporation or other exempt recipient or provides a taxpayer identification number and certifies that no loss of exemption has occurred. Non-US holders generally are not subject to information reporting or backup withholding, but may be required to provide a certification of their non-US status in connection with payments received. Any amounts withheld will be allowed as a refund or credit against a holder’s US federal income tax liability provided the required information is furnished to the Internal Revenue Service.
Estate and gift taxes
Under the Estate and Gift Tax Convention, a US shareholder is not generally subject to UK inheritance tax.
Stamp duty
UK stamp duty and/or SDRT will, subject to certain exemptions, be payable on any transfer of shares to the ADS custodian or depository at a rate of 1.5% of the amount of any consideration provided (if transferred on sale), or their value (if transferred for no consideration).
However, no stamp duty or SDRT should be payable on the transfer of, or agreement to transfer, an ADS.
| | |
| 272 | | |
GSK Annual Report 2017 | | |
| | |
| | |
Shareholder informationcontinued
Shareholder services and contacts
Registrar
The company’s registrar is:
Equiniti Limited
Aspect House, Spencer Road, Lancing, BN99 6DA
www.shareview.co.uk
Tel: 0371 384 2991 (in the UK)*
Tel: +44 (0)121 415 7067 (outside the UK)
Equiniti provides a range of services for shareholders:
| | | | |
Service | | What it offers | | How to participate |
| | |
| Dividend Reinvestment Plan (DRIP) | | As an alternative to receiving cash dividends you may choose to reinvest your dividends to buy more GSK shares. | | A DRIP election form can be downloaded from www.shareview.co.uk or requested by contacting Equiniti. |
| | |
| Dividend payment direct to your bank account (Bank Mandate) | | If you currently receive your dividends by cheque through the post, you can instead have them paid directly into your bank or building society account. This is quicker, more secure and avoids the risk of your cheque going astray. | | A dividend bank mandate form can be downloaded from www.shareview.co.uk or requested by contacting Equiniti. |
| | |
| Dividend payment direct to bank account for overseas shareholders | | Instead of waiting for a sterling cheque to arrive by post, Equiniti will convert your dividend into your local currency and send it direct to your local bank account. This service is available in over 100 countries worldwide. | | For more details on this service and the costs involved please contact Equiniti. |
| | |
| Electronic communications | | Shareholders may elect to receive electronic notifications of company communications including our Annual Report, dividend payments (if paid by way of a Bank Mandate), access to electronic tax vouchers and the availability of online voting for all general meetings. Each time GSK mails out hard copy shareholder documents you will receive an email containing a link to the document or relevant website. | | You can register at www.shareview.co.uk |
| | |
| Shareview portfolio service | | This enables you to create a free online portfolio to view your share balance and movements, update your address and dividend payment instructions and register your votes for our AGM. | | You can register at www.shareview.co.uk |
| | |
| Duplicate publications or mailings | | If you receive duplicate copies of this report or other mailings, please contact Equiniti and they will arrange for your accounts to be merged into one for your convenience and to avoid waste and unnecessary costs. | | Please contact Equiniti. |
| | |
Share dealing service† (please note that market trading hours are from 8.00am to 4.30pm UK time, Monday to Friday (excluding public holidays in England and Wales)) | | Shareholders may trade shares, either held in certificated form or held in our Corporate Sponsored Nominee, by internet, telephone or by a postal dealing service provided by Equiniti Financial Services Limited. | | For internet transactions, please log on to www.shareview.co.uk/dealing. For telephone transactions, please call 0345 603 7037 (in the UK) or +44 (0)121 415 7560 (outside the UK). For postal transactions, please call 0371 384 2991* to request a dealing form. |
| | |
| Corporate Sponsored Nominee Account | | This is a convenient way to manage your shares without requiring a share certificate. The service provides a facility for you to hold your shares in a nominee account sponsored by the company. You will continue to receive dividend payments, annual reports and can attend and vote at the company’s general meetings. Shareholders’ names do not appear on the publicly available share register and the service is free to join. | | An application form can be requested from www.shareview.co.uk or by contacting Equiniti. |
| | |
| Individual Savings Accounts (ISAs)† | | The company has arranged for Equiniti Financial Services Limited to provide a GSK Corporate ISA to hold GSK Ordinary Shares. | | Details are available from www.shareview.co.uk or can be requested by telephoning Equiniti, on 0345 300 0430. Lines are open 8.00am to 4.30pm for dealing, and until 6.00pm for enquiries Monday to Friday (excluding public holidays in England and Wales). |
| * | UK lines are open from 8.30am to 5.30pm, Monday to Friday (excluding public holidays in England and Wales). |
| † | The provision of share dealing details is not intended to be an invitation or inducement to engage in an investment activity. |
| | Advice on share dealing should be obtained from a stockbroker or independent financial adviser. |
| | | | |
| 273 | | |
| | | | | |
| GSK Annual Report 2017 | | Strategic report | | |
| | Governance and remuneration | | |
| | Financial statements | | |
| | Investor information | | |
Shareholders services and contactscontinued
ADS Depositary
The ADS programme is administered by The Bank of New York Mellon:
BNY Mellon Shareowner Services
PO Box 505000
Louisville, KY 40233-5000
Overnight correspondence should be sent to:
BNY Mellon Shareowner Services
462 South 4th Street, Suite 1600
Louisville, KY 40202
www.mybnymdr.com
| Tel: | +1 877 353 1154 (US toll free) |
| Tel: | +1 201 680 6825 (outside the US) |
| email: | shrrelations@cpushareownerservices.com |
The Depositary also provides Global BuyDIRECT†, a direct ADS purchase/sale and dividend reinvestment plan for ADS holders. For details of how to enrol please visit www.mybnymdr.com or call the above helpline number to obtain an enrolment pack.
Glaxo Wellcome and SmithKline Beecham
Corporate PEPs
The Share Centre Limited
Oxford House, Oxford Road, Aylesbury, Bucks HP21 8SZ
Tel: +44 (0)1296 414 141
www.share.com
Donating shares to Save the Children
In 2013, GSK embarked on an ambitious global partnership with Save the Children to share our expertise and resources with the aim of helping to save the lives of one million children.
Shareholders with a small number of shares, the value of which makes it uneconomical to sell, may wish to consider donating them to Save the Children. Donated shares will be aggregated and sold by Save the Children who will use the funds raised to help them reach the above goal.†
To obtain a share donation form, please contact our registrar, Equiniti, which is managing the donation and sale of UK shares to Save the Children free of charge.
| † | The provision of share dealing details is not intended to be an invitation or inducement to engage in an investment activity. |
| | Advice on share dealing should be obtained from a stockbroker or independent financial adviser. |
Contacts
Investor relations
Investor relations may be contacted as follows:
UK
980 Great West Road
Brentford, Middlesex, TW8 9GS
Tel: +44 (0)20 8047 5000
US
5 Crescent Drive
Philadelphia PA 19112
Tel: +1 888 825 5249 (US toll free)
Tel: +1 215 751 4611 (outside the US)
GSK Response Center
Tel: +1 888 825 5249 (US toll free)
Share scam alert
If you receive an unsolicited telephone call offering to sell or buy your shares, please take extra care. The caller may be part of a highly organised financial scam.
If you are a UK shareholder, please contact the Financial Conduct Authority for further information on this, or other similar activities, at www.fca.org.uk/consumers or on its consumer helpline:
Tel: 0800 111 6768 (in the UK)*
Tel: +44 (0)20 7066 1000 (outside the UK)
| * | Lines are open from 8.00am to 6.00pm, UK time, Monday to Friday, except UK public holidays, and 9.00am to 1.00pm on Saturdays. |
Responsible Business Supplement
We are publishing our Responsible Business Supplement 2017 online. This will outline GSK’s approach to, and performance in, our key responsible business areas: Health for all, Our behaviour, Our people and Our planet.
| | |
| 274 | | |
GSK Annual Report 2017 | | |
| | |
| | |
Other statutory disclosures
US law and regulation
A number of provisions of US law and regulation apply to the company because our shares are quoted on the New York Stock Exchange (NYSE) in the form of ADS.
NYSE rules
In general, the NYSE rules permit the company to follow UK corporate governance practices instead of those applied in the US, provided that we explain any significant variations. This explanation is contained in our Form 20-F, which can be accessed from the Securities and Exchange Commission’s (SEC) EDGAR database or via our website. NYSE rules that came into effect in 2005 require us to file annual and interim written affirmations concerning the Audit & Risk Committee and our statement on significant differences in corporate governance.
Sarbanes-Oxley Act of 2002
Following a number of corporate and accounting scandals in the US, Congress passed the Sarbanes-Oxley Act of 2002. Sarbanes-Oxley is a wide-ranging piece of legislation concerned largely with financial reporting and corporate governance.
As recommended by the SEC, the company has established a Disclosure Committee. The Committee reports to the CEO, the CFO and to the Audit & Risk Committee (ARC). It is chaired by the Company Secretary and the members consist of senior managers from finance, legal, corporate communications and investor relations.
External legal counsel, the external auditors and internal experts are invited to attend its meetings periodically. It has responsibility for considering the materiality of information and, on a timely basis, determining the disclosure of that information. It has responsibility for the timely filing of reports with the SEC and the formal review of the Annual Report and Form 20-F. In 2017, the Committee met 18 times.
Sarbanes-Oxley requires that the annual report on Form 20-F contain a statement as to whether a member of the ARC is an audit committee financial expert as defined by Sarbanes-Oxley. Such a statement for the relevant member of the ARC (Judy Lewent) is included in the Audit & Risk Committee report on page 96 and in her biography on page 85. Additional disclosure requirements arise under section 302 and section 404 of Sarbanes-Oxley in respect of disclosure controls and procedures and internal control over financial reporting.
Section 302: Corporate responsibility for financial reports
Sarbanes-Oxley also introduced a requirement for the CEO and the CFO to complete formal certifications, confirming that:
| – | | they have each reviewed the annual report on Form 20-F |
| – | | based on their knowledge, the annual report on Form 20-F contains no material misstatements or omissions |
| – | | based on their knowledge, the financial statements and other financial information fairly present, in all material respects, the financial condition, results of operations and cash flows as of the dates, and for the periods, presented in the annual report on Form 20-F |
| – | | they are responsible for establishing and maintaining disclosure controls and procedures that ensure that material information is made known to them, and have evaluated the effectiveness of these controls and procedures as at the year-end, the results of such evaluation being contained in the annual report on Form 20-F |
| – | | they are responsible for establishing and maintaining internal control over financial reporting that provides reasonable assurance regarding the reliability of financial reporting and the preparation of financial statements for external purposes in accordance with generally accepted accounting principles |
| – | | they have disclosed in the annual report on Form 20-F any changes in internal controls over financial reporting during the period covered by the annual report on Form 20-F that have materially affected, or are reasonably likely to affect materially, the company’s internal control over financial reporting, and they have disclosed, based on their most recent evaluation of internal control over financial reporting, to the external auditors and the ARC, all significant deficiencies and material weaknesses in the design or operation of internal controls over financial reporting which are reasonably likely to affect adversely the company’s ability to record, process, summaries and report financial information, and any fraud (regardless of materiality) involving persons that have a significant role in the company’s internal control over financial reporting. |
The Group has carried out an evaluation under the supervision and with the participation of its management, including the CEO and CFO, of the effectiveness of the design and operation of the Group’s disclosure controls and procedures as at 31 December 2017.
There are inherent limitations to the effectiveness of any system of disclosure controls and procedures, including the possibility of human error and the circumvention or overriding of the controls and procedures. Accordingly, even effective disclosure controls and procedures can only provide reasonable assurance of achieving their control objectives.
The CEO and CFO expect to complete these certifications and report their conclusions on the effectiveness of disclosure controls and procedures in March 2018, following which the certificates will be filed with the SEC as part of our Group’s Form 20-F.
Section 404: Management’s annual report on internal control over financial reporting
In accordance with the requirements of section 404 of Sarbanes-Oxley, the following report is provided by management in respect of the company’s internal control over financial reporting (as defined in Rules 13a-15(f) and 15d-15(f) under the US Securities Exchange Act of 1934, as amended (the ‘Exchange Act’)):
| – | | management is responsible for establishing and maintaining adequate internal control over financial reporting for the Group. Internal control over financial reporting is designed to provide reasonable assurance regarding the reliability of financial reporting and the preparation of financial statements for external purposes in accordance with IFRS |
| – | | management conducted an evaluation of the effectiveness of internal control over financial reporting based on the framework, Internal Control – Integrated Framework (2013) issued by the Committee of Sponsoring Organisations of the Treadway Commission (COSO) |
| – | | there have been no changes in the Group’s internal control over financial reporting during 2017 that have materially affected, or are reasonably likely to affect materially, the Group’s internal control over financial reporting |
| – | | management has assessed the effectiveness of internal control over financial reporting as at 31 December 2017 and its conclusion will be filed as part of the Group’s Form 20-F, and |
| | | | |
| 275 | | |
| | | | | |
| GSK Annual Report 2017 | | Strategic report | | |
| | Governance and remuneration | | |
| | Financial statements | | |
| | Investor information | | |
US law and regulationcontinued
| – | | PricewaterhouseCoopers LLP, which has audited the consolidated financial statements of the Group for the year ended 31 December 2017, has also assessed the effectiveness of the Group’s internal control over financial reporting under Auditing Standard No. 5 of the Public Company Accounting Oversight Board (United States). Their audit report will be filed with the Group’s Form 20-F. |
Section 13(r) of the Exchange Act
Section 13(r) of the Exchange Act (Section 13(r)) requires issuers to make specific disclosure in their annual reports of certain types of dealings with Iran, including transactions or dealings with government-owned entities, as well as dealings with entities sanctioned for activities related to terrorism or proliferation of weapons of mass destruction, even when those activities are not prohibited by US law and do not involve US persons. The Group exports certain pharmaceutical, vaccine and consumer products to Iran, via sales by non-US entities, to two privately held Iranian distributors.
We do not believe that any of the Group’s direct dealings with Iran require specific disclosure under these requirements.
The Group does not regularly receive information regarding the identity of its distributors’ downstream customers in Iran, and it is possible that these customers include entities, such as government-owned hospitals and pharmacies, that are owned or controlled directly or indirectly by the Iranian government or by persons or entities sanctioned in connection with terrorism or proliferation activities.
Because the Group does not regularly receive information regarding the identity of its distributors’ downstream customers, it cannot establish the proportion of gross revenue or sales potentially attributable to entities affiliated with the Iranian government or parties sanctioned for disclosable activities. As a result, the Group is reporting the entire gross revenues (£12 million) and net profits (£4 million) from the Group’s sales to Iran in 2017.
The Group is also aware that some hospitals or other medical facilities in Lebanon may be affiliated with or controlled by Hezbollah, which is designated by the United States as a terrorist organisation. Again, the Group does not deal directly with such facilities and sells through distributors. The Group is also unable to identify with certainty the degree or nature of any affiliation of the end customers with Hezbollah, and the Group is unable to establish the proportion of gross revenue or sales potentially attributable to reportable entities. As a result, the Group is reporting the entire gross revenues (£48 million) and net profits (£25 million) from the Group’s sales to Lebanon in 2017.
In addition to Section 13(r), US law also generally restricts dealings by US persons or persons which are subject to US jurisdiction with certain countries or territories that are subject to comprehensive sanctions. The Group does business, via non-US entities, in such jurisdictions targeted by sanctions laws, including Syria, Cuba, North Korea and Crimea. While we believe the Group complies with all applicable US sanctions laws, such laws are complex and continue to evolve rapidly.
Donations to political organisations and political expenditure
With effect from 1 January 2009, to ensure a consistent approach to political contributions across the Group, we introduced a global policy to stop voluntarily all corporate political contributions.
In the period from 1 January 2009 to 31 December 2017, the Group did not make any political donations to EU or non-EU organisations.
Notwithstanding the introduction of this policy, in accordance with the Federal Election Campaign Act in the US, we continue to support an employee-operated Political Action Committee (PAC) that facilitates voluntary political donations by eligible GSK employees.
The PAC is not controlled by GSK. Decisions on the amounts and recipients of contributions are made by participating employees exercising their legal right to pool their resources and make political contributions, which are subject to strict limitations. In 2017, a total of US$ 384,875 (2016 – US$ 380,360) was donated to political organisations by the GSK employee PAC.
Notwithstanding our policy, the Companies Act 2006 requires companies to continue to obtain shareholder approval before they can make donations to EU political organisations or incur EU political expenditure. Therefore, while we do not make and do not intend to make donations to any EU political parties or organisations nor do we incur any EU political expenditure, the definitions of political donations, political expenditure and political organisations used in the legislation are so wide that we annually seek shareholder authorisation for any inadvertent expenditure. In particular, the definition of EU political organisations may extend to bodies such as those concerned with policy review, law reform, the representation of the business community and special interest groups such as those concerned with the environment, which the company and its subsidiaries might wish to support. As a result, the definitions may cover legitimate business activities not in the ordinary sense considered to be political donations or political expenditure.
Such activities are not designed to support any political party or independent election candidate. The authority which the Board has sought annually is a precautionary measure to ensure that the company and its subsidiaries do not inadvertently breach the legislation.
This authorisation process, for expenditure of up to £100,000 each year, dates back to the AGM held in May 2001, following the introduction of the Political Parties, Elections and Referendums Act 2000. The authority has since been renewed annually.
| | |
| 276 | | |
GSK Annual Report 2017 | | |
| | |
| | |
Other statutory disclosurescontinued
Group companies
In accordance with Section 409 of the Companies Act 2006 a full list of subsidiaries, associates, joint ventures and joint arrangements, the address of the registered office and effective percentage of equity owned, as at 31 December 2017 are disclosed below. Unless otherwise stated the share capital disclosed comprises ordinary shares which are indirectly held by GlaxoSmithKline plc. The percentage held by class of share is stated where this is less than 100%. Unless otherwise stated, all subsidiary companies have their registered office in their country of incorporation. All subsidiary companies are resident for tax purposes in their country of incorporation unless otherwise stated.
| | | | |
Name | | Security | | Registered address |
Wholly owned subsidiaries | | | | |
|
| 1506369 Alberta ULC | | Common | | 3500 855-2nd Street SW, Calgary, AB, T2P 4J8, Canada |
|
| Action Potential Venture Capital Limited | | Ordinary | | 980 Great West Road, Brentford, Middlesex, TW8 9GS, England |
|
| Adechsa GmbH | | Ordinary | | c/o PRV Provides Treuhandgesellschaft AG, Dorfstrasse 38, Baar, 6341, Switzerland |
|
| Affymax Research Institute | | Common | | Corporation Service Company, 2710 Gateway Oaks Drive, Suite 150N, Sacramento, California, CA, 95833, United States |
|
| Alenfarma – Especialidades Farmaceuticas, Limitada (iv) | | Ordinary Quota | | Rua Dr Antonio Loureiro Borges No 3, Arquiparque, Miraflores, Alges, 1499-013, Portugal |
|
| Allen & Hanburys Limited (iv) | | Ordinary | | 980 Great West Road, Brentford, Middlesex, TW8 9GS, England |
|
| Allen & Hanburys Pharmaceutical Nigeria Limited | | Ordinary | | 24 Abimbola Way, Ilasamaja, Isolo, Lagos, Nigeria |
|
| Allen Farmaceutica, S.A. | | Ordinary | | Severo Ochoa, 2, Parque Tecnologico de Madrid, Tres Cantos, Madrid, 28760, Spain |
|
| Allen Pharmazeutika Gesellschaft m.b.H. | | Ordinary | | Wagenseilgasse 3, Euro Plaza, Gebäude I, 4. Stock, Vienna, A-1120, Austria |
|
| Barrier Therapeutics, Inc. | | Common | | Corporation Service Company, 251 Little Falls Drive, Wilmington, Delaware, 19808, United States |
|
| Beecham Group p.l.c | | 20p Shares ‘A’; 5p Shares ‘B’ | | 980 Great West Road, Brentford, Middlesex, TW8 9GS, England |
|
| Beecham Pharmaceuticals (Pte) Limited | | Ordinary | | 38 Quality Road, Jurong Industrial Estate, Jurong, 618809, Singapore |
|
| Beecham Pharmaceuticals S.A. (iv) (vi) | | Nominative | | Av 10 De Agosto N36-239, y Naciones Unidas, Edificio Electroectuatoriana, 2do piso, Quito, Ecuador |
|
| Beecham Portuguesa-Produtos Farmaceuticos e Quimicos, Lda, | | Ordinary Quota | | Rua Dr Antonio Loureiro Borges No 3, Arquiparque, Miraflores, Alges, 1499-013, Portugal |
|
| Beecham S.A. (iv) (vi) | | Ordinary | | Parc de la Noire Epine, rue Fleming 20, 1300 Wavre, Belgium |
|
| Biddle Sawyer Limited | | Equity | | 252 Dr Annie Besant Road, Mumbai, 400030, India |
|
| Biovesta Ilaçlari Ltd. Sti. (iv) | | Nominative | | Büyükdere Caddesi No. 173, 1.Levent Plaza B Blok, 1.Levent, Istanbul, 34394, Turkey |
|
| Burroughs Wellcome & Co (Australia) Pty Limited (in liquidation) | | Ordinary | | 1061 Mountain Highway, Boronia, VIC, 3155, Australia |
|
| Burroughs Wellcome & Co (Bangladesh) Limited | | Ordinary | | Fouzderhat Industrial Area, Dhaka Trunk Road, North Kattali, Chittagong – 4217, Bangladesh |
|
| Burroughs Wellcome International Limited | | Ordinary | | 980 Great West Road, Brentford, Middlesex, TW8 9GS, England |
|
| Cascan GmbH & Co. KG | | Partnership Capital | | Industriestrasse 32-36, Bad Oldesloe, 23843, Germany |
|
| Castleton Investment Ltd (vi) | | Ordinary | | C/O DTOS, 19 Cybercity, 10th Floor Standard Chartered Tower, Ebene, Mauritius |
|
| Cellzome GmbH | | Ordinary | | Meyerhofstrasse 1, Heidelberg, 69117, Germany |
|
| Cellzome Limited | | Ordinary | | 980 Great West Road, Brentford, Middlesex, TW8 9GS, England |
|
| Cellzome Therapeutics, Inc. (iv) | | Ordinary | | Corporation Service Company, 251 Little Falls Drive, Wilmington, Delaware, 19808, United States |
|
| Cellzome, Inc. | | Ordinary;
Series A Preferred;
Series B Preferred;
Series C-1 Convertible Preferred;
Series C-3 Convertible Preferred | | Corporation Service Company, 251 Little Falls Drive, Wilmington, Delaware, 19808, United States |
|
| Charles Midgley Limited (iv) | | Ordinary; 7% Cumulative Preference | | 980 Great West Road, Brentford, Middlesex, TW8 9GS, England |
|
| Chiron Behring Vaccines Private Limited | | Ordinary | | 401-402, A, Wing, 4th Floor,Floral Deck Plaza, Opp Rolta Bhavan, Central MIDC Road, Mumbai, Andheri (E), 400093, India |
|
| Clarges Pharmaceuticals Limited | | Ordinary; Preference (99.97%) | | 980 Great West Road, Brentford, Middlesex, TW8 9GS, England |
|
| Colleen Corporation | | Common with no par value | | Corporation Service Company, 251 Little Falls Drive, Wilmington, Delaware, 19808, United States |
|
| Corixa Corporation | | Common | | Corporation Service Company, 251 Little Falls Drive, Wilmington, Delaware, 19808, United States |
|
| Coulter Pharmaceutical, Inc. (iv) | | Common | | Corporation Service Company, 251 Little Falls Drive, Wilmington, Delaware, 19808, United States |
|
| Dealcyber Limited | | Ordinary | | 980 Great West Road, Brentford, Middlesex, TW8 9GS, England |
|
| Desarrollo Energia Solar Alternativa S.L. | | Ordinary | | Severo Ochoa, 2, Parque Tecnologico de Madrid, Tres Cantos, Madrid, 28760, Spain |
|
| | | | |
| 277 | | |
| | | | | |
| GSK Annual Report 2017 | | Strategic report | | |
| | Governance and remuneration | | |
| | Financial statements | | |
| | Investor information | | |
Group companiescontinued
| | | | |
Name | | Security | | Registered address |
| | |
| Wholly owned subsidiariescontinued | | | | |
|
| Domantis Limited | | Ordinary | | 980 Great West Road, Brentford, Middlesex, TW8 9GS, England |
|
| Duncan Flockhart Australia Pty Limited (iv) (vi) | | Ordinary | | 1061 Mountain Highway, Boronia, VIC, 3155, Australia |
|
| Edinburgh Pharmaceutical Industries Limited (iv) | | Ordinary; Preference | | Shewalton Road, Irvine, Ayrshire, KA11 5AP, Scotland |
|
| Eskaylab Limited | | 10p Ordinary | | 980 Great West Road, Brentford, Middlesex, TW8 9GS, England |
|
| Etex Farmacéutica Limitada | | Social Capital | | Avenida Andres Bello 2687, Piso 19, Las Condes, Santiago, C.P. 7550611, Chile |
|
| Fipar (Thailand) Ltd (in liquidation) | | Ordinary | | 12th Floor Wave Place, 55 Wireless Road, Lumpini, Pathumwan, Bangkok, 10330, Thailand |
|
| Genelabs Technologies, Inc. | | Common | | Corporation Service Company, 2710 Gateway Oaks Drive, Suite 150N, Sacramento, California, 95833, United States |
|
| Glaxo AS (iv) | | Ordinary | | Klaus Torgårds vei 3, Oslo, NO-0372, Norway |
|
| Glaxo Group Limited | | Ordinary | | 980 Great West Road, Brentford, Middlesex, TW8 9GS, England |
|
| Glaxo Kabushiki Kaisha (iv) | | Ordinary | | 1-8-1 Asasaka Minato-ku, Tokyo, Japan |
|
| Glaxo Laboratories (Nigeria) Limited (iv) | | Ordinary | | 82 Marine Road, Apapa, Lagos, Nigeria |
|
| Glaxo Laboratories Limited (iv) | | Ordinary | | 980 Great West Road, Brentford, Middlesex, TW8 9GS, England |
|
| Glaxo New Zealand Pension Plan Trustee Limited | | Ordinary | | Level 11, Zurich House, 21 Queen Street, Auckland, 1010, New Zealand |
|
| Glaxo Operations UK Limited | | Ordinary | | 980 Great West Road, Brentford, Middlesex, TW8 9GS, England |
|
| Glaxo Properties BV | | Ordinary | | Huis ter Heideweg 62, 3705 LZ, Zeist, Netherlands |
|
| Glaxo Verwaltungs GmbH | | Ordinary | | Industriestrasse 32-36, Bad Oldesloe, 23843, Germany |
|
| Glaxo Wellcome Australia Pty Ltd (iv) (vi) | | Ordinary | | 1061 Mountain Highway, Boronia, VIC, 3155, Australia |
|
| Glaxo Wellcome Farmaceutica, Limitada | | Ordinary Quota | | Rua Dr Antonio Loureiro Borges No 3, Arquiparque, Miraflores, Alges, 1499-013, Portugal |
|
| Glaxo Wellcome International B.V. (v) | | Ordinary | | Huis ter Heideweg 62, 3705 LZ, Zeist, Netherlands |
|
| Glaxo Wellcome Manufacturing Pte Ltd | | Ordinary | | 1 Pioneer Sector 1, Jurong Industrial Estate, Jurong, 628413, Singapore |
|
| Glaxo Wellcome Production S.A.S. | | Ordinary | | 23 rue François Jacob, 92500, Rueil-Malmaison, France |
|
| Glaxo Wellcome PST Pty Ltd (in liquidation) | | Ordinary | | 1061 Mountain Highway, Boronia, VIC, 3155, Australia |
|
| Glaxo Wellcome UK Limited | | Ordinary | | 980 Great West Road, Brentford, Middlesex, TW8 9GS, England |
|
| Glaxo Wellcome Vidhyasom Limited (iv) | | Ordinary | | 12th Floor Wave Place, 55 Wireless Road, Lumpini, Pathumwan, Bangkok, 10330, Thailand |
|
| Glaxo Wellcome, S.A. | | Ordinary | | Poligono Industrial Allendeduero, Avenida de Extremadura, 3, Aranda de Duero, Burgos, 09400, Spain |
|
| Glaxo, S.A. | | Ordinary | | Severo Ochoa, 2, Parque Tecnologico de Madrid, Tres Cantos, Madrid, 28760, Spain |
|
| Glaxo-Allenburys (Nigeria) Limited (iv) | | Ordinary | | 41 Creek Road, Apapa, Lagos, PMB 1401, Nigeria |
|
| Glaxochem (UK) Unlimited | | Ordinary;
Ordinary B;
Ordinary C | | 980 Great West Road, Brentford, Middlesex, TW8 9GS, England |
|
| Glaxochem Pte Ltd (v) | | Ordinary | | 23 Rochester Park, 139234, Singapore |
|
| GlaxoSmithKline – Produtos Farmaceuticos, Limitada | | Ordinary Quota | | Rua Dr Antonio Loureiro Borges No 3, Arquiparque, Miraflores, Alges, 1499-013, Portugal |
|
| GlaxoSmithKline (Cambodia) Co., Ltd. | | Ordinary | | 5th Floor DKSH Building, No.797 Preah Monivong Boulevard (Corner of Street 484), Sangkat Phsar Deum Thakov, Khan Chamkarmon, Phnom Penh, Cambodia |
|
| GlaxoSmithKline (China) Investment Co Ltd | | Ordinary | | Room 901 – 910, Building A, Ocean International Center, 56 Mid 4th East Ring Road, Bejing, Chaoyang District, China |
|
| GlaxoSmithKline (China) R&D Company Limited | | Equity | | No 3 Building, 898 Halei Road, Zhang Jiang, Hi Tech Park Pudong New Area, Shanghai, China |
|
| GlaxoSmithKline (Cyprus) Limited | | Ordinary | | Arch. Makariou III, 2-4, Capital Center, 9th Floor, Nicosia, P.C. 1065, Cyprus |
|
| GlaxoSmithKline (GSK) S.R.L. | | Ordinary | | 1-5 Costache Negri Street, Opera Center One, 5th and 6th floors, Zone 1, District 5, Bucharest, Romania |
|
| GlaxoSmithKline (Ireland) Limited (ii) | | Ordinary | | 12 Riverwalk Citywest Business Campus, Dublin, 24, Ireland |
|
| GlaxoSmithKline (Israel) Ltd | | Ordinary | | 25 Basel Street, PO Box 10283, Petach-Tikva, 49002, Israel |
|
| GlaxoSmithKline (Malta) Limited | | Ordinary | | 1, First Floor, De La Cruz Avenue, Qormi, QRM2458, Malta |
|
| GlaxoSmithKline (Private) Limited (iv) | | Ordinary | | Unit 3, 20 Anthony Road, Msasa, Harare, Zimbabwe |
|
| GlaxoSmithKline (Thailand) Limited | | Ordinary | | 12th Floor Wave Place, 55 Wireless Road, Lumpini, Pathumwan, Bangkok, 10330, Thailand |
|
| GlaxoSmithKline A.E.B.E. | | Ordinary | | 266 Kifissias Avenue, Halandri, Athens, 152 32, Greece |
|
| GlaxoSmithKline AB | | Ordinary | | Hemvarnsg. 9, Solna, 171 54, Sweden |
|
| GlaxoSmithKline AG | | Ordinary | | Talstrasse 3-5, 3053 Muenchenbuchsee, Switzerland |
|
| GlaxoSmithKline Angola Unipessoal Limitada | | Quotas | | At Bollore Africa Logistics Angola, Estrada de Cacuaco n° 288, CP 2163, Bairro Petrangol, Luanda, Angola |
|
| | |
| 278 | | |
GSK Annual Report 2017 | | |
| | |
| | |
Other statutory disclosurescontinued
Group companiescontinued
| | | | |
Name | | Security | | Registered address |
Wholly owned subsidiariescontinued | | |
|
| GlaxoSmithKline Argentina S.A. | | Ordinary | | Tucumán 1, piso 4, Buenos Aires, C1049AAA, Argentina |
|
| GlaxoSmithKline AS | | Ordinary | | Klaus Torgårds vei 3, Oslo, NO-0372, Norway |
|
| GlaxoSmithKline Asia Pvt. Limited | | Equity | | Patiala Road, Nabha 147201, Dist Patiala, Punjab, India |
|
| GlaxoSmithKline Australia Pty Ltd | | Ordinary | | 1061 Mountain Highway, Boronia, VIC, 3155, Australia |
|
| GlaxoSmithKline B.V. | | Ordinary | | Huis ter Heideweg 62, 3705 LZ, Zeist, Netherlands |
|
| GlaxoSmithKline Beteiligungs GmbH | | Ordinary | | Prinzregentenplatz 9, München, 81675, Germany |
|
| GlaxoSmithKline Biologicals (Shanghai) Ltd. | | Ordinary | | No. 277 Niudun Road, Zhangjiang Hi-Teck Park, Shanghai, China |
|
| GlaxoSmithKline Biologicals Kft. | | Ordinary | | 2100 Gödöllõ, Homoki Nagy István utca 1, Hungary |
|
| GlaxoSmithKline Biologicals S.A.S. | | Ordinary | | 637 Rue des Aulnois, Saint-Amand Les Eaux, 59230, France |
|
| GlaxoSmithKline Biologicals SA | | Ordinary; Preference | | Rue de l’Institut 89, B-1330 Rixensart, Belgium |
|
| GlaxoSmithKline Brasil Limitada | | Quotas | | Estrada dos Banderiantes, 8464, Rio de Janeiro, 22783-110, Brazil |
|
| GlaxoSmithKline Capital Inc. | | Ordinary | | Wilmington Trust SP Services Inc., 1105 North Market Street, Suite 1300, Wilmington, Delaware, 19801, United States |
|
| GlaxoSmithKline Capital plc | | Ordinary | | 980 Great West Road, Brentford, Middlesex, TW8 9GS, England |
|
| GlaxoSmithKline Caribbean Limited | | Ordinary | | 980 Great West Road, Brentford, Middlesex, TW8 9GS, England |
|
| GlaxoSmithKline Chile Farmaceutica Limitada | | Social Capital | | Avenida Andres Bello No. 2687, Piso 19, Las Condes, Santiago,
C.P. 7550611, Chile |
|
| GlaxoSmithKline Colombia S.A. | | Ordinary | | Avenida El Dorado, #69B-45/Piso 9, Bogota, Colombia |
|
GlaxoSmithKline Consumer Healthcare Investments (Ireland)
Limited (ii) (iv) (v) | | Ordinary | | 6900 Cork Airport Business Park, Kinsale Road, Cork, County Cork, Ireland |
|
| GlaxoSmithKline Consumer Healthcare Ireland IP Limited (ii) (v) | | Ordinary | | Currabinny, Carrigaline, County Cork, Ireland |
|
| GlaxoSmithKline Consumer Holding B.V. (iv) | | Ordinary | | Huis ter Heideweg 62, 3705 LZ, Zeist, Netherlands |
|
| GlaxoSmithKline d.o.o | | Quotas | | Zmja od Bosne broj 7-7a, Sarajevo, 71000, Bosnia and Herzegovina |
|
| GlaxoSmithKline d.o.o. | | Equity capital | | Ulica Damira Tomljanovica Gavrana 15, Zagreb, Croatia |
|
| GlaxoSmithKline doo Beograd | | Ordinary | | Omladinskih brigada 88, New Belgrade, City of Belgrade, 11070, Serbia |
|
| GlaxoSmithKline Ecuador S.A. | | Ordinary | | Av 10 De Agosto N36-239, y Naciones Unidas, Edificio Electroectuatoriana, 2do piso, Quito, Ecuador |
|
| GlaxoSmithKline Eesti OU | | Ordinary | | Lõõtsa 8a, Tallinn, 11415, Estonia |
|
| GlaxoSmithKline ehf (iv) (vi) (Dissolved January 2018) | | Ordinary | | Thverholt 14, 105, Reykjavik, Iceland |
|
| GlaxoSmithKline El Salvador S.A. de C.V. | | Ordinary | | Avenida El Boqueron y Calle Izalco No 7 y 8 Parque Industrial El Boqueron, Santa Elen, Antiguo Custatlan, La Libertad, El Salvador |
|
| GlaxoSmithKline EOOD | | Ordinary | | 115 G Tsarigradsko Shose Blvd., floor 9, Mladost Region, Sofia, 1784, Bulgaria |
|
| GlaxoSmithKline Export Limited | | Ordinary | | 980 Great West Road, Brentford, Middlesex, TW8 9GS, England |
|
| GlaxoSmithKline Export Panama S.A. | | Ordinary | | Panama City, Republic of Panama, Panama |
|
| GlaxoSmithKline Far East B.V. | | Ordinary | | Huis ter Heideweg 62, 3705 LZ, Zeist, Netherlands |
|
| GlaxoSmithKline Finance plc | | Ordinary | | 980 Great West Road, Brentford, Middlesex, TW8 9GS, England |
|
| GlaxoSmithKline GmbH & Co. KG | | Partnership Capital | | Prinzregentenplatz 9, München, 81675, Germany |
|
| GlaxoSmithKline Guatemala S.A. | | Ordinary | | Novena Avenida 0-09, Zona 4, Guatemala City, Guatemala |
|
| GlaxoSmithKline Holding AS | | Ordinary | | Klaus Torgårds vei 3, Oslo, NO-0372, Norway |
|
| GlaxoSmithKline Holdings (Americas) Inc. | | Common with no par value | | Wilmington Trust SP Services Inc., 1105 North Market Street,
Suite 1300, Wilmington, Delaware, 19801, United States |
|
| GlaxoSmithKline Holdings (Ireland) Limited | | Ordinary; Deferred | | 980 Great West Road, Brentford, Middlesex, TW8 9GS, England |
|
| GlaxoSmithKline Holdings (One) Limited (i) | | Ordinary | | 980 Great West Road, Brentford, Middlesex, TW8 9GS, England |
|
| GlaxoSmithKline Holdings Limited (i) | | Ordinary | | 980 Great West Road, Brentford, Middlesex, TW8 9GS, England |
|
| GlaxoSmithKline Holdings Pty Ltd | | Ordinary | | 1061 Mountain Highway, Boronia, VIC, 3155, Australia |
|
| GlaxoSmithKline Honduras S.A. | | Ordinary | | Tegucigalpa, MDC, Honduras |
|
| GlaxoSmithKline IHC Limited | | Ordinary | | 980 Great West Road, Brentford, Middlesex, TW8 9GS, England |
|
| GlaxoSmithKline Ilaclari Sanayi ve Ticaret A.S. | | Nominative | | Büyükdere Caddesi No. 173, 1.Levent Plaza B Blok, 1.Levent, Istanbul, 34394, Turkey |
|
| GlaxoSmithKline Inc. | | Class A Common; Class C Preference | | 7333 Mississauga Road North, Mississauga, ON, L5N 6L4, Canada |
|
| GlaxoSmithKline Insurance Ltd. | | Ordinary | | 19 Par-La-Ville Road, Hamilton, HM11, Bermuda |
|
| GlaxoSmithKline Intellectual Property (No.2) Limited | | Ordinary | | 980 Great West Road, Brentford, Middlesex, TW8 9GS, England |
|
| GlaxoSmithKline Intellectual Property Development Limited | | Ordinary | | 980 Great West Road, Brentford, Middlesex, TW8 9GS, England |
|
| GlaxoSmithKline Intellectual Property Holdings Limited | | A Ordinary; B Ordinary | | 980 Great West Road, Brentford, Middlesex, TW8 9GS, England |
|
| GlaxoSmithKline Intellectual Property Limited | | Ordinary; Deferred | | 980 Great West Road, Brentford, Middlesex, TW8 9GS, England |
|
| GlaxoSmithKline Intellectual Property Management Limited | | Ordinary | | 980 Great West Road, Brentford, Middlesex, TW8 9GS, England |
|
| GlaxoSmithKline International Limited | | Ordinary | | 980 Great West Road, Brentford, Middlesex, TW8 9GS, England |
|
| GlaxoSmithKline Investigación y Desarrollo, S.L. | | Ordinary | | Severo Ochoa 2 Parque Tecnológico de Madrid, Tres Cantos, Madrid, 28760, Spain |
|
| | | | |
| 279 | | |
| | | | | |
| GSK Annual Report 2017 | | Strategic report | | |
| | Governance and remuneration | | |
| | Financial statements | | |
| | Investor information | | |
Group companiescontinued
| | | | |
Name | | Security | | Registered address |
Wholly owned subsidiariescontinued | | | | |
|
| GlaxoSmithKline Investment Holdings Limited | | Ordinary | | 980 Great West Road, Brentford, Middlesex, TW8 9GS, England |
|
| GlaxoSmithKline Investment Services Limited | | Ordinary | | 980 Great West Road, Brentford, Middlesex, TW8 9GS, England |
|
| GlaxoSmithKline Investments (Ireland) Limited (ii) (v) | | Ordinary | | Currabinny, Carrigaline, County Cork, Ireland |
|
| GlaxoSmithKline Investments Pty Ltd | | Ordinary | | 1061 Mountain Highway, Boronia, VIC, 3155, Australia |
|
| GlaxoSmithKline K.K. | | Ordinary | | 1-8-1 Asasaka Minato-ku, Tokyo, Japan |
|
| GlaxoSmithKline Korea Limited | | Ordinary | | 9F LS Yongsan Tower 92, Hangangdae-ro Yongsan-gu, Seoul, 140-702, Republic of Korea |
|
| GlaxoSmithKline Latin America, S.A. | | Ordinary | | Panama City, Republic of Panama, Panama |
|
| GlaxoSmithKline Latvia SIA | | Ordinary | | Duntes iela 3, Riga, Latvia |
|
| GlaxoSmithKline Lietuva UAB | | Ordinary | | Ukmerges st. 120, Vilnius, LT-08105, Lithuania |
|
| GlaxoSmithKline Limited | | Ordinary | | Units 2201, 2214 and 23/F, Tower 6, The Gateway, 9 Canton Road, Harbour City, Tsimshatsui, Kowloon, Hong Kong |
|
| GlaxoSmithKline LLC | | LLC Interests | | Corporation Service Company, 251 Little Falls Drive, Wilmington, Delaware, 19808, United States |
|
| GlaxoSmithKline Manufacturing SpA | | Ordinary | | Via Alessandro Fleming 2, Verona, 37135, Italy |
|
| GlaxoSmithKline Maroc S.A. | | Ordinary | | 42-44 Angle Bd, Rachidi et Abou Hamed El Glaza, Casablanca, Morocco |
|
| GlaxoSmithKline Medical and Healthcare Products Limited | | Ordinary | | H-1124, Csorsz utca 43, Budapest, Hungary |
|
| GlaxoSmithKline Mercury Limited (i) | | Ordinary | | 980 Great West Road, Brentford, Middlesex, TW8 9GS, England |
|
| GlaxoSmithKline Mexico S.A. de C.V. | | Ordinary | | Calzada, Mexico-Xochimilco 4900, Colonia San Lorenzo, Huipulco, Delegacion Tlalpan, 14370, Mexico |
|
| GlaxoSmithKline NZ Limited | | Ordinary | | Level 11, Zurich House, 21 Queen Street, Auckland, 1010, New Zealand |
|
| GlaxoSmithKline Oy | | Ordinary | | Piispansilta 9A, P.O. Box 24, Espoo, FIN-02230, Finland |
|
| GlaxoSmithKline Peru S.A. | | Ordinary | | Av. Javier Prado Oeste, 995, San Isidro, LIMA 27, Peru |
|
| GlaxoSmithKline Pharma A/S | | Ordinary | | Nykaer 68, Brondby, DK-2605, Denmark |
|
| GlaxoSmithKline Pharma GmbH | | Ordinary | | Wagenseilgasse 3, Euro Plaza, Gebäude I, 4. Stock, Vienna, A-1120, Austria |
|
| GlaxoSmithKline Pharmaceutical Kenya Limited | | Ordinary | | L.R. NO. 209/6921, 5th Floor, Icea Lion Centre, Riverside Park West Wing, Chiromo Road, Westlands P.O. Box 10643-00100, Nairobi, Kenya |
|
| GlaxoSmithKline Pharmaceutical Nigeria Limited | | Ordinary | | 1 Industrial Avenue, Ilupeju, Ikeja, Lagos, PM B 21218, Nigeria |
|
| GlaxoSmithKline Pharmaceutical Sdn Bhd | | Ordinary | | Level 6, Quill 9, 112, Jalan Semangat, Petaling Jaya, Selangor Darul Ehsan, 46300, Malaysia |
|
| GlaxoSmithKline Pharmaceuticals (Pvt) Ltd | | Ordinary | | 121 Galle Road, Kaldemulla, Moratuwa, Sri Lanka |
|
| GlaxoSmithKline Pharmaceuticals (Suzhou) Limited | | Ordinary | | No 40 Su Hong Xi Road, Suzhou Industrial Park, Suzhou, 215021, China |
|
| GlaxoSmithKline Pharmaceuticals Costa Rica S.A | | Ordinary | | 300 metros al este de la Rotonda de la Betania, Mercedes de Montes de Oca, Sabanilla, Montes de Oca, San Jose, Costa Rica |
|
| GlaxoSmithKline Pharmaceuticals S.A. | | Ordinary A; | | Ul. Grunwaldzka 189, Poznan, 60-322, Poland |
| | Ordinary B; | | |
| | Ordinary C; | | |
| | Ordinary D | | |
|
| GlaxoSmithKline Pharmaceuticals SA | | Ordinary | | Site Apollo, Avenue Pascal 2-4-6, Wavre, 1300, Belgium |
|
| GlaxoSmithKline Pharmaceuticals Ukraine LLC | | Chartered Capital | | Pavla Tychyny avenue, 1-V, Kiev, 02152, Ukraine |
|
| GlaxoSmithKline Pte Ltd | | Ordinary | | 23 Rochester Park, 139234, Singapore |
|
| GlaxoSmithKline Puerto Rico Inc. | | Common | | Centro Internacional de Mercadeo, 90 Road # 165, Tower II, Suite 800, Guaynabo, 00968, Puerto Rico |
|
| GlaxoSmithKline Republica Dominicana S.A. | | Ordinary | | Ave. Lope de Vega #29, Torre NovoCentro, Local 406, Santo Domingo, Dominican Republic |
|
| GlaxoSmithKline Research & Development Limited | | Ordinary | | 980 Great West Road, Brentford, Middlesex, TW8 9GS, England |
|
| GlaxoSmithKline S.A. | | Ordinary | | Severo Ochoa, 2, Parque Tecnologico de Madrid, Tres Cantos, Madrid, 28760, Spain |
|
| GlaxoSmithKline S.p.A. | | Ordinary | | Via Alessandro Fleming 2, Verona, 37135, Italy |
|
| GlaxoSmithKline s.r.o. | | Ordinary | | Hvezdova 1734/2c, Prague, 4 140 00, Czech Republic |
|
| GlaxoSmithKline Services GmbH & Co. KG | | Partnership Capital | | Prinzregentenplatz 9, München, 81675, Germany |
|
| GlaxoSmithKline Services Inc. (iv) | | Common | | Corporation Service Company, 251 Little Falls Drive, Wilmington, Delaware, 19808, United States |
|
| GlaxoSmithKline Services Unlimited (i) | | Ordinary | | 980 Great West Road, Brentford, Middlesex, TW8 9GS, England |
|
| GlaxoSmithKline SL Holdings, LLC | | LLC Interests | | Corporation Service Company, 251 Little Falls Drive, Wilmington, Delaware, 19808, United States |
|
| GlaxoSmithKline SL LLC | | LLC Interests | | Corporation Service Company, 251 Little Falls Drive, Wilmington, Delaware, 19808, United States |
|
| GlaxoSmithKline SL LP (iv) | | Partnership | | 980 Great West Road, Brentford, Middlesex, TW8 9GS, England |
|
| GlaxoSmithKline Slovakia s.r.o. | | Ordinary | | Galvaniho 7/A, Bratislava, 821 04, Slovakia |
|
| | |
| 280 | | |
GSK Annual Report 2017 | | |
| | |
| | |
Other statutory disclosurescontinued
Group companiescontinued
| | | | |
Name | | Security | | Registered address |
Wholly owned subsidiariescontinued | | | | |
|
| GlaxoSmithKline South Africa (Pty) Limited | | Ordinary | | Flushing Meadows Building, The Campus, 57 Sloane Street, Bryanston 2021, South Africa |
|
GlaxoSmithKline Superannuation Company Pty Ltd (in liquidation) | | Ordinary | | 1061 Mountain Highway, Boronia, VIC, 3155, Australia |
|
| GlaxoSmithKline Trading Services Limited (ii) (v) | | Ordinary | | Currabinny, Carrigaline, County Cork, Ireland |
|
| GlaxoSmithKline Trading ZAO | | Ordinary | | Yakimanskaya nab., 2, Moscow, 119180, Russian Federation |
|
| GlaxoSmithKline Tunisia S.A.R.L. | | Ordinary | | Immeuble Les Quatres R, Rue du Lac Lochness, Berges du Lac, Tunis, Tunisia |
|
| GlaxoSmithKline UK Limited | | Ordinary | | 980 Great West Road, Brentford, Middlesex, TW8 9GS, England |
|
| GlaxoSmithKline Uruguay S.A. | | Registered shares provisory stock | | Salto 1105, CP 11.200 Montevideo, Uruguay |
|
| GlaxoSmithKline Venezuela C.A. | | Ordinary | | Urbanizacion La Trinidad, Calle luis De Camoems, Edif No 115-117 Apatado Posta, Caracas, 1010, Venezuela |
|
| GlaxoSmithKline Vietnam Limited Liability Company (iv) (vi) | | Equity capital | | The Metropolitan, 235 Dong Khoi Street, District 1, 7th Floor Unit 701, Ho Chi Minh City, Viet Nam |
|
| GlycoVaxyn AG (vi) | | Common; Preferred A; Preferred B; Preferred C | | Grabenstrasse 3, 8952 Schlieren, Switzerland |
|
| Group Laboratories South Africa (Pty) Limited (iv) (vi) | | Ordinary | | Flushing Meadows Building, The Campus, 57 Sloane Street, Bryanston 2021, South Africa |
|
| Groupe GlaxoSmithKline S.A.S. | | Ordinary | | 23 rue François Jacob, 92500, Rueil-Malmaison, France |
|
| GSK Business Service Centre Sdn Bhd | | Ordinary | | Level 6, Quill 9, 112, Jalan Semangat, Petaling Jaya, Selangor Darul Ehsan, 46300, Malaysia |
|
| GSK Capital K.K. | | Ordinary | | 1-8-1 Asasaka Minato-ku, Tokyo, Japan |
|
| GSK CH Argentina S.A. | | Nominative non endorseable ordinary shares | | Tucumán 1, piso 4, Buenos Aires, C1049AAA, Argentina |
|
| GSK Commercial Sp. z o.o. | | Ordinary | | ul. Rzymowskiego 53, Warsaw, 02-697, Poland |
|
| GSK d.o.o., Ljubljana | | Ordinary | | Ameriška ulica 8,Ljubljana, 1000, Slovenia |
|
| GSK Kazakhstan LLP | | Charter Capital | | 273, Furmanov Street, Almaty, Medeu District, 050059, Kazakhstan |
|
| GSK Pharmaceutical Trading SA | | Ordinary | | 5 Poienelor Street, Brasov, Romania |
|
| GSK Services Sp z o.o. | | Ordinary | | Ul. Grunwaldzka 189, Poznan, 60-322, Poland |
|
| GSK Vaccines BV (iv) | | Ordinary | | Hullenbergweg 85, Amsterdam, 1101 CL, Netherlands |
|
| GSK Vaccines GmbH | | Ordinary | | Emil-von-Behring-Str.76, 35041 Marburg, Germany |
|
| GSK Vaccines Institute for Global Health S.r.l. | | Quotas | | Via Fiorentina 1, Siena, 53100, Italy |
|
| GSK Vaccines S.r.l. | | Quotas | | Via Fiorentina 1, Siena, 53100, Italy |
|
| GSK Vaccines Vertriebs GmbH | | Ordinary | | Rudolf-Diesel-Ring 27, Holzkirchen, 83607, Germany |
|
| HGS France S.a.r.l. (iv) (vi) | | Ordinary | | 52-54 rue de la Belle Feuille, Boulogne-Billancourt, 92100, France |
|
| Horlicks Limited | | Ordinary | | 980 Great West Road, Brentford, Middlesex, TW8 9GS, England |
|
Human Genome Sciences Pacific Pty Ltd (in liquidation) | | Ordinary | | 1061 Mountain Highway, Boronia, VIC, 3155, Australia |
|
| Human Genome Sciences, Inc. | | Common | | Corporation Service Company, 251 Little Falls Drive, Wilmington, Delaware, 19808, United States |
|
| ID Biomedical Corporation of Quebec | | Common | | 2323 du Parc Technologique, Québec, PQ, G1P 4R8, Canada |
|
| ID Biomedical Corporation of Washington (iv) | | Common | | Corporation Service Company, 251 Little Falls Drive, Wilmington, Delaware, 19808, United States |
|
| Instituto Luso Farmaco, Limitada (iv) | | Quotas | | Rua Dr Antonio Loureiro Borges No 3, Arquiparque, Miraflores, Alges, 1499-013, Portugal |
|
| InterPharma Dienstleistungen GmbH | | Quotas | | Wagenseilgasse 3, Euro Plaza, Gebäude I, 4. Stock, Vienna, A-1120, Austria |
|
| J&J Technologies, LC (iv) | | LLC Interests | | Corporation Service Company, 100 Shockoe Slip, 2nd Floor, Richmond, VA 23219, United States |
|
| Laboratoire GlaxoSmithKline | | Ordinary | | 23 rue François Jacob, 92500, Rueil-Malmaison, France |
|
| Laboratoire Pharmaceutique Algérien LPA Production SPA | | Ordinary | | Zone Industrielle Est, Boudouaou, Boumerdes, Algeria |
|
| Laboratoire Pharmaceutique Algérien SPA | | Ordinary | | Zone Industrielle Est, Boudouaou, Boumerdes, Algeria |
|
| Laboratoires Paucourt (iv) | | Ordianry | | 23 rue François Jacob, 92500, Rueil-Malmaison, France |
|
| Laboratoires Saint-Germain (iv) | | Ordianry | | 23 rue François Jacob, 92500, Rueil-Malmaison, France |
|
| Laboratorios Dermatologicos Darier, S.A de C.V. | | Ordianry | | Calzada Mexico Xochimilco, 4900 San Lorenzo Huipulco, District Federal Mexico, 14370, Mexico |
|
| Laboratorios Farmaceuticos Stiefel (Portugal) LTDA (iv) | | Ordinary | | Rua Dr Antonio Loureiro Borges No 3, Arquiparque, Miraflores, Alges, 1499-013, Portugal |
|
| Laboratorios Stiefel de Chile & Compañía Limitada (vi) | | Social Capital | | Avenida Andres Bello 2687, Piso 19, Las Condes, Santiago, C.P. 7550611, Chile |
|
| Laboratorios Stiefel de Venezuela SA (vi) | | Ordinary | | Urbanizacion La Trinidad, Calle luis De Camoems, Edif No 115-117 Apatado Posta, Caracas, 1010, Venezuela |
|
| Laboratorios Stiefel Ltda. | | Ordinary | | Rua Professor Joao C Salem 1081 1301, Guarulhos, Sao Paulo, Brazil |
|
| | | | |
| 281 | | |
| | | | | |
| GSK Annual Report 2017 | | Strategic report | | |
| | Governance and remuneration | | |
| | Financial statements | | |
| | Investor information | | |
Group companiescontinued
| | | | |
| Name | | Security | | Registered address |
| | |
Wholly owned subsidiariescontinued | | | | |
|
| Laboratorios Wellcome De Portugal Limitada (iv) | | Ordinary Quota | | Rua Dr Antonio Loureiro Borges No 3, Arquiparque, Miraflores, Alges, 1499-013, Portugal |
|
| Maxinutrition Limited (in liquidation) | | Ordinary | | 55 Baker Street, London, W1U 7EU, England |
|
| Mixis Genetics Limited | | Ordinary; Ordinary Euro | | 980 Great West Road, Brentford, Middlesex, TW8 9GS, England |
|
| Montrose Fine Chemical Company Ltd | | Ordinary | | Shewalton Road, Irvine, Ayrshire, KA11 5AP, Scotland |
|
| Montrose Pharma Company Limited (iv) (vi) | | Ordinary Quota | | H-1124, Csorsz utca 43, Budapest, Hungary |
|
| Novartis Vaccines and Diagnostics AG (in liquidation) | | Ordinary | | c/o OBC Suisse AG, Aeschenvorstadt 71, Basel, 4051, Switzerland |
|
| Novartis Vaccines and Diagnostics Pty Ltd (iv) (vi) | | Ordinary | | 1061 Mountain Highway, Boronia, VIC, 3155, Australia |
|
| Okairos AG (in liquidation) | | Common; Preferred A; Preferred B | | c/o OBC Suisse AG, Aeschenvorstadt 71, 4051, Basel, Switzerland |
|
| Penn Labs Inc. (iv) | | Common | | Corporation Service Company, 251 Little Falls Drive, Wilmington, Delaware, 19808, United States |
|
| S.R. One International B.V. | | Ordinary | | Huis ter Heideweg 62, 3705 LZ, Zeist, Netherlands |
|
| S.R. One, Limited | | Units (Common) | | Corporation Service Company, 2595 Interstate Drive, Suite 103, Harrisburg, Pennsylvania, 17110, United States |
|
| Setfirst Limited | | Ordinary | | 980 Great West Road, Brentford, Middlesex, TW8 9GS, England |
|
| Smith Kline & French Laboratories Limited | | Ordinary | | 980 Great West Road, Brentford, Middlesex, TW8 9GS, England |
|
Smith Kline & French Portuguesa-Produtos Farmaceuticos, LDA (iv) | | Ordinary | | Rua Dr Antonio Loureiro Borges No 3, Arquiparque, Miraflores, Alges, 1499-013, Portugal |
|
| SmithKline Beecham (Australia) Pty Ltd (in liquidation) | | Ordinary | | 1061 Mountain Highway, Boronia, VIC, 3155, Australia |
|
| SmithKline Beecham (Bangladesh) Private Limited (iv) | | Ordinary | | 14, Topkhana Road, Segunbagicha, Dhaka 1000, Bangladesh |
|
| SmithKline Beecham (Cork) Limited (ii) | | Ordinary | | Currabinny, Carrigaline, County Cork, Ireland |
|
| SmithKline Beecham (Export) Limited | | Ordinary | | 980 Great West Road, Brentford, Middlesex, TW8 9GS, England |
|
| SmithKline Beecham (H) Limited | | Non-cumulative non-redeemables; Ordinary | | 980 Great West Road, Brentford, Middlesex, TW8 9GS, England |
|
| SmithKline Beecham (Investments) Limited | | Ordinary | | 980 Great West Road, Brentford, Middlesex, TW8 9GS, England |
|
| SmithKline Beecham (Manufacturing) Limited (ii) | | Ordinary | | Currabinny, Carrigaline, County Cork, Ireland |
|
| SmithKline Beecham (SWG) Limited | | Ordinary | | 980 Great West Road, Brentford, Middlesex, TW8 9GS, England |
|
| SmithKline Beecham Biologicals US Partnership | | Partnership Interest | | Corporation Service Company, 251 Little Falls Drive, Wilmington, Delaware, 19808, United States |
|
| SmithKline Beecham Egypt L.L.C. | | Quotas | | Amoun Street, El Salam City, Cairo, Egypt |
|
| SmithKline Beecham Farma, S.A. | | Ordinary | | Severo Ochoa, 2, Parque Tecnologico de Madrid, Tres Cantos, Madrid, 28760, Spain |
|
SmithKline Beecham Holdings (Australia) Pty. Limited (in liquidation) | | Ordinary | | 1061 Mountain Highway, Boronia, VIC, 3155, Australia |
|
| SmithKline Beecham Inter-American Corporation (iv) | | Common | | Corporation Service Company, 251 Little Falls Drive, Wilmington, Delaware, 19808, United States |
|
| SmithKline Beecham Limited | | Ordinary 6.25p | | 980 Great West Road, Brentford, Middlesex, TW8 9GS, England |
|
| SmithKline Beecham Marketing and Technical Services Limited | | Ordinary | | 980 Great West Road, Brentford, Middlesex, TW8 9GS, England |
|
| SmithKline Beecham Nominees Limited | | Ordinary | | 980 Great West Road, Brentford, Middlesex, TW8 9GS, England |
|
| SmithKline Beecham Overseas Limited | | Ordinary | | 980 Great West Road, Brentford, Middlesex, TW8 9GS, England |
|
| SmithKline Beecham Pension Plan Trustee Limited (iv) | | Ordinary | | 980 Great West Road, Brentford, Middlesex, TW8 9GS, England |
|
| SmithKline Beecham Pension Trustees Limited (iv) | | Ordinary | | 980 Great West Road, Brentford, Middlesex, TW8 9GS, England |
|
| SmithKline Beecham Pharma GmbH & Co KG | | Partnership Capital | | Prinzregentenplatz 9, München, 81675, Germany |
|
| SmithKline Beecham Pharma Verwaltungs GmbH | | Ordinary | | Prinzregentenplatz 9, München, 81675, Germany |
|
| SmithKline Beecham Pharmaceuticals (Pty) Limited (iv) (vi) | | Ordinary | | Flushing Meadows Building, The Campus, 57 Sloane Street, Bryanston 2021, South Africa |
|
| SmithKline Beecham Pharmaceuticals Co. | | Common | | Corporation Service Company, 251 Little Falls Drive, Wilmington, Delaware, 19808, United States |
|
| SmithKline Beecham Port Louis Limited (vi) | | Ordinary | | C/o CIM Corporate Services Ltd, Les Cascades Building, Edith Cavell Street, Port Louis, Mauritius |
|
SmithKline Beecham Retirement Plan (Nominees) Pty Limited (in liquidation) | | Ordinary | | 1061 Mountain Highway, Boronia, VIC, 3155, Australia |
|
| SmithKline Beecham Senior Executive Pension Plan Trustee Limited (iv) | | Ordinary | | 980 Great West Road, Brentford, Middlesex, TW8 9GS, England |
|
| Stiefel Distributors (Ireland) Limited (ii) (iv) | | Ordinary | | Finisklin Business Park, Sligo, Ireland |
|
| Stiefel Dominicana, S.R.L. (iv) (vi) | | Ordinary | | Ave. Lope de Vega #29, Torre NovoCentro, Local 406, Santo Domingo, Dominican Republic |
|
| Stiefel Farma, S.A. | | Ordinary | | Severo Ochoa, 2, Parque Tecnologico de Madrid, Tres Cantos, Madrid, 28760, Spain |
|
| Stiefel GmbH & Co. KG | | Partnership Capital | | Industriestrasse 32-36, Bad Oldesloe, 23843, Germany |
|
| | |
| 282 | | |
GSK Annual Report 2017 | | |
| | |
| | |
Other statutory disclosurescontinued
Group companiescontinued
| | | | |
| Name | | Security | | Registered address |
Wholly owned subsidiariescontinued | | | | |
| Stiefel India Private Limited | | Equity | | 401-402, A, Wing, 4th Floor, Floral Deck Plaza, Opp Rolta Bhavan, Central MIDC Road, Mumbai, Andheri (E), 400093, India |
| Stiefel Laboratories (Maidenhead) Ltd | | Ordinary | | Eurasia Headquarters, Concorde Road, Maidenhead, Berkshire, SL6 4BY, England |
| Stiefel Laboratories (U.K.) Ltd | | Ordinary | | Eurasia Headquarters, Concorde Road, Maidenhead, Berkshire, SL6 4BY, England |
| Stiefel Laboratories Legacy (Ireland) Limited (ii) | | Ordinary | | Finisklin Business Park, Sligo, Ireland |
| Stiefel Laboratories Limited (iv) | | Ordinary | | Eurasia Headquarters, Concorde Road, Maidenhead, Berkshire, SL6 4BY, England |
| Stiefel Laboratories Pte Limited (vi) | | Ordinary | | 103 Gul Circle, 629589, Singapore |
| Stiefel Laboratories Pty Ltd (in liquidation) | | Ordinary | | 1061 Mountain Highway, Boronia, VIC, 3155, Australia |
| Stiefel Laboratories, Inc. | | Common | | Corporation Service Company, 251 Little Falls Drive, Wilmington, Delaware, 19808, United States |
| Stiefel Maroc SARL | | Ordinary | | 275 Boulevard Zerktouni, Casablanca, Morocco |
| Stiefel Research (Australia) Holdings Pty Ltd (vi) | | Ordinary | | 1061 Mountain Highway, Boronia, VIC, 3155, Australia |
| Stiefel Research Australia Pty Ltd (vi) | | Ordinary | | 1061 Mountain Highway, Boronia, VIC, 3155, Australia |
| Stiefel West Coast LLC | | LLC Interests | | Corporation Service Company, 251 Little Falls Drive, Wilmington, Delaware, 19808, United States |
| Strebor Inc. | | Common | | Corporation Service Company, 251 Little Falls Drive, Wilmington, Delaware, 19808, United States |
| Tempero Pharmaceuticals, Inc. | | Series A Preference; Series B Preference; Common | | Corporation Service Company, 251 Little Falls Drive, Wilmington, Delaware, 19808, United States |
| The Sydney Ross Co. (iv) | | Ordinary | | Corporation Service Company, Princeton South Corporate Center, Suite 160, 100 Charles Ewing Blvd, Ewing, New Jersey, 08628, United States |
| The Wellcome Foundation Limited | | Ordinary | | 980 Great West Road, Brentford, Middlesex, TW8 9GS, England |
| UCB Pharma Asia Pacific Sdn Bhd (iv) | | Ordinary | | Level 8, Symphony House, Pusat Dagangan Dana 1, Jalan PJU 1A/46, Petaling Jaya, Selangor Darul Ehsan, 47301, Malaysia |
| Wellcome Consumer Healthcare Limited (iv) | | Ordinary | | 980 Great West Road, Brentford, Middlesex, TW8 9GS, England |
| Wellcome Consumer Products Limited (iv) | | Ordinary | | 980 Great West Road, Brentford, Middlesex, TW8 9GS, England |
| Wellcome Developments Pty Ltd (iv) (vi) | | Ordinary | | 1061 Mountain Highway, Boronia, VIC, 3155, Australia |
| Wellcome Limited | | Ordinary | | 980 Great West Road, Brentford, Middlesex, TW8 9GS, England |
| Wellcome Operations Pty Ltd (iv) (vi) | | Ordinary | | 1061 Mountain Highway, Boronia, VIC, 3155, Australia |
| | | | | | |
| Name | | Security | | Effective % Ownership | | Registered address |
|
| Subsidiaries where the effective interest is less than 100% |
| Amoun Pharmaceutical Industries Co. S.A.E. | | New Monetary Shares (99.5%) | | 90.7 | | El Salam City 11491, PO Box 3001, Cairo, Egypt |
| Beecham Enterprises Inc. (iv) | | Common | | 55.9 | | Corporation Service Company, 251 Little Falls Drive, Wilmington, Delaware, 19808, United States |
| Block Drug Company, Inc. | | Common | | 63.5 | | Corporation Service Company, Princeton South Corporate Center, Suite 160, 100 Charles Ewing Blvd, Ewing, New Jersey, 08628, United States |
| Block Drug Corporation (iv) | | Common | | 63.5 | | Corporation Service Company, Princeton South Corporate Center, Suite 160, 100 Charles Ewing Blvd, Ewing, New Jersey, 08628, United States |
| British Pharma Group Limited (i) | | Captial (50%) | | 50 | | 980 Great West Road, Brentford, Middlesex, TW8 9GS, England |
| de Miclén a.s. | | Ordinary | | 63.5 | | Priemyselny Park Gena, Ul. E. Sachsa 4-6, 934 01, Levice, Slovakia |
| Duncan Consumer Healthcare Philippines Inc | | Common | | 63.5 | | 2266 Don Chino Roces Avenue, Makati City, Philippines |
| Duncan Pharmaceuticals Philippines Inc. | | Common | | 91.5 | | 2266 Don Chino Roces Avenue, Makati City, Philippines |
| Ex-Lax, Inc. | | Common | | 63.5 | | The Prentice Hall Corporation System, Puerto Rico, Inc., c/o Fast Solutions, LLC, Citi Tower, 252 Ponce de Leon Avenue, Floor 20, San Juan, 00918, Puerto Rico |
| Galvani Bioelectronics Inc. | | Common | | 55 | | Corporation Service Company, 251 Little Falls Drive, Wilmington, Delaware, 19808, United States |
| Galvani Bioelectronics Limited | | A Ordinary; B Ordinary (0%) | | 55 | | 980 Great West Road, Brentford, Middlesex, TW8 9GS, England |
| Glaxo Saudi Arabia Limited | | Ordinary | | 75 | | PO Box 22617, Area No 73 to 156, Warehouse City, First Stage Al Khomrah, Jeddah 21416, Saudi Arabia |
| | | | |
| 283 | | |
| | | | | |
| GSK Annual Report 2017 | | Strategic report | | |
| | Governance and remuneration | | |
| | Financial statements | | |
| | Investor information | | |
Group companiescontinued
| | | | | | |
Name | | Security | | Effective % Ownership | | Registered address |
|
Subsidiaries where the effective interest is less than 100%continued |
| Glaxo Wellcome Ceylon Limited | | Ordinary; Ordinary B | | 63.3 | | 121 Galle Road, Kaldemulla, Moratuwa, Sri Lanka |
| GlaxoSmithKline (Tianjin) Co. Ltd | | Ordinary (90%) | | 90 | | No. 65, the Fifth Avenue, Tai Feng Industrial Park, Tianjin Economic and Technolog, Tianjin, 300457, China |
| GlaxoSmithKline Algérie S.P.A. | | Ordinary | | 99.99 | | Zone Industrielle Est, Boudouaou, Wilaya de Boumerdes, Algeria |
| GlaxoSmithKline Bangladesh Limited | | Ordinary (82%) | | 82 | | Fouzderhat Industrial Area, Dhaka Trunk Road, North Kattali, Chittagong – 4217, Bangladesh |
| GlaxoSmithKline Brasil Produtos para Consumo e Saude Ltda | | Quotas | | 63.5 | | 66 BL1/302, Vitor Civita Street, Barra Tijuca, Rio de Janeiro, 22775-044, Brazil |
| GlaxoSmithKline Consumer Healthcare (China) Co. Ltd | | Ordinary | | 63.5 | | Rooms 01A, 06B-09, 23F, The Headquarters Building, No. 168 Tibet Road (M), Shanghai, 200001, China |
| GlaxoSmithKline Consumer Healthcare (Hong Kong) Limited | | Ordinary | | 63.5 | | Units 2201, 2214 and 23/F, Tower 6, The Gateway, 9 Canton Road, Harbour City, Tsimshatsui, Kowloon, Hong Kong |
| GlaxoSmithKline Consumer Healthcare (Ireland) Limited (ii) | | Ordinary | | 63.5 | | 12 Riverwalk Citywest Business Campus, Dublin, 24, Ireland |
| GlaxoSmithKline Consumer Healthcare (Overseas) Limited | | Ordinary | | 63.5 | | 980 Great West Road, Brentford, Middlesex, TW8 9GS, England |
| GlaxoSmithKline Consumer Healthcare (Thailand) Limited | | Ordinary | | 63.5 | | 13th Floor, Unit 13.05 and 13.06 Wave Place, 55 Wireless Road, Lumpini, Pathumwan, Bangkok, 10330, Thailand |
| GlaxoSmithKline Consumer Healthcare (UK) IP Limited | | Ordinary | | 63.5 | | 980 Great West Road, Brentford, Middlesex, TW8 9GS, England |
| GlaxoSmithKline Consumer Healthcare (UK) Trading Limited | | Ordinary | | 63.5 | | 980 Great West Road, Brentford, Middlesex, TW8 9GS, England |
| GlaxoSmithKline Consumer Healthcare (US) IP LLC | | LLC Interests | | 63.5 | | Corporation Service Company, 251 Little Falls Drive, Wilmington, Delaware, 19808, United States |
| GlaxoSmithKline Consumer Healthcare A/S | | Ordinary | | 63.5 | | Nykaer 68, Brondby, DK-2605, Denmark |
| GlaxoSmithKline Consumer Healthcare AB (vii) | | Ordinary | | 63.5 | | Nykaer 68, DK-2605, Brondby, Denmark |
| GlaxoSmithKline Consumer Healthcare Australia Pty Ltd | | Ordinary | | 63.5 | | 82 Hughes Avenue, Ermington, NSW, 2115, Australia |
| GlaxoSmithKline Consumer Healthcare B.V. | | Ordinary | | 63.5 | | Huis ter Heideweg 62, 3705 LZ, Zeist, Netherlands |
| GlaxoSmithKline Consumer Healthcare Colombia SAS | | Ordinary | | 63.5 | | Avenida El Dorado, #69B-45/Piso 9, Bogota, Colombia |
| GlaxoSmithKline Consumer Healthcare Czech Republic s.r.o. | | Ordinary | | 63.5 | | Hvezdova 1734/2c, Prague, 4 140 00, Czech Republic |
| GlaxoSmithKline Consumer Healthcare Finance Limited | | Ordinary | | 63.5 | | 980 Great West Road, Brentford, Middlesex, TW8 9GS, England |
| GlaxoSmithKline Consumer Healthcare Finance No.2 Limited | | Ordinary | | 63.5 | | 980 Great West Road, Brentford, Middlesex, TW8 9GS, England |
| GlaxoSmithKline Consumer Healthcare Finland Oy | | Ordinary | | 63.5 | | Piispansilta 9A, Fin-02230, Espoo, Finland |
| GlaxoSmithKline Consumer Healthcare GmbH | | Ordinary | | 63.5 | | Wagenseilgasse 3, Euro Plaza, Gebäude I, 4. Stock, Vienna, A-1120, Austria |
| GlaxoSmithKline Consumer Healthcare GmbH & Co. KG | | Partnership Capital | | 63.5 | | Barthstr. 4, München, 80339, Germany |
| GlaxoSmithKline Consumer Healthcare Greece Societe Anonyme | | Ordinary | | 63.5 | | 274 Kifissias Avenue Halandri, Athens, 152 32, Greece |
| GlaxoSmithKline Consumer Healthcare Holdings (US) LLC | | LLC Interests | | 63.5 | | Corporation Service Company, 251 Little Falls Drive, Wilmington, Delaware, 19808, United States |
| GlaxoSmithKline Consumer Healthcare Holdings Limited | | Ordinary A; Ordinary B (0%) | | 63.5 | | 980 Great West Road, Brentford, Middlesex, TW8 9GS, England |
| GlaxoSmithKline Consumer Healthcare Inc. | | Common | | 63.5 | | 7333 Mississauga Road North, Mississagua, ON, L5N 6L4, Canada |
| GlaxoSmithKline Consumer Healthcare Investments (Ireland) (No 3) Limited (ii) (v) | | Ordinary | | 63.5 | | Knockbrack, Dungarvan, Co Waterford, X35 RY76, Ireland |
| GlaxoSmithKline Consumer Healthcare Investments (Ireland) (No.2) Unlimited Company (ii) (iv) (v) | | Ordinary | | 63.5 | | Knockbrack, Dungarvan, Co Waterford, X35 RY76, Ireland |
| GlaxoSmithKline Consumer Healthcare Japan K.K. | | Ordinary | | 63.5 | | 1-8-1 Asasaka Minato-ku, Tokyo, Japan |
| GlaxoSmithKline Consumer Healthcare Korea Co., Ltd. | | Ordinary | | 63.5 | | 9F LS Yongsan Tower, 92, Hangang-daero, Yongsan-gu, Seoul, 140-702, Republic of Korea |
| GlaxoSmithKline Consumer Healthcare L.L.C. | | LLC Interests | | 63.5 | | Corporation Service Company, 2595 Interstate Drive Suite 103, Harrisburg, Pennsylvania, 17110, United States |
| GlaxoSmithKline Consumer Healthcare Limited | | Equity (72.5%) | | 72.5 | | Patiala Road, Nabha 147201, Dist Patiala, Punjab, India |
GlaxoSmithKline Consumer Healthcare Mexico, S. De R.L. de C.V. | | Ordinary | | 63.5 | | Calzada Mexico-Xochimilco 4900, Colonia San Lorenzo Huipulco, Delegacion Tlalpan, Mexico, D.F. 14370, Mexico |
| GlaxoSmithKline Consumer Healthcare New Zealand Limited | | Ordinary | | 63.5 | | Level 11, Zurich House, 21 Queen Street, Auckland, 1010, New Zealand |
| GlaxoSmithKline Consumer Healthcare Norway AS | | Ordinary | | 63.5 | | Klaus Torgårds vei 3, Oslo, NO-0372, Norway |
| GlaxoSmithKline Consumer Healthcare Pakistan Limited | | Ordinary (82.6%) | | 52.4 | | The Sykes Building, 35 Dockyard Road, West Wharf, Karachi, 74000, Pakistan |
| GlaxoSmithKline Consumer Healthcare Philippines Inc | | Common | | 63.5 | | 2266 Don Chino Roces Avenue, Makati City, Philippines |
| GlaxoSmithKline Consumer Healthcare Pte. Ltd. | | Ordinary | | 63.5 | | 23 Rochester Park, 139234, Singapore |
| GlaxoSmithKline Consumer Healthcare S.A. | | Ordinary | | 63.5 | | Site Apollo, Avenue Pascal 2-4-6, Wavre, 1300, Belgium |
| GlaxoSmithKline Consumer Healthcare S.A. | | Ordinary | | 63.5 | | Severo Ochoa, 2, Parque Tecnologico de Madrid, Tres Cantos, Madrid, 28760, Spain |
| | |
| 284 | | |
GSK Annual Report 2017 | | |
| | |
| | |
Other statutory disclosurescontinued
Group companiescontinued
| | | | | | |
| Name | | Security | | Effective % Ownership | | Registered address |
|
| Subsidiaries where the effective interest is less than 100%continued |
| GlaxoSmithKline Consumer Healthcare S.p.A. | | Ordinary | | 63.5 | | Via Zambeletti snc, Baranzate, Milan, 20021, Italy |
| GlaxoSmithKline Consumer Healthcare Sdn. Bhd. | | Ordinary | | 63.5 | | Lot 89, Jalan Enggang, Ampang/Ulu Kelang Industrial Estate, Selangor, 54200, Malaysia |
| GlaxoSmithKline Consumer Healthcare Slovakia s. r. o. | | Ownership interest | | 63.5 | | Galvaniho 7/A, Bratislava, 821 04, Slovakia |
| GlaxoSmithKline Consumer Healthcare South Africa (Pty) Ltd | | Ordinary | | 63.5 | | Flushing Meadows Building, The Campus, 57 Sloane Street, Bryanston 2021, South Africa |
| GlaxoSmithKline Consumer Healthcare Sp.z.o.o. | | Common | | 63.5 | | ul. Rzymowskiego 53, Warsaw, 02-697, Poland |
| GlaxoSmithKline Consumer Healthcare Sri Lanka Holdings Limited | | Ordinary | | 63.5 | | 980 Great West Road, Brentford, Middlesex, TW8 9GS, England |
| GlaxoSmithKline Consumer Healthcare SRL | | Ordinary | | 63.5 | | 1-5 Costache Negri Street, Opera Center One, 6th floor (Zone 2), District 5, Bucharest, Romania |
| GlaxoSmithKline Consumer Healthcare Vietnam Company Limited | | Charter Capital | | 63.5 | | Floor 16, Metropolitan, 235 Dong Khoi, Ben Nghe Ward, District 1, Ho Chi Minh City, Viet Nam |
| GlaxoSmithKline Consumer Healthcare, L.P. | | Partnership Interest (55.9%) | | 55.9 | | Corporation Service Company, 251 Little Falls Drive, Wilmington, Delaware, 19808, United States |
GlaxoSmithKline Consumer Healthcare, Produtos para a Saude e Higiene, Lda | | Ordinary Quota | | 63.5 | | Rua Dr Antonio Loureiro Borges No 3, Arquiparque, Miraflores, Alges, 1499-013, Portugal |
| GlaxoSmithKline Consumer Nigeria plc (iii) | | Ordinary (46.4%) | | 46.4 | | 1 Industrial Avenue, Ilupeju, Ikeja, Lagos, PM B 21218, Nigeria |
| GlaxoSmithKline Consumer Private Limited | | Equity | | 63.5 | | Patiala Road, Nabha 147201, Dist Patiala, Punjab, India |
| GlaxoSmithKline Consumer Trading Services Limited | | Ordinary | | 63.5 | | 980 Great West Road, Brentford, Middlesex, TW8 9GS, England |
| GlaxoSmithKline Costa Rica S.A. | | Ordinary | | 63.5 | | San Jose 300 Este de la Rotonda Betania, Carretera a Sabanilla, Costa Rica |
| GlaxoSmithKline Dungarvan Limited (ii) | | Ordinary | | 63.5 | | Knockbrack, Dungarvan, Co Waterford, X35 RY76, Ireland |
| GlaxoSmithKline Healthcare AO | | Ordinary | | 63.5 | | Presnenskaya nab 10, Moscow, 123112 |
| GlaxoSmithKline Healthcare GmbH | | Ordinary | | 63.5 | | Barthstr. 4, München, 80339, Germany |
| GlaxoSmithKline Healthcare Ukraine O.O.O. | | Ownership interest | | 63.5 | | Pavla Tychyny avenue, 1-V, Kiev, 02152, Ukraine |
| GlaxoSmithKline Limited | | Ordinary | | 63.5 | | Likoni Road, PO Box 78392, Nairobi, Kenya |
| GlaxoSmithKline OTC (PVT.) Limited | | Ordinary | | 63.5 | | The Sykes Building, 35 Dockyard Road, West Wharf, Karachi, 74000, Pakistan |
| GlaxoSmithKline Pakistan Limited | | Ordinary (82.6%) | | 82.6 | | The Sykes Building, 35 Dockyard Road, West Wharf, Karachi, 74000, Pakistan |
| GlaxoSmithKline Panama S.A. | | Ordinary | | 63.5 | | Panama City, Republic of Panama, Panama |
| GlaxoSmithKline Paraguay S.A. | | Ordinary | | 63.5 | | Oficial Gilberto Aranda 333, Planta Alta casi Salvador del Mundo, Asuncion, Paraguay |
| GlaxoSmithKline Pharmaceuticals Limited | | Equity (75%) | | 75 | | 252 Dr Annie Besant Road, Mumbai, 400030, India |
| GlaxoSmithKline Philippines Inc | | Common | | 91.5 | | 2266 Chino Roces Avenue, Makati City, Philippines |
| GlaxoSmithKline S.A.E. | | Ordinary (91.2%) | | 91.2 | | Boomerang Office Building – Land No. 46, Zone (J) – 1st District, Town Center – 5th Tagammoe, New Cairo City, Egypt |
| GlaxoSmithKline Sante Grand Public SAS | | Ordinary | | 63.5 | | 23 rue François Jacob, 92500, Rueil-Malmaison, France |
| GlaxoSmithKline Tuketici Sagligi Anonim Sirketi | | Nominative | | 63.5 | | Büyükdere Caddesi No. 173, 1.Levent Plaza B Blok, 1.Levent, Istanbul, 34394, Turkey |
| GlaxoSmithKline-Consumer Hungary Limited Liability Company | | Membership | | 63.5 | | H-1124, Csorsz utca 43, Budapest, Hungary |
| GSK CH Kazakhstan LLP | | Charter Capital | | 63.5 | | 32 A Manasa Str., Bostandyk District, Almaty, 050008, Kazakhstan |
| GSK Consumer Health, Inc. | | Common | | 63.5 | | Corporation Service Company, 251 Little Falls Drive, Wilmington, Delaware, 19808, United States |
| GSK Consumer Healthcare Israel Ltd (iv) | | Ordinary | | 63.5 | | 25 Basel Street, Petech Tikva 49510, Israel |
| GSK Consumer Healthcare Schweiz AG | | Ordinary | | 63.5 | | Suurstoffi 14, Rotkreuz, 6343, Switzerland |
| GSK Consumer Healthcare Services, Inc. | | Common | | 63.5 | | Corporation Service Company, 251 Little Falls Drive, Wilmington, Delaware, 19808, United States |
| GSK Consumer Healthcare Singapore Pte. Ltd. | | Ordinary | | 63.5 | | 23 Rochester Park, 139234, Singapore |
| GSK-Gebro Consumer Healthcare GmbH | | Ordinary | | 38.1 | | Bahnhofbichl 1, 6391 Fieberbrunn, Kitzbühel, Austria |
| Iodosan S.p.A. | | Ordinary | | 63.5 | | Via Zambeletti snc,Baranzate, Milan, 20021, Italy |
| Kuhs GmbH | | Ordinary | | 63.5 | | Barthstr. 4, München, 80339, Germany |
| Laboratorios ViiV Healthcare, S.L. | | Ordinary | | 78.3 | | Severo Ochoa, 2, Parque Tecnologico de Madrid, Tres Cantos, Madrid, 28760, Spain |
| Modern Pharma Trading Company L.L.C. | | Quotas (98.2%) | | 98.2 | | Amoun Street, PO Box 3001, El Salam City, Cairo, 11491, Egypt |
| N.C.H. – Nutrition Consumer Health Ltd (vi) | | Ordinary | | 63.5 | | 14 Hamephalsim St, Petach Tikva, Israel |
| Novartis Consumer Health Australasia Pty Ltd (iv) (vi) | | Ordinary; Redeemable Preference | | 63.5 | | 82 Hughes Avenue, Ermington, NSW, 2115, Australia |
| Novartis Consumer Health GmbH | | Ordinary | | 63.5 | | Barthstr. 4, München, 80339, Germany |
| | | | |
| 285 | | |
| | | | | |
| GSK Annual Report 2017 | | Strategic report | | |
| | Governance and remuneration | | |
| | Financial statements | | |
| | Investor information | | |
Group companiescontinued
| | | | | | |
| Name | | Security | | Effective % Ownership | | Registered address |
|
| Subsidiaries where the effective interest is less than 100%continued |
| Novartis Consumer Health S.A. | | Ordinary | | 63.5 | | Route de I’Etraz 2, 1197 Prangins, Switzerland |
| Novartis Consumer Health UK Limited | | Ordinary | | 63.5 | | Park View, Riverside Way, Watchmoor Park, Camberley, Surrey, GU15 3YL, England |
| P.T. SmithKline Beecham Pharmaceuticals | | A Shares; B Shares (0%) | | 99 | | Jl. Pulobuaran Raya, Kav. III DD/2,3,4, Kawasan Industri Pulogadung, Jakarta, 13930, Indonesia |
| P.T. Sterling Products Indonesia | | A shares; B Shares | | 63.5 | | Graha Paramita Building, 5th F, Jalan Denpasar Raya Blok D-2, Jakarta, 12940, Indonesia |
| Panadol GmbH | | Ordinary | | 63.5 | | Barthstr. 4, München, 80339, Germany |
| PHIVCO Jersey II Limited (iv) (v) | | Ordinary | | 78.3 | | 13 Castle Street, St. Helier, JE4 5UT, Jersey |
| PHIVCO Jersey Limited (iv) (v) | | Ordinary | | 78.3 | | 13 Castle Street, St. Helier, JE4 5UT, Jersey |
| PHIVCO UK II Limited | | Ordinary | | 78.3 | | 980 Great West Road, Brentford, Middlesex, TW8 9GS, England |
| PHIVCO UK Limited | | Ordinary | | 78.3 | | 980 Great West Road, Brentford, Middlesex, TW8 9GS, England |
| PHIVCO-1 LLC | | LLC Interests | | 78.3 | | Corporation Service Company, 251 Little Falls Drive, Wilmington, Delaware, 19808, United States |
| PHIVCO-2 LLC | | LLC Interests | | 78.3 | | Corporation Service Company, 251 Little Falls Drive, Wilmington, Delaware, 19808, United States |
| PT Glaxo Wellcome Indonesia | | A Shares; B Shares (0%) | | 95 | | Jl Pulobuaran Raya Kav III DD/, Kawasan Industri Pulogadung, Timur, Jakarta, 13930, Indonesia |
| PT GSK Consumer Healthcare Indonesia | | Ordinary | | 63.5 | | Graha Paramita 3B Floor, Jl. Denpasar Raya Blok D-2, Kuningan, Jakarta, 12940, Indonesia |
| PT. Bina Dentalindo (in liquidation) | | Ordinary | | 63.5 | | Gedung Graha Ganesha Lantai 3, Jl Raya Bekasi Km 17, No5, Jakarta Timur 13930, Indonesia |
| Shionogi-ViiV Healthcare LLC (iv) | | Common Interests | | 78.3 | | Corporation Service Company, 251 Little Falls Drive, Wilmington, Delaware, 19808, United States |
| Sino-American Tianjin Smith Kline & French Laboratories Ltd | | Ordinary (55%) | | 34.9 | | Cheng Lin Zhuang Industrial Zone, Dong Li District, Tianjin, 300163, China |
| SmithKline Beecham (Private) Limited | | Ordinary (99.6%) | | 63.3 | | World Trade Center, Level 34, West Tower, Echelon Square, Colombo 1, Sri Lanka |
| SmithKline Beecham Research Limited | | Ordinary | | 63.5 | | 980 Great West Road, Brentford, Middlesex, TW8 9GS, England |
| SmithKline Beecham S.A. | | Ordinary | | 63.5 | | Ctra de Ajalvir Km 2.500, Alcala de Henares, Madrid, 28806, Spain |
| SmithKline Beecham-Biomed O.O.O. | | Participation Interest (97%) | | 97 | | Krylatskaya str., 17/3., Moscow, 121614, Russian Federation |
| Stafford-Miller (Ireland) Limited (ii) | | Ordinary | | 63.5 | | Clocherane, Youghal Road, Dungarvan, Co. Waterford, Ireland |
| Stafford-Miller Limited | | Ordinary; Non-Cumulative Non Redeemable Preference | | 63.5 | | 980 Great West Road, Brentford, Middlesex, TW8 9GS, England |
| Sterling Drug (Malaya) Sdn Berhad | | Ordinary | | 63.5 | | Lot 89, Jalan Enggang, Ampang/Ulu Kelang Industrial Estate, Selangor, 54200, Malaysia |
| Sterling Products International, Incorporated (iv) | | Common | | 63.5 | | Corporation Service Company, 251 Little Falls Drive, Wilmington, Delaware, 19808, United States |
| Stiefel Consumer Healthcare (UK) Limited | | Ordinary | | 63.5 | | 980 Great West Road, Brentford, Middlesex, TW8 9GS, England |
| Stiefel Egypt LLC (iv) | | Quota (99%) | | 99 | | 3 Amoun Street, El Salam City, Cairo, Egypt |
| Stiefel Laboratories (Ireland) Limited (ii) | | Ordinary | | 63.5 | | Finisklin Business Park, County Sligo, Ireland |
| ViiV Healthcare (South Africa) (Proprietary) Limited | | Ordinary | | 78.3 | | Flushing Meadows Building, The Campus, 57 Sloane Street, Bryanston 2021, South Africa |
| ViiV HealthCare BV | | Ordinary | | 78.3 | | Huis ter Heideweg 62, 3705 LZ, Zeist, Netherlands |
| ViiV Healthcare Company | | Common | | 78.3 | | Corporation Service Company, 251 Little Falls Drive, Wilmington, Delaware, 19808, United States |
| ViiV Healthcare Finance 1 Limited | | Ordinary | | 78.3 | | 980 Great West Road, Brentford, Middlesex, TW8 9GS, England |
| ViiV Healthcare Finance 2 Limited | | Ordinary | | 78.3 | | 980 Great West Road, Brentford, Middlesex, TW8 9GS, England |
| ViiV Healthcare Finance Limited | | Ordinary; Redeemable Preference | | 78.3 | | 980 Great West Road, Brentford, Middlesex, TW8 9GS, England |
| ViiV Healthcare GmbH | | Ordinary | | 78.3 | | Prinzregentenplatz 9, München, 81675, Germany |
| ViiV Healthcare GmbH | | Ordinary | | 78.3 | | Talstrasse 3-5, 3053 Muenchenbuchsee, Switzerland |
| ViiV Healthcare Hong Kong Limited | | Ordinary | | 78.3 | | 23/F Tower 6, The Gateway, 9 Canton Road, Harbour City, Tsimshatsui, Kowloon, Hong Kong |
| ViiV Healthcare Kabushiki Kaisha | | Ordinary | | 78.3 | | 1-8-1 Asasaka Minato-ku, Tokyo, Japan |
| ViiV Healthcare Limited | | Class A Shares, Deferred; Class B Shares (0%); Class C Shares (0%); Class D1 (0%); Class D2 (0%); Class E 5% Cumulative Preference (0%) | | 78.3 | | 980 Great West Road, Brentford, Middlesex, TW8 9GS, England |
| | |
| 286 | | |
GSK Annual Report 2017 | | |
| | |
| | |
Other statutory disclosurescontinued
Group companiescontinued
| | | | | | |
| Name | | Security | | Effective % Ownership | | Registered address |
Subsidiaries where the effective interest is less than 100%continued | | |
| ViiV Healthcare Overseas Limited | | Ordinary | | 78.3 | | 980 Great West Road, Brentford, Middlesex, TW8 9GS, England |
| ViiV Healthcare Pty Ltd | | Ordinary | | 78.3 | | 1061 Mountain Highway, Boronia, VIC, 3155, Australia |
| ViiV Healthcare Puerto Rico, LLC | | LLC Interests | | 78.3 | | Centro International de Mercadeo, 90 carr. 165 Torre 2, Suite 800, Guaynabo, 00968, Puerto Rico |
| ViiV Healthcare S.r.l. | | Quota | | 78.3 | | Via Alessandro Fleming 2, Verona, 37135, Italy |
| ViiV Healthcare SAS | | Ordinary | | 78.3 | | 23 rue François Jacob, 92500, Rueil-Malmaison, France |
| ViiV Healthcare sprl | | Ordinary | | 78.3 | | Site Apollo, Avenue Pascal 2-4-6, Wavre, 1300, Belgium |
| ViiV Healthcare Trading LLC (iv) | | Participation Interest | | 78.3 | | Krylatskaya str., 17/3., Moscow, 121614, Russian Federation |
| ViiV Healthcare Trading Services UK Limited | | Ordinary | | 78.3 | | 980 Great West Road, Brentford, Middlesex, TW8 9GS, England |
| ViiV Healthcare UK (No.2) Limited (v) | | Ordinary | | 78.3 | | 13 Castle Street, St. Helier, JE4 5UT, Jersey |
| ViiV Healthcare UK (No.3) Limited | | Ordinary | | 78.3 | | 980 Great West Road, Brentford, Middlesex, TW8 9GS, England |
| ViiV Healthcare UK (No.4) Limited | | Ordinary | | 78.3 | | 980 Great West Road, Brentford, Middlesex, TW8 9GS, England |
| ViiV Healthcare UK (No.5) Limited | | Ordinary | | 78.3 | | 980 Great West Road, Brentford, Middlesex, TW8 9GS, England |
| ViiV Healthcare UK Limited | | Ordinary | | 78.3 | | 980 Great West Road, Brentford, Middlesex, TW8 9GS, England |
| ViiV Healthcare ULC | | Common | | 78.3 | | 3500 855-2nd Street SW, Calgary, AB, T2P 4J8, Canada |
| ViiV Healthcare Venture LLC | | LLC Interests | | 78.3 | | Corporation Service Company, 251 Little Falls Drive, Wilmington, Delaware, 19808, United States |
| ViiVHIV Healthcare Unipessoal Lda | | Quota | | 78.3 | | Rua Dr Antonio Loureiro Borges No 3, Arquiparque, Miraflores, Alges, 1499-013, Portugal |
| Winster Pharmaceuticals Limited (iv) | | Ordinary | | 46.4 | | 2A Association Avenue, Ilupeju Industrial Estate, Lagos, PO Box 3199, Nigeria |
| Zhejiang Tianyuan Bio-Pharmaceutical Co. Ltd. | | Ordinary (95%) | | 95 | | No. 56, Tian He Road, Yuhang Economic Development Zone, Hangzhou, Zhejiang Province, China |
Associates | | | | | | |
| Apollo Therapeutics LLP | | Partnership Interest (25%) | | 25 | | |
| Calci Medica Inc. | | Series A and Junior Preferred (33.9%) | | 43.3 | | |
| GlaxoSmithKline Landholding Company, Inc. | | Common (40%) | | 40 | | |
| Index Ventures Life VI (Jersey) LP | | Partnership Interest (25%) | | 25 | | |
| Innoviva, Inc. | | Common (31.4%) | | 31.4 | | |
| Japan Vaccine Distribution Co., Ltd | | Ordinary (50%) | | 50 | | |
| Kurma Biofund II, FCPR | | Partnership Interest (32%) | | 32 | | |
| Longwood Founders Fund LP | | Partnership Interest (28%) | | 28 | | |
| Medicxi Ventures I LP | | Partnership Interest (26.2%) | | 26.2 | | |
Joint Ventures | | | | | | |
| Chiron Panacea Vaccines Private Limited (in liquidation) | | | | 50 | | 708/718, 7th Floor, A Wing, Sagar Tech Plaza, Saki Naka, Andheri East, Mumbai, Maharashtra, 400072, India |
| Japan Vaccine Co., Ltd. | | | | 50 | | 6 Yonbancho,Chiyoda-ku,Tokyo,Japan |
| Qualivax Pte. Limited | | | | 50 | | 80 Robinson Road, #02-00, 068898, Singapore |
| Qura Therapeutics, LLC | | | | 50 | | Corporation Service Company, 251 Little Falls Drive, Wilmington, Delaware, 19808, United States |
Key
| (i) | Directly owned by GlaxoSmithKline plc. |
| (ii) | Exempt from the provisions of section 347 and 348 of the Companies Act 2014 (Ireland), in accordance with the exemptions noted in Section 357 of that Act. |
| (iii) | Consolidated as a subsidiary in accordance with section 1162 (4)(a) of the Companies Act 2006 on the grounds of dominant influence. |
| | (v) | Tax resident in the UK. |
| | (vi) | Entity expected to be disposed of or removed. |
| | (vii) | Incorporated in Sweden. |
| | | | |
| 287 | | |
| | | | | |
| GSK Annual Report 2017 | | Strategic report | | |
| | Governance and remuneration | | |
| | Financial statements | | |
| | Investor information | | |
Glossary of terms
| | |
| Terms used in the Annual Report | | US equivalent or brief description |
| Accelerated capital allowances | | Tax allowance in excess of depreciation arising from the purchase of fixed assets that delay the
charging and payment of tax. The equivalent of tax depreciation. |
| American Depositary Receipt (ADR) | | Receipt evidencing title to an ADS. Each GSK ADR represents two Ordinary Shares. |
| American Depositary Shares (ADS) | | Listed on the New York Stock Exchange; represents two Ordinary Shares. |
| Basic earnings per share | | Basic income per share. |
| Called up share capital | | Ordinary Shares, issued and fully paid. |
| CER growth | | Growth at constant exchange rates. |
| The company | | GlaxoSmithKline plc. |
| Currency swap | | An exchange of two currencies, coupled with a subsequent re-exchange of those currencies, at
agreed exchange rates and dates. |
| Defined benefit plan | | Pension plan with specific employee benefits, often called ‘final salary scheme’. |
| Defined contribution plan | | Pension plan with specific contributions and a level of pension dependent upon the growth of the
pension fund. |
| Derivative financial instrument | | A financial instrument that derives its value from the price or rate of some underlying item. |
| Diluted earnings per share | | Diluted income per share. |
| | | |
| | | |
| | | |
| | | |
| Employee Share Ownership Plan Trusts | | Trusts established by the Group to satisfy share-based employee incentive plans. |
| Equity Shareholders’ funds | | Shareholders’ equity. |
| Finance lease | | Capital lease. |
| Freehold | | Ownership with absolute rights in perpetuity. |
| The Group | | GlaxoSmithKline plc and its subsidiary undertakings. |
| GSK | | GlaxoSmithKline plc and its subsidiary undertakings. |
| Hedging | | The reduction of risk, normally in relation to foreign currency or interest rate movements, by making
off-setting commitments. |
| Intangible fixed assets | | Assets without physical substance, such as computer software, brands, licences, patents, know-how
and marketing rights purchased from outside parties. |
| Novartis transaction | | The three-part inter-conditional transaction with Novartis AG involving the Consumer Healthcare,
Vaccines and Oncology businesses completed on 2 March 2015. |
| Ordinary Share | | A fully paid up ordinary share in the capital of the company. |
| Profit | | Income. |
| Profit attributable to shareholders | | Net income. |
| Share capital | | Ordinary Shares, capital stock or common stock issued and fully paid. |
| Share option | | Stock option. |
| Share premium account | | Additional paid-up capital or paid-in surplus (not distributable). |
| Shares in issue | | The number of shares outstanding. |
| Subsidiary | | An entity in which GSK exercises control. |
| Treasury share | | Treasury stock. |
| Turnover | | Revenue. |
| UK Corporate Governance Code | | As required by the UK Listing Authority, the company has disclosed in the Annual Report how it has
applied the best practice corporate governance provisions of the Financial Reporting Council’s UK
Corporate Governance Code. |
| | |
| 288 | | |
GSK Annual Report 2017 | | |
| | |
| | |
Index
| | | | | | | | | | |
| | | Page | | | | | Page | |
| | | |
| Access to our high-quality products | | | 46 | | | Investments in associates and joint ventures | | | 186 | |
| Accountability | | | 96 | | | Investor relations | | | 273 | |
| Accounting principles and policies | | | 162 | | | Key accounting judgements and estimates | | | 166 | |
| Acquisitions and disposals | | | 206 | | | Key performance indicators | | | 18 | |
| Adjustments reconciling profit after tax to operating | | | | | | Leadership and effectiveness | | | 88 | |
| cash flows | | | 204 | | | Legal proceedings | | | 227 | |
| Annual General Meeting 2018 | | | 270 | | | Major restructuring costs | | | 175 | |
| Approach to Brexit | | | 55 | | | Modern employer | | | 48 | |
| Approach to tax | | | 56 | | | Movements in equity | | | 202 | |
| Assets held for sale | | | 188 | | | Net debt | | | 199 | |
| Associates and joint ventures | | | 176 | | | New accounting requirements | | | 168 | |
| Audit & Risk Committee Report | | | 96 | | | Nominations Committee Report | | | 94 | |
| Cash and cash equivalents | | | 188 | | | Non-controlling interests | | | 210 | |
| CEO’s statement | | | 5 | | | Non-controlling interests in ViiV Healthcare | | | 59 | |
| Chairman’s statement | | | 4 | | | Non-Executive Directors’ fees | | | 127 | |
| Chairman’s Governance statement | | | 80 | | | Notes to the financial statements | | | 162 | |
| Chairman’s Remuneration annual statement | | | 114 | | | Operating profit | | | 173 | |
| Commitments | | | 212 | | | Other intangible assets | | | 184 | |
| Consolidated balance sheet | | | 159 | | | Other investments | | | 187 | |
| Consolidated cash flow statement | | | 161 | | | Other non-current assets | | | 187 | |
| Consolidated income statement | | | 158 | | | Other non-current liabilities | | | 199 | |
| Consolidated statement of changes in equity | | | 160 | | | Other operating income | | | 172 | |
| Consolidated statement of comprehensive income | | | 158 | | | Other provisions | | | 198 | |
| Consumer Healthcare | | | 36 | | | Our Board | | | 82 | |
| Consumer Healthcare products and competition | | | 256 | | | Our long-term priorities | | | 12 | |
| Contingent consideration liabilities | | | 209 | | | Pay for performance | | | 120 | |
| Contingent liabilities | | | 200 | | | Pensions and other post-employment benefits | | | 190 | |
| Corporate Executive Team | | | 86 | | | Pharmaceuticals | | | 22 | |
| Corporate governance | | | 79 | | | Pharmaceuticals products, competition and | | | | |
| Corporate Responsibility Committee Report | | | 110 | | | intellectual property | | | 254 | |
| Critical accounting policies | | | 76 | | | Pipeline | | | 251 | |
| Directors and senior management | | | 138 | | | Presentation of the financial statements | | | 162 | |
| Directors’ interests in shares | | | 128 | | | Principal Group companies | | | 226 | |
| Directors’ statement of responsibilities | | | 148,233 | | | Principal risks and uncertainties | | | 257 | |
| Dividends | | | 180,269 | | | Property, plant and equipment | | | 181 | |
| Donations to political organisations and | | | | | | Quarterly trend | | | 244 | |
| political expenditure | | | 275 | | | Reconciliation of net cash flow to movement in net debt | | | 205 | |
| Earnings per share | | | 180 | | | Registrar | | | 272 | |
| Employee costs | | | 174 | | | Related party transactions | | | 204 | |
| Employee share schemes | | | 224 | | | Relations with stakeholders | | | 107 | |
| Ethical conduct and environmental sustainability | | | 50 | | | Remuneration governance | | | 125 | |
| Exchange rates | | | 168 | | | Remuneration policy summary | | | 142 | |
| Executive Director remuneration | | | 117 | | | Remuneration report | | | 113 | |
| Finance expense | | | 176 | | | Reporting framework | | | 58 | |
| Finance income | | | 175 | | | Science Committee report | | | 109 | |
| Financial calendar | | | 269 | | | Segment information | | | 169 | |
| Financial instruments and related disclosures | | | 213 | | | Share capital and control | | | 267 | |
| Financial position and resources | | | 72 | | | Share capital and share premium account | | | 201 | |
| Financial statements of GlaxoSmithKline plc, prepared | | | | | | Share price | | | 267 | |
| under UK GAAP | | | 233 | | | Shareholder information | | | 267 | |
| Five year record | | | 248 | | | Shareholder services and contacts | | | 272 | |
| Global health through science | | | 44 | | | Taxation | | | 177 | |
| Glossary of terms | | | 287 | | | Tax information for shareholders | | | 270 | |
| Goodwill | | | 182 | | | Trade and other payables | | | 189 | |
| Group companies | | | 276 | | | Trade and other receivables | | | 188 | |
| Group financial review | | | 52 | | | Treasury policies | | | 77 | |
| How we create long-term value | | | 8 | | | Trust | | | 42 | |
| How we manage risk | | | 20 | | | US law and regulation | | | 274 | |
| Independent Auditors’ report | | | 149,234 | | | Vaccines | | | 30 | |
| Industry trends | | | 10 | | | Vaccines products, competition and intellectual property | | | 255 | |
| Inventories | | | 187 | | | Viability statement | | | 57 | |
About GSK
GlaxoSmithKline plc was incorporated as an English public limited company on 6 December 1999. We were formed by a merger between Glaxo Wellcome plc and SmithKline Beecham plc. GSK acquired these two English companies on 27 December 2000 as part of the merger arrangements.
Our shares are listed on the London Stock Exchange and the New York Stock Exchange.
> Read more atwww.gsk.com

Brand names
Brand names appearing in italics throughout this report are trade marks either owned by and/or licensed to GSK or associated companies, with the exception ofEdurant owned by Janssen,Cialisowned by Eli Lilly and Company andRituxan owned by Biogen MA Inc.Zofran owned by Novartis AG andTrumenba owned by Pflzer Inc.
Acknowledgements
Design
Friend www.friendstudio.com
Printing
Pureprint Group, ISO 14001.
FSC certifled and Carbon Neutral.
Paper
This Annual Report is printed on Revive 100 Silk, a 100% recycled paper with full FSC certiflcation. All pulps used are made from 100% de-inked, paper waste and are elemental chlorine free. The manufacturing mill holds the ISO 14001 and EU Ecolabel certiflcates for environmental management.
Download PDFs:
> Annual Report 2017
> Form 20-F
> Responsible Business Supplement 2017
| | | | | | | | |
| | | | | | | | |
| | Cautionary statement regarding forward-looking statements The Group’s reports filed with or furnished to the US Securities and Exchange Commission (SEC), including this document and written information released, or oral statements made, to the public in the future by or on behalf of the Group, may contain forward-looking statements. Forward-looking statements give the Group’s current expectations or forecasts of future events. An investor can identify these statements by the fact that they do not relate strictly to historical or current facts. They use words such as ‘anticipate’, ‘estimate’, ‘expect’, ‘intend’, ‘will’, ‘project’, ‘plan’, ‘believe’ and other words and terms of similar meaning in connection with any discussion of future operating or flnancial performance. In particular, these include statements relating to future actions, prospective products or product approvals, future performance or results of current and anticipated products, sales efforts, expenses, the outcome of contingencies such as legal proceedings, and flnancial results. Other than in accordance with its legal or regulatory obligations (including under the UK Listing Rules and the Disclosure and Transparency Rules of the Financial Conduct Authority), the Group undertakes no obligation to update any forward-looking statements, whether as a result of new information, future events or otherwise. The reader should, however, consult any additional disclosures that the Group may make in any documents which it publishes and/or flles with the SEC. All readers, wherever located, should take note of these disclosures. Accordingly, no assurance can be given that any particular expectation will be met and shareholders are cautioned not to place undue reliance on the forward-looking statements. Forward-looking statements are subject to assumptions, inherent risks and uncertainties, many of which relate to factors that are beyond the Group’s control or precise estimate. The Group cautions investors that a number of important factors, including those in this document, could cause actual results to differ materially from those expressed or implied in any forward-looking statement. Such factors include, but are not limited to, those discussed under ‘Principal risks and uncertainties’ on pages 257 to 266 of this Annual Report. Any forward-looking statements made by or on behalf of the Group speak only as of the date they are made and are based upon the knowledge and information available to the Directors on the date of this Annual Report. | | A number of adjusted measures are used to report the performance of our business. These measures are deflned on page 58 and a reconciliation of Adjusted results to Total results is set out on page 67. The information in this document does not constitute an offer to sell or an invitation to buy shares in GlaxoSmithKline plc or an invitation or inducement to engage in any other investment activities. Past performance cannot be relied upon as a guide to future performance. Nothing in this Annual Report should be construed as a proflt forecast. Assumptions related to 2016-2020 outlook In outlining the expectations for 2018 and the flve-year period 2016-2020, the Group has made certain assumptions about the healthcare sector, the different markets in which the Group operates and the delivery of revenues and flnancial beneflts from its current portfolio, pipeline and restructuring programmes. For the Group speciflcally, over the period to 2020 GSK expects further declines in sales ofSeretide/Advair. The introduction of a generic alternative toAdvair in the US has been factored into the Group’s assessment of its future performance. The Group assumes no premature loss of exclusivity for other key products over the period. The Group expects at least £6 billion of revenues per annum on a CER basis in 2018 from products launched since 2013 including contributions fromShingrix. The assumptions for the Group’s revenue and earnings expectations assume no material interruptions to supply of the Group’s products and no material mergers, acquisitions, disposals, litigation costs or share repurchases for the Company; and no change in the Group’s shareholdings in ViiV Healthcare or Consumer Healthcare. They also assume no material changes in the macro-economic and healthcare environment. The 2018 guidance and 2016-2020 outlook have factored in all divestments and product exits since 2015, including the divestment and exit of more than 130 non-core tail brands (£0.5 billion in annual sales) as announced on 26 July 2017. The Group’s expectations assume successful delivery of the Group’s integration and restructuring plans over the period 2016-2020 including the extension and enhancement to the combined programme announced on 26 July 2017. Material costs for investment in new product launches and R&D have been factored into the expectations given. | | Given the potential development options in the Group’s pipeline, the outlook may be affected by additional data-driven R&D investment decisions. The expectations are given on a constant currency basis (2016-2020 outlook at 2015 CER). Subject to material changes in the product mix, and following the enactment of US tax reform, the Group’s medium-term effective tax rate is expected to be in the region of 19-20% of Adjusted proflts. This incorporates management’s best estimates of the impact of US tax reform on the Group based on the information currently available. As more information on the detailed application of the US Tax Cuts and Jobs Act becomes available, the assumptions underlying these estimates could change with consequent adjustments to the charges taken that could have a material impact on the results of the Group. Notice regarding limitations on Director Liability under English Law Under the UK Companies Act 2006, a safe harbour limits the liability of Directors in respect of statements in and omissions from the Directors’ Report (for which see page 112), the Strategic report and the Remuneration report. Under English law the Directors would be liable to the company, but not to any third party, if one or more of these reports contained errors as a result of recklessness or knowing misstatement or dishonest concealment of a material fact, but would otherwise not be liable. Pages 79 to 112, 148, 233 and 257 to 286 inclusive comprise the Directors’ Report, pages 2 to 78 inclusive comprise the Strategic report and pages 113 to 146 inclusive comprise the Remuneration report, each of which have been drawn up and presented in accordance with and in reliance upon English company law and the liabilities of the Directors in connection with these reports shall be subject to the limitations and restrictions provided by such law. Website GSK’s website www.gsk.com gives additional information on the Group. Notwithstanding the references we make in this Annual Report to GSK’s website, none of the information made available on the website constitutes part of this Annual Report or shall be deemed to be incorporated by reference herein. | | |

Head Office and Registered Office
GlaxoSmithKline plc
980 Great West Road
Brentford, Middlesex TW8 9GS
United Kingdom
| | | | | | |
| Tel: +44 (0)20 8047 5000 | | | | Search for us here | | |
Registered number: 3888792 | | | | |
| www.gsk.com | | | |  |