Exhibit 99.2
Final results from an open-label, randomised, phase II study of adecatumumab (MT201), a fully human anti-
EpCAM antibody, in patients with metastatic breast cancer
Ahmad Awada*, Marcus Schmidt, Peter Obrist, Max E Scheulen, Norbert Marschner, Luc Dirix, Christian Dittrich, Carsten Reinhardt, and Martin Schuler
Institut Jules Bordet, Brussels, Belgium*; Mainz, Germany; Zams, Austria; Essen, Germany; Freiburg, Germany; Wilrijk-Antwerp, Belgium; Vienna, Austria; Munich, Germany; and Mainz, Germany
Introduction
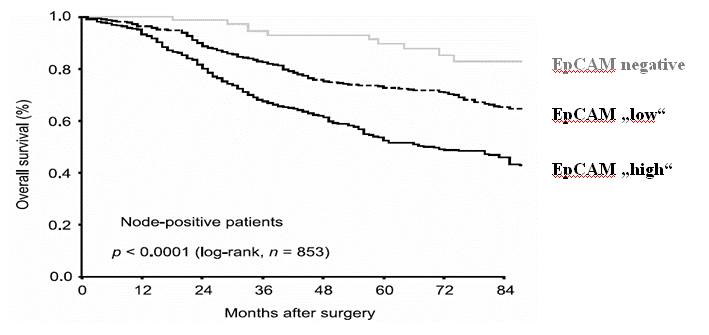
High level expression of the epithelial cell adhesion molecule (EpCAM) identifies a subgroup of breast cancer patients with unfavourable prognosis (Spizzo et al., 2004; Figure 1). Adecatumumab (MT201) was developed as a low-affinity human IgG1 antibody mediating antibody-dependent cellular cytotoxicity (ADCC) and complement-mediated cytotoxicity (CDC) against EpCAM-positive cancer cells (Naundorf et al., 2002). A previous phase I trial in HRPC has demonstrated a well-tolerated safety profile of Adecatumumab at dose up to 262 mg/m2 (Oberneder et al., 2006).
| | |
| Figure 1: | | EpCAM Expression and Survival in Node-positive Primary BC
Kaplan–Meier analysis of overall survival including 853 node-positive breast cancer patients |
Patients & Methods
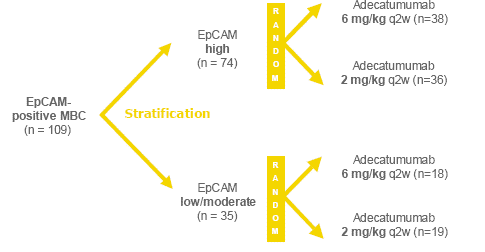
MBC patients had to have histologically confirmed EpCAM expression and at least one measurable lesion. Major exclusion criteria were history of CNS metastases, indication for other treatments incl. trastuzumab, anti-tumor therapy within 4 weeks prior to inclusion. An initial restriction to allow for a maximum of one previous chemotherapy for metastatic disease was subsequently removed allowing for unrestricted number of previous therapies. After stratification for EpCAM expression according to published methodology (Spizzo et al., 2004) and subsequent randomisation (Figure 2), adecatumumab was administered i.v. over 60 minutes every other week until progression. Primary endpoint was Clinical Benefit Rate (CBR, i.e. CR, PR or SD at week 24), secondary outcomes were CBR at week 12, time-to-progression (TTP), safety, and PK.
In a retrospective analysis the influence of EpCAM expression on clinical outcome was analysed in more detail. Whereas the primary analysis included certain IHC2+ samples in the EpCAM “high” group, this was restricted to IHC3+ tumors with increasing frequency of stained cells in the retrospective analysis (Table 2).
Figure 2: Study design
In total, 109 EpCAM-positive and 3 EpCAM-negative patients were treated. Patient characteristics were overall comparable between the groups with no significant differences regarding disposition factors (age, weight, ER/PR, HER-2, ECOG-PS, duration of disease) and previous anti-tumour treatments. Of the previous chemotherapy regimens, 67% of patients received anthracyclins, and 35% of patients received taxanes for adjuvant and/or metastatic disease. 52% and 43% of patients had pre-treatment with tamoxifen and aromatase inhibitors, respectively (Schmidt et al., 2006).
Safety
Patients receiving high dose adecatumumab (n= 56) showed a higher rate of AE as compared to patients (n= 56) in the low dose group. Gastrointestinal (nausea, vomiting, diarrhoea, constipation) and general symptoms (chills, fatigue, headache) were reported as the most common clinical toxicities and of mild to moderate severity in most cases (Table 1). Some patients experienced transient increases of lipase/amylase, however clinical acute pancreatitis has not been reported in any patient.
Table 1: Analysis of Adverse Events (regardless of relationship)
| | | | | | | | | | | | | | | | | |
| | | Low dose adecatumumab (n=56) | | High dose adecatumumab (n=56) |
| | | AE, n | | Patients, n (%) | | AE, n | | Patients, n (%) |
Adverse Events (all) | | | 459 | | | | 55 (98.2 | ) | | | 940 | | | | 56 (100.0 | ) |
Specific Adverse Events (occurring in >10% of the total study population) | | | | | | | | | | | | | | | | |
| Fatigue | | | 31 | | | | 23 (41.1 | ) | | | 61 | | | | 28 (50.0 | ) |
| Chills | | | 17 | | | | 11 (19.6 | ) | | | 68 | | | | 33 (58.9 | ) |
| Nausea | | | 29 | | | | 15 (26.8 | ) | | | 79 | | | | 32 (57.1 | ) |
| Enzyme abnormality | | | 28 | | | | 17 (30.4 | ) | | | 18 | | | | 16 (28.6 | ) |
| Vomiting | | | 7 | | | | 7 (12.5 | ) | | | 67 | | | | 26 (46.4 | ) |
| Diarrhea | | | 10 | | | | 5 (8.9 | ) | | | 85 | | | | 27 (48.2 | ) |
| Hepatic function abnormal | | | 33 | | | | 12 (31.4 | ) | | | 23 | | | | 14 (25.0 | ) |
| Constipation | | | 9 | | | | 7 (12.5 | ) | | | 21 | | | | 10 (17.9 | ) |
| Upper abdominal pain | | | 6 | | | | 6 (10.7 | ) | | | 16 | | | | 9 (16.1 | ) |
| Coagulopathy | | | 13 | | | | 10 (17.9 | ) | | | 5 | | | | 4 (7.1 | ) |
| Bone pain | | | 13 | | | | 7 (12.5 | ) | | | 11 | | | | 6 (10.7 | ) |
| Dyspnea | | | 8 | | | | 7 (12.5 | ) | | | 16 | | | | 10 (17.9 | ) |
| Cough | | | 6 | | | | 6 (10.7 | ) | | | 8 | | | | 6 (10.7 | ) |
| Headache | | | 7 | | | | 6 (10.7 | ) | | | 38 | | | | 11 (19.6 | ) |
| Hypertension | | | 14 | | | | 9 (16.1 | ) | | | 33 | | | | 13 (23.2 | ) |
| Anorexia | | | 6 | | | | 6 (10.7 | ) | | | 9 | | | | 9 (16.1 | ) |
| Hypersensitivity | | | 3 | | | | 2 (3.6 | ) | | | 22 | | | | 11 (19.6 | ) |
| Pancreatic enzyme abnormality | | | 12 | | | | 7 (12.5 | ) | | | 6 | | | | 5 (8.9 | ) |
Efficacy
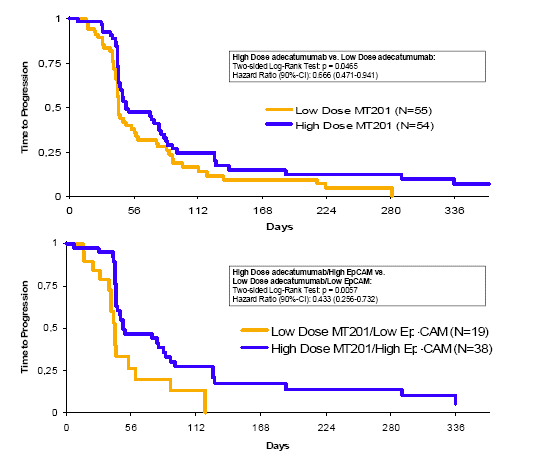
Whilst the central radiology review failed to confirm complete/partial responses (local investigators reported 2 partial responses according to RECIST criteria; both in the high EpCAM — high Dose group), clinical benefit in terms of stable disease at 24 weeks was centrally confirmed according to RECIST in a total of 6 patients (5 in high EpCAM, 1 in low EpCAM group). As a result, the primary endpoint was not met (i.e. >25% CBR in any group), A longer time-to-disease progression (TTP), however, was observed in patients receiving high-dose adecatumumab compared to the low-dose group (Hazard Ratio: 0.67; p < 0.05), with the longest TTP seen in patients expressing high EpCAM levels and receiving high dose adecatumumab (Hazard Ratio: 0.43; p < 0.01 [compared to patients expressing low levels of EpCAM and receiving low dose adecatumumab]) (Figure 3).
| | |
| Figure 3: | | Time to Progression analysis comparing high vs. low Dose (independent of EpCAM expression, top) and high Dose/high EpCAM vs. low Dose/low EpCAM (bottom) |
A trend towards better clinical outcome was also observed when comparing patients with “high” EpCAM expression to those whose tumors express only “low” amounts of target antigen (Table 2, columns 1-2), a finding which would not be expected in untreated patients (Figure 1, Spizzo et al., 2004 and unpublished data). Further retrospective exploratory analysis selecting patients with increasing amounts of target antigen expression (Table 2, columns 3-6) substantiated this improved outcome as examplified by the rate of patients being progression-free after 24 weeks of observation: whereas only 1 out of 35 patients (2.9%) categorized as “low” EpCAM did not progress during the first 24 weeks, the rate of patients without signs of clinical progression was up to 22.2% in patients with strongest EpCAM expression (IHC3+ in more than 50% of cells). Notably, treatment with the higher dose again appeared to result in superior outcome, i.e. respective values for the PFS rate at week 24 of patients treated with high dose of adecatumumab were 6.3% (low EpCAM) and 30.0% (IHC3+ in more than 50% of cells).
Table 2: Analysis of various efficacy parameters in relation to EpCAM expression
| | | | | | | | | | | | | | | | | | | | | | | | | |
| | |  | |  | |  | | | | | | | | | |  |
| | | low | | high | | IHC 3+ | | IHC 3+ | | IHC 3+ | | IHC 3+ |
| | | EpCAM | | EpCAM | | (all) | | (>25%) | | (>33%) | | (>50%) |
| | | (n=35) | | (n=74) | | (n=63) | | (n=47) | | (n=31) | | (n=18) |
| CR/PR (RECIST) [%] | | | 0 | | | | 0 | | | | 0 | | | | 0 | | | | 0 | | | | 0 | |
| CBR at week 24 (RECIST) [%] | | | 2.9 | | | | 6.8 | | | | 7.9 | | | | 10.6 | | | | 12.9 | | | | 11.1 | |
| CBR at week 12 (RECIST) [%] | | | 8.6 | | | | 18.9 | | | | 19.0 | | | | 21.3 | | | | 25.8 | | | | 27.8 | |
| Progression-free at week 24 [%] | | | 2.9 | | | | 12.2 | | | | 12.7 | | | | 17.0 | | | | 19.4 | | | | 22.2 | |
| Progression-free at week 12 [%] | | | 14.3 | | | | 31.1 | | | | 31.7 | | | | 36.2 | | | | 38.7 | | | | 38.9 | |
| TTP 50% (median) [days] | | | 43 | | | | 49 | | | | 47 | | | | 49 | | | | 51 | | | | 55 | |
| TTP 75% (median) [days] | | | 78 | | | | 94 | | | | 94 | | | | 91 | | | | 128 | | | | 189 | |
| a) | | Classification into “low” and “high” EpCAM according to the original definitions (according to Spizzo et al., 2004). In short, samples with IHC1+ expressionorIHC2+ expression in few cells only were considered as “low”, while IHC2+ expression in > 50% of cellsorIHC3+ expression regardless of frequency was considered as “high” . |
| |
| b) | | IHC 3+: only patients with 3+ staining intensity were analysed; values in (>%) denote percentage of cells stained positive for EpCAM selected as cut-off in the respective group. |
| |
| c) | | “CR”, “PR” and “CBR” depict values confirmed by central assessment, i.e. patients with missing scans or non-measurable lesion according to RECIST could not qualify for CR, PR, or SD. “Progression-free” denotes all patients where there was no evidence of progression, either from local sites or central assessments. |
| |
| d) | | Table shows data irrespective of dose (i.e. pooled data from 2mg/kg and 6 mg/kg groups). |
| |
| e) | | TTP 50%/75%: Time at which 50%/75% of patients progressed. |
Conclusion
In summary, this analysis demonstrates the safety and feasibility of adecatumumab treatment in patients with metastatic breast cancer. Although the trial did not reach its primary endpoint, time-to-progression results from exploratory and retrospective subgroup analyses showing a lower probability of tumour progression in patients receiving high-dose adecatumumab suggest clinical activity of adecatumumab in patients with tumour with high level of EpCAM. Although a dose-dependent occurrence of side effects was observed, the safety profile of both dose regimens is considered to be overall acceptable.
Studies are ongoing and planned to evaluate the effect of an increase in dose and/or frequency of dosing of adecatumumab. Additionally, continued efforts will be undertaken to assess the use of EpCAM expression as a potential predictive marker for response to adecatumumab treatment.
References
| • | | Spizzo et al. (2004),Breast Cancer Res Treat, 86:207 |
| |
| • | | Naundorf et al. (2002),Int Journal of Cancer, 100:101 |
| |
| • | | Oberneder et al. (2006),European Journal of Cancer, 42:2530 |
| |
| • | | Schmidt et al. (2006),Breast Cancer Res Treat, 100:2072 |