As filed with the Securities and Exchange Commission on September 20, 2006
Registration No. 333-135537
UNITED STATES
SECURITIES AND EXCHANGE COMMISSION
Washington, D.C. 20549
Amendment No. 1
to
FORM S-1
REGISTRATION STATEMENT
UNDER
THE SECURITIES ACT OF 1933
Ascent Energy Inc.
(Exact name of registrant as specified in its charter)
| | | | |
| Delaware | | 1311 | | 72-1493233 |
(State or other jurisdiction of
incorporation or organization) | | (Primary Standard Industrial
Classification Code Number) | | (I.R.S. Employer
Identification Number) |
4965 Preston Park Blvd., Suite 800
Plano, Texas 75093
(972) 543-3900
(Address, including zip code, and telephone number, including area code, of registrant’s principal executive offices)
Terry W. Carter
Chief Executive Officer and President
Ascent Energy Inc.
4965 Preston Park Blvd., Suite 800
Plano, Texas 75093
(972) 543-3900
(Name, address, including zip code, and telephone number, including area code, of agent for service)
Copies to:
| | |
| T. Mark Kelly | | J. Michael Chambers |
| Caroline B. Blitzer | | Akin Gump Strauss Hauer & Feld LLP |
| Vinson & Elkins L.L.P. | | 1111 Louisiana Street, 44th Floor |
| 2300 First City Tower | | Houston, Texas 77002 |
| 1001 Fannin | | (713) 220-5800 |
| Houston, Texas 77002-6760 | | |
| (713) 758-2222 | | |
Approximate date of commencement of proposed sale to the public: As soon as practicable after this registration statement becomes effective.
If any of the securities being registered on this Form are to be offered on a delayed or continuous basis pursuant to Rule 415 under the Securities Act of 1933, check the following box. ¨
If this Form is filed to register additional securities for an offering pursuant to Rule 462(b) under the Securities Act, please check the following box and list the Securities Act registration statement number of the earlier effective registration statement for the same offering. ¨
If this Form is a post-effective amendment filed pursuant to Rule 462(c) under the Securities Act, check the following box and list the Securities Act registration statement number of the earlier effective registration statement for the same offering. ¨
If this Form is a post-effective amendment filed pursuant to Rule 462(d) under the Securities Act, check the following box and list the Securities Act registration statement number of the earlier effective registration statement for the same offering. ¨
The registrant hereby amends this registration statement on such date or dates as may be necessary to delay its effective date until the registrant shall file a further amendment which specifically states that this registration statement shall thereafter become effective in accordance with section 8(a) of the Securities Act of 1933 or until the registration statement shall become effective on such date as the Commission, acting pursuant to said section 8(a), may determine.
The information in this prospectus is not complete and may be changed. We may not sell these securities until the registration statement filed with the Securities and Exchange Commission is effective. This prospectus is not an offer to sell these securities and it is not soliciting an offer to buy these securities in any jurisdiction where the offer or sale is not permitted.
Subject to Completion, dated September 20, 2006
PROSPECTUS
Shares

Common Stock
This is the initial public offering by Ascent Energy Inc. We are offering shares of our common stock for which no public market currently exists. We currently expect the initial public offering price to be between $ and $ per share. We have applied to list our common stock on The Nasdaq Global Market under the symbol “ASNT.”
Investing in our common stock involves risks. Please read “Risk Factors” beginning on page 14.
| | | | |
| | | Per Share | | Total |
| | |
Public offering price | | $ | | $ |
| | |
Underwriting discount | | $ | | $ |
| | |
Proceeds (before expenses) to Ascent Energy Inc. | | $ | | $ |
We have granted the underwriters a 30-day option to purchase up to an additional shares of our common stock from us on the same terms and conditions as set forth above if the underwriters sell more than shares of our common stock in this offering.
We intend to use a portion of the net proceeds of this offering to repay certain indebtedness outstanding under our credit facility, our senior notes and our senior subordinated notes. Certain of the underwriters and their affiliates are lenders under our credit facility or holders of our senior notes and/or our senior subordinated notes and therefore will receive a portion of those proceeds. In addition, our executive officers will receive a portion of those proceeds in the form of cash bonuses representing a part of the consideration in connection with the termination of an existing incentive plan.
Neither the Securities and Exchange Commission nor any state securities commission has approved or disapproved of these securities or determined if this prospectus is truthful or complete. Any representation to the contrary is a criminal offense.
Lehman Brothers, on behalf of the underwriters, expects to deliver the shares of common stock on or about , 2006.
Joint Book-Running Managers
LEHMAN BROTHERS | JEFFERIES & COMPANY |
Senior Co-Managers
| | | | |
| MORGAN KEEGAN & COMPANY, INC. | | PETRIE PARKMAN & CO. |
Co-Managers
| | | | |
| CAPITAL ONE SOUTHCOAST | | FORTIS SECURITIES LLC | | KEYBANC CAPITAL MARKETS |
, 2006
[Art to come]
TABLE OF CONTENTS
| | |
U.S. Federal Tax Considerations for Non-U.S. Holders | | 118 |
Shares Eligible for Future Sale | | 121 |
Underwriting | | 123 |
Legal Matters | | 128 |
Experts | | 128 |
Where You Can Find More Information | | 129 |
Index to Consolidated Financial Statements | | F-1 |
Glossary of Natural Gas and Oil Terms | | A-1 |
Report of Netherland, Sewell & Associates, Inc., Reserve Engineering Firm as of December 31, 2005 | | B-1 |
Report of LaRoche Petroleum Consultants, Ltd., Reserve Engineering Firm as of December 31, 2005 | | C-1 |
Report of Netherland, Sewell & Associates, Inc., Reserve Engineering Firm as of June 30, 2006 | | D-1 |
Report of LaRoche Petroleum Consultants, Ltd., Reserve Engineering Firm as of June 30, 2006 | | E-1 |
You should rely only on the information contained in this prospectus. We have not, and the underwriters have not, authorized any other person to provide you with different information. If anyone provides you with different or inconsistent information, you should not rely on it. We are not, and the underwriters are not, making an offer to sell these securities in any jurisdiction where an offer or sale is not permitted. You should assume that the information appearing in this prospectus is accurate as of the date on the front cover of this prospectus only. Our business, financial condition, results of operations and prospects may have changed since that date.
Non-GAAP Financial Measures
The body of accounting principles generally accepted in the United States is commonly referred to as “GAAP.” A non-GAAP financial measure is generally defined by the Securities and Exchange Commission, or SEC, as one that purports to measure historical or future financial performance, financial position or cash flows, but excludes or includes amounts that would not be so excluded or included in the most comparable GAAP measure. In this prospectus, we disclose EBITDAX, which is, and PV-10, which may be, a non-GAAP financial measure. See note 3 to “Summary—Summary Consolidated Historical and Pro Forma Financial Information,” note 3 to “Summary—Summary Historical Reserve and Operating Data” and note 2 to the table in “Business and Properties—Our Areas of Operations.”
Natural Gas and Oil Information
We have provided definitions for the natural gas and oil terms used in this prospectus in the “Glossary of Natural Gas and Oil Terms” included as Appendix A. Unless otherwise indicated, all natural gas and oil statistics with respect to our proved reserves as of December 31, 2005 and as of June 30, 2006 set forth in this prospectus are based on reserve reports prepared by Netherland, Sewell & Associates, Inc. and LaRoche Petroleum Consultants, Ltd., independent reserve engineering firms. A summary of Netherland, Sewell & Associates, Inc.’s report on our proved reserves as of December 31, 2005 is attached to this prospectus as Appendix B and a
i
summary of Netherland, Sewell & Associates, Inc.’s report on our proved reserves as of June 30, 2006 is attached to this prospectus as Appendix D. A summary of LaRoche Petroleum Consultants, Ltd.’s report on our proved reserves as of December 31, 2005 is attached to this prospectus as Appendix C and a summary of LaRoche Petroleum Consultants, Ltd.’s report on our proved reserves as of June 30, 2006 is attached to this prospectus as Appendix E.
Our Investors
Unless the context requires otherwise, references in this prospectus to “The Jefferies Investors” means Jefferies & Company, Inc. and certain of its affiliated funds and employees, all of which are our securityholders, and “The TCW Funds” refers to certain affiliated funds that are our securityholders.
Our Financial Statements
The consolidated financial statements of Ascent Energy Inc. as of December 31, 2004 and December 31, 2005, and for each of the three years in the period ended December 31, 2005, appearing elsewhere in this prospectus and registration statement, have been audited by Ernst & Young LLP. In May 2006, Ernst & Young LLP informed us that the India member firm of E&Y Global had a business arrangement with an affiliate of Jefferies Group, Inc. in the United Kingdom that was not in accordance with the SEC’s auditor independence rules regarding Ernst & Young’s independence in its performance of audit services for us because Jefferies & Company, Inc., which is another affiliate of Jefferies Group, Inc., is a substantial shareholder of us. We have been advised by Ernst & Young LLP and Jefferies Group, Inc. that this business arrangement was terminated in June 2006. Please read “Experts” for additional information.
ii
SUMMARY
This summary highlights information contained elsewhere in this prospectus. This summary is not complete and does not contain all of the information that you should consider before investing in our common stock. You should read this entire prospectus carefully, including “Risk Factors” and our consolidated financial statements and the notes to those financial statements included elsewhere in this prospectus, as well as the exhibits to the registration statement of which this prospectus forms a part. See “Where You Can Find More Information.” Some of the statements in this prospectus are forward-looking statements. See “Cautionary Statement Concerning Forward-Looking Statements.”
Unless otherwise indicated, the information contained in this prospectus (i) assumes that the underwriters do not exercise their option to purchase additional shares of our common stock and (ii) gives effect to the -for-1 reverse stock split of our common stock expected to be effected in connection with this offering. Unless the context requires otherwise, references in this prospectus to (i) ”Ascent,” “we,” “us” and “our” refer to Ascent Energy Inc., its Parent and its subsidiaries, (ii) “Parent” or “SLPH” refers to South Louisiana Property Holdings, Inc., formerly known as Forman Petroleum Corporation, which holds approximately 83% of the outstanding common stock (on a non-diluted basis) of Ascent Energy Inc. prior to the consummation of this offering and the Recapitalization and (iii) “Recapitalization” refers to a corporate recapitalization that we intend to consummate prior to this offering, as further described below.
Overview
We are a growth-oriented, independent natural gas and oil company engaged in the acquisition, exploration and development of both conventional and unconventional natural gas and oil properties in Texas, Oklahoma, Louisiana and the Appalachian region. Our growth efforts are directed primarily at finding and developing natural gas reserves in unconventional shale gas areas and in known tight gas areas. We operate substantially all of our properties.
Since joining us in mid-2003, our senior management team has embarked on a strategy to acquire and develop a risk-balanced inventory of high growth opportunities, predominately in shale gas. In order to implement this strategy, our new management initially devoted a substantial portion of its efforts to improving our operational efficiency and increasing our liquidity. Since 2004, our management has successfully added unconventional shale gas acreage in four large shale gas exploration areas and entered the prospective tight gas areas of the Cotton Valley trend in east Texas.
Our unconventional shale gas acreage acquired through June 30, 2006 consists of approximately 144,235 gross acres (89,654 net acres) located in the Woodford/Barnett shale in west Texas, the Barnett shale in north Texas, the Woodford shale and the Caney shale in Oklahoma and the Devonian shale in the Appalachian region. We have employed a strategy to acquire a meaningful position in several prospective shale gas areas to diversify risk while providing exposure to significant potential reserves.
As of June 30, 2006, most of our current production was from our approximate 64,510 gross acres (37,385 net acres) of conventional natural gas and oil properties in Texas, Oklahoma and Louisiana, which includes our acreage in the tight gas sands of the Cotton Valley trend in east Texas and the Vicksburg and Wilcox trends in south Texas. Each of these fields is characterized by established production profiles and numerous producing wells. We plan to expand our production and reserves from such conventional areas by further developing our current properties as well as acquiring additional properties that we believe can generate near-term production and cash flow.
1
Based on reserve reports prepared by our independent reserve engineering firms, our total proved reserves as of December 31, 2005 were approximately 106.1 Bcfe, of which 51.7% were proved developed producing and 10.5% were proved developed non-producing and 60.3% were oil and NGLs. As of June 30, 2006, we had interests in approximately 127,039 net acres, including approximately 103,843 net undeveloped acres. As of December 31, 2005, the PV-10 of our proved reserves was $371.3 million. Our 2005 reserve reports do not reflect any reserves attributable to our unconventional shale gas acreage.
The following table provides certain information regarding our proved reserves as of December 31, 2005 and our June 2006 average net daily production:
| | | | | | | | | | | | |
Area | | Bcfe (1) | | % Gas | | | PV-10 (2)
(in millions) | | June 2006
Average Net
Daily
Production
(MMcfe/d) | | Reserve Life
(in years) (3) |
Oklahoma | | 62.8 | | 17.1 | % | | $ | 204.3 | | 10.1 | | 17.0 |
Texas | | 31.0 | | 76.3 | % | | | 105.2 | | 10.4 | | 8.2 |
Louisiana | | 12.2 | | 62.4 | % | | | 61.8 | | 2.9 | | 11.5 |
| | | | | | | | | | | | |
Total | | 106.1 | | 39.7 | % | | $ | 371.3 | | 23.4 | | 12.4 |
| | | | | | | | | | | | |
| (1) | As of June 30, 2006, our estimated net proved reserves were 100.8 Bcfe, which was determined using June 30, 2006 posted prices, in accordance with SEC guidelines, of $6.04 per MMBtu of natural gas and $70.50 per Bbl of oil and includes 61.5 Bcfe attributable to our Oklahoma properties, 27.7 Bcfe attributable to our Texas properties and 11.6 Bcfe attributable to our Louisiana properties. Our June 30, 2006 reserve estimates are based on reserve reports prepared by our independent reserve engineers. See “Business and Properties—Proved Reserves.” |
| (2) | PV-10 represents the present value of estimated future cash inflows from proved natural gas and oil reserves, less future development and production expenses, discounted at 10% per annum to reflect timing of future cash flows and using December 31, 2005 posted prices for natural gas and oil. See note 3 to “—Summary Historical Reserve and Operating Data” for additional information about our computation of PV-10 and its reconciliation to the standardized measure of discounted future net cash flows, which is its most comparable GAAP financial measure as well as price sensitivity analysis related to PV-10. |
| (3) | Reserve life is calculated by dividing our proved reserves as of December 31, 2005 by our annualized June 2006 average net daily production. |
We have a 2006 capital expenditure budget of approximately $80.3 million, of which $59.7 million is targeted for drilling and workovers and $17.8 million is targeted for leasehold acquisitions. Approximately 41% of our 2006 capital expenditure budget is allocated to the acquisition, exploration and development of unconventional shale gas properties, and approximately 59% is allocated to exploration and development of our conventional resource properties, including our tight gas sands. From January 1, 2006 through June 30, 2006, we spent approximately $24.9 million on the drilling of 28 gross wells andthe completion of 16 producing wells. Eight of the wells were pending completion and evaluation and three wells were pending pipeline connections as of June 30, 2006. During the year ending December 31, 2006, we anticipate drilling 50 to 60 wells.
2
Unconventional Shale Gas
Our growth strategy is primarily directed at acquiring opportunities for reserve growth in long-lived reservoirs in unconventional shale gas areas. Unlike with most conventional reservoirs, the determination whether the development of our unconventional shale gas acreage is economically viable could take one to two years from the time we assemble a significant leasehold position. Our unconventional shale gas properties are located in regions that have experienced significant increases in industry leasing and drilling activity in the past several years. The following is a brief description of our unconventional shale gas acreage:
West Texas Woodford/Barnett Shale. As of June 30, 2006, we had acquired leasehold interests in approximately 80,078 gross (55,498 net) acres in this region, primarily located in Brewster County. We are currently drilling our initial test wells in this region. We are the operator of this acreage with an average working interest of approximately 65%.
North Texas Barnett Shale. As of June 30, 2006, we had acquired leasehold interests in approximately 13,764 gross (13,282 net) acres in this region. We expect to drill our initial test wells on a portion of this acreage in the first half of 2007. We are the operator of this acreage with a 100% working interest.
Oklahoma Woodford Shale and Caney Shale. As of June 30, 2006, we had acquired leasehold interests in approximately 7,629 gross (2,469 net) acres in the Woodford shale and approximately 3,848 gross (2,850 net) acres in the Caney shale. We have drilled and completed our first vertical test well in the Woodford shale. Based on the initial production results of approximately 411 Mcf/d from this well, we plan to drill six additional wells in the Woodford shale during the remainder of 2006. We have also drilled our initial horizontal well in the Caney shale. We are the operator of our Woodford shale acreage and our Caney shale acreage with working interests in each ranging from 50% to 80%.
Appalachian Devonian Shale. As of June 30, 2006, we had acquired leasehold interests in approximately 38,916 gross (15,555 net) acres in this region. We have initiated a five-well drilling program to test for natural gas and gather data that will help us determine the most appropriate drilling and completion strategy. We are the operator of this acreage with a 42% working interest. During September 2006, we entered into a non-binding agreement to acquire the outside 58% working interest in this region, which would bring our working interest to 100%. This agreement is subject to the negotiation of definitive documentation satisfactory to all parties, and consummation will be subject to customary closing conditions.
East Texas Tight Gas
Our growth strategy also includes acquiring property in tight gas sand areas in east Texas that has existing infrastructure to transport natural gas to market. This area is characterized by lower exploration and development risk than many of our other projects. We believe there are several offset opportunities that can be enhanced with the use of modern completion and stimulation techniques. We began acquiring leasehold interests and drilling in this area in the fourth quarter of 2005. As of June 30, 2006, we had drillednine wells in this area with a 100% success rate. As of June 30, 2006, we had acquired leasehold interests in approximately 5,280 gross (3,159 net) acres in the tight gas sands of the Cotton Valley trend in east Texas. We are the operator of this acreage with working interests ranging from 38% to 100%. Our year-end December 31, 2005 proved reserves from this acreage are associated with 12 proved undeveloped and proved developed producing locations.
3
South Texas Natural Gas
We are continuously seeking to expand our acreage in south Texas, including the Vicksburg and Wilcox trends, by acquiring property located in mature producing areas that we believe can generate near-term production and cash flow. As of June 30, 2006, we owned leasehold interests in approximately 4,228 gross (3,337 net) acres in the Vicksburg trend and approximately 4,736 gross (4,018 net) acres in the Wilcox trend, including producing acreage in the region. From January 1, 2006 to June 30, 2006, we drilledthree wells in this area with a 100% success rate. We are the operator of this acreage with working interests ranging from 75% to 100%. As of June 30, 2006, we had 34 producing wells in this region. Our year-end December 31, 2005 proved reserves from this acreage are associated with 49 proved undeveloped and proved developed producing locations.
Our Strengths
High Quality Asset Base in Mature Producing Basins.Our producing properties, consisting of approximately 36,330 gross acres (23,196 net acres) as of June 30, 2006, are located in prolific producing areas of south and east Texas, Oklahoma and Louisiana, with long histories of natural gas and oil production. We support our unconventional shale gas exploration with the cash flow generated from these mature properties.
Significant Growth Opportunities.We believe our approximate two-year inventory of conventional and tight gas drilling projects will generate near-term production growth and cash flow. In addition, we have acquired acreage positions in several unconventional shale gas areas where industry drilling and production activity has increased in the past several years. If our initial unconventional shale gas drilling projects are successful, we expect to increase significantly our long-term reserves, production and drilling inventory.
Effective Risk Management. Our areas of operation provide us with geographic, geological and operational diversity. Our diversified inventory of conventional and unconventional resource drilling locations ranges from lower risk development locations to higher risk exploration locations, including most of our unconventional shale gas acreage, that expose us to opportunities for greater reserve and production growth.
Experienced, Incentivized Management Team with Strong Technical Capability. Our senior management team has on average more than 28 years of industry experience and has considerable technical expertise in engineering, geoscience and field operations. Our in-house technical personnel have extensive experience in geology, geophysics, engineering and drilling and completion technology, including horizontal drilling and fracturing technology. Our officers will beneficially own approximately % of our common stock after the consummation of this offering and the Recapitalization.
Our Business Strategy
Drive Growth Through the Drillbit.We intend to create near-term reserve and production growth from our approximate two-year inventory of drilling opportunities. We anticipate most of our cash flow in the next several years will be generated from our existing producing properties and proved reserves as well as our lower-risk drilling opportunities, exploration and development. We intend to allocate a significant portion of our exploration budget to our higher-risk unconventional shale gas exploration and our tight gas sands exploration.
Focus on Growing Our Inventory of Shale Gas Opportunities. We intend to continue expanding our acreage positions in multiple shale gas areas. As of June 30, 2006, we had leasehold interests in approximately 144,235 gross (89,654 net) acres of prospective shale gas property over four areas. We have budgeted approximately $14.0 million to acquire shale gas acreage in 2006.
4
Pursue Tight Gas Sand Opportunities. We are pursuing multiple tight gas sand opportunities. We believe that our tight gas sand areas have significant potential reserves that have not been depleted by the use of past drilling and completion techniques. We typically pursue opportunities in known tight gas sand areas that have existing infrastructure to transport natural gas to the market. We have budgeted approximately $36.3 million to drill 16 wells in our tight gas sand operations in south and east Texas by the end of 2006.
Operate Substantially All of Our Assets.We serve as the operator of substantially all of our producing properties and intend to continue to do so in the future. Operating control enables us to better control timing and risk as well as the cost of exploration and development drilling and ongoing operations. We believe that in the competitive market for drilling rigs it is advantageous to be in a position to make longer term commitments to drilling rig operators in order to secure service.
Maintain Financial Flexibility. Following the completion of this offering and our anticipated Recapitalization, we will have increased our equity capital base by over $ million and will have approximately $ million of undrawn availability under our credit facility. We believe that future cash flow and access to the capital markets following this offering will provide us with financial flexibility that both enhances our ability to execute our business plan and allows us to selectively seek and complete acquisitions.
Seek Acquisitions that Complement Our Exploration and Development Plans. We pursue acquisitions that add efficiency to our existing operations or represent attractive additions to our exploration and development prospect inventory in large, mature producing regions. We maintain a disciplined acquisition process to help ensure that acquisitions fit our strategic and financial objectives.
Recapitalization
Immediately prior to the sale of our shares in this offering, we intend to consummate a corporate recapitalization involving the following transactions:
| | • | | we will effect a -for 1 reverse stock split of our Parent’s common stock and corresponding payment of cash in lieu of fractional shares; |
| | • | | our Parent will become a wholly owned subsidiary of Ascent Energy Inc. in a tax-free transaction that we refer to as the “Parent Merger;” |
| | • | | we will issue shares of our common stock in repayment of our senior subordinated notes that are not repaid with the net proceeds of this offering in a transaction that we refer to as the “Debt Exchange;” and |
| | • | | we will issue shares of our common stock in exchange for our outstanding Series A preferred stock (including accrued but unpaid dividends thereon) and warrants in a transaction we refer to as the “Preferred Exchange.” |
In addition, we intend to terminate our Amended and Restated Equity Incentive Plan, or 2005 Incentive Plan, and the awards granted thereunder. Participants in the 2005 Incentive Plan will receive cash bonuses and awards of restricted stock, which vest over a three year period, in exchange for terminating their rights under the 2005 Incentive Plan. We refer to this exchange as the “Incentive Issuance.” The Incentive Issuance is contingent on the consummation of this offering and the Recapitalization and the consent of each of the holders of awards under our 2005 Incentive Plan.
We refer to the transactions to be consummated in connection with this offering, including our Parent’s reverse stock split, the Parent Merger, the Debt Exchange, the Preferred Exchange and the Incentive Issuance, collectively as the “Recapitalization.” For additional information about the Recapitalization, please see “Recapitalization” and “Use of Proceeds.”
5
The Jefferies Investors, including Jefferies & Company, Inc., one of the underwriters in this offering, and certain of its affiliates, and The TCW Funds are the principal holders of our securities, and will receive cash and shares of our common stock in this offering and the Recapitalization. In addition, our executive officers are expected to participate in the Incentive Issuance and to receive cash and shares of our common stock in this offering and the Recapitalization. Please see “Related Party Transactions,” “Principal Stockholders” and “Management.”
Upon the consummation of this offering, the application of the net proceeds of this offering as described in “Use of Proceeds” and the consummation of the Recapitalization, all of our senior notes and senior subordinated notes will be extinguished and our outstanding long-term indebtedness will consist solely of approximately$ million of borrowings under our credit facility which mature November 1, 2009.
Our Company
Ascent Energy Inc. is a Delaware corporation formed in 2001. Our principal executive offices are located at 4965 Preston Park Blvd., Suite 800, Plano, Texas 75093. Our telephone number at that address is (972) 543-3900. We maintain a web site atwww.ascentenergy.info, which contains information about us. Our web site and the information contained on it and connected to it are not a part of, and will not be deemed incorporated by reference into, this prospectus.
6
THE OFFERING
Common stock offered | shares |
Underwriters’ option to purchase additional shares | shares |
Common stock outstanding immediately after the completion this offering and the Recapitalization (1) | shares |
Use of proceeds | We estimate that the net proceeds from this offering, after deducting underwriting discounts and estimated offering expenses payable by us, will be approximately $ million, based on an initial public offering price of $ per share. We intend to use the net proceeds of this offering to repay a portion of the indebtedness outstanding under our credit facility, all of our senior notes and a portion of our senior subordinated notes, to pay $ million of cash bonuses to employees participating in the Incentive Issuance, to pay cash in lieu of fractional shares pursuant to a reverse stock split of the Parent’s common stock to be effected in connection with the Parent Merger and for general corporate purposes, which could include refinancing some of our derivative arrangements. See “Use of Proceeds.” |
| | The Jefferies Investors, including Jefferies & Company, Inc., one of the underwriters in this offering, are holders of our senior notes and our senior subordinated notes and therefore are expected to receive a portion of the net proceeds of this offering and shares of common stock in connection with this offering and the Recapitalization. In addition, affiliates of certain of the underwriters in this offering are lenders under our credit facility and accordingly are expected to receive a portion of the net proceeds of this offering. See “Use of Proceeds,” “Related Party Transactions—Recapitalization,” “Principal Stockholders,” and “Underwriting.” |
| | Our executive officers are expected to participate in the Incentive Issuance and to receive a portion of the net proceeds of this offering and shares of our common stock in connection with this offering and the Recapitalization. See “Use of Proceeds,” “Management—Termination of 2005 Incentive Plan,” “Related Party Transactions—Termination of 2005 Incentive Plan” and “Principal Stockholders.” |
Nasdaq Global Market symbol | “ASNT” |
Risk factors | See “Risk Factors” beginning on page 14 and the other information included in this prospectus for a discussion of factors you should carefully consider before deciding to invest in our common stock. |
| (1) | The number of shares of our common stock to be outstanding after this offering and the Recapitalization excludes shares reserved for issuance under our 2006 Long-Term Incentive Plan, of which shares are subject to options outstanding at the time of this offering with a weighted average exercise price of $ per share. |
7
SUMMARY CONSOLIDATED HISTORICAL AND PRO FORMA FINANCIAL INFORMATION
The following tables present our summary consolidated historical and pro forma condensed consolidated financial information for the periods presented. The summary consolidated historical financial information as of and for each of the three years ended December 31, 2005 has been derived from our audited consolidated financial statements and related notes. The audited consolidated financial statements and related notes as of December 31, 2004 and December 31, 2005 and for each of the three years ended December 31, 2005 are included elsewhere in this prospectus. The summary consolidated historical financial information as of June 30, 2006 and for the six months ended June 30, 2005 and June 30, 2006 has been derived from our unaudited consolidated financial statements and related notes included elsewhere in this prospectus which, in the opinion of management, have been prepared on the same basis as our audited consolidated financial statements and include all adjustments, consisting of normal recurring adjustments, necessary for a fair presentation of this information.
The summary pro forma condensed consolidated statement of operations data for the year ended December 31, 2005 and for the six months ended June 30, 2005 and June 30, 2006 assumes that the Recapitalization, this offering and the application of the net proceeds from this offering occurred on January 1, 2005. The summary pro forma condensed consolidated balance sheet data as of June 30, 2006 assumes that the Recapitalization, this offering and the application of the net proceeds from this offering occurred on June 30, 2006. Unless otherwise indicated, the summary pro forma condensed consolidated financial information has been derived from our unaudited pro forma condensed consolidated financial statements and related notes included elsewhere in this prospectus and gives pro forma effect to the Recapitalization, this offering and the application of the net proceeds of this offering as described in “Use of Proceeds.” See “Unaudited Pro Forma Condensed Consolidated Financial Statements” for further discussion.
This information is only a summary and you should read it in conjunction with the material contained in “Management’s Discussion and Analysis of Financial Condition and Results of Operations,” which includes a discussion of factors materially affecting the comparability of the information presented, and in conjunction with the historical and pro forma condensed consolidated financial statements and related notes included elsewhere in this prospectus.
Our historical consolidated financial statements for the years ending prior to December 31, 2005 have been restated to reflect our conversion to the successful efforts method of accounting for our investment in natural gas and oil properties and to correct our previously recorded income tax provision. Our audited historical consolidated financial statements for the years ended December 31, 2003 and December 31, 2004 have been restated to reflect our previously understated asset retirement obligation.
Prior to the Spring of 2003, we focused on the exploration and development of the reserves we acquired in connection with our formation in 2001. Since joining us in 2003, our senior management team has embarked on a strategy to acquire and develop a risk-balanced inventory of high growth opportunities. In order to implement this strategy, our management initially devoted a substantial portion of its efforts to increasing our liquidity and improving our operational efficiency. In July 2004, we completed a financial restructuring that allowed the operating subsidiaries of Ascent Energy Inc., as borrowers, to enter into a new credit facility and reduced our debt service obligations by permitting us to pay in kind certain interest obligations.
8
For the foregoing reasons, our summary consolidated historical and pro forma condensed consolidated financial information may not be meaningful or indicative of our future results.
| | | | | | | | | | | | | | | | | | | | | | | | | | |
| | | Historical | | | Pro Forma |
| | | Year Ended December 31, | | | Six Months Ended June 30, | | | Year Ended
December 31, | | Six
Months Ended
June 30, | | Six
Months Ended
June 30, |
| | | 2003 | | | 2004 | | | 2005 | | | 2005 | | | 2006 | | | 2005 | | 2005 | | 2006 |
| | | (Restated) | | | (Restated) | | | | | | (Unaudited) | | | (Unaudited) | | (Unaudited) | | (Unaudited) |
| | | (in thousands, except per share amounts) |
Statement of Operations Data: | | | | | | | | | | | | | | | | | | | | | | | | | | |
Revenues: | | | | | | | | | | | | | | | | | | | | | | | | | | |
Oil | | $ | 20,377 | | | $ | 25,431 | | | $ | 33,228 | | | $ | 15,694 | | | $ | 19,631 | | | | | | | |
Natural gas | | | 24,553 | | | | 22,021 | | | | 36,634 | | | | 14,848 | | | | 16,271 | | | | | | | |
NGLs | | | 2,027 | | | | 3,257 | | | | 3,714 | | | | 1,776 | | | | 1,713 | | | | | | | |
| | | | | | | | | | | | | | | | | | | | | | | | | | |
Total | | | 46,957 | | | | 50,709 | | | | 73,576 | | | | 32,318 | | | | 37,615 | | | | | | | |
Expenses: | | | | | | | | | | | | | | | | | | | | | | | | | | |
Production and ad valorem taxes | | | 4,307 | | | | 3,091 | | | | 3,332 | | | | 1,731 | | | | 2,231 | | | | | | | |
Lease operating expenses | | | 11,915 | | | | 12,018 | | | | 11,594 | | | | 5,487 | | | | 6,398 | | | | | | | |
General and administrative expenses | | | 10,388 | | | | 8,272 | | | | 8,436 | | | | 3,851 | | | | 5,548 | | | | | | | |
Exploration expenses | | | 5,630 | | | | 854 | | | | 3,460 | | | | 444 | | | | 818 | | | | | | | |
Depreciation, depletion and amortization | | | 21,539 | | | | 31,207 | | | | 20,771 | | | | 10,623 | | | | 10,393 | | | | | | | |
Property impairments | | | 3,802 | | | | 20,711 | | | | 1,254 | | | | — | | | | — | | | | | | | |
Derivative loss | | | — | | | | 6,604 | | | | 33,851 | | | | 17,983 | | | | 6,725 | | | | | | | |
| | | | | | | | | | | | | | | | | | | | | | | | | | |
Total operating expenses | | | 57,581 | | | | 82,757 | | | | 82,698 | | | | 40,119 | | | | 32,113 | | | | | | | |
| | | | | | | | | | | | | | | | | | | | | | | | | | |
Income (loss) from operations | | | (10,624 | ) | | | (32,048 | ) | | | (9,122 | ) | | | (7,801 | ) | | | 5,502 | | | | | | | |
Interest and other income | | | 7 | | | | 203 | | | | 561 | | | | 78 | | | | 110 | | | | | | | |
Interest expense | | | (13,661 | ) | | | (16,958 | ) | | | (19,496 | ) | | | (9,286 | ) | | | (11,266 | ) | | | | | | |
| | | | | | | | | | | | | | | | | | | | | | | | | | |
Loss before income taxes | | | (24,278 | ) | | | (48,803 | ) | | | (28,057 | ) | | | (17,009 | ) | | | (5,654 | ) | | | | | | |
Income tax benefit (expense) | | | 8,624 | | | | 12,472 | | | | 209 | | | | 127 | | | | (317 | ) | | | | | | |
| | | | | | | | | | | | | | | | | | | | | | | | | | |
Loss before cumulative effect of change in accounting principle | | | (15,654 | ) | | | (36,331 | ) | | | (27,848 | ) | | | (16,882 | ) | | | (5,971 | ) | | | | | | |
Cumulative effect of change in accounting principle, net of income tax of $273 in 2003 (1) | | | 262 | | | | — | | | | — | | | | — | | | | — | | | | | | | |
| | | | | | | | | | | | | | | | | | | | | | | | | | |
Net loss | | | (15,392 | ) | | | (36,331 | ) | | | (27,848 | ) | | | (16,882 | ) | | | (5,971 | ) | | | | | | |
Preferred stock dividends (2) | | | (3,976 | ) | | | (3,367 | ) | | | (3,358 | ) | | | (1,665 | ) | | | (1,665 | ) | | | | | | |
| | | | | | | | | | | | | | | | | | | | | | | | | | |
Net loss attributable to common shares | | $ | (19,368 | ) | | $ | (39,698 | ) | | $ | (31,206 | ) | | $ | (18,547 | ) | | $ | (7,636 | ) | | | | | | |
| | | | | | | | | | | | | | | | | | | | | | | | | | |
Net loss per common share: | | | | | | | | | | | | | | | | | | | | | | | | | | |
Basic and diluted net loss per common share | | $ | (3.63 | ) | | $ | (6.67 | ) | | $ | (5.25 | ) | | $ | (3.12 | ) | | $ | (1.28 | ) | | | | | | |
Basic and diluted net loss per common share (pro forma for reverse stock split) | | | | | | | | | | | | | | | | | | | | | | | | | | |
Selected Cash Flow and Other Financial Data: | | | | | | | | | | | | | | | | | | | | | | | | | | |
Net cash provided by operating activities | | $ | 16,935 | | | $ | 17,369 | | | $ | 31,475 | | | $ | 14,671 | | | $ | 18,281 | | | | | | | |
Net cash used in investing activities | | | (39,121 | ) | | | (22,584 | ) | | | (35,019 | ) | | | (17,316 | ) | | | (36,490 | ) | | | | | | |
Net cash provided by financing activities | | | 26,236 | | | | 1,650 | | | | 4,108 | | | | 4,550 | | | | 18,425 | | | | | | | |
Capital expenditures | | | 39,121 | | | | 22,985 | | | | 34,588 | | | | 16,296 | | | | 36,554 | | | | | | | |
EBITDAX (3) | | | 20,354 | | | | 28,658 | | | | 37,342 | | | | 17,351 | | | | 18,766 | | | | | | | |
9
| | | | | | | | | | | | | | | | | | | | | | |
| | | Historical | | | Pro Forma |
| | | As of December 31, | | | As of June 30, | | | As of June 30, |
| | | 2003 | | | 2004 | | | 2005 | | | 2005 | | | 2006 | | | 2006 |
| | | (Restated) | | | (Restated) | | | | | | (Unaudited) | | | (Unaudited) |
| | | (in thousands) |
Balance Sheet Data: | | | | | | | | | | | | | | | | | | | | | | |
Cash and cash equivalents | | $ | 4,081 | | | $ | 516 | | | $ | 1,080 | | | $ | 2,421 | | | $ | 1,296 | | | |
Total assets | | | 200,374 | | | | 169,267 | | | | 187,221 | | | | 179,360 | | | | 215,059 | | | |
Long-term debt (4) | | | 141,493 | | | | 164,954 | | | | 185,223 | | | | 174,498 | | | | 212,429 | | | |
Preferred stock (including accrued but unpaid dividends) (5) | | | 46,265 | | | | 9,577 | | | | 12,865 | | | | 11,208 | | | | 14,496 | | | |
Stockholders’ deficit | | | (40,587 | ) | | | (36,060 | ) | | | (67,196 | ) | | | (54,572 | ) | | | (74,796 | ) | | |
Total liabilities and stockholders’ equity | | | 200,374 | | | | 169,267 | | | | 187,221 | | | | 179,360 | | | | 215,059 | | | |
| (1) | Reflects adoption of Statement of Financial Accounting Standards No. 143,“Accounting for Asset Retirement Obligations”(“SFAS 143”), effective January 1, 2003. |
| (2) | Represents accrued but unpaid dividends on our Series A preferred stock and Series B preferred stock. In August 2003, all outstanding shares of the Series B preferred stock were converted into an aggregate of one million shares of our common stock ( shares of our common stock pro forma for the reverse stock split), and all accrued but unpaid dividends thereon were declared and paid in cash. |
| (3) | EBITDAX is a non-GAAP financial measure. EBITDAX represents earnings before interest expense, income tax (expense) benefit, depreciation, depletion and amortization, property impairments, exploration expenses, non-cash hedging and derivative losses and cumulative effect of change in accounting principle. The following table shows our calculation of EBITDAX and reconciles it to net cash provided by operating activities, which we believe is the most comparable GAAP financial measure. EBITDAX should not be considered as an alternative to, or more meaningful than, net income (loss) or cash flow as determined in accordance with GAAP or as an indicator of a company’s operating performance or liquidity. Certain items excluded from EBITDAX are significant components in understanding and assessing a company’s financial performance, such as a company’s cost of capital and tax structure and the historical costs of depreciable assets, none of which are components of EBITDAX. Our computations of EBITDAX may not be comparable to other similarly titled measures of other companies. We believe that EBITDAX is a widely followed measure of operating performance and may also be used by investors to measure our ability to meet future debt service requirements, if any. We also believe EBITDAX assists investors in comparing a company’s liquidity on a consistent basis without regard to depreciation, depletion and amortization, property impairment and exploration expenses, which can vary significantly depending upon accounting methods. Our credit facility requires that, as of the last day of each fiscal quarter, our ratio of total debt to EBITDAX for the preceding four fiscal quarters be not greater than 2.5 to 1.0 and that our ratio of EBITDAX to cash interest expense (plus certain subsidiary dividends) for the preceding four fiscal quarters be not less than 2.5 to 1.0. As of June 26, 2006, our credit facility defines EBITDAX consistently with the definition of EBITDAX used and presented by us in this prospectus. As of June 30, 2006, our total debt to EBITDAX ratio was approximately1.8 to 1.0 and our EBITDAX to cash interest expense ratio was approximately9.0 to 1.0. |
| | | | | | | | | | | | | | | | | | | | |
| | | Year Ended December 31, | | | Six Months Ended June 30, | |
| | | 2003 | | | 2004 | | | 2005 | | | 2005 | | | 2006 | |
| | | (Restated) | | | (Restated) | | | | | | (Unaudited) | |
| | | (in thousands) | |
Net loss | | $ | (15,392 | ) | | $ | (36,331 | ) | | $ | (27,848 | ) | | $ | (16,882 | ) | | $ | (5,971 | ) |
Interest expense | | | 13,661 | | | | 16,958 | | | | 19,496 | | | | 9,286 | | | | 11,266 | |
Income tax (benefit) expense | | | (8,624 | ) | | | (12,472 | ) | | | (209 | ) | | | (127 | ) | | | 317 | |
Depreciation, depletion and amortization | | | 21,539 | | | | 31,207 | | | | 20,771 | | | | 10,623 | | | | 10,393 | |
Property impairments | | | 3,802 | | | | 20,711 | | | | 1,254 | | | | — | | | | — | |
Exploration expenses | | | 5,630 | | | | 854 | | | | 3,460 | | | | 444 | | | | 818 | |
Non-cash hedging and derivative losses | | | — | | | | 7,731 | | | | 20,418 | | | | 14,007 | | | | 1,943 | |
Cumulative effect of change in accounting principle | | | (262 | ) | | | — | | | | — | | | | — | | | | — | |
| | | | | | | | | | | | | | | | | | | | |
EBITDAX | | | 20,354 | | | | 28,658 | | | | 37,342 | | | | 17,351 | | | | 18,766 | |
Exploration expenses | | | (4,604 | ) | | | (854 | ) | | | (3,460 | ) | | | (444 | ) | | | (514 | ) |
Interest expense | | | (13,003 | ) | | | (2,303 | ) | | | (3,392 | ) | | | (1,488 | ) | | | (2,447 | ) |
Gain on sale of assets | | | — | | | | (200 | ) | | | (658 | ) | | | (51 | ) | | | (71 | ) |
Other non-cash gains | | | (52 | ) | | | 21 | | | | 6 | | | | — | | | | 17 | |
Income tax expense | | | — | | | | — | | | | (98 | ) | | | (33 | ) | | | (156 | ) |
Changes in assets and liabilities | | | 14,240 | | | | (7,953 | ) | | | 1,735 | | | | (664 | ) | | | 2,686 | |
| | | | | | | | | | | | | | | | | | | | |
Net cash provided by operating activities | | $ | 16,935 | | | $ | 17,369 | | | $ | 31,475 | | | $ | 14,671 | | | $ | 18,281 | |
| | | | | | | | | | | | | | | | | | | | |
| (4) | All periods include borrowings under our credit facility and the aggregate principal amount of outstanding senior notes and senior subordinated notes, and all periods, except the year ended December 31, 2003, include long-term accrued interest on our senior notes and senior subordinated notes. |
| (5) | The amounts for the year ended December 31, 2003 represent the book value of our Series A preferred stock plus all accrued but unpaid dividends thereon. The amounts for all other periods represent only accrued but unpaid dividends on the Series A preferred stock. In December 2004, the terms of the Series A preferred stock were amended to eliminate our requirement to redeem the outstanding shares of Series A preferred stock on a specified date. The amendment resulted in a balance sheet reclassification of the book value of the Series A preferred stock to stockholders’ deficit. |
10
SUMMARY HISTORICAL RESERVE AND OPERATING DATA
The following tables present summary historical operating information for the years ended December 31, 2003, December 31, 2004 and December 31, 2005 and for the six months ended June 30, 2005 and June 30, 2006. The following tables also present summary historical information regarding our estimated net proved natural gas and oil reserves as of December 31, 2003, 2004 and 2005. All calculations of estimated net proved reserves have been made in accordance with the rules and regulations of the SEC and, except as otherwise indicated, give no effect to federal or state income taxes. For additional information about our reserves, please read “Business and Properties—Proved Reserves” and the information regarding our oil and gas activities beginning on page F-32.
Upon joining us in mid-2003, our senior management team undertook a detailed review and analysis of our proved natural gas and oil reserves, which resulted in a downward revision of our estimates of proved natural gas and oil reserves by a total of 37.7 Bcfe for the year ended December 31, 2003 and by an additional 62.9 Bcfe during the year ended December 31, 2004. The 2003 revision included approximately 22.3 Bcfe of proved non-producing and proved undeveloped reserves plus a subsequent 15.4 Bcfe reduction in underperforming producing properties. The 2004 revision included approximately 28.5 Bcfe of proved non-producing reserves and 34.4 Bcfe of proved undeveloped reserves. As a result of the events leading up to our July 2004 financial restructuring, we were forced to delay our 2004 capital expenditure program which resulted in a decline in our natural gas and oil production for the year ended December 31, 2004, because we were unable to offset natural production declines with new production. We had further production declines for the year ended December 31, 2005 resulting from a reduction in our capital expenditure program due to rig delays and the impact of Hurricanes Katrina and Rita. Our June 2006 production from our South Louisiana properties was2.9 MMcfe/d, which isapproximately 75% of our average daily pre-hurricane production from these properties during February 2005 through July 2005. We continue to see some post-hurricane improvement in production from our South Louisiana properties; however, it is common for production from mature water-drive wells not to return to pre-shut-in production rates after being shut-in. We do not expect that all of these wells will return completely to pre-hurricane production rates. Please read “Management’s Discussion and Analysis of Financial Condition and Results of Operations,” including “—Overview—Reserve Write Down.”
For the foregoing reasons, our summary historical reserve and operating data may not be meaningful or indicative of our future reserve and operating data.
| | | | | | | | | | | | | | | |
| | | Year Ended December 31, | | Six Months Ended
June 30, |
| | | 2003 | | 2004 | | 2005 | | 2005 | | 2006 |
| | | (Restated) | | (Restated) | | | | | | |
Production data: | | | | | | | | | | | | | | | |
Oil (MBbls) | | | 688 | | | 625 | | | 598 | | | 309 | | | 298 |
Natural gas (MMcf) | | | 6,545 | | | 5,158 | | | 4,592 | | | 2,348 | | | 2,324 |
NGLs (MBbls) | | | 107 | | | 120 | | | 107 | | | 60 | | | 43 |
Combined volumes (MMcfe) | | | 11,318 | | | 9,630 | | | 8,826 | | | 4,560 | | | 4,370 |
Average prices (net of hedging): | | | | | | | | | | | | | | | |
Oil (per Bbl) | | $ | 29.60 | | $ | 40.66 | | $ | 55.55 | | $ | 50.79 | | $ | 65.95 |
Natural gas (per Mcf) | | | 3.75 | | | 4.27 | | | 7.98 | | | 6.32 | | | 7.00 |
NGLs (per Bbl) | | | 21.37 | | | 27.15 | | | 34.56 | | | 29.76 | | | 39.41 |
Combined (per Mcfe) | | | 4.17 | | | 5.27 | | | 8.34 | | | 7.09 | | | 8.61 |
Average expenses (per Mcfe): | | | | | | | | | | | | | | | |
Production and ad valorem taxes | | $ | 0.38 | | $ | 0.32 | | $ | 0.38 | | $ | 0.38 | | $ | 0.51 |
Lease operating expenses | | | 1.05 | | | 1.25 | | | 1.31 | | | 1.20 | | | 1.46 |
General and administrative expenses | | | 0.92 | | | 0.86 | | | 0.96 | | | 0.84 | | | 1.27 |
Exploration expenses | | | 0.50 | | | 0.09 | | | 0.39 | | | 0.10 | | | 0.19 |
Depreciation, depletion and amortization | | | 1.90 | | | 3.24 | | | 2.35 | | | 2.33 | | | 2.38 |
Property impairments | | | 0.34 | | | 2.15 | | | 0.14 | | | — | | | — |
Derivative loss | | | — | | | 0.69 | | | 3.84 | | | 3.94 | | | 1.54 |
11
| | | | | | | | | |
| | | As of December 31, |
| | | 2003 | | 2004 | | 2005 |
| | | (dollars in thousands) |
Estimated net proved reserves (1): | | | | | | | | | |
Oil (MBbls) | | | 13,620 | | | 9,578 | | | 9,572 |
Natural gas (MMcf) | | | 80,423 | | | 37,311 | | | 42,066 |
NGLs (MBbls) (2) | | | — | | | 1,119 | | | 1,098 |
Total (MMcfe) | | | 162,141 | | | 101,491 | | | 106,089 |
PV-10 (3) | | $ | 379,494 | | $ | 239,632 | | $ | 371,303 |
Standardized measure of discounted future net cash flows (3) | | $ | 271,715 | | $ | 190,322 | | $ | 280,928 |
| (1) | In accordance with SEC requirements, our estimated net proved reserves, PV-10 and the standardized measure of discounted future net cash flows were determined using the following year-end posted prices for natural gas and oil: |
| | | | | | | | | |
| | | Year Ended December 31, |
| | | 2003 | | 2004 | | 2005 |
Natural gas (per MMBtu) | | $ | 5.97 | | $ | 5.74 | | $ | 8.17 |
Oil (per Bbl) | | | 29.25 | | | 40.00 | | | 57.75 |
| (2) | Oil reserve data as of December 31, 2003 includes NGLs. |
| (3) | PV-10 may be considered a non-GAAP financial measure; therefore, the following table reconciles our calculation of PV-10 to the standardized measure of discounted future net cash flows, which is the most comparable GAAP financial measure. PV-10 is the computation of the standardized measure of discounted future net cash flows on a pre-tax basis. Our reserve estimates have been calculated using the prices for natural gas and oil in note 1 above. The prices in note 1 above do not reflect adjustments for quality, transportation fees, energy content and regional price differentials as included in the calculation of our reserve estimates. We estimate that if natural gas prices declined by $0.25 per Mcf from the price used in determining our proved reserves as of December 31, 2005, the PV-10 of our proved reserves as of December 31, 2005 would decrease from $371.3 million to $364.9 million and the quantity of our reserves would decline by 825 MMcf of natural gas and 40,000 Bbls of oil and NGLs. We estimate that if oil prices declined by $1.00 per Bbl from the price used in determining our proved reserves as of December 31, 2005, then the PV-10 of our proved reserves as of December 31, 2005 would decrease from $371.3 million to $366.5 million and the quantity of our reserves would decline by 43 MMcf of natural gas and 44,300 Bbls of oil and NGLs. Estimates of PV-10 of reserves and the quantity of reserves would likely decline at a rate proportionately greater than specified above if natural gas and oil prices decline significantly from those used in calculating such estimates. Management believes that the presentation of the non-GAAP financial measure of PV-10 provides useful information to investors because it is widely used by professional analysts and sophisticated investors in evaluating natural gas and oil companies. Management also believes that PV-10 is relevant and useful for evaluating the relative monetary significance of our natural gas and oil properties. Further, professional analysts and sophisticated investors may use the measure as a basis for comparison of the relative size and value of our reserves to other companies’ reserves. Management also uses this pre-tax measure when assessing the potential return on investment related to our natural gas and oil properties and in evaluating acquisition candidates. Because there are many unique factors that can impact an individual company when estimating the amount of future income taxes to be paid, we believe the use of a pre-tax measure is valuable for evaluating us. PV-10 is not a measure of financial or operating performance under GAAP, nor is it intended to represent the current market value of our estimated natural gas and oil reserves. PV-10 should not be considered in isolation or as a substitute for the standardized measure of discounted future net cash flows as defined under GAAP. |
12
| | | | | | | | | | | | |
| | | Year Ended December 31, | |
| | | 2003 | | | 2004 | | | 2005 | |
| | | (in thousands) | |
Future cash inflows | | $ | 911,612 | | | $ | 664,223 | | | $ | 986,683 | |
Less: Future production costs | | | (235,308 | ) | | | (199,622 | ) | | | (276,962 | ) |
Less: Future development costs | | | (56,733 | ) | | | (48,002 | ) | | | (56,042 | ) |
| | | | | | | | | | | | |
Future net cash flows | | | 619,571 | | | | 416,599 | | | | 653,679 | |
Less: 10% discount factor | | | (240,077 | ) | | | (176,967 | ) | | | (282,376 | ) |
| | | | | | | | | | | | |
PV-10 | | | 379,494 | | | | 239,632 | | | | 371,303 | |
Less: Undiscounted income taxes | | | (187,825 | ) | | | (102,131 | ) | | | (179,732 | ) |
Plus: 10% discount factor | | | 80,046 | | | | 52,821 | | | | 89,357 | |
| | | | | | | | | | | | |
Discounted income taxes | | | (107,779 | ) | | | (49,310 | ) | | | (90,375 | ) |
| | | | | | | | | | | | |
Standardized measure of discounted future net cash flows | | $ | 271,715 | | | $ | 190,322 | | | $ | 280,928 | |
| | | | | | | | | | | | |
Our independent reserve engineers also prepared reports of our estimated net proved natural gas and oil reserves as of June 30, 2006. As of June 30, 2006, our estimated net proved reserves were 100.8 Bcfe, which included 37,401 MMcf of natural gas and 10,569 MBbls of oil and NGLs. These estimates were determined using a price of $6.04 per MMBtu of natural gas and $70.50 per Bbl of oil as compared to our December 31, 2005 year-end pricing of $8.17 per MMBtu of natural gas and $57.75 per Bbl of oil.
13
RISK FACTORS
An investment in our common stock involves a high degree of risk. You should carefully consider the following risks and all of the other information contained in this prospectus before deciding to invest in our common stock.
Risks Related to Our Business and Our Industry
Natural gas and oil prices are volatile and a decline in natural gas and oil prices could materially and adversely affect our financial results and impede our growth.
Our revenue, profitability and cash flow depend upon the prices and demand for natural gas and oil. Moreover, changes in natural gas and oil prices have a significant impact on the value of our reserves. The markets for these commodities are very volatile and even relatively modest drops in prices can significantly affect our financial results and impede our growth. Prices for natural gas and oil may fluctuate widely in response to a variety of additional factors that are beyond our control, such as:
| | • | | changes in global supply and demand for natural gas and oil; |
| | • | | commodity processing, gathering and transportation availability; |
| | • | | domestic and global political and economic conditions; |
| | • | | the ability of members of the Organization of Petroleum Exporting Countries to agree to and maintain oil price and production controls; |
| | • | | weather conditions, including hurricanes; |
| | • | | technological advances affecting energy consumption; |
| | • | | domestic and foreign governmental regulations; and |
| | • | | the price and availability of alternative fuels. |
Lower natural gas and oil prices may not only decrease our revenue on a per share basis, but also may reduce the amount of natural gas and oil that we can produce economically. This reduction may result in our having to make substantial downward adjustments to our estimated proved reserves.
Our natural gas and oil reserves and future production and, therefore, our future cash flow and revenue, are highly dependent on our successfully developing our undeveloped leasehold acreage, including our unconventional shale gas acreage.
Approximately 82% of our net leasehold acreage as of June 30, 2006, which includes our unconventional shale gas acreage, was undeveloped. Our business strategy involves using a significant amount of our operational and financial resources and cash flow for acquiring, exploring and developing our unconventional shale gas acreage. Unconventional shale gas acreage requires greater amounts of time and capital to develop, and to determine whether commercially productive reserves exist, than conventional acreage. As a result, we may not successfully develop our undeveloped acreage on the schedule we have established, at the costs we have budgeted, or at all. Our future natural gas and oil reserves and production and, therefore, our future cash flow and revenue are highly dependent on our successfully developing our undeveloped leasehold acreage. If we are unsuccessful in developing our undeveloped acreage as we have anticipated, our future cash flow and revenues could be materially and adversely affected.
Unless we replace our natural gas and oil reserves, our reserves and production will decline, which would materially and adversely affect our business, financial condition and results of operations.
Producing natural gas and oil reservoirs generally are characterized by declining production rates that vary depending upon reservoir characteristics and other factors. Thus, our future natural gas and oil reserves and
14
production and, therefore, our cash flow and revenue are highly dependent on our success in efficiently developing our current reserves and acquiring additional recoverable reserves, including additional recoverable reserves within our unconventional shale gas acreage. We may not be able to develop, find or acquire reserves to replace our current and future production at costs or other terms acceptable to us, or at all, in which case our business, financial condition and results of operations would be materially and adversely affected. Our combined natural gas, oil and NGL production has declined in each of the last two years from 11,318 MMcfe in 2003 to 9,630 MMcfe in 2004 to 8,826 MMcfe in 2005. In addition, our combined production for the six months ended June 30, 2006 declined to 4,370 MMcfe as compared to combined production for the six months ended June 30, 2005 of 4,560 MMcfe. Our independent reserve engineers have estimated that our natural gas and oil production in 2006 from our proved developed producing reserves as of December 31, 2005 will decline by approximately 18.6% from our production from those reserves for the year ended December 31, 2005.
If natural gas or oil prices decrease, we may be required to write down the capitalized cost of individual natural gas and oil properties.
Effective January 1, 2005, we changed our accounting method for our natural gas and oil properties from the full cost method to the successful efforts method. Under the successful efforts method of accounting, we capitalize all costs related to property acquisitions and successful exploratory wells, all development costs and the costs of support equipment and facilities. All costs related to unsuccessful exploratory wells are expensed once the well is determined to be unsuccessful. Other exploratory costs, including geological and geophysical costs, are expensed as incurred.
The capitalized costs of our natural gas and oil properties, on a field-by-field basis, may exceed the estimated undiscounted future net cash flows of that field. This may occur when natural gas or oil prices are low or if we have substantial downward adjustments to our estimated proved reserves or increases in our estimates of development costs. In such event, we would be required to record impairment charges to reduce the capitalized costs of each such field to our estimate of the field’s fair market value. Any impairment reduces our earnings and stockholders’ equity. Once incurred, an impairment charge cannot be reversed at a later date even if we experience increases in the price of natural gas or oil, or both, or increases in the amount of our estimated proved reserves. For the years ended December 31, 2005, 2004 and 2003, we recorded impairment charges of approximately $1.3 million, $20.7 million and $3.8 million, respectively, to reduce the capitalized costs of our fields to estimated fair market value.
The marketability of our production depends on gathering systems, transportation facilities and processing facilities that we do not control or that may not currently exist. If these systems and facilities become unavailable or are otherwise unable to provide services, or are not developed in areas without current infrastructure, our business, financial condition and results of operations could be materially and adversely affected.
The marketability of our natural gas and oil production depends in part upon the availability, proximity and capacity of pipelines, natural gas gathering systems, transportation barges and processing facilities owned by third parties. We do not control most of these facilities and they may not be available to us in the future. Alternative delivery methods could either be prohibitively expensive or available only after a period of delay, if at all, at certain well sites. We may be required to shut in wells for lack of a market or because access to natural gas pipelines, gathering system capacity or processing facilities may be limited or unavailable. If that were to occur, we would be unable to realize revenue from those wells until arrangements were made to deliver the production to market. As a result, if one or more transportation, gathering or processing facilities that we depend on became unavailable or otherwise unable to provide services, our revenues and, in turn, our business, financial condition and results of operations could be materially and adversely affected. In addition, most of the unconventional shale gas and tight gas areas in which we own acreage do not currently contain gathering systems, transportation facilities or processing facilities. If our drilling efforts are successful within these areas, we will need access to transportation and gathering facilities to deliver our production to market. Until such facilities are available, we would be unable to realize revenue from such production and, as a result, our business, financial condition and results of operations could be materially and adversely affected.
15
Any significant inaccuracies in our reserve estimates, or the underlying assumptions on which such estimates were based, could materially affect the quantities and present value of our reserves.
On several occasions, inaccurate estimates of our proved reserves have required downward revisions in our estimates of our proved reserves. Any further significant inaccuracies in the interpretations, assumptions or projections used to develop our natural gas and oil reserves could materially affect the estimated quantities and present value of our reserves as shown in this prospectus. In addition, actual future production, natural gas and oil prices, revenues, taxes, development expenditures, operating expenses and quantities of recoverable natural gas and oil reserves most likely will vary from our estimates. Any significant variance could materially affect the estimated quantities and present value of our reserves as shown in this prospectus.
The present values referred to in this prospectus may not represent the current market value of our estimated natural gas and oil reserves. The timing of our production and the expenses related to the development of our natural gas and oil properties will affect both the timing of actual future net cash flows from our proved reserves and their present value. In addition, our PV-10 estimates are based on prices and costs as of the date of the estimates. Actual future prices and costs may be materially higher or lower than the prices and costs as of the date of the estimates. Further, the effect of derivative instruments is not reflected in these assumed prices. Also, the 10% discount factor we use when calculating our PV-10 estimates may not be the most appropriate discount factor based on interest rates in effect from time to time and risks associated with us or the natural gas and oil industry in general. For example, if natural gas prices decline by $0.25 per Mcf, the PV-10 of our total proved reserves as of December 31, 2005 would decrease from approximately $371.3 million to $364.9 million, and if oil prices decline by $1.00 per Bbl, the PV-10 of our total proved reserves as of December 31, 2005 would decrease from approximately $371.3 million to $366.5 million.
The unavailability or high cost of drilling rigs, equipment, supplies or personnel could adversely affect our ability to execute our exploration and development plans.
The natural gas and oil industry is cyclical and, from time to time, there are shortages of drilling rigs, equipment, supplies or qualified personnel. During these periods, the costs of rigs, equipment and supplies may be substantially increased and their availability may be limited. In addition, the demand for, and wage rates of, qualified personnel, including drilling rig crews, may rise as the number of rigs in service increases. If drilling rigs, equipment, supplies or qualified personnel are unavailable to us due to excessive costs or demand or otherwise, our ability to execute our exploration and development plans could be materially and adversely affected and, as a result, our business, financial condition and results of operations could be materially and adversely affected.
We depend on a limited number of key personnel who would be difficult to replace.
We depend on the performance of our executive officers and other key employees. The loss of any member of our senior management or other key employee, including Terry W. Carter, our President and Chief Executive Officer, Eddie M. LeBlanc, III, our Chief Financial Officer, or David L. McCabe, our Chief Operating Officer and Executive Vice President of Exploration and Development, could negatively impact our ability to execute our strategy. We do not maintain key person life insurance policies on any of our executive officers or key employees.
We may have difficulty managing growth in our business, which could adversely affect our financial condition and results of operations.
Significant growth in the size and scope of our operations could place a strain on our financial, technical, operational and management resources. The failure to continue to upgrade our technical, administrative, operating and financial control systems or the occurrences of unexpected expansion difficulties, including the failure to recruit and retain experienced managers, geologists, engineers and other professionals in the natural gas
16
and oil industry could have a material adverse effect on our business, financial condition and results of operations and our ability to timely execute our business plans.
Our identified drilling locations are scheduled over several years, which makes them susceptible to uncertainties that could materially alter the occurrence or timing of their drilling.
As part of our growth strategy, our management has identified drilling locations as an estimation of our future multi-year drilling activities on our existing acreage. As of June 30, 2006, we had identified over 865 gross drilling locations, only 83 of which were attributable to proved undeveloped reserves. Our ability to drill and develop these locations depends on a number of uncertainties, including the availability of capital, regulatory approvals, natural gas and oil prices, costs and drilling results. Because of these uncertainties, we do not know if the drilling locations we have identified will be drilled on our anticipated schedule, or at all, or if we will be able to produce natural gas or oil from these locations in commercially viable quantities. As such, our actual drilling activities may differ materially from those presently identified, which could materially and adversely affect our business, financial condition and results of operations.
Prospects that we decide to drill may not yield natural gas or oil in commercially viable quantities, or at all.
A prospect is a property on which we have identified what our geoscientists and engineers believe, based on available seismic, geological and engineering information, to be indications of commercial quantities of natural gas or oil. However, the use of seismic data and other technologies and the study of producing fields in the same area will not enable us to know conclusively prior to drilling and testing whether natural gas or oil will be present or, if present, whether natural gas or oil will be present in sufficient quantities to recover drilling or completion costs or to be economically viable. Even if sufficient amounts of natural gas or oil exist, we may damage the reservoir or experience mechanical difficulties while drilling or completing the well, resulting in a reduction in production from the well or abandonment of the well. From January 1, 2003 through June 30, 2006, 14% of the development wells we drilled were dry holes and 33% of the exploration wells we drilled were dry holes. If we drill wells that we identify as dry holes in our current and future prospects, our drilling success rate may decline and it may materially and adversely affect our business, financial condition and results of operations.
Drilling for and producing natural gas and oil are high risk activities with many uncertainties that could materially and adversely affect our business, financial condition and results of operations.
Our operations are subject to many risks and hazards incident to exploring and drilling for, producing, transporting, marketing and selling natural gas and oil. Many of these risks and hazards are beyond our control and unavoidable under certain circumstances. Any of these risks can cause substantial losses, including personal injury or loss of life, damage to or destruction of property, natural resources and equipment, pollution, environmental contamination or loss of wells and other regulatory penalties. These risks and hazards include:
| | • | | unusual or unexpected geological formations; |
| | • | | pressures, blowouts or fires; |
| | • | | cratering and explosions; |
| | • | | loss of drilling fluid circulation; |
| | • | | facility or equipment malfunctions; |
| | • | | unexpected operational events; |
| | • | | pipeline accidents and failures or casing collapses; |
| | • | | uncontrollable flows of natural gas, oil, brine or well fluids; |
17
| | • | | compliance with environmental and other governmental requirements; and |
| | • | | adverse weather conditions. |
If any of these risks is realized, our business, financial condition and results of operations could be materially and adversely affected.
Losses and liabilities from uninsured or underinsured drilling and operating activities could materially and adversely affect our business, financial condition and operations.
Insurance against every operational risk is not available at economic rates. Additionally, we may elect not to obtain insurance if we believe that the cost of available insurance is excessive relative to the perceived risks presented. Insurance expenses have increased due to recent hurricane activity in the Gulf of Mexico. Thus, losses could occur for uninsurable or uninsured risks or in amounts in excess of existing insurance coverage. The occurrence of an event that is not fully covered by insurance could materially and adversely affect our business, financial condition and results of operations.
We may be unable to successfully acquire additional leasehold interests or other natural gas and oil properties, and acquisitions that we do acquire may prove to be worth less than we paid because of uncertainties in evaluating recoverable reserves and potential liabilities, which may inhibit our ability to grow our production and replace our reserves.
We expect that acquisitions will continue to contribute to our future growth. However, suitable acquisitions may not be available in the future on reasonable terms. If we are successfully able to acquire additional properties, these acquisitions will require an assessment of a number of factors, including estimates of recoverable reserves, exploration potential, future natural gas and oil prices, operating costs and potential environmental and other liabilities. These assessments are inexact and their accuracy is inherently uncertain. Moreover, our review of properties to be acquired will not reveal all existing or potential problems. In addition, our review may not permit us to become sufficiently familiar with the properties to fully assess their deficiencies and capabilities. We may not be able to negotiate contractual indemnification for pre-closing liabilities, including environmental liabilities. We may also acquire interests in properties on an “as is” basis with limited remedies for breaches of representations and warranties. As a result, we may ultimately acquire natural gas and oil properties that do not contain economically recoverable reserves, which, in turn, may materially and adversely affect our business, financial condition and results of operations.
We may not effectively consolidate and integrate acquired operations, which may materially and adversely affect our business, financial condition and results of operations.
Acquisitions present operational and administrative challenges that may prove more difficult than anticipated. The failure to consolidate functions and integrate procedures, personnel and operations in an effective and timely manner may adversely affect our business, financial condition and results of operations, at least temporarily. Significant acquisitions can change the nature of our operations and business depending upon the character of the acquired properties, which may have substantially different operating and geological characteristics or be in different geographic locations than our existing properties. To the extent that we acquire properties substantially different from the properties in our operating areas or acquire properties that require different technical expertise, we may not be able to realize the economic benefits of these acquisitions as efficiently as originally anticipated.
Our derivative arrangements could result in financial losses or could materially and adversely affect our business, financial condition and results of operations.
To achieve more predictable cash flow and to reduce our exposure to adverse fluctuations in the prices of natural gas and oil, we currently, and may in the future, enter into derivative arrangements for a portion of our
18
natural gas and oil production. Derivative arrangements for a portion of our natural gas and oil production expose us to the risk of financial loss in some circumstances, including when:
| | • | | production is less than expected; |
| | • | | the counter-party to the derivative arrangement defaults on its contract obligations; or |
| | • | | there is a change in the expected differential between the underlying price in the derivative arrangement and actual prices received. |
In addition, our derivative arrangements limit the benefit we would receive from increases in the prices for natural gas and oil and may expose us to cash margin requirements. These financial losses and other lost benefits could materially and adversely affect our business, financial condition and results of operations.
Competition in the natural gas and oil industry is intense, which may adversely affect our ability to succeed.
The natural gas and oil industry is intensely competitive, and we compete with companies that have greater resources than we do. Many of these companies not only explore for and produce natural gas and oil, but also have refining, processing and gathering operations and market petroleum and other products on a regional, national or worldwide basis. These companies may be able to pay more for productive natural gas and oil properties and exploratory prospects or identify, evaluate, bid for and purchase a greater number of properties and prospects than our financial or human resources permit. In addition, these companies may have a greater ability to continue exploration activities during periods of low natural gas and oil market prices. Our larger competitors may be able to absorb the burden of present and future federal, state, local and other laws and regulations more easily than we can. Our ability to acquire additional properties and discover reserves in the future will be dependent upon our ability to evaluate and select suitable properties and to consummate transactions in a highly competitive environment. Some of our competitors have been operating in Texas, Oklahoma, Louisiana and the Appalachian region much longer than we have and have demonstrated the ability to operate through industry cycles. Any of these competitive disadvantages could adversely affect our business, financial condition and results of operations.
We are subject to complex federal, state, local and other laws and regulations that could materially and adversely affect our business, financial condition and results of operations.
Our natural gas and oil exploration and production operations are subject to complex and stringent laws and regulations. In order to conduct our operations in compliance with these laws and regulations, we must obtain and maintain numerous permits, approvals and certificates from various federal, state and local governmental authorities. We may incur substantial costs in order to maintain compliance with these existing laws and regulations. In addition, our costs of compliance may increase if existing laws and regulations are revised or reinterpreted or if new laws and regulations become applicable to our operations. These costs could have a material and adverse effect on our business, financial condition and results of operations. Moreover, our failure to comply with these laws and regulations, as interpreted and enforced, could have a material adverse effect on our business, financial condition and results of operations.
Our operations may expose us to substantial costs and liabilities with respect to environmental, health and safety matters.
We may incur substantial costs and liabilities as a result of environmental, health and safety requirements applicable to our natural gas and oil exploration, production and other activities. These costs and liabilities could arise under a wide range of environmental and safety laws, including regulations and enforcement policies, which have tended to become increasingly strict over time. Failure to comply with environmental laws or regulations may result in the assessment of administrative, civil and criminal penalties, the imposition of cleanup and site restoration costs and liens, or the issuance of orders enjoining or limiting our current or future operations.
19
Compliance with these laws and regulations also increases the cost of our operations and may prevent or delay the commencement or continuance of a given operation. In addition, claims for damages to persons or property may result from environmental and other impacts of our operations.
Strict, joint and several liability to remediate contamination may be imposed under certain environmental laws, which could cause us to become liable for, among other things, the conduct of others or for consequences of our own actions that were in compliance with all applicable laws at the time those actions were taken. Moreover, new or modified environmental, health or safety laws, regulations or enforcement policies could be more stringent and impose unforeseen liabilities or significantly increase compliance costs. As a result, the costs to comply with environmental, health or safety laws or regulations or the liabilities incurred as a result of any violations of these laws or regulations may materially and adversely affect our business, financial condition and results of operations.
Properties in which we have interests may have title defects which materially impair their value.
We may suffer monetary losses from title defects relating to properties that we drill or acquire. Generally, under the terms of the operating agreements affecting our properties, any monetary loss is to be borne by all parties to any such agreement in proportion to their interests in such property. If there are any title defects or defects in assignment of leasehold rights in properties in which we hold an interest, we may suffer a monetary loss.
We may continue to incur net losses.
We realized net losses of approximately $6.0 million for the six months ended June 30, 2006 and approximately $27.8 million, $36.3 million and $15.4 million for the years ended December 31, 2005, 2004 and 2003, respectively. We may continue to incur net losses over the next several years. Our failure to achieve profitability in the future could adversely affect our ability to repay indebtedness under our credit facility and our ability to raise additional capital and, accordingly, our ability to grow our business.
Covenants in our credit facility impose significant restrictions and requirements on us.
Our credit facility contains a number of covenants imposing various significant restrictions on Ascent Energy Inc., its operating subsidiaries and our Parent, including restrictions on the repurchase of capital stock and limitations on the ability to incur additional indebtedness, make investments, engage in transactions with affiliates, sell assets and create liens. In addition, our credit facility contains restrictions on the payment of dividends by the operating subsidiaries of Ascent Energy Inc. and by our Parent. Our operating subsidiaries and our Parent are only permitted to pay cash dividends if certain financial tests are satisfied, our then outstanding borrowings do not exceed our borrowing base and no default under our credit facility exists or is anticipated as a result of payment of the dividend. Because Ascent Energy Inc. is a holding company and depends on its subsidiaries for cash flow, the restrictions in our credit facility on our subsidiaries’ ability to pay dividends may, in turn, limit the ability of Ascent Energy Inc. to pay dividends on its capital stock. All of these restrictions under our credit facility may affect our ability to operate our business to take advantage of potential business opportunities as they arise and, in turn, may materially and adversely affect our business, financial condition and results of operations.
Our credit facility also requires us to achieve and maintain certain financial ratio tests. There can be no assurance that we will be able to achieve and maintain compliance with these prescribed financial ratio tests or other requirements under our credit facility. Failure to achieve or maintain compliance with the financial ratio tests or other requirements under our credit facility would result in a default and could lead to the acceleration of our obligations under our credit facility.
The stock of Ascent Oil and Gas Inc., the direct wholly owned subsidiary of Ascent Energy Inc., and substantially all of the assets of the subsidiaries of Ascent Energy Inc. are pledged to secure the obligations of
20
the borrowers under our credit facility. Our lack of unencumbered collateral could materially and adversely affect our ability to obtain, or increase the cost of obtaining, additional financing in the future.
The failure of one or more of our customers or counterparties to meet their contractual obligations may materially and adversely affect our business, financial condition and results of operations.
Substantially all of our accounts receivable for natural gas and oil sales result from billings to third parties in the energy industry. This concentration of customers and joint interest owners may impact our overall credit risk in that these entities may be similarly affected by changes in economic and other conditions. In addition, our natural gas and oil derivative arrangements expose us to credit risk in the event of nonperformance by counterparties. In the event one or more of our customers or counterparties fails to meet its contractual obligations, our business, financial condition and results of operations could be materially and adversely affected.
Our exploration and development operations require substantial capital and we may be unable to obtain needed capital on satisfactory terms, which could lead to a loss of properties and a decline in our natural gas and oil reserves.
We make and expect to continue to make substantial capital expenditures in our business and operations for the exploration, development and acquisition of natural gas and oil reserves. Our cash flow from operations and access to capital are subject to a number of variables, including:
| | • | | the level of natural gas and oil we are able to produce from existing wells; |
| | • | | the prices at which natural gas and oil are sold; and |
| | • | | our ability to acquire, locate and produce new reserves. |
If our revenue decreases as a result of lower natural gas and oil prices, operating difficulties, declines in reserves or for any other reason, we may have insufficient cash flow or access to capital to sustain our operations at current or planned levels. As of September 15, 2006, we had $1.6 million available for additional borrowings under our revolving credit facility and $15.0 million available for additional borrowings under our acquisition facility. Therefore, prior to the consummation of this offering and the application of the net proceeds therefrom, we are limited in our ability to use our credit facility and must rely almost entirely on our cash flow from operations to meet our additional capital expenditure requirements. Additionally, a decline in the condition of the capital markets, a substantial rise in interest rates or other factors could adversely affect the availability or terms of additional financing. If cash generated by operations is not sufficient to meet our capital requirements, our failure to obtain additional financing could require us to curtail our exploration and development activities, which in turn could lead to a possible loss of properties and a decline in our natural gas and oil reserves.
Our failure to achieve and maintain effective internal control over financial reporting in accordance with the rules of the SEC could harm our business, financial condition and results of operations and/or result in a loss of investor confidence in our financial reports, which could have a material adverse effect on us and our stock price.
We are in the process of evaluating our internal controls systems to allow management to report on, and our independent auditors to audit, our internal controls over financial reporting. We will be performing the system and process evaluation and testing (and any necessary remediation) required to comply with the management certification and auditor attestation requirements of Section 404 of the Sarbanes-Oxley Act of 2002. Under the current rules, we will be required to comply with Section 404 for the year ending December 31, 2007. However, we cannot be certain as to the timing of completion of our evaluation, testing and remediation actions or the impact of the same on our operations. Furthermore, upon completion of this process, we may identify control
21
deficiencies of varying degrees of severity under applicable SEC and Public Company Accounting Oversight Board rules and regulations that remain unremediated. As a public company, we will be required to report, among other things, control deficiencies that constitute a “material weakness” or changes in internal controls that, or that are reasonably likely to, materially affect internal controls over financial reporting. A “material weakness” is a significant deficiency or combination of significant deficiencies that results in more than a remote likelihood that a material misstatement of the annual or interim consolidated financial statements will not be prevented or detected. If we fail to implement the requirements of Section 404 in a timely manner, we might be subject to sanctions or investigation by regulatory authorities such as the SEC. In addition, failure to comply with Section 404 or the reporting of a material weakness may cause investors to lose confidence in our consolidated financial statements, and our stock price may be adversely affected as a result. If we fail to remedy any material weakness, our consolidated financial statements may be inaccurate, we may face restricted access to the capital markets and our stock price may be adversely affected.
Risks Related to this Offering and Our Common Stock
The Jefferies Investors have relationships with us that may present conflicts of interest.
In connection with this offering and the Recapitalization, The Jefferies Investors anticipate receiving approximately $ million of the net proceeds of this offering and shares of our common stock in exchange for the cancellation of certain indebtedness and securities held by them. Jefferies & Company, Inc. is an underwriter participating in this offering and, in such capacity, will receive an underwriting discount with respect to shares purchased by it from us in this offering. These circumstances may present conflicts of interest because The Jefferies Investors may have an interest in the successful completion of this offering and the Recapitalization in addition to the underwriting discounts Jefferies & Company Inc. expects to receive. In addition, persons associated with The Jefferies Investors are serving as our directors. Please read “Use of Proceeds,” “Recapitalization,” “Principal Stockholders” and “Related Party Transactions” for a more complete description of the interests of The Jefferies Investors in this offering and the Recapitalization.
We have significant stockholders with the ability to influence our actions.
On a pro forma as adjusted basis giving effect to this offering, the application of the net proceeds therefrom and the Recapitalization, The Jefferies Investors will beneficially own % of our common stock. The interests of The Jefferies Investors may differ from other stockholders, and The Jefferies Investors may vote their interests in a manner that may adversely affect other stockholders. In addition, of our directors are affiliated with The Jefferies Investors. Through their direct and indirect interests in us, The Jefferies Investors will be in a position to influence the outcome of matters requiring a stockholder vote. This concentrated ownership makes it less likely that any other holder or group of holders of common stock will be able to affect the way we are managed or the direction of our business. These factors also may delay or prevent a change in our management or voting control.
We will renounce any interest in specified business opportunities, and our non-employee directors generally will have no obligation to offer us those opportunities.
Our amended and restated certificate of incorporation will provide that if an opportunity in our line of business is presented to any of our non-employee directors:
| | • | | they will have no obligation to communicate or present the opportunity to us; |
| | • | | they will not breach any fiduciary duty to us merely because they or their affiliates pursue or acquire the opportunity; and |
| | • | | they and their affiliates may pursue the opportunity as that entity or individual sees fit, |
unless it was presented to such director solely in that person’s capacity as our director or is identified by such director or such director’s affiliates solely through the disclosure of information by or on behalf of us.
22
Our amended and restated certificate of incorporation also will permit our non-employee directors and their affiliates to engage or invest in businesses that compete with ours. Accordingly, these persons may, and in some cases of which we are aware, do engage in business activities with or invest in competing companies. We will renounce any interest in any such business activities or ventures.
These provisions of our amended and restated certificate of incorporation will be permitted to be amended only by an affirmative vote of holders of at least a majority of our total voting power. As a result of these provisions, conflicts of interest could arise between us and our significant stockholders, such as The Jefferies Investors, who are affiliated with our non-employee directors, concerning competitive business activities or business opportunities, and these conflicts could materially and adversely affect our future competitive position and growth potential.
There has been no active trading market for our common stock, and an active trading market may not develop.
Prior to this offering, there has been no public market for our common stock. An active trading market may not develop for our common stock, which may make it more difficult for you to sell your shares. As described in the section of this prospectus entitled “Underwriting,” negotiations between the underwriters and us will determine the initial public offering price, which may not be indicative of the price at which our common stock will trade following the completion of this offering. You may not be able to resell your shares at or above the initial public offering price.
If our stock price fluctuates after the initial public offering, you could lose a significant part of your investment.
The stock market has experienced extreme price and volume fluctuations that have had a significant effect on the market price of securities issued by many companies for reasons unrelated to the operating performance of these companies. The market price of our common stock could similarly be subject to wide fluctuations in response to a number of factors, most of which we cannot control, including:
| | • | | changes in securities analysts’ recommendations and their estimates of our future financial performance; |
| | • | | fluctuations in broader stock market prices and volumes, particularly among securities of natural gas and oil exploration and development companies; |
| | • | | additions or departures of personnel, including key personnel; |
| | • | | commencement of, or our involvement in, significant litigation; |
| | • | | announcements by us or our competitors of significant business developments; |
| | • | | future issuances of our common stock; |
| | • | | supplies and prices of and demand for natural gas and oil; and |
| | • | | general market and economic factors. |
The realization of any of these risks and other factors, whether beyond or within our control, could cause the market price of our common stock to decline significantly.
Provisions in our amended and restated certificate of incorporation, amended and restated bylaws and Delaware law may delay or prevent our acquisition by a third party.
Certain provisions of Delaware law, our amended and restated certificate of incorporation and our amended and restated bylaws will have the effect of discouraging, delaying or preventing transactions that involve an actual or threatened change in control of our company. For example, our amended and restated certificate of incorporation and bylaws will include provisions for a staggered board of directors, board authority to fill vacancies on our board of directors and to issue preferred stock, and advance notice provisions for stockholders
23
to nominate directors or propose business to be considered at a stockholders’ meeting. In addition, our amended and restated certificate of incorporation and amended and restated bylaws will not permit our stockholders to call a special meeting of stockholders or to remove directors except for cause.
Future sales of substantial shares of our common stock may affect its market price.
After this offering and the consummation of the Recapitalization, we will have outstanding shares of common stock. Of these shares, shares (or shares if the underwriters exercise in full their option to purchase additional shares of our common stock) will be freely tradable without restriction under the Securities Act, except for any shares purchased, acquired or held by our “affiliates” as defined in Rule 144 under the Securities Act. All of the other shares outstanding (a total of shares) are “restricted securities” within the meaning of Rule 144 under the Securities Act. Holders of shares of our common stock have agreed not to sell shares of our common stock for a period of 180 days after this offering. However, the representatives of our underwriters may waive this restriction to allow sales of any number of shares at any time. Certain holders of our shares will also have demand registration rights for four separate registrations beginning 185 days after the registration of our common stock under the Exchange Act and specified piggyback registration rights, in each case in accordance with a registration rights agreement that we have entered into with these holders. See “Related Party Transactions—Registration Rights.”
Sales of a substantial number of shares of our common stock in the public market after this offering or the perception that these sales may occur could cause the market price of our common stock to decline. See “Shares Eligible for Future Sale” for a more detailed description of possible future sales of common stock.
We do not intend to pay, and are effectively limited in our ability to pay, dividends on our common stock.
We expect to retain all future earnings and other cash resources for the future operation and development of our business. Accordingly, we do not intend to declare or pay any dividends on our common stock in the foreseeable future. Our credit facility contains restrictions on the payment of dividends by the operating subsidiaries of Ascent Energy Inc. and by our Parent. Our operating subsidiaries and our Parent are only permitted to pay cash dividends if certain financial tests are satisfied, our then outstanding borrowings do not exceed our borrowing base and no default under our credit facility exists or is anticipated as a result of payment of the dividend. Because Ascent Energy Inc. is a holding company and depends on its subsidiaries for cash flow, the restrictions in our credit facility on our subsidiaries’ ability to pay dividends may, in turn, limit the ability of Ascent Energy Inc. to pay dividends on its capital stock. Therefore, our ability to declare and pay dividends on our common stock is effectively limited by the terms of our credit facility and may be restricted by other loan agreements we may enter into from time to time, and is subject to the provisions of Delaware law. Any future decision to pay a dividend on our common stock and the amount of any dividend paid, if permitted, will be made at the discretion of our board of directors after taking into account many factors, including our operating results, financial condition and cash needs. As a result, any return on your investment in shares of our common stock will depend on the market price of our common stock.
You will be immediately diluted by $ per share of common stock you purchase in this offering.
Our net tangible book value as of June 30, 2006, after giving effect to adjustments relating to this offering and the Recapitalization, would have been approximately $ million, or $ per share of common stock. Based on our net tangible book value and the initial public offering price of $ per share, you will experience an immediate dilution of $ for each share of common stock that you purchase in this offering. Please read “Dilution.”
24
CAUTIONARY STATEMENT CONCERNING FORWARD-LOOKING STATEMENTS
This prospectus contains forward-looking statements, within the meaning of Section 27A of the Securities Act and Section 21E of the Securities Exchange Act of 1934, as amended, or the Exchange Act, that are subject to a number of risks and uncertainties, many of which are beyond our control, which may include statements about our:
| | • | | business and financial strategy; |
| | • | | drilling prospects, inventories, projects and programs; |
| | • | | natural gas and oil reserves; |
| | • | | realized natural gas and oil prices; |
| | • | | lease operating expenses, general and administrative expenses and exploration and other expenses; |
| | • | | marketing of natural gas and oil; |
| | • | | competition and government regulation; |
| | • | | general economic conditions; |
| | • | | future operating results; and |
| | • | | plans, objectives, expectations and intentions. |
All of these types of statements, other than statements of historical fact included in this prospectus, are forward-looking statements. These forward-looking statements may be found in the “Summary,” “Risk Factors,” “Management’s Discussion and Analysis of Financial Condition and Results of Operations,” “Business and Properties” and other sections of this prospectus. In some cases, you can identify forward-looking statements by terminology such as “may,” “could,” “should,” “expect,” “plan,” “project,” “intend,” “anticipate,” “believe,” “estimate,” “predict,” “potential,” “pursue,” “target” or “continue,” the negative of such terms or other comparable terminology.
The forward-looking statements contained in this prospectus are largely based on our expectations, which reflect estimates and assumptions made by our management. These estimates and assumptions reflect our best judgment based on currently known market conditions and other factors. Although we believe such estimates and assumptions to be reasonable, they are inherently uncertain and involve a number of risks and uncertainties that are beyond our control. In addition, management’s assumptions about future events may prove to be inaccurate. Management cautions all readers that the forward-looking statements contained in this prospectus are not guarantees of future performance, and such statements may not be realized and the forward-looking events and circumstances may not occur. Actual results may differ materially from those anticipated or implied in the forward-looking statements due to the factors listed in the “Risk Factors” section and elsewhere in this prospectus. All forward-looking statements speak only as of the date on the front cover of this prospectus. We do not intend to publicly update or revise any forward-looking statements as a result of new information, future events or otherwise. These cautionary statements qualify all forward-looking statements attributable to us or persons acting on our behalf.
25
USE OF PROCEEDS
We estimate that the net proceeds from this offering, after deducting underwriting discounts and estimated offering expenses payable by us, will be approximately $ million ($ million if the underwriters’ option to purchase additional shares of our common stock is fully exercised), based on an assumed initial public offering price of $ per share. A $1.00 increase (decrease) in the assumed initial public offering price of $ per share would increase (decrease) the net proceeds to us from the offering by $ million, assuming no change in the number of shares offered by us as set forth on the front cover of this prospectus and after deducting underwriting discounts and estimated offering expenses payable by us. We intend to use the net proceeds of this offering:
| | • | | to repay $ million of indebtedness outstanding under our credit facility; |
| | • | | to repay in full $ million of indebtedness outstanding under our senior notes; |
| | • | | to repay $ million of indebtedness outstanding under our senior subordinated notes; |
| | • | | to pay $ million of cash bonuses to employees participating in the Incentive Issuance, as further described in “Recapitalization;” |
| | • | | to pay $ million in cash in lieu of fractional shares pursuant to a reverse stock split of the Parent’s common stock to be effected in connection with the Parent Merger, as further described in “Recapitalization;” and |
| | • | | $ million for general corporate purposes, which could include refinancing some of our derivative arrangements. |
The Jefferies Investors, including Jefferies & Company, Inc., one of the underwriters in this offering, are holders of our senior notes and our senior subordinated notes and therefore are expected to receive a portion of the net proceeds of this offering and shares of common stock in connection with this offering and the Recapitalization. In addition, affiliates of certain of the underwriters in this offering are lenders under our credit facility and accordingly are expected to receive a portion of the net proceeds of this offering. See “Principal Stockholders,” “Related Party Transactions—Recapitalization” and “Underwriting.”
As of June 30, 2006, we had approximately $68.2 million outstanding under our credit facility and the interest rate on the outstanding borrowings as of June 30, 2006 was 8.62%. The borrowings outstanding under our credit facility mature in November 2009.
As of June 30, 2006, we had outstanding approximately $36.1 million of indebtedness under our senior notes. The senior notes bear interest at a rate of 16% per annum, which is payable in the form of additional senior notes. The senior notes are due and payable on February 1, 2010 unless automatically extended in accordance with their terms, but in no event later than February 1, 2015. The indebtedness under the senior notes was incurred in November 2005 in exchange for other senior notes that had been issued in connection with our 2004 financial restructuring. Those senior notes were issued in exchange for certain promissory notes issued in 2003 for short term liquidity needs.
As of June 30, 2006, we had outstanding approximately $105.1 million of indebtedness under our senior subordinated notes. The senior subordinated notes bear interest at a rate of 11 3/4% per annum, which is payable in the form of additional senior subordinated notes. The senior subordinated notes are due and payable on May 1, 2011 unless automatically extended in accordance with their terms, but in no event later than May 1, 2015. The indebtedness under the senior subordinated notes was incurred in November 2005 in exchange for other senior subordinated notes that had been issued in connection with our 2004 financial restructuring. Those senior subordinated notes were issued in exchange for certain senior notes issued in 2001 in connection with the acquisition of our south Texas properties.
26
We have granted the underwriters an option to purchase up to an additional shares of common stock within 30 days following the date of this prospectus. The holders of our senior subordinated notes have agreed that we may delay the issuance in the Debt Exchange of up to shares of our common stock, which is % of the number of shares subject to the underwriters’ option to purchase additional shares of our common stock, until the expiration of the underwriters’ 30-day option period. If the underwriters exercise their option to purchase additional shares of our common stock, then the number of shares issued in the Debt Exchange will be correspondingly reduced by a number of shares equal to the net proceeds to us from the underwriters’ exercise of their option to purchase additional shares of our common stock divided by the per share price offered to the public.
Our executive officers are expected to participate in the Incentive Issuance and to receive a portion of the net proceeds of this offering and shares of our common stock in connection with this offering and the Recapitalization. See “Management—Termination of 2005 Incentive Plan,” “Related Party Transactions—Termination of 2005 Incentive Plan” and “Principal Stockholders.”
DIVIDEND POLICY
We do not expect to declare or pay cash dividends or make any other distributions on our common stock in the foreseeable future. We expect to retain our future earnings, if any, for use in the operation and expansion of our business, including exploration, development and acquisition activities. Any future determination to pay dividends will be at the discretion of our board of directors and will depend on our financial condition, results of operations, capital requirements and such other factors as our board of directors deems relevant. In addition, our credit facility contains restrictions on the payment of dividends by the operating subsidiaries of Ascent Energy Inc. and our Parent. Our operating subsidiaries and our Parent are only permitted to pay cash dividends if certain financial tests are satisfied, our then outstanding borrowings do not exceed our borrowing base and no default under our credit facility exists or is anticipated as a result of payment of the dividend. Because Ascent Energy Inc. is a holding company and depends on its subsidiaries for cash flow, the restrictions in our credit facility on our operating subsidiaries’ ability to pay dividends may, in turn, limit the ability of Ascent Energy Inc. to pay dividends on its capital stock. Therefore, our ability to declare and pay future dividends on our common stock is effectively limited by our credit facility, may be restricted by other loan agreements we may enter into from time to time, and is subject to the provisions of Delaware law.
RECAPITALIZATION
Immediately prior to the sale of our shares in this offering, we intend to consummate a corporate recapitalization involving the following transactions:
Parent Merger.We will merge an indirect wholly owned subsidiary of Ascent Energy Inc. with and into our Parent, with our Parent surviving the Parent Merger, in a tax-free transaction. Upon consummation of the Parent Merger, our Parent will be a wholly owned subsidiary of Ascent Energy Inc. In the Parent Merger:
| | • | | each share of common stock of the Parent outstanding prior to the Parent Merger will be converted into shares of our common stock, or an aggregate of shares of our common stock; and |
| | • | | each warrant to purchase shares of common stock of our Parent outstanding prior to the Parent Merger will be converted into a warrant to purchaseshares of our common stock, based on the ratio at which shares of the Parent common stock are converted into shares of our common stock. We refer to these converted warrants as the “Merger Warrants.” In connection with the Recapitalization, certain of the Merger Warrants will be surrendered to Ascent Energy Inc. and cancelled in exchange for an aggregate cash payment of $ . Any Merger Warrants not so surrendered will expire on January 14, 2007, unless earlier exercised by the holders thereof. |
Immediately prior to the consummation of the Parent Merger, our Parent will effect a -for-1 reverse stock split of its common stock. We intend to use a portion of the net proceeds of this offering to pay cash in lieu of fractional shares to holders of our Parent’s common stock in connection with this reverse stock split. See “Use of Proceeds.”
The primary purpose of the Parent Merger is to simplify our capital structure with the result that Ascent Energy Inc., the issuer in this offering, will become our parent company. In July 2001, our Parent contributed to Ascent Energy Inc. substantially all of its assets and liabilities. The contribution was accounted for using
27
reorganization accounting for entities under common control which requires retroactive restatement of all periods presented as if the contribution had occurred at the beginning of the earliest period. Our financial information presented in this prospectus therefore includes the assets and liabilities of the Parent prior to the contribution. As of June 30, 2006, the shares of common stock of Ascent Energy Inc. held by our Parent constituted substantially all of our Parent’s assets.
A copy of the agreement and plan of merger pursuant to which we expect to consummate the Parent Merger is filed as an exhibit to the registration statement of which this prospectus forms a part.
The following chart shows our simplified organizational structure before the Parent Merger:
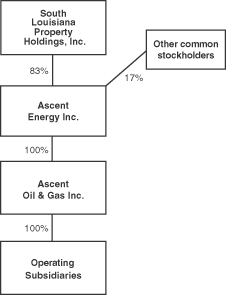
The following chart shows our simplified organizational structure immediately following the Parent Merger:
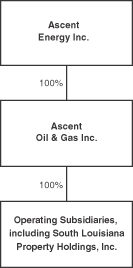
28
Debt Exchange. We intend to issue an aggregate of up to shares of our common stock (subject to reduction as discussed below), at the per share price offered to the public, in repayment of approximately $ million of our senior subordinated notes in a transaction we refer to as the “Debt Exchange.” However, we intend to use the net proceeds, if any, of the underwriters’ exercise of their option to purchase additional shares of our common stock to repay indebtedness under our senior subordinated notes in lieu of issuing shares of our common stock in the Debt Exchange. The holders of our senior subordinated notes have agreed that we may delay the issuance in the Debt Exchange of up to shares of our common stock, which is % of the number of shares subject to the underwriters’ option to purchase additional shares of our common stock, until the expiration of the underwriters’ 30-day option period. If the underwriters exercise their option to purchase additional shares of our common stock, then the number of shares issued in the Debt Exchange will be correspondingly reduced by a number of shares equal to the net proceeds to us from the underwriters’ exercise of their option to purchase additional shares of our common stock divided by the per share price offered to the public. As a result of the repayment of a portion of our senior subordinated notes in cash with a portion of the net proceeds of this offering and the satisfaction in shares of common stock of the remainder of our senior subordinated notes in the Debt Exchange, all of our senior subordinated notes will be extinguished.
Preferred Exchange. The holders of our outstanding warrants to purchase shares of Series A preferred stock will exercise those warrants in a net share exercise (or by tendering shares of our common stock) in exchange for shares of Series A preferred stock and warrants to purchase shares of our common stock at a purchase price of $ per share. Thereafter, we will issue an aggregate of shares of our common stock in exchange for all of our outstanding shares of Series A preferred stock (including accrued but unpaid dividends thereon) and all of our outstanding warrants to purchase shares of our common stock (other than the Merger Warrants) at an exchange ratio of shares of our common stock for each $1,000 of Series A preferred stock (including accrued but unpaid dividends thereon) in a transaction we refer to as the “Preferred Exchange.” All such warrants to purchase shares of our common stock are substantially out-of-the-money and will be cancelled in connection with the Preferred Exchange.
Incentive Issuance. In May 2005, we adopted our 2005 Incentive Plan, which provides for aggregate awards of up to 13.5% of the amount by which the present value of the consideration payable to Ascent or its securityholders in connection with a defined sale of our company exceeds our consolidated funded debt, as defined in the plan. As of September 15, 2006, awards providing for 12.8% of that amount had been granted under the plan. As of September 15, 2006, no amounts were payable to the participants under the 2005 Incentive Plan and no amounts will be payable to the participants unless and until a defined sale occurs under the 2005 Incentive Plan. In connection with and immediately prior to the closing of this offering, we intend to terminate our 2005 Incentive Plan. Participants in the 2005 Incentive Plan will receive cash bonuses and awards of restricted stock, which vest over a three year period, in exchange for terminating their rights under the 2005 Incentive Plan. We refer to this exchange as the “Incentive Issuance.” At the mid-point of the proposed offering range, the Incentive Issuance will be $ million in aggregate, of which $ million will be in the form of a cash bonus and $ million in the form of restricted stock awarded under our 2006 Long-Term Incentive Plan ( shares valued at the mid-point of the proposed offering range). The entire $ million Incentive Issuance is expected to be taxable to the recipients in this tax year. The cash bonus portion of the Incentive Issuance is intended to approximate the recipients’ related income tax liability. Because the entire Incentive Issuance is a taxable transaction, the recipients will not have income tax liability in the future merely as a result of the vesting of the restricted stock and will therefore not have to consider selling their shares to pay income taxes upon vesting. The terms of the 2005 Incentive Plan prohibit us from canceling or modifying an existing award without the consent of the affected holder; therefore, each of the holders of awards under our 2005 Incentive Plan must consent to this exchange in order to terminate all prior awards under our 2005 Incentive Plan. We have received the consent of % of the participants in the 2005 Incentive Plan. The Incentive Issuance is contingent on the consummation of this offering and the Recapitalization and the consent of each of the holders of awards under our 2005 Incentive Plan.
29
Upon the consummation of this offering, the application of the net proceeds of this offering as described in “Use of Proceeds” and the consummation of the Recapitalization, all of our senior notes and senior subordinated notes will be extinguished and our outstanding long-term indebtedness will consist solely of approximately $ million of borrowings under our credit facility which mature November 1, 2009. The following table shows our capitalization as of June 30, 2006 on an actual basis and on a pro forma as adjusted basis giving effect to the Recapitalization and this offering as further described in “Use of Proceeds:”
| | | | | | | |
| | | As of June 30, 2006 |
| | | Actual | | | Pro Forma
As Adjusted |
| | | (in thousands) |
Long-term debt and accrued dividends: | | | | | | | |
Credit facility | | $ | 68,215 | | | $ | |
Senior notes | | | 36,053 | | | | — |
Senior subordinated notes | | | 105,141 | | | | |
Series A preferred stock accrued dividends | | | 14,496 | | | | — |
Interest payable (1) | | | 3,020 | | | | |
| | | | | | | |
Total long-term debt and accrued dividends | | $ | 226,925 | | | $ | |
Stockholders’ (deficit) equity: | | | | | | | |
Series A preferred stock | | | 40,160 | | | | — |
Common stock | | | 6 | | | | |
Additional paid-in capital (2) | | | 23,610 | | | | |
Accumulated deficit | | | (138,572 | ) | | | |
| | | | | | | |
Total stockholders’ (deficit) equity (2) | | | (74,796 | ) | | | |
| | | | | | | |
Total capitalization (2) | | $ | 153,425 | | | $ | |
| | | | | | | |
| (1) | Represents accrued but unpaid interest on the senior notes and the senior subordinated notes, which interest is payable in the form of additional notes. |
| (2) | A $1.00 increase (decrease) in the assumed initial public offering price of $ per share would increase (decrease) each of cash and cash equivalents, additional paid-in capital, total stockholders’ (deficit) equity and total capitalization by $ million, assuming no change in the number of shares offered by us as set forth on the front cover of this prospectus and after deducting underwriting discounts and commissions and estimated offering expenses payable by us. |
You should read this information in conjunction with “Selected Consolidated Historical Financial Information,” “Management’s Discussion and Analysis of Financial Condition and Results of Operations” and our historical and pro forma consolidated financial statements and the related notes appearing elsewhere in this prospectus.
The Jefferies Investors and The TCW Funds are the principal holders of our securities and are expected to receive cash and shares of our common stock in connection with this offering and the Recapitalization. Please see “Use of Proceeds,” “Related Party Transactions” and “Principal Stockholders.”
Our executive officers are expected to participate in the Incentive Issuance and to receive a portion of the net proceeds of this offering and shares of our common stock in connection with this offering and the Recapitalization. See “Management—Termination of 2005 Incentive Plan,” “Related Party Transactions—Termination of 2005 Incentive Plan” and “Principal Stockholders.”
We have entered into an agreement with the holders of our outstanding senior subordinated notes, Series A preferred stock, warrants to purchase shares of our common stock and warrants to purchase shares of Series A preferred stock and certain holders of outstanding warrants to purchase shares of common stock of our Parent pursuant to which certain transactions contemplated by the Recapitalization will be consummated. A copy of the recapitalization agreement is filed as an exhibit to the registration statement of which this prospectus forms a part. The parties to the recapitalization agreement have agreed that all payments of cash by Ascent Energy Inc. and all deliveries of common stock or other securities of Ascent Energy Inc. in satisfaction of or in respect of the securities of Ascent Energy Inc. or our Parent that are being repaid, satisfied, exchanged or surrendered in
30
connection with this offering or pursuant to the recapitalization agreement, including, without limitation, the senior notes, senior subordinated notes, Series A preferred stock, common stock warrants, preferred stock warrants and Merger Warrants shall be made in accordance with the relative rankings, preferences and priorities of such securities and in no event shall the holders of our common stock immediately prior to the consummation of this offering and the transactions contemplated by the recapitalization agreement own, immediately after the consummation of this offering and the transactions contemplated by the recapitalization agreement, less than a de minimis amount of our outstanding common stock. The consummation of the transactions contemplated by the recapitalization agreement are conditioned on the consummation of this offering and the other closing conditions set forth in the recapitalization agreement.
31
CAPITALIZATION
The following table sets forth our cash and capitalization as of June 30, 2006:
| | • | | on an actual basis, other than share amounts which give pro forma effect to the reverse stock split; and |
| | • | | on a pro forma as adjusted basis giving effect to the Recapitalization, the sale of the shares of our common stock in this offering at an assumed initial public offering price of $ per share and the anticipated use of the net proceeds therefrom as described under “Use of Proceeds.” |
You should read this information in conjunction with “Selected Consolidated Historical Financial Information,” “Management’s Discussion and Analysis of Financial Condition and Results of Operations” and our historical and pro forma consolidated financial statements and the related notes appearing elsewhere in this prospectus.
| | | | | | | |
| | | As of June 30, 2006 |
| | | Actual | | | Pro Forma
As Adjusted |
| | | (in thousands) |
Cash and cash equivalents (1) | | $ | 1,296 | | | $ | |
Long-term debt and accrued dividends: | | | | | | | |
Credit facility | | $ | 68,215 | | | $ | |
Senior notes | | | 36,053 | | | | — |
Senior subordinated notes | | | 105,141 | | | | |
Series A preferred stock accrued dividends | | | 14,496 | | | | — |
Interest payable (2) | | | 3,020 | | | | |
| | | | | | | |
Total long-term debt and accrued dividends | | $ | 226,925 | | | $ | |
Stockholders’ (deficit) equity: | | | | | | | |
Series A preferred stock, $0.001 par value; 44,100 shares authorized, shares issued and outstanding pro forma for the reverse stock split; no shares issued and outstanding, pro forma as adjusted | | | 40,160 | | | | — |
Common stock, $0.001 par value; 20,000,000 shares authorized, shares issued and outstanding pro forma for the reverse stock split; shares authorized, shares issued and outstanding, pro forma as adjusted | | | 6 | | | | |
Additional paid-in capital (1) | | | 23,610 | | | | |
Accumulated deficit | | | (138,572 | ) | | | |
| | | | | | | |
Total stockholders’ (deficit) equity (1) | | | (74,796 | ) | | | |
| | | | | | | |
Total capitalization (1) | | $ | 153,425 | | | $ | |
| | | | | | | |
| (1) | A $1.00 increase (decrease) in the assumed initial public offering price of $ per share would increase (decrease) each of cash and cash equivalents, additional paid-in capital, total stockholders’ (deficit) equity and total capitalization by $ million, assuming no change in the number of shares offered by us as set forth on the front cover of this prospectus and after deducting underwriting discounts and estimated offering expenses payable by us. |
| (2) | Represents accrued but unpaid interest on the senior notes and the senior subordinated notes, which interest is payable in the form of additional notes. |
32
DILUTION
The net tangible book value per share of our common stock is the difference between our tangible assets and our liabilities, divided by the number of shares of our common stock outstanding. For investors in our common stock, dilution is the per share difference between the initial public offering price of the common stock in this offering and the net tangible book value of our common stock immediately after completing this offering and the Recapitalization. Dilution results from the fact that the per share offering price of the common stock is substantially in excess of the book value per share attributable to our existing stockholders prior to this offering and the Recapitalization.
As of June 30, 2006, our net tangible book value was approximately $ million, or $ per share of common stock, based on shares of common stock outstanding.
After giving effect to the sale of common stock offered by this prospectus, the receipt of the estimated net proceeds, after deducting underwriting discounts and estimated offering expenses payable by us, and the Recapitalization, our net tangible book value as of June 30, 2006 would have been $ per share of common stock. This represents an immediate and substantial increase in the net tangible book value of $ per share to existing stockholders and an immediate dilution of $ per share, resulting from the difference between the initial public offering price and the net tangible book value after this offering and the Recapitalization, to new investors purchasing common stock in this offering. The following table illustrates the per share dilution to new investors purchasing common stock in this offering:
| | | |
Assumed initial public offering price per share of common stock | | $ | |
| | | |
Net tangible book value per share of common stock as of June 30, 2006 | | | |
Increase in pro forma net tangible book value per share of common stock attributable to investors in this offering | | | |
Net tangible book value per share of common stock after this offering and the Recapitalization | | | |
| | | |
Dilution per share to new investors | | $ | |
| | | |
A $1.00 increase (decrease) in the assumed initial public offering price of $ per share would increase (decrease) our net tangible book value by $ million, the net tangible book value per share, after giving effect to this offering and the Recapitalization, by $ per share and the dilution in net tangible book value per share to new investors in this offering by $ per share, assuming no change in the number of shares offered by us as set forth on the front cover of this prospectus, and after deducting the estimated underwriting discounts and estimated offering expenses payable by us.
The following table summarizes, as of June 30, 2006, the differences between existing stockholders and the new investors with respect to the number of shares of common stock purchased from us, the total consideration paid and the average price per share paid before deducting the underwriting discounts and our estimated offering expenses payable by us, assuming an initial public offering price of $ per share.
| | | | | | | | | | | | |
| | | Shares Purchased | | Total Consideration | | Average Price
per Share |
| | | Number | | Percent | | Amount | | Percent | |
Existing stockholders | | | | % | | $ | | | % | | $ | |
New investors | | | | | | | | | | | | |
| | | | | | | | | | | | |
Total | | | | % | | $ | | | % | | $ | |
| | | | | | | | | | | | |
A $1.00 increase (decrease) in the assumed initial public offering price of $ per share would increase (decrease) total consideration paid by new investors, total consideration paid by all stockholders and the average price per share paid by all stockholders by $ million, $ million and $ million, respectively, assuming no change in the number of shares offered by us as set forth on the front cover of this prospectus, and without deducting underwriting discounts and estimated offering expenses payable by us.
33
UNAUDITED PRO FORMA CONDENSED CONSOLIDATED FINANCIAL STATEMENTS
The following unaudited pro forma condensed consolidated financial statements give effect to the Recapitalization, this offering and the application of the net proceeds of this offering as described under “Use of Proceeds.” The unaudited pro forma condensed consolidated balance sheet as of June 30, 2006 assumes that the Recapitalization, this offering and the application of the net proceeds from this offering occurred on June 30, 2006. The unaudited pro forma condensed consolidated statements of operations for the year ended December 31, 2005 and for the six months ended June 30, 2005 and June 30, 2006 assumes that the Recapitalization, this offering and the application of the net proceeds from this offering occurred on January 1, 2005. Adjustments for the Recapitalization and this offering are described in the accompanying notes to the unaudited pro forma condensed consolidated financial statements. Please read the accompanying notes to the unaudited pro forma condensed consolidated financial statements for further explanation.
The unaudited pro forma condensed consolidated financial statements and accompanying notes should be read together with our historical consolidated financial statements and related notes included elsewhere in this prospectus. The unaudited pro forma condensed consolidated financial statements were derived by adjusting our historical consolidated financial statements. The adjustments are based upon currently available information and certain estimates and assumptions; therefore, the actual effects of the Recapitalization and this offering may differ from the effects reflected in the unaudited pro forma condensed consolidated financial statements. However, management believes that the assumptions used provide a reasonable basis for presenting the significant effects of the Recapitalization and this offering and that the pro forma adjustments give appropriate effect to those assumptions and are properly applied in the unaudited pro forma condensed consolidated financial statements.
The unaudited pro forma condensed consolidated financial statements do not purport to present our financial position or results of operations had the Recapitalization and this offering actually occurred as of the dates indicated. Moreover, they do not project our financial position or results of operations for any future date or period.
34
Ascent Energy Inc.
Unaudited Pro Forma Condensed Consolidated Balance Sheet
As of June 30, 2006
(in thousands)
| | | | | | | | | | |
| | | Historical | | | Adjustments | | Pro Forma |
| ASSETS | | | | | | | | | | |
CURRENT ASSETS: | | | | | | | | | | |
Cash and cash equivalents | | $ | 1,296 | | | $ | | | $ | |
Oil and gas revenue receivable | | | 7,482 | | | | | | | |
Joint interest and other receivables | | | 1,892 | | | | | | | |
Prepaid expenses | | | 496 | | | | | | | |
Fair value of derivatives | | | 1,178 | | | | | | | |
Inventory and other assets | | | 1,273 | | | | | | | |
| | | | | | | | | | |
TOTAL CURRENT ASSETS | | | 13,617 | | | | | | | |
| | | | | | | | | | |
PROPERTY AND EQUIPMENT, at cost: | | | | | | | | | | |
Oil and gas properties, successful efforts method | | | 358,922 | | | | | | | |
Unevaluated oil and gas properties | | | 21,330 | | | | | | | |
Other property and equipment | | | 6,286 | | | | | | | |
| | | | | | | | | | |
| | | 386,538 | | | | | | | |
Less—accumulated depreciation, depletion and amortization | | | (186,525 | ) | | | | | | |
| | | | | | | | | | |
Net property and equipment | | | 200,013 | | | | | | | |
| | | |
OTHER ASSETS: | | | | | | | | | | |
Deferred financing costs | | | 722 | | | | | | | |
Fair value of derivatives | | | 50 | | | | | | | |
Escrowed and restricted funds | | | 657 | | | | | | | |
| | | | | | | | | | |
TOTAL ASSETS | | $ | 215,059 | | | $ | | | $ | |
| | | | | | | | | | |
| | | | | | | | | | |
| LIABILITIES AND STOCKHOLDERS’ (DEFICIT) EQUITY | | | | | | | | | | |
| | | |
CURRENT LIABILITIES: | | | | | | | | | | |
Accounts payable | | $ | 4,404 | | | $ | | | $ | |
Accrued liabilities | | | 8,562 | | | | | | | |
Undistributed oil and gas proceeds | | | 4,588 | | | | | | | |
Interest payable | | | 476 | | | | | | | |
Accrued abandonment cost | | | 1,325 | | | | | | | |
Fair value of derivatives | | | 13,182 | | | | | | | |
| | | | | | | | | | |
TOTAL CURRENT LIABILITIES | | | 32,537 | | | | | | | |
| | | |
LONG-TERM LIABILITIES: | | | | | | | | | | |
Bank credit facility | | | 68,215 | | | | | | | |
Senior notes | | | 36,053 | | | | | | | |
Senior subordinated notes | | | 105,141 | | | | | | | |
Interest payable | | | 3,020 | | | | | | | |
Fair value of derivatives | | | 18,139 | | | | | | | |
Accrued abandonment cost | | | 9,898 | | | | | | | |
Deferred income taxes | | | 2,026 | | | | | | | |
Series A preferred stock accrued dividends | | | 14,496 | | | | | | | |
Commitments and contingencies | | | 330 | | | | | | | |
| | | | | | | | | | |
TOTAL LONG-TERM LIABILITIES | | | 257,318 | | | | | | | |
| | | |
STOCKHOLDERS’ (DEFICIT) EQUITY: | | | | | | | | | | |
Series A preferred stock, par value $0.001 per share | | | 40,160 | | | | | | | |
Common stock, par value $0.001 per share | | | 6 | | | | | | | |
Additional paid-in capital | | | 23,610 | | | | | | | |
Accumulated deficit | | | (138,572 | ) | | | | | | |
| | | | | | | | | | |
| | | | | | | | | | |
TOTAL STOCKHOLDERS’ DEFICIT | | | (74,796 | ) | | | | | | |
| | | | | | | | | | |
TOTAL LIABILITIES AND STOCKHOLDERS’ DEFICIT | | $ | 215,059 | | | $ | | | $ | |
| | | | | | | | | | |
See Notes to Unaudited Pro Forma Condensed Consolidated Financial Statements.
35
Ascent Energy Inc.
Unaudited Pro Forma Condensed Consolidated Statement of Operations
For the Six Months Ended June 30, 2005
(in thousands, except per share data)
| | | | | | | | | | |
| | | Historical | | | Adjustments | | Pro Forma |
REVENUES: | | | | | | | | | | |
Oil | | $ | 15,694 | | | $ | | | $ | |
Natural gas | | | 14,848 | | | | | | | |
NGLs | | | 1,776 | | | | | | | |
| | | | | | | | | | |
TOTAL REVENUES | | | 32,318 | | | | | | | |
| | | | | | | | | | |
COSTS AND EXPENSES: | | | | | | | | | | |
Production and ad valorem taxes | | | 1,731 | | | | | | | |
Lease operating expenses | | | 5,487 | | | | | | | |
General and administrative expenses | | | 3,851 | | | | | | | |
Exploration expenses | | | 444 | | | | | | | |
Depreciation, depletion, and amortization | | | 10,623 | | | | | | | |
Property impairments | | | — | | | | | | | |
Derivative loss | | | 17,983 | | | | | | | |
| | | | | | | | | | |
TOTAL OPERATING EXPENSES | | | 40,119 | | | | | | | |
| | | | | | | | | | |
INCOME FROM OPERATIONS | | | (7,801 | ) | | | | | | |
INTEREST AND OTHER INCOME | | | 78 | | | | | | | |
INTEREST EXPENSE | | | (9,286 | ) | | | | | | |
| | | | | | | | | | |
LOSS BEFORE INCOME TAXES | | | (17,009 | ) | | | | | | |
INCOME TAX BENEFIT | | | 127 | | | | | | | |
| | | | | | | | | | |
NET LOSS | | | (16,882 | ) | | | | | | |
PREFERRED STOCK DIVIDENDS | | | (1,665 | ) | | | | | | |
| | | | | | | | | | |
NET LOSS ATTRIBUTABLE TO COMMON SHARES | | $ | (18,547 | ) | | $ | | | $ | |
| | | | | | | | | | |
NET LOSS PER COMMON SHARE: | | | | | | | | | | |
Basic and diluted net loss per common share | | $ | (3.12 | ) | | | | | $ | |
Basic and diluted net loss per common share, pro forma for reverse stock split | | $ | | | | | | | $ | |
| | | | | | | | | | |
Weighted average shares | | | 5,949 | | | | | | | |
Weighted average shares pro forma for reverse stock split | | | | | | | | | | |
| | | | | | | | | | |
See Notes to Unaudited Pro Forma Condensed Consolidated Financial Statements.
36
Ascent Energy Inc.
Unaudited Pro Forma Condensed Consolidated Statement of Operations
For the Six Months Ended June 30, 2006
(in thousands, except per share data)
| | | | | | | | | | |
| | | Historical | | | Adjustments | | Pro Forma |
REVENUES: | | | | | | | | | | |
Oil | | $ | 19,631 | | | $ | | | $ | |
Natural gas | | | 16,271 | | | | | | | |
NGLs | | | 1,713 | | | | | | | |
| | | | | | | | | | |
TOTAL REVENUES | | | 37,615 | | | | | | | |
| | | | | | | | | | |
COSTS AND EXPENSES: | | | | | | | | | | |
Production and ad valorem taxes | | | 2,231 | | | | | | | |
Lease operating expenses | | | 6,398 | | | | | | | |
General and administrative expenses | | | 5,548 | | | | | | | |
Exploration expenses | | | 818 | | | | | | | |
Depreciation, depletion, and amortization | | | 10,393 | | | | | | | |
Property impairments | | | — | | | | | | | |
Derivative loss | | | 6,725 | | | | | | | |
| | | | | | | | | | |
TOTAL OPERATING EXPENSES | | | 32,113 | | | | | | | |
| | | | | | | | | | |
LOSS FROM OPERATIONS | | | 5,502 | | | | | | | |
INTEREST AND OTHER INCOME | | | 110 | | | | | | | |
INTEREST EXPENSE | | | (11,266 | ) | | | | | | |
| | | | | | | | | | |
LOSS BEFORE INCOME TAXES | | | (5,654 | ) | | | | | | |
INCOME TAX EXPENSE | | | (317 | ) | | | | | | |
| | | | | | | | | | |
NET LOSS | | | (5,971 | ) | | | | | | |
PREFERRED STOCK DIVIDENDS | | | (1,665 | ) | | | | | | |
| | | | | | | | | | |
NET LOSS ATTRIBUTABLE TO COMMON SHARES | | $ | (7,636 | ) | | $ | | | $ | |
| | | | | | | | | | |
NET LOSS PER COMMON SHARE: | | | | | | | | | | |
Basic and diluted net loss per common share | | $ | (1.28 | ) | | | | | $ | |
Basic and diluted net loss per common share, pro forma for reverse stock split | | $ | | | | | | | $ | |
| | | | | | | | | | |
Weighted average shares | | | 5,949 | | | | | | | |
Weighted average shares pro forma for reverse stock split | | | | | | | | | | |
| | | | | | | | | | |
See Notes to Unaudited Pro Forma Condensed Consolidated Financial Statements.
37
Ascent Energy Inc.
Unaudited Pro Forma Condensed Consolidated Statement of Operations
For the Year Ended December 31, 2005
(in thousands, except per share data)
| | | | | | | | | | |
| | | Historical | | | Adjustments | | Pro Forma |
REVENUES: | | | | | | | | | | |
Oil | | $ | 33,228 | | | $ | | | $ | |
Natural gas | | | 36,634 | | | | | | | |
NGLs | | | 3,714 | | | | | | | |
| | | | | | | | | | |
TOTAL REVENUES | | | 73,576 | | | | | | | |
| | | | | | | | | | |
COSTS AND EXPENSES: | | | | | | | | | | |
Production and ad valorem taxes | | | 3,332 | | | | | | | |
Lease operating expenses | | | 11,594 | | | | | | | |
General and administrative expenses | | | 8,436 | | | | | | | |
Exploration expenses | | | 3,460 | | | | | | | |
Depreciation, depletion, and amortization | | | 20,771 | | | | | | | |
Property impairments | | | 1,254 | | | | | | | |
Derivative loss | | | 33,851 | | | | | | | |
| | | | | | | | | | |
TOTAL OPERATING EXPENSES | | | 82,698 | | | | | | | |
| | | | | | | | | | |
LOSS FROM OPERATIONS | | | (9,122 | ) | | | | | | |
INTEREST AND OTHER INCOME | | | 561 | | | | | | | |
INTEREST EXPENSE | | | (19,496 | ) | | | | | | |
| | | | | | | | | | |
LOSS BEFORE INCOME TAXES | | | (28,057 | ) | | | | | | |
INCOME TAX BENEFIT | | | 209 | | | | | | | |
| | | | | | | | | | |
NET LOSS | | | (27,848 | ) | | | | | | |
PREFERRED STOCK DIVIDENDS | | | (3,358 | ) | | | | | | |
| | | | | | | | | | |
NET LOSS ATTRIBUTABLE TO COMMON SHARES | | $ | (31,206 | ) | | $ | | | $ | |
| | | | | | | | | | |
NET LOSS PER COMMON SHARE: | | | | | | | | | | |
Basic and diluted net loss per common share | | $ | (5.25 | ) | | | | | $ | |
Basic and diluted net loss per common share, pro forma for reverse stock split | | $ | | | | | | | $ | |
| | | | | | | | | | |
Weighted average shares | | | 5,949 | | | | | | | |
Weighted average shares pro forma for reverse stock split | | | | | | | | | | |
| | | | | | | | | | |
See Notes to Unaudited Pro Forma Condensed Consolidated Financial Statements.
38
Ascent Energy Inc.
Notes to Unaudited Pro Forma Condensed Consolidated Financial Statements
Note 1: Basis of Presentation, the Offering and the Recapitalization
The historical financial information is derived from our historical consolidated financial statements. The unaudited pro forma condensed consolidated financial statements adjust our historical consolidated financial statements to give effect to the following:
| | • | | A -for-1 reverse stock split of our common stock. |
| | • | | The issuance of shares of our common stock to the public at the initial public offering price of $ per share resulting in aggregate gross proceeds to us of $ million. |
| | • | | The payment of estimated underwriting discounts and offering expenses payable by us of $ million. |
| | • | | The repayment of $ million of borrowings under our credit facility with a portion of the net proceeds of this offering. |
| | • | | The repayment of all $ million of our outstanding senior notes with a portion of the net proceeds of this offering. |
| | • | | The repayment of $ million of our senior subordinated notes with a portion of the net proceeds of this offering. |
| | • | | The issuance of shares of our common stock in connection with the merger of our Parent with a wholly owned subsidiary of Ascent Energy Inc. in a tax-free reorganization that we refer to as the “Parent Merger” and the conversion of warrants to purchase shares of common stock of our Parent into warrants to purchase shares of our common stock in connection with the Parent Merger. We refer to these converted warrants as the “Merger Warrants.” |
| | • | | The issuance of shares of our common stock in exchange for $ million of indebtedness under our senior subordinated notes in a transaction that we refer to as the “Debt Exchange.” The number of shares of our common stock issued in the Debt Exchange is subject to reduction as described below. |
| | • | | The issuance of shares of our Series A preferred stock and warrants to purchase shares of our common stock upon the net share exercise (or tender of shares of our common stock as consideration for the exercise price) of warrants to purchase shares of Series A preferred stock at an exercise price of $ per share. |
| | • | | The issuance of shares of our common stock in exchange for all outstanding shares of our Series A preferred stock (including accrued but unpaid dividends thereon) and all outstanding warrants to purchase shares of our common stock (other than the Merger Warrants) at an exchange ratio of shares of our common stock for each $1,000 of Series A preferred stock (including accrued but unpaid dividends thereon) in a transaction that we refer to as the “Preferred Exchange.” All such warrants to purchase shares of our common stock are substantially out-of-the-money and will be cancelled in connection with the Preferred Exchange. |
| | • | | The payment of $ in exchange for Merger Warrants to purchase shares of our common stock at an exercise price of $ per share. |
| | • | | The payment of $ million of cash bonuses and the award of shares of restricted stock in connection with the surrender of outstanding awards under our 2005 Incentive Plan pursuant to the Incentive Issuance. |
We intend to use the net proceeds, if any, of the underwriters’ exercise of their option to purchase additional shares of our common stock to repay indebtedness under our senior subordinated notes in lieu of issuing shares of our common stock in the Debt Exchange. The holders of our senior subordinated notes have agreed that we may delay the issuance in the Debt Exchange of up to shares of our common stock, which is % of the number of shares subject to the underwriters’ option to purchase additional shares of our common stock, until the expiration of the underwriters’ 30-day option period. If the underwriters exercise their option to purchase additional shares
39
of our common stock, then the number of shares issued in the Debt Exchange will be correspondingly reduced by a number of shares equal to the net proceeds to us from the underwriters’ exercise of their option to purchase additional shares of our common stock divided by the per share price offered to the public.
In addition, subsequent to this offering, we anticipate incurring incremental expenses during the year ended December 31, 2007 of $ million and subsequently at an annual rate of approximately $ million related to being a public company, including our compliance with the Exchange Act and the Sarbanes-Oxley Act of 2002. The unaudited pro forma condensed consolidated financial statements do not include any adjustment for these estimated incremental costs.
Note 2: Pro Forma Adjustments and Assumptions
(a) Reflects estimated gross proceeds of $ million from the issuance and sale of million shares of our common stock to the public, assuming the underwriters do not exercise their option to purchase additional shares of our common stock, at the initial public offering price of $ per share. Also reflects estimated underwriting discounts and other offering expenses of approximately $ million and the application of a portion of the net proceeds of this offering to repay approximately $ million of indebtedness under our credit facility, all $ million of the indebtedness under our senior notes and $ million of indebtedness under our senior subordinated notes.
(b) Reflects net adjustments to compensation expense in the amount of $ million in connection with the exchange of awards under the 2005 Incentive Plan for cash bonuses and awards of restricted stock under the 2006 Long-Term Incentive Plan pursuant to the Incentive Issuance.
(c) Reflects the issuance of shares of Series A preferred stock and warrants to purchase an aggregate of shares of our common stock at a purchase price of $ per share upon the exercise of warrants to purchase shares of our Series A preferred stock at an exercise price of $ per share.
(d) Reflects the issuance of shares of our common stock in the Preferred Exchange in exchange for $ million of Series A preferred stock (including accrued but unpaid dividends thereon) and all outstanding warrants to purchase shares of our common stock (other than the Merger Warrants) at an exchange ratio of shares of our common stock for each $1,000 of Series A preferred stock (including accrued but unpaid dividends thereon) and the cancellation of such warrants, which are substantially out-of-the-money.
(e) Reflects the repayment of $ million of indebtedness under our senior subordinated notes with a portion of the net proceeds of this offering and the issuance of million shares of our common stock in exchange for $ million of indebtedness under our senior subordinated notes in the Debt Exchange at the exchange ratio of $ per share. If the underwriters exercise their option to purchase additional shares of our common stock, then the number of shares issued in exchange for our senior subordinated notes in the Debt Exchange will be correspondingly reduced by a number of shares equal to the net proceeds to us from the underwriters’ exercise of their option to purchase additional shares of our common stock divided by the per share price offered to the public, and the net proceeds from any exercise of such option will be used to repay indebtedness under our senior subordinated notes.
(f) Reflects the change in interest expense resulting from the repayment of $ million under our credit facility and the repayment or exchange for common stock of all $ million of our outstanding senior notes and $ million of our senior subordinated notes in connection with this offering and the Debt Exchange. Interest expense on our credit facility assumes a rate of %.
(g) Reflects the reduction of deferred financing costs resulting from the repayment or exchange for common stock of all $ million of our outstanding senior notes and $ million of our senior subordinated notes in connection with this offering and the Debt Exchange.
(h) Reflects the payment of $ in exchange for Merger Warrants to purchase shares of our common stock at an exercise price of $ per share.
40
SELECTED CONSOLIDATED HISTORICAL FINANCIAL INFORMATION
The following table presents our selected consolidated historical financial information for the periods presented. The selected consolidated historical financial information as of and for each of the five years ended December 31, 2005 has been derived from our audited consolidated financial statements and related notes. The audited consolidated financial statements and related notes as of December 31, 2004 and December 31, 2005 and for each of the three years ended December 31, 2005 are included elsewhere in this prospectus. The selected consolidated historical financial information as of June 30, 2006 and for the six months ended June 30, 2005 and June 30, 2006 has been derived from our unaudited consolidated financial statements and related notes included elsewhere in this prospectus which, in the opinion of management, have been prepared on the same basis as our audited consolidated financial statements and include all adjustments, consisting of normal recurring adjustments, necessary for a fair presentation of this information.
In July 2001, the Parent contributed to Ascent Energy Inc. substantially all of its assets and liabilities. The contribution was accounted for using reorganization accounting for entities under common control which requires retroactive restatement of all periods presented as if the contribution had occurred at the beginning of the earliest period. The information presented below therefore includes the assets and liabilities of the Parent prior to the contribution.
This information is only a summary and you should read it in conjunction with the material contained in “Management’s Discussion and Analysis of Financial Condition and Results of Operations,” which includes a discussion of factors materially affecting the comparability of the information presented, and in conjunction with the financial statements and related notes included elsewhere in this prospectus.
Our audited consolidated financial statements for the years ending prior to December 31, 2005 have been restated to reflect our conversion to the successful efforts method of accounting for our investment in natural gas and oil properties and to correct our previously recorded income tax provision. Our audited consolidated financial statements for the years ended December 31, 2003 and December 31, 2004 have been restated to reflect our previously understated asset retirement obligation.
Prior to the Spring of 2003, we focused on the exploration and development of the reserves we acquired in connection with our formation in 2001. Since joining us in mid-2003, our senior management team has embarked on a strategy to acquire and develop a risk-balanced inventory of high growth opportunities. In order to implement this strategy, our new management initially devoted a substantial portion of its efforts to increasing our liquidity and improving our operational efficiency. In July 2004, we completed a financial restructuring that allowed the operating subsidiaries of Ascent Energy Inc., as borrowers, to enter into a new credit facility and reduced our debt service obligations by permitting us to pay in kind certain interest obligations.
For the foregoing reasons, our selected consolidated historical financial information may not be meaningful or indicative of our future results.
41
| | | | | | | | | | | | | | | | | | | | | | | | | | | | |
| | | Year Ended December 31, | | | Six Months Ended
June 30, | |
| | | 2001 | | | 2002 | | | 2003 | | | 2004 | | | 2005 | | | 2005 | | | 2006 | |
| | | (Restated) | | | (Restated) | | | (Restated) | | | (Restated) | | | | | | (Unaudited) | |
| | | (in thousands, except per share amounts) | |
Statement of Operations Data: | | | | | | | | | | | | | | | | | | | | | | | | | | | | |
Revenues: | | | | | | | | | | | | | | | | | | | | | | | | | | | | |
Oil | | $ | 9,884 | | | $ | 15,924 | | | $ | 20,377 | | | $ | 25,431 | | | $ | 33,228 | | | $ | 15,694 | | | $ | 19,631 | |
Natural gas | | | 11,746 | | | | 25,486 | | | | 24,553 | | | | 22,021 | | | | 36,634 | | | | 14,848 | | | | 16,271 | |
NGLs | | | (13 | ) | | | 1,664 | | | | 2,027 | | | | 3,257 | | | | 3,714 | | | | 1,776 | | | | 1,713 | |
| | | | | | | | | | | | | | | | | | | | | | | | | | | | |
Total | | | 21,617 | | | | 43,074 | | | | 46,957 | | | | 50,709 | | | | 73,576 | | | | 32,318 | | | | 37,615 | |
Expenses: | | | | | | | | | | | | | | | | | | | | | | | | | | | | |
Production and ad valorem taxes | | | 1,422 | | | | 3,508 | | | | 4,307 | | | | 3,091 | | | | 3,332 | | | | 1,731 | | | | 2,231 | |
Lease operating expenses | | | 5,492 | | | | 10,939 | | | | 11,915 | | | | 12,018 | | | | 11,594 | | | | 5,487 | | | | 6,398 | |
General and administrative expenses | | | 5,290 | | | | 4,152 | | | | 10,388 | | | | 8,272 | | | | 8,436 | | | | 3,851 | | | | 5,548 | |
Exploration expenses | | | 100 | | | | 1,370 | | | | 5,630 | | | | 854 | | | | 3,460 | | | | 444 | | | | 818 | |
Depreciation, depletion and amortization | | | 6,922 | | | | 13,039 | | | | 21,539 | | | | 31,207 | | | | 20,771 | | | | 10,623 | | | | 10,393 | |
Property impairments | | | 58,829 | | | | 21 | | | | 3,802 | | | | 20,711 | | | | 1,254 | | | | — | | | | — | |
Derivative loss | | | — | | | | — | | | | — | | | | 6,604 | | | | 33,851 | | | | 17,983 | | | | 6,725 | |
| | | | | | | | | | | | | | | | | | | | | | | | | | | | |
Total operating expenses | | | 78,055 | | | | 33,029 | | | | 57,581 | | | | 82,757 | | | | 82,698 | | | | 40,119 | | | | 32,113 | |
| | | | | | | | | | | | | | | | | | | | | | | | | | | | |
Income (loss) from operations | | | (56,438 | ) | | | 10,045 | | | | (10,624 | ) | | | (32,048 | ) | | | (9,122 | ) | | | (7,801 | ) | | | 5,502 | |
Interest and other income | | | 182 | | | | 438 | | | | 7 | | | | 203 | | | | 561 | | | | 78 | | | | 110 | |
Interest expense | | | (3,707 | ) | | | (11,437 | ) | | | (13,661 | ) | | | (16,958 | ) | | | (19,496 | ) | | | (9,286 | ) | | | (11,266 | ) |
| | | | | | | | | | | | | | | | | | | | | | | | | | | | |
Loss before income taxes | | | (59,963 | ) | | | (954 | ) | | | (24,278 | ) | | | (48,803 | ) | | | (28,057 | ) | | | (17,009 | ) | | | (5,654 | ) |
Income tax benefit (expense) | | | 21,163 | | | | 1,495 | | | | 8,624 | | | | 12,472 | | | | 209 | | | | 127 | | | | (317 | ) |
| | | | | | | | | | | | | | | | | | | | | | | | | | | | |
Income (loss) before cumulative effect of change in accounting principle | | | (38,800 | ) | | | 541 | | | | (15,654 | ) | | | (36,331 | ) | | | (27,848 | ) | | | (16,882 | ) | | | (5,971 | ) |
Cumulative effect of change in accounting principle, net of income tax of $273 in 2003 (1) | | | — | | | | — | | | | 262 | | | | — | | | | — | | | | — | | | | — | |
| | | | | | | | | | | | | | | | | | | | | | | | | | | | |
Net income (loss) | | | (38,800 | ) | | | 541 | | | | (15,392 | ) | | | (36,331 | ) | | | (27,848 | ) | | | (16,882 | ) | | | (5,971 | ) |
Preferred stock dividends (2) | | | (1,168 | ) | | | (3,457 | ) | | | (3,976 | ) | | | (3,367 | ) | | | (3,358 | ) | | | (1,665 | ) | | | (1,665 | ) |
| | | | | | | | | | | | | | | | | | | | | | | | | | | | |
Net loss attributable to common shares | | $ | (39,968 | ) | | $ | (2,916 | ) | | $ | (19,368 | ) | | $ | (39,698 | ) | | $ | (31,206 | ) | | $ | (18,547 | ) | | $ | (7,636 | ) |
| | | | | | | | | | | | | | | | | | | | | | | | | | | | |
Net loss per common share : | | | | | | | | | | | | | | | | | | | | | | | | | | | | |
Basic and diluted net loss per common share | | $ | (8.07 | ) | | $ | (0.59 | ) | | $ | (3.63 | ) | | $ | (6.67 | ) | | $ | (5.25 | ) | | $ | (3.12 | ) | | $ | (1.28 | ) |
Basic and diluted net loss per common share (pro forma for reverse stock split) | | | | | | | | | | | | | | | | | | | | | | | | | | | | |
| | | | | | | |
Selected Cash Flow and Other Financial Data: | | | | | | | | | | | | | | | | | | | | | | | | | | | | |
Net cash provided by operating activities | | $ | 5,149 | | | $ | 4,674 | | | $ | 16,935 | | | $ | 17,369 | | | $ | 31,475 | | | $ | 14,671 | | | $ | 18,281 | |
Net cash used in investing activities | | | (51,662 | ) | | | (27,965 | ) | | | (39,121 | ) | | | (22,584 | ) | | | (35,019 | ) | | | (17,316 | ) | | | (36,490 | ) |
Net cash provided by financing activities | | | 44,856 | | | | 21,251 | | | | 26,236 | | | | 1,650 | | | | 4,108 | | | | 4,550 | | | | 18,425 | |
Capital expenditures | | | 6,993 | | | | 27,965 | | | | 39,121 | | | | 22,985 | | | | 34,588 | | | | 16,296 | | | | 36,554 | |
EBITDAX (3) | | | 30,758 | | | | 22,951 | | | | 20,354 | | | | 28,658 | | | | 37,342 | | | | 17,351 | | | | 18,766 | |
| | | | | | | | | | | | | | | | | | | | | | | | | | | | |
| | | As of December 31, | | | As of June 30, | |
| | | 2001 | | | 2002 | | | 2003 | | | 2004 | | | 2005 | | | 2005 | | | 2006 | |
| | | (Restated) | | | (Restated) | | | (Restated) | | | (Restated) | | | | | | (Unaudited) | |
| | | (in thousands) | |
Balance Sheet Data: | | | | | | | | | | | | | | | | | | | | | | | | | | | | |
Cash and cash equivalents | | $ | 2,072 | | | $ | 31 | | | $ | 4,081 | | | $ | 516 | | | $ | 1,080 | | | $ | 2,421 | | | $ | 1,296 | |
Total assets | | | 148,726 | | | | 178,590 | | | | 200,374 | | | | 169,267 | | | | 187,221 | | | | 179,360 | | | | 215,059 | |
Long-term debt(4) | | | 109,108 | | | | 112,969 | | | | 141,493 | | | | 164,954 | | | | 185,223 | | | | 174,498 | | | | 212,429 | |
Series A preferred stock (including accrued but unpaid dividends) (5) | | | 21,813 | | | | 42,907 | | | | 46,265 | | | | 9,577 | | | | 12,865 | | | | 11,208 | | | | 14,496 | |
Stockholders’ deficit | | | (13,322 | ) | | | (24,340 | ) | | | (40,587 | ) | | | (36,060 | ) | | | (67,196 | ) | | | (54,572 | ) | | | (74,796 | ) |
Total liabilities and stockholders’ deficit | | $ | 148,726 | | | $ | 178,590 | | | $ | 200,374 | | | $ | 169,267 | | | $ | 187,221 | | | | 179,360 | | | | 215,059 | |
| (1) | Reflects adoption of SFAS 143 effective January 1, 2003. |
| (2) | Represents accrued but unpaid dividends on our Series A preferred stock and Series B preferred stock. In August 2003, all outstanding shares of the Series B preferred stock were converted into an aggregate of one million shares of our common stock ( shares of our common stock pro forma for the reverse stock split), and all accrued but unpaid dividends thereon were declared and paid in cash. |
42
| (3) | EBITDAX is a non-GAAP financial measure. See note 3 to “Summary—Summary Consolidated Historical and Pro Forma Financial Information” for additional information about our calculation of EBITDAX and its reconciliation to net cash provided by operating activities, which is the most comparable GAAP financial measure. |
| (4) | Represents borrowings under our credit facility and the aggregate principal amount of outstanding senior notes and senior subordinated notes. Also includes long-term accrued interest on our senior notes and senior subordinated notes as of periods ending on or after December 31, 2004. |
| (5) | The amounts for the years ended December 31, 2001, December 31, 2002 and December 31, 2003 represent the book value of our Series A preferred stock plus all accrued but unpaid dividends thereon. The amount for periods ending on or after December 31, 2004 represent only accrued but unpaid dividends on the Series A preferred stock. In December 2004, the terms of the Series A preferred stock were amended to eliminate our requirement to redeem the outstanding shares of Series A preferred stock on a specified date. The amendment resulted in a balance sheet reclassification of the book value of the Series A preferred stock to stockholders’ deficit. |
43
MANAGEMENT’S DISCUSSION AND ANALYSIS OF
FINANCIAL CONDITION AND RESULTS OF OPERATIONS
Introduction
The following discussion and analysis should be read in conjunction with our selected consolidated historical financial data and our accompanying consolidated historical financial statements and the notes to those financial statements included elsewhere in this prospectus. The following discussion includes forward-looking statements that reflect our plans, estimates and beliefs. Our actual results could differ materially from those discussed in these forward-looking statements. Factors that could cause or contribute to such differences include, but are not limited to, those discussed below and elsewhere in this prospectus, particularly the section entitled “Risk Factors.” See also “Cautionary Statement Concerning Forward-Looking Statements.”
Overview
We are a growth-oriented, independent natural gas and oil company engaged in the acquisition, exploration and development of both conventional and unconventional natural gas and oil properties in Texas, Oklahoma, Louisiana and the Appalachian region. Our growth efforts are primarily directed at finding and developing natural gas reserves in unconventional shale gas areas and in known tight gas areas. We operate substantially all of our properties.
We were formed in July 2001 to acquire natural gas and oil properties in south Texas, Oklahoma and Louisiana. Prior to the Spring of 2003, we focused on the exploration and development of the reserves we acquired in connection with our formation. Since joining us in mid-2003, our senior management team has embarked on a strategy to acquire and develop a risk-balanced inventory of high growth opportunities, predominantly in shale gas. In order to implement this strategy, our new management initially devoted a substantial portion of its efforts to improving our operational efficiency and increasing our liquidity. In July 2004, we completed a financial restructuring that allowed the operating subsidiaries of Ascent Energy Inc., as borrowers, to enter into a new credit facility and reduced our debt service obligations by permitting us to pay in kind certain interest obligations.
Upon joining us in mid-2003, our senior management team undertook a detailed review and analysis of our proved natural gas and oil reserves, which resulted in a downward revision of our estimates of proved natural gas and oil reserves by a total of 37.7 Bcfe for the year ended December 31, 2003 and by an additional 62.9 Bcfe during the year ended December 31, 2004. The 2003 revision included approximately 22.3 Bcfe of proved non-producing and proved undeveloped reserves plus a subsequent 15.4 Bcfe reduction in underperforming producing properties. The 2004 revision included approximately 28.5 Bcfe of proved non-producing reserves and 34.4 Bcfe of proved undeveloped reserves. As a result of the events leading up to our July 2004 financial restructuring, we were forced to delay our 2004 capital expenditure program which resulted in a decline in our natural gas and oil production for the year ended December 31, 2004 because we were unable to offset natural production declines with new production. We had further production declines for the year ended December 31, 2005 resulting from a reduction in our capital expenditure program due to rig delays and the impact of Hurricanes Katrina and Rita. Our June 2006 production from our South Louisiana properties was2.9 MMcfe/d, which isapproximately 75% of our average daily pre-hurricane production from these properties during February through July 2005. We continue to see some post-hurricane improvement in production from our South Louisiana properties; however, it is common for production from mature water-drive wells not to return to pre-shut-in production rates after being shut-in. We do not expect that all of these wells will return completely to pre-hurricane production rates.
Like all natural gas and oil production companies, we face the challenge of natural production declines. Natural gas and oil production from a given well naturally decreases over time. We attempt to overcome this natural decline by increasing our production through the development and identification of additional reserves and by acquiring additional reserves that are expected to produce. Our future growth will depend upon our ability to increase production in an amount which exceeds our production declines and to add natural gas and oil reserves at a reasonable cost. We will maintain our focus on adding reserves through drilling and acquisitions and
44
producing such reserves at attractive costs. Our independent reserve engineers have estimated that our natural gas and oil production in 2006 from our proved developed producing reserves as of December 31, 2005 will decline by approximately 18.6% from our production from those reserves for the year ended December 31, 2005.
This discussion and analysis of our financial condition and results of operations reflects the restatement of our financial statements:
| | • | | for years ending prior to December 31, 2005 to reflect our conversion to the successful efforts method of accounting for natural gas and oil properties and to correct our previously recorded income tax provision; and |
| | • | | for the years ended December 31, 2003 and December 31, 2004 to reflect our previously understated asset retirement obligation. |
In addition, in connection with our July 2004 financial restructuring, we entered into new derivative arrangements and no longer designated our derivative arrangements as hedges.
This discussion does not give effect to the -for-1 reverse stock split of our common stock expected to be effected in connection with this offering.
For the foregoing reasons, our results of operations and period-to-period comparisons of these results and certain other financial information may not be meaningful or indicative of our future results of operations.
Revenue and Expense Drivers
Revenues
Natural gas and oil sales.Our revenues are generated from sales of natural gas and oil which are substantially dependent on prevailing prices of natural gas and oil. Prices for natural gas and oil are subject to large fluctuations in response to relatively minor changes in the supply of or demand for natural gas and oil, market uncertainty and a variety of additional factors beyond our control. We enter into derivative arrangements for a portion of our natural gas and oil production to achieve a more predictable cash flow and to reduce our exposure to adverse fluctuations in the prices of natural gas and oil. Our derivative arrangements for future production prior to our July 2004 financial restructuring were designated as hedges under Statement of Financial Accounting Standards No. 133, “Accounting for Derivative Instruments and Hedging Activities” (“SFAS 133”), and accordingly realized gains and losses from these derivative arrangements were recorded as natural gas and oil sales and unrealized gains and losses from these derivative arrangements were not reported in earnings.
We generally sell our natural gas and oil at current market prices at the wellhead, or we transport it to “pooling points” where it is sold. We are required to pay gathering and transportation costs with respect to substantially all of our products. We market our products in several different ways depending upon a number of factors, including the availability of purchasers for the product at the wellhead, the availability and cost of pipelines near the well, market prices, pipeline constraints and operational flexibility. We sold an average of approximately 12.6 Mmcf/d and 12.8 Mmcf/d of natural gas and approximately 1.9 MBbls/d and 1.9 MBbls/d of oil and NGLs during the year ended December 31, 2005 and the six months ended June 30, 2006, respectively. Our revenues for the year ended December 31, 2005 and for the six months ended June 30, 2006 benefited from a general rise in natural gas and oil prices over those periods.
Operating Expenses
Our operating expenses primarily involve the expense of operating and maintaining our wells.
| | • | | Lease operating expenses. Our lease operating expenses include certain direct employment-related costs, repair and maintenance costs, electrical power and fuel costs and other expenses necessary to |
45
| | maintain our operations. Our lease operating expenses are driven in part by the type of commodity produced, the level of maintenance activity and the geographical location of our properties. Workover costs that improve the value of our properties are capitalized and otherwise are included in lease operating expenses. |
| | • | | Production and ad valorem taxes. Production taxes represent the state taxes imposed on mineral production. Production taxes are calculated based on sales revenues or volume of sales depending on the state. Ad valorem taxes represent property taxes. |
| | • | | General and administrative expenses. General and administrative expenses include employee compensation and benefits, professional fees for legal, accounting and other advisory services, corporate overhead and franchise taxes. Upon completion of this offering, we expect that our ongoing general and administrative expenses will increase as a result of significant increases in legal, accounting and other expenses associated with compliance with the Sarbanes-Oxley Act of 2002, other rules and regulations of the SEC, the listing standards of The Nasdaq Global Market and otherwise being a public company. |
| | • | | Exploration expenses. Exploration expenses include the geological and geophysical costs relating to our exploration efforts and costs related to unsuccessful exploratory wells. |
| | • | | Depreciation, depletion and amortization. Depreciation, depletion and amortization represent the expensing of the capitalized costs of our natural gas and oil properties and our other property and equipment. |
| | • | | Property impairments. We review our natural gas and oil properties for impairment on a field-by-field basis whenever events or circumstances indicate the carrying value of those properties may not be recoverable. The impairment provision for each field is based on the excess of the carrying value of the field over its fair value. |
| | • | | Derivative loss. Subsequent to our July 2004 financial restructuring, we do not designate any of our derivative arrangements relating to future production as hedges under SFAS 133. Accordingly, derivative loss represents the changes in fair market value of, and realized gains and losses related to, our derivative arrangements. |
Other Expenses and Income
Interest and other income.We also generate interest income from our cash deposits and other income (loss) from gains or losses on sales of our assets.
Interest expense. Our interest expense reflects our borrowing costs under our credit facility, our senior notes and our senior subordinated notes. Interest accrued on our senior notes and senior subordinated notes is payable in the form of additional notes. Upon consummation of the Recapitalization, this offering and the application of the net proceeds of this offering, we expect our interest expense to reflect only our borrowing costs under our credit facility.
Income tax benefit (expense). Income tax benefit (expense) represents current and deferred federal and state income taxes. Our taxes are calculated by applying the statutory tax rates in effect for the applicable period to our book loss or book income. These calculated income tax amounts are further adjusted to reflect the impact of federal and state valuation allowances and to adjust for the tax effect of book income and book expense items which are not taxable or deductible for tax purposes.
Reserve Write Down
Upon joining us in 2003, our management undertook a detailed review and analysis of our proved natural gas and oil reserves. Netherland, Sewell & Associates, Inc., one of our independent reserve engineers, has performed our reserves evaluation since our formation in 2001. LaRoche Petroleum Consultants, Ltd., our other
46
independent reserve engineering firm, was first engaged in 2004 to prepare a report on our proved reserves located in Louisiana and Texas as of December 31, 2004. Based on reports from both of our independent reserve engineering firms, our estimates of proved natural gas and oil reserves were revised downward by a total of 37.7 Bcfe for the year ended December 31, 2003, which included approximately 22.3 Bcfe of proved non-producing and proved undeveloped reserves plus a subsequent 15.4 Bcfe reduction in underperforming producing properties, and by an additional 62.9 Bcfe during the year ended December 31, 2004, which included approximately 28.5 Bcfe of proved non-producing reserves and 34.4 Bcfe of proved undeveloped reserves. The decrease primarily affected proved developed non-producing and proved undeveloped reserves that had been on our books prior to 2003. The revisions are not expected to have a material impact on our near-term production volumes, and it is still our intention to make investments in a number of the projects impacted by the revisions. The primary reasons for the revisions were as follows:
| | • | | Two successful recompletions in the New Taiton field in south Texas during late 2002 resulted in the addition of proved developed non-producing and proved undeveloped locations throughout much of the field. This early success led our internal engineers and Netherland, Sewell & Associates, Inc., our independent reserve engineers, to believe that New Taiton’s potential development was analogous to a large, nearby field. Subsequent producing performance and failure of additional recompletions caused us to reconsider the initial conclusions. As a result, the majority of these reserves were removed or were moved to probable or possible status in 2003. We made additional downward revisions to our proved reserves in 2003 after disappointing well performance subsequent to our new completions caused us to determine that certain proved undeveloped locations in the La Copita field in south Texas were not economic. |
| | • | | In connection with our retention of LaRoche Petroleum Consultants, Ltd., we undertook a more detailed analysis of the mapping underlying our reserves which resulted in the reclassifications of certain proved undeveloped reserves in the New Taiton and La Copita fields and certain proved undeveloped reserves in Louisiana as probable or possible as of December 31, 2004. |
| | • | | In Oklahoma, prior to 2003, a large number of proved developed non-producing reserves were generally recognized throughout a broad area. We developed an extensive casing gas gathering system to rapidly exploit the reserves. Well performance subsequent to recompletion indicated reserve estimates of approximately 46% of the previously estimated reserves. This lower-than-expected well production, along with higher costs, made many of the identified reserves uneconomic, and resulted in a significant downward revision in 2004. Our 2004 reserve write downs also reflect a downward revision of our estimated proved undeveloped reserves attributable to an expected waterflood response in the Hunton Devonian limestone. Although water had been injected into portions of the reservoir for some time, we did not have conclusive evidence that any response to water injection was occurring. We revised downward the balance of these estimated proved undeveloped reserves in 2005, and these downward revisions were reflected in the net increase in the revisions of previous estimates in our estimated net proved reserves in 2005 of 8.0 Bcfe. As of the date of this prospectus, we recognized no proved undeveloped reserves attributable to expected waterflood response in the Hunton reservoir at the Northeast Fitts Unit. |
Asset Retirement Obligation Restatement and Tax Provision Restatement
During the fourth quarter of 2005, we determined that our initial adoption of SFAS 143 understated our asset retirement obligation. The understatement was primarily attributable to our understating the number of wells subject to future retirement obligations and associated retirement costs on certain properties. Additionally, we overstated the useful lives of a significant portion of our properties which contributed to the understatement of our asset retirement obligation because we determined the present value of the asset retirement obligation to be recorded by discounting the estimated future cash flows related to our asset retirement obligation over the useful lives of our properties.
47
We restated our financial statements for the years ended December 31, 2003 and December 31, 2004 to reflect the revision to our asset retirement obligation for those periods. The effect of the restatement at adoption is as follows:
| | | | | | | | |
| | | Initial adoption | | | Restated adoption | |
| | | (in thousands) | |
Natural gas and oil properties | | $ | 1,563 | | | $ | 6,033 | |
Accumulated depreciation, depletion and amortization | | | (276 | ) | | | 1,496 | |
Asset retirement obligations | | | (1,996 | ) | | | (7,103 | ) |
Deferred tax liability | | | 273 | | | | (164 | ) |
| | | | | | | | |
Cumulative effect of change in accounting principle, net of income tax benefit of $273 at initial adoption and income tax expense of $164 as restated | | $ | (436 | ) | | $ | 262 | |
| | | | | | | | |
The following table summarizes the restated changes to our asset retirement obligation for the years ended December 31, 2004 and December 31, 2005:
| | | | | | | | |
| | | Year Ended December 31, | |
| | | 2004 | | | 2005 | |
| | | (in thousands) | |
Asset retirement obligations at beginning of period | | $ | 8,319 | | | $ | 9,274 | |
Accretion expense | | | 868 | | | | 991 | |
Liabilities incurred | | | 135 | | | | 450 | |
Liabilities settled | | | (48 | ) | | | (145 | ) |
| | | | | | | | |
Asset retirement obligations at year-end | | | 9,274 | | | | 10,570 | |
Less: current asset retirement obligations | | | 85 | | | | 517 | |
| | | | | | | | |
Long-term asset retirement obligations | | $ | 9,189 | | | $ | 10,053 | |
| | | | | | | | |
During 2005, we reviewed the tax basis of all our related assets and net operating loss carryforwards for the current year and previous four years. As a result of this review, we restated our 2003 financial statements to reduce by $5.6 million the valuation allowance previously recorded for the year ended December 31, 2003. We determined that the valuation allowance recorded during 2003 was not required because the reported gross federal deferred tax assets were more likely than not fully realizable as an offset against the recorded federal deferred tax liabilities.
The effect of the restatement of our asset retirement obligations, net of income taxes, and our tax provision on the financial statements was an increase in retained earnings as of December 31, 2004 of $4.6 million, an increase in net loss by $0.3 million ($0.04 per basic and diluted share) for the year ended December 31, 2004 and a decrease in net loss by $5.3 million ($0.99 per basic and diluted share) for the year ended December 31, 2003.
Critical Accounting Policies
Basis of Presentation. The consolidated financial statements include our accounts and the accounts of our subsidiaries as of the respective dates of such financial statements. All inter-company balances have been eliminated. Certain prior year amounts for accounts payable and accrued liabilities have been reclassified to conform to current year presentation due to segregation of the accounts on the consolidated balance sheets. This discussion and analysis of our financial condition and results of operation are based upon our consolidated financial statements, which have been prepared in accordance with generally accepted accounting principles as presently established in the United States.
Use of Estimates in the Preparation of Financial Statements. The preparation of our financial statements requires us to make estimates and judgments that affect the reported amounts of assets, liabilities, equity,
48
revenues and expenses. Our estimates include those related to natural gas and oil revenues, bad debts, natural gas and oil properties, operating expenses, natural gas and oil reserves, abandonment liabilities, contingencies; and litigation. Certain accounting policies involve judgments and uncertainties to such an extent that there is reasonable likelihood that materially different amounts could have been reported under different conditions, or if different assumptions had been used. We evaluate our estimates and assumptions on a regular basis. We base our estimates on historical experience and various other assumptions that are believed to be reasonable under the circumstances, the results of which form the basis for making judgments about the carrying values of assets and liabilities that are not readily apparent from other sources. Actual results may differ from these estimates used in preparation of our financial statements. In addition, alternatives can exist among various accounting methods. In such cases, the choice of accounting method can have a significant impact on reported amounts. After this offering, we will discuss the development, selection and disclosure of each of these with our audit committee. We believe the accounting policies described below reflect our more significant estimates and assumptions used in preparation of our financial statements. Please read the notes to our consolidated financial statements for a discussion of additional accounting policies and estimates made by management.
Natural Gas and Oil Reserve Estimates.Independent petroleum engineers prepare estimates of our natural gas and oil reserves. Proved reserves, estimated future net revenues and the present value of our reserves are estimated based upon a combination of historical data and estimates of future activity. You should not assume that the present value of our reserves is the current market value of our estimated proved reserves. In accordance with SEC requirements, we have based our present value from proved reserves on prices on the date of the estimate. The reserve estimates are used in calculating depletion, depreciation and amortization and in the assessment of assets for impairment as further discussed below. Significant assumptions are required in the valuation of proved natural gas and oil reserves which, as described herein, may affect the amount at which natural gas and oil properties are recorded. Actual results could differ materially from these estimates.
Revenue Recognition Policy. We follow the accrual method of accounting for revenue recognition and natural gas imbalances. Natural gas and oil revenues are recognized when sales are confirmed or reasonably anticipated and collection of the sales proceeds is probable. Accrued sales are based on field or pipeline volume statements valued at purchaser contract terms. Volumes attributable to natural gas imbalances are valued at published prices for the anticipated settlement date and accrued accordingly. Recognized sales attributable to natural gas imbalances were not significant for the periods presented.
Change in Accounting Principle to Successful Efforts from Full Cost. Generally accepted accounting principles allow the option of two acceptable methods for accounting for natural gas and oil properties. The primary differences between the two methods are in the treatment of exploration costs, the computation of depreciation, depletion and amortization, and the calculation of property impairments.
Effective January 1, 2005, we changed our accounting method for natural gas and oil properties from the full cost method to the successful efforts method. Management believes that the successful efforts method of accounting is the preferable method in the natural gas and oil industry and that the accounting change will more accurately present the results of our exploration and development activities, minimize asset write-offs caused by temporary declines in natural gas and oil prices and reflect an impairment in the carrying value of our natural gas and oil properties only when there has been a permanent decline in their fair value.
Under the successful efforts method of accounting, we capitalize all costs related to property acquisitions and successful exploratory wells, all development costs and the costs of support equipment and facilities. All costs related to unsuccessful exploratory wells are expensed. Other exploration costs, including geological and geophysical costs, are expensed as incurred.
Unproved leasehold costs are capitalized and reviewed periodically for impairment. Costs related to impaired prospects are charged to expense. If natural gas and oil prices decline in the future, some of these unproved prospects may not be economic to develop, which could lead to increased impairment expense.
49
Costs of development dry holes and proved leaseholds are amortized on the unit-of-production method based on proved reserves on a field basis. The depreciation of capitalized production equipment and drilling costs is based on the unit-of-production method using proved developed reserves on a field basis.
We review our proved natural gas and oil properties for impairment on a field basis. For each field, an impairment provision is recorded whenever events or circumstances indicate that the carrying value of those properties may not be recoverable. The impairment provision is based on the excess of carrying value over fair value. Fair value is defined as the present value of the estimated future net revenues from estimated future production of total proved natural gas and oil reserves based on our expectations of future natural gas and oil prices and costs. Due to the volatility of natural gas and oil prices, it is possible that our assumptions regarding natural gas and oil prices may change in the future and may result in future impairment provisions. We recorded impairment provisions related to our proved natural gas and oil properties of $3.8 million, $20.7 million and $1.3 million for the years ended December 31, 2003, December 31, 2004 and December 31, 2005, respectively. The impairment provision for 2004 resulted primarily from a downward revision of our reserves at our New Taiton field in Texas.
We retrospectively adjusted our financial statements for the periods ending prior to December 31, 2005 to give effect to our change to the successful efforts method of accounting. The effect of the retrospective application, net of income taxes, was a reduction of retained earnings as of December 31, 2004 of $56.5 million, primarily resulting from a reduction of net property, plant and equipment of $92.3 million and a reduction of deferred income tax liability of $35.8 million. The change in accounting method increased our net loss by $5.6 million ($1.05 per basic and diluted share) and $19.8 million ($3.32 per basic and diluted share) for the years ended December 31, 2003 and December 31, 2004, respectively.
Asset Retirement Obligations.Effective January 1, 2003, we adopted SFAS 143. SFAS 143 requires legal obligations associated with the retirement of long-lived assets to be recognized at their fair value at the time that the obligations are incurred. Upon initial recognition of a liability, that cost is capitalized as part of the related long-lived asset and allocated to expense over the useful life of the asset. Periodic accretion of the discount of the estimated liability is recorded in the statement of operations. We determine our asset retirement obligation by calculating the present value of estimated cash flows related to the liability.
We escrow a portion of the future abandonment costs of our wells and facilities. Approximately $0.5 million is included in escrowed and restricted funds on our balance sheets as of December 31, 2004 and December 31, 2005.
Asset Retirement Obligation Restatement and Tax Provision Restatement.During the fourth quarter of 2005, we determined that our initial adoption of SFAS 143 understated our asset retirement obligation. The understatement was primarily attributable to our understating the number of wells subject to future retirement obligations and associated retirement costs on certain properties. Additionally, we overstated the useful lives of a significant portion of our properties which contributed to the understatement of our asset retirement obligation because we determined the present value of the asset retirement obligation to be recorded by discounting the estimated future cash flows related to our asset retirement obligation over the useful lives of our properties. During 2005, we reviewed the tax basis of all our related assets and net operating loss carryforwards for the current year and previous four years. As a result of this review, we restated our 2003 financial statements to reduce by $5.6 million the valuation allowance previously recorded for the year ended December 31, 2003. We determined that the valuation allowance recorded during 2003 was not required because the reported gross federal deferred tax assets were more likely than not fully realizable as an offset against the recorded federal deferred tax liabilities. Please see “—Overview—Asset Retirement Obligation Restatement and Tax Provision Restatement” above for additional information about these restatements.
Depletion, Depreciation and Amortization. We use estimates of proved natural gas and oil reserve quantities to estimate depletion, depreciation and amortization expense using the unit-of-production method of accounting.
50
Depreciation of property and equipment other than natural gas and oil properties is calculated using the straight-line method over the useful lives of the assets ranging from three to seven years. Any change in reserves directly impacts the amount of depreciation, depletion and amortization expense we recognize in a given period. Assuming no other changes, as our reserves increase, depletion, depreciation and amortization expense decreases and as reserves decrease, depletion, depreciation and amortization expense increases. Changes in our estimate of proved reserves can cause material changes in our depletion, depreciation and amortization expense.
Fair Value of Financial Instruments. Our financial instruments consist primarily of cash equivalents, trade receivables, trade payables, derivative instruments and bank debt. Our cash equivalents, trade receivables and trade payables are considered to be representative of their respective fair values due to their short maturities. Our derivative instruments are reflected at fair value as provided by our counterparties. The fair value of our bank debt approximates its carrying value because the interest rate available to us is variable and reflective of market rates. Our senior notes and senior subordinated notes do not trade on any market and to determine the fair value of these financial instruments is not practicable.
Derivative Instruments. We account for our derivative arrangements under SFAS 133, as amended by Statement of Financial Accounting Standards No. 137,“Accounting for Derivative Instruments and HedgingActivities—Deferral of the Effective Date of FASB Statement No. 133,” Statement of Financial Accounting Standards No. 138,“Accounting for Certain Derivative Instruments and Certain Hedging Activities,” and Statement of Financial Accounting Standards No. 149, “Amendment of Statement 133 on Derivative Instruments and Hedging Activities,”which is more fully discussed below under “—Quantitative and Qualitative Disclosures about Market Risk—Commodity Price Risk.” Under SFAS 133, instruments qualifying for hedge accounting treatment are recorded on the balance sheet as an asset or liability measured at fair value and subsequent changes in fair value are recognized in equity through other comprehensive income until the sale of the related hedgedproduction is recognized in earnings, at which time amounts previously recognized on other comprehensive income are recognized in earnings. Any ineffective portion of changes in fair value on derivatives qualifying for hedge accounting treatment is recognized in earnings immediately. Instruments not qualifying for hedge accounting treatment are recorded on the balance sheet at fair value and subsequent changes in fair value are recognized in earnings. Derivative instruments entered into prior to our July 2004 financial restructuring qualified for hedge accounting treatment; however, derivative instruments entered into subsequent to such restructuring were not qualified for hedge accounting treatment.
Deferred Income Taxes. We follow the asset and liability method for accounting for deferred income taxes and income taxes in accordance with SFAS No. 109, “Accounting for Income Taxes.” Provisions for income taxes include deferred taxes resulting primarily from temporary differences due to different reporting methods for natural gas and oil properties for financial reporting purposes and income tax purposes. As of December 31, 2005, we had a net deferred tax liability of $1.9 million. For financial reporting purposes, all development expenditures and certain exploratory costs on successful wells are capitalized and depreciated, depleted and amortized on the units-of-production method. For income tax purposes, only the equipment and leasehold costs relative to successful wells are capitalized and recovered through depreciation or depletion. Generally, most other exploratory and development costs are charged to expense as incurred; however, we follow certain provisions of the Internal Revenue Code of 1986, as amended, or the Code, that allow capitalization of intangible drilling costs where management deems appropriate. Other financial and income tax reporting differences occur as a result of statutory depletion and capitalization of interest expenses for income tax purposes. Beginning in 2001, we established a valuation allowance which we increased periodically to reflect the uncertainty about the realization of the deferred tax asset. In 2005, we increased the valuation allowance of $6.2 million by an additional $9.8 million and in the first six months of 2006, we increased the valuation allowance of $16.0 million by an additional $0.9 million based on uncertainty surrounding our ability to utilize the entire balance of our deferred tax assets based on an analysis of whether we are more likely than not to receive such a benefit and if so, to what extent.
51
Contingencies. Contingencies are recognized upon determination of an exposure, which when analyzed indicates that it is both probable that a liability has been incurred and the amount of the liability can reasonably be determined.
Recent Accounting Pronouncements
In December 2004, the Financial Accounting Standards Board (“FASB”) issued Statement of Financial Accounting Standards No. 123(R), “Share-Based Payment” (“SFAS 123(R)”), which is a revision of Statement of Financial Accounting Standards No. 123, “Accounting for Stock Based Compensation” (“SFAS 123”). SFAS 123(R) is effective for public companies for interim or annual periods beginning after December 15, 2005. SFAS 123(R) supersedes Accounting Principles Board Opinion No. 25, “Accounting for Stock Issued to Employees,” and amends Statement of Financial Accounting Standards No. 95, “Statement of Cash Flows.” SFAS 123(R) requires all share-based payments to employees, including grants of employee stock options, to be recognized in financial statements based on their fair values beginning with the first interim or annual period after December 15, 2005, with early adoption encouraged. The pro forma disclosures previously permitted under SFAS 123 are no longer an alternative to financial statement recognition. SFAS 123(R) also requires the tax benefits in excess of recognized compensation expenses to be reported as a financing cash flow rather than as an operating cash flow as currently required. SFAS 123(R) is effective for our first annual reporting period ending after December 31, 2005. We adopted SFAS 123(R) on January 1, 2006 using a modified prospective application. Our adoption of SFAS 123(R) did not have an impact on our financial statements.
In May 2005, the FASB issued Statement of Financial Accounting Standards No. 154, “Accounting Changes and Error Corrections” (“SFAS 154”), which replaces Accounting Principles Board Opinion No. 20 “Accounting Changes,” and Statement of Financial Accounting Standards No. 3, “Reporting Accounting Changes in Interim Financial Statements.” SFAS 154 is effective for accounting changes and corrections of errors made in fiscal years beginning after December 15, 2005 and requires retrospective application to prior period financial statements of voluntary changes in accounting principles unless it is impractical to determine either the period-specific effects or the cumulative effect of the change. We adopted SFAS 154 during 2005. The adoption of SFAS 154 resulted in additional disclosure requirements for our change in accounting principle from full cost to successful efforts and our restatements. See “—Critical Accounting Policies—Change in Accounting Principle to Successful Efforts from Full Cost” and “—Critical Accounting Policies—Asset Retirement Obligation Restatement and Tax Provision Restatement.”
In July 2006, the FASB issued Interpretation No. 48, “Accounting for Uncertainty in Income Taxes—an Interpretation of FASB Statement 109” (“FIN 48”), which clarifies the accounting for uncertainty in tax positions taken or expected to be taken in a tax return, including issues relating to financial statement recognition and measurement. FIN 48 provides that the tax effects from an uncertain tax position can be recognized in the financial statements only if the position is “more-likely-than-not” of being sustained if the position were to be challenged by a taxing authority. The provisions of FIN 48 are effective for fiscal years beginning after December 15, 2006, with the cumulative effect of the change in accounting principle recorded as an adjustment to opening retained earnings. We are currently evaluating the impact, if any, the adoption of FIN 48 will have on our consolidated financial position or results of operations.
52
Results of Operations
The following table sets forth certain operating information with respect to our natural gas, oil and NGL operations for the periods presented:
| | | | | | | | | | | | | | | | | |
| | | Year Ended December 31, | | Six Months Ended
June 30, |
| | | 2003 | | | 2004 | | | 2005 | | 2005 | | 2006 |
| | | (Restated) | | | | | | | |
Production data: | | | | | | | | | | | | | | | | | |
Oil (MBbls) | | | 688 | | | | 625 | | | | 598 | | | 309 | | | 298 |
Natural gas (MMcf) | | | 6,545 | | | | 5,158 | | | | 4,592 | | | 2,348 | | | 2,324 |
NGLs (MBbls) | | | 107 | | | | 120 | | | | 107 | | | 60 | | | 43 |
Combined volumes (MMcfe) | �� | | 11,318 | | | | 9,630 | | | | 8,826 | | | 4,560 | | | 4,370 |
Average prices: | | | | | | | | | | | | | | | | | |
Oil (per Bbl) | | $ | 30.14 | | | $ | 40.66 | | | $ | 55.55 | | $ | 50.79 | | $ | 65.95 |
Effects of hedging | | | (0.54 | ) | | | — | | | | — | | | — | | | — |
| | | | | | | | | | | | | | | | | |
Oil price (net of hedging) | | $ | 29.60 | | | $ | 40.66 | | | $ | 55.55 | | $ | 50.79 | | $ | 65.95 |
Natural gas (per Mcf) | | $ | 5.52 | | | $ | 5.93 | | | $ | 7.98 | | $ | 6.32 | | $ | 7.00 |
Effects of hedging | | | (1.77 | ) | | | (1.66 | ) | | | — | | | — | | | — |
| | | | | | | | | | | | | | | | | |
Natural gas price (net of hedging) | | $ | 3.75 | | | $ | 4.27 | | | $ | 7.98 | | $ | 6.32 | | $ | 7.00 |
NGLs (per Bbl) | | $ | 21.37 | | | $ | 27.15 | | | $ | 34.56 | | $ | 29.76 | | $ | 39.41 |
Combined (per Mcfe): | | | | | | | | | | | | | | | | | |
Price | | $ | 5.23 | | | $ | 6.15 | | | $ | 8.34 | | $ | 7.09 | | $ | 8.61 |
Effects of hedging | | | (1.06 | ) | | | (0.89 | ) | | | — | | | — | | | — |
| | | | | | | | | | | | | | | | | |
Price (net of hedging) | | $ | 4.17 | | | $ | 5.27 | | | $ | 8.34 | | $ | 7.09 | | $ | 8.61 |
| | | | | | | | | | | | | | | |
| | | Year Ended December 31, | | Six Months Ended
June 30, |
| | | 2003 | | 2004 | | 2005 | | 2005 | | 2006 |
| | | (Restated) | | | | |
Average expenses (per Mcfe): | | | | | | | | | | | | | | | |
Production and ad valorem taxes | | $ | 0.38 | | $ | 0.32 | | $ | 0.38 | | $ | 0.38 | | $ | 0.51 |
Lease operating expenses | | | 1.05 | | | 1.25 | | | 1.31 | | | 1.20 | | | 1.46 |
General and administrative expenses | | | 0.92 | | | 0.86 | | | 0.96 | | | 0.84 | | | 1.27 |
Exploration expenses | | | 0.50 | | | 0.09 | | | 0.39 | | | 0.10 | | | 0.19 |
Depreciation, depletion and amortization | | | 1.90 | | | 3.24 | | | 2.35 | | | 2.33 | | | 2.38 |
Property impairments | | | 0.34 | | | 2.15 | | | 0.14 | | | — | | | — |
Derivative loss | | | — | | | 0.69 | | | 3.84 | | | 3.94 | | | 1.54 |
| | | | | | | | | |
| | | As of December 31, |
| | | 2003 | | 2004 | | 2005 |
| | | (dollars in thousands) |
Estimated net proved reserves: | | | | | | | | | |
Oil (MBbls) | | | 13,620 | | | 9,578 | | | 9,572 |
Natural gas (MMcf) | | | 80,423 | | | 37,311 | | | 42,066 |
NGLs (MBbls) (1) | | | — | | | 1,119 | | | 1,098 |
Total (MMcfe) | | | 162,141 | | | 101,491 | | | 106,089 |
PV-10 (2) | | $ | 379,494 | | $ | 239,632 | | $ | 371,303 |
| (1) | Oil reserve data as of December 31, 2003 includes NGLs. |
| (2) | See note 3 to “Summary—Summary Historical Reserve and Operating Data.” |
53
| | | | | | | | | | | | | | | | | | | | |
| | | Year Ended December 31, | | | Six Months Ended
June 30, | |
| | | 2003 | | | 2004 | | | 2005 | | | 2005 | | | 2006 | |
| | | (Restated) | | | (Restated) | | | | | | (Unaudited) | |
| | | (in thousands) | |
Revenues: | | | | | | | | | | | | | | | | | | | | |
Oil | | $ | 20,377 | | | $ | 25,431 | | | $ | 33,228 | | | $ | 15,694 | | | $ | 19,631 | |
Natural gas | | | 24,553 | | | | 22,021 | | | | 36,634 | | | | 14,848 | | | | 16,271 | |
NGLs | | | 2,027 | | | | 3,257 | | | | 3,714 | | | | 1,776 | | | | 1,713 | |
| | | | | | | | | | | | | | | | | | | | |
Total revenues | | | 46,957 | | | | 50,709 | | | | 73,576 | | | | 32,318 | | | | 37,615 | |
Expenses: | | | | | | | | | | | | | | | | | | | | |
Production and ad valorem taxes | | | 4,307 | | | | 3,091 | | | | 3,332 | | | | 1,731 | | | | 2,231 | |
Lease operating expenses | | | 11,915 | | | | 12,018 | | | | 11,594 | | | | 5,487 | | | | 6,398 | |
General and administrative expenses | | | 10,388 | | | | 8,272 | | | | 8,436 | | | | 3,851 | | | | 5,548 | |
Exploration expenses | | | 5,630 | | | | 854 | | | | 3,460 | | | | 444 | | | | 818 | |
Depreciation, depletion and amortization | | | 21,539 | | | | 31,207 | | | | 20,771 | | | | 10,623 | | | | 10,393 | |
Property impairments | | | 3,802 | | | | 20,711 | | | | 1,254 | | | | — | | | | — | |
Derivative loss | | | — | | | | 6,604 | | | | 33,851 | | | | 17,983 | | | | 6,725 | |
| | | | | | | | | | | | | | | | | | | | |
Total operating expenses | | | 57,581 | | | | 82,757 | | | | 82,698 | | | | 40,119 | | | | 32,113 | |
| | | | | | | | | | | | | | | | | | | | |
Income (loss) from operations | | | (10,624 | ) | | | (32,048 | ) | | | (9,122 | ) | | | (7,801 | ) | | | 5,502 | |
Interest and other income | | | 7 | | | | 203 | | | | 561 | | | | 78 | | | | 110 | |
Interest expense | | | (13,661 | ) | | | (16,958 | ) | | | (19,496 | ) | | | (9,286 | ) | | | (11,266 | ) |
| | | | | | | | | | | | | | | | | | | | |
Loss before income taxes | | | (24,278 | ) | | | (48,803 | ) | | | (28,057 | ) | | | (17,009 | ) | | | (5,654 | ) |
Income tax benefit (expense) | | | 8,624 | | | | 12,472 | | | | 209 | | | | 127 | | | | (317 | ) |
| | | | | | | | | | | | | | | | | | | | |
Loss before cumulative effect of change in accounting principle | | | (15,654 | ) | | | (36,331 | ) | | | (27,848 | ) | | | (16,882 | ) | | | (5,971 | ) |
Cumulative effect of change in accounting principle, net of income tax of $273 in 2003 | | | 262 | | | | — | | | | — | | | | — | | | | — | |
| | | | | | | | | | | | | | | | | | | | |
Net loss | | $ | (15,392 | ) | | $ | (36,331 | ) | | $ | (27,848 | ) | | $ | (16,882 | ) | | $ | (5,971 | ) |
| | | | | | | | | | | | | | | | | | | | |
Our independent reserve engineers also prepared reports of our estimated net proved natural gas and oil reserves as of June 30, 2006. As of June 30, 2006, our estimated net proved reserves were 100.8 Bcfe, which included 37,401 MMcf of natural gas and 10,569 MBbls of oil and NGLs. These estimates were determined using a price of $6.04 per MMBtu of natural gas and $70.50 per Bbl of oil as compared to our December 31, 2005 year-end pricing of $8.17 per MMBtu of natural gas and $57.75 per Bbl of oil.
Six Months Ended June 30, 2006 Compared to Six Months Ended June 30, 2005
Revenues. Revenues for the six months ended June 30, 2006 increased $5.3 million, or 16%, to $37.6 million as compared to $32.3 million for the six months ended June 30, 2005. This increase was due primarily to increases in the prices received for natural gas, oil and NGLs of 11%, 30% and 32%, respectively, partially offset by decreases in natural gas, oil and NGL production of 1%, 4% and 27%, respectively.
The average sales prices for natural gas, oil and NGLs for the six months ended June 30, 2006 were $7.00 per Mcf, $65.95 per Bbl and $39.41 per Bbl, respectively, as compared to average sales prices for natural gas, oil and NGLs for the six months ended June 30, 2005 of $6.32 per Mcf, $50.79 per Bbl and $29.76 per Bbl, respectively.
The 4% decrease in oil production was due primarily to production declines in Louisiana and Texas of 22% and 13%, respectively. The decline in Louisiana production was due primarily to wells not fully recovering to previous production levels after a mandatory shut-in in response to Hurricanes Katrina and Rita. The decline in Texas production was due primarily to natural declines and maintenance issues which resulted in production shut-ins, primarily in south Texas, partially offset by production on new wells in south and east Texas.
54
The 1% decrease in natural gas production was due primarily to production declines in Louisiana and Oklahoma of 21% and 7%, respectively, partially offset by a 7% production increase in Texas. The decrease in Oklahoma production resulted from production declines, which are typical for tight gas sands, and weather related shut-ins. Declines in our Louisiana production resulted from wells not fully recovering to previous production levels after a mandatory shut-in in response to Hurricanes Katrina and Rita. The increase in Texas production was due primarily to production from new wells in south and east Texas.
The decrease of 27% in NGL production was due primarily to an overall decline in processed gas production at our La Copita Field in south Texas.
Lease operating expenses. Lease operating expenses for the six months ended June 30, 2006 increased $0.9 million, or 17%, to $6.4 million as compared to $5.5 million for the six months ended June 30, 2005 and increased 22% per Mcfe during the six months ended June 30, 2006 to $1.46 per Mcfe as compared to $1.20 per Mcfe during the six months ended June 30, 2005. The increase in lease operating expenses was due primarily to increased costs for well insurance, chemicals, and surface and subsurface repair and maintenance. During early 2005, marginal wells in need of repair were temporarily shut-in which delayed completion of repairs. As natural gas and oil prices have increased, many of these wells were repaired and returned to production, which resulted in increased repair and maintenance costs during the six months ended June 30, 2006 as compared to the six months ended June 30, 2005. Additionally, field employee costs during the six months ended June 30, 2006 exceeded field employee costs for the six months ended June 30, 2005 due to higher field staff bonuses during the six months ended June 30, 2006. The increase in lease operating expenses on a per Mcfe basis during the six months ended June 30, 2006 was due primarily to increased costs and a 4% decline in production.
Production and ad valorem taxes. Production and ad valorem taxes for the six months ended June 30, 2006 increased $0.5 million, or 29%, to $2.2 million from $1.7 million for the six months ended June 30, 2005. The increase was due primarily to increases in revenues during the six months ended June 30, 2006 as compared to the six months ended June 30, 2005. Production and ad valorem taxes were 6% of revenues for the six months ended June 30, 2006 and 5% of revenues for the six months ended June 30, 2005. These rates are lower than historical percentages due to current and retroactive exemptions granted by the State of Texas for high-cost natural gas.
General and administrative expenses. General and administrative expenses, or G&A, for the six months ended June 30, 2006 increased $1.7 million, or 44%, to $5.5 million as compared to $3.9 million for the six months ended June 30, 2005. The increase in G&A was due primarily to increases in employee-related costs, legal costs and audit costs during the six months ended June 30, 2006. Employee-related costs increased primarily due to our hiring additional staff and awarding annual salary increases, legal costs increased primarily due to an increase in legal issues arising in the normal course of business and audit costs increased primarily due to additional fees related to our conversion from full-cost accounting to successful efforts accounting and the restatement of our prior period financial statements.
Exploration expenses. Exploration expenses for the six months ended June 30, 2006 increased $0.4 million, or 84%, to $0.8 million as compared to $0.4 million for the six months ended June 30, 2005. The increase was due primarily to an increase in delay rental costs during the six months ended June 30, 2006 resulting from the timing of delay rental payments and the expiration of a lease during February 2006.
Depreciation, depletion and amortization. Depreciation, depletion and amortization, or DD&A, for the six months ended June 30, 2006 decreased $0.2 million, or 2%, to $10.4 million as compared to $10.6 million for the six months ended June 30, 2005. On a per Mcfe basis, DD&A for the six months ended June 30, 2006 increased 2% to $2.38, as compared to $2.33 for the six months ended June 30, 2005. The decrease in DD&A expense for the six months ended June 30, 2006 was due primarily to a decrease in production, partially offset by a higher DD&A rate per Mcfe.
55
Loss on derivatives. Derivative loss for the six months ended June 30, 2006 decreased $11.3 million, or 63%, to $6.7 million as compared to $18.0 million during the six months ended June 30, 2005. The decrease in derivative losses for the six months ended June 30, 2006 as compared to the six months ended June 30, 2005 was due primarily to a decrease in unrealized natural gas and oil derivative losses resulting from less significant unfavorable changes in the prices of natural gas and oil and due to more favorable pricing under our derivative instruments during the six months ended June 30, 2006 as compared to the six months ended June 30, 2005. See “—Quantitative and Qualitative Disclosures about Market Risk.”
Interest expense. Interest expense increased $2.0 million, or 21%, to $11.3 million during the six months ended June 30, 2006 from $9.3 million for the six months ended June 30, 2005. The increase in interest expense during the six months ended June 30, 2006 was due to increased interest rates under our credit facility and increased outstanding debt under our credit facility, senior notes and senior subordinated notes.
Income tax benefit. We are required to establish a net deferred tax liability or benefit calculated at the applicable federal and state tax rates resulting primarily from financial reporting and income tax reporting basis differences in natural gas and oil properties. Beginning in 2001, we established a valuation allowance which we increased periodically to reflect the uncertainty about the realization of the deferred tax asset. We increased the prior accumulated valuation allowance of $16.0 million for the six months ended June 30, 2006 by an additional $0.9 million, based on uncertainty surrounding our ability to utilize the entire balance of our deferred tax assets based on an analysis of whether we are more likely than not to receive such a benefit and if so, to what extent.
We recognized income tax expense of $0.3 million for the six months ended June 30, 2006 primarily due to the recognition of current federal alternative minimum tax of $0.07 million, current state income tax of $0.09 million and the recognition of $0.16 million in deferred state tax expense. The deferred tax expense in the amount of $0.16 million relates primarily to the implementation of the Texas margin tax.
Net loss. Due to the factors described above, a net loss of $6.0 million was recorded for the six months ended June 30, 2006 compared to a net loss of $16.9 million for the six months ended June 30, 2005.
Year Ended December 31, 2005 Compared to Year Ended December 31, 2004
Revenues. Revenues for the year ended December 31, 2005 increased $22.9 million, or 45%, to $73.6 million as compared to $50.7 million for the year ended December 31, 2004. This increase was due primarily to increases in the prices received for oil, natural gas and NGLs of 37%, 87% and 27%, respectively, which were partially offset by decreases in oil, natural gas and NGL production of 4%, 11% and 10%, respectively.
The average sales prices for oil, natural gas and NGLs for the year ended December 31, 2005 were $55.55 per Bbl, $7.98 per Mcf and $34.56 per Bbl, respectively, as compared to the average sales prices for oil, natural gas and NGLs for the year ended December 31, 2004 of $40.66 per Bbl, $4.27 per Mcf and $27.15 per Bbl, respectively. We had no oil hedging losses during the years ended December 31, 2004 or December 31, 2005 and no natural gas hedging losses during the year ended December 31, 2005. The average sales prices for natural gas received during the year ended December 31, 2004 were net of hedging losses of $1.66 per Mcf.
The 4% decrease in oil production was due primarily to production declines during the year ended December 31, 2005 in Louisiana and Texas of 30% and 14%, respectively. The decline in Louisiana and Texas production was due primarily to a loss of production from August through December 2005 of approximately 9,200 Bbls of oil as a result of mandatory shut-ins in response to Hurricanes Katrina and Rita and our subsequent inability to return to pre-hurricane production rates.
The 11% decrease in natural gas production was due primarily to production declines during the year ended December 31, 2005 in Louisiana, Oklahoma and Texas of 19%, 11% and 8%, respectively. Production decreases during the year ended December 31, 2005 resulted primarily from natural production declines in Texas and
56
Oklahoma, which are typical for tight gas sands, and decreases in production of approximately 87,000 Mcf in Louisiana due to Hurricanes Katrina and Rita. Reductions in our capital spending during the years ended December 31, 2003 and December 31, 2004 due to liquidity constraints delayed plans to offset natural declines in these areas with new production. Production during the year ended December 31, 2005 was also adversely affected by intermittent shut-ins necessary for repairs.
The decrease of 10% in NGL production was due primarily to the declines in natural gas production in Texas discussed above.
Lease operating expenses.Lease operating expenses for the year ended December 31, 2005 decreased $0.4 million, or 4%, to $11.6 million as compared to $12.0 million for the year ended December 31, 2004 and increased 5% per Mcfe during the year ended December 31, 2005 to $1.31 per Mcfe as compared to $1.25 per Mcfe during the year ended December 31, 2004. The decrease in lease operating expenses was due primarily to cost saving measures implemented during the year ended December 31, 2004. These cost saving measures included closing our Louisiana field office, reducing our field staff and reducing costs associated with producing certain marginal wells due to curtailment of daily production. The increase in lease operating expenses on a per Mcfe basis during the year ended December 31, 2005 was due primarily to a 8% decrease in production during 2005.
Production and ad valorem taxes.Production and ad valorem taxes for the year ended December 31, 2005 increased $0.2 million, or 8%, to $3.3 million from $3.1 million for the year ended December 31, 2004. The increase was due primarily to increases in revenues during the year ended December 31, 2005 as compared to the year ended December 31, 2004. Production and ad valorem taxes were 5% of revenues for both years which is lower than historical percentages due to current and retroactive exemptions granted by the State of Texas for high-cost natural gas.
General and administrative expenses.G&A for the year ended December 31, 2005 increased $0.2 million, or 2%, to $8.4 million as compared to $8.3 million for the year ended December 31, 2004. The increase in G&A was due primarily to an increase in professional fees of $0.2 million for the year ended December 31, 2005 and increased franchise taxes of $0.3 million during the year ended December 31, 2005 due primarily to our July 2004 financial restructuring. These costs were partially offset by reduced employee-related costs of $0.3 million resulting from staff reductions, attrition and cost saving reductions made throughout the year ended December 31, 2004.
Exploration expenses. Exploration expenses for the year ended December 31, 2005 increased $2.6 million, or 305%, to $3.5 million as compared to $0.9 million for the year ended December 31, 2004. The increase was due primarily to increases in dry hole costs and geological and geophysical costs of $1.7 million and $0.6 million, respectively, during the year ended December 31, 2005 as compared to the year ended December 31, 2004.
Depreciation, depletion and amortization.DD&A for the year ended December 31, 2005 decreased $10.5 million, or 34%, to $20.8 million as compared to $31.2 million for the year ended December 31, 2004. DD&A for the year ended December 31, 2005 decreased to $2.35, or 27% on a per-Mcfe basis, as compared to $3.24 for the year ended December 31, 2004. The decrease in DD&A expenses and the DD&A rate during the year ended December 31, 2005 was due primarily a significant decrease in depletable costs on our New Taiton field in Texas resulting from a impairment of $20.3 million at December 31, 2004. Additionally we experienced a decrease in production and an increase in reserves of 8% and 4%, respectively, for the year ended December 31, 2005 as compared to the year ended December 31, 2004 which further reduced the DD&A rate for the year ended December 31, 2005 and resulted in a significantly lower depletion rate during the year ended December 31, 2005. The decrease in DD&A during the year ended December 31, 2005 was due to the lower DD&A rate per Mcfe and the decrease in production.
Property impairments. Property impairments for the year ended December 31, 2005 decreased $19.5 million, or 94%, to $1.3 million as compared to $20.7 million for the year ended December 31, 2004. Property
57
impairments for the year ended December 31, 2004 were due primarily to a significant downward revision in reserves on our New Taiton field in Texas at year-end 2004, which resulted in a property impairment of $20.3 million. During the year ended December 31, 2005, we did not experience any significant reserve writedowns.
Loss on derivatives.Derivative loss for the year ended December 31, 2005 increased $27.2 million, or 413%, to $33.9 million as compared to $6.6 million during the year ended December 31, 2004. We recognized natural gas and oil realized losses of $11.9 million, natural gas and oil unrealized losses of $22.3 million and interest rate unrealized gains of $0.4 million during the year ended December 31, 2005. During the year ended December 31, 2004, we recognized natural gas and oil realized losses of $2.0 million and unrealized losses of $4.6 million. The increase in derivative losses for the year ended December 31, 2005 as compared to the year ended December 31, 2004 is due to significant price increases in natural gas and oil during the year ended December 31, 2005, an increase in production volumes covered under derivative arrangements during the year ended December 31, 2005 and differences in the accounting treatment of derivative arrangements during the first seven months of 2004 as compared to subsequent periods. Derivative arrangements for production prior to our July 2004 financial restructuring were designated as hedges under SFAS No 133; therefore, realized gains and losses were recorded as natural gas and oil sales and unrealized gains and losses were not reported in earnings. Subsequent to our July 2004 restructuring, we did not designate any of our derivative arrangements for future production as hedges under SFAS No 133; therefore, changes in fair market value and realized losses related to those derivative arrangements are reported in earnings as gain or loss on derivatives.
Interest and other income. Interest and other income for the year ended December 31, 2005 increased $0.4 million, or 176%, to $0.6 million as compared to $0.2 million for the year ended December 31, 2004. The increase was due primarily to gains on the sales of assets during the year ended December 31, 2005.
Interest expense. Interest expense increased $2.5 million, or 15%, to $19.5 million during the year ended December 31, 2005 from $17.0 million for the year ended December 31, 2004. The increase in interest expense during 2005 was due to increased borrowing under our credit facility and the issuance of additional senior notes and senior subordinated notes as interest paid in kind. These increases were partially offset by a decrease in interest rates under our credit facility during the year ended December 31, 2005.
Income tax benefit. We are required to establish a net deferred tax liability or benefit calculated at the applicable federal and state tax rates resulting primarily from financial reporting and income tax reporting basis differences in natural gas and oil properties. Our effective income tax rate of approximately 38.5% reflects the combined federal statutory rate and applicable state taxes. Beginning in 2001, we established a valuation allowance which we increased periodically to reflect the uncertainty about the realization of the deferred tax asset. During 2005, we increased the valuation allowance of $6.2 million by an additional $9.8 million based on uncertainty surrounding our ability to utilize the entire balance of our deferred tax assets based on an analyses of whether we are more likely than not to receive such a benefit and if so, to what extent.
Net loss. Due to the factors described above, we recorded a net loss of $27.8 million for the year ended December 31, 2005 compared to a net loss of $36.3 million for the year ended December 31, 2004.
Year Ended December 31, 2004 Compared to Year Ended December 31, 2003
Revenues. Revenues for the year ended December 31, 2004 increased $3.8 million, or 8%, to $50.7 million as compared to $47.0 million for the year ended December 31, 2003. This increase was due primarily to increases in the prices received for oil, natural gas (net of hedging losses) and NGLs of 37%, 14% and 27%, respectively, and a 12% increase in NGL production, which was partially offset by decreases in natural gas and oil production of 21% and 9%, respectively.
The average sales prices received for oil, natural gas and NGLs for the year ended December 31, 2004 were $40.66 per Bbl, $4.27 per Mcf and $27.15 per Bbl, respectively, as compared to average sales prices for oil,
58
natural gas and NGLs for the year ended December 31, 2003 of $29.60 per Bbl, $3.75 per Mcf and $21.37 per Bbl, respectively. The average sales prices received for natural gas during the year ended December 31, 2004 are net of natural gas hedging losses of $1.66 per Mcf. The average sales prices received during the year ended December 31, 2003 are net of natural gas and oil hedging losses of $0.54 per Bbl and $1.77 per Mcf, respectively.
The decreases of 9% in oil production and 21% in natural gas production during the year ended December 31, 2004 were due to several factors, including weather, repairs, natural production declines, particularly in south Texas, and curtailment of capital expenditures during late 2003 and 2004 due to liquidity constraints, which prevented us from offsetting natural production declines with new production.
The 12% increase in NGL production during the year ended December 31, 2004 was due primarily to the completion of several new wells in Texas during mid to late 2004.
Lease operating expenses.Lease operating expenses for the year ended December 31, 2004 increased $0.1 million, or 1%, to $12.0 million as compared to $11.9 million for the year ended December 31, 2003 and increased 19% to $1.25 per Mcfe for the year ended December 31, 2004 from $1.05 per Mcfe for the year ended December 31, 2003. The increase on a per-Mcfe basis is due to a 15% decrease in production during the year ended December 31, 2004 as compared to the year ended December 31, 2003.
Production and ad valorem taxes.Production and ad valorem taxes for the year ended December 31, 2004 decreased $1.2 million, or 28%, to $3.1 million for the year ended December 31, 2004 from $4.3 million during 2003 and on a Mcfe basis, decreased 16% to $0.32 per Mcfe during 2004 from $0.38 per Mcfe during the year ended December 31, 2003. This decrease was primarily attributable to current and retroactive exemptions for high-cost natural gas granted by the State of Texas during the year ended December 31, 2004. Additionally, we experienced increased sales on certain Oklahoma production, which is exempt from Oklahoma severance tax.
General and administrative expenses.G&A for the year ended December 31, 2004 decreased $2.1 million, or 20%, to $8.3 million as compared to $10.4 million for the year ended December 31, 2003. On a Mcfe basis, G&A decreased 6% to $0.86 per Mcfe during the year ended December 31, 2004 from $0.92 per Mcfe for the year ended December 31, 2003. The decrease in G&A was due primarily to decreases of $1.0 million in employee related costs due to staff attrition and employee terminations during the year ended December 31, 2004 and a $1.2 million reduction in franchise taxes resulting from the application of a credit from the overpayment of franchise taxes in 2002 and a decrease in Louisiana franchise taxes due primarily to our 2004 financial restructuring.
Exploration expenses. Exploration expenses for the year ended December 31, 2004 decreased $4.8 million, or 85%, to $0.9 million as compared to $5.6 million for the year ended December 31, 2003. The decrease in exploration expenses was due primarily to a decrease in dry hole costs. During 2003, we expensed $0.5 million on unsuccessful exploratory drilling projects. During 2002 and 2003, we incurred $4.7 million in capitalized exploration costs on drilling a deep exploratory well in our New Taiton field in south Texas. During 2003, the well was determined to be unsuccessful and the capitalized costs were expensed as exploration expense.
Depreciation, depletion and amortization. DD&A for the year ended December 31, 2004 increased $9.7 million, or 45%, to $31.2 million from $21.5 million for the year ended December 31, 2003 and increased 70% on a Mcfe basis to $3.24 per Mcfe during the year ended December 31, 2004 from $1.90 per Mcfe during the year ended December 31, 2003. The increase in DD&A during the year ended December 31, 2004 was due to a 37% decline in proved reserves as of December 31, 2004 as compared to the proved reserves as of December 31, 2003, see “—Overview—Reserve Write Down” above.
Property impairments.Property impairments for the year ended December 31, 2004 increased $16.9 million, or 445%, to $20.7 million as compared to $3.8 million for the year ended December 31, 2003. Property
59
impairments for the year ended December 31, 2004 increased due primarily to a significant downward revision in reserves on our New Taiton field in Texas at year-end 2004, which resulted in a property impairment of $20.3 million. During the year ended December 31, 2003, we recorded impairments primarily on our Manilla Village field in Louisiana due to a downward revision in reserves, which resulted in a $3.7 million property impairment.
Loss on derivatives.During July 2004 and subsequent periods, we entered into new derivative arrangements, which were not designated as hedges under SFAS No 133. Therefore, changes in fair market value and realized losses related to these new derivative arrangements are required to be reported in current earnings as a derivative loss. During the year ended December 31, 2004, we recorded $2.0 million in realized losses and $4.6 million in unrealized losses. In prior periods, all derivative arrangements were designated as hedges and realized gains and losses on derivative arrangements were recognized in natural gas and oil sales; therefore, no derivative gain or loss amounts were recognized as a derivative loss in such periods.
Interest and other income. Interest and other income for the year ended December 31, 2004 increased $0.2 million to $0.2 million for the year ended December 31, 2004. The increase was due primarily to gains on the sales of assets during the year ended December 31, 2004.
Interest expense.Interest expense for the year ended December 31, 2004 increased $3.3 million, or 24%, to $17.0 million from $13.7 million for the year ended December 31, 2003. The increase in interest expense was due to an increase in outstanding indebtedness during 2004 as a result of our July 2004 financial restructuring in which we issued our senior notes and senior subordinated notes in exchange for our old senior notes and senior subordinated notes, including all accrued and unpaid interest thereon. In addition, we did not incur indebtedness under our old senior notes until mid-2003 and accrued interest on those notes for only five months in 2003.
Income tax benefit. We are required to establish a net deferred tax liability calculated at the applicable federal and state tax rates resulting primarily from financial reporting and income tax reporting basis differences in natural gas and oil properties. Beginning in 2001, we established a valuation allowance which we increased periodically to reflect the uncertainty about the realization of the deferred tax asset. In 2003, we increased the valuation allowance of $0.4 million by an additional $0.6 million and during 2004, we increased the valuation allowance by an additional $5.2 million, resulting in a valuation allowance of $6.2 million as of December 31, 2004. The increases in the valuation allowance are based on uncertainty surrounding our ability to utilize the entire balance of our deferred tax assets based on an analysis of whether we are more likely than not to receive such a benefit and, if so, to what extent.
Net loss.Due to the factors described above, we recorded a net loss of $36.3 million for the year ended December 31, 2004 compared to a net loss of $15.4 million for the year ended December 31, 2003.
Liquidity and Capital Resources
Overview
Virtually all of our exploration expenditures and a significant portion of our development expenditures are discretionary expenditures that are made based on current economic conditions and expected future natural gas and oil prices. We make capital expenditures to develop existing natural gas and oil reserves as well as to acquire additional reserves through exploration or acquisition. We operate substantially all of our properties, which gives us significant flexibility in the timing of making capital expenditures on these properties. We may also choose not to participate in capital expenditures on properties operated by others. This flexibility allows us to adjust our annual exploration and development capital expenditure levels according to liquidity and the other sources of operating capital. When we determine that a project involves more risk than we can accept alone or more capital than is commercially prudent to commit, such as certain of our exploration projects, we may take on partners. Historically, we have financed, and we currently finance, our exploration and development programs with net cash provided by operating activities and borrowings under our credit facility. However, as of September 15,
60
2006, we had $1.6 million available for additional borrowings under our revolving credit facility and $15.0 million available for additional borrowings under our acquisition facility. Therefore, prior to the consummation of this offering and the application of the net proceeds thereof, we are limited in our ability to use our credit facility and must rely almost entirely on our cash flow from operations to meet our additional capital expenditure requirements.
Our cash flows from operating activities are significantly affected by changes in natural gas and oil prices. Accordingly, our cash flows from operating activities would be significantly reduced by lower natural gas and oil prices, which would also reduce our exploration and development capital expenditure levels. Lower natural gas and oil prices may also reduce our borrowing base under our credit facility which would further reduce our ability to obtain funds. However, in an effort to minimize fluctuations in our cash flows and to reduce our exposure to adverse fluctuations in the prices of natural gas and oil, we enter into derivative arrangements for a portion of our natural gas and oil production as further discussed under “—Qualitative and Quantitative Disclosures about Market Risk—Commodity Price Risk.”
Upon consummation of this offering, the application of the net proceeds therefrom and the Recapitalization, we believe that the cash we generate from operations and availability under our credit facility will be sufficient to satisfy our obligations through December 31, 2007. Our capital expenditure budget for 2006 is approximately $80.3 million, of which $59.7 million is targeted for drilling and workover and $17.8 million is targeted for leasehold acquisitions. Approximately 41% of our 2006 capital expenditure budget is allocated to acquisition, exploration and development of unconventional shale gas properties, and approximately 59% is allocated to exploration and development of our conventional resource properties, including our tight gas sands properties. Actual levels of capital expenditures may vary significantly due to many factors, including drilling results, natural gas and oil prices, industry conditions, participation by other working interest owners and the prices and availability of drilling rigs and other oilfield goods and services. The following table provides certain information about our 2006 capital expenditure budget:
| | | | | | | | | | | | | | | | | |
Area | | Drilling
and
Workover | | Land | | Equipment
and
Maintenance | | Seismic | | Total | | % of Total |
| | | (dollars in thousands) |
Unconventional shale gas: | | | | | | | | | | | | | | | | | |
Texas | | $ | 6,272 | | $ | 10,434 | | $ | — | | $ | 872 | | $ | 17,578 | | 21.9% |
Oklahoma | | | 8,025 | | | 1,268 | | | — | | | — | | | 9,293 | | 11.6% |
Appalachian region | | | 3,734 | | | 2,292 | | | — | | | 25 | | | 6,051 | | 7.5% |
| | | | | | | | | | | | | | | | | |
Subtotal | | | 18,031 | | | 13,994 | | | — | | | 897 | | | 32,922 | | 41.0% |
East Texas | | | 20,384 | | | 1,036 | | | — | | | 102 | | | 21,522 | | 26.8% |
South Texas | | | 15,960 | | | 2,108 | | | — | | | 253 | | | 18,321 | | 22.8% |
Other | | | 5,293 | | | 703 | | | 1,512 | | | — | | | 7,508 | | 9.4% |
| | | | | | | | | | | | | | | | | |
Total | | $ | 59,668 | | $ | 17,841 | | $ | 1,512 | | $ | 1,252 | | $ | 80,273 | | 100.0% |
| | | | | | | | | | | | | | | | | |
% of Total | | | 74.3% | | | 22.2% | | | 1.9% | | | 1.6% | | | 100.0% | | |
Cash flows
Operating activities. For the six months ended June 30, 2006, net cash provided by operating activities increased $3.6 million, or 25%, to $18.3 million as compared to $14.7 million of net cash provided by operating activities for the six months ended June 30, 2005. This increase was due primarily to changes in assets and liabilities providing $2.7 million in cash for the six months ended June 30, 2006 as compared to changes in assets and liabilities using $0.7 million in cash for the six months ended June 30, 2005. The changes in assets and liabilities for the six months ended June 30, 2006 provided cash due primarily to an increase in trade payables and accrued liabilities resulting from increased capital expenditures and a decrease in natural gas and oil receivables resulting from declining natural gas and oil sales. These increases in cash were partially offset by
61
decreases in cash due to an increase in joint interest receivables resulting from increased capital expenditures and increased outside ownership participation during the first six months of 2006, an increase in other assets due primarily to capitalization of deferred costs associated with this offering and a decrease in natural gas and oil revenue payables resulting from decreased natural gas sales during June of 2006. The changes in assets and liabilities for the six months ended June 30, 2005 used cash primarily for the payment of trade payables.
For the year ended December 31, 2005, net cash provided by operating activities increased $14.1 million, or 81%, to $31.5 million as compared to $17.4 million of net cash provided by operating activities for the year ended December 31, 2004. This increase was due primarily to an increase of $4.4 million in total revenues net of expenses (adjusted for non-cash items) for the year ended December 31, 2005 as compared to the year ended December 31, 2004, as well as to changes in operating assets and liabilities providing $1.7 million of cash for operating activities during the year ended December 31, 2005 as compared to $8.0 million of cash used for operating activities for the year ended December 31, 2004. The increase in total revenues net of expenses for the year ended December 31, 2005 resulted primarily from increased revenues of $22.9 million, partially offset by increased realized derivative losses of $10.6 million, increased exploration expenses of $2.6 million and increased interest expense of $1.2 million. Changes in operating assets and liabilities for the year ended December 31, 2005 provided $1.7 million of cash due primarily to an increase in trade payables and accrued liabilities resulting from increased capital expenditures during the year as compared to $8.0 million of cash used during the year ended December 31, 2004, primarily for the payment of trade payables that had not been paid during the prior year due to liquidity constraints.
For the year ended December 31, 2004, net cash provided by operating activities increased $0.4 million, or 3%, to $17.4 million compared to $17.0 million of net cash provided by operating activities for the year ended December 31, 2003. We used $2.2 million of cash for interest expense for the year ended December 31, 2004 as compared to $13.0 million of cash used for interest expense for the year ended December 31, 2003. The reduction in cash used for interest expense for the year ended December 31, 2004 was primarily attributable to our July 2004 restructuring which allowed us to pay interest on our senior notes and senior subordinated notes in the form of additional notes instead of in cash. Additionally, total revenues net of total expenses (adjusted for non-cash items) increased $11.9 million for the year ended December 31, 2005 as compared the year ended December 31, 2004. The increase in cash was partially offset by a reduction in cash for changes in operating assets and liabilities using $8.0 million of cash for operating activities during the year ended December 31, 2004 compared to $14.2 million of cash provided by operating activities for the year ended December 31, 2003. Cash was used during the year ended December 31, 2004 primarily for the payment of trade payables that had not been paid during the year ended December 31, 2003 due to liquidity constraints which contributed to the $14.3 million of cash provided during the year ended December 31, 2003.
Investing Activities. Substantially all of our investing activities involve capital expenditures. For the six months ended June 30, 2006, net cash used in investing increased $19.2 million, or 111%, to $36.5 million as compared to $17.3 million of net cash used in investing activities for the six months ended June 30, 2005. This increase was due primarily to an increase in capital expenditures of $20.3 million, or 124%, to $36.6 million for the six months ended June 30, 2006 compared to capital expenditures of $16.3 million for the six months ended June 30, 2005, as further described below. Additionally, we used $1.2 million of cash during the six months ended June 30, 2005 to acquire all of the outstanding capital stock of Dyne Exploration Company.
For the year ended December 31, 2005, net cash used in investing activities increased $12.4 million, or 55%, to $35.0 million as compared to $22.6 million of net cash used in investing activities for the year ended December 31, 2004. This increase was due primarily to an increase in capital expenditures of $11.6 million, or 50%, to $34.6 million for the year ended December 31, 2005 compared to capital expenditures of $23.0 million for the year ended December 31, 2004, as further described below. Additionally, we used $1.2 million of cash during the year ended December 31, 2005 to acquire all of the outstanding capital stock of Dyne Exploration Company.
For the year ended December 31, 2004, net cash used in investing activities decreased $16.5 million, or 42%, to $22.6 million as compared $39.1 million of net cash used in investing activities for the year ended
62
December 31, 2003. The decrease was due primarily to a decrease in capital expenditures of $16.1 million, or 41%, to $23.0 million for the year ended December 31, 2004 as compared to $39.1 million of capital expenditures for the year ended December 31, 2003, as further described below.
The following table summarizes the major components of capital expenditures for the following periods (in thousands):
| | | | | | | | | | | | | | | |
| | | Year Ended December 31, | | Six Months Ended
June 30, |
| | | 2003 | | 2004 | | 2005 | | 2005 | | 2006 |
Unproved property acquisitions | | $ | 127 | | $ | 1,045 | | $ | 5,454 | | $ | 908 | | $ | 9,116 |
Proved property acquisitions | | | 1,410 | | | 449 | | | 1,748 | | | 382 | | | 46 |
Exploration activities | | | 319 | | | 3,725 | | | 5,370 | | | 2,822 | | | 10,671 |
Development activities | | | 36,489 | | | 17,724 | | | 21,820 | | | 12,125 | | | 16,628 |
Other property | | | 776 | | | 42 | | | 196 | | | 59 | | | 93 |
| | | | | | | | | | | | | | | |
Total | | $ | 39,121 | | $ | 22,985 | | $ | 34,588 | | $ | 16,296 | | $ | 36,554 |
| | | | | | | | | | | | | | | |
Financing Activities. For the six months ended June 30, 2006, net cash provided by financing activities increased $13.9 million, or 305%, to $18.4 million as compared to $4.6 million of net cash provided by financing activities for the six months ended June 30, 2005. This increase was primarily the result of borrowings under our credit facility during the six months ended June 30, 2006.
For the year ended December 31, 2005, net cash provided by financing activities increased $2.5 million, or 149%, to $4.1 million as compared to $1.7 million of net cash provided by financing activities for the year ended December 31, 2004. The increase was due primarily to an increase in borrowings under our credit facility during the year ended December 31, 2005.
For the year ended December 31, 2004, net cash provided by financing activities decreased $24.6 million, or 94%, to $1.7 million as compared to $26.2 million of net cash provided by financing activities for the year ended December 31, 2003. The decrease was due primarily to decreased borrowings under our credit facility and our senior notes during the year ended December 31, 2004. We had borrowings under our credit facility of $2.4 million during the year ended December 31, 2004 as compared to borrowing under our credit facility and our senior notes of $4.4 million and $24.0 million, respectively, during the year ended December 31, 2003. Additionally, we used $2.1 million of cash to pay accrued but unpaid dividends on our Series B preferred stock in connection with its mandatory conversion to common stock in August 2003.
Contractual Obligations and Commitments
The following is a summary of our contractual obligations and commitments as of December 31, 2005:
| | | | | | | | | | | | | | | |
| | | Total | | Payments due by Period |
| | | | Less than 1
Year | | 1 – 3
Years | | 3 – 5
Years | | More than 5
Years |
| | | (in thousands) |
Credit facility (1) | | $ | 64,274 | | $ | 3,798 | | $ | 7,596 | | $ | 52,880 | | $ | — |
Senior notes (2) | | | 64,259 | | | — | | | — | | | 64,259 | | | — |
Senior subordinated notes (2) | | | 166,004 | | | — | | | — | | | 166,004 | | | — |
Operating leases | | | 3,237 | | | 239 | | | 896 | | | 870 | | | 1,232 |
Accrued abandonment costs (3) | | | 10,570 | | | 517 | | | 3,743 | | | 776 | | | 5,534 |
Fair value of derivatives (4) | | | 28,512 | | | 11,469 | | | 14,925 | | | 2,118 | | | — |
Series A preferred stock accrued dividends (5) | | | 12,865 | | | — | | | — | | | — | | | 12,865 |
| | | | | | | | | | | | | | | |
Total | | $ | 349,721 | | $ | 16,023 | | $ | 27,160 | | $ | 286,907 | | $ | 19,631 |
| | | | | | | | | | | | | | | |
63
| (1) | Represents required payments on outstanding borrowings plus estimated interest through maturity. See “Use of Proceeds.” Interest payments on floating-rate debt were estimated using December 31, 2005 interest rates applicable to the floating-rate debt. Actual payments will fluctuate as interest rates fluctuate. |
| (2) | Represents the outstanding principal amount of the notes plus estimated interest thereon through maturity. All outstanding principal and accrued interest are expected to be repaid or exchanged for common stock in connection with this offering and the Recapitalization. See “Use of Proceeds” and “Recapitalization.” Interest is payable semi-annually in kind by the issuance of new notes. The issuances of new notes for payment of interest in kind are excluded from the above table until the notes mature and are included at the maturity period. Assumes no extension of the maturity dates of the notes. |
| (3) | Accrued abandonment costs are based on estimates. The timing and amounts of cash settlements may vary from the amounts presented. |
| (4) | Commitments under our natural gas, oil and interest rate derivative instruments are based on market values, which fluctuate month to month. Actual cash settlements will be calculated based on applicable NYMEX natural gas and oil prices at the time of settlement and may vary significantly from the amounts presented. See “—Quantitative and Quantitative Disclosures about Market Risk.” |
| (5) | Cash payments for preferred stock accrued dividends are at our option or at the option of the holder in the event of a change of control. |
On a pro forma basis, after giving effect to the Recapitalization, this offering and the application of the use of proceeds therefrom to repay long-term debt, as described in “Use of Proceeds” and “Recapitalization,” our contractual obligations and commitments as of December 31, 2005 would have consisted of the following:
| | | | | | | | | | | | | | | |
| | | Total | | Payments due by Period |
| | | | Less than 1
Year | | 1 – 3
Years | | 3 – 5
Years | | More than 5
Years |
| | | (in thousands) |
Credit facility (1) | | $ | | | $ | | | $ | | | $ | | | $ | — |
Operating leases | | | 3,237 | | | 239 | | | 896 | | | 870 | | | 1,232 |
Accrued abandonment costs (2) | | | 10,570 | | | 517 | | | 3,743 | | | 776 | | | 5,534 |
Fair value of derivatives (3) | | | 28,512 | | | 11,469 | | | 14,925 | | | 2,118 | | | — |
| | | | | | | | | | | | | | | |
Total | | $ | | | $ | | | $ | | | $ | | | $ | |
| | | | | | | | | | | | | | | |
| (1) | Reflects repayment of $ million of indebtedness with a portion of the net proceeds of this offering. See “Use of Proceeds.” |
| (2) | Accrued abandonment costs are based on estimates. The timing and amounts of cash settlements may vary from the amounts presented. |
| (3) | Commitments under our natural gas, oil and interest rate derivative instruments are based on market values, which fluctuate month to month. Actual cash settlements will be calculated based on applicable NYMEX natural gas and oil prices at the time of settlement and may vary significantly from the amounts presented. See “—Quantitative and Quantitative Disclosures about Market Risk.” |
Credit Facility
On July 27, 2004, we completed a financial restructuring that permitted the operating subsidiaries of Ascent Energy Inc., as borrowers, to enter into a new credit facility with a new group of lenders. In connection with our financial restructuring, Ascent Energy Inc. reorganized as a holding company by transferring all of our natural gas and oil operations to certain operating subsidiaries of Ascent Energy Inc. Our Parent and each operating subsidiary of Ascent Energy Inc. are borrowers under our credit facility. Ascent Energy Inc. is not a borrower under our credit facility, but is a party thereto and subject to certain restrictions thereunder. The stock of Ascent Oil and Gas Inc., which is the direct wholly owned subsidiary of Ascent Energy Inc., and substantially all of the
64
assets of the operating subsidiaries of Ascent Energy Inc., are pledged to our bank lenders to secure the obligations of the borrowers under our credit facility. If an event of a default were to occur under our credit facility, our lenders would have no recourse to Ascent Energy Inc., other than to the stock of Ascent Oil and Gas Inc., but would have recourse to all of our revenue generating assets.
Our credit facility provides for loans to finance our future acquisition opportunities and to assist in meeting our working capital requirements. Our lenders periodically re-determine our borrowing base by applying criteria similar to those used with similarly situated natural gas and oil borrowers.
Subject to our borrowing base (currently set at $80.0 million), our credit facility provides for borrowings of up to $115.0 million, which includes a $100.0 million revolving credit facility and a $15.0 million acquisition facility. Borrowings under our revolving credit facility mature on November 1, 2009. As of September 15, 2006, we had $1.6 million available for additional borrowings under our revolving credit facility and $15.0 million available for additional borrowings under our acquisition facility.
Our credit facility provides for interest periods of one, two, three or six months for LIBOR loans. We can also elect to pay interest at a base rate calculated by reference to the higher of the federal funds rate or Fortis Bank’s prime rate. In the case of London Interbank Offered Rate, or LIBOR, loans or base rate loans, we are required to pay an additional interest rate margin that varies with the aggregate amount of loans and letters of credit outstanding under the line of credit. Our interest rate on our outstanding borrowings as of June 30, 2006 was 8.62%.
Under our acquisition facility, we are permitted to borrow up to 70% of the net discounted present value of proved reserves that we acquire. Advances under the acquisition facility are required to be repaid on the later of the six-month anniversary of the advance or the three-month anniversary of the date of the first borrowing base redetermination following the advance and may be repaid in cash or converted to borrowings under our credit facility. If a conversion of an acquisition advance at its maturity would exceed our borrowing base, we are permitted to convert the amount in excess of our borrowing base to a term loan.
Our credit facility contains various covenants that, among other restrictions, limit the ability of Ascent Energy Inc., its operating subsidiaries and our Parent to: grant or assume liens; enter into derivative arrangements above certain limitations; incur indebtedness; change the nature of our business; or enter into agreements to merge or acquire assets. Our credit facility also limits the ability of the operating subsidiaries of Ascent Energy Inc. and our Parent to allow a change of control; engage in transactions with affiliates; sell assets; make loans or advances to third parties; make investments; create subsidiaries or amend their organizational documents. In addition, our credit facility prohibits the operating subsidiaries of Ascent Energy Inc. and our Parent from making cash dividends, cash redemptions or cash distributions unless certain financial tests are satisfied, the then outstanding borrowings do not exceed our borrowing base and no default under our credit facility exists or is anticipated as a result of payment of the dividend, redemption or distribution.
Additionally, our credit agreement requires that as of the last day of any fiscal quarter:
| | • | | we have a consolidated tangible net worth of at least $170.0 million; |
| | • | | our ratio of current assets (which includes remaining availability under our credit facility) to current liabilities is 1.0 to 1.0; |
| | • | | our ratio of total debt to EBITDAX for the immediately preceding four fiscal quarters be not greater than 2.5 to 1.0; and |
| | • | | our ratio of EBITDAX to an amount equal to cash interest expense plus dividends, if any, from our direct subsidiary for the immediately preceding four fiscal quarters be at least 2.5 to 1.0. |
EBITDAX is defined in our credit facility as earnings before interest expense; income tax (expense) benefit; depreciation, depletion and amortization; exploration expenses; any other item expensed under successful efforts
65
accounting and capitalized under full cost accounting, such as property impairments; and any other non-cash items deducted at arriving in earnings, such as non-cash hedging and derivative losses and cumulative effect of change in accounting principle. As of June 30, 2006, we were in compliance with all of the covenants under our credit facility.
Our credit facility limits the ability of Ascent Energy Inc. to modify or amend the terms of the senior notes or the indenture governing the senior subordinated notes generally and prohibits Ascent Energy Inc. from amending or modifying the senior notes or the indenture governing the senior subordinated notes to provide for cash interest payments or a maturity date that is earlier than 90 days after the maturity date of our credit facility. Ascent Energy Inc. is also prohibited from engaging in any activity other than in connection with the ownership of its shares of stock in Ascent Oil and Gas Inc., but it may form and own additional subsidiaries which would not be restricted in the nature of their businesses.
Our Parent will remain a borrower under our credit facility and therefore will be subject to the same covenants and restrictions thereunder after it becomes a wholly owned subsidiary of Ascent Energy Inc. pursuant to the Parent Merger.
Recapitalization
Upon the consummation of this offering, the application of the net proceeds of this offering as described in “Use of Proceeds” and the consummation of the Recapitalization, all of our senior notes and senior subordinated notes will be extinguished and our outstanding long-term indebtedness will consist solely of approximately $ million of borrowings under our credit facility. In connection with this offering and the Recapitalization, we intend to repay in cash or exchange for common stock all indebtedness outstanding under our senior notes and our senior subordinated notes and to repay $ million of borrowings outstanding under our credit facility. We also expect that all of our outstanding Series A preferred stock (including accrued but unpaid dividends thereon) and all warrants to purchase shares of our common stock (other than the Merger Warrants) will be exchanged for an aggregate of shares of our common stock at a ratio of shares of our common stock for each $1,000 of Series A preferred stock (including accrued but unpaid dividends thereon). All such warrants to purchase shares of our common stock are substantially out-of-the-money and will be cancelled in connection with the Preferred Exchange. We expect to pay an aggregate of $ in exchange for the cancellation of Merger Warrants to purchase shares of our common stock at an exercise price of $ per share and that Merger Warrants to purchase shares of our common stock at an exercise price of $ per share will remain outstanding until January 14, 2007, unless earlier exercised by the holders thereof . The Jefferies Investors and The TCW Funds are the principal holders of our senior notes, our senior subordinated notes, our Series A preferred stock and our warrants and will receive cash and shares of our common stock in this offering and the Recapitalization. Our executive officers are expected to participate in the Incentive Issuance and to receive a portion of the net proceeds of this offering and shares of our common stock in connection with this offering and the Recapitalization. See “Management—Termination of 2005 Incentive Plan,” “Related Party Transactions—Termination of 2005 Incentive Plan” and “Principal Stockholders.”
Senior Notes. On November 9, 2005, we issued approximately $33.5 million aggregate principal amount of our 16% senior notes due February 1, 2010 (or such later date as automatically extended in accordance with the terms of the notes, but in no event later than February 1, 2015) in exchange for all then-outstanding principal and accrued but unpaid interest on our 16% senior notes due October 26, 2007, which we refer to as the old senior notes. The old senior notes were issued on July 27, 2004 in connection with our financial restructuring in exchange for all then-outstanding principal and accrued but unpaid interest on certain promissory notes that we issued during 2003 for short-term liquidity needs.
The senior notes are senior unsecured obligations and are not guaranteed by any of our subsidiaries. The senior notes are effectively subordinated to all indebtedness and other liabilities of our subsidiaries, including indebtedness under our credit facility. Interest on the senior notes accrues at a rate of 16% per annum and is payable semi-annually, in the form of additional senior notes. On April 30, 2006, we paid the accrued interest on the senior notes by issuing an additional $2.6 million in senior notes.
During each of the years 2006 through 2010, each holder of senior notes has the right, during the 30-day period beginning on September 1 of each such year, to deliver written notice to us rejecting any further extension of the maturity date of such holder’s senior notes. If the holder fails to deliver such notice on a timely basis, the
66
maturity date of such holder’s senior notes will be automatically extended by one calendar year from the then applicable maturity date. Any senior notes that are the subject of a timely delivered notice will become due and payable at the then applicable maturity date.
Senior Subordinated Notes.On November 9, 2005, we issued approximately $99.6 million aggregate principal amount of our 11 3/4% senior subordinated notes due May 1, 2011 (or such later date as automatically extended in accordance with the terms of the notes, but in no event later than May 1, 2015) in exchange for all then-outstanding principal and accrued but unpaid interest on our 11 3/4% senior subordinated notes due 2008, which we refer to as the old senior subordinated notes. The old senior subordinated notes were issued on July 27, 2004 in connection with our financial restructuring in exchange for all then-outstanding principal and accrued but unpaid interest on our 11 3/4% Series A senior notes due 2006 which were originally issued on June 28, 2001 in connection with our acquisition of our south Texas properties.
The senior subordinated notes are subordinate in right of payment to the senior notes and are effectively subordinated to all indebtedness and other liabilities of our subsidiaries, including indebtedness under our credit facility. Interest on the senior subordinated notes accrues at a rate of 11 3/4% per annum and is payable semi-annually in the form of additional senior subordinated notes. On April 30, 2006, we paid the accrued interest on the senior subordinated notes by issuing an additional $5.6 million in senior subordinated notes.
During each of the years 2006 through 2010, each holder of senior subordinated notes has the right, during a 30-day period beginning on July 15 of each such year, to deliver written notice to us rejecting any further extension of the maturity date of such holder’s senior subordinated notes. If the holder fails to deliver such notice on a timely basis, the maturity date of such holder’s senior subordinated notes will be automatically extended by one calendar year from the then applicable maturity date. Any senior subordinated notes that are the subject of a timely delivered notice will become due and payable at the then applicable maturity date.
8% Series A Preferred Stock and Warrants. As of June 30, 2006, we had outstanding 41,100 shares of our 8% Series A preferred stock, par value $0.001 per share, and warrants to purchase an additional 3,000 shares of our Series A preferred stock at an exercise price of $333.33 per share. Dividends on our Series A preferred stock accrue at the rate of 8% per annum. Accrued but unpaid dividends do not bear interest. Our board of directors has never declared or paid any dividends on the outstanding shares of Series A preferred stock. Each outstanding share of Series A preferred stock, and each share issuable upon exercise of the warrants described above, was or will be issued with a warrant to purchase 191.943 shares of our common stock at an exercise price of $5.21 per share (exercise price will be adjusted to $ per share in connection with the reverse stock split). As of June 30, 2006, we had outstanding warrants to purchase 7,888,858 shares of our common stock. On a pro forma basis, assuming the exercise of all outstanding warrants to purchase shares of our Series A preferred stock and giving effect to the reverse stock split, we would have had outstanding warrants to purchase shares of our common stock as of June 30, 2006.
Inflation
Historically, general inflationary trends have not had a material effect on our operating revenue or expenses. However, we have experienced inflationary pressure on technical staff compensation and the cost of oilfield services and equipment due to the increase in drilling activity and competitive pressures from higher natural gas and oil prices in recent years.
Quantitative and Qualitative Disclosures about Market Risk
Commodity price risk.Our revenue, profitability and future rate of growth substantially depend upon market prices of natural gas and oil, which fluctuate widely. Natural gas and oil price decline and volatility could adversely affect our revenue, net cash provided by operating activities and profitability. For example, assuming a 10% decline in realized natural gas and oil prices, our net loss attributable to common stock for the six months ended June 30, 2006 would have increased by approximately 49% from a loss of $7.6 million to a loss of $11.4 million. If the costs and expenses of operating our properties had increased by 10% for the six months ended June 30, 2006, our net loss attributable to common stock would have increased by approximately 8% from a loss of $7.6 million to a loss of $8.3 million.
67
We have entered into derivative arrangements with respect to portions of our natural gas and oil production to reduce our sensitivity to volatile commodity prices. Our credit facility requires us to enter into derivative instruments covering a minimum of 50% of our production for the three-year period following the effective date of the credit facility, but not in excess of 85% for the 12-month period immediately subsequent to any fiscal quarter, of our forecast proved developed producing reserves. Our management limits the periods covered by derivative instruments to the term of the credit facility. Historically, our derivative arrangements have been puts, price swaps and costless collar agreements. We believe that these derivative arrangements, although not free of risk, allow us to achieve a more predictable cash flow and to reduce exposure to price fluctuations. However, derivative arrangements limit the benefit to us of increases in the prices of natural gas and oil sales. Moreover, our derivative arrangements apply only to a portion of our production and provide only partial price protection against declines in prices. Additionally, these arrangements may expose us to risk of financial loss in certain circumstances. We continuously reevaluate our derivative arrangements in light of market conditions, commodity price forecasts, capital spending and debt service requirements. We do not enter into derivative transactions for trading purposes.
Fixed price swaps typically require monthly payments by us (if prices rise) or provide payments to us (if prices fall) based on the difference between the strike price and the agreed-upon average of either New York Mercantile Exchange, or NYMEX, or other widely recognized index prices. Currently, all of our derivative arrangements are settled based on NYMEX pricing.
Collar contracts set a minimum price, or floor, and a maximum price, or ceiling, and provide payments to us if the NYMEX price falls below the floor or require payments by us if the NYMEX price rises above the ceiling.
Puts provide payment to us if the NYMEX price falls below the strike price. If the NYMEX price is above the strike price, we have no payment obligation.
Currently, our natural gas contracts settle using the near-month NYMEX prices for the next to last trading day or the last trading day of the month. Our crude oil contracts settle using the average of the near month closing price for each day of the month.
In connection with our July 2004 financial restructuring, Fortis Energy LLC, an affiliate of one of the underwriters in this offering, assumed our then existing derivative arrangements, which we refer to as the old derivative arrangements, and replaced them with new derivative arrangements. As of that date, we had a $4.0 million liability under our old derivative arrangements representing a deferred loss which we recognized on our balance sheet as a current asset and a corresponding derivative liability. The deferred loss was amortized monthly into earnings over the related contract periods, which were August 2004 through December 2004, and settlement of the liability will occur monthly through June 2007 as the new derivative arrangements are settled. The old derivative arrangements qualified for hedge accounting treatment under SFAS 133; therefore, amortization of the deferred loss was recognized in natural gas sales.
Our new derivative arrangements are not designated as hedges under SFAS 133; therefore, changes in fair market value and realized gains and losses related to our new derivative arrangements are reported in current earnings.
As of June 30, 2006, the fair market value of our natural gas and oil derivative arrangements was a liability of $30.6 million, which includes the remaining liability of $1.1 million related to the deferred loss on the old derivative arrangements. The fair market values of our derivative arrangements as of June 30, 2006 are reflected on our balance sheet in current assets (fair value of derivatives) in the amount of $0.7 million, in other assets (fair value of derivatives) in the amount of $20,000, in current liabilities (fair value of derivatives) in the amount of $13.2 million and in long-term liabilities (fair value of derivatives) in the amount of $18.1 million.
68
As of June 30, 2006 our natural gas and oil derivative arrangements were as follows:
| | | | | | | | | | | | | | |
Natural Gas (MMBtu) | | Quantity | | Ceiling | | Floor | | Fixed Price | | Put |
2006 | | | | | | | | | | | | | | |
July 1, 2006 to October 31, 2006 | | 410,820 | | | — | | | — | | $ | 7.26 | | | — |
July 1, 2006 to October 31, 2006 | | 69,741 | | $ | 8.20 | | $ | 5.00 | | | — | | | — |
July 1, 2006 to October 31, 2006 | | 139,359 | | | — | | | — | | | — | | $ | 5.00 |
July 1, 2006 to October 31, 2006 | | 503,894 | | $ | 8.05 | | $ | 6.25 | | | — | | | — |
November 1, 2006 to December 31, 2006 | | 246,986 | | $ | 13.65 | | $ | 8.00 | | | — | | | — |
November 1, 2006 to December 31, 2006 | | 176,290 | | $ | 6.75 | | $ | 4.65 | | | — | | | — |
November 1, 2006 to December 31, 2006 | | 92,720 | | $ | 10.25 | | $ | 5.50 | | | — | | | — |
2007 | | | | | | | | | | | | | | |
January 1, 2007 to March 31, 2007 | | 260,100 | | $ | 6.75 | | $ | 4.65 | | | — | | | — |
January 1, 2007 to June 30, 2007 | | 275,120 | | $ | 10.25 | | $ | 5.50 | | | — | | | — |
January 1, 2007 to March 31, 2007 | | 315,912 | | $ | 13.65 | | $ | 8.00 | | | — | | | — |
April 1, 2007 to June 30, 2007 | | 234,780 | | | — | | | — | | $ | 7.26 | | | — |
April 1, 2007 to October 31, 2007 | | 509,999 | | $ | 10.95 | | $ | 7.00 | | | — | | | — |
July 1, 2007 to December 31, 2007 | | 920,000 | | $ | 9.05 | | $ | 5.00 | | | — | | | — |
November 1, 2007 to December 31, 2007 | | 78,436 | | $ | 13.95 | | $ | 8.00 | | | — | | | — |
2008 | | | | | | | | | | | | | | |
January 1, 2008 to March 31, 2008 | | 179,230 | | $ | 13.95 | | $ | 8.00 | | | — | | | — |
January 1, 2008 to December 31, 2008 | | 1,460,000 | | $ | 9.05 | | $ | 5.00 | | | — | | | — |
April 1, 2008 to October 31, 2008 | | 298,551 | | $ | 9.60 | | $ | 7.00 | | | — | | | — |
November 1, 2008 to December 31, 2008 | | 56,808 | | $ | 12.25 | | $ | 8.00 | | | — | | | — |
2009 | | | | | | | | | | | | | | |
January 1, 2009 to March 31, 2009 | | 154,402 | | $ | 12.25 | | $ | 8.00 | | | — | | | — |
January 1, 2009 to June 30, 2009 | | 543,000 | | $ | 9.05 | | $ | 5.00 | | | — | | | — |
April 1, 2009 to October 31, 2009 | | 647,304 | | $ | 8.55 | | $ | 6.75 | | | — | | | — |
| | | | | | | | | | | | | | |
Total | | 7,573,452 | | | | | | | | | | | | |
| | | | | | | | | | | | | | |
Oil (Bbls) | | Quantity | | Ceiling | | Floor | | Fixed Price | | Put |
2006 | | | | | | | | | | | | | | |
July 1, 2006 to August 31, 2006 | | 3,410 | | $ | 60.50 | | $ | 50.00 | | | — | | | — |
July 1, 2006 to December 31, 2006 | | 77,675 | | | — | | | — | | $ | 61.56 to $64.68 | | | — |
July 1, 2006 to December 31, 2006 | | 156,400 | | | — | | | — | | $ | 44.95 | | | — |
2007 | | | | | | | | | | | | | | |
January 1, 2007 to June 30, 2007 | | 25,010 | | $ | 56.50 | | $ | 47.00 | | | — | | | — |
January 1, 2007 to June 30, 2007 | | 135,750 | | | — | | | — | | $ | 44.95 | | | — |
January 1, 2007 to December 31, 2007 | | 105,725 | | | — | | | — | | $ | 64.80 to $65.03 | | | — |
July 1, 2007 to December 31, 2007 | | 147,200 | | $ | 50.00 | | $ | 42.50 | | | — | | | — |
2008 | | | | | | | | | | | | | | |
January 1, 2008 to December 31, 2008 | | 255,500 | | $ | 50.00 | | $ | 42.50 | | | — | | | — |
January 1, 2008 to December 31, 2008 | | 101,960 | | | — | | | — | | $ | 64.00 to $64.74 | | | — |
2009 | | | | | | | | | | | | | | |
January 1, 2009 to June 30, 2009 | | 108,600 | | $ | 50.00 | | $ | 42.50 | | | — | | | — |
January 1, 2009 to October 31, 2009 | | 154,328 | | | — | | | — | | $ | 63.37 to $63.94 | | | — |
| | | | | | | | | | | | | | |
Total | | 1,271,558 | | | | | | | | | | | | |
| | | | | | | | | | | | | | |
We also incur gains and losses on our interest rate derivative instruments. See “—Quantitative and Qualitative Disclosures about Market Risk.”
69
The following table shows the effect of our natural gas and oil derivative instruments on our consolidated income statements for the periods presented (in thousands):
| | | | | | | | | | | | | | | | | | | | | | | | | | | |
| | | Natural Gas and Oil
Derivatives Designated as Hedges | | | Natural Gas and Oil Derivatives Not Designated as Hedges | |
| | | Cash
Settlements (1) | | | Amortization (2) | | | Reduction in
Oil and Gas
Sales (3) | | | Cash
Settlements (1) | | | Amortization of
Old Derivative
Arrangements (4) | | Unrealized
Gains
(Losses) | | | Derivative
Gains
(Losses) (5) | |
2003 | | | | | | | | | | | | | | | | | | | | |
1st Quarter | | $ | (3,962 | ) | | $ | (122 | ) | | $ | (4,084 | ) | | $ | — | | | $ | — | | $ | — | | | $ | — | |
2nd Quarter | | | (2,941 | ) | | | (122 | ) | | | (3,063 | ) | | | — | | | | — | | | — | | | | — | |
3rd Quarter | | | (2,461 | ) | | | (122 | ) | | | (2,583 | ) | | | — | | | | — | | | — | | | | — | |
4th Quarter | | | (2,213 | ) | | | (6 | ) | | | (2,219 | ) | | | — | | | | — | | | — | | | | — | |
| | | | | | | | | | | | | | | | | | | | | | | | | | | |
Total | | $ | (11,577 | ) | | $ | (372 | ) | | $ | (11,949 | ) | | $ | — | | | $ | — | | $ | — | | | $ | — | |
| | | | | | | | | | | | | | | | | | | | | | | | | | | |
2004 | | | | | | | | | | | | | | | | | | | | |
1st Quarter | | $ | (1,645 | ) | | $ | — | | | $ | (1,645 | ) | | $ | — | | | $ | — | | $ | — | | | $ | — | |
2nd Quarter | | | (2,168 | ) | | | — | | | | (2,168 | ) | | | — | | | | — | | | — | | | | — | |
3rd Quarter | | | (775 | ) | | | (1,484 | ) | | | (2,259 | ) | | | (973 | ) | | | 411 | | | (7,537 | ) | | | (8,099 | ) |
4th Quarter | | | — | | | | (2,474 | ) | | | (2,474 | ) | | | (1,858 | ) | | | 407 | | | 2,946 | | | | 1,495 | |
| | | | | | | | | | | | | | | | | | | | | | | | | | | |
Total | | $ | (4,588 | ) | | $ | (3,958 | ) | | $ | (8,546 | ) | | $ | (2,831 | ) | | $ | 818 | | $ | (4,591 | ) | | $ | (6,604 | ) |
| | | | | | | | | | | | | | | | | | | | | | | | | | | |
2005 | | | | | | | | | | | | | | | | | | | | |
1st Quarter | | $ | — | | | $ | — | | | $ | — | | | $ | (1,481 | ) | | $ | 254 | | $ | (15,062 | ) | | $ | (16,289 | ) |
2nd Quarter | | | — | | | | — | | | | — | | | | (2,494 | ) | | | 469 | | | 332 | | | | (1,693 | ) |
3rd Quarter | | | — | | | | — | | | | — | | | | (4,654 | ) | | | 475 | | | (15,038 | ) | | | (19,217 | ) |
4th Quarter | | | — | | | | — | | | | — | | | | (4,779 | ) | | | 332 | | | 7,457 | | | | 3,010 | |
| | | | | | | | | | | | | | | | | | | | | | | | | | | |
Total | | $ | — | | | $ | — | | | $ | — | | | $ | (13,408 | ) | | $ | 1,530 | | $ | (22,311 | ) | | $ | (34,189 | ) |
| | | | | | | | | | | | | | | | | | | | | | | | | | | |
2006 | | | | | | | | | | | | | | | | | | | | |
1st Quarter | | $ | — | | | $ | — | | | $ | — | | | $ | (2,423 | ) | | $ | 206 | | $ | (966 | ) | | $ | (3,183 | ) |
2nd Quarter | | | — | | | | — | | | | — | | | | (2,430 | ) | | | 339 | | | (1,706 | ) | | | (3,797 | ) |
| | | | | | | | | | | | | | | | | | | | | | | | | | | |
Total | | $ | — | | | $ | — | | | $ | — | | | $ | (4,853 | ) | | $ | 545 | | $ | (2,672 | ) | | $ | (6,980 | ) |
| | | | | | | | | | | | | | | | | | | | | | | | | | | |
| (1) | Cash settlements of derivative arrangements are included in net cash provided by operating activities. |
| (2) | Amortization during 2003 relates to premium on oil put options. Amortization during 2004 relates to deferred loss under old derivative arrangements. |
| (3) | The ineffectiveness of these hedges was tested and determined to be immaterial. |
| (4) | Amortization relates to cash settlement of old derivative arrangements which qualified as hedges and were expensed in the prior year as a reduction of natural gas and oil sales. The amortization period for settlement of old derivative arrangements extends through June 2007. |
| (5) | Derivative loss for the year ended December 31, 2005 includes a $34.2 million loss on natural gas and oil derivatives and a $0.4 million gain on interest rate derivatives. Derivative loss for the quarter ended March 31, 2006 includes a $3.2 million loss on natural gas and oil derivatives and a $0.2 million gain on interest rate derivatives. Derivative loss for the quarter ended June 30, 2006 includes a $3.8 million loss on natural gas and oil derivatives and a $0.1 million gain on interest rate derivatives. |
Based on NYMEX crude oil futures prices as of June 30, 2006, we would expect to make future cash payments of $21.6 million to settle our crude oil derivative arrangements as they mature. If future prices of
70
natural gas and oil were to decline by 10%, we would expect to make future cash payments under our crude oil derivative arrangements of $9.9 million, and if future prices were to increase by 10% we would expect to make future cash payments of $32.9 million.
Interest Rate Risk.As of June 30, 2006, we had outstanding $68.2 million of floating-rate debt attributable to borrowings under our credit facility. As a result, our interest expense fluctuates based on changes in short-term interest rates. A hypothetical 10% change in the short-term interest rate (approximately 81 basis points) would have a $0.2 million impact on interest expense and a $0.2 million impact on net loss for the six months ended June 30, 2006.
We enter into derivative transactions to secure a fixed interest rate for a portion of our debt under our credit facility. The primary objective of these transactions is to reduce our exposure to the possibility of rising interest rates during the term of the derivative transactions. We currently use fixed rate interest swaps for these purposes. Fixed rate interest swaps are not designated as hedges; therefore, gains and losses resulting from these derivative arrangements are reported as they occur as derivative loss on our consolidated statements of operations. We do not enter into derivative transactions for trading purposes.
Our fixed rate interest swaps typically provide monthly payments to us (if rates rise) or by us (if rates fall) based on the difference between the strike price and the LIBOR. All of our fixed rate interest swaps are with affiliates of the financial institutions that are parties to our credit facility.
As of June 30, 2006, we had fixed rate interest swaps for $30.0 million per day for the period July 1, 2006 through July 27, 2007 at a fixed rate of 3.98%. For the six months ended June 30, 2006, we had realized gains of $72,000 relating to these swaps, and their fair market value was a net unrealized receivable of $546,000 of which $513,000 was recorded on our balance sheet as a current asset (fair value of derivatives) and $33,000 of which was recorded on our balance sheet as an other asset (fair value of derivatives).
Based on LIBOR as of June 30, 2006, we would expect to receive future cash payments of $0.5 million to settle our fixed rate interest swaps as they mature. If interest rates were to decline by 10%, we would expect to receive future cash payments under these derivative arrangements of $0.4 million, and if interest rates were to increase by 10% we would expect to receive future cash payments under these derivative arrangements of $0.7 million.
71
BUSINESS AND PROPERTIES
Overview
We are a growth-oriented, independent natural gas and oil company engaged in the acquisition, exploration and development of both conventional and unconventional natural gas and oil properties in Texas, Oklahoma, Louisiana and the Appalachian region. Our growth efforts are directed primarily at finding and developing natural gas reserves in unconventional shale gas areas and in known tight gas areas. We operate substantially all of our properties.
Since joining us in mid-2003, our senior management team has embarked on a strategy to acquire and develop a risk-balanced inventory of high growth opportunities, predominately in shale gas. In order to implement this strategy, our new management initially devoted a substantial portion of its efforts to improving our operational efficiency and increasing our liquidity. Since 2004, our management has successfully added unconventional shale gas acreage in four large shale gas exploration areas and entered the tight gas areas of the Cotton Valley trend in east Texas.
Our unconventional shale gas acreage acquired through June 30, 2006 consists of approximately 144,235 gross acres (89,654 net acres) located in the Woodford/Barnett shale in west Texas, the Barnett shale in north Texas, the Woodford shale and the Caney shale in Oklahoma and the Devonian shale in the Appalachian region. We have employed a strategy to acquire a meaningful position in several prospective shale gas areas to diversify risk while providing exposure to significant potential reserves.
As of June 30, 2006, most of our current production was from our approximate 64,510 gross acres (37,385 net acres) of conventional natural gas and oil properties in Texas, Oklahoma and Louisiana, which includes our acreage in the tight gas sands of the Cotton Valley trend in east Texas and the Vicksburg and Wilcox trends in south Texas. Each of these fields is characterized by established production profiles and numerous producing wells. We plan to expand our production and reserves from such conventional areas by further developing our current properties as well as acquiring additional properties that we believe can generate near-term production and cash flow.
Based on reserve reports prepared by our independent reserve engineering firms, our total proved reserves as of December 31, 2005 were approximately 106.1 Bcfe, of which 51.7% were proved developed producing and 10.5% were proved developed non-producing and 60.3% were oil and NGLs. As of June 30, 2006, we had interests in approximately 127,039 net acres, including approximately 103,843 net undeveloped acres. Our average net daily production during June 2006 was approximately 23.4 MMcfe/d. As of December 31, 2005, the related PV-10 of our proved reserves was $371.3 million. Our 2005 reserve reports do not reflect any reserves attributable to our unconventional shale gas acreage.
Ascent Energy Inc. was incorporated on July 9, 2001 as a wholly owned subsidiary of our Parent to acquire natural gas and oil properties in Louisiana, Texas and Oklahoma. In July 2001, our Parent contributed to Ascent Energy Inc. substantially all of its assets and liabilities which consisted primarily of natural gas and oil properties in Louisiana and Texas. In August 2001, Ascent Energy Inc. acquired Pontotoc Production, Inc. which held primarily natural gas and oil properties in Oklahoma. In connection with that acquisition, Ascent Energy Inc. issued shares of its convertible preferred stock to the former stockholders of Pontotoc Production, Inc. When those shares automatically converted into shares of common stock of Ascent Energy Inc. in August 2003, our Parent’s ownership of Ascent Energy Inc. was reduced to 83% of the outstanding shares of common stock of Ascent Energy Inc. Prior to mid-2003, when our new management team joined us, we focused primarily on the acquisition, exploitation, exploration, development and production of conventional natural gas and oil properties in Louisiana, Texas and Oklahoma.
72
Our Strengths
High Quality Asset Base in Mature Producing Basins.Our producing properties, consisting of approximately 36,330 gross acres (23,196 net acres) as of June 30, 2006, are located in prolific producing areas of south and east Texas, Oklahoma and Louisiana, with long histories of natural gas and oil production. We support our unconventional shale gas exploration with the cash flow generated from these mature properties. The average net daily production from these mature properties was 23.3 MMcfe/d during June 2006.
Significant Growth Opportunities. We have an attractive inventory of drilling projects, which we believe contains significant production growth opportunities. We believe our approximate two-year inventory of conventional and tight gas drilling projects will generate near-term production growth and cash flow. In addition, we have acquired acreage positions in several unconventional shale gas areas where industry drilling and production activity has increased in the past several years. If our initial unconventional shale gas drilling projects are successful, we expect to increase significantly our long-term reserves, production and drilling inventory. Additionally, we expect to add to our existing acreage position, which will provide additional growth potential.
Effective Risk Management. Our areas of operation provide us with geographic, geological and operational diversity. Our diversified inventory of conventional and unconventional resource drilling locations ranges from lower risk development locations to higher risk exploration locations, including most of our unconventional shale gas acreage, that expose us to opportunities for greater reserve and production growth. We believe that the diversity of our asset base helps reduce our overall risk profile.
Experienced, Incentivized Management Team with Strong Technical Capability. Our senior management team has on average more than 28 years of industry experience and has considerable technical expertise in engineering, geoscience and field operations. Our in-house technical personnel have extensive experience in geology, geophysics, engineering and drilling and completion technology, including horizontal drilling and fracturing technology. Our officers will beneficially own approximately % of our common stock after the consummation of this offering and the Recapitalization.
Our Business Strategy
Drive Growth Through the Drillbit.We intend to create near-term reserve and production growth from our approximate two-year inventory of drilling opportunities. We anticipate most of our cash flow in the next several years will be generated from our existing producing properties and proved reserves as well as our lower-risk drilling opportunities, exploration and development. We intend to allocate a significant portion of our exploration budget to our higher-risk unconventional shale gas exploration and our tight gas sands exploration.
Focus on Growing Our Inventory of Shale Gas Opportunities. We intend to continue expanding our acreage positions in multiple shale gas areas. As of June 30, 2006, we had leasehold interests in approximately 144,235 gross (89,654 net) acres of prospective shale gas property over four areas. We have budgeted approximately $14.0 million to acquire shale gas acreage in 2006.
Pursue Tight Gas Sand Opportunities. We are pursuing multiple tight gas sand opportunities. We believe that our tight gas sand areas have significant potential reserves that have not been depleted by the use of past drilling and completion techniques. We typically pursue opportunities in known tight gas sand areas that have existing infrastructure to transport natural gas to the market. We have budgeted approximately $36.3 million to drill 16 wells in our tight gas sand operations in south and east Texas by the end of 2006.
Operate Substantially All of Our Assets.We serve as the operator of substantially all of our producing properties and intend to continue to do so in the future. Operating control enables us to better control timing and
73
risk as well as the cost of exploration and development drilling and ongoing operations. We believe that in the competitive market for drilling rigs it is advantageous to be in a position to make longer term commitments to drilling rig operators in order to secure service.
Maintain Financial Flexibility. Following the completion of this offering and our anticipated Recapitalization, we will have increased our equity capital base by over $ million and will have approximately $ million of undrawn availability under our credit facility. We believe that future cash flow and access to the capital markets following this offering will provide us with financial flexibility that both enhances our ability to execute our business plan and allows us to selectively seek and complete acquisitions. We expect to use our commodity price risk management program to protect our ability to execute our capital expenditure program and service our debt. We may also to reduce our existing derivative liability with a portion of the net proceeds of this offering, which should increase our flexibility and could increase our future cash flow.
Seek Acquisitions that Complement Our Exploration and Development Plans. We pursue acquisitions that add efficiency to our existing operations or represent attractive additions to our exploration and development prospect inventory in large, mature producing regions. We direct our acquisitions toward areas with long production histories or areas where we believe significant untapped reserve potential exists. We maintain a disciplined acquisition process to help ensure that acquisitions fit our strategic and financial objectives.
Our Areas of Operation
We operate in Texas, Oklahoma, Louisiana and the Appalachian region. The following table presents descriptive information about our natural gas and oil properties based on our 2005 reserve reports prepared by our independent reserve engineering firms:
| | | | | | | | |
Field | | Estimated
Net Proved Reserves (1) (MMcfe) | | PV-10 (2)
(in thousands) | | %
Developed | |
Texas: | | | | | | | | |
La Copita | | 22,323 | | $ | 72,570 | | 44.9 | % |
Rosita | | 2,238 | | | 8,188 | | 93.3 | % |
New Taiton | | 3,191 | | | 18,378 | | 100.0 | % |
Other | | 3,268 | | | 6,066 | | 36.6 | % |
| | | | | | | | |
Subtotal | | 31,020 | | $ | 105,202 | | 53.2 | % |
| | | |
Oklahoma: | | | | | | | | |
Northeast Fitts | | 20,870 | | $ | 67,225 | | 82.6 | % |
Allen | | 31,238 | | | 103,076 | | 52.7 | % |
Other | | 10,726 | | | 34,011 | | 72.1 | % |
| | | | | | | | |
Subtotal | | 62,834 | | $ | 204,312 | | 66.0 | % |
| | | |
Louisiana: | | | | | | | | |
Lake Enfermer | | 5,546 | | $ | 32,238 | | 53.6 | % |
Boutte | | 4,947 | | | 23,283 | | 100.0 | % |
Other | | 1,742 | | | 6,268 | | 10.6 | % |
| | | | | | | | |
Subtotal | | 12,235 | | | 61,789 | | 66.2 | % |
| | | | | | | | |
Total | | 106,089 | | $ | 371,303 | | 62.3 | % |
| | | | | | | | |
| (1) | In accordance with SEC requirements, our estimated net proved reserves were determined using year-end posted prices for natural gas and oil: |
| | | |
Natural gas (per MMBtu) | | $ | 8.17 |
Oil (per Bbl) | | $ | 57.75 |
74
| (2) | PV-10 may be considered a non-GAAP financial measure; therefore, the following table reconciles our calculation of PV-10 to the standardized measure of discounted future net cash flows, which is the most comparable GAAP financial measure. PV-10 is the computation of the standardized measure of discounted future net cash flows on a pre-tax basis. Our reserve estimates have been calculated using the prices for natural gas and oil in note 1 above. The prices in note 1 above do not reflect adjustments for quality, transportation fees, energy content and regional price differentials as included in the calculation of our reserve estimates. We estimate that if natural gas prices declined by $0.25 per Mcf from the price used in determining our proved reserves as of December 31, 2005, the PV-10 of our proved reserves as of December 31, 2005 would decrease from $371.3 million to $364.9 million and the quantity of our reserves would decline by 825 MMcf of natural gas and 40,000 Bbls of oil and NGLs. We estimate that if oil prices declined by $1.00 per Bbl from the price used in determining our proved reserves as of December 31, 2005, then the PV-10 of our proved reserves as of December 31, 2005 would decrease from $371.3 million to $366.5 million and the quantity of our reserves would decline by 43 MMcf of natural gas and 44,300 Bbls of oil and NGLs. Estimates of PV-10 of reserves and the quantity of reserves would likely decline at a rate proportionately greater than specified above if natural gas and oil prices decline significantly from those used in calculating such estimates. Management believes that the presentation of the non-GAAP financial measure of PV-10 provides useful information to investors because it is widely used by professional analysts and sophisticated investors in evaluating natural gas and oil companies. Management also believes that PV-10 is relevant and useful for evaluating the relative monetary significance of our natural gas and oil properties. Further, professional analysts and sophisticated investors may use the measure as a basis for comparison of the relative size and value of our reserves to other companies’ reserves. Management also uses this pre-tax measure when assessing the potential return on investment related to our natural gas and oil properties and in evaluating acquisition candidates. Because there are many unique factors that can impact an individual company when estimating the amount of future income taxes to be paid, we believe the use of a pre-tax measure is valuable for evaluating us. PV-10 is not a measure of financial or operating performance under GAAP, nor is it intended to represent the current market value of our estimated natural gas and oil reserves. PV-10 should not be considered in isolation or as a substitute for the standardized measure of discounted future net cash flows as defined under GAAP. |
| | | | | | | | | | | | |
| | | Year Ended December 31, | |
| | | 2003 | | | 2004 | | | 2005 | |
| | | (in thousands) | |
Future cash inflows | | $ | 911,612 | | | $ | 664,223 | | | $ | 986,683 | |
Less: Future production costs | | | (235,308 | ) | | | (199,622 | ) | | | (276,962 | ) |
Less: Future development costs | | | (56,733 | ) | | | (48,002 | ) | | | (56,042 | ) |
| | | | | | | | | | | | |
Future net cash flows | | | 619,571 | | | | 416,599 | | | | 653,679 | |
Less: 10% discount factor | | | (240,077 | ) | | | (176,967 | ) | | | (282,376 | ) |
| | | | | | | | | | | | |
PV-10 | | | 379,494 | | | | 239,632 | | | | 371,303 | |
Less: Undiscounted income taxes | | | (187,825 | ) | | | (102,131 | ) | | | (179,732 | ) |
Plus: 10% discount factor | | | 80,046 | | | | 52,821 | | | | 89,357 | |
| | | | | | | | | | | | |
Discounted income taxes | | | (107,777 | ) | | | (49,310 | ) | | | (90,375 | ) |
| | | | | | | | | | | | |
Standardized measure of discounted future net cash flows | | $ | 271,715 | | | $ | 190,322 | | | $ | 280,928 | |
| | | | | | | | | | | | |
As of June 30, 2006, our estimated net proved reserves were 100.8 Bcfe, which was determined using June 30, 2006 posted prices, in accordance with SEC guidelines of $6.04 per MMBtu of natural gas and $70.50 per Bbl of oil and includes 61.5 Bcfe attributable to our Oklahoma properties, 27.7 Bcfe attributable to our Texas properties and 11.6 Bcfe attributable to our Louisiana properties. Our reserve estimates are based on reserve reports prepared by our independent reserve engineers. See “Business and Properties—Proved Reserves.” The standardized measure of discounted future net cash flows from our total proved natural gas and oil reserves as of December 31, 2005 was $280.9 million.
75
Operating Area Production
The following table sets forth our production for the areas and periods presented:
| | | | | | |
Operating Area | | Total
Production for
Year Ended
December 31,
2005 (MMcfe) | | Total Production
for the Six
Months Ended
June 30, 2006
(MMcfe) | | June 2006
Average Net
Daily
Production
(Mcfe/d) |
Texas: | | | | | | |
Cotton Valley trend | | 22 | | 258 | | 1,070 |
Vicksburg trend | | 2,578 | | 1,123 | | 5,981 |
Wilcox trend | | 1,324 | | 605 | | 3,347 |
| | | | | | |
Subtotal | | 3,924 | | 1,986 | | 10,398 |
| | | |
Oklahoma: | | | | | | |
Northeast Fitts | | 1,650 | | 892 | | 5,081 |
Allen Anticline | | 1,661 | | 756 | | 4,060 |
Other | | 328 | | 176 | | 867 |
| | | | | | |
Subtotal | | 3,639 | | 1,824 | | 10,008 |
| | | |
Louisiana: | | | | | | |
Lake Enfermer | | 631 | | 287 | | 1,534 |
Boutte | | 580 | | 238 | | 1,272 |
Other | | 51 | | 26 | | 113 |
| | | | | | |
Subtotal | | 1,262 | | 551 | | 2,919 |
| | | | | | |
Total | | 8,825 | | 4,361 | | 23,325 |
| | | | | | |
| | | |
Unconventional shale gas: | | | | | | |
Texas: | | | | | | |
Woodford/Barnett shale | | — | | — | | — |
Barnett shale | | — | | — | | — |
| | | | | | |
Subtotal | | — | | — | | — |
| | | |
Oklahoma: | | | | | | |
Woodford shale | | — | | 8 | | 99 |
Caney shale | | — | | 1 | | 20 |
| | | | | | |
Subtotal | | — | | 9 | | 119 |
| | | |
Appalachian region: | | | | | | |
Devonian shale | | — | | — | | — |
| | | | | | |
Total | | — | | 9 | | 119 |
| | | | | | |
Conventional Natural Gas and Oil
As of June 30, 2006, most of our current production was from our approximate 64,510 gross acres (37,385 net acres) of conventional natural gas and oil properties in Texas, Oklahoma and Louisiana, which includes our acreage in the tight gas sands of the Cotton Valley trend in east Texas and the Vicksburg and Wilcox trends in south Texas. Each of these fields is characterized by established production profiles and numerous producing wells. We plan to expand our production and reserves from such conventional areas by further developing our current properties as well as acquiring additional properties that we believe can generate near-term production and cash flow.
76
Texas
East Texas. Our growth strategy also includes acquiring property in tight gas sand areas in east Texas that has existing infrastructure to transport natural gas to market. This area is characterized by lower exploration and development risk than many of our other projects. We believe there are several offset opportunities that can be enhanced with the use of modern completion and stimulation techniques, which we believe can be used to increase our production and proved reserves. We began acquiring leasehold interests and drilling in this area in the fourth quarter of 2005. As of June 30, 2006, we had drilled nine wells in this area with a 100% success rate. As of June 30, 2006, we had acquired leasehold interests in approximately 5,280 gross (3,159 net) acres in the tight gas sands of the Cotton Valley trend. We are the operator of this acreage with working interests ranging from 38% to 100%. Our year-end December 31, 2005 proved reserves from this acreage are associated with 12 proved undeveloped and proved developed producing locations. We believe the depths of the formation range from 9,500 feet to 11,500 feet.
South Texas. We are continuously seeking to expand our acreage in south Texas, including the Vicksburg and Wilcox trends, by acquiring property located in mature producing areas that we believe can generate near-term production and cash flow. As of June 30, 2006, we owned leasehold interests in approximately 4,228 gross (3,337 net) acres in the Vicksburg trend and approximately 4,736 gross (4,018 net) acres in the Wilcox trend, including producing acreage in the region. From January 1, 2006 to June 30, 2006, we drilled three wells in this area with a 100% success rate. We are the operator of this acreage with working interests ranging from 75% to 100%. As of June 30, 2006, we had 34 producing wells in this region. Our year-end December 31, 2005 proved reserves from this acreage are associated with 49 proved undeveloped and proved developed producing locations.
| | • | | Vicksburg Trend. The La Copita field is located in the Vicksburg trend in east-central Starr County. We are the operator of this field with working interests ranging from 53% to 100%. Cumulative production from this field, including our interests, exceeds 353.9 Bcfe. Our proved reserves in this field are associated with 11 proved undeveloped and 25 proved developed producing locations. We are working to expand our acreage in this area. We have completed a successful three-well development program, which could turn into an inventory of 8 to 15 wells. We also plan to increase our in-fill drilling from 40-acre to 20-acre spacing. We have 3-D seismic data over a significant portion of this field. We believe the depths of the formation range from 9,000 feet to 11,000 feet. |
| | • | | Wilcox Trend. The Rosita field is located in Duval County and the New Taiton field is located in Wharton County in the Wilcox trend. We are the operator of these fields with working interests ranging from 50% to 100%. These fields are highly developed and mature, and generate capital for use in other properties. We have 3-D seismic data over a significant portion of these fields. We believe the depths of the formation in the Rosita field range from 9,500 to 14,000 feet and in the New Taiton field range from 7,000 feet to 12,500 feet. We have farmed out 50% of our deep rights to the Rosita field in exchange for a carried interest in a well drilled in this field in 2005. |
Oklahoma
Northeast Fitts Field. The Northeast Fitts field is located in southern Pontotoc County. This field produces oil primarily from two reservoirs, the McAlester Lower Pennsylvanian Sandstone at approximately 1,300 feet in depth and the Hunton Devonian Limestone at approximately 3,900 feet in depth. In 2002, we initiated a waterflood recompletion on the deeper Hunton interval and began an in-fill drilling program to ten-acre spacing in 2003, which should be completed by the end of 2008. To date, we have seen no conclusive evidence of an enhanced recovery response due to the waterflood recompletion or the in-fill drilling program. Our current production in the Hunton interval comes from primary depletion drive natural gas and oil reserves as a result of our drilling program, which commenced in late 2002. We are the operator of this unit with a working interest of approximately 91%. Our proved reserves in this field are associated with 15 proved undeveloped locations. This field is highly developed and mature, and generates capital for use in other properties.
77
Allen Field. The Allen field is located in Pontotoc County. We also hold leasehold interests in the Byng field, the Roper Beebee field and other minor fields in Pontotoc County, which are all part of the Allen Anticline trend. We operate the wells in which we have an interest within the Allen field with working interests ranging from 50% to 100%. Our proved reserves in this area are associated with 37 proved undeveloped locations. We currently use our Pontotoc Gas Gathering System, operated by our wholly-owned subsidiary Pontotoc Gathering, L.L.C., to transport substantially all of our production generated from this field.
Louisiana
Lake Enfermer Field. The Lake Enfermer field is located in a marsh area on a deep, complex faulted salt structure in Lafourche Parish. Currently, we hold leasehold interests in approximately 2,532 gross acres in this field. We are the operator of this field with working interests ranging from 82% to 100%. We own 3-D seismic data over a significant portion of this field. We currently have plans to expand our exploratory drilling within this field. We also operate a small gathering line at this field to transport our production generated from this field.
Boutte Field. The Boutte field is located in St. Charles Parish. We have a 100% working interest in approximately 3,089 acres of which 2,640 acres are held by production.
Unconventional Shale Gas
Our growth strategy is primarily directed at acquiring opportunities for reserve growth in long-lived reservoirs in unconventional shale gas areas. We expect to invest between $30.0 million and $35.0 million in 2006 for leasehold acquisitions, drilling and testing of unconventional shale gas acreage. Typically, the exploration and development of unconventional shale gas reserves involves five stages: (i) acquisition of a significant leasehold interest, (ii) drilling and evaluation of several initial test wells, (iii) development of area-specific well completion and fracturing techniques, (iv) connecting to a natural gas transportation system and (v) establishment of a drilling program that exploits a substantial portion of the leased acreage. Unlike with most conventional reservoirs, the determination whether the development of our unconventional resource acreage is economically viable could take one to two years from the time we assemble a significant leasehold position. Our unconventional shale gas acreage is located in regions that have experienced significant increases in industry leasing and drilling activity in the past several years. We intend to acquire additional leasehold interests in unconventional shale gas regions. We have used, or expect to use, vertical drilling for each of our initial test wells to determine the areas in which we intend to expand our drilling program. In the areas where these initial test wells are successful, we also have used, or expect to use, horizontal drilling and completion technology to explore and develop these regions.
Shale gas formations are usually located in broad, contiguous geographic areas, often over hundreds of square miles or more. This characteristic allows us to acquire pieces of a resource pool over continuous acreage or acreage located within close proximity, which allows us to take advantage of operational efficiencies. Also, if unconventional shale gas exploration is successful, there is a greater likelihood that the surrounding area will produce reserves, and since we often hold continuous acreage or acreage located within a close proximity, we can establish multiple producing wells within the area. The following is a brief summary of our unconventional shale gas acreage:
West Texas Woodford/Barnett Shale. As of June 30, 2006, we had acquired leasehold interests in approximately 80,078 gross (55,498 net) acres in this region, primarily located in Brewster County. We are currently drilling our initial test wells in this region. We are the operator of this acreage with an average working interest of approximately 65%. We believe the depths of these formations range from 4,400 feet to 10,000 feet and the thickness ranges from 80 to 400 feet.
North Texas Barnett Shale. As of June 30, 2006, we had acquired leasehold interests in approximately 13,764 gross (13,282 net) acres in this region. We expect to drill our initial test wells on a portion of this acreage
78
in the first half of 2007. We are the operator of this acreage with a 100% working interest. The leasehold interests we hold in this area are located on emerging, raw acreage in the Barnett shale rather than the proven developed portion. We believe the depths of this formation range from 4,000 feet to 6,000 feet and the thickness ranges from 80 to 135 feet.
Oklahoma Woodford Shale and Caney Shale. As of June 30, 2006, we had acquired leasehold interests in approximately 7,629 gross (2,469 net) acres in the Woodford shale and approximately 3,848 gross (2,850 net) acres in the Caney shale. We have drilled and completed our first vertical test well in the Woodford shale. Based on the initial production results of approximately 411 Mcf/d from this well, we plan to drill six additional wells in the Woodford shale during the remainder of 2006. Based on recent industry activity, we expect to use horizontal drilling to explore and develop this region. We are the operator of our Woodford shale acreage with working interests ranging from 50% to 80%. We believe the depths of this formation range from 4,500 to 7,500 feet. We have also drilled our initial horizontal well in the Caney shale. We are also the operator of our Caney shale acreage with working interests ranging from 50% to 80%. We believe the depths of this formation range from 3,500 feet to 5,000 feet. We believe the thickness of the Woodford shale formation ranges from 80 to 150 and the thickness of the Caney Shale ranges from 40 to 150 feet.
Appalachian Devonian Shale. As of June 30, 2006, we had acquired leasehold interests in approximately 38,916 gross (15,555 net) acres in this region. We have initiated a five-well drilling program to test for natural gas and gather data that will help determine the most appropriate drilling and completion strategy. We expect to continue completion and testing of this area throughout 2006. We are the operator of this acreage with a 42% working interest. We believe the depths of the formation range from 3,400 feet to 4,600 feet and the thickness ranges from 280 to 325 feet. During September 2006, we entered into a non-binding agreement to acquire the outside 58% working interest in this region, which would bring our working interest to 100%. This agreement is subject to the negotiation of definitive documentation satisfactory to all parties, and consummation will be subject to customary closing conditions.
Proved Reserves
Of our approximately 106.1 Bcfe of proved reserves as of December 31, 2005, 62.3% were proved developed and 60.3% were oil and NGLs. The following table presents our estimated net proved natural gas and oil reserves and the present value of our estimated net proved reserves as of December 31, 2003, 2004 and 2005 based on reserve reports prepared by our independent reserve engineering firms. All calculations of estimated net proved reserves have been made in accordance with the rules and regulations of the SEC and, except as otherwise indicated, give no effect to federal or state income taxes. For additional information regarding our reserves, please readthe information regarding oil and gas activities beginning on page F-32 and “Risk Factors—Any significant inaccuracies in our reserve estimates, or the underlying assumptions on which such estimates were based, could materially affect the quantities and present value of our reserves.” The PV-10 and standardized measure of discounted future net cash flows shown in the table are not intended to represent the current market value of our estimated market value or our estimated natural gas and oil reserves.
| | | | | | | | | |
| | | As of December 31, |
| | | 2003 | | 2004 | | 2005 |
| | | (dollars in thousands) |
Estimated net proved reserves (1): | | | | | | | | | |
Oil (MBbls) | | | 13,620 | | | 9,578 | | | 9,572 |
Natural gas (MMcf) | | | 80,423 | | | 37,311 | | | 42,066 |
NGLs (MBbls) (2) | | | — | | | 1,119 | | | 1,098 |
Total (MMcfe) | | | 162,141 | | | 101,491 | | | 106,089 |
PV-10 (3) | | $ | 379,494 | | $ | 239,632 | | $ | 371,303 |
Standardized measure of discounted future net cash flows (3) | | $ | 271,715 | | $ | 190,322 | | $ | 280,928 |
79
| (1) | In accordance with SEC requirements, our estimated net proved reserves, PV-10 and the standardized measure of discounted future net cash flows were determined using the following year-end posted prices for natural gas and oil: |
| | | | | | | | | |
| | | Year Ended December 31, |
| | | 2003 | | 2004 | | 2005 |
Natural gas (per MMBtu) | | $ | 5.97 | | $ | 5.74 | | $ | 8.17 |
Oil (per Bbl) | | $ | 29.25 | | $ | 40.00 | | $ | 57.75 |
| (2) | Oil reserve data as of December 31, 2003 includes NGLs. |
| (3) | See note 3 to “Summary—Summary Historical Reserve and Operating Data.” |
Our independent reserve engineers also prepared reports of our estimated net proved natural gas and oil reserves as of June 30, 2006. As of June 30, 2006, our estimated net proved reserves were 100.8 Bcfe, which included 37,401 MMcf of natural gas and 10,569 MBbls of oil and NGLs. These estimates were determined using a price of $6.04 per MMBtu of natural gas and $70.50 per Bbl of oil as compared to our December 31, 2005 year-end pricing of $8.17 per MMBtu of natural gas and $57.75 per Bbl of oil.
Production, Price and Expense History
The following table presents summary information concerning our production results, average sales prices and production expenses for the periods presented:
| | | | | | | | | | | | | | | | | |
| | | Year Ended December 31, | | Six Months Ended
June 30, |
| | | 2003 | | | 2004 | | | 2005 | | 2005 | | 2006 |
Production data: | | | | | | | | | | | | | | | | | |
Oil (MBbls) | | | 688 | | | | 625 | | | | 598 | | | 309 | | | 298 |
Natural gas (MMcf) | | | 6,545 | | | | 5,158 | | | | 4,592 | | | 2,348 | | | 2,324 |
NGLs (MBbls) | | | 107 | | | | 120 | | | | 107 | | | 60 | | | 43 |
Total (MMcfe) | | | 11,318 | | | | 9,630 | | | | 8,826 | | | 4,560 | | | 4,370 |
Average prices: | | | | | | | | | | | | | | | | | |
Oil (per Bbl) | | $ | 30.14 | | | $ | 40.66 | | | $ | 55.55 | | $ | 50.79 | | $ | 65.95 |
Effects of hedging | | | (0.54 | ) | | | — | | | | — | | | — | | | — |
| | | | | | | | | | | | | | | | | |
Oil price (net of hedging) | | $ | 29.60 | | | $ | 40.66 | | | $ | 55.55 | | $ | 50.79 | | $ | 65.95 |
Natural gas (per Mcf) | | $ | 5.52 | | | $ | 5.93 | | | $ | 7.98 | | $ | 6.32 | | $ | 7.00 |
Effects of hedging | | | (1.77 | ) | | | (1.66 | ) | | | — | | | — | | | — |
| | | | | | | | | | | | | | | | | |
Natural gas price (net of hedging) | | $ | 3.75 | | | $ | 4.27 | | | $ | 7.98 | | $ | 6.32 | | $ | 7.00 |
NGLs (per Bbl) | | $ | 21.37 | | | $ | 27.15 | | | $ | 34.56 | | $ | 29.76 | | $ | 39.41 |
Combined (per Mcfe): | | | | | | | | | | | | | | | | | |
Price | | $ | 5.23 | | | $ | 6.15 | | | $ | 8.34 | | $ | 7.09 | | $ | 8.61 |
Effects of hedging | | | (1.06 | ) | | | (0.89 | ) | | | — | | | — | | | — |
| | | | | | | | | | | | | | | | | |
Price (net of hedging) | | $ | 4.17 | | | $ | 5.27 | | | $ | 8.34 | | $ | 7.09 | | $ | 8.61 |
| | | | | | | | | | | | | | | |
| | | Year Ended December 31, | | Six Months Ended
June 30, |
| | | 2003 | | 2004 | | 2005 | | 2005 | | 2006 |
| | | (Restated) | | | | |
Average expenses (per Mcfe): | | | | | | | | | | | | | | | |
Production and ad valorem taxes | | $ | 0.38 | | $ | 0.32 | | $ | 0.38 | | $ | 0.38 | | $ | 0.51 |
Lease operating expenses | | | 1.21 | | | 1.25 | | | 1.31 | | | 1.20 | | | 1.46 |
General and administrative expenses | | | 0.76 | | | 0.86 | | | 0.96 | | | 0.84 | | | 1.27 |
Exploration expenses | | | 0.50 | | | 0.09 | | | 0.39 | | | 0.10 | | | 0.17 |
Depreciation, depletion and amortization | | | 1.90 | | | 3.24 | | | 2.35 | | | 2.33 | | | 2.38 |
Property impairments | | | 0.34 | | | 2.15 | | | 0.14 | | | — | | | 0.02 |
Derivative loss | | | — | | | 0.69 | | | 3.84 | | | 3.94 | | | 1.54 |
80
Productive Wells
The following table sets forth information as of December 31, 2005 relating to the productive wells in which we owned a working interest. Productive wells consist of producing wells and wells capable of producing, including natural gas wells awaiting pipeline connections to commence deliveries and oil wells awaiting connection to production facilities. Gross wells are the total number of producing wells in which we have an interest, and net wells are the sum of our fractional working interests owned in gross wells.
| | | | | | | | |
| | | Natural Gas | | Oil |
Area | | Gross Wells | | Net Wells | | Gross Wells | | Net Wells |
Oklahoma | | 149.0 | | 95.7 | | 420.0 | | 374.8 |
Texas | | 42.0 | | 34.5 | | — | | — |
Louisiana | | 8.0 | | 6.3 | | 14.0 | | 13.7 |
| | | | | | | | |
Total | | 199.0 | | 136.5 | | 434.0 | | 388.5 |
| | | | | | | | |
Developed and Undeveloped Acreage
The following table sets forth information relating to our leasehold acreage as of December 31, 2005:
Total Acreage
| | | | | | | | |
| | | Developed Acreage (1) | | Undeveloped Acreage (2) |
Area | | Gross (3) | | Net (4) | | Gross (3) | | Net (4) |
Louisiana | | 5,829 | | 5,755 | | 919 | | 833 |
Oklahoma | | 27,547 | | 15,064 | | 23,729 | | 8,762 |
Texas | | 2,633 | | 2,201 | | 91,609 | | 63,776 |
Appalachian Region | | — | | —�� | | 34,392 | | 14,445 |
| | | | | | | | |
Total | | 36,009 | | 23,020 | | 150,649 | | 87,816 |
| | | | | | | | |
The following table sets forth information relating to our leasehold acreage as of June 30, 2006:
| | | | | | | | |
| | | Developed Acreage (1) | | Undeveloped Acreage (2) |
Area | | Gross (3) | | Net (4) | | Gross (3) | | Net (4) |
Louisiana | | 5,829 | | 5,755 | | 693 | | 632 |
Oklahoma | | 27,547 | | 15,064 | | 24,746 | | 8,807 |
Texas | | 2,954 | | 2,377 | | 108,060 | | 78,849 |
Appalachian Region | | — | | — | | 38,916 | | 15,555 |
| | | | | | | | |
Total | | 36,329 | | 23,196 | | 172,415 | | 103,843 |
| | | | | | | | |
| (1) | Developed acres are acres spaced to productive wells. |
| (2) | Undeveloped acres are acres on which wells have not been drilled or completed to a point that would permit the production of commercial quantities of natural gas or oil, regardless of whether such acreage contains proved reserves. |
| (3) | A gross acre is an acre in which a working interest is owned. The number of gross acres is the total number of acres in which a working interest is owned. |
| (4) | A net acre is deemed to exist when the sum of the fractional ownership working interests in gross acres equals one. The number of net acres is the sum of the fractional working interests owned in gross acres expressed as whole numbers and fractions thereof. |
81
Unconventional Shale Gas Acreage
The following table sets forth information relating to our unconventional shale gas acreage as of June 30, 2006:
| | | | |
| | | Undeveloped
Acreage (1) |
Area | | Gross (2) | | Net (3) |
Oklahoma | | 11,477 | | 5,319 |
Texas | | 93,842 | | 68,780 |
Appalachian Region | | 38,916 | | 15,555 |
| | | | |
Total | | 144,235 | | 89,654 |
| | | | |
| (1) | Undeveloped acres are acres on which wells have not been drilled or completed to a point that would permit the production of commercial quantities of natural gas or oil, regardless of whether such acreage contains proved reserves. |
| (2) | A gross acre is an acre in which a working interest is owned. The number of gross acres is the total number of acres in which a working interest is owned. |
| (3) | A net acre is deemed to exist when the sum of the fractional ownership working interests in gross acres equals one. The number of net acres is the sum of the fractional working interests owned in gross acres expressed as whole numbers and fractions thereof. |
Many of the leases comprising the undeveloped acreage set forth in the tables above will expire at the end of their respective primary terms unless production from the leasehold acreage has been established prior to such date, in which event the lease will remain in effect until the cessation of production. The following table sets forth as of December 31, 2005, the expiration periods of the gross and net acres that are subject to leases in the undeveloped acreage summarized in the above table.
| | | | |
| | | Expiring
Undeveloped Acres |
Twelve Months Ending | | Gross | | Net |
December 31, 2006 | | 7,645 | | 3,428 |
December 31, 2007 | | 12,013 | | 4,671 |
December 31, 2008 | | 9,897 | | 5,645 |
December 31, 2009 | | 8,175 | | 5,691 |
December 31, 2010 and later | | 112,919 | | 68,381 |
| | | | |
Total | | 150,649 | | 87,816 |
| | | | |
82
Drilling Results
The following table sets forth information with respect to wells completed during the periods indicated. The information should not be considered indicative of future performance, nor should it be assumed that there is necessarily any correlation between the number of productive wells drilled, quantities of reserves found or economic value. Productive wells are those that produce commercial quantities of hydrocarbons, regardless of whether they produce a reasonable rate of return.
| | | | | | | | | | | | |
| | | Year Ended December 31, |
| | | 2003 | | 2004 | | 2005 |
| | | Gross | | Net | | Gross | | Net | | Gross | | Net |
Development: | | | | | | | | | | | | |
Productive | | 31.0 | | 29.2 | | 22.0 | | 20.3 | | 24.0 | | 22.2 |
Non-productive | | 5.0 | | 4.7 | | 6.0 | | 5.6 | | 8.0 | | 7.2 |
Exploratory: | | | | | | | | | | | | |
Productive | | 2.0 | | 2.0 | | 4.0 | | 4.0 | | 5.0 | | 4.3 |
Non-productive | | 4.0 | | 3.9 | | 3.0 | | 2.9 | | 1.0 | | 1.0 |
Total: | | | | | | | | | | | | |
Productive | | 33.0 | | 31.2 | | 26.0 | | 24.3 | | 29.0 | | 26.5 |
Non-productive | | 9.0 | | 8.6 | | 9.0 | | 8.5 | | 9.0 | | 8.2 |
We have identified 32 exploratory wells and 21 development wells to be drilled during 2006 and, as of June 30, 2006, we have drilled, or are drilling, 15 exploratory wells and 13 development wells. Our drilling and completion cost, net to our interest, for the six months ended June 30, 2006 was approximately $24.9 million. Each of these prospects is technically ready to be drilled or currently being drilled. Although we expect to drill each of these prospects this year, there can be no assurance that they will be drilled at all or within the expected time frame. Furthermore, we have identified three to five additional exploration prospects, which may be drilled in 2007 or beyond.
Marketing and Major Customers
General. We sell our natural gas and oil through various marketing companies to end users, marketers and other purchasers that have access to nearby pipeline facilities. In areas where there is no practical access to pipelines, natural gas and oil production is transported by truck or barge to storage facilities. Our marketing of natural gas and oil can be affected by factors beyond our control, the effects of which cannot be accurately predicted. For a description of some of these factors, see “Risk Factors—The marketability of our production depends on gathering systems, transportation facilities and processing facilities that we do not control or that may not currently exist. If these systems and facilities become unavailable or are otherwise unable to provide services, or are not developed in areas without current infrastructure, our business, financial condition and results of operations could be materially and adversely affected.” Although we sell the majority of our production to two customers, we do not believe that we are dependent upon one purchaser or small groups of purchasers because of the nature of natural gas and oil markets and the numerous purchasers of these commodities. All natural gas, oil and plant products produced from properties we operate are sold under contract, usually for terms of one year or less. We sell to multiple purchasers within each state in which we operate.
Customers.The principal customers for our natural gas and oil production are Sunoco, Inc. and Upstream Energy Services, L.P. During the year ended December 31, 2005, revenues from the sale of natural gas and oil to Sunoco, Inc. and Upstream Energy Services, L.P. accounted for 37% and 28%, respectively, of our total revenues. During 2003, 2004 and 2005, we sold our natural gas and oil production to approximately 44, 41 and 50 customers, respectively. We believe we would be able to locate alternate purchasers in the event of the loss of any one or more purchasers and that any such loss would not have a material adverse effect on our financial condition or results of operations.
83
Natural Gas. Approximately 63% of our natural gas is sold on the spot market by an independent marketer. All natural gas sales are based on published index prices and tied to contracts with terms that are generally no longer than one year in length and renewable at the expiration of their terms on a month-to-month basis. Realized prices are affected by minimum quantity and quality provisions. We typically gather our own natural gas for delivery into major transmission lines. Natural gas produced at certain locations in Texas is processed and all other natural gas is sold unprocessed to the respective purchasers. We experience gas imbalances on certain properties; however, our gas imbalance positions are insignificant.
Oil and Condensate. Our oil and condensate production is sold at posted prices without adjustment for product quantity or quality. Approximately 85% of our sales are tied to published NYMEX postings and the remainder to West Texas Intermediate postings. All oil and condensate sales contracts have terms of one year or less. Transportation arrangements vary by the area of production. Our Texas oil production is primarily transported by truck and our Louisiana oil production is primarily transported by barge. Approximately 58% of our Oklahoma oil production is transported by pipeline and the remaining 42% of our Oklahoma oil production is transported by truck.
NGLs. The majority of our NGL sales are produced in Texas, processed at a third party natural gas processing plant and purchased by the owner of the plant. Payment terms are established by annual contract and funds are remitted to us net of processing fees. Prices paid for each product extracted are based on published indexes adjusted for quantity and quality per contract provisions.
Title to Properties
We believe that we have satisfactory title to all of our producing properties in accordance with standards generally accepted in the natural gas and oil industry. As is customary in the natural gas and oil industry, we perform only a preliminary title investigation before leasing undeveloped properties. A title opinion is typically obtained before the commencement of drilling operations and any material defects are remedied prior to the time the actual drilling of a well is commenced. Generally, under the terms of the operating agreements affecting our properties, any monetary loss is borne by all parties to any such agreement in proportion to their interests in such property. If any title defects or defects in assignment of leasehold rights in properties in which we hold an interest exist, we may suffer a monetary loss. Our properties are subject to customary royalty interests, liens for current taxes, liens of vendors and other customary burdens, which we do not believe materially interfere with the use of or affect the value of our producing properties. As is customary in the industry, we can retain our interests in undeveloped acreage by drilling activity that establishes commercial production or by payment of delay rentals during the remaining primary term. The natural gas and oil leases in which we have an interest are for varying primary terms, but most of our developed leased acreage is beyond the initial primary term and is held through producing wells.
Operations
We generally seek to be named as operator for wells in which we have acquired a significant interest, although, as is common in the industry, this typically occurs only when we own the majority of the working interests in a particular well or field. At December 31, 2005, we operated 577 (out of a total of 633) gross producing wells.
As operator, we are able to exercise substantial influence over the development and enhancement of a well and to supervise operation and maintenance activities on a daily basis. On properties for which we act as operator, we either conduct the actual drilling of wells or engage independent contractors who are supervised by us. We employ petroleum engineers, geologists and other operation and production specialists who strive to improve production rates, increase reserves and lower the cost of operating our natural gas and oil properties.
84
Capital Expenditures
The following table presents information regarding our net costs incurred in natural gas and oil property acquisition, exploration and development activities for the periods presented:
| | | | | | | | | | | | | | | |
| | | Year Ended December 31, | | Six Months Ended
June 30, |
| | | 2003 | | 2004 | | 2005 | | 2005 | | 2006 |
| | | (in thousands) |
Property Acquisitions: | | | | | | | | | | | | | | | |
Proved | | $ | 1,410 | | $ | 449 | | $ | 1,748 | | $ | 382 | | $ | 46 |
Unproved | | | 127 | | | 1,045 | | | 5,454 | | | 908 | | | 9,116 |
Exploration (1) | | | 4,923 | | | 4,579 | | | 8,829 | | | 3,266 | | | 11,184 |
Development | | | 36,489 | | | 17,724 | | | 21,820 | | | 12,125 | | | 16,628 |
| | | | | | | | | | | | | | | |
Totals | | $ | 42,949 | | $ | 23,797 | | $ | 37,851 | | $ | 16,681 | | $ | 36,974 |
| | | | | | | | | | | | | | | |
| (1) | Includes capitalized and expensed costs incurred. |
Competition
We operate in a highly competitive environment. We compete with major independent natural gas and oil companies for the acquisition of desirable natural gas and oil properties, as well as for the equipment and labor required to develop and operate these properties. We also compete with major independent natural gas and oil companies in the marketing and sale of natural gas and oil to marketers and end-users. Many of our competitors have financial and other resources substantially greater than ours. Competitors may be able to pay more for natural gas and oil properties and may be able to define, evaluate, bid for and acquire a greater number of properties. Our ability to acquire and develop additional properties in the future will depend on our ability to conduct operations, evaluate and select suitable properties and close transactions in this highly competitive market environment.
The marketability of our production depends upon the availability and capacity of natural gas gathering systems, pipelines and processing facilities, and the unavailability or lack of capacity thereof could result in the shut-in of producing wells or the delay or termination of development plans for properties. In addition, regulatory changes affecting natural gas and oil production and transportation, general economic conditions and changes in supply and demand could adversely affect our ability to produce and market our natural gas and oil on a profitable basis. In addition, larger competitors may be able to absorb the burden of any regulatory changes more easily than us, which would adversely affect our competitive position.
Environmental Matters and Regulation
General. We are subject to various stringent and complex federal, state and local laws and regulations governing environmental protection as well as the discharge of materials into the environment. These laws and regulations may, among other things:
| | • | | require the acquisition of various permits before drilling commences; |
| | • | | require the installation of expensive pollution control equipment; |
| | • | | restrict the types, quantities and concentration of various substances that can be released into the environment in connection with natural gas and oil drilling production, transportation and processing activities; |
| | • | | suspend, limit or prohibit construction, drilling and other activities in certain lands lying within wilderness, wetlands and other protected areas; and |
| | • | | require remedial measures to mitigate pollution from historical and ongoing operations, such as the closure of pits and plugging of abandoned wells. |
85
These laws, rules and regulations may also restrict the rate of natural gas and oil production below the rate that would otherwise be possible. The regulatory burden on the natural gas and oil industry increases the cost of doing business in the industry and consequently affects profitability.
Governmental authorities have the power to enforce compliance with environmental laws, regulations and permits, and violations are subject to injunction, as well as administrative, civil and even criminal penalties. The effects of these laws and regulations, as well as other laws or regulations that may be adopted in the future, could have a material adverse impact on our business, financial condition and results of operations.
The following is a summary of the existing material laws, rules, and regulations to which our business operations are subject.
Comprehensive Environmental Response, Compensation and Liability Act. The Comprehensive Environmental Response, Compensation and Liability Act, or CERCLA, also known as the Superfund law, and comparable state laws impose joint and several liability, without regard to fault or legality of conduct, on classes of persons who are considered to be responsible for the release of a hazardous substance into the environment. These persons include the owner or operator of the site where the release occurred, and anyone who disposed or arranged for the disposal of a hazardous substance released at the site. Under CERCLA, such persons may be subject to joint and several liability for the costs of cleaning up the hazardous substances that have been released into the environment, for damages to natural resources and for the costs of certain health studies. In addition, it is not uncommon for neighboring landowners and other third-parties to file claims for personal injury and property damage allegedly caused by the hazardous substances released into the environment. Such claims may be filed under CERCLA as well as state common law theories or state laws that are modeled after CERCLA. In the course of our operations, we generate wastes that may fall within CERCLA’s definition of hazardous substances or that are otherwise subject to common law or state law claims. Therefore, governmental agencies or third-parties could seek to hold us responsible for all or part of the costs to clean up a site at which such substances may have been released or deposited.
Waste Handling. The Resource Conservation and Recovery Act, or RCRA, and comparable state statutes, regulate the generation, transportation, treatment, storage, disposal and cleanup of hazardous and non-hazardous wastes. Under the auspices of the federal Environmental Protection Agency, or EPA, the individual states administer some or all of the provisions of RCRA, sometimes in conjunction with their own, more stringent requirements. Drilling fluids, produced waters and most of the other wastes associated with the exploration, development and production of oil or natural gas are currently regulated under RCRA’s non-hazardous waste provisions. However, it is possible that certain natural gas and oil exploration and production wastes now classified as non-hazardous could be classified as hazardous wastes in the future. Any such change could result in an increase in our operating expenses, which could have a material adverse effect on our results of operations and financial position.
Air Emissions. The Federal Clean Air Act and comparable state laws regulate emissions of various air pollutants through air emissions permitting programs and the imposition of other requirements. These regulatory programs may require us to install expensive emissions abatement equipment, modify our operational practices and obtain permits for our existing operations and before commencing construction on a new or modified source of air emissions, such laws may require us to reduce emissions at existing facilities. As a result, we may be required to incur increased capital and operating costs. Federal and state regulatory agencies can impose administrative, civil and criminal penalties for non-compliance with air permits or other requirements of the federal Clean Air Act and associated state laws and regulations.
Water Discharges. The Federal Water Pollution Control Act, or the Clean Water Act, and analogous state laws, impose restrictions and strict controls with respect to the discharge of pollutants, including spills and leaks of oil and other substances into waters of the United States, including wetlands. The discharge of pollutants into regulated waters is prohibited, except in accordance with the terms of a permit issued by EPA or an analogous
86
state agency. Federal and state regulatory agencies can impose administrative, civil and criminal penalties for non-compliance with discharge permits or other requirements of the Clean Water Act and analogous state laws and regulations.
National Environmental Policy Act. Natural gas and oil exploration and production activities on federal lands are subject to the National Environmental Policy Act, or NEPA. NEPA requires federal agencies, including the Department of Interior, to evaluate major agency actions having the potential to significantly impact the environment. In the course of such evaluations, an agency will prepare an Environmental Assessment that assesses the potential direct, indirect and cumulative impacts of a proposed project and, if necessary, will prepare a more detailed Environmental Impact Statement that may be made available for public review and comment. All of our current exploration and production activities, as well as proposed exploration and development plans on federal lands require governmental permits that are subject to the requirements of NEPA. This process has the potential to delay our development of natural gas and oil projects.
Other Laws and Regulations. In February 2005, the Kyoto Protocol to the United Nations Framework Convention on Climate Change entered into force. Pursuant to the Protocol, adopting countries are required to implement national programs to reduce emissions of certain gases, generally referred to as greenhouse gases, that are suspected of contributing to global warming. The Bush administration has indicated it will not support ratification of the Protocol, and Congress has not actively considered recent proposed legislation directed at reducing greenhouse gas emissions.However, there has been support in various regions of the United States for legislation that requires reductions in greenhouse gas emissions, and some states, although not those in which we currently operate, have already adopted legislation addressing greenhouse gas emissions from certain greenhouse gas emission sources, primarily power plants. Additionally, in late 2006, the U.S. Supreme Court will review the U.S. Circuit Court of Appeals for the District of Columbia’s ruling inMassachusetts, et al. v. EPA, in which the appellate court held that EPA had discretion under the Clean Air Act to refuse to regulate carbon dioxide emissions from mobile sources. A Supreme Court reversal of the appellate decision could result in federal regulation of carbon dioxide emissions and other greenhouse gases, and may affect the outcome of other climate change lawsuits pending in U.S. federal courts in a manner unfavorable to our industry. The natural gas and oil exploration and production industry is a direct source of certain greenhouse gas emissions, namely carbon dioxide and methane, and future laws, judicial rulings and regulations regarding such emissions would likely adversely impact our future operations, results of operations and financial condition. Any future laws, judicial rulings and regulations regarding greenhouse gas emissions may also restrict or decrease consumption of natural gas and oil, which would also have an adverse impact on our future operations, results of operations and financial condition. Currently, our operations are not adversely affected by existing state and local climate change initiatives and judicial rulings and, at this time, we cannot accurately predict the effect of future laws, judicial rulings and regulations regarding greenhouse gas emissions on our future operations, results of operations and financial condition.
New and more stringent laws and regulations concerning the security of industrial facilities, including natural gas and oil facilities could be adopted in the future. Our operations may in the future be subject to such laws and regulations. Presently, it is not possible to accurately estimate the costs we could incur to comply with any such facility security laws or regulations, but such expenditures could be substantial.
Other Regulation of the Natural Gas and Oil Industry
The natural gas and oil industry is extensively regulated by numerous federal, state and local authorities. Legislation affecting the natural gas and oil industry is under constant review for amendment or expansion, frequently increasing the regulatory burden. Also, numerous departments and agencies, both federal and state are authorized by statute to issue rules and regulations binding on the natural gas and oil industry and its individual members, some of which carry substantial penalties for failure to comply. Although the regulatory burden on the natural gas and oil industry increases our cost of doing business and, consequently, affects our profitability, these burdens generally do not affect us any differently or to any greater or lesser extent than they affect other companies in the industry with similar types, quantities and locations of production.
87
Drilling and Production. Our operations are subject to various types of regulation at federal, state and local levels. These types of regulation include requiring permits for the drilling of wells, drilling bonds and reports concerning operations. Most states, and some counties and municipalities, in which we operate also regulate one or more of the following:
| | • | | the method of drilling and casing wells; |
| | • | | the rates of production or “allowables;” |
| | • | | the surface use and restoration of properties upon which wells are drilled and other third-parties; |
| | • | | the plugging and abandoning of wells; and |
| | • | | notice to surface owners and other third-parties. |
State laws regulate the size and shape of drilling and spacing units or proration units governing the pooling of natural gas and oil properties. Some states allow forced pooling or integration of tracts to facilitate exploration while other states rely on voluntary pooling of lands and leases. In some instances, forced pooling or unitization may be implemented by third-parties and may reduce our interest in the unitized properties. In addition, state conservation laws establish maximum rates of production from natural gas and oil wells, generally prohibit the venting or flaring of natural gas and impose requirements regarding the ratability of production. These laws and regulations may limit the amount of natural gas and oil we can produce from our wells or limit the number of wells or the locations that we can drill. Moreover, each state generally imposes a production or severance tax with respect to the production and sale of natural gas and oil within its jurisdiction. Our drilling and production operations are in compliance with state regulations.
Natural Gas Gathering Regulation. Intrastate gas gathering service, which occurs upstream of interstate transmission services, is regulated by the states’ regulatory agencies. State regulation of gathering facilities generally includes various safety, environmental and, in some circumstances, nondiscriminatory take requirements and complaint-based rate regulation. The two gathering lines we operate are both intrastate gathering lines and are located in Louisiana and Oklahoma. Louisiana’s Pipeline Operations Section of the Department of Natural Resources’ Office of Conservation is generally responsible for regulating gathering facilities in Louisiana. In Oklahoma, the Oil and Gas Division of the Oklahoma Corporation Commission is responsible for regulating gathering facilities. These state agencies have the authority to review and authorize construction, acquisition, abandonment and interconnection of physical pipeline facilities. Our intrastate gathering lines are in compliance with state pipeline regulations.
Federal Natural Gas Regulation. Historically, federal legislation and regulatory controls have affected the price of the natural gas we produce and the manner in which we market our production. The Federal Energy Regulatory Commission, or FERC, has jurisdiction over the transportation and sale for resale of natural gas in interstate commerce by natural gas companies under the Natural Gas Act of 1938 and the Natural Gas Policy Act of 1978. Since 1978, various federal laws have been enacted which have resulted in the complete removal of all price and non-price controls for sales of domestic natural gas sold in “first sales,” which include all of our sales of our own production.
FERC also regulates interstate natural gas transportation rates and service conditions, which affects the marketing of natural gas that we produce, as well as the revenues we receive for sales of our natural gas. Although we do not operate interstate gas transmission facilities, federal regulations that increase interstate transportation costs will affect the value of our product at market. Commencing in 1985, FERC promulgated a series of orders, regulations and rule makings that significantly fostered competition in the business of transporting and marketing gas. Today, interstate pipeline companies are required to provide nondiscriminatory transportation services to producers, marketers and other shippers, regardless of whether such shippers are affiliated with an interstate pipeline company. FERC’s initiatives have led to the development of a competitive, unregulated, open access market for natural gas purchases and sales that permits all purchasers of natural gas to
88
buy natural gas directly from third-party sellers other than pipelines. However, the natural gas industry historically has been very heavily regulated; therefore, we cannot guarantee that the less stringent regulatory approach recently pursued by FERC and Congress will continue indefinitely into the future nor can we determine what affect, if any, future regulatory changes might have on our natural gas related activities. Under FERC’s current regulatory regime, transmission services must be provided on an open-access, non-discriminatory basis at cost-based rates or at market-based rates if the transportation market at issue is sufficiently competitive. Although its policy is still in flux, FERC recently has reclassified certain jurisdictional transmission facilities as non-jurisdictional gathering facilities, which has the tendency to increase our costs of getting natural gas to point-of-sale locations. Changes in transportation costs as a result of changes in FERC regulations will effect the value of our product at market.
Legal Proceedings
We are, and from time to time in the future may be, a party to various legal proceedings and regulatory matters arising in the ordinary course of business. We do not expect the resolution of any pending or threatened proceedings to have a material adverse effect on our business, financial condition or results of operation.
Employees
As of September 15, 2006, we employed 95 people, including 50 that work in our field offices. None of our employees is covered by a collective bargaining agreement, and we believe that our relationships with our employees are satisfactory. From time to time, we use the services of independent contractors to perform various field, technical and other services.
Offices
As of September 15, 2006, we leased approximately 27,537 square feet of office space in Plano, Texas at 4965 Preston Park Blvd., Suite 800, Plano, Texas 75093, where our principal offices are located. The lease for our Plano office expires in October 2013. We believe that our office facilities are adequate for our current needs and that additional office space can be obtained if necessary.
89
MANAGEMENT
Executive Officers and Directors
The following table sets forth the names, ages and positions of our executive officers and directors as of September 15, 2006:
| | | | |
Name | | Age | | Position |
Terry W. Carter | | 53 | | President, Chief Executive Officer and Director |
Eddie M. LeBlanc, III | | 57 | | Executive Vice President, Chief Financial Officer, Treasurer and Secretary |
David L. McCabe | | 51 | | Chief Operating Officer and Executive Vice President—Exploration and Development |
Steve Limke | | 53 | | Vice President—Production Operations and Drilling |
David A. Rice | | 53 | | Vice President—Business Development and Reserves Management |
James L. Luikart | | 61 | | Chairman of the Board of Directors |
Stuart B. Katz | | 51 | | Director |
Robert J. Welch | | 43 | | Director |
Terry W. Carter. Mr. Carter has been our President and Chief Executive Officer since June 2003. He was elected to the board of directors in September 2003. Mr. Carter joined us as Chief Operating Officer in May 2003. Prior to joining us, from January 2001 until May 2003, Mr. Carter served as Executive Vice President of Exploration and Production for Range Resources Corporation, an oil and natural gas exploration and production company. From May 1999 to December 2000, Mr. Carter was a principal investor and officer in an independent oil and gas company. From 1976 to 1999, Mr. Carter was employed by Oryx Energy Company, an oil and natural gas exploration and production company, and its predecessor, Sun Exploration and Production Company. While with Oryx and Sun, he held a variety of technical and management positions, including Planning Manager, Development Manager, Operations Manager, Business Unit General Manager and various technical and project management roles. Mr. Carter received a Bachelor of Science in petroleum engineering from Tulsa University.
Eddie M. LeBlanc, III. Mr. LeBlanc has been our Executive Vice President, Chief Financial Officer, Treasurer and Secretary since June 2003. From January 2000 to June 2003, Mr. LeBlanc was Senior Vice President and Chief Financial Officer of Range Resources Corporation. Previously, Mr. LeBlanc was a founder of Interstate Natural Gas Company, which merged into Coho Energy, Inc., an oil and natural gas exploration and production company, in 1994. At Coho, Mr. LeBlanc served as Senior Vice President and Chief Financial Officer. Mr. LeBlanc’s 29 years of experience includes assignments in natural gas and oil subsidiaries of Celeron Corporation and Goodyear Tire and Rubber. Mr. LeBlanc received a Bachelor of Science in accounting from the University of Southwestern Louisiana and is a Certified Public Accountant and Chartered Financial Analyst.
David L. McCabe. Mr. McCabe has served as our Chief Operating Officer since September 2006 and Executive Vice President of Exploration and Production since August 2003. Prior to joining us in January 2002, Mr. McCabe was an independent consultant geophysicist for approximately 16 months, and for the prior 12 years, he held a succession of managerial and technical positions with Oryx Energy Company and its predecessor, Sun Exploration and Production Company, in its onshore and offshore Gulf coast exploration and development operations. Mr. McCabe held similar positions with Atlantic Richfield Company (ARCO) prior to joining Oryx. Mr. McCabe received a Bachelor of Science in geophysics from Texas A&M University and a Masters of Business Administration from Houston Baptist University.
Steve Limke. Mr. Limke has served as our Vice President of Production Operations and Drilling since February 2005. Mr. Limke joined us in April 2002 as our Drilling Manager. Prior to joining us, Mr. Limke managed the drilling operations for Prize Energy Corp., an oil and natural gas exploration and production company, for approximately two years. Mr. Limke’s 26 years of experience include management, supervisory and
90
technical positions with Oryx Energy Company and its predecessor, Sun Exploration and Production Company. Mr. Limke attended Oklahoma State University where he received a Bachelor of Science degree in agriculture and petroleum engineering technology.
David A. Rice. Mr. Rice has served as our Vice President of Business Development and Reserves Management since August 2004. Prior to his employment with us, Mr. Rice was a Vice President and Energy Lending Officer at Americrest Bank from February 2004 to August 2004 and a Manager of Engineering for Maynard Oil Company, an oil and natural gas exploration and production company, from July 2003 to January 2004. Mr. Rice spent approximately one month at Forest Oil Company, an oil and natural gas exploration and production company, managing the divestment of oil and gas properties acquired in conjunction with the acquisition of Maynard. Prior to his employment at Maynard and for approximately five years, Mr. Rice was a Senior Vice President and Senior Petroleum Engineer at the Bank of Texas. Mr. Rice is a registered professional engineer in Texas. Mr. Rice earned his Bachelor of Science in geological engineering at University of Missouri-Rolla and was honored with the Professional Degree of Geological Engineering in December 2001.
James L. Luikart. Mr. Luikart has been a director since September 2001 and was elected as Chairman of the Board during April 2005. Mr. Luikart is a Managing Member of Jefferies Capital Partners, the manager of a series of private equity funds, some of which are included in The Jefferies Investors. Mr. Luikart has been an Executive Vice President of Jefferies Capital Partners (and predecessor entities) for over 10 years. Prior to joining Jefferies Capital Partners, Mr. Luikart spent over 20 years with Citicorp, the last seven years of which he served as a Vice President of Citicorp Venture Capital. Mr. Luikart received a Bachelor of Arts from Yale University and a Master of International Affairs from Columbia University. Mr. Luikart also serves on the board of directors of The Sheridan Group, W&T Offshore, Inc. (NYSE: WTI) and Edgen Corporation.
Stuart B. Katz. Mr. Katz has been a director sinceNovember 2005. Mr. Katz is a Managing Director of Jefferies Capital Partners. Prior to joining Jefferies Capital Partners in 2001, Mr. Katz was an investment banker with Furman Selz LLC and its successors for over sixteen years. Mr. Katz received a Bachelor of Science in engineering from Cornell University and a Juris Doctorate from Fordham Law School. Mr. Katz is a member of the bar of the State of New York. Mr. Katz also serves on the boards of directors of W&T Offshore, Inc. (NYSE: WTI) and various other privately owned portfolio companies of Jefferies Capital Partners.
Robert J. Welch. Mr. Welch has been a director since February 2003. Mr. Welch has been with Jefferies & Company, Inc. for the past 12 years and is currently a Senior Vice President. Mr. Welch also serves as Chief Financial Officer of three hedge funds that actively invest in and trade high yield, distressed and special situation instruments. From 1987 to 1993, Mr. Welch was employed in the compliance division of The National Association of Securities Dealers. In 1987, Mr. Welch received a Bachelor of Science in commerce and engineering from Drexel University.
Board of Directors
Our board of directors currently consists of four members, of which are independent directors for purposes of the rules and regulations of the SEC and the rules of The Nasdaq Global Market. In compliance with the requirements of the SEC rules and regulations and the rules of The Nasdaq Global Market (i) at least one director on our audit, compensation and corporate governance and nominating committees will be independent at the time of quotation of our common stock on The Nasdaq Global Market, (ii) at least a majority of the directors on our audit, compensation and corporate governance and nominating committees will be independent within 90 days of quotation of our common stock on The Nasdaq Global Market and (iii) within one year of quotation of our common stock on The Nasdaq Global Market, these committees will be fully independent and a majority of our board will be independent. If the effective date of the registration statement of which this prospectus forms a part is declared effective prior to quotation of our common stock on The Nasdaq Global Market, we will satisfy the foregoing independence requirements as of such effective date.
91
Our board of directors is divided into three classes. The members of each class serve staggered, three-year terms. Upon the expiration of the term of a class of directors, directors in that class will be elected for three-year terms at the annual meeting of stockholders in the year in which their term expires. Immediately after the consummation of this offering, the classes will be composed as follows:
| | • | | will be Class I director, whose term will expire at the first annual meeting of stockholders following this offering; |
| | • | | will be Class II directors, whose terms will expire at the second annual meeting of stockholders following this offering; and |
| | • | | will be Class III directors, whose terms will expire at the third annual meeting of stockholders following this offering. |
Any additional directorships resulting from an increase in the number of directors will be distributed among the three classes so that, as nearly as possible, each class will consist of one-third of our directors. This classification of our board of directors may have the effect of delaying or preventing changes in control of our company.
Committees of the Board of Directors
Audit committee
Prior to the closing of this offering, our audit committee will be comprised of three directors, at least one of whom will be “independent” as defined under and required by the rules and regulations of the SEC and The Nasdaq Global Market rules. A majority of the directors on our audit committee will be independent within 90 days of the earlier of the effectiveness of the registration statement of which this prospectus forms a part and quotation of our common stock on The Nasdaq Global Market and, within one year of such time, the committee will be fully independent. Initially, Messrs. , and will comprise our audit committee. One member of the audit committee will be designated as the “audit committee financial expert,” as defined by Item 401(h) of Regulation S-K of the Exchange Act. The audit committee will be responsible for, among other things:
| | • | | recommending annually to our board of directors the selection of our independent public accountants; |
| | • | | reviewing and approving the scope of our independent public accountants’ audit activity and the extent of non-audit services; |
| | • | | reviewing with management and the independent public accountants the adequacy of our basic accounting systems and the effectiveness of our internal audit plan and activities; |
| | • | | reviewing our financial statements with management and the independent public accountants and exercising general oversight of our financial reporting process; and |
| | • | | reviewing our litigation and other legal matters that may affect our financial condition and monitoring compliance with our business ethics and other policies. |
Our board of directors will adopt a written charter for the audit committee, which will be available on our web site.
Compensation committee
Prior to the closing of this offering, our compensation committee will be comprised of three directors, at least one of whom will be independent as defined under and required by the rules and regulations of the SEC and The Nasdaq Global Market rules. A majority of directors on this committee will be independent within 90 days of the earlier of the effectiveness of the registration statement of which this prospectus forms a part and quotation
92
of our common stock on The Nasdaq Global Market, and this committee will be fully independent within one year of such time. Initially, Messrs. , and will comprise our compensation committee. This committee’s responsibilities include, among other things:
| | • | | administering and granting awards under our 2006 Long-Term Incentive Plan; |
| | • | | reviewing the compensation of our President and Chief Executive Officer and recommendations of our President and Chief Executive Officer as to appropriate compensation for our other executive officers and key personnel; |
| | • | | examining periodically our general compensation structure; and |
| | • | | supervising our welfare and pension plans and compensation plans. |
Our board of directors will adopt a written charter for the compensation committee, which will be available on our web site.
Nominating and corporate governance committee
Prior to the closing of this offering, our nominating and corporate governance committee will be comprised of three directors, at least one of whom will be independent as defined under and required by the rules and regulations of the SEC and The Nasdaq Global Market rules. A majority of directors on this committee will be independent within 90 days of the earlier of the effectiveness of the registration statement of which this prospectus forms a part and quotation of our common stock on The Nasdaq Global Market, and this committee will be fully independent within one year of such time. Initially, Messrs. , and will comprise our nominating and corporate governance committee. The committee’s responsibilities include, among other things:
| | • | | to recommend to the board of directors proposed nominees for election to the board of directors by the stockholders at annual meetings, including an annual review as to the renominations of incumbents and proposed nominees for election by the board of directors to fill vacancies that occur between stockholder meetings; and |
| | • | | to make recommendations to the board of directors regarding corporate governance matters and practices. |
Our board of directors will adopt a written charter for the nominating and corporate governance committee, which will be available on our web site.
Director Compensation
To date, none of our directors has received compensation for services rendered as a board member. Members of our board of directors who are also our officers or employees will not receive compensation for their services as directors. It is anticipated that after the completion of this offering, we will pay our non-employee directors an annual retainer of $ and an attendance fee of $ for each regular meeting of our board of directors attended. In addition, we will pay the chairman of our audit committee an additional annual retainer of $ and each chairman of our other committees an additional annual retainer of $ . Committee members other than the chairman will be paid an additional annual retainer of $ . We will also pay a fee of $ for each special board meeting attended and a fee of $ for each committee meeting attended. Directors will be reimbursed for reasonable out-of-pocket expenses incurred in attending meetings of the board or committees and for other reasonable expenses related to the performance of their duties as directors.
In connection with this offering, we intend to implement our 2006 Long-Term Incentive Plan. Under that plan, certain non-employee directors will be granted options to purchase shares of our common stock or other awards under our 2006 Long-Term Incentive Plan.
93
Compensation Committee Interlocks and Insider Participation
None of our executive officers serves as a member of the board of directors or compensation committee of any entity that has one or more of its executive officers serving as a member of our board of directors or compensation committee.
Executive Compensation
The following table sets forth all compensation awarded or paid to, or earned by, our Chief Executive Officer and each of our four other most highly compensated executive officers during fiscal 2005 for services rendered to us in all capacities during fiscal years 2003, 2004 and 2005. The annual compensation amounts in the table exclude perquisites and other personal benefits because they did not exceed the lesser of $50,000 or 10% of the total annual salary and bonus reported for each executive officer.
Summary Compensation Table
| | | | | | | | | | | |
| | | | | Annual compensation | | Other annual compensation (1) |
Name and principal position | | Year | | Salary | | Bonus | |
Terry W. Carter—President and
Chief Executive Officer (2) | | 2005
2004
2003 | | $
| 275,000
275,000
176,042 | | $
| 110,000
—
68,920 | | $
| 8,400
8,400
— |
| | | | |
Eddie M. LeBlanc, III—Executive Vice President, Chief Financial Officer, Treasurer and Secretary (3) | | 2005
2004
2003 | | $
| 231,187
225,000
112,500 | | $
| 70,000
38,769
— | | $
| 8,400
6,174
2,625 |
| | | | |
David L. McCabe—Chief Operating
Officer and Executive Vice President— Exploration and Development | | 2005
2004
2003 | | $
| 158,045
148,000
132,675 | | $
| 70,000
21,500
27,000 | | $
| 8,400
4,458
3,600 |
| | | | |
Steve Limke—Vice President— Production Operations and Drilling | | 2005
2004
2003 | | $
| 149,481
133,849
127,458 | | $
| 47,000
22,000
28,750 | | $
| 7,943
4,486
3,465 |
| | | | |
David A. Rice—Vice President—
Business Development and
Reserves Management (4) | | 2005
2004
2003 | | $
| 132,031
46,474
— | | $
| 18,000
7,500
— | | $
| 6,301
417
— |
| (1) | Represents 401(k) matching and awards under our 401(k) defined contribution plan. |
| (2) | Mr. Carter joined Ascent in May 2003. |
| (3) | Mr. LeBlanc joined Ascent in June 2003. |
| (4) | Mr. Rice joined Ascent in August 2004. |
2005 Incentive Plan
On May 20, 2005, we adopted an equity incentive plan for certain of our employees and directors, which we amended and restated in December 2005. We refer to this plan as the 2005 Incentive Plan. The purpose of the 2005 Incentive Plan is to advance our interests by encouraging and enabling a larger personal proprietary interest in us by certain key employees and directors. The 2005 Incentive Plan provides for payment of aggregate awards of up to 13.5% of our “Total Eligible Enterprise Value,” which is defined in the 2005 Incentive Plan as the amount by which the present value of the consideration payable to Ascent or its securityholders in connection with a “Sale of Ascent,” as defined in the plan, exceeds our “Consolidated Funded Debt,” as defined in the plan. Our 2005 Incentive Plan defines a “Sale of Ascent” as (1) the merger or consolidation of Ascent, or the sale or transfer of a majority of the outstanding voting securities of Ascent to a person or group, in each case in which
94
the holders of a majority of the outstanding voting power of Ascent immediately prior to the transaction own less than a majority of the outstanding voting power of Ascent, or of the surviving or resulting corporation or acquirer, immediately following the transaction or series of related transactions or (2) the sale of substantially all of Ascent’s assets. Our 2005 Incentive Plan defines our “Consolidated Funded Debt” as the amount determined in good faith by our board of directors to constitute the principal amount of all of our indebtedness for borrowed money and the deferred purchase price of any property, including, without limitation, interest bearing obligations, capitalized interest, capitalized lease obligations and guaranties. As of September 15, 2006, no amounts are payable to the participants under the 2005 Incentive Plan and no amounts will be payable to the participants until a Sale of Ascent occurs under the 2005 Incentive Plan, if ever. Upon consummation of any Sale of Ascent, vested awards are payable in cash or in the same form of consideration received by Ascent or its securityholders in such Sale, as determined by the committee administering the 2005 Incentive Plan.
During 2005, awards providing for approximately 12.8% of Total Eligible Enterprise Value had been granted, including awards of 3.0%, 1.5%, 1.6%, 1.1% and 0.9% to Messrs. Carter, LeBlanc, McCabe, Limke and Rice, respectively, of which 40% were vested as of September 15, 2006.
In connection with and immediately prior to the closing of this offering, we intend to terminate our 2005 Incentive Plan. Participants in the 2005 Incentive Plan will receive cash bonuses and awards of restricted stock, which vest over a three year period, in exchange for terminating their rights under the 2005 Incentive Plan. We refer to this exchange as the “Incentive Issuance.” At the mid-point of the proposed offering range, the Incentive Issuance will be $ million in aggregate, of which $ million will be in the form of a cash bonus and $ million in the form of restricted stock awarded under our 2006 Long-Term Incentive Plan ( shares valued at the mid-point of the proposed offering range). The entire $ million Incentive Issuance is expected to be taxable to the recipients in this tax year. The cash bonus portion of the Incentive Issuance is intended to approximate the recipients’ related income tax liability. Because the entire Incentive Issuance is a taxable transaction, the recipients will not have income tax liability in the future merely as a result of the vesting of the restricted stock and will therefore not have to consider selling their shares to pay income taxes upon vesting. The terms of the 2005 Incentive Plan prohibit us from canceling or modifying an existing award without the consent of the affected holder; therefore, each of the holders of awards under our 2005 Incentive Plan must consent to this exchange in order to terminate all prior awards under our 2005 Incentive Plan. We have received the consent of % of the participants in the 2005 Incentive Plan. The Incentive Issuance is contingent on the consummation of this offering and the Recapitalization and the consent of each of the holders of awards under our 2005 Incentive Plan. Awards of restricted stock granted in the Incentive Issuance will vest on the first, second and third anniversaries of their respective dates of grant in increments of 40%, 35% and 25%, respectively, provided that the holder is still employed by us or in our service on the applicable vesting date and will otherwise be subject to the terms and conditions set forth in the restricted stock agreements governing such awards and the 2006 Long-Term Incentive Plan. In addition, Messrs. Carter, LeBlanc, McCabe, Limke and Rice are expected to receive cash bonuses of $ , $ , $ , $ and $ , respectively, in connection with the Incentive Issuance.
Aggregate Plan Limit. Awards under the 2005 Incentive Plan are limited to 13.5% of our Total Eligible Enterprise Value and are sometimes referred to as “Enterprise Appreciation Rights.” If the amount payable pursuant to an award ceases to be payable for any reason, the percentage under such award shall again be available for future grants of awards.
Eligibility. The class of persons who are potential recipients of awards granted under the 2005 Incentive Plan are our employees and directors who are designated by the committee administering the 2005 Incentive Plan, and shall be an “Eligible Person.” The parties to whom awards are granted under the 2005 Incentive Plan, and the incentive percentage under each such award, are determined by the committee administering the 2005 Incentive Plan in its sole discretion, subject, however, to the terms and conditions of the 2005 Incentive Plan.
Administration. The committee administering the 2005 Incentive Plan has the authority to grant to any Eligible Person, in its sole discretion, Enterprise Appreciation Rights, which are the rights to receive a percentage
95
of our Total Eligible Enterprise Value upon a Sale of Ascent, if and to the extent provided pursuant to the 2005 Incentive Plan. Except as otherwise provided in the 2005 Incentive Plan, upon the Sale of Ascent, the holder of Enterprise Appreciation Rights which are then vested shall be entitled to receive payment from us of an amount equal to the then vested portion of the product obtained by multiplying (i) the Total Eligible Enterprise Value upon such Sale of Ascent, by (ii) the incentive percentage under such holder’s award of Enterprise Appreciation Rights. Awards are payable in cash or in the same form of consideration payable to Ascent or its securityholders in such Sale, as determined by the committee administering the 2005 Incentive Plan.
Terms of Awards. Except as otherwise provided in an award grant agreement, awards of Enterprise Appreciation Rights vest at the rate of 10% on the date of grant and an additional 30% on each of the first, second and third anniversaries of the date of grant provided that the holder is still employed by us or in our service on the applicable vesting date. All awards granted under the 2005 Incentive Plan become fully vested upon a Sale of Ascent so long as the holder is still employed by us or in our service. If the employment or service of a holder of an award is terminated by reason of death, permanent disability or by us without cause, such holder shall retain such holder’s award, to the extent then vested, for a period of six months after such termination. No incentive awards shall be granted after May 20, 2015.
2006 Long-Term Incentive Plan
General. We intend to adopt our 2006 Long-Term Incentive Plan as of the date immediately prior to the closing of this offering. The purposes of the 2006 Long-Term Incentive Plan are to attract and retain the best available personnel for positions of substantial responsibility, to provide additional incentives to our employees and consultants, and to promote the success of our business. The 2006 Long-Term Incentive Plan primarily provides for grants of (1) incentive stock options qualified as such under U.S. federal income tax laws, (2) stock options that do not qualify as incentive stock options (i.e., “nonstatutory options”), (3) stock appreciation rights, or SARs, (4) restricted stock awards, (5) restricted stock units or (6) any combination of such awards.
The 2006 Long-Term Incentive Plan will not be subject to ERISA. For a period of time following this offering, the 2006 Long-Term Incentive Plan will qualify for an exception to the rules imposed by Section 162(m) of the Code. Therefore, awards will be exempt from the limitations on the deductibility of compensation that exceeds $1.0 million.
Shares available. The maximum aggregate number of shares of our common stock that may be reserved and available for delivery in connection with awards under the 2006 Long-Term Incentive Plan will be , of which shares will remain available for awards upon the consummation of this offering and the Recapitalization. If common stock subject to any award is not issued or transferred, or ceases to be issuable or transferable for any reason, those shares of common stock will again be available for delivery under the 2006 Long-Term Incentive Plan to the extent allowable by law.
Eligibility. Any individual who provides services to us, including non-employee directors and consultants, and is designated by the compensation committee to receive an award under the 2006 Long-Term Incentive Plan will be a “Participant.” A Participant will be eligible to receive an award pursuant to the terms of the 2006 Long-Term Incentive Plan and subject to any limitations imposed by appropriate action of the compensation committee.
Administration. Our board of directors is expected to appoint the compensation committee to administer the 2006 Long-Term Incentive Plan pursuant to its terms, except in the event our board of directors chooses to take action under the 2006 Long-Term Incentive Plan. Our compensation committee at all times will be comprised of two or more individuals that constitute “outside directors” as defined in Section 162(m) of the Code and, in the discretion of our board of directors, “non-employee directors” as defined in Rule 16b-3 under the Exchange Act. Unless otherwise limited, the compensation committee will have broad discretion to administer the 2006 Long-Term Incentive Plan, including the power to determine to whom and when awards will be granted, to determine
96
the amount of such awards (measured in cash, shares of common stock or as otherwise designated), to proscribe and interpret the terms and provisions of each award agreement, to accelerate the exercise terms of an option, to delegate duties under the 2006 Long-Term Incentive Plan, to terminate, modify or amend the 2006 Long-Term Incentive Plan (subject to ratification by the board of directors) and to execute all other responsibilities permitted or required under the 2006 Long-Term Incentive Plan.
Terms of options. We may grant options to eligible persons including (1) incentive stock options (only to our employees) that comply with Section 422 of the Code and (2) nonstatutory options. The exercise price for an incentive stock option must not be less than the greater of (a) the par value per share of common stock or (b) the fair market value per share as of the date of grant. The exercise price per share of common stock subject to a nonstatutory option will not be less than the par value per share of the common stock (but may be less than the fair market value of a share of the common stock on the date of grant). Options may be exercised as the compensation committee determines, but not later than ten years from the date of grant. Any incentive stock option granted to an employee who possesses more than ten percent of the total combined voting power of all classes of our shares within the meaning of Section 422(b)(6) of the Code must have an exercise price of at least 110% of the fair market value of the underlying shares at the time the option is granted, and such option may not be exercised later than five years from the date of grant.
Terms of SARs. SARs may be awarded in connection with or separate from an option. An SAR is the right to receive an amount equal to the excess of the fair market value of one share of common stock on the date of exercise over the grant price of the SAR. SARs awarded in connection with an option will entitle the holder, upon exercise, to surrender the related option or portion thereof relating to the number of shares for which the SAR is exercised, which option or portion thereof will then cease to be exercisable. Such SAR is exercisable or transferable only to the extent that the related option is exercisable or transferable. SARs granted independently of an option will be exercisable as the compensation committee determines. The term of an SAR will be for a period determined by the compensation committee but will not exceed ten years. SARs may be paid in cash, common stock or a combination of cash and stock, as provided for by the compensation committee in the Participant’s award agreement.
Restricted stock awards. A restricted stock award is a grant of shares of common stock subject to a risk of forfeiture, restrictions on transferability, and any other restrictions imposed by the compensation committee in its discretion. Except as otherwise provided under the terms of the 2006 Long-Term Incentive Plan or an award agreement, the holder of a restricted stock award may have rights as a stockholder, including the right to vote or to receive dividends (subject to any mandatory reinvestment or other requirements imposed by the compensation committee). A restricted stock award that is subject to forfeiture restrictions may be forfeited and reacquired by us upon termination of employment or services. Common stock distributed in connection with a stock split or stock dividend, and other property distributed as a dividend, may be subject to the same restrictions and risk of forfeiture as the restricted stock with respect to which the distribution was made.
Restricted Stock Units. Restricted stock units are rights to receive common stock, cash or a combination of both at the end of a specified period. Restricted stock units may be subject to restrictions, including a risk of forfeiture, as specified in the Participant’s award agreement. Restricted stock units may be satisfied by common stock, cash or any combination thereof determined by the compensation committee. Except as otherwise provided by the compensation committee in the award agreement or otherwise, restricted stock units subject to forfeiture restrictions will be forfeited upon termination of a Participant’s employment or services prior to the end of the specified period. The compensation committee may, in its sole discretion, grant dividend equivalents with respect to restricted stock units.
Bonus Stock and Awards in Lieu of Company Obligations. The compensation committee will be authorized to grant common stock as a bonus, or to grant common stock or other awards in lieu of obligations to pay cash or deliver other property under the 2006 Long-Term Incentive Plan or under other plans or compensatory arrangements, subject to any applicable provision under Section 16 of the Exchange Act. Common stock or
97
awards granted hereunder will be subject to such other terms as determined by the compensation committee. Any grant of common stock to one of our officers or to an officer of a subsidiary in lieu of salary or other cash compensation will be reasonable, as determined by the compensation committee.
Dividend Equivalents. The compensation committee will be authorized to grant dividend equivalents to a Participant, entitling the Participant to receive cash, common stock, other awards, or other property equal in value to dividends paid with respect to a specified number of shares of common stock, or other periodic payments. Dividend equivalents may be awarded on a free-standing basis or in connection with another award. The compensation committee may provide that dividend equivalents will be payable or distributed when accrued or that they will be deemed as reinvested in additional common stock, awards, or other investment vehicles. The compensation committee will specify any restrictions on transferability and risks of forfeiture that are imposed upon dividend equivalents.
Other awards. Participants may be granted, subject to applicable legal limitations and the terms of the 2006 Long-Term Incentive Plan and its purposes, other awards related to common stock (in terms of being valued, denominated, paid or otherwise defined by reference to common stock). Such awards may include, but are not limited to, convertible or exchangeable debt securities, other rights convertible or exchangeable into common stock, purchase rights for common stock, awards with value and payment contingent upon our performance or any other factors designated by the compensation committee, and awards valued by reference to the book value of common stock or the value of securities of or the performance of specified subsidiaries. The compensation committee will determine terms and conditions of all such awards, including without limitation, the method of delivery, the consideration to be paid, the timing and methods of payment, and any performance criteria associated with an award. Cash awards may granted as an element of or a supplement to any awards permitted under the 2006 Long-Term Incentive Plan.
Performance awards. The compensation committee may designate that certain awards granted under the 2006 Long-Term Incentive Plan constitute “performance” awards. A performance award is any award the grant, exercise or settlement of which is subject to one or more performance standards. These standards may include business criteria, such as total stockholders’ return and earnings per share, for us on a consolidated basis or for specific subsidiaries or business or geographical units.
Termination of the 2005 Incentive Plan
As described above, our 2005 Incentive Plan provides for payment of aggregate awards of up to 13.5% of our Total Eligible Enterprise Value upon a Sale of Ascent. As of September 15, 2006, awards providing for approximately 12.8% of our Total Eligible Enterprise Value had been granted under the plan. In connection with and immediately prior to the closing of this offering, we intend to terminate our 2005 Incentive Plan. Participants in the 2005 Incentive Plan will receive cash bonuses and awards of restricted stock, which vest over a three year period, in exchange for terminating their rights under the 2005 Incentive Plan. We refer to this exchange as the “Incentive Issuance.” At the mid-point of the proposed offering range, the Incentive Issuance will be $ million in aggregate, of which $ million will be in the form of a cash bonus and $ million in the form of restricted stock awarded under our 2006 Long-Term Incentive Plan ( shares valued at the mid-point of the proposed offering range). The entire $ million Incentive Issuance is expected to be taxable to the recipients in this tax year. The cash bonus portion of the Incentive Issuance is intended to approximate the recipients’ related income tax liability. Because the entire Incentive Issuance is a taxable transaction, the recipients will not have income tax liability in the future merely as a result of the vesting of the restricted stock and will therefore not have to consider selling their shares to pay income taxes upon vesting. The terms of the 2005 Incentive Plan prohibit us from canceling or modifying an existing award without the consent of the affected holder; therefore, each of the holders of awards under our 2005 Incentive Plan must consent to this exchange in order to terminate all prior awards under our 2005 Incentive Plan. We have received the consent of % of the participants in the 2005 Incentive Plan. The Incentive Issuance is contingent on the consummation of this offering and the Recapitalization and the consent of each of the holders of awards under our 2005 Incentive Plan. Awards of
98
restricted stock granted in the Incentive Issuance will vest on the first, second and third anniversaries of their respective dates of grant in increments of 40%, 35% and 25%, respectively, provided that the holder is still employed by us or in our service on the applicable vesting date and will otherwise be subject to the terms and conditions set forth in the restricted stock agreements governing such awards and the 2006 Long-Term Incentive Plan.
401(k) Defined Contribution Plan
We have a Section 401(k) Defined Contribution Plan. The 401(k) plan is a tax-qualified retirement plan. Under the 401(k) plan, all employees with at least three months of continuous service are eligible to participate and may elect to defer up to 70% of their annual compensation on a pre-tax basis and have it contributed to the plan, subject to certain limitations under the Code. We may elect to make discretionary matching contributions to the 401(k) plan, which would be allocated on the basis of compensation. All matching contributions and discretionary contributions under the 401(k) plan are immediately vested in full.
Employment Agreements/Change of Control Agreements
We have entered into employment agreements with Messrs. Carter, LeBlanc, McCabe, Limke and Rice and another of our employees who is not one of our executive officers. These employment agreements were effective as of April 1, 2005 and amended effective as of June 26, 2006. Each employment agreement has an initial term of three years, but will automatically be extended for successive two-year terms on April 1 of each year beginning on April 1, 2007 unless either party gives not less than 90 days written notice that such party desires not to renew the employment agreement. The employment agreements initially provided for an annual base salary of $275,000 for Mr. Carter, $231,187.50 for Mr. LeBlanc, $157,039.87 for Mr. McCabe, $150,732 for Mr. Limke and $134,375.17 for Mr. Rice, which amounts are subject to upward (but not downward) adjustment annually by our board of directors. In addition, we pay annual insurance premiums for a one million dollar term life insurance policy and for an individual disability policy for each of Messrs. Carter and LeBlanc, both of which are transferable should either Messrs. Carter or LeBlanc leave our employment. During the period of employment under these agreements, each of the employees is entitled to additional benefits, including reimbursement of business expenses, vacation time, and participation in other company benefits, plans or programs that may be available to our other employees and is eligible to participate in our bonus, incentive compensation and other programs established by our board of directors.
If any of these officers is involuntarily terminated without cause or if the officer terminates his employment for good reason, as defined by the employment agreements, we will pay the officer his current annual rate of total compensation for the remaining term of the employment agreements, or if we elect, pay such amount in a lump sum within 30 days after the date of termination. If within one year of a change of control, as defined under the employment agreements, such officer is terminated without cause or such officer terminates his employment with us for good reason, we will pay the officer a lump sum cash payment equal to two times his then-current annual rate of total compensation in the case of Mr. Carter, and one time his then-current annual rate of total compensation in the case of Messrs. LeBlanc, McCabe, Limke and Rice, within 30 days after the date of termination. In addition to such severance payment(s), the officer may be entitled to continue to participate in certain employee benefit plans for a period of up to one year following a non-change of control involuntary termination or up to two years following an involuntary termination due to a change of control.
Any amount or benefit payable under the employment agreements that is subject to an excise tax under Section 4999 of the Code shall be reduced in a manner which results in the officer receiving the maximum amount permitted without the imposition of the excise tax under Section 4999 of the Code. In determining whether a payment or benefit would incur an excise tax, all payments and benefits under the employment agreements shall be consolidated with all other payments or benefits conferred upon the officer by us or our affiliates if they are the type that would be deemed “parachute payments” under Section 280G of the Code. However, any payment or benefit under the 2005 Incentive Plan, any stock option plans, share appreciation rights
99
or any additional current or future of our incentive plans shall not be considered “parachute payments” for purposes of the employment agreements and shall be excluded from the limitation on payments described above. If it is determined that any such excise tax would be due, the officer may elect to reduce the amounts payable to him under one or more of the agreements, plans or programs in any way he determines.
In addition, each of these employment agreements contains provisions that prohibit, with certain limitations and subject to certain exceptions, the officer from competing with us, directly or indirectly, in the exploration for hydrocarbons or soliciting or hiring of any of our employees or inducing any of them to terminate their employment with us. This non-competition restriction continues during the term of employment and for a period of one year following termination of the employment agreement.
Indemnification Agreements
Prior to the completion of this offering, we intend to enter into indemnification agreements with all of our directors and executive officers and some of our other officers under which we will agree to indemnify such persons against expenses (including attorneys’ fees), judgments, fines and amounts paid in settlement incurred as a result of the fact that such person, in his or her capacity as a director or officer, is made or threatened to be made a party to any suit or proceeding. These persons will be indemnified to the fullest extent now or hereafter permitted by the Delaware General Corporation Law, or DGCL. The indemnification agreements also provide for the advancement of expenses to these directors and officers in connection with any suit or proceeding.
100
RELATED PARTY TRANSACTIONS
The following is a discussion of transactions between us and our executive officers, directors and beneficial owners of more than 5% of our common stock.
Recapitalization
The Jefferies Investors, including Jefferies & Company, Inc., which is one of the underwriters in this offering, and The TCW Funds will receive a portion of the net proceeds of this offering and shares of our common stock in connection with the Recapitalization and the use of proceeds of this offering. Upon consummation of this offering, the application of the proceeds from this offering as described under “Use of Proceeds” and the Recapitalization, The Jefferies Investors and The TCW Funds will beneficially own an aggregate of approximately shares and shares, respectively, of our outstanding common stock, representing % and %, respectively, of our outstanding common stock, and will beneficially own none of our other securities. In addition, persons associated with The Jefferies Investors serve as our directors. Please read “Recapitalization,” “Principal Stockholders” and “Management.”
The following table presents certain information regarding the aggregate ownership of our securities by The Jefferies Investors and The TCW Funds before and after the consummation of this offering, the application of the net proceeds of this offering as described under “Use of Proceeds” and the Recapitalization. For information relating to the beneficial ownership of our common stock, within the meaning of Rule 13d-3 under the Exchange Act, held by The Jefferies Investors and The TCW Funds before and after this consummation of this offering and the Recapitalization, please see “Principal Stockholders.”
| | | | | | | | | | | | | | | | | | | | | | |
| | | Securities Owned Prior to this Offering and the Recapitalization |
| | | Shares of
Common
Stock of
Parent(1) | | Shares of
Common
Stock of
Ascent
Energy Inc.(2) | | Shares of
Series A
Preferred
Stock of
Ascent
Energy Inc.(3) | | Senior Notes(4) | | Senior Subordinated
Notes(5) |
| | | | | | |
| | | Number | | % | | Number | | % | | Number | | % | | Principal
Amount | | % | | Principal
Amount | | % |
The Jefferies Investors | | | | % | | | | % | | | | % | | $ | | | % | | $ | | | % |
The TCW Funds | | | | | | | | | | | | | | | | | | | | | | |
| | | | | | | | | | | | | | | | | | | | | | |
Total | | | | % | | | | % | | | | % | | $ | | | % | | $ | | | % |
| | | | | | | | | | | | | | | | | | | | | | |
| | | | | | | | | | | | | | | | | | |
| | | Securities Owned After this Offering and the Recapitalization |
| | | Shares of
Common
Stock of
Parent | | Shares of Common Stock of Ascent Energy Inc. | | Shares of Series A
Preferred Stock of
Ascent Energy Inc. | | Senior Notes | | Senior
Subordinated
Notes |
| | | | Number | | % | | | |
| | | | Assuming No
Exercise of
Underwriters’
Option | | Assuming
Full Exercise
of
Underwriters’
Option | | Assuming No
Exercise of
Underwriters’
Option | | Assuming
Full Exercise
of
Underwriters’
Option | | | |
| | | | | | | | | |
The Jefferies Investors | | — | | | | | | % | | % | | — | | $ | — | | $ | |
The TCW Funds | | — | | | | | | | | | | — | | | — | | | |
| | | | | | | | | | | | | | | | | | |
Total | | — | | | | | | % | | % | | — | | $ | — | | $ | |
| | | | | | | | | | | | | | | | | | |
| (1) | Does not include shares of common stock of our Parent issuable upon exercise of warrants, which are out-of-the-money and will be extinguished upon the consummation of the Recapitalization. |
| (2) | Does not include the exercise of warrants, which are out-of-the-money and will be extinguished upon the consummation of the Recapitalization. |
101
| (3) | Includes shares of Series A preferred stock of Ascent Energy Inc. issuable upon exercise of currently exercisable warrants to purchase shares of our Series A preferred stock at an exercise price of $ per share. Each share of Series A preferred stock issued upon exercise of such warrants will be issued with one warrant to purchase shares of common stock of Ascent Energy Inc. Such warrants to purchase common stock are out-of-the-money and will be extinguished upon the consummation of the Recapitalization. See below for further information regarding the Series A preferred stock and these warrants. |
| (4) | See below for further information regarding the senior notes. |
| (5) | See below for further information regarding the senior subordinated notes. |
The following table presents certain information regarding the board representation of The Jefferies Investors and The TCW Funds before and after the consummation of this offering and the Recapitalization:
| | | | | | | | | | | | | | | | | | | | | | | | | | | | | |
| | | | | Board Representation |
| | | | | Board Seats prior to this offering
and the Recapitalization | | | Board Seats after this offering
and the Recapitalization |
| | | | | Parent(1) | | | Ascent Energy Inc.(2) | | | Parent | | | Ascent Energy Inc. |
| | | | | Number
Entitled | | Number
Held | | %
Held | | | Number
Entitled | | Number
Held | | %
Held | | | Number
Entitled | | Number
Held | | %
Held | | | Number
Entitled | | Number
Held | | %
Held |
The Jefferies Investors | | | | 1 | | 1 | | 50 | % | | 4 | | 3 | | 75 | % | | — | | — | | — | % | | — | | — | | % |
The TCW Funds | | | | 1 | | — | | — | | | 1 | | — | | — | | | — | | — | | — | | | — | | — | | — |
| | | | | | | | | | | | | | | | | | | | | | | | | | | | | |
Total | | | | 2 | | 1 | | 50 | % | | 5 | | 3 | | 75 | % | | — | | — | | — | % | | — | | | | % |
| | | | | | | | | | | | | | | | | | | | | | | | | | | | | |
| (1) | Pursuant to the Parent shareholders’ agreement described below, Jefferies & Company, Inc. and The TCW Funds each have the right to designate one member of the board of directors of our Parent subject to certain terms and conditions. The bylaws of our Parent fix the number of directors constituting the whole board of directors at four; however, prior to the consummation of this offering and the Recapitalization, the board of directors of our Parent consists of only two members, James L. Luikart and Terry W. Carter. In connection with this offering and the Recapitalization, the shareholders’ agreement will be terminated, and neither Jefferies & Company, Inc., nor The TCW Funds will have a contractual right to designate for election any directors of our Parent. Upon consummation of this offering and the Recapitalization, the board of directors of our Parent will consist of two members, Terry W. Carter and Eddie M. LeBlanc, III. |
| (2) | Pursuant to the voting agreement of Ascent Energy Inc. described below, certain of The Jefferies Investors, including Jefferies & Company, Inc., have the right to designate two directors of Ascent Energy Inc., certain other of The Jefferies Investors have the right to designate two directors of Ascent Energy Inc. and The TCW Funds have the right to designate one director of Ascent Energy Inc., in each case subject to the terms and conditions of the voting agreement. The voting agreement fixes the number of directors constituting the whole board of directors of Ascent Energy Inc. at eight; however, prior to the consummation of this offering and the Recapitalization, the board of directors of Ascent Energy Inc. consists of only four members, one of whom was designated by Jefferies & Company, Inc. and two of whom were designated for election by certain other of The Jefferies Investors. In connection with this offering and the Recapitalization, the voting agreement will be terminated, and none of The Jefferies Investors or The TCW Funds will be entitled to designate for election any directors of Ascent Energy Inc. Upon consummation of this offering and the Recapitalization, the board of directors of Ascent Energy Inc. will consist of directors, including directors who are associated with The Jefferies Investors. |
102
The following table sets forth certain information regarding the aggregate shares of common stock and cash proceeds (net of underwriting discounts and estimated offering expenses payable by us) that The Jefferies Investors, including Jefferies & Company, Inc., which is one of the underwriters in this offering, and The TCW Funds will receive in connection with this offering and the Recapitalization:
| | | | | | | | | | | | | | | | | | | | |
| | | Shares of Common Stock of Ascent Energy Inc. | | | | | | | | |
| | | Number | | % | | Cash Proceeds (Net) | | Underwriting Discounts |
| | | Assuming No
Exercise of
Underwriters’
Option | | Assuming
Full Exercise
of
Underwriters’
Option | | Assuming No
Exercise of
Underwriters’
Option | | Assuming
Full Exercise of
Underwriters’
Option | | Assuming No
Exercise of
Underwriters’
Option | | Assuming
Full Exercise
of
Underwriters’
Option | | Assuming No
Exercise of
Underwriters’
Option | | Assuming
Full Exercise
of
Underwriters’
Option |
The Jefferies Investors(1) | | | | | | % | | % | | $ | | | $ | | | $ | | | $ | |
The TCW Funds | | | | | | | | | | | | | | | | | — | | | — |
| | | | | | | | | | | | | | | | | | | | |
Total | | | | | | % | | % | | $ | | | $ | | | $ | | | $ | |
| | | | | | | | | | | | | | | | | | | | |
| (1) | Jefferies & Company, Inc. is an underwriter in this offering and entitled to underwriting discounts with respect to the shares purchased by it in this offering. |
Senior Notes.We issued $24.0 million aggregate principal amount of senior promissory notes between May 2003 and July 2003 to The Jefferies Investors and certain of The TCW Funds for short-term liquidity needs and to fund our limited capital expenditure program in the third and fourth quarters of 2003. In connection with our July 2004 financial restructuring, we issued approximately $27.5 million aggregate principal amount of our 16% senior notes due October 26, 2007 and warrants to purchase up to 3,000 shares of our Series A preferred stock to The Jefferies Investors and certain of The TCW Funds in exchange for all then-outstanding principal and accrued but unpaid interest on our senior promissory notes. On November 9, 2005, we issued approximately $33.5 million aggregate principal amount of our senior notes to The Jefferies Investors and certain of The TCW Funds in exchange for all then-outstanding principal and accrued but unpaid interest on our 16% senior notes due October 26, 2007. Interest on our senior notes is payable semi-annually in the form of additional senior notes.
As of December 31, 2003, The Jefferies Investors and The TCW Funds held approximately $22.8 million and $1.2 million, respectively, aggregate principal amount of our senior promissory notes. As of December 31, 2004, The Jefferies Investors and The TCW Funds held approximately $27.2 million and $1.4 million, respectively, aggregate principal amount of our 16% senior notes due October 26, 2007. As of June 30, 2006, The Jefferies Investors and The TCW Funds held approximately $34.2 million and $1.8 million, respectively, aggregate principal amount of our senior notes.
Senior Subordinated Notes. In June 2001, we issued $75.0 million aggregate principal amount of 11 3/4% Series A senior notes due 2006 in connection with the acquisition of our south Texas properties. In connection with our July 2004 financial restructuring, we issued approximately $85.9 million aggregate principal amount of our 11 3/4% senior subordinated notes due 2008 to The Jefferies Investors and The TCW Funds in exchange for all then-outstanding principal and accrued but unpaid interest on our 11 3/4% Series A senior notes due 2006. On November 9, 2005, we issued approximately $99.6 million aggregate principal amount of our senior subordinated notes to The Jefferies Investors and The TCW Funds in exchange for all then-outstanding principal and accrued but unpaid interest on our 11 3/4% senior subordinated notes due 2006. Interest on our senior subordinated notes is payable semi-annually in the form of additional senior subordinated notes.
As of December 31, 2003, The Jefferies Investors and The TCW Funds held approximately $60.7 million and $14.3 million, respectively, aggregate principal amount of our 11 3/4% Series A senior notes due 2006. As of December 31, 2004, The Jefferies Investors and The TCW Funds held approximately $71.7 million and $16.9 million, respectively, aggregate principal amount of our 11 3/4% senior subordinated notes due 2008. As of June 30, 2006, The Jefferies Investors and The TCW Funds held approximately $85.1 million and $20.0 million, respectively, aggregate principal amount of our 11 3/4% senior subordinated notes due 2008.
103
8% Series A Preferred Stock and Warrants to Purchase Common Stock.In July 2001, we issued an aggregate of $21.1 million of units, each consisting of one share of our Series A preferred stock and one warrant to purchase 191.943 shares of our common stock at an exercise price of $5.21 per share (each of which will be adjusted to a warrant to purchase shares of our common stock at a purchase price of $ per share in connection with the reverse stock split), to The Jefferies Investors and The TCW Funds to fund part of the cash portion of our purchase price for Pontotoc Production, Inc. In August 2002, we issued an additional $20.0 million of units to The Jefferies Investors and The TCW Funds. In connection with the August 2002 issuance, we paid Jefferies & Company, Inc. an aggregate of $1.0 million of the cash proceeds of the unit offering for its services as our advisor.
Voting Agreement.In connection with the August 2002 unit issuance, we entered into a voting agreement with our Parent and certain holders of our Series A preferred stock, which provides for a majority of our board of directors to be appointed by The Jefferies Investors and The TCW Funds. Under the voting agreement, Jefferies & Company, Inc. and certain of its affiliates are entitled to designate two of our directors so long as they hold not less than 10% of the outstanding Series A preferred stock, other of The Jefferies Investors are entitled to designate two of our directors so long as they hold not less than 25% of the outstanding Series A preferred stock and The TCW Funds are entitled to designate one of our directors so long as it holds not less than 10% of the outstanding Series A preferred stock. The voting agreement fixes the number of directors constituting the whole board of directors of Ascent Energy Inc. at eight; however, prior to the consummation of this offering and the Recapitalization, the board of directors of Ascent Energy Inc. consists of only four members, one of whom was designated by Jefferies & Company, Inc. and two of whom were designated for election by certain other of The Jefferies Investors. In connection with this offering and the Recapitalization, this voting agreement will be terminated and none of The Jefferies Investors or The TCW Funds will be entitled to designate for election any directors of Ascent Energy Inc. Upon consummation of this offering and the Recapitalization, the board of directors of Ascent Energy Inc. will consist of directors, including directors who are associated with The Jefferies Investors.
Parent Shareholders’ Agreement. Pursuant to a shareholders’ agreement dated as of January 14, 2000 by and among our Parent, The TCW Funds, Jefferies & Company, Inc., McLain J. Forman and certain other holders of our Parent’s securities, The TCW Funds, Jefferies & Company, Inc. and Mr. Forman have the right to designate for election three members of the board of directors of our Parent. Pursuant to the shareholders’ agreement, The TCW Funds have the right to designate one member of the board of directors of our Parent unless and until the earlier of such date that The TCW Funds own less than 5% of the outstanding common stock of our Parent or, solely as a result of any transfers by The TCW Funds, The TCW Funds own less than 10% of the outstanding common stock of our Parent; Jefferies & Company, Inc. has the right to designate one member of the board of directors of our Parent unless and until the earlier of such date that Jefferies & Company, Inc. owns less than 5% of the outstanding common stock of our Parent or, solely as a result of any transfers by Jefferies & Company, Inc., Jefferies & Company, Inc. owns less than 10% of the outstanding common stock of our Parent; and Mr. Forman has the right to designate one member of the board of directors of our Parent unless and until the date he has transferred 50% or more of the securities of our Parent owned by him as of the date of the shareholders’ agreement to persons other than his permitted transferees and the aggregate ownership of our Parent’s securities (assuming the exercise or conversion thereof) by Mr. Forman and his permitted transferees represents less than 10% of the voting power of our Parent. The bylaws of our Parent fix the number of directors constituting the whole board of directors at four; however, prior to the consummation of this offering and the Recapitalization, our board of directors of our Parent consists of only two members, James L. Luikart and Terry W. Carter. In connection with this offering and the Recapitalization, the shareholders’ agreement will be terminated, and none of Jefferies & Company, Inc., The TCW Funds or Mr. Forman will have a contractual right to designate for election any directors of our Parent. Upon consummation of this offering and the Recapitalization, the board of directors of our Parent will consist of two members, Terry W. Carter and Eddie M. LeBlanc, III.
104
Registration Rights
In connection with the July 2001 issuance of Series A preferred stock and warrants to purchase common stock, we entered into a registration rights agreement with the holders of the warrants to purchase shares of our common stock. According to the terms of the registration rights agreement, these holders are entitled to registration rights with respect to shares of our common stock representing the shares of our common stock issuable upon exercise of the warrants to purchase our common stock. Beginningon the date 185 days after the common stock is registered under the Exchange Act, the holders of not less than a majority of such registrable securities will have the right to require us to file a registration statement under the Securities Act for the sale by such holders of not less than 5% of our then-outstanding shares of common stock. We will not be required to effect more than four such demand registrations under the registration rights agreement and no more than two such demand registrations during any 12-month period. The holders entitled to such demand registrations may require us to effect any such demand registration as an underwritten offering, in which case they shall have the right to select the managing underwriters, subject to our reasonable satisfaction, and any additional investment bankers and managers for the offering. In addition, the holders may participate in any public offering by us of our common stock, other than on a registration statement with respect to corporate reorganizations or other transactions under Rule 145 under the Securities Act or on a registration statement on Form S-8, unless the lead managing underwriter delivers to us a written opinion that the proposed size of the offering would materially and adversely affect the offering or offering price. We will pay all expenses in connection with any demand or piggyback registration under the registration rights agreement, other than any underwriting fees, discounts attributable to the sale of registrable securities by the holders and any other expenses of the holders. We will also pay the reasonable fees and expenses of counsel chosen by the holders of a majority of the registrable securities being sold pursuant to the registration rights agreement. Under the registration rights agreement, the holders have also agreed not to effect any public sale, including a sale pursuant to Rule 144 under the Securities Act, of any registrable securities or any securities convertible into or exchangeable or exercisable for such securities during the 14 days prior to, and during the 90 days following (or 180 days in the case of this offering), the effective date of any underwritten demand or piggyback registration.
Business Opportunities
Our amended and restated certificate of incorporation will provide that if an opportunity in our line of business is presented to any of our non-employee directors:
| | • | | they will have no obligation to communicate or present the opportunity to us; |
| | • | | they will not breach any fiduciary duty to us merely because they or their affiliates pursue or acquire the opportunity; and |
| | • | | they and their affiliates may pursue the opportunity as that entity or individual sees fit, |
unless it was presented to such director solely in that person’s capacity as our director or is identified by such director or such director’s affiliates solely through the disclosure of information by or on behalf of us.
Our amended and restated certificate of incorporation also will permit our non-employee directors and their affiliates to engage or invest in businesses that compete with ours. Accordingly, these persons may, and in some cases of which we are aware, do engage in business activities with or invest in competing companies. We will renounce any interest in any such business activities or ventures.
These provisions of our amended and restated certificate of incorporation will be permitted to be amended only by an affirmative vote of holders of at least a majority of our total voting power. As a result of these provisions, conflicts of interest could arise between us and our significant stockholders who are affiliated with our non-employee directors.
105
Potential Conflicts of Interest
Conflicts of interest may arise in the future as a result of the relationships between us and our significant stockholders, including The Jefferies Investors, who are affiliated with our non-employee directors. We intend to conduct an appropriate review of all related party transactions for potential conflicts of interest. The members of the board of directors of Ascent Energy Inc. are subject to fiduciary duties under Delaware law in their management of the business and affairs of Ascent Energy Inc. In accordance with applicable rules of The Nasdaq Global Market, we intend to have the audit committee of the board of directors of Ascent Energy Inc. review and approve related party transactions and other matters that may present a conflict of interest.
Related Party Leases
From February 1, 2002 through April 30, 2005, we subleased a portion of rented office space in New Orleans, Louisiana to Jefferies & Company, Inc. at subrental rates equal to the proportionate share of our rental rates under the lease. For the years ended December 31, 2003, 2004 and 2005, Jefferies & Company, Inc. paid us approximately $57,000, $57,000 and $19,000, respectively, in subrent.
We lease office space under a three-year lease which expires on October 31, 2007 from a company owned by an individual who served as our Vice President until April 2005, his brother, who is one of our employees, and their father. For the years ended December 31, 2003, 2004 and 2005, we paid approximately $87,000, $86,000 and $73,000, respectively, in rent under this arrangement.
Employment Agreements
We have entered into employment agreements with our executive officers. Please see “Management—Employment Agreements/Change of Control Agreements.”
Indemnification of Officers and Directors
Prior to the completion of this offering, we intend to enter into indemnification agreements with all of our directors and executive officers and some of our other officers. For additional information about the indemnification of our officers and directors, please read “Management—Indemnification Agreements” and “Description of Capital Stock—Limitation of Liability of Officers and Directors.”
Termination of 2005 Incentive Plan
In connection with and immediately prior to the closing of this offering, we intend to terminate our 2005 Incentive Plan. Participants in the 2005 Incentive Plan will receive cash bonuses and awards of restricted stock, which vest over a three year period, in exchange for terminating their rights under the 2005 Incentive Plan. We refer to this exchange as the “Incentive Issuance.” At the mid-point of the proposed offering range, the Incentive Issuance will be $ million in aggregate, of which $ million will be in the form of a cash bonus and $ million in the form of restricted stock awarded under our 2006 Long-Term Incentive Plan ( shares valued at the mid-point of the proposed offering range). The entire $ million Incentive Issuance is expected to be taxable to the recipients in this tax year. The cash bonus portion of the Incentive Issuance is intended to approximate the recipients’ related income tax liability. Because the entire Incentive Issuance is a taxable transaction, the recipients will not have income tax liability in the future merely as a result of the vesting of the restricted stock and will therefore not have to consider selling their shares to pay income taxes upon vesting. The terms of the 2005 Incentive Plan prohibit us from canceling or modifying an existing award without the consent of the affected holder; therefore, each of the holders of awards under our 2005 Incentive Plan must consent to this exchange in order to terminate all prior awards under our 2005 Incentive Plan. We have received the consent of % of the participants in the 2005 Incentive Plan. The Incentive Issuance is contingent on the consummation of this offering and the Recapitalization and the consent of each of the holders of awards under our 2005 Incentive Plan. All of our executive officers are expected to participate in the Incentive Issuance and
106
therefore will receive cash bonuses and awards of restricted stock under our 2006 Long-Term Incentive Plan in connection with the Incentive Issuance. Messrs. Carter, Leblanc, McCabe, Limke and Rice are expected to receive cash bonuses of $ , $ , $ , $ and $ , respectively, and shares, shares, shares, shares and shares of restricted stock, respectively. Awards of restricted stock granted in the Incentive Issuance will vest on the first, second and third anniversaries of their respective dates of grant in increments of 40%, 35% and 25%, respectively, provided that the holder is still employed by us or in our service on the applicable vesting date and will otherwise be subject to the terms and conditions set forth in the restricted stock agents governing such awards and the 2006 Long-Term Incentive Plan.
Underwriting
Jefferies & Company, Inc. is an underwriter participating in this offering and will be entitled to underwriting discounts with respect to the shares purchased by it in this offering. In addition, The Jefferies Investors, including Jefferies & Company, Inc., will receive a portion of the net proceeds of this offering and shares of common stock in connection with this offering and the Recapitalization. See “Underwriting,” “Risk Factors—Risks Related to this Offering and Our Common Stock—The Jefferies Investors have relationships with us that may present conflicts of interest,” “Recapitalization” and “Related Party Transactions.” In addition, an affiliate of Fortis Securities is serving as an agent, and affiliates of each of Fortis Securities and Capital One are lenders, under our credit facility and will indirectly receive a portion of the net proceeds of this offering as a result of our intended repayment of loans outstanding under our credit facility. See “Underwriting.”
107
PRINCIPAL STOCKHOLDERS
The following table presents information regarding beneficial ownership of our common stock as of , 2006, adjusted to reflect the Recapitalization and the sale of common stock in this offering, by:
| | • | | each person who we know owns beneficially more than 5% of our common stock; |
| | • | | our Chief Executive Officer and each of our four other most highly compensated executive officers during 2005; and |
| | • | | all of our executive officers, directors and nominees for director as a group. |
Unless otherwise indicated in the footnotes to this table and subject to community property laws where applicable, we believe that each of the stockholders named in this table has the sole voting and investment power with respect to the shares indicated as beneficially owned. Under the regulations of the SEC, shares are deemed to be “beneficially owned” by a person if the holder directly or indirectly has or shares the power to vote or dispose of these shares, whether or not the holder has any pecuniary interest in these shares, or if the holder has the right to acquire the power to vote or dispose of these shares within 60 days, including any right to acquire through the exercise of any option, warrant or right. Unless otherwise indicated, the address for each person set forth in the table is c/o Ascent Energy Inc., 4965 Preston Park Blvd., Suite 800, Plano, Texas 75093.
| | | | | | | | | | | | |
| | | Shares Beneficially Owned
Prior to this Offering
and the
Recapitalization(1) | | Shares Beneficially Owned After this Offering and the Recapitalization(2) |
| | | | Number | | % |
Name of beneficial owner | | Number | | % | | Assuming No
Exercise of
Underwriters’
Option | | Assuming Full
Exercise of
Underwriters’
Option | | Assuming No
Exercise of
Underwriters’
Option | | Assuming Full
Exercise of
Underwriters’
Option |
South Louisiana Property Holdings, Inc. (3) | | | | | | | | | | | | |
Jefferies Group, Inc. (4) | | | | | | | | | | | | |
Jefferies & Company, Inc. (5) | | | | | | | | | | | | |
Jefferies Capital Partners (6) | | | | | | | | | | | | |
Jefferies Partners Opportunity Fund, L.L.C. (7) | | | | | | | | | | | | |
Jefferies Partners Opportunity Fund II, L.L.C. (7) | | | | | | | | | | | | |
Jefferies Employees Opportunity Fund, L.L.C. (7) | | | | | | | | | | | | |
ING Furman Selz Investors III, L.P. (8) | | | | | | | | | | | | |
ING Barings U.S. Leveraged Equity Plan LLC (8) | | | | | | | | | | | | |
ING Barings Global Leveraged Equity Plan Ltd. (8) | | | | | | | | | | | | |
Brian P. Friedman (9) | | | | | | | | | | | | |
The TCW Funds (10) | | | | | | | | | | | | |
Terry W. Carter (11) | | | | | | | | | | | | |
Eddie M. LeBlanc, III (11) | | | | | | | | | | | | |
David L. McCabe (11) | | | | | | | | | | | | |
Steve Limke (11) | | | | | | | | | | | | |
David A. Rice (11) | | | | | | | | | | | | |
James L. Luikart (6) | | | | | | | | | | | | |
Stuart B. Katz (6) | | | | | | | | | | | | |
Robert J. Welch (5) | | | | | | | | | | | | |
All directors and executive officers as a group (8 persons) | | | | | | | | | | | | |
108
| (1) | Based on an aggregate of shares of common stock issued and outstanding after giving pro forma effect to the -for-1 reverse stock split expected to be effected in connection with this offering. |
| (2) | Assumes the issuance of shares of common stock in this offering, shares of common stock in the Recapitalization, if the underwriters do not exercise in full their option to purchase additional shares of our common stock and shares of common stock in the Recapitalization if the underwriters exercise in full their option to purchase additional shares of our common stock. Gives effect to the -for-1 reverse stock split expected to be effected in connection with this offering. |
| (3) | The Jefferies Investors, which includes Jefferies & Company, Inc., Jefferies Capital Partners, Jefferies Partners Opportunity Fund, L.L.C., Jefferies Partners Opportunity Fund II, L.L.C., Jefferies Employees Opportunity Fund, L.L.C., ING Furman Selz Investors III, L.P., ING Barings U.S. Leveraged Equity Plan LLC and ING Barings Global Leveraged Equity Plan Ltd. (as well as certain other affiliated persons not named in the table above), and The TCW Funds beneficially own approximately 77.4% and 17.6%, respectively, of the shares and total outstanding voting power of SLPH. In addition, The Jefferies Investors and The TCW Funds are each entitled to designate one member of SLPH’s board of directors, which is currently fixed at four with two vacancies. |
| (4) | Prior to this offering and the Recapitalization, represents shares issuable upon exercise of immediately exercisable warrants which includes shares issuable upon exercise of warrants held by Jefferies & Company, Inc.; shares issuable upon exercise of warrants held by Jefferies Partners Opportunity Fund, L.L.C.; shares issuable upon exercise of warrants held by Jefferies Partners Opportunity Fund II, L.L.C. and shares issuable upon exercise of warrants held by Jefferies Employees Opportunity Fund, L.L.C. Also includes the shares held by SLPH because Jefferies Group, Inc. may be deemed the beneficial owner of these shares. After this offering and the Recapitalization, represents shares of common stock which includes shares of common stock held by Jefferies & Company, Inc., shares of common stock held by Jefferies & Company, Inc.; shares of common stock held by Jefferies Partners Opportunity Fund, L.L.C.; shares of common stock held by Jefferies Partners Opportunity Fund II, L.L.C.; and shares of common stock held by Jefferies Partners Employees Opportunity Fund, L.L.C. Jefferies Group, Inc. may be deemed the beneficial owner of the shares included in this note due to its relationship as parent of Jefferies & Company, Inc., which is the manager of the three funds named in this note. In addition, Jefferies & Company, Inc.,Jefferies Partners Opportunity Fund, L.L.C., Jefferies Partners Opportunity Fund II, L.L.C. and Jefferies Employees Opportunity Fund, L.L.C. have an agreement which requires them to act together regarding decisions pertaining to the dispositive or voting power of the shares identified in the table as beneficially owned by them. Jefferies Group, Inc. may also be deemed to be the beneficial owner of the shares identified in this table as beneficially owned by Jefferies Capital Partners (see note 6) because of Mr. Friedman’s relationships with Jefferies Group, Inc. and Jefferies Capital Partners. Pursuant to Rule 13d-4 under the Exchange Act, Jefferies Group, Inc. disclaims the beneficial ownership of the shares identified in this table as beneficially owned by Jefferies Capital Partners. Prior to this offering and the Recapitalization, Jefferies & Company, Inc. and the three funds named in this note have an option to purchase shares of SLPH common stock issuable upon exercise of warrants held by Jefferies Capital Partners. The address for Jefferies Group, Inc. is 520 Madison Avenue, New York, New York 10022. |
| (5) | Prior to this offering and the Recapitalization, represents shares issuable upon exercise of immediately exercisable warrants which includes shares issuable upon exercise of warrants held by Jefferies & Company, Inc., shares issuable upon exercise of warrants held by Jefferies Partners Opportunity Fund, L.L.C.; shares issuable upon exercise of warrants held by Jefferies Partners Opportunity Fund II, L.L.C. and shares issuable upon exercise of warrants held by Jefferies Employees Opportunity Fund, L.L.C. Also includes the shares held by SLPH because Jefferies & Company, Inc. may be deemed the beneficial owner of these shares. After this offering and the Recapitalization, represents shares of common stock which includes shares of common stock held by |
109
| | Jefferies & Company, Inc., shares of common stock held by Jefferies Partners Opportunity Fund, L.L.C.; shares of common stock held by Jefferies Partners Opportunity Fund II, L.L.C.; and shares of common stock held by Jefferies Partners Employees Opportunity Fund, L.L.C. Jefferies & Company, Inc. may be deemed the beneficial owner of the shares of common stock included in this note due to its relationship as the manager of the three funds named in this note. In addition, Jefferies & Company, Inc., Jefferies Partners Opportunity Fund, L.L.C., Jefferies Partners Opportunity Fund II, L.L.C. and Jefferies Employees Opportunity Fund, L.L.C. have an agreement which requires them to act together regarding decisions pertaining to the dispositive or voting power of the shares identified in the table as beneficially owned by them. Jefferies & Company, Inc. may also be deemed to be the beneficial owner of the shares identified in this table as beneficially owned by Jefferies Capital Partners (see note 6) because of Mr. Friedman’s relationships with Jefferies & Company, Inc. and Jefferies Capital Partners. Pursuant to Rule 13d-4 under the Exchange Act, Jefferies & Company, Inc. disclaims the beneficial ownership of the shares identified in this table as beneficially owned by Jefferies Capital Partners. Mr. Welch is an officer of Jefferies & Company, Inc., however, he does not have dispositive or voting power over the shares identified in this table as beneficially owned by Jefferies & Company, Inc. Therefore, the shares included in the table for Mr. Welch do not include the shares which may be deemed beneficially owned by Jefferies & Company, Inc. In addition, prior to this offering and the Recapitalization, Jefferies & Company, Inc. and the three funds named in this footnote have an option to purchase shares of SLPH common stock issuable upon exercise of warrants held by Jefferies Capital Partners. The address for each of Jefferies & Company, Inc. and Mr. Welch is 520 Madison Avenue, New York, New York 10022. |
| (6) | ING Furman Selz Investors III, L.P., ING Barings U.S. Leverage Equity Plan Ltd. and ING Baring Global Leveraged Equity Plan Ltd. have an agreement which requires them to act together regarding decisions pertaining to the dispositive or voting power of the share identified in the table as beneficially owned by them. Jefferies Capital Partners includes ING Furman Selz Investors III, L.P., ING Barings U.S. Leveraged Equity Plan Ltd. and ING Baring Global Leveraged Equity Plan Ltd. Prior to this offering and the Recapitalization, represents shares issuable upon exercise of immediately exercisable warrants which includes shares issuable upon exercise of warrants held by ING Furman Selz Investors III, L.P.; shares issuable upon exercise of warrants held by ING Barings U.S. Leveraged Equity Plan Ltd. and shares issuable upon exercise of warrants held by ING Baring Global Leveraged Equity Plan Ltd. After this offering and the Recapitalization, represents shares of common stock which includes shares of common stock held by ING Furman Selz Investors III, L.P.; shares of common stock held by ING Barings U.S. Leveraged Equity Plan Ltd.; shares of common stock held by ING Baring Global Leveraged Equity Plan Ltd. Jefferies Capital Partners may also be deemed to be the beneficial owner of the shares identified in this table as beneficially owned by Jefferies Group Inc. (see note 4) and the shares identified in this table as beneficially owned by Jefferies & Company, Inc. (see note 5) because of Mr. Friedman’s relationships with Jefferies Capital Partners, Jefferies Group Inc. and Jefferies & Company, Inc. Pursuant to Rule 13d-4 under the Exchange Act, Jefferies Capital Partners disclaims the beneficial ownership of the shares identified in this table as beneficially owned by Jefferies Group Inc. and Jefferies & Company, Inc. Mr. Luikart may be deemed to have beneficial ownership of the shares identified in this table as beneficially owned by Jefferies Capital Partners because he is one of two managing members of Jefferies Capital Partners. Mr. Katz is an officer and managing director of Jefferies Capital Partners; however, he does not have dispositive or voting power of the shares identified in this table as beneficially owned by Jefferies Capital Partners. Therefore, the shares included in this table for Mr. Katz do not include the shares beneficially owned by Jefferies Capital Partners. The address for each of Messrs. Katz and Luikart and Jefferies Capital Partners is c/o Jefferies Capital Partners, 520 Madison Avenue, New York, New York 10022. |
| (7) | Jefferies Partners Opportunity Fund, L.L.C., Jefferies Partners Opportunity Fund II, L.L.C. and Jefferies Partners Employees Opportunity Fund, L.L.C. have an agreement which requires them to act together with Jefferies & Company, Inc. regarding decisions pertaining to the dispositive or voting power of the shares identified in this table as beneficially owned by them. Prior to this offering and the Recapitalization, represents shares issuable upon exercise of immediately exercisable warrants which includes |
110
| | shares issuable upon exercise of warrants held by Jefferies & Company, Inc.; shares issuable upon exercise of warrants held by Jefferies Partners Opportunity Fund, L.L.C.; shares issuable upon exercise of warrants held by Jefferies Partners Opportunity Fund II, L.L.C. and shares issuable upon exercise of warrants held by Jefferies Employees Opportunity Fund, L.L.C. Also includes shares held by SLPH because Jefferies & Company, Inc. and the three funds named in this note may be deemed to beneficially own such shares. After this offering and the Recapitalization, represents shares of common stock which includes shares of common stock held by Jefferies & Company, Inc.; shares of common stock held by Jefferies Partners Opportunity Fund, L.L.C.; shares of common stock held by Jefferies Partners Opportunity Fund II, L.L.C.; and shares of common stock held by Jefferies Partners Employees Opportunity Fund, L.L.C. Jefferies Partners Opportunity Fund, L.L.C., Jefferies Partners Opportunity Fund II, L.L.C. and Jefferies Partners Employees Opportunity Fund, L.L.C. may also be deemed to be the beneficial owner of the shares identified in this table as beneficially owned by Jefferies Capital Partners (see note 6) because of Mr. Friedman’s relationships with Jefferies Partners Opportunity Fund, L.L.C., Jefferies Partners Opportunity Fund II, L.L.C., Jefferies Partners Employees Opportunity Fund, L.L.C and Jefferies Capital Partners. Pursuant to Rule 13d-4 under the Exchange Act, Jefferies Partners Opportunity Fund, L.L.C., Jefferies Partners Opportunity Fund II, L.L.C. and Jefferies Partners Employees Opportunity Fund, L.L.C disclaim the beneficial ownership of the shares identified in this table as beneficially owned by Jefferies Capital Partners. The address for each of Jefferies Partners Opportunity Fund, L.L.C., Jefferies Partners Opportunity Fund II, L.L.C. and Jefferies Partners Employees Opportunity Fund, L.L.C is 520 Madison Avenue, New York, New York 10022. |
| (8) | ING Furman Selz Investors III, L.P., ING Barings U.S. Leveraged Equity Plan Ltd. and ING Baring Global Leveraged Equity Plan Ltd. have an agreement which requires them to act together regarding decisions pertaining to the dispositive or voting power of the shares identified in this table as beneficially owned by them. Prior to this offering and the Recapitalization, represents shares issuable upon exercise of immediately exercisable warrants which includes shares issuable upon exercise of warrants held by ING Furman Selz Investors III, L.P.; shares issuable upon exercise of warrants held by ING Barings U.S. Leveraged Equity Plan Ltd. and shares issuable upon exercise of warrants held by ING Baring Global Leveraged Equity Plan Ltd. After this offering and the Recapitalization, represents shares of common stock which includes shares of common stock held by ING Furman Selz Investors III, L.P.; shares of common stock held by ING Barings U.S. Leveraged Equity Plan Ltd.; shares of common stock held by ING Baring Global Leveraged Equity Plan Ltd. ING Furman Selz Investors III, L.P., ING Barings U.S. Leverage Equity Plan Ltd. and ING Baring Global Leveraged Equity Plan Ltd. may also be deemed to be the beneficial owner of the shares identified in this table as beneficially owned by Jefferies Group Inc. (see note 4) and the shares identified as beneficially owned by Jefferies & Company, Inc. (see note 5) because of Mr. Friedman’s relationships with ING Furman Selz Investors III, L.P., ING Barings U.S. Leverage Equity Plan Ltd., ING Baring Global Leveraged Equity Plan Ltd., Jefferies Group Inc. and Jefferies & Company, Inc. Pursuant to Rule 13d-4 under the Exchange Act, ING Furman Selz Investors III, L.P., ING Barings U.S. Leverage Equity Plan Ltd. and ING Baring Global Leveraged Equity Plan Ltd. disclaim the beneficial ownership of the shares identified in this table as beneficially owned by Jefferies Group Inc. and Jefferies & Company, Inc. The address for each of ING Furman Selz Investors III, L.P., ING Barings U.S. Leverage Equity Plan Ltd. and ING Baring Global Leveraged Equity Plan Ltd. is 520 Madison Avenue, New York, New York 10022. |
| (9) | Mr. Friedman is one of two managing members of Jefferies Capital Partners and shares voting power over the securities managed by Jefferies Capital Partners with Mr. Luikart. As a result of his relationship with Jefferies Capital Partners, the shares included for Mr. Friedman include the shares identified in this table as beneficially owned by Jefferies Capital Partners (see note 6). Mr. Friedman is also a director and executive officer of Jefferies Group, Inc. and the chairman of the executive committee of the broad of directors of Jefferies & Company, Inc. and therefore may be deemed to have beneficial ownership of the shares identified in this table as beneficially owned by Jefferies Group, Inc. and Jefferies & Company, Inc. (see notes 4 and 5). As a result of his relationships with Jefferies Group, Inc. and Jefferies & Company, Inc., the shares included in the table for Mr. Friedman include the shares identified in this table as beneficially owned |
111
| | by Jefferies Group, Inc. and Jefferies & Company, Inc. The address for Mr. Friedman is 520 Madison Avenue, New York, New York 10022. |
| (10) | Prior to this offering and the Recapitalization, represents shares issuable upon exercise of immediately exercisable warrants, which includes shares issuable upon exercise of warrants held by TCW Leveraged Income Trust, IV, L.P.; shares issuable upon exercise of warrants held by TCW Shared Opportunity Fund, III, L.P.; shares issuable upon exercise of warrants held by Shared Opportunity Fund, IIB, L.L.C.; shares issuable upon exercise of warrants held by TCW/Crescent Mezzanine Partners, L.P.; shares issuable upon exercise of warrants held by TCW/Crescent Mezzanine Trust; and shares issuable upon exercise of warrants held by TCW/Crescent Mezzanine Investment Partners, L.P. After this offering and the Recapitalization, represents shares of common stock, which includes shares of common stock held by TCW Leveraged Income Trust, IV, L.P.; shares of common stock held by TCW Shared Opportunity Fund, III, L.P.; shares of common stock held by Shared Opportunity Fund, IIB, L.L.C.; shares of common stock held by TCW/Crescent Mezzanine Partners, L.P.; shares of common stock held by TCW/Crescent Mezzanine Trust; and shares of common stock held by TCW/Crescent Mezzanine Investment Partners, L.P. The investment adviser to TCW/Crescent Mezzanine Partners, L.P., TCW/Crescent Mezzanine Trust and TCW/Crescent Mezzanine Investment Partners, L.P. is TCW/Crescent Mezzanine LLC, an SEC registered adviser. The investment adviser to TCW Leveraged Income Trust L.P., Shared Opportunity Fund IIB LLC and TCW Shared Opportunity Fund III, L.P. is TCW Asset Management Company, an SEC-registered investment adviser. As investment advisers to The TCW Funds, TCW/Crescent Mezzanine LLC and TCW Asset Management Company have dispositive and voting power with respect to the shares held by the funds they advise. The address of The TCW Funds is 11100 Santa Monica Blvd., Suite 2000, Los Angeles, California 90025. |
| (11) | Represents shares of restricted stock to be issued in connection with the Incentive Issuance pursuant to our 2006 Long-Term Incentive Plan. |
112
DESCRIPTION OF CAPITAL STOCK
The following summary of our capital stock, our amended and restated certificate of incorporation and our amended and restated bylaws is qualified in its entirety by reference to the provisions of the DGCL, and to the complete terms of our capital stock contained in the form of our amended and restated certificate of incorporation and the form of our amended and restated bylaws, both of which have been filed as exhibits to the registration statement of which this prospectus is a part.
Upon the completion of this offering and the Recapitalization, we will be authorized to issue shares of common stock, par value $0.001 per share, and shares of preferred stock, par value $0.001 per share, and we will have outstanding shares of common stock and no shares of preferred stock. In addition, our board of directors will have reserved shares of common stock for issuance under our 2006 Long-Term Incentive Plan, of which shares are subject to outstanding awards upon completion of this offering and the Recapitalization.
Common Stock
Subject to any special voting rights of any series of preferred stock that we may issue in the future, each share of common stock has one vote on all matters voted on by our stockholders, including the election of our directors. Because holders of common stock do not have cumulative voting rights, the holders of a majority of the shares of common stock can elect all of the members of the board of directors standing for election, subject to the rights, powers and preferences of any outstanding series of preferred stock.
No share of common stock affords any preemptive rights to acquire unissued shares of common stock or is convertible, redeemable, assessable or entitled to the benefits of any sinking or repurchase fund. Holders of common stock will be entitled to dividends in the amounts and at the times declared by our board of directors in its discretion out of funds legally available for the payment of dividends. See “Dividend Policy.”
Holders of common stock will share equally in our assets on liquidation after payment or provision for all liabilities and any preferential liquidation rights of any preferred stock then outstanding. All outstanding shares of common stock are fully paid and non-assessable.
Preferred Stock
At the direction of our board of directors, we may issue shares of preferred stock from time to time. Our board of directors may, without any action by holders of the common stock, adopt resolutions to issue preferred stock in one or more classes or series, fix or change the number of shares constituting any class or series of preferred stock and establish or change the rights of the holders of any class or series of preferred stock. The rights of any class or series of preferred stock may include, among others, general or special voting rights, preferential liquidation or preemptive rights, preferential cumulative or noncumulative dividend rights, redemption or put rights and conversion or exchange rights. We may issue shares of, or rights to purchase, preferred stock, the terms of which might adversely affect voting or other rights evidenced by, or amounts otherwise payable with respect to, the common stock, discourage an unsolicited proposal to acquire us or facilitate a particular business combination involving us. Any of these actions could discourage a transaction that some or a majority of our stockholders might believe to be in their best interests or in which our stockholders might receive a premium for their common stock over its then market price.
Anti-Takeover Provisions
General
Our amended and restated certificate of incorporation and amended and restated bylaws will contain the following additional provisions, some of which are intended to enhance the likelihood of continuity and stability
113
in the composition of our board of directors and in the policies formulated by our board of directors. In addition, some provisions of the DGCL, if applicable to us, may hinder or delay an attempted takeover without prior approval of our board of directors. Provisions of the DGCL and of our amended and restated certificate of incorporation and amended and restated bylaws could discourage attempts to acquire us or remove incumbent management even if some or a majority of our stockholders believe this action is in their best interest. These provisions could, therefore, prevent stockholders from receiving a premium over the market price for the shares of common stock they hold.
Classified Board
Our amended and restated certificate of incorporation will provide that our board of directors will be divided into three classes of directors, with the classes to be as nearly equal in number as possible. As a result, approximately one-third of our board of directors will be elected each year. The classification of directors will have the effect of making it more difficult for stockholders to change the composition of our board. Our amended and restated certificate of incorporation and amended and restated bylaws will provide that the number of directors will be fixed from time to time exclusively pursuant to a resolution adopted by the board; provided, however, that such number shall be not less than three and not greater than 15.
Filling Board of Directors Vacancies; Removal
Our amended and restated certificate of incorporation and bylaws will provide that only the board of directors may set the number of directors. We intend to elect to be subject to certain provisions of Delaware law which vest in the board of directors the exclusive right, by the affirmative vote of a majority of the remaining directors, to fill vacancies on the board even if the remaining directors do not constitute a quorum. When effective, these provisions of Delaware law, which are applicable even if other provisions of Delaware law or the charter or bylaws of a company provide to the contrary, also provide that any director elected to fill a vacancy shall hold office for the remainder of the full term of the class of directors in which the vacancy occurred, rather than the next annual meeting of stockholders as would otherwise be the case, and until his or her successor is elected and qualifies. Each director will hold office until his or her successor is elected and qualified, or until the director’s earlier death, resignation, retirement or removal from office. Any director may resign at any time upon written notice to us. Our amended and restated certificate of incorporation and amended and restated bylaws will provide, in accordance with the DGCL, that, subject to the rights, powers and preferences of any outstanding series of preferred stock, the stockholders may remove directors only at a stockholders’ meeting called for such purpose and only by a majority vote and for cause. We believe that the removal of directors by the stockholders only for cause, together with the classification of the board of directors, will promote continuity and stability in our management and policies and that this continuity and stability will facilitate long-range planning.
Call Of Special Meetings
Our amended and restated bylaws will provide that special meetings of our stockholders may be called at any time only by the board of directors acting pursuant to a resolution adopted by the board of directors or by the chairman of the board of directors, but not the stockholders.
Advanced Notice Requirements for Stockholder Proposals and Director Nominations
Our amended and restated bylaws will provide that stockholders seeking to bring business before or to nominate candidates for election as directors at an annual meeting of stockholders must provide timely notice of their proposal in writing to our corporate secretary. To be timely, a stockholder’s notice must be delivered to our corporate secretary at our principal executive offices no later than the 90th day or earlier than the 120th day before the first anniversary of the preceding year’s annual meeting. If, however, the date of the annual meeting is more than 30 days before or more than 70 days after such anniversary date, notice by the stockholder in order to be timely must be delivered to our corporate secretary no later than the 90th day before the annual meeting or the
114
tenth day following the day on which the date of the annual meeting is publicly announced, whichever is later, and no earlier than the 120th day prior to the annual meeting. The first anniversary of our first annual meeting of stockholders will be deemed to be , 2007 pursuant to our amended and restated bylaws. Our amended and restated bylaws will also specify requirements as to the form and content of a stockholder’s notice. Our amended and restated bylaws will also provide advance notice requirements for stockholders to bring business before, or nominate candidates for election as directors at, our annual meeting of stockholders. These provisions may preclude stockholders from bringing matters before an annual meeting of stockholders or from making nominations for directors at an annual meeting of stockholders or may discourage or defer a potential acquirer from conducting a solicitation of proxies to elect its own slate of directors or otherwise attempting to obtain control of us.
No Cumulative Voting
The DGCL provides that stockholders are not entitled to the right to cumulate votes in the election of directors unless amended and restated our certificate of incorporation provides otherwise. Our amended and restated certificate of incorporation will not provide for cumulative voting. Under cumulative voting, a majority stockholder holding a sufficient percentage of a class of shares may be able to ensure the election of one or more directors.
Authorized but Unissued Shares
The authorized but unissued shares of common stock and preferred stock are available for future issuance without stockholder approval, subject to various limitations imposed by The Nasdaq Global Market. These additional shares may be used for a variety of corporate purposes, including future private or public offerings to raise additional capital, corporate acquisitions and employee benefit plans. The existence of authorized but unissued shares of common stock and preferred stock could make it more difficult or discourage an attempt to obtain control of us by means of a proxy contest, tender offer, merger or otherwise.
Amendments to our Certificate of Incorporation and Bylaws
Our amended and restated certificate of incorporation will provide that it can be amended in accordance with the DGCL. Our amended and restated certificate of incorporation will permit our board of directors to adopt, amend and repeal our amended and restated bylaws. Our amended and restated bylaws will provide that our amended and restated bylaws can be amended by either our board of directors or the affirmative vote of the holders of at least a majority of the voting power of the outstanding shares of our capital stock.
Action by Written Consent of Stockholders
Our amended and restated bylaws will allow any action required or permitted to be taken at any annual or special meeting of stockholders, including the election of directors, to be taken without a meeting, prior notice or a vote, if a written consent setting forth the action to be taken is signed by holders of not less than the minimum number of votes that would be necessary to authorize such action at a meeting at which all shares entitled to vote thereon were present and voted.
Delaware Anti-Takeover Statute
Upon the completion of this offering, we will be subject to Section 203 of the DGCL, which is an anti-takeover law. In general, this section prevents us, under certain circumstances, from engaging in a “business combination” with (1) a stockholder who owns 15% or more of our outstanding voting stock, otherwise known as an “interested stockholder;” (2) an affiliate of an interested stockholder; or (3) an associate of an interested stockholder, for three years following the date that the stockholder became an interested stockholder. A “business combination” includes a merger or sale of 10% or more of our assets. However, the above provisions of
115
Section 203 do not apply if (1) prior to the time the stockholder became an interested stockholder, our board of directors approves the business combination or the transaction that resulted in the stockholder becoming an interested stockholder; (2) upon completion of the transaction that resulted in the stockholder becoming an interested stockholder, that stockholder owned at least 85% of our voting stock outstanding at the time the transaction commenced, excluding shares owned by our officers and directors and certain employee benefit plans; or (3) at or prior to the time the stockholder became an interested stockholder, the business combination is approved by our board of directors and authorized at a meeting of our stockholders (and not by written consent) by the affirmative vote of at least two-thirds of the outstanding voting stock not owned by the interested stockholder. This statute could prohibit or delay mergers or other change in control attempts, and thus may discourage attempts to acquire us.
Delaware Business Opportunity Statute
As permitted by Section 122(17) of the DGCL, our amended and restated certificate of incorporation will provide that we can renounce any interest or expectancy in any business opportunity or transaction involving the natural gas or oil business in which any of our non-employee directors and their respective affiliates participate, or seek to participate, subject to certain exceptions. Certain of our institutional investors required this provision because they have or may have other investments in entities that conduct operations in the natural gas and oil industry.
Limitation of Liability of Officers and Directors
Our amended and restated certificate of incorporation will provide that no director shall be personally liable to us or our stockholders for monetary damages for breach of fiduciary duty as a director, except for liability for:
| | • | | any breach of the director’s duty of loyalty to us or our stockholders; |
| | • | | acts or omissions not in good faith or which involve intentional misconduct or a knowing violation of law; |
| | • | | payment of unlawful dividends and certain other actions prohibited by the DGCL; and |
| | • | | any transaction from which the director derived an improper personal benefit. |
The effect of these provisions is to eliminate our rights and the rights of our stockholders to recover monetary damages against a director for a breach of the fiduciary duty of care, including breaches resulting from negligent or grossly negligent behavior, except in the situations described above. This provision will not limit or eliminate our rights or the rights of any stockholder to seek non-monetary relief, such as an injunction or rescission in the event of a breach of a director’s duty of care.
Our amended and restated bylaws will also provide that we will indemnify officers and directors against losses that they may incur in investigations and legal proceedings resulting from their services to us.
Our amended and restated bylaws will further provide that:
| | • | | we are required to indemnify our directors and officers to the fullest extent permitted by Delaware law, subject to limited exceptions; |
| | • | | we may indemnify our other employees and agents to the extent that we indemnify our officers and directors, unless otherwise required by law, our amended and restated certificate of incorporation, our amended and restated bylaws or agreements to which we are a party; |
| | • | | we are required to advance expenses, as incurred, to our directors and officers in connection with a legal proceeding to the fullest extent permitted by Delaware law, subject to limited exceptions; and |
| | • | | we are required to pay within 60 days reasonable amounts related to a settlement or judgment, subject to limited exceptions. |
116
Transfer Agent and Registrar
The transfer agent and registrar of our common stock is .
Record Ownership
As of September 15, 2006, we had approximately 61 holders of record of our common stock.
117
U.S. FEDERAL TAX CONSIDERATIONS FOR NON-U.S. HOLDERS
The following is a summary of certain U.S. federal income and estate tax consequences of the ownership and disposition of our common stock by a non-U.S. holder (as defined below) as of the date hereof. Except where noted, this summary deals only with a non-U.S. holder that holds our common stock as a capital asset (generally, as an investment).
For purposes of this summary, a “non-U.S. holder” means a beneficial owner of our common stock that is not any of the following for U.S. federal income tax purposes:
| | • | | an individual who is a citizen or resident of the United States; |
| | • | | a corporation (or any other entity treated as a corporation for U.S. federal income tax purposes) created or organized in or under the laws of the United States, any state thereof, or the District of Columbia; |
| | • | | an estate, the income of which is subject to U.S. federal income taxation regardless of its source; or |
| | • | | a trust, if its administration is subject to the primary supervision of a court within the United States and one or more United States persons have the authority to control all of its substantial decisions, or it has a valid election in effect under applicable U.S. Treasury regulations to be treated as a United States person. |
An individual may be treated as a resident of the United States in any calendar year for U.S. federal income tax purposes, instead of a nonresident, by, among other ways, being present in the United States for at least 31 days in that calendar year and for an aggregate of at least 183 days during a three-year period ending in the current calendar year. For purposes of the 183-day calculation, all of the days present in the current year, one-third of the days present in the immediately preceding year and one-sixth of the days present in the second preceding year are counted. Residents are taxed for U.S. federal income tax purposes as if they were U.S. citizens.
This summary is based upon provisions of the Code and regulations, rulings and judicial decisions as of the date hereof. Those authorities may be changed, perhaps retroactively, so as to result in U.S. federal income or estate tax consequences different from those summarized below. This summary does not represent a detailed description of the U.S. federal income or estate tax consequences to you in light of your particular circumstances. In addition, this discussion does not consider:
| | • | | U.S. state or local or non-U.S. tax consequences; |
| | • | | all aspects of U.S. federal income and estate taxes or specific facts and circumstances that may be relevant to a particular non-U.S. holder’s tax position, including the fact that in the case of a non-U.S. holder that is an entity treated as a partnership for U.S. federal income tax purposes, the U.S. tax consequences of holding and disposing of our common stock may be affected by certain determinations made at the partner level; |
| | • | | the tax consequences for the stockholders, partners or beneficiaries of a non-U.S. holder; |
| | • | | special tax rules that may apply to particular non-U.S. holders, such as financial institutions, insurance companies, tax-exempt organizations, U.S. expatriates, broker-dealers, and traders in securities; or |
| | • | | special tax rules that may apply to a non-U.S. holder that holds our common stock as part of a “straddle,” “hedge,” “conversion transaction,” “synthetic security” or other integrated investment. |
If you are considering the purchase of our common stock, you are urged to consult your own tax adviser concerning the particular U.S. federal tax consequences to you of the ownership and disposition of the common stock, as well as the consequences to you arising under the laws of any other taxing jurisdiction, including any state, local or foreign income tax consequences.
118
Dividends
We do not anticipate paying cash dividends on our common stock in the foreseeable future. See “Dividend Policy.” If dividends are paid on shares of our common stock, however, such dividends paid to a non-U.S. holder of our common stock generally will be subject to withholding of U.S. federal income tax at a 30% rate or such lower rate as may be specified by an applicable income tax treaty. However, dividends that are effectively connected with the conduct of a trade or business by a non-U.S. holder within the United States and, where an income tax treaty applies, are attributable to a U.S. permanent establishment of the non-U.S. holder, are not subject to this withholding tax, but instead are subject to U.S. federal income tax on a net income basis at applicable individual or corporate rates. Certain certification and disclosure requirements must be complied with in order for effectively connected income to be exempt from this withholding tax. Any such effectively connected dividends received by a foreign corporation may, under certain circumstances, be subject to an additional “branch profits tax” at a 30% rate or such lower rate as may be specified by an applicable income tax treaty.
A non-U.S. holder of our common stock who wishes to claim the benefit of an applicable treaty rate (and avoid backup withholding as discussed below) for dividends, will be required to satisfy the relevant certification requirements. Special certification and other requirements apply to certain non-U.S. holders that are entities rather than individuals.
A non-U.S. holder of our common stock eligible for a reduced rate of U.S. federal withholding tax pursuant to an income tax treaty may obtain a refund of any excess amounts withheld by filing an appropriate claim for refund with the IRS.
Gain on Disposition of Common Stock
A non-U.S. holder generally will not be subject to U.S. federal income tax with respect to gain recognized on a sale or other disposition of our common stock unless:
| | • | | the gain is effectively connected with a trade or business of the non-U.S. holder in the United States (in which case, for a non-U.S. holder that is a foreign corporation, the branch profits tax described above may also apply), and, where a tax treaty applies, is attributable to a U.S. permanent establishment of the non-U.S. holder; in these cases, the gain will be taxed on a net income basis at the rates and in the manner applicable to United States persons, and if the non-U.S. holder is a foreign corporation, the branch profits tax described above may also apply; |
| | • | | in the case of a non-U.S. holder who is an individual and holds the common stock as a capital asset, such holder is present in the United States for 183 or more days in the taxable year of the sale or other disposition and certain other conditions are met; or |
| | • | | we are or have been a “United States real property holding corporation” for U.S. federal income tax purposes. |
We believe that we are a United States real property holding corporation for U.S. federal income tax purposes. Generally, a corporation is a United States real property holding corporation if the fair market value of its United States real property interests equals or exceeds 50% of the sum of the fair market value of its worldwide real property interests and its other assets used or held for use in a trade or business. However, the tax relating to stock in a United States real property holding corporation generally will not apply to a non-U.S. holder whose holdings, direct and indirect, at all times during the applicable period, constituted 5% or less of our common stock, provided that our common stock was regularly traded on an established securities market. Non-U.S. holders that may be treated as beneficially owning more than 5% of our common stock should consult their tax advisers with respect to the U.S. federal income tax consequences of the ownership and disposition of our common stock.
119
Federal Estate Tax
Common stock held by an individual non-U.S. holder at the time of death will be included in such holder’s gross estate for U.S. federal estate tax purposes, unless an applicable estate tax treaty provides otherwise, and therefore may be subject to U.S. estate tax.
Information Reporting and Backup Withholding
We must report annually to the IRS and to each non-U.S. holder the amount of dividends paid to such holder and the tax withheld (if any) with respect to such dividends, regardless of whether withholding was required. Copies of the information returns reporting such dividends and any withholding may also be made available to the tax authorities in the country in which the non-U.S. holder resides under the provisions of an applicable income tax treaty. In addition, dividends paid to a non-U.S. holder generally will be subject to backup withholding unless applicable certification requirements are met and the payor does not have actual knowledge or reason to know that such holder is a United States person as defined under the Code, or such holder otherwise establishes an exemption.
Payment of the proceeds of a sale of our common stock effected by or through a U.S. office of a broker is subject to both backup withholding and information reporting unless the beneficial owner certifies under penalties of perjury that it is not a United States person (and the payor does not have actual knowledge or reason to know that the beneficial owner is a United States person) or the holder otherwise establishes an exemption. Generally, U.S. information reporting and backup withholding will not apply to a payment of the proceeds of a sale of our common stock if the transaction is effected outside the United States by or through a non-U.S. office of a broker. However, if the broker is, for U.S. federal income tax purposes, a United States person, a “controlled foreign corporation,” a foreign person 50% or more of whose gross income from a specified period is effectively connected with the conduct of a trade or business in the United States, or a foreign partnership with various connections with the United States, information reporting, but not backup withholding, will apply unless the broker has documentary evidence in its records that you are a non- U.S. holder and certain other conditions are met, or you otherwise establish an exemption.
Any amounts withheld under the backup withholding rules may be allowed as a refund or a credit against such holder’s U.S. federal income tax liability provided the required information is furnished to the IRS.
120
SHARES ELIGIBLE FOR FUTURE SALE
Prior to this offering, there has been no public market for our common stock. Sales of substantial amounts of our common stock in the public market, or the perception that such sales may occur, could cause the market price of our common stock to fall and could affect our ability to raise capital on terms favorable to us in the future.
After this offering and the consummation of the Recapitalization, we will have outstanding shares of common stock. Of these shares, the shares that we are selling in this offering, or shares if the underwriters exercise in full their option to purchase additional shares of our common stock, and the shares held by the stockholders of Ascent (other than our Parent) prior to this offering, will be freely tradable without restriction under the Securities Act except for any shares purchased, acquired or held by our “affiliates” as defined in Rule 144 under the Securities Act. All of the other shares outstanding (a total of shares) will be “restricted securities” within the meaning of Rule 144 under the Securities Act because they will be issued in the Recapitalization. Restricted securities may be sold in the public market only if the sale is registered under the Securities Act or if it qualifies for an exemption from registration, such as under Rule 144 under the Securities Act, which is summarized below.
All of our directors and executive officers and certain of our stockholders have agreed that they will not, without the prior written consent of the representatives of the underwriters, sell or otherwise dispose of any shares of common stock or options to acquire shares of common stock during the 180-day period following the closing of this offering. See “Underwriting.”
Rule 144
In general, under Rule 144 as currently in effect, beginning 90 days after the date of this prospectus, a person who has beneficially owned shares that are restricted securities for at least one year, including the holding period of any prior owner except an affiliate, would be entitled to sell within any three-month period a number of shares that does not exceed the greater of:
| | • | | one percent of the number of shares of our common stock then outstanding, which will equal approximately shares immediately after this offering and the Recapitalization; or |
| | • | | the average weekly trading volume of the common stock on The Nasdaq Global Market during the four calendar weeks preceding the filing with the SEC of a notice on Form 144 with respect to the sale. |
Sales under Rule 144 also are subject to manner-of-sale provisions and notice requirements and to the availability of current public information about us.
Under Rule 144(k), a person who is not deemed to have been one of our affiliates at any time during the 90 days preceding a sale and who has beneficially owned the shares proposed to be sold for at least two years, including the holding period of any prior owner except an affiliate, is entitled to sell those shares without complying with the manner of sale, public information, volume limitation or notice provisions of Rule 144.
Rule 701
Rule 701 permits resales of shares in reliance on Rule 144 but without compliance with specified restrictions of Rule 144. Any of our employees, officers, directors, consultants or advisors who receives shares upon exercise of options granted prior to the offering may be entitled to rely on the resale provisions of Rule 701. Rule 701 permits our affiliates to sell their Rule 701 shares under Rule 144 without complying with the holding period requirements of Rule 144. Rule 701 further provides that non-affiliates may sell those shares in reliance on Rule 144 without having to comply with the holding period, public information, volume limitation or notice provisions of Rule 144. All holders of Rule 701 shares are required to wait until 90 days after the date of this
121
prospectus before selling those shares. After the expiration of that 90-day period, shares subject to outstanding options could be sold under Rule 701.
Registration Rights
Certain holders of our shares will also have demand registration rights for four separate registrations beginning 185 days after the registration of our common stock under the Exchange Act and specified piggyback registration rights, in each case in accordance with a registration rights agreement that we have entered into with these holders. See “Related Party Transactions—Registration Rights.”
Stock Options
Following the consummation of this offering, we intend to file a registration statement on Form S-8 under the Securities Act covering shares of common stock to be reserved for issuance under our 2006 Long-Term Incentive Plan. Based on the number of shares to be reserved for issuance under our 2006 Long-Term Incentive Plan, that registration statement would cover up to shares issuable on exercise of options. No options have been granted as of the date of this prospectus. The registration statement on Form S-8 will automatically become effective upon filing and will permit the resale of these shares by nonaffiliates in the public market without restriction under the Securities Act, upon expiration of the lock-up period described above. Shares registered under the Form S-8 registration statement held by affiliates will be subject to the Rule 144 volume limitations.
122
UNDERWRITING
Lehman Brothers Inc. and Jefferies & Company, Inc. are acting as joint book-running managers and as representatives of the underwriters of this offering. Under the terms of an underwriting agreement, which will be filed as an exhibit to the registration statement of which this prospectus forms a part, each of the underwriters named below has severally agreed to purchase from us the number of shares of common stock shown opposite its name below:
| | |
Underwriters | | Number of
Shares |
Lehman Brothers Inc. | | |
Jefferies & Company, Inc. | | |
Morgan Keegan & Company, Inc. | | |
Petrie Parkman & Co., Inc. | | |
Capital One Southcoast, Inc. | | |
Fortis Securities LLC | | |
KeyBanc Capital Markets, A Division of McDonald Investments Inc. | | |
| | |
Total | | |
| | |
The underwriting agreement provides that the underwriters’ obligation to purchase shares of our common stock depends on the satisfaction of the conditions contained in the underwriting agreement, including:
| | • | | the obligation to purchase all of the shares of common stock offered hereby (other than those shares of common stock covered by their option to purchase additional shares as described below); |
| | • | | the accuracy of the representations and warranties made by us to the underwriters; |
| | • | | the absence of a material change in the financial markets, such as, for example, the suspension of trading in securities on The Nasdaq Global Market or in the over-the-counter market, the declaration of a banking moratorium or the occurrence of such a material adverse change in general economic, political or financial conditions as to make it impracticable or inadvisable to proceed with the offering; and |
| | • | | our delivery of customary closing documents to the underwriters. |
Discounts and Expenses
The following table summarizes the underwriting discounts to which the underwriters will be entitled. These amounts are shown assuming both no exercise and full exercise of the underwriters’ option to purchase additional shares. The underwriting discount is the difference between the initial public offering price and the amount the underwriters pay to us for the shares.
| | | | |
| | | No Exercise | | Full Exercise |
Per share | | | | |
Total | | | | |
The representatives of the underwriters have advised us that the underwriters propose to offer the shares of common stock directly to the public at the public offering price on the front cover of this prospectus and to selected dealers, which may include the underwriters, at such offering price less a selling concession not in excess of $ per share. After the offering, the representatives may change the offering price and other selling terms.
The expenses of the offering that are payable by us are estimated to be $ (excluding underwriting discounts).
123
Option to Purchase Additional Shares
We have granted the underwriters an option, exercisable for 30 days after the date of this prospectus, to purchase, from time to time, in whole or in part, up to an aggregate of additional shares of our common stock at the public offering price less the underwriting discounts. This option may be exercised if the underwriters sell more than shares of our common stock in connection with this offering. To the extent that this option is exercised, each underwriter will be obligated, subject to certain conditions, to purchase its pro rata portion of these additional shares based on the underwriter’s percentage underwriting commitment in the offering as indicated in the table at the beginning of this “Underwriting” section.
Lock-Up Agreements
We, all of our directors and executive offers and certain of our stockholders have agreed that, without the prior written consent of Lehman Brothers Inc. and Jefferies & Company, Inc., we will not directly or indirectly (1) offer for sale, pledge, or otherwise dispose of (or enter into any transaction or device that is designed to, or could be expected to, result in the disposition by any person at any time in the future of) any shares of our common stock (including, without limitation, shares of our common stock that may be deemed to be beneficially owned in accordance with the rules and regulations of the SEC and shares of our common stock that may be issued upon exercise of any options or warrants) or securities convertible into or exercisable or exchangeable for common stock, (2) enter into any swap or other derivatives transaction that transfers to another, in whole or in part, any of the economic consequences of ownership of our common stock, (3) make any demand for the filing of, exercise any right to have filed or file or cause to be filed a registration statement, including any amendments thereto, with respect to the registration of any shares of our common stock or securities convertible, exercisable into our common stock or any of our other securities, or (4) publicly disclose the intention to do any of the foregoing for a period of 180 days after the date of this prospectus.
The 180-day restricted period described in the preceding paragraph will be extended if:
| | • | | during the last 17 days of the 180-day restricted period we issue an earnings release or announce material news or a material event relating to us; or |
| | • | | prior to the expiration of the 180-day restricted period, we announce that we will release earnings results during the 16-day period beginning on the last day of the 180-day period, |
in which case the restrictions described in the preceding paragraph will continue to apply until the expiration of the 18-day period beginning on the issuance of the earnings release or the announcement of the material news or material event.
Lehman Brothers Inc. and Jefferies & Company, Inc., in their sole discretion, may release the common stock and other securities subject to the lock-up agreements described above in whole or in part at any time with or without notice. When determining whether or not to release the common stock and other securities from lock-up agreements, Lehman Brothers Inc. and Jefferies & Company, Inc. will consider, among other factors, the holder’s reasons for requesting the release, the number of shares of common stock and other securities for which the release is being requested and market conditions at the time. Currently, there are no agreements or understandings relating to the granting of a release to any person subject to a lock-up agreement.
Offering Price Determination
Prior to this offering, there has been no public market for our common stock. The initial public offering price will be negotiated among the qualified independent underwriter (as further described below), the representatives and us. In determining the initial public offering price of our common stock, the qualified independent underwriter and the representatives will consider:
| | • | | the history and prospects for the industry in which we compete; |
| | • | | our financial information; |
124
| | • | | the ability of our management and our business potential and earning prospects; |
| | • | | the prevailing securities markets at the time of this offering; and |
| | • | | the recent market prices of, and the demand for, publicly traded shares of generally comparable companies. |
Indemnification
We have agreed to indemnify the underwriters against certain liabilities, including liabilities under the Securities Act and to contribute to payments that the underwriters may be required to make for these liabilities.
Stabilization, Short Positions and Penalty Bids
The representatives may engage in stabilizing transactions, short sales and purchases to cover positions created by short sales, and penalty bids or purchases for the purpose of pegging, fixing or maintaining the price of the common stock, in accordance with Regulation M under the Exchange Act as follows:
| | • | | Stabilizing transactions permit bids to purchase the underlying security so long as the stabilizing bids do not exceed a specified maximum. |
| | • | | A short position involves a sale by the underwriters of shares in excess of the number of shares the underwriters are obligated to purchase in the offering, which creates the syndicate short position. This short position may be either a covered short position or a naked short position. In a covered short position, the number of shares involved in the sales made by the underwriters in excess of the number of shares they are obligated to purchase is not greater than the number of shares that they may purchase by exercising their option to purchase additional shares. In a naked short position, the number of shares involved is greater than the number of shares in their option to purchase additional shares. The underwriters may close out any short position by either exercising their option to purchase additional shares and/or purchasing shares in the open market. In determining the source of shares to close out the short position, the underwriters will consider, among other things, the price of shares available for purchase in the open market as compared to the price at which they may purchase shares through their option to purchase additional shares. A naked short position is more likely to be created if the underwriters are concerned that there could be downward pressure on the price of the shares in the open market after pricing that could adversely affect investors who purchase in the offering. |
| | • | | Syndicate covering transactions involve purchases of the common stock in the open market after the distribution has been completed in order to cover syndicate short positions. |
| | • | | Penalty bids permit the representatives to reclaim a selling concession from a syndicate member when the common stock originally sold by the syndicate member is purchased in a stabilizing or syndicate covering transaction to cover syndicate short positions. |
These stabilizing transactions, syndicate covering transactions and penalty bids may have the effect of raising or maintaining the market price of our common stock or preventing or retarding a decline in the market price of the common stock. As a result, the price of the common stock may be higher than the price that might otherwise exist in the open market. These transactions may be effected on The Nasdaq Global Market or otherwise and, if commenced, may be discontinued at any time.
Neither we nor any of the underwriters makes any representation or prediction as to the direction or magnitude of any effect that the transactions described above may have on the price of the common stock. In addition, neither we nor any of the underwriters makes representation that the representatives will engage in these stabilizing transactions or that any transaction, once commenced, will not be discontinued without notice.
125
Electronic Distribution
A prospectus in electronic format may be made available on the Internet or through other online services maintained by one or more of the underwriters and/or selling group members participating in this offering, or by their affiliates. In those cases, prospective investors may view offering terms online and, depending upon the particular underwriter or selling group member, prospective investors may be allowed to place orders online. The underwriters may agree with us to allocate a specific number of shares for sale to online brokerage account holders. Any such allocation for online distributions will be made by the representatives on the same basis as other allocations.
Other than this prospectus in electronic format, the information on any underwriter’s or selling group member’s website and any information contained in any other web site maintained by an underwriter or selling group member is not part of, and will not be deemed incorporated by reference into, this prospectus or the registration statement of which this prospectus forms a part, has not been approved and/or endorsed by us or any underwriter or selling group member in its capacity as underwriter or selling group member and should not be relied upon by investors.
The Nasdaq Global Market
We have applied to list our shares of common stock for quotation on The Nasdaq Global Market under the symbol “ASNT.”
Discretionary Sales
The underwriters have informed us that they do not intend to confirm sales to discretionary accounts without the prior written approval of the customer.
Stamp Taxes
If you purchase shares of common stock offered in this prospectus, you may be required to pay stamp taxes and other charges under the laws and practices of the country of purchase, in addition to the offering price listed on the front cover of this prospectus.
Relationships
Jefferies Group, Inc., which is the parent company of Jefferies & Company, Inc., one of the underwriters in this offering, is an investor in certain funds managed by certain of The Jefferies Investors. Further, the chairman of the executive committee of the board of directors of Jefferies & Company, Inc., is also a director of Jefferies Group, Inc. and a managing member of certain of The Jefferies Investors. The Jefferies Investors, including Jefferies & Company, Inc., are also beneficial owners of certain of the indebtedness to be repaid with a portion of the net proceeds of this offering and of certain other securities expected to be exchanged for our common stock in the Recapitalization. In addition, an affiliate of Fortis Securities LLC is serving as an agent, and affiliates of each of Fortis Securities LLC and Capital One Southcoast Inc. are lenders, under our credit facility for which they have received customary compensation in such capacities. Pursuant to the terms of our credit facility, we have also agreed to indemnify such persons against a variety of liabilities and to reimburse certain expenses. Moreover, an affiliate of Fortis Securities LLC is the counterparty to a majority of our natural gas and oil derivate instruments.
As a result of these and other relationships, the National Association of Securities Dealers, Inc., or NASD, may view this offering as a participation by Jefferies & Company, Inc., Fortis Securities LLC and/or Capital One Southcoast Inc. in the distribution in a public offering of securities issued by a company with which such underwriters have a conflict of interest. When a member of the NASD with a conflict of interest participates as an underwriter in a public offering, Rule 2720 of the Conduct Rules of the NASD requires that the initial public
126
offering price be no higher than that recommended by a “qualified independent underwriter,” as defined by the NASD. In accordance with this rule, Lehman Brothers Inc. is acting as a qualified independent underwriter in the offering, and the initial public offering price of the shares will not be higher than the price recommended by Lehman Brothers Inc.
Jefferies & Company, Inc. has in the past performed investment banking and advisory services for us and has received customary fees and expenses for such services. The underwriters may perform investment banking and advisory services for us from time to time for which they may in the future receive customary fees and expenses. In addition, the underwriters may, from time to time, engage in transactions with or perform services for us in the ordinary course of their business.
Foreign Selling Restrictions
United Kingdom. Each of the underwriters has represented and agreed that:
| | (a) | it has not made or will not make an offer of shares to the public in the United Kingdom within the meaning of section 102B of the Financial Services and Markets Act 2000, as amended, or FSMA, except to legal entities which are authorized or regulated to operate in the financial markets or, if not so authorized or regulated, whose corporate purpose is solely to invest in securities or otherwise in circumstances which do not require the publication by the company of a prospectus pursuant to the Prospectus Rules of the Financial Services Authority; |
| | (b) | it has only communicated or caused to be communicated, and will only communicate or cause to be communicated, an invitation or inducement to engage in investment activity (within the meaning of Section 21 of the FSMA) received by it in connection with the issue or sale of the shares in circumstances in which Section 21(1) of the FSMA does not apply to us, and |
| | (c) | it has complied with, and will comply with, all applicable provisions of the FSMA with respect to anything done by it in relation to the shares in, from or otherwise involving the United Kingdom. |
European Economic Area. In relation to each Member State of the European Economic Area which has implemented the Prospectus Directive (each, a “Relevant Member State”), each underwriter has represented and agreed that with effect from and including the date on which the Prospectus Directive is implemented in that Relevant Member State (the “Relevant Implementation Date”) it has not made and will not make an offer of shares to the public in that Relevant Member State prior to the publication of a prospectus in relation to the shares which has been approved by the competent authority in that Relevant Member State or, where appropriate, approved in another Relevant Member State and notified to the competent authority in that Relevant Member State, all in accordance with the Prospectus Directive, except that it may, with effect from and including the Relevant Implementation Date, make an offer of shares to the public in that Relevant Member State at any time:
| | • | | to legal entities which are authorized or regulated to operate in the financial markets or, if not so authorized or regulated, whose corporate purpose is solely to invest in securities; |
| | • | | to any legal entity which has two or more of (1) an average of at least 250 employees during the last financial year; (2) a total balance sheet of more than €43,000,000 and (3) an annual net turnover of more than €50,000,000, as shown in its last annual or consolidated accounts; or |
| | • | | in any other circumstances which do not require the publication by Ascent of a prospectus pursuant to Article 3 of the Prospectus Directive. |
For the purposes of this provision, the expression an “offer of shares to the public” in relation to any shares in any Relevant Member State means the communication in any form and by any means of sufficient information on the terms of the offer and the shares to be offered so as to enable an investor to decide to purchase or subscribe for the shares, as the same may be varied in that Member State by any measure implementing the Prospectus Directive in that Member State, and the expression “Prospectus Directive” means Directive 2003/71/EC and includes any relevant implementing measure in each Relevant Member State.
127
LEGAL MATTERS
The validity of the issuance of the shares of common stock offered by this prospectus will be passed on for us by Vinson & Elkins L.L.P., Houston, Texas. Certain legal matters relating to the common stock offered by this prospectus will be passed on by Akin Gump Strauss Hauer & Feld LLP, Houston, Texas, as counsel for the underwriters.
EXPERTS
The consolidated financial statements of Ascent Energy Inc. at December 31, 2004 and 2005, and for each of the three years in the period ended December 31, 2005, appearing in this prospectus and registration statement have been audited by Ernst & Young LLP, independent registered public accounting firm, as set forth in their report thereon appearing elsewhere herein, and are included in reliance upon such report given on the authority of such firm as experts in accounting and auditing.
In May 2006, Ernst & Young LLP informed us that the India member firm of E&Y Global, or Ernst & Young India, had a business arrangement with an affiliate of Jefferies Group, Inc. in the United Kingdom that was not in accordance with the SEC’s auditor independence rules regarding Ernst & Young’s independence in its performance of audit services for us because another affiliate of Jefferies Group, Inc. is a substantial shareholder of us. Commencing in 2005 and continuing through June 2006, Ernst & Young India had a business arrangement with Jefferies International Limited, or JIL, pursuant to which Ernst & Young India introduced JIL to third parties desiring to undertake capital raising transactions and also provided advisory services, along with JIL, to these third parties in connection with capital raising transactions. Three such transactions were successfully completed pursuant to this business arrangement, and Ernst & Young India received payments from JIL for certain transactions pursuant to this arrangement. We have been advised by Ernst & Young and Jefferies Group, Inc., which is the parent company of JIL, that the business arrangement between Ernst & Young India and JIL was terminated in June 2006.
Our board of directors and Ernst & Young have separately considered the impact that this business relationship may have had on Ernst & Young’s independence with respect to us. Ernst & Young has concluded that there has been no impairment of Ernst & Young’s independence with respect to us. Our board of directors has concluded that Ernst & Young has been capable of exercising objective and impartial judgment in connection with its audits of us and therefore is of the opinion that Ernst & Young was independent with respect to us. In making this determination, both our board of directors and Ernst & Young considered, among other things, the following:
| | • | | All services provided to us by Ernst & Young were permissible under the SEC’s auditor independence rules. |
| | • | | None of The Jefferies Investors nor JIL is involved in our day-to-day management or operations. |
| | • | | Our management, and not The Jefferies Investors or JIL, pre-approves the selection of our auditors and our non-audit service providers. |
| | • | | The business arrangement was not entered into by Jefferies Group, Inc. or The Jefferies Investors, but by Ernst & Young India and JIL, none of which had involvement with us or our Ernst & Young audit engagement team. |
| | • | | JIL is not a shareholder of Ascent and its relationship with us is solely as an affiliate of Jefferies Group, Inc., which through another of its affiliates is a substantial shareholder of Ascent. |
| | • | | Our Ernst & Young audit engagement team had no knowledge of the business arrangement between JIL and Ernst & Young India until performing Ernst & Young’s independence procedures relating to this offering. By that time, the audit of our financial statements was substantially complete. |
128
| | • | | We have no operations in India, and no personnel from Ernst & Young India were involved in the audits of us. |
| | • | | Ernst & Young and Jefferies Group, Inc. took prompt corrective action upon learning of the possible impact these matters in India could have had on the independence of Ernst & Young as our auditors. |
In making its determination, our board of directors also relied as to factual matters on representations made to it by Jefferies Group, Inc. and Ernst & Young.
The information included in this prospectus regarding estimated quantities of proved reserves, the future net revenues from those reserves and their present value is based, in part, on estimates of the proved reserves and present values of proved reserves as of December 31, 2003, 2004 and 2005 and June 30, 2006, in each case prepared or derived from estimates prepared by Netherland, Sewell & Associates, Inc., independent reserve engineering firm. The summary pages of their reports as of December 31, 2005 and June 30, 2006 are included in this prospectus as Appendix B and Appendix D, respectively. These estimates are included in this prospectus in reliance upon the authority of the firm as experts in these matters.
The information included in this prospectus regarding estimated quantities of proved reserves, the future net revenues from those reserves and their present value is based, in part, on estimates of the proved reserves and present values of proved reserves as of December 31, 2004 and 2005 and June 30, 2006, in each case prepared or derived from estimates prepared by LaRoche Petroleum Consultants, Ltd., independent reserve engineering firm. The summary pages of their reports as of December 31, 2005 and June 30, 2006 are included in this prospectus as Appendix C and Appendix E, respectively. These estimates are included in this prospectus in reliance upon the authority of the firm as experts in these matters.
WHERE YOU CAN FIND MORE INFORMATION
We have filed a registration statement on Form S-1 with the SEC for the common stock we are offering by this prospectus. This prospectus does not include all of the information contained in the registration statement. You should refer to the registration statement and its exhibits for additional information. Whenever we make reference in this prospectus to any of our contracts, agreements or other documents, the references are not necessarily complete and you should refer to the exhibits attached to the registration statement for copies of the actual contract, agreement or other document. When we complete this offering, we will be required to file annual, quarterly and special reports, proxy statements and other information with the SEC.
You can read our SEC filings, including the registration statement, over the Internet at the SEC’s web site atwww.sec.gov. You may also read and copy any document we file with the SEC at its public reference facilities at 100 F. Street, N.E., Washington, D.C. 20549. You may also obtain copies of these documents at prescribed rates by calling the Public Reference Room of the SEC at 1-800-SEC-0330.
Our website on the Internet is located atwww.ascentenergy.info, and we expect to make our periodic reports and other information filed with or furnished to the SEC available, free of charge, through our web site, as soon as reasonably practicable after those reports and other information are electronically filed with or furnished to the SEC. Information on our web site or any other web site is not incorporated into this prospectus and does not constitute a part of this prospectus. You may also request a copy of these filings at no cost, by writing or telephoning us at the following address: Ascent Energy Inc., Attention: Chief Financial Officer, 4965 Preston Park Blvd., Suite 800, Plano, Texas 75093, (972) 543-3900.
129
INDEXTO CONSOLIDATED FINANCIAL STATEMENTS
| | |
Report of Independent Registered Public Accounting Firm | | F-2 |
Consolidated Balance Sheets as of December 31, 2004 and December 31, 2005 and
June 30, 2006 (unaudited) | | F-3 |
Consolidated Statements of Operations for each of the three years in the period ended December 31, 2005 and for the six months ended June 30, 2005 (unaudited) and June 30, 2006 (unaudited) | | F-4 |
Consolidated Statements of Stockholders’ Deficit and Comprehensive Income (Loss) for each of the three years in the period ended December 31, 2005 and for the six months ended June 30, 2006 (unaudited) | | F-5 |
Consolidated Statements of Cash Flows for each of the three years in the period ended December 31, 2005 and for the six months ended June 30, 2005 (unaudited) and June 30, 2006 (unaudited) | | F-6 |
Notes to Consolidated Financial Statements | | F-7 |
F-1
Report of Independent Registered Public Accounting Firm
The Board of Directors and Stockholders
Ascent Energy Inc.
We have audited the accompanying consolidated balance sheets of Ascent Energy Inc. as of December 31, 2004 and 2005, and the related consolidated statements of operations, stockholders’ deficit and comprehensive income (loss), and cash flows for each of the three years in the period ended December 31, 2005. These financial statements are the responsibility of the Company’s management. Our responsibility is to express an opinion on these financial statements based on our audits.
We conducted our audits in accordance with the standards of the Public Company Accounting Oversight Board (United States). Those standards require that we plan and perform the audit to obtain reasonable assurance about whether the financial statements are free of material misstatement. We were not engaged to perform an audit of the Company’s internal control over financial reporting. Our audits included consideration of internal control over financial reporting as a basis for designing audit procedures that are appropriate in the circumstances, but not for the purpose of expressing an opinion on the effectiveness of the Company’s internal control over financial reporting. Accordingly, we express no such opinion. An audit also includes examining, on a test basis, evidence supporting the amounts and disclosures in the financial statements, assessing the accounting principles used and significant estimates made by management, and evaluating the overall financial statement presentation. We believe that our audits provide a reasonable basis for our opinion.
In our opinion, the financial statements referred to above present fairly, in all material respects, the consolidated financial position of Ascent Energy Inc. at December 31, 2004 and 2005, and the consolidated results of their operations and their cash flows for each of the three years in the period ended December 31, 2005 in conformity with U.S generally accepted accounting principles.
As discussed in Note 2 to the consolidated financial statements, effective January 1, 2003, the Company adopted Statement of Financial Accounting Standards No. 143, “Accounting for Asset Retirement Obligations”, and effective January 1, 2005, the Company changed its method of accounting for oil and natural gas properties from the full-cost method to the successful efforts method and retrospectively applied the change to the 2003 and 2004 consolidated financial statements. Also as discussed in Note 2, the 2003 and 2004 consolidated financial statements have been restated to correct an understatement of the income tax benefit and asset retirement obligations.
/s/ ERNST & YOUNG LLP
Dallas, Texas
June 2, 2006
F-2
ASCENT ENERGY INC.
CONSOLIDATED BALANCE SHEETS
(in thousands, except par value and share data)
| | | | | | | | | | | | |
| | | As of
December 31, | | | As of June 30, | |
| | | 2004 | | | 2005 | | | 2006 | |
| | | (Restated) | | | | | | (Unaudited) | |
| ASSETS | | | | | | | | | | | | |
CURRENT ASSETS: | | | | | | | | | | | | |
Cash and cash equivalents | | $ | 516 | | | $ | 1,080 | | | $ | 1,296 | |
Oil and gas revenue receivable | | | 6,555 | | | | 8,939 | | | | 7,482 | |
Joint interest and other receivables | | | 1,759 | | | | 877 | | | | 1,892 | |
Prepaid expenses | | | 277 | | | | 333 | | | | 496 | |
Fair value of derivatives | | | 257 | | | | 236 | | | | 1,178 | |
Inventory and other assets | | | 847 | | | | 776 | | | | 1,273 | |
| | | | | | | | | | | | |
TOTAL CURRENT ASSETS | | | 10,211 | | | | 12,241 | | | | 13,617 | |
PROPERTY AND EQUIPMENT, at cost: | | | | | | | | | | | | |
Oil and gas properties, successful efforts method | | | 305,677 | | | | 336,746 | | | | 358,922 | |
Unevaluated oil and gas properties | | | 1,437 | | | | 7,147 | | | | 21,330 | |
Other property and equipment | | | 7,055 | | | | 6,298 | | | | 6,286 | |
| | | | | | | | | | | | |
| | | 314,169 | | | | 350,191 | | | | 386,538 | |
Less—accumulated depreciation, depletion and amortization | | | (156,389 | ) | | | (176,747 | ) | | | (186,525 | ) |
| | | | | | | | | | | | |
Net property and equipment | | | 157,780 | | | | 173,444 | | | | 200,013 | |
OTHER ASSETS: | | | | | | | | | | | | |
Deferred financing costs | | | 703 | | | | 760 | | | | 722 | |
Fair value of derivatives | | | 25 | | | | 127 | | | | 50 | |
Escrowed and restricted funds | | | 548 | | | | 649 | | | | 657 | |
| | | | | | | | | | | | |
TOTAL ASSETS | | $ | 169,267 | | | $ | 187,221 | | | $ | 215,059 | |
| | | | | | | | | | | | |
| LIABILITIES AND STOCKHOLDERS’ DEFICIT | | | | | | | | | | | | |
CURRENT LIABILITIES: | | | | | | | | | | | | |
Accounts payable | | $ | 3,615 | | | $ | 3,841 | | | $ | 4,404 | |
Accrued liabilities | | | 3,985 | | | | 5,483 | | | | 8,562 | |
Undistributed oil and gas proceeds | | | 3,487 | | | | 5,385 | | | | 4,588 | |
Interest payable | | | 250 | | | | 343 | | | | 476 | |
Accrued abandonment cost | | | 85 | | | | 517 | | | | 1,325 | |
Fair value of derivatives | | | 4,333 | | | | 11,469 | | | | 13,182 | |
| | | | | | | | | | | | |
TOTAL CURRENT LIABILITIES | | | 15,755 | | | | 27,038 | | | | 32,537 | |
LONG-TERM LIABILITIES: | | | | | | | | | | | | |
Bank credit facility | | | 45,265 | | | | 49,715 | | | | 68,215 | |
Senior notes | | | 28,612 | | | | 33,492 | | | | 36,053 | |
Senior subordinated notes | | | 88,579 | | | | 99,552 | | | | 105,141 | |
Interest payable | | | 2,498 | | | | 2,464 | | | | 3,020 | |
Fair value of derivatives | | | 3,680 | | | | 17,043 | | | | 18,139 | |
Accrued abandonment cost | | | 9,189 | | | | 10,053 | | | | 9,898 | |
Deferred income taxes | | | 2,172 | | | | 1,865 | | | | 2,026 | |
Series A preferred stock accrued dividends | | | 9,577 | | | | 12,865 | | | | 14,496 | |
Commitments and contingencies | | | – | | | | 330 | | | | 330 | |
STOCKHOLDERS’ DEFICIT: | | | | | | | | | | | | |
Series A preferred stock, par value $0.001 per share; 44,100 shares authorized, 41,100 shares issued and outstanding; liquidation preference $1,000 per share | | | 40,054 | | | | 40,124 | | | | 40,160 | |
Common stock, par value $0.001 per share; 20,000,000 shares authorized, 5,949,026 shares issued and outstanding | | | 6 | | | | 6 | | | | 6 | |
Additional paid-in capital | | | 23,610 | | | | 23,610 | | | | 23,610 | |
Accumulated deficit | | | (99,730 | ) | | | (130,936 | ) | | | (138,572 | ) |
| | | | | | | | | | | | |
TOTAL STOCKHOLDERS’ DEFICIT | | | (36,060 | ) | | | (67,196 | ) | | | (74,796 | ) |
| | | | | | | | | | | | |
TOTAL LIABILITIES AND STOCKHOLDERS’ DEFICIT | | $ | 169,267 | | | $ | 187,221 | | | $ | 215,059 | |
| | | | | | | | | | | | |
The accompanying notes are an integral part of these consolidated financial statements.
F-3
ASCENT ENERGY INC.
CONSOLIDATED STATEMENTS OF OPERATIONS
(in thousands, except per share data)
| | | | | | | | | | | | | | | | | | | | |
| | | Years Ended December 31, | | | Six Months Ended June 30, | | | Six Months
Ended June 30, | |
| | | 2003 | | | 2004 | | | 2005 | | | 2005 | | | 2006 | |
| | | (Restated) | | | (Restated) | | | | | | (Unaudited) | |
REVENUES: | | | | | | | | | | | | | | | | | | | | |
Oil | | $ | 20,377 | | | $ | 25,431 | | | $ | 33,228 | | | $ | 15,694 | | | $ | 19,631 | |
Natural gas | | | 24,553 | | | | 22,021 | | | | 36,634 | | | | 14,848 | | | | 16,271 | |
NGLs | | | 2,027 | | | | 3,257 | | | | 3,714 | | | | 1,776 | | | | 1,713 | |
| | | | | | | | | | | | | | | | | | | | |
TOTAL REVENUES | | | 46,957 | | | | 50,709 | | | | 73,576 | | | | 32,318 | | | | 37,615 | |
| | | | | | | | | | | | | | | | | | | | |
COSTS AND EXPENSES: | | | | | | | | | | | | | | | | | | | | |
Production and ad valorem taxes | | | 4,307 | | | | 3,091 | | | | 3,332 | | | | 1,731 | | | | 2,231 | |
Lease operating expenses | | | 11,915 | | | | 12,018 | | | | 11,594 | | | | 5,487 | | | | 6,398 | |
General and administrative expenses | | | 10,388 | | | | 8,272 | | | | 8,436 | | | | 3,851 | | | | 5,548 | |
Exploration expenses | | | 5,630 | | | | 854 | | | | 3,460 | | | | 444 | | | | 818 | |
Depreciation, depletion, and amortization | | | 21,539 | | | | 31,207 | | | | 20,771 | | | | 10,623 | | | | 10,393 | |
Property impairments | | | 3,802 | | | | 20,711 | | | | 1,254 | | | | — | | | | — | |
Derivative loss | | | — | | | | 6,604 | | | | 33,851 | | | | 17,983 | | | | 6,725 | |
| | | | | | | | | | | | | | | | | | | | |
TOTAL OPERATING EXPENSES | | | 57,581 | | | | 82,757 | | | | 82,698 | | | | 40,119 | | | | 32,113 | |
| | | | | | | | | | | | | | | | | | | | |
(LOSS) INCOME FROM OPERATIONS | | | (10,624 | ) | | | (32,048 | ) | | | (9,122 | ) | | | (7,801 | ) | | | 5,502 | |
INTEREST AND OTHER INCOME | | | 7 | | | | 203 | | | | 561 | | | | 78 | | | | 110 | |
INTEREST EXPENSE | | | (13,661 | ) | | | (16,958 | ) | | | (19,496 | ) | | | (9,286 | ) | | | (11,266 | ) |
| | | | | | | | | | | | | | | | | | | | |
LOSS BEFORE INCOME TAXES | | | (24,278 | ) | | | (48,803 | ) | | | (28,057 | ) | | | (17,009 | ) | | | (5,654 | ) |
INCOME TAX BENEFIT (EXPENSE) | | | 8,624 | | | | 12,472 | | | | 209 | | | | 127 | | | | (317 | ) |
| | | | | | | | | | | | | | | | | | | | |
LOSS BEFORE CUMULATIVE EFFECT OF CHANGE IN ACCOUNTING PRINCIPLE | | | (15,654 | ) | | | (36,331 | ) | | | (27,848 | ) | | | (16,882 | ) | | | (5,971 | ) |
CUMULATIVE EFFECT OF CHANGE IN ACCOUNTING PRINCIPLE, NET OF INCOME TAX OF $273 | | | 262 | | | | — | | | | — | | | | — | | | | — | |
| | | | | | | | | | | | | | | | | | | | |
NET LOSS | | | (15,392 | ) | | | (36,331 | ) | | | (27,848 | ) | | | (16,882 | ) | | | (5,971 | ) |
PREFERRED STOCK DIVIDENDS | | | (3,976 | ) | | | (3,367 | ) | | | (3,358 | ) | | | (1,665 | ) | | | (1,665 | ) |
| | | | | | | | | | | | | | | | | | | | |
NET LOSS ATTRIBUTABLE TO COMMON SHARES | | $ | (19,368 | ) | | $ | (39,698 | ) | | $ | (31,206 | ) | | $ | (18,547 | ) | | $ | (7,636 | ) |
| | | | | | | | | | | | | | | | | | | | |
NET LOSS PER COMMON SHARE: | | | | | | | | | | | | | | | | | | | | |
Basic and diluted: | | | | | | | | | | | | | | | | | | | | |
Net loss per common share before cumulative effect of change in accounting principle | | $ | (3.68 | ) | | $ | (6.67 | ) | | $ | (5.25 | ) | | $ | (3.12 | ) | | $ | (1.28 | ) |
Cumulative effect of change in accounting principle | | | 0.05 | | | | — | | | | — | | | | — | | | | — | |
| | | | | | | | | | | | | | | | | | | | |
Net loss per common share | | $ | (3.63 | ) | | $ | (6.67 | ) | | $ | (5.25 | ) | | $ | (3.12 | ) | | $ | (1.28 | ) |
| | | | | | | | | | | | | | | | | | | | |
AVERAGE COMMON SHARES OUTSTANDING | | | 5,334 | | | | 5,949 | | | | 5,949 | | | | 5,949 | | | | 5,949 | |
| | | | | | | | | | | | | | | | | | | | |
The accompanying notes are an integral part of these consolidated financial statements.
F-4
ASCENT ENERGY INC.
CONSOLIDATED STATEMENTS OF STOCKHOLDERS’ DEFICIT
AND COMPREHENSIVE INCOME (LOSS)
(in thousands)
| | | | | | | | | | | | | | | | | | | | | | | | | |
| | | Series A Preferred Stock | | Series B Preferred Stock | | | Common Stock | | Additional Paid-in Capital | | Accumulated Deficit | | | Other Comprehensive Income (loss) | | | Total | |
Balance, December 31, 2002 | | $ | — | | $ | 2,609 | | | $ | 5 | | $ | 20,979 | | $ | (9,361 | ) | | $ | (7,268 | ) | | $ | 6,964 | |
Cumulative effect on prior years of restatements | | | — | | | — | | | | — | | | — | | | (31,303 | ) | | | — | | | | (31,303 | ) |
Net loss attributable to common shares | | | — | | | — | | | | — | | | — | | | (19,368 | ) | | | — | | | | (19,368 | ) |
Other comprehensive income: | | | | | | | | | | | | | | | | | | | | | | | | | |
Net change in fair value of derivatives, net of income tax of $1,913 | | | — | | | — | | | | — | | | — | | | — | | | | 3,120 | | | | 3,120 | |
| | | | | | | | | | | | | | | | | | | | | | | | | |
Comprehensive loss | | | | | | | | | | | | | | | | | | | | | | | | (16,248 | ) |
Mandatory conversion of Series B preferred stock | | | — | | | (2,609 | ) | | | 1 | | | 2,608 | | | — | | | | — | | | | — | |
| | | | | | | | | | | | | | | | | | | | | | | | | |
Balance, December 31, 2003 | | $ | — | | $ | — | | | $ | 6 | | $ | 23,587 | | $ | (60,032 | ) | | $ | (4,148 | ) | | $ | (40,587 | ) |
Net loss attributable to common shares | | | — | | | — | | | | — | | | — | | | (39,698 | ) | | | — | | | | (39,698 | ) |
Other comprehensive income: | | | | | | | | | | | | | | | | | | | | | | | | | |
Net change in fair value of derivatives, net of income tax of $2,705 | | | — | | | — | | | | — | | | — | | | — | | | | 4,148 | | | | 4,148 | |
| | | | | | | | | | | | | | | | | | | | | | | | | |
Comprehensive loss | | | | | | | | | | | | | | | | | | | | | | | | (35,550 | ) |
Issuance of warrants to purchase common stock | | | — | | | — | | | | — | | | 23 | | | — | | | | — | | | | 23 | |
Reclassification of Series A preferred stock | | | 40,054 | | | — | | | | — | | | — | | | — | | | | — | | | | 40,054 | |
| | | | | | | | | | | | | | | | | | | | | | | | | |
Balance, December 31, 2004 | | $ | 40,054 | | $ | — | | | $ | 6 | | $ | 23,610 | | $ | (99,730 | ) | | $ | — | | | $ | (36,060 | ) |
Net loss attributable to common shares | | | — | | | — | | | | — | | | — | | | (31,206 | ) | | | — | | | | (31,206 | ) |
Amortization of warrants to purchase common stock | | | 70 | | | — | | | | — | | | — | | | — | | | | — | | | | 70 | |
| | | | | | | | | | | | | | | | | | | | | | | | | |
Balance, December 31, 2005 | | $ | 40,124 | | $ | — | | | $ | 6 | | $ | 23,610 | | $ | (130,936 | ) | | $ | — | | | $ | (67,196 | ) |
Net loss attributable to common shares (unaudited) | | | — | | | — | | | | — | | | — | | | (7,636 | ) | | | — | | | | (7,636 | ) |
Amortization of warrants to purchase common stock (unaudited) | | | 36 | | | — | | | | — | | | — | | | — | | | | — | | | | 36 | |
| | | | | | | | | | | | | | | | | | | | | | | | | |
Balance, June 30, 2006 (unaudited) | | $ | 40,160 | | $ | — | | | $ | 6 | | $ | 23,610 | | $ | (138,572 | ) | | $ | — | | | $ | (74,796 | ) |
| | | | | | | | | | | | | | | | | | | | | | | | | |
The accompanying notes are an integral part of these consolidated financial statements.
F-5
ASCENT ENERGY INC.
CONSOLIDATED STATEMENTS OF CASH FLOWS
(in thousands)
| | | | | | | | | | | | | | | | | | | | |
| | | Years Ended December 31, | | | Six Months Ended June 30, | | | Six Months Ended June 30, | |
| | | 2003 | | | 2004 | | | 2005 | | | 2005 | | | 2006 | |
| | | (Restated) | | | (Restated) | | | | | | (Unaudited) | |
OPERATING ACTIVITIES: | | | | | | | | | | | | | | | | | | | | |
Net loss | | $ | (15,392 | ) | | $ | (36,331 | ) | | $ | (27,848 | ) | | $ | (16,882 | ) | | $ | (5,971 | ) |
Adjustments to reconcile net loss to net cash provided by operating activities: | | | | | | | | | | | | | | | | | | | | |
Cumulative effect of change in accounting principle | | | (262 | ) | | | — | | | | — | | | | — | | | | — | |
Depletion, depreciation and amortization | | | 21,539 | | | | 31,207 | | | | 20,771 | | | | 10,623 | | | | 10,393 | |
Property impairments | | | 3,802 | | | | 20,711 | | | | 1,254 | | | | — | | | | — | |
Exploratory costs | | | 1,026 | | | | — | | | | — | | | | — | | | | 304 | |
Deferred income tax benefit | | | (8,624 | ) | | | (12,472 | ) | | | (307 | ) | | | (160 | ) | | | 161 | |
Non-cash interest expense | | | 658 | | | | 14,655 | | | | 16,104 | | | | 7,798 | | | | 8,819 | |
Non-cash hedging and derivative losses | | | — | | | | 7,731 | | | | 20,418 | | | | 14,007 | | | | 1,943 | |
Gain on sale of assets | | | — | | | | (200 | ) | | | (658 | ) | | | (51 | ) | | | (71 | ) |
Other | | | (52 | ) | | | 21 | | | | 6 | | | | — | | | | 17 | |
Changes in assets and liabilities: | | | | | | | | | | | | | | | | | | | | |
Oil and gas revenue receivable | | | 212 | | | | (4 | ) | | | (2,347 | ) | | | (858 | ) | | | 1,457 | |
Joint interest and other accounts receivables | | | 2,738 | | | | (312 | ) | | | 1,107 | | | | 908 | | | | (1,015 | ) |
Prepaid expenses, inventory and other assets | | | 2,539 | | | | (28 | ) | | | 16 | | | | (139 | ) | | | (676 | ) |
Interest payable | | | 6,194 | | | | 103 | | | | 93 | | | | 308 | | | | 134 | |
Accounts payable and accrued liabilities | | | 781 | | | | (7,305 | ) | | | 959 | | | | (1,336 | ) | | | 3,643 | |
Undistributed oil and gas proceeds | | | 1,753 | | | | (355 | ) | | | 1,675 | | | | 456 | | | | (797 | ) |
Commitments and contingencies | | | — | | | | — | | | | 330 | | | | — | | | | — | |
Accrued abandonment costs | | | — | | | | — | | | | — | | | | — | | | | (52 | ) |
Escrowed and restricted funds | | | 23 | | | | (52 | ) | | | (98 | ) | | | (3 | ) | | | (8 | ) |
| | | | | | | | | | | | | | | | | | | | |
Net cash provided by operating activities | | | 16,935 | | | | 17,369 | | | | 31,475 | | | | 14,671 | | | | 18,281 | |
INVESTING ACTIVITIES: | | | | | | | | | | | | | | | | | | | | |
Capital expenditures | | | (39,121 | ) | | | (22,985 | ) | | | (34,588 | ) | | | (16,296 | ) | | | (36,554 | ) |
Investment in Dyne Exploration Company | | | — | | | | — | | | | (1,159 | ) | | | (1,159 | ) | | | — | |
Sales proceeds | | | — | | | | 401 | | | | 728 | | | | 139 | | | | 64 | |
| | | | | | | | | | | | | | | | | | | | |
Net cash used in investing activities | | | (39,121 | ) | | | (22,584 | ) | | | (35,019 | ) | | | (17,316 | ) | | | (36,490 | ) |
FINANCING ACTIVITIES: | | | | | | | | | | | | | | | | | | | | |
Proceeds on bank credit facility | | | 10,865 | | | | 3,800 | | | | 9,550 | | | | 5,050 | | | | 18,500 | |
Repayments on bank credit facility | | | (6,500 | ) | | | (1,400 | ) | | | (5,100 | ) | | | (500 | ) | �� | | — | |
Series B preferred stock dividend paid in cash | | | (2,129 | ) | | | — | | | | — | | | | — | | | | — | |
Proceeds on promissory notes | | | 24,000 | | | | — | | | | — | | | | — | | | | — | |
Deferred financing costs | | | — | | | | (750 | ) | | | (342 | ) | | | — | | | | (75 | ) |
| | | | | | | | | | | | | | | | | | | | |
Net cash provided by financing activities | | | 26,236 | | | | 1,650 | | | | 4,108 | | | | 4,550 | | | | 18,425 | |
| | | | | | | | | | | | | | | | | | | | |
NET INCREASE (DECREASE) IN CASH AND CASH EQUIVALENTS | | | 4,050 | | | | (3,565 | ) | | | 564 | | | | 1,905 | | | | 216 | |
CASH AND CASH EQUIVALENTS—BEGINNING OF YEAR | | | 31 | | | | 4,081 | | | | 516 | | | | 516 | | | | 1,080 | |
| | | | | | | | | | | | | | | | | | | | |
CASH AND CASH EQUIVALENTS—END OF PERIOD | | $ | 4,081 | | | $ | 516 | | | $ | 1,080 | | | $ | 2,421 | | | $ | 1,296 | |
| | | | | | | | | | | | | | | | | | | | |
SUPPLEMENTAL DISCLOSURES: | | | | | | | | | | | | | | | | | | | | |
Cash paid for interest | | $ | 7,247 | | | $ | 2,200 | | | $ | 3,299 | | | | | | | | | |
| | | | | | | | | | | | | | | | | | | | |
Cash paid for income taxes | | $ | 19 | | | $ | — | | | $ | 99 | | | | | | | | | |
| | | | | | | | | | | | | | | | | | | | |
The accompanying notes are an integral part of these consolidated financial statements.
F-6
ASCENT ENERGY INC.
NOTES TO CONSOLIDATED FINANCIAL STATEMENTS
(Information as of June 30, 2006 and for the six months ended June 30, 2005
and June 30, 2006 is unaudited)
1. ORGANIZATION
Ascent Energy Inc. (“Ascent,” “we” or “us”) is a growth-oriented, independent natural gas and oil company engaged in the acquisition, exploration and development of both conventional and unconventional natural gas and oil properties in Texas, Oklahoma, Louisiana and the Appalachian region.
Ascent Energy Inc., a Delaware corporation, was incorporated on January 9, 2001 as a wholly owned subsidiary of South Louisiana Property Holdings, Inc., a Louisiana corporation formerly known as Forman Petroleum Corporation, which we refer to as the “Parent,” to acquire natural gas and oil properties in Louisiana, Texas and Oklahoma. In July 2001, the Parent contributed to Ascent substantially all of its assets and liabilities. In August 2001, Ascent acquired Pontotoc Production, Inc., an Oklahoma corporation, or Pontotoc, for approximately $48.5 million of cash and 5,323,695 shares of 8% Series B convertible preferred stock, $0.001 par value per share, or Series B preferred stock, of Ascent. We financed a portion of the cash purchase price for the Pontotoc acquisition with a portion of the net proceeds from the sale of $21.1 million of 8% Series A redeemable preferred stock, $0.001 par value per share, or Series A preferred stock, of Ascent. In August 2003, all of the outstanding shares of Series B preferred stock converted automatically into an aggregate of 1,000,000 shares of common stock of Ascent, and we paid all accrued but unpaid dividends in cash. Following the mandatory conversion of the Series B preferred stock, the Parent owns approximately 83% of the issued and outstanding shares of Ascent common stock.
2. BASIS OF PRESENTATION AND SUMMARY OF SIGNIFICANT ACCOUNTING POLICIES
Basis of Presentation. The audited and unaudited consolidated financial statements include the accounts of Ascent and its subsidiaries. Those subsidiaries include Ascent Oil and Gas Inc., Ascent Energy Holdings, Inc., Ascent Louisiana, LLC, Ascent GP, LLC, Ascent LP, LLC, Ascent Operating, LP, Ascent Resources WV, Inc., Pontotoc Acquisition Corp., Dyne Exploration Company, Pontotoc Production Company, Inc., Oklahoma Basic Economy Corporation, Pontotoc Holdings, Inc., and Pontotoc Gathering, L.L.C. All inter-company balances have been eliminated. Certain prior year amounts have been reclassified to conform to current year presentation. The consolidated financial statements have been prepared in accordance with U.S. generally accepted accounting principles.
Unaudited Periods. The financial information with respect to the six months ended June 30, 2005 and 2006 is unaudited. In the opinion of management, this information contains all adjustments, consisting only of normal recurring adjustments, necessary for a fair presentation of the results for the periods presented. The results of operations for interim periods are not necessarily indicative of the results of operations for the full fiscal year.
Use of Estimates in the Preparation of Financial Statements. The preparation of the financial statements requires us to make estimates and judgments that affect the reported amounts of assets, liabilities, equity, revenues and expenses. Our estimates include those related to natural gas and oil revenues, bad debts, natural gas and oil properties, operating expenses, natural gas and oil reserves, abandonment liabilities, contingencies and litigation. Certain accounting policies involve judgments and uncertainties to such an extent that there is reasonable likelihood that materially different amounts could have been reported under different conditions, or if different assumptions had been used. We evaluate our estimates and assumptions on a regular basis. We base our estimates on historical experience and various other assumptions that are believed to be reasonable under the circumstances, the results of which form the basis for making judgments about the carrying values of assets and liabilities that are not readily apparent from other sources. Actual results may differ from these estimates used in preparation of our financial statements. In addition, alternatives can exist among various accounting methods. In such cases, the choice of accounting method can have a significant impact on reported amounts.
F-7
ASCENT ENERGY INC.
NOTES TO CONSOLIDATED FINANCIAL STATEMENTS—(Continued)
(Information as of June 30, 2006 and for the six months ended June 30, 2005
and June 30, 2006 is unaudited)
Natural Gas and Oil Reserve Estimates.Independent petroleum and geological engineers prepare estimates of our natural gas and oil reserves. Proved reserves, estimated future net revenues and the present value of our reserves are estimated based upon a combination of historical data and estimates of future activity. Our investors should not assume that the present value of our reserves is the current market value of our estimated proved reserves. Consistent with SEC requirements, we have based our present value from proved reserves on prices on the date of the estimate. The reserve estimates are used in calculating depletion, depreciation and amortization and in the assessment of assets for impairment as further discussed below. Significant assumptions are required in the valuation of proved natural gas and oil reserves which, as described herein, may affect the amount at which natural gas and oil properties are recorded. Actual results could differ materially from these estimates.
Revenue Recognition Policy. We follow the entitlements method of accounting for revenue recognition and natural gas imbalances and record our oil and natural gas revenues based on our revenue interest in our properties. Accrued sales are based on field or pipeline volume statements valued at purchaser contract terms. Natural gas imbalances were not significant for the periods presented.
F-8
ASCENT ENERGY INC.
NOTES TO CONSOLIDATED FINANCIAL STATEMENTS��(Continued)
(Information as of June 30, 2006 and for the six months ended June 30, 2005
and June 30, 2006 is unaudited)
Financial Statements. Our audited consolidated financial statements for the years ended December 31, 2003 and December 31, 2004 have been restated to reflect our conversion to the successful efforts method of accounting for our investment in natural gas and oil properties to correct our previously recorded income tax provision and to correct our previously understated asset retirement obligation. The following tables reflect the effects of the restatements, and presents only those line items affected by the restatements. See “—Change in Accounting Principle to Successful Efforts from Full Cost” and “—Asset Retirement Obligation Restatement and Tax Provision Restatement.”
| | | | | | | | | | | | | | | | | | | | |
| | | Year Ended December 31, 2003 | |
| | | As
Previously Reported | | | Change in
Accounting
Principle | | | As
Restated for Change in Accounting Principle | | | Other Restatements | | | As
Restated for Change in Accounting Principle
and Other Restatements | |
| | | (in thousands, except per share data) | |
Statements of Operations: | | | | | | | | | | | | | | | | | | | | |
General and administrative expenses | | $ | 8,942 | | | $ | 1,446 | | | $ | 10,388 | | | $ | — | | | $ | 10,388 | |
Exploration expenses | | | — | | | | 5,630 | | | | 5,630 | | | | — | | | | 5,630 | |
| | | | | |
Depreciation, depletion, and amortization | | | 22,699 | | | | (1,699 | ) | | | 21,000 | | | | 539 | | | | 21,539 | |
Property impairments | | | — | | | | 3,802 | | | | 3,802 | | | | — | | | | 3,802 | |
TOTAL OPERATING EXPENSES | | | 47,863 | | | | 9,179 | | | | 57,042 | | | | 539 | | | | 57,581 | |
LOSS FROM OPERATIONS | | | (906 | ) | | | (9,179 | ) | | | (10,085 | ) | | | (539 | ) | | | (10,624 | ) |
INTEREST AND OTHER INCOME (LOSS) | | | (4 | ) | | | — | | | | (4 | ) | | | 11 | | | | 7 | |
INTEREST EXPENSE | | | (13,661 | ) | | | — | | | | (13,661 | ) | | | — | | | | (13,661 | ) |
LOSS BEFORE INCOME TAXES | | | (14,571 | ) | | | (9,179 | ) | | | (23,750 | ) | | | (528 | ) | | | (24,278 | ) |
INCOME TAX BENEFIT (LOSS) | | | (90 | ) | | | 3,603 | | | | 3,513 | | | | 5,111 | | | | 8,624 | |
INCOME (LOSS) BEFORE CUMULATIVE EFFECT OF CHANGE IN ACCOUNTING PRINCIPLE | | | (14,661 | ) | | | (5,576 | ) | | | (20,237 | ) | | | 4,583 | | | | (15,654 | ) |
CUMULATIVE EFFECT OF CHANGE IN ACCOUNTING PRINCIPLE, NET OF INCOME TAX | | | (436 | ) | | | — | | | | (436 | ) | | | 698 | | | | 262 | |
NET INCOME (LOSS) | | | (15,097 | ) | | | (5,576 | ) | | | (20,673 | ) | | | 5,281 | | | | (15,392 | ) |
NET INCOME (LOSS) ATTRIBUTABLE TO COMMON SHARES | | $ | (19,073 | ) | | $ | (5,576 | ) | | $ | (24,649 | ) | | $ | 5,281 | | | $ | (19,368 | ) |
NET INCOME (LOSS) PER COMMON SHARE: | | | | | | | | | | | | | | | | | | | | |
Basic and diluted: | | | | | | | | | | | | | | | | | | | | |
Net income (loss) before cumulative change in accounting principle | | $ | (3.49 | ) | | $ | (1.05 | ) | | $ | (4.54 | ) | | $ | 0.86 | | | $ | (3.68 | ) |
Cumulative effect of change in accounting principle | | | (0.08 | ) | | | — | | | | (0.08 | ) | | | 0.13 | | | | 0.05 | |
| | | | | | | | | | | | | | | | | | | | |
Net income (loss) attributable to common shares | | $ | (3.57 | ) | | $ | (1.05 | ) | | $ | (4.62 | ) | | $ | 0.99 | | | $ | (3.63 | ) |
F-9
ASCENT ENERGY INC.
NOTES TO CONSOLIDATED FINANCIAL STATEMENTS—(Continued)
(Information as of June 30, 2006 and for the six months ended June 30, 2005
and June 30, 2006 is unaudited)
| | | | | | | | | | | | | | | | | | | | |
| | | Year Ended December 31, 2004 | |
| | | As Previously
Reported | | | Change in
Accounting
Principle | | | As
Restated for Change in Accounting Principle | | | Other Restatements | | | As Restated
for Change
in Accounting Principle and Other Restatements | |
| | | (in thousands, except per share data) | |
General and administrative expenses | | $ | 7,807 | | | $ | 465 | | | $ | 8,272 | | | $ | — | | | $ | 8,272 | |
Exploration expenses | | | — | | | | 854 | | | | 854 | | | | — | | | | 854 | |
Depreciation, depletion, and amortization | | | 20,755 | | | | 9,821 | | | | 30,576 | | | | 631 | | | | 31,207 | |
Property impairments | | | — | | | | 20,711 | | | | 20,711 | | | | — | | | | 20,711 | |
TOTAL OPERATING EXPENSES | | | 50,275 | | | | 31,851 | | | | 82,126 | | | | 631 | | | | 82,757 | |
INCOME (LOSS) FROM OPERATIONS | | | 434 | | | | (31,851 | ) | | | (31,417 | ) | | | (631 | ) | | | (32,048 | ) |
INTEREST AND OTHER INCOME (LOSS) | | | 221 | | | | — | | | | 221 | | | | (18 | ) | | | 203 | |
INTEREST EXPENSE | | | (16,958 | ) | | | — | | | | (16,958 | ) | | | — | | | | (16,958 | ) |
LOSS BEFORE INCOME TAXES | | | (16,303 | ) | | | (31,851 | ) | | | (48,154 | ) | | | (649 | ) | | | (48,803 | ) |
INCOME TAX BENEFIT (LOSS) | | | — | | | | 12,092 | | | | 12,092 | | | | 380 | | | | 12,472 | |
INCOME (LOSS) BEFORE CUMULATIVE EFFECT OF CHANGE IN ACCOUNTING PRINCIPLE | | | (16,303 | ) | | | (19,759 | ) | | | (36,062 | ) | | | (269 | ) | | | (36,331 | ) |
CUMULATIVE EFFECT OF CHANGE IN ACCOUNTING PRINCIPLE, NET OF INCOME TAX | | | — | | | | — | | | | — | | | | — | | | | — | |
NET INCOME (LOSS) | | | (16,303 | ) | | | (19,759 | ) | | | (36,062 | ) | | | (269 | ) | | | (36,331 | ) |
NET INCOME (LOSS) ATTRIBUTABLE TO COMMON SHARES | | $ | (19,670 | ) | | $ | (19,759 | ) | | $ | (39,429 | ) | | $ | (269 | ) | | $ | (39,698 | ) |
INCOME (LOSS) PER COMMON SHARE: | | | | | | | | | | | | | | | | | | | | |
Basic and diluted: | | | | | | | | | | | | | | | | | | | | |
Net income (loss) attributable to common shares | | $ | (3.31 | ) | | $ | (3.32 | ) | | $ | (6.63 | ) | | $ | (0.04 | ) | | $ | (6.67 | ) |
Balance Sheet: | | | | | | | | | | | | | | | | | | | | |
Oil and gas properties, successful efforts method | | $ | 312,281 | | | $ | (11,547 | ) | | $ | 300,734 | | | $ | 4,943 | | | $ | 305,677 | |
Unevaluated oil and gas properties | | | 2,289 | | | | (852 | ) | | | 1,437 | | | | — | | | | 1,437 | |
Other property and equipment | | | 8,150 | | | | — | | | | 8,150 | | | | (1,095 | ) | | | 7,055 | |
Net property and equipment | | | 322,720 | | | | (12,399 | ) | | | 310,321 | | | | 3,848 | | | | 314,169 | |
Less – accumulated depreciation, depletion and amortization | | | (79,794 | ) | | | (79,877 | ) | | | (159,671 | ) | | | 3,282 | | | | (156,389 | ) |
Net property and equipment | | | 242,926 | | | | (92,276 | ) | | | 150,650 | | | | 7,130 | | | | 157,780 | |
TOTAL ASSETS | | | 254,413 | | | | (92,276 | ) | | | 162,137 | | | | 7,130 | | | | 169,267 | |
Accounts payable | | | 3,580 | | | | — | | | | 3,580 | | | | 35 | | | | 3,615 | |
Accrued abandonment cost | | | — | | | | — | | | | — | | | | 85 | | | | 85 | |
TOTAL CURRENT LIABILITIES | | | 15,635 | | | | — | | | | 15,635 | | | | 120 | | | | 15,755 | |
Accrued abandonment cost | | | 2,523 | | | | — | | | | 2,523 | | | | 6,666 | | | | 9,189 | |
Deferred income taxes | | | 42,478 | | | | (35,783 | ) | | | 6,695 | | | | (4,523 | ) | | | 2,172 | |
Accumulated (deficit) equity | | | (48,104 | ) | | | (56,493 | ) | | | (104,597 | ) | | | 4,867 | | | | (99,730 | ) |
TOTAL STOCKHOLDERS’ (DEFICIT) EQUITY | | | 15,566 | | | | (56,493 | ) | | | (40,927 | ) | | | 4,867 | | | | (36,060 | ) |
TOTAL LIABILITIES AND STOCKHOLDERS’ (DEFICIT) EQUITY | | | 254,413 | | | | (92,276 | ) | | | 162,137 | | | | 7,130 | | | | 169,267 | |
F-10
ASCENT ENERGY INC.
NOTES TO CONSOLIDATED FINANCIAL STATEMENTS—(Continued)
(Information as of June 30, 2006 and for the six months ended June 30, 2005
and June 30, 2006 is unaudited)
| | | | | | | | | | | | | | | | | | | | |
| | | Year Ended December 31, 2003 | |
| | | As
Previously
Reported | | | Change in Accounting Principle | | | As
Restated for
Change in
Accounting
Principle | | | Other
Restatements | | | As Restated for
Change in
Accounting
Principle
and Other
Restatements | |
| | | (in thousands) | |
Cash Flows: | | | | | | | | | | | | | | | | | | | | |
OPERATING ACTIVITIES: | | | | | | | | | | | | | | | | | | | | |
Loss before cumulative effect of change in accounting principle | | $ | (14,661 | ) | | $ | (5,576 | ) | | $ | (20,237 | ) | | $ | 4,583 | | | $ | (15,654 | ) |
Adjustments to reconcile loss before cumulative effect of change in accounting principle to net cash provided by operating activities | | | | | | | | | | | | | | | | | | | | |
Depletion, depreciation and amortization | | | 23,317 | | | | (1,699 | ) | | | 21,618 | | | | (79 | ) | | | 21,539 | |
Property impairments | | | — | | | | 3,802 | | | | 3,802 | | | | — | | | | 3,802 | |
Exploratory dry hole costs | | | — | | | | 1,026 | | | | 1,026 | | | | — | | | | 1,026 | |
Deferred income tax benefit | | | — | | | | (3,603 | ) | | | (3,603 | ) | | | (5,021 | ) | | | (8,624 | ) |
Non-cash interest expense | | | — | | | | — | | | | — | | | | 658 | | | | 658 | |
Other | | | — | | | | — | | | | — | | | | (52 | ) | | | (52 | ) |
Changes in assets and liabilities: | | | | | | | | | | | | | | | | | | | | |
Accounts Payable | | | 870 | | | | — | | | | 870 | | | | (89 | ) | | | 781 | |
Net cash provided by (used in) operating activities | | | 22,985 | | | | (6,050 | ) | | | 16,935 | | | | — | | | | 16,935 | |
INVESTING ACTIVITIES: | | | | | | | | | | | | | | | | | | | | |
Capital expenditures | | | (45,171 | ) | | | 6,050 | | | | (39,121 | ) | | | — | | | | (39,121 | ) |
Net cash (used in) provided by investing activities | | $ | (45,171 | ) | | $ | 6,050 | | | $ | (39,121 | ) | | $ | — | | | $ | (39,121 | ) |
| |
| | | Year Ended December 31, 2004 | |
| | | As
Previously
Reported | | | Change in Accounting Principle | | | As
Restated for
Change in
Accounting
Principle | | | Other
Restatements | | | As Restated for Change in
Accounting
Principle
and Other
Restatements | |
| | | (in thousands) | |
Cash Flows: | | | | | | | | | | | | | | | | | | | | |
OPERATING ACTIVITIES: | | | | | | | | | | | | | | | | | | | | |
Loss before cumulative effect of change in accounting principle | | $ | (16,304 | ) | | $ | (19,759 | ) | | $ | (36,063 | ) | | $ | (269 | ) | | $ | (36,331 | ) |
Adjustments to reconcile loss before cumulative effect of change in accounting principle to net cash provided by operating activities | | | | | | | | | | | | | | | | | | | | |
Depletion, depreciation and amortization | | | 20,755 | | | | 9,821 | | | | 30,576 | | | | 631 | | | | 31,207 | |
Property impairments | | | — | | | | 20,711 | | | | 20,711 | | | | — | | | | 20,711 | |
Exploratory dry hole costs | | | — | | | | — | | | | — | | | | — | | | | — | |
Deferred income tax benefit | | | — | | | | (12,092 | ) | | | (12,092 | ) | | | (380 | ) | | | (12,472 | ) |
Non-cash interest expense | | | 14,655 | | | | — | | | | 14,655 | | | | — | | | | 14,655 | |
Other | | | — | | | | — | | | | — | | | | 18 | | | | 21 | |
Changes in assets and liabilities: | | | | | | | | | | | | | | | | | | | | |
Accounts Payable | | | (7,304 | ) | | | — | | | | (7,304 | ) | | | — | | | | (7,305 | ) |
Net cash provided by (used in) operating activities | | | 18,688 | | | | (1,319 | ) | | | 17,369 | | | | — | | | | 17,369 | |
INVESTING ACTIVITIES: | | | | | | | | | | | | | | | | | | | | |
Capital expenditures | | | (24,304 | ) | | | 1,319 | | | | (22,985 | ) | | | — | | | | (22,985 | ) |
Net cash (used in) provided by investing activities | | $ | (23,903 | ) | | $ | 1,319 | | | $ | (22,985 | ) | | $ | — | | | $ | (22,584 | ) |
F-11
ASCENT ENERGY INC.
NOTES TO CONSOLIDATED FINANCIAL STATEMENTS—(Continued)
(Information as of June 30, 2006 and for the six months ended June 30, 2005
and June 30, 2006 is unaudited)
Change in Accounting Principle to Successful Efforts from Full Cost. U.S. generally accepted accounting principles allow the option of two acceptable methods for accounting for natural gas and oil properties. The primary differences between the two methods are in the treatment of exploration costs, the computation of depreciation, depletion and amortization and the calculation of property impairments.
Effective January 1, 2005, we changed our accounting method for natural gas and oil properties from the full cost method to the successful efforts method. Management believes that the successful efforts method of accounting is the preferable method in the natural gas and oil industry and that the accounting change will more accurately present the results of our exploration and development activities, minimize asset write-offs caused by temporary declines in natural gas and oil prices and reflect an impairment in the carrying value of our natural gas and oil properties when there has been a permanent decline in their fair value.
We use the successful efforts method of accounting, and, as such, we capitalize all costs related to property acquisitions and successful exploratory wells, all development costs and the costs of support equipment and facilities. All costs related to unsuccessful exploratory wells are expensed. Other exploration costs, including geological and geophysical costs, are expensed as incurred.
Unproved leasehold costs are capitalized and are reviewed periodically for impairment. Costs related to impaired prospects are charged to expense. If natural gas and oil prices decline in the future, some of these unproved prospects may not be economical to develop, which could lead to increased impairment expense.
Costs of development dry holes and proved leaseholds are amortized on the unit-of-production method based on proved reserves on a field basis. The depreciation of capitalized production equipment and drilling costs is based on the unit-of-production method using proved developed reserves on a field basis.
We review our proved natural gas and oil properties for impairment on a field basis. For each field, an impairment provision is recorded whenever events or circumstances indicate that the carrying value of those properties may not be recoverable. The impairment provision is based on the excess of carrying value over fair value. Fair value is defined as the present value of the estimated future net revenues from estimated future production of total proved natural gas and oil reserves based on our expectations of future natural gas and oil prices and costs. Due to the volatility of natural gas and oil prices, it is possible that our assumptions regarding natural gas and oil prices may change in the future and may result in future impairment provisions. We recorded impairment provisions related to our proved natural gas and oil properties of $3.8 million, $20.7 million and $1.3 million for the years ended December 31, 2003, December 31, 2004 and December 31, 2005, respectively. The impairment provision for 2004 resulted primarily from a downward revision of our reserves at our New Taiton field in Texas.
We retrospectively adjusted our financial statements for the periods ending prior to December 31, 2005 to give effect to our change to the successful efforts method of accounting. The effect of the retrospective application, net of income taxes, was a reduction of retained earnings as of December 31, 2004, of $56.5 million, primarily resulting from a reduction of net property, plant and equipment of $92.3 million and a reduction of deferred income tax liability of $35.8 million. The change in accounting method increased our net loss by $5.6 million ($1.05 per basic and diluted share) and $19.8 million ($3.32 per basic and diluted share) for the year ended December 31, 2003 and the year ended December 31, 2004, respectively.
Asset Retirement Obligations.Effective January 1, 2003, we adopted Statement of Financial Accounting Standards (“SFAS”) No. 143, “Accounting for Asset Retirement Obligations” (“SFAS 143”). SFAS 143 requires legal obligations associated with the retirement of long-lived assets to be recognized at their fair value at the time that the obligations are incurred. Upon initial recognition of a liability, that cost is capitalized as part of the
F-12
ASCENT ENERGY INC.
NOTES TO CONSOLIDATED FINANCIAL STATEMENTS—(Continued)
(Information as of June 30, 2006 and for the six months ended June 30, 2005
and June 30, 2006 is unaudited)
related long-lived asset and allocated to expense over the useful life of the asset. Periodic accretion of the discount of the estimated liability is recorded in the income statement. We determine our asset retirement obligation by calculating the present value of estimated cash flows related to the liability.
We escrow a portion of the future abandonment costs of our wells and facilities. Escrowed funds of approximately $0.5 million related to future abandonment costs are included in escrowed and restricted funds on our balance sheets as of December 31, 2004 and December 31, 2005.
Asset Retirement Obligation Restatement and Tax Provision Restatement.During the fourth quarter of 2005, we determined that our initial adoption of SFAS 143 understated our asset retirement obligation. The understatement was primarily attributable to our understating the number of wells subject to future retirement obligations and associated retirement costs on certain properties. Additionally, we overstated the useful lives of a significant portion of our properties which contributed to the understatement of our asset retirement obligation.
We restated our financial statements for the years ended December 31, 2003 and December 31, 2004 to reflect the revision to our asset retirement obligation for those periods. The effect of the restatement at adoption is as follows:
| | | | | | | | |
| | | Initial Adoption | | | Restated
Adoption | |
| | | (in thousands) | |
Natural gas and oil properties | | $ | 1,563 | | | $ | 6,033 | |
Accumulated depreciation, depletion and amortization | | | (276 | ) | | | 1,496 | |
Asset retirement obligation | | | (1,996 | ) | | | (7,103 | ) |
Deferred tax liability | | | 273 | | | | (164 | ) |
| | | | | | | | |
Cumulative effect of change in accounting principle, net of income tax benefit of $273 at initial adoption and income tax expense of $164 as restated | | $ | (436 | ) | | $ | 262 | |
| | | | | | | | |
The following table summarizes the changes to our asset retirement obligation for the periods ended December 31, 2004, December 31, 2005 and June 30, 2006:
| | | | | | | | | | | | |
| | | Year Ended December 31, | | | Six Months
Ended
June 30, | |
| | | 2004 | | | 2005 | | | 2006 | |
| | | (in thousands) | |
Asset retirement obligations at beginning of period | | $ | 8,319 | | | $ | 9,274 | | | $ | 10,570 | |
Accretion expense | | | 868 | | | | 991 | | | | 515 | |
Liabilities incurred | | | 135 | | | | 450 | | | | 218 | |
Liabilities settled | | | (48 | ) | | | (145 | ) | | | (52 | ) |
Liabilities retired due to sale of assets | | | — | | | | — | | | | (28 | ) |
| | | | | | | | | | | | |
Asset retirement obligations at period-end | | | 9,274 | | | | 10,570 | | | | 11,223 | |
Less: current asset retirement obligations | | | 85 | | | | 517 | | | | 1,325 | |
| | | | | | | | | | | | |
Long-term asset retirement obligations | | $ | 9,189 | | | $ | 10,053 | | | $ | 9,898 | |
| | | | | | | | | | | | |
During 2005, we reviewed the tax basis of all our related assets and net operating loss carryforwards for the current year and previous four years. As a result of this review, we restated our 2003 financial statements toeliminate the $5.6 million valuation allowance previously recorded for the year ended December 31, 2003. We
F-13
ASCENT ENERGY INC.
NOTES TO CONSOLIDATED FINANCIAL STATEMENTS—(Continued)
(Information as of June 30, 2006 and for the six months ended June 30, 2005
and June 30, 2006 is unaudited)
determined that the valuation allowance recorded during 2003 was not required because the reported grossfederal deferred tax assets were more likely than not fully realizable as an offset against the recorded federal deferred tax liabilities.
The effect of the restatement of our asset retirement obligations, net of income taxes, and our tax provision on the financial statements was an increase in retained earnings as of December 31, 2004 of $4.6 million. The restatement decreased our net loss by $5.3 million ($0.99 per basic and diluted share) for the year ended December 31, 2003, and increased our net loss by $0.3 million ($0.04 per basic and diluted share) for the year ended December 31, 2004.
Depletion, Depreciation and Amortization. We use estimates of proved natural gas and oil reserve quantities to estimate depletion, depreciation and amortization expense using the unit-of-production method of accounting. Depreciation of property and equipment other than natural gas and oil properties is calculated using the straight line method over the useful lives of the assets, ranging from three to seven years. Any change in reserves directly impacts the amount of depreciation, depletion and amortization expense we recognize in a given period. Assuming no other changes, as our reserves increase, depletion, depreciation and amortization expense decreases, and as our reserves decrease, depletion, depreciation and amortization expense increases. Changes in our estimate of proved reserves can cause material changes in our depletion, depreciation and amortization expense.
Cash and Cash Equivalents. We consider all highly liquid investments with an original maturity of three months or less to be cash equivalents. Substantially all of our cash balances as of December 31, 2004 and December 31, 2005 and June 30, 2006 are in excess of federally insured limits.
Concentration of Credit Risk and Accounts Receivable. Financial instruments that potentially subject us to a concentration of credit risk consist principally of cash equivalents, accounts receivable and derivative instruments. We place our cash with reputable commercial banks and our derivative instruments with financial institutions and other firms that management believes have high credit ratings. A significant portion of our accounts receivable are due from purchasers of natural gas and oil, and such receivables seldom extend beyond 60 days. We do not require collateral to secure our natural gas and oil sales. In our capacity as operator of our properties, we incur drilling and operating costs that we bill to our joint interest owners based on their working interests. We have provided an allowance for doubtful accounts for certain joint interest owners when the receivable balances extend beyond 90 days. Accounts receivable are presented net of the related allowance for doubtful accounts, which totaled $0.2 million, $0.3 million and $0.3 million as of December 31, 2004, December 31, 2005 and June 30, 2006, respectively.
Major Customers.We sold oil and natural gas production representing more than 10% of our total revenues to the following customers:
| | | | | | | | | | | | |
| | | Year Ended December 31, | | | Six Months
Ended June 30, | |
| | | 2003 | | | 2004 | | | 2005 | | | 2006 | |
Duke Energy Field Services, LP | | 13 | % | | — | | | — | | | — | |
Sunoco | | 26 | % | | 33 | % | | 37 | % | | 43 | % |
Upstream Energy Services | | 23 | % | | 27 | % | | 28 | % | | 28 | % |
Inventories. Inventories are stated at the lower of average cost or market. Inventory consists primarily of approximately $0.3 million of oil as of December 31, 2004 and December 31, 2005, and $0.5 million of materials as of December 31, 2004 and December 31, 2005. As of June 30, 2005 and June 30, 2006, inventory consisted primarily of approximately $0.3 million of oil and $0.3 million of materials, respectively.
F-14
ASCENT ENERGY INC.
NOTES TO CONSOLIDATED FINANCIAL STATEMENTS—(Continued)
(Information as of June 30, 2006 and for the six months ended June 30, 2005
and June 30, 2006 is unaudited)
Deferred Financing Costs. Costs incurred in connection with the issuance of long-term debt are capitalized and amortized using the straight line amortization method over the term of the related instruments and reported as interest expense. As of December 31, 2004 and December 31, 2005, we had capitalized costs of $0.7 million and $0.8 million, respectively, relating to our issuance of long-term debt in connection with our July 2004 financial restructuring and subsequent amendments of our debt. During the years ended December 31, 2003, December 31, 2004 and December 31, 2005, we recognized associated interest expense of $0.3 million, $0.3 million and $0.2 million, respectively.
Fair Value of Financial Instruments. Our financial instruments consist primarily of cash equivalents, trade receivables, trade payables, derivative instruments and bank debt. Our cash equivalents, trade receivables and trade payables are considered to be representative of their respective fair values due to their short maturities. Our derivative instruments are reflected at fair value as provided by our counterparties. The fair value of our bank debt approximates its carrying value because the interest rate available to us is variable and reflective of market rates. Our senior notes and senior subordinated notes do not trade on any market and to determine the fair value of these financial instruments is not practicable. See note 4 for the terms of the senior notes and senior subordinated notes.
Derivative Instruments. We account for our derivative arrangements under SFAS No. 133, “Accounting for Derivative Instruments and Hedging Activities” (“SFAS 133”), as amended by SFAS No. 137, “Accounting for Derivative Instruments and Hedging Activities—Deferral of the Effective Date of FASB Statement No. 133,” SFAS No. 138, “Accounting for Certain Derivative Instruments and Certain Hedging Activities,” and SFAS No. 149, “Amendment of Statement 133 on Derivative Instruments and Hedging Activities.” Under SFAS No. 133, instruments qualifying for hedge accounting treatment are recorded on the balance sheet as an asset or liability measured at fair value and subsequent changes in fair value are recognized in equity through other comprehensive income until the sale of the related hedged production is recognized in earnings, at which time amounts previously recognized on other comprehensive income are recognized in earnings. Any ineffective portion of changes in fair value on derivatives qualifying for hedge accounting treatment is recognized in earnings immediately. Instruments not qualifying for hedge accounting treatment are recorded on the balance sheet at fair value and subsequent changes in fair value are recognized in earnings. Derivative instruments entered into prior to our July 2004 financial restructuring qualified for hedge accounting treatment; however, derivative instruments entered into subsequent to such restructuring were not qualified for hedge accounting treatment.
Deferred Income Taxes. We follow the asset and liability method for accounting for deferred income taxes and income taxes in accordance with SFAS No. 109, “Accounting for Income Taxes.” Provisions for income taxes include deferred taxes resulting primarily from temporary differences due to different reporting methods for natural gas and oil properties for financial reporting purposes and income tax purposes.
As of December 31, 2005, we had a net deferred tax liability of $1.9 million. For financial reporting purposes, all development expenditures and certain exploratory costs on successful wells are capitalized and depreciated, depleted and amortized on the units-of-production method. For income tax purposes, only the equipment and leasehold costs relative to successful wells are capitalized and recovered through depreciation or depletion. Generally, most other exploratory and development costs are charged to expense as incurred; however, we follow certain provisions of the Internal Revenue Code that allow capitalization of intangible drilling costs where management deems appropriate. Other financial and income tax reporting differences occur as a result of statutory depletion and capitalization of interest expense for income tax purposes.
F-15
ASCENT ENERGY INC.
NOTES TO CONSOLIDATED FINANCIAL STATEMENTS—(Continued)
(Information as of June 30, 2006 and for the six months ended June 30, 2005
and June 30, 2006 is unaudited)
Contingencies. Contingencies are recognized upon determination of an exposure, which when analyzed indicates that it is both probable that a liability has been incurred and the amount of the liability can reasonably be determined.
Equity Compensation. As permitted by SFAS No. 123, “Accounting for Stock-Based Compensation” (“SFAS 123”), we accounted for stock-based compensation under Accounting Principles Board Opinion No. 25, “Accounting for Stock Issued to Employees” (“APB 25”) using the intrinsic method for periods ended prior to the first interim or annual period after December 31, 2005. Accordingly, we measured compensation cost for stock options as the excess, if any, of the quoted market price of our common stock on the date of grant over the amount an employee must pay to acquire the stock. SFAS 123 established accounting and disclosure requirements using a fair-value based method of accounting for stock-based employee compensation plans. As allowed by SFAS 123, we elected to continue to apply the intrinsic value based method of accounting described above, and we adopted the disclosure requirements of SFAS 123, which was amended by SFAS No. 148, “Accounting for Stock-Based Compensation—Transition and Disclosures.”In March 2002, our board of directors adopted the Ascent Energy Inc. 2002 Stock Incentive Plan under which shares of our common stock were available for awards. On May 20, 2005, we adopted the Ascent Energy Inc. Amended and Restated Equity Incentive Plan (the “2005 Incentive Plan”); and, in connection therewith, each holder of options granted under our 2002 Stock Incentive Plan surrendered his or her options in exchange for an award under our 2005 Incentive Plan.
In December 2004, the Financial Accounting Standards Board (“FASB”) issued SFAS No. 123(R), “Share-Based Payment” (“SFAS 123(R)”), which is a revision of SFAS 123. SFAS 123(R) is effective for public companies for interim or annual periods beginning after December 15, 2005. SFAS 123(R) supersedes APB 25, and amends SFAS No. 95, “Statement of Cash Flows.” SFAS 123(R) requires all share-based payments to employees, including grants of employee stock options, to be recognized in financial statements based on their fair values beginning with the first interim or annual period after December 15, 2005, with early adoption encouraged. The pro-forma disclosures previously permitted under SFAS 123 are no longer an alternative to financial statement recognition. SFAS 123(R) also requires the tax benefits in excess of recognized compensation expenses to be reported as a financing cash flow rather than as an operating cash flow as currently required. SFAS 123(R) is effective for our first annual reporting period ending after December 31, 2005. We adopted SFAS 123(R) on January 1, 2006 using a modified prospective application. Our adoption of SFAS 123(R) did not have an impact on our financial statements.
Loss Per Common Share. Basic loss per common share is computed by dividing net loss by the weighted average number of common shares outstanding for the period presented.
Diluted loss per common share for the years ended December 31, 2003, December 31, 2004 and December 31, 2005 and the six months ended June 30, 2005 and June 30, 2006 does not reflect the potential dilution of dilutive stock options or dilutive warrants to purchase shares of common stock. Because we had a net loss for each of these periods, the effect of the assumed exercise of these stock options and warrants to purchase common stock would have been antidilutive.
Recent Accounting Pronouncement. In May 2005, the FASB issued SFAS No. 154, “Accounting Changes and Error Corrections” (“SFAS 154”), which replaces Accounting Principles Board Opinion No. 20 “AccountingChanges,” and SFAS No. 3, “Reporting Accounting Changes in Interim Financial Statements.” SFAS 154 is effective for accounting changes and corrections of errors made in fiscal years beginning after December 15, 2005 and requires retrospective application to prior period financial statements of voluntary changes in accounting principles unless it is impractical to determine either the period-specific effects or the cumulative
F-16
ASCENT ENERGY INC.
NOTES TO CONSOLIDATED FINANCIAL STATEMENTS—(Continued)
(Information as of June 30, 2006 and for the six months ended June 30, 2005
and June 30, 2006 is unaudited)
effect of the change. We adopted SFAS 154 during 2005. See Note 2, “Basis of Presentation and Summary of Significant Accounting Policies—Change in Accounting Principle to Successful Efforts from Full Cost” and Note 2, “Basis of Presentation and Summary of Significant Accounting Policies—Asset Retirement Obligation Restatement and Tax Provision Restatement.”
In July 2006, the FASB issued Interpretation No. 48, “Accounting for Uncertainty in Income Taxes—an Interpretation of FASB Statement 109” (“FIN 48”), which clarifies the accounting for uncertainty in tax positions taken or expected to be taken in a tax return, including issues relating to financial statement recognition and measurement. FIN 48 provides that the tax effects from an uncertain tax position can be recognized in the financial statements only if the position is “more-likely-than-not” of being sustained if the position were to be challenged by a taxing authority. The provisions of FIN 48 are effective for fiscal years beginning after December 15, 2006, with the cumulative effect of the change in accounting principle recorded as an adjustment to opening retained earnings. We are currently evaluating the impact, if any, the adoption of FIN 48 will have on our consolidated financial position or results of operations.
3. DERIVATIVE ARRANGEMENTS
Commodity Price Derivatives. We adopted SFAS 133 on January 1, 2001. SFAS 133 established accounting and reporting standards that require every derivative instrument (including certain derivative instruments embedded in other contracts) to be recorded in the balance sheet as either an asset or a liability measured at its fair value and that changes in the derivative’s fair value be recognized currently in earnings unless specific hedge accounting criteria are met.
We enter into derivative arrangements with respect to portions of our natural gas, oil and natural gas liquid production to reduce our sensitivity to volatile commodity prices. Our bank credit facility requires us to enter into derivative instruments covering a minimum of 50% for the three-year period following the effective date of the bank credit facility, but not in excess of 85% for the 12-month period immediately subsequent to any fiscal quarter, of forecast proved developed producing reserves. Historically, our derivative arrangements have been puts, price swaps and costless collar agreements. We believe that these derivative arrangements, although not free of risk, allow us to achieve a more predictable cash flow and to reduce exposure to price fluctuations. However, derivative arrangements limit the benefit of increases in the prices of natural gas and oil. Moreover, our derivative arrangements apply only to a portion of our production and provide only partial price protection against declines in prices. Additionally, these arrangements may expose us to risk of financial loss in certain circumstances. We have entered into all of our natural gas and oil derivatives with Fortis Energy LLC. We do not obtain collateral to support the agreements but monitor the financial viability of our counterparty and believe the credit risk is minimal. We continuously reevaluate our derivative arrangements in light of market conditions, commodity price forecasts, capital spending and debt service requirements. We do not enter into derivative transactions for trading purposes.
Fixed price swaps typically require monthly payments by us (if prices rise) or provide payments to us (if prices fall) based on the difference between the strike price and the agreed-upon average of either New York Mercantile Exchange, or NYMEX, or other widely recognized index prices. Currently, all of our derivative arrangements are settled based on NYMEX pricing.
Collar contracts set a minimum price, or floor, and a maximum price, or ceiling, and provide payments to us if the NYMEX price falls below the floor or require payments by us if the NYMEX price rises above the ceiling.
Puts provide payment to us if the NYMEX price falls below the strike price. If the NYMEX price is above the strike price, we have no payment obligation.
F-17
ASCENT ENERGY INC.
NOTES TO CONSOLIDATED FINANCIAL STATEMENTS—(Continued)
(Information as of June 30, 2006 and for the six months ended June 30, 2005
and June 30, 2006 is unaudited)
Currently, our natural gas contracts settle using the near-month NYMEX prices for the next to last trading day or the last trading day of the month. Our crude oil contracts settle using the average of the near month closing price for each day of the month.
In connection with our July 2004 financial restructuring, Fortis Energy LLC assumed our then existing derivative arrangements, which we refer to as the old derivative arrangements, and replaced them with new derivative arrangements. As of that date, we had a $4.0 million liability under our old derivative arrangements representing a deferred loss which was recognized on the balance sheet as a current asset and a corresponding derivative liability. The deferred loss was amortized monthly into earnings over the related contract periods, which were August 2004 through December 2004 and settlement of the liability will occur monthly through June 2007 as the new derivative arrangements are settled. The old derivative arrangements qualified for hedge accounting treatment; therefore, amortization of the deferred loss was recognized in gas sales.
The new derivative arrangements were not designated as hedges under SFAS 133; therefore, changes in fair market value and realized losses related to the new derivative arrangements are required to be reported in current earnings.
As of December 31, 2005, the fair market value of our derivative arrangements was a liability of $28.5 million, which included the remaining liability of $1.6 million related to the deferred loss on the old derivative arrangements. The fair market values of our derivative arrangements as of December 31, 2005 are reflected on our balance sheet in current liabilities (fair value of derivatives) in the amount of $11.5 million and in long-term liabilities (fair value of derivatives) in the amount of $17.0 million.
As of December 31, 2005 our natural gas and oil derivative arrangements were as follows:
| | | | | | | | | | | | | | |
Natural Gas (MMBtus) | | Quantity | | Ceiling | | Floor | | Fixed
Price | | Put |
2006 | | | | | | | | | | | | | | |
January 1, 2006 to March 31, 2006 | | 384,300 | | $ | 7.00 | | $ | 5.50 | | | — | | | — |
January 1, 2006 to March 31, 2006 | | 180,000 | | $ | 10.50 | | $ | 7.00 | | | — | | | — |
April 1, 2006 to October 31, 2006 | | 714,760 | | | — | | | — | | $ | 7.26 | | | — |
April 1, 2006 to October 31, 2006 | | 121,268 | | $ | 8.20 | | $ | 5.00 | | | — | | | — |
April 1, 2006 to October 31, 2006 | | 242,532 | | | — | | | — | | | — | | $ | 5.00 |
November 1, 2006 to December 31, 2006 | | 176,290 | | $ | 6.75 | | $ | 4.65 | | | — | | | — |
November 1, 2006 to December 31, 2006 | | 92,720 | | $ | 10.25 | | $ | 5.50 | | | — | | | — |
| | | | | |
2007 | | | | | | | | | | | | | | |
January 1, 2007 to March 31, 2007 | | 260,100 | | $ | 6.75 | | $ | 4.65 | | | — | | | — |
January 1, 2007 to June 30, 2007 | | 275,120 | | $ | 10.25 | | $ | 5.50 | | | — | | | — |
April 1, 2007 to June 30, 2007 | | 234,780 | | | — | | | — | | $ | 7.26 | | | — |
July 1, 2007 to December 31, 2007 | | 920,000 | | $ | 9.05 | | $ | 5.00 | | | — | | | — |
| | | | | |
2008 | | | | | | | | | | | | | | |
January 1, 2008 to December 31, 2008 | | 1,460,000 | | $ | 9.05 | | $ | 5.00 | | | — | | | — |
| | | | | |
2009 | | | | | | | | | | | | | | |
January 1, 2009 to June 30, 2009 | | 543,000 | | $ | 9.05 | | $ | 5.00 | | | — | | | — |
| | | | | | | | | | | | | | |
Total | | 5,604,870 | | | | | | | | | | | | |
| | | | | | | | | | | | | | |
F-18
ASCENT ENERGY INC.
NOTES TO CONSOLIDATED FINANCIAL STATEMENTS—(Continued)
(Information as of June 30, 2006 and for the six months ended June 30, 2005
and June 30, 2006 is unaudited)
| | | | | | | | | | | | | |
Oil (Bbls) | | Quantity | | Ceiling | | Floor | | Fixed
Price | | Put |
2006 | | | | | | | | | | | | | |
January 1, 2006 to March 31, 2006 | | 9,000 | | | — | | | — | | $ | 42.70 | | — |
January 1, 2006 to August 31, 2006 | | 26,580 | | $ | 60.50 | | $ | 50.00 | | | — | | — |
April 1, 2006 to June 30, 2006 | | 9,100 | | | — | | | — | | $ | 41.60 | | — |
January 1, 2006 to December 31, 2006 | | 310,250 | | | — | | | — | | $ | 44.95 | | — |
| | | | | |
2007 | | | | | | | | | | | | | |
January 1, 2007 to June 30, 2007 | | 25,010 | | $ | 56.50 | | $ | 47.00 | | | — | | — |
January 1, 2007 to June 30, 2007 | �� | 135,750 | | | — | | | — | | $ | 44.95 | | — |
July 1, 2007 to December 31, 2007 | | 147,200 | | $ | 50.00 | | $ | 42.50 | | | — | | — |
| | | | | |
2008 | | | | | | | | | | | | | |
January 1, 2008 to December 31, 2008 | | 255,500 | | $ | 50.00 | | $ | 42.50 | | | — | | — |
| | | | | |
2009 | | | | | | | | | | | | | |
January 1, 2009 to June 30, 2009 | | 108,600 | | $ | 50.00 | | $ | 42.50 | | | — | | — |
| | | | | | | | | | | | | |
Total | | 1,026,990 | | | | | | | | | | | |
| | | | | | | | | | | | | |
As of June 30, 2006, the fair market value of our natural gas and oil derivative arrangements was a liability of $30.6 million, which includes the remaining liability of $1.1 million related to the deferred loss on the old derivative arrangements. The fair market values of our derivative arrangements as of June 30, 2006 are reflected on our balance sheet in current assets (fair value of derivatives) in the amount of $0.7 million, in other assets (fair value of derivatives) in the amount of $0.02 million, in current liabilities (fair value of derivatives) in the amount of $13.2 million and in long-term liabilities (fair value of derivatives) in the amount of $18.1 million.
As of June 30, 2006 our natural gas and oil derivative arrangements were as follows:
| | | | | | | | | | | | | | |
Natural Gas (MMBtus) | | Quantity | | Ceiling | | Floor | | Fixed
Price | | Put |
2006 | | | | | | | | | | | | | | |
July 1, 2006 to October 31, 2006 | | 410,820 | | | — | | | — | | $ | 7.26 | | | — |
July 1, 2006 to October 31, 2006 | | 69,741 | | $ | 8.20 | | $ | 5.00 | | | — | | | — |
July 1, 2006 to October 31, 2006 | | 139,359 | | | — | | | — | | | — | | $ | 5.00 |
July 1, 2006 to October 31, 2006 | | 503,894 | | $ | 8.05 | | $ | 6.25 | | | — | | | — |
November 1, 2006 to December 31, 2006 | | 246,986 | | $ | 13.65 | | $ | 8.00 | | | — | | | — |
November 1, 2006 to December 31, 2006 | | 176,290 | | $ | 6.75 | | $ | 4.65 | | | — | | | — |
November 1, 2006 to December 31, 2006 | | 92,720 | | $ | 10.25 | | $ | 5.50 | | | — | | | — |
2007 | | | | | | | | | | | | | | |
January 1, 2007 to March 31, 2007 | | 260,100 | | $ | 6.75 | | $ | 4.65 | | | — | | | — |
January 1, 2007 to June 30, 2007 | | 275,120 | | $ | 10.25 | | $ | 5.50 | | | — | | | — |
January 1, 2007 to March 31, 2007 | | 315,912 | | $ | 13.65 | | $ | 8.00 | | | — | | | — |
April 1, 2007 to June 30, 2007 | | 234,780 | | | — | | | — | | $ | 7.26 | | | — |
April 1, 2007 to October 31, 2007 | | 509,999 | | $ | 10.95 | | $ | 7.00 | | | — | | | — |
July 1, 2007 to December 31, 2007 | | 920,000 | | $ | 9.05 | | $ | 5.00 | | | — | | | — |
November 1, 2007 to December 31, 2007 | | 78,436 | | $ | 13.95 | | $ | 8.00 | | | — | | | — |
F-19
ASCENT ENERGY INC.
NOTES TO CONSOLIDATED FINANCIAL STATEMENTS—(Continued)
(Information as of June 30, 2006 and for the six months ended June 30, 2005
and June 30, 2006 is unaudited)
| | | | | | | | | | | | | |
Natural Gas (MMBtus) | | Quantity | | Ceiling | | Floor | | Fixed Price | | Put |
2008 | | | | | | | | | | | | | |
January 1, 2008 to March 31, 2008 | | 179,230 | | $ | 13.95 | | $ | 8.00 | | | — | | — |
January 1, 2008 to December 31, 2008 | | 1,460,000 | | $ | 9.05 | | $ | 5.00 | | | — | | — |
April 1, 2008 to October 31, 2008 | | 298,551 | | $ | 9.60 | | $ | 7.00 | | | — | | — |
November 1, 2008 to December 31, 2008 | | 56,808 | | $ | 12.25 | | $ | 8.00 | | | — | | — |
2009 | | | | | | | | | | | | | |
January 1, 2009 to March 31, 2009 | | 154,402 | | $ | 12.25 | | $ | 8.00 | | | — | | — |
January 1, 2009 to June 30, 2009 | | 543,000 | | $ | 9.05 | | $ | 5.00 | | | — | | — |
April 1, 2009 to October 31, 2009 | | 647,304 | | $ | 8.55 | | $ | 6.75 | | | — | | — |
| | | | | | | | | | | | | |
Total | | 7,573,452 | | | | | | | | | | | |
| | | | | | | | | | | | | |
| | | | | |
Oil (Bbls) | | Quantity | | Ceiling | | Floor | | Fixed Price | | Put |
2006 | | | | | | | | | | | | | |
July 1, 2006 to August 31, 2006 | | 3,410 | | $ | 60.50 | | $ | 50.00 | | | — | | — |
July 1, 2006 to December 31, 2006 | | 77,675 | | | — | | | — | | $ | 61.56 to $64.68 | | — |
July 1, 2006 to December 31, 2006 | | 156,400 | | | — | | | — | | $ | 44.95 | | — |
| | | | | |
2007 | | | | | | | | | | | | | |
January 1, 2007 to June 30, 2007 | | 25,010 | | $ | 56.50 | | $ | 47.00 | | | — | | — |
January 1, 2007 to June 30, 2007 | | 135,750 | | | — | | | — | | $ | 44.95 | | — |
January 1, 2007 to December 31, 2007 | | 105,725 | | | — | | | — | | $ | 64.80 to $65.03 | | — |
July 1, 2007 to December 31, 2007 | | 147,200 | | $ | 50.00 | | $ | 42.50 | | | — | | — |
| | | | | |
2008 | | | | | | | | | | | | | |
January 1, 2008 to December 31, 2008 | | 255,500 | | $ | 50.00 | | $ | 42.50 | | | — | | — |
January 1, 2008 to December 31, 2008 | | 101,960 | | | — | | | — | | $ | 64.00 to $64.74 | | — |
| | | | | |
2009 | | | | | | | | | | | | | |
January 1, 2009 to June 30, 2009 | | 108,600 | | $ | 50.00 | | $ | 42.50 | | | — | | — |
January 1, 2009 to October 31, 2009 | | 154,328 | | | — | | | — | | $ | 63.37 to $63.94 | | — |
| | | | | | | | | | | | | |
Total | | 1,271,558 | | | | | | | | | | | |
| | | | | | | | | | | | | |
F-20
ASCENT ENERGY INC.
NOTES TO CONSOLIDATED FINANCIAL STATEMENTS—(Continued)
(Information as of June 30, 2006 and for the six months ended June 30, 2005
and June 30, 2006 is unaudited)
The following table shows the effect of our natural gas and oil derivative instruments on our consolidated income statements for the periods presented (in thousands) (quarterly amounts are unaudited):
| | | | | | | | | | | | | | | | | | | | | | | | | | | |
| | | Natural Gas and Oil Derivatives Designated as Hedges | | | Natural Gas and Oil Derivatives Not Designated as Hedges | |
| | | Cash
Settlements (1) | | | Amortization (2) | | | Reduction in
Oil and Gas
Sales (3) | | | Cash
Settlements (1) | | | Amortization of
Old Derivative
Arrangements (4) | | Unrealized
Gains
(Losses) | | | Derivative
Loss (5) | |
2003 | | | | | | | | | | | | | | | | | | | | |
1st Quarter | | $ | (3,962 | ) | | $ | (122 | ) | | $ | (4,084 | ) | | $ | — | | | $ | — | | $ | — | | | $ | — | |
2nd Quarter | | | (2,941 | ) | | | (122 | ) | | | (3,063 | ) | | | — | | | | — | | | — | | | | — | |
3rd Quarter | | | (2,461 | ) | | | (122 | ) | | | (2,583 | ) | | | — | | | | — | | | — | | | | — | |
4th Quarter | | | (2,213 | ) | | | (6 | ) | | | (2,219 | ) | | | — | | | | — | | | — | | | | — | |
| | | | | | | | | | | | | | | | | | | | | | | | | | | |
Total | | $ | (11,577 | ) | | $ | (372 | ) | | $ | (11,949 | ) | | $ | — | | | $ | — | | $ | — | | | $ | — | |
| | | | | | | | | | | | | | | | | | | | | | | | | | | |
2004 | | | | | | | | | | | | | | | | | | | | |
1st Quarter | | $ | (1,645 | ) | | $ | — | | | $ | (1,645 | ) | | $ | — | | | $ | — | | $ | — | | | $ | — | |
2nd Quarter | | | (2,168 | ) | | | — | | | | (2,168 | ) | | | — | | | | — | | | — | | | | — | |
3rd Quarter | | | (775 | ) | | | (1,484 | ) | | | (2,259 | ) | | | (973 | ) | | | 411 | | | (7,537 | ) | | | (8,099 | ) |
4th Quarter | | | — | | | | (2,474 | ) | | | (2,474 | ) | | | (1,858 | ) | | | 407 | | | 2,946 | | | | 1,495 | |
| | | | | | | | | | | | | | | | | | | | | | | | | | | |
Total | | $ | (4,588 | ) | | $ | (3,958 | ) | | $ | (8,546 | ) | | $ | (2,831 | ) | | $ | 818 | | $ | (4,591 | ) | | $ | (6,604 | ) |
| | | | | | | | | | | | | | | | | | | | | | | | | | | |
2005 | | | | | | | | | | | | | | | | | | | | |
1st Quarter | | $ | — | | | $ | — | | | $ | — | | | $ | (1,481 | ) | | $ | 254 | | $ | (15,062 | ) | | $ | (16,289 | ) |
2nd Quarter | | | — | | | | — | | | | — | | | | (2,494 | ) | | | 469 | | | 332 | | | | (1,693 | ) |
3rd Quarter | | | — | | | | — | | | | — | | | | (4,654 | ) | | | 475 | | | (15,038 | ) | | | (19,217 | ) |
4th Quarter | | | — | | | | — | | | | — | | | | (4,779 | ) | | | 332 | | | 7,457 | | | | 3,010 | |
| | | | | | | | | | | | | | | | | | | | | | | | | | | |
Total | | $ | — | | | $ | — | | | $ | — | | | $ | (13,408 | ) | | $ | 1,530 | | $ | (22,311 | ) | | $ | (34,189 | ) |
| | | | | | | | | | | | | | | | | | | | | | | | | | | |
2006 | | | | | | | | | | | | | | | | | | | | |
1st Quarter | | $ | — | | | $ | ��� | | | $ | — | | | $ | (2,423 | ) | | $ | 206 | | $ | (966 | ) | | $ | (3,183 | ) |
2nd Quarter | | | — | | | | — | | | | — | | | | (2,430 | ) | | | 339 | | | (1,706 | ) | | | (3,797 | ) |
| | | | | | | | | | | | | | | | | | | | | | | | | | | |
Total | | $ | — | | | $ | — | | | $ | — | | | $ | (4,853 | ) | | $ | 545 | | $ | (2,672 | ) | | $ | (6,980 | ) |
| | | | | | | | | | | | | | | | | | | | | | | | | | | |
| (1) | Cash settlements of derivative arrangements are included in net cash provided by operating activities. |
| (2) | Amortization during 2003 relates to premium on oil put options. Amortization during 2004 relates to deferred loss under old derivative arrangements. |
| (3) | The ineffectiveness of these hedges was tested and determined to be immaterial. |
| (4) | Amortization relates to cash settlement of old derivative arrangements which qualified as hedges and were expensed in the prior year as a reduction of oil and natural gas sales. The amortization period for settlement of old derivative arrangements extends through June 2007. |
| (5) | Derivative loss for the year ended December 31, 2005 includes a $34.2 million loss on natural gas and oil derivatives and a $0.4 million gain on interest rate derivatives. Derivative loss for the quarter ended March 31, 2006 includes a $3.2 million loss on natural gas and oil derivatives and a $0.2 million gain on interest rate derivatives. Derivative loss for the quarter ended June 30, 2006 includes a $3.8 million loss on natural gas and oil derivatives and a $0.1 million gain on interest rate derivatives. |
F-21
ASCENT ENERGY INC.
NOTES TO CONSOLIDATED FINANCIAL STATEMENTS—(Continued)
(Information as of June 30, 2006 and for the six months ended June 30, 2005
and June 30, 2006 is unaudited)
Interest Rate Derivatives. As of December 31, 2005 and June 30, 2006, we had outstanding $49.7 million and $68.2 million, respectively, of floating-rate debt attributable to borrowings under our bank credit facility. As a result, our interest expense fluctuates based on changes in short-term interest rates.
We enter into derivative transactions to secure a fixed interest rate for a portion of our debt under the bank credit facility. The primary objective of these transactions is to reduce our exposure to the possibility of rising interest rates during the term of the derivative transactions. We currently use fixed rate interest swaps for these purposes. Fixed rate interest swaps are not designated as hedges; therefore, gains and losses resulting from these derivative arrangements are reported as they occur as Derivative Loss in our consolidated statements of operations. We do not enter into derivative transactions for trading purposes.
Our fixed rate interest swaps typically provide monthly payments to us (if rates rise) or by us (if rates fall) based on the difference between the strike price and the British Bankers’ Association London Interbank Offered Rate, or the LIBOR. All of the Company’s fixed rate interest swaps are with affiliates of the financial institutions that are parties to our bank credit facility.
As of December 31, 2005, we had fixed rate interest swaps for $30.0 million per day for the period January 1, 2006 through July 27, 2007 at a fixed rate of 3.98%. At December 31, 2005, we had realized losses of $0.03 million and the fair market values of our interest rate derivative instruments was a net unrealized receivable of $0.4 million which is reflected on our balance sheet in current assets (fair value of derivatives) in the amount of $0.2 million and in other assets (fair value of derivatives) in the amount of $0.1 million.
As of June 30, 2006, we had fixed rate interest swaps for $30.0 million per day for the period July 1, 2006 through July 27, 2007 at a fixed rate of 3.98%. As of June 30, 2006, the fair market value of these arrangements was a net unrealized receivable of $546,000 million, of which $513,000 million was recorded on our balance sheet as a current assets (fair value of derivatives) and $33,000 million of which was recorded on our balance sheet as an other asset (fair value of derivatives).
4. LONG-TERM DEBT
We had the following long-term debt and long-term accrued interest outstanding as of the dates presented:
| | | | | | | | | |
| | | As of December 31, | | As of June 30, |
| | | 2004 | | 2005 | | 2006 |
| | | (in thousands) |
Bank credit facility | | $ | 45,265 | | $ | 49,715 | | $ | 68,215 |
Senior notes | | | 28,612 | | | 33,492 | | | 36,053 |
Senior subordinated notes | | | 88,579 | | | 99,552 | | | 105,141 |
Interest payable | | | 2,498 | | | 2,464 | | | 2,843 |
| | | | | | | | | |
| | $ | 164,954 | | $ | 185,223 | | $ | 212,252 |
| | | | | | | | | |
F-22
ASCENT ENERGY INC.
NOTES TO CONSOLIDATED FINANCIAL STATEMENTS—(Continued)
(Information as of June 30, 2006 and for the six months ended June 30, 2005
and June 30, 2006 is unaudited)
Following is the principal maturity schedule for the long-term debt and long-term accrued interest outstanding as of December 31, 2005 assuming no extension of the maturing date of notes (in thousands):
| | | |
2006 | | $ | — |
2007 | | | — |
2008 | | | — |
2009 | | | 49,715 |
2010 | | | 135,508 |
| | | |
| | $ | 185,223 |
| | | |
Bank Credit Facility. On July 27, 2004, we completed a financial restructuring that permitted the operating subsidiaries of Ascent Energy Inc., as borrowers, to enter into a new bank credit facility with a new group of bank lenders. In connection with our financial restructuring, we reorganized as a holding company by transferring all of our natural gas and oil operations to certain operating subsidiaries of Ascent Energy Inc.
Our bank credit facility provides for a borrowing base to finance our future acquisition opportunities and to assist in meeting our working capital requirements. Our lenders periodically re-determine our borrowing base by applying criteria similar to those used with similarly situated natural gas and oil borrowers. Subject to our borrowing base limitation of $70 million, our bank credit facility provided for borrowings of up to $105.0 million as of December 31, 2005, which included a $100.0 million revolving credit facility and a $5.0 million acquisition facility. Borrowings under our revolving credit facility mature on November 1, 2009. As of December 31, 2005, we had $15.1 million available under our revolving credit facility and $5.0 million available under our acquisition facility. During May 2006, our lenders increased our borrowing base limit from $70.0 million to $80 million and increased our acquisition facility from $5.0 million to $15.0 million. As of June 30, 2006, we had $11.6 million available under our revolving credit facility and $15.0 million available under our acquisition facility.
Our bank credit facility provides for interest periods of one, two, three or six months for LIBOR loans. We can also elect to pay interest at a base rate calculated by reference to the higher of the federal funds rate or The Chase Manhattan Bank’s prime rate. In the case of either LIBOR loans or base rate loans, we are required to pay an additional interest rate margin that varies with the aggregate amount of loans and letters of credit outstanding under the line of credit. Additionally, we are required to pay commitment fees that range from 0.375% to 0.5% on our unused borrowings. Our interest rate as of December 31, 2005 and June 30, 2006 was 7.64% and 8.62%, respectively.
Our Parent and each operating subsidiary of Ascent Energy Inc. are borrowers under our credit facility. Ascent Energy Inc. is not a borrower under our bank credit facility, but is a party thereto and subject to certain restrictions thereunder. The stock of Ascent Oil and Gas Inc., which is the only direct wholly owned subsidiary of Ascent Energy Inc. that holds any assets, and substantially all of the assets of the subsidiaries of Ascent Energy Inc. are pledged to our lenders to secure the obligations of our operating subsidiaries under our bank credit facility.
We are subject to various financial and other covenants, and are required to maintain specified ratios, under our bank credit facility. As of December 31, 2005, and June 30, 2006 we were in compliance with all covenants and ratios.
Our bank credit facility prohibits the subsidiaries of Ascent Energy Inc. from paying any cash dividends or cash redemptions or making any other cash distributions to Ascent Energy Inc. prior to July 27, 2006, and thereafter such cash dividends, redemptions, and distributions may be made only under certain circumstances.
F-23
ASCENT ENERGY INC.
NOTES TO CONSOLIDATED FINANCIAL STATEMENTS—(Continued)
(Information as of June 30, 2006 and for the six months ended June 30, 2005
and June 30, 2006 is unaudited)
We paid approximately $0.8 million of deferred financing costs in July 2004 in connection with our entering into the bank credit facility and approximately $0.3 million of deferred financing costs during the year ended December 31, 2005 in connection with amendments to our bank credit facility. These costs are being amortized on a straight-line basis over the life of the bank credit facility. During the years ended December 31, 2004 and December 31, 2005, we recognized $0.1 million and $0.2 million, respectively, of interest expense related to the amortization of deferred financing costs associated with our bank credit facility.
Senior Notes. On November 9, 2005, Ascent Energy Inc. issued approximately $33.5 million aggregate principal amount of its 16% Senior Notes due February 1, 2010 (or such later date as automatically extended in accordance with the terms of the notes, but in no event later than February 1, 2015) in exchange for all then outstanding principal and accrued but unpaid interest on its 16% Senior Notes due October 26, 2007, which we refer to as the old senior notes. The old senior notes were issued on July 27, 2004 in connection with our financial restructuring in exchange for all then outstanding principal and accrued but unpaid interest on certain promissory notes that Ascent Energy Inc. had issued during 2003 for short-term liquidity needs.
The senior notes are senior unsecured obligations and are not guaranteed by any of our subsidiaries. The senior notes are effectively subordinated to all indebtedness and other liabilities of our subsidiaries, including indebtedness under our bank credit facility. Interest on the senior notes accrues at a rate of 16% per annum and is payable semi-annually, in the form of additional senior notes. On April 30, 2006, we paid the accrued interest on the senior notes by issuing an additional $2.6 million in senior notes.
During each of the years 2006 through 2010, each holder of senior notes has the right, during the 30-day period beginning on September 1 of each such year, to deliver written notice to us rejecting any further extension of the maturity date of such holder’s senior notes. If the holder fails to deliver such notice on a timely basis, the maturity date of such holder’s senior notes will be automatically extended by one calendar year from the then applicable maturity date. Any senior notes that are the subject of a timely delivered notice will become due and payable at the then applicable maturity date. Upon maturity of the senior notes we must secure alternative financing arrangements in order to satisfy the maturing debt and accrued interest.
As of December 31, 2005 and June 30, 2006, we had outstanding $33.5 million and $36.1 million of indebtedness, respectively, under our senior notes and $0.8 million and $0.9 million of accrued interest, respectively.
Senior Subordinated Notes.On November 9, 2005, Ascent Energy Inc. issued approximately $99.6 million aggregate principal amount of its 11 3/4% Senior Subordinated Notes due May 1, 2010 (or such later date as automatically extended in accordance with the terms of the notes, but in no event later than May 1, 2015) in exchange for all then outstanding principal and accrued but unpaid interest on its 11 3/4% Senior Subordinated Notes due 2008, which we refer to as the old senior subordinated notes. The old senior subordinated notes were issued on July 27, 2004 in connection with our financial restructuring in exchange for all then outstanding principal and accrued but unpaid interest on its 11 3/4% Series A Senior Notes due 2006 which were originally issued on June 28, 2001 in connection with our acquisition of our south Texas properties.
The senior subordinated notes are senior subordinated unsecured obligations and are not guaranteed by any of our subsidiaries. The senior subordinated notes are subordinate in right of payment to the senior notes and are effectively subordinated to all indebtedness and other liabilities of our subsidiaries, including indebtedness under our bank credit facility. Interest on the senior subordinated notes accrues at a rate of 11 3/4% per annum and is payable semi-annually in the form of additional senior subordinated notes. On April 30, 2006, we paid the accrued interest on the senior subordinated notes by issuing an additional $5.6 million in senior subordinated notes.
F-24
ASCENT ENERGY INC.
NOTES TO CONSOLIDATED FINANCIAL STATEMENTS—(Continued)
(Information as of June 30, 2006 and for the six months ended June 30, 2005
and June 30, 2006 is unaudited)
During each of the years 2006 through 2010, each holder of senior subordinated notes has the right, during a 30-day period beginning on July 15 of each such year, to deliver written notice to us rejecting any further extension of the maturity date of such holder’s senior subordinated notes. If the holder fails to deliver such notice on a timely basis, the maturity date of such holder’s senior subordinated notes will be automatically extended by one calendar year from the then applicable maturity date. Any senior subordinated notes that are the subject of a timely delivered notice will become due and payable at the then applicable maturity date. Upon maturity of the senior subordinated notes we must secure alternative financing arrangements in order to satisfy the maturing debt and accrued interest.
As of December 31, 2005 and June 30, 2006, we had outstanding $99.6 million and $105.1 million of indebtedness, respectively, under our senior subordinated notes and $1.7 million and $2.1 million of accrued interest, respectively.
8% Series A Preferred Stock and Warrants. As of December 31, 2005 and June 30, 2006, we had outstanding 41,100 shares of our Series A preferred stock and warrants to purchase 3,000 shares of our Series A preferred stock at an exercise price of $333.33 per share. Dividends on our Series A preferred stock accrue at the rate of 8% per annum. Accrued but unpaid dividends do not bear interest. Our board of directors has never declared or paid any dividends on the outstanding shares of Series A preferred stock. Each outstanding share of Series A preferred stock, and each share issuable upon exercise of the warrants described above, was or will be issued with a warrant to purchase 191.943 shares of our common stock at an exercise price of $5.21 per share. As of December 31, 2005 and June 30, 2006, we had outstanding warrants to purchase 7,888,858 shares of our common stock and had reserved for issuance warrants to purchase 575,829 shares of our common stock. All of our warrants are, or will be, exercisable on the date of issue.
During December 2004, the terms of our Series A preferred stock were amended to eliminate our requirement to redeem the outstanding shares on a specified date, among other things. The amendment resulted in a balance sheet reclassification of the book value of the Series A preferred stock to stockholders’ deficit. Accrued but unpaid dividends on the Series A preferred stock are reflected as a liability on our balance sheet.
So long as the Series A preferred stock is outstanding, the warrants to purchase common stock must be exercised by tendering shares of Series A preferred stock. The fair value of the warrants to purchase common stock is reflected as an increase in additional paid-in capital and as a reduction of the Series A preferred stock. This value of approximately $299,000 will be accreted through Series A preferred stock dividends. For each quarter during the years ended December 31, 2004 and December 31, 2005, approximately $17,000 was accreted as Series A preferred stock dividends.
If dividends are paid in respect of our common stock (other than dividends payable in common stock or in other securities or rights convertible into or exchangeable for common stock), the holders of our Series A preferred stock are entitled to participate with the holders of our common stock in the receipt of such dividends on a pro-rata basis based on the number of shares of common stock held by each holder assuming that each share of Series A preferred stock has been exchanged for a number of shares of common stock determined by dividing $1,000 by the then current exercise price of our warrants to purchase common stock. In addition, upon any voluntary or involuntary liquidation, winding up or dissolution of Ascent Energy Inc., the holders of our Series A preferred stock are entitled to receive, in preference to any payment or distribution to the holders of our commonstock or any of our securities ranking junior to the Series A preferred stock, the greater of (i) $1,000 per share of Series A preferred stock plus all accrued but unpaid dividends thereon and (ii) the sum of (A) the amount such holders would have received had each share of Series A preferred stock been exchanged for a number of shares
F-25
ASCENT ENERGY INC.
NOTES TO CONSOLIDATED FINANCIAL STATEMENTS—(Continued)
(Information as of June 30, 2006 and for the six months ended June 30, 2005
and June 30, 2006 is unaudited)
of common stock determined by dividing $1,000 by the then current exercise price of our warrants to purchase common stock and such holders participated with the holders of our common stock, on a pro rata basis, in the distribution of our assets and (B) all accrued but unpaid dividends on each such share of Series A preferred stock. As of December 31, 2005 and June 30, 2006, the exercise price of our warrants to purchase common stock was $5.21 per share.
8% Series B Convertible Preferred Stock.We issued 5,323,695 shares of our Series B preferred stock to the former holders of Pontotoc in connection with our acquisition of Pontotoc in August 2001. On or about August 14, 2003, each outstanding share of our Series B preferred stock converted automatically into 0.1878395 shares of our common stock, or an aggregate of 1,000,000 shares, and we paid cash dividends of $0.40 per share of Series B preferred stock, or an aggregate of $2.1 million in cash dividends.
5. STOCK COMPENSATION
2002 Stock Option Plan. We previously had outstanding options to purchase shares of our common stock issued pursuant to the Ascent Energy Inc. 2002 Stock Incentive Plan. On May 20, 2005, we terminated the 2002Stock Incentive Plan; and, in connection therewith, each holder of options surrendered his or her options in exchange for awards under our 2005 Incentive Plan.
Options granted under the 2002 Stock Incentive Plan were non-qualified stock options with terms of ten years from the date of grant. Granted stock options vested over a five-year period at the rate of 20% per year or over a three-year period at the rate of 33 1/3% per year, in each case commencing on the first anniversary of the date of grant. A maximum of 1,500,000 shares of common stock were reserved for issuance under the 2002 Stock Option Plan.
Set forth below is a summary of stock option grants under our 2002 Stock Option Plan:
| | | | | | | | | | | | | | | | | | | | | | | | |
| | | 2003 | | 2004 | | 2005 | | Six Months Ended
June 30, 2005 |
| | | Shares | | | Weighted
Average
Exercise
Price | | Shares | | | Weighted
Average
Exercise
Price | | Shares | | | Weighted
Average
Exercise
Price | | Shares | | | Weighted
Average
Exercise
Price |
Outstanding at beginning of year | | 1,150,000 | | | $ | 5.21 | | 1,516,320 | | | $ | 5.21 | | 1,054,120 | | | $ | 5.21 | | 1,054,120 | | | $ | 5.21 |
Granted | | 585,000 | | | | 5.21 | | — | | | | — | | — | | | | — | | — | | | | — |
Exercised | | — | | | | — | | — | | | | — | | — | | | | — | | — | | | | — |
Cancelled | | — | | | | — | | — | | | | — | | (1,054,120 | ) | | | 5.21 | | (1,054,120 | ) | | | 5.21 |
Forfeited | | (218,680 | ) | | | 5.21 | | (462,200 | ) | | | 5.21 | | — | | | | — | | — | | | | — |
| | | | | | | | | | | | | | | | | | | | | | | | |
Outstanding at end of year | | 1,516,320 | | | $ | 5.21 | | 1,054,120 | | | $ | 5.21 | | — | | | | — | | — | | | | — |
| | | | | | | | | | | | | | | | | | | | | | | | |
Options exercisable at period-end | | 501,997 | | | $ | 5.21 | | 461,928 | | | $ | 5.21 | | — | | | | — | | — | | | | — |
Weighted-average fair value of options granted during the year | | — | | | | — | | — | | | | — | | — | | | | — | | — | | | | — |
F-26
ASCENT ENERGY INC.
NOTES TO CONSOLIDATED FINANCIAL STATEMENTS—(Continued)
(Information as of June 30, 2006 and for the six months ended June 30, 2005
and June 30, 2006 is unaudited)
The following table summarizes relevant information about our reported results under the intrinsic method of accounting for stock awards with supplemental pro forma information as if the fair value recognition provision of SFAS 123 had been applied (in thousands, except per share data):
| | | | | | | | | | | | | | | | | | |
| | | | | Year Ended December 31, | | | Six Months
Ended
June 30, | |
| | | | | 2003 | | | 2004 | | | 2005 | | | 2005 | |
| | | | | (Restated) | | | (Restated) | | | | | | (Unaudited) | |
Net loss available to common | | As reported | | $ | (19,368 | ) | | $ | (39,698 | ) | | $ | (31,206 | ) | | $ | (18,547 | ) |
| | Pro forma | | $ | (19,588 | ) | | $ | (39,890 | ) | | $ | (31,304 | ) | | $ | (18,646 | ) |
Basic and diluted loss per share | | As reported | | $ | (3.63 | ) | | $ | (6.67 | ) | | $ | (5.25 | ) | | $ | (3.12 | ) |
| | Pro forma | | $ | (3.67 | ) | | $ | (6.71 | ) | | $ | (5.26 | ) | | $ | (3.13 | ) |
Weighted average shares used in computation: | | | | | | | | | | | | | | | | | | |
Basic and diluted | | | | | 5,334 | | | | 5,949 | | | | 5,949 | | | | 5,949 | |
As required, the pro-forma disclosures above include options granted since March 6, 2002 through the date of cancellation. For purposes of pro-forma disclosures, the estimated fair value of stock-based compensation and other options was amortized to expense primarily over the vesting period.
The fair value of each option grant for the year ended December 31, 2003 is estimated on the date of grant using the Black-Scholes option-pricing model with the following weighted average assumptions:
| | | |
Expected life (years) | | 6 | |
Interest rate | | 3.37 | % |
Volatility | | 0 | % |
Dividend yield | | 0 | % |
6. INCOME TAXES
The provision (benefit) for income taxes for the periods presented consisted of the following (in thousands):
| | | | | | | | | | | | |
| | | Years Ended December 31, | |
| | | 2003 | | | 2004 | | | 2005 | |
| | | (Restated) | | | (Restated) | | | | |
Current: | | | | | | | | | | | | |
Federal | | $ | — | | | $ | — | | | $ | — | |
State | | | — | | | | 35 | | | | 98 | |
| | | | | | | | | | | | |
| | | — | | | | 35 | | | | 98 | |
| | | | | | | | | | | | |
Deferred: | | | | | | | | | | | | |
Federal | | | (8,675 | ) | | | (12,109 | ) | | | — | |
State | | | 51 | | | | (398 | ) | | | (307 | ) |
| | | | | | | | | | | | |
Total benefit | | $ | (8,624 | ) | | $ | (12,472 | ) | | $ | (209 | ) |
| | | | | | | | | | | | |
F-27
ASCENT ENERGY INC.
NOTES TO CONSOLIDATED FINANCIAL STATEMENTS—(Continued)
(Information as of June 30, 2006 and for the six months ended June 30, 2005
and June 30, 2006 is unaudited)
We had the following deferred tax assets and liabilities recorded as of the following dates (in thousands):
| | | | | | | | |
| | | December 31, | |
| | | 2004 | | | 2005 | |
| | | (Restated) | | | | |
Non Current Deferred Tax Assets: | | | | | | | | |
Accrued Compensation | | $ | 404 | | | $ | 320 | |
Bad Debts Reserved | | | — | | | | 60 | |
Hedge Gains(Losses) | | | 1,785 | | | | 10,258 | |
Accrued Retirement Obligations | | | 3,613 | | | | 4,114 | |
Accrued Contingent Liabilities | | | — | | | | 128 | |
Accrued Deferred Interest | | | — | | | | 708 | |
Percentage Depletion Carry forwards | | | 969 | | | | 1,354 | |
Net Operating Loss Carry forwards | | | 26,792 | | | | 32,308 | |
| | | | | | | | |
Non Current Deferred Tax Assets | | | 33,563 | | | | 49,250 | |
Valuation Allowance | | | (6,205 | ) | | | (15,993 | ) |
| | | | | | | | |
| | | 27,358 | | | | 33,257 | |
Non Current Deferred Tax Liabilities: | | | | | | | | |
Oil & Gas Properties | | | (29,486 | ) | | | (35,077 | ) |
Other | | | (44 | ) | | | (45 | ) |
| | | | | | | | |
Non Current Deferred Tax Liabilities | | | (29,530 | ) | | | (35,122 | ) |
| | | | | | | | |
Net Deferred Tax Liability | | $ | (2,172 | ) | | $ | (1,865 | ) |
| | | | | | | | |
Beginning in 2001, we established a valuation allowance which we increased periodically to reflect the uncertainty about the realization of the deferred tax asset. In 2005, we increased the valuation allowance by $9.8 million from $6.2 million to $16.0 million. During the first six months of 2006, we increased the valuation allowance of $16.0 million by an additional $0.9 million. These increases in our valuation allowance are based on uncertainty surrounding our ability to utilize the entire balance of our deferred tax assets based on an analysis of whether we are more likely than not to receive such a benefit and if so, to what extent.
The provision for income taxes (on loss before cumulative effect of change in accounting principle) at our effective tax rate differed from the provision for income taxes at the federal statutory rate as follows for the periods presented (in thousands):
| | | | | | | | | | | | |
| | | December 31, | |
| | | 2003 | | | 2004 | | | 2005 | |
| | | (Restated) | | | (Restated) | | | | |
Computed benefit at the expected federal statutory rate | | $ | (8,497 | ) | | $ | (17,081 | ) | | $ | (9,820 | ) |
State taxes | | | 51 | | | | (363 | ) | | | (210 | ) |
Permanent Differences: | | | | | | | | | | | | |
Interest on High Yield Debt Obligations Disallowed | | | — | | | | — | | | | 155 | |
Club Dues, Travel & Entertainment | | | 18 | | | | 11 | | | | 17 | |
Adjustments To Valuation Allowance (Federal Portion) | | | — | | | | 4,887 | | | | 9,647 | |
Other | | | (196 | ) | | | 74 | | | | 2 | |
| | | | | | | | | | | | |
Income tax benefit | | $ | (8,624 | ) | | $ | (12,472 | ) | | $ | (209 | ) |
| | | | | | | | | | | | |
Effective Tax Rate on Income Before Taxes | | | 35.5 | % | | | 25.6 | % | | | 0.8 | % |
| | | | | | | | | | | | |
F-28
ASCENT ENERGY INC.
NOTES TO CONSOLIDATED FINANCIAL STATEMENTS—(Continued)
(Information as of June 30, 2006 and for the six months ended June 30, 2005
and June 30, 2006 is unaudited)
The primary cause of differences between the effective tax rate and the statutory normal tax rate in years ended December 31, 2004 and 2005 respectively relate to changes in the valuation allowance accounting for rate differences of 9.73% and 33.40% for those years respectively. Items relating to the tax impacts of other adjustments accounted for rate differences of (0.81)%, 0.15% and 0.01% for the years ended December 31, 2003, 2004 and 2005 respectively.
As of December 31, 2005, we had a net loss carryforward of approximately $87.1 million that expires from 2021 through 2025.
7. COMMITMENTS AND CONTINGENCIES
Contractual Obligations.We lease office space and equipment under lease obligations classified as operating leases. Future commitments under these leases as of December 31, 2005 were as follows (in thousands):
| | | |
| | | Operating Leases |
2006 | | $ | 239 |
2007 | | | 429 |
2008 | | | 467 |
2009 | | | 435 |
2010 | | | 435 |
2011 and thereafter | | | 1,232 |
| | | |
| | $ | 3,237 |
| | | |
Rental expense under operating leases for the years ended December 31, 2003, December 31, 2004 and December 31, 2005 was approximately $0.5 million, $0.6 million and $0.7 million, respectively, and is recorded as general and administrative expense.
Contingent Liabilities. From time to time, we may be a party to various legal proceedings and regulatory matters arising in the ordinary course of business. Currently, we are a party to litigation arising in the ordinary course of business. While we cannot determine the ultimate liability with respect to all of these matters, management does not expect these matters to have a material adverse effect on our business, financial condition, results of operations or cash flows.
During 2005, we entered into employment agreements with our officers. The agreements initially provide for a term of three years. If the officer’s employment is terminated other than for cause (as defined in the agreement) or if the officer terminates his employment for good reason (as defined in the agreement), compensation will continue to be paid at the current rate of total compensation (as defined by the agreements) for the remaining term of the employment agreement and the officer will continue to be provided employee benefit plans offered by us for a period of time. These employment agreements generally provide for additional severance compensation based on the officer’s then current annual rate of total compensation (as defined by the agreements) in the event the officer’s employment is terminated without cause or is terminated by the officer with good reason within one year following a change in control. The additional severance compensation amount following a change of control varies by officer and ranges from 50% to 200% of total compensation. The employment agreements limit total compensation under the agreements, except for compensation under certain incentive plans, to 2.99 times the rate of total annual compensation of the officer.
F-29
ASCENT ENERGY INC.
NOTES TO CONSOLIDATED FINANCIAL STATEMENTS—(Continued)
(Information as of June 30, 2006 and for the six months ended June 30, 2005
and June 30, 2006 is unaudited)
In May 2005, we adopted the 2005 Incentive Plan to retain and attract key employees by awarding rights to certain employees to receive in the aggregate up to 13.5% of our enterprise value (defined by the 2005 Incentive Plan as the excess of the present value of the consideration payable in a sale over consolidated debt) upon a defined sale of us.
8. EMPLOYEE BENEFITS
We adopted a defined contribution retirement plan that complies with Section 401(k) of the Internal Revenue Code. Pursuant to the terms of the 401(k) Plan, all employees with at least three months of continuous service are eligible to participate and may contribute up to 70% of their annual compensation (subject to certain limitations). The 401(k) Plan provides that a discretionary match of employee contributions may be made by us in cash. For each of the years ended December 31, 2003, December 31, 2004 and December 31, 2005, we made aggregate matching contributions of approximately $0.2 million based upon each employee’s plan contributions for the respective plan year. These matching employer contributions are immediately fully vested to the employees. The amounts held under the 401(k) Plan are invested among various investment funds maintained under the 401(k) Plan in accordance with the directions of each participant. Employee contributions under the 401(k) Plan are 100% vested, and participants are entitled to payment of vested benefits upon termination of employment.
9. RELATED PARTY TRANSACTIONS
Senior Notes.We issued approximately $33.5 million aggregate principal amount of our senior notes on November 9, 2005 to Jefferies & Company, Inc. and certain of its affiliated funds and employees (“The Jefferies Investors”), all of which are our securityholders, and certain affiliated funds that we refer to as “The TCW Funds” in exchange for all then outstanding principal and accrued but unpaid interest on our 16% senior notes due October 26, 2007.
We issued approximately $27.5 million aggregate principal amount of our 16% senior notes due October 26, 2007 and warrants to purchase up to 3,000 shares of our Series A preferred stock to The Jefferies Investors and The TCW Funds in connection with our July 2004 financial restructuring. The notes and warrants were issued in exchange for all then outstanding principal and accrued but unpaid interest on our senior promissory notes.
We issued $24.0 million aggregate principal amount of senior promissory notes between May 2003 and December 2003 to The Jefferies Investors and The TCW Funds for short-term liquidity needs and to fund our limited capital expenditure program in the third and fourth quarters of 2003.
As of December 31, 2003, The Jefferies Investors and The TCW Funds held approximately $22.8 million and $1.2 million, respectively, aggregate principal amount of our senior promissory notes. As of December 31, 2004, The Jefferies Investors and The TCW Funds held approximately $27.2 million and $1.4 million, respectively, aggregate principal amount of 16% senior notes due October 26, 2007. As of December 31, 2005, The Jefferies Investors and The TCW Funds held approximately $31.8 million and $1.7 million, respectively, aggregate principal amount of our senior notes. Interest on the senior notes is payable semi-annually in the form of additional senior notes.
Senior Subordinated Notes. We issued approximately $99.6 million aggregate principal amount of our senior subordinated notes on November 9, 2005 to The Jefferies Investors and The TCW Funds in exchange for all then outstanding principal and accrued but unpaid interest on our 11 3/4% senior subordinated notes due 2008.
F-30
ASCENT ENERGY INC.
NOTES TO CONSOLIDATED FINANCIAL STATEMENTS—(Continued)
(Information as of June 30, 2006 and for the six months ended June 30, 2005
and June 30, 2006 is unaudited)
We issued approximately $85.9 million aggregate principal amount of our 11 3/4% senior subordinated notes due 2008 to The Jefferies Investors and The TCW Funds in connection with our July 2004 financial restructuring. The notes were issued in exchange for all then outstanding principal and accrued but unpaid interest on our 11 3/4% Series A senior notes due 2006. The 11 3/4% Series A senior notes due 2006 were issued on June 28, 2001 in connection with the acquisition of our south Texas properties.
As of December 31, 2003, The Jefferies Investors and The TCW Funds held approximately $60.7 million and $14.3 million, respectively, aggregate principal amount of our 11 3/4% Series A senior notes due 2006. As of December 31, 2004, The Jefferies Investors and The TCW Funds held approximately $71.7 million and $16.9 million, respectively, aggregate principal amount of 11 3/4% senior subordinated notes due 2006. As of December 31, 2005, The Jefferies Investors and The TCW Funds held approximately $80.6 million and $19.0 million, respectively, aggregate principal amount of our senior subordinated notes. Interest on the senior subordinated notes is payable semi-annually in the form of additional senior subordinated notes.
8% Series A Preferred Stock and Warrants to Purchase Common Stock.In July 2001, we issued an aggregate of $21.1 million of units, each consisting of one share of our Series A preferred stock and one warrant to purchase 191.943 shares of our common stock at an exercise price of $5.21 per share, to The Jefferies Investors and The TCW Funds to fund part of the cash portion of our purchase price for Pontotoc. In August 2002, we issued an additional $20.0 million of units to The Jefferies Investors and The TCW Funds. In connection with the August 2002 issuance, we paid Jefferies & Company, Inc. an aggregate of $1.0 million of the cash proceeds of the unit offering for its services as our advisor.
Voting Agreement.In connection with the August 2002 unit issuance, we entered into a Voting Agreement with South Louisiana Property Holdings, Inc. and certain holders of our Series A preferred stock, which provides for a majority of our board of directors to be appointed by certain of The Jefferies Investors and The TCW Funds. Under the Voting Agreement, certain of The Jefferies Investors are entitled to designate two of our directors so long as they hold not less than 10% of the outstanding Series A preferred stock, certain other of The Jefferies Investors are entitled to designate two of our directors so long as they hold not less than 25% of the outstanding Series A preferred stock and The TCW Funds is entitled to designate one of our directors so long as it holds not less than 10% of the outstanding Series A preferred stock. In connection with this offering and the Recapitalization, this Voting Agreement will be terminated.
Related Party Leases. From February 1, 2002 through April 30, 2005, we subleased a portion of rented office space in New Orleans, Louisiana to Jefferies & Company, Inc. at subrental rates equal to the proportionate share of our rental rates under the lease. For the years ended December 31, 2003, December 31, 2004 and December 31, 2005, Jefferies & Company, Inc. paid us approximately $57,000, $57,000 and $19,000, respectively, in subrent.
We lease office space under a three year lease which expires on October 31, 2007 from a company owned by an individual who served as our Vice President until April 2005, his brother, who is one of our employees, and their father. For the years ended December 31, 2003, December 31, 2004 and December 31, 2005, we paid approximately $87,000, $86,000 and $73,000 in rent under this arrangement.
F-31
OIL AND GAS ACTIVITIES (UNAUDITED)
In accordance with Statement of Financial Accounting Standards No. 69, “Disclosures About Oil and Gas Producing Activities,” we are making certain supplemental disclosures about our oil and gas exploration and production operations. While this information was developed with reasonable care and disclosed in good faith, it is emphasized that some of the data is necessarily imprecise and represents only approximate amounts because of the subjective judgments involved in developing such information. Accordingly, this information may not necessarily represent our current financial condition or our expected future results.
Capitalized Costs
Capitalized costs and accumulated depreciation, depletion, and amortization relating to our natural gas and oil producing activities, all of which are conducted within the continental United States, are summarized below for the periods presented (in thousands):
| | | | | | | | |
| | | Years Ended December 31, | |
| | | 2004 | | | 2005 | |
| | | (Restated) | | | | |
Proved producing oil and gas properties | | $ | 305,677 | | | $ | 336,746 | |
Unevaluated properties | | | 1,437 | | | | 7,147 | |
Accumulated depreciation, depletion, and amortization | | | (152,790 | ) | | | (172,938 | ) |
| | | | | | | | |
Net capitalized costs | | $ | 154,324 | | | $ | 170,955 | |
| | | | | | | | |
Costs Incurred (a)
Costs incurred in oil and gas property acquisition, exploration, and development activities are summarized below for the periods presented (in thousands, except per Mcfe data):
| | | | | | | | | |
| | | Years Ended December 31, |
| | | 2003 | | 2004 | | 2005 |
| | | (Restated) | | (Restated) | | |
Unproved acquisition costs | | $ | 127 | | $ | 1,045 | | $ | 5,454 |
Proved acquisition costs | | | 1,410 | | | 449 | | | 1,748 |
Exploration costs (b) | | | 4,923 | | | 4,579 | | | 8,829 |
Development costs | | | 36,489 | | | 17,724 | | | 21,820 |
| | | | | | | | | |
Costs incurred | | $ | 42,949 | | $ | 23,797 | | $ | 37,851 |
| | | | | | | | | |
DD&A per Mcfe | | $ | 1.90 | | $ | 3.24 | | $ | 2.35 |
| (a) | Includes capitalized and expensed costs incurred. |
| (b) | Includes $4.6 million, $0.9 million and $3.5 million of exploration costs expensed in 2003, 2004 and 2005, respectively. |
Proved Oil and Gas Reserves
Proved reserves are estimated quantities of natural gas and oil which geological and engineering data demonstrate, with reasonable certainty, to be recoverable in future years from known reservoirs under existing economic and operating conditions. Proved developed reserves are proved reserves that can reasonably be expected to be recovered through existing wells with existing equipment and operating methods. All estimates of natural gas and oil reserves are inherently imprecise and subject to change as new technical information about the properties is obtained.
F-32
Proved natural gas and oil reserve quantities and the related discounted future net cash flows before income taxes for the years ended December 31, 2004 and December 31, 2005 for our Oklahoma properties and for the year ended December 31, 2003 for our Louisiana, Oklahoma and Texas properties were prepared by Netherland, Sewell & Associates, Inc., independent reserve engineers. Proved natural gas and oil reserves and the related future net cash flows before income taxes for the years ended December 31, 2004 and December 31, 2005 for our Texas and Louisiana properties were prepared by LaRoche Petroleum Consultants, Ltd. (independent reserve engineers).
Our net ownership interests in estimated quantities of proved natural gas and oil reserves and changes in net proved reserves, all of which are located in the continental United States, are summarized below for the periods presented:
| | | | | | | | | |
| | | Oil and NGLs Years Ended December 31, | |
| | | 2003 | | | 2004 | | | 2005 | |
| | | (MBbls) | |
Proved developed and undeveloped reserves: | | | | | | | | | |
Beginning of year | | 14,343 | | | 13,620 | | | 10,697 | |
Revisions of previous estimates | | (263 | ) | | (2,894 | ) | | 567 | |
Purchases of oil and gas properties | | 82 | | | 98 | | | 24 | |
Extensions and discoveries | | 253 | | | 630 | | | 93 | |
Dispositions | | — | | | (12 | ) | | (5 | ) |
Production | | (795 | ) | | (745 | ) | | (706 | ) |
| | | | | | | | | |
End of year | | 13,620 | | | 10,697 | | | 10,670 | |
| | | | | | | | | |
Proved developed reserves at end of year | | 7,283 | | | 6,043 | | | 6,371 | |
| | | | | | | | | |
| | | | | | | | | |
| | | Natural Gas
Years Ended December 31, | |
| | | 2003 | | | 2004 | | | 2005 | |
| | | (MMcf) | |
Proved developed and undeveloped reserves: | | | | | | | | | |
Beginning of year | | 118,214 | | | 80,423 | | | 37,311 | |
Revisions of previous estimates | | (36,150 | ) | | (45,525 | ) | | 4,609 | |
Purchases of oil and gas properties | | 21 | | | 30 | | | 3,991 | |
Extensions and discoveries | | 4,883 | | | 7,541 | | | 747 | |
Dispositions | | — | | | — | | | — | |
Production | | (6,545 | ) | | (5,158 | ) | | (4,592 | ) |
| | | | | | | | | |
End of year | | 80,423 | | | 37,311 | | | 42,066 | |
| | | | | | | | | |
Proved developed reserves at end of year | | 47,105 | | | 24,398 | | | 27,827 | |
| | | | | | | | | |
F-33
Standardized Measure
The table of the standardized measure of discounted future net cash flows related to our ownership interests in proved oil and gas reserves as of period end is shown below for the periods presented (in thousands):
| | | | | | | | | | | | |
| | | Years Ended December 31, | |
| | | 2003 | | | 2004 | | | 2005 | |
Future cash inflows | | $ | 911,612 | | | $ | 664,223 | | | $ | 986,683 | |
Future oil and natural gas operating expenses | | | (235,308 | ) | | | (199,622 | ) | | | (276,962 | ) |
Future development costs | | | (56,733 | ) | | | (48,002 | ) | | | (56,042 | ) |
| | | | | | | | | | | | |
Future net cash flows before income taxes | | | 619,571 | | | | 416,599 | | | | 653,679 | |
Future income taxes | | | (187,825 | ) | | | (102,131 | ) | | | (179,732 | ) |
| | | | | | | | | | | | |
Future net cash flows | | | 431,746 | | | | 314,468 | | | | 473,947 | |
10% annual discount for estimating timing of cash flow | | | (160,031 | ) | | | (124,146 | ) | | | (193,019 | ) |
| | | | | | | | | | | | |
Standardized measure of discounted future net cash flows | | $ | 271,715 | | | $ | 190,322 | | | $ | 280,928 | |
| | | | | | | | | | | | |
Future cash flows are computed by applying year-end posted prices of oil and natural gas to year-end quantities of proved oil and natural gas reserves. Future operating expenses and development costs are computed primarily by our independent reserve engineers by estimating the expenditures to be incurred in developing and producing our proved oil and natural gas reserves at the end of the year, based on year-end costs and assuming the continuation of existing economic conditions. Future income taxes are computed using our tax basis in evaluated oil and gas properties and other related tax carryforwards. The standardized measure of discounted future net cash flows does not purport, nor should it be interpreted, to present the fair value of our oil and natural gas reserves. An estimate of fair value would also take into account, among other things, the recovery of reserves not presently classified as proved, anticipated future changes in prices and costs, a discount factor more representative of the time value of money, and the risks inherent in reserve estimates. The posted prices of oil and gas used with the above tables at December 31, 2003, 2004, and 2005 were $29.95, $40.00, and $57.75, respectively, per barrel and $5.97, $5.74, and $8.17, respectively, per Mcf. These prices are adjusted for energy content, transportation fees, and regional price differentials.
F-34
Changes in Standardized Measure
Changes in standardized measure of discounted future net cash flows relating to proved natural gas and oil reserves are summarized below for the periods presented (in thousands):
| | | | | | | | | | | | |
| | | Years Ended December 31, | |
| | | 2003 | | | 2004 | | | 2005 | |
Changes due to current year operations: | | | | | | | | | | | | |
Sales of oil and natural gas, net of oil and natural gas operating expense | | $ | (41,178 | ) | | $ | (44,145 | ) | | $ | (58,650 | ) |
Extensions and discoveries, net of future production and development costs | | | 17,612 | | | | 24,440 | | | | 5,765 | |
Purchases of oil and gas properties | | | 843 | | | | 1,119 | | | | 8,419 | |
Sales of oil and gas properties | | | — | | | | (124 | ) | | | (58 | ) |
Changes due to revisions in standardized variables: | | | | | | | | | | | | |
Prices and operating expenses | | | 38,992 | | | | 38,764 | | | | 123,290 | |
Revisions of previous quantity estimates | | | (94,695 | ) | | | (175,615 | ) | | | 30,847 | |
Estimated future development costs, net of development costs incurred during the period | | | 24,329 | | | | 20,251 | | | | 3,546 | |
Accretion of discount | | | 41,384 | | | | 37,949 | | | | 23,963 | |
Net change in income taxes | | | 20,262 | | | | 58,468 | | | | (41,064 | ) |
Production rates, timing and other | | | (21,632 | ) | | | (42,500 | ) | | | (5,452 | ) |
| | | | | | | | | | | | |
Net change | | | (14,083 | ) | | | (81,393 | ) | | | 90,606 | |
Beginning of year | | | 285,798 | | | | 271,715 | | | | 190,322 | |
| | | | | | | | | | | | |
End of Year | | $ | 271,715 | | | $ | 190,322 | | | $ | 280,928 | |
| | | | | | �� | | | | | | |
F-35
Appendix A
GLOSSARY OF NATURAL GAS AND OIL TERMS
The following is a description of the meanings of some of the natural gas and oil terms used in this prospectus.
3-D seismic data. Geophysical data that depict the subsurface strata in three dimensions. 3-D seismic typically provides a more detailed and accurate interpretation of the subsurface strata than 2-D, or two-dimensional, seismic.
Bbl. One stock tank barrel, or 42 U.S. gallons liquid volume, used in this prospectus in reference to oil or other liquid hydrocarbons.
Bcfe. Billion cubic feet equivalent, determined using the ratio of six Mcf of natural gas to one Bbl of oil, condensate or natural gas liquids.
Btu or British thermal unit. The quantity of heat required to raise the temperature of one pound of water by one degree Fahrenheit.
Completion. The process of treating a drilled well followed by the installation of permanent equipment for the production of natural gas or oil, or in the case of a dry hole, the reporting of abandonment to the appropriate agency.
Condensate. Liquid hydrocarbons associated with the production of a primarily natural gas reserve.
Developed acreage. The number of acres that are allocated or assignable to productive wells or wells capable of production.
Development well. A well drilled into a proved natural gas or oil reservoir to the depth of a stratigraphic horizon known to be productive.
Dry hole. A well found to be incapable of producing hydrocarbons in sufficient quantities such that proceeds from the sale of such production exceed production expenses and taxes.
Environmental Assessment.An environmental assessment, a study that can be required pursuant to federal law prior to drilling a well.
Environmental Impact Statement. An environmental impact statement, a more detailed study that can be required pursuant to federal law of the potential direct, indirect and cumulative impacts of a project that may be made available for public review and comment.
Exploratory well. A well drilled to find and produce natural gas or oil reserves not classified as proved, to find a new reservoir in a field previously found to be productive of natural gas or oil in another reservoir or to extend a known reservoir.
Farm-out. An agreement under which the owner of a working interest in a natural gas and oil lease assigns the working interest or a portion of the working interest to another party who desires to drill on the leased acreage. Generally, the assignee is required to drill one or more wells in order to earn its interest in the acreage. The assignor usually retains a royalty or reversionary interest in the lease. The interest received by an assignee is a “farm-in” while the interest transferred by the assignor is a “farm-out.”
Field. An area consisting of either a single reservoir or multiple reservoirs, all grouped on or related to the same individual geological structural feature and/or stratigraphic condition.
Finding and development costs. Capital costs incurred in the exploration and acquisition of proved natural gas and oil reserves divided by proved reserve additions and revisions to proved reserves.
A-1
Gross acres or gross wells. The total acres or wells, as the case may be, in which a working interest is owned.
Identified drilling locations. Total gross locations specifically identified and scheduled by management as an estimation of our multi-year drilling activities on existing acreage. Our actual drilling activities may change depending on the availability of capital, regulatory approvals, seasonal restrictions, natural gas and oil prices, costs, drilling results and other factors.
Infill drilling. The drilling of wells between established producing wells on a lease to increase reserves or productive capacity from the reservoir.
MBbls. Thousand barrels of oil or other liquid hydrocarbons.
Mcf. Thousand cubic feet of natural gas.
Mcf/d. One Mcf per day.
Mcfe. Thousand cubic feet equivalent, determined using the ratio of six Mcf of natural gas to one Bbl of oil, condensate or natural gas liquids.
MMBbls. Million barrels of crude oil or other liquid hydrocarbons.
MMBtu. Million British Thermal Units.
MMcf. Million cubic feet of natural gas.
MMcf/d. One Mmcf per day.
MMcfe. Million cubic feet equivalent, determined using the ratio of six Mcf of natural gas to one Bbl of oil, condensate or natural gas liquids.
MMcfe/d. One MMcfe per day.
Net acres or net wells. The sum of the fractional working interest owned in gross acres or gross wells, as the case may be.
NGLs: Natural gas liquids, which consist primarily of ethane, propane, isobutane, normal butane and natural gasoline.
Operator. The individual or company responsible for the exploration of and/or production from a natural gas or oil well or lease.
Plugging and abandonment. Refers to the sealing off of fluids in the strata penetrated by a well so that the fluids from one stratum will not escape into another or to the surface. Regulations of all states require plugging of abandoned wells.
Present value of future net revenues (PV-10). The present value of estimated future revenues to be generated from the production of proved reserves, before income taxes, calculated in accordance with SEC guidelines, net of estimated production and future development costs, using prices and costs as of the date of estimation without future escalation and without giving effect to hedging activities, non-property related expenses such as general and administrative expenses, debt service and depreciation, depletion and amortization. PV-10 is calculated using an annual discount rate of 10% from our proved natural gas and oil reserves, without deduction for estimated future income tax expenses.
Productive well. A well that is found to be capable of producing hydrocarbons in sufficient quantities such that proceeds from the sale of the production exceed production expenses and taxes.
A-2
Prospect. A specific geographic area which, based on supporting geological, geophysical or other data and also preliminary economic analysis using reasonably anticipated prices and costs, is deemed to have potential for the discovery of commercial hydrocarbons.
Proved developed reserves. Reserves that can be expected to be recovered through existing wells with existing equipment and operating methods.
Proved reserves. The estimated quantities of oil, natural gas and natural gas liquids which geological and engineering data demonstrate with reasonable certainty to be commercially recoverable in future years from known reservoirs under existing economic and operating conditions.
Proved undeveloped reserves. Proved reserves that are expected to be recovered from new wells on undrilled acreage or from existing wells where a relatively major expenditure is required for recompletion.
PV-10. Present value of future net revenues.
Recompletion. The process of re-entering an existing wellbore that is either producing or not producing and completing new reservoirs in an attempt to establish or increase existing production.
Reservoir. A porous and permeable underground formation containing a natural accumulation of producible natural gas and/or oil that is confined by impermeable rock or water barriers and is separate from other reservoirs.
Royalty. An interest in a natural gas or oil lease that gives the owner of the interest the right to receive a portion of the production from the leased acreage (or of the proceeds of the sale thereof), but generally does not require the owner to pay any portion of the costs of drilling or operating the wells on the leased acreage. Royalties may be either landowner’s royalties, which are reserved by the owner of the leased acreage at the time the lease is granted, or overriding royalties, which are usually reserved by an owner of the leasehold in connection with a transfer to a subsequent owner.
Standardized measure of discounted future net cash flows. The present value of estimated future cash inflows from proved natural gas and oil reserves, less future development and production costs and future income tax expenses, discounted at 10% per annum to reflect timing of future cash flows and using the same pricing assumptions as were used to calculate PV-10. The standardized measure of discounted future net cash flows differs from PV-10 because such measure includes the effect of future income taxes.
Tight gas sands. A formation with low permeability that produces natural gas with very low flow rates for long periods of time.
Undeveloped acreage. Lease acreage on which wells have not been drilled or completed to a point that would permit the production of commercial quantities of natural gas and oil regardless of whether such acreage contains proved reserves.
Working interest. The operating interest that gives the owner the right to drill, produce and conduct operating activities on the property and receive a share of production and requires the owner to pay a share of the costs of drilling and production operations.
Workover. Operations on a producing well to restore or increase production.
A-3
Appendix B

March 1, 2006
Mr. David A. Rice
Ascent Energy, Inc.
Suite 450
1700 Redbud Boulevard
McKinney, Texas 75069
Dear Mr. Rice:
In accordance with your request, we have estimated the proved reserves and future revenue, as of December 31, 2005, to the Ascent Energy, Inc. (Ascent) interest in certain oil and gas properties located in Oklahoma, as listed in the accompanying tabulations. This report has been prepared using constant prices and costs, as discussed in subsequent paragraphs of this letter. The estimates of reserves and future revenue in this report conform to the guidelines of the Securities and Exchange Commission (SEC). The projections in this report are the same as in our report dated February 28, 2006, except that the February 28 report was prepared using price and cost parameters specified by Ascent.
As presented in the accompanying summary projections, Tables I through IV, we estimate the net reserves and future net revenue to the Ascent interest in these properties, as of December 31, 2005, to be:
| | | | | | | | | | |
| | | Net Reserves | | Future Net Revenue ($) |
Category | | Oil
(Barrels) | | NGL
(Barrels) | | Gas
(MCF) | | Total | | Present
Worth at 10% |
Proved Developed | | | | | | | | | | |
Producing | | 5,251,143 | | 95,598 | | 4,194,816 | | 213,400,300 | | 107,963,900 |
Non-Producing | | 0 | | 1,683 | | 5,165,578 | | 23,915,200 | | 14,374,800 |
Proved Undeveloped | | 3,304,096 | | 27,393 | | 1,393,560 | | 166,772,500 | | 81,973,100 |
| | | | | | | | | | |
Total Proved | | 8,555,240 | | 124,675 | | 10,753,954 | | 404,088,000 | | 204,311,800 |
The oil reserves shown include crude oil and condensate. Oil and natural gas liquids (NGL) volumes are expressed in barrels that are equivalent to 42 United States gallons. Gas volumes are expressed in thousands of cubic feet (MCF) at standard temperature and pressure bases.
The estimates shown in this report are for proved developed producing, proved developed non-producing, and proved undeveloped reserves. In accordance with SEC guidelines, our estimates do not include any probable or possible reserves that may exist for these properties. This report does not include any value that could be attributed to interests in undeveloped acreage beyond those tracts for which undeveloped reserves have been estimated. Definitions of all reserve categories are presented immediately following this letter. As shown in the Table of Contents, for each reserve category this report includes a summary projection of reserves and revenue along with one-line summaries of reserves, economics, and basic data by lease.
| | |
| 4500 THANKSGIVING TOWER • 1601 ELM STREET • DALLAS, TEXAS 75201-4754 • PH: 214-969-5401 • FAX: 214-969-5411 | | nsai@nsai-petro.com |
| 1221 LAMAR STREET, SUITE 1200 • HOUSTON, TEXAS 77010-3072 • PH: 713-654-4950 • FAX: 713-654-4951 | | netherlandsewell.com |
B-1

Future gross revenue to the Ascent interest is prior to deducting state production taxes. Future net revenue is after deductions for these taxes, future capital costs, operating expenses, and abandonment costs but before consideration of federal income taxes. In accordance with SEC guidelines, the future net revenue has been discounted at an annual rate of 10 percent to determine its “present worth.” The present worth is shown to indicate the effect of time on the value of money and should not be construed as being the fair market value of the properties.
For the purposes of this report, we did not perform any field inspection of the properties, nor did we examine the mechanical operation or condition of the wells and their related facilities. We have not investigated possible environmental liability related to the properties; therefore, our estimates do not include any costs due to such possible liability. Our estimates of future revenue include Ascent’s estimates of the costs to abandon the wells and production facilities, net of any salvage value. Abandonment costs are included as capital costs.
Oil and NGL prices used in this report are based on a December 31, 2005, Plains West Texas Intermediate posted price of $57.75 per barrel and are adjusted by lease for quality, transportation fees, and regional price differentials. Gas prices used in this report are based on a December 31, 2005, Tennessee (zone 0) spot market price of $8.17 per MMBTU and are adjusted by lease for energy content, transportation fees, and regional price differentials. All prices are held constant in accordance with SEC guidelines.
Lease and well operating costs used in this report are based on operating expense records of Ascent. For nonoperated properties, these costs include the per-well overhead expenses allowed under joint operating agreements along with estimates of costs to be incurred at and below the district and field levels. As requested, lease and well operating costs for the operated properties include only direct lease- and field-level costs. For all properties, headquarters general and administrative overhead expenses of Ascent are not included. Lease and well operating costs are held constant in accordance with SEC guidelines. Capital costs are included as required for workovers, new development wells, and production equipment.
We have made no investigation of potential gas volume and value imbalances resulting from overdelivery or underdelivery to the Ascent interest. Therefore, our estimates of reserves and future revenue do not include adjustments for the settlement of any such imbalances; our projections are based on Ascent receiving its net revenue interest share of estimated future gross gas production.
The reserves shown in this report are estimates only and should not be construed as exact quantities. The reserves may or may not be recovered; if they are recovered, the revenues therefrom and the costs related thereto could be more or less than the estimated amounts. A substantial portion of these reserves are for undeveloped locations and waterflood response. Therefore, these reserves are based on estimates of reservoir volumes and recovery efficiencies along with analogies to similar production. Because such reserve estimates are usually subject to greater revision than those based on substantial production and pressure data, it may be necessary to revise these estimates as additional performance data become available. Because of governmental policies and uncertainties of supply and demand, the sales rates, prices received for the reserves, and costs incurred in recovering such reserves may vary from assumptions made while preparing this report. Also, estimates of reserves may increase or decrease as a result of future operations.
In evaluating the information at our disposal concerning this report, we have excluded from our consideration all matters as to which the controlling interpretation may be legal or accounting, rather than engineering and geologic. As in all aspects of oil and gas evaluation, there are uncertainties inherent in the interpretation of engineering and geologic data; therefore, our conclusions necessarily represent only informed professional judgment.
B-2
The titles to the properties have not been examined by Netherland, Sewell & Associates, Inc., nor has the actual degree or type of interest owned been independently confirmed. The data used in our estimates were obtained from Ascent Energy, Inc.; public data sources; and the nonconfidential files of Netherland, Sewell & Associates, Inc. and were accepted as accurate. Supporting geologic, field performance, and work data are on file in our office. We are independent petroleum engineers, geologists, geophysicists, and petrophysicists; we do not own an interest in these properties and are not employed on a contingent basis.
| | | | | | | | |
| | | | Very truly yours, |
| | |
| | | | NETHERLAND, SEWELL & ASSOCIATES, INC. |
| | | | |
| | | | | | By: | | /s/ FREDERIC D. SEWELL, P.E. |
| | | | | | | | Frederic D. Sewell, P.E. |
| | | | | | | | Chairman and Chief Executive Officer |
| | | | |
| By: | | /s/ DANNY D. SIMMONS, P.E. | | | | By: | | /s/ MIKE K. NORTON, P.G. |
| | Danny D. Simmons, P.E. | | | | | | Mike K. Norton, P.G. |
| | Executive Vice President | | | | | | Senior Vice President |
| | |
Date Signed: March 1, 2006 | | | | Date Signed: March 1, 2006 |
B-3
Appendix C
[LaRoche Petroleum Consultants, Ltd. Letterhead]
March 23, 2006
Mr. David A. Rice
Ascent Oil & Gas, Inc.
Suite 450
1700 Redbud Boulevard
McKinney, Texas 75069
Dear Mr. Rice:
At your request, LaRoche Petroleum Consultants, Ltd. (LPC) has estimated the proved reserves and future cash flow, as of December 31, 2005, to the Ascent Oil & Gas, Inc. (Ascent) interest in certain properties located in Louisiana and Texas. This report has been prepared using constant prices and costs and conforms to our understanding of the Securities and Exchange Commission (SEC) guidelines.
Summarized below are our estimates of net reserves and future net cash flow. Future net revenue is prior to deducting estimated production and ad valorem taxes. Future net cash flow is after deducting these taxes, operating expenses, future capital expenditures, and abandonment costs but before consideration of federal income taxes. The discounted cash flow values included in this report are intended to represent the time value of money and should not be construed to represent an estimate of fair market value. We estimate the net reserves and future net cash flow to the Ascent interest, as of December 31, 2005, to be:
| | | | | | | | | | | | |
| | | Net Reserves | | Future Net Cash Flow ($) |
Category | | Oil (BBL) | | Gas (MCF) | | NGL (BBL) | | Total | | Present Worth
at 10% |
Proved Developed | | | | | | | | | | | | |
Producing | | 374,840 | | 14,129,893 | | 368,081 | | $ | 103,569,633 | | $ | 76,988,203 |
Non-Producing | | 245,148 | | 4,336,382 | | 34,480 | | | 45,918,434 | | | 28,720,895 |
Proved Undeveloped | | 397,125 | | 12,845,513 | | 570,899 | | | 100,103,234 | | | 61,282,051 |
| | | | | | | | | | | | |
Total Proved(1) | | 1,017,114 | | 31,311,787 | | 973,460 | | $ | 249,591,281 | | $ | 166,991,125 |
| (1) | Values above reflect those shown in the economic summaries and may not add due to rounding. |
The oil reserves include crude oil, condensate, and natural gas liquids. Oil and natural gas liquid reserves are expressed in barrels, which are equivalent to 42 United States gallons. Gas volumes are expressed in thousands of standard cubic feet (MCF) at the contract temperature and pressure bases.
The estimated reserves and future cash flow shown in this report are for proved developed producing reserves and, for certain properties, proved developed non-producing and proved undeveloped reserves. In accordance with SEC guidelines, our estimates do not include any value for probable or possible reserves that may exist for these properties. This report does not include any value that could be attributed to interests in undeveloped acreage beyond those tracts for which undeveloped reserves have been estimated. Definitions of all reserve categories used in this report are presented immediately following this letter.
This report includes: (1) summary economic projections of reserves and cash flow for each reserve category and field area, (2) one-line summaries of basic economic data and reserves for each property evaluated by reserve category and state, and (3) economic projections of reserves and cash flow for each evaluated property.
Our estimates of reserves were prepared using standard geological and engineering methods generally accepted by the petroleum industry. The method or combination of methods utilized in the evaluation of each reservoir included consideration of the stage of development of the reservoir, quality and completeness of basic
C-1
data, and production history. Recovery from various reservoirs and leases was estimated after consideration of the type of energy inherent in the reservoirs, the structural positions of the properties, and reservoir and well performance. In some instances, comparisons were made with similar properties where more complete data were available.
The estimated reserves and future income shown in this report are related to hydrocarbon prices. The prices on December 31, 2005 were used in the preparation of this report as required by SEC guidelines; however, actual future prices may vary significantly from the December 31, 2005 prices. Therefore, volumes of reserves actually recovered and amounts of income actually received may differ significantly from the estimated quantities presented in this report.
Oil prices used in this report are based on a December 31, 2005 physical crude oil price of $57.75 per barrel, as posted by Plains Marketing, L.P., adjusted by lease for gravity, transportation fees, and regional price differentials. Gas prices are referenced to a December 31, 2005 Tennessee Zone 0 (South Texas) physical composite gas price of $8.17 per MMBtu, adjusted by lease for energy content, transportation fees, and regional price differentials. Natural gas liquid prices are referenced to a December 31, 2005 physical crude oil price of $57.75 per barrel, as posted by Plains Marketing, L.P., adjusted by area for composition, quality, transportation fees and regional price differentials. Prices are held constant in accordance with SEC guidelines.
Lease and well operating expenses are based on data obtained from Ascent. Expenses for the properties operated by Ascent include allocated overhead costs as well as direct lease and field level costs. Wells operated by others include all direct expenses as well as general, administrative, and overhead costs allowed under the joint operating agreements. Lease and well operating costs are held constant in accordance with SEC guidelines.
Capital costs and timing of all investments have been provided by Ascent and are included as required for workovers, new development wells, and production equipment. Ascent’s estimates of the cost to plug and abandon the wells are included at the end of the economic life of each area for Louisiana properties and each well for Texas properties. These costs are also held constant until the date of expenditure.
We have made no investigation of possible oil and gas volume and value imbalances that may have been the result of overdelivery or underdelivery to the Ascent interest. Our projections are based on Ascent receiving its net revenue interest share of estimated future gross oil and gas production.
Technical information necessary for the preparation of the reserve estimates herein was furnished by Ascent or was obtained from state regulatory agencies and commercially available data sources. No special tests were obtained to assist in the preparation of this report. For the purpose of this report, the individual well test and production data as reported by the above sources were accepted as represented together with all other factual data presented by Ascent including the extent and character of the interest evaluated.
An on-site inspection of the properties has not been performed nor has the mechanical operation or condition of the wells and their related facilities been examined by LPC. The continued operation of uneconomic properties was not taken into account.
The evaluation of potential environmental liability from the operation and abandonment of the properties evaluated is beyond the scope of this report. In addition, no evaluation was made to determine the degree of operator compliance with current environmental rules, regulations, and reporting requirements. Therefore, no estimate of the potential economic liability, if any, from environmental concerns is included in the projections presented herein.
The reserves included in this report are estimates only and should not be construed as exact quantities. They may or may not be recovered; if recovered, the revenues therefrom and the costs related thereto could be more or less than the estimated amounts. These estimates should be accepted with the understanding that future
C-2
development, production history, changes in regulations, product prices, and operating expenses would probably cause us to make revisions in subsequent evaluations. A portion of these reserves are for behind-pipe zones, undeveloped locations, and producing wells that lack sufficient production history to utilize performance-related reserve estimates. Therefore, these reserves are based on estimates of reservoir volumes and recovery efficiencies along with analogies to similar production. These reserve estimates are subject to a greater degree of uncertainty than those based on substantial production and pressure data. It may be necessary to revise these estimates up or down in the future as additional performance data become available. As in all aspects of oil and gas evaluation, there are uncertainties inherent in the interpretation of engineering and geological data; therefore, our conclusions represent informed professional judgments only, not statements of fact.
This report is solely for the use of Ascent, its agents, and its representatives in their evaluation of these properties and is not to be used, circulated, quoted, or otherwise referenced for any other purpose without the express written consent of the undersigned except as required by law. Persons other than those to whom this report is addressed or those authorized by the addressee shall not be entitled to rely upon the report unless it is accompanied by such consent.
We are independent petroleum engineers, geologists, and geophysicists; we do not own an interest in these properties and are not employed on a contingent basis. Basic geologic and field performance data together with our engineering work sheets are maintained on file in our office.
| | |
Very truly yours, |
|
LaRoche Petroleum Consultants, Ltd. |
|
/s/ Joe A. Young |
Joe A. Young Registered Professional Engineer State of Texas No. 62866 |
C-3
Appendix D
[Letterhead of Netherland, Sewell & Associates, Inc.]
August 28, 2006
Mr. David A. Rice
Ascent Energy, Inc.
Suite 800
4965 Preston Park Boulevard
Piano, Texas 75093
Dear Mr. Rice:
In accordance with your request, we have estimated the proved reserves and future revenue, as of June 30, 2006, to the Ascent Energy, Inc. (Ascent) interest in certain oil and gas properties located in Oklahoma, as listed in the accompanying tabulations. This report has been prepared using constant prices and costs, as discussed in subsequent paragraphs of this letter. The estimates of reserves and future revenue in this report conform to the guidelines of the Securities and Exchange Commission (SEC).
As presented in the accompanying summary projections, Tables I through IV, we estimate the net reserves and future net revenue to the Ascent interest in these properties, as of June 30, 2006, to be:
| | | | | | | | | | |
| | | Net Reserves | | Future Net Reserves ($) |
Category | | Oil
(Barrels) | | NGL
(Barrels) | | Gas (MCF) | | Total | | Present
Worth at 10% |
Proved Developed | | | | | | | | | | |
Producing | | 5,120,311 | | 103,599 | | 2,754,991 | | 238,905,000 | | 118,102,200 |
Non-Producing | | 8,074 | | 0 | | 4,945,576 | | 15,780,600 | | 12,527,800 |
Proved Undeveloped | | 3,511,105 | | 36,633 | | 1,087,275 | | 198,415,800 | | 98,117,000 |
| | | | | | | | | | |
Total Proved (1) | | 8,639,491 | | 140,232 | | 8,787,843 | | 453,101,400 | | 228,747,200 |
| (1) | Totals may not add because of rounding. |
The oil reserves shown include crude oil and condensate. Oil and natural gas liquids (NGL) volumes are expressed in barrels that are equivalent to 42 United States gallons. Gas volumes are expressed in thousands of cubic feet (MCF) at standard temperature and pressure bases.
The estimates shown in this report are for proved developed producing, proved developed non-producing, and proved undeveloped reserves. In accordance with SEC guidelines, our estimates do not include any probable or possible reserves that may exist for these properties. This report includes Pontotoc Gathering System revenue and expenses associated with the gathering, compression, and dehydration of gas production from multiple Ascent leases in the Allen Anticline area in Oklahoma. This report does not include any value that could be attributed to interests in undeveloped acreage beyond those tracts for which undeveloped reserves have been estimated. Definitions of all reserve categories are presented immediately following this letter. As shown in the Table of Contents, for each reserve category this report includes a summary projection of reserves and revenue along with one-line summaries of reserves, economics, and basic data by lease.
Future gross revenue to the Ascent interest is prior to deducting state production taxes. Future net revenue is after deductions for these taxes, future capital costs, operating expenses, and abandonment costs but before consideration of federal income taxes. In accordance with SEC guidelines, the future net revenue has been
D-1
discounted at an annual rate of 10 percent to determine its “present worth.” The present worth is shown to indicate the effect of time on the value of money and should not be construed as being the fair market value of the properties.
For the purposes of this report, we did not perform any field inspection of the properties, nor did we examine the mechanical operation or condition of the wells and their related facilities. We have not investigated possible environmental liability related to the properties; therefore, our estimates do not include any costs due to such possible liability. Our estimates of future revenue do not include any salvage value for the lease and well equipment but do include Ascent’s estimates of the costs to abandon the wells and production facilities. Abandonment costs are included as capital costs.
Oil and NGL prices used in this report are based on a June 30, 2006, Plains West Texas Intermediate posted price of $70.50 per barrel and are adjusted by lease for quality, transportation fees, and regional price differentials. Gas prices used in this report are based on a June 30, 2006, Tennessee Gas (Texas, zone 0) spot market price of $6.04 per MMBTU and are adjusted by lease for energy content, transportation fees, and regional price differentials. All prices are held constant in accordance with SEC guidelines.
Lease and well operating costs used in this report are based on operating expense records of Ascent. These costs include the per-well overhead expenses allowed under joint operating agreements along with estimates of costs to be incurred at and below the district and field levels. Headquarters general and administrative overhead expenses of Ascent are included only to the extent that they are covered under joint operating agreements for the operated properties. Lease and well operating costs are held constant in accordance with SEC guidelines. Capital costs are included as required for workovers, new development wells, and production equipment.
We have made no investigation of potential gas volume and value imbalances resulting from overdelivery or underdelivery to the Ascent interest. Therefore, our estimates of reserves and future revenue do not include adjustments for the settlement of any such imbalances; our projections are based on Ascent receiving its net revenue interest share of estimated future gross gas production.
The reserves shown in this report are estimates only and should not be construed as exact quantities. The reserves may or may not be recovered; if they are recovered, the revenues therefrom and the costs related thereto could be more or less than the estimated amounts. A substantial portion of these reserves are for undeveloped locations and waterflood response. Therefore, these reserves are based on estimates of reservoir volumes and recovery efficiencies along with analogies to similar production. Because such reserve estimates are usually subject to greater revision than those based on substantial production and pressure data, it may be necessary to revise these estimates as additional performance data become available. Because of governmental policies and uncertainties of supply and demand, the sales rates, prices received for the reserves, and costs incurred in recovering such reserves may vary from assumptions made while preparing this report. Also, estimates of reserves may increase or decrease as a result of future operations.
In evaluating the information at our disposal concerning this report, we have excluded from our consideration all matters as to which the controlling interpretation may be legal or accounting, rather than engineering and geologic. As in all aspects of oil and gas evaluation, there are uncertainties inherent in the interpretation of engineering and geologic data; therefore, our conclusions necessarily represent only informed professional judgment.
The titles to the properties have not been examined by Netherland, Sewell & Associates, Inc., nor has the actual degree or type of interest owned been independently confirmed. The data used in our estimates were obtained from Ascent Energy, Inc.; public data sources; and the nonconfidential files of Netherland, Sewell & Associates, Inc. and were accepted as accurate. Supporting geologic, field performance, and work data are on
D-2
file in our office. We are independent petroleum engineers, geologists, geophysicists, and petrophysicists; we do not own an interest in these properties and are not employed on a contingent basis.
|
| Very truly yours, |
NETHERLAND, SEWELL & ASSOCIATES,
INC. |
| /s/ C.H. (Scott) Rees III, P.E. |
By: C.H. (Scott) Rees III, P.E. |
President and Chief Operating Officer |
| | | | | | | | |
| /s/ Danny D. Simmons, P.E. | | | | /s/ Mike K. Norton, P.G. |
| | By: Danny D. Simmons, P.E. Executive Vice President | | | | | | By: Mike K. Norton, P.G. Senior Vice President |
| | | | |
| | Date Signed: August 28, 2006 | | | | | | Date Signed: August 28, 2006 |
D-3
Appendix E
[Letterhead of LaRoche Petroleum Consultants, Ltd.]
August 24, 2006
Mr. David A. Rice
Ascent Oil & Gas, Inc.
4965 Park Boulevard, Suite 800
Piano, Texas 75093
Dear Mr. Rice:
At your request, LaRoche Petroleum Consultants, Ltd. (LPC) has estimated the proved reserves and future cash flow, as of June 30, 2006, to the Ascent Oil & Gas, Inc. (Ascent) interest in certain properties located in Louisiana and Texas. This report has been prepared using constant prices and costs and conforms to our understanding of the Securities and Exchange Commission (SEC) guidelines.
Our estimates of net reserves and future net cash flow are summarized below. Future net revenue is prior to deducting estimated production and ad valorem taxes. Future net cash flow is after deducting these taxes, operating expenses, and future capital expenditures but before consideration of federal income taxes. The discounted cash flow values included in this report are intended to represent the time value of money and should not be construed to represent an estimate of fair market value. We estimate the net reserves and future net cash flow to the Ascent interest, as of June 30, 2006, to be:
| | | | | | | | | | |
| | | Net Reserves | | Future Net Cash Flow (M$) |
Category | | Oil
(MBBL) | | Gas
(MMCF) | | NGL
(MBBL) | | Total | | Present
Worth at 10% |
Proved Developed | | | | | | | | | | |
Producing | | 329.1 | | 14,746.9 | | 362.7 | | 78,215.9 | | 58,668.3 |
Non-producing | | 288.0 | | 4,970.1 | | 36.6 | | 39,083.4 | | 26,484.4 |
Proved Undeveloped | | 360.7 | | 8,896.0 | | 411.5 | | 46,241.0 | | 26,998.7 |
| | | | | | | | | | |
Total Proved (1) | | 977.9 | | 28,613.0 | | 810.8 | | 163,540.3 | | 112,151.4 |
| (1) | Values above reflect those shown in the economic summaries and may not add due to rounding. |
The oil reserves include crude oil, condensate, and natural gas liquids. Oil reserves are expressed in barrels, which are equivalent to 42 United States gallons. Gas volumes are expressed in thousands of standard cubic feet (Mcf) at the contract temperature and pressure bases.
The estimated reserves and future cash flow shown in this report are for proved developed producing reserves and, for certain properties, proved developed non-producing and proved undeveloped reserves. This report does not include any value that could be attributed to interests in undeveloped acreage beyond those tracts for which undeveloped reserves have been estimated. Definitions of all reserve categories used in this report are presented immediately following this letter.
This report includes: (1) summary economic projections of reserves and cash flow for each reserve category, (2) one-line summaries of basic economic data and reserves for each property evaluated, and (3) economic projections of reserves and cash flow for each evaluated property.
Estimates of reserves were prepared using standard geological and engineering methods generally accepted by the petroleum industry. The method or combination of methods utilized in the evaluation of each reservoir
E-1
included consideration of the stage of development of the reservoir, quality and completeness of basic data, and production history. Recovery from various reservoirs and leases was estimated after consideration of the type of energy inherent in the reservoirs, the structural positions of the properties, and reservoir and well performance. In some instances, comparisons were made with similar properties where more complete data were available.
The estimated reserves and future cash flow amounts in this report are related to hydrocarbon prices. The prices on June 30, 2006 were used in the preparation of this report as required by SEC guidelines; however, actual future prices may vary significantly from the June 30, 2006 prices. Therefore, volumes of reserves actually recovered and amounts of cash flow actually received may differ significantly from the estimated quantities presented in this report.
Oil prices are referenced to a June 30, 2006 West Texas Intermediate physical crude oil price of $70.50 per barrel, as posted by Plains Marketing, L.P., adjusted for gravity, crude quality, transportation fees, and regional price differentials. Gas prices are referenced to a June 30, 2006 Tennessee Zone 0 (South Texas) physical composite gas price of $6.04 per MMBtu, as posted in Gas Daily, adjusted for energy composition, quality, transportation fees, and regional price differentials. Prices are held constant in accordance with SEC guidelines.
Lease and well operating expenses are based on data obtained from Ascent. Expenses for the properties include allocated overhead costs as allowed under joint operating agreements along with direct lease and field level costs. Wells operated by others include all direct expenses as well as general, administrative, and overhead costs allowed under the joint operating agreements. Lease and well operating costs are held constant in accordance with SEC guidelines.
Capital costs and timing of all investments have been provided by Ascent and are included as required for workovers, new development wells, and production equipment. Ascent’s estimates of the cost to plug and abandon the wells are included at the end of the economic life of each area for Louisiana properties and each well for Texas properties. These costs are held constant until the date of expenditure.
We have made no investigation of possible oil and gas volume and value imbalances that may have been the result of overdelivery or underdelivery to the Ascent interest. Our projections are based on the Ascent interest receiving its net revenue interest share of estimated future gross oil and gas production.
Technical information necessary for the preparation of the reserve estimates herein was furnished by Ascent or was obtained from state regulatory agencies and commercially available data sources. No special tests were obtained to assist in the preparation of this report. For the purpose of this report, the individual well test and production data as reported by the above sources were accepted as represented together with all other factual data presented by Ascent including the extent and character of the interest evaluated.
An on-site inspection of the properties has not been performed nor has the mechanical operation or condition of the wells and their related facilities been examined by LPC. The continued operation of uneconomic properties was not taken into account.
The evaluation of potential environmental liability from the operation and abandonment of the properties evaluated is beyond the scope of this report. In addition, no evaluation was made to determine the degree of operator compliance with current environmental rules, regulations, and reporting requirements. Therefore, no estimate of the potential economic liability, if any, from environmental concerns is included in the projections presented herein.
The reserves included in this report are estimates only and should not be construed as exact quantities. They may or may not be recovered; if recovered, the revenues therefrom and the costs related thereto could be more or less than the estimated amounts. These estimates should be accepted with the understanding that future development, production history, changes in regulations, product prices, and operating expenses would probably
E-2
cause us to make revisions in subsequent evaluations. A portion of these reserves are for behind-pipe zones, undeveloped locations, and producing wells that lack sufficient production history to utilize performance-related reserve estimates. Therefore, these reserves are based on estimates of reservoir volumes and recovery efficiencies along with analogies to similar production. These reserve estimates are subject to a greater degree of uncertainty than those based on substantial production and pressure data. It may be necessary to revise these estimates up or down in the future as additional performance data become available. As in all aspects of oil and gas evaluation, there are uncertainties inherent in the interpretation of engineering and geological data; therefore, our conclusions represent informed professional judgments only, not statements of fact.
This report is solely for the use of Ascent, its agents, and its representatives in their evaluation of these properties and is not to be used, circulated, quoted, or otherwise referenced for any other purpose without the express written consent of the undersigned. Persons other than those to whom this report is addressed shall not be entitled to rely upon the report unless it is accompanied by such consent.
We are independent petroleum engineers, geologists, and geophysicists; we do not own an interest in these properties and are not employed on a contingent basis. Data pertinent to this report are maintained on file in our office.
|
| Very truly yours, |
|
| LaRoche Petroleum Consultants, Ltd. |
|
| /s/ Joe A. Young |
Joe A. Young |
Registered Professional Engineer |
State of Texas No. 62866 |
E-3

Shares
Common Stock
PROSPECTUS
, 2006
Joint Book-Running Managers
LEHMAN BROTHERS
JEFFERIES & COMPANY
Senior Co-Managers
MORGAN KEEGAN & COMPANY, INC.
PETRIE PARKMAN & CO.
Co-Managers
CAPITAL ONE SOUTHCOAST
FORTIS SECURITIES LLC
KEYBANC CAPITAL MARKETS
Until , 2006 (25 days after the date of this prospectus), all dealers that buy, sell or trade our common stock, whether or not participating in this offering, may be required to deliver a prospectus. This is in addition to the dealers’ obligation to deliver a prospectus when acting as underwriters and with respect to their unsold allotments or subscriptions.
Part II
Information not required in prospectus
| Item 13. | Other expenses of issuance and distribution |
The expenses of this offering, other than underwriting discount, are estimated to be as follows:
| | | |
Securities and Exchange Commission registration fee | | $ | 21,534 |
NASD filing fee | | | 20,625 |
Nasdaq Global Market listing fee | | | 100,000 |
Legal fees and expenses | | | * |
Accounting fees and expenses | | | * |
Printing expenses | | | * |
Transfer agent fees | | | * |
Miscellaneous | | | * |
| | | |
Total | | $ | * |
| | | |
| * | To be provided by amendment. |
| Item 14. | Indemnification of directors and officers |
Section 145 of the General Corporation Law of the State of Delaware (the “DGCL”) authorizes a corporation, under certain circumstances, to indemnify any person who was or is a party or is threatened to be made a party to any threatened, pending or completed action, suit or proceeding, whether civil, criminal, administrative or investigative (other than an action by or in the right of the corporation), by reason of the fact that the person is or was an officer or director of such corporation, or is or was serving at the request of that corporation as a director, officer, employee or agent of another corporation, partnership, joint venture, trust or other enterprise, against expenses (including attorneys’ fees), judgments, fines and amounts paid in settlement actually and reasonably incurred by such person in connection with such action, suit or proceeding, if he acted in good faith and in a manner he reasonably believed to be in or not opposed to the best interests of the corporation. With respect to any criminal action or proceeding, such indemnification is available if he had no reasonable cause to believe his conduct was unlawful.
Article VI of the registrant’s Amended and Restated Bylaws (the “Bylaws”), will provide for indemnification of each person who is or was made a party to any actual or threatened civil, criminal, administrative or investigative action, suit or proceeding because such person is, was or has agreed to become an officer or director of the registrant or is a person who is or was serving or has agreed to serve at the request of the registrant as a director, officer, partner, venturer, proprietor, trustee, employee, agent or similar functionary of another corporation or of a partnership, joint venture, sole proprietorship, trust, employee benefit plan or other enterprise to the fullest extent permitted by the DGCL as it existed at the time the indemnification provisions of the Bylaws were adopted or as may be thereafter amended. Article VI expressly provides that it is not the exclusive method of indemnification.
Section 145 of the DGCL also empowers a corporation to purchase and maintain insurance on behalf of any person who is or was an officer or director of such corporation against liability asserted against or incurred by him in any such capacity, whether or not such corporation would have the power to indemnify such officer or director against such liability under the provisions of Section 145.
Article VI of the Bylaws will also provide that the registrant may maintain insurance, at the registrant’s expense, to protect the registrant and any director, officer, employee or agent of the registrant or of another entity against any expense, liability, or loss, regardless of whether the registrant would have the power to indemnify such person against such expense, liability or loss under the DGCL.
II-1
Section 102(b)(7) of the DGCL provides that a certificate of incorporation may contain a provision eliminating or limiting the personal liability of a director to the corporation or its stockholders for monetary damages for breach of fiduciary duty as a director, provided that such provision shall not eliminate or limit the liability of a director (a) for any breach of the director’s duty of loyalty to the corporation or its stockholders, (b) for acts or omissions not in good faith or which involve intentional misconduct or a knowing violation of law, (c) under Section 174 of the DGCL (relating to liability for unauthorized acquisitions or redemptions of, or dividends on, capital stock) or (d) for any transaction from which the director derived improper personal benefit. Article VII of the registrant’s Amended and Restated Certificate of Incorporation will contain such a provision.
The underwriting agreement to be entered into in connection with this offering will provide that the Underwriters shall indemnify the registrant, its directors and certain officers of the registrant against liabilities resulting from information furnished by or on behalf of the Underwriters specifically for use in the Registration Statement. See “Item 17. Undertakings” for a description of the Commission’s position regarding such indemnification provisions.
| Item 15. | Recent sales of unregistered securities |
Ascent Energy Inc. was formed January 9, 2001. During the three years preceding the date of this registration statement, the registrant has sold the following securities without registration under the Securities Act:
The registrant issued $24,000,000 aggregate principal amount of senior promissory notes between May andDecember 2003 to The Jefferies Investors and certain of The TCW Funds for cash in reliance on the exemption from registration provided by Section 4(2) of the Securities Act.
On July 27, 2004, the registrant issued $27,465,008 aggregate principal amount of 16% senior notes due October 26, 2007 and warrants to purchase up to 3,000 shares of its 8% Series A preferred stock, $0.001 par value per share, to The Jefferies Investors and certain of The TCW Funds in exchange for all then outstanding principal and accrued but unpaid interest on its senior promissory notes. The 16% senior notes due October 26, 2007 and the preferred stock warrants were issued in reliance on the exemption from registration provided by Section 4(2) of the Securities Act.
On July 27, 2004, the registrant issued $85,942,188 aggregate principal amount of 11 3/4% senior subordinated notes due 2006 to The Jefferies Investors and The TCW Funds in exchange for all then outstanding principal and accrued but unpaid interest on its 11 3/4% Series A senior notes due 2006 which were issued on June 28, 2001. The 11 3/4% senior subordinated notes due 2006 were issued in reliance on the exemption from registration provided by Section 4(2) of the Securities Act.
On November 9, 2005, the registrant issued $33,492,207 aggregate principal amount of 16% senior notes due February 1, 2010 (or such later maturity date as automatically extended in accordance with Section 7 thereof (but in no event later than February 1, 2015)) (the “senior notes”) to The Jefferies Investors and The TCW Funds in exchange for all then outstanding principal and accrued but unpaid interest on its 16% senior notes due October 27, 2006. The senior notes were issued in reliance on the exemption from registration provided by Section 4(2) of the Securities Act. Interest on the senior notes is payable semi-annually in the form of additional senior notes.
On November 9, 2005, the registrant issued $99,6551,968 aggregate principal amount of 11 3/4% senior subordinated notes due May 1, 2010 (or such later maturity date as automatically extended in accordance with Section 7 thereof (but in no event later than May 1, 2015)) (the “senior subordinated notes”) to The Jefferies Investors and The TCW Funds in exchange for all then outstanding principal and accrued but unpaid interest on the 11 3/4% senior subordinated notes due 2006. The senior subordinated notes were issued in reliance on the
II-2
exemption from registration provided by Section 4(2) of the Securities Act. Interest on the senior subordinated notes is payable semi-annually in the form of additional senior subordinated notes.
| Item 16. | Exhibits and financial statement schedules |
| | |
| *1.1 | | — Form of Underwriting Agreement |
| **3.1 | | — Form of Amended and Restated Certificate of Incorporation |
| **3.2 | | — Form of Amended and Restated Bylaws |
| *4.1 | | — Form of Common Stock Certificate |
| **4.2 | | — Registration Rights Agreement |
| 4.3 | | — Agreement and Plan of Merger dated June 30, 2006 |
| 4.4 | | — Form of Recapitalization Agreement |
| *5.1 | | — Opinion of Vinson & Elkins L.L.P. |
| **10.1 | | — Second Amended and Restated Loan Agreement |
| **10.2 | | — First Amendment to Second Amended and Restated Loan Agreement |
| **10.3 | | — Second Amendment to Second Amended and Restated Loan Agreement |
| **10.4 | | — Amended and Restated Equity Incentive Plan |
| *10.5 | | — Form of 2006 Long-Term Incentive Plan |
| **10.6 | | — Employment Agreement of Terry W. Carter |
| **10.7 | | — Employment Agreement of Eddie M. LeBlanc, III |
| **10.8 | | — Employment Agreement of David L. McCabe |
| **10.9 | | — Employment Agreement of Steve Limke |
| **10.10 | | — Employment Agreement of David A. Rice |
| **10.11 | | — Amendment to Employment Agreement of Terry W. Carter |
| **10.12 | | — Amendment to Employment Agreement of Eddie M. LeBlanc, III |
| **10.13 | | — Amendment to Employment Agreement of David L. McCabe |
| **10.14 | | — Amendment to Employment Agreement of Steve Limke |
| **10.15 | | — Amendment to Employment Agreement of David A. Rice |
| 10.16 | | — Security Agreement dated July 27, 2004 |
| 10.17 | | — ISDA Master Agreement dated March 9, 2006 |
| 10.18 | | — ISDA Master Agreement dated July 27, 2004 |
| **21.1 | | — Subsidiaries of the Company |
| 23.1 | | — Consent of Ernst & Young LLP |
| 23.2 | | — Consent of Netherland, Sewell & Associates, Inc. |
| 23.3 | | — Consent of LaRoche Petroleum Consultants, Ltd. |
| *23.4 | | — Consent of Vinson & Elkins L.L.P. (contained in Exhibit 5.1 hereto) |
| **24.1 | | — Power of Attorney (included on the signature page to this Registration Statement) |
| * | To be filed by amendment. |
| (b) | Consolidated Financial Statement Schedules: |
All schedules are omitted because the required information is inapplicable or the information is presented in the Consolidated Financial Statements or related notes.
II-3
The undersigned Registrant hereby undertakes:
(a) Insofar as indemnification for liabilities arising under the Securities Act of 1933 may be permitted to directors, officers and controlling persons of the Registrant pursuant to the provisions described in Item 14, or otherwise, the Registrant has been advised that in the opinion of the SEC such indemnification is against public policy as expressed in the Act and is, therefore, unenforceable. In the event that a claim for indemnification against such liabilities (other than the payment by the Registrant of expenses incurred or paid by a director, officer or controlling person of the Registrant in the successful defense of any action, suit or proceeding) is asserted by such director, officer or controlling person in connection with the securities being registered, the Registrant will, unless in the opinion of its counsel the matter has been settled by controlling precedent, submit to a court of appropriate jurisdiction the question whether such indemnification by it is against public policy as expressed in the Act and will be governed by the final adjudication of such issue.
(b) To provide to the underwriters at the closing specified in the underwriting agreement, certificates in such denominations and registered in such names as required by the underwriters to permit prompt delivery to each purchaser.
(c) For purpose of determining any liability under the Securities Act of 1933, the information omitted from the form of prospectus filed as part of this Registration Statement in reliance upon Rule 430A and contained in the form of prospectus filed by the Registrant pursuant to Rule 424(b)(1) or (4) or 497(h) under the Securities Act shall be deemed to be part of this Registration Statement as of the time it was declared effective.
(d) For the purpose of determining any liability under the Securities Act of 1933, each post-effective amendment that contains a form of prospectus shall be deemed to be a new registration statement relating to the securities offered therein, and the offering of such securities at that time shall be deemed to be the initial bona fide offering thereof.
II-4
Signatures
Pursuant to the requirements of the Securities Act of 1933, as amended, the registrant has duly caused this registration statement to be signed on its behalf by the undersigned, thereunto duly authorized, in the City of Plano, State of Texas, on the 19th day of September, 2006.
| | |
| Ascent Energy Inc. |
| |
By: | | /S/ TERRY W. CARTER |
| | Terry W. Carter President, Chief Executive Officer and Director |
Pursuant to the requirements of the Securities Act of 1933, as amended, this registration statement has been signed below by the following persons in the capacities indicated on the 19th day of September, 2006.
| | |
Signature | | Title |
| |
/S/ TERRY W. CARTER Terry W. Carter | | President, Chief Executive Officer and Director (Principal Executive Officer) |
| |
/S/ EDDIE M. LEBLANC, III Eddie M. LeBlanc, III | | Executive Vice President, Chief Financial Officer, Treasurer and Secretary (Principal Financial Officer and Principal Accounting Officer) |
| |
* James L. Luikart | | Chairman of the Board of Directors |
| |
* Stuart B. Katz | | Director |
| |
* Robert J. Welch | | Director |
| | |
| |
| | |
| * By: | | /S/ TERRY W. CARTER |
| | Terry W. Carter |
| | Attorney-in-fact |
II-5
Index to Exhibits
| | |
| *1.1 | | — Form of Underwriting Agreement |
| |
| **3.1 | | — Form of Amended and Restated Certificate of Incorporation |
| |
| **3.2 | | — Form of Amended and Restated Bylaws |
| |
| *4.1 | | — Form of Common Stock Certificate |
| |
| **4.2 | | — Registration Rights Agreement |
| |
| 4.3 | | — Agreement and Plan of Merger dated June 30, 2006 |
| |
| 4.4 | | — Form of Recapitalization Agreement |
| |
| *5.1 | | — Opinion of Vinson & Elkins L.L.P. |
| |
| **10.1 | | — Second Amended and Restated Loan Agreement |
| |
| **10.2 | | — First Amendment to Second Amended and Restated Loan Agreement |
| |
| **10.3 | | — Second Amendment to Second Amended and Restated Loan Agreement |
| |
| **10.4 | | — Amended and Restated Equity Incentive Plan |
| |
| *10.5 | | — Form of 2006 Long-Term Incentive Plan |
| |
| **10.6 | | — Employment Agreement of Terry W. Carter |
| |
| **10.7 | | — Employment Agreement of Eddie M. LeBlanc, III |
| |
| **10.8 | | — Employment Agreement of David L. McCabe |
| |
| **10.9 | | — Employment Agreement of Steve Limke |
| |
| **10.10 | | — Employment Agreement of David A. Rice |
| |
| **10.11 | | — Amendment to Employment Agreement of Terry W. Carter |
| |
| **10.12 | | — Amendment to Employment Agreement of Eddie M. LeBlanc, III |
| |
| **10.13 | | — Amendment to Employment Agreement of David L. McCabe |
| |
| **10.14 | | — Amendment to Employment Agreement of Steve Limke |
| |
| **10.15 | | — Amendment to Employment Agreement of David A. Rice |
| |
| 10.16 | | — Security Agreement dated July 27, 2004 |
| |
| 10.17 | | — ISDA Master Agreement dated March 9, 2006 |
| |
| 10.18 | | — ISDA Master Agreement dated July 27, 2004 |
| |
| **21.1 | | — Subsidiaries of the Company |
| |
| 23.1 | | — Consent of Ernst & Young LLP |
| |
| 23.2 | | — Consent of Netherland, Sewell & Associates, Inc. |
| |
| 23.3 | | — Consent of LaRoche Petroleum Consultants, Ltd. |
| |
| *23.4 | | — Consent of Vinson & Elkins L.L.P. (contained in Exhibit 5.1 hereto) |
| |
| **24.1 | | — Power of Attorney (included on the signature page to this Registration Statement) |
| * | To be filed by amendment. |