
UNITED STATES
SECURITIES AND EXCHANGE COMMISSION
WASHINGTON, D.C. 20549
FORM 20-F
¨ REGISTRATION STATEMENT PURSUANT TO SECTION 12(b) OR (g)
OF THE SECURITIES EXCHANGE ACT OF 1934
OR
x ANNUAL REPORT PURSUANT TO SECTION 13 OR 15(d)
OF THE SECURITIES EXCHANGE ACT OF 1934
For the fiscal year ended: December 31, 2011
OR
¨ TRANSITION REPORT PURSUANT TO SECTION 13 OR 15(d) OF THE
SECURITIES EXCHANGE ACT OF 1934
¨ SHELL COMPANY REPORT PURSUANT TO SECTION 13 OR 15(d) OF THE SECURITIES EXCHANGE ACT OF 1934
Commission file number: 001-15276
ITAÚ UNIBANCO HOLDING S.A. (*)
(Exact name of Registrant as specified in its charter)
(*) Former corporate name Banco Itaú Holding Financeira S.A.
N/A
(Translation of Registrant’s name into English)
Federative Republic of Brazil
(Jurisdiction of incorporation)
Praça Alfredo Egydio de Souza Aranha, 100
04344-902 São Paulo, SP, Brazil
Alfredo Egydio Setubal (Investor Relations Officer)
e-mail:aes-drinvest@itau-unibanco.com.br
Telephone number: +55-11-5019-1549
Securities registered or to be registered pursuant to Section 12(b) of the Act:
| Title of each share: | | Name of each exchange on which registered: |
| Preferred Share, without par value | | New York Stock Exchange* |
| American Depositary Shares (as evidenced by | | |
| American Depositary Receipts), each | | |
| representing 1(one) Share of Preferred Stock | | New York Stock Exchange |
*Not for trading purposes, but only in connection with the listing of American Depositary Shares pursuant to the requirements of the Securities and Exchange Commission.
Securities registered or to be registered pursuant to Section 12(g) of the Act:
None.
Securities for which there is a reporting obligation
pursuant to Section 15(d) of the Act:
None.
The number of outstanding shares of each class of stock of ITAÚ UNIBANCO HOLDING S.A., as of December 31, 2011 was:
2,289,284,300 Common Shares, no par value per share
2,224,355,729 Preferred Shares, no par value per share
Indicate by check mark if the registrant is a well-known seasoned issuer, as defined in Rule 405 of the Securities Act.
Yes x No ¨
If this report is an annual or transition report, indicate by check mark if the registrant is not required to file reports pursuant to Section 13 or 15(d) of the Securities Exchange Act of 1934.
Yes ¨ No x
Indicate by check mark whether the registrant (1) has filed all reports required to be filed by Section 13 or 15(d) of the Securities Exchange Act of 1934 during the preceding 12 months (or for such shorter period that the registrant was required to file such reports) and (2) has been subject to such filing requirements for the past 90 days.
Yes x No ¨
Indicate by check mark whether the registrant has submitted electronically and posted on its corporate Web site, if any, every Interactive Data File required to be submitted and posted pursuant to Rule 405 of Regulation S-T (§232.405 of this chapter) during the preceding 12 months (or for such shorter period that the registrant was required to submit and post such files).
Yes x No ¨
Indicate by check mark whether the registrant is a large accelerated filer, an accelerated filer, or a non-accelerated filer. See definition of “accelerated filer and large accelerated filer” in Rule 12b-2 of the Exchange Act. (Check one):
Large accelerated filer x Accelerated filer ¨ Non-accelerated filer¨
Indicate by check mark which basis of accounting the registrant has used to prepare the financial statements included in this filing:
| U.S. GAAP¨ | | International Financial Reporting Standards as issued by the International Accounting Standards Boardx | | Other¨ |
If “Other” has been checked in response to the previous question, indicate by check mark which financial statement item the registrant has elected to follow.
Item 17 ¨ Item 18 x
If this is an annual report, indicate by check mark whether the registrant is a shell company (as defined in Rule 12b-2 of the Exchange Act).
Yes ¨ No x
TABLE OF CONTENTS
| | | Page |
| | | |
| PART I |
| | | |
| ITEM 1 | IDENTITY OF DIRECTORS, SENIOR MANAGEMENT AND ADVISORS | 2 |
| | | |
| ITEM 2 | OFFER STATISTICS AND EXPECTED TIMETABLE | 2 |
| | | |
| ITEM 3 | KEY INFORMATION | 3 |
| | | |
| 3A. | Selected Financial Data | 3 |
| 3B. | Capitalization and Indebtedness | 9 |
| 3C. | Reasons for the Offer and Use of Proceeds | 9 |
| 3D. | Risk Factors | 10 |
| | | |
| ITEM 4 | INFORMATION ON THE COMPANY | 20 |
| | | |
| 4A. | History and Development of the Company | 20 |
| 4B. | Business Overview | 23 |
| 4C. | Organizational Structure | 113 |
| 4D. | Property, Plants and Equipment | 114 |
| | | |
| ITEM 4A | UNRESOLVED STAFF COMMENTS | 114 |
| | | |
| ITEM 5 | OPERATING AND FINANCIAL REVIEW AND PROSPECTS | 115 |
| | | |
| 5A. | Operating Results | 115 |
| 5B. | Liquidity and Capital Resources | 136 |
| 5C. | Research and Development, Patents and Licenses, Etc. | 145 |
| 5D. | Trend Information | 145 |
| 5E. | Off-Balance Sheet Arrangements | 146 |
| 5F. | Tabular Disclosure of Contractual Obligations | 147 |
| | | |
| ITEM 6 | DIRECTORS, SENIOR MANAGEMENT AND EMPLOYEES | 148 |
| | | |
| 6A. | Directors and Senior Management | 148 |
| 6B. | Compensation | 153 |
| 6C. | Board Practices | 154 |
| 6D. | Employees | 160 |
| 6E. | Share Ownership | 161 |
| | | |
| ITEM 7 | MAJOR SHAREHOLDERS AND RELATED PARTY TRANSACTIONS | 164 |
| | | |
| 7A. | Major Shareholders | 164 |
| 7B. | Related Party Transactions | 165 |
| 7C. | Interests of Experts and Counsel | 167 |
| | | |
| ITEM 8 | FINANCIAL INFORMATION | 168 |
| | | |
| 8A. | Consolidated Financial Statements and Other Financial Information | 168 |
| 8B. | Significant Changes | 172 |
| | | |
| ITEM 9 | THE OFFER AND LISTING | 173 |
| | | |
| 9A. | Offer and Listing Details | 173 |
| 9B. | Plan of Distribution | 175 |
| 9C. | Markets | 176 |
| 9D. | Selling Shareholders | 181 |
| 9E. | Dilution | 181 |
| 9F. | Expenses of the Issue | 181 |
| | | |
| ITEM 10 | ADDITIONAL INFORMATION | 182 |
| | | |
| 10A. | Share Capital | 182 |
| 10B. | Memorandum and Articles of Association | 182 |
| 10C. | Material Contracts | 191 |
| 10D. | Exchange Controls | 191 |
| 10E. | Taxation | 192 |
| 10F. | Dividends and Paying Agents | 198 |
| 10G. | Statement by Experts | 198 |
| 10H. | Documents on Display | 198 |
| 10I. | Subsidiary Information | 199 |
| | | |
| ITEM 11 | QUANTITATIVE AND QUALITATIVE DISCLOSURES ABOUT MARKET RISK | 200 |
| | | |
| ITEM 12 | DESCRIPTION OF SECURITIES OTHER THAN EQUITY SECURITIES | 211 |
| | | |
| 12A. | Debt Securities | 211 |
| 12B. | Warrants and Rights | 211 |
| 12C. | Other Securities | 211 |
| 12D. | American Depositary Shares | 211 |
| | | |
| PART II |
| | | |
| ITEM 13 | DEFAULTS, DIVIDEND ARREARAGES AND DELINQUENCIES | 212 |
| | | |
| ITEM 14 | MATERIAL MODIFICATIONS TO THE RIGHTS OF SECURITY HOLDERS AND USE OF PROCEEDS | 212 |
| | | |
| ITEM 15 | CONTROLS AND PROCEDURES | 213 |
| | | |
| ITEM 16 | [RESERVED] | 214 |
| | | |
| 16A. | Audit Committee Financial Expert | 214 |
| 16B. | Code of Ethics | 214 |
| 16C. | Principal Accountant Fees and Services | 214 |
| 16D. | Exemptions from the Listing Standards for Audit Committees | 215 |
| 16E. | Purchases of Equity Securities by the Issuer and Affiliated Purchasers | 216 |
| 16F. | Change in Registrant’s Certifying Accountant | 216 |
| 16G. | Corporate Governance | 216 |
| | | |
| PART III |
| | | |
| ITEM 17 | FINANCIAL STATEMENTS | 219 |
| | | |
| ITEM 18 | FINANCIAL STATEMENTS | 219 |
| | | |
| itEM 19 | EXHIBITS | 220 |
INTRODUCTION
All references in this annual report to (1) “Itaú Unibanco Holding,” “Itaú Holding,” ”we,” “us,” or “our,” are to Itaú Unibanco Holding S.A. (formerly Banco Itaú Holding Financeira S.A.) and its consolidated subsidiaries, except where otherwise specified or the context otherwise requires; (2) “Itaú Unibanco,” is to Itaú Unibanco S.A. (formerly Banco Itaú S.A.) and “Itaú BBA” is to Banco Itaú BBA S.A., in each case, together with its consolidated subsidiaries, except where otherwise specified or the context otherwise requires; (3) the “Itaú Financial Group” are to Itaú Holding and all of its subsidiaries before the Association; (4) the “Unibanco Financial Group” are to Unibanco Holdings and all of its subsidiaries before the Association; (5) “Itaú Unibanco Group” is to Itaú Unibanco Holding together with its subsidiaries and affiliates; (6) the “Brazilian government” is to the federal government of the Federative Republic of Brazil; (7) “preferred shares” and “common shares” are to our authorized and outstanding shares of preferred stock and common stock, designated asações preferenciaisandações ordinárias, respectively, each without par value; (8) “ADSs” are to our American Depositary Shares (one ADS represents one preferred share); (9) the “real,” “reais” or “R$” are to Brazilianreais, the official currency of Brazil, and (10) “US$,” “dollars” or “U.S. dollars” are to United States dollars.
As of December 31, 2011 and March 21, 2012, the selling rate for purchasing U.S. dollars was R$1.8758 to US$1.00 and R$1.8267 to US$1.00, respectively.
We have prepared our consolidated financial statements included in this annual report under Item 18, in accordance with International Financial Reporting Standards(“IFRS”) as issued by the International Accounting Standards Board (“IASB”), as of December 31, 2011 and 2010 and January 1, 2010, and for the years ended December 31, 2011 and 2010. Until December 31, 2010, we prepared our consolidated financial information in accordance with generally accepted accounting principles in the United States (“U.S. GAAP”). All 2011 and 2010 financial data included in this report, unless stated otherwise, has been prepared in accordance with IFRS.
We use accounting practices adopted in Brazil applicable to the institutions authorized to operate by the Central Bank for our reports to Brazilian shareholders, in filings with the Brazilian Securities Commission(Comissão de Valores Mobiliários), or the CVM, for the determination of dividend payments, and for the determination of tax liability.
Our fiscal year ends on December 31, and references in this annual report to any specific fiscal year are to the twelve-month period ended December 31 of such year.
Certain industry data presented in this annual report have been derived from the following sources: the Central Bank System (Sistema do Banco Central),or SISBACEN, a database of information provided by financial institutions to the Central Bank; the Brazilian association of leasing companies (Associação Brasileira de Empresas de Leasing),or ABEL; the Brazilian government development bank (Banco Nacional de Desenvolvimento Econômico e Social), or BNDES; the Brazilian financial and capital markets association (Associação Brasileira das Entidades dos Mercados Financeiros e de Capitais), or ANBIMA; the National Monetary Council (Conselho Monetário Nacional), or CMN, and the insurance industry regulator (Superintendência de Seguros Privados), or SUSEP.
You should assume that the information appearing in this annual report is accurate only as of the date to which it refers or as of the date of this annual report, as the case may be. Our business, financial condition, results of operations and prospects may have changed since that date.
CAUTIONARY STATEMENT REGARDING FORWARD-LOOKING STATEMENTS
This annual report contains statements that are or may constitute forward-looking statements, including but not limited to statements in “Item 3D. Risk Factors,” “Item 4B. Business Overview” and “Item 5. Operating and Financial Review and Prospects.” We have based these forward-looking statements largely on our current expectations and projections about future events and financial trends affecting our business. These forward-looking statements are subject to risks, uncertainties and assumptions including, among other risks:
| · | General economic, political and business conditions in Brazil and changes in inflation, interest rates, exchange rates and the performance of financial markets; |
| · | Disruptions and volatility in the global financial markets; |
| · | Difficulties in integrating acquired or merged businesses; |
| · | Government regulations and tax laws and changes therein; |
| · | Competition and industry consolidation; |
| · | Increases in reserve and compulsory deposit requirements; |
| · | Changes in our loan, securities and derivatives portfolios; |
| · | Our exposure to Brazilian federal government debt; |
| · | Incorrect pricing expectations and inadequate reserves; |
| · | Effectiveness of our risk management policies; |
| · | Failure in, or breach of, our operational or security systems or infrastructure; |
| · | Losses associated with counterparty exposures; |
| · | The ability of our controlling shareholder to direct our business; |
| · | Regulation of our business on a consolidated basis; |
| · | Integration of acquired and merged businesses; and |
| · | Other risk factors as set forth under “Item 3D. Risk Factors”. |
The words “believe,” “may,” “will,” “estimate,” “continue,” “anticipate,” “intend,” “expect” and similar words are intended to identify forward-looking statements, but are not the exclusive means of identifying such statements. We undertake no obligation to update publicly or revise any forward-looking statements because of new information, future events or otherwise. In light of these risks and uncertainties, the forward-looking information, events and circumstances discussed in this annual report might not occur. Our actual results and performance could differ substantially from those anticipated in such forward-looking statements.
ITEM 1 IDENTITY OF DIRECTORS, SENIOR MANAGEMENT AND ADVISORS
Not applicable.
ITEM 2 OFFER STATISTICS AND EXPECTED TIMETABLE
Not applicable.
ITEM 3 KEY INFORMATION
3A. Selected Financial Data
You should read the following selected financial data in conjunction with the “Introduction” and “Item 5. Operating and Financial Review and Prospects” included in this annual report. The information below is qualified in its entirety by reference to our consolidated financial statements included in Item 18 in this annual report.
We maintain our books and records inreais, the official currency of Brazil, and prepare our financial statements for statutory and regulatory purposes in accordance with accounting practices adopted in Brazil applicable to institutions authorized to operate by the Central Bank, or Brazilian GAAP. Accounting principles and standards generally applicable under Brazilian GAAP include those established by Brazilian Corporate Law (Law No. 6,404, as amended, including Law No. 11,638), by the accounting pronouncements committee (Comitê de Pronunciamentos Contábeis), or CPC, which began issuing standards in 2007, and by the federal accounting council (Conselho Federal de Contabilidade), or CFC, while interpretative guidance was issued before the CPC became active by the Brazilian professional body of independent accountants (Instituto dos Auditores Independentes do Brasil), or IBRACON. In the case of companies subject to regulation by the Central Bank, such as Itaú Unibanco Holding, the effectiveness of accounting pronouncements issued by accounting standard setters, such as the CPC, depends on approval of the pronouncement by the (Conselho Monetário Nacional), or CMN and the Central Bank which also establishes the effective date of the pronouncements. In addition, the CVM and other regulatory entities, such as SUSEP and the Central Bank, provide additional industry-specific guidelines. See “Item 9C. Markets” for additional information.
Notwithstanding the above, we have derived the data we present in the tables below from our audited consolidated financial statements for the years presented. You should read all of the data in the tables below together with the consolidated financial statements and notes included in “Item 18. Financial Statements” and the information we provide in “Item 5. Operating and Financial Review and Prospects.” Except where we have indicated otherwise, we have prepared all of the consolidated financial information in this document in accordance with IFRS as issued by IASB. Until December 31, 2010, we prepared our consolidated financial information in accordance U.S. GAAP. All 2011 and 2010 data included in this report has been prepared in accordance with IFRS as issued by the IASB. Our group division and segment data come from our management reporting systems and are not based on, or prepared in accordance with, IFRS. For a discussion of the major differences between our management reporting systems and our consolidated financial statements under IFRS, see “Item 5A. Operating Results – Our Business Operating Segments” and note 33 to our consolidated financial statements.
The consolidated financial statements as of December 31, 2011, 2010 and January 1, 2010 included in this annual report have been audited by PricewaterhouseCoopers Auditores Independentes, an independent registered public accounting firm, as stated in their report included elsewhere in this annual report.
IFRS Selected Financial Data
This information is qualified in its entirety by reference to the consolidated financial statements included in Item 18.
| | | For the Year Ended December 31, | |
| Statement of Income | | 2011 | | | 2010 | |
| | | (in millions of R$) | |
| Banking product | | | 74,276 | | | | 69,415 | |
| Losses on loans and claims | | | (16,072 | ) | | | (12,938 | ) |
| Operating margin | | | 58,204 | | | | 56,477 | |
| General and administrative expenses | | | (35,674 | ) | | | (34,632 | ) |
| Tax expenses | | | (4,166 | ) | | | (4,164 | ) |
| Share of comprehensive income of unconsolidated companies | | | (113 | ) | | | 349 | |
| Current income tax and social contribution | | | (6,956 | ) | | | (4,042 | ) |
| Deferred income tax and social contribution | | | 3,315 | | | | (1,494 | ) |
| Net income | | | 14,610 | | | | 12,494 | |
| Net income attributable to non-controlling interests | | | (773 | ) | | | (786 | ) |
| Net income attributable to owners of the parent company | | | 13,837 | | | | 11,708 | |
Earnings and Dividend per Share Information (4)
| | | For the Year Ended December 31, | |
| | | 2011 | | | 2010 | |
| | | (in R$, except number of shares) | |
| Basic earnings per share(1): | | | | | | | | |
| Common | | | 3.06 | | | | 2.58 | |
| Preferred | | | 3.06 | | | | 2.58 | |
| Diluted earnings per share(1): | | | | | | | | |
| Common | | | 3.05 | | | | 2.57 | |
| Preferred | | | 3.05 | | | | 2.57 | |
| Dividends and interest on stockholders’ equity per share(2): | | | | | | | | |
| Common | | | 0.97 | | | | 0.86 | |
| Preferred | | | 0.97 | | | | 0.86 | |
| Weighted average number of shares outstanding - basic | | | | | | | | |
| Common | | | 2,289,284,275 | | | | 2,289,284,273 | |
| Preferred | | | 2,240,026,557 | | | | 2,246,784,818 | |
| Weighted average number of shares outstanding - diluted | | | | | | | | |
| Common | | | 2,289,284,275 | | | | 2,289,284,273 | |
| Preferred | | | 2,251,061,836 | | | | 2,260,240,831 | |
(1) Earnings per share have been computed following the “two class method” set forth by IAS 33 Earnings Per Share. See “Item 10B. Memorandum and Articles of Association” for a description of our two classes of stock. See note 27 to our consolidated financial statements for a detailed calculation of earnings per share.
(2)Under Brazilian Corporate Law, we are allowed to pay interest on stockholders’ equity as an alternative to paying dividends to our shareholders. See "Item 8A. Consolidated Financial Statements and Other Financial Information - Dividend Policy and Dividends" and “Item 10E. Taxation – Interest on Stockholders’ Equity” and note 20b to our consolidated financial statements for a description of interest on stockholders’ equity.
| | | For the Year Ended December 31, | |
| | | 2011 | | | 2010 | |
| | | (in US$) | |
| Dividends and interest on stockholders’ equity per share(1)(2): | | | | | | | | |
| Common | | | 0.52 | | | | 0.52 | |
| Preferred | | | 0.52 | | | | 0.52 | |
(1)Under Brazilian Corporate Law, we are allowed to pay interest on stockholders’ equity as an alternative to paying dividends to our stockholders. See "Item 8A. Consolidated Financial Statements and Other Financial Information - Dividend Policy and Dividends" and "Item 10E. Taxation - Brazilian Tax Considerations - Interest on Stockholders Equity" for a description of interest on stockholders’ equity.
(2)Translated into US$ fromreais at the selling rate established by the Central Bank at the end of the year in which dividends or interest on stockholders’ equity were paid or declared, as the case may be.
Balance Sheet Data
| | | As of December, 31 | |
| Assets | | 2011 | | | 2010 | |
| | | (in millions of R$) | |
| Cash and deposits on demand | | | 10,668 | | | | 10,172 | |
| Central Bank compulsory deposits | | | 98,053 | | | | 85,776 | |
| Interbank deposits | | | 27,821 | | | | 14,835 | |
| Securities purchased under agreements to resell | | | 92,248 | | | | 88,682 | |
| Financial assets held for trading | | | 121,889 | | | | 115,497 | |
| Financial assets designated at fair value through profit or loss | | | 186 | | | | 306 | |
| Derivatives | | | 8,754 | | | | 7,777 | |
| Available-for-sale financial assets | | | 47,510 | | | | 44,539 | |
| Held-to-maturity financial assets | | | 3,105 | | | | 3,170 | |
| Loan operations and lease operations, net | | | 322,391 | | | | 274,843 | |
| Other financial assets | | | 40,254 | | | | 40,945 | |
| Investments in unconsolidated companies | | | 2,544 | | | | 2,948 | |
| Fixed assets, net | | | 5,358 | | | | 4,801 | |
| Intangible assets, net | | | 3,825 | | | | 2,934 | |
| Tax assets | | | 26,088 | | | | 24,142 | |
| Assets held for sale | | | 85 | | | | 78 | |
| Other assets | | | 7,357 | | | | 5,637 | |
| Total assets | | | 818,136 | | | | 727,082 | |
| | | | | | | | | |
| Average interest-earning assets (*) | | | 731,572 | | | | 592,744 | |
| Average non-interest-earning assets (*) | | | 59,248 | | | | 57,425 | |
| Average total assets (*) | | | 790,820 | | | | 650,169 | |
(*) See “Item 4B. Business Overview – Selected Statistical Information – Average Balance Sheet and Interest Rate Data” for more detailed information on our average assets, liabilities and stockholders’ equity for the years ended December 31, 2011 and 2010.
| | | As of December, 31 | |
| Liabilities | | 2011 | | | 2010 | |
| | | (in millions of R$) | |
| Deposits | | | 242,636 | | | | 202,688 | |
| Securities sold under repurchase agreements | | | 185,413 | | | | 199,657 | |
| Financial liabilities held for trading | | | 2,815 | | | | 1,335 | |
| Derivatives | | | 6,747 | | | | 5,671 | |
| Interbank market debt | | | 90,498 | | | | 62,599 | |
| Institutional market debt | | | 54,807 | | | | 44,513 | |
| Other financial liabilities | | | 44,119 | | | | 41,012 | |
| Reserves for insurance and private pension | | | 70,904 | | | | 56,864 | |
| Liabilities for capitalization plans | | | 2,838 | | | | 2,603 | |
| Provisions | | | 15,990 | | | | 14,457 | |
| Tax liabilities | | | 7,408 | | | | 12,110 | |
| Other liabilities | | | 18,625 | | | | 16,021 | |
| Total liabilities | | | 742,800 | | | | 659,530 | |
| Stockholders’ equity: | | | | | | | | |
| Capital | | | 45,000 | | | | 45,000 | |
| Treasury shares | | | (1,663 | ) | | | (628 | ) |
| Additional paid-in capital | | | 738 | | | | 490 | |
| Appropriated reserves | | | 24,279 | | | | 16,904 | |
| Unappropriated reserves | | | 5,561 | | | | 3,615 | |
| Cumulative comprehensive income | | | 26 | | | | 494 | |
| Total stockholders’ equity attributed to the owners of the the parent company | | | 73,941 | | | | 65,875 | |
| Non-controlling interests | | | 1,395 | | | | 1,677 | |
| Total liabilities and stockholders’ equity | | | 818,136 | | | | 727,082 | |
| | | | | | | | | |
| Average interest-bearing liabilities (*) | | | 580,695 | | | | 471,501 | |
| Average non-interest-bearing liabilities (*) | | | 142,740 | | | | 120,440 | |
| Total average stockholders’ equity (*) | | | 67,385 | | | | 57,736 | |
| Total average liabilities and stockholders’ equity (*) | | | 790,820 | | | | 650,169 | |
(*) See “Item 4B. Business Overview – Selected Statistical Information – Average Balance Sheet and Interest Rate Data” for more detailed information on our average assets, liabilities and stockholders’ equity for the years ended December 31, 2011 and 2010.
Selected Consolidated Ratios (%)
| | | For the Year Ended December 31, | |
| | | 2011 | | | 2010 | |
| Profitability and performance | | | | | | | | |
| Net interest margin (1) | | | 6.6 | | | | 7.8 | |
| Return on average assets(2) | | | 1.7 | | | | 1.8 | |
| Return on average equity (3) | | | 20.5 | | | | 20.3 | |
| | | | | | | | | |
| Liquidity | | | | | | | | |
| Loans and leases as a percentage of total deposits(4) | | | 142.7 | | | | 145.5 | |
| | | | | | | | | |
| Capital | | | | | | | | |
| Total stockholders' equity as a percentage of total assets(5) | | | 9.0 | | | | 9.1 | |
(1) Net interest income divided by average interest-earning assets. See “Item 4B. Business Overview - Selected Statistical Information – Average Balance Sheets and Interest Rate Data” for more detailed information on our average assets, liabilities and stockholders' equity for the years ended December 31, 2011 and 2010.
(2)Net income attributable to Itaú Unibanco Holding divided by average total assets. See “Item 4B. Business Overview - Selected Statistical Information – Average Balance Sheet and Interest Rate Data” for more detailed information on our average assets, liabilities and stockholders' equity for the years ended December 31, 2011 and 2010.
(3) Net income attributable to Itaú Unibanco Holding divided by average stockholders' equity. See “Item 4B. Business Overview - Selected Statistical Information – Average Balance Sheet and Interest Rate Data” for more detailed information on our average assets, liabilities and stockholders' equity for the years ended December 31, 2011 and 2010.
(4)Loans and leases operations as of year-end divided by total deposits as of year-end.
(5) Total stockholders' equity as of year-end divided by total assets as of year-end.
Exchange Rates
Before March 14, 2005, under Brazilian regulations, foreign exchange transactions were carried out on either the commercial rate exchange market or the floating rate exchange market. The commercial market was reserved primarily for foreign trade transactions and transactions that generally required prior approval from the Central Bank, such as registered investments by foreign persons and related remittances of funds abroad (including the payment of principal and interest on loans, notes, bonds and other debt instruments denominated in foreign currencies and registered with the Central Bank). The floating rate exchange market generally applied to specific transactions for which Central Bank approval was not required. Rates in the two markets were generally the same. On March 4, 2005, the CMN, through Resolution No. 3,265 effective March 14, 2005, as updated by CMN Resolution No. 3,568 of May 29, 2008, unified the two markets and allowed the exchange rate to float freely for all purposes. In addition, CMN issued Resolutions No. 3,844 and No. 3,845, both dated March 3, 2010, and the Central Bank issued Circulars No. 3,491, No. 3,492 and No. 3,493, all dated March 24, 2010, which consolidate and simplify certain exchange rules and related procedures. In 2011 the process of simplifying certain exchange rules and related procedures continued. By the issuance of Circular no. 3,545 on July 4, 2011, Central Bank adopted a new processing system of exchange transactions and revised the methodology of foreign exchange contracts. Currently, the Brazilian foreign exchange system allows the purchase and sale of foreign currency and the performance of international transfers inreais by any individual or legal entity, subject to certain regulatory procedures.
The Brazilian government may impose temporary restrictions on the conversion of Brazilian currency into foreign currencies and on the remittance to foreign investors of proceeds from their investments in Brazil. Brazilian law allows the government to impose these restrictions whenever there is a serious imbalance in Brazil’s balance of payments or there are reasons to foresee a serious imbalance. We cannot predict whether the Brazilian government will impose remittance restrictions in the future. The real may depreciate or appreciate substantially against the U.S. dollar in the future.
As of March 21, 2012, the U.S. dollar-real exchange rate was R$1.8267 to U$1.00.
The following table sets forth information on the selling rate for U.S. dollars as reported by the Central Bank for the periods and dates indicated.
| | | | Exchange Rate of Brazilian Currency per US$ 1.00 | |
| Year | | | Low | | | High | | | Average (1) | | | Period-End | |
| 2007 | | | | 1.7325 | | | | 2.1556 | | | | 1.9300 | | | | 1.7713 | |
| 2008 | | | | 1.5593 | | | | 2.5004 | | | | 1.8335 | | | | 2.3370 | |
| 2009 | | | | 1.7024 | | | | 2.4218 | | | | 1.9905 | | | | 1.7412 | |
| 2010 | | | | 1.6554 | | | | 1.8811 | | | | 1.7589 | | | | 1.6662 | |
| 2011 | | | | 1.5345 | | | | 1.9016 | | | | 1.6709 | | | | 1.5611 | |
| 2012 (through March 21, 2012) | | | | 1.7024 | | | | 1.8683 | | | | 1.7583 | | | | 1.8267 | |
| | | | | | | | | | | | | | | | | | | |
Source: Central Bank
(1) Represents the average of the exchange rates on the last day of each month during the relevant period.
| | | Exchange Rate of Brazilian Currency per US$ 1.00 | |
| Month | | Low | | | High | | | Average (1) | | | Period-End | |
| September 2011 | | | 1.6040 | | | | 1.9016 | | | | 1.7498 | | | | 1.8544 | |
| October 2011 | | | 1.6885 | | | | 1.8856 | | | | 1.7726 | | | | 1.6885 | |
| November 2011 | | | 1.7270 | | | | 1.8937 | | | | 1.7905 | | | | 1.8109 | |
| December 2011 | | | 1.7830 | | | | 1.8758 | | | | 1.8369 | | | | 1.8758 | |
| January 2012 | | | 1.7389 | | | | 1.8683 | | | | 1.7897 | | | | 1.7391 | |
| February 2012 | | | 1.7024 | | | | 1.7376 | | | | 1.7184 | | | | 1.7092 | |
| March 2012 (through March 21, 2012) | | | 1.7152 | | | | 1.7245 | | | | 1.7199 | | | | 1.8267 | |
Source: Central Bank
(1) Represents the average of the exchange rates on the last day of each month during the relevant period.
| 3B. | Capitalization and Indebtedness |
Not applicable.
| 3C. | Reasons for the Offer and Use of Proceeds |
Not applicable.
The following section does not describe all the risks of an investment in our preferred shares and ADSs. These are the risks we consider material as of the date of this annual report. There may be additional risks that we currently consider immaterial or of which we are currently unaware, and any of these risks could have similar effects to those set forth below.
Therefore, you should carefully read this annual report in its entirety. You should consider, among other things, the risk factors with respect to Itaú Unibanco Holding, to Brazilian financial institutions and to Brazil not normally associated with investments in securities of United States, European and other similar issuers, including those risk factors set out below. Our business, results of operations, financial condition or prospects could be negatively affected if any of such risks occurs, and as a result, the trading price of our preferred shares and ADSs could decline and you could lose all or part of your investment.
Risks Relating to Brazil
The Brazilian government has exercised, and continues to exercise, influence over the Brazilian economy. This influence, as well as Brazilian political and economic conditions, could have a material adverse effect on our business, financial condition and results of operations and, as a consequence, on the market price of our preferred shares and ADSs.
The Brazilian government from time to time intervenes in the Brazilian economy and makes changes in policies and regulations. The Brazilian government’s actions have involved, in the past, among other measures, changes in interest rates, changes in tax policies, price controls, capital control limits and restrictions on selected imports and, prior to the current floating exchange regime, currency devaluations. Our business, financial condition, and results of operations may be materially and adversely affected by changes in policies or regulations involving or affecting factors, such as:
| · | liquidity of capital, financial and credit markets; |
| · | general economic growth, inflation and currency fluctuations; |
| · | tax and regulatory policies; |
| · | restrictions on remittances abroad and other exchange controls; |
| · | increases in unemployment rates, decreases in wage and income levels and other factors that influence our customers’ ability to meet their obligations with us; and |
| · | other political, diplomatic, social and economic developments within and outside Brazil that affect the country. |
As a bank in Brazil, the vast majority of our income, expenses, assets and liabilities are directly tied to interest rates. Therefore, our results of operations and financial condition are significantly affected by inflation, interest rate fluctuations and related government monetary policies, all of which may have a material adverse effect on the growth of the Brazilian economy and on us, including our loan portfolio, our cost of funding and our income from credit operations.
In addition, changes in administrations may result in changes in government policy that may affect us. Uncertainty over whether the Brazilian government in the future will implement changes in policies or regulations affecting these and other factors in the future may contribute to heightened volatility in the Brazilian securities markets and in the securities of Brazilian issuers, which in turn may have a material adverse effect on us and, as a consequence, on the market price of our preferred shares and ADSs.
Inflation and fluctuation in interest rates could have a material adverse effect on our business, financial condition and results of operations.
Inflation and interest rate volatility have in the past caused material adverse effects in the Brazilian economy. While the Brazilian government has been able to keep inflation close to target levels since the introduction of inflation targets in 1999, we cannot assure you that it will continue to be able to do so. Inflation, especially sudden increases in inflation, usually causes the loss of purchasing power. Also prolonged periods of high inflation provoke distortions in the allocation of resources. From 2004 to 2011, the average annual inflation was 5.4%. Expected inflation for 2012, as surveyed by the Central Bank, is 5.28%.
Measures to combat historically high rates of inflation have included tight monetary policies with high interest rates, resulting in restrictions on credit and short-term liquidity. Between 2005 and 2011, the base interest rate established by the Central Bank, which is the benchmark interest rate payable to holders of securities issued by the Brazilian government and traded through the Special Clearing and Settlement System (Sistema Especial de Liquidação e Custódia), or the SELIC, varied between 19.75% per year and 8.75% per year. Public expectations regarding possible future governmental actions in the economy, government intervention in the foreign exchange market and the effects of the downturn in the global financial markets have caused and may continue to cause interest rates to fluctuate. In addition, if Brazil experiences fluctuations in rates of inflation in the future, our costs and net margins may be materially and adversely affected, and government measures to combat inflation may include tightening monetary policy with high interest rates which may harm our business. Increases in the SELIC rate could materially and adversely affect us by reducing the demand for credit, increasing our cost of funds and increasing the risk of customer default. Conversely, decreases in the SELIC rate could also materially and adversely affect us by decreasing revenues on interest-earning assets and lowering our margins.
Exchange rate instability may have a material adverse effect on the Brazilian economy and our business, financial condition and results of operations.
The Brazilian currency fluctuates in relation to the U.S. dollar and other foreign currencies. The Brazilian government has in the past implemented various economic plans and utilized a number of exchange rate regimes, including sudden devaluations, periodic mini-devaluations in which the frequency of adjustments has ranged from daily to monthly, floating exchange rate systems, and dual exchange rates coupled with exchange controls. Since 1999, Brazil has adopted a floating exchange rate system with interventions by the Central Bank in buying or selling foreign currency. From time to time, the exchange rate between thereal and the U.S. dollar and other currencies has fluctuated significantly. For example, thereal depreciated 15.7%, 34.3% and 24.2% against the U.S. dollar in 2001, 2002 and 2008, respectively, and appreciated 22.3%, 8.8%, 13.4%, 9.5%, 20.7%, 34.2% and 4.5% against the U.S. dollar in 2003, 2004, 2005, 2006, 2007, 2009 and 2010, respectively. In 2011, thereal depreciated 11.2% against the U.S. dollar from an exchange rate of R$1.67 per US$1.00 as of December 31, 2010 to an exchange rate of R$1.88 per US$1.00 as of December 31, 2011. The average exchange rate in 2011 was R$1.67 per US$1.00 compared with an average exchange rate of R$1.76 per US$1.00 in 2010.
Some of our assets and liabilities are denominated in, or indexed to, foreign currencies, especially the U.S. dollar. As of December 31, 2011, 27.0% of our total liabilities and 19.8% of our total assets were denominated in, or indexed to, a foreign currency. Although as of December 31, 2011, our material foreign investments were economically hedged in order to mitigate effects arising out of foreign exchange volatility, including the potential tax impact of such investments, there can be no assurance that such hedging strategies will remain in place or will offset such effects. Therefore, a depreciation of thereal could have several adverse effects on us, including (i) losses on our liabilities denominated in or indexed to foreign currencies, (ii) impairments to our ability to pay dollar-denominated or dollar-indexed liabilities by making it more costly for us to obtain the foreign currency required to pay such obligations, (iii) impairments to the ability of our borrowers to repay dollar-denominated or dollar-indexed liabilities to us and (iv) negatively affect the market price of our securities portfolio. Conversely, an appreciation of the Brazilian currency could cause us to incur losses on our assets denominated in or indexed to foreign currencies. Therefore, depending on the circumstances, either a depreciation or appreciation of thereal could have a material adverse effect on our business, financial condition and results of operations and, as a consequence, on the market price of our preferred shares and ADSs.
Developments and the perception of risk of other countries may adversely affect the Brazilian economy and the market price of Brazilian securities.
Economic and market conditions in other countries, including the United States, the European Union and emerging market countries, may affect to varying degrees the market value of securities of Brazilian issuers. Although economic conditions in these countries may differ significantly from economic conditions in Brazil, investors’ reactions to developments in these other countries may have a material adverse effect on the market value of securities of Brazilian issuers, the availability of credit in Brazil and the amount of foreign investment in Brazil. Crises in the European Union, the United States and emerging market countries may diminish investor interest in securities of Brazilian issuers, including Itaú Unibanco Holding. This could materially and adversely affect the market price of our securities, and could also make it more difficult for us to access the capital markets and finance our operations in the future on acceptable terms or at all.
Banks located in countries considered to be emerging markets may be particularly susceptible to disruptions and reductions in the availability of credit or increases in financing costs, which could have a material adverse impact on our financial condition. In addition, the availability of credit to entities that operate within emerging markets is significantly influenced by levels of investor confidence in such markets as a whole and any factor that impacts market confidence (for example, a decrease in credit ratings or state or central bank intervention in one market) could materially and adversely affect the price or availability of funding for entities within any of these markets.
Risks Relating to Our Business and the Banking Industry
We are exposed to effects of the disruptions and volatility in the global financial markets and the economies in those countries where we do business, especially Brazil.
Beginning in late 2007, major financial institutions, including some of the largest global commercial and investment banks, and insurance companies experienced significant difficulties, especially lack of liquidity and depreciation of financial assets. These difficulties constricted the ability of a number of major global financial institutions to engage in further lending activity and caused losses. In addition, defaults by, and doubts about the solvency of certain financial institutions and the financial services industry generally led to market-wide liquidity problems and could lead to losses or defaults by, and bankruptcies of, other institutions.
We are exposed to the disruptions and volatility in the global financial markets because of their effects on the financial and economic environment in the countries in which we operate, especially Brazil, such as a slowdown in the economy, an increase in the unemployment rate, a decrease in the purchasing power of consumers and the lack of credit availability. We lend primarily to Brazilian borrowers and these effects could materially and adversely affect our customers and increase our non-performing loans and, as a result, increase the risk associated with our lending activity and require us to make corresponding revisions to our risk management and loan loss reserve models. For example, in 2009, we experienced an increase in our non-performing loans past due more than 90 days from 3.9% of total loans in December 31, 2008 to 5.6% December 31, 2009. As of December 31, 2011, our non-performing loans past due more than 90 days represented 4.9% of our total loan portfolio.
The global financial downturn has had significant consequences for Brazil and the other countries in which we operate, including stock, interest and credit market volatility, a general economic slowdown, and volatile exchange rates that may, directly or indirectly, materially and adversely affect the market price of Brazilian securities and have a material adverse effect on our business, financial condition and results of operations. In addition, institutional failures and disruption of the financial market in Brazil and the other countries in which we operate could restrict our access to the public equity and debt markets.
Continued or worsening disruption or volatility in the global financial markets could lead to further increase in negative effects on the financial and economic environment in Brazil and the other countries in which we operate, which could have a material adverse effect on us.
A failure in, or breach of, our operational or security systems could temporarily interrupt our businesses, increasing our costs and causing losses.
Although we have high profile information security controls, continuing investments in infrastructure, and operations and crisis management in place, our business, financial, accounting, data processing systems or other operating systems and facilities may stop operating properly for a limited period of time or become temporarily disabled or damaged as a result of a number of factors including events that are wholly or partially beyond our control, such as: electrical or telecommunications outages; breakdowns, systems failures or other events affecting third parties with which we do business or that facilitate our business activities, including exchanges, clearing houses, financial intermediaries or vendors that provide services; events arising from local or larger-scale political or social matters and cyber attacks.
Temporary interruptions or failures in the physical infrastructure or operating systems that support our businesses and customers, or cyber attacks could result in customer attrition, regulatory fines, penalties or intervention, reimbursement or other compensation costs.
Changes in applicable law and regulation may have a material adverse effect on our business.
Brazilian banks, including us, are subject to extensive and continuous regulatory review by the Brazilian government, principally by the Central Bank. We have no control over applicable law and government regulations, which govern all aspects of our operations, including regulations that impose:
· minimum capital requirements;
· reserve and compulsory deposit requirements;
· restrictions on credit card activities;
· minimum levels for federal housing and rural sector lending;
· funding restrictions;
· lending limits, earmarked lending and other credit restrictions;
· limits on investments in fixed assets;
· corporate governance requirements;
· limitations on charging of commissions and fees by financial institutions for services to retail clients and the amount of interest financial institutions can charge;
· accounting and statistical requirements; and
· other requirements or limitations in the context of the global financial crisis.
The regulatory structure governing Brazilian financial institutions, including banks, broker-dealers and leasing companies, and Brazilian insurance companies is continuously evolving. Disruptions and volatility in the global financial markets resulting in liquidity problems at major international financial institutions could lead the Brazilian government to change laws and regulations applicable to Brazilian financial institutions based on such international developments.
In response to the global financial crisis which began in late 2007, national and intergovernmental regulatory entities, such as the Basel Committee on Banking Supervision, proposed reforms to prevent the recurrence of a similar crisis, including the Basel III framework. In 2012, the Central Bank issued preliminary guidance and an estimated timeline for implementation of the Basel III framework in Brazil. See “Item 4B. Business Overview — Regulation and Supervision — Regulation by the Central Bank — Capital Adequacy and Leverage/Regulatory Capital Requirements”. In addition, the Central Bank issued new rules for implementation of the Basel III framework in Brazil, as detailed in notice of Public Hearing 40/2012 of February 17, 2012. See “Item 4B. Business Overview — Regulation and Supervision - Capital Adequacy and Leverage/Regulatory Capital Requirements — Implementation of Basel III in Brazil”. In the event that Public Hearing 40/2012 is fully implemented as currently proposed by the Central Bank and based on our current regulatory capital ratios, as well as conservative assumptions on expected returns and asset growth, we do not anticipate that additional regulatory capital will be required to support our operations in the near future. However, depending on the outcome of Public Hearing 40/2012, we may need to reassess our ongoing funding strategy for regulatory capital.
Moreover, there are several proposed bills under consideration in the Brazilian congress that, if signed into law as currently drafted, could adversely affect us. For example, a proposed law to benefit insolvent individual borrowers would allow courts to change the terms and conditions of credit agreements in certain situations. In addition, another proposed bill to amend the rules of civil procedures could have the effect of making recovery more difficult and appealing unfavorable judicial decisions in higher courts more burdensome.
We also have operations in countries outside of Brazil, including Argentina, Chile, Paraguay, Uruguay, Portugal and the United States. Changes in the laws or regulations applicable to our business in the countries in which we operate or adoption of new laws, such as the Dodd-Frank Wall Street Reform and Consumer Protection Act in the United States, and the related rulemaking, may have a material adverse effect on our business, financial condition and results of operations.
The amendment of existing laws and regulations or the adoption of new laws and regulations could have a material adverse effect on our business, financial condition and results of operations, including our ability to provide loans, make investments or render certain financial services. See “ Item 4B. Business Overview — Regulation and Supervision”.
Tax reforms may have a material adverse impact on our results of operations.
To maintain its fiscal policies, the Brazilian government regularly enacts reforms to tax and other assessment regimes. These reforms include the enactment of new taxes, changes in the bases of calculation or rates of assessments, including rates applicable solely to the banking industry, and occasional enactment of temporary taxes for designated governmental purposes. For example, in July 2011, the Brazilian government introduced a tax on securities transactions or IOF/Securities-Derivatives at the rate of 1.0% on the notional adjusted value of financial derivatives. Also, the government changed twice the tax charged on consumer financial transactions in 2011: an increase of 1.5% per year in April and a reduction of 0.5% per year in December. See “ Item 4B. Business Overview — Regulation and Supervision— Taxation — Taxation on Financial Transactions”. The effects of these changes and any other changes that could result from the enactment of additional taxation cannot be quantified. These changes, however, may reduce our volume of operations, increase our costs or limit our profitability.
Future changes in tax policy that may affect financial operations include the creation of new taxes. Until 2007, certain financial transactions were subject to the provisional contribution on financial transactions (Contribuição Provisória sobre a Movimentação ou Transmissão de Valores e de Créditos e Direitos de Natureza Financeira or “CPMF”). However, much uncertainty exists as to whether the CPMF, or similar taxes, will be re-introduced in the future. Also, the Brazilian Congress may discuss broad tax reforms in Brazil to improve the efficiency of allocation of economic resources, as proposed by the executive branch of the Brazilian federal government. Major tax reforms in Brazil have been discussed over the last few years. We cannot predict if such tax reforms will be implemented in the future. The effects of these changes, if enacted, and any other changes that could result from the enactment of additional tax reforms, cannot be quantified.
Increases in reserve and compulsory deposit requirements may have a material adverse effect on business, financial condition and results of operations.
The Central Bank has periodically changed the level of reserves and compulsory deposits that financial institutions in Brazil are required to maintain with the Central Bank. The Central Bank may increase the reserve and compulsory deposits requirements in the future or impose new requirements.
Increases in reserve and compulsory deposit requirements reduce our liquidity to make loans and other investments and, as a result, may have a material adverse effect on business, financial condition and results of our operations.
The compulsory deposits generally do not yield the same return as other investments and deposits because a portion of compulsory deposits:
· do not bear interest;
· must be held in Brazilian federal government securities; and
· must be used to finance government programs, including a federal housing program and rural sector subsidies.
For more detailed information on compulsory deposits and capital requirements, see “Item 4B. Business Overview — Regulation and Supervision”.
As of December 31, 2011, we had R$92,323 million in interest-bearing compulsory deposits and R$5,730 million in non-interest-bearing compulsory deposits. For more detailed information on compulsory deposits, see “Item 4B. Business Overview — Selected Statistical Information — Central Bank Compulsory Deposits”.
The increasingly competitive environment and consolidations in the Brazilian banking industry may have a material adverse effect on us.
The markets for financial and banking services in Brazil are highly competitive. We face significant competition from other large Brazilian and international banks, including Brazilian public banks. Competition has increased as a result of recent consolidations among financial institutions in Brazil and as a result of new regulations by CMN that facilitate the customer’s ability to switch business between banks. See Item 4B. Business Overview – Regulation and Supervision. The increased competition may materially and adversely affect us by, among other things, limiting our ability to retain our existing consumer base, increase our customer base and to expand our operations, reducing our profit margins on banking and other services and products we offer, and to the extent it limits investment opportunities.
Changes in the profile of our business may have a material adverse effect on our loan portfolio.
As of December 31, 2011, our loan and financing portfolio was R$ 346,264 million, compared to R$294,837 million as of December 31, 2010. Our allowance for loan losses was R$23,873 million, representing 6.9% of our total loan portfolio, as of December 31, 2011, compared to R$19,994 million, representing 6.8% of our total loan portfolio, as of December 31, 2010. The quality of our loan portfolio is subject to changes in the profile of our business resulting from organic growth and our merger and acquisition activity and is dependent on domestic and, to a lesser extent, international economic conditions. Adverse changes affecting any of the sectors to which we have significant lending exposure, political events within and external to Brazil and the variability of economic activity may have a material adverse impact on our business and our results of operations. Furthermore, our historic loan loss experience may not be indicative of our future loan losses.
In addition, our strategy includes efforts to significantly expand our loan portfolio as well as increase the number of clients, particularly individuals and small and middle-market companies, that we serve. Certain financial products we offer to individuals and other clients are generally characterized by higher margins, but also higher risks of default. A future increase in our loan portfolio, as well as a shift to higher margins and higher risk products, could result in increased default rates, which could have a material adverse effect on our financial condition and results of operations.
The value of our securities and derivatives positions are subject to market fluctuations due to changes in Brazilian or international economic conditions and may produce material losses.
As of December 31, 2011, investment securities represented R$172,690 million, or 21.1% of our assets, and derivative financial instruments, which are used to hedge against risks in each of our business units, represented R$8,754 million, or 1.1% of our assets, and realized and unrealized gains and losses have had and will continue to have a significant impact on our results of operations. These gains and losses, which we record when investments in securities are sold or are marked to market (in the case of trading securities) or when our derivative financial instruments are marked to market, may fluctuate considerably from period to period and are impacted by domestic and international economic conditions. If, for example, we have entered into derivatives transactions to protect against decreases in the value of the real or in interest rates and the real increases in value or interest rates increase, we may incur financial losses. We cannot predict the amount of realized or unrealized gains or losses for any future period, and variations from period to period have no practical analytical value in helping us to make such a prediction. Such losses could materially and adversely affect our results of operations and financial condition. Gains or losses on our investment portfolio may not continue to contribute to net income at levels consistent with recent periods or at all, and we may not successfully realize the appreciation or depreciation now existing in our consolidated investment portfolio or any portion thereof.
Exposure to Brazilian federal government debt could have a material adverse effect on us.
Like many other Brazilian banks, we invest in debt securities of the Brazilian government. As of December 31, 2011, approximately 14.2% of our total assets, and 64.0% of our securities portfolio, was comprised of debt securities issued by the Brazilian government. Any failure by the Brazilian government to make timely payments under the terms of these securities, or a significant decrease in their market value, will have a material adverse effect on us.
If our pricing expectations are incorrect or our reserves for future policyholder benefits and claims are inadequate, the profitability of our insurance and pension products or our results of operations and financial condition may be materially and adversely affected.
Our insurance and pension plan business sets prices and establishes reserves for many of our insurance and pension products based upon actuarial or statistical estimates. The pricing of our insurance and pension products and the insurance and pension plans reserves carried to pay future policyholder benefits and claims are each based on models that include many assumptions and projections which are inherently uncertain and involve the exercise of significant judgment, including as to the levels of and timing of receipt or payment of premiums, contributions, benefits, claims, expenses, interest credits, investment results, interest rates, retirement, mortality, morbidity and persistency. Although we frequently review the pricing of our insurance and pensions products and the adequacy of our insurance and pension plans reserves, we cannot determine with precision the ultimate amounts that we will pay for, or the timing of payment of, actual benefits, claims and expenses or whether the assets supporting our policy liabilities, together with future premiums and contributions will be sufficient for payment of benefits and claims. Significant deviations in actual experience from our pricing assumptions could have a material adverse effect on the profitability of our insurance and pension plans products. In addition, if we conclude that our reserves, together with future premiums, are insufficient to cover future policy benefits and claims, we would be required to increase our reserves and incur income statement charges for the period in which the determination is made, which may have a material adverse effect on our business, financial condition and results of operations.
Our market, credit and operational risk management policies, procedures and methods may not be fully effective in mitigating our exposure to unidentified or unanticipated risks.
Our market, credit and operational risk management policies, procedures and methods, including our statistical modeling tools, such as value at risk (VaR), stress test and sensitivity analyses, may not be fully effective in mitigating our risk exposure in all economic market environments or against all types of risk, including risks that we fail to identify or anticipate. Some of our qualitative tools and metrics for managing risk are based upon our use of observed historical market behavior. We apply statistical and other tools to these observations to quantify our risk exposures. These qualitative tools and metrics may fail to predict future risk exposures. These risk exposures could, for example, arise from factors we did not anticipate or correctly evaluate in our statistical models. This would limit our ability to manage our risks. Our losses thus could be significantly greater than the historical measures indicate. In addition, our quantified modeling does not take all risks into account. Our more qualitative approach to managing those risks could prove insufficient, exposing us to material unanticipated losses. If existing or potential customers believe our risk management is inadequate, they could take their business elsewhere. This could harm our reputation as well as our revenues and profits.
In addition, our businesses depend on the ability to process a large number of transactions securely, efficiently and accurately. Losses can result from inadequate personnel, inadequate or failed internal control processes and systems, information systems failures or breaches or from external events that interrupt normal business operations. We also face the risk that the design of our controls and procedures for mitigating operational risk proves to be inadequate or is circumvented.
We may incur losses associated with counterparty exposures.
We face the possibility that a counterparty will be unable to honor its contractual obligations. These counterparties may default on their obligations due to bankruptcy, lack of liquidity, operational failure or other reasons. This risk may arise, for example, from entering into reinsurance agreements or loan facilities or other credit agreements under which counterparties have obligations to make payments to us; executing currency or other trades that fail to settle at the required time due to non-delivery by the counterparty or systems failure by clearing agents, exchanges, clearing houses or other financial intermediaries. In addition, we routinely transact with counterparties in the financial services industry, including brokers and dealers, commercial banks, investment banks, mutual and hedge funds and other institutional clients.
Our controlling shareholder has the ability to direct our business.
As of January 31, 2012, IUPAR, our controlling shareholder, directly owned 51.00% of our common stock and 25.54% of our total capital stock. See “Item 7A. Major Shareholders”. As a result, IUPAR has the power to control us, including the power to elect and remove our directors and officers and determine the outcome of any action requiring shareholder approval, including transactions with related parties, corporate reorganizations and the timing and payment of dividends. In addition, IUPAR is jointly controlled by Itaúsa, which is controlled by the Egydio de Souza Aranha family, and the former controlling shareholders of Unibanco, the Moreira Salles family. The interests of IUPAR, Itaúsa and the Egydio de Souza Aranha and Moreira Salles families may be different from your interests as a holder of our preferred shares and ADSs.
Investors in our securities do not have the same protections as if the majority of the members of our board of directors were independent.
As described in “Item 7A. Major Shareholders”, IUPAR is our controlling shareholder and, as a result, has the power to control us, including the power to elect and remove our directors and officers. Our current board of directors is comprised of 13 members; only three of those directors are independent in accordance with our corporate governance policy. As a foreign private issuer, we are subject to corporate governance standards, such as the New York Stock Exchange listed company rules, that differ from those applicable to U.S. domestic issuers, including with respect to director independence requirements. See “Item 16G. Corporate Governance.” A significant number of our directors participate in decision-making on matters in which they have greater interests than would an independent director. As a result, the interests of these directors may not be, at all times, the same as those of our securityholders. In addition, several of our directors are affiliated with IUPAR and circumstances may arise in which the interests of IUPAR and its affiliates conflict with the interests of our other stockholders. Where these and other conflicting interests exist, our securityholders will be dependent on our directors exercising, in a manner fair to all of our securityholders, their fiduciary duties as a member of our board of directors.
We are subject to regulation on a consolidated basis and may be subject to liquidation or intervention on a consolidated basis.
The Central Bank treats us and our subsidiaries and affiliates as a single financial institution for regulatory purposes. While our consolidated capital base provides financial strength and flexibility to our subsidiaries and affiliates, their activities could indirectly put our capital base at risk. In particular, any investigation of, or intervention by the Central Bank in, the affairs of any of our subsidiaries and affiliates could have a material adverse impact on our other subsidiaries and affiliates and ultimately on us.
Integration of acquired or merged businesses involves certain risks that may have a material adverse effect on us.
We have engaged in a number of mergers and acquisitions in the past and may make further acquisitions in the future as part of our growth strategy in the Brazilian financial services industry. We believe that these transactions will contribute to our continued growth and competitiveness in the Brazilian banking sector.
Any acquisition and merger of institutions and assets and the integration of such institutions and assets involves certain risks including the risk that:
| § | integrating new networks, information systems, personnel, financial and accounting systems, risk and other management systems, financial planning and reporting, products and customer bases into our existing business may run into difficulties, cause us to incur unexpected costs and operating expenses and place additional demands on management time; |
| § | we may incur unexpected liabilities or contingencies relating to the acquired businesses; |
| § | antitrust and other regulatory authorities may impose restrictions or limitations on the terms of the acquisition or merger, require disposition of certain assets or businesses or withhold their approval of such transaction; and |
| § | the expected operation and financial synergies and other benefits from such mergers or acquisitions may not be fully achieved. |
If we fail to achieve the business growth opportunities, cost savings and other benefits we anticipate from mergers and acquisition transactions, or incur greater integration costs than we have estimated, our results of operations and financial condition may be materially and adversely affected.
Risks Relating to the Preferred Shares and the ADSs
The relative volatility and illiquidity of the Brazilian securities markets may substantially limit your ability to sell the preferred shares underlying the ADSs at the price and time you desire.
Investing in securities that trade in emerging markets often involves greater risk than investing in securities of issuers in the United States or in other countries, and these investments are generally considered to be more speculative in nature. The Brazilian securities market is substantially smaller, less liquid, more concentrated and can be more volatile than major securities markets in the United States or in other countries. There is also significantly greater concentration in the Brazilian securities market than in major securities markets such as the United States or in other countries. The ten largest companies in terms of market capitalization represented 54.4% of the aggregate market capitalization of BM&FBOVESPA S.A. – Bolsa de Valores, Mercadorias e Futuros, or BM&FBOVESPA, as of December 31, 2011. Therefore, the ability of the holders to sell the preferred shares underlying the ADSs at the price and at time they desire may be limited.
The preferred shares and ADSs generally do not have voting rights.
According to our bylaws , holders of preferred shares, and therefore of the ADSs, are not entitled to vote at meetings of our shareholders, except in limited circumstances. See “Item 10B. Memorandum and Articles of Association.” In the limited circumstances where the preferred shareholders are able to vote, holders may exercise voting rights with respect to the preferred shares represented by ADSs only in accordance with the provisions of the deposit agreement relating to the ADSs.
Despite there are no provisions under Brazilian law or under our bylaws that limit ADS holders' ability to exercise their voting rights through the depositary bank with respect to the underlying preferred shares, there are practical limits to the ability of ADS holders to exercise their voting rights due to extra procedural steps involved in communicating with such holders. For example, our preferred shareholders will either receive notice of the meetings directly from us or through publication of notice in Brazilian newspapers and will be able to exercise their voting rights by either attending the meeting in person or voting by proxy. ADS holders, by comparison, will only receive notice of the meetings directly from us, if they are properly registered in our mailing list. If they are not registered in our mailing list, they will receive the notice only through the depositary bank.
According to the provisions of the deposit agreement, we will provide notice to the depositary bank, which will, in its turn, and to the extent practicable, mail such notice to holders and instructions on how the ADS holder can participate in the shareholders meeting. To exercise their voting rights, ADS holders must instruct the depositary bank on how to vote the shares represented by their ADSs. Because of this extra procedural step involving the depositary bank, the process for exercising voting rights is longer for ADS holders.
Holders of ADSs may be unable to exercise preemptive rights with respect to our preferred shares.
We may not be able to offer our preferred shares to U.S. holders of ADSs pursuant to preemptive rights granted to holders of our preferred shares in connection with any issuance of our preferred shares unless a registration statement under the Securities Act is effective with respect to the preferred shares and preemptive rights, or an exemption from the registration requirements of the Securities Act is available. However, as we are not obligated to file a registration statement relating to preemptive rights with respect to our preferred shares, we cannot assure you that we will file any such registration statement. If a registration statement is not filed and an exemptionfrom registration does not exist, The Bank of New York Mellon, as depositary, will attempt to sell the preemptive rights, and you will be entitled to receive the proceeds of the sale. However, these preemptive rights will expire if the depositary does not sell them in a timely manner, and U.S. holders of ADSs will not realize any value from the granting of the preemptive rights. For more information on the exercise of your preemptive rights, see “Item 10B. Memorandum and Articles of Association– Preemptive Rights on Increase in Preferred Share Capital.”
If you surrender your ADSs and withdraw preferred shares, you risk losing the ability to remit foreign currency abroad and certain Braziliantax advantages.
As a holder of ADSs, you benefit from the electronic certificate of foreign capital registration obtained by the custodian for our preferred shares underlying the ADSs in Brazil, which permits the custodian to convert dividends and other distributions with respect to the preferred shares into non-Brazilian currency and remit the proceeds abroad. If you surrender your ADSs and withdraw preferred shares, you will be entitled to continue to rely on the custodian’s electronic certificate of foreign capital registration for only five business days from the date of withdrawal. Thereafter, upon the disposition of or distributions relating to the preferred shares, you will not be able to remit abroad non-Brazilian currency unless you obtain your own electronic certificate of foreign capital registration or you qualify under Brazilian foreign investment regulations that entitle some foreign investors to buy and sell shares on Brazilian stock exchanges without obtaining separate electronic certificates of foreign capital registration. If you do not qualify under the foreign investment regulations you will generally be subject to less favorable tax treatment of dividends and distributions on, and the proceeds from any sale of, our preferred shares. If you attempt to obtain your own electronic certificate of foreign capital registration, you may incur expenses or suffer delays in the application process, which could delay your ability to receive dividends or distributions relating to our preferred shares or the return of your capital in a timely manner. Moreover, should you surrender your ADSs and withdraw preferred shares, applicable regulations require you to enter into corresponding exchange transactions and pay taxes on these exchange transactions. The depositary’s electronic certificate of foreign capital registration may also be adversely affected by future legislative changes.
Holders of our preferred shares and ADSs may not receive any dividends
According to our bylaws, we are obligated to pay our shareholders at least 25% of our annual adjusted net income, which may differ significantly from our net income calculated under IFRS. This adjusted net income may be capitalized, used to absorb losses or otherwise retained as allowed by Brazilian Corporate Law. In addition, Brazilian Corporate Law allows us to suspend the mandatory distribution of dividends in any particular year if our board of directors informs our shareholders that such distribution would be incompatible with our financial condition. See “Item 8A. Consolidated Financial Statements and Other Financial Information – Dividend Policy and Dividends” and “Item 10B. Memorandum and Article of Association – Calculation of Distributable Amount.”
As a holder of ADSs, you have shareholder rights that differ from those of shareholders of companies organized under the laws of the United States or other jurisdictions
Our corporate affairs are governed by the Brazilian Corporate Law and our bylaws, which may differ from the legal principles that would apply if we were incorporated in a jurisdiction in the United States or in other jurisdictions outside Brazil. Under Brazilian Corporate Law, you and the holders of the preferred shares may have different rights with respect to protection of their interests, including measures related to actions taken by our board of directors or the holders of our common shares, which may differ from the laws of other jurisdictions outside Brazil.
ITEM 4 INFORMATION ON THE COMPANY
| 4A. | History and Development of the Company |
General
Our legal and commercial name is Itaú Unibanco Holding S.A. We were incorporated on September 9, 1943 and registered under NIRE 35300010230. We are organized as a publicly held corporation for an unlimited period of time under the laws of Brazil. Our head offices are located at Praça Alfredo Egydio de Souza Aranha, 100, 04344-902, São Paulo, SP, Brazil and our telephone number is +55-11-5019-1267.
Investor information can be found on our website at www.itau-unibanco.com/ir. Information contained on our website is not incorporated by reference in, and shall not be considered a part of, this annual report. Our agent for service of process in the United States is the general manager of our New York branch, which is located at 767 Fifth Avenue, 50th Floor New York, NY 10153-0023.
History
We trace our origins to 1944, when members of the Egydio de Souza Aranha family founded Banco Federal de Crédito S.A. in São Paulo. Since 1973 we have operated through Banco Itaú S.A., now Itaú Unibanco. Unibanco was founded by the Moreira Salles family in 1924, making it Brazil’s oldest non-state owned bank at the time of the Association.
On November 3, 2008, the controlling shareholders of Itaúsa and of Unibanco Holdings entered into an association agreement to combine the operations of Itaú Holding (now Itaú Unibanco Holding) and its subsidiaries and E. Johnston, Unibanco Holdings, Unibanco and Unibanco’s subsidiaries. To effect the Association, we carried out a corporate restructuring pursuant to which E. Johnston, Unibanco Holdings and its subsidiary Unibanco became wholly owned subsidiaries of Itaú Unibanco Holding through a series of transactions, as described below:
| · | the merger of all shares of E. Johnston into Itaú Unibanco; |
| · | the merger of all shares of Unibanco Holdings and Unibanco that were not already indirectly held by Itaú Unibanco into Itaú Unibanco; and |
| · | the merger of all shares of Itaú Unibanco into Itaú Unibanco Holding. |
A merger of shares means “incorporação de ações” as defined by article 252 of the Brazilian Corporate Law, and is a corporate restructuring where one company (A) exchanges its shares for shares of another company (B), and as a consequence the shareholders of B become shareholders of A, and A becomes the sole shareholder of B. The shareholders of each of Itaú Unibanco Holding, Itaú Unibanco, E. Johnston, Unibanco Holdings and Unibanco approved the transactions at extraordinary shareholders’ meetings held on November 28, 2008. The transactions were approved by the Central Bank on February 18, 2009 and the minutes of the shareholders’ meetings reflecting the approval of the merger of shares were registered by the Commercial Registry of the State of São Paulo in March 2009. The Association was approved with no restrictions by CADE on August 18, 2010.
The shares of Itaú Unibanco Holding, including those issued in exchange for shares of Unibanco and Unibanco Holdings, commenced trading under the same symbol on March 31, 2009. In May 2009, the trading symbols were standardised to “ITUB” on all the stock exchanges where Itaú Unibanco Holding’s securities are listed. At the extraordinary shareholders’ meeting held on November 28, 2008, our shareholders approved the change of our corporate name from Banco Itaú Holding Financeira S.A. to Itaú Unibanco Banco Múltiplo S.A. At the extraordinary shareholders’ meeting held on April 24, 2009, our shareholders approved a further change of our corporate name to Itaú Unibanco Holding S.A., which change was approved by the Central Bank on August 12, 2009. Finally, at the extraordinary shareholders’ meeting held on April 30, 2009, the shareholders of Itaú Unibanco approved the change of the corporate name of Banco Itaú S.A. to Itaú Unibanco S.A., which change was approved by the Central Bank on December 30, 2009.
As a result of the Association, many initiatives were taken in order to complete the integration of the two banks. The main initiatives were:
| · | the adoption of a new corporate governance structure by the board of directors; |
| · | the integration of the corporate, investment banking, brokerage, asset management, vehicle lending, private banking and treasury divisions, which have been operating on a unified basis since the first quarter of 2009; |
| · | the interconnection of ATMs; |
| · | reporting under a single annual report and the adoption of unified corporate governance policies and risk management; and |
| · | the integration of Unibanco branches under the “Itaú” brand, which began in the first quarter of 2010. |
Statistical Disclosure by Bank Holding Companies
See “Item 4B. Business Overview – Selected Statistical Information” for additional information relating to our business.
Divestitures
Unibanco Saúde Seguradora
On December 16, 2009, Itaú Seguros S.A. (“Itaú Seguros”), and Itaú Unibanco entered into an agreement with a subsidiary of Tempo Participações S.A. for the sale of all the shares of Unibanco Saúde Seguradora held by Itaú Seguros and Itaú Unibanco, for R$55 million. The performance of Unibanco Saúde Seguradora in the 12-month period after the closing date of the transaction entitled Itaú Seguros and Itaú Unibanco to an additional payment of approximately R$50 million. CADE approved the transaction in December 2009. The Brazilian National Agency of Supplemental Health (Agência Nacional de Saúde Suplementar) (“ANS”), approved the transaction on April 1, 2010. The closing of the transaction occurred on April 29, 2010.
Allianz Seguros
On December 29, 2009, Allianz South America Holding B.V. entered into an agreement with Itaú Unibanco Holding for the purchase for R$109 million of the 14.03% indirect interest that Itaú Unibanco Holding held in Allianz Seguros. The transaction closed on January 14, 2010 and was approved by CADE in March 2010. We notified SUSEP of the transaction.
Capital Expenditures
On January 27, 2012, we announced the construction of a new technology center, representing a total investment of approximately R$800 million. See “Business – Technology”.
See “Item 5B. Liquidity and Capital Resources – Capital – Capital Expenditures” for a discussion of our capital expenditures for the last two fiscal years.
Acquisitions
Redecard
On February 7, 2012 Itaú Unibanco Holding announced its intention to acquire, directly or through its affiliates, all outstanding shares of Redecard S.A. (“Redecard”), through a public tender offer (the “Tender Offer”) aimed at (i) cancelling Redecard’s authorization as a publicly-held company registered with the CVM and (ii) delisting Redecard from the Novo Mercado Corporate Governance Listing Segment maintained by the São Paulo Stock Exchange (BM&FBOVESPABolsa de Valores, Mercadorias e Futuros, or “BM&F Bovespa”). The Tender Offer will target the acquisition of common shares of Redecard corresponding to approximately 50% of its share capital. The announced maximum price to be offered for each of such shares will be R$35.00, payable in reais, a total offer of up to R$11.8 billion. We intend to fund the Tender Offer with available cash. Itaú BBA will act as advisor and intermediary institution of the Tender Offer. The completion of the Tender Offer is subject to regulatory approval.
Banco Carrefour
On April 14, 2011 Itaú Unibanco entered into a share purchase and sale agreement governing the acquisition by Itaú Unibanco of 49% of Banco Carrefour for the amount of R$725 million. Banco Carrefour is the entity responsible for the offering and distribution, on an exclusive basis, of financial, insurance and pension products and services through the distribution channels of Carrefour Comércio e Indústria Ltda., which operates under the “Carrefour” brand in Brazil. As of April 14, 2011, the “Carrefour” brand included 163 hypermarkets and supermarkets and related e-commerce channels, and had 7.7 million accounts and a credit portfolio (gross book value) of R$2,254 million as of December 31, 2010. This transaction is subject to the approval of the Central Bank.
HSBC Portfolio in Chile
On October 24, 2011, we completed the acquisition of HSBC’s retail portfolio in Chile, which included, among others, 4 branches and the consumer credit and mortgage portfolios, ranking Itaú as the leader in the premium market, with a network of 88 branches in Chile.
MCC Securities
On August 1, 2011, Itaú Unibanco, through its subsidiaries, entered into certain agreements with the shareholders of MCC, acquiring 50% plus one share issued by MCC Securities Inc. (Cayman Islands) (“MCC Securities”), a wealth management company, forming a joint venture with MCC’s shareholders targeting Chilean high net worth clients.
Unibanco Participações Societárias
On July 29, 2011, we acquired, through a wholly-owned subsidiary, all remaining interests not previously owned in Unibanco Participações Societárias, an indirect investment subsidiary of Itaú Unibanco Holding, for approximately R$1.2 billion in cash.
Itaú Unibanco Holding ranked among the ten largest banks in the world in 2011 and was the largest bank in Brazil, each ranking based on market capitalization according to Bloomberg. Our principal operations are: (i) commercial banking (including insurance, pension plan and capitalization products, credit cards, asset management and a variety of credit products and services for individuals, small and middle-market companies); (ii) Itaú BBA (corporate, investment banking and treasury); (iii) consumer credit (financial products and services to our non-accountholders); and (iv) operations with the market and corporation (referred to as corporate and treasury in note 33 of our consolidated financial statements).
On October 24, 2010, Itaú Unibanco completed the integration of customer service locations throughout Brazil. In total, 998 branches and 245 client service branches, or CSBs, of Unibanco were redesigned and integrated as Itaú Unibanco customer service locations, thus creating a network of approximately 4,700 units in the country under the “Itaú” brand. We have an extensive network with 4,072 branches, 912 CSBs and 28,769 ATMs in Brazil and abroad, as of December 31, 2011, we were elected or ranked:
| · | “The Best Private Banking Overall Services” in Brazil, according to the 2011 Annual Private Banking and Wealth Management Survey, coordinated by Euromoney magazine; |
| · | the largest mutual fund manager among private banks in Brazil based on our assets under management, according to ANBIMA; |
| · | the largest manager of private bank client assets, according to ANBIMA; and |
| · | the top provider of securities services in Brazil by ANBIMA. |
In addition, we received the following awards and recognition in 2011:
| · | “Bank of the Year 2011 – Bank of the Year in Brazil and Latin America” from The Banker magazine; |
| · | The World’s Most Sustainable Bank in the 2011 FT/IFC Sustainable Finance Awards, granted by the British newspaper Financial Times and the International Finance Corporation (IFC), the financial institution of the World Bank; |
| · | Private Banker International Awards 2011 — Outstanding Private Banking in Latin America. Hosted by British magazine “Private Banker International”; and |
| · | Top 1000 World Banks ranking, according to “The Banker” British magazine. Itaú Unibanco ranked first among Brazilian financial institutions. |
Our Ownership Structure
We are a financial holding company controlled by IUPAR, a holding company jointly controlled by (i) Itaúsa, which is a holding company controlled by members of the Egydio de Souza Aranha family, and (ii) E. Johnston, which is a holding company controlled by the former controlling shareholders of Unibanco, the Moreira Salles family. Itaúsa also directly owned 38.66% of the shares of our common stock as of December, 31, 2011. See “Item 7A. Major Shareholders”.
The following chart is a simplified overview of the direct and indirect ownership structure of the Itaú Unibanco Group as of February 29, 2012:

(*) Excluding controlling stockholders and treasury shares
Ownership percentages above refer to the total of direct and indirect ownership. All of the above companies were organized and have their operations in Brazil, except Banco Itaú Argentina S.A., or Banco Itaú Argentina, Banco Itaú BBA International S.A., or Banco Itaú BBA International, Banco Itaú Chile S.A., or Banco Itaú Chile and Banco Itaú Uruguay S.A., or Banco Itaú Uruguay. For further information with respect to our significant subsidiaries, see note 2.4.a to our consolidated financial statements.
Competitive Strengths
We believe the following strengths provide us with significant competitive advantages and distinguish us from our competitors.
Premier banking brand in Brazil.
Our brands are very strong and very well recognized in Brazil. They represent quality and reliability and, with our large portfolio of products, help us to maintain a low customer turnover rate, especially among customers in the high income segment. According to a 2011 Interbrand report, a brand consultancy, we have the most valuable brand in Brazil, with a value of R$24.3 billion in 2011, an increase of 18% compared to 2010.
Large branch network in geographic areas of high economic activities.
We have an extensive network with 4,072 branches, 912 CSBs and 28,769 ATMs in Brazil and abroad, as of December 31, 2011. Our Brazilian branch network, while national in scope, is strategically concentrated in Southeast Brazil, the country’s wealthiest region. Our branch network in other countries of the Southern Cone (Argentina, Chile, Paraguay, and Uruguay) is also positioned in regions of high levels of economic activity. A branch network in wealthier and key economic areas gives us a strong presence and a competitive advantage to offer our services to a broad range of customers and profit from selective market opportunities. Our exclusive ATM network allows us to offer a wide range of products and services to our customers.
Diverse line of products and services.
We are a multi-service bank offering a diverse line of products and services that are designed to address the needs of various types of clients, including corporate clients, small and medium-sized enterprises, retail customers, high-income individuals, private bank clients, non-accountholders and credit card users. We believe that this model creates opportunities to improve our client relationships and thereby increase our market share. We expect to sustain our leading presence by capturing a solid and growing pipeline of transactions across a number of business segments.
Technology and electronic distribution channels as drivers for sales.
Our intensive use of technology and electronic distribution channels, which has contributed significantly to an increase in sales of products and services, is one of our most important competitive advantages. In 2011, we spent approximately R$4,000 million on information technology, approximately R$1,000 million for the purchase of hardware and software and approximately R$3,000 million for the cost of information technology (“IT”) infrastructure, operation and maintenance. We have sophisticated technology that supports other remote banking access (call centers, Internet banking, etc.) and offers customers the ability to verify their statements and perform their transactions. Our sales teams can access client credit scores directly through mobile phones and credit proposals can be sent over the Internet by any broker registered in our systems.
Risk-based pricing model as a tool to manage risk while exploring opportunities.
Our risk-based pricing model is an important competitive advantage as it gives us a more precise dimension of the risk equation versus return in various scenarios. This is an essential tool to explore commercial opportunities and simultaneously manage risks. Depending on the product, each contract is individually priced using risk adjusted return on capital models that give us a better assessment of the market
Business Strategy
Our board of directors is responsible for defining the guidelines of our strategy and that of our subsidiaries. Strategic decisions by our board of directors are supported by the strategy committee of the board, which provides data and information about strategic business issues. See “Item 6C. Board Practices — Statutory Bodies” The strategy committee’s activities and responsibilities range from evaluating investment opportunities and budget guidelines to providing advice and support to the chief executive officer for the monitoring of our consolidated strategy. The strategy committee is supported by the economic scenarios sub-committee which provides macroeconomic data in order to support discussions on strategies, investments and budgets.
Expand our wholesale and investment bank operations abroad.
In 2011, we took significant steps to expand our wholesale and investment bank operations abroad. In Chile, we entered into an agreement with MCC, one of the leaders in third party wealth management services. Also in 2011, we acquired HSBC Bank’s high net worth portfolio in Chile, making Itaú Chile a leader for high net worth individuals with a network of 88 branches in that country. In addition, Itaú Unibanco started operations in Switzerland through Banco Itaú Suisse, located in Zurich, to provide services to private clients, both Brazilian and Latin American, who seek global investment opportunities. Finally, in November 2011, Itaú BBA was authorized by the Central Bank to structure its wholesale and investment bank operations in Colombia, pending approval by local regulatory bodies, which is expected to be granted in 2012. Itaú BBA’s target market in Colombia is composed of institutional investors and large companies present in Brazil. The products portfolio in Colombia will include loan operations, foreign trade financing, foreign exchange and derivatives, and investment bank activities, such as advising on mergers and acquisitions and access to capital markets.
Continue to improve efficiency.
During 2009 and 2010, we focused our efforts on completing the integration of the Unibanco branches and customer site branches, while maintaining service quality and increasing our customer base. After the completion of the integration of Itaú and Unibanco branches in 2010, we implemented the “Efficiency Project” during 2010 and 2011, which implements close budget management and monitoring of costs and revenues, the establishment of targets for each business unit and the promotion of a strong culture of operational efficiency. In 2011, we fully integrated all systems that still had Unibanco’s legacy information on operations entered into prior to the integration of the branch network. This was the last remaining step to the integration of Itaú and Unibanco.
Grow our loan portfolio with the maintenance of asset quality.
The growth of our loan portfolio and the maintenance of asset quality are central issues to our strategy. We are constantly seeking to improve our models for risk management and our economic forecasts and scenario modeling. We intend to increase the average volume of credit operations to maintain and even grow our market share, depending on the product, market and customer type, including through the development of new products for specific client demographics.
Implement an advanced and fully integrated risk management approach should position us for sustainable growth and enhanced profitability.
Our main strategic goals in risk management include: (i) the incorporation of best practice recommendations and the implementation of the advanced approaches under Basel II and Basel III, which should enhance profitability from more precise risk-based pricing and risk-adjusted performance measurement frameworks, which are important sources of competitive advantage; and (ii) developing and implementing a fully integrated risk management approach, through the integration of processes and systems to provide a comprehensive picture of risk exposures across risk types and from multiple viewpoints, as well as through the development of stress testing and risk appetite standards.
Develop strong relationships with our clients based on customer segmentation.
We will continue to work on our customer segmentation strategy in order to identify our customers’ needs and enhance our relationship with our customer base, as well as to increase market penetration. A customer segment is a distinguishable part of our customer base that is subject to a specific set of needs that we focus on meeting. We believe that our customer segmentation tools and strategy provide us an important competitive advantage developed over the course of more than 25 years. We aim to fulfill clients’ financial needs through a wide product portfolio, including cross-selling of banking and insurance products and sales through a variety of channels. It is also extremely important to deliver best-in-class customer service, in order to maintain and increase client satisfaction and increase portfolio profitability.
Operations
The table below presents revenues for our segments for each of the years ended December 31, 2011 and 2010. As disclosed in note 33 to the consolidated financial statements we have four operational and reporting segments: Commercial Banking, Itaú BBA, Consumer Credit and Activities with the Market and Corporation.
(in millions of R$, except percentages)
| | | Year Ended December 31, | | | Variation | |
| | | 2011 | | | 2010 | | | 2011-2010 | | | % | |
| Commercial Banking | | | 42,499 | | | | 36,314 | | | | 6,185 | | | | 17.0 | % |
| Interest margin(1) | | | 31,584 | | | | 27,068 | | | | 4,516 | | | | 16.7 | % |
| Banking service fees | | | 10,915 | | | | 9,246 | | | | 1,669 | | | | 18.1 | % |
| Itaú BBA | | | 7,019 | | | | 6,533 | | | | 486 | | | | 7.4 | % |
| Interest margin(1) | | | 4,896 | | | | 4,601 | | | | 295 | | | | 6.4 | % |
| Banking service fees | | | 2,123 | | | | 1,932 | | | | 191 | | | | 9.9 | % |
| Consumer Credit | | | 14,075 | | | | 14,809 | | | | (734 | ) | | | -5.0 | % |
| Interest margin(1) | | | 8,356 | | | | 9,044 | | | | (688 | ) | | | -7.6 | % |
| Banking service fees | | | 5,719 | | | | 5,765 | | | | (46 | ) | | | -0.8 | % |
| Activities with the Market and Corporation (2) | | | 5,110 | | | | 3,538 | | | | 1,572 | | | | 44.4 | % |
| Interest margin(1) | | | 4,801 | | | | 3,356 | | | | 1,445 | | | | 43.1 | % |
| Banking service fees | | | 309 | | | | 182 | | | | 127 | | | | 69.8 | % |
| IFRS Adjustments and consolidation elimination | | | (930 | ) | | | 1,888 | | | | (2,818 | ) | | | -149.3 | % |
| Interest margin(1) | | | (1,274 | ) | | | 1,921 | | | | (3,195 | ) | | | -166.3 | % |
| Banking service fees | | | 344 | | | | (33 | ) | | | 377 | | | | 1142.4 | % |
| Total | | | 67,773 | | | | 63,082 | | | | 4,691 | | | | 7.4 | % |
| Interest margin(1) | | | 48,363 | | | | 45,990 | | | | 2,373 | | | | 5.2 | % |
| Banking service fees | | | 19,410 | | | | 17,092 | | | | 2,318 | | | | 13.6 | % |
(1) Includes net interest and similar income and expenses, dividend income, net gain (loss) from financial assets and liabilities and foreign exchange results and exchange variation on transactions.
(2) Activities with the Market and Corporation includes the results related to the trading activities in our proprietary portfolio, trading related to managing currency, interest rate and other market risk factors, asset and liability management and arbitrage opportunities in domestic and foreign markets. It also includes the results associated with financial income from the investment of our excess capital.
We mainly carry out our business activities in Brazil. We do not break down our revenues by geographic market within Brazil. Our revenues consisting of income from financial operations, fee and comission income and income from insurance, private pension and capitalization operations are divided between revenues earned in Brazil and abroad.
(in millions of R$, except percentages)
| | | Year Ended December 31, | | | Variation | |
| | | 2011 | | | 2010 | | | 2011-2010 | | | % | |
| Income from financial operations(1) | | | 103,962 | | | | 82,830 | | | | 21,132 | | | | 25.5 | % |
| Brazil | | | 99,083 | | | | 79,236 | | | | 19,848 | | | | 25.0 | % |
| Abroad | | | 4,879 | | | | 3,594 | | | | 1,284 | | | | 35.7 | % |
| Banking service fees | | | 19,410 | | | | 17,092 | | | | 2,318 | | | | 13.6 | % |
| Brazil | | | 18,506 | | | | 16,196 | | | | 2,310 | | | | 14.3 | % |
| Abroad | | | 904 | | | | 896 | | | | 8 | | | | 0.9 | % |
| Income from insurance, private pension and capitalization operations | | | 2,566 | | | | 2,007 | | | | 559 | | | | 27.9 | % |
| Brazil | | | 2,535 | | | | 1,991 | | | | 545 | | | | 27.4 | % |
| Abroad | | | 31 | | | | 16 | | | | 14 | | | | 86.7 | % |
(1)Includes interest and similar income, dividend income, net gain (loss) from financial assets and liabilities, foreign exchange results and exchange variation on transactions.
The table below presents revenues abroad by operational segment for each of the years ended December 31, 2011and 2010:
(in millions of R$, except percentages)
| | | Year Ended December 31, | | | Variation | |
| | | 2011 (5) | | | 2010 (5) | | | 2011-2010 | | | % | |
| Commercial Banking | | | 3,081 | | | | 2,467 | | | | 614 | | | | 24.9 | % |
| Argentina(1) | | | 244 | | | | 169 | | | | 75 | | | | 44.2 | % |
| Chile(2) | | | 444 | | | | 500 | | | | (56 | ) | | | -11.1 | % |
| Uruguay(3) | | | 166 | | | | 135 | | | | 31 | | | | 22.7 | % |
| Other companies abroad(4) | | | 2,227 | | | | 1,663 | | | | 564 | | | | 33.9 | % |
| Itaú BBA | | | 968 | | | | 656 | | | | 312 | | | | 47.5 | % |
| Other companies abroad(4) | | | 968 | | | | 656 | | | | 312 | | | | 47.5 | % |
| Consumer Credit | | | 103 | | | | 105 | | | | (2 | ) | | | -1.7 | % |
| Argentina (1) | | | 20 | | | | 22 | | | | (2 | ) | | | -8.4 | % |
| Uruguay (3) | | | 17 | | | | 18 | | | | (1 | ) | | | -2.9 | % |
| Chile (2) | | | 66 | | | | 65 | | | | 1 | | | | 0.8 | % |
| IFRS adjustments | | | 1,662 | | | | 1,278 | | | | 384 | | | | 30.1 | % |
(1) Includes Banco Itaú Argentina, Itaú Asset Management S.A., Sociedad Gerente de Fondos Comunes de Inversión, Itrust Servicios Inmobiliarios S.A.C.I (formerly known as Itrust Servicios Financieros S.A) and Itaú Sociedad de Bolsa S.A.
(2) Includes Itaú Chile Holdings, Inc., BICSA Holdings LTD., Banco Itaú Chile S.A., Itaú Chile Inversiones, Servicios y Administración S.A., Itaú Chile Corredor de Bolsa Ltda., Itaú Chile Corredora de Seguros Ltda., Itaú Chile Administradora General de Fondos S.A., Itaú Chile Securitizadora S.A., Recuperadora de Créditos Ltda. and Itaú Chile Compañía de Seguros de Vida S.A.
(3) Includes ACO Ltda., Banco Itaú Uruguay, OCA Casa Financiera S.A., OCA S.A, and Unión Capital AFAP S.A.
(4) Itaú Unibanco S.A. - Grand Cayman, New York, Tokyo, and Nassau branches; Banco Itaú-BBA S.A - Nassau Branch; Itaú Unibanco Holding S.A - Grand Cayman branch and Unibanco Grand Cayman branch; only at 12/31/2010 Banco Itaú BBA S.A. Uruguay branch; IPI - Itaúsa Portugal Investimentos, SGPS Lda. (49%), Itaúsa Europa - Investimentos, SGPS, Lda., Itaú Europa, SGPS, Lda., Itaúsa Portugal - SGPS, S.A., Banco Itau BBA International, S.A , Itau BBA International (Cayman) Ltd., Banco Itaú Europa Luxembourg; Afinco Americas Madeira, SGPS, Soc. Unipessoal Ltda., Zux Cayman Company Ltd., Topaz Holding Ltd., United Corporate Services Inc (new company name of Itaú USA Inc), Itaú International Investment LLC, Albarus S.A., Banco Del Paraná S.A. and Garnet Corporativo.
(5) Activities with the Market and Corporation has no operations outside Brazil.
Our Business
Overview
We provide a broad range of banking services to a diverse customer base of individuals and corporate customers. We provide these services on an integrated basis through the following operational units:
| · | Itaú BBA (corporate, investment banking and treasury); |
| · | Activities with the market and corporation (referred to as corporate and treasury in note 33 of our consolidated financial statements). |
The commercial banking business unit offers a wide range of banking services to a diversified base of individuals and companies. Services offered by the commercial banking segment include insurance, pension plan and capitalization products, credit cards, asset management, credit products and customized products and solutions specifically developed to meet customers’ demands. Our marketing strategies are adjusted for each customer profile and implemented through the most suitable distribution channels. We aim to increase the number of products used by our customers, thus diversifying our revenue sources. This segment is an important funding source for our operations and generates significant financial income and banking fees. The commercial banking segment is comprised of the following specialized areas and products:
| · | Retail banking (individuals); |
| · | Personnalité (banking for high-income individuals); |
| · | Private banking (banking and financial consulting for high net worth individuals); |
| · | Very small business banking; |
| · | Corporate social responsibility fund; |
| · | Securities services for third parties; |
| · | Insurance, private retirement and capitalization products. |
Itaú BBA is responsible for our corporate and investment banking activities. Itaú BBA’s management model is based on building close relationships with its customers by obtaining an in-depth understanding of their needs and offering them customized solutions. Corporate activities include providing banking services to large corporations and investment banking activities include offering funding resources to the corporate segment, including through fixed and variable income instruments.
Through the consumer credit business unit, we implement our strategy of expanding our offering of financial products and services beyond our current accountholders. As such, this division oversees the financing of vehicles outside our branch network, credit cards to individuals who are not accountholders, and lending to lower income consumers.
Itaú Unibanco Holding also has a broad range of overseas operations and has built its international presence based on strategically positioned units in the Americas, Europe and Asia. This creates significant synergies in foreign trade finance, the placement of Eurobonds, offering more sophisticated financial transactions, and private banking operations.
Commercial Banking
Overview of Accountholder Products and Services
We have a large and diverse portfolio of products to address our customers’ needs. The main available products to our accountholders are:
| · | Credit: personal loans, overdraft protection, payroll loans, vehicles, credit cards, mortgage and agricultural loans, working capital, trade note discount and export; |
| · | Investments: pension plans, mutual funds, time deposits, demand deposit accounts, savings accounts and capitalization plans; and |
| · | Services: insurance (life, home, credit/cash cards, vehicles, loan protection, among others), exchange, brokerage and others. |
Retail Banking
Our core business is retail banking, which serves individuals with a monthly income below R$10,000. In December 31, 2011, we had over 17.6 million customers and 4,484 branches and CSBs. Our retail banking operations are present in all Brazilian states and in cities that together represented more than 80.0%of Brazil’s individual domestic consumption as of December 31, 2011.
We classify our retail clients in accordance with their income and profile:
| · | Itaú retail (agências) customers, who earn less than R$4,000 per month or R$5,000, depending upon the region; and |
| · | Itaú Uniclass customers, who earn more than R$4,000 or R$5,000, depending upon the region. Specialized account managers provide services to Itaú Uniclass customers who also have access to certain customized products. |
For the year ended December 31, 2011, credit products represented 63.8% of our consolidated revenue from retail banking, while investments represented 25.0% and services and other fee-based products represented 11.3%.
Our strategy is to offer high quality and differentiated banking products to our retail banking customers. As part of this strategy, Itaú Unibanco now serves two retail segments: (i) Itaú Uniclass serves customers with differentiated needs and who require a more diversified service with separate areas within branches; and (ii) Itaú retail serves all other customers. This diversified relationship concept is interwoven by “Itaú 30 horas,” a convenience service that enables users to carry out banking transactions in ATMs, telephones, mobiles, on the internet and at the branches.
Public Sector
Our public sector business operates in all areas of the public sector, including the federal, state and municipal governments (in the executive, legislative and judicial branches). As of December 31, 2011, we had 2,315 public sector customers. To service these customers, we use platforms that are separate from the retail banking branches, with teams of specially trained managers who offer customized solutions in tax collection, foreign exchange services, administration of public agency assets, payments to suppliers, payroll for civil and military servants and retirement. Based on these platforms, we have a significant amount of business with public sector clients, particularly in those Brazilian states where we acquired previously state-owned financial institutions.
Itaú Personnalité
Itaú Unibanco began providing customized services to higher-income individuals in 1996 with the creation of Itaú Personnalité. Itaú Personnalité serves individuals who earn more than R$10,000 per month or have investments in excess of R$100,000.
Itaú Personnalité’s focus is delivering (i) financial advisory services by its managers, who understand the specific needs of our higher-income customers; (ii) a large portfolio of exclusive products and services (iii) special benefits based on the type and length of relationship with the customer, including discounts on various products and services. Itaú Personnalité services its clients through a dedicated network comprised of 213 branches, located in the main Brazilian cities. Itaú Personnalité customers also have access to Itaú Unibanco network of branches and ATMs throughout the country, as well as internet and telephone banking.
Itaú Private Bank
Itaú Private Bank is a leading Brazilian bank in the global private banking industry, providing wealth management services to Latin American high net worth individuals. Approximately 600 employees are focused on offering financial consulting services to clients with at least US$1.5 million in investment assets. In addition, we provide our customers with a full range of banking products and services. As of December 31, 2011, our private banking activity for more than 9,900 clients had assets under management equivalent to US$82 billion, including US$66,169 million in Brazil, US$7,665 million in Luxembourg, US$5,942 million in the United States, US$424 million in Switzerland, US$27 million in the Bahamas, US$11 million in the Cayman Islands and US$1,392 million in Chile through MCC. Fees earned from our private banking customers are, in most cases, a function of assets under management.
Wealth management services are provided by teams of experienced relationship managers based in Brazil, United States, Luxembourg, Switzerland, Argentina, Uruguay, Chile and Paraguay, and supported by investment specialists who recommend the most appropriate solutions for each individual risk profile. We serve our customers’ needs for offshore wealth management solutions in major jurisdictions through independent institutions: in the United States through Banco Itaú Europa International and Itaú Europa Securities, in Luxembourg through Banco Itaú Europa Luxembourg S.A., in Switzerland through Banco Itaú Suisse, in the Bahamas through Itaú Bank & Trust Bahamas and in the Cayman Islands through Itaú Bank & Trust Cayman. On August 21, 2011, Itaú Private Bank International entered into a joint venture with MCC to develop the Chilean private banking market. With over 28 years of experience, MCC is a leading wealth management services provider in Chile acknowledged for its expertise in global fixed income. The new institution will retain the name of Munita, Cruzat & Claro.
According to the 2011 Annual Private Banking and Wealth Management Survey, coordinated by Euromoney magazine, Itaú Private Bank was recognized as offering “The Best Private Banking Overall Services” in Brazil for the third consecutive year. In this latest ranking published in the February edition of Euromoney magazine, Itaú Private Bank was also named the “Best Private Banking Services Overall” in Peru and Top 5 “Best Private Banking Services Overall” in Latin America, being the only Latin-American bank included in this list. Euromoney’s Private Banking Awards cover over 60 countries each year and provide a qualitative and quantitative review of the best services in private banking, by region and by areas of services. Factors such as market position, assets under management, profitability, ratio of clients to private bankers, and quality of services offered are considered in determining the rankings of top private banks.
In addition, we have received awards from Private Banker International magazine for “The Outstanding Private Bank – Latin America / 2011” and the recognition from The Banker & PWM magazines, subsidiaries of the Financial Times Group for “Best Private Bank in Latin America, 2011”.
Very Small Business Banking
Our very small business banking office managers are trained to offer customized solutions and provide detailed advice on all products and services to very small companies. Our strategy is to capture the market opportunity by meeting the needs of these companies and their owners, particularly with respect to the management of cash flow and credit facilities.
As of December 31, 2011, we had 1,774 very small business banking offices located throughout Brazil and approximately 2,750 managers working for over 1,400,000 small business customers. In 2009, 2010 and 2011, we continued expanding our specialized services to companies with annual revenues below R$500,000 and set up 454, 487 and 136 additional offices, respectively, focused on very small business banking. In 2012, we expect to continue to expand our very small business banking operations.
Loans to very small businesses totaled R$6,150 million as of December 31, 2011.
Small Business Banking
We have structured our relationships with small business customers through the use of specialized offices since 2001. As of December 31, 2011, we had 377 offices located nationwide in Brazil and nearly 2,800 managers who worked for over 586,000 companies with annual revenues from R$500,000 to R$6 million.
All our managers are certified by ANBIMA, and throughout the year they receive training to offer the best solutions for each customer profile. Our customers rely on our ability to provide products, terms and rates customized to their needs.
Loans to small businesses totaled R$29,443 million as of December 31, 2011.
Middle-Market Banking
As of December 31, 2011, we had approximately 132,000 middle-market corporate customers that represented a broad range of Brazilian companies located in over 84 cities in Brazil. Our middle-market customers are generally companies with annual revenues from R$6 million to R$150 million. As of December 31, 2011, we had over 1,500 managers specializing in middle-market customers and 237 specialized offices located at key branches.
We offer a full range of financial products and services to middle-market customers, including deposit accounts, investment options, insurance, private retirement plans and credit products. Credit products include investment capital loans, working capital loans, inventory financing, trade financing, foreign currency services, equipment leasing services, letters of credit and guarantees. We also carry out financial transactions on behalf of middle-market customers, including interbank transactions, open market transactions and futures, swaps, hedging and arbitrage transactions. We also offer our middle-market customers collection services and electronic payment services. We are able to provide these services for virtually any kind of payment, including Internet office banking. We charge collection fees and fees for making payments, such as payroll, on behalf of our customers.
Consistent with customary lending practices in Brazil, our loan portfolio for our middle-market customers is composed predominantly of short-term products, defined as having a maturity of less than 12 months. Loans to middle-market businesses totaled R$53,261 million as of December 31, 2011.
Credit Cards and Commercial Agreements
We are the leading company in the Brazilian credit card market, based on transaction volume as of December 31, 2011. Our subsidiaries, Banco Itaucard S.A. (“Banco Itaucard”) and Hipercard Banco Múltiplo S.A. (“Hipercard”), offer a wide range of products to 34.3 million credit card accounts as of December 31, 2011, including Itaú Unibanco’s current accountholders and non-accountholders and also to clients from business partnerships and joint ventures. In the year ended December 31, 2011, the volume of credit cards transactions was R$154,186 million, a 20.3% increase from the prior year.
We have developed a strong presence in the consumer finance sector through our strategic alliances and commercial agreements with leading retailers in Brazil. Since 2001, when we established the first partnerships, these alliances have been supporting our credit card and consumer finance business through several products, such as co-branded credit cards, private label cards, personal loans and insurance.
Our main challenges in the credit card business are to continually increase activation and retention of our cardholder base and improve our portfolio profitability. To this end, our credit card division focuses on the development of new products, the enhancement of partnerships, cross-selling of banking and insurance products and sales through a variety of channels.
Real Estate Financing
As of December 31, 2011, we had approximately R$20.1 billion in outstanding real estate loans, already considering the sale of R$534.2 million of our mortgage portfolio for theFundo de Garantia por Tempo de Serviço (“FGTS”), the Brazilian social security fund.
Given our expectation of growth over the next several years in the mortgage market in Brazil, we are investing in the operational platform in order to reduce costs and improve quality for our customers. We are also developing our distribution channels for mortgage loans by focusing on our branch network and developing our relationships with real estate brokers. We have partnerships with two of the largest real estate brokers in Brazil: LPS Brasil Consultoria de Imóveis S.A. (“Lopes”) and Coelho da Fonseca Empreendimentos Imobiliários Ltda (“Coelho da Fonseca”). These two long-term partnerships provide us with exclusive real estate financing origination at a large number of locations throughout Brazil.
According to Brazilian regulations, financial institutions are required to allocate at least 65% of their savings accounts balances to fund mortgage financing, of which 80% must be used to finance properties with a value lower than R$500,000 and must have annual interest rates lower than 12%.
Asset Management
According to ANBIMA, as of December 31, 2011, we were the largest mutual fund manager among private banks in Brazil based on our assets under management. As of that date, we had total net assets under management of R$379,737 million on behalf of approximately 1.7 million customers. We also provide portfolio management services for pension funds, corporations, private bank customers and foreign investors. According to ANBIMA, as of December 31, 2011, we were the largest manager of private bank clients’ assets and the second largest private manager of pension fund assets in Brazil, based on our assets under management. As of December 31, 2011, we had R$212,573 million of assets under management for pension funds, corporations and private bank customers.
As of December 31, 2011, we offered and managed about 1,584 mutual funds, which are mostly fixed-income and money market funds. For individual customers, we offered 141 funds to our retail customers and approximately 263 funds to our Itaú Personnalité customers. Private banking customers may invest in over 611 funds, including those offered by other institutions. Itaú BBA’s capital markets group also provides tailor-made mutual funds to institutional, corporate and private banking customers.
In August 2011, Fitch Ratings, one of the largest international rating agencies in Brazil, maintained its M1 (bra) rating (the highest rating granted to an asset manager) of our asset management business unit. We have been in the top rating category since July 2003.
Corporate Social Responsibility
The Itaú Social Excellence Fund (Fundo Itaú Excelência Social) (“FIES”), launched in 2004, is a socially responsible investment fund. It invests in the shares of companies with superior corporate social responsibility practices with the goal of achieving higher long-term returns than those offered by the main Brazilian financial market indices. In addition to analyzing the risks and returns of companies, fund managers take into account three fundamental criteria relating to companies: corporate social activities; environmental protection aspects and good corporate governance practices.
In addition, every year the fund manager donates 50% of FIES’s accumulated asset management fees to social projects in the following categories: environmental education; employment education; and childhood education. The projects are selected by the FIES Advisory Board, which is comprised of market leaders and sustainability specialists. Since its launch in 2004, FIES donated R$16.5 million to social projects from 97 NGOs, which have supported 15,433 children and 1,572 educators.
As of December 31, 2011, FIES had net assets of R$220 million while the donations to social projects in the same year totaled more than R$3.4 million. Twenty projects were selected to receive R$120,000 each. Unicef Brazil received an amount of R$300,000 and R$725,000 was spent on analyzing and visiting applicants’ projects, training, monitoring and providing technical support for the selected projects. The selected organizations also have access to an online platform in which they can interact with other peer organizations and technical partners.
Securities Services
We provide securities services in the Brazilian capital markets, where we act as custodian, transfer agent and registrar. In December 2011, we were ranked the top provider of securities services in Brazil by ANBIMA. We provide registrar services to 235 companies listed on BM&F Bovespa, the Brazilian securities, commodities and futures exchange, which companies together represent 63% of the aggregate market capitalization of that exchange.
As of December 31, 2011, Itaú Unibanco held assets of R$822,733 million in connection with securities services, representing 25.2% of the Brazilian market based on assets held. Our broad range of products relates to both domestic and international custody.
Our services also include acting as transfer agent, providing services related to debentures and promissory notes, custody and control services for mutual funds, pension funds and portfolios. We also provide trustee services and non-resident investor services, and act as custodian for depositary receipt programs. As of December 31, 2011, our specialized staff reached 755 employees.
Brokerage
Itaú Corretora de Valores S.A (“Itaú Corretora”) has been providing brokerage services in BM&F Bovespa since 1965. The brokerage services are also provided to international customers via our broker-dealers in New York, Hong Kong and Dubai.
In 2011, Itaú Corretora was ranked fifth on the BM&F Bovespa equity trading volume, among all brokers, and sixth in number of commodities and derivatives contracts.
Insurance, Private Retirement Plans and Capitalization Products
Insurance
As of November 30, 2011, according to SUSEP, we were one of the leading providers of insurance in Brazil based on aggregate insurance premiums, including our indirect 30.0% share in Porto Seguro S.A. (“Porto Seguro”), and excluding health insurance and VGBL (private retirement plan providing annuity benefits). For regulatory purposes VGBL is considered life insurance. For the year ended December 31, 2011, our insurance premiums totaled approximately R$6,219 million.
Our main lines of insurance are (i) life and casualty (excluding VGBL; see “— Private Retirement Plans”), (ii) extended warranties and (iii) property, which accounted for 42.8%, 22.0% and 15.4% of insurance premiums, respectively, for the year ended December 31, 2011. Our policies are sold through our banking operations, independent local brokers, multinational brokers and other channels. We reinsure a portion of the risks we underwrite, particularly large marine property and casualty risks that exceed the retention limits we have established within regulatory limits.
Risks that exceed the retention limit must be ceded to licensed Brazilian reinsurers in accordance with Supplementary Law No. 126 published on January 15, 2007 and the SUSEP regulations published on December 17, 2007.
Our strategy to increase our level of penetration in the Brazilian insurance market varies by market. In the high risk market, we intend to grow our market share through independent local brokers and multinational brokerage firms. For individuals and small and medium company markets, we focus on operations within our banking client base to increase customer penetration. We are working on improving customer penetration in property and casualty insurance for small and medium companies. Our customer relationship management has implemented several advances and the development of specific products for different segments allows more efficient use of each marketing channel (our branches, telemarketing, Internet, ATMs and bank teller terminals).
In August 2009, Itaú Unibanco Holding and Porto Seguro entered into an operating agreement that provided for the offering and distribution, on an exclusive basis, of homeowner and automobile insurance products to customers of Itaú Unibanco Holding in Brazil and Uruguay, (the “Porto Seguro Alliance”). In connection with the Porto Seguro Alliance, Itaú Unibanco Holding transferred all the assets and liabilities related to its then current portfolio of homeowner and automobile insurance to Itaú Seguros de Auto e Residência S.A. (“ISAR”), all of the shares of which were subsequently transferred to Porto Seguro. In exchange, Porto Seguro issued shares representing 30.0% of its capital stock to Itaú Unibanco Holding and its affiliates. The controlling shareholders of Porto Seguro and Itaú Unibanco Holding established a new company named Porto Seguro Itaú Unibanco Participações S.A., (“PSIUPAR”), and transferred their shares of Porto Seguro to PSIUPAR. The controlling shareholders of Porto Seguro remained controlling shareholders of PSIUPAR, which became the parent company of Porto Seguro. Itaú Unibanco Holding is entitled to nominate two members of the board of directors of each of Porto Seguro and PSIUPAR. ISAR, which is directly controlled by Porto Seguro and indirectly controlled by PSIUPAR, is managed by Porto Seguro and utilises the trademarks “Porto Seguro,” “Itaú Unibanco” and “Azul”. As of August 2009, Itaú Unibanco (through Itaú Seguros) had 3.4 million automobiles and 1.2 million homes insured, which were subsequently transferred to ISAR. In October 2009, SUSEP granted authorization for the corporate acts related to the Porto Seguro Alliance. CADE approved the transaction on August 31, 2011.
In November, 2009, Itaú Seguros and XL Swiss Holding Ltd. (“XL Swiss”), a company controlled by XL Capital Ltd. (“XL Capital”), signed an agreement providing for the acquisition by Itaú Seguros of XL Swiss’ participation in Itaú XL Seguros Corporativos S.A. (“Itaú XL”), such that Itaú XL would be wholly owned by us. In line with XL Capital’s interest in continuing to operate in Brazil and our existing relationship with XL Capital, a separate arrangement has been entered into by which Itaú Seguros provides insurance to XL Capital’s clients in Brazil and XL Capital’s Global Program clients with operations in Brazil. These insurance policies are being reinsured by a reinsurance company of XL Capital incorporated in Brazil in the same way that they were reinsured before the acquisition mentioned herein. The acquisition by Itaú Seguros of 100% of the shares of Itaú XL held by XL Swiss was approved by SUSEP on October 6, 2010. On November 9, 2010, SUSEP approved the change of Itaú XL’s corporate name to Itaú Unibanco Seguros Corporativos S.A.
In December 2009, Allianz South America Holding B.V. entered into an agreement with Itaú Unibanco Holding for the purchase of the 14.03% indirect interest that Itaú Unibanco Holding held in Allianz Seguros for R$109 million. Also in December 2009, Itaú Seguros and Itaú Unibanco entered into an agreement with a subsidiary of Tempo Participações S.A. for the sale of all the shares of Unibanco Saúde Seguradora held by Itaú Seguros and Itaú Unibanco for R$55 million. See “Item 4A. History and Development of the Company - Divestitures”.
Private Retirement Plans
As of December 31, 2011, balances under private retirement plans (including VGBL but excluding our 30% interest in Porto Seguro) totaled R$63,295 million. As of December 31, 2011, we had sufficient values of assets to support our private retirement liabilities (including VGBL but excluding our 30% interest in Porto Seguro). As of November 30, 2011, we were the second largest private retirement plan manager in Brazil based on total liabilities according to SUSEP.
Capitalization Products
Capitalization products are savings account products that generally require a customer to deposit a fixed sum with us to be returned at the end of an agreed upon term, with accrued interest. In return, the customer is automatically entered into periodic drawings for the opportunity to win a significant cash prize. As of December 31, 2011, we had 11.6 million in capitalization products outstanding, representing R$2,847 million in liabilities with assets that function as guarantees of R$2,848 million. We distribute these products through our retail network, electronic channels and ATMs. These products are sold by our subsidiary, Cia. Itaú de Capitalização S.A. During 2011, R$1,881 million of capitalization products were sold and we distributed over R$31.5 million in cash prizes to 2,119 customers.
Itaú BBA
Itaú BBA is responsible for our corporate and investment banking activities. As of December 31, 2011, Itaú BBA offered a complete portfolio of products and services to approximately 2,600 companies and conglomerates in Brazil through a team of highly qualified professionals. Itaú BBA’s activities range from typical operations of a commercial bank to capital markets operations and advisory services for mergers and acquisitions. These activities are fully integrated, which enables Itaú BBA to achieve a performance tailored to its clients’ needs.
As of December 31, 2011, our corporate loan portfolio reached R$140.1 billion. Foreign currency loans were the main contributors to the growth of our corporate loan portfolio in 2011. On a consolidated basis, we had total outstanding foreign-currency loans of R$42.0 billion as of December 31, 2011, an increase of R$14.2 billion compared to December 31, 2010. In investment banking, the fixed income department was responsible for the issuance of debentures and promissory notes that totaled R$11.6 billion and securitization transactions that amounted to R$3.5 billion in Brazil in 2011. According to ANBIMA, Itaú BBA was the leader in distribution of fixed income in 2011 with a 28.9% market share, thus maintaining the bank’s historic leadership in the domestic fixed income market. In the international debt markets, Itaú BBA acted as joint bookrunner in issuances of US$3.1 billion of debt securities in 2011, earning the second place in Bloomberg of Brazilian-based corporate issuers including sovereign issuers. With respect to equity issuances, Itaú BBA coordinated public offerings that totaled R$13.5 billion in 2011, and ranked first in ANBIMA’s origination rankings in Brazil, with 31.8% of the market share in Brazil in 2011.
In addition, Itaú BBA advised 38 merger and acquisition transactions with an aggregate deal volume of R$22.8 billion in 2011, ranking second in Brazil based on net debt of target according to Thomson.
During 2011, Itaú Corretora acted as a broker dealer for transactions totaling R$191.4 billion on shares on the BM&F Bovespa for individual, institutional, foreign and company clients. During 2011, Itaú Corretora was in fifth place in the ranking of brokerages, with a 5.9% market share. Also, Itaú Corretora finished 2011 with a 7.9% market share and 100.7 million negotiated contracts on the Futures market, an increase of 21.4% when compared with 2010. See “— Commercial Banking — Brokerage”.
Itaú BBA has a strong and evident commitment to environmental and social management that dates back to 2000 when Itaú BBA created its environmental management system. In 2004, Itaú Unibanco adopted the Equator Principles, being the first financial institution from emerging markets to adopt criteria to assess financing from a social and environmental perspective of risk. The Equator Principles were launched in 2003 and there are currently 73 financial institutions that have voluntarily committed themselves to incorporating the Equator Principles into project financing deals worth US$10 million or more. Itaú Unibanco’s project finance deals, as defined by Basel II, conducted by Itaú BBA, must comply with the Equator Principles criteria. In 2011, six project finance deals were assessed using Equator Principles criteria representing about R$5.1 billion in total investment and approximately R$1.5 billion on Itaú BBA’s share.
In addition to adopting the Equator Principles, Itaú Unibanco, represented by Itaú BBA, plays a leading role in the Equator Principles Steering Committee and Update Review Process Working Groups, having occupied the position of Chair of the Steering Committee from September 2008 until March 2010. As a consequence of its outstanding performance in sustainability, Itaú Unibanco was elected Sustainable Bank of The Year by FT/IFC Sustainable Finance Conference and Awards in 2011.
In 2007, Itaú Unibanco approved its first institutional Social and Environmental Risk Policy for credit deals and updated the policy in 2011. Itaú BBA, in compliance with the new policy, developed its own Social and Environmental Risk Policy for credit deals in order to address its clients’ needs.
Itaú BBA has a multidisciplinary team responsible for social and environmental risk assessment in credit deals and for developing business opportunities including promoting sustainable products and green lines. In addition, in 2011, in order to develop Itaú BBA’s capacity in dealing with social and environmental themes, the members of the environmental and social risk analysis team underwent 400 hours of training on biodiversity, sustainability in hydropower projects, legal environmental issues, social and environmental issues on oil and gas industry, among others. Itaú BBA’s team attended and made presentations at events with Inter-American Development Bank, United Nations Environment Programme Finance Initiative and other financial institutions, such as the International Finance Corporation.
Itaú BBA focuses on the following products and initiatives in the international business unit: (1) structuring long-term, bilateral and syndicated financing; and (2) spot foreign exchange (whereby a foreign exchange purchase in reais or sale in foreign currency is completed in two business days), which exceeded US$71.4 billion in volume in 2011.
In August 2011, Itaú BBA was recognized by Institutional Investor magazine for the second consecutive year as the best research team in Brazil and for the first time as the best sales team in Latin America. Institutional Investor also recognized the investor relations team as the best in five out of eight categories of “Latin America Investor Relations Perception”. In January 2012, Latin Finance awarded Itaú BBA as the “Best Investment Bank for Brazil” for 2011.
In October 2011, Itaú BBA was also recognized for the fourth consecutive year as “Domestic Cash Management Provider in Brazil” by Euromoney magazine.
Consumer Credit
Vehicle Financing
As of December 31, 2011, our portfolio of vehicle financing, leasing and consortium lending consisted of approximately 3.9 million contracts, of which approximately 71.5% were non accountholder customers. The personal loan portfolio relating to vehicle financing, leasing and the National Industrial Finance Authority (Financiamento de Máquinas e Equipamentos or “FINAME”) grew 1% to R$64,871 million in 2011 as compared to 2010, representing a market share in Brazil of approximately 33.1% as of December 31, 2011.
The vehicle financing sector in Brazil is dominated by banks and finance companies that are affiliated with vehicle manufacturers. According to ABEL, the Brazilian association of leasing companies, as of December 31, 2011, we were the largest leasing company in Brazil in terms of present value of lease operations.
We lease and finance vehicles through 13,532 dealers as of December 31, 2011. Sales are made through computer terminals installed in the dealerships that are connected to our computer network. Each vehicle financing application is reviewed based on credit scoring and dealer scoring systems. The dealer scoring system analyses the credit quality and amount of business provided by each vehicle dealer. We usually grant credit approvals within 8 minutes, depending on the credit history of the customer. Approximately 77.9% of our credit approvals in 2011 were made instantaneously because we have developed scoring models that permit pre-approvals for our customers, which provide us with a very efficient tool and high credit approval performance. Currently, all of the applications are processed through the Internet, conferring more security and agility to the process of concession of credit, for the dealers, customers and us.
The truck financing division grew 25% in 2011 as compared to 2010, reaching R$8,441 million in December 31, 2011, including vehicle financing, leasing and FINAME. The financial volume of transactions relating to motorcycles reached R$1,472 million in 2011. Itaú Unibanco Holding has a partnership with MMC Automotores do Brasil Ltda. and SBV Automotores do Brasil Ltda. for exclusive financing of Mitsubishi and Suzuki brand vehicles. The financial volume of related transactions reached R$684 million in 2011, an increase of 10.9% compared to 2010. The agreement includes that Itaú Unibanco Holding will provide loans to Mitsubishi and Suzuki dealers and that dealers will offer our products and services to their customers.
Redecard
Redecard S.A. (“Redecard”) is one of the two largest multi-brand acquirers of credit, debit and benefit card transactions in Brazil. Its activities include merchant acquiring, capturing, transmission, processing and settlement of credit and debit card transactions, prepayment of receivables to merchants, (resulting from sales made with credit cards), rental of point-of-sale (“POS”) terminals, check verification through POS terminals, and the capture and transmission of transactions using coupons, private-label cards and loyalty programs. As of December 31, 2011, Redecard was present in all municipalities in Brazil with electric power and telecommunication networks. We have held 50.0% plus one share of Redecard’s capital stock since March 30, 2009, at which time Redecard became a subsidiary of Itaú Unibanco and its results were presented on a consolidated basis in our financial statements. In May 2010, Hipercard, also a subsidiary of Itaú Unibanco, entered into an agreement with Redecard, pursuant to which, beginning in the second quarter of 2010, Redecard started capturing Hipercard transactions and Hipercard had access to Redecard’s nationwide infrastructure and network, which is expected to improve the efficiency and speed of Hipercard’s merchant affiliations.
In 2011, Redecard’s net income was R$1.4 billion, an increase of 0.3% compared to 2010. Net Operating Revenue for Redecard in 2011 totaled R$3.6 billion, representing an increase of 6.8% from 2010 due to the capture of R$230.5 billion in transactions with credit cards and debit cards, an increase of 25.2% from 2010. The number of transactions captured and processed reached 2.8 billion, representing an increase of 22.2% from 2010. In December 2011, Redecard had 1.1 million installed POS terminals throughout Brazil.
The following table sets forth the financial volume of transactions in millions of reais and the quantity of transactions of credit and debit cards processed by Redecard in 2011 and 2010:
| | | Financial volume | | | Transactions | |
| | | 2011 | | | 2010 | | | 2011 | | | 2010 | |
| | | (millions of R$) | | | (millions) | |
| Redecard | | | | | | | | | | | | | | | | |
| Credit cards | | | 151,272 | | | | 123,866 | | | | 1,402 | | | | 1,194 | |
| Debit cards | | | 79,207 | | | | 60,205 | | | | 1,433 | | | | 1,126 | |
| Total | | | 230,478 | | | | 184,071 | | | | 2,835 | | | | 2,320 | |
See “Item 4A. History and Development of the Company — Acquisitions” for a discussion on our intention to acquire all the outstanding shares of Redecard.
International Operations
Banco Itaú Argentina
Argentina is the third largest economy in Latin America by gross domestic product (“GDP”), Brazil’s main trading partner and has one of the highest GDPs per capita in South America. We believe recent increases in banking penetration demonstrate that the Argentine financial system has ample growth potential. Banco Itaú Argentina’s core business is retail banking, with approximately 281,000 customers in the Argentine middle and upper-income segment as of December 31, 2011. Compared with 2010, this represents a 6.3% increase in the number of customers. As of December 31, 2011, Banco Itaú Argentina had assets of R$3,436 million, loan and leasing operations of R$2,162 million, deposits totaling R$2,599 million and shareholders’ equity of R$323 million. As of the same date, Banco Itaú Argentina had 81 branches, 201 ATMs and 22 CSBs.
Banco Itaú Chile
Banco Itaú Chile started its official activities on February 26, 2007, when BAC transferred the operations of BankBoston Chile and BankBoston Uruguay to us. This acquisition increased our presence in Latin America and expanded the scope of our operations. In addition, Itaú Chile Inversiones Servicios y Administración S.A. provides services related to collection, securitization and insurance. In 2011, we also entered into an agreement with MCC for the joint development of third party wealth management services. Also in 2011, we acquired the high net worth portfolio of HSBC Bank.
As of December 31, 2011, our consolidated Chilean operations had R$16,712 million in assets, R$12,537 million in loans and leases, R$10,655 million in deposits and R$1,993 million in shareholders’ equity. According to the Chilean banking and financial institutions regulator (Superintendencia de Bancos e Instituciones Financieras –SBIF), as of that same date, Banco Itaú Chile ranked eighth in the Chilean loans and leases market with a 3.95% market share and ranked fifth in number of demand deposit accounts in the private sector, with approximately 164,000 accounts.
Banco Itaú Chile offers several products such as factoring, leasing, corporate finance, mutual funds, insurance brokerage and trading, which are offered through different entities and different lines of business. The retail segment focuses on the upper-income segment that, as of December 31, 2011, accounted for 61.6% of Banco Itaú Chile’s total revenues. As of December 31, 2011, Banco Itaú Chile had 62 ATMs and 88 branches, of which 66.7% were located in Santiago. Banco Itaú Chile’s commercial banking segment offers a wide range of products to improve customer experience by building a competitive advantage based on service quality, products and processes for targeted customers (companies with annual revenues of between US$2 million and US$100 million). Banco Itaú Chile’s global corporate banking segment offers local and international corporate finance capabilities such as syndications, private placements and securitizations. It also provides trade financing and global treasury services complementing Banco Itaú Chile’s marketing strategy. Treasury products such as foreign exchange and derivatives are a key part of this strategy.
Banco Itaú Uruguay
Bank Itaú’s operations in Uruguay include Banco Itaú Uruguay, the main credit card issuer, OCA S.A. (“OCA”), and the pension fund management company Unión Capital AFAP S.A. (“Unión Capital”), making Bank Itaú one of the leading financial operations in Uruguay. Banco Itaú Uruguay’s strategy is to serve a broad range of customers through customized banking solutions. As of December 31, 2011, Bank Itaú’s operations in Uruguay had R$4,882 million in assets, R$2,201 million in loans and leases, R$3,691 million in deposits and R$444 million in shareholders’ equity.
Banco Itaú Uruguay ranks third in terms of asset volume among private banks in Uruguay, according to the Uruguayan Central Bank (Banco Central del Uruguay) (“BCU”).
The retail banking business is focused on individuals and small business customers, with more than 181,500 customers as of December 31, 2011. The core branch network is located in the metropolitan area of Montevideo with 17 branches. In addition, Banco Itaú Uruguay has branches in Punta del Este, Tucuarembó, Salto, Paysandú y Mercedes Banco Itaú Uruguay has a leading position in the debit card segment of private banks in Uruguay with 18.5% market share as of December 31, 2011, according to BANRED, and a leading role as a credit card issuer (mainly Visa), with a 28.5% market share as of December 31, 2011 based on the aggregate amount of credit card purchases in Uruguay according to Visanet Compañía Uruguaya de Medios de Procesamiento S.A. Retail products and services focus on the middle and upper-income segments, and also include current and savings accounts, payroll payment, self-service areas and ATMs in all branches, and phone and Internet banking. The wholesale banking division is focused on multinational companies, financial institutions, large and medium-sized corporations and the public sector. It provides lending, cash management, treasury, trade and investment services. Additionally, the private banking business unit provides a dedicated regional service (for both resident and non-resident customers), offering a full portfolio of local and international financial market products.
OCA is the main credit card issuer in Uruguay, with a 40.1% market share based on the aggregate amount of credit card purchases in Uruguay as of December 31, 2011, and an approximately 50.0% market share in terms of number of transactions processed. OCA performs the three main credit card operations: customer acquisition, issuance of cards and transaction processing. The main products offered by OCA are credit cards and consumer loans and it had approximately 405,000 customers, and a network of 21 branches, as of December 31, 2011.
Unión Capital is a pension fund management company which has been operating in Uruguay since 1996, when the current Uruguayan pension system was created. As of December 31, 2011, it had approximately 231,000 customers, managed US$1,280 million in pension funds, with a market share of 16.5%, according to the BCU.
Banco Itaú Paraguay
Banco Itaú Paraguay S.A. (“Banco Itaú Paraguay”), formerly known as Interbanco, was set up in Paraguay in 1978 and has become one of the largest banks in the Paraguayan financial market. In 1995, Interbanco was acquired by Unibanco, and the “Itaú” brand has been present in the country since July 12, 2010. Banco Itaú Paraguay has experienced significant growth since 1999, expanding the variety and quality of its services across the country. As of December 31, 2011, Banco Itaú Paraguay had 27 branches, approximately 295,000 customers and 204 ATMs.
Banco Itaú Paraguay’s products and services operate under the following structure: corporate banking (small and medium-sized businesses, agribusiness, large companies, institutional clients) and consumer banking (individuals and payroll customers). Its main sources of income are consumer banking products, primarily credit cards. The retail segment also focuses on the payroll customers. Under corporate banking, Banco Itaú Paraguay has a well-established presence in the agribusiness segment, which has experienced attractive credit performance. Banco Itaú Paraguay has been the most profitable bank in Paraguay for the past seven years. As of December 31, 2011, Banco Itaú Paraguay had R$3,748 million in total assets, including R$2,364 million in loans and leases and R$2,665 million in deposits.
Banco Itaú Paraguay is also recognized by launching innovative products and services. It provides its customers several products and services, such as International Debit Card Cirrus Maestro and the Internet Banking Service Interhome Banking and also offers banking customer information through mobile phones with the Click Banking service.
Itaú Colombia
In November 2011, Itaú BBA was authorized by the Central Bank to structure its wholesale and investment bank operations in Colombia, pending approval by local regulatory bodies, which is expected to be granted in 2012. Itaú BBA’s target market is composed of institutional investors and large companies present in Brazil. The products portfolio will include loan operations, foreign trade financing, foreign exchange and derivatives, and investment bank activities, such as advising on mergers and acquisitions and access to capital markets.
Banco Itaú BBA International
Banco Itaú BBA International, is a Portuguese-chartered bank controlled by Itaú Unibanco Holding. Banco Itaú BBA International focuses mainly on two lines of business:
| · | Corporate & Investment Banking — This segment supports the financial needs of companies with international presence and operations and is an important player in the segment of international financial operation associated with trading finance and investment relations between Latin America and Europe. The various services provided include the origination of structured financing and risk hedge operations, including exchange rate and interest rate derivatives, particularly involving European parent corporations of companies in Latin America, the financing of exports among Itaú Unibanco’s best corporate clients and European companies, advisory and financing services to European companies investing in Latin America, and also to Latin American companies undergoing internationalization processes. This segment includes also all the activities conducted by Itaú Unibanco Group in the financial, capital and derivative markets, both to meet the needs for financing other activities of Itaú Unibanco Group and to develop financial intermediation activities and management of its assets. These activities involve funding and applications in interbank markets, the issue of debt securities and structured funding products, intermediation (creation and distribution) of debt securities for clients, particularly large companies and groups, clients of Itaú Unibanco Group, investment and trading securities, derivatives and structured products, with institutional investors and corporate clients. |
| · | Private Banking — The international Private Banking business is conducted by Banco Itaú Europa Luxembourg, Banco Itaú Europa International, Itaú Bank & Trust Bahamas and Banco Itaú Suisse. This segment offers financial and asset management services for customers with high purchasing power by providing a diversified and specialized basis of investment funds, trading and managing on their account securities and other financial instruments, as well as by managing trusts and investment companies on behalf of customers. As part of our strategy, we are scaling down our Luxembourg activities and the private bank operations currently performed in Luxembourg will gradually be transferred to Switzerland. |
As of December 31, 2011, Banco Itaú BBA International had US$6,750 million in assets, US$3,963 million in loans and leases, US$1,895 million in deposits and US$746 million in shareholders’ equity.
Banco Itaú BBA International’s corporate banking business offers several products, such as credit, derivatives and advisory services for European companies with Latin American subsidiaries.
The private banking business provides financial and asset management services to our Latin American customers, putting at their disposal a diversified and specialized range of investment funds, dealing in and managing securities and other financial instruments, trusts and investment companies on behalf of customers. Assets under management of the private banking business amounted to US$12,589 million as of December 31, 2011.
All of our transactions with Banco Itaú BBA International and its subsidiaries are on an arm’s-length basis.
Other International Operations
Our other international operations have the following objectives:
| (1) | Support our customers in cross-border financial transactions and services: |
The international units of Itaú Unibanco Holding are active in providing our customers with a variety of financial products such as trade financing, loans from multilateral credit agencies, off-shore loans, international cash management services, foreign exchange, letters of credit, guarantees required in international bidding processes, derivatives for hedging or proprietary trading purposes, structured transactions, and international capital markets offerings. These services are mainly offered through our branches in Nassau, New York, Cayman Islands, and Uruguay, as well as through Banco Itaú Argentina and Banco Itaú Chile.
Also among our international units, Itaú Unibanco Tokyo branch offers a portfolio of services and products that satisfy the banking needs of Brazilians living in Japan.
(2) Manage proprietary portfolios and raise funds through the issuance of securities in the international market:
Funds rising through the issuance of securities, certificates of deposit, commercial paper and trade notes can be executed by Itaú Unibanco’s branches located in the Cayman Islands, Bahamas and New York, as well as through Itaú Bank Ltd. (“Itaú Bank”), a banking subsidiary incorporated in the Cayman Islands.
The proprietary portfolios are mainly held by Itaú Bank and Itaú Unibanco Cayman Islands branch. These offices also enhance our ability to manage our international liquidity. Itaú BBA’s proprietary positions abroad are booked in the Itaú BBA’s Nassau branch.
Through our international operations, we establish and monitor trade-related lines of credit from foreign banks and maintain correspondent banking relationships with money centers and regional banks throughout the world and oversee our other foreign currency-raising activities.
(3) Participate in the international capital markets as dealers:
Itaú BBA has equity and fixed income sales and trading teams in São Paulo, New York, London, Hong Kong and Tokyo. Besides having one of the largest sales and trading teams in Latin America, we have the largest research analyst team in Latin America and provide extensive coverage of over 176 listed companies in Brazil, Mexico, Chile, Colombia, Peru and Argentina. Our international fixed income and equity teams are active in trading and offering Brazilian and Latin American securities to institutional investors.
(4) In addition, we are also present and servicing our clients in Asia, especially in China, through Itaú BBA’s representative office in Shanghai.
Trade Financing
As of December 31, 2011, our trade finance portfolio accounted for US$13,034 million, of which US$9,983 million was export related (both pre-export and post-export financing). Our export financing to larger corporate customers is generally unsecured, but some transactions require complex guarantees, particularly those originally structured to be syndicated. Our import financing business accounted for US$3,051 million as of December 31, 2011. For the year ended December 31, 2011, our total volume of foreign exchange transactions related to exports was approximately US$27,060 million and our total volume of foreign exchange transactions related to imports was approximately US$28,457 million.
Marketing and Distribution Channels
We provide integrated financial services and products to our customers through a variety of marketing and distribution channels. Our distribution network consists principally of branches, ATMs and CSBs, which are banking service centers located on corporate customers’ premises.
The following table provides information relating to our branch network, CSBs and ATMs as of December 31, 2011 in Brazil and abroad:
| | | Branches | | | CSBs | | | ATMs | |
| Itaú Unibanco | | | 3,606 | | | | 878 | | | | 27,810 | |
| Itaú Personnalité | | | 214 | | | | 3 | | | | 454 | |
| Itaú BBA | | | 9 | | | | — | | | | — | |
| Total in Brazil | | | 3,829 | | | | 881 | | | | 28,264 | |
| Itaú Unibanco abroad (excluding Latin America) | | | 4 | | | | — | | | | — | |
| Argentina | | | 81 | | | | 22 | | | | 201 | |
| Chile | | | 88 | | | | — | | | | 62 | |
| Uruguay | | | 43 | | | | 1 | | | | 38 | |
| Paraguay | | | 27 | | | | 8 | | | | 204 | |
| Total | | | 4,072 | | | | 912 | | | | 28,769 | |
The following table provides information relating to the geographic distribution of our distribution network throughout Brazil as of December 31, 2011:
| Region | | Branches | | | CSBs | | | ATMs | |
| South | | | 639 | | | | 119 | | | | 3,942 | |
| Southeast | | | 2,531 | | | | 614 | | | | 19,994 | |
| Center-west | | | 294 | | | | 66 | | | | 1,686 | |
| Northeast | | | 287 | | | | 50 | | | | 2,053 | |
| North | | | 78 | | | | 32 | | | | 589 | |
| Total in Brazil | | | 3,829 | | | | 881 | | | | 28,264 | |
Branches
As of December 31, 2011, we had a network of 3,829 full service branches throughout Brazil. As of December 31, 2011, 79.8% of our branches were located in the States of São Paulo, Rio de Janeiro and Minas Gerais in the Southeast region, Paraná in the South, and Goiás in the Center-west. The branch network serves as a distribution network for all of the products and services we offer to our customers, such as credit cards, insurance plans and private retirement plans.
Customer Site Branches
As of December 31, 2011, we operated 881 CSBs throughout Brazil. The range of services provided at the CSBs may be the same as those provided at a full service branch, or more limited according to the size of a particular corporate customer and its needs. CSBs represent a low-cost alternative to opening full service branches. In addition, we believe CSBs provide us with an opportunity to target new retail customers while servicing corporate customers and personnel.
ATMs
As of December 31, 2011, we operated 28,264 ATMs throughout Brazil. Our customers may conduct almost all account, related operations through ATMs. ATMs are low cost alternatives to employee-based services and give us points of service at costs significantly lower than branches. We also have arrangements with other network operators such as the brands “Cirrus” and “Maestro” to allow our clients to use simplified services through their networks.
Risk Management
We have implemented processes to comply with risk management rules adopted by the Central Bank in line with Basel II. Our required regulatory capital has the following components, pursuant to CMN Resolution No. 3,490:
| · | PEPR: the regulatory capital required to cover credit risk and other asset exposures not included in the other portions; |
| · | PCAM: the regulatory capital required to cover market risk exposure related to gold and fluctuation of foreign currencies; |
| · | PJUR: the regulatory capital required to cover market risk exposure in the trading book related to interest rate fluctuation; |
| · | PCOM: the regulatory capital required to cover market risk exposure related to commodity price fluctuation; |
| · | PACS: the regulatory capital required to cover market risk exposure in the trading book related to equity price fluctuation; and |
| · | POPR: the regulatory capital required to cover operational risk exposure. |
We manage our risk exposure using advanced methodologies aligned with Basel II requirements and therefore our risk management tools either already incorporate many of the features required by Basel II or we are in the process of including such requirements. Our efforts are concentrated on Basel II capital requirement rules related to credit, market and operational risks and we are in the process of implementing the advanced approaches defined in the Basel Accord. Additionally, Itaú Unibanco actively participates in discussions and studies on Basel III in Brazil and abroad. See ”Item 5B. Liquidity and Capital Resources — Capital” for a discussion of our regulatory capital requirements and our calculation of regulatory capital. Moreover, in order to meet the provisions of CMN Resolution No. 3,988, Itaú Unibanco is establishing and implementing its capital management structure.
As part of our risk control tools, we developed and improved proprietary risk management systems that are in compliance with the Central Bank’s regulations and aligned with international practices and procedures. These models are based on the following elements:
| · | Economic, financial and statistical analyses, which enable the evaluation of the effects of adverse events on our liquidity, credit and market positions; |
| · | Market risks, using VaR to evaluate risk in the structural portfolio, and stress tests using independent scenarios, to evaluate our exposure on a consolidated basis in extreme situations; |
| · | Credit risks tools, which typically involve credit analysis and behavior scoring for retail portfolios and proprietary rating models for corporate customers. We also use credit portfolio management models to quantify and allocate economic capital; |
| · | Operational risks, many of which have been evaluated through the use of internal databases and statistical models that monitor the frequency and the severity of internal events of loss to quantify the risks and allocate economic capital. We are in the process of extending statistical and scenario-based approaches to cover all material operational risks; |
| · | Daily monitoring of positions in relation to pre-established market risk limits; and |
| · | Simulations of alternatives for protection due to liquidity losses and contingency plans for crisis situations in different scenarios. |
The Risk Control and Finance Division (“ACRF”), our corporate risk division, centralizes credit, market, operational, liquidity, and insurance underwriting risk management. In addition, we have established committees responsible for risk management, structured as follows:
| · | The Capital and Risk Management Committee (“CGRC”) advises our board of directors on its functions related to Itaú Unibanco’s risks and capital management. The CGRC submits reports and recommendations for the analysis of the board of directors with respect to: (i) supervision of Itaú Unibanco’s risk management and control activities; (ii) review and approve capital management policies and strategies; (iii) determination of the minimum return expected on Itaú Unibanco’s capital; (iv) supervision of incentives structures, including compensation; and (v) the improvement of Itaú Unibanco’s risk culture. See “Item 6C. Board Practices — Statutory Bodies”. |
| o | The Superior Risk Policies Committee (“CSRisc”) is our superior risk and capital management body at the executive level, responsible for (i) establishing guidelines consistent with the policies on risk management; (ii) approving management-level risk policies with high impact on capital positions; (iii) defining decision authority levels for the lower level committees; (iv) setting limits combined by type of risk, and ensuring consistency of risk management across the Itaú Unibanco Group. In addition to the CSRisc, senior management oversight of risk management is performed through four committees: the Superior Institutional Treasury Committee (“CSTI”) and the Superior Institutional Treasury and Liquidity Committee (“CSTIL”), the Superior Credit Committee (“CSC”), and the Superior Audit and Operational Risk Management Committee (“CSAGRO”). |
| § | The CSTI and the CSTIL are responsible for assessing and establishing strategies for market and liquidity risks. CSTI establishes the exposure limits for market risk and the maximum loss limits of positions based on the limits determined by CSRisc. The limits are monitored on a daily basis and excesses are reported to the appropriate level. CSTIL establishes liquidity limits based on the limits determined by CSRisc, and monitors current and future levels of liquidity in order to manage cash flows. |
| § | The CSC is responsible for managing large corporate credit risks, including establishing corporate credit policies, coordinating internal rules on credit limits to grant financing and bank guarantees and determining the authority levels to approve credit transactions. |
| o | The CSAGRO is responsible for operational risks and internal controls, including (i) managing risks associated with our processes and businesses; (ii) setting up guidelines for internal audits and management of operational risks; and (iii) analyzing the results from our internal controls and compliance system. |
| o | The Superior Product Committee (“CSP”) approves products, operations, services and processes in Itaú Unibanco, ensuring the adherence to the customer and unit needs, and is responsible for assessing potential risks for Itaú Unibanco and its public relations. |
We believe that the deployment of the advanced approaches of Basel II and Basel III will benefit the institution as it will promote greater alignment of regulatory requirements and internal management, which are already based on sophisticated models for identifying, measuring and monitoring risks. Therefore, we are actively contributing to the adaptation and standardization of Basel II and Basel III through active participation in discussions in several forums in Brazil and abroad and through dialogue with central banks.
Market Risk Management
Market risk is defined as the possibility of losses and reduction in capital as a result of fluctuations in the market prices of financial instruments. It includes, among other things, risks associated with interest rates, foreign exchange rates, commodity prices and stock prices. The market risk control carried out by Itaú Unibanco covers all financial instruments contained in all portfolios of the companies controlled by Itaú Unibanco. In this respect, Itaú Unibanco’s market risk management policy is in line with the principles of CMN Resolution No. 3,464, of June 26, 2007, constituting a set of principles that guide the institution’s strategy of market risk control and management in all conglomerate business units and legal entities of the Itaú Unibanco group.
To manage and control market risk, we have implemented internal risk management and valuation models. These models employ statistical and historical information with regard to interest and foreign exchange rates, volatilities and trends, and seek to reduce the impact of market fluctuations on our liquidity, results of operations and financial condition. The internal VaR model used by Itaú Unibanco considers a one-day holding period and a 99% confidence level. Volatilities and correlations are estimated based on a methodology that confers higher weight to the most recent information.
Market risk control is managed by a control unit in each business unit, which performs daily measurement, evaluation and reporting of market risk to the corporate market risk area and regulatory authorities that oversee the business unit. The corporate market risk area is responsible for monitoring, evaluating and reporting consolidated market risk information, providing support to the superior committees and monitoring compliance with Brazilian regulatory agency requirements.
Liquidity Risk Management
Liquidity risk is defined as the occurrence of imbalances between assets and liabilities, or a mismatch between payments and receipts, that may affect an institution’s payment capabilities, taking into consideration the different currencies and settlement terms of its rights and obligations. Liquidity risk management aims to use best practices so as to avoid cash shortages and difficulties making payments.
Liquidity risk management is overseen by CSTIL, which analyses current and expected levels of liquidity and establishes limits related to liquidity, including the maximum levels of liquidity mismatch based on maturities and currencies and minimum levels of reserves in domestic and foreign currencies. It also establishes policies for raising and investing funds in the national and international markets and strategies for funding our portfolios. This committee reports to CSRisc and oversees the Institutional Treasury Management Committee, and bears the responsibility of setting limits regarding liquidity risk and developing criteria and models for liquidity risk assessment. In addition, the Cash Committee is responsible for implementing and controlling the established strategies for liquidity risk control.
We have a structure dedicated to improving monitoring and analysis of liquidity risk by applying statistical models and economic and financial forecasts of the variables that impact cash flows and the level of reserves in local and foreign currency.
In addition, we have established guidelines and limits, which compliance is periodically reviewed by technical committees to ensure an additional safety margin with respect to the minimum liquidity requirements based on our models. Our liquidity management policies and related limits are established based on prospective scenarios that are periodically reviewed in light of cash requirements due to atypical market conditions or arising from strategic decisions.
Pursuant to the requirements of CMN Resolution No. 2,804 and Central Bank Circular No. 3,393, we deliver our Liquidity Risk Statements (DRL) to the Central Bank monthly and the following items are regularly prepared and submitted to senior management for monitoring and support:
| · | Different scenarios for liquidity projections; |
| · | Contingency plans for critical situations; |
| · | Reports and charts to enable monitoring risk positions; |
| · | Evaluation of funding costs and alternatives for funding sources; and |
| · | Tracking and control of funding sources by counterparty type, maturity and other aspects. |
Credit Risk Management
Credit risk is defined as the possibility of losses associated with the failure by the borrower or counterparty to fulfill their obligations. It includes, among other things, counterparty risk, country risk, currency transfer risk, guarantor risk, settlement risk and product concentration risk. Our continuous improvement in the process for decision-making and for credit risk management and control, guided by the best market practices, have made it possible for us to use methodologies based on mathematical modeling for risk analysis, including the following:
| · | Analysis of our credit portfolios and definition of credit limits using economic capital for credit risk as a measure of risk; |
| · | A risk-adjusted return on capital model; |
| · | Review of new products and credit policy changes that indicate increased risk; |
| · | Quality of the portfolios by customer, industry group, product lines, line of business, and economic sector; |
| | | |
| · | Concentration and dispersion of the portfolios (by maturities, lines of business, currency, credit by customer and economic sector); |
| · | Evolution of the profile of the portfolio and economic impacts arising therefrom (e.g., allowance for loan losses and allocated capital); |
| · | Validation of customer rating models, probabilities of default, loss given default and exposure at default for market segments; |
| · | Control of ratings change and volatility; |
| · | Monitoring of the largest credits, including evolution of amounts borrowed, allowance and allocated economic capital for credit risk; and |
| · | Assessment and risk control of changes in products, credit and collection policies that involve changes in risk parameters is overseen by CSC and CSRisc. |
We prepare our credit policy on the basis of internal and external factors, relating to the economic environment in Brazil and abroad. Such factors include customer ratings, determined by advanced credit analysis and control instruments, levels of default, rates of return, quality of the portfolio, and economic capital allocated. We have focused on evaluating the risk/return ratio in our strategy to expand our assets. Our main concern is the quality of the credit portfolio and the creation of value for our shareholders. The decision-making process and the definition of our credit policy are centralized to ensure synchronized actions and optimize business opportunities.
Our CSC defines the credit approval authority levels for individual divisions. The approval authority depends on the professional skills and personal experiences of each individual with credit authority, and also considers the economic conditions and risk profile of the different divisions. In addition, each division has credit committees, composed of the credit managers and directors, that establish standards and limits, fix risk classifications and oversee the credit operation approval process, models and policies of that division. Depending on the amount and terms of a proposed loan, as well as on the risk rating of the potential borrower, the credit committee must consult with the CSC.
Within retail and very small, small and medium businesses, most types of loans to individuals and companies are subject to our automated credit process. When an account is established with us, we obtain information about the customer’s income, net worth and professional standing (in the case of individuals). In addition, information from outside agencies, such as the Central Bank, is also gathered automatically and credit record and relationship history is continuously updated. Based on these data and advanced credit and behavior scoring models, we assign each customer an aggregate credit limit. The customer must update new credit information at least annually.
There is a different credit review process for credit amounts higher than those available through the automated credit process and for categories of customer or types of credit not subject to the automated credit process, including credit operations in the middle market and corporate divisions. In these cases, we examine each application individually, verify data and carry out traditional credit analysis methodologies.
In addition, our credit business unit carries out technical support research on business groups and economic and industrial sectors within Brazil. This enables us to evaluate credit risk for companies in the middle market (with annual revenues in excess of R$6 million) and corporate divisions. Payroll deduction loans are evaluated at least on a yearly basis, or sooner, if something relevant comes to the attention of the credit business unit.
We give to each credit manager (manager of the credit business unit responsible for a team of credit analysts) a credit approval authorization limit for each of several categories of loans. The amount of the limit depends upon the experience of the particular manager and economic conditions. Loans up to R$100 million require approval from the credit committee, and may require approval from a senior credit authority, depending on the term of the proposed loan, the credit rating of the potential borrower and the allocated capital for the proposed loan. In addition, any proposed capital allocation greater than R$20 million is subject to the approval of the CSC.
Itaú BBA targets the large corporate divisions and its credit decision process is also based on the rating and size of the loan. There is no individual authority. The highest credit authority within Itaú BBA is represented by the president and the credit director who together can approve up to R$820 million, depending on the risk rating. Any loan above R$820 million must be submitted for CSC approval.
Operational Risk Management
Operational risk is defined as the possibility of losses resulting from failure, deficiency or inadequacy of internal processes, people and systems or from external events. It includes legal risk, coupled with inadequacy or deficiency of contracts, as well as the penalties due to non-compliance with laws and punitive damages to third parties arising from the activities undertaken by an institution.
The sophistication of the banking businesses and the evolution of technologies have increased the complexity of our risk profiles and affected our operational risk management. As a result, we have established a specific structure for the operational risk distinct from the one traditionally applied to market and credit risks. The CSAGRO oversees operational risk management and establishes guidance for internal auditing. The committee analyses audit reports, establishes operational risk management guidelines and models and monitors internal controls, operational risks and legal compliance. Decisions regarding capital measurement models and risk control policies are made by the CSRisc.
In line with the principles established by the CMN, we established an operational risk management policy, which was approved by our audit committee and ratified by the board of directors. The operational risk management policy is applicable to Itaú Unibanco Holding. The policy is comprised of a set of principles, procedures and guidelines that provide for the management of products, services, activities, processes and systems’ risks, also taking into consideration their nature and complexity. The policy defines the procedures for identifying, assessing, mitigating, monitoring and reporting in respect to operational risk, as well as its participants’ roles and responsibilities.
Since July 1, 2008, the Central Bank has required financial institutions to allocate capital for operational risk, based on Basel II operational risk capital requirements guidelines. Itaú-Unibanco Holding has opted for the Alternative Standardized Approach (“ASA”).
See “Item 5B. Liquidity and Capital Resources — Capital”.
Insurance Underwriting and Portfolio Risk Management
Insurance underwriting and portfolio risk is the risk from an adverse economic scenario that contradicts the assumptions used in our underwriting policy and in estimating its reserves. This risk is managed by the same bodies that oversee operational risk as described above. Management of our insurance operations establishes our underwriting policies relating to retentions, protections, reinsurance programs and pricing, depending on the type of business. This approach is designed to maintain high quality underwriting, pricing discipline and reduce volatility in the results. The actuarial department analyses the adherence of the probability tables used in the pricing models to the experience of our portfolio. In the retail market, the prices of our insurance products are established according to proprietary scoring and rating systems based on data we gathered and analyzed over many years, which underwriters use to assess and evaluate risks prior to quotation. This information provides specialized knowledge relating to industry segments and helps analyze risk based on account characteristics and pricing parameters. In the group life market, the prices of our insurance products are established according to rating systems based on an international actuarial table of mortality and the historical experience of our policies, the age of the group, the industry segments, the percentage of females and males and experience of each group and the financial health of the client. Property insurance underwriting is monitored through risk factors and pricing is based on exposure based on economic segment analysis, activity and level of severity risk, customer and similar companies experiences, financial health and customized management instruments. Our strategy for reinsurance underwriting is to work with a limited number of reinsurers in order to have a high pre-negotiated retention limit, which decreases our risk exposure. In addition, the underwriters analyze all of our accounts on an annual basis to manage risk associated with our insurance portfolio. In addition we apply risk-adjusted return on capital model to the corporate segment to allocate enough capital to ensure business sustainability. The risk adjustment return on capital model allows us to quantify the exposure to risk based on statistical criteria.
Funding
Main Sources
Our principal source of funding is deposits. Deposits include non-interest bearing demand deposits, interest bearing savings account deposits, time deposits certificates sold to customers and interbank deposits from financial institutions. As of December 31, 2011, total deposits amounted to approximately R$ 243 billion, representing 42.3% of total funding. As of December 31, 2010, total deposits amounted to approximately R$ 203 billion, representing 39.9% of our total funding. Our savings deposits represent one of our major sources of funding which, as of December 31, 2011 and 2010 accounted for 27.7% and 28.6% of total deposits, respectively.
The following table sets forth a breakdown of our sources of funding as of December 31, 2011 and 2010:
| | | 2011 | | | 2010 | |
| | | millions of
R$ | | | % of total
funding | | | millions of
R$ | | | % of total
funding | |
| Deposits | | | 242,636 | | | | 42.3 | | | | 202,688 | | | | 39.9 | |
| Demand deposits | | | 28,932 | | | | 5.0 | | | | 25,349 | | | | 5.0 | |
| Investment deposits | | | - | | | | - | | | | 906 | | | | 0.2 | |
| Savings deposits | | | 67,170 | | | | 11.7 | | | | 57,900 | | | | 11.4 | |
| Time deposits | | | 144,469 | | | | 25.2 | | | | 116,416 | | | | 22.9 | |
| Interbank deposits | | | 2,065 | | | | 0.4 | | | | 1,929 | | | | 0.4 | |
| Other deposits | | | - | | | | - | | | | 188 | | | | - | |
| Securities sold under repurchase agreements | | | 185,413 | | | | 32.3 | | | | 199,657 | | | | 39.2 | |
| Interbank market debt | | | 90,498 | | | | 15.8 | | | | 62,599 | | | | 12.1 | |
| Mortgage notes | | | 244 | | | | - | | | | 302 | | | | 0.1 | |
| Real estate credit bills | | | 15,751 | | | | 2.7 | | | | 8,736 | | | | 1.7 | |
| Agribusiness credit bills | | | 3,284 | | | | 0.6 | | | | 2,774 | | | | 0.5 | |
| Financial credit bills | | | 14,308 | | | | 2.5 | | | | 2,466 | | | | 0.5 | |
| Import and export Financing | | | 21,452 | | | | 3.7 | | | | 15,455 | | | | 3.0 | |
| Onlending-domestic | | | 35,459 | | | | 6.3 | | | | 31,689 | | | | 6.1 | |
| Other | | | - | | | | - | | | | 1,177 | | | | 0.2 | |
| Institutional market debt | | | 54,807 | | | | 9.6 | | | | 44,513 | | | | 8.8 | |
| Debentures | | | 1,039 | | | | 0.2 | | | | 1,384 | | | | 0.3 | |
| Subordinated debt | | | 39,715 | | | | 6.9 | | | | 34,487 | | | | 6.8 | |
| Foreign borrowings through securities | | | 14,053 | | | | 2.5 | | | | 8,642 | | | | 1.7 | |
| Total | | | 573,354 | | | | 100.0 | | | | 509,457 | | | | 100.0 | |
The following tables set forth a breakdown of deposits by maturity, as of December 31, 2011 and 2010:
(in millions of R$)
| | | 2011 | |
| | | 0-30 days | | | 31-180 days | | | 181-365 days | | | Over 365 days | | | Total | |
| Non-interest bearing deposits | | | 28,932 | | | | - | | | | - | | | | - | | | | 28,932 | |
| Demand deposits | | | 28,932 | | | | - | | | | - | | | | - | | | | 28,932 | |
| Other deposits | | | - | | | | - | | | | - | | | | - | | | | - | |
| Interest bearing deposits | | | 98,754 | | | | 19,849 | | | | 11,920 | | | | 83,181 | | | | 213,704 | |
| Savings deposits | | | 67,170 | | | | - | | | | - | | | | - | | | | 67,170 | |
| Time deposits | | | 30,918 | | | | 19,167 | | | | 11,475 | | | | 82,909 | | | | 144,469 | |
| Interbanks Deposits | | | 666 | | | | 682 | | | | 445 | | | | 272 | | | | 2,065 | |
| Total | | | 127,686 | | | | 19,849 | | | | 11,920 | | | | 83,181 | | | | 242,636 | |
(in millions of R$)
| | | 2010 | |
| | | 0-30 days | | | 31-180 days | | | 181-365 days | | | Over 365 days | | | Total | |
| Non-interest bearing deposits | | | 25,537 | | | | - | | | | - | | | | - | | | | 25,537 | |
| Demand deposits | | | 25,349 | | | | - | | | | - | | | | - | | | | 25,349 | |
| Other deposits | | | 188 | | | | - | | | | - | | | | - | | | | 188 | |
| Interest bearing deposits | | | 74,486 | | | | 17,550 | | | | 21,981 | | | | 63,134 | | | | 177,151 | |
| Savings deposits | | | 57,900 | | | | - | | | | - | | | | - | | | | 57,900 | |
| Investment deposits | | | 906 | | | | - | | | | - | | | | - | | | | 906 | |
| Time deposits | | | 15,332 | | | | 16,714 | | | | 21,476 | | | | 62,894 | | | | 116,416 | |
| Interbanks Deposits | | | 348 | | | | 836 | | | | 505 | | | | 240 | | | | 1,929 | |
| Total | | | 100,023 | | | | 17,550 | | | | 21,981 | | | | 63,134 | | | | 202,688 | |
The following table sets forth the mix of the individual and corporate time deposits divided among our retail, Itaú Personnalité, middle market and corporate markets (each expressed as a percentage of total time deposits) as of December 31, 2011 and 2010:
| | | 2011 | | | 2010 | |
| Retail | | | 19.0 | % | | | 15.0 | % |
| Itaú Personnalité | | | 18.2 | % | | | 27.7 | % |
| Middle market | | | 40.7 | % | | | 43.3 | % |
| Corporate | | | 22.1 | % | | | 14.0 | % |
| Total | | | 100.0 | % | | | 100.0 | % |
Other Sources
We also act as a financial agent through borrowing funds from the BNDES, and from the FINAME, and passing of such funds at a spread determined by the government to targeted sectors of the economy. We refer to these borrowings as onlending and they are primarily in the form of credit lines that are directed by the government agencies through private banks to specific targeted sectors for economic development. As of December 31, 2011, we participated as a financial agent in onlending transactions financed by BNDES and FINAME in the total amount of approximately R$35,459 million. See “─ Itaú BBA.”
We obtain U.S. dollar-denominated lines of credit from our correspondent banks to provide a source of trade finance funding for Brazilian companies. As of December 31, 2011, our total import and export funding was approximately R$21,452 million.
In addition, we obtain foreign currency funds from the issuance of securities in the international capital markets, either by borrowing privately or by issuing debt securities generally to onlend these funds in Brazil to Brazilian corporations and financial institutions. These onlendings take the form of loans denominated inreais and are indexed to the U.S. dollar. As of December 31, 2011, we had approximately R$14,053 million outstanding of structured and financial transactions. Our international operations including Portugal, the Grand Cayman-Branch, Itaú Unibanco´s Grand Cayman and New York branches, and Itaú BBA’s Nassau Branch, represent further funding vehicles for us, as they are responsible for issuing securities and establishing programs for the issuance of several financial instruments. See “─ International Operations – Other International Operations.”
We also generate additional funds for our operations through the resale to our customers of securities issued by us and previously held in our treasury account. Our customers have the right to sell the securities back to us at their option at any time until the maturity date. We pay interest on these securities funds at variable rates based on the Interbank Deposit Certificate. Total funding under this financial product as of December 31, 2011 amounted to R$185,413 million.
On January 24, 2012, Itaú Unibanco Holding, acting through its Cayman Islands Branch, issued US$550 million of 6.20% subordinated notes due 2021, to be fungible with, to be consolidated and form a single series with, and to vote as a single class with its outstanding US$500 million of 6.20% subordinated notes due 2021 issued June 21, 2011.
On March 19, 2012, Itaú Unibanco Holding, acting through its Cayman Islands Branch, issued US$1,250 million of 5.65% subordinated notes due 2022.
Technology
We are committed to offering the most advanced technology for the convenience of our customers. Therefore, we continuously invest in the development and improvement of our systems.
In 2011, our IT budget consisted of approximately R$3,000 million in expenditures, including application development, and R$1,000 million in investments, with 6,320 employees.
In 2011, we worked on improving our technology, focusing on increasing system efficiency and sustainable development and were able to make better use of our technology resources. We are also committed to better understanding and identifying our customers’ various needs, and our Internet and Mobile Banking is now available 24 hours a day, 7 days a week. Also, in the second half of 2011, the process of integration between Itaú and Unibanco was completed. Today, 100% of the technology platforms are integrated and run in a single environment.
While we were working on branch migration, we disposed of our used hardware using sustainable means gaining 25% more space in our current data center, as well as reducing our power consumption by 40%.
For our environmentally sound and energy saving actions, Itaú Unibanco received the following awards and recognition:
| · | VII Prêmio Relatório Bancário (Banking Report Award) |
| o | Prêmio Destaque – Melhor Data Center – Projeto NGDC – Next Generation Data Center (Best Data Center); |
| o | Prêmio Excelência – Melhor Serviço de Mobile Banking – Aplicativos Itaú Mobile Banking; (Best Mobile Banking Services) |
| o | Prêmio Excelência – Melhor em Serviço Tablet – Aplicativo Itaú para Tablet (Best Tablet Service) |
| · | Prêmio Datacenter Leaders Awards 2011 |
| o | Melhorias em Eficiência Energética de Datacenters (Improvements in Electricity Efficiency in Data Centers) |
| o | Melhor CIO (Best Chief Information Officer) |
| o | Banco Mais Conectado (Most Connected Bank) |
We have workplace contingency and disaster recovery processes for our main businesses. The back-up site is located in Campinas, São Paulo. Both our primary and secondary data centers have dedicated uninterruptible power systems (“UPS”) and generators that are designed to start automatically whenever a power outage occurs.
For 2012, our IT goal is to continue the modernization of our current data center, which began in 2011 and includes the virtualization of servers and the deployment of biometrics throughout the branch network as well as conclude the implementation of the demand management process, which further eliminates inefficiencies in IT processes relating to the demand of the business divisions.
In addition, on January 27, 2012, we announced the construction of a new technology center in which we will concentrate our data processing and storage equipment and is intended to become our main technology hub (“Data Center”). The Data Center will be set up on a 815 thousand-square-meter site in the city of Mogi Mirim, São Paulo representing a total investment of approximately R$800 million. The project is scheduled to be completed in 2014 and will feature approximately 60 thousand square meters of floor area and employ close to 400 direct employees on-site.
Competition
General
The last several years have been characterized by increased competition and consolidation in the financial services industry in Brazil.
Retail Banking
As of December 31, 2011, there were 139 multiple-service banks, 20 commercial banks, and numerous savings and loan, brokerage, leasing and other financial institutions in Brazil.
We, together with Banco Bradesco S.A. (“Bradesco”), Banco Santander (Brasil) S.A. (“Banco Santander”) and HSBC Bank Brasil S.A. (“HSBC”), are the leaders in the non-state-owned multiple-services banking sector. As of September 30, 2011, these banks accounted for 40.0% of the Brazilian banking sector’s total assets. We also face competition from state-owned banks. As of September 30, 2011, Banco do Brasil S.A. (“Banco do Brasil”), BNDES, and Caixa Econômica Federal (“CEF”), ranked first, fourth and fifth in the banking sector, respectively, accounting for 39.3% of the banking system’s total assets.
The table below sets forth the total assets of the top 14 banks in Brazil, ranked according to their share of the Brazilian banking sector’s total assets:
| | | As of September 30, 2011(*) | |
| | | In billions of R$ | | | % of Total Assets | |
| Banco do Brasil(**) | | | 907.7 | | | | 18.0 | |
| Itaú Unibanco Holding | | | 810.5 | | | | 16.1 | |
| Bradesco | | | 636.4 | | | | 12.6 | |
| BNDES | | | 567.9 | | | | 11.2 | |
| CEF | | | 507.3 | | | | 10.0 | |
| Banco Santander | | | 422.4 | | | | 8.4 | |
| HSBC | | | 152.3 | | | | 3.0 | |
| Banco Votorantim | | | 127.4 | | | | 2.5 | |
| Safra | | | 89.1 | | | | 1.8 | |
| Citibank | | | 62.3 | | | | 1.2 | |
| BTG Pactual | | | 59.5 | | | | 1.2 | |
| Banrisul | | | 36.8 | | | | 0.7 | |
| Deutsche | | | 33.5 | | | | 0.7 | |
| Credit Suisse | | | 28.2 | | | | 0.6 | |
| Others | | | 606.8 | | | | 12.0 | |
| Total | | | 5,048.1 | | | | 100.0 | |
(*) Based on banking services, excluding insurance and pension funds.
(**)Includes the consolidation of 50.0% of Banco Votorantim S.A. based on Banco do Brasil ownership of a 50.0% interest in Banco Votorantim S.A..
Source: Central Bank, 50 Largest Banks and the Consolidated Financial System (September 2011).
With the Association and the establishment of Itaú Unibanco Holding, new business opportunities arose in the domestic market, in which the economies of scale have become crucial for competition. Itaú Unibanco Holding has a leading position in many areas in the domestic financial market. We achieved a market share of 16.2% based on total loans as of November 2011, positioning us at second place in the Brazilian market. Not considering the public banks, we had a leading position based on total loans with 27.8% of the Brazilian market share as of November 2011.
We also have a highly qualified team of employees. We intensified our presence in the Southern Cone (Argentina, Chile, Paraguay and Uruguay) to strengthen our operations in Latin America. Our long-term strategy is to move gradually to a global position, but our strategy gives priority to the consolidation of our presence in the domestic and regional markets.
Credit Cards
The Brazilian credit card market is highly competitive, growing at a compound annual growth rate of 21.4% over the last three years, as of September 30, 2011, according to the Brazilian Association of Credit Card Companies and Services (Associação Brasileira das Empresas de Cartões de Crédito e Serviços). Itaú Unibanco’s major competitors are Bradesco, Banco do Brasil and Banco Santander. Credit card companies are increasingly adopting alliances and co-branding strategies and adapting relationship pricing policies (interest rates, cardholder fees and merchant fees) in order to strengthen their position in the market.
Asset Management
The asset management industry in Brazil has grown in recent years but is still dominated by activities of commercial banks that offer fixed-income funds to customers of retail banks. The primary factors affecting competition in institutional funds are expertise and price. Our competition in the sector includes large and well-established banks such as Banco do Brasil and Bradesco as well as several other participants such as CEF, HSBC and Banco Santander.
Insurance
The Brazilian insurance market is highly competitive. Our primary competitors in this sector, excluding health insurance, are Bradesco, Banco do Brasil, CEF, Banco Santander and other related companies. On November 30, 2011, this industry consisted of approximately 113 insurance companies of various sizes, including 29 conglomerates and 46 independent companies. The Porto Seguro Alliance resulted in gains in scale and efficiency. Giving effect to our 30.0% ownership interest in Porto Seguro, we had insurance premiums as of November 2011, with 13.8%of Brazilian market share.
Private Retirement Plans and Capitalization Products
Our primary competitors in private retirement plans and capitalization products are controlled by large commercial banks, such as Bradesco, Banco do Brasil, Banco Santander and CEF, which, like us, take advantage of their branch network to gain access to the retail market.
Corporate and Investment Banking
In the wholesale credit market, Itaú BBA contends for the top spot against Banco do Brasil (including its 50.0% stake in Banco Votorantim) based on aggregate loan volume, where it is currently followed by Bradesco and Santander Brasil.
Itaú BBA also has a prominent position in the derivatives market, particularly in structured derivatives. In this market, its main competitors are the international banks, namely Banco Citibank S.A., Banco de Investimentos Credit Suisse (Brasil) S.A., HSBC, Banco JP Morgan S.A., Banco Morgan Stanley S.A. and Banco Santander.
Itaú BBA also has a leading position in the cash management market, where its main challengers are Banco do Brasil, Banco Santander and Bradesco. In 2011, Itaú BBA received the “Domestic Cash Management Provider in Brazil” award from Euromoney, for the fourth consecutive time.
In investment banking, Itaú BBA’s main competitors include Banco Santander, Banco de Investimentos Credit Suisse (Brasil) S.A., Banco Merrill Lynch de Investimentos S.A., Banco Morgan Stanley S.A., Banco JP Morgan S.A., Bradesco and Banco BTG Pactual S.A. In 2011, Itaú BBA ranked in a top-one or two position in each of equity capital markets, debt capital markets and mergers and acquisitions.
Real Estate Financing
The main player in the Brazilian real estate market is CEF, a government owned bank. CEF is focused on real estate financing and, with its aggressive pricing strategy, is the leader in this market. This position is reinforced with the “Minha Casa, Minha Vida” federal program, which is responsible for the construction and financing of one million low income homes and for which CEF is the main operator. There are also two important private bank competitors: Banco Santander and Bradesco. Banco do Brasil, another government owned bank, is also becoming an important player in this market.
REGULATION AND SUPERVISION
The following regulation relates to the Brazilian financial system and Banking sector, unless stated otherwise. The basic institutional framework of the Brazilian financial system was established in 1964 through Law No. 4,595 of December 31, 1964, or the “Banking Reform Law. The Banking Reform Law regulates the national financial system, composed of the CMN, the Central Bank, Banco do Brasil, the BNDES, and many financial institutions from the public and private sectors. This legislation created the CMN, as the regulatory agency responsible for establishing currency and credit policies promoting economic and social development, as well as for the operation of the financial system. This law confers on the CMN powers to set the loan and capital limits, approve monetary budgets, establish exchange and interest rate policies, oversee activities related to stock markets, regulate the organization and operation of financial institutions in the public and private sectors, give authority to the Central Bank over issuing banknotes and setting reserve requirement levels, and setting out general guidelines related to the banking and financial markets.
Principal Regulatory Agencies
The CMN
The CMN, the highest authority responsible for monetary and financial policies in Brazil, is responsible for the overall supervision of Brazilian monetary, credit, budgetary, fiscal and public debt policies. The CMN is chaired by the minister of finance and includes the minister of planning budget and management and the president of the Central Bank. The CMN is authorized to regulate the credit operations which Brazilian financial institutions are engaged in, to regulate the Brazilian currency, to supervise Brazil’s reserves of gold and foreign exchange, to determine Brazilian saving and investment policies and to regulate the Brazilian capital markets. In this regard, the CMN also oversees the activities of the Central Bank and the CVM.
The Central Bank
The Central Bank is responsible for implementing the policies established by the CMN, related to monetary policy and exchange control matters, regulating public and private sector Brazilian financial institutions, monitoring and registration of foreign investment in Brazil and overseeing the Brazilian financial markets. The president of the Central Bank is appointed by the president of Brazil subject to ratification by the Brazilian senate, to perform his duties for an indefinite term. Since January 2011, the president of the Central Bank has been Mr. Alexander Antônio Tombini.
The CVM
The CVM is the body responsible for regulating the Brazilian securities and derivative markets in accordance with the general regulatory framework determined by the CMN. The CVM also regulates its participants, such as companies whose securities are traded on the Brazilian securities markets, investment funds, investors, financial intermediaries and others such as securities custodians, asset managers, independent auditors, securities analysts and consultants.
SUSEP
The Superintendence of Private Insurance (“SUSEP”), a body subject to the Ministry of Finance, established by Decree Law No. 73, of November, 21, 1966, is responsible for the supervision and control of insurance, open private pension plans, capitalization and reinsurance businesses in Brazil.
CNSP
The National Private Insurance Council (Conselho Nacional de Seguros Privados or “CNSP”), also established by Decree Law No. 73, regulates (together with SUSEP) insurance, open private pension plans, capitalization and reinsurance businesses in Brazil. The CNSP is chaired by the minister of finance or his representative and includes the superintendent of private insurance and representatives of the ministry of justice, the ministry of social welfare, the Central Bank and the CVM.
Principal Limitations and Restrictions on Financial Institutions
Under Brazilian banking laws and regulations, financial institutions may not:
| · | operate in Brazil without the prior approval of the Central Bank and carry out transactions that fail to comply with principles of selectivity of transactions, adequate guarantees, liquidity and risk diversification; |
| · | invest in the equity of another company unless the investment receives the prior approval of the Central Bank, based upon certain standards established by the CMN. Those investments may, however, be made through the investment banking business unit of a multiple-service bank or through an investment bank; |
| · | own real estate unless the institution occupies that property. When real estate is transferred to a financial institution in satisfaction of a debt, the property must be sold within one year, except if otherwise authorized by the Central Bank; and |
| · | lend more than 25.0% of their capital calculated in accordance with CMN Resolution No. 3,444 as the basis for their regulatory capital to any single person or group. |
Principal Financial Institutions
Public Sector
The federal and state governments of Brazil control several commercial banks and financial institutions devoted to fostering economic development, primarily with respect to the agricultural and industrial sectors. State development banks act as independent regional development agencies in addition to performing commercial banking activities. In the last decade, several public sector multiple-service banks have been privatized and acquired by Brazilian and foreign financial groups. Government-controlled banks include:
| · | Banco do Brasil, which is a federal government-controlled bank. Banco do Brasil provides a full range of banking products to the public and private sectors; |
| · | BNDES, which is the federal government-controlled development bank primarily engaged in the provision of medium- and long-term finance to the Brazilian private sector, including to industrial companies, either directly or indirectly through other public and private sector financial institutions; |
| · | CEF, which is a federal government-controlled multiple-service bank and the principal agent of the national housing finance system. CEF is involved principally in deposit-taking, savings accounts and the provision of financing for housing and urban infrastructure; and |
| · | other federal public sector development and multiple-service banks, including those controlled by the various state governments. |
Private Sector
The private financial sector includes commercial banks, investment, finance and credit companies, investment banks, multiple-service banks, securities dealers, stock brokerage firms, credit co-operatives, leasing companies, insurance companies and others. In Brazil, the largest participants in the financial markets are financial conglomerates involved in commercial banking, investment banking, financing, leasing, securities dealing, brokerage and insurance. As of December 31, 2011, there were 578 financial institutions operating in the private sector, including:
| · | commercial banks — approximately 19 private sector commercial banks engaged in wholesale and retail banking, being particularly active in demand deposits and lending for working capital purposes; |
| · | investment banks — approximately 14 private investment banks engaged primarily in time deposits, specialized lending, and securities underwriting and trading; and |
| · | multiple-service banks (bancos múltiplos) — 137 private sector multiple-service banks providing, through different departments, a full range of commercial banking, investment banking (including securities underwriting and trading), consumer financing and other services including fund management and real estate financing. |
In addition to the above, the Central Bank also supervises the operations of consumer credit companies (financeiras), securities dealerships (distribuidoras de títulos e valores mobiliários), stock brokerage companies (corretoras de valores), leasing companies (sociedades de arrendamento mercantil), savings and credit associations (associações de poupança e empréstimo) and real estate credit companies (sociedades de crédito imobiliário).
Regulation by the Central Bank
Overview
The Central Bank implements the currency and credit policies established by the CMN, and controls and supervises all public- and private-sector financial institutions. Any amendment to a financial institution’s bylaws, any increase in its capital or any establishment or transfer of its principal place of business or any branch (whether in Brazil or abroad) must be approved by the Central Bank. Central Bank approval is necessary to enable a financial institution to merge with or acquire another financial institution or in any transaction resulting in a change of control of a financial institution. See also “— Antitrust Regulation”. The Central Bank also determines minimum capital requirements, permanent asset limits, lending limits and mandatory reserve requirements. No financial institution may operate in Brazil without the prior approval of the Central Bank.
The Central Bank monitors compliance with accounting and statistical requirements. Financial institutions must submit annual and semi-annual audited financial statements, quarterly financial statements, subject to a limited review, as well as monthly unaudited financial statements, prepared in accordance with the Central Bank rules, all of which must be filed with the Central Bank. Publicly held financial institutions must also submit quarterly financial statements to the CVM, which are subject to a limited review. In addition, financial institutions are required to disclose to the Central Bank all credit transactions, foreign exchange transactions, export and import transactions and any other related economic activity. This disclosure is usually made on a daily basis by computer and through periodic reports and statements. A financial institution and the corporate entities or individuals which control such financial institution have a duty to make available for inspection by the Central Bank its corporate records and any other document which the Central Bank may require in order to carry out its activities.
Capital Adequacy and Leverage/Regulatory Capital Requirements
Existing Requirements
Since January 1995, Brazilian financial institutions have been required to comply with Basel I on risk-based capital adequacy, modified as described below.
In general, Basel I and Basel II require banks to maintain a ratio of capital to assets and certain off-balance sheet items, determined on a risk-weighted basis, of at least 8.0%. At least half of the required capital must consist of Tier 1 Capital, and the balance must consist of Tier 2 Capital. Tier 1 Capital includes equity capital (i.e., common shares and non-cumulative permanent preferred shares), share premium, retained earnings and certain disclosed reserves less goodwill. Tier 2 Capital, or supplementary capital, includes “hidden” reserves, asset revaluation reserves, general loan loss reserves, subordinated debt and other quasi-equity capital instruments (such as cumulative preferred shares, long-term preferred shares and mandatory convertible debt instruments). There are also limitations on the maximum amount of certain Tier 2 Capital items. To assess the capital adequacy of banks under the risk-based capital adequacy guidelines, a bank’s capital is evaluated on the basis of the aggregate amount of its assets and off-balance sheet exposures, such as financial guarantees, letters of credit and foreign currency and interest rate contracts, which are weighted according to their categories of risk.
Brazilian legislation closely tracks the provisions of Basel II standardized or basic approaches for credit, market and operational risks. Among the key differences between Brazilian legislation and Basel II are:
| · | the minimum ratio of capital to assets determined on a risk-weighted basis is 11.0%; |
| · | the risk-weighting assigned to certain assets and off-balance sheet exposures differs slightly from those set forth in Basel II, including a risk weighting of 300.0% on deferred tax assets other than temporary differences, and certain types of lending to individuals; |
| · | the ratio of capital to assets of 11.0% mentioned above must be calculated according to two different methods: by consolidating only our financial subsidiaries and on a fully consolidated basis since July 2000, i.e., including all financial and non-financial subsidiaries. In making these consolidations, Brazilian financial institutions are required to take into account all investments made in Brazil or abroad in which the financial institution holds, directly and indirectly, individually or together with another partner, including through voting agreements: (i) partner rights that ensure a majority in adopting corporate resolutions of the invested entity; (ii) power to elect or dismiss the majority of the management of the invested entity; (iii) operational control of the invested company characterized by common management; and (iv) effective corporate control of the invested entity characterized by the total equity interest held by its management, controlling individuals or entities, related entities and the equity interest held, directly or indirectly, through investment funds. Upon preparation of the consolidated financial statements, the financial institutions that are related by actual operational control or by operation in the market under the same trade name or trademark must also be considered for consolidation purposes; |
| · | since July 1, 2008, the Central Bank has required financial institutions to set aside a portion of their equity to cover operational risk based on Basel II’s guidelines on operational risk capital requirements. Itaú Unibanco Holding has opted for the Alternative Standardized Approach (ASA), which requires a financial institution to set aside 12.0% to 18.0% of its financial intermediation average gross income or a percentage of its average volume of loans, depending on the line of business, according to regulatory classification, to cover operational risks; and |
| · | undisclosed or “hidden” reserves are not included within the definition of Tier 2 Capital under Brazilian law and regulation. |
For limited purposes, the Central Bank establishes the criteria for the determination of regulatory capital for Brazilian financial institutions. In accordance with those criteria established by CMN Resolution No. 3,444, the capital of the banks is divided into Tier 1 Capital and Tier 2 Capital.
Tier 1 Capital is represented by shareholders’ equity plus balance of credit income account and blocked deposits account in order to mitigate the capital deficiency, excluding the balance of debt income account, revaluation reserves, contingency reserves, special profit reserves related to mandatory dividends not yet distributed, preferred cumulative stock, preferred redeemable stock, non-realized earnings related to available-per-sale securities market value adjustments and certain tax credits in accordance with Resolution No. 3,059, as amended, established by CMN.
Tier 2 Capital is represented by revaluation reserves, contingency reserves, special profit reserves related to mandatory dividends not yet distributed, preferred cumulative stock, preferred redeemable stock, subordinated debt and hybrid instruments and non-realized earnings related to available-for-sale securities market value adjustments. As mentioned above, Tier 2 Capital must not exceed Tier 1 Capital. In addition, preferred redeemable stock with original maturity of less than 10 years plus the amount of subordinated debt is limited to 50.0% of the amount of Tier 1 Capital.
Regulatory capital is represented by the sum of Tier 1 Capital and Tier 2 Capital and, together with the deductions described in note 32 to our consolidated financial statements as of and for the year ended December 31, 2011, is taken into consideration for the purposes of defining the operational limits of financial institutions.
Basel III Framework
On December 16, 2010, the Basel Committee on Banking Supervision (the “Basel Committee”) issued its new Basel III framework, which was revised and republished on June 1, 2011. The Basel III framework includes higher minimum capital requirements and new conservation and countercyclical buffers, revised risk-based capital measures, and the introduction of a new leverage ratio and two liquidity standards. The new rules will be phased in gradually and, as with other Basel directives, these will not be self-effectuating. Rather, each country must adopt them by legislation or regulation to be imposed upon that country’s home banks.
The Basel III framework will require banks to maintain: (i) a minimum common equity capital ratio of 4.5%, (ii) a minimum Tier 1 Capital ratio of 6% and (iii) a minimum total capital ratio of 8%. In addition to the minimum capital requirements, Basel III will require a “capital conservation buffer” of 2.5% and each national regulator is given discretion to institute a “countercyclical buffer” if it perceives a greater system-wide risk to the banking system as the result of a build-up of excess credit growth in its jurisdiction. The Basel Committee phased in the three basic minimum requirements first, beginning on January 1, 2013, with a longer period for banks to comply with the capital conservation buffer, the “countercyclical buffer” and other requirements, beginning on January 1, 2016.
Basel III also introduces a new leverage ratio. A supervisory monitoring period began on January 1, 2011 and a parallel semi-annual testing run period of a minimum Tier 1 Capital leverage ratio of 3% will begin in January 1, 2013 and run until January 1, 2017. Basel III will require banks to disclose their leverage ratio and its components beginning January 1, 2015.
In addition, Basel III aims to improve risk coverage by reforming the treatment of counterparty credit risk (“CCR”). Going forward, affected banks generally will, among other things, be required to determine their capital requirement for CCR using stressed inputs and be subject to a capital charge for potential mark-to-market losses associated with counterparties’ deteriorating credit-worthiness.
In relation to liquidity, Basel III implements a liquidity coverage ratio (“LCR”) and a net stable funding ratio (“NSFR”). The LCR will require affected banks to maintain sufficient high-quality liquid assets to cover the net cash outflows that could be encountered under a potential liquidity disruption scenario over a thirty-day period. The NFSR establishes a minimum amount of stable sources of funding a bank will be required to maintain based on the liquidity profiles of the bank’s assets, as well as the potential for contingent liquidity needs arising from off-balance sheet commitments over a one-year period. Basel III provides for an observation period which began in 2011 and it is contemplated that the LCR and the NSFR, including any revisions, will be introduced as minimum standards beginning January 1, 2015 and 2018, respectively.
In addition, on January 13, 2011, the Basel Committee expanded on the Basel III capital rules with additional requirements, also referred to generally as the “January 13 Annex”, applicable to non-common Tier 1 Capital or Tier 2 Capital instruments issued by internationally active banks. These requirements are in addition to the criteria detailed in the Basel III capital rules outlined above. To be included in additional Tier 1 Capital or Tier 2 Capital, the January 13 Annex requires an instrument issued by an internationally active bank to have a provision that requires such instruments, at the option of the relevant authority, to either be written off or converted to common equity upon a “trigger event”. A “trigger event” is the earlier of: (i) a decision that a write-off, without which the bank would become non-viable, is necessary, as determined by the relevant authority; and (ii) the decision to make a public sector injection of capital, or equivalent support, without which the bank would have become non-viable, as determined by the relevant authority. The additional requirements will apply to all instruments issued after January 1, 2013; otherwise, qualifying instruments issued prior to that date will be phased out over a ten-year period, beginning on January 1, 2013.
On November 4, 2011, the Basel Committee published the final document addressing the assessment methodology for determining the systemically important financial institutions (“G-SIFIs”) and the amount of additional regulatory capital requirements that G-SIFIs should meet and the arrangements by which such additional requirements will be phased in. The assessment methodology is based on an indicator-based measurement approach. The selected indicators reflect a G-SIFI’s (i) size, (ii) interconnectedness, (iii) lack of readily available substitute or financial institution infrastructure for the services they provide; (iv) global, or cross-jurisdictional, activity; and (v) complexity, each of them receiving an equal weight of 20.0% in the assessment. The magnitude of additional loss absorbency requirements for G-SIFIs proposed by the Basel Committee ranges from 1% to 2.5% of risk-weighted assets to be met with Common Equity Tier 1 only, as defined in the Basel III framework. The additional loss absorbency requirement for G-SIFIs will be phased-in in parallel with the “capital conservation” and “countercyclical” buffers between January 1, 2016 and year end 2018, becoming fully effective on January 1, 2019.
The Issuer has not been classified as a G-SIFI by the Basel Committee.
Implementation of Basel III in Brazil
On February 17, 2011, the Central Bank issued Notice No. 20,615, or Notice 20,615, containing preliminary guidance and an estimated schedule for the implementation of Basel III in Brazil. Further to Notice 20,615, on February 17, 2012, the Central Bank announced a process for public comment (“Public Hearing 40/2012”), proposing new regulations and the schedule for implementing certain aspects of the Basel III Framework in Brazil. The public comment period is 90 days, ending on May 17, 2012.
If Public Hearing 40/2012 is converted into effective regulation with no material changes, Brazilian banks’ minimum total capital ratio will be calculated as the sum of three components:
| · | regulatory capital (patrimônio de referência); |
| · | a fixed capital conservation buffer (to enhance the loss absorption ability of financial institutions); and |
| · | a variable countercyclical capital buffer (to address the risk of the build-up of excess credit growth). |
According to Public Hearing 40/2012, Brazilian banks’ regulatory capital will continue to comprise two tiers, Tier 1 Capital and Tier 2 Capital, and qualification of financial instruments as Tier 1 Capital or Tier 2 Capital will be based on the ability of such instruments to absorb losses at a viable financial institution. Tier 1 Capital will be further divided into two portions: Common Equity Tier 1 Capital (common equity capital, certain regulatory adjustments and profit reserves, etc.) and Additional Tier 1 Capital (hybrid debt and equity instruments authorized by the Central Bank that comply with certain requirements imposed by the applicable regulation). Existing hybrid instruments and subordinated debt already approved by the Central Bank as Tier 1 Capital or Tier 2 Capital by the date when the proposed regulations are definitively enacted by the CMN will continue to qualify as Tier 1 Capital or Tier 2 Capital, as the case may be, provided that such instruments comply with Basel III requirements as implemented by the Central Bank, including the mandatory loss absorbency provisions required under the January 13 Annex. If such instruments do not comply with these requirements as implemented by the Central Bank it is expected that such instruments will be subject to a phase-out period beginning January 1, 2013, when 10% of the nominal value of such instruments will begin to be deducted annually from the amount that qualifies as Additional Tier 1 Capital or Tier 2 Capital.
Under the proposed regulations of Public Hearing 40/2012, capital requirements will be increased in 2017 to a maximum of 13.0% of risk-weighted assets, of which 2.5% will only be required as a countercyclical measure (the countercyclical capital buffer), with phase-in of the modifications beginning in 2013. Capital requirements will be applied at a consolidated level (consolidado prudencial), as determined by the Central Bank. The proposed regulations define the criteria for calculation of various elements of a financial institution’s risk-weighted assets and also address which instruments will qualify as regulatory capital. As a result of the loss absorption principle outlined by the Basel III Framework, Public Hearing 40/2012 introduces the possibility of regulatory capital being comprised of securities that may be written-off under certain circumstances. Public Hearing 40/2012 also provides for the possibility that holders of such instruments subject to write-off be compensated by the issuer of such instruments with shares eligible to qualify as Common Equity Tier 1 (whereas such compensation in shares may still be subject to further legislative changes).
The following table, provided by Public Hearing 40/2012, presents the proposed schedule for implementation by the Central Bank of the new required regulatory capital ratios.
| | | From January 1, | |
| | | 2013 | | | 2014 | | | 2015 | | | 2016 | | | 2017 | | | 2018 | | | 2019 | |
| Common Equity Tier 1 | | | 4.5 | % | | | 4.5 | % | | | 4.5 | % | | | 4.5 | % | | | 4.5 | % | | | 4.5 | % | | | 4.5 | % |
| Tier 1 Capital | | | 5.5 | % | | | 5.5 | % | | | 6.0 | % | | | 6.0 | % | | | 6.0 | % | | | 6.0 | % | | | 6.0 | % |
| Regulatory Capital | | | 11.0 | % | | | 11.0 | % | | | 11.0 | % | | | 9.875 | % | | | 9.25 | % | | | 8.625 | % | | | 8.00 | % |
| Capital Conservation Buffer | | | - | | | | - | | | | - | | | | 0.625 | % | | | 1.25 | % | | | 1.875 | % | | | 2.5 | % |
| Countercyclical Capital Buffer | | | - | | | | Up to 0.625% | | | | Up to 1.25% | | | | Up to 1.875% | | | | Up to 2.5% | | | | Up to 2.5% | | | | Up to 2.5% | |
Additionally, Public Hearing 40/2012 does not address leverage and liquidity ratios, as proposed by the Basel III Framework, but according to Notice 20,615, a maximum leverage ratio of 3% is expected to be required for Brazilian banks from January 1, 2018, with certain disclosure requirements applicable from January 1, 2015. A LCR to address short-term liquidity risk and a NSFR to address long-term liquidity risk are also expected to apply to Brazilian banks from January 1, 2015 and 2018, respectively, with certain calculation and monitoring requirements applicable from January 1, 2012.
Also as part of the implementation of the Basel III framework, on June 30, 2011 the CMN enacted Resolution No. 3,988, which sets forth that Brazilian financial institutions shall implement a capital management function compatible with the nature of their operations, the complexity of the products and services they offer, as well as with the extent of their exposure to risks. Capital management is defined as a process that includes: (i) monitoring and controlling the financial institution’s capital; (ii) assessing capital needs in light of the risks to which the financial institution is subject; and (iii) setting goals and conducting capital planning in order to anticipate capital needs due to changes in market conditions. Financial institutions shall provide to the general public a report describing the structure of their capital management function at least on an annual basis. Financial institutions had until January 31, 2012 to appoint a director responsible for capital management function, which shall be fully implemented by December 31, 2012.
Given that the Central Bank’s current regulation on capital adequacy establishes a more stringent requirement than the internationally agreed minimal capital requirements under the Basel III Framework, as outlined above, and that Public Hearing 40/2012 proposes the full adoption of such requirements in Brazil, we anticipate that implementation of the Basel III Framework might not have the same impacts on Brazilian financial institutions as it will possibly have on financial institutions from developed countries.
The Public Hearing 40/2012 proposed regulations are not definitive, are subject to comment by market participants, may require changes in legislation and may be significantly changed by the Central Bank upon their final implementation.
In any case, until definitive rules implementing Basel III in Brazil are issued, the existing capital rules described above under “— Capital Adequacy and Leverage/Regulatory Capital Requirements” continue to be in force.
Changes in Capital Allocation
On November 11, 2011, CMN and the Central Bank revised certain capital adequacy rules and on December 22, 2011 revised certain reserve requirement rules (see “— Reserve Requirements” below).
On November 11, 2011, the Central Bank enacted Circular No. 3,563 (“Circular 3,563/11”) which amended Circular No. 3,360, of September 12, 2007, establishing certain measures to ease the capital requirements relating to certain retail transactions given the current economic scenario. Circular 3,563/11 reduced the credit risk weight, from 150% to 75% or 100%, applicable to (i) payroll loans, (ii) secured loans for vehicle acquisition or vehicle leasing with a term of up to 60 months, (iii) other individual loans without specific purpose with a term of up to 36 months and (iv) other individual loans without specific purpose with a term longer than 60 months and entered into or renegotiated after November 11, 2011. In contrast, Circular 3,563/11 increased the credit risk weight applicable to long-term individual loans, establishing that a 300% credit risk weight is applicable to individual loans without specific purpose, including payroll loans with a term longer than 60 months entered into or renegotiated on or before November 11, 2011. In addition, Circular 3,563/11 revoked the requirement of a minimum of 20% payment of the outstanding balance on credit cards which would be applicable as of December 1, 2011, maintaining the minimum payment requirement at 15% of the outstanding balance. Finally, Circular 3,563/11 authorized the deduction of provisions from benefits to be paid from financial institutions’ exposure to investment funds with special purpose (Fundos de Investimentos Especialmente Constituidos – FIE) relating to pension plan funds of the typeVida Gerador de Benefício Livre - VGBL orPlano Gerador de Benefício Livre – PGBL.
Reserve Requirements
The Central Bank currently imposes several reserve requirements on Brazilian financial institutions and such reserve amounts must be deposited with the Central Bank. Reserve requirements are a mechanism to control the liquidity of the Brazilian financial system. These reserve requirements are applied to a wide range of banking activities and transactions, such as demand deposits, savings deposits and time deposits.
Subsequent to the most intense periods of the global financial crisis in 2008 and 2009, the CMN and the Central Bank have enacted the following measures in order to provide the Brazilian financial system with greater stability:
| · | Increases in the rate for demand deposit reserve requirements from 42.0% until July 2010 to a rate of 43.0% from July 2010 to July 2012, 44.0% from July 2012 to July 2014 and 45.0% as of July 2014; |
| · | Increases in the additional rate for demand and time deposit reserve requirements from 8.0% to 12.0% (for savings deposits the rate was maintained at 10.0%); |
| · | Limitation on deductibility from the additional rate for demand, savings and time deposit reserve requirements for financial institutions with consolidated Tier 1 Capital of (i) less than R$2 billion has been increased from R$2 billion to R$2.5 billion, and (i) equal to or greater than R$2 billion and less than R$5 billion has been increased from R$1.5 billion to R$2 billion; |
| · | Increase in the reserve requirement for time deposits from 15.0% to 20.0%; |
| · | Limitation on deductibility from time deposit reserve requirements for financial institutions with consolidated Tier 1 Capital of (i) less than R$2 billion has been increased from R$2 billion to R$3 billion, (ii) equal to or greater than R$2 billion and less than R$5 billion has been increased from R$1.5 billion to R$2.5 billion, and (iii) greater than R$5 billion has been maintained at zero; |
| · | Limitation on deductibility from time deposit reserve requirements of certain transactions concluded before June, 11, 2011 with smaller financial institutions with consolidated Tier 1 Capital of less than R$2.5 billion (including: (x) interbank deposits with such smaller financial institutions; (y) investments in debt securities issued by such smaller financial institutions, and (z) any loan portfolio purchased from such smaller financial institutions) has been reduced from 45.0% to 36.0% of a financial institution total demand deposit reserve requirements; |
| · | Financial bills issued by financial institutions have been exempted from reserve requirements; and |
| · | Creation of a cash reserve requirement for financial institutions with foreign exchange operations, effective as of April, 4, 2011, corresponding to 60.0% of the amount of daily short position taken in foreign currencies in excess of the lower of (i) the amount exceeding US$1 billion or the Tier 1 Capital, whichever is lower, or (ii) the regulatory capital of the financial institution. |
On December 22, 2011, the Central Bank issued Circular No. 3,569 (“Circular 3,569/11”), amended on February 10, 2012 by Circular No. 3,576 (“Circular 3,576/12”), consolidating and redefining term deposit reserve requirements applicable to commercial banks, multiservice banks, development banks, investment banks, foreign exchange banks, savings banks and credit, financing and investment companies. The percentage of term deposit reserves eligible to earn interest will be limited to 80% beginning February 2012, 75% beginning April 2012, 70% beginning June 2012 and 64% beginning August 2012. The Central Bank also (i) redefined the transactions where the counterparty is a smaller financial institution that can be deducted from time deposit reserve requirements and (ii) reduced the Tier 1 Regulatory Capital criterion (Patrimônio de Referência, Nível I) applicable to smaller financial institutions from R$2.5 billion to R$2.2 billion for purposes of deductibility from time deposit reserve requirements. Interbank deposit transactions with a smaller financial institution for purposes of such deduction must be concluded before June 29, 2012. In addition, the reduction of term deposit reserve requirements of R$1 billion now applies to financial institutions with Tier I Regulatory Capital ranging between R$5 billion to R$15 billion, instead of from R$5 billion to R$7 billion as previously set forth by Circular No. 3,569/11.
On January 23, 2012, the Central Bank issued Circular No. 3,573, which set forth new rules regarding deductions linked to rural credit financing with agricultural funding for compulsory reserves over demand deposits. The Central Bank allowed deductions corresponding to the: (i) daily average balance of rural credit financings with agricultural funding relating to the 2012 second crop, 2012 winter crop and 2012 northeastern crop contracted between January 1, 2012 and June 30, 2012, and mandatory funds established in the Manual of Rural Lending; and (ii) daily average balance of investments in Interfinancial Deposits Linked to Rural Lending, which funds shall be used in the transactions mentioned in (i) above. Deductions for both (i) and (ii) above are limited to 5% of the requirement calculated under Circular No. 3,274, dated February 2, 2005. Financial institutions are still permitted to deduct from their demand deposit reserve requirements the amount of voluntary instalments of contributions to the Brazilian federal deposit guarantee plan (FundoGarantidor de Créditos (“FGC”).
As of December 31, 2011, we had required reserves funded in cash of R$98,053 million compared to R$85,776 million as of December 31, 2010, of which R$92,323 million and R$81,034 million, respectively, earn interest. The significant increase in reserve amounts from December 31, 2009 to December 31, 2010 is primarily the result of the introduction of amendments by the Central Bank and the CMN to the requirements as described above and that such reserve amounts be funded entirely in cash.
Foreign Currency Exposure
The total exposure in gold, foreign currency and other assets and liabilities indexed or linked to the foreign exchange rate variation undertaken by financial institutions, and their direct and indirect subsidiaries, on a consolidated basis, may not exceed 30.0% of their regulatory capital, in accordance with CMN Resolution No. 3,488.
Liquidity and Fixed Assets Investment Regime
In accordance with CMN Resolution No. 2.669, the Central Bank prohibits Brazilian financial institutions, including us, from holding, on a consolidated basis, permanent assets in excess of 50.0% of their adjusted regulatory capital. Permanent assets include investments in unconsolidated subsidiaries as well as real estate, equipment and intangible assets.
Lending Limits
In accordance with the CMN Resolution No. 2,844, a financial institution, on a consolidated basis, may not extend loans or advances, grant guarantees, enter into credit derivative transactions, underwrite or hold in its investment portfolio securities of any customer or group of affiliated customers that, in the aggregate, exceed 25.0% of the financial institution’s regulatory capital.
Treatment of Past Due Debts
In accordance with CMN Resolution No 2,682, Brazilian financial institutions are required to classify their credit transactions (including leasing transactions and other transactions characterized as credit advances) at different levels and make provisions according to the level attributed to each such transaction. The classification is based on the financial condition of the customer, the terms and conditions of the transaction and the period of time during which the transaction has been in arrears, if any. For purposes of Central Bank requirements, transactions are classified as level AA, A, B, C, D, E, F, G or H, with AA being the highest classification. Credit classifications must be reviewed on a monthly basis and, apart from to additional provisions required by the Central Bank which are deemed necessary by management of those financial institutions, provisions required to be made vary from 0.5% of the value of the transaction, in the case of level A transactions, to 100.0% in the case of level H transactions.
Provision for Loan Losses for Income Tax Deduction Purposes
Brazilian financial institutions are allowed to deduct loan losses as expenses for purposes of determining their taxable income. The period during which these deductions may be made depends on the amounts, maturities and types involved in the transaction, in accordance with article 9 of Law No. 9,430 of December 27, 1996.
Foreign Currency Loans
Financial institutions in Brazil are permitted to borrow foreign-currency denominated funds in the international markets (either through direct loans or through the issuance of debt securities) for any purpose including on-lending those funds in Brazil to Brazilian corporations and financial institutions without the prior written consent of the Central Bank, in accordance with CMN Resolution No. 3,844. The Central Bank may establish limits on the term, interest rate and general conditions of such international loan transactions (including the issuance of bonds and notes by financial institutions). Currently, there are no limits imposed on such transactions, but the inflow of funds to, deriving from or for, loans, including the issuance of notes in the international market, whose average minimum payment term is no longer than 1,800 days is subject to the IOF/FX tax, at a rate of 6.0%. However, if the average minimum term of the loan is longer than 1,800 days, the IOF/FX tax is reduced to zero. Moreover, if a loan transaction with a minimum term longer than 1,800 days is settled partially or completely before completion of 1,800 days term, the IOF/FX tax would be 6.0%, plus interest and penalty. The Central Bank frequently changes these regulations in accordance with the economic scenario and the monetary policy of the Brazilian government.
Cross-border loans between individual or legal entities (including banks) resident or domiciled in Brazil and individual or legal entities resident or domiciled abroad are no longer subject to the prior approval of the Central Bank, but are subject to the prior registration with the Central Bank.
Foreign Currency Position
Transactions involving the sale and purchase of foreign currency in Brazil may only be conducted by institutions authorized to do so by the Central Bank. The Central Bank imposes limits on the foreign exchange sale and purchase positions of institutions authorized to operate in the foreign exchange markets. These limits vary according to the type of financial institution conducting foreign exchange transactions, the foreign exchange sale positions held by those institutions, as well as the shareholders’ equity of the relevant institution. There is no current limit to long or short positions in foreign currency for banks authorized to carry out transactions on the foreign exchange market. In accordance with the Central Bank Circular No. 3,401, other institutions within the national financial system are not allowed to have short positions in foreign currency, although there are no limits in respect to foreign exchange long positions.
On July 8, 2011, the Central Bank enacted Circular No. 3,548, creating a cash reserve requirement for financial institutions with foreign exchange operations, effective as of July 11, 2011, corresponding to 60.0% of the average amount of the last five days foreign exchange short position in excess of the lower of (i) US$1 billion or (ii) the Tier I regulatory capital of the financial institution.
On November 30, 2011, the CMN issued Resolution No. 4,033 which established new rules governing investments by Brazilian banks of foreign currency reserves held outside of Brazil. Among other changes, Resolution No. 4,033 authorized banks with regulatory capital exceeding R$5 billion to lend funds raised through external funding activities to (i) Brazilian companies, (ii) their offshore subsidiaries and (iii) foreign companies, provided that the majority of such foreign company’s voting stock belongs to a shareholder that is, directly or indirectly, an individual or legal entity resident or domiciled in Brazil. Resolution No. 4,033 also authorized banks to acquire, in the primary market, bonds issued or guaranteed by the above mentioned companies.
On January 26, 2012, the Central Bank enacted Resolution No. 4,051, setting forth that securities brokerage firms, securities dealerships and foreign exchange brokerage firms may carry on foreign exchange transactions with clients for prompt settlement of up to US$100,000. Furthermore, Resolution No. 4,051 establishes guidelines for granting advances on foreign exchange contracts, or ACC, and advances on delivered commercial papers, or ACE, relating to service export agreements, limiting them to the services indicated by the Ministry of Development, Industry and Foreign Trade. Finally, Resolution No. 4,051 generally consolidates the policies in effect regarding exports, modifying current CMN Resolution No. 3,568.
On March 1, 2012 the Central Bank of Brazil issued Circular No. 3,580, which amended Brazilian regulations on foreign exchange markets and international capital flows and established limitations on export financings. According to Circular No. 3,580, beginning on the day of its enactment, pre-payments on goods to be exported from Brazil can only be made by the importer of such goods and pre-payments can only be made for a period of up to 360 days.
Transactions with Affiliates
Law No. 7,492 of June 16, 1986, which sets forth crimes against the Brazilian financial system, establishes the extension of credit by a financial institution to any of its controlling shareholders, directors or officers and certain family members of such individuals and any entity controlled directly or indirectly by such financial institution or which is subject to common control with such financial institution as a crime. Violations of Law No. 7,492 are punishable by two to six years’ imprisonment and a fine. On June 30, 1993, the CMN issued Resolution No. 1,996, which requires any such transaction to be reported to the public ministry’s office.
Brazilian banking laws and regulations also impose prohibitions on the extension of credit or guarantee to any company which holds more than 10.0% of the financial institution’s capital and to any company in which they hold more than 10.0% of the capital. This limitation is also applicable in respect to directors and officers of the financial institution and certain of their relatives, as well to those companies in which such persons hold more than 10.0% of the capital.
Establishment of Offices and Investments Abroad
For a Brazilian financial institution to establish foreign offices or directly or indirectly maintain equity interests in financial institutions outside Brazil, it must obtain the prior approval of the Central Bank, which will depend on the applicant Brazilian bank being able to meet certain criteria, including:
| · | the Brazilian financial institution must have been in operation for at least six years; |
| · | the Brazilian financial institution’s paid-in capital and shareholders’ equity must meet the minimum levels established by Central Bank regulations for the relevant financial institution plus an amount equal to 300.0% of the minimum paid-in capital and shareholders’ equity required by Central Bank regulations for commercial banks; |
| · | the Central Bank must be assured of access to information, data and documents regarding the transactions and accounting records of the branch for its global and consolidated supervision; and |
| · | the Brazilian financial institution must present to the Central Bank a study on the economic and financial viability of the subsidiary, branch or investment and the expected return on investment. |
Within 180 days of Central Bank approval, the Brazilian financial institution must submit a request to open the branch to the competent foreign authorities and begin operations within one year. Failure to fulfill these conditions may result in cancellation of the authorization.
Compensation of Directors and Officers of Financial Institutions
On November 25, 2010, the CMN issued Resolution No. 3,921, which established new rules related to the compensation of directors and officers of financial institutions. The compensation of directors and officers may be fixed or variable. Variable compensation may be based on specific criteria set forth in Resolution No. 3,921 and is required to be compatible with the financial institution’s risk management policies. At least 50.0% of variable compensation must be paid in stock or stock-based instruments and at least 40.0% of variable compensation must be deferred for future payment by at least 3 years and is subject to claw-backs, based on the result of the institution and business unit during the period of deferral. These new rules took effect on January 1, 2012 and are applicable to compensation of directors and officers based on the services rendered during the year of 2012. In addition, financial institutions that are publicly-held companies or required by the Central Bank to establish an audit committee must also establish a compensation committee prior to the first shareholders’ meeting of 2012. Such committee must follow the requirements set out in Resolution No. 3,921.
Other
On July 28, 2011 the CMN enacted Resolution No. 3,998, supplemented by Central Bank Circular No. 3,553, both effective as of August 22, 2011, which requires that financial institutions in Brazil register assignments of the following types of credit transactions: (i) payroll loans and (ii) vehicle leases. Under Resolution No. 3,998, financial institutions must appoint an officer responsible for registration procedures and specified controls related to these credit transactions and the assignment thereof. The information required to be disclosed upon registration of these credit transactions and their assignment includes: (i) identification of the assignor and assignee, (ii) identification of the financial institution that granted the underlying credit, (iii) certain information with respect to the credit transaction being assigned (e.g., identity of the debtor, specified dates, any guarantees, amounts payable, installments, etc.) and (iv) details of the credit assignment transaction (e.g., amounts assigned, portion of the credit transaction subject to the assignment, specified dates, any guarantees involved).
Bank Insolvency
Insolvency Regime
Financial institution insolvency is largely a matter handled by the Central Bank. The Central Bank will commence and oversee all administrative proceedings, whether for, or in avoidance of, liquidation.
Law No. 11,101, as amended or the Brazilian Insolvency Law, was sanctioned by the president on February 9, 2005, became effective in June 2005 and was amended in June and November 2005; it has significantly reshaped and modernized bankruptcy law in Brazil, until then governed by rules originating in 1945. Among the more important innovations introduced by such law are the following: (i) the availability of reorganization arrangements that, subject to flexible statutory terms and conditions, may be structured under varying forms so as to enable a debtor deemed by its creditors to have business potential to effectively attempt to financially restructure; and (ii) in the event of bankruptcy, the ranking of secured debts ahead of tax liabilities.
While the insolvency of financial institutions remains governed by specific regimes set forth in Law No. 6,024 of March 13, 1974 and Presidential Decree No. 2.321 of February 25, 1987 (intervention, extrajudicial liquidation and temporary special administration regime, each of which is discussed in further detail below), they are subject to the Brazilian Insolvency Law, to the extent applicable, on an ancillary basis, until such time as a specific set of rules is enacted. These specific regimes are imposed by the Central Bank to avoid bankruptcy of financial institutions.
Intervention
The Central Bank may intervene in the operations of a bank in the following circumstances:
| · | if there is a material risk for creditors, resulting from mismanagement; |
| · | if the bank fails to remedy material violation of the Brazilian banking laws or regulations after notice of the Central Bank; or |
| · | if intervention is an alternative to liquidation. |
| · | Beginning with the date it is ordered, by the Central Bank, an intervention suspends actions or foreclosures related to payable obligations of the financial institutions, prevents early termination or maturity of obligations of the financial institution, and freezes pre-existing deposits. |
The intervention may cease:
| · | at the discretion of the Central Bank if the controlling shareholders or interested third parties take over the administration of the financial institution under intervention after having provided the guarantees required by the Central Bank; |
| · | when the situation of the financial institution is regularized as determined by the Central Bank; or |
| · | when extrajudicial liquidation or bankruptcy of the entity is ordered by the Central Bank or by the relevant courts, respectively. |
Extrajudicial Liquidation
An extrajudicial liquidation of any financial institution (with the exception of public financial institutions controlled by the Brazilian government) may be carried out by the Central Bank if it can be established that:
| · | debts of the financial institution are not being paid when due; |
| · | the financial institution is deemed insolvent; |
| · | the financial institution has incurred losses that could abnormally increase the exposure of the unsecured creditors; |
| · | management of the relevant financial institution has materially violated Brazilian banking laws or regulations; or |
| · | upon cancellation of its operating authorization, a financial institution’s ordinary liquidation proceedings are not carried out within 90 days or are carried out with delay representing a risk to its creditors, at the Central Bank’s discretion. |
Liquidation proceedings may otherwise be requested, on reasonable grounds, by the financial institution’s officers or by the intervener appointed by the Central Bank in the intervention proceeding.
Extrajudicial liquidation (i) suspends actions or foreclosures related to the financial institution, during which time no other action or foreclosure may be commenced, (ii) accelerates the term of its obligations and (iii) interrupts the statute of limitations with regard to the obligations of the financial institution. In addition, interest ceases accruing on the obligations of the financial institution until all its obligations to third parties are duly paid.
.
Extrajudicial liquidation proceedings may cease:
| · | at the discretion of the Central Bank if the controlling shareholder or interested third parties take over the administration of the financial institution after having provided the guarantees required by the Central Bank; |
| · | when the liquidator’s final accounts are rendered and approved, and subsequently filed with the competent public registry; |
| · | when converted to an ordinary liquidation; or |
| · | when the financial institution is declared bankrupt. |
Temporary Special Administration Regime
In addition to the aforesaid procedures, the Central Bank may also establish the Temporary Special Administration Regime (Regime de Administração Especial Temporária), or RAET, which is a less severe form of Central Bank intervention in private and non-federal public financial institutions and which allows institutions to continue to operate normally. The RAET may be imposed by the Central Bank in the following circumstances:
| · | the financial institution continually participates in transactions contrary to economic and financial policies established by federal law; |
| · | the financial institution fails to comply with the compulsory reserves rules; |
| · | the financial institution has operations or circumstances which call for an intervention; |
| · | illegal or management misconduct exists; or |
| · | the institution faces a shortage of assets. |
The main purpose of the RAET is to assist with the recovery of the financial condition of the institution under special administration. Although the RAET does not affect the day-to-day business operations, liabilities or rights of the financial institution, which continue to operate in its ordinary course, the Central Bank has the authority to order corporate reorganizations of the financial institution and its subsidiaries, including changing the corporate type, merger or other types of business consolidations, spin-off or change of control of the financial institution under such regime.
Repayment of Creditors in Liquidation
In the event of the extrajudicial liquidation of a financial institution or a liquidation of a financial institution under the terms of a bankruptcy proceeding, employees’ wages and related labor claims up to a certain amount, secured credits and indemnities and tax claims enjoy the highest priority of any claims against the bankruptcy estate. The FGC, a deposit insurance system, guarantees a maximum amount of R$70,000 of certain deposits and credit instruments held by an individual with a financial institution (or financial institutions of the same financial group). The FGC is funded principally by mandatory contributions from all Brazilian financial institutions that handle customer deposits, currently at 0.0125% per month, in accordance with CMN Resolution No. 3,400, as amended. The payment of unsecured credit, including regular retail customer deposits not payable under the FGC, is subject to the prior payment of all secured credits and other credits to which specific laws may grant special privileges. Additionally, deposits and credit instruments raised outside of Brazil are not payable by the FGC, in accordance with CMN Resolution No. 3,400.
CMN Resolution No. 3,692 of March 26, 2009, authorizes financial institutions to raise funds by means of time deposits guaranteed by the FGC up to a certain amount provided that such deposits (i) have a minimum term of twelve months and a maximum term of sixty months, (ii) are not callable before their term (applicable only for deposits raised after May, 2009), and (iii) are limited to an amount assessed considering bank’s Tier 1 reference net worth and bank’s time deposits, whichever is higher, per deposit of the same bank, limited to R$5 billion. CMN Resolution No. 3,931, enacted on December 3, 2010, reduced the volume of deposits that financial institutions can accept with the guarantee granted by FGC by 20.0% every year from January 2012 to January 2016, thereby ending such guarantee by 2016.
Brazilian Payment and Settlement System
The rules for the settlement of payments in Brazil are based on the guidelines adopted by the Bank of International Settlements. The Brazilian payment and settlement system began operating in April 2002. The Central Bank and the CVM have the power to regulate and supervise this system. Pursuant to these rules, all clearing houses are required to adopt procedures designed to reduce the possibility of systemic crises and to reduce the risks previously borne by the Central Bank. The most important principles of the Brazilian payment and settlement system are:
| · | the existence of two main payment and settlement systems: real time gross settlements, using the reserves deposited with the Central Bank; and deferred net settlements, through the clearing houses; |
| · | the clearing houses, with some exceptions, are liable for the payment orders they accept; and |
| · | bankruptcy laws do not affect the payment orders made through the credits of clearing houses, nor the collateral granted to secure those orders. However, clearing houses have ordinary credits against any participant under bankruptcy laws. |
Foreign Banks and Foreign Investments
Foreign Banks
The establishment in Brazil of new branches by foreign financial institutions (financial institutions which operate and have a head office offshore), as well as the acquisition of equity interests by foreign financial institutions in Brazilian financial institutions, is prohibited, except when duly authorized by the Brazilian government, in accordance with international treaties, the policy of reciprocity and the interest of the Brazilian government. Once authorized to operate in Brazil, a foreign financial institution is subject to the same rules, regulations and requirements that are applicable to any other Brazilian financial institution.
Foreign Investments in Brazilian Financial Institutions
Foreign investment in Brazilian financial institutions by individuals or companies is permitted only if specific authorization is granted by the Brazilian government, in accordance with international treaties, the policy of reciprocity and the interest of the Brazilian government. Once authorization is granted, Brazilian law sets forth the following rules concerning foreign investment in Brazil and the remittance of capital outside of Brazil:
| · | foreign and Brazilian investors must be treated equally, unless legislation states otherwise, |
| · | any foreign entity that directly owns shares of Brazilian companies must be registered with the Brazilian corporate taxpayer registry (Cadastro Nacional de Pessoa Jurídica), or CNPJ; |
| · | foreign direct investments, repatriations and profit remittances must be registered electronically with the Central Bank; |
| · | the Central Bank may require that Brazilian companies provide information regarding the foreign equity interests in those Brazilian companies, and any other information in connection with the relevant foreign investment in Brazil; and |
| · | Brazilian companies must provide in their financial statements relevant foreign investments, obligations and credits. |
On December 9, 1996, a presidential decree authorized the acquisition by non-Brazilians of non-voting shares issued by Brazilian financial institutions as well as the offering abroad of depositary receipts representing those shares. Also in December 1996, the CMN approved a resolution specifically authorizing the global offering of depositary receipts representing non-voting shares of Brazilian financial institutions. Therefore, in these specific cases, authorization from the Brazilian government is not necessary. For cases involving the acquisition of non-voting shares issued by Brazilian financial institutions, foreign investors must also observe the abovementioned requirements concerning registration with the Brazilian corporate taxpayer registry and with the Central Bank.
Internal Compliance Procedures
All financial institutions must have in place internal policies and procedures to control their activities, their financial, operational and management information systems, and their compliance with all regulations applicable to them.
Audit Committee
For information regarding our audit committee and our audit committee financial experts, see “Item 6C. Board Practices — Statutory Bodies — Audit Committee” and “Item 16D. Exemptions from the Listing Standards for Audit Committees.”
Regulation of Independent Auditors
CMN Resolution No. 3,198, of May 27, 2004, as amended, establishes the rules governing external audit services provided to financial institutions.
In accordance with CMN Resolution No. 3,198, financial statements and financial information of financial institutions must be audited by independent auditors who are (i) registered with the CVM, (ii) certified as banking analyst experts by the CFC and IBRACON, and (iii) meet certain independence requirements.
In order to maintain their banking analyst certification, the responsible partner and the audit team members with management duties must (i) pass a new exam organized by the CFC and the IBRACON within a period not to exceed three years of the last approval; or (ii) perform independent audit in financial institutions and attend a continuing professional education program.
At least every five consecutive fiscal years, the responsible partner and the audit team members with management duties must be replaced. Such former auditors may only be re-engaged after three fiscal years have passed since their prior engagement.
CMN Resolution No. 3,198 also prohibits the engagement and maintenance of independent auditors by financial institutions in the event that: (i) any of the circumstances of impediment or incompatibility for the provision of audit services provided for in the rules and regulations of the CVM, CFC or IBRACON arise; (ii) any ownership interest or any asset or liability in the audited financial institution held by the audit firm or members of the audit team involved in the audit work of the financial institution exists; and (iii) the payment of fees representing at least 25% or more of the total annual fees of the independent auditor. Additionally, the audited institution is prohibited from hiring partners and audit team members in management positions that were involved in the audit work for the financial institution for the past 12 months.
In connection with the audit work for the financial institution, in addition to the audit report, the independent auditor must prepare the following reports:
| · | an assessment of the internal control and risk management procedures of the financial institution, including the electronic data processing system, showing any deficiencies found; and |
| · | a description of any non-compliance with legal and regulatory provisions that have, or may have, a significant impact on the audited financial statements or operations of the audited financial institution. |
These reports, as well as working papers, mail, service agreements and other documents related to the audit work must be made available to the Central Bank for at least five years.
Under Brazilian law, our financial statements must be prepared in accordance with Brazilian GAAP. Financial institutions must have their financial statements audited every six months. Quarterly financial statements filed with the CVM must be reviewed by a financial institution’s independent auditors. CVM Rule No. 381 requires public companies, including financial institutions, to disclose information relating to services from independent auditors, other than the audit work, that represented 5.0% of more of the fees paid to the independent accounting firm.
In addition, CMN Resolution No. 3,786, of September 24, 2009, requires that, beginning December 31, 2010, our annual consolidated financial statements be prepared in accordance with IFRS, and accompanied by an independent audit report on such financial statements. See “Presentation of Financial and Certain Other Information”.
Regulation of Presentation of Financial Statements
CMN Resolution No. 2,723 of May 31, 2000, as amended, establishes certain rules on consolidation of financial statements by financial institutions. According to this Resolution, financial institutions, except for credit unions, are required to prepare their financial statements on a consolidated basis, including investments in companies in which they hold, directly or indirectly, solely or jointly, (i) the right to nominate or designate a majority of the company’s board of directors; (ii) the right to appoint or dismiss the majority of the officers and directors of the company; or (iii) operational or corporate control. Such resolution is applied by the Central Bank to us on a group-wide basis.
Rules Governing the Collection of Bank and Credit Card Fees
The collection of bank fees and commissions is extensively regulated by the CMN and by the Central Bank. CMN Resolution No. 3,919, effective as of March 1, 2011, amended the existing rules seeking standardization of the collection of bank fees and the cost of credit transactions for individuals. According to these rules, bank services to individuals are divided into the following four groups: (i) essential services; (ii) priority services; (iii) special services; and (iv) specific or differentiated services. Banks are not able to collect fees in exchange for supplying essential services to individuals with regard to checking accounts, such as (i) supplying a debit card; (ii) supplying ten checks per month to accountholders who meet the requirements to use checks, as per the applicable rules; (iii) supplying a second debit card (except in cases of loss, theft, damage and other reasons not caused by the bank); (iv) up to four withdrawals per month, which can be made at a branch of the bank, using checks or in ATM terminals; (v) supplying up to two statements describing the transactions during the month, to be obtained through branch counters or ATM terminals; (vi) inquiries over the internet; (vii) up to two transfers of funds between accounts held by the same bank, per month, at a branch counter, through ATM terminals or over the internet; (viii) clearance of checks; and (ix) supplying, by February 28th of each year, a consolidated statement describing, on a month-by-month basis, the fees charged over the preceding year with regard to checking accounts and savings accounts. Certain services rendered to individuals with regard to savings accounts also fall under the category of essential services and, therefore, are exempt from the payment of fees. CMN Resolution No. 3,919 prohibits banks from collecting fees for supplying essential services in connection with deposit and savings accounts where clients agree to access and use their accounts by electronic means only. In the case of these exclusively electronic deposit and savings accounts, banks are only authorized to collect fees for supplying essential services when the client voluntarily elects to obtain personal service at the banks’ branches or client service locations.
Priority services are the ones rendered to individuals with regard to checking accounts, transfers of funds, credit transactions, leasing, standard credit cards and records and are subject to the collection of fees by the financial institutions only if the service and its nomenclature are listed in Appendix I. CMN Resolution No. 3,919 also states that commercial banks must offer to their individual clients a “standardized package” of priority services, whose content is defined by Appendix II to such resolution. Banking clients must have the option to acquire individual services, instead of adhering to the package.
The collection of fees in exchange for the supply of special services (including, among others, services relating to rural credit, currency exchange market and on-lending of funds from the real estate financial system, for example) are still governed by the specific provisions found in the laws and regulations relating to such services.
The regulation authorizes financial institutions to collect fees for the performance of specific or differentiated services, provided that the account holder or user shall be informed of the conditions for use and payment or the fee and charging method are defined in the contract. Some of the specific or differentiated services are (i) approval of signatures; (ii) management of investment funds; (iii) rental of safe deposit boxes; (iv) courier services; (v) custody and brokerage services, (vi) endorsement of clients debts (aval/guarantee); (vii) pledge of credit instruments; and (viii) foreign currency exchange, among others.
Other changes included in CMN Resolution No. 3,919 are: (i) prohibition from charging fees for amending adhesion contracts, except in the cases of asset replacement in leasing transactions and early liquidation or amortization, cancelation or termination; (ii) prohibition from including services related to credit cards and other services not subject to fees in service packages that include priority, special and/or differentiated services; (iii) subscription to service packages must be through a separate contract; (iv) information given to the customer with respect a service package must include the value of each service included in the package, the number of times that each service may be utilized per month, and the total price of the package; (v) a customer’s annual banking statement must separately identify default interest, penalties and other costs charged on loans and leasing transactions; (vi) registration fees cannot be cumulatively charged; (vii) overdraft fees can be charged, at most, once for the last 30 days.
CMN Resolution No. 3,919 also established new rules applicable to credit card, including types of fees that can be charged for services rendered by financial institutions, information to be disclosed in credit card invoices and agreement and creation of two types of credit cards: (i) a basic credit cards with certain basic services, which was classified as a prior service; and (ii) a differentiated credit card, with rewards and other benefits to the consumer, which was classified as a differentiated service. In addition, Central Bank Circular No. 3,512 established a minimum amount that credit card holders must pay monthly on outstanding credit card balances: 15.0% as of June, 2011.
In addition, CMN regulations establish that all debits related to the collection of fees must be charged to a bank account only if there are sufficient funds to cover such debits in such account thus forbidding overdrafts caused by the collection of banking fees. Furthermore, a minimum of 30 days notice must precede any increase or creation of fees, while fees related to priority services and the “standardized package” can be increased only after 180 days from the date of the last increase (whereas reductions can take place at any time). With respect to credit cards, a minimum of 45 days notice is required for any increase or creation of fees, and such fees can only be increased after 365 days from the date of last increase. The period of 365 days is also applicable to changes in rewards or benefits program rules.
Finally, CMN Resolution No 3,919 also established that, as of March 2012, financial institutions must supply, by February 28th of each year, a consolidated statement describing, on a month-by-month basis, the fees, interest, late fees, fines, and other expenses charged over the preceding year with respect to any credit and leasing transactions.
Regulation of Internet and Electronic Commerce
Although Brazil does not have a comprehensive legislation regulating electronic commerce, since 2001 the legal validity of electronic documents in Brazil is ruled by Provisional Measure No. 2,200, which establishes a government controlled digital certification system, aimed at guaranteeing the authenticity, integrity and legal validity of electronic documents and ensuring the security of electronic transactions. However, there are currently several bills relating to internet and electronic commerce regulation in the Brazilian Congress. The proposed legislation, if enacted, will reinforce the legal effect, validity and enforceability of information in the form of electronic messages, allowing parties to enter into an agreement, make an offer and accept one through electronic messages.
Considering the increasing use of electronic channels in the Brazilian banking sector, the CMN enacted Resolution No. 2,817 on February 22, 2001, as amended by CMN Resolution No. 2,953 of April, 25, 2002, allowing Brazilian residents to open deposit bank accounts by electronic means, which includes the internet, ATM machines, telephone and other communication channels. This regulation sets forth specific rules on the opening and use of bank accounts via electronic means, including: (i) requirements contained in CMN Resolution No. 2,025 for verification of the identity of the customer; and (ii) transfers of amounts are allowed only between accounts of the same accountholders or in the event of liquidation of investment products and funds, to an account of the same accountholders of the investment products/funds.
On March 26, 2009, the CMN enacted Resolution No. 3,694 requiring that all financial institutions offering products and services to their clients through electronic means must guarantee security, secrecy and reliability in all electronic transactions and disclose, in clear and precise terms, the risks and responsibilities involving the product or service acquired through such channel.
In addition, the Central Bank also permits, under CMN Resolution No. 3,919, the opening of deposit bank and savings accounts, accessed and used exclusively through electronic means. See “—Rules Governing the Collection of Bank and Credit Card Fees” above.
Anti-Money Laundering Regulations
The Brazilian anti-money laundering law (Law No. 9,613, as amended), or the AML Law, makes it a crime to hide or disguise the nature, origin, location, disposal, movement or ownership of goods, rights or finances coming, directly or indirectly, from the following crimes: (i) illegal trafficking of narcotic substances; (ii) terrorism and terrorism financing; (iii) smuggling or trafficking weapons or munitions; (iv) extortion through kidnapping; (v) acts against Brazilian public administration; (vi) acts against the national financial system; (vii) acts conducted by a criminal organization; or (viii) acts against a foreign public administration.
The AML Law also created the Council of Control of Financial Activities (Conselho de Controle de Atividades Financeiras, or “COAF”), which is the Brazilian financial intelligence unit that operates under the Ministry of Finance. COAF has a central role in the Brazilian system of fighting against money laundering and terrorism financing, and the legal responsibility to coordinate mechanisms for international cooperation and information exchange.
According to the AML Law and complementary regulations enacted by the Central Bank, financial institutions must have internal controls procedures in order to:
| · | identify and know their customer, which includes determining whether the customer is a Politically-Exposed Person (“PEP”), as well as identifying the beneficial owners in the related transaction, if any. These records must be kept up to date; |
| · | compile an analysis of new products and services with respect to anti-money laundering issues; |
| · | maintain records of all financial services or transactions held on behalf of, or for, a customer. The record system must allow the identification of: (i) any transaction or series of transactions involving amounts that exceed R$10,000 and belong to the same customer or conglomerate in one calendar month; and (ii) operations that reveal a pattern of activity that suggests a scheme to avoid identification; |
| · | pay special attention to (i) unusual transactions, or proposed transactions, related to the parties involved, amounts, forms of execution and the instruments used, or that have no apparent economic or legal basis; (ii) transactions or proposed transactions involving PEPs, persons from countries with which Brazil has a high number of financial and commercial transactions or countries bordering Brazil or with ethnic, linguistic or political ties to Brazil; (iii) evidence of fraud in customer or transaction identification; (iv) customers or transactions involving unidentifiable beneficial owners; (v) operations originated from or destined to countries that do not fully comply the Financial Action Task Force Recommendations; and (vi) situations where it is not possible to keep a customer’s identification records up to date. Financial institutions must have enhanced monitoring programs, check if a certain customer or transaction must be reported to COAF and evaluate if they want to begin or maintain a relationship with a customer; |
| · | report suspicious transactions to COAF, including all cash transactions equal to or above R$100,000, which must be reported automatically in the same day of transaction; |
| · | keep the records referred to above for at least five years or ten years, depending on the nature of information, even after ending a customer relationship or closing a transaction; and |
| · | define criteria for employee hiring and maintain an employee anti-money laundering training. |
Non-compliance with any of the obligations indicated above subjects the financial institution and its managers to penalties varying from fines (from 1.0% to 200.0% of the amount of the transaction, 200.0% of the profit generated thereby, or a fine of up to R$200,000) to rendering its managers ineligible for the exercise of any functions in financial institutions and the revocation of the financial institution’s license to operate.
Politically-Exposed Persons
PEPs are public agents who occupy or have occupied a relevant public function (for example heads of state or of government, senior politicians, senior government, judicial or military officials, senior executives of state owned corporations, important political party officials), over the past five years, in Brazil or other countries, territories and foreign jurisdictions. It also includes their family members and close associates. Financial institutions must develop and implement internal procedures to identify PEPs and obtain special approval of a more senior staff member than otherwise would be authorized to approve relationships, such as directors, prior to establishing any relationship with those individuals. They must also adopt reinforced and continuous surveillance actions with regard to transactions with PEPs and report all the suspicious transactions to COAF.
Banking Secrecy
Financial institutions must maintain the secrecy of their banking operations and services provided to their customers. The only circumstances in which information about clients, services or operations of Brazilian financial institutions or credit card companies may be disclosed to third parties are the following: (i) the disclosure of information with the express consent of the interested parties; (ii) the exchange of information between financial institutions for record purposes; (iii) the provision to credit reference agencies of information based on data from the records of subscribers of checks drawn on accounts without sufficient funds and defaulting debtors; (iv) the provision by financial institutions and credit card companies to competent authorities of information relating to the occurrence of, or suspicions as to a criminal or other unlawful act; (v) as otherwise expressly allowed by Supplementary Law No. 105 of January 10, 2001; and (vi) the disclosure of information in compliance with a judicial order. Supplementary Law No. 105 also allows the Central Bank or the CVM to exchange information with foreign governmental authorities pursuant to an existing treaty.
Finally, a breach of bank confidentiality may be ordered by judicial authority when necessary to investigate any torts or crimes. With the exception of instances permitted by Supplementary Law No. 105 and other instances permitted by judicial order, a breach of bank confidentiality is a crime punished by one to four years of confinement, and fine.
The Consumer Defense Code and Banking Client Protection Regulation
In 1990, the Brazilian Consumer Defense Code (Código de Defesa do Consumidor, or the “CDC”) was enacted to establish rules for consumers’ protection and governs the relationship between product and service providers and consumers. After a long controversy over the extent to which CDC applies to financial services, the Brazilian Supreme Court decided in a final judgment that the CDC also applies to transactions between financial institutions and their clients. Based on this decision, CMN and the Central Bank focused their regulation and supervisory role to issues that are specific to financial services, which includes: (i) ombudsman services organized as a free communication channel between customers and financial institutions under the supervision of an ombudsmen officer (CMN Resolution No. 3,849); (ii) early liquidation of loans (CMN Resolution No. 3,516); (iii) standards for disclosure and transparency requirements for consumer credit products and financial services, such as the total cost of credit transactions (CMN Resolution No. 3,517); (iv) liability prevention and control in financial transactions (CMN Resolution No. 3,694); (v) collection of bank fees and commissions (CMN Resolution No 3,919).
Besides the banking client protection regulation enforced by CMN and the Central Bank, the basic consumer rights guaranteed by the CDC regarding the relationship between financial institutions and their clients include: (i) the imposition of a reverse burden of proof in court; (ii) financial institutions must ensure that customers are fully aware of all contractual clauses, including responsibilities and penalties applicable to both parties, in order to protect against abusive practices; (iii) financial institutions are prohibited from releasing misleading or abusive publicity or information about their contracts or services; (iv) financial institutions are liable for any damages caused to their customers by misrepresentations in their publicity or information provided; and (v) interest charges in connection with personal credit and consumer directed credit transactions must be proportionally reduced in case of early payment of debts.
With respect to consumer’s rights, Decree No. 6,523 directed the CDC to establish general rules on Customer Service Assistance (Serviço de Atendimento ao Consumidor, or “SAC”), by phone for information, clarification of doubts, complaints, and agreements regarding suspension or cancellation, and Law No. 11,785 amended CDC’s article 54 to define that in adhesions agreements, the font size may not be smaller than a size 12.
Antitrust Regulation
A new Brazilian Antitrust law (Law No 12,529) was enacted on November 30, 2011 and will become effective with respect to transactions consummated on or after May 30, 2012. According to the new regime, transactions resulting in economic concentration must be previously submitted to CADE for approval if any of the parties had, in the last fiscal year, gross revenues of R$400 million or more and the other party had gross revenues of R$30 million or more in the same period. The current criterion subjecting a transaction to CADE’s approval if it involves 20% or more market share will no longer apply once the new law comes into effect. The closing of a transaction before its approval by CADE will subject the parties to fines ranging from R$60,000 to R$60 million. The prior approval requirement set forth in new law may delay the closing of transactions that we submit to CADE after the new law comes into effect.
Financial conglomerates submit merger and acquisitions transactions in various industries, including the insurance and pension plan industries, to SBDC for approval. Merger and acquisition transactions in the banking industry, however, must be submitted to the Central Bank, as financial institutions depend on the approval of the Central Bank in order to merge with or acquire another financial institution. The exclusive authority of the Central Bank to review and approve merger and acquisition transactions involving financial institutions was confirmed in August, 2010, by the Superior Court of Justice, in a decision still subject to further review. Although the outcome of this case will not automatically become a binding precedent for financial institutions in general, an overruling of this decision could nevertheless make it advisable for financial institutions to submit any merger or acquisition transactions in the banking industry to the SBDC, in addition to the submission of such transactions to the Central Bank.
Asset Management Regulation
Asset management is regulated by the CMN and the CVM. CMN and CVM regulations stipulate that institutions must segregate their asset management activities from their other activities.
Certain investment funds within the asset management industry, such as private equity investment funds are also regulated by ANBIMA, which enacts additional rules and policies, especially with respect to the offering, marketing and advertising of financial products and services.
Investment funds are subject to the regulation and supervision of the CVM and are managed by companies authorized by the CVM to manage investment fund portfolios. Investment funds may invest in instruments available in the financial and capital markets, including fixed income instruments, stocks, debentures and derivative products, provided that, in addition to the denomination of the fund, a reference to the relevant type of fund is included.
According to CVM Instruction No. 409, of August 18, 2004, as amended, investment funds may be classified as (i) short term funds; (ii) referenced funds; (iii) fixed income funds; (iv) stocks funds; (v) exchange funds; (vi) external debt funds; and (vii) multi-market funds.
Investment funds are subject to certain restrictions with respect to the composition of their portfolios and the classification of their investors, including, among other things, restrictions on the types of securities, financial assets and operations, limits per issuer and limits by type of financial assets. Such restrictions are set forth in CVM regulations.
In addition, the CVM regulations establish criteria for the registration and accounting evaluation of titles, securities, financial instruments and derivatives. Pursuant to such regulations, fund managers must mark their securities to market; hence, the fund’s portfolio assets must be accounted for at their fair market value, instead of their expected yield to maturity.
The CVM has also enacted rules to regulate private equity funds, credit rights investment funds, real estate investment funds and other specified investment funds. The rules of CVM Instruction No. 409 are applicable to each and every investment fund registered with the CVM to the extent they are not contrary to the provisions of specific rules applicable to such funds.
Leasing Regulations
The basic legal framework governing leasing transactions is established by Law No. 6,099 of September 12, 1974, as amended, Ordinance No. 564, of November 3, 1978 of the Ministry of Finance and the regulations issued thereunder by the CMN from time to time, in particular CMN Resolution No. 2,309 of August 28, 1996.
Law No. 6,099, as amended, sets forth the general guidelines for the tax treatment of leasing transactions and provides that all leasing transactions are subject to the control and supervision of the Central Bank according to standards established by the National Monetary Council. CMN Resolution No. 2,309 provides the types of leasing, the legal requirements of a leasing contract and other relevant guidelines applicable to the product. The Ministry of Finance’s Ordinance No. 564 establishes the loss/profit recognition, for purposes of taxation of leasing transactions, and, in particular, establishes that the guaranteed residual amount of a leasing transaction is the value contractually guaranteed by the leaseholder as a minimum that will be received by the lessor after the sale of the leasehold item to a third-party, if the purchase option is not exercised. Furthermore, the laws and regulations applicable to financial institutions, such as those related to reporting requirements, capital adequacy and leverage, assets composition limits and treatment of doubtful loans, are generally also applicable to leasing companies.
Taxation
We describe below the main corporate taxes that may impact financial transactions entered into by companies of the Itaú Unibanco Group, as well as a description of the main taxes on financial transactions. For more detailed analyses and understanding of the Brazilian tax system, investors should consult their tax advisers.
Overview
The table below summarizes the main taxes imposed on our activities.
Tax | | Rate | | Calculation of Taxable Profit |
| IRPJ | | 15.0% plus 10.0% | | Net income with adjustments (exclusions, additions, and deductions). |
| CSLL | | 15.0% or 9.0% | | Net income with adjustments (exclusions, additions, and deductions). |
| COFINS | | 4.0% | | Gross revenue minus specific deductions |
| PIS | | 0.65% | | Gross revenue minus specific deductions |
| ISS | | 2.0% to 5.0% | | Service value |
Corporate Income Tax and Social Contribution on Profits
Currently, Brazilian companies are subject to the corporate income tax (imposto de renda da pessoa juridica) (“IRPJ”) and the social contribution on profits (contribuição social sobre o lucro liquido) (“CSLL”).
According to the tax regime adopted by each company, the IRPJ and CSLL may be imposed on an adjusted tax basis (taxable income regime), which is subject to adjustments (deductions, additions and exclusions) upon the ascertainment of the tax due at the end of the fiscal year (e.g., operating costs, expenses, provisions and equity accounting).
The IRPJ is imposed at a rate of 15.0% and a surtax of 10.0% is applicable when the total amount of profit exceeds R$20,000 per month or R$240,000 per year (imposing a total rate of 25.0% on the amount of profit exceeding R$20,000 per month).
The CSLL is generally imposed at a rate of 9.0%. Law No. 11,727 of June 23, 2008, established that as of May 1, 2008, the CSLL rate on income of financial, insurance and similar companies increased to 15.0%. The following companies are considered financial, insurance and similar companies for this purpose: private insurance and capitalization companies, banks of any type, securities underwriters, foreign exchange and securities brokerages, credit, financing and investment companies, real estate loan companies, credit card management companies, leasing companies, credit cooperatives and savings and loan associations. The increased CSLL rate is applicable to us and many of our subsidiaries and affiliates. Brazilian financial institutions, including us, are disputing the constitutionality of a higher CSLL tax rate that applies only to financial, insurance and similar companies. The amounts in dispute are accounted for as a tax liability provision in our balance sheet.
Brazilian companies can offset the historical nominal amount of tax losses against results of subsequent years at any time (i.e., with no limitations with respect to time periods),provided that such offsetting does not exceed 30.0% of the annual taxable income of such future year.
Companies pay the IRPJ and CSLL taxes based on their worldwide income rather than on income solely from Brazilian operations. Therefore, profits, capital gains and other income obtained abroad by Brazilian entities will be computed in the determination of their net income. In addition, profits, capital gains and other income from foreign branches or income from subsidiaries or foreign corporations controlled by a Brazilian entity will also be computed in the calculation of such entity’s profits, in proportion to its participation in such foreign companies’ capital. The Brazilian company is allowed to deduct income tax paid abroad, up to the amount of Brazilian income taxes imposed on such income.
Taxation of Profit Distribution
Dividends paid by a Brazilian company, including stock dividends and other dividends paid to a investor domiciled either in Brazil or abroad, are currently not subject to withholding income tax in Brazil to the extent that these amounts are related to profits generated on or after January 1, 1996. Dividends paid from profits generated before January 1, 1996 may be subject to Brazilian withholding income tax at varying rates, according to the tax legislation applicable to each corresponding year.
Law No. 9,249 of December 26, 1995, as amended, allows a Brazilian corporation to make, instead of dividend distributions, distributions that are treated as interest on net equity and that constitute deductible expenses for purposes of calculating the IRPJ and CSLL. These distributions may be paid in cash. For tax purposes, this interest is limited to the daily average of the TJLP, as determined by the Central Bank, over the taxable year, and the amount of payments and deduction may not exceed the greater of (i) 50.0% of net income (after the deduction of CSLL, but before taking into account the amount of such interest on net equity and the provision for IRPJ) for the period in respect of which the payment is made; and (ii) 50.0% of the sum of retained profits and profit reserves.
Any payment of interest on net equity is subject to withholding income tax at the rate of 15.0%, or 25.0% in the case of a shareholder who is resident or domiciled in a tax haven jurisdiction (see “Item 10E. Taxation – Brazilian Tax Considerations”). These payments may be qualified, at their net value, as part of any mandatory dividend.
Taxes on Revenue – Contribution on Social Integration Program and Social Security Financing Contribution
In addition to IRPJ and CSLL, Brazilian companies are subject to the following taxes on revenues: contribution on social integration program (contribuição para o programa da integração social) (“PIS”) and social security financing contribution (contribuição social para o financiamento da seguridade social) (“COFINS”).
According to Law 9.718 of November 27, 1998, as amended, financial institutions must pay contribution to PIS at a rate of 0.65% and COFINS at a rate of 4.0%. In general, PIS and COFINS are charged on companies’ gross revenues, with some exemptions. In the case of financial institutions, certain additional deductions are provided by law so that the taxation basis is similar to the gross profit margin. Certain of our financial subsidiaries are currently claiming that the PIS and COFINS should be levied only on their revenue from the sale of goods and services, and not on revenues from financial and other activities. The amounts in dispute are accounted for as a tax liability provision on our balance sheet.
Non-financial companies that calculate IRPJ and CSLL based on the taxable income regime are required to calculate PIS and COFINS contributions according to the non-cumulative regime. Under this regime, PIS is imposed at a rate of 1.65% and COFINS is imposed at a rate of 7.6%. The calculation basis of these contributions is the gross revenue earned by the company, however, the taxpayer can offset credits arising from the application of the same rates on the value paid on the purchase of certain inputs used in the production process of the company. Currently, under such non-cumulative regime, financial income (except, for example, for income from interest on net equity) of non-financial companies is not subject to PIS and COFINS.
Service Tax
The tax on services (imposto sobre serviços de qualquer natureza) (“ISS”) is generally imposed on the price of value of services rendered (e.g., bank services) and charged by the municipality where our branch or office that renders the service is located. The tax rates vary from 2.0% up to the maximum rate of 5.0%, depending on the municipality.
Tax on Financial Transactions
The tax on financial transactions (imposto sobre operações de crédito, câmbio e seguro, e sobre operações relativas a títulos e valores mobiliários) (“IOF”) is imposed on foreign exchange, insurance, credit, securities and derivatives transactions. The IOF rate may be changed by a decree from the executive branch (which is effective beginning on its publication date) rather than a law.
The IOF on foreign exchange transactions (“IOF/FX”) tax is imposed on several foreign exchange transactions. Its applicable rates may be increased up to 25.0%. The IOF/FX tax rates imposed on foreign exchange transactions recently have been modified and are currently imposed at a rate of 0.38%, with the following main important exceptions:
| · | the IOF/FX tax is imposed at a rate of 6.0% on the inflow of funds to Brazil deriving from, or for, loans, including the issuance of notes in the international market, whose average minimum payment term is no longer than 1,800 days (if the average minimum term of the loan is longer than 1,800 days, and for foreign financing, the IOF/FX rate is 0.0%); |
| · | the IOF/FX is imposed at a rate of 6.0% on the inflow of funds into Brazil in connection with settlement of foreign exchange transactions by foreign investors, including simultaneous foreign exchange transactions, with the purpose of investing in the Brazilian financial and capital markets, except, for example, for the transactions set out below; |
| · | the IOF/FX is imposed at a rate of 0.0% on the inflow of funds into Brazil in connection with the settlement of foreign exchange transactions by foreign investors that involve variable-income investments on stock exchanges or on futures and commodities exchanges, in compliance with the regulations issued by the CMN, except for derivative transactions giving rise to predetermined income; |
| · | the IOF/FX is imposed at a rate of 0.0% on the inflow of funds into Brazil from December 1, 2011 in connection with the settlement of foreign exchange transactions by foreign investors for the purchase of shares as a result of public offerings registered or exempt from registration with the CVM or for the subscription of shares, provided that in each case the issuer is a publicly-held company whose shares are admitted to trade in a stock exchange; |
| · | IOF/FX tax is imposed at a rate of 0.0% on the inflow of funds into Brazil in connection with the settlement of foreign exchange transactions carried out on or after December 1, 2011 by a foreign investor, including simultaneous foreign exchange transactions, to purchase units in private equity funds (Fundo de Investimento em Participações) (“FIP”) and emerging companies funds (Fundo de Investimento em Empresas Emergentes) (“FIEE”), as well as units in investment funds that invest in units of FIPs and FIEEs that are established in accordance with regulation issued by CVM; |
| · | the IOF/FX is imposed at a rate of 0.0% on the outflow of funds from Brazil in connection with the settlement of foreign exchange transactions for the purpose of repatriating funds of foreign investors out of the Brazilian financial and capital markets, with some exceptions; |
| · | IOF/FX tax is imposed at a rate of 0.0% on the outflow of funds from Brazil in connection with foreign exchange transactions for the remittance of interest on net equity and dividends earned by foreign investors; |
| · | IOF/FX tax is imposed at a rate of 0.0% on the inflow of funds into Brazil from December 1, 2011, deriving from the cancelling of depositary receipts to invest in shares tradable in a stock exchange; |
| · | IOF/FX tax is imposed at a rate of 6.38% on foreign exchange transactions in accordance with obligations of credit card management companies or commercial or multiple banks, as credit card issuers, and deriving from the purchase of goods and services made abroad by their credit card users; and |
| · | IOF/FX tax is imposed at a rate of 0.0% on the inflow of funds into Brazil in connection with the acquisition of publicly-traded bonds and securities acquired on or after January 1, 2011,provided some conditions are met. |
| · | IOF/FX tax is imposed at a rate of 0.0% on the inflow and outflow of funds into and from Brazil by foreign investors in connection with the settlement of foreign exchange transactions for the acquisition of Brazilian Depositary Receipts (“BDR”) in accordance with regulations issued by CVM. |
Depending upon the type of inflow of foreign funds into Brazil, the IOF/FX may be levied on the outflow and inflow of funds. It may also be levied when the type of investment is changed. In many cases, the outflow and inflow of funds will require simultaneous foreign exchange transactions.
The IOF tax is also imposed on insurance transactions upon the receipt of a premium (“IOF/Insurance”). In insurance transactions, the IOF/Insurance tax will be imposed at a highest rate of 25.0%. Currently, the rates imposed vary from 0.0% to 7.38% according to the type of insurance purchased.
The IOF tax is also imposed on credit transactions, including financing, discounts and factoring (“IOF/Credit”). Currently, individuals pay IOF/Credit at a rate of 0.0068% per day, until the total amount of IOF/Credit due reaches a limit of 2.5% in a period of 365 days, in most credit transactions; and companies pay IOF tax at a rate of 0.0041% per day, until the total amount of IOF/Credit due reaches a limit of 1.5% in a period of 365 days. An additional IOF/Credit tax rate of 0.38% is also imposed on any credit transaction.
The IOF tax is also imposed on the acquisition, assignment, redemption, renegotiation or payment for settlement of securities, even though these transactions are carried out on stock, commodities and futures exchanges (“IOF/Securities”). The rate of the IOF/Securities with respect to many securities transactions is currently 0.0%, although certain transactions may be subject to specified rates. The President has the legal authority to increase the rate to a maximum of 1.5% of the amount of the taxed transaction per day for the period during which the investor holds the securities, up to the amount equal to the gain on the transaction. Currently, there is a short-term IOF/Securities tax on fixed income and investments in fund quotas with a holding period of less than 30 days. If the investor sells, redeems, assigns, resells or renews fixed income and investments in fund quotas within 30 days of the original investment, IOF/Securities is levied at a rate of 1.0% per day, with certain maximum limits based on a regressive percentage of the total fixed income gain for a security reaching zero and for a maturity equal to or higher than 30 days. Finally, the IOF/Securities tax is levied at a rate of 1.5% on the assignment of shares traded in the Brazilian stock market in order to permit the issuance of depositary receipts to be negotiated overseas.
On July 27, 2011, the Brazilian government enacted Decree No. 7,536, which introduced a tax on securities transactions (“IOF/Securities-Derivatives”) at the rate of 1% on the notional adjusted value of financial derivatives, the value of which is affected by exchange rates and which results in an increase in the net sold exposure of the holder (“Derivative Contract”). On the same date, the Brazilian government enacted Provisional Measure No. 539, which sets forth that institutions authorized to register Derivative Contracts will be responsible for charging and collecting the IOF/Securities-Derivatives amounts due.
According to Decree No. 7,563, enacted on September 15, 2011, the IOF/Securities-Derivatives taxpayer is the holder of the Derivative Contract, but the entities or institutions authorized to register the Derivative Contracts are responsible for the calculation and collection of this tax. In the event it is not possible for them to calculate and collect the IOF/Securities-Derivatives due by the taxpayer, such entities and institutions must provide the necessary information for the calculation of the tax base, through intermediaries and authorized participants, by the tenth business day of the month following the occurrence of a taxable event to: (i) the taxpayer resident or domiciled in Brazil; (ii) the legal representative of the taxpayer resident or domiciled abroad; and (iii) the manager of funds and investment clubs. Any such information relating to taxable events occurring between July 27, 2011 and November 30, 2011 should have been provided by December 14, 2011. On November 3, 2011, the Brazilian Revenue Office enacted Normative Ruling No. 1,207 which further regulated the terms, conditions and tax base of the IOF/Securities-Derivatives.
On December 8, 2011, Provisional Measure No. 539 was converted into Law No. 12,543 (“Law No. 12,543”), which further provides that legal entities that carry out export transactions may deduct from their IOF due the amount of IOF/Securities-Derivatives assessed on derivatives hedge transactions or, in the event such discount is not possible, such entities may require a refund or offset against other federal taxes and certain social contributions. Law No. 12,543 also grandfathered the IOF/Securities-Derivatives assessment on taxable events between July 27 and September 15, 2011. On December 27, 2011, the Ministry of Finance enacted Ruling No. 560, which postponed to January 31, 2012 the collection of the IOF/Securities-Derivatives assessed from September 16 to December 31, 2011. In the wake of recent changes by the Brazilian government in regard to IOF/Securities-Derivatives regulations, the rates of IOF/Securities-Derivatives levied on derivative contracts to hedge risks inherent to price fluctuation of foreign exchange resulting from export contracts signed by an individual or legal entity resident or domiciled in Brazil and on other transactions with financial derivative contracts not expressly mentioned by the tax law were reduced to 0.0%. Under Brazilian law, the Brazilian government is authorized to increase the IOF/Securities-Derivatives rate up to 25% of the notional adjusted value at any time. IOF/Securities-Derivatives may be subject to further regulation and the related rules may be changed.
The table below summarizes IOF tax, which is imposed on financial transactions (such as foreign exchange, insurance transactions, credit or those transactions related to securities), as explained above.
Transaction Type | | Rate (general rule subject to change by executive decree) |
| International Loans | | IOF/FX: 6.0% (average minimum payment term is no longer than 1,800 days) |
| | | |
| | | IOF/FX: 0.0% (average minimum payment term is longer than 1,800 days and foreign financing) |
| | | |
| Foreign Investments in Brazilian Financial and Capital Markets | | IOF/FX: 6.0% (general rule for inflow of funds) |
| | | |
| | | IOF/FX: 0.0% (general rule for variable income investments; purchase of shares outside of the stock exchange as a result of public offerings; and investments in FIPs and FIEEs and units of investment funds that invest in units of such funds). |
Transaction Type | | Rate (general rule subject to change by executive decree) |
| | | |
| | | IOF/FX: 0.0% (general rule for outflow of resources, including repatriation of funds and remittance of interest on net equity and dividends.) |
| | | |
| Credit Card | | IOF/FX: 6.38% |
| | | |
| Insurance Transactions | | IOF/Insurance: 0.0% to 7.38% |
| | | |
| Loans and Credits | | IOF/Credit: 0.0041% (companies) and 0.0068% (individuals) per day, until it reaches the limit of 1.5% or 2.5%, respectively, up to a limit of 365 days, plus 0.38% |
| | | |
| Securities | | IOF/Securities: 0.0% to 1.0% (general rule) |
| | | |
| | | IOF/Securities: 1.5% (assignment of shares in order to permit issuances of depository receipts) |
| | | |
| Securities-Derivatives | | IOF/Securities-Derivatives: 1.0% IOF/Securities-Derivatives: 0.0% for derivative contracts to hedge risks inherent to the price fluctuation of foreign exchange resulting from export contracts signed by an individual or legal entity resident or domiciled in the country IOF/Securities-Derivatives: 0.0% for other transactions with financial derivative contracts not expressly mentioned by the tax law |
Income Taxes Imposed on Financial Investments
Foreign investors that receive payments derived from Brazilian sources, or gains related to Brazilian assets, will be subject to the Brazilian income tax. Under Brazilian law, income tax on capital gains and income from financial transactions carried out in the Brazilian financial and capital market vary depending on the domicile or residence of the investor, the type of registration of the investment held by the investor with the Central Bank and the manner in which the transaction is carried out.
For foreign investors who invested in the Brazilian financial and capital markets, in accordance with CMN Resolution No. 2,689/00, and are not located in a jurisdiction considered a “tax haven jurisdiction” (see “Item 10E. Taxation — Brazilian Tax Considerations”), the income tax is imposed, in general, pursuant to a special regime, as follows:
| · | capital gains from the sale of stock on Brazilian stock exchanges or income derived from derivatives traded on the Brazilian stock and future exchanges are exempted, except if related to combined transactions in derivatives with a predetermined income; |
| · | income tax will be imposed at a rate of 10.0% on income from stock funds, swaps and other transactions on futures market not carried out through a Brazilian stock exchange; and |
| · | income tax will be imposed at a rate of 15.0% on income from all other fixed income investments made through a Brazilian stock exchange or over-the-counter market and on gains earned therefrom. |
Foreign investors that invested in the Brazilian financial and capital markets, in accordance with CMN Resolution No. 2,689/00, and are located in a tax haven jurisdiction are subject to income tax, in general, pursuant to rules applicable to Brazilian individuals, as follows:
| · | on income from financial transactions (variable income) at a rate of 15.0%; |
| · | on income from fixed income, including public bonds, at rates varying from 22.5% to 15.0% (the rates vary according to the transaction type and terms); and |
| · | income from other long and short-term investment funds at rates varying from 22.5% to 15.0%, according to the investment period. |
The table below is a summary of the income taxation relating to the foreign investment in the Brazilian financial and capital market located in a non-tax haven jurisdiction and a tax haven jurisdiction. It does not purport to be a complete analysis of all tax considerations relating to investments in Brazil.
| | | Rate for | |
Transaction Type (Under CMN
Resolution No. 2,689/00) | | | Foreign investor located in a non-tax haven jurisdiction | | | | Foreign investor located in a tax haven jurisdiction | |
| Capital gains from stock and derivatives and other variable income securities traded on the stock and futures exchange | | 0.0% | | | 15.0% | |
| Swap transactions | | 10.0% | | | 22.5% to 15.0% | |
| Other over-the-counter derivatives | | 10.0% | | | 15.0% | |
| Fixed income securities, including structured fixed income combinations (rates may vary according to the transaction type and term) | | 15.0% | | | 22.5% to 15.0% | |
| Income from public bonds (provided certain requirements are observed) | | 0.0% | | | 22.5% to 15.0% | |
| Short-term fixed income investment funds | | 15.0% | | | 22.5% to 20.0% | |
| Long-term fixed income investment funds | | 15.0% | | | 22.5% to 15.0% | |
| Income from stock funds | | 10.0% | | | 15.0% | |
Finally, Provisional Measure No. 517 of December 31, 2010, converted into Law 12,431 of June 24, 2011, provides that income from publicly-traded bonds and securities acquired as of January 1, 2011, of non-resident investors that are not resident or domiciled in tax haven jurisdictions are subject to the withholding income tax at a 0.0% rate. To be eligible for this benefit, the following requirements must be met: (i) the bonds and securities must have been issued by private non-financial entities in accordance with the rules set forth by the CMN; (ii) the bonds must have weighted average maturity greater than four years, (iii) the issuer may not repurchase the bonds or securities within the first two years after issuance, (iv) the remuneration must be linked to predetermined rates and related to certain inflation indices; (v) the buyer has no agreement or commitment to resell; (vi) income payments, if any, must take place no more frequently than once per 180 day period; (vii) the bonds must be traded in regulated markets; and (viii) the issuer must demonstrate the allocation of the proceeds from the issuance to investment projects.
Insurance Regulation
The Brazilian insurance system is governed by three regulatory agencies: the CNSP, SUSEP and the ANS. With governmental approval, an insurance company may offer all types of insurance with the exception of workers’ compensation insurance, which is provided exclusively by the National Institute of Social Welfare (Instituto Nacional do Seguro Social or “INSS”). Insurance companies are required to sell policies through qualified brokers. In accordance with Brazilian insurance legislation, health plans/insurance must be sold separately from other types of insurance by a specialized company that is subject to the rules of the ANS, the agency responsible for private health plans and insurance.
Insurance companies must set aside reserves to be invested in specific types of securities. As a result, insurance companies are among the main investors in the Brazilian financial market and are subject to the rules of the CMN regarding the investment of technical reserves.
Insurance companies are exempt from ordinary bankruptcy procedures and instead are subject to a special procedure administered by SUSEP or by ANS, the insurance sector regulators, except when the assets of the insurance company are not sufficient to guarantee at least half of the unsecured credits or procedures relating to acts that may be considered bankruptcy-related crimes. Dissolutions may be either voluntary or compulsory. The Minister of Finance is responsible for the institution of compulsory dissolutions of insurance companies under SUSEP’s regulation and ANS is responsible for the dissolution of health insurance companies.
There is currently no restriction on foreign investments in insurance companies.
According to Brazilian law, insurance companies must buy reinsurance to the extent their liabilities exceed their technical limits under SUSEP rules. For several years, reinsurance activities in Brazil were carried out on a monopoly basis by the Brazilian Reinsurance Institute (IRB – Brasil Resseguros S.A. or “IRB”). On January 16, 2007, Supplementary Law No. 126 came into force, providing for the opening of the Brazilian reinsurance market to other reinsurance companies. This supplementary law specifically established new policies related to reinsurance, retrocession and its intermediation, coinsurance operations, contracting insurance products abroad and insurance sector foreign currency operations.
The main changes introduced by Supplementary Law No. 126 are summarized below. Three types of reinsurers are established by such law:
| · | Local reinsurer: a reinsurer with its head office in Brazil, incorporated as a corporation (sociedade por ações) and having as its exclusive purpose the performance of reinsurance and retrocession transactions; |
| · | Admitted reinsurer: a non-resident reinsurer, registered with SUSEP to carry out reinsurance and retrocession transactions, with a representative office in Brazil, which complies with the requirements of Supplementary Law No. 126 and the applicable rules regarding reinsurance and retrocession activities; and |
| · | Eventual reinsurer: a non-resident reinsurer, registered with SUSEP to carry out reinsurance and retrocession transactions, without a representative office in Brazil, which complies with the requirements of Supplementary Law No. 126 and the applicable rules regarding reinsurance and retrocession activities. |
An eventual reinsurer cannot be resident in a country considered as a tax-haven jurisdiction, as defined in Supplementary Law No. 126.
An admitted or eventual reinsurer must comply with the following requirements:
| · | to be duly incorporated, according to the laws of their countries of origin, in order to underwrite local and international reinsurance in the fields that they intend to operate in Brazil and present evidence that they have carried out their operations in their respective countries of origin for at least five years; |
| · | to have economic and financial capacity equal to or higher than the minimum established by CNSP; |
| · | to have a rating issued by rating agencies recognized by SUSEP equal to or higher than the minimum established by CNSP; |
| · | to have a duly appointed resident attorney-in-fact in Brazil with full administrative and judicial powers; and |
| · | to comply with additional requirements established by CNSP and SUSEP. |
In addition to the requirements mentioned above, an admitted reinsurer must keep a foreign currency account with SUSEP and periodically submit their financial statements to SUSEP, pursuant to the rules enacted by CNSP.
Entering into reinsurance and retrocession contracts in Brazil or abroad must occur either through direct negotiation between the involved parties or an authorized broker. Foreign reinsurance brokers may be authorized to operate in Brazil, according to the law and additional requirements established by SUSEP and CNSP.
Reinsurance operations relating to survival life insurance and private pension plans may only be offered by local reinsurers.
With due observance of the rules enacted by CNSP, insurance companies, when transferring their risks in reinsurance, have to transfer to local reinsurers 40.0% of said risks.
The technical reserves of local reinsurers and funds deposited in Brazil for purposes of guaranteeing admitted reinsurers’ local activities will be managed according to the rules of the CMN. IRB continues to be authorized to carry out reinsurance and retrocession activities in Brazil as a local reinsurer.
SELECTED STATISTICAL INFORMATION
The following information is included for analytical purposes and should be read in connection with our IFRS consolidated financial statements in Item 18 as well as with “Item 5. Operating and Financial Review and Prospects.” Information is presented as of and for the years ended December 31, 2011 and 2010.
The data included in this section are presented in accordance with IFRS, unless otherwise indicated.
Average Balance Sheet and Interest Rate Data
The following table presents the average balances of our interest-earning assets and interest-bearing liabilities, other assets and liabilities accounts, the related interest income and expense amounts and the average real yield/rate for each period. We calculated the average balances using monthly book balances for the years ended December 31, 2011 and 2010 as we believe such balances are representative of our operations and it would be too costly to produce average balances using daily book balances in IFRS. The majority of our business is composed of retail banking operations, which have grown organically and without significant fluctuations over short periods of time during 2011 and 2010. Non-accrual loans and leases are disclosed as a non-interest earning asset in the table below.
| | | | | | (in millions of R$, except percentages) | |
| | | 2011 | | | 2010 | |
| Assets | | Average
balance | | | Interest
received | | | Average
yield/rate (%) | | | Average
balance | | | Interest
received | | | Average
yield/rate (%) | |
| Interest-earning assets (*) | | | 731,572 | | | | 103,963 | | | | 14.2 | % | | | 592,744 | | | | 82,830 | | | | 14.0 | % |
| Interbank deposits | | | 17,015 | | | | 890 | | | | 5.2 | % | | | 15,147 | | | | 824 | | | | 5.4 | % |
| Securities purchased under agreements to resell | | | 146,052 | | | | 16,224 | | | | 11.1 | % | | | 156,335 | | | | 12,946 | | | | 8.3 | % |
| Derivatives | | | 9,734 | | | | 341 | | | | 3.5 | % | | | 7,489 | | | | 2,488 | | | | 33.2 | % |
| Central Bank compulsory deposits | | | 88,926 | | | | 9,182 | | | | 10.3 | % | | | 45,524 | | | | 4,025 | | | | 8.8 | % |
| Financial assets held for trading | | | 121,583 | | | | 15,142 | | | | 12.5 | % | | | 73,178 | | | | 8,250 | | | | 11.3 | % |
| Available-for-sale financial assets | | | 43,036 | | | | 3,332 | | | | 7.7 | % | | | 40,159 | | | | 3,148 | | | | 7.8 | % |
| Held-to-maturity financial assets | | | 3,101 | | | | 360 | | | | 11.6 | % | | | 2,842 | | | | 456 | | | | 16.0 | % |
| Loan operations and lease operations (accrual) | | | 302,125 | | | | 58,492 | | | | 19.4 | % | | | 252,070 | | | | 50,693 | | | | 20.1 | % |
| Non-interest-earning assets | | | 59,248 | | | | | | | | | | | | 57,425 | | | | | | | | | |
| Cash and deposits on demand | | | 14,205 | | | | | | | | | | | | 12,717 | | | | | | | | | |
| Central Bank compulsory deposits | | | 4,664 | | | | | | | | | | | | 4,139 | | | | | | | | | |
| Non-accrual loans | | | 17,528 | | | | | | | | | | | | 14,816 | | | | | | | | | |
| Allowance for loan and lease losses | | | (22,976 | ) | | | | | | | | | | | (21,889 | ) | | | | | | | | |
| Fixed assets, net | | | 4,932 | | | | | | | | | | | | 4,340 | | | | | | | | | |
| Investments in unconsolidated companies | | | 2,268 | | | | | | | | | | | | 2,539 | | | | | | | | | |
| Intangible assets, net | | | 3,224 | | | | | | | | | | | | 3,240 | | | | | | | | | |
| Other assets | | | 35,402 | | | | | | | | | | | | 37,522 | | | | | | | | | |
| Total assets | | | 790,820 | | | | | | | | | | | | 650,169 | | | | | | | | | |
(*) For the net yield on total average interest-earning assets, see "Net Interest Margin and Spread".
| | | | | | (in millions of R$, except percentages) | |
| | | 2011 | | | 2010 | |
| Liabilities | | Average
balance | | | Interest
paid | | | Average
yield/rate (%) | | | Average
balance | | | Interest
paid | | | Average
yield/rate (%) | |
| Interest-bearing liabilities | | | 580,695 | | | | 55,599 | | | | 9.6 | % | | | 471,501 | | | | 36,840 | | | | 7.8 | % |
| Interest-bearing deposits: | | | 186,429 | | | | 14,757 | | | | 7.9 | % | | | 164,210 | | | | 12,245 | | | | 7.5 | % |
| Savings deposits | | | 61,143 | | | | 3,992 | | | | 6.5 | % | | | 52,457 | | | | 3,127 | | | | 6.0 | % |
| Interbank Deposits | | | 2,376 | | | | 169 | | | | 7.1 | % | | | 1,703 | | | | 145 | | | | 8.5 | % |
| Time deposits | | | 122,910 | | | | 10,596 | | | | 8.6 | % | | | 110,050 | | | | 8,973 | | | | 8.2 | % |
| Securities sold under repurchase agreements | | | 203,021 | | | | 22,133 | | | | 10.9 | % | | | 163,634 | | | | 15,774 | | | | 9.6 | % |
| Interbank market debt and Institutional market debt: | | | 125,007 | | | | 13,470 | | | | 10.8 | % | | | 89,231 | | | | 4,783 | | | | 5.4 | % |
| Interbank market debt | | | 77,189 | | | | 5,536 | | | | 7.2 | % | | | 50,782 | | | | 2,100 | | | | 4.1 | % |
| Institutional market debt | | | 47,818 | | | | 7,934 | | | | 16.6 | % | | | 38,449 | | | | 2,683 | | | | 7.0 | % |
| Reserves for insurance and private pension and Liabilities for capitalization plans | | | 66,237 | | | | 5,239 | | | | 7.9 | % | | | 54,426 | | | | 4,038 | | | | 7.4 | % |
| Non-interest bearing liabilities | | | 142,740 | | | | | | | | | | | | 120,440 | | | | | | | | | |
| Non-interest bearing deposits | | | 26,072 | | | | | | | | | | | | 25,817 | | | | | | | | | |
| Other non-interest-bearing liabilities | | | 116,668 | | | | | | | | | | | | 95,116 | | | | | | | | | |
| Stockholders’ equity | | | 67,385 | | | | | | | | | | | | 57,736 | | | | | | | | | |
| Total liabilities and stockholders’ equity | | | 790,820 | | | | | | | | | | | | 650,169 | | | | | | | | | |
The following tables present, calculated in accordance with U.S. GAAP, the average balances of our interest-earning assets and interest-bearing liabilities, other assets and liabilities accounts, the related interest income and expense amounts and the average real yield/rate for each period. We calculated the average balances using daily book balances for the years ended December 31, 2010 and 2009. Non-accrual loans and leases are disclosed as a non-interest earning asset in the table below. We have included 2010 average balances for comparative purposes.
| | | (in millions of R$, except percentages) | |
| | | U.S. GAAP | |
| | | 2010 | | | 2009 | |
| Assets | | Average
balance | | | Interest | | | Average
yield/rate (%) | | | Average
balance | | | Interest | | | Average
yield/rate (%) | |
| Interest-earning assets | | | 544,252 | | | | 78,369 | | | | 14.4 | % | | | 453,883 | | | | 72,567 | | | | 16.0 | % |
| Interest-bearing deposits in other banks | | | 61,827 | | | | 3,165 | | | | 5.1 | % | | | 54,046 | | | | 3,533 | | | | 6.5 | % |
| Securities purchased under resale agreements | | | 59,843 | | | | 7,572 | | | | 12.7 | % | | | 59,916 | | | | 8,673 | | | | 14.5 | % |
| Central Bank compulsory deposits | | | 39,313 | | | | 4,036 | | | | 10.3 | % | | | 7,816 | | | | 519 | | | | 6.6 | % |
| Trading assets and securities: | | | 139,173 | | | | 11,561 | | | | 8.3 | % | | | 121,215 | | | | 11,260 | | | | 9.3 | % |
| Trading assets, at fair value | | | 97,175 | | | | 7,767 | | | | 8.0 | % | | | 78,933 | | | | 7,087 | | | | 9.0 | % |
| Available for sale securities, at fair value | | | 40,229 | | | | 3,315 | | | | 8.2 | % | | | 40,605 | | | | 3,996 | | | | 9.8 | % |
| Held-to-maturity securities, at amortized cost | | | 1,769 | | | | 479 | | | | 27.1 | % | | | 1,677 | | | | 177 | | | | 10.5 | % |
| Loans and leases | | | 244,095 | | | | 52,035 | | | | 21.3 | % | | | 210,890 | | | | 48,582 | | | | 23.0 | % |
| Non-interest-earning assets | | | 68,024 | | | | | | | | | | | | 60,812 | | | | | | | | | |
| Cash and due from banks | | | 5,947 | | | | | | | | | | | | 6,235 | | | | | | | | | |
| Central Bank compulsory deposits | | | 5,159 | | | | | | | | | | | | 5,087 | | | | | | | | | |
| Non-accrual loans | | | 14,995 | | | | | | | | | | | | 10,919 | | | | | | | | | |
| Allowance for loan and lease losses | | | (23,149 | ) | | | | | | | | | | | (21,186 | ) | | | | | | | | |
| Premises and equipments, net | | | 4,822 | | | | | | | | | | | | 3,393 | | | | | | | | | |
| Investments in unconsolidated companies | | | 3,555 | | | | | | | | | | | | 3,890 | | | | | | | | | |
| Goodwill and intangible assets, net | | | 21,958 | | | | | | | | | | | | 21,583 | | | | | | | | | |
| Other assets | | | 34,737 | | | | | | | | | | | | 30,891 | | | | | | | | | |
| Total assets | | | 612,276 | | | | | | | | | | | | 514,695 | | | | | | | | | |
| | | (in millions of R$, except percentages) | |
| | | U.S. GAAP | |
| | | 2010 | | | 2009 | |
| Liabilities | | Average
balance | | | Interest | | | Average yield/rate (%) | | | Average
balance | | | Interest | | | Average yield/rate (%) | |
| Interest-bearing liabilities | | | 458,755 | | | | 34,824 | | | | 7.6 | % | | | 382,880 | | | | 31,876 | | | | 8.3 | % |
| Interest-bearing deposits: | | | 166,549 | | | | 11,776 | | | | 7.1 | % | | | 159,296 | | | | 11,773 | | | | 7.4 | % |
| Savings deposits | | | 52,882 | | | | 3,130 | | | | 5.9 | % | | | 40,998 | | | | 2,429 | | | | 5.9 | % |
| Deposits from banks | | | 2,030 | | | | 147 | | | | 7.2 | % | | | 2,605 | | | | 336 | | | | 12.9 | % |
| Time deposits | | | 111,637 | | | | 8,499 | | | | 7.6 | % | | | 115,693 | | | | 9,008 | | | | 7.8 | % |
| Securities sold under repurchase agreements | | | 80,167 | | | | 7,291 | | | | 9.1 | % | | | 65,939 | | | | 7,177 | | | | 10.9 | % |
| Borrowings: | | | 167,526 | | | | 13,000 | | | | 7.8 | % | | | 124,953 | | | | 9,901 | | | | 7.9 | % |
| Short-term borrowings | | | 99,041 | | | | 8,198 | | | | 8.3 | % | | | 70,861 | | | | 5,314 | | | | 7.5 | % |
| Long-term debt | | | 68,485 | | | | 4,802 | | | | 7.0 | % | | | 54,093 | | | | 4,586 | | | | 8.5 | % |
| Investment contracts | | | 44,513 | | | | 2,757 | | | | 6.2 | % | | | 32,691 | | | | 3,025 | | | | 9.3 | % |
| Non-interest-bearing liabilities | | | 80,202 | | | | | | | | | | | | 70,272 | | | | | | | | | |
| Non-interest-bearing deposits | | | 26,928 | | | | | | | | | | | | 23,799 | | | | | | | | | |
| Other non-interest-bearing liabilities | | | 53,273 | | | | | | | | | | | | 46,474 | | | | | | | | | |
| Shareholders’ equity | | | 73,320 | | | | | | | | | | | | 61,544 | | | | | | | | | |
| Total liabilities and shareholders’ equity | | | 612,276 | | | | | | | | | | | | 514,695 | | | | | | | | | |
Changes in Interest Income and Expenses – Volume and Rate Analysis
The following table sets forth the allocation of the changes in our interest income and expense in terms of average volume and changes in the average yields/rates for the year ended December 31, 2011 compared to 2010. Volume balance and rate variations have been calculated based on variations of average balances over the period and changes in average interest yield/rates on interest-earning assets and interest-bearing liabilities from one period to the other. Volume change has been computed as the change in the average interest-earning assets or interest-bearing liabilities from one period to the other multiplied by the average yield/rate in the earlier period. Yield/rate change has been computed as the change in the yield/rate in the period multiplied by the average interest-earning assets or interest-bearing liabilities in the earlier period. We allocated the net change from the combined effects of volume and yield/rate proportionately to volume change and yield/rate change, in absolute terms, without considering positive and negative effects.
| (in millions of R$) | |
| | | Increase/(decrease) due to changes in: | |
| | | 2011/2010 | |
| | | Volume | | | Yield/rate | | | Net change | |
| Interest-earning assets: | | | 19,706 | | | | 1,426 | | | | 21,133 | |
| Interbank deposits | | | 96 | | | | (30 | ) | | | 66 | |
| Securities purchased under agreements to resell | | | (782 | ) | | | 4,060 | | | | 3,278 | |
| Derivatives | | | 1,082 | | | | (3,229 | ) | | | (2,148 | ) |
| Central Bank compulsory deposits | | | 4,385 | | | | 772 | | | | 5,157 | |
| Financial assets held for trading | | | 5,951 | | | | 941 | | | | 6,892 | |
| Available-for-sale financial assets | | | 222 | | | | (38 | ) | | | 184 | |
| Held-to-maturity financial assets | | | 47 | | | | (143 | ) | | | (96 | ) |
| Loan and lease operations (accrual) | | | 9,604 | | | | (1,805 | ) | | | 7,799 | |
| Interest-bearing liabilities: | | | 9,506 | | | | 9,253 | | | | 18,759 | |
| Interest-bearing deposits: | | | 1,727 | | | | 785 | | | | 2,512 | |
| Saving deposits | | | 549 | | | | 315 | | | | 865 | |
| Interbank deposits | | | 41 | | | | (17 | ) | | | 24 | |
| Time deposits | | | 1,089 | | | | 534 | | | | 1,623 | |
| Securities sold under repurchase agreements | | | 4,119 | | | | 2,240 | | | | 6,359 | |
| Interbank market debt and Institutional market debt | | | 2,468 | | | | 6,218 | | | | 8,686 | |
| Interbank market debt | | | 1,425 | | | | 2,011 | | | | 3,435 | |
| Institutional market debt | | | 789 | | | | 4,462 | | | | 5,251 | |
| Reserves for insurance and private pension and Liabilities for capitalization | | | 921 | | | | 281 | | | | 1,202 | |
Net Interest Margin and Spread
The following table sets forth our average interest-earning assets, total average interest-bearing liabilities, net interest income and the comparative net interest margin and net interest spread for the years ended December 31, 2011 and 2010.
| (in millions of R$, except percentages) | |
| | | 2011 | | | 2010 | |
| Total average interest-earning assets | | | 731,572 | | | | 592,744 | |
| Total average interest-bearing liabilities | | | 580,695 | | | | 471,501 | |
| Net interest income(1) | | | 48,364 | | | | 45,990 | |
| Average yield on average interest-earning assets(2) | | | 14.2 | % | | | 14.0 | % |
| Average rate on average interest-bearing liabilities(3) | | | 9.6 | % | | | 7.8 | % |
| Net interest spread(4) | | | 4.6 | % | | | 6.2 | % |
| Net interest margin(5) | | | 6.6 | % | | | 7.8 | % |
(1) Is the sum of total interest income, dividend income, net gain (loss) from financial assets and liabilities, foreign exchange results and exchange variation on transactions less total interest expense.
(2)Total interest income, dividend income, net gain (loss) from financial assets and liabilities, foreign exchange results and exchange variation on transactions divided by total average interest-earning assets.
(3) Total interest expense divided by total average interest-bearing liabilities.
(4)Difference between the average yield on interest-earning assets and the average rate on interest-bearing liabilities.
(5)Net interest income divided by total average interest-earning assets.
The following table sets forth our average interest-earning assets, total average interest-bearing liabilities, net interest income and the comparative net interest margin and net interest spread, calculated in accordance with U.S. GAAP, for the year ended December 31, 2009.
| (in millions of R$, except percentages) | |
| | | U.S. GAAP | |
| | | 2009 | |
| Total average interest-earning assets | | | 453,883 | |
| Total average interest-bearing liabilities | | | 382,880 | |
| Net interest income(1) | | | 40,691 | |
| Average yield on average interest-earning assets(2) | | | 16.0 | % |
| Average rate on average interest-bearing liabilities(3) | | | 8.3 | % |
| Net interest spread(4) | | | 7.7 | % |
| Net interest margin(5) | | | 9.0 | % |
(1)Total interest income less total interest expense.
(2) Total interest income divided by total average interest-earning assets.
(3) Total interest expense divided by total average interest-bearing liabilities.
(4) Difference between the average yield on interest-earning assets and the average rate on interest-bearing liabilities.
(5)Net interest income divided by total average interest-earning assets.
Return on Equity and Assets
The following table sets forth certain data with respect to return on equity and assets for the years ended December 31, 2011 and 2010:
| (in millions of R$, except percentages) | |
| | | 2011 | | | 2010 | |
| Net income attributable to owners of the parent company | | | 13,837 | | | | 11,708 | |
| Average total assets | | | 790,820 | | | | 650,169 | |
| Average stockholders' equity | | | 67,385 | | | | 57,736 | |
| Net income as a percentage of average total assets(1) | | | 1.7 | % | | | 1.8 | % |
| Net income as a percentage of average stockholder's equity (1) | | | 20.5 | % | | | 20.3 | % |
| Average stockholder's equity as a percentage of average total assets | | | 8.5 | % | | | 8.9 | % |
| Dividend payout ratio per share(2) | | | 31.9 | % | | | 33.5 | % |
(1)Attributable to owners of the parent company.
(2) Dividend and interest on stockholders’ equity per share divided by basic earnings per share. Please see “Item 3A. Selected Financial Data – IFRS Selected Financial Data – Earnings and Dividend Per Share” for additional information on the computation of both dividend and interest on shareholders’ equity and basic earnings per share.
The following table sets forth certain data with respect to return on equity and assets, calculated in accordance with U.S. GAAP, for the year ended December 31, 2009:
| (in millions of R$, except percentages) | |
| | | U.S. GAAP | |
| | | 2009 | |
| Net income attributable to Itaú Unibanco Holding | | | 14,085 | |
| Average total assets | | | 514,695 | |
| Average stockholders' equity | | | 61,544 | |
| Net income attributable to Itaú Unibanco Holding as a percentage of average total assets | | | 2.7 | % |
| Net income attributable to Itaú Unibanco Holding as a percentage of average stockholder's equity | | | 22.9 | % |
| Average stockholder's equity as a percentage of average total assets | | | 12.0 | % |
| Dividend payout ratio per share | | | 28.4 | % |
Securities Portfolio
General
The following table sets forth our portfolio of financial assets held for trading, derivatives, available-for-sale financial assets and held-to-maturity financial assets, as of December 31, 2011 and 2010. The amounts exclude our investments in securities of unconsolidated companies. For more information on our investments in unconsolidated companies see note 12 to our consolidated financial statements. Financial assets held for trading assets, financial assets designated at fair value through profit or loss, derivatives and available-for-sale financial assets are stated at fair value and held-to-maturity financial assets are stated at amortized cost. See notes 6, 7, 9 and 10 to our consolidated financial statements for a description of the accounting policies applied to account for our securities portfolio and for additional information on the portfolio maintained as of such dates.
| (in millions of R$, except percentages) | |
| | | 2011 | | | % of total | | | 2010 | | | % of total | |
| Financial assets held for trading | | | 121,889 | | | | 100 | % | | | 115,497 | | | | 100 | % |
| Investment funds | | | 1,339 | | | | 1.1 | % | | | 1,748 | | | | 1.5 | % |
| Government securities - domestic | | | 94,824 | | | | 77.8 | % | | | 87,365 | | | | 75.6 | % |
| Brazilian government securities | | | 93,914 | | | | 77.0 | % | | | 86,699 | | | | 75.1 | % |
| Brazilian external debt bonds | | | 910 | | | | 0.7 | % | | | 666 | | | | 0.6 | % |
| Government securities - abroad | | | 802 | | | | 0.7 | % | | | 9,353 | | | | 8.1 | % |
| Argentina | | | 225 | | | | 0.2 | % | | | 293 | | | | 0.3 | % |
| United States | | | 292 | | | | 0.2 | % | | | 8,714 | | | | 7.5 | % |
| Mexico | | | 205 | | | | 0.2 | % | | | 29 | | | | 0.0 | % |
| Russia | | | - | | | | 0.0 | % | | | 45 | | | | 0.0 | % |
| Chile | | | 50 | | | | 0.0 | % | | | 248 | | | | 0.2 | % |
| Uruguay | | | 27 | | | | 0.0 | % | | | 24 | | | | 0.0 | % |
| Other | | | 3 | | | | 0.0 | % | | | - | | | | 0.0 | % |
| Corporate securities | | | 24,924 | | | | 20.4 | % | | | 17,031 | | | | 14.7 | % |
| Shares | | | 2,297 | | | | 1.9 | % | | | 3,248 | | | | 2.8 | % |
| Securitized real estate loans | | | 24 | | | | 0.0 | % | | | 596 | | | | 0.5 | % |
| Bank deposit certificates | | | 7,820 | | | | 6.4 | % | | | 8,932 | | | | 7.7 | % |
| Debentures | | | 3,526 | | | | 2.9 | % | | | 2,800 | | | | 2.4 | % |
| Eurobonds and other | | | 1,431 | | | | 1.2 | % | | | 1,452 | | | | 1.3 | % |
| Financial credit bills | | | 8,973 | | | | 7.4 | % | | | - | | | | 0.0 | % |
| Other | | | 853 | | | | 0.7 | % | | | 3 | | | | 0.0 | % |
| Financial assets held for trading as a percentage of total assets | | | 14.90 | % | | | | | | | 15.89 | % | | | | |
| Financial assets designated at fair value through profit or loss - Government securities - domestic - Brazilian external debt bonds | | | 186 | | | | 100 | % | | | 306 | | | | 100 | % |
| Financial assets designated at fair value as a percentage of total assets | | | 0.02 | % | | | | | | | 0.04 | % | | | | |
| Derivatives | | | 8,754 | | | | 100 | % | | | 7,777 | | | | 100 | % |
| Derivatives as a percentage of total assets | | | 1.07 | % | | | | | | | 1.07 | % | | | | |
| Available-for-sale financial assets | | | 47,510 | | | | 100 | % | | | 44,539 | | | | 100 | % |
| Investment funds | | | 806 | | | | 1.7 | % | | | 770 | | | | 1.7 | % |
| Government securities - domestic | | | 18,330 | | | | 38.6 | % | | | 14,799 | | | | 33.2 | % |
| Brazilian government securities | | | 12,424 | | | | 26.2 | % | | | 10,079 | | | | 22.6 | % |
| Brazilian external debt bonds | | | 5,906 | | | | 12.4 | % | | | 4,720 | | | | 10.6 | % |
| Government securities - abroad | | | 4,317 | | | | 9.1 | % | | | 4,559 | | | | 10.2 | % |
| United States | | | - | | | | 0.0 | % | | | 679 | | | | 1.5 | % |
| Mexico | | | 11 | | | | 0.0 | % | | | - | | | | 0.0 | % |
| Denmark | | | 1,949 | | | | 4.1 | % | | | 2,016 | | | | 4.5 | % |
| Spain | | | 418 | | | | 0.9 | % | | | 734 | | | | 1.6 | % |
| Korea | | | 295 | | | | 0.6 | % | | | 236 | | | | 0.5 | % |
| Chile | | | 995 | | | | 2.1 | % | | | 453 | | | | 1.0 | % |
| Paraguay | | | 344 | | | | 0.7 | % | | | 256 | | | | 0.6 | % |
| Uruguay | | | 268 | | | | 0.6 | % | | | 185 | | | | 0.4 | % |
| Other | | | 37 | | | | 0.1 | % | | | - | | | | 0.0 | % |
| Corporate securities | | | 24,057 | | | | 50.6 | % | | | 24,411 | | | | 54.8 | % |
| Shares | | | 3,978 | | | | 8.4 | % | | | 5,124 | | | | 11.5 | % |
| Securitized real estate loans | | | 8,014 | | | | 16.9 | % | | | 6,975 | | | | 15.7 | % |
| Bank deposit certificates | | | 274 | | | | 0.6 | % | | | 559 | | | | 1.3 | % |
| Debentures | | | 7,236 | | | | 15.2 | % | | | 6,634 | | | | 14.9 | % |
| Eurobonds and others | | | 3,638 | | | | 7.7 | % | | | 3,843 | | | | 8.6 | % |
| Promissory notes | | | 646 | | | | 1.4 | % | | | 1,265 | | | | 2.8 | % |
| Other | | | 271 | | | | 0.6 | % | | | 11 | | | | 0.0 | % |
| Available-for-sale financial assets as a percentage of total assets | | | 5.81 | % | | | | | | | 6.13 | % | | | | |
| Held-to-maturity financial assets | | | 3,105 | | | | 100 | % | | | 3,170 | | | | 100 | % |
| Government securities - domestic | | | 3,008 | | | | 96.9 | % | | | 2,990 | | | | 94.3 | % |
| Brazilian government securities | | | 2,812 | | | | 90.6 | % | | | 2,764 | | | | 87.2 | % |
| Brazilian external debt bonds | | | 196 | | | | 6.3 | % | | | 226 | | | | 7.1 | % |
| Government securities – abroad | | | - | | | | 0.0 | % | | | 16 | | | | 0.5 | % |
| Corporate securities | | | 97 | | | | 3.1 | % | | | 164 | | | | 5.2 | % |
| Debentures | | | 30 | | | | 1.0 | % | | | 30 | | | | 0.9 | % |
| Eurobonds and others | | | 65 | | | | 2.1 | % | | | 130 | | | | 4.1 | % |
| Securitized real estate loans | | | 2 | | | | 0.1 | % | | | 4 | | | | 0.1 | % |
| Held-to-maturity financial assets, as a percentage of total assets | | | 0.38 | % | | | | | | | 0.44 | % | | | | |
As of December 31, 2011, we held securities issued by the Brazilian federal government classified above as “Government securities - domestic” with an aggregate book value and an aggregate market value of R$116,348 million, which amount represented 154.4%, of our consolidated stockholders’ equity as of that date. As of December 31, 2011, we did not hold securities of any other issuer which in the aggregate represented more than 10.0% of our consolidated stockholders’ equity.
The following table sets forth our portfolio of trading assets, securities available for sale and held-to-maturity securities, calculated in accordance with U.S. GAAP, as of December 31, 2009. The amounts exclude our investments in securities of unconsolidated companies. Trading assets and securities available for sale are stated at fair value and held-to-maturity securities are stated at amortized cost.
| (in millions of R$, except percentages) | |
| | | U.S. GAAP | |
| | | 2009 | | | % of total | |
| Trading assets, at fair value | | | 73,529 | | | | 100.0 | % |
| Investment funds | | | 39,347 | | | | 53.5 | % |
| Government securities - domestic | | | 24,207 | | | | 32.9 | % |
| Brazilian federal government securities | | | 23,985 | | | | 32.6 | % |
| Brazilian external debt bonds | | | 222 | | | | 0.3 | % |
| Government securities - abroad | | | 1,058 | | | | 1.3 | % |
| Argentina | | | 179 | | | | 0.2 | % |
| United States | | | 748 | | | | 1.2 | % |
| Mexico | | | 10 | | | | 0.0 | % |
| Russia | | | - | | | | 0.0 | % |
| Spain | | | - | | | | 0.0 | % |
| Korea | | | - | | | | 0.0 | % |
| Chile | | | 77 | | | | 0.1 | % |
| Uruguay | | | 30 | | | | 0.0 | % |
| Others | | | 14 | | | | 0.0 | % |
| Corporate debt securities | | | 2,226 | | | | 3.0 | % |
| Marketable equity securities | | | 1,142 | | | | 1.6 | % |
| Derivative financial instruments | | | 5,549 | | | | 7.5 | % |
| Trading assets as a percentage of total assets | | | 18.21 | % | | | | |
| Securities available for sale, at fair value | | | 41,263 | | | | 100.0 | % |
| Investment funds | | | 1,259 | | | | 2.9 | % |
| Government securities - domestic | | | 16,423 | | | | 39.8 | % |
| Brazilian federal government securities | | | 14,443 | | | | 35.0 | % |
| Brazilian external debt bonds | | | 1,980 | | | | 4.8 | % |
| Government securities - abroad | | | 7,243 | | | | 17.7 | % |
| Portugal | | | 26 | | | | 0.1 | % |
| Argentina | | | - | | | | 0.0 | % |
| United States | | | 17 | | | | 0.1 | % |
| Norway | | | - | | | | 0.0 | % |
| Austria | | | 213 | | | | 0.5 | % |
| Denmark | | | 1,971 | | | | 4.8 | % |
| Spain | | | 1,093 | | | | 2.6 | % |
| Korea | | | 1,757 | | | | 4.3 | % |
| Chile | | | 1,274 | | | | 3.1 | % |
| Paraguay | | | 417 | | | | 1.0 | % |
| Uruguay | | | 475 | | | | 1.2 | % |
| Corporate debt securities | | | 14,966 | | | | 36.3 | % |
| Marketable equity securities | | | 1,372 | | | | 3.3 | % |
| Securities available for sale as a percentage of total assets | | | 10.22 | % | | | | |
| Held-to-maturity securities, at amortized cost | | | 1,762 | | | | 100.0 | % |
| Government securities - domestic | | | 1,511 | | | | 85.7 | % |
| Brazilian federal government securities | | | 1,273 | | | | 72.2 | % |
| Brazilian external debt bonds | | | 238 | | | | 13.5 | % |
| Government securities - abroad | | | 17 | | | | 1.0 | % |
| Corporate debt securities | | | 234 | | | | 13.3 | % |
| Held-to-maturity securities, as a percentage of total assets | | | 0.44 | % | | | | |
The following table sets forth our portfolio of financial assets held for trading, financial assets designated at fair value through profit or loss, derivatives, available-for-sale financial assets and held-to-maturity financial assets at its amortized cost and its fair value as of December 31, 2011.
| (in millions of R$) | |
| | | Amortized
Cost | | | Fair
Value | |
| Financial assets held for trading | | | 121,860 | | | | 121,889 | |
| Investment funds | | | 1,326 | | | | 1,339 | |
| Government securities - domestic | | | 94,782 | | | | 94,824 | |
| Brazilian government securities | | | 93,914 | | | | 93,914 | |
| Brazilian external debt bonds | | | 868 | | | | 910 | |
| Government securities - abroad | | | 787 | | | | 802 | |
| Argentina | | | 226 | | | | 225 | |
| United States | | | 280 | | | | 292 | |
| Mexico | | | 201 | | | | 205 | |
| Chile | | | 50 | | | | 50 | |
| Uruguay | | | 27 | | | | 27 | |
| Other | | | 3 | | | | 3 | |
| Corporate securities | | | 24,965 | | | | 24,924 | |
| Shares | | | 2,325 | | | | 2,297 | |
| Securitized real estate loans | | | 23 | | | | 24 | |
| Bank deposit certificates | | | 7,820 | | | | 7,820 | |
| Debentures | | | 3,525 | | | | 3,526 | |
| Eurobonds and other | | | 1,446 | | | | 1,431 | |
| Financial credit bills | | | 8,973 | | | | 8,973 | |
| Other | | | 853 | | | | 853 | |
| Financial assets designated at fair value through profit or loss - Government securities - domestic - Brazilian external debt bonds | | | 182 | | | | 186 | |
| Derivatives | | | 8,175 | | | | 8,754 | |
| Available-for-sale financial assets | | | 46,266 | | | | 47,510 | |
| Investment funds | | | 802 | | | | 806 | |
| Government securities - domestic | | | 17,963 | | | | 18,330 | |
| Brazilian government securities | | | 12,296 | | | | 12,424 | |
| Brazilian external debt bonds | | | 5,667 | | | | 5,906 | |
| Government securities - abroad | | | 4,327 | | | | 4,317 | |
| Mexico | | | 10 | | | | 11 | |
| Denmark | | | 1,949 | | | | 1,949 | |
| Spain | | | 418 | | | | 418 | |
| Korea | | | 295 | | | | 295 | |
| Chile | | | 992 | | | | 995 | |
| Paraguay | | | 358 | | | | 344 | |
| Uruguay | | | 268 | | | | 268 | |
| Other | | | 37 | | | | 37 | |
| Corporate securities | | | 23,174 | | | | 24,057 | |
| Shares | | | 3,458 | | | | 3,978 | |
| Securitized real estate loans | | | 7,806 | | | | 8,014 | |
| Bank deposit certificates | | | 274 | | | | 274 | |
| Debentures | | | 7,165 | | | | 7,236 | |
| Eurobonds and others | | | 3,554 | | | | 3,638 | |
| Promissory notes | | | 646 | | | | 646 | |
| Other | | | 271 | | | | 271 | |
| Held-to-maturity financial assets | | | 3,105 | | | | 3,713 | |
| Government securities - domestic | | | 3,008 | | | | 3,611 | |
| Brazilian government securities | | | 2,812 | | | | 3,416 | |
| Brazilian external debt bonds | | | 196 | | | | 195 | |
| Corporate securities | | | 97 | | | | 102 | |
| Debentures | | | 30 | | | | 30 | |
| Eurobonds and others | | | 65 | | | | 69 | |
| Securitized real estate loans | | | 2 | | | | 2 | |
Maturity Distribution
The following table sets forth the maturity distribution and average yields as of December 31, 2011 for our financial assets held for trading, financial assets designated at fair value through profit or loss, derivatives, available-for-sale financial assets and held-to-maturity financial assets.
| (in millions of R$, except percentages) | |
| | | Maturity | |
| | | No stated
maturity | | | Due in 1 year or less | | | Due after 1 year to 5
years | | | Due after 5 years to 10
years | | | Due after 10 years | | | Total | |
| | | R$ | | | Average
yield % | | | R$ | | | Average
yield % | | | R$ | | | Average
yield % | | | R$ | | | Average
yield % | | | R$ | | | Average
yield % | | | R$ | | | Average
yield % | |
| Financial assets held for trading, at fair value | | | 3,636 | | | | | | | | 34,070 | | | | | | | | 72,087 | | | | | | | | 8,550 | | | | | | | | 3,546 | | | | | | | | 121,889 | | | | | |
| Investment funds (1) | | | 1,339 | | | | 0.1 | % | | | - | | | | 0.0 | % | | | - | | | | 0.0 | % | | | - | | | | 0.0 | % | | | - | | | | 0.0 | % | | | 1,339 | | | | 0.1 | % |
| Government securities - domestic | | | - | | | | | | | | 25,922 | | | | | | | | 59,244 | | | | | | | | 6,322 | | | | | | | | 3,336 | | | | | | | | 94,824 | | | | | |
| Brazilian government securities | | | - | | | | 0.0 | % | | | 25,900 | | | | 6.9 | % | | | 59,028 | | | | 6.8 | % | | | 6,140 | | | | 8.5 | % | | | 2,846 | | | | 8.4 | % | | | 93,914 | | | | 7.0 | % |
| Brazilian external debt bonds | | | - | | | | 0.0 | % | | | 22 | | | | 11.0 | % | | | 216 | | | | 7.9 | % | | | 182 | | | | 8.9 | % | | | 490 | | | | 10.3 | % | | | 910 | | | | 9.4 | % |
| Government securities - abroad | | | - | | | | | | | | 272 | | | | | | | | 303 | | | | | | | | 206 | | | | | | | | 21 | | | | | | | | 802 | | | | | |
| Argentina | | | - | | | | 0.0 | % | | | 203 | | | | 15.8 | % | | | 1 | | | | 4.3 | % | | | - | | | | 0.0 | % | | | 21 | | | | 6.0 | % | | | 225 | | | | 14.8 | % |
| United States | | | - | | | | 0.0 | % | | | 4 | | | | 2.4 | % | | | 288 | | | | 2.4 | % | | | - | | | | 0.0 | % | | | - | | | | 0.0 | % | | | 292 | | | | 2.4 | % |
| Mexico | | | - | | | | 0.0 | % | | | - | | | | 0.0 | % | | | - | | | | 0.0 | % | | | 205 | | | | 5.6 | % | | | - | | | | 0.0 | % | | | 205 | | | | 5.6 | % |
| Chile | | | - | | | | 0.0 | % | | | 50 | | | | 3.4 | % | | | - | | | | 0.0 | % | | | - | | | | 0.0 | % | | | - | | | | 0.0 | % | | | 50 | | | | 3.4 | % |
| Uruguay | | | - | | | | 0.0 | % | | | 15 | | | | 3.7 | % | | | 12 | | | | 8.1 | % | | | - | | | | 0.0 | % | | | - | | | | 0.0 | % | | | 27 | | | | 5.7 | % |
| Other | | | - | | | | 0.0 | % | | | - | | | | 0.0 | % | | | 2 | | | | 10.8 | % | | | 1 | | | | 7.4 | % | | | - | | | | 0.0 | % | | | 3 | | | | 9.6 | % |
| Corporate securities | | | 2,297 | | | | | | | | 7,876 | | | | | | | | 12,540 | | | | | | | | 2,022 | | | | | | | | 189 | | | | | | | | 24,924 | | | | | |
| Shares | | | 2,297 | | | | 7.4 | % | | | - | | | | 0.0 | % | | | - | | | | 0.0 | % | | | - | | | | 0.0 | % | | | - | | | | 0.0 | % | | | 2,297 | | | | 7.4 | % |
| Securitized real estate loans | | | - | | | | 0.0 | % | | | - | | | | 0.0 | % | | | 24 | | | | 13.8 | % | | | - | | | | 0.0 | % | | | - | | | | 0.0 | % | | | 24 | | | | 13.8 | % |
| Bank deposit certificates | | | - | | | | 0.0 | % | | | 5,405 | | | | 0.0 | % | | | 2,415 | | | | 0.0 | % | | | - | | | | 0.0 | % | | | - | | | | 0.0 | % | | | 7,820 | | | | 0.0 | % |
| Debentures | | | - | | | | 0.0 | % | | | 1,427 | | | | 0.9 | % | | | 1,541 | | | | 2.7 | % | | | 391 | | | | 2.8 | % | | | 167 | | | | 0.0 | % | | | 3,526 | | | | 1.8 | % |
| Eurobonds and other | | | - | | | | 0.0 | % | | | 43 | | | | 8.4 | % | | | 822 | | | | 7.0 | % | | | 544 | | | | 7.1 | % | | | 22 | | | | 7.8 | % | | | 1,431 | | | | 7.1 | % |
| Financial credit bills | | | - | | | | 0.0 | % | | | 148 | | | | 0.0 | % | | | 7,738 | | | | 0.0 | % | | | 1,087 | | | | 0.0 | % | | | - | | | | 0.0 | % | | | 8,973 | | | | 0.0 | % |
| Other | | | - | | | | 0.0 | % | | | 853 | | | | 0.0 | % | | | - | | | | 0.0 | % | | | - | | | | 0.0 | % | | | - | | | | 0.0 | % | | | 853 | | | | 0.0 | % |
| Financial assets designated at fair value through profit or loss - Government securities - domestic - Brazilian external debt bonds | | | - | | | | 0.00 | % | | | 186 | | | | 0.00 | % | | | - | | | | 0.00 | % | | | - | | | | 0.00 | % | | | - | | | | 0.00 | % | | | 186 | | | | 0.0 | % |
| Derivatives | | | - | | | | 0.00 | % | | | 5,948 | | | | 0.00 | % | | | 2,315 | | | | 0.00 | % | | | 452 | | | | 0.00 | % | | | 39 | | | | 0.00 | % | | | 8,754 | | | | 0.0 | % |
| Available-for-sale financial assets, at fair value | | | 4,780 | | | | | | | | 9,124 | | | | | | | | 17,041 | | | | | | | | 9,656 | | | | | | | | 6,909 | | | | | | | | 47,510 | | | | | |
| Investment funds (1) | | | 802 | | | | 0.0 | % | | | - | | | | 0.0 | % | | | 4 | | | | 0.0 | % | | | - | | | | 0.0 | % | | | - | | | | 0.0 | % | | | 806 | | | | 0.0 | % |
| Government securities - domestic | | | - | | | | | | | | 1,818 | | | | | | | | 9,075 | | | | | | | | 4,155 | | | | | | | | 3,282 | | | | | | | | 18,330 | | | | | |
| Brazilian government securities | | | - | | | | 0.0 | % | | | 1,817 | | | | 10.9 | % | | | 8,965 | | | | 10.8 | % | | | 569 | | | | 9.2 | % | | | 1,073 | | | | 4.9 | % | | | 12,424 | | | | 10.2 | % |
| Brazilian external debt bonds | | | - | | | | 0.0 | % | | | 1 | | | | 8.4 | % | | | 110 | | | | 8.4 | % | | | 3,586 | | | | 7.7 | % | | | 2,209 | | | | 9.3 | % | | | 5,906 | | | | 8.3 | % |
| Government securities - abroad | | | - | | | | | | | | 4,140 | | | | | | | | 155 | | | | | | | | 22 | | | | | | | | - | | | | | | | | 4,317 | | | | | |
| Mexico | | | - | | | | 0.0 | % | | | - | | | | 0.0 | % | | | - | | | | 0.0 | % | | | 11 | | | | 5.1 | % | | | - | | | | 0.0 | % | | | 11 | | | | 5.1 | % |
| Denmark | | | - | | | | 0.0 | % | | | 1,949 | | | | 9.0 | % | | | - | | | | 0.0 | % | | | - | | | | 0.0 | % | | | - | | | | 0.0 | % | | | 1,949 | | | | 9.0 | % |
| Spain | | | - | | | | 0.0 | % | | | 418 | | | | 10.2 | % | | | - | | | | 0.0 | % | | | - | | | | 0.0 | % | | | - | | | | 0.0 | % | | | 418 | | | | 10.2 | % |
| Korea | | | - | | | | 0.0 | % | | | 295 | | | | 10.5 | % | | | - | | | | 0.0 | % | | | - | | | | 0.0 | % | | | - | | | | 0.0 | % | | | 295 | | | | 10.5 | % |
| Chile | | | - | | | | 0.0 | % | | | 939 | | | | 3.7 | % | | | 46 | | | | 3.0 | % | | | 10 | | | | 4.0 | % | | | - | | | | 0.0 | % | | | 995 | | | | 3.7 | % |
| Paraguay | | | - | | | | 0.0 | % | | | 290 | | | | 8.0 | % | | | 54 | | | | 8.1 | % | | | - | | | | 0.0 | % | | | - | | | | 0.0 | % | | | 344 | | | | 8.0 | % |
| Uruguay | | | - | | | | 0.0 | % | | | 212 | | | | 0.1 | % | | | 55 | | | | 0.0 | % | | | 1 | | | | 0.1 | % | | | - | | | | 0.0 | % | | | 268 | | | | 0.1 | % |
| Other | | | - | | | | 0.0 | % | | | 37 | | | | 0.0 | % | | | - | | | | 0.0 | % | | | - | | | | 0.0 | % | | | - | | | | 0.0 | % | | | 37 | | | | 0.0 | % |
| Corporate securities | | | 3,978 | | | | | | | | 3,166 | | | | | | | | 7,807 | | | | | | | | 5,479 | | | | | | | | 3,627 | | | | | | | | 24,057 | | | | | |
| Shares | | | 3,978 | | | | 2.2 | % | | | - | | | | 0.0 | % | | | - | | | | 0.0 | % | | | - | | | | 0.0 | % | | | - | | | | 0.0 | % | | | 3,978 | | | | 2.2 | % |
| Securitized real estate loans | | | - | | | | 0.0 | % | | | 513 | | | | 0.1 | % | | | 2,371 | | | | 0.2 | % | | | 1,918 | | | | 0.6 | % | | | 3,212 | | | | 0.7 | % | | | 8,014 | | | | 0.5 | % |
| Bank deposit certificates | | | - | | | | 0.0 | % | | | 274 | | | | 1.4 | % | | | - | | | | 0.0 | % | | | - | | | | 0.0 | % | | | - | | | | 0.0 | % | | | 274 | | | | 1.4 | % |
| Debentures | | | - | | | | 0.0 | % | | | 466 | | | | 3.3 | % | | | 3,945 | | | | 2.8 | % | | | 2,482 | | | | 3.9 | % | | | 343 | | | | 6.8 | % | | | 7,236 | | | | 3.4 | % |
| Eurobonds and others | | | - | | | | 0.0 | % | | | 1,149 | | | | 3.4 | % | | | 1,358 | | | | 5.7 | % | | | 1,059 | | | | 6.9 | % | | | 72 | | | | 5.9 | % | | | 3,638 | | | | 5.3 | % |
| Promissory notes | | | - | | | | 0.0 | % | | | 646 | | | | 2.4 | % | | | - | | | | 0.0 | % | | | - | | | | 0.0 | % | | | - | | | | 0.0 | % | | | 646 | | | | 2.4 | % |
| Other | | | - | | | | 0.0 | % | | | 118 | | | | 14.2 | % | | | 133 | | | | 9.7 | % | | | 20 | | | | 0.0 | % | | | - | | | | 0.0 | % | | | 271 | | | | 10.9 | % |
| Held-to-maturity financial assets, at amortized cost | | | - | | | | | | | | 120 | | | | | | | | 242 | | | | | | | | 1,077 | | | | | | | | 1,666 | | | | | | | | 3,105 | | | | | |
| Government securities - domestic | | | - | | | | | | | | 87 | | | | | | | | 185 | | | | | | | | 1,077 | | | | | | | | 1,659 | | | | | | | | 3,008 | | | | | |
| Brazilian government securities | | | - | | | | 0.0 | % | | | - | | | | 0.0 | % | | | 76 | | | | 6.0 | % | | | 1,077 | | | | 0.0 | % | | | 1,659 | | | | 0.0 | % | | | 2,812 | | | | 0.2 | % |
| Brazilian external debt bonds | | | - | | | | 0.0 | % | | | 87 | | | | 11.0 | % | | | 109 | | | | 8.6 | % | | | - | | | | 0.0 | % | | | - | | | | 0.0 | % | | | 196 | | | | 9.6 | % |
| Corporate securities | | | - | | | | | | | | 33 | | | | | | | | 57 | | | | | | | | - | | | | | | | | 7 | | | | | | | | 97 | | | | | |
| Debentures | | | - | | | | 0.0 | % | | | 30 | | | | 3.6 | % | | | - | | | | 0.0 | % | | | - | | | | 0.0 | % | | | - | | | | 0.0 | % | | | 30 | | | | 3.6 | % |
| Eurobonds and others | | | - | | | | 0.0 | % | | | 1 | | | | 7.7 | % | | | 57 | | | | 8.7 | % | | | - | | | | 0.0 | % | | | 7 | | | | 7.9 | % | | | 65 | | | | 8.6 | % |
| Securitized real estate loans | | | - | | | | 0.0 | % | | | 2 | | | | 0.0 | % | | | - | | | | 0.0 | % | | | - | | | | 0.0 | % | | | - | | | | 0.0 | % | | | 2 | | | | 0.0 | % |
(1) Average yields are not shown for these securities, as such yields are not meaningful because future yields are not quantifiable. These securities have been excluded from the calculation of the total yield.
The following table sets forth our securities and derivative portfolio by currency as of December 31, 2011 and 2010.
| (in millions of R$) | |
| | | Fair Value | | | Amortized cost | | | | |
| | | Financial assets
held for trading | | | Financial assets
designated at fair
value | | | Derivatives | | | Available-for-sale
financial assets | | | Held-to-maturity
financial assets | | | Total | |
| As of December 31, 2011 | | | 121,889 | | | | 186 | | | | 8,754 | | | | 47,510 | | | | 3,105 | | | | 181,444 | |
| Denominated in Brazilian currency | | | 108,755 | | | | - | | | | 8,655 | | | | 37,670 | | | | 2,823 | | | | 157,903 | |
| Denominated in Brazilian currency and indexed by foreign currency (1) | | | 12,602 | | | | - | | | | - | | | | 5,690 | | | | 282 | | | | 18,574 | |
| Denominated in foreign currency (1) | | | 532 | | | | 186 | | | | 99 | | | | 4,150 | | | | - | | | | 4,967 | |
| | | | | | | | | | | | | | | | | | | | | | | | | |
| As of December 31, 2010 | | | 115,497 | | | | 306 | | | | 7,777 | | | | 44,539 | | | | 3,170 | | | | 171,289 | |
| Denominated in Brazilian currency | | | 95,805 | | | | - | | | | 7,777 | | | | 33,428 | | | | 2,834 | | | | 139,844 | |
| Denominated in Brazilian currency and indexed by foreign currency(1) | | | 8,879 | | | | - | | | | - | | | | 5,073 | | | | 313 | | | | 14,265 | |
| Denominated in foreign currency (1) | | | 10,813 | | | | 306 | | | | - | | | | 6,038 | | | | 23 | | | | 17,180 | |
(1) Predominantly U.S. dollar.
The following table sets forth our securities portfolio by currency, calculated in accordance with U.S. GAAP, as of December 31, 2009.
| (in millions of R$) | |
| | | U.S. GAAP | |
| | | Fair
value | | | Amortized cost | | | | |
| | | Trading assets (1) | | | Securities
available for sale | | | Held-to-maturity securities | | | Total | |
| As of December 31, 2009 | | | | | | | | | | | | | | | | |
| Denominated in Brazilian currency | | | 67,748 | | | | 33,073 | | | | 1,264 | | | | 102,085 | |
| Denominated in Brazilian currency and indexed by foreign currency(2) | | | 474 | | | | 1,685 | | | | 60 | | | | 2,219 | |
| Denominated in foreign currency(2) | | | 5,307 | | | | 6,505 | | | | 438 | | | | 12,250 | |
(1)Includes derivative financial instruments.
(2) Predominantly U.S. dollar.
Central Bank Compulsory Deposits
We are required to either maintain certain deposits with the Central Bank or to purchase and hold federal government securities as compulsory deposits. The following table shows the amounts of these deposits as of December 31, 2011 and 2010.
| (in millions of R$, except percentages) | |
| | | 2011 | | | 2010 | |
| | | R$ | | | % of total
Compulsory
deposits | | | R$ | | | % of total
Compulsory
deposits | |
| Non-interest bearing deposits(1) | | | 5,730 | | | | 5.8 | % | | | 4,742 | | | | 5.5 | % |
| Interest-bearing deposits (2) | | | 92,323 | | | | 94.2 | % | | | 81,034 | | | | 94.5 | % |
| Total | | | 98,053 | | | | 100.0 | % | | | 85,776 | | | | 100.0 | % |
(1)Mainly related to demand deposits.
(2)Mainly related to time and savings deposits.
We are required to either maintain certain deposits with the Central Bank or to purchase and hold federal government securities as compulsory deposits. The following table shows the amounts of these deposits, calculated in accordance with U.S. GAAP, as of December 31, 2009.
| (in millions of R$, except percentages) | |
| | | U.S. GAAP | |
| | | 2009 | |
| | | R$ | | | % of total
compulsory
deposits | |
| Non-interest earning (1) | | | 4,042 | | | | 29.1 | % |
| Interest-earning (2) | | | 9,827 | | | | 70.9 | % |
| Total | | | 13,869 | | | | 100.0 | % |
(1) Mainly related to demand deposits.
(2)Mainly related to time and savings deposits.
Loan and Lease Operations
The following table presents our loan and lease portfolio by category of transaction. Substantially all of our loans are to borrowers domiciled in Brazil and are denominated inreais. Additionally, the majority of our loan portfolio is indexed to Brazilian base interest rates or to the U.S. dollar.
| (in millions of R$) | |
| | 2011 | | | 2010 | |
| Loan and Lease Operations, by type(1) | | Loan | | | Allowance | | | Loan | | | Allowance | |
| Individuals | | | 148,127 | | | | 13,629 | | | | 124,787 | | | | 10,619 | |
| Credit card | | | 38,961 | | | | 3,825 | | | | 33,041 | | | | 3,306 | |
| Personal loans | | | 35,253 | | | | 5,343 | | | | 23,528 | | | | 3,492 | |
| Vehicles | | | 60,463 | | | | 4,415 | | | | 60,151 | | | | 3,709 | |
| Mortgage loans | | | 13,450 | | | | 46 | | | | 8,067 | | | | 112 | |
| | | | | | | | | | | | | | | | | |
| Corporate | | | 93,229 | | | | 758 | | | | 76,583 | | | | 1,071 | |
| | | | | | | | | | | | | | | | | |
| Small and Medium Businesses | | | 85,649 | | | | 9,197 | | | | 79,950 | | | | 8,041 | |
| | | | | | | | | | | | | | | | | |
| Foreign Loans Latin America | | | 19,259 | | | | 289 | | | | 13,517 | | | | 263 | |
| | | | | | | | | | | | | | | | | |
| Total loans and advances to clients | | | 346,264 | | | | 23,873 | | | | 294,837 | | | | 19,994 | |
(1)We consider all loans and leases more than 60 days overdue as non-accrual loans and we discontinue accruing financial income related to them. The contractual amount of non-accrual loans was R$20,439 million and R$14,736 million as of December 31, 2011 and 2010, respectively. Non-accrual loans are presented in the table above in the appropriate category of loan and lease. The interest income foregone on our non-accrual loans for 2011 and 2010 was R$2,865 million and R$2,393 million respectively.
- The Individuals portfolio consists primarily of vehicle financing to individuals, credit card, personal loans (including mainly consumer finance and overdrafts) and residential mortgage loans.
- The Corporate portfolio consists primarily of loans made to large corporate clients.
- The Small and Medium Businesses portfolio consists primarily of loans to small and medium-sized companies.
- The Foreign Loans Latin America portfolio consists primarily of loans granted by our operations in Argentina, Chile, Paraguay and Uruguay, primarily to individuals.
With respect to loans which are not considered either impaired or non-accural and that have not been renegotiated, as of December 31, 2011, we are not aware of any information about borrowers’ credit problems that could cause us to have serious doubts as to the ability of such borrowers to pay us.
The following table presents our loan and lease portfolio by category of transaction, calculated in accordance with U.S. GAAP. The vast majority of our loans are to borrowers domiciled in Brazil and are denominated inreais. Additionally, the majority of our loan portfolio is indexed to Brazilian base interest rates or to the U.S. dollar.
| (in millions of R$) | |
| | | U.S. GAAP | |
| | | 2009 | | | 2008 | | | 2007 | |
| Type of loans and leases(1) | | | | | | | | | | | | |
| Commercial: | | | | | | | | | | | | |
| Industrial and others | | | 104,505 | | | | 64,952 | | | | 40,991 | |
| Import financing | | | 1,895 | | | | 3,643 | | | | 1,287 | |
| Export financing | | | 6,823 | | | | 9,746 | | | | 3,257 | |
| Real estate loans (primarily residential housing loans) | | | 10,939 | | | | 6,469 | | | | 4,732 | |
| Lease financing (primarily vehicle financing) | | | 47,230 | | | | 41,663 | | | | 29,531 | |
| Public sector (domestic) | | | 1,611 | | | | 759 | | | | 827 | |
| Individuals: | | | | | | | | | | | | |
| Overdraft | | | 4,119 | | | | 3,544 | | | | 2,768 | |
| Consumer finance operations | | | 32,701 | | | | 20,272 | | | | 18,023 | |
| Credit card | | | 30,781 | | | | 14,288 | | | | 11,391 | |
| Agricultural | | | 5,132 | | | | 4,364 | | | | 3,652 | |
| Allowance for loan and lease losses | | | (19,968 | ) | | | (12,202 | ) | | | (7,473 | ) |
| Loans, net of allowance for loan and lease losses | | | 225,768 | | | | 157,498 | | | | 108,986 | |
(1)The contractual amount of non-accrual loans was R$15,499 million, R$7,579 million and R$4,777 million as of December 31, 2009, 2008 and 2007, respectively. The interest income foregone on our non-accrual loans for 2009, 2008 and 2007 was R$1,564 million, R$1,265 million and R$939 million respectively.
- The Commercial portfolio consists primarily of short-term loans as well as medium-term loans and financing for large, medium, and small companies. We also act as a financial agent for the Brazilian government through BNDES and its affiliates for the onlending of money to target groups of private sector borrowers. Our trade financing activities focus on export, pre-export and import financing.
- The Real estate portfolio consists primarily of loans for the construction, refurbishment, extension and acquisition of homes. We fund real estate loans primarily from Central Bank mandated portions of our savings account deposits. We extended real estate loans principally to retail bank customers to finance home acquisitions. Maturity is generally limited to 15 years.
- The Lease financing portfolio consists primarily of automobiles leased to individuals and machinery and equipment leased to corporate and middle market borrowers. We are a major participant in the Brazilian leasing market through our subsidiary, Itauleasing.
- The Public sector portfolio consists primarily of loans to federal government, state and municipal entities.
- The Individuals portfolio consists primarily of providing individual customers with three main credit products: overdraft accounts, consumer finance operations and credit card. In addition, we are one of the largest issuers of credit cards in Brazil under the Itaucard brand.
- The Agricultural portfolio consists primarily of obtaning funding for our Agricultural loans from Central Bank mandated portions of our deposit base. We extend agricultural loans principally to agro-industrial borrowers.
Loan Approval Process
Our management seeks to optimize the relationship between risk and return of assets, maintaining the quality of credit financial instruments at an acceptable level in the market segments in which we operate. Both our accepted risk levels and return objectives are set for each of our credit areas, and interest rates applicable to each transaction are defined through models of risk-adjusted pricing.
Our credit policies are defined and reviewed considering internal and external factors. Internal factors include the criteria for classification of customers; analysis of portfolio evolution, observed delinquency levels, observed rates of return, portfolio quality and allocation of economic capital. External factors are related to the economic environment in Brazil and abroad, and factors such as market share, interest rates, and indicators of market default, inflation and increase (or decrease) in consumer spending.
Our decision-making process and our process for setting credit policy is structured to ensure alignment of credit approvals with the optimization of business opportunities, and this process is managed by our credit committees. For retail credit transactions, decisions regarding granting and management of credit portfolio are made based on credit score models that are continuously monitored by us. For Corporate credit transactions, our various committees are subordinated to the Superior Credit Committee responsible for managing credit risk and the various authority levels within our risk management structure ensure detailed monitoring of the risk of credit transactions as well as the necessary timing and flexibility in our approval processes. For a discussion of our credit committee structure, see “Item 4B. Business Overview— Credit Risk Management”.
Credit Cards
Granting of credit cards is based mainly on each customer’s level of income and score models. Through these models, we define which customers will receive credit offers and the conditions under which they receive offers. We also look to each customer’s monthly income to establish monthly credit limits.
Personal Loans
Granting of credit to our account holder customers is based mainly on their level of income (whether self-reported or estimated according to internal methodologies) and our customer internal credit score determined based on statistical models of behavior and credit score. Through these models and the observation of several financial indicators, we define which customers will receive credit offers and in what amount. According to their credit score, we define the maximum number of installments, interest rates (which are fixed) and the maximum percentage of the monthly installment with respect to monthly income. Based on these limits, customers choose the amount and terms that best meet their needs. We do not require collateral from the majority of our customers. We require the following documents during the credit granting process: personal identification, tax identification number, proof of income and proof of residential address.
Vehicles
Our vehicle financing applications are originated in multi-brand car dealers or official brand car dealers and subject to “filters” to reject those from customers with serious indications of credit default or indications of fraud. Subsequently, a score is calculated internally for the loan requested, which takes into consideration the internal credit score of the customer and the terms of the proposed transaction. Applications with scores below an established cutoff level are automatically rejected. Applications with high credit scores and for which personal information is validated by our credit bureaus are automatically approved. The process of consulting with credit bureau is similar to the process described under “Real Estate” above. Applications that are not automatically approved also go through individual reviews by our credit approval desk. The maximum maturity is determined based on the age of the vehicle. Our credit policy also defines maximum ratio of lease payments to income and maximum LTV ratio, which may not exceed 100% at the date credit is granted.
Interest rates are generally fixed. Interest rates vary from customer to customer depending on factors such as the department through which the loan is made, maturity and the age of the vehicle acquired and a spread which is defined for each individual contract based on our RAROC (Risk Adjusted Return on Capital) analysis.
Mortgage loans
The mortgage application is originated by Internet, telephone, real estate brokers or by our branch network. A client score is calculated internally based on credit score models. Applications with score below an established cutoff level are automatically rejected (such as applications rejected due to serious indications of credit default and/or score may be exceptionally approved by the appropriate credit committee). Applications with high credit scores and for which no significant negative information is provided by credit bureaus are automatically approved. A request of information made to credit bureaus has the purpose of verifying whether the applicant’s history shows anything that we would consider an impediment to grant loans (applicants with assets blocked in court, applicants who provided invalid tax identification number), or that would effectively restrict the granting of a loan (e.g., customers who have entered into debt restructuring or renegotiation or have issued checks with insufficient funds) or other information (e.g., customers under other types of judicial debt restructuring). In Brazil, credit bureaus do not provide score information or general credit history but rather only information with respect to default and other negative events. If, as result of information provided by a credit bureau, we identify an impediment or suspect fraud exists (e.g., cases where the telephone number provided by the applicant matches the number of another existing client in our files or if last name provided by the applicant does not match the last name provided by the credit bureau), the proposals are individually reviewed by one of our credit approval desks. If there is additional relevant positive information (such as acceptable evidence of current funds or income or there is evidence that any negative information obtained results from isolated events), the application may be approved by the one of our credit desks or by our Real Estate Credit Committee, even if the credit score is below the cutoff threshold we have established. The volume and the observed levels of default associated with credit approved in this manner are monitored so we can control the quality of our lending practices. Our credit policy also defines maximum maturity, maximum ratio of mortgage installment to income and maximum loan-to-value (“LTV”) ratio, which may not exceed 85% at the date the loan is granted. Interest rates are established based on the “TR” rate (a Brazilian interest rate that represents the interest rate of saving deposits) plus a fixed spread defined for each individual contract based on our RAROC (Risk Adjusted Return on Capital) analysis.
In the corporate segment, credit committees periodically evaluate customer data, analyzing several material aspects for determining credit ratings and credit limits to be applied to each customer. In addition, all corporate customers shall be subject to KYC (know-your-customer) procedures.
Our various credit committees are subordinated to the Superior Credit Committee responsible for managing credit risk and the various authority levels within our risk management structure ensure detailed monitoring of the risk of credit transactions as well as the necessary timing and flexibility in our approval processes.
Much of the credit for companies requires guarantees. Transactions to finance the production of goods usually require machinery and equipment as collateral. Financing for working capital might be guaranteed by trade receivables, check receivables or credit card receivables or is guaranteed by the company's partners or shareholders and/or by third parties. Investment transactions, on the other hand, typically require insurance or mortgage liens but may also include liens on acceptable investments, fund shares, debt securities and other instruments.
| III. | Small and medium businesses |
We grant credit to companies on the condition that they open a current account with us, a process which includes review of company documents and implementation of KYC procedures. For each client, we determine a maximum credit amount to be granted. This limit is determined based on our internal customer classification (based on credit score and history) and the level of average monthly earnings of the company. Billing information may be provided by the company or estimated by us based on internal methods. Our internal customer classification determines a maximum level of indebtedness, maximum credit to be granted, interest rates (substantially fixed rates), maximum ratio of the monthly installment to the company’s profits and the amount and type of guarantees required. Similar to the corporate segment, the majority of the portfolio is guaranteed by receivables within the retail sector and by goods in the case of financing.
| IV. | Foreign Loans Latin America |
Granting of credit in our subsidiaries in Latin America follows the same corporate governance and the policies established by Itaú Unibanco Holding. All subsidiaries are subject to a centralized management that monitors the performance of our portfolio, establishes the rules for granting of credit and is responsible for the corporate governance related to granting of credit within Itaú Unibanco Holding.
The Individuals and Corporate units within our Foreign Loans Latin America segment follow similar procedures as the Individuals and Corporate segments discussed above. For the Individuals unit, granting of credit is based on mainly on each customer’s level of income and score models. For the Corporate unit, granting of credit is based on an evaluation of customer data and KYC procedures. Credit analysis is made after analysis of such information and credit limits are approved according to the guidelines established by the risk management structure. Such guidelines depend upon the size and the needs of each of the subsidiaries, but are subordinate to the guidelines established by the credit committees within Itaú Unibanco Holding.
Indexing
Most of our portfolio is denominated inreais. However, a portion of our portfolio is indexed to foreign currencies, primarily the U.S. dollar. The foreign currency portion of our portfolio consists of loans and financing for foreign trade and onlending operations. Our loans indexed to foreign currencies or denominated in U.S. dollars represented 22.1% and 19.7% of our loan portfolio as of December 31, 2011 and 2010, respectively.
Our loans indexed to foreign currencies or denominated in U.S. dollars represented 13.7% of our loan portfolio as of December 31, 2009, calculated in accordance with U.S. GAAP.
Loans and Leases – Maturity and Interest Rates
The following tables present an analysis of the distribution of our loan and lease portfolio as of December 31, 2011 by maturity according to the type of loan and lease, as well as the classification of the portfolio between variable and fixed rates for each range of maturity. The values are secreted by overdue and non-overdue loans and are considered contractual values.
| Non-Overdue |
| | | | | | | | | | | | | | | | | | | | | | |
| | | | | | | | | | | | | | | | | | (in millions of R$) | |
| | | | | | | | | | | | | | | Due in one | | | | | | Total Non- | |
| | | Due in 30 | | | Due in 31- | | | Due in 91- | | | Due in 181- | | | year to five | | | Due after | | | Overdue | |
| Type of loan and lease | | days or less | | | 90 days | | | 180 days | | | 360 days | | | years | | | five years | | | Loans | |
| Individuals | | | | | | | | | | | | | | | | | | | | | | | | | | | | |
| Credit card | | | 15,187 | | | | 11,112 | | | | 5,740 | | | | 2,650 | | | | 81 | | | | - | | | | 34,770 | |
| Personal loan | | | 5,325 | | | | 2,629 | | | | 3,340 | | | | 5,469 | | | | 15,642 | | | | 440 | | | | 32,845 | |
| Vehicles | | | 2,071 | | | | 3,781 | | | | 5,385 | | | | 10,515 | | | | 37,050 | | | | 23 | | | | 58,825 | |
| Mortgage loans | | | 139 | | | | 186 | | | | 233 | | | | 501 | | | | 3,388 | | | | 8,961 | | | | 13,408 | |
| | | | | | | | | | | | | | | | | | | | | | | | | | | | | |
| Corporate | | | 7,384 | | | | 11,539 | | | | 11,016 | | | | 13,965 | | | | 40,792 | | | | 7,867 | | | | 92,563 | |
| | | | | | | | | | | | | | | | | | | | | | | | | | | | | |
| Small and Medium Businesses | | | 16,829 | | | | 12,532 | | | | 9,592 | | | | 14,289 | | | | 27,303 | | | | 309 | | | | 80,854 | |
| | | | | | | | | | | | | | | | | | | | | | | | | | | | | |
| Foreign Loans Latin America | | | 2,502 | | | | 4,233 | | | | 1,559 | | | | 1,184 | | | | 3,572 | | | | 5,070 | | | | 18,120 | |
| | | | | | | | | | | | | | | | | | | | | | | | | | | | | |
| Total (1) | | | 49,437 | | | | 46,012 | | | | 36,865 | | | | 48,573 | | | | 127,828 | | | | 22,670 | | | | 331,385 | |
(1)Non-accrual loans of R$20,439 million are presented in the table above in the appropriate category. Non-accrual loans include in the case of loans payable in installments both current and past due installments.
| Overdue(2) |
| (in millions of R$) | |
| | | | | | | | | | | | | | | | | | | | | | | | Allowance | | | | |
| | | | | | | | | | | | 91-180 | | | 181-360 | | | One year | | | Total gross | | | for loan | | | | |
| Type of loan and lease | | 01-30 days | | | 31-60 days | | | 61-90 days | | | days | | | days | | | or more | | | loans | | | losses | | | Total net | |
| Individuals | | | | | | | | | | | | | | | | | | | | | | | | | | | | | | | | | | | | |
| Credit card | | | 608 | | | | 256 | | | | 370 | | | | 1,062 | | | | 1,780 | | | | 115 | | | | 38,961 | | | | (3,825 | ) | | | 35,136 | |
| Personal loan | | | 518 | | | | 327 | | | | 348 | | | | 630 | | | | 583 | | | | 2 | | | | 35,253 | | | | (5,343 | ) | | | 29,910 | |
| Vehicles | | | 587 | | | | 255 | | | | 150 | | | | 292 | | | | 287 | | | | 67 | | | | 60,463 | | | | (4,415 | ) | | | 56,048 | |
| Mortgage loans | | | 17 | | | | 7 | | | | 3 | | | | 5 | | | | 6 | | | | 4 | | | | 13,450 | | | | (46 | ) | | | 13,404 | |
| | | | | | | | | | | | | | | | | | | | | | | | | | | | | | | | | | | | | |
| Corporate | | | 444 | | | | 74 | | | | 60 | | | | 54 | | | | 34 | | | | - | | | | 93,229 | | | | (758 | ) | | | 92,471 | |
| | | | | | | | | | | | | | | | | | | | | | | | | | | | | | | | | | | | | |
| Small and Medium Businesses | | | 950 | | | | 524 | | | | 454 | | | | 1,182 | | | | 1,668 | | | | 17 | | | | 85,649 | | | | (9,197 | ) | | | 76,452 | |
| | | | | | | | | | | | | | | | | | | | | | | | | | | | | | | | | | | | | |
| Foreign Loans Latin America | | | 1,065 | | | | 27 | | | | 16 | | | | 15 | | | | 15 | | | | 1 | | | | 19,259 | | | | (289 | ) | | | 18,970 | |
| | | | | | | | | | | | | | | | | | | | | | | | | | | | | | | | | | | | | |
| Total (1) | | | 4,189 | | | | 1,470 | | | | 1,401 | | | | 3,240 | | | | 4,373 | | | | 206 | | | | 346,264 | | | | (23,873 | ) | | | 322,391 | |
(1) Non-accrual loans of R$20,439 million are presented in the table above in the appropriate category. Non-accrual loans include, in the case of loans payable in installments, both current and past due installments.
(2) Defined as loans and leases contractually past due as to payment of interest or principal.
| Non-Overdue |
| (in millions of R$) | |
| | | | | | | | | | | | | | | Due in one | | | | | | Total Non- | |
| | | Due in 30 | | | Due in 31-90 | | | Due in 91- | | | Due in 181- | | | year to five | | | Due after | | | Overdue | |
| | | days or less | | | days | | | 180 days | | | 360 days | | | years | | | five years | | | Loans | |
| Interest rate of loans to customers by maturity: | | | | | | | | | | | | | |
| Variable rates | | | 43,053 | | | | 31,742 | | | | 26,772 | | | | 36,517 | | | | 82,432 | | | | 1,495 | | | | 222,011 | |
| Fixed rates | | | 6,384 | | | | 14,270 | | | | 10,093 | | | | 12,056 | | | | 45,396 | | | | 21,175 | | | | 109,374 | |
| Total(1) | | | 49,437 | | | | 46,012 | | | | 36,865 | | | | 48,573 | | | | 127,828 | | | | 22,670 | | | | 331,385 | |
(1) Non-accrual loans of R$20,439 million are presented in the table above in the appropriate category. Non-accrual loans include, in the case of loans payable in installments, both current and past due installments.
| Overdue(2) |
| (in millions of R$) | |
| | | | | | | | | | | | | | | | | | One year or | | | Total gross | |
| | | 01-30 days | | | 31-60 days | | | 61-90 days | | | 91-180 days | | | 181-360 days | | | more | | | loans | |
| Interest rate of loans to customers by maturity: |
| Variable rates | | | 2,923 | | | | 1,350 | | | | 1,326 | | | | 3,166 | | | | 4,282 | | | | 200 | | | | 235,259 | |
| Fixed rates | | | 1,266 | | | | 120 | | | | 75 | | | | 74 | | | | 91 | | | | 6 | | | | 111,005 | |
| Total(1) | | | 4,189 | | | | 1,470 | | | | 1,401 | | | | 3,240 | | | | 4,373 | | | | 206 | | | | 346,264 | |
(1) Non-accrual loans of R$20,439 million are presented in the table above in the appropriate category. Non-accrual loans include, in the case of loans payable in installments, both current and past due installments.
(2) Defined as loans and leases contractually past due as to payment of interest or principal.
Cross-Border Outstandings
Loans outstanding to foreign borrowers exceeded 1% of total assets in the case of foreign borrowers from our subsidiaries and branches in Argentina, Chile, Paraguay, Uruguay and Europe. Total amount outstanding to such borrowers consisting of loans and leases, deposits in banks and securities, as of December 31, 2011 was R$39,596 million. The amounts have been translated intoreais from their original amounts in foreign currencies (Argentine pesos, Chilean pesos, Paraguayan guaranis, U.S. dollars, euros, Swiss francs and Uruguayan pesos, as appropriate) using the exchange rate at each date.
Total cross-border outstanding amounts to countries listed above, as of December 31, 2011 and 2010 consisted of:
| (in millions of R$, except percentages) | |
| | | 2011 | | | % | | | 2010 | | | % | |
| Cash and deposits on demand | | | 2,753 | | | | 7.0 | | | | 2,097 | | | | 6.9 | |
| Interbank deposits | | | 3,719 | | | | 9.4 | | | | 4,112 | | | | 13.6 | |
| Securities purchased under agreements to resell | | | 127 | | | | 0.3 | | | | 109 | | | | 0.4 | |
| Central Bank compulsory deposits | | | 2,111 | | | | 5.3 | | | | 906 | | | | 3.0 | |
| Financial assets held for trading | | | 1,127 | | | | 2.8 | | | | 1,536 | | | | 5.1 | |
| Derivatives | | | 1,067 | | | | 2.7 | | | | 377 | | | | 1.2 | |
| Available-for-sale financial assets | | | 2,309 | | | | 5.8 | | | | 2,615 | | | | 8.6 | |
| Loan and lease operations | | | 26,383 | | | | 66.6 | | | | 18,552 | | | | 61.2 | |
| Total outstandings | | | 39,596 | | | | 100.0 | | | | 30,304 | | | | 100.0 | |
Total cross-border outstanding amounts to countries listed above, calculated in accordance with U.S. GAAP, as of December 31, 2009, consisted of:
| (in millions of R$) | |
| | | U.S.GAAP | |
| | | 2009 | |
| Due from banks | | | 345 | |
| Interest-bearing deposits in other banks | | | 5,722 | |
| Securities purchased under resale agreements | | | 137 | |
| Central Bank compulsory deposits | | | 1,308 | |
| Trading assets | | | 1,782 | |
| Available-for-sale securities | | | 2,782 | |
| Loans and leases | | | 15,813 | |
| Total outstanding | | | 27,889 | |
Loans and Leases by Economic Activity
The following table presents the composition of our loan portfolio, including non-accrual loans, by economic activity of the borrower at each of the dates indicated.
| (in millions of R$, except percentages) | |
| | | 2011 | | | 2010 | |
| | | Loan | | | % of Loan | | | Loan | | | % of Loan | |
| Economic Activities | | portfolio | | | portfolio | | | portfolio | | | portfolio | |
| Public sector | | | 1,990 | | | | 0.6 | % | | | 1,138 | | | | 0.4 | % |
| Industry and commerce | | | 99,859 | | | | 28.8 | % | | | 84,997 | | | | 28.8 | % |
| Services | | | 70,642 | | | | 20.4 | % | | | 60,295 | | | | 20.5 | % |
| Primary sector | | | 16,109 | | | | 4.7 | % | | | 13,933 | | | | 4.7 | % |
| Individuals | | | 156,167 | | | | 45.1 | % | | | 132,289 | | | | 44.9 | % |
| Other sectors | | | 1,497 | | | | 0.4 | % | | | 2,185 | | | | 0.7 | % |
| | | | | | | | | | | | | | | | | |
| TOTAL | | | 346,264 | | | | 100.0 | % | | | 294,837 | | | | 100.0 | % |
As of December 31, 2011, there was no concentration of loans and leases exceeding 10% of total loans and leases not otherwise disclosed on a category of loans and losses.
The following table presents the composition of our credit portfolio, including non-accrual loans, by economic activity of the borrower at each as of December 31, 2009, calculated in accordance with U.S. GAAP.
| (in millions of R$, except percentages) | |
| | | U.S. GAAP | |
| | 2009 | |
| | | Loan | | | % of Loan | |
| Economic Activities | | portfolio | | | portfolio | |
| Public sector | | | 1,611 | | | | 0.7 | % |
| Industry and commerce | | | 67,530 | | | | 27.4 | % |
| Services | | | 48,389 | | | | 19.8 | % |
| Primary sector | | | 13,276 | | | | 5.4 | % |
| Other companies | | | 1,260 | | | | 0.5 | % |
| Individuals | | | 113,670 | | | | 46.3 | % |
| | | | | | | | | |
| TOTAL | | | 245,736 | | | | 100.0 | % |
Rating of the Loan and Lease Portfolio
We present below the classification of our loan and lease portfolio based on probability of default. For corporate clients, the classification is based on information such as the economic and financial condition of the client, its ability to generate cash, the economic group to which it belongs, current economic and financial conditions and prospects for the market in which it operates, the collateral offered and the ultimate purpose of the loans granted. For the remaining clients, the classification is based on statistical models of credit and behavior scoring, as required by Basel II. In certain exceptional circumstances, classification may be based on individualized analyses which are submitted to the appropriate credit committees. The ratings are grouped in four categories: strong, satisfactory, higher risk and impairment.
| (in millions of R$, except percentages) | |
| | | 12/31/2011 | | | 12/31/2010 | |
| | | Loans neither | | | Loans | | | | | | | | | Loans neither | | | Loans | | | | | | | |
| Internal | | overdue nor | | | overdue not | | | Loans | | | | | | overdue nor | | | overdue not | | | Loans | | | Total | |
| Rating | | impaired | | | impaired | | | impaired | | | Totalloans | | | impaired | | | impaired | | | impaired | | | loans | |
| | | | | | | | | | | | | | | | | | | | | | | | | |
| Strong | | 221,315 | | | 5,800 | | | - | | | 227,115 | | | 195,988 | | | 4,346 | | | - | | | 200,334 | |
| Satisfactory | | | 63,763 | | | | 10,921 | | | | - | | | | 74,684 | | | | 52,561 | | | | 8,053 | | | | - | | | | 60,614 | |
| Higher Risk | | | 16,910 | | | | 8,703 | | | | - | | | | 25,613 | | | | 13,663 | | | | 6,348 | | | | - | | | | 20,011 | |
| Impairment | | | - | | | | - | | | | 18,852 | | | | 18,852 | | | | - | | | | - | | | | 13,878 | | | | 13,878 | |
| Total | | | 301,988 | | | | 25,424 | | | | 18,852 | | | | 346,264 | | | | 262,212 | | | | 18,747 | | | | 13,878 | | | | 294,837 | |
| % | | | 87.3 | % | | | 7.3 | % | | | 5.4 | % | | | 100.0 | % | | | 88.9 | % | | | 6.4 | % | | | 4.7 | % | | | 100 | % |
Non-Accrual Loans and Leases
We consider all loans and leases more than 60 days overdue as non-accrual loans and we discontinue accruing financial income related to them the contractual amount of such loans and leases. In 2011, we did not have any individually material non-accrual loans or leases.
Charge-offs
Loans and leases are charged off against the allowance when the loan is not collected or is considered permanently impaired. We normally charge off loans when they become 360 days past due as to principal or interest payments, except for loans with original maturity in excess of 36 months that we charge off when they are overdue 540 days. However, charge-offs may be recognized earlier than 360 days if we conclude that the loan is not recoverable.
Loans and Leases Quality Information
The table below presents our non-accrual loans together with certain asset quality ratios for the years ended December 31, 2011 and 2010.
| (in millions of R$, except percentages) | |
| | | 2011 | | | 2010 | |
| Non-accrual loans | | | 20,439 | | | | 14,736 | |
| Allowance for loan losses | | | 23,873 | | | | 19,994 | |
| Total loans and leases | | | 346,264 | | | | 294,837 | |
| Non-accrual loans as a percentage of total loans | | | 5.9 | % | | | 5.0 | % |
| Allowance for loan losses as a percentage of total loans | | | 6.9 | % | | | 6.8 | % |
| Allowance for loan losses as a percentage of non-accrual loans | | | 116.8 | % | | | 135.7 | % |
The table below presents, calculated in accordance with U.S. GAAP, our non-accrual loans together with certain asset quality ratio for the years ended December 31, 2009, 2008 and 2007.
| (in millions of R$, except percentages) | |
| | | U.S. GAAP | |
| | | 2009 | | | 2008 | | | 2007 | |
| Non-accrual loans and foreclosed assets | | | 15,717 | | | | 7,760 | | | | 5,012 | |
| Non-accrual loans | | | 15,499 | | | | 7,579 | | | | 4,777 | |
| Foreclosed assets, net of reserves | | | 218 | | | | 181 | | | | 235 | |
| Allowance for loan losses | | | 19,968 | | | | 12,202 | | | | 7,473 | |
| Total loans and leases | | | 245,736 | | | | 169,700 | | | | 116,459 | |
| Non-accrual loans as a percentage of total loans | | | 6.3 | % | | | 4.5 | % | | | 4.1 | % |
| Non-accrual loans and foreclosed assets as a percentage of total loans | | | 6.4 | % | | | 4.6 | % | | | 4.3 | % |
| Allowance for loan losses as a percentage of total loans | | | 8.1 | % | | | 7.2 | % | | | 6.4 | % |
| Allowance for loan losses as a percentage of non-accrual loans | | | 128.8 | % | | | 161.0 | % | | | 156.4 | % |
| Allowance for loan losses as a percentage of non-accrual loans and foreclosed assets | | | 127.0 | % | | | 157.2 | % | | | 149.1 | % |
Loan Loss Experience
The table below sets forth the allowance for loan and lease losses for the years ended December 31, 2011 and 2010.
| (in millions of R$, except percentages) | |
| | | 2011 | | | 2010 | |
| Balance at the beginning of period | | | 19,994 | | | | 20,245 | |
| Charge-offs | | | (16,159 | ) | | | (15,798 | ) |
| Individuals | | | | | | | | |
| Credit card | | | (3,558 | ) | | | (2,731 | ) |
| Personal loans | | | (2,959 | ) | | | (3,908 | ) |
| Vehicles | | | (2,041 | ) | | | (2,377 | ) |
| Mortgage loans | | | (73 | ) | | | (75 | ) |
| Corporate | | | (294 | ) | | | (466 | ) |
| Small and Medium Businesses | | | (7,001 | ) | | | (5,793 | ) |
| Foreign Loans Latin America | | | (233 | ) | | | (448 | ) |
| Increase Provision for loan losses | | | 20,038 | | | | 15,547 | |
| Balance at the end of period | | | 23,873 | | | | 19,994 | |
| Recoveries from Loans Writen Off | | | 5,477 | | | | 4,195 | |
| Individuals | | | | | | | | |
| Credit card | | | 616 | | | | 470 | |
| Personal loans | | | 586 | | | | 275 | |
| Vehicles | | | 956 | | | | 856 | |
| Mortgage loans | | | 184 | | | | 174 | |
| Corporate | | | 1,475 | | | | 1,090 | |
| Small and Medium Businesses | | | 1,355 | | | | 1,138 | |
| Foreign Loans Latin America | | | 305 | | | | 192 | |
| Net charge-offs | | | (10,682 | ) | | | (11,603 | ) |
| Ratio of charge-offs during the period to average loans outstanding during the period | | | 5.1 | % | | | 5.9 | % |
| Ratio of net charge-offs during the period to average loans outstanding during the period | | | 3.3 | % | | | 4.3 | % |
| Ratio of allowance for loan losses to total loans and leases | | | 6.9 | % | | | 6.8 | % |
The table below sets forth our provision for loan and lease losses, charge-offs and recoveries included in our result of operations for the years ended December 31, 2011 and 2010.
| (in millions of R$, except percentages) | |
| | | 2011 | | | 2010 | | | 2011/2010 | |
| Provision for loan and lease losses | | | (20,038 | ) | | | (15,547 | ) | | | 28.9 | % |
| Loan charge-offs | | | (16,159 | ) | | | (15,798 | ) | | | 2.3 | % |
| Loan recoveries | | | 5,477 | | | | 4,195 | | | | 30.6 | % |
| Net charge-offs | | | (10,682 | ) | | | (11,603 | ) | | | (7.9 | )% |
Itaú Unibanco Holding periodically assesses whether there is any objective evidence that a receivable or group of receivables is impaired. A receivable or group of receivables is impaired and there is a need for recognizing an impairment loss if there is objective evidence of impairment as a result of one or more events that occurred after the initial recognition of the asset (a “loss event”) and that loss event (or events) has an impact on the estimated future cash flows that can be reliably estimated.
The allowance for loan losses is recognized for probable losses inherent in the portfolio at the balance sheet date. The determination of the level of the allowance rests upon various judgments and assumptions, including current economic conditions, loan portfolio composition, prior loan and lease loss experience and evaluation of credit risk related to individual loans. Our process for determining the allowance for loan losses includes management's judgment and the use of estimates. The adequacy of the allowance is regularly analyzed by management.
Our criteria adopted for determining whether there is objective evidence of impairment include the following:
| • | default in principal or interest payment; |
| • | financial difficulties of the debtor and other objective evidence that results in the deterioration of the financial position of the debtor (for example, debt-to-equity ratio, percentage of net sales or other indicators obtained through processes adopted to monitor credit, particularly for retail portfolios); |
| • | breach of loan clauses or terms; |
| • | entering into bankruptcy; and |
| • | loss of competitive position of the debtor. |
The estimated period between the loss event and its identification is defined by management for each identified portfolio of similar receivables. The periods adopted by management are of twelve months, considering that the observed period for homogenous receivables portfolios vary, depending upon the specific portfolio, between nine and twelve months. We have determined the period between the loss events and their identification for receivables individually tested for impairment is also twelve months.
Assessment
We first assess whether objective evidence of impairment exists for receivables that are individually significant, and individually or collectively for receivables that are not individually significant. To determine the amount of the allowance for individually significant receivables with objective evidence of impairment, we use methodologies that consider both the quality of the client and the nature of the transaction, including its collateral, to estimate the cash flows expected from these loans.
If no objective evidence of impairment exists for an individually assessed receivable, whether significant or not, the asset is included in a group of receivables with similar credit risk characteristics and such group is collectively assessed for impairment. Receivables that are individually assessed for impairment and for which an impairment loss is recognized are not included in the collective assessment. The amount of loss is measured as the difference between the asset’s carrying amount and the present value of estimated future cash flows (excluding future credit losses that have not been incurred) discounted at the financial asset’s original effective interest rate.
For collectively assessed loans, the calculation of the present value of the estimated future cash flows for which there is collateral reflects the historical performance of the foreclosure and recovery of fair value, considering the cash flows that may arise from foreclosure less costs for obtaining and selling that collateral.
For the purpose of a collective evaluation of impairment, receivables are grouped on the basis of similar credit risk characteristics. The characteristics are relevant to the estimation of future cash flows for such receivables by being indicative of the debtors’ ability to pay all amounts due, according to the contractual terms of the receivables being evaluated. Future cash flows in a group of receivables that are collectively evaluated for purposes of identifying the need for recognizing impairment are estimated on the basis of the contractual cash flows of the group of receivables and the historical loss experience for receivables with similar credit risk characteristics. The historical loss experience is adjusted on the basis of current observable data to reflect the effects of current conditions that did not affect the period on which the historical loss experience is based and to remove the effects of conditions in the historical period that do not exist currently.
For individually significant receivables with no objective evidence of impairment, these loans are classified into certain rating categories based on several qualitative and quantitative factors applied through internally developed models. Considering the size and the different risk characteristics of each contract, the rating category determined according to internal models may be reviewed and modified by our Corporate Credit Committee, the members of which are executives and experts in corporate credit risk. We estimate inherent losses for each rating category considering an internally developed approach for low-default portfolios, that uses our historical experience for building internal models, that are used both to estimate the probability of default (“PD”) and to estimate the loss given default (“LGD”).
To determine the amount of the allowance for individually non-significant items, loans are segregated into classes considering the underlying risks and characteristics of each group. The allowance for loan losses is determined for each of those classes through a process that considers historical delinquency and loan loss experience over the most recent years.
During the year ended December 31, 2011, we charged off loans and leases in the total amount of R$16,159 million and as of December 31, 2011 our ratio of allowances for loan and lease losses to total loans and leases was 6.9%. Our ratio of allowances for loan and lease losses to total loans and leases increased by 0.1 percentage points compared to the previous year, as we continue to provide for loans and leases in 2011 as a result of increased delinquency in 2009 and 2010, combined with the strong growth of our loan and lease portfolio in 2011.
During the year ended December 31, 2010, we charged off loans and leases in the total amount of R$15,798 million and as of December 31, 2010 our ratio of allowances for loan and lease losses to total loans and leases was 6.8%. The increase in the volume of loans and leases written off in 2010 was a result of increased delinquency in 2009 combined with the strong growth of our loan and lease portfolio.
The table below sets forth allowance for loan and lease losses, calculated in accordance with U.S. GAAP, for the years ended December 31, 2009, 2008 and 2007.
| (in millions of R$, except percentages) | |
| | | U.S. GAAP | |
| | | 2009 | | | 2008 | | | 2007 | |
| Balance at the beginning of period | | | 12,202 | | | | 7,473 | | | | 6,426 | |
| Charge-offs | | | (9,490 | ) | | | (5,904 | ) | | | (5,566 | ) |
| Commercial | | | | | | | | | | | | |
| Industrial and others | | | (3,883 | ) | | | (2,069 | ) | | | (1,921 | ) |
| Import financing | | | (53 | ) | | | (7 | ) | | | (7 | ) |
| Export financing | | | - | | | | - | | | | - | |
| Real estate loans (primarily residential housing loans) | | | (72 | ) | | | (78 | ) | | | (170 | ) |
| Lease financing (primarily vehicle financing) | | | (1,465 | ) | | | (453 | ) | | | (280 | ) |
| Public sector (domestic) | | | - | | | | - | | | | - | |
| Individuals | | | | | | | | | | | | |
| Overdraft | | | (903 | ) | | | (587 | ) | | | (679 | ) |
| Consumer finance operations | | | (1,606 | ) | | | (1,218 | ) | | | (1,239 | ) |
| Credit card | | | (1,508 | ) | | | (1,482 | ) | | | (1,263 | ) |
| Agricultural | | | (1 | ) | | | (10 | ) | | | (7 | ) |
| Recoveries | | | 1,884 | | | | 1,272 | | | | 1,071 | |
| Commercial | | | | | | | | | | | | |
| Industrial and others | | | 255 | | | | 254 | | | | 103 | |
| Import financing | | | - | | | | - | | | | - | |
| Export financing | | | - | | | | - | | | | - | |
| Real estate loans (primarily residential housing loans) | | | 207 | | | | 166 | | | | 169 | |
| Lease financing (primarily vehicle financing) | | | 119 | | | | 174 | | | | 78 | |
| Public sector (domestic) | | | - | | | | - | | | | - | |
| Individuals | | | | | | | | | | | | |
| Overdraft | | | 398 | | | | 232 | | | | 194 | |
| Consumer finance operations | | | 769 | | | | 401 | | | | 468 | |
| Credit card | | | 136 | | | | 45 | | | | 59 | |
| Agricultural | | | - | | | | - | | | | - | |
| Net charge-offs | | | (7,606 | ) | | | (4,632 | ) | | | (4,495 | ) |
| Provision for loan losses | | | 15,372 | | | | 9,361 | | | | 5,542 | |
| Balance at the end of period | | | 19,968 | | | | 12,202 | | | | 7,473 | |
| Ratio of charge-offs during the period to average loans outstanding during the period | | | 4.3 | % | | | 4.2 | % | | | 6.1 | % |
| Ratio of net charge-offs during the period to average loans outstanding during the period | | | 3.4 | % | | | 3.3 | % | | | 4.9 | % |
| Ratio of allowance for loan losses to total loans and leases | | | 8.1 | % | | | 7.2 | % | | | 6.4 | % |
The table below sets forth our provision for loan and lease losses, charge-offs and recoveries included in our result of operations, calculated in accordance with U.S. GAAP, for the years ended December 31, 2010, 2009 and 2008.
| (in millions of R$, except percentages) | |
| | | U.S. GAAP | |
| | | 2010 | | | 2009 | | | 2008 | | | 2010/2009 | | | 2009/2008 | |
| Provision for loan and lease losses | | | (11,871 | ) | | | (15,372 | ) | | | (9,361 | ) | | | (22.8 | )% | | | 64.2 | % |
| Loan charge-offs | | | (16,158 | ) | | | (9,490 | ) | | | (5,904 | ) | | | 70.3 | % | | | 60.7 | % |
| Loan recoveries | | | 4,457 | | | | 1,884 | | | | 1,272 | | | | 136.6 | % | | | 48.1 | % |
| Net charge-offs | | | (11,701 | ) | | | (7,606 | ) | | | (4,632 | ) | | | 53.8 | % | | | 64.2 | % |
During the year ended December 31, 2010, we charged off loans and leases in the total amount of R$16,158 million and as of December 31, 2010 our ratio of allowances for loan and lease losses to total loans and leases was 6.8%. The increase in the volume of loans and leases written off in 2010 was a result of increased delinquency in 2009 combined with the strong growth of our loan and lease portfolio. Despite this increase, our ratio of allowances for loan and lease losses to total loans and leases decreased by 1.3 percentage points compared to the previous year.
Effective December 31, 2010 we changed the methodology used to estimate our allowance for loan and lease losses, which were based on transition matrices, because the transition matrices were lagging in capturing, in a relatively short period, the effects of significant changes in economic conditions. The change in methodology resulted in a reduction in the amount of the allowance for loans and leases as of December 31, 2010 (and in the amount of the provision for loan and lease losses charged to expense for such year) as compared to the one that would have resulted from the prior methodology of R$ 935 million.
During the year ended December 31, 2009 we charged off loans and leases in the total amount of R$9,490 million and as of December 31, 2009 our ratio of allowance for loan and lease losses to total loans and leases was 8.1%. The increase in losses reflects the adverse economic environment and occurred in accordance with our forecasted scenario. Recent data indicate that leading indicators for default rates, such as first payment default rates, improved and we believe that this is a result of increased selectivity in our origination, our ongoing development of risk analysis procedures and an overall improvement in macroeconomic conditions in Brazil.
During the year ended December 31, 2008 we charged off loans and leases in the total amount of R$5,904 million and as of December 31, 2008 our ratio of allowance for loan and lease losses to total loans and leases was 7.2%. The relatively small increase in our charged-off loans and leases in 2008, in an environment where our portfolio has been growing significantly, was due to the improved performance of our portfolio and collection activities during that year, mainly in the first nine months of the year. During the fourth quarter, with the worsening of the global economic crisis, we increased the balance of allowance for loans and lease losses to adapt to the new economic scenario of increased credit risk in our loan and lease portfolio. As a consequence, our ratio of allowance for loan and lease losses to total loans and leases was 7.2% as of December 31, 2008, compared to 6.4% as of December 31, 2007.
During the year ended December 31, 2007 we charged off loans and leases in the total amount of R$5,566 million and as of December 31, 2007 our ratio of allowance for loan and lease losses to total loans and leases was 6.4%. The increase in the volume of loans and leases written off in 2007 was a result of the growth of and the change in the mix of our loan and lease portfolio, which occurred in the prior four years. However, the loan and lease portfolio also presented an improvement in quality indicators during the year as a result of the adoption of improved credit policies. Our continuously developing risk models have permitted us to reach our goals of loan and lease portfolio increase with improvements in quality indicators. Therefore, the growth in expenses with provision for loan and lease losses in 2007 was low when compared to the growth in our loan and lease portfolio. Also, our collection efforts resulted in an increase in the recovery of loans and leases previously written off as losses.
Allocation of the Allowance for Loans and Lease Losses
The table below presents a breakdown, by each segment and class, as defined under our portfolio segmentation, of the allowance for loan and lease losses, the allowance as a percentage of total loan and lease losses for the relevant segment or class and the percentage of total loans and leases in each segment and class of total loans and leases as of December 31, 2011 and 2010.
| (in millions of R$, except percentages) | |
| | | 2011 | | | 2010 | |
| | | | | | Allocated | | | | | | | | | Allocated | | | | |
| | | | | | allowance as a % | | | Loans category | | | | | | allowance as a % | | | Loans category | |
| | | Allocated | | | of total loans and | | | as a % of total | | | Allocated | | | of total loans and | | | as a % of total | |
| | | allowance | | | leases | | | loans(1) | | | allowance | | | leases | | | loans(1) | |
| Individuals | | | 13,629 | | | | 9.2 | % | | | 57.1 | % | | | 10,619 | | | | 8.5 | % | | | 53.1 | % |
| Credit Card | | | 3,825 | | | | 9.8 | % | | | 16.0 | % | | | 3,306 | | | | 10.0 | % | | | 16.5 | % |
| Personal Loans | | | 5,343 | | | | 15.2 | % | | | 22.4 | % | | | 3,492 | | | | 14.8 | % | | | 17.5 | % |
| Vehicles | | | 4,415 | | | | 7.3 | % | | | 18.5 | % | | | 3,709 | | | | 6.2 | % | | | 18.6 | % |
| Mortgage Loans | | | 46 | | | | 0.3 | % | | | 0.2 | % | | | 112 | | | | 1.4 | % | | | 0.6 | % |
| | | | | | | | | | | | | | | | | | | | | | | | | |
| Corporate | | | 758 | | | | 0.8 | % | | | 3.2 | % | | | 1,071 | | | | 1.4 | % | | | 5.4 | % |
| | | | | | | | | | | | | | | | | | | | | | | | | |
| Small and Medium Businesses | | | 9,197 | | | | 10.7 | % | | | 38.5 | % | | | 8,041 | | | | 10.1 | % | | | 40.2 | % |
| | | | | | | | | | | | | | | | | | | | | | | | | |
| Foreign Loans Latin America | | | 289 | | | | 1.5 | % | | | 1.2 | % | | | 263 | | | | 1.9 | % | | | 1.3 | % |
| | | | | | | | | | | | | | | | | | | | | | | | | |
| Total | | | 23,873 | | | | 6.9 | % | | | 100.0 | % | | | 19,994 | | | | 6.8 | % | | | 100.0 | % |
| (1) Excludes non-accrual loans. | | | | | | | | | | | | | | | | | | | |
The following table sets forth, calculated in accordance with U.S. GAAP, our allocation of the allowance for loan and lease losses by type of loan as of December 31, 2009, 2008 and 2007. The allocated amount of the allowance is expressed as a percentage of the related loan and lease amount with the corresponding percentage of the loan and lease category to total loans and leases.
| (in millions of R$, except percentages) | |
| | | U.S. GAAP | |
| | | 2009 | | | 2008 | | | 2007 | |
| | | | | | Allocated | | | | | | | | | Allocated | | | | | | | | | Allocated | | | | |
| | | | | | allowance as a | | | Loans category | | | | | | allowance as a | | | Loans category | | | | | | allowance as a | | | Loans category | |
| | | Allocated | | | % of total loans | | | as a % of total | | | Allocated | | | % of total loans | | | as a % of total | | | Allocated | | | % of total loans | | | as a % of total | |
| | | allowance | | | and leases | | | loans (1) | | | allowance | | | and leases | | | loans (1) | | | allowance | | | and leases | | | loans (1) | |
| Type of loan | | | | | | | | | | | | | | | | | | | | | | | | | | | | | | | | | | | | |
| Commercial | | | | | | | | | | | | | | | | | | | | | | | | | | | | | | | | | | | | |
| Industrial and other | | | 3,334 | | | | 1.4 | % | | | 42.4 | % | | | 2,399 | | | | 1.4 | % | | | 38.4 | % | | | 1,250 | | | | 1.1 | % | | | 35.2 | % |
| Import financing | | | 11 | | | | 0.0 | % | | | 0.8 | % | | | 10 | | | | 0.0 | % | | | 2.1 | % | | | 6 | | | | 0.0 | % | | | 1.1 | % |
| Export financing | | | 127 | | | | 0.1 | % | | | 2.8 | % | | | 135 | | | | 0.1 | % | | | 5.7 | % | | | 75 | | | | 0.1 | % | | | 2.8 | % |
| Real estate loans (primarily residential housing loans) | | | 209 | | | | 0.1 | % | | | 4.5 | % | | | 171 | | | | 0.1 | % | | | 3.8 | % | | | 199 | | | | 0.2 | % | | | 4.1 | % |
| Lease financing (primarily vehicle financing) | | | 2,521 | | | | 1.0 | % | | | 19.2 | % | | | 1,454 | | | | 0.9 | % | | | 24.6 | % | | | 862 | | | | 0.7 | % | | | 25.4 | % |
| Public sector (domestic) | | | - | | | | 0.0 | % | | | 0.7 | % | | | 2 | | | | 0.0 | % | | | 0.4 | % | | | 1 | | | | 0.0 | % | | | 0.7 | % |
| Individuals: | | | | | | | | | | | | | | | | | | | | | | | | | | | | | | | | | | | | |
| Overdraft | | | 1,319 | | | | 0.5 | % | | | 1.7 | % | | | 2,290 | | | | 1.3 | % | | | 2.1 | % | | | 993 | | | | 0.9 | % | | | 2.4 | % |
| Consumer finance operations | | | 6,382 | | | | 2.6 | % | | | 13.3 | % | | | 4,042 | | | | 2.4 | % | | | 11.9 | % | | | 2,975 | | | | 2.6 | % | | | 15.5 | % |
| Credit Card | | | 5,309 | | | | 2.2 | % | | | 12.5 | % | | | 1,564 | | | | 0.9 | % | | | 8.4 | % | | | 1,045 | | | | 0.9 | % | | | 9.8 | % |
| Agricultural | | | 756 | | | | 0.3 | % | | | 2.1 | % | | | 135 | | | | 0.1 | % | | | 2.6 | % | | | 67 | | | | 0.1 | % | | | 3.0 | % |
| Total | | | 19,968 | | | | 8.1 | % | | | 100.0 | % | | | 12,202 | | | | 7.2 | % | | | 100.0 | % | | | 7,473 | | | | 6.4 | % | | | 100.0 | % |
(1) Excludes non-accrual loans.
Average Deposit Balances and Interest Rates
The table below sets forth the average balances of deposits together with the average interest rates paid for each period presented.
| (in millions of R$, except percentages) | |
| | | 2011 | | | 2010 | |
| | | Average | | | | | | Average | | | | |
| | | balance | | | Average rate | | | balance | | | Average rate | |
| Non-interest bearing deposits | | | 26,072 | �� | | | | | | | 25,817 | | | | | |
| Interbank deposits | | | 25,752 | | | | | | | | 24,719 | | | | | |
| Other deposits | | | 321 | | | | | | | | 1,098 | | | | | |
| Interest-bearing deposits | | | 186,429 | | | | 7.9 | % | | | 164,210 | | | | 7.5 | % |
| Deposits from banks | | | 2,376 | | | | 7.1 | % | | | 1,703 | | | | 8.5 | % |
| Savings deposits | | | 61,143 | | | | 6.5 | % | | | 52,457 | | | | 6.0 | % |
| Time deposits | | | 122,910 | | | | 8.6 | % | | | 110,050 | | | | 8.2 | % |
| Total | | | 212,502 | | | | | | | | 190,027 | | | | | |
The table below sets forth the average balances of deposits together with the average interest rates paid, calculated in accordance with U.S. GAAP, as of December 31, 2009.
| (in millions of R$, except percentages) | |
| | | U.S. GAAP | |
| | | 2009 | |
| | | Average | | | | |
| | | balance | | | Average rate | |
| Non-interest-bearing deposits | | | 23,799 | | | | | |
| Demand deposits | | | 22,821 | | | | | |
| Other deposits | | | 978 | | | | | |
| Interest-bearing deposits | | | 159,296 | | | | 7.4 | % |
| Deposits from banks | | | 2,605 | | | | 12.9 | % |
| Savings deposits | | | 40,998 | | | | 5.9 | % |
| Time deposits | | | 115,693 | | | | 7.8 | % |
| Total | | | 183,095 | | | | | |
Maturity of Deposits
The following tables set forth a breakdown of deposits by maturity, as of December 31, 2011:
| (in millions of R$) | |
| | | 2011 | |
| | | 0-30 days | | | 31-180 days | | | 181-365 days | | | Over 365 days | | | Total | |
| Non-interest bearing deposits | | | 28,932 | | | | - | | | | - | | | | - | | | | 28,932 | |
| Demand deposits | | | 28,932 | | | | - | | | | - | | | | - | | | | 28,932 | |
| Other deposits | | | - | | | | - | | | | - | | | | - | | | | - | |
| Interest bearing deposits | | | 98,754 | | | | 19,849 | | | | 11,920 | | | | 83,181 | | | | 213,704 | |
| Savings deposits | | | 67,170 | | | | - | | | | - | | | | - | | | | 67,170 | |
| Time deposits | | | 30,918 | | | | 19,167 | | | | 11,475 | | | | 82,909 | | | | 144,469 | |
| Interbanks Deposits | | | 666 | | | | 682 | | | | 445 | | | | 272 | | | | 2,065 | |
| Total | | | 127,686 | | | | 19,849 | | | | 11,920 | | | | 83,181 | | | | 242,636 | |
The table below sets forth the maturity of outstanding time deposits with balances in excess of US$100,000 (or its equivalent) issued by us as of December 31, 2011.
| (in millions of R$) | |
| Maturity within three months | | | 28,183 | |
| Maturity after three months to six months | | | 5,335 | |
| Maturity after six months to twelve months | | | 9,298 | |
| Maturity after twelve months | | | 11,937 | |
| Total time deposits in excess of US$100,000 | | | 54,754 | |
Short-Term Borrowings
Short-term borrowings are included in our balance sheet under the line items "Securities sold under repurchase agreements", "Interbank market debt" and "Institutional market debt". The principal category of our short-term borrowings is securities held under repurchase agreements. The average monthly balance outstanding during 2011 and 2010 for other categories of short-term borrowings was less than 30% of our stockholders’ equity at the end of each fiscal year.
The table below presents a summary of securities sold under repurchase agreements for the periods indicated.
| (in millions of R$, except percentages) | |
| | | 2011 | | | 2010 | |
| Securities sold under repurchase agreements | | | | | | | | |
| Amount outstanding (as of December 31) | | | 185,413 | | | | 199,657 | |
| Maximum amount outstanding during the period | | | 206,753 | | | | 199,657 | |
| Weighted average interest rate at period-end | | | 9.75 | % | | | 7.93 | % |
| Average amount outstanding during period | | | 196,400 | | | | 163,901 | |
| Weighted average interest rate | | | 10.36 | % | | | 7.82 | % |
The table below presents a summary of securities sold under repurchase agreements and the primary short-term borrowings, calculated in accordance with U.S. GAAP, as of December 31, 2009.
| (in millions of R$, except percentages) | |
| | | U.S. GAAP | |
| | | 2009 | |
| Securities sold under repurchase agreements | | | | |
| Amount outstanding | | | 66,174 | |
| Maximum amount outstanding during the period | | | 84,259 | |
| Weighted average interest rate at period-end | | | 3.77 | % |
| Average amount outstanding during period | | | 70,032 | |
| Weighted average interest rate | | | 10.90 | % |
| Securities issued and sold to customers under repurchase agreements | | | | |
| Amount outstanding | | | 65,520 | |
| Maximum amount outstanding during the period | | | 66,317 | |
| Weighted average interest rate at period-end | | | 8.69 | % |
| Average amount outstanding during period | | | 57,651 | |
| Weighted average interest rate | | | 8.99 | % |
Capital
Specific regulatory capital requirements are discussed in “Item 4B. Business Overview — Regulation and Supervision — Regulatory Capital Requirements.” Additional information on capital requirements is discussed in note 32 to our consolidated financial statements.
Minimum Capital Requirements
The following table sets forth our capital positions of total risk-weighted assets, as well as our minimum capital requirements under Central Bank rules, in each case as of December 31, 2011, 2010 and 2009, in each case on a fully consolidated basis, including our financial and non-financial subsidiaries.
| (in millions of R$, except percentages) | |
| | | 2011 | | | 2010 | | | 2009 | |
| Tier 1 Capital | | | 71,601 | | | | 62,240 | | | | 57,706 | |
| Tier 2 Capital | | | 21,565 | | | | 18,652 | | | | 12,837 | |
| Tier 1 plus Tier 2 Capital | | | 93,166 | | | | 80,892 | | | | 70,543 | |
| Adjustments | | | (55 | ) | | | (173 | ) | | | (28 | ) |
| Our regulatory capital (1) | | | 93,111 | | | | 80,719 | | | | 70,515 | |
| Minimum regulatory capital required(2) | | | 62,556 | | | | 57,525 | | | | 46,513 | |
| Excess over minimum regulatory capital required | | | 30,555 | | | | 23,194 | | | | 24,002 | |
| Total risk-weighted assets | | | 568,693 | | | | 522,952 | | | | 422,840 | |
| Our regulatory capital to risk-weighted assets ratio | | | 16.4 | % | | | 15.4 | % | | | 16.7 | % |
(1) Based on Central Bank requirements (see note 32 to our consolidated financial statements).
(2) The minimum requirement in Brazil was 11% as of December 31, 2011, 2010 and 2009.
| 4C. | Organizational Structure |
We are a financial holding company controlled by IUPAR, a holding company jointly controlled by Itaúsa and E. Johnston, which is a holding company controlled by the former controlling shareholders of Unibanco, the Moreira Salles family. See “Item 4B. Business Overview – Our Ownership Structure” and “Item 7A. Major Shareholders.” Our list of significant subsidiaries as of December 31, 2011 is included as Exhibit 8.1 to this annual report. This list contains information relating to our significant subsidiaries in accordance with our consolidated financial statements.
| 4D. | Property, Plants and Equipment |
We own our principal executive offices located in São Paulo, Brazil and a number of other administrative buildings. The main offices and the main activities conducted in each of them are:
| · | Itaú Unibanco Centro Empresarial, located at Praça Alfredo Egydio de Souza Aranha, 100, São Paulo – head office, commercial department, back-offices and main administrative departments; |
| · | Centro Administrativo Tatuapé, located at Rua Santa Virgínia/Rua Santa Catarina, 299, São Paulo –administrative center; |
| · | Centro Técnico Operacional, located at Avenida do Estado, 5,533, São Paulo – data processing center; |
| · | The wholesale and investment bank activities at Banco Itaú BBA S.A. in our leased office, located at: (a) Avenida Brigadeiro Faria Lima, 3,400, 3rd to 8th and 11th and 12th floors, São Paulo; (b) Avenida Nações Unidas, 7,815, Tower I – 3rd through 13th floors, Tower II – 5th floor, São Paulo; and (c) Avenida Brigadeiro Faria Lima, 3,311, 1st through 3rd floors, 13th and 14th floors; |
| · | Centro Administrativo Unibanco, located at Rua João Moreira Sales, 130 – Jardim Monte Alegre – São Paulo – administrative center and data processing center; |
| · | Edifício Unibanco, located at Av. Eusébio Matoso, 891 – Pinheiros – São Paulo – administrative center; |
| · | Edifício Boa Vista, located at Rua Boa Vista, 162 – São Paulo – administrative center; and |
| · | Edifício Barão de Iguape, located at Praça do Patriarca, 30/Rua Direita, 250 – São Paulo – administrative center. |
We also lease a portion of our administrative offices and the majority of our branches at competitive market prices from third parties and under renewable leases with terms ending from the first semester of 2011 (which are in the process of being renewed under similar terms) to the fourth quarter of 2029. As of December 31, 2011, we owned 12% of our total administrative offices and branches (including electronic service points, banking sites and parking lots) and leased the remaining 88%. As of December 31, 2011, we also owned 32% of our central administrative buildings and branches and leased the remaining 68%.
In addition, on January 27, 2012, we announced the construction of a new technology center. See “Item 4B. Business Overview – Technology”.
| ITEM 4A | UNRESOLVED STAFF COMMENTS |
None.
ITEM 5. OPERATING AND FINANCIAL REVIEW AND PROSPECTS
The following discussion should be read in conjunction with our consolidated financial statements and accompanying notes and other financial information included elsewhere in this annual report, and in conjunction with the information included under “Item 3A. Selected Financial Data” and “Item 4B. Business Overview – Selected Statistical Information”. The following discussion contains forward-looking statements that involve risks and uncertainties. Our actual results may differ materially from these discussed in forward-looking statements as a result of various factors, including those set in forth in “Cautionary Statement Regarding Forward-Looking Statements” and “Item 3D. Risk Factors”.
Effects of the Global Financial Markets on our Financial Condition and Results of Operations
The global financial markets crisis has significantly affected the world economy since the last quarter of 2008. The crisis led to (i) recessions and increasing unemployment in the world’s leading economies, (ii) a reduction in investments on a global scale, (iii) a decrease in commodities prices, (iv) a sharp decline in credit availability and liquidity and (iv) a general reduction in the levels of transactions in the capital markets worldwide. The world economy and the credit and capital markets substantially recovered in 2010 and early 2011 but the condition of the global financial markets deteriorated again in the second half of 2011.
Recent increased risk in the global financial markets resulted primarily from fiscal problems in Europe, such as the high debt levels that impair growth and the increased risk of a sovereign default. Worries regarding the fiscal crisis in Europe intensified in the third quarter of 2011 and the probability of a new global recession increased, with heightened risk aversion and volatility in financial markets. Markets feared sovereign or bank defaults and the lack of political coordination in Europe.
The Greek debt crisis spread to other highly indebted European countries, such as Italy, Spain and Portugal. A significant portion of these countries’ debt is held by financial institutions, and their economic situation may impact the results of banks and investment funds. The fiscal crisis in Europe is expected to last for an extended period, and may include sovereign restructurings as well as the implementation of fiscal adjustment measures with the assistance of the European Central Bank.
Although the European Union has been taking measures to face these difficulties, a financial deterioration of any of these countries may impair growth of economies worldwide and, indirectly, Brazil’s economy.
In determining which countries are presented in the table, we focused on those experiencing significant economic fiscal and/or political strains such that the likelihood of default would be higher than would be anticipated when such factors do not exist.
Our exposure as of December 31, 2011 to the sovereign bonds of Greece, Ireland, Italy, Portugal and Spain, or the GIIPS Countries, as well as to financial institutions and other corporations and small businesses and individuals domiciled in those countries, is set forth in the table below, in millions ofreais:
| December 31, 2011 | |
| | | Segment | | Credit | | | Co-obligation | | | Sovereign | | | Bond | | | Derivative | | | Total Exposure | |
| Greece | | Corporate | | | - | | | | - | | | | - | | | | - | | | | - | | | | - | |
| | | Financial | | | | | | | | | | | | | | | | | | | | | | | | |
| Ireland | | Corporate | | | - | | | | - | | | | - | | | | - | | | | - | | | | - | |
| | | Financial | | | | | | | | | | | | | | | | | | | | | | | | |
| Italy | | Corporate | | | - | | | | - | | | | - | | | | - | | | | - | | | | - | |
| | | Financial | | | - | | | | 6 | | | | - | | | | - | | | | - | | | | 6 | |
| Portugal | | Corporate | | | 880 | | | | 4 | | | | - | | | | - | | | | 1 | | | | 884 | |
| | | Financial | | | - | | | | - | | | | - | | | | 43 | | | | 6 | | | | 49 | |
| Spain | | Corporate | | | 1.459 | | | | 28 | | | | 418 | | | | - | | | | | | | | 1.906 | |
| | | Financial | | | | | | | 132 | | | | | | | | | | | | 22 | | | | 153 | |
| Total | | | | | 2.339 | | | | 170 | | | | 418 | | | | 43 | | | | 29 | | | | 2.998 | |
The exposure presented above as of December 31, 2011 amounted R$2,998 million, with co-obligations in the amount of R$170 million, primarily related to our exposure to corporate credits. The disclosure above has been measured at our estimated realizable value which is updated depending on its nature (such as pledged amounts in current accounts used to collect customer receivables, financial investments, real estate, machinery and equipment or others), except for guarantees provided by third parties where the amount corresponds to the outstanding debt. Our derivatives related to GIIPS countries as of December 31, 2011 amounted R$ 29 million.
In addition to the exposure described above and reflected in our consolidated financial statements, we are also exposed to the GIIPS Countries through our investment in our equity investee Banco BPI S.A., or Banco BPI, in which we had a 19.04% interest at December 31, 2011. Banco BPI is one of the five largest banks in Portugal. As disclosed in note 12 to our consolidated financial statements, our investment in Banco BPI as of December 31, 2011 amounted to R$219 million. Banco BPI had sovereign securities issued by governments of the GIIPS Countries in its portfolio classified as available-for-sale for which carrying amount exceeded fair value and with respect to which we recognized our interest in such unrealized loss representing an amount in accumulated other comprehensive income of R$ 245 million as of December 31, 2011.
The world economy has been recovering throughout 2011 and beginning of 2012, but several consequences of the crisis remain. Important risks have been identified in the aftermath of the financial crisis in Europe, such as the high debt levels that impair growth and increase the risk of sovereign default. Growing concern over the sustainability of current levels of indebtedness of GIIPS countries has increased the focus on the exposure of financial institutions to the risk of those countries. Particularly, the markets have increased the risk premiums on debt of GIIPS countries. These countries’ debt is held by international financial institutions, and their economic situation may impact the results of banks and investment funds. Although the European Union is prepared to face these difficulties, a financial deterioration of any of these countries may impair the recovery of economies worldwide and, indirectly, Brazil’s recovery. Although we have international operations and investments in certain European countries affected by the financial crisis, our exposure to the sovereign bonds of the GIIPS countries, as well as to financial institutions and other corporations and small businesses and individuals domiciled in those countries is not significant when compared to our total assets or shareholders’ equity. As of December 31, 2011 our gross credit exposure to entities (including governments) domiciled in the GIIPS countries represented 0.366% and 3.980% of our total assets and shareholders’ equity, respectively.
The U.S. economy grew 1.7% in 2011, decelerating from 3.0% in 2010. Production was lifted by durable goods following the normalisation in the Japanese supply-chain after the early 2011 earthquake and tsunami. Consumer expenditure growth remained steady as households reacted to low real income growth. Inflation decelerated in the fourth quarter of 2011. We believe that economic growth in the U.S. will remain modest in 2012, as we assume that (i) households will again increase their savings rate in the next few quarters; (ii) fiscal policy will remain restrictive in 2012; and (iii) the European debt crisis is likely to impact U.S. exports and overall financial condition.
Finally, emerging markets, including Brazil and China, are experiencing the first signs of growth deceleration. China’s government is gradually moving from a tightening policy to a more flexible stance. Similarly, Brazilian Central Bank started a monetary easing cycle. Although less growth is expected in 2012, emerging markets are expected to perform better than the developed world.
Our results of operations since the last quarter of 2008 have been partially negatively affected by the global financial markets crisis. Fiscal problems in advanced economies, sluggishness in the developed world and inflation and other issues in developing economies may have an impact on future growth in Brazil and, therefore, on our results of operations.
Brazilian Economic, Political and Social Conditions
As a Brazilian bank with most of our operations in Brazil, we are significantly affected by economic, political and social conditions in Brazil. In recent years, we have benefited from Brazil’s generally stable economic environment, with average annual gross domestic product, or GDP, growth of approximately 4.2% from 2004 to 2010, which led to increased bank lending and deposits. The downward trend in inflation until recently had allowed the Central Bank to ease the benchmark interest rate payable to holders of securities issued by the Brazilian government and traded through the Special Clearing and Settlement System (Sistema Especial de Liquidação e Custódia, or SELIC) from a high of 17.75% in December 2004 to a low of 8.75% in July 2009. The Central Bank started to reduce the SELIC interest rate in August, due to fears of an internationally driven deceleration of Brazilian economic activity. Since then, the government reduced the SELIC rate by 200 basis points, and was at 10.50% as of January 2012. As a proportion of GDP, bank lending expanded to 49.1% in December 2011 from 45.2% in December 2010. In addition, the Brazilian government reduced the manufactured products tax (Imposto sobre Produtos Industrializados, or IPI) for domestic utilities and vehicles, in order to stimulate domestic activity. Further tax reductions could take place to further stimulate the Brazilian economy.
There are still concerns about the acceleration of inflation in Brazil. Consumer price inflation in 2011 is considerably above the levels reached in 2010, reflecting not only high commodity prices during 2011 but also an overheated labour market and inflationary inertia. The Consumer Price Index(Índice de Preços ao Consumidor Amplo, or IPCA) increased by 6.5% in 2011, compared to 5.9% in 2010. If inflation continues to rise, incomes of families may decrease inreal terms and could eventually lead to higher delinquency rates in the Brazilian banking system. In addition, we have experienced some deterioration in non-performing loans in the very small and small companies market principally due to the increase in interest rates and other macroprudential measures taken by the Central Bank.
In 2010, Brazil experienced strong growth and GDP increased 7.5% from the previous year. This was primarily due to the Brazilian economy rebounding from negative growth in 2009, and also the result of rapid expansion of domestic demand, driven mainly by the recovery of consumer and investment expenditures as well as stimulative fiscal expenditures in 2010. Nonetheless, Brazilian GDP growth decelerated to 2.7% in 2011. Growth is moderating as a result of global deceleration, macroprudential measures taken in late 2010 by the Brazilian government and fiscal and monetary tightening. The Brazilian credit market showed moderate growth over the previous year, impacted by the effects of the macroprudential measures and the tightening of monetary policy in 2010. Total new consumer loans in Brazil increased by 4.4% inreal terms in 2011 compared to 2010, after growing 15.4% in 2010 compared to 2009. Similarly, total new corporate loans in Brazil grew by 1.4% in 2011 compared to 2010 and by 2.5% compared to 2009.
The current account deficit (net balance from trade of goods and services and international transfers) reached 2.12% of GDP as of December 31, 2011, from 2.21% in 2010. Brazil’s external solvency improved considerably, with US$352 billion in international reserves and US$297.3 billion in external debt as of December 31, 2011. Brazil’s external liabilities excluding foreign direct investments (mainly foreign portfolio investments) decreased to US$784 billion as of December 31, 2011, from US$828 billion as of December 31, 2010. In addition, the Central Bank bought US$47.6 billion on the foreign exchange spot market until January 2012. The recent balance of payments results could increase exchange-rate volatility, potentially affecting our results. See “— Certain Effects of Foreign Exchange Rates on Our Net Interest Income”.
We are also exposed to tax-policy and regulatory changes, which are sometimes adopted on short notice. For instance, in October 2010, the government increased the tax on financial transactions (Imposto Sobre Operações Financeiras, or IOF) to 6.0% applicable to foreign exchange transactions made by foreign residents for purposes of investing in the Brazilian financial and capital markets (the IOF/FX). The IOF/FX tax rates imposed on foreign exchange transactions have been recently modified and are currently imposed at a rate of 0.38%, with certain exceptions to this general rule. See “Item 4B. Business Overview — Regulation and Supervision — Taxation — Tax on Financial Transactions”.
In July 2011, with the enactment of Provisional Measure No. 539 and the Executive Decree No. 7,536, the Brazilian government imposed an IOF tax of 1% on the net derivatives positions of taxpayers who increase their net short position on the U.S. dollar/real exchange rate. Those measures reduced the liquidity in the currency market, contributing to increased volatility in the U.S. dollar-real exchange rate, which was R$1.7468 to US$1.00 as of January 31, 2012, from R$1.56 to US$1.00 as of June 30, 2011. Increased risk aversion along with an interruption in the U.S. dollar weakening process around the world contributed to this movement.
In addition, in 2008, a tax on withdrawals from checking accounts, or the CPMF, was abolished; there is a risk, however, that this may be imposed again. In July 2011, the Brazilian government resumed interventions in the currency market through administrative measures, requiring banks to deposit with the Central Bank the equivalent of 60% of their spot short dollar positions exceeding US$1 billion.
Furthermore, a number of regulatory changes for the domestic banking sector are under consideration, such as limits to compensation packages of financial institutions, additional disclosure of derivative transactions and further modifications to capital requirement models. These changes have the potential to adversely affect our operations and profitability.
On April 30, 2008, Standard & Poor’s Rating Services upgraded the long-term rating of Brazil’s sovereign foreign currency debt to BBB- from BB+, upgrading Brazil’s rating to investment grade. On November 17, 2011, S&P further upgraded Brazil to BBB. On May 29, 2008, Fitch Ratings followed suit and upgraded Brazil to investment grade, raising its rating to BBB- from BB+, and on April 4, 2011, to BBB. On September 22, 2009, Moody’s Investors Service Inc. raised Brazil’s sovereign rating to Baa3 from Ba1, and on June 20, 2011 updated it to Baa2. These upgrades have contributed to further increases in the inflow of foreign capital, which in turn has strengthened thereal.
The table below shows the real GDP growth, the inflation rate, exchange rate variation and the interest rates in Brazil as of the years ended December 31, 2011, 2010, 2009, 2008 and 2007:
| | | As of and for the year ended December 31 | |
| | | 2011 | | | 2010 | | | 2009 | | | 2008 | | | 2007 | |
| Real GDP growth %(1) | | | 2.7 | | | | 7.5 | | | | (0.3 | ) | | | 5.2 | | | | 6.1 | |
| Inflation rate % (2) | | | 5.0 | | | | 11.3 | | | | (1.4 | ) | | | 9.1 | | | | 7.9 | |
| Inflation rate %(3) | | | 6.5 | | | | 5.9 | | | | 4.3 | | | | 5.9 | | | | 4.5 | |
| Exchange rate variation %(R$ /US$)(4) | | | (11.2 | ) | | | 4.5 | | | | 34.2 | | | | (24.2 | ) | | | 20.7 | |
| TR – a reference interest rate %(5) | | | 1.07 | | | | 0.66 | | | | 0.20 | | | | 2.27 | | | | 0.85 | |
| CDI (interbank interest rate) %(5) | | | 10.87 | | | | 10.64 | | | | 8.61 | | | | 13.49 | | | | 11.11 | |
| SELIC – overnight interest rate %(5) | | | 10.90 | | | | 10.66 | | | | 8.65 | | | | 13.66 | | | | 11.18 | |
| CDS 5 year(6) | | | 161.6 | | | | 111.3 | | | | 122.5 | | | | 300.5 | | | | 103.0 | |
(1) Source: Instituto Brasileiro de Geografia e Estatística (“IBGE”)
(2)Source: General Price Index– Internal Availability (Índice Geral de Preços – Disponibilidade Interna or “IGP-DI”), as published by the Fundação Getulio Vargas.
(3) Source: IPCA, as published by IBGE.
(4) Source: Central Bank (accumulated rates for the period, negative numbers mean depreciation of the Brazilianreal).
(5) Source: Central Bank (period end). 2011 data are presented in percent per annum.
(6)Source: Bloomberg (period end). Credit default swap (CDS) is a measure of country risk (basis point).
Certain Effects of Foreign Exchange Rates on Our Net Interest Income
The variation of the real can affect our net interest income. A certain amount of our financial assets and liabilities are denominated in or indexed to foreign currencies, primarily the U.S. dollar. When the real depreciates, we incur losses on our liabilities denominated in or indexed to foreign currencies, such as our U.S. dollar-denominated long-term debt and short-term borrowings, because the cost inreais of the related interest expense increases. At the same time, we realize gains on monetary assets denominated in or indexed to foreign currencies, such as our dollar-indexed trading securities and loans, due to increased interest income from such assets measured inreais. When the real appreciates, the effects are the opposite of those described above. Consequently, the management of the gap in foreign currencies can have material effects on our net income. Our foreign currency gap management also takes into account the tax effects of such positions. As the profits from exchange rate variation on investments abroad are not taxable, we aim to maintain sufficient hedges (a liability position in foreign exchange derivatives) to reduce the potential effects from our total foreign-exchange exposure, net of tax effects.
Unless otherwise indicated, the discussion in “Item 5. Operating and Financial Review and Prospects” relates to our annual interest rates and yields. Interest rates cited are measured inreais and include the effect of the variation of the real against foreign currencies.
Seasonality
Generally our retail banking and our credit card businesses have some seasonality, with increased levels of retail and credit card transactions during the Christmas season and a subsequent decrease of these levels at the beginning of the year. We also have some seasonality in our banking service fees related to collection services at the beginning of the year, which is when taxes and other fiscal contributions are generally paid.
Discussion of Critical Accounting Policies
General
The preparation of the consolidated financial statements included in this annual report involves certain assumptions that are derived from historical experience and various other factors that we deem reasonable and relevant. While we review these estimates and assumptions in the ordinary course of business, the portrayal of our financial condition and results of operations often requires our management to make judgments regarding the effects on our financial condition and results of operations on matters that are inherently uncertain. The following discussion describes those areas that require the most judgment or involve a higher degree of complexity in the application of the accounting policies that currently affect our financial condition and results of operations. Actual results may differ from those estimated under different variables, assumptions or conditions. note 2 to our consolidated financial statements includes a summary of the significant accounting policies and methods used in the preparation of the consolidated financial statements.
Use of Estimates and Assumptions
The preparation of consolidated financial statements in accordance with IFRS requires management to make estimates and assumptions that affect the reported amounts of assets, liabilities and contingent liabilities at the date of the consolidated financial statements, as well as the reported amounts of revenue, expenses, gains and losses over the reporting and subsequent periods, because actual results may differ from those determined in accordance with such estimates and assumptions.
All estimates and assumptions made by management are in accordance with IFRS and represent the current best estimates made in conformity with the applicable rule standards. Estimates and judgments are evaluated on an ongoing basis, considering past experience and other factors.
Allowance for Loan Losses
The allowance for loan losses represents our estimate of the probable losses inherent to our loan and lease portfolio at the end of each reporting period. The methodology for determining the allowance for loan and lease losses is further described in “Item 4B. Business Overview – Selected Statistical Information – Loan Approval Process - Allowance for Loan and Lease Losses.” In order to determine the amount of the allowance for loan losses, a portfolio is classified into two categories with respect to which specific methodologies are used to estimate inherent losses. Loans reviewed on an individual basis (which corresponds to our corporate portfolio) are individually reviewed for impairment. For those considered to be impaired, we determine the allowance amount based on expected cash flows. For those that are not impaired, loans are classified by ratings based on risk factors and inherent losses for each rating are estimated based on our historical experience. This involves judgments in identifying the risk factors and assigning a rating. Loans reviewed on a portfolio basis (which includes individuals, small and medium business and foreign loans Latin America portfolios) when appropriate are further segregated into classes based on the underlying risks and characteristics, and the allowance for loan losses is determined by category based on historical experience. This also involves judgments and assumptions. Many factors affect the estimate for the range of losses in each of the categories for which we estimate the allowance on a portfolio basis, such as the methodology used to measure historical delinquency and the historical period to be used. Additionally, factors affecting the specific amount of allowance to be recorded are subjective, and include economic and political conditions, credit quality trends, the volume and growth observed in each sub-category and specific economic conditions affecting a sub-category. Our total allowance for loan losses as of December 31, 2011 and 2010 was R$23,873 million and R$19,994 million, respectively and we recognized a provision for loan losses in our statement of income of R$20,038 million and R$15,547 million for the years ended December 31, 2011 and 2010.
Fair Value of Financial Instruments
Financial instruments recorded at fair value on our balance sheet include mainly securities classified as trading and available-for-sale, and other trading assets including derivatives. Securities classified as held-to- maturity are recorded at amortized historical cost on our balance sheet, and their corresponding fair values are shown in the notes to our consolidated financial statements. Total financial instruments recorded at fair value at December 31, 2011 are assets amounting to R$ 178,339 million (R$ 168,119 million at December 31, 2010), of which R$ 8,754 million are derivatives (R$ 7,777 million at December 31, 2010) and liabilities in the amount of R$ 9,562 million (R$ 7,006 million at December 31, 2010), of which R$ 6,747 million are derivatives (R$ 5,671 million at December 31, 2010). We determine the fair values of our financial instruments based on IAS 39, which defines fair value as the amount for which an asset could be exchanged, or a liability settled, between knowledgeable, willing parties in an arm's length transaction. According to IFRS 7, there are different levels of inputs that may be used to measure the fair value of financial instrumentsand we prioritize the use of available inputs in a higher level before using inputs in a level that is lower in the hierarchy. Level 1 inputs are quoted prices (unadjusted) in active markets for identical assets or liabilities; Level 2 inputs are inputs other than quoted prices included within Level 1 that are observable for the asset or liability, either directly (i.e., as prices) or indirectly (i.e., derived from prices); Level 3 inputs are inputs for the asset or liability that are not based on observable market data (unobservable inputs). For instruments classified in Levels 1 and 2, where inputs are principally based on observable market data, there is less judgment applied in arriving at a fair value measurement. For instruments classified within Level 3, judgments are more significant. In arriving at an estimate of fair value for an instrument within Level 3, management first determines the appropriate model to use. Second, due to the lack of observability of significant inputs, management assesses all relevant empirical data in deriving valuation inputs, including but not limited to yield curves, interest rates, volatilities, equity or debt prices, foreign exchange rates and credit curves. Additionally, with respect to non-exchange traded products, management judgment must be applied to assess the appropriate level of valuation adjustments to reflect counterparty credit quality, our own creditworthiness, and constraints on liquidity and unobservable parameters, where relevant. While we believe our valuation methods are appropriate and consistent with those of other market participants, the use of different methodologies or assumptions to determine the fair value of certain financial instruments could result in a different estimate of fair value at the reporting date. Securities classified as Level 3 as of December 31, 2011 and 2010 amounted to R$1,886 million and R$1,806 million, respectively and net derivatives as of such date amounted to R$205 million and R$150 million, respectively. For additional information see note 30 to our consolidated financial statements. Judgments are also required to determine whether there is objective evidence that a financial asset or a group of financial assets is impaired. If any impairment evidence exists for available-for-sale or held-to-maturity financial assets, the cumulative loss, measured as the difference between the acquisition cost and the current fair value is recognized in the consolidated statement of income. Factors that are used by management in determining whether there is objective evidence that a financial asset is impaired includes mainly the observed period of the loss, the degree of the loss whether we will be required to sell the security before recovery and the expectation as of the date of analysis as to the potential for realization of the security.
Significant Changes in Accounting Rules
See note 2.2 to our consolidated financial statements for information about significant changes in accounting rules.
Results of Operations for Year Ended December 31, 2011 Compared to Year Ended December 31, 2010
Highlights
For the year ended December 31, 2011, our net income attributable to owners of the parent company was R$13,837 million and our total stockholders’ equity was R$73,941 million.
As of December 31, 2011, total loan operations and lease operations was R$346,264 million, a 17.4% increase compared to December 31, 2010. Loans to individuals increased by 18.7%, while loans to companies increased by 14.3% compared to December 31, 2010. During 2011, we maintained our strategy of increasing the volume of credit card lending, personal loans, mortgage loans and loans to middle market companies, with personal loans increasing at a higher rate than other segments. We highlight that mortgage loans and rural loans portfolios (which are regulatory required loans) are presented within loans to individuals or loans to companies, as appropriate, according to the type of client.
Losses on loans and claims are the sum of expenses for allowance for loan losses, recovery of loans written off as losses and expenses for claims. In 2011, our losses on loans and claims increased from R$12,938 million in 2010 to R$16,072 million in 2011 a R$3,134 million increase, or 24.2%, mainly due to an increase of expenses for allowance for loan losses and to a lesser extent to an increase of expenses for claims, partially offset by an increase of the recovery in loans written off as losses.
As of December 31, 2011, the ratio of 90-day non-performing loans as a percentage of our total loan portfolio increased to 4.9%, compared to 4.2% as of December 31, 2010. Credits under renegotiation, including extended, modified and deferred repayments, increased to 4.2% of our total portfolio as of December 31, 2011, compared to 3.1% as of December 31, 2010.
Efficiency Project
During 2011, after the completion of the integration of Itaú and Unibanco branches in 2010, we implemented the “Efficiency Project”, which aims a close budget management and matricial monitoring of costs and revenues, the establishment of targets for each business unit and the promotion of a strong culture of operational efficiency.
During 2010 our main challenge was the completion of the integration of Unibanco branches and CSBs throughout Brazil. With the completion of the integration, we were able to improve our processes and, accordingly, expand the volume of services and increase our customer base, while maintaining service quality. We highlight the improvement of asset quality as the principal change in our financial condition for the year ended December 31, 2010. Our operations were positively affected by a decrease in nonperforming loans, mainly due to an improvement in the quality of our portfolio with individuals and companies, and an improvement in our recovery of loans previously written off as losses. Reduced delinquency levels are associated with the improving Brazilian economy.
Results of Operations
The following table shows the main components of our net income for 2011 and 2010.
| (in millions of R$, except percentages) | |
| | | Year Ended December 31, | | | Variation | |
| | | 2011 | | | 2010 | | | 2011-2010 | | | % | |
| | | | | | | |
| Banking product | | | 74,276 | | | | 69,415 | | | | 4,861 | | | | 7.0 | % |
| Interest and similar income | | | 97,352 | | | | 77,818 | | | | 19,534 | | | | 25.1 | % |
| Interest and similar expense | | | (55,599 | ) | | | (36,840 | ) | | | (18,759 | ) | | | 50.9 | % |
| Dividend income | | | 361 | | | | 326 | | | | 35 | | | | 10.7 | % |
| Net gain (loss) from financial assets and liabilities | | | 1,251 | | | | 2,862 | | | | (1,611 | ) | | | -56.3 | % |
| Foreign exchange results and exchange variation on transactions | | | 4,998 | | | | 1,824 | | | | 3,174 | | | | 174.0 | % |
| Banking service fees | | | 19,410 | | | | 17,092 | | | | 2,318 | | | | 13.6 | % |
| Income from insurance, private pension and capitalization operations before claim and selling expenses | | | 5,345 | | | | 4,923 | | | | 422 | | | | 8.6 | % |
| Other income | | | 1,158 | | | | 1,410 | | | | (252 | ) | | | -17.9 | % |
| Losses on loans and claims | | | (16,072 | ) | | | (12,938 | ) | | | (3,134 | ) | | | 24.2 | % |
| Expenses for allowance for loan losses | | | (20,038 | ) | | | (15,547 | ) | | | (4,491 | ) | | | 28.9 | % |
| Recovery of loans written off as loss | | | 5,477 | | | | 4,195 | | | | 1,282 | | | | 30.6 | % |
| Expenses for claims | | | (1,511 | ) | | | (1,586 | ) | | | 75 | | | | -4.7 | % |
| Operating margin | | | 58,204 | | | | 56,477 | | | | 1,727 | | | | 3.1 | % |
| Other operating income (expenses) | | | (39,953 | ) | | | (38,447 | ) | | | (1,506 | ) | | | 3.9 | % |
| General and administrative expenses | | | (35,674 | ) | | | (34,632 | ) | | | (1,042 | ) | | | 3.0 | % |
| Tax expenses | | | (4,166 | ) | | | (4,164 | ) | | | (2 | ) | | | 0.0 | % |
| Share of comprehensive income of unconsolidated companies | | | (113 | ) | | | 349 | | | | (462 | ) | | | -132.4 | % |
| Income before income tax and social contribution | | | 18,251 | | | | 18,030 | | | | 221 | | | | 1.2 | % |
| Current income tax and social contribution | | | (6,956 | ) | | | (4,042 | ) | | | (2,914 | ) | | | 72.1 | % |
| Deferred income tax and social contribution | | | 3,315 | | | | (1,494 | ) | | | 4,809 | | | | -321.9 | % |
| Net income | | | 14,610 | | | | 12,494 | | | | 2,116 | | | | 16.9 | % |
| Net income attributable to non-controlling interests | | | 773 | | | | 786 | | | | (13 | ) | | | -1.7 | % |
| Net income attributable to owners of the parent company | | | 13,837 | | | | 11,708 | | | | 2,129 | | | | 18.2 | % |
Interest and similar Income
The following table shows the main components of our interest income for 2011 and 2010.
| (in millions of R$, except percentages) | |
| | | Year Ended December 31, | | | Variation | |
| | | 2011 | | | 2010 | | | 2011-2010 | | | % | |
| | | | | | | |
| Interest and similar income | | | | | | | | | | | | | | | | |
| Interest on loan and lease operations | | | 58,492 | | | | 50,693 | | | | 7,799 | | | | 15.4 | % |
| Interest on Interbank deposits | | | 890 | | | | 824 | | | | 66 | | | | 8.1 | % |
| Interest on Central Bank compulsory deposits | | | 9,182 | | | | 4,025 | | | | 5,157 | | | | 128.1 | % |
| Interest on securities purchased under agreements to resell | | | 9,961 | | | | 9,940 | | | | 21 | | | | 0.2 | % |
| Interest on financial assets held for trading | | | 14,676 | | | | 8,028 | | | | 6,648 | | | | 82.8 | % |
| Interest on available-for-sale financial assets | | | 2,888 | | | | 2,997 | | | | (109 | ) | | | -3.6 | % |
| Interest on held-to-maturity financial assets | | | 360 | | | | 456 | | | | (96 | ) | | | -21.0 | % |
| Interest on other financial assets | | | 903 | | | | 855 | | | | 48 | | | | 5.7 | % |
| Total Interest and similar income | | | 97,352 | | | | 77,818 | | | | 19,534 | | | | 25.1 | % |
Banking Product
Banking product is a subtotal of individual line items, such as interest and similar income, interest and similar expense, dividend income, net gain (loss) from financial assets and liabilities, foreign exchange results and exchange variation on transactions, banking service fees, income from insurance, private pension and capitalization operations before claim and selling expenses and other income.
Interest and Similar Income
The R$19,534 million or 25.1% increase in interest income in 2011 is primarily due to an increase in the balance of loan and lease operations, financial assets held for trading and securities and in a lesser extent to Central Bank compulsory deposits.
Interest and similar income is a subtotal of individual line items, such as interest on loan and lease operations, interest on interbank deposits, interest on Central Bank compulsory deposits, interest on securities purchased under agreements to resell, interest on financial assets held for trading, interest on available-for-sale financial assets, interest on held-to-maturity financial assets and interest on other financial assets.
Interest on Loan and Lease Operations
The table below shows the performance of loan operations and lease operations, with loans classified by type of creditor (individuals and companies) and further broken down by type of product for individuals and by size of customer for companies. In addition, the table presents the balance of credit operations from our subsidiaries in Latin America outside of Brazil (Argentina, Chile, Uruguay and Paraguay).
| (in millions of R$, except percentages) | |
| | | As of December 31, | | | | |
| | | 2011 | | | 2010 | | | Variation (%) | |
| | | | | | | | | | | | | | | | | | | |
| Loans to individuals | | | 148,127 | | | | 42.8 | % | | | 124,787 | | | | 42.3 | % | | | 23,340 | | | | 18.7 | % |
| Credit card | | | 38,961 | | | | 11.3 | % | | | 33,041 | | | | 11.2 | % | | | 5,920 | | | | 17.9 | % |
| Personal loan | | | 35,253 | | | | 10.2 | % | | | 23,528 | | | | 8.0 | % | | | 11,725 | | | | 49.8 | % |
| Vehicles | | | 60,463 | | | | 17.5 | % | | | 60,151 | | | | 20.4 | % | | | 312 | | | | 0.5 | % |
| Mortgage Loans | | | 13,450 | | | | 3.9 | % | | | 8,067 | | | | 2.7 | % | | | 5,383 | | | | 66.7 | % |
| Loans to companies | | | 178,878 | | | | 51.7 | % | | | 156,533 | | | | 53.1 | % | | | 22,345 | | | | 14.3 | % |
| Small and Medium Businesses | | | 85,649 | | | | 24.7 | % | | | 79,950 | | | | 27.1 | % | | | 5,699 | | | | 7.1 | % |
| Corporate | | | 93,229 | | | | 26.9 | % | | | 76,583 | | | | 26.0 | % | | | 16,646 | | | | 21.7 | % |
| Foreign loans Latin America | | | 19,259 | | | | 5.6 | % | | | 13,517 | | | | 4.6 | % | | | 5,742 | | | | 42.5 | % |
| Total loan operations and lease operations | | | 346,264 | | | | 100.0 | % | | | 294,837 | | | | 100.0 | % | | | 51,427 | | | | 17.4 | % |
Our results of operations for the year ended December 31, 2011, when compared to the year ended December 31, 2010, reflected a significant impact from exchange rate variations. The exchange rate between the U.S. dollar and the real changed significantly. During the year ended December 31, 2011, the real depreciated 12.6% against the U.S. dollar, while in 2010 the real appreciated 4.3% against the U.S. dollar.
In 2011, we observed an increase in the CDI rate to 11.6% from 9.8% which caused impacts on costs as revenues of many our assets and liabilities.
Interest on loan and lease operations totaled R$58,492 million in 2011, an increase of R$7,799 million, or 15.4% compared to 2010. This increase was due primarily to an increase in the average volume of loans and lease transactions.
As of December 31, 2011, total loan operations and lease operations was R$346,264 million, a 17.4% increase compared to December 31, 2010. Loans to individuals increased by 18.7%, while loans to companies increased by 14.3% compared to December 31, 2010. During 2011, we maintained our strategy of increasing the volume of credit card lending, personal loans, mortgage loans and loans to medium businesses, with personal loans increasing at a higher rate than other segments. We highlight that mortgage loans and rural loans portfolios (which are regulatory required loans) are presented within loans to individuals or loans to companies, as appropriate, according to the type of client.
Loans to individuals totaled R$148,127 million in 2011, an increase of R$23,340 million, or 18.7% compared to 2010. This increase is primarily a result of a 49.8% growth in personal loans, totaling R$35,253 million, primarily due to the conclusion of systems integration at the end of 2010, which allowed a better use of Unibanco account holder data during 2011. Mortgage loans in 2011 compared to 2010 increased 66.7%, totaling R$13,450 million, as a result of a favorable Brazilian economic environment. Credit card increased 17.9%, totaling R$38,961 million in 2011, due to the consistently growing popularity of this product due to its practicality and safety. Credit card lending is an increasingly important tool that we use to acquire new customers, in particular low-income individuals. Vehicle financing increased 0.5% in 2011 compared to 2010, totaling R$60,463 million, due to the low overall growth in this market in Brazil, mainly due to macro prudential measures taken by the government at the end of 2010.
Loans to companies totaled R$178,878 million in 2011, an increase of R$22,345 million, or 14.3%, compared to 2010. Loans to small and medium businesses increased R$5,699 million, or 7.1% in 2011 compared to 2010, totaling R$85,649 million. Loans to corporate increased R$16,646 million, or 21.7%, in 2011 compared to 2010, totaling R$93,229 million, due to our strategy of growth in medium and large companies in 2011.
The balance of our foreign loans from our operations in Latin America outside Brazil (Argentina, Chile, Uruguay and Paraguay) totaled R$19,259 million as of December 31, 2011, an increase of 42.5% compared to December 31, 2010, primarily driven by the growth of operations abroad and the fluctuation of the real against several of these currencies.
Interest on Interbank Deposits
Interest on interbank deposits totaled R$890 million in 2011, an increase of R$66 million, or 8.1%, compared to 2010. This increase was due primarily to the increase on the average balance of these deposits, which is managed by our treasury department.
Interest on Central Bank Compulsory Deposits
Interest on Central Bank compulsory deposits totaled R$9,182 million in 2011, an increase of R$5,157 million, in 2011 compared to 2010. This increase was mainly due to increases in the average balance of levels of compulsory deposits required by the Central Bank compared to 2010. In December 2010, the Central Bank increased compulsory deposit requirements in order to restore the levels of compulsory deposits held by the banks before the international financial crisis of 2008, when the Central Bank decreased required amounts of compulsory deposits, and also to help control inflation and credit growth in Brazil.
Interest on Securities Purchased under Agreements to Resell
Interest on securities purchased under agreements to resell totaled R$9,961 million in 2011, an increase of R$21 million, or 0.2% in 2011 compared to 2010. This increase was mainly due to higher yield/rate of interest on securities purchased under agreements to resell in 2011 compared to 2010.
Interest on Financial Assets Held for Trading
Interest on financial assets held for trading totaled R$14,676 million in 2011, an increase of R$6,648 million, or 82.8%, compared to 2010. This increase was mainly due to an increase in the average balance and in the average yield/rate of financial assets held for trading in 2011 compared to 2010, which is managed by our treasury department.
Interest on Available for Sale Financial Assets
Interest on available-for-sale financial assets totaled R$2,888 million in 2011, a decrease of R$109 million, or 3.6%, compared to 2010. This decrease was mainly due to the decrease of average yield/rate of available-for-sale financial assets, partially offset by an increase in the average balance of available-for-sale financial assets in 2011 compared to 2010.
Interest on Held-to-Maturity Financial Assets
Interest on held-to-maturity financial assets totaled R$360 million in 2011, a decrease of R$96 million, or 21.0%, compared to 2010. This decrease was mainly due to a decrease in the average yield/rate of held-to-maturity financial assets, partially offset by an increase in the average balance of held-to-maturity financial assets in 2011 compared to 2010.
Interest on Other Financial Assets
Interest on other financial assets totaled R$903 million, an increase of R$48 million, or 5.7%, compared to 2010. This increase was mainly due to an increase in other operational income.
Interest and similar Expense
The following table shows the main components of our interest expense in 2011 and 2010.
| (in millions of R$, except percentages) | |
| | | Year Ended December 31, | | | Variation | |
| | 2011 | | | 2010 | | | 2011-2010 | | | % | |
| Interest and similar expense | | | | | | | | | | | | | | | | |
| | | | | | | | | | | | | | | | | |
| Interest on deposits | | | 14,757 | | | | 12,245 | | | | 2,512 | | | | 20.5 | % |
| Interest on securities sold under repurchase agreements | | | 22,133 | | | | 15,774 | | | | 6,359 | | | | 40.3 | % |
| Interbank market debt | | | 5,536 | | | | 2,100 | | | | 3,436 | | | | 163.6 | % |
| Institutional market debt | | | 7,934 | | | | 2,683 | | | | 5,251 | | | | 195.7 | % |
| Financial expense from reserves for insurance and private pension | | | 5,239 | | | | 4,038 | | | | 1,201 | | | | 29.8 | % |
| Total interest expense | | | 55,599 | | | | 36,840 | | | | 18,759 | | | | 50.9 | % |
Total interest expense was R$55,599 million in 2011, an increase of R$18,759 million, or 50.9%, compared to 2010, mainly due to increases in interest expense from interest on securities sold under repurchase agreements and from institutional market debt.
Interest on Deposits
Interest on deposits was R$14,757 million in 2011, an increase of R$2,512 million, or 20.5% in comparison to 2010. An increase in the average balance of deposits resulted in an increase in expenses of R$1,727 million in 2011 and an increase in the average yield/rate resulted in an increase in expenses of R$785 million. See “Item 4B. Business Overview — Selected Statistical Information — Average Balance Sheet and Interest Rate Data."
Interest on Securities Sold Under Repurchase Agreements
Interest on securities sold under repurchase agreements was R$22,133 million in 2011 an increase of R$6,359 million, or 40.3%, compared to 2010. An increase in the average balance resulted in an increase in expenses of R$4,119 million in 2011 and an increase in the average yield/rate resulted in an increase in expenses of R$2,240 million related to our strategy of liquidity management.
Interbank Market Debt
Interest expense on interbank market debt totaled R$5,536 million in 2011, an increase of R$3,436 million, or 163.6%, compared to 2010. This increase was due to an increase in the average balance of interbank market debt, that resulted in an increase in expenses of R$1,424 million, and to an increase on the average yield/rate that increased the expenses by R$2,011 million. See “Item 4B. Business Overview — Selected Statistical Information — Average Balance Sheet and Interest Rate Data.
Institutional Market Debt
Interest expense on institutional market debt totaled R$7,934 million in 2011, with an increase of R$5,251 million, or 195.7% compared to 2010. This increase was primarily due to an increase in the average yield/rate that resulted in an increase in expenses of R$4,463 million and by an increase on the average balance of institutional market debt that increased expenses by R$789 million. See “Item 4B. Business Overview — Selected Statistical Information — Average Balance Sheet and Interest Rate Data."
Financial Expense from Reserves for Insurance and Private Pension
Financial expense from reserves for insurance and private pension plans totaled R$5,239 million in 2011, an increase of R$1,201 million, or 29.8%, compared to 2010. This increase was primarily due to an increase in the average balance of reserves for insurance and private pension and liabilities for capitalization plans of R$921 million, and by an increase of R$281 million due to an increase on the average yield/rate. See “Item 4B. Business Overview — Selected Statistical Information — Average Balance Sheet and Interest Rate Data."
Other interest income
The following table shows the main components of our other interest income in 2011 and 2010.
| (in millions of R$, except percentages) | |
| | | Year Ended December 31, | | | Variation | |
| | | 2011 | | | 2010 | | | 2011-2010 | | | % | |
| | | | | | | |
| Other interest income | | | | | | | | | | | | | | | | |
| | | | | | | | | | | | | | | | | |
| Dividend income | | | 361 | | | | 326 | | | | 35 | | | | 10.7 | % |
| Net gain (loss) from financial assets and liabilities | | | 1,251 | | | | 2,862 | | | | (1,611 | ) | | | -56.3 | % |
| Foreign exchange results and exchange variation on transactions | | | 4,998 | | | | 1,824 | | | | 3,174 | | | | 174.0 | % |
| Total other interest income | | | 6,610 | | | | 5,012 | | | | 1,598 | | | | 31.9 | % |
In 2011, our other interest income totaled R$6,610 million, an increase of R$1,598 million, or 31.9%, in 2011 compared to 2010. This increase was primarily due to the increase of R$3,174 million in foreign exchange results and exchange variation on transactions, partially offset by a decrease of R$1,611 million in net gain (loss) from financial assets and liabilities related mainly to our risk management strategy and administration of gaps, particularly those associated with derivative instruments used to hedge our investments abroad.
Dividend Income
Dividend income totaled R$361 million on 2011, an increase of R$35 million compared to 2010, due to higher income from dividends of other companies.
Net Gain (Loss) from Financial Assets and Liabilities
Net gain (loss) from financial assets and liabilities totaled a gain of R$1,251 million in 2011 compared to gains of R$2,862 million in 2010, mainly to our risk management strategy and administration of gaps, particularly those associated with derivative instruments used to hedge our investments abroad.
Foreign Exchange Results and Exchange Variation on Transactions
Foreign exchange results and exchange variation on transactions totaled R$4,998 million an increase of R$3,174 million, or 174.0% compared to 2010, due mainly to the effect of the depreciation of the real against the dollar in our investments in subsidiaries abroad.
Non-Interest Income
The following table shows the main components of our non-interest income in 2011 and 2010.
| (in millions of R$, except percentages) | |
| | | Year Ended December 31, | | | Variation | |
| | | 2011 | | | 2010 | | | 2011-2010 | | | % | |
| | | | | | | |
| Non-interest income | | | | | | | | | | | | | | | | |
| | | | | | | | | | | | | | | | | |
| Banking service fees | | | 19,410 | | | | 17,092 | | | | 2,318 | | | | 13.6 | % |
| Income from insurance, private pension and capitalization operations before claim and selling expenses | | | 5,345 | | | | 4,923 | | | | 422 | | | | 8.6 | % |
| Other income | | | 1,158 | | | | 1,410 | | | | (252 | ) | | | -17.9 | % |
| Total non-interest income | | | 25,913 | | | | 23,425 | | | | 2,488 | | | | 10.6 | % |
In 2011, our non-interest income totaled R$25,913 million, an increase of R$2,488 million, or 10.6%, in 2011 compared to 2010. This increase was primarily due an increase of R$2,318 million in banking service fees, partially offset by a decrease of R$252 million in other non-interest income.
Banking Service Fees
Banking service fees totaled R$19,410 million in 2011, an increase of R$2,318 million, or 13.6%, compared to 2010. This increase was mainly due to increased revenues from credit card fees, which increased by 16.2% from R$6,408 million in 2010 to R$7,446 million in 2011, primarily due to higher annual fees, and higher interchange revenues arising from the increased volume of transactions due to year-end sales and growth in the number of credit card transactions. See note 23 of our consolidated financial statements for more details.
Income from Insurance, Private Pension and Capitalization Operations Before Claim and Selling Expenses
Income from insurance, private pension and capitalization operations before claim and selling expenses totaled R$5,345 million in 2011, an increase of R$422 million, or 8.6%, compared to 2010. This increase was mainly due to an increase in insurance and private pension premiums and to a lesser extent to an increase on revenue from capitalization plans, partially offset by an increase in reserves for insurance and private pension.
Other Income
Other income totaled R$1,158 million in 2011, a decrease of R$252 million, or 17.9%, compared to 2010. This decrease was mainly due to a reversal of operational provisions in 2010.
Losses on Loans and Claims
Losses on loans and claims are the sum of expenses for allowance for loan losses, recovery of loans written off as losses and expenses for claims. In 2011, our losses on loans and claims increased from R$12,938 million in 2010 to R$16,072 in 2011 a R$3,134 million increase, or 24.2%, mainly due to an increase of expenses for allowance for loan losses and to a lesser extent to an increase of expenses for claims, partially offset by an increase in the recovery in loans written off as losses.
Expenses for Allowance for Loan Losses
Expenses for allowance for loan losses totaled R$20,038 million in 2011, an increase of R$4,491 million, or 28.9%, in comparison to 2010. See note 11.b of our consolidated financial statements for more details.
During 2011, the asset quality of our loan portfolio decreased in comparison to the previous year. In 2011, the adverse effects of the international economic and financial crisis spread among industries and resulted in increased risk related to certain credit portfolios. Levels of non-performing loans increased for individuals and companies generally, reflecting these adverse market conditions.
Recovery of Loans Written off as Losses
Recovery of loans written off as losses increased from R$4,195 million in 2010 to R$5,477 million in 2011, an increase of R$1,282 million, or 30.6%, mainly due to an increase in collection efforts.
Expenses for Claims
Expenses for claims decreased from R$1,586 million in 2010 to R$1,511 million in 2011, a reduction of R$75 million, or 4.7%, mainly due to decreases in claims in the life and personal accidents portfolios.
Operating Margin
Operating margin is the sum of banking product and losses on loans and claims. The operating margin increased R$1,727 million, or 3.1%, amounting R$58,204 million in 2011, due to the 7.0% growth in the banking product, partially offset by the 24.2% increase in the losses on loans and claims.
The following table shows the main components of our non-interest expense in 2011 and 2010.
| (in millions of R$, except percentages) | |
| | | Year Ended December 31, | | | Variation | |
| | | 2011 | | | 2010 | | | 2011-2010 | | | % | |
| | | (in millions of R$) | | | | |
| | | | | | | | | | | | | |
| General and administrative expenses | | | (35,674 | ) | | | (34,632 | ) | | | (1,042 | ) | | | 3.0 | % |
| Salaries and employee benefits | | | (13,373 | ) | | | (13,007 | ) | | | (366 | ) | | | 2.8 | % |
| Administrative expenses | | | (12,490 | ) | | | (12,350 | ) | | | (139 | ) | | | 1.1 | % |
| Amortization of intangible assets | | | (984 | ) | | | (978 | ) | | | (6 | ) | | | 0.6 | % |
| Insurance selling expenses | | | (1,268 | ) | | | (1,330 | ) | | | 61 | | | | -4.6 | % |
| Depreciation | | | (1,183 | ) | | | (1,165 | ) | | | (18 | ) | | | 1.6 | % |
| Other non-interest expense | | | (6,376 | ) | | | (5,801 | ) | | | (575 | ) | | | 9.9 | % |
| Tax expenses | | | (4,166 | ) | | | (4,164 | ) | | | (3 | ) | | | 0.1 | % |
| Share of comprehensive income of unconsolidated companies | | | (113 | ) | | | 349 | | | | (462 | ) | | | -132.4 | % |
| Total non-interest expense | | | (39,953 | ) | | | (38,447 | ) | | | (1,506 | ) | | | 3.9 | % |
Non-interest expense totaled R$39,953 million in 2011, an increase of R$1,506 million, or 3.9%, compared to 2010. This increase was mainly due to general and administrative expenses and the increase in share of comprehensive income of unconsolidated companies.
General and Administrative Expenses
General and administrative expenses is composed by salaries and employee benefits, administrative expenses, amortization of intangible assets, insurance selling expenses, depreciation and other non-interest expenses.
Salaries and Employee Benefits
Salaries and employee benefits totaled R$13,373 million in 2011, an increase of 2.8% compared with 2010, partially offset by the 3.2% decrease in number of employees in 2011. This increase was lower than the 9.0% on the labor agreement. See note 25 to our consolidated financial statements.
Administrative Expenses
Administrative expenses totaled R$12,490 million in 2011, an increase of R$139 million, or 1.1%, compared to 2010. This increase was driven by the higher volume of overall customer transactions, partially offset by a reduction of expenses related to the migration of Unibanco branches and CSBs to the Itaú layout and platform.
Amortization of Intangible Assets
Amortization of intangible assets totaled R$984 million in 2011, an increase of R$6 million, or 0.6%, compared to 2010, due to amortization of intangible assets in line with 2010. See note 15 to our consolidated financial statements.
Insurance Selling Expenses
Insurance selling expenses totaled R$1,268 million in 2011, a decrease of R$61 million, or 4.6%, compared to 2010. This decrease was mainly due to improvements in our insurance selling process.
Depreciation
Depreciation totaled R$1,183 million in 2011, an increase of R$18 million, or 1.6%, compared to 2010. This increase was due to an increase in the balance sheet amount of our fixed assets.
Other Non-Interest Expense
Other non-interest expenses totaled R$6,376 million in 2011, an increase of R$575 million, or 9.9%, compared to 2010. This increase was mainly related to an increase in provisions for civil lawsuits (see note 31 to our consolidated financial statements), as well as increased selling expenses for credit cards due to the growth in client base and volume of transactions (see note 25 to our consolidated financial statements).
Tax Expenses
Tax expenses amounted to R$4,166 million in 2011 an increase of R$ 2 million, or 0.1%, from R$4,164 million in 2010, remaining practically stable. PIS, COFINS expenses increased in 2011, but were offset by the decrease in ISS and other tax expenses.
Share of Comprehensive Income of Unconsolidated Companies
Share of comprehensive income of unconsolidated companies decreased from a R$349 million gain in 2010 to a R$113 million loss in 2011 a R$ 462 million decrease, or 132.4%, mainly due to a lower result fromBanco Português de Investimento, which had a R$75 million profit in 2010 and had a R$343 million loss in 2011. The investment held in theBanco Português de Investimento was adjusted to recognize its market value based on the share price on the respective closing dates.
Current Income Tax and Social Contribution and Deferred Income Tax and Social Contribution
Certain amounts of income and expenses are recognized in our statement of income but do not affect our taxable basis and, conversely certain amounts are taxable income or deductible expenses in determining our taxes on income but do not affect our statement of income. Those items are known as permanent differences, which it segregates our total income tax and social contribution in two different lines: current income tax and social contribution and deferred income tax and social contribution. The first is the tax expense demanded by the Brazilian tax laws in the period. The second is a result from the permanent differences.
Income tax expense and social contribution for the year resulted in a tax expense of R$3,641 million in 2011 compared to R$5,536 million in the prior year, a 34.2% decrease. Deferred income tax and social contribution totaled positive R$3,315 million, a decrease of R$4,809 million compared to 2010. Current income tax and social contribution totaled R$6,956 million in 2011, an increase of R$2,914 million, or 72.1% compared to 2010. The main reason for this decrease was the effect of, decreased exchange rate losses on our investments in subsidiaries abroad and related increased gains on the derivative instruments used to hedge our investments in subsidiaries abroad as described below, which was partially offset by increased income in the banking activities.
For Brazilian tax purposes, exchange rate gains and losses on our investments in subsidiaries abroad are not taxable, if they represent a gain, or are not deductible, if they represent a loss, they constitute a permanent difference. From an economic perspective we hedge our investments in subsidiaries outside Brazil by using foreign-currency denominated liabilities or derivative instruments. The gains or losses on derivative instruments and the exchange rate gains and losses on foreign-currency denominated liabilities are taxable or deductible for purposes of Brazilian taxes.
Results of our operating segments
The following discussion should be read in conjunction with our consolidated financial statements, especially note 33 regarding segment information included elsewhere in this annual report as well as the information included under “Item 3A. Selected Financial Data” and “Item 4B. Business Overview - Selected Statistical Information”. The following discussion contains forward-looking statements that involve risks and uncertainties. Our actual results may differ materially from these discussed in forward-looking statements as a result of various factors, including those set in forth in “Cautionary Statement Regarding Forward-Looking Statements” and “Item 3D. Risk Factors”.
Overview
We provide awide range of financial products and services to a diverse customer base of individuals and corporate customers.
Below we describe our four operational and reporting segments: Commercial Bank, Itaú BBA, Consumer Credit, and Activities with the Market and Corporation:
Commercial Bank
Our commercial bank segment provides a broad range of banking services to a diversified client base of individuals and companies, among which are the following: retail clients (individuals and very small companies), high net worth clients, private banking clients, and small and medium-sized companies. The products and services provided by our commercial bank segment include insurance, private pension and capitalization plans, credit cards, asset management and loans, among others. The segment provides solutions specifically developed to meet the needs of clients, devising marketing strategies appropriate to each of the different profiles and using the most convenient distribution channels. Accordingly, we are constantly seeking to increase the number of products provided to clients, diversifying the sources of income. The segment is an important source of funding for our operations and provides significant interest and banking services income.
Itaú BBA
Itaú BBA is the segment responsible for banking operations for large companies and investment banking services. Itaú BBA offers a wide range of products and services to the largest economic groups of Brazil. The management model of Itaú BBA is focused on the development of close relationships with its clients, gaining an in-depth knowledge of their needs and providing customized solutions. The investment banking activities comprise lending to corporate borrowers through fixed and variable income instruments. In addition, this segment performs activities related to mergers and acquisitions.
Consumer Credit
Our consumer credit segment is responsible for the development of the strategy of increasing the range of financial products and services beyond the universe of clients who are accountholders. Thus, the consumer credit segment comprises vehicle financing services provided by units other than the branch network, credit cards to clients who are not accountholders, and credit to low income individuals. The business of vehicle financing comprises new vehicles, used vehicles, heavy vehicles and motorcycles. The credit approval process for vehicle financing is based on scoring models that provides prompt approval of credit proposals for the clients, using the Internet to process these proposals with security and efficiency.
Activities with the Market and Corporation
Our activities with the market and corporation segment manages the interest income associated with our capital surplus, subordinated debt surplus and the net balance of tax credits and debits, as well as the net interest income from the trading of financial assets through proprietary positions (desks), management of currency interest rate gaps, and other risk factors, arbitrage opportunities in the foreign and domestic markets, and mark-to-market of financial assets. In this segment, we also present the effect of non-recurring items that are not considered in the managerial statement of income.
Basis of presentation of segment information
We prepare segment information based on reports used by senior management to assess the performance of our business and to make decisions regarding the allocation of funds for investment and other purposes. Our senior management uses a variety of information for such purposes, including financial information that is prepared based on accounting practices adopted in Brazil. Our segment information is not prepared in accordance with IFRS.
The segment information has been prepared following accounting practices adopted in Brazil modified for the adjustments described below. Financial segment information differs from accounting practices adopted in Brazil because: (i) it includes recognition of the impact related to allocated capital using a proprietary model; (ii) it presents net interest income using certain management criteria. For more information our segment financial information, see note 33 to our audited consolidated financial statements.
Capital allocation to each segment
The book value of each of stockholders' equity and subordinated debt was replaced by funding at estimated market price, and interest income and expense were allocated to the segments, based on Tier I Capital, following a proprietary model, with surplus capital and subordinated debt being allocated to the activities with the market and corporation segment. The tax effects of payments of interest on capital by each segment have been reversed and reallocated to the segments in amounts proportional to the amount of the Tier I Capital. Share of income of unconsolidated companies which is not related to segment and non-controlling interest were allocated to the activities with the market and corporation segment.
Net interest income
We adopt a strategy to manage the foreign exchange risk of subsidiaries outside Brazil in order to economically hedge against impacts on our results arising from variation in exchange rates. In order to achieve this objective, we use derivative instruments to hedge against foreign currency risk. Hedge accounting is not applied for those derivatives; instead, they are recorded at fair value, with gains and losses included in income.
Our hedging strategy considers all tax effects, including those not related to taxes or to the non-deductibility of the exchange variation on the investments abroad as well as gains and losses on derivative financial instruments used. When the parity of the real against foreign currencies is considerable, there is a significant impact on interest income and expense.
As a result of the above, we have adopted a managerial statement of income to report segment information. The managerial statement of income is prepared by making reclassifications in the financial statements in accordance with the accounting practices adopted in Brazil. Tax effects of the hedge of these investments abroad, which are presented in tax expenses (PIS and COFINS) and income tax and social contribution expense, have been reclassified for our segment information.
Additionally, the managerial interest margin for banking product includes, for each operation, allocation of its opportunity cost.
For a better analysis we present below a summary of the results from our operating segments.
We have made adjustments in our management reporting in 2011. The principal adjustment was related to the change in the income tax rate applicable to our operational segments from 34% to 40%, which reflects the full tax rate applicable for financial institutions. However, since we have obtained an interim judicial decision that allows us to pay income tax at the rate of 34%, instead of 40%, we allocate the amount collected in excess of the equivalent of 34% to the activities with the market and corporation segment. This adjustment affected all operating segments.
| From January 1 to December 31, 2011 | |
| (In millions ofreais, except per share information) | |
| Consolidated Statement of Income | | COMMERCIAL
BANK | | | ITAÚ BBA | | | CONSUMER
CREDIT | | | ACTIVITIES
WITH THE
MARKET AND
CORPORATION | | | ITAÚ
UNIBANCO | | | ADJUSTMENTS | | | IFRS CONSOLIDATED | |
| | | | | | | | | | | | | | | | | | | | | | |
| Banking product | | | 48,236 | | | | 6,897 | | | | 14,102 | | | | 5,109 | | | | 74,257 | | | | 19 | | | | 74,276 | |
| Losses on loans and claims | | | (11,011 | ) | | | (134 | ) | | | (4,270 | ) | | | (521 | ) | | | (15,936 | ) | | | (136 | ) | | | (16,072 | ) |
| Operating margin | | | 37,225 | | | | 6,763 | | | | 9,832 | | | | 4,588 | | | | 58,321 | | | | (117 | ) | | | 58,204 | |
| Other operating income (expenses) | | | (25,829 | ) | | | (2,911 | ) | | | (7,911 | ) | | | (390 | ) | | | (37,025 | ) | | | (2,928 | ) | | | (39,953 | ) |
| Income before income tax and social contribution | | | 11,396 | | | | 3,852 | | | | 1,921 | | | | 4,198 | | | | 21,296 | | | | (3,045 | ) | | | 18,251 | |
| Income tax and social contribution | | | (3,833 | ) | | | (1,287 | ) | | | (477 | ) | | | (244 | ) | | | (5,841 | ) | | | 2,200 | | | | (3,641 | ) |
| Non-controlling interest in subsidiaries | | | - | | | | - | | | | - | | | | (885 | ) | | | (814 | ) | | | 41 | | | | (773 | ) |
| Net income attributable to owners of the parent company | | | 7,563 | | | | 2,565 | | | | 1,444 | | | | 3,069 | | | | 14,641 | | | | (804 | ) | | | 13,837 | |
From January 1 to December 31, 2010 | |
| (In millions ofreais, except per share information) | |
| Consolidated Statement of Income | | COMMERCIAL
BANK | | | ITAÚ BBA | | | CONSUMER
CREDIT | | | ACTIVITIES
WITH THE
MARKET AND
CORPORATION | | | ITAÚ
UNIBANCO | | | ADJUSTMENTS | | | IFRS
CONSOLIDATED | |
| Banking product | | | 41,238 | | | | 6,400 | | | | 15,148 | | | | 3,657 | | | | 66,390 | | | | 3,025 | | | | 69,415 | |
| Losses on loans and claims | | | (9,523 | ) | | | 186 | | | | (3,754 | ) | | | (2 | ) | | | (13,093 | ) | | | 155 | | | | (12,938 | ) |
| Operating margin | | | 31,715 | | | | 6,586 | | | | 11,394 | | | | 3,655 | | | | 53,297 | | | | 3,180 | | | | 56,477 | |
| Other operating income (expenses) | | | (22,927 | ) | | | (2,721 | ) | | | (7,826 | ) | | | (860 | ) | | | (34,327 | ) | | | (4,120 | ) | | | (38,447 | ) |
| Income before income tax and social contribution | | | 8,788 | | | | 3,865 | | | | 3,568 | | | | 2,795 | | | | 18,970 | | | | (940 | ) | | | 18,030 | |
| Income tax and social contribution | | | (2,509 | ) | | | (1,023 | ) | | | (1,054 | ) | | | (495 | ) | | | (5,081 | ) | | | (455 | ) | | | (5,536 | ) |
| Non-controlling interest in subsidiaries | | | 2 | | | | - | | | | - | | | | (914 | ) | | | (866 | ) | | | 80 | | | | (786 | ) |
| Net income attributable to owners of the parent company | | | 6,281 | | | | 2,842 | | | | 2,514 | | | | 1,386 | | | | 13,023 | | | | (1,315 | ) | | | 11,708 | |
Results of Operations for Year Ended December 31, 2011 Compared to Year Ended December 31, 2010
The result per segment is disclosed based on managerial criteria. Such information excludes certain results which are considered not related to our core business by our management. We highlight that in note 33 of our consolidated financial statements, we have disclosed the main IFRS adjustments into the business operating segments’ consolidated managerial data to obtain the IFRS consolidated financial statements.
Commercial Bank
We have a large and diverse portfolio of products to address our customers’ needs. The main products and services we provide to our accountholders are:
| · | Credit: personal loans, overdraft protection, payroll loans, vehicles, credit cards, mortgage and agricultural loans, working capital, trade note discount and export; |
| · | Investments: pension plans, mutual funds, time deposits, demand deposit accounts, savings accounts and capitalization plans; and |
| · | Services: insurance (life, home, credit/cash cards, vehicles, loan protection, among others), exchange, brokerage and others. |
The table below shows our banking product in the commercial bank segment for 2011 and 2010:
| | | For the Year Ended December 31, | |
| | | 2011 | | | 2010 | | | 2011-2010 | | | % | |
| | | (in millions of R$) | | | Variation | |
| Banking product | | | 48,236 | | | | 41,238 | | | | 6,998 | | | | 17.0 | % |
| Interest margin(1) | | | 31,584 | | | | 27,068 | | | | 4,516 | | | | 16.7 | % |
| Banking service fees | | | 10,915 | | | | 9,246 | | | | 1,669 | | | | 18.1 | % |
| Income from insurance, private pension and capitalization operations before claim and selling expenses | | | 5,229 | | | | 4,469 | | | | 760 | | | | 17.0 | % |
| Other income | | | 508 | | | | 455 | | | | 53 | | | | 11.6 | % |
(1) Includes net interest and similar income and expenses, dividend income, net gain (loss) from financial assets and liabilities and foreign exchange results and exchange variation on transactions.
For the year ended December 31, 2011, our consolidated banking product from the commercial bank segment increased by 17.0%, from R$41,238 million in the year ended December 31, 2010 to R$48,236 million for the same period in 2011, an increase of R$6,998 million. This increase was mainly due to the 16.7% growth in interest margin, related to a 20.4% growth in the loan portfolio as well as a 18.1% growth in banking service fees related to the increase in our customer base and to an increase in the volume of services, and to a lesser extent to income from insurance, private pension and capitalization operations before claim and selling expenses that increased by 17.0% and to other income that increased by 11.6%.
The table below shows an increase of 15.6% on our losses on loans and claims in the commercial bank segment for the year ended December 31, 2011, compared to the same period of 2010.
| | | For the Year Ended December 31, | |
| | | 2011 | | | 2010 | | | 2011-2010 | | | % | |
| | | (in millions of R$) | | | Variation | |
| Banking product | | | 48,236 | | | | 41,238 | | | | 6,998 | | | | 17.0 | % |
| Losses on loans and claims | | | (11,011 | ) | | | (9,523 | ) | | | (1,488 | ) | | | 15.6 | % |
| Expenses for allowance for loan losses | | | (13,845 | ) | | | (10,808 | ) | | | (3,037 | ) | | | 28.1 | % |
| Recovery of loans written-off as losses | | | 4,346 | | | | 2,893 | | | | 1,453 | | | | 50.2 | % |
| Expenses for claims | | | (1,512 | ) | | | (1,608 | ) | | | 96 | | | | -6.0 | % |
| Operating margin | | | 37,225 | | | | 31,715 | | | | 5,510 | | | | 17.4 | % |
Our expenses for allowance for loan losses increased by 28.1%, from R$10,808 million in the year ended December 31, 2010 to R$13,845 million in the same period of 2011. We highlight the increase in the delinquency levels and reduction in the asset quality as the principal change in our commercial bank segment for the year ended December 31, 2011. This increase was partially offset by the increase in the recovery of loans written-off as losses due to a higher effort in collection services and lower expenses for claims.
The table below shows an increase of 12.7% on our other operating income (expenses) from the commercial bank segment for the year ended December 31, 2011, compared to the same period of 2010.
| | | For the Year Ended December 31, | |
| | | 2011 | | | 2010 | | | 2011-2010 | | | % | |
| | | (in millions of R$) | | | Variation | |
| Operating margin | | | 37,225 | | | | 31,715 | | | | 5,510 | | | | 17.4 | % |
| Other operating income (expenses) | | | (25,829 | ) | | | (22,927 | ) | | | (2,902 | ) | | | 12.7 | % |
| Non-interest expenses(1) | | | (23,315 | ) | | | (20,827 | ) | | | (2,488 | ) | | | 11.9 | % |
| Tax expenses for ISS, PIS and COFINS and other | | | (2,596 | ) | | | (2,139 | ) | | | (457 | ) | | | 21.4 | % |
| Share of comprehensive income of unconsolidated companies, net | | | (43 | ) | | | 19 | | | | (62 | ) | | | -326.3 | % |
| Other | | | 125 | | | | 20 | | | | 105 | | | | 525.0 | % |
| Income before income tax and social contribution | | | 11,396 | | | | 8,788 | | | | 2,608 | | | | 29.7 | % |
(1) Refers to general and administrative expenses including salaries and employee benefits, depreciation expenses and amortization.
Upon the completion of the integration of Unibanco's branches and other customer sites throughout Brazil in the end of 2010. During 2011 we were able to improve our processes and expand accordingly the volume of services and increase our customer base, while maintaining service quality. Non-interest expenses totaled R$23,315 million in 2011, an increase of R$2,488 million, or 11.9%, compared to 2010.This increase was driven by the higher volume of overall customer transactions, an increase in provisions for civil lawsuits (see note 31 of our consolidated financial statements), as well as increased selling expenses for credit cards due to the growth in client base and volume of transactions (see note 25 to our consolidated financial statements) and to the 9.0% salaries increase on the labor agreement, partially offset by a reduction of expenses related to the migration of Unibanco branches and CSBs to the Itaú layout and platform and to improvements in our insurance selling process.
Our tax expense for ISS, PIS and COFINS and other taxes increased 21.4% compared to year ended December 31, 2010. This increase reflects the increase in revenues and in our operational activities throughout the year. See “—Net interest income above”.
Our share of comprehensive income of unconsolidated companies, net from commercial bank activities decreased by R$62 million for the year ended December 31, 2011 compared to the same period of 2010, mainly due to an impairment of the investment held in the Banco Português de Investimento to recognize its market value based on the share price on the respective closing dates.
The net income from commercial bank activities totaled R$7,563 million in 2011, an increase of R$1,282 million compared to 2010.
| | | For the Year Ended December 31, | |
| | | 2011 | | | 2010 | | | 2011-2010 | | | % | |
| | | (in millions of R$) | | | Variation | |
| Income before income tax and social contribution | | | 11,396 | | | | 8,788 | | | | 2,608 | | | | 29.7 | % |
| Income tax and social contribution | | | (3,833 | ) | | | (2,509 | ) | | | (1,324 | ) | | | 52.8 | % |
| Non-controlling interest in subsidiaries | | | - | | | | 2 | | | | (2 | ) | | | -100.0 | % |
| Net income attributable to owners of the parent company | | | 7,563 | | | | 6,281 | | | | 1,282 | | | | 20.4 | % |
Income tax expense and social contribution for the year resulted in a tax expense of R$3,833 million in 2011 compared to R$2,509 million in the prior year, a 52.8% increase. The main reasons for this was the increase in income before income tax and social contribution and the adjustment in tax rate as explained above.
Itaú BBA
For our corporate and investment bank activities (Itaú BBA), the banking product for 2011 compared to 2010, is shown in the table below:
| | | For the Year Ended December 31, | |
| | | 2011 | | | 2010 | | | 2011-2010 | | | % | |
| | | (in millions of R$) | | | Variation | |
| Banking product | | | 6,897 | | | | 6,400 | | | | 497 | | | | 7.8 | % |
| Interest margin(1) | | | 4,896 | | | | 4,601 | | | | 295 | | | | 6.4 | % |
| Banking service fees | | | 2,123 | | | | 1,932 | | | | 191 | | | | 9.9 | % |
| Income from insurance, private pension and capitalization operations before claim and selling expenses | | | - | | | | - | | | | - | | | | - | |
| Other income | | | (122 | ) | | | (133 | ) | | | 11 | | | | -8.3 | % |
(1) Includes net interest and similar income and expenses, dividend income, net gain (loss) from financial assets and liabilities and foreign exchange results and exchange variation on transactions.
For the year ended December 31, 2011, our consolidated banking product from Itaú BBA increased by 7.8%, from R$6,400 million in the year ended December 31, 2010 to R$6,897 million for the same period in 2011, an increase of R$497 million. This increase was mainly due to an increase in interest margin and in banking service fees due to an increase in the large companies’ segment credit portfolio by 21.7%, and an increase in revenues from investment bank transactions and credit fees and by an increase in other income of R$11 million.
Our losses on loans and claims from Itaú BBA are shown in the table below:
| | | For the Year Ended December 31, | |
| | | 2011 | | | 2010 | | | 2011-2010 | | | % | |
| | | (in millions of R$) | | | Variation | |
| Banking product | | | 6,897 | | | | 6,400 | | | | 497 | | | | 7.8 | % |
| Losses on loans and claims | | | (134 | ) | | | 186 | | | | (320 | ) | | | -172.0 | % |
| Expenses for allowance for loan losses | | | (266 | ) | | | (182 | ) | | | (84 | ) | | | 46.2 | % |
| Recovery of loans written-off as losses | | | 132 | | | | 368 | | | | (236 | ) | | | -64.1 | % |
| Expenses for claims | | | - | | | | - | | | | - | | | | - | |
| Operating margin | | | 6,763 | | | | 6,586 | | | | 177 | | | | 2.7 | % |
We had a loss of R$134 million on loans and claims for the year ended December 31, 2011 compared to a gain on losses on loans and claims of R$186 million for the year ended December 31, 2010. In both 2011 and 2010 we reversed provisions for allowance for loans losses, with significantly increased reversals in 2010. The strong quality level of the credit portfolio is to be highlighted, with 95,3% of the credits as described as “AA”, “A” an “B” risk ratings, in accordance with criteria set forth in the Brazilian Monetary Council Resolution 2,682.
Our other operating income (expenses) in the Itaú BBA segment in the table below shows an increase of 7.0% for the year ended December 31, 2011, compared to the same period of 2010.
| | | For the Year Ended December 31, | |
| | | 2011 | | | 2010 | | | 2011-2010 | | | % | |
| | | (in millions of R$) | | | Variation | |
| Operating margin | | | 6,763 | | | | 6,586 | | | | 177 | | | | 2.7 | % |
| Other operating income (expenses) | | | (2,911 | ) | | | (2,721 | ) | | | (190 | ) | | | 7.0 | % |
| Non-interest expenses(1) | | | (2,605 | ) | | | (2,379 | ) | | | (226 | ) | | | 9.5 | % |
| Tax expenses for ISS, PIS and COFINS and other | | | (341 | ) | | | (387 | ) | | | 46 | | | | -11.9 | % |
| Share of comprehensive income of unconsolidated companies, net | | | 6 | | | | (6 | ) | | | 12 | | | | -200.0 | % |
| Other | | | 29 | | | | 51 | | | | (22 | ) | | | -43.1 | % |
| Income before income tax and social contribution | | | 3,852 | | | | 3,865 | | | | (13 | ) | | | -0.3 | % |
(1) Refers to general and administrative expenses including salaries and employee benefits, depreciation expenses and amortization.
Non-interest expenses totaled R$2,605 million in 2011, an increase of R$226 million, or 9.5%, compared to 2010. The rise in non-interest expense is primarily attributable to the 9.0% salaries increase on the labor agreement.
Tax expense for ISS, PIS and COFINS and other taxes resulted in R$341 million in 2011 compared to R$387 million in the prior year, an 11.9% decrease.
Net income from Itaú BBA activities decreased by 9.7% for the year ended December 31, 2011 compared to the same period of 2010, as showed in the table below.
| | | For the Year Ended December 31, | |
| | | 2011 | | | 2010 | | | 2011-2010 | | | % | |
| | | (in millions of R$) | | | Variation | |
| Income before income tax and social contribution | | | 3,852 | | | | 3,865 | | | | (13 | ) | | | -0.3 | % |
| Income tax and social contribution | | | (1,287 | ) | | | (1,023 | ) | | | (264 | ) | | | 25.8 | % |
| Non-controlling interest in subsidiaries | | | - | | | | - | | | | - | | | | - | |
| Net income attributable to owners of the parent company | | | 2,565 | | | | 2,842 | | | | (277 | ) | | | -9.7 | % |
Income before tax and social contribution from Itaú BBA decreased 0.3% for the period ended December 31, 2011 compared to the same period of 2010, from R$3,865 million in 2010 to R$3,852 million in 2011. Income before tax and social contribution for the year totaled R$1,287 million in 2011 compared to R$1,023 million in the prior year, a 25.8% increase due to the adjustment in tax rate as explained above.
Consumer credit
We offer credit cards to non-account holders both through direct sales and through our partnerships, in the form of joint ventures and operating agreements with major retailers present in the Brazilian market. We also offer vehicle financing to non-account holders, through a wide chain of partnerships with both new and used car retailers in Brazil.
The banking product from consumer credit business operating segment is show in the table below.
| | | For the Year Ended December 31, | |
| | | 2011 | | | 2010 | | | 2011-2010 | | | % | |
| | | (in millions of R$) | | | Variation | |
| Banking product | | | 14,102 | | | | 15,148 | | | | (1,046 | ) | | | -6.9 | % |
| Interest margin(1) | | | 8,356 | | | | 9,044 | | | | (688 | ) | | | -7.6 | % |
| Banking service fees | | | 5,719 | | | | 5,765 | | | | (46 | ) | | | -0.8 | % |
| Income from insurance, private pension and capitalization operations before claim and selling expenses | | | (13 | ) | | | 254 | | | | (267 | ) | | | -105.1 | % |
| Other income | | | 40 | | | | 85 | | | | (45 | ) | | | -52.9 | % |
(1) Includes net interest and similar income and expenses, dividend income, net gain (loss) from financial assets and liabilities and foreign exchange results and exchange variation on transactions.
For the year ended December 31, 2011, our interest margin from consumer credit decreased by 7.6%, from R$9,044 million in the year ended December 31, 2010 to R$8,356 million for the same period in 2011, a decrease of R$ 688 million. Banking service fees remained in line with 2010. The income from insurance, private pension and capitalization operations before claim and selling expenses decreased R$ 267 million in the year ended December 31, 2011 compared to the year ended December, 31, 2010. This decrease is due to the small growth in the vehicles loan portfolio during 2011, as a result of an increase in the capital requirements established by Central Bank for this market.
Our losses on loans and claims from consumer credit segment increased 13.7% in the year ended December 31, 2011 compared to the same period of 2010, from R$3,754 million in 2010 to R$4,270 million in 2011, as shown in the table below.
| | | For the Year Ended December 31, | |
| | | 2011 | | | 2010 | | | 2011-2010 | | | % | |
| | | (in millions of R$) | | | Variation | |
| Banking product | | | 14,102 | | | | 15,148 | | | | (1,046 | ) | | | -6.9 | % |
| Losses on loans and claims | | | (4,270 | ) | | | (3,754 | ) | | | (516 | ) | | | 13.7 | % |
| Expenses for allowance for loan losses | | | (5,270 | ) | | | (4,702 | ) | | | (568 | ) | | | 12.1 | % |
| Recovery of loans written-off as losses | | | 1,000 | | | | 948 | | | | 52 | | | | 5.5 | % |
| Expenses for claims | | | - | | | | - | | | | - | | | | - | |
| Operating margin | | | 9,832 | | | | 11,394 | | | | (1,562 | ) | | | -13.7 | % |
Our expenses for allowance for loan losses increased by 12.1%, from R$4,702 million in the year ended December 31, 2010 to R$5,270 million in the same period of 2011. This increase is due to an increase in the delinquency levels of Brazilian consumers generally and the growth in the credit portfolio in 2011.
| | | For the Year Ended December 31, | |
| | | 2011 | | | 2010 | | | 2011-2010 | | | % | |
| | | (in millions of R$) | | | Variation | |
| Operating margin | | | 9,832 | | | | 11,394 | | | | (1,562 | ) | | | -13.7 | % |
| Other operating income (expenses) | | | (7,911 | ) | | | (7,826 | ) | | | (85 | ) | | | 1.1 | % |
| Non-interest expenses(1) | | | (6,948 | ) | | | (6,857 | ) | | | (91 | ) | | | 1.3 | % |
| Tax expenses for ISS, PIS and COFINS and other | | | (953 | ) | | | (969 | ) | | | 16 | | | | -1.7 | % |
| Share of comprehensive income of unconsolidated companies, net | | | - | | | | - | | | | - | | | | - | |
| Other | | | (10 | ) | | | - | | | | (10 | ) | | | - | |
| Income before income tax and social contribution | | | 1,921 | | | | 3,568 | | | | (1,647 | ) | | | -46.2 | % |
(1) Refers to general and administrative expenses including salaries and employee benefits, depreciation expenses and amortization.
Non-interest expenses totaled R$6,948 million in 2011, an increase of R$91 million, or 1.3%, compared to 2010, remaining in line with 2010, mainly due to the 9.0% salaries increase on the labor agreement, offset by the restructuring of the consumer credit area.
Tax expenses for ISS, PIS and COFINS and other taxes remained in line with 2010. See “—Net interest income above”.
Our income before tax and social contribution on net income in the consumer credit segment decreased 46.2% in the year ended December 31, 2011 compared to the same period of 2010, from R$3,568 million in 2010 to R$1,921 million in 2011, as shown in the table below.
| | | For the Year Ended December 31, | |
| | | 2011 | | | 2010 | | | 2011-2010 | | | % | |
| | | (in millions of R$) | | | Variation | |
| Income before income tax and social contribution | | | 1,921 | | | | 3,568 | | | | (1,647 | ) | | | -46.2 | % |
| Income tax and social contribution | | | (477 | ) | | | (1,054 | ) | | | 577 | | | | -54.7 | % |
| Non-controlling interest in subsidiaries | | | - | | | | - | | | | - | | | | - | |
| Net income attributable to owners of the parent company | | | 1,444 | | | | 2,514 | | | | (1,070 | ) | | | -42.6 | % |
Income tax and social contribution for the year totaled R$477 million in 2011 compared to R$1,054 million in the prior year, a 54.7% decrease, primarily due to lower income before income tax and social contribution, partially offset by the adjustment in tax rate as explained above.
Activities with the Market and Corporation
The activities with the market and corporation segment presents the result from excess capital, excess subordinated debt and the net balance of tax assets and liabilities. It also shows the financial margin on market transactions, costs of treasury operations, equity in the earnings of companies that are not linked to any segments, as well those adjustments relating to minority shareholdings in subsidiaries and our interest in Porto Seguro.
The banking product from activities with the market and corporation business operational segment is shown in the table below and increased by 39.7%, from R$3,657 million in the year ended December 31, 2010 to R$5,109 million in the same period in 2011, an increase of R$1,452 million, mainly due to an increase in the interest margin.
| | | For the Year Ended December 31, | |
| | | 2011 | | | 2010 | | | 2011-2010 | | | % | |
| | | (in millions of R$) | | | Variation | |
| Banking product | | | 5,109 | | | | 3,657 | | | | 1,452 | | | | 39.7 | % |
| Interest margin(1) | | | 4,801 | | | | 3,356 | | | | 1,445 | | | | 43.1 | % |
| Banking service fees | | | 309 | | | | 182 | | | | 127 | | | | 69.8 | % |
| Income from insurance, private pension and capitalization operations before claim and selling expenses | | | (1 | ) | | | (12 | ) | | | 11 | | | | -91.7 | % |
| Other income | | | - | | | | 131 | | | | (131 | ) | | | -100.0 | % |
(1) Includes net interest and similar income and expenses, dividend income, net gain (loss) from financial assets and liabilities and foreign exchange results and exchange variation on transactions.
The interest margin within this segment primarily consists of revenues by treasury transactions and excess capital. During the year ended December 31, 2011, the interest margin totaled R$4,801 million and increased by 43.1% compared to the same period of 2010. This increase is primarily due to higher investing capital excess gains in 2011 compared to 2010, partially offset by lower gains in treasury operations.
Banking service fees increased 69.8% while income from insurance, private pension and capitalization operations before claim and selling expenses decreased 91.7% and other income in 2011 decreased 100%. These changes were due to differences in revenues and expenses allocation to other operating segments in 2011 compared to 2010.
Losses on loans and claims increased from R$2 million in 2010 to R$521 million in 2011, as shown in the table below.
| | | For the Year Ended December 31, | |
| | | 2011 | | | 2010 | | | 2011-2010 | | | % | |
| | | (in millions of R$) | | | Variation | |
| Banking product | | | 5,109 | | | | 3,657 | | | | 1,452 | | | | 39.7 | % |
| Losses on loans and claims | | | (521 | ) | | | (2 | ) | | | (519 | ) | | | - | |
| Expenses for allowance for loan losses | | | (531 | ) | | | (2 | ) | | | (529 | ) | | | - | |
| Recovery of loans written-off as losses | | | 10 | | | | - | | | | 10 | | | | - | |
| Expenses for claims | | | - | | | | - | | | | - | | | | - | |
| Operating margin | | | 4,588 | | | | 3,655 | | | | 933 | | | | 25.5 | % |
The expenses for allowance for loans losses increased from R$2 million in 2010 to R$531 million in 2011, due to an increase in provisions we made in 2011 in connection with our activities with the market and corporation segment in excess of Central Bank requirements as a result of our model for allowance for loan losses which includes the expected loss.
Other operating income (expenses) decreased from R$860 million in 2010 to R$390 million in 2011, as shown in the table below:
| | | For the Year Ended December 31, | |
| | | 2011 | | | 2010 | | | 2011-2010 | | | % | |
| | | (in millions of R$) | | | Variation | |
| Operating margin | | | 4,588 | | | | 3,655 | | | | 933 | | | | 25.5 | % |
| Other operating income (expenses) | | | (390 | ) | | | (860 | ) | | | 470 | | | | -54.7 | % |
| Non-interest expenses(1) | | | (935 | ) | | | (1,005 | ) | | | 70 | | | | -7.0 | % |
| Tax expenses for ISS, PIS and COFINS and other | | | 51 | | | | (274 | ) | | | 325 | | | | -118.6 | % |
| Share of comprehensive income of unconsolidated companies, net | | | 447 | | | | 409 | | | | 38 | | | | 9.3 | % |
| Other | | | 47 | | | | 10 | | | | 37 | | | | 370.0 | % |
| Income before income tax and social contribution | | | 4,198 | | | | 2,795 | | | | 1,403 | | | | 50.2 | % |
(1) Refers to general and administrative expenses including salaries and employee benefits, depreciation expenses and amortization.
The Tax expenses for ISS, PIS and COFINS and other decreased R$ 325 million in the year ended December 31, 2011 compared to the year ended December, 31, 2010, mainly due to the increase in the PIS and COFINS taxable base with respect to the payment of interest on own capital between the different group companies.
Non-interest expenses decreased R$70 million in the year ended December 31, 2011 compared to the year ended December, 31, 2010.
Share of comprehensive income of unconsolidated companies, net remained in line with 2010, due to the results of Porto Seguro.
Net income in the activities with the market and corporation segment increased from R$1,386 million in 2010 to R$3,069 million in 2011, as shown in the table below.
| | | For the Year Ended December 31, | |
| | | 2011 | | | 2010 | | | 2011-2010 | | | % | |
| | | (in millions of R$) | | | Variation | |
| Income before income tax and social contribution | | | 4,198 | | | | 2,795 | | | | 1,403 | | | | 50.2 | % |
| Income tax and social contribution | | | (244 | ) | | | (495 | ) | | | 251 | | | | -50.7 | % |
| Non-controlling interest in subsidiaries | | | (885 | ) | | | (914 | ) | | | 29 | | | | -3.2 | % |
| Net income attributable to owners of the parent company | | | 3,069 | | | | 1,386 | | | | 1,683 | | | | 121.4 | % |
Income tax and social contribution decreased R$251 million in 2011 from 2010, due to the adjustment in tax rate as explained above.
Non-controlling interest in subsidiaries in 2011 stood in line with 2010.
5B. Liquidity and Capital Resources
Our Superior Institutional Treasury and Committee forLiquidity determines our policy regarding asset and liability management. See “Item 4B. Business Overview — Risk Management.” Our policy is to maintain a close match of our maturity, interest rate and currency exposures. In establishing our policies and limits, the Superior Institutional TreasuryCommittee for Liquidityconsiders our exposure limits for each market segment and product, and the volatility and correlation across different markets and products.
We have invested in improving risk management of the liquidity inherent in our activities. At the same time, we maintain a portfolio of bonds and securities with higher liquidity, or an operational reserve, which represents a potential source for additional liquidity.
Management controls our liquidity reserves by projecting the resources that will be available for investment by our treasury department. The technique we employ involves the statistical projection of scenarios for our assets and liabilities, considering the liquidity profiles of our counterparties.
Short-term minimum liquidity limits are defined according to guidelines set by the Superior Institutional TreasuryCommittee for Liquidity. These limits aim to ensure sufficient liquidity, including upon the occurrence of unforeseen market events. These limits are revised periodically based on the projection of cash needs in atypical market situations (i.e., stress scenarios).
Management of liquidity makes it possible for us to simultaneously meet our operating requirements, protect our capital and take advantage of market opportunities. We manage the balance between maturity distribution and diversity of sources of funds. Our strategy is to maintain adequate liquidity to meet our present and future financial obligations and to capitalize on business opportunities as they arise. See “Item 4B. Business Overview — Risk Management — Liquidity Risk Management.”
Due to our stable sources of funding, which include a large deposit base the large number of correspondent banks with which we have long-standing relationships, as well as facilities in place pursuant to which we can access further funding, we have not historically experienced liquidity problems, despite the disruptions in the international financial markets. See “Item 3D. Risk Factors — Risks Relating to Our Business and the Banking Industry — We are exposed to effects of the disruptions and volatility in the global financial markets and the economies in those countries where we do business, especially Brazil.”
Under Brazilian law, cash dividends may only be paid if the subsidiary paying such dividends has reported a profit in its financial statements. In addition, subsidiaries that are financial institutions are prohibited from making loans to Itaú Unibanco Holding but are allowed to make deposits in Itaú Unibanco Holding, which are represented by CDIs —certificados de depósitos interfinanceiros. These restrictions have not had and are not expected to have a material impact on our ability to meet our cash obligations.
The following table sets forth our average liabilities for 2011 and 2010.
| | | (in millions of R$, except percentages) | |
| | | For the Year Ended December 31, | |
| | | 2011 | | | 2010 | |
| | | Average
balance | | | % of
total | | | Average
balance | | | % of
total | |
| Interest-bearing liabilities | | | 580,695 | | | | 80.3 | % | | | 471,501 | | | | 79.6 | % |
| Interest-bearing deposits | | | 186,429 | | | | 25.8 | % | | | 164,210 | | | | 27.7 | % |
| Savings deposits | | | 61,143 | | | | 8.5 | % | | | 52,457 | | | | 8.9 | % |
| Interbank Deposits | | | 2,376 | | | | 0.3 | % | | | 1,703 | | | | 0.3 | % |
| Time deposits | | | 122,910 | | | | 17.0 | % | | | 110,050 | | | | 18.6 | % |
| Securities sold under repurchase agreements | | | 203,021 | | | | 28.1 | % | | | 163,634 | | | | 27.6 | % |
| | | | | | | | | | | | | | | | | |
| Interbank market debt and Institutional market debt | | | 125,007 | | | | 17.3 | % | | | 89,231 | | | | 15.1 | % |
| Interbank market debt | | | 77,189 | | | | 10.7 | % | | | 50,782 | | | | 8.6 | % |
| Institutional market debt | | | 47,818 | | | | 6.6 | % | | | 38,449 | | | | 6.5 | % |
Reserves for insurance private pension and liabilities
for capitalization plans | | | 66,237 | | | | 9.2 | % | | | 54,426 | | | | 9.2 | % |
| Non-interest-bearing liabilities | | | 142,740 | | | | 19.7 | % | | | 120,933 | | | | 20.4 | % |
| Non-interest bearing deposits | | | 26,072 | | | | 3.6 | % | | | 25,817 | | | | 4.4 | % |
| Other non-interest bearing liabilities | | | 116,668 | | | | 16.1 | % | | | 95,116 | | | | 16.1 | % |
| Total liabilities | | | 723,435 | | | | 100.0 | % | | | 592,434 | | | | 100.0 | % |
Our principal sources of funding are interest-bearing deposits, deposits received under repurchase agreements, onlending from government financial institutions, lines of credit with foreign banks and the issuance of securities abroad. For a more detailed description of our sources of funding see “Item 4B — Business Overview — Funding” and notes 16 and 18 to our consolidated financial statements.
Our current funding strategy is to continue to use all our funding sources in accordance with their cost and availability and our general asset and liability management strategy. We consider our current level of liquidity to be adequate. The international financial turmoil magnified the importance of issues associated with funding and the liquidity of financial institutions around the world. In order to finance our operations, we intensified the use of liquidity provided by savings and time deposits, securities sold under repurchase agreements, interbank market debt and institutional market debt during 2010 and 2011. The balance of time deposits decreased its share on the total funding in 2011 because we utilized less expensive funding sources, such as Brazilian debentures subject to repurchase which are reported under “securities sold under repurchase agreements” and are offered not only to institutional clients but also to private banking, corporate banking and retail clients. This funding strategy is designed to provide better profitability through higher spreads on our savings deposits and higher fees earned on market funds.
Our ability to obtain funding depends on numerous factors, including our credit ratings, general economic conditions, investors’ perception of emerging markets in general and of Brazil (in particular, prevailing economic and political conditions in Brazil and government regulations in relation to foreign exchange funding).
Some of our long-term debt provides for acceleration of the outstanding principal balance upon the occurrence of specified events, which are events ordinarily found in long-term financing agreements. As of December 31, 2011, none of these events, including any events of default or failure to satisfy financial covenants had occurred and we have no reason to believe that it is reasonably likely that any of these events will occur in 2012.
Changes in Cash Flows
The following table sets forth the main variations in our cash flows during the years ended December 31, 2011 and 2010.
| | | (in millions of R$) | |
| | | For the Year Ended December 31, | |
| | | 2011 | | | 2010 | |
| | | | | | | |
| Net cash (used in) provided by operating activities | | | (7,440 | ) | | | (30,872 | ) |
| Net cash used in investing activities | | | (1,311 | ) | | | (2,117 | ) |
| Net cash provided by (used in) financing activities | | | (921 | ) | | | 6,575 | |
| Net increase (decrease) in cash and cash equivalents | | | (9,672 | ) | | | (26,414 | ) |
Operating Activities
Our cash flows from operating activities resulted in cash outflows of approximately R$7,440 million in 2011 compared to cash outflows of R$30,872 million in 2010. In 2011, the change in cash flows was primarily due to a change in deposits of R$26,442 million, from cash inflows of R$12,165 million in 2010 to cash inflows of R$38,607 million in 2011 and to a change in funds from interbank markets of R$9,962 million, from cash inflows of R$17,891 million in 2010 to a cash inflows of R$27,853 million in 2011.
Investing Activities
Our cash flows from investing activities generated cash outflows of R$1,311 million and R$2,117 million in 2011 and 2010, respectively. In 2011, the change in cash flows was primarily due to a change in available for sale securities of R$15,971 million, from cash outflows of R$17,629 million in 2010 to a cash outflows of R$33,600 million in 2011.
Financing Activities
Our cash flows from financing activities generated cash outflows of R$921 million in 2011, inflows of approximately R$6,575 million in 2010. In 2011, the change in cash outflows was primarily due to a decrease in redemptions in institutional markets of R$6,778 million, from cash outflows of R$1,796 million in 2010 to cash outflows of R$8,574 million in 2011, partially offset by an increase in funding from institutional market of R$1,293 million, from R$12,953 million in 2010 to R$14,246 million in 2011.
We paid dividends and interest on capital in the amount of approximately R$4,588 million and R$4,315 million in 2011 and 2010, respectively. In 2011 we purchased an amount of R$1,303 million treasury shares, which generated a cash outflow of the same amount.
Capital
We are required to comply with Brazilian capital adequacy regulations under Central Bank rules, which require banks to have total capital equal to or greater than 11.0% of risk-weighted assets, in lieu of the 8% minimum capital requirement of the original Basel Accord, or Basel I, and Basel II. See “Item 4B. Business Overview — Regulation and Supervision — Regulation by the Central Bank — Capital Adequacy and Leverage/Regulatory Capital Requirements”. In addition, the Central Bank of Brazil is expected to issue in the near future new rules for implementation of the Basel III framework in Brazil, as detailed in the Public Hearing 40/2012 of February 17, 2012. See “Item 4B. Business Overview — Regulation and Supervision – Regulation by the Central Bank – Capital Adequacy and Leverage/Regulatory Capital Requirements – Implementation of Basel III in Brazil”.
We have internal procedures and committees responsible for assessing the impacts of the implementation of the Basel III Framework on our capital ratios and operations, based on the Basel III Framework as proposed by the Basel Committee and on the proposed rules for its implementation in Brazil, as currently outlined in Public Hearing 40/2012. In the event that Public Hearing 40/2012 is fully implemented as currently proposed by the Central Bank and based on our current regulatory capital ratios, as well as conservative assumptions on expected returns and asset growth, we do not anticipate that additional regulatory capital will be required to support our operations in the near future. However, depending on the outcome of Public Hearing 40/2012, we might need to reassess our ongoing funding strategy for regulatory capital.
Additionally, we have been monitoring our liquidity ratios, as they are defined by the Basel III Framework and, based on conservative assumptions, we are already in compliance with such ratios. Public Hearing 40/2012 does not address liquidity ratios requirements and the Central Bank has not yet officially pronounced itself on liquidity regulation. Nevertheless our intention is to not only comply with, but to actually maintain liquidity resulting in ratios higher than the minimal requirements of the Basel III Framework.
As required by Central Bank rules, we currently measure our capital compliance according to two different methods: (i) by consolidating only our financial subsidiaries, and (ii) on a fully consolidated basis, including all of our financial and non-financial subsidiaries. We believe we have a solid capital base as measured by both methods. As of December 31, 2011, 2010 and 2009, our solvency ratio measured on a fully consolidated basis was 16.4%, 15.4% and 16.7%, respectively. The variation in our solvency ratio measured on a fully consolidated basis since December 31, 2009 was the result of several factors, including: (i) the impact of net income less payments of dividends and interest on stockholder’s equity for each period and (ii) the issuance of subordinated debt, which factors were partially offset by (iii) an organic increase in our total risk-weighted assets, mainly due to the growth of lending transactions, and (iv) the changes in the weight applied to lending to individuals. See “Item 4B. Business Overview — Regulation and Supervision — Regulation by the Central Bank — Capital Adequacy and Leverage/Regulatory Capital Requirements”.
As approved by the Central Bank on January 13, 2012, issuances of our subordinated debt, which total R$198 million as of January 31, 2012, qualify as Tier 2 Capital.
In addition, issuances of our subordinated debt in the amount of R$108.4 million as of December 31, 2011 are pending Central Bank approval in order to qualify as Tier 2 Capital. After the effect of such issuances, our Basel ratios would increase by 0.05%.
The following table sets forth our capital positions of total risk-weighted assets, as well as our minimum capital requirements under Central Bank rules, in each case as of December 31, 2011 and 2010, in each case on a fully consolidated basis, including our financial and non-financial subsidiaries.
| (in millions of R$, except percentages) | |
| | | As of December 31, | |
| | | 2011 | | | 2010 | |
| | | | |
| Tier 1 Capital | | | 71,601 | | | | 62,240 | |
| Tier 2 Capital | | | 21,565 | | | | 18,652 | |
| Tier 1 plus Tier 2 Capital | | | 93,166 | | | | 80,892 | |
| Adjustments | | | (55 | ) | | | (173 | ) |
| Our regulatory capital (1) | | | 93,111 | | | | 80,719 | |
| Minimum regulatory capital required(2) | | | 62,556 | | | | 57,525 | |
| Excess over minimum regulatory capital required | | | 30,555 | | | | 23,194 | |
| Total risk-weighted assets | | | 568,693 | | | | 522,952 | |
| Our regulatory capital to risk-weighted assets ratio | | | 16.4 | % | | | 15.4 | % |
| (1) Based on Central Bank requirements (see note 32 to our consolidated financial statement). |
| (2) The minimum requirement in Brazil was 11% as of December 31, 2011 and 2010. |
CMN Resolution No. 3,490, of August 29, 2007, which sets out the criteria currently applicable to our computation of our minimum regulatory capital required, has been in effect since July 1, 2008. For calculation of our risk portions, we follow the procedures of the following Central Bank circulars and circular letters:
| · | Circular No. 3,360, of September 12, 2007 for credit risk; |
| · | Circulars No. 3,361, 3,362, 3,363, 3,364, 3,366 and 3,368, of September 12, 2007, 3,388, of June 4, 2008, and 3,389, of June 25, 2008 and Circular Letters No. 3,309 and 3,310, of April 15, 2008 for market risk; and |
| · | Circular No. 3,383 and Circular Letters No. 3,315 and 3,316, of April 30, 2008 for operational risk. For calculation of our operational risk portion, we opted for the use of the standardised alternative approach. |
Since January 1, 2010, the operational risk portion has been included in full in our total risk-weighted assets for purposes of our calculation of regulatory capital to risk weighted assets ratio, pursuant to Circular No. 3,383 of April 30, 2008.
Effective April 1, 2010, CMN Resolution No. 3,825 of December 16, 2009 revoked CMN Resolution No. 3,674, of December 30, 2008, which permitted the full addition to Tier 1 Capital of any allowance for loan losses in excess of the minimum amounts required by CMN Resolution No. 2,682 of December 21, 1999.
Beginning on June 30, 2010, Circular No. 3,476 of December 28, 2009 required that our minimum regulatory capital on a fully consolidated basis include an additional portion under regulatory capital to cover operational risk, which portion is calculated based on our weighted equity in the earnings of our subsidiaries and affiliated companies.
On November 11, 2011, the Central Bank enacted Circular No. 3,563, which amended Circular No. 3,360, of September 12, 2007, establishing certain measures to ease the capital requirements relating to certain retail transactions given the current economic scenario. See “Item 4B. Business Overview — Regulation and Supervision — Regulations by the Central Bank — Capital Adequacy and Leverage/Regulatory Capital Requirements — Changes in Capital Allocation”.
Circular No. 3,568, of December 21, 2011, amends the provisions of Circulars No 3,361, of September 12, 2007, No. 3,388, of June 4, 2008, No. 3,389, of June 25, 2008, No. 3,478 of December 24, 2009 and No. 3,498, of June 28, 2010, which set forth the procedures for calculation of the portion of regulatory capital related to market risk. The new calculation method will be adopted gradually from January 1, 2012, and will be fully effective on December 31, 2012. If these new rules had already been in effect on December 31, 2011, our solvency ratio would have been reduced by approximately 0.7%.
The funds obtained through the issue of subordinated debt securities that are considered capital Tier II for purposes of capital to risk-weighted assets ratio, are set forth below as of December 31, 2011:
| Name of security | | Issue | | | Maturity | | | Return p.a. | | Principal R$ | |
| Subordinated CDB | | | | | | | | | | | | | | |
| | | | 2007 | | | | 2012 | | | 103.5% to 104% of CDI | | | 4,970 | |
| | | | | | | | | | | 100% CDI + 0.35% to 0.45% | | | 732 | |
| | | | | | | | | | | IGPM + 7.31 to 7.35% | | | 278 | |
| | | | 2002 | | | | 2012 | | | 102.5% of CDI | | | 200 | |
| | | | 2008 | | | | 2013 | | | 100% to CDI + 0.50% to 0.60% | | | 1,558 | |
| | | | | | | | | | | 106% to 107% of CDI | | | 48 | |
| | | | 2003 | | | | 2013 | | | 102% of CDI | | | 40 | |
| | | | 2007 | | | | 2014 | | | 100% to CDI + 0.35% to 0.60% | | | 1,865 | |
| | | | 2007 | | | | 2014 | | | IGPM + 7.35% | | | 33 | |
| | | | 2008 | | | | 2014 | | | 112% of CDI | | | 1,000 | |
| | | | 2008 | | | | 2015 | | | 119.8% of CDI | | | 400 | |
| | | | 2010 | | | | 2015 | | | 113% to CDI | | | 50 | |
| | | | 2006 | | | | 2016 | | | 100% to CDI + 0.47%(1) | | | 466 | |
| | | | 2010 | | | | 2016 | | | 110% to 114% of CDI | | | 2,664 | |
| | | | 2010 | | | | 2016 | | | IPCA + 7.33% | | | 123 | |
| | | | 2010 | | | | 2017 | | | IPCA + 7.45% | | | 367 | |
| | | | | | | | | | | TOTAL | | | 14,793 | |
| | | | | | | | | | | | | | | |
| Subordinated financial credit bills | | | | | | | | | | | | | | |
| | | | 2010 | | | | 2016 | | | 100 % to CDI + 1.35% to 1.36% | | | 365 | |
| | | | 2010 | | | | 2016 | | | 112% to 112.5% of CDI | | | 1,873 | |
| | | | 2010 | | | | 2016 | | | IPCA + 7% | | | 30 | |
| | | | 2010 | | | | 2017 | | | IPCA + 6.95% to 7.2% | | | 206 | |
| | | | 2011 | | | | 2017 | | | 108% to 112% of CDI | | | 3,011 | |
| | | | 2011 | | | | 2017 | | | IPCA + 6.15% to 7.8% | | | 343 | |
| | | | 2011 | | | | 2017 | | | IGPM + 6.55% to 7.6% | | | 55 | |
| | | | 2011 | | | | 2017 | | | 100% to CDI + 1.29% to 1.52% | | | 3,650 | |
| | | | 2011 | | | | 2018 | | | IGPM + 7% | | | 42 | |
| | | | 2011 | | | | 2018 | | | IPCA + 7.53% to 7.7% | | | 30 | |
| | | | 2011 | | | | 2019 | | | 109% to 109.7% to CDI | | | 1 | |
| | | | 2011 | | | | 2021 | | | 109.25% to 110.5% to CDI | | | 6 | |
| | | | | | | | | | | TOTAL | | | 9,612 | |
| | | | | | | | | | | | | | | |
| Subordinated euronotes | | | | | | | | | | | | | | |
| | | | 2010 | | | | 2020 | | | 6.2% | | | 1,731 | |
| | | | 2010 | | | | 2021 | | | 5.8% | | | 1,694 | |
| | | | 2011 | | | | 2021 | | | 5.8% | | | 401 | |
| | | | 2011 | | | | 2021 | | | 6.2% | | | 765 | |
| | | | | | | | | | | TOTAL | | | 4,591 | |
| | | | | | | | | | | | | | | |
| Preferred shares | | | | | | | | | | | | | | |
| | | | 2002 | | | | 2015 | | | 3.04% | | | 1,389 | |
| (1) Subordinated CDBs may be redeemed as from November 2011. |
Interest Rate Sensitivity
Management of interest rate sensitivity is a key component of our asset and liability policy. Interest rate sensitivity is the relationship between market interest rates and net interest income resulting from the maturity or re-pricing characteristics of interest-earning assets and interest-bearing liabilities. The pricing structure is matched when an equal amount of these assets or liabilities matures or re-prices. Any mismatch of interest-earning assets and interest-bearing liabilities is known as a gap position. A negative gap denotes liability sensitivity and normally means that a decline in interest rates would have a positive effect on net interest income, while a positive gap denotes asset sensitivity and normally means that an increase in interest rates would have a positive effect on net interest income. These relationships are as of one particular date only, and significant swings can occur daily as a result of both market forces and management decisions. Our interest rate sensitivity strategy takes into account rates of return, the underlying degree of risk, and liquidity requirements, including minimum regulatory cash reserves, mandatory liquidity ratios, withdrawal and maturity of deposits, capital costs and additional demand for funds.
Our Superior Institutional Treasury Committee for Liquidity analyzes the statement of income and risk information on a monthly basis and establishes limits for market risk exposure, interest rate positions and foreign currency positions. For more detailed information on the monitoring of our positions, see “Item 4B — Business Overview — Risk Management — Market Risk Management.”
The following table sets forth our interest-earning assets and interest-bearing liabilities based on our contractual cash flows as of December 31, 2011 and therefore does not reflect interest rate gap positions that may exist as at other times. In addition, variations in interest rate sensitivity may exist within the re-pricing periods presented due to differing re-pricing dates within the period. Variations may also arise among the different currencies in which interest rate positions are held.
| (in millions of R$, except percentages) | |
| | | Up to 30
days | | | 31-180
days | | | 181-365
days | | | 1-5
years | | | Over 5
years | | | Total | |
| Total interest-earning assets | | | 236,921 | | | | 142,241 | | | | 90,272 | | | | 222,650 | | | | 53,746 | | | | 745,830 | |
| Central Bank compulsory deposits | | | 98,053 | | | | - | | | | - | | | | - | | | | - | | | | 98,053 | |
| Interbank deposits | | | 18,911 | | | | 3,226 | | | | 3,247 | | | | 2,176 | | | | 261 | | | | 27,821 | |
| Securities purchased under agreements to ressel | | | 50,131 | | | | 40,462 | | | | 1,655 | | | | - | | | | - | | | | 92,248 | |
| Financial assets held for trading | | | 7,188 | | | | 3,369 | | | | 27,149 | | | | 72,088 | | | | 12,095 | | | | 121,889 | |
| Financial assets designated at fair value through profit or loss | | | 186 | | | | - | | | | - | | | | - | | | | - | | | | 186 | |
| Derivatives | | | 2,277 | | | | 2,199 | | | | 1,473 | | | | 2,315 | | | | 490 | | | | 8,754 | |
| Available-for-sale financial assets | | | 6,139 | | | | 3,997 | | | | 3,768 | | | | 17,042 | | | | 16,564 | | | | 47,510 | |
| Held-to-maturity financial assets | | | 87 | | | | - | | | | 33 | | | | 1,319 | | | | 1,666 | | | | 3,105 | |
| Loan operations and lease operations | | | 53,949 | | | | 88,988 | | | | 52,947 | | | | 127,710 | | | | 22,670 | | | | 346,264 | |
| Total interest-bearing liabilities | | | 167,707 | | | | 69,188 | | | | 47,978 | | | | 230,642 | | | | 41,307 | | | | 556,822 | |
| Savings deposits | | | 67,170 | | | | - | | | | - | | | | - | | | | - | | | | 67,170 | |
| Time deposits | | | 30,918 | | | | 19,167 | | | | 11,475 | | | | 79,543 | | | | 3,366 | | | | 144,469 | |
| Interbank deposits | | | 665 | | | | 683 | | | | 445 | | | | 272 | | | | - | | | | 2,065 | |
| Securities sold under repurchase agreements | | | 55,866 | | | | 11,403 | | | | 11,139 | | | | 89,261 | | | | 17,744 | | | | 185,413 | |
| Financial liabilities held for trading | | | 48 | | | | 854 | | | | 901 | | | | 909 | | | | 103 | | | | 2,815 | |
| Derivatives | | | 1,526 | | | | 1,245 | | | | 1,364 | | | | 2,104 | | | | 508 | | | | 6,747 | |
| Interbank maket debt | | | 5,904 | | | | 24,588 | | | | 16,773 | | | | 38,781 | | | | 4,452 | | | | 90,498 | |
| Institucional market debt | | | 2,772 | | | | 11,248 | | | | 5,881 | | | | 19,772 | | | | 15,134 | | | | 54,807 | |
| Liabilities for capitalization plans | | | 2,838 | | | | - | | | | - | | | | - | | | | - | | | | 2,838 | |
| Asset/liability gap | | | 69,214 | | | | 73,053 | | | | 42,294 | | | | (7,992 | ) | | | 12,439 | | | | 189,008 | |
| Cumulative gap | | | 69,214 | | | | 142,267 | | | | 184,561 | | | | 176,569 | | | | 189,008 | | | | | |
| Ratio of cumulative gap to total interest-earning assets | | | 9.3 | % | | | 19.1 | % | | | 24.7 | % | | | 23.7 | % | | | 25.3 | % | | | | |
Exchange Rate Sensitivity
The greater part of our operations is denominated in, or indexed to,reais. We also have assets and liabilities denominated in foreign currency, mainly in U.S. dollars, as well as assets and liabilities, which, although denominated inreais, are dollar-indexed and therefore expose us to exchange rate risks. The Central Bank regulates our maximum open, short and long foreign currency positions. As of December 31, 2011, our net foreign currency position, including investments abroad was a liability totaling R$8,345 million. See “note 35 of our consolidated financial statements”. The gap management policy adopted by our Superior Institutional Treasury Committee for Liquidity takes into consideration the tax effects on this position. Since the profits from exchange rate variation on investments abroad are not taxed, we have set up a hedge (a liability in foreign exchange derivatives) of a sufficient amount, so that our total foreign exchange exposure, net of the tax effects, is consistent with our strategy of low exposure to risk.
Our foreign currency position is composed on the liability side of the issuance of securities in the international capital markets, credit from foreign banks to finance trade operations and dollar-linked onlending from government financial institutions. The proceeds of these operations are mainly applied to dollar-linked lending operations and securities purchases.
The following table sets forth assets and liabilities classified by currency including those denominated in Brazilianreais and those denominated in or indexed to foreign currencies as of December 31, 2011. This table may not reflect currency gap positions at other times. Variations may also arise among the different currencies that are held.
| (in millions of R$, except percentages) | |
| | | As of December 31, 2011 | |
| | | Brazilian
currency | | | Denominated
in foreign
currency (1) | | | Indexed to foreign currency(1) | | | Total | | | Percentage of amounts denominated in and indexed to foreign currency of total | |
| Assets: | | | 656,457 | | | | 30,125 | | | | 131,555 | | | | 818,136 | | | | 19.8 | % |
| Cash and deposits on demand | | | 5,500 | | | | 472 | | | | 4,696 | | | | 10,668 | | | | 48.4 | % |
| Central Bank compulsory deposits | | | 95,942 | | | | - | | | | 2,111 | | | | 98,053 | | | | 2.2 | % |
| Interbank deposits | | | 9,820 | | | | 920 | | | | 17,081 | | | | 27,821 | | | | 64.7 | % |
| Securities purchased under agreements to resell | | | 91,643 | | | | - | | | | 605 | | | | 92,248 | | | | 0.7 | % |
| Financial assets held for trading | | | 108,755 | | | | 532 | | | | 12,602 | | | | 121,889 | | | | 10.8 | % |
| Financial assets designated at fair value through profit or loss | | | - | | | | 186 | | | | - | | | | 186 | | | | 100.0 | % |
| Derivatives | | | 8,655 | | | | 99 | | | | - | | | | 8,754 | | | | 1.1 | % |
| Available-for-sale financial assets | | | 37,670 | | | | 4,150 | | | | 5,690 | | | | 47,510 | | | | 20.7 | % |
| Held-to-maturity financial assets | | | 2,823 | | | | - | | | | 282 | | | | 3,105 | | | | 9.1 | % |
| Loan operations and lease operations | | | 274,221 | | | | 10,280 | | | | 61,763 | | | | 346,264 | | | | 20.8 | % |
| Allowance for loan losses | | | (23,187 | ) | | | - | | | | (686 | ) | | | (23,873 | ) | | | 2.9 | % |
| Other financial assets | | | 872 | | | | 13,229 | | | | 26,153 | | | | 40,254 | | | | 97.8 | % |
| Investments in unconsolidated companies | | | 2,544 | | | | - | | | | - | | | | 2,544 | | | | 0.0 | % |
| Fixed assets, net | | | 5,023 | | | | - | | | | 335 | | | | 5,358 | | | | 6.3 | % |
| Intangibles assets, net | | | 3,515 | | | | - | | | | 310 | | | | 3,825 | | | | 8.1 | % |
| Tax assets | | | 25,772 | | | | - | | | | 316 | | | | 26,088 | | | | 1.2 | % |
| Assets held for sale | | | 77 | | | | - | | | | 8 | | | | 85 | | | | 9.4 | % |
| Other assets | | | 6,812 | | | | 257 | | | | 288 | | | | 7,357 | | | | 7.4 | % |
| Percentage of total assets | | | 80.2 | % | | | 3.7 | % | | | 16.1 | % | | | 100.0 | % | | | | |
| Liabilities and Stockholders’ Equity: | | | 595,795 | | | | 57,448 | | | | 164,893 | | | | 818,136 | | | | 27.2 | % |
| Deposits | | | 183,569 | | | | 183 | | | | 58,884 | | | | 242,636 | | | | 24.3 | % |
| Securities sold under repurchase agreements | | | 178,009 | | | | - | | | | 7,404 | | | | 185,413 | | | | 4.0 | % |
| Financial liabilities held for trading | | | - | | | | - | | | | 2,815 | | | | 2,815 | | | | 100.0 | % |
| Derivatives | | | 4,389 | | | | - | | | | 2,358 | | | | 6,747 | | | | 34.9 | % |
| Interbank market debt | | | 59,816 | | | | 13,742 | | | | 16,940 | | | | 90,498 | | | | 33.9 | % |
| Institutional market debt | | | 2,404 | | | | 29,901 | | | | 22,502 | | | | 54,807 | | | | 95.6 | % |
| Other financial liabilities | | | 8,694 | | | | 10,045 | | | | 25,380 | | | | 44,119 | | | | 80.3 | % |
| Reserves for insurance and private pension | | | 69,788 | | | | 1,112 | | | | 4 | | | | 70,904 | | | | 1.6 | % |
| Liabilities for capitalization plans | | | 2,838 | | | | - | | | | - | | | | 2,838 | | | | 0.0 | % |
| Provisions | | | 15,974 | | | | - | | | | 16 | | | | 15,990 | | | | 0.1 | % |
| Tax liabilities | | | 6,957 | | | | - | | | | 451 | | | | 7,408 | | | | 6.1 | % |
| Other liabilities | | | 14,699 | | | | 2,465 | | | | 1,461 | | | | 18,625 | | | | 21.1 | % |
| Non-controlling interests | | | 1,395 | | | | - | | | | - | | | | 1,395 | | | | 0.0 | % |
| Stockholders’ equity | | | 47,263 | | | | - | | | | 26,678 | | | | 73,941 | | | | 36.1 | % |
| Percentage of total liabilities and stockholders’ equity | | | 72.8 | % | | | 7.0 | % | | | 20.2 | % | | | 100.0 | % | | | | |
| (1) Predominantly U.S. dollar. | | | | | | | | | | | | | | | | | | | | |
For purposes of analysing our exposure to changes in foreign currency, the table below present the composition of the notional amount of our derivative instruments as of December 31, 2011, classified inreais and foreign currency, which also include the instruments linked to foreign currency. For the fair value of the derivatives financial instruments we refer to note 7 and note 30 of our consolidated financial statements.
| (in millions of R$) | |
| | | Notional amounts | |
| | | | Brazilian Currency | | | | Denominated in or linked to Foreign Currency | | | | Total | |
| Derivative financial instruments | | | | | | | | | | | | |
| Swap contracts | | | | | | | | | | | | |
| Buy (Sale) commitments, net | | | 1,289 | | | | (1,289 | ) | | | - | |
| Forward contracts | | | | | | | | | | | | |
| Buy (Sale) commitments, net | | | 1,987 | | | | 3,857 | | | | 5,844 | |
| Future contracts | | | | | | | | | | | | |
| Buy (Sale) commitments, net | | | 192,332 | | | | 43,402 | | | | 235,734 | |
| Option contracts | | | | | | | | | | | | |
| Buy (Sale) commitments, net | | | 72,569 | | | | 4,035 | | | | 76,604 | |
| Others | | | | | | | | | | | | |
| Buy (Sale) commitments, net | | | 4,020 | | | | 543 | | | | 4,563 | |
Capital Expenditures
In 2011, we made capital expenditures related to the opening of new branches and other points of sale. Over the past two years, we also have made significant capital expenditures to automate and upgrade our branch network and develop specific programs to improve the layout of several of our branches. In addition, we have made significant capital expenditures for computer systems, communications equipment and other technology designed to increase the efficiency of our operations, the services offered to our customers and our productivity.
At the end of the year 2011, our network was comprised of 4,984 branches and CSBs, including Brazil and abroad. In Brazil, 123 branches and 43 CSBs were opened during the year. The number of ATMs totals approximately 29 thousand, including Brazil and abroad, representing a decrease from the prior year, mainly due to the branch remodeling to the new pattern which resulted in the resizing and the replacement with more efficient equipments, such as, for example, the removal of check dispensers.
The table below sets forth our capital expenditures for the years ended December 31, 2011 and 2010.
| (in millions of R$) | |
| | | For the Year Ended December 31, | |
| | | 2011 | | | 2010 | |
| FIXED ASSETS | | | 1,903 | | | | 1,924 | |
| Land and buildings | | | 248 | | | | 208 | |
| Leasehold improvements | | | 229 | | | | 225 | |
| Furniture and data processing equipment | | | 1,341 | | | | 1,374 | |
| Other | | | 85 | | | | 117 | |
| | | | | | | | | |
| INTANGIBLE ASSETS | | | 1,972 | | | | 582 | |
| Acquisition of rights to credit payroll | | | 366 | | | | 182 | |
| Partnership for the promotion and offer of financial products and services | | | 318 | | | | 195 | |
| Software developed or obtained for internal use | | | 981 | | | | 205 | |
| Other intangible | | | 307 | | | | - | |
| Total | | | 3,875 | | | | 2,506 | |
We expect that our capital expenditures in 2012 will not be substantially greater than our historical expenditure levels and will consist mainly of investments to continue the upgrade of our technology, customer service and back office administrative systems, as well as continue to make internet-related investments. We anticipate that, in accordance with our practice during recent years, our capital expenditures in 2012 will be funded by our internal resources. We cannot assure you, however, that the capital expenditures will be made and, if made, that those expenditures will be made in the amounts currently expected.
5C. Research and Development, Patents and Licenses, Etc.
Not applicable.
5D. Trend Information
As of the date of filing of our annual report on Form 20-F, we could not identify any known trend that we believe is reasonably likely to materially impact our future results, liquidity and/or capital resources. However, we acknowledge that there are factors that will affect our future results of operations, liquidity and capital resources, including:
The Brazilian economic environment.As a Brazilian bank with most of our operations in Brazil, we are significantly affected by economic, political and social conditions in Brazil. In recent years, we have benefited from Brazil’s generally stable economic environment, with average annual gross domestic product, or GDP, growth of approximately 4.2% from 2004 to 2010, which led to increased bank lending and deposits. The Brazilian government from time to time intervenes in the Brazilian economy and makes changes in policies and regulations. Our business may be affected by changes in policies or regulations involving or affecting interest rates, reserve requirements, capital requirements, liquidity of capital, financial and credit markets, general economic growth, inflation and currency fluctuations, taxes, exchange controls, increases in unemployment rates, decreases in wage and income levels and other factors that influence our customers’ ability to meet their obligations with us. We may also be affected by other political, diplomatic, social and economic developments within and outside Brazil that affect the country. See “Item 5A. Operating Results”.
Legal and regulatory developments.The regulatory structure governing Brazilian financial institutions is continuously evolving, and, as a consequence, parts of our business that are not currently subject to government regulation may become regulated in the future. Amendment of existing laws and regulations or the adoption of new laws and regulations could have a material adverse effect on our business, financial condition, and results of operations, including our ability to provide loans, make investments or render certain financial services.We also have operations in countries outside of Brazil, including Argentina, Chile, Paraguay, Uruguay, Portugal and the United States. Changes in the laws or regulations applicable to our business in the countries in which we operate or adoption of new laws may have a material adverse effect on our business, financial condition, and results of operations.
The effects of any continued international financial turmoil, including on our required liquidity and capital.The global financial crisis and any resulting lack of liquidity and depreciation of financial assets by the major global financial institutions may affect our business. We lend primarily to Brazilian borrowers and the effects of a global financial crisis could materially and adversely affect our customers and increase our non-performing loans and, as a result, increase the risk associated with our lending activity and require us to make corresponding revisions to our risk management and loan loss reserve models.
Continued or worsening disruption or volatility in the global financial markets could lead to further increase negative effects on the financial and economic environment in Brazil and the other countries in which we operate. See “Item 5A. Operating Results - Effects of the Global Financial Markets on our Financial Conditions and Results of Operations”.
The effects of fluctuations in the value of the real and interest rates on our net interest income. The real fluctuates in relation to the U.S. dollar and other foreign currencies. Since 1999, Brazil has adopted a floating exchange rate system with interventions by the Central Bank in buying or selling foreign currency. From time to time, the exchange rate between the real and the U.S. dollar and other currencies has fluctuated significantly. Some of our assets and liabilities are denominated in, or indexed to, foreign currencies, especially the U.S. dollar. Although as of December 31, 2011, our material foreign investments were economically hedged in order to mitigate effects arising out of foreign exchange volatility, there can be no assurance that such hedging strategies will remain in place or will offset such effects. Therefore, depending on the circumstances, either a depreciation or an appreciation of the real could have a material adverse effect on our business, financial condition and results of operations.
The effects of inflation in our results of operations.As a bank in Brazil, the majority of our income, expenses, assets and liabilities are directly tied to interest rates. Therefore, our results of operations and financial condition are affected by inflation, interest rate fluctuations and related government monetary policies, all of which may have a material adverse effect on the Brazilian economy and on us, including our loan portfolio, our cost of funding and our income from credit operations. Inflation, especially sudden increases in inflation, usually causes the loss of purchasing power. Also prolonged periods of high inflation provoke distortions in the allocation of resources. Measures to combat historically high rates of inflation have included maintaining a tight monetary policy with high interest rates, resulting in restrictions on credit and short-term liquidity. In addition, if Brazil experiences fluctuations in rates of inflation in the future, our costs and net margins may be materially and adversely affected, and government measures to combat inflation may include tightening monetary policy with high interest rates which may harm our business. Increases in the SELIC rate could materially and adversely affect us by reducing the demand for credit, increasing our cost of funds and increasing the risk of customer default. Conversely, decreases in the SELIC rate could also materially and adversely affect us by decreasing revenues on interest-earning assets and lowering our margins.
Challenges inherent to any acquisition of financial institutions.Acquisition and integration of institutions and assets involves certain risks including the risk that (a) the integration process may cause us to incur unexpected costs and operating expenses and place additional demands on management time, (b) we may incur unexpected liabilities or contingencies relating to the acquired businesses, (c) antitrust and other regulatory authorities may impose restrictions or limitations on the terms of the acquisition or merger, require disposition of certain assets or businesses or withhold their approval of such transaction, and (d) we may fail to achieve the expected operational and financial synergies and other benefits from such mergers or acquisitions.
Developments and perception of risk of other countries.Economic and market conditions in other countries, including the United States, the European Union and emerging market countries, may affect the market value of securities of Brazilian issuers. Crises in the European Union, the United States and emerging market countries may diminish investor interest in securities of Brazilian issuers, including Itaú Unibanco Holding. This could materially and adversely affect the market price of our securities, and could also make it more difficult for us to access the capital markets and finance our operations in the future on acceptable terms or at all.
Banks located in countries considered to be emerging markets may be particularly susceptible to disruptions and reductions in the availability of credit or increases in financing costs, which could have a material adverse impact on our financial condition. In addition, the availability of credit to entities that operate within emerging markets is significantly influenced by levels of investor confidence in such markets as a whole and any factor that impacts market confidence (for example, a decrease in credit ratings or state or central bank intervention in one market) could materially and adversely affect the price or availability of funding for entities within any of these markets.
In addition to the above, you should read “Item 3D. Risk Factors” for a discussion of the risks we face in our business operations, which could affect our business, results of operations or financial condition.
5E. Off-Balance Sheet Arrangements
We do not have any off-balance sheet arrangements, other than the guarantees we granted that are described in note 35 of our consolidated financial statements and derivative financial instruments discussed above under “Item 5B. Liquidity and Capital Resources –- Exchange Rate Sensitivity.”
5F. Tabular Disclosure of Contractual Obligations
The table below summarizes the maturity profile of our consolidated long-term debt, operating leases and other contractual commitments as of December 31, 2011:
| (in millions of R$) | |
| | Payments due by period | |
| Contractual Obligations | | | Total | | | | Less than 1
year | | | | 1-3 years | | | | 3-5 years | | | | More than 5
years | |
| Interbank market debt | | | 90,498 | | | | 47,265 | | | | 30,133 | | | | 8,648 | | | | 4,452 | |
| Institutional market debt | | | 54,807 | | | | 19,901 | | | | 9,565 | | | | 10,207 | | | | 15,134 | |
| | | | | | | | | | | | | | | | | | | | | |
| Operating and capital (finance) lease obligations | | | 4,353 | | | | 1,102 | | | | 1,909 | | | | 748 | | | | 595 | |
| Guarantees and stand by letters of credit | | | 51,530 | | | | 11,502 | | | | 5,314 | | | | 1,910 | | | | 32,804 | |
| Pension Obligation | | | 245 | | | | 17 | | | | 15 | | | | 14 | | | | 199 | |
| Health Benefits | | | 120 | | | | 6 | | | | 14 | | | | 16 | | | | 84 | |
| Total | | | 201,553 | | | | 79,793 | | | | 46,950 | | | | 21,543 | | | | 53,268 | |
ITEM 6 DIRECTORS, SENIOR MANAGEMENT AND EMPLOYEES
| 6A. | DIRECTORS AND SENIOR MANAGEMENT |
We are managed by our Conselho de Administração, or board of directors, and our Diretoria, or board of officers.
Pursuant to our bylaws, our board of directors must be composed of a minimum of 10 and a maximum of 14 directors elected by our shareholders at the annual shareholders’ meeting. Our board of directors meets regularly eight times a year and extraordinarily any time it deems necessary.
Our board of officers must be composed of a minimum of 5 and a maximum of 20 members. Our board of officers is elected by our board of directors.
All of our directors and officers are elected for a term of one year and can be re-elected. Set forth below are the names, positions and dates of birth of the members of our board of directors and board of officers as of the date hereof. The members of our board of directors were elected on April 25, 2011 at our annual shareholders’ meeting and the majority of the members of our board of officers were elected on April 28, 2011 at a meeting of our board of directors, respectively. Additionally, on September 21, 2011, Mr. Emerson Macedo Bortoloto was elected as officer for a term ending at the board meeting following the 2012 general shareholders’ meeting and took office on November 1, 2011. Mr. Bortoloto replaced Wagner Roberto Pugliese, who served as an officer of Itaú Unibanco Holding until June 3, 2011. In addition, on December 16, 2011, Mr. Rodrigo Luís Rosa Couto was elected as officer for a term ending at the investiture of the members to be elected on the board meeting following the 2012 general shareholders’ meeting. His election was approved by the Central Bank and he was invested in his position on January 10, 2012. Finally, Mr. Carlos Eduardo de Souza Lara and Mr. Jackson Ricardo Gomes stepped down from their positions as officers of Itaú Unibanco Holding on February 29, 2012 and March 6, 2012, respectively.
Pursuant to Brazilian law, the election of each member of our board of directors and our board of officers must be approved by the Central Bank. Under Brazilian law, an acting director or officer retains his or her position until he or she is reelected or a successor is elected.
As determined pursuant to our corporate governance policy, we have three directors who are independent. See “Item 16G. Corporate Governance — Principal Differences between Brazilian and U.S. Corporate Governance Practices – Majority of Independent Directors”
The business address for correspondence with each of our directors and officers is Praça Alfredo Egydio de Souza Aranha, 100, 04344-902, São Paulo, SP, Brazil.
Directors:
Name | | Position | | Date of Birth |
| Pedro Moreira Salles | | Chairman | | 10/20/1959 |
| Alfredo Egydio Arruda Villela Filho | | Vice Chairman | | 11/18/1969 |
| Roberto Egydio Setubal | | Vice Chairman | | 10/13/1954 |
| Alcides Lopes Tápias(*) | | Director | | 09/16/1942 |
| Alfredo Egydio Setubal | | Director | | 09/01/1958 |
| Candido Botelho Bracher | | Director | | 12/05/1958 |
| Fernando Roberto Moreira Salles | | Director | | 05/29/1946 |
| Francisco Eduardo de Almeida Pinto | | Director | | 12/14/1958 |
| Gustavo Jorge Laboissiere Loyola(*) | | Director | | 12/19/1952 |
| Henri Penchas | | Director | | 02/03/1946 |
| Israel Vainboim | | Director | | 06/01/1944 |
| Pedro Luiz Bodin de Moraes(*) | | Director | | 07/13/1956 |
| Ricardo Villela Marino | | Director | | 01/28/1974 |
(*) Independent director.
Officers:
Name | | Position | | Date of Birth |
| Roberto Egydio Setubal | | President and Chief Executive | | 10/13/1954 |
| Alfredo Egydio Setubal | | Executive Vice President | | 09/01/1958 |
| Candido Botelho Bracher | | Executive Vice President | | 12/05/1958 |
| Caio Ibrahim David | | Executive Officer | | 01/20/1968 |
| Claudia Politanski | | Executive Officer | | 08/31/1970 |
| Marcos de Barros Lisboa | | Executive Officer | | 08/02/1964 |
| Ricardo Baldin | | Executive Officer | | 07/14/1954 |
| Sérgio Ribeiro da Costa Werlang | | Executive Officer | | 06/23/1959 |
| Eduardo Hiroyuk Miyaki | | Officer | | 06/11/1972 |
| Emerson Macedo Bortoloto | | Officer | | 07/25/1977 |
| Marco Antonio Antunes | | Officer | | 10/31/1959 |
| Rogério Paulo Calderón Peres | | Officer | | 02/02/1962 |
| Rodrigo Luis Rosa Couto | | Officer | | 08/08/1975 |
Set forth below are the summary biographical descriptions of our directors and officers. As described, some of the members of our board of directors and board of officers also perform senior management functions at our subsidiaries and at Itaúsa and its subsidiaries.
Mr.Pedro Moreira Salles has been chairman of our board of directors since February 2009 (with investiture (i.e., the date on which he assumed such role after approval of his election by the Central Bank) on February 19, 2009) and was our executive vice president from November 2008 to August 2009. He worked at Unibanco since 1989, where he served as vice chairman of the board of directors from 1991 to 1997, chairman of the board of directors from 1997 to 2004, and again as vice chairman of the board of directors from 2004 until November 2008. At Unibanco, he also held the post of chief executive officer from April 2004 to November 2008. At Unibanco Holdings he served as vice chairman of the board of directors and chief executive officer. He served as chairman of the boards of directors of Unibanco Seguros and Banco Fininvest S.A. and vice chairman of the board of AIU Seguros S.A. He is currently a member of the board of IBMEC and was previously a member of the board of Instituto Empreender Endeavor Brasil, as well as the president of the board of PlaNet Finance Brasil. Mr. Pedro Moreira Salles has a bachelor’s degree, magna cum laude, in Economics and History from the University of California, Los Angeles. He also attended the international relations masters program at Yale University and the OPM - Owners/President Management Program at Harvard University.
Mr.Alfredo Egydio Arruda Villela Filho has been the vice chairman of our board of directors since November 2002 (with investiture on March 10, 2003). He has served as president and CEO of Itaúsa since September 2008 and was a member of the board of directors of Itaúsa from 1995 to 2008. He is the chairman of the board of directors of Itautec S.A., or Itautec, and vice chairman of the boards of directors of Duratex S.A., or Duratex, and of Elekeiroz S.A., or Elekeiroz. Mr. Villela Filho has a bachelor’s degree in Mechanical Engineering from the Mauá Engineering School of the Instituto Mauá de Tecnologia (IMT) and a post-graduate degree in Business Administration from Fundação Getulio Vargas (FGV).
Mr.Roberto Egydio Setubal has been the vice chairman of our board of directors since March 2003 (with investiture on March 10, 2003). He has served as a director since April 1995 and president and chief executive officer since April 1994. He served as our general manager from 1990 to 1994. He has served as executive vice president of Itaúsa since May 1994 and chairman of the board of directors of Itaú BBA since February 2003. Mr. Roberto Setubal was the president of the FEBRABAN and of the Brazilian National Federation of Banks (Federação Nacional de Bancos, or FENABAN, from April 1997 to March 2001. He was a member of the board of directors of Petróleo Brasileiro S.A. — PETROBRÁS from March 2002 to January 2003. He is currently a board member of the IIF and of the International Monetary Conference and serves on the international advisory committee of the Federal Reserve Bank of New York and the international advisory committee of the New York Stock Exchange, or NYSE. Mr. Roberto Setubal has a bachelor’s degree in Production Engineering from Escola Politécnica of the Universidade de São Paulo (USP) and a master of science degree in Engineering from Stanford University.
Mr.Alcides Lopes Tápias has been a member of our board of directors since November 2002 (with investiture on March 10, 2003). He has been a member of the audit committee of Itaú Unibanco Holding since 2004. He is a partner in Aggrego Consultores and a member of its advisory board and a member of the board of directors and of the audit, finance and actuarial, human resources and information technology committees of Medial Saúde S.A. He served on the board of directors of Tigre S.A. — Tubos e Conexões from 1995 to 1999 and again since 2004. He was the president of FEBRABAN from 1991 to 1994 and chairman of the board of Camargo Corrêa S.A. from 1996 to 1999, of Usinas Siderúrgicas de Minas Gerais — Usiminas S.A. from 1997 to 1999 and of São Paulo Alpargatas S.A. from 1996 to 1999. He was the Minister for Development, Industry and Commerce of the Brazilian government from September 1999 to July 2001. He was also a member of the trustee board of the Antonio Prudente Foundation Cancer Hospital from 1999 to 2005 and the Advisory Council of the BMF&BOVESPA (formerly the BM&F — Futures and Commodities Exchange) from 2003 to 2008. He also served as the president of the fiscal council of Cia. de Bebidas das Américas — AMBEV from 2005 to 2008. Mr. Tápias has a bachelor’s degree in Business Administration from Universidade Mackenzie (MACKENZIE) and a bachelor’s degree in law from Faculdades Metropolitanas Unidas (FMU).
Mr.Alfredo Egydio Setubal has been a member of our board of directors since April 2007 (with investiture on June 29, 2007) and has served as executive vice president since April 29, 1996 (with investiture on July 3, 1996). He has served as our investor relations officer since 1995. He is currently responsible for our wealth management and capital markets services divisions, with primary responsibility for communications with capital markets, for increasing the transparency of financial and strategic information through improvements in the quality, relevance, timeliness, reliability and comparability of information and for managing relations with the CVM, the Central Bank and other official capital markets authorities. He served as our executive officer between 1993 and 1996 and managing officer between 1988 and 1993. He has been a member of the board of directors of Itaúsa since September 2008. He was a member of ANBIMA from 1994 to August 2003 and its president from August 2003 to August 2008. He has been a member of the board of directors of the Securities Dealers’ Association (Associação das Empresas Distribuidoras de Valores ADEVAL), since 1993, of BM&FBOVESPA (formerly BOVESPA) since 1996, of the Brazilian Association of Listed Companies (Associação Brasileira das Companhias Abertas ABRASCA), since 1999, and of BM&FBOVESPA (formerly BOVESPA) since August 2007. He was a member of the board of directors of the Brazilian Settlement and Custody Company (Companhia Brasileira de Liquidação e Custódia CBLC), from 1998 to 2003. He was president of the board of directors of the Brazilian Institute of Investor Relations (Instituto Brasileiro de Relações com Investidores IBRI), from 2000 to 2003 and a member since 2004. He has served as the finance officer of the Museum of Modern Art of São Paulo — MAM since 1992. Mr. Alfredo Setubal has a bachelor’s and a post-graduate degree in Business Management from Fundação Getulio Vargas (FGV).
Mr.Candido Botelho Bracher has been a member of our board of directors since November 2008 (with investiture on February 19, 2009) and the executive vice president of our board of officers since May 2, 2005 (with investiture on August 1, 2005). He is currently responsible for our corporate treasury division. He has been a member of the board of directors of Itaú BBA since February 2003, CEO since April 2005, and is responsible for the commercial, capital markets and human resources divisions and was vice president of the board of officers from February 2003 to April 2005. He served as an officer at Banco BBA Creditanstalt S.A. from 1988 to 2003. He has served as executive vice president of Unibanco since November 2008. He is a member of the board of directors of Pão de Açúcar S.A. and of BM&FBOVESPA (formerly BOVESPA). Mr. Bracher has a degree in Business Administration from the Fundação Getulio Vargas (FGV).
Mr.Fernando Roberto Moreira Salles has been a member of our board of directors since November 2008 (with investiture on February 19, 2009). He was vice chairman of the board of directors of E. Johnston. He has been chairman of the boards of directors of Companhia Brasileira de Metalurgia e Mineração since 2008 and of Brasil Warrant Administração de Bens e Empresas S.A. since 1988. He has been an officer of Editora Schwarcz Ltda. since 1988. He served as vice chairman of the board of directors of Unibanco from 1976 to 1988. He has been a member of the advisory board of Fundação Roberto Marinho since 1996 and a member of the board of directors of Instituto Moreira Salles, serving as president of the board from 2001 to 2008. Mr. Fernando Moreira Salles has a degree in Finance and Capital Markets from the Fundação Getulio Vargas (FGV).
Mr.Francisco Eduardo de Almeida Pinto has been a member of our board of directors since November 2008 (with investiture on February 19, 2009). During 1982, he was a financial assistant at Visius — Instituto Boavista de Seguridade Social. From 1983 to 1984, he served as the technical department manager at Saga Investimentos e Participações do Brasil Ltda. From 1984 to 1993, he was at Banco da Bahia Investimentos (currently Banco BBM S.A.), most recently as finance officer. From 1993 to 1994, he served as deputy governor of monetary policy at the Central Bank. From 1994 to 1995 he served as general officer of Banco da Bahia Investimentos S.A., and during 1995 as general officer of Unibanco Asset Management. He was the managing partner at Radix Gestão de Recursos Financeiros Ltda. from 1996 to 1998 and the chief financial officer of BBA Capital DTVM (and its successor, BBA Icatu Investimentos DTVM) from 1998 to 2002. From 2002 to 2007, he worked for his own account. Since 2007 he has been a director at Brasil Warrant Administração de Bens e Empresas S.A. and from 2007 to 2008 he served on the board of directors of Unibanco. Since 2008 he has been a director of BW Gestão de Investimentos Ltda. Mr. Almeida Pinto graduated from the Pontifícia Universidade Católica do Rio de Janeiro (PUC) in Economics.
Mr.Gustavo Jorge Laboissiere Loyola has been a member of our board of directors since April 2006 (with investiture on July 31, 2006). He has also been a member of our audit committee since May 2007, and since September 2008 he has served as its president. He was president of our fiscal council from March 2003 to April 2006. He has been a partner and an officer of Gustavo Loyola Consultoria S/C since February 1998 and a member of the board of directors of Caramuru Alimentos S.A., since April 2008. He was the governor of the Central Bank from November 1992 to March 1993 and from June 1995 to August 1997, as well as the deputy governor for the Financial System Regulation and Organisation from March 1990 to November 1992. He was a partner and an officer of MCM Consultores Associados Ltda. from August 1993 to May 1995, assistant officer of Banco de Investimento Planibanc S.A. from February to October 1989 and operating officer of Planibanc Corretora de Valores S.A. from November 1987 to January 1989. Mr. Loyola has a bachelor’s degree in Economics from Universidade de Brasília and a master’s degree and Ph.D. in Economics from the Fundação Getulio Vargas (FGV).
Mr. Henri Penchas has been a member of our board of directors since November 2002 (with investiture on March 10, 2003) and served as senior vice president from April 1997 to April 2008, executive vice president from 1993 to 1997 and executive officer from 1988 to 1993. He was an executive officer of Itaúsa from December 1984 to April 2008, has been its investor relations officer since 1995 and its executive vice president since April 2009. He has also been the chief executive officer of Duratex since April 2009. Mr. Penchas was the vice president of the board of directors of Itaú BBA from February 2003 to April 2008. Mr. Penchas has a bachelor’s degree in Mechanical Engineering from the Universidade Mackenzie (MACKENZIE) and a post-graduate degree in finance from the Fundação Getulio Vargas (FGV).
Mr. Israel Vainboim has been a member of our board of directors since November 2008 (with investiture on February 19, 2009). He was elected to the board of directors of Unibanco in 1988 and to the board of directors of Unibanco Holdings in 1994. He was chairman of Unibanco from 1988 to 1992. He has served as executive chairman of Unibanco Holdings since 1992. He joined Unibanco in 1969. He has served on the board of directors of Souza Cruz S.A., Iochpe Maxion S.A.,E-Bit Tecnologia em Marketing S.A., Vinhedo Investimentos Ltda., Casa da Cultura de Israel, Museu de Arte Moderna de São Paulo — MAM and Hospital Israelita Albert Einstein. Mr. Vainboim has a bachelor’s degree in Mechanical Engineering from the Universidade Federal do Rio de Janeiro (UFRJ), and a master’s degree in Business Administration, or MBA, from Stanford University.
Mr. Pedro Luiz Bodin de Moraes has been a member of our board of directors since November 2008 (with investiture on February 19, 2009). He was a partner in Itaú Holding and a member of the board of directors of Unibanco, from April 2003 to November 2008. He was an officer and partner at Banco Icatu S.A. from 1993 to 2002. He served as deputy governor for monetary policy at the Central Bank from 1991 to 1992 and officer of BNDES from 1990 to 1991. Mr. Bodin de Moraes has a bachelor’s and master’s degree in economics from the Pontifícia Universidade Católica do Rio de Janeiro (PUC-RJ) and a Ph.D. in economics from Massachusetts Institute of Technology (MIT).
Mr. Ricardo Villela Marino has been a member of our board of directors since April 2008 (with investiture on June 2, 2008) and has served as executive vice president of Itaú Unibanco since September 2009 (with investiture on February 2, 2010). He is currently responsible for our human resources and international division. He served as our senior managing officer from May 2005 to August 2006, managing officer from April 2004 to April 2005, head of the derivatives dealing desk (heading the team responsible for the structuring and sale of derivative products to middle market companies, institutional investors and private individuals) from 2003 to 2004 and head of business intelligence (responsible for the implementation of new technologies and methodologies which have helped us become a leader in the credit card industry in Brazil) from 2002 to 2003. He has served as chairman of Federación Latino Americana de Bancos, or FELABAN, since November 2008. He was a manager of the emerging markets’ equities portfolio covering Argentina, Chile, Peru, Colombia and South Africa and of the relations with governments, banks and manager of companies in each of these countries at Goldman Sachs Asset Management in London. Mr. Villela Marino has a degree in Business Administration from MIT Sloan School of Management, Cambridge, a master’s degree in Business Administration with specialisation in Financial Administration and bachelor’s degree in Mechanical Engineering from the Escola Politécnica of the Universidade de São Paulo (USP).
Mr. Caio Ibrahim David has been a member of our board of officers since May 2010 (with investiture on December 3, 2010). He joined the group in 1987 as a trainee, with expertise as a controller and in risk management. He has been an executive officer of Itaú BBA since April 2008 and is responsible for finance, market intelligence and operations of corporate investment bank and institutional treasury. He has been a vice-chairman of the board of directors of Redecard since May 2010. He has been an executive officer of Itauseg Participa��ões S.A. and member of the board of directors of BFB Leasing S.A. Arrendamento Mercantil and Dibens Leasing S.A. - Arrendamento Mercantil, all since April 2010. He has been alternate chairman of the board of directors of Financeira Itaú CBD S.A. Crédito, Financiamento e Investimento since April 2010. Additionally, he worked at Bankers Trust in New York as an associate in the area of Global Risk Management in 1998. He has bachelor degree in Engineering from the Universidade Mackenzie (MACKENZIE) (1986-1990), post-graduate degree in Economics and Finance (1992-1993) from the Universidade de São Paulo (USP) and master in Controllership also from the Universidade de São Paulo (USP) (1994-1997) and an MBA from the New York University (1997-1999) with major in finance, accounting and international business.
Ms. Claudia Politanski has been a member of our board of officers since November 2008 (with investiture on November 27, 2008) and is currently responsible for our legal division and serves as general legal counsel. She joined Unibanco in 1991 and was elected executive officer of Unibanco in 2007. Ms. Politanski has a law degree from the Universidade de São Paulo (USP). She also holds a master’s degree in law, or L.L.M., from the University of Virginia and an MBA from the Fundação Dom Cabral, Minas Gerais.
Mr.Marcos de Barros Lisboa has been a member of our board of officers since April 2009 (with investiture on September 1, 2009) and is currently responsible for our operational risk and efficiency divisions. He was elected executive officer of Unibanco in July 2006. From 2001 to 2003, he was the academic director of the graduate school of economics of Fundação Getulio Vargas (FGV), Rio de Janeiro. He was also the Secretary of Economic Policy at the Finance Ministry of Brazil from 2003 to 2005 and the chief executive officer of the IRB from 2005 to 2006. He was elected to the boards of directors of AIG Brasil Cia. de Seguros and Unibanco AIG Consultoria de Investimentos Ltda. in 2008. He holds a bachelor’s degree and a master’s degree in Economics from the Universidade Federal do Rio de Janeiro (UFRJ) and a Ph.D. in Economics from the University of Pennsylvania. Mr. Lisboa held academic positions at the department of economics at Stanford University and at the Fundação Getulio Vargas (FGV).
Mr.Ricardo Baldin has been a member of our board of officers since April 2009 (with investiture on September 1, 2009) and is currently responsible for our internal audit division. In 1977 he joined PricewaterhouseCoopers as a trainee and was a partner there for 18 years. As an independent auditor, he was the leading partner in the area of financial institutions. He was also the partner responsible for PricewaterhouseCoopers’ financial institutions group in South America, where he was responsible for coordinating various projects in the region, including the evaluation of the Ecuadorian financial system. He was an officer of the National Association of Financial, Administrative and Accounting Executives and was also responsible for the financial institutions group at IBRACON for several years. Mr. Baldin has a bachelor’s degree in accounting science from the Universidade do Vale do Rio dos Sinos, Rio Grande do Sul, and university extension courses in Management and Finance from the Fundação Dom Cabral and the Fundação Getulio Vargas (FGV).
Mr.Sérgio Ribeiro da Costa Werlang has been a member of our board of officers since April 30, 2003 (with investiture on October 1, 2003) and has served as our chief risk executive officer since May 2008. He is currently responsible for our risk and financial controls divisions. He was our senior managing officer from March 2002 to March 2003. He has been a member of Itaú BBA since April 2005. He was a deputy governor for economic policy for the Central Bank from February 1999 to September 2000 and an executive officer of Banco BBM S.A. from October 1997 to December 1998. He was an officer for research and administrative resources and asset management of Banco BBM S.A. from 1994 to 1998. Mr. Werlang has a degree in Naval Engineering from the Universidade Federal do Rio de Janeiro (UFRJ), a master’s degree in mathematical economics from Instituto de Matemática Pura e Aplicada do Rio de Janeiro and a Ph.D. in economics from Princeton University.
Mr.Eduardo Hiroyuki Miyaki has been a member of our board of officers since April 2011 (with investiture on August 1, 2011). He has been an officer of Itaú Unibanco since June 2010. He was the manager and compliance officer of the Money Laundering Prevention program of the Itaú Unibanco Group from 1996 to 2003 and, from 2003 until 2004, he was the manager responsible for its internal audit department for our treasury and asset management units. Mr. Miyaki was also the manager of our internal audit of treasury, capital markets, insurance and securities units from 2005 to 2010, when he became a managing director of Itaú Unibanco. He holds a degree in Civil Engineering from the Universidade de São Paulo (USP), a postgraduate degree in sanitation from Federal University of Gunma Province in Japan and an a post-graduate degree in Business Administration from the Fundação Getulio Vargas (FGV). Mr. Miyaki also holds an MBA in International Finance and Business from the Leonard Stern School of Business of New York University.
Mr.Emerson Macedo Bortoloto has been a member of our board of officers since September 2011 (with investiture on November 1, 2011). He joined us in July 2003, holding positions in the Internal Audit group. Since November 2008, he has been responsible for the evaluation of processes related to Market, Credit and Operational Risks in addition to Auditing Projects and Continuous Auditing. Previously, Mr. Bortoloto held positions in the Itaú Unibanco group in Coordination and Management, where he was responsible for auditing the processes of Information Technology and Analysis and Concession of Retail Credit. He also worked at Ernst & Young Auditores Independentes from May 2001 to June 2003, as well as at Banco Bandeirantes S.A. between 1992 and 2001, where he was responsible for conducting IT and operational processes audits. He holds a degree in Data Processing Technology from the Faculdades Integradas TIBIRIÇA and a postgraduate degree in Auditing and Consultancy in Information Security from FASP – Faculdades Associadas de São Paulo. In 2004, he was awarded a CISA certification issued by ISACA. Mr. Bortoloto holds an MBA in Internal Auditing from FIPECAFI.
Mr.Marco Antonio Antunes has been a member of our board of officers since May 2005 (with investiture on August 1, 2005) and is currently responsible for our accounting division. He was the manager of the budget control department from December 1990 to May 1997 and general manager from June 1997 to February 2000. He has been an officer of Itaucred since February 2003, of Banco Itaucard since July 2000, and a managing officer of Banco Itauleasing S.A. since April 2003. Mr. Antunes holds a degree in Metallurgical Engineering from Universidade Presbiteriana Mackenzie (MACKENZIE)and a specialisation (master’s degree level) in accounting and finance from the Universidade de São Paulo (USP).
Mr.Rogério Paulo Calderón Peres has been a member of our board of officers since April 2011 (with investiture on August 1, 2011). He has been an officer of Itaú Unibanco since April 2009 and member of the Disclosure and Trading Committee of Itaú Unibanco Holding since June 2009. Mr. Calderón was an executive officer of Unibanco from 2007 to April 2009 and of Grupo Bunge from 2003 to 2006. Mr. Calderón was a member of the board of directors of Fertilizantes Fosfatados S.A. – Fosfertil, Ultrafertil S.A. and Fertifos S.A., an officer of Bunge Brasil S.A. and Fertifos S.A. and member of the audit committee of Fundação Bunge, Bungeprev — Fundo Múltiplo de Previdência Privada and Fosfertil from 2003 to 2006. From 1981 to 2003 he was a partner at PricewaterhouseCoopers’s audit, tax and consulting divisions. Mr. Calderón holds a degree in Business Administration from the Fundação Getulio Vargas (FGV), a degree in Accounting from Fundação Paulo Eiró and has completed a postgraduate course from the E-Business Education Series from Darden Graduate School of Business Administration of University of Virginia. He also attended courses at the Summer Executive Business School at the University of Western Ontario Canada, the Center for Executive Development Faculty of Princeton University, Management of Continuing Education and Training Professionals in Arundel, England, and Executive Business Development at Fundação Getulio Vargas (FGV).
Mr.Rodrigo Luis Rosa Couto has been a member of our board of officers since December, 2011 (with investiture on January 10, 2012). He joined us in 2008, holding a position in the corporate risk management sector. Previously, Mr. Couto worked at McKinsey & Company as an Associate from September 2005 to February 2008, as well as at the Central Bank from 1998 to 2003. He holds a degree in Business from Universidade Federal do Rio Grande do Sul and an MBA in Finance from the Wharton School, University of Pennsylvania.
Three of our directors, Alfredo Egydio Arruda Villela Filho, Roberto Egydio Setubal and Alfredo Egydio Setubal, are members of the Egydio de Souza Aranha family and two of our directors, Pedro Moreira Salles and Fernando Roberto Moreira Salles, are members of the Moreira Salles family.
There are no pending legal proceedings in which any of our directors, nominees for director, or officers is a party adverse to us. We have no knowledge of any arrangement or understanding with major shareholders, customers, suppliers or any other person pursuant to which any person was selected as a director or executive officer, except the shareholders’ agreement between Itaúsa and E. Johnston to govern their relationship regarding IUPAR, Itaú Unibanco Holding and its subsidiaries. See “ Item 7A. Major Shareholders — Shareholders’ Agreements”.
For the year ended December 31, 2011, the aggregate compensation accrued by us for all members of the board of directors and the board of officers of the Itaú Unibanco Group for services rendered during that year in all capacities was approximately R$617.6 million. This figure includes salaries in the amount of approximately R$271.0 million, a profit-sharing plan in the amount of approximately R$191.9 million and contributions to employer-sponsored pension plans in the amount of approximately R$5.0 million. Except for the highest and lowest compensation received by a director and an officer, without identification of the individual recipients, we are not required under Brazilian law to, and we do not, disclose the compensation of our directors, officers and members of our administrative, supervisory or management bodies on an individual basis.
On April 25, 2011, our shareholders approved (i) compensation for members of our board of directors in an annual aggregate amount of R$11 million, (ii) compensation for members of our board of officers in an annual aggregate amount of R$115 million, and (iii) monthly individual compensation of R$12,000 and R$5,000 for members and alternate members of our fiscal council, respectively.
Our officers and members, of our board of directors receive additional benefits generally provided to our employees, such as medical and dental assistance, which benefits totalled approximately R$3.7 million for the year ended December 31, 2011.
Regarding the disclosure of the highest and lowest compensation received by a director and an officer, on March 2, 2010, the Brazilian Institute of Financial Executives – IBEF Rio de Janeiro filed, on behalf of affiliated executives, an ordinary proceeding requesting an injunction, in which the legality of this disclosure requirement is being challenged on the grounds that it would cause great discomfort to the executives and would violate their individual rights and guarantees. We do not intend to make this disclosure until the matter is finally determined, especially in light of our view that our executives’ rights to judicial review would otherwise be curtailed.
We have established a profit sharing plan for our management, including our board of directors and board of officers. The plan and its rules have been approved by our board of directors. Under the terms of such plan, each member of our management (including our board of directors and board of officers) who is a beneficiary of the plan is assigned semi-annually a base amount for computation of payments under the profit sharing plan. The final amount of the profit sharing payment to an individual is based on the consolidated results of the Itaú Unibanco Group, the results of the business unit to which the individual belongs and the individual’s performance. This individual amount is determined by multiplying the base amount by an index applicable to all participants. This index depends on our level of return on stockholders’ equity.
In addition, we have granted options to our management under the stock option plan described below.
Our directors have not entered into any service contract with us or any of our subsidiaries providing for benefits upon termination of employment.
For information concerning the election of our directors and officers and their respective term of office see “Item 6A. Directors and Senior Management.”
For information concerning the duties of the board of directors, see “Item 10B. Memorandum and Articles of Association”.
Statutory Bodies
Fiscal Council
According to Brazilian Corporate Law, the adoption of a fiscal council is voluntary. Our fiscal council has been established annually since 2000, even when our bylaws granted non-permanent status to our fiscal council. The fiscal council may be adopted on a permanent or temporary basis. The fiscal council is an independent body elected by shareholders annually to supervise the activities of management and independent auditors. The responsibilities of the fiscal council are established by the Brazilian Corporate Law and encompass the oversight of management’s compliance with the laws and bylaws, the issuance of a report included in the annual and quarterly reports and certain matters submitted for shareholders’ approval and calling of shareholders’ meetings and the reporting of specific adverse matters arising at those meetings. Our fiscal council is composed of the following individuals, each of whom serves for a term of one year and was elected on April 25, 2011 at the annual shareholders’ meeting:
Name | | Position | | Date of Birth |
| Iran Siqueira Lima(*) | | President | | 05/21/1944 |
| Alberto Sozin Furuguem(*) | | Member | | 02/09/1943 |
| Artemio Bertholini(**) | | Member | | 04/01/1947 |
| Ernesto Rubens Gelbcke(**) | | Alternate | | 12/01/1943 |
| José Caruso Cruz Henriques(*) | | Alternate | | 12/31/1947 |
| João Costa(*) | | Alternate | | 08/10/1950 |
(*) Members appointed by the controlling block of shareholders.
(**) Members appointed by the holders of preferred shares.
Audit Committee
In accordance with CMN regulations, all financial institutions that (i) have regulatory capital equal to or in excess of R$1 billion; (ii) manage third-party funds of at least R$1 billion; or (iii) hold deposits and manage third-party funds in an aggregate amount of at least R$5 billion, are required to have an in-house audit committee. Audit committees are required to be created under an express provision in the bylaws of the respective financial institution and are required to be composed of at least three members, one of which must be a financial expert, who should rotate every five years. The members of the audit committee will only be allowed to be part of the committee again after three years following the maximum five-year office term.
Audit committee members of publicly held financial institutions may not (i) be or have been in the previous twelve months: (a) an officer of the institution or its affiliates, (b) an employee of the institution or its affiliates, (c) an officer, manager, supervisor, technician, or any other member of the team involved in auditing activities at the institution, or (d) a member of the institution’s fiscal council or that of its affiliates; and (ii) be a spouse or relative (first or second-degree relative) of the persons described in items (i)(a) or (i)(c).
Audit committee members of publicly held financial institutions are also prohibited from receiving any compensation from the institution or its affiliates other than as a member of the audit committee. In the event an audit committee member of the institution is also a member of the board of directors of the institution or its affiliates, such member must opt for compensation related to only one of the positions.
Our audit committee reports to the board of directors and its principal functions are to oversee:
| · | the quality and integrity of the financial statements of Itaú Unibanco Holding; |
| · | the compliance with legal and regulatory requirements; |
| · | the performance, independence and quality of the services rendered by the independent auditors of Itaú Unibanco Holding; |
| · | the performance, independence and quality of the work performed by the internal auditors of Itaú Unibanco Holding; |
| · | the quality and the effectiveness of the internal controls and risk management systems of Itaú Unibanco Holding; |
| · | recommendations for improvement or change of policies and procedures; and |
| · | recommendations for hiring and replacement of independent auditors to the board of directors. |
According to Central Bank regulations, the audit committee is required to be a statutory body, created by a shareholders’ resolution, which is separate from the board of directors. Notwithstanding the requirement of separate corporate bodies, the members of the audit committee may be members of the board of directors, provided that they meet certain independence requirements. In addition, under Brazilian law, the hiring of the independent auditor is a function reserved exclusively for the board of directors of a company. However, Brazilian regulation permits the creation of a single committee for an entire group of companies.
Independent auditors and the audit committee must immediately notify the Central Bank of the existence or evidence of error or fraud within a maximum period of three business days from the respective identification of the same, including:
| · | non-compliance with legal and regulatory norms that place the continuity of the audited entity at risk; |
| · | fraud of any amount perpetrated by the administration of said institution; |
| · | relevant fraud perpetrated by entity employees or third parties; and |
| · | errors that result in significant mistakes in the accounting records of the entity. |
Our audit committee is comprised of the following individuals, each of whom serves for a one year term and was elected by our board of directors.
Name | | Position |
| Gustavo Jorge Laboissiere Loyola | | President |
| Alkimar Ribeiro Moura | | Member |
| Eduardo Augusto de Almeida Guimarães | | Member |
Name | | Position |
| Guy Almeida Andrade | | Member and Financial Expert |
| Luiz Alberto Fiore | | Member |
Our board of directors has determined that one of the members of our audit committee, Mr. Guy Almeida Andrade, is an audit committee financial expert and meets the requirements set forth by the SEC and the NYSE. Our audit committee financial expert, along with the other members of our audit committee, who are financially literate, are independent pursuant to CMN Resolution No. 3,198, which requires that such members not be, or have been in the last year, an officer or employee of the company or its affiliates or an employee with managerial responsibilities in the internal audit division of the company. We believe the skills, experience and education of our audit committee members qualify them to carry out all of their duties as members of the audit committee, including overseeing the preparation of our IFRS financial statements. In addition, our audit committee has the ability to retain independent auditors, financial advisers or other consultants, advisers and experts whenever it deems appropriate.
See above for the biography of Gustavo Jorge Laboissiere Loyola. Set forth below are brief biographical descriptions of Messrs.Alkimar Ribeiro Moura, Eduardo Augusto de Almeida Guimarães, Guy Almeida Andrade and Luiz Alberto Fiore.
Mr. Alkimar Ribeiro Moura has been a member of our audit committee since May 2010. He was an independent member on the Supervisory Board of BM&FBOVESPA Supervisão de Mercados (BSM) from October 2007 to September 2010. Previously, he was a member of the board of Banco Nossa Caixa S.A. from May 2006 to February 2007 and of Cia. Brasil de Seguros from May 2001 to February 2003. He was a member of the board of Banco Bandeirantes S.A. from May 1999 to December 2000, and chief executive officer of the Banco do Brasil Banco de Investimentos (BBBI), and executive vice-president for Finance and Capital Markets of the Banco do Brasil S.A., from April 2001 to January 2003. In the Central Bank, he was deputy governor for Financial System Regulations and Organization, from February 1996 to September 1997, deputy governor for monetary policy from March 1994 to February 1996, and deputy governor for public debt and open market operations from January 1987 to January 1988. Mr. Moura has a degree in economics from the Universidade Federal de Minas Gerais, a master’s degree from University of California, Berkeley, USA in 1966, and a Ph.D. in economics from Stanford University.
Mr. Eduardo Augusto de Almeida Guimarães has been a member of our audit committee since December 2008. He was a member of the audit committee of Unibanco from April 2004 to December 2008. He previously held the positions of president of the IBGE from 1990 to 1992, National Treasury Secretary at the Ministry of Finance from 1996 to 1999, CEO of the BANESPA from 1999 to 2000, and CEO of Banco do Brasil from 2001 to 2003. He has been a member of the boards of directors of various companies such as Banco do Brasil, CEF, BNDES Participações S.A. and Banco Nossa Caixa S.A. He has also undertaken various academic functions, such as professor and dean of the Economics Institute of the Universidade Federal of Rio de Janeiro, lecturer in the Economics Departments of both the Pontifícia Universidade Católica of Rio de Janeiro (PUC), and the Universidade Federal Fluminense. Mr. Guimarães has a degree in civil engineering, a degree in economics, a master’s degree in production engineering from the Universidade Federal do Rio de Janeiro, and a Ph.D. in economics from the University of London.
Mr. Guy Almeida Andrade has been a member of our audit committee since December 2008. He was a member of the audit committee of Unibanco from April 2004 to December 2008. He began his career in 1974 at Magalhães Andrade S/S Auditores Independentes, where he became a partner in 1982, a position he currently holds. In 1984, he joined an intern program at Dunwoody & Co., Toronto, Canada. In 1983, he was admitted to the Chamber of Independent Auditors of IBRACON. From 2002 to 2004, he was president of the National Executive Board of IBRACON and, currently, Mr. Andrade is Chairman of the board of directors of IBRACON. In 2000, he was elected as a member of the board of directors of the International Federation of Accountants — IFAC, headquartered in New York, a position he held until November 2006. Mr. Andrade was the chairman of IFAC’s audit committee, from 2003 to 2006. He was also a member of IFAC’s nominating committee, from 2007 to 2010. Mr. Guy Almeida Andrade has a bachelor’s degree in accounting from the Universidade de São Paulo, (USP), and a bachelor’s degree in business administration from Universidade Mackenzie.
Mr. Luiz Alberto Fiore was elected as a member of our audit committee in February, 2012 (with election approved by the Central Bank and pending investiture). He began his career in 1971 at PriceWaterhouseCoopers. In 1973, he joined Deloitte Touche Tohmatsu, where he became a partner in the External Audit and Corporate Finance areas in 1985 and member of the Executive Committee and of the board of directors of Deloitte do Brasil in 1987. In 1998, he became a representative for Latin America of the International Board of Deloitte Corporate Finance, continuing at Deloitte until 2010. Mr. Luiz Alberto Fiore has a bachelor’s degree in Business Management from Universidade Católica (ESAN-PUC) and a bachelor’s degree in Accounting Sciences from Universidade Mackenzie.
Committees of the Board of Directors
The information provided below relates to the members of the strategy, risks and capital management, appointment and corporate governance, personnel and compensation committees elected on April 28, 2011.
The board of directors generally appoints members to each committee from the members of our board of directors, however, key employees of Itaú Unibanco Holding and specialists in each specific committee area may be invited to be members of a committee. Members are appointed on an annual basis.
Strategy Committee
Our strategy committee is responsible for corporate strategy, investments and budget.
With respect to corporate strategy, the committee: (i) supports the board of directors in its discussions with the board of officers regarding the strategic guidelines with respect to business matters; (ii) issues opinions and recommendations on the strategic guidelines and provides input for the board of directors’ discussions and decisions; and (iii) takes the initiative in the discussion of key matters and those of a high impact nature.
Regarding investments, the committee: (i) reviews investment opportunities presented by the board of officers which have a relevant impact on the business; and (ii) issues opinions and recommendations on investment opportunities presented, providing input and support to the discussions and decisions of the board of directors.
As to the budget, the committee: (i) proposes budgetary guidelines; (ii) conducts a thorough discussion with the board of officers in order to establish budgetary guidelines; (iii) conducts discussions with the board of officers and makes a recommendation on the budget for the current year to the board of directors; and (iv) advises and supports the CEO in monitoring corporate strategy in relation to the budget.
Further, the strategy committee also establishes an economic scenarios sub-committee, made up of key employees of Itaú Unibanco Holding and its controlled companies that have recognised expertise in macroeconomy. Such sub-committee supplies macroeconomic input to the strategy committee to provide support for its considerations in defining strategy, investments and budgets.
The following members of our board of directors were appointed to our strategy committee: Pedro Moreira Salles, Roberto Egydio Setubal, Ricardo Villela Marino, Henri Penchas and Israel Vainboim.
Capital and Risk Management Committee
Our capital and risk management committee is responsible for supporting the board of directors in the performance of its functions related to Itaú Unibanco’s risk and capital management, submitting reports and recommendations for the analysis of the board of directors with respect to: (i) supervision of Itaú Unibanco’s risk management and control activities, for the purpose of ensuring their adequacy to the risk levels assumed and to the complexity of operations, as well as complying with regulatory requirements; (ii) review and approve capital management policies and strategies that establish mechanisms and procedures aimed at maintaining capital compatible with the risks incurred by the institution; (iii) determination of the minimum return expected on the capital of Itaú Unibanco as a whole and of its business lines, as well as performance monitoring; (iv) supervision of incentive structures, including compensation, aimed at ensuring their alignment with risk control and value creation objectives; and (v) promotion of the improvement of Itaú Unibanco’s risk culture.
The following members of our board of directors were appointed to our capital and risk management committee: Roberto Egydio Setubal, Gustavo Jorge Laboissière Loyola, Pedro Luiz Bodin de Moraes, Francisco Eduardo de Almeida Pinto and Candido Botelho Bracher.
Appointment and Corporate Governance Committee
Our appointment and corporate governance committee is responsible for certain corporate governance matters, such as the selection, appointment and assessment of members of our board of directors and CEO.
In connection with corporate governance matters, the Committee: (i) analyses and opines on potential situations of conflicts of interest between the directors and companies that are part of the Itaú Unibanco Group based on criteria established by the board of directors, in particular (a) situations arising from external activities undertaken by members of the board of directors or the board of Officers in the statutory bodies of other companies which are not part of the Itaú Unibanco Holding, and (b) transactions between directors and companies which are part of the Itaú Unibanco Holding; (ii) proposes the division among the directors of the fixed aggregate compensation established by the annual shareholders meeting; (iii) recommends changes in the composition of the board of directors and its committees; and (iv) recommends changes to the structure of committees, including the creation and dissolution of committees.
In connection with selection and appointment of members of the board of directors and the CEO, the committee: (i) identifies, analyses and proposes candidates for the board of directors to be presented at the annual shareholders meeting, and determines, if elected, whether the candidate will be deemed an internal (also an officer of the company), external (not an officer of the company) or independent (not elected by the controlling shareholder, among other independence requirements) director; (ii) periodically reviews criteria for defining independent, external and internal directors pursuant to best practice governance principles and applicable regulations, recommends to the board of directors any modifications that may be necessary and re-evaluates the standing of each director in the light of any new independence criteria that may be established; (iii) assesses the functioning of the board of directors; (iv) discusses and makes recommendations on the succession of the chairman of the board of directors; (v) discusses and makes recommendations on the succession of the CEO; and (vi) assists in the identification of directors qualified to fill vacancies on the board committees, including the appointment and corporate governance committee, and is specifically required to provide an opinion with respect to the independence and financial specialisation of members of the audit committee.
With respect to the assessment of members of the board of directors and the CEO, the committee: (i) recommends processes for evaluating the board of directors, individual directors, the chairman of the board, the committees and the CEO; and (ii) provides support with respect to evaluation methodology and to the board of directors, individual directors, chairman of the board, committees and CEO.
The following members of the board of directors were appointed to the appointment and corporate governance committee: Pedro Moreira Salles, Alfredo Egydio Arruda Villela Filho, Alfredo Egydio Setubal, Henri Penchas, Israel Vainboim and Fernando Roberto Moreira Salles.
Personnel Committee
Since 2009, the personnel committee has been in charge of establishing compensation principles and practices, as well as stock options and overseeing recruiting, training and retaining talented employees. In view of the creation of the compensation committee by our board of directors at a meeting held on February 17, 2011, in response to CMN Resolution No. 3,921, some of the responsibilities of the personnel committee regarding the establishment of the main compensation policies and principles of the Itaú Unibanco Group were transferred to the compensation committee.
Our personnel committee is responsible for establishing the compensation policy of the Company’s directors and officers and staff, defining stock options, attracting, recruiting, training and retaining talented employees.
Regarding compensation and stock options, the personnel committee, among other functions: (i) establishes and revises the policy for compensation of the Company’s directors and officers and staff; (ii) proposes various forms of fixed and variable compensation in addition to benefits and special programs for recruiting and severance; and (iii) approves the granting of stock options of Itaú Unibanco Holding, as the committee responsible for the institutional decisions within the scope of the stock option plans sponsored by Itaú Unibanco Holding.
With respect to recruitment and training issues, the committee: (i) proposes guidelines for recruitment, evaluation and career development policies of the companies which are part of Itaú Unibanco Holding, ensuring the preparation of successors for all key positions; (ii) discusses, monitors and advises the board of officers on the career of key personnel within Itaú Unibanco Holding (varying from 100 to 150 persons) identified not necessarily according to hierarchical function; (iii) monitors the performance of key employees of Itaú Unibanco Holding, evaluating their results in comparison with established targets; (iv) monitors the results of the trainee program, including recruitment during the year, development of the trainees from previous years and an overall analysis of the program; (v) tracks the evaluation system used by the board of officers to evaluate Itaú Unibanco Holding’s employees and analyses compliance with the established guidelines; (vi) assists in the establishment of mentoring guidelines; (vii) advises on skills necessary for Itaú Unibanco Holding to achieve its medium term goals while complying with ethical and moral principles; (viii) reviews the profiles of the principal employees to be hired, recommending their engagement to the CEO and, if hiring an officer, to the board of directors; (ix) recommends general recruitment policies; (x) tracks what companies in the same sector are seeking in regard to their key employees; (xi) advises on the engagement of consultants and specialists for assisting in the hiring process; (xii) monitors the number of employees per business unit compared with established targets; (xiii) discusses the culture and training needs; (xiv) tracks policies with respect to courses and training programs for training personnel; and (xv) assists in the definition of continuing education programs.
The following members of our board of directors were appointed to our personnel committee: Pedro Moreira Salles, Roberto Egydio Setubal, Ricardo Villela Marino, Francisco Eduardo de Almeida Pinto and Candido Botelho Bracher.
Compensation Committee
On February 17, 2011, our board of directors created the compensation committee.
The main functions of the compensation committee currently include: (i) discussion and analysis of the existing compensation models of Itaú Unibanco Holding, Itaú Unibanco and Itaú BBA (including the treasury operations); (ii) proposal of a compensation package for the CEO of Itaú Unibanco Holding for approval by the board of directors; and (iii) evaluation and approval of the compensation packages proposed by the CEO for the executive vice-presidents of Itaú Unibanco and Itaú BBA and for their respective CEOs, including fixed and variable compensation components, benefits and long-term incentive compensation. The impact of CMN Resolution No. 3,921, as well as other legislation relating to existing compensation practices in countries in which our subsidiaries operate, is being reviewed by the compensation committee. See “Item 4B. Business Overview – Regulation by the Central Bank – Compensation of Directors and Officers of Financial Institutions”.
The following members of our board of directors were appointed to our compensation committee: Pedro Moreira Salles, Alfredo Egydio Arruda Vilela Filho, Henri Penchas, Israel Vainboim and Pedro Luiz Bodin de Moraes.
Committees of the Board of Officers
Disclosure and Trading Committee
Our disclosure and trading committee’s main responsibility is to manage our trading and disclosure policies. It covers a range of internal actions in order to improve the flow of information and oversee the ethical conduct of the management and employees in order to: (i) ensure the transparency, quality, equality and accuracy of the information rendered to shareholders, investors, press, government authorities and other capital market entities; (ii) address and implement the criteria established by us so that Itaú Unibanco Holding’s management, shareholders, controllers and employees, as well as third parties that have a relationship with us, may comply with ethical and legal standards in the trading of our securities; (iii) evaluate the guidelines and procedures under our trading policy and guidelines for disclosure of an act or material fact and for maintaining confidentiality of certain information established by our disclosure policy, as well as the prior analysis of the content of announcements to the press; (iv) monitor and regulate compliance by management and other employees of Itaú Unibanco Holding to our policies; and (v) investigate cases of breach of our policies, notifying any infractions to the board of directors.
Our disclosure and trading committee is comprised of our principal investor relations officer and from two to ten persons elected annually among the members of the board of directors, board of officers or controlled companies and specialists in capital markets.
General
The following, table sets forth the number of our employees as of December 31, 2011, 2010 and 2009:
| | | December 31, | |
| | | 2011 | | | 2010 | | | 2009 | |
| Employees (on a consolidated basis) | | | 104,542 | | | | 108,040 | | | | 101,640 | |
| Brazil | | | 98.258 | | | | 102,316 | | | | 96,240 | |
| Abroad | | | 6.284 | | | | 5,724 | | | | 5,400 | |
| Argentina | | | 1.566 | | | | 1,514 | | | | 1,376 | |
| Chile | | | 2.334 | | | | 2,043 | | | | 2,012 | |
| Uruguay | | | 1.099 | | | | 1,071 | | | | 983 | |
| Paraguay | | | 650 | | | | 517 | | | | 461 | |
| Europe | | | 213 | | | | 212 | | | | 345 | |
| Others | | | 422 | | | | 367 | | | | 223 | |
Employees, from each of our operations segments as of December 31, 2011, 2010 and 2009 are presented in the following table:
| | | December 31, | |
| | | 2011 | | | 2010 | | | 2009 | |
| Commercial Banking | | | 95,534 | | | | 93,430 | | | | 89,360 | |
| Itaú BBA | | | 3,024 | | | | 2,387 | | | | 2,310 | |
| Consumer Credit | | | 5,941 | | | | 12,133 | | | | 9,888 | |
| Corporate and Treasury | | | 43 | | | | 90 | | | | 82 | |
| Total | | | 104,542 | | | | 108,040 | | | | 101,640 | |
The number of our employees decreased by 3.2% from December 31, 2010 to December 31, 2011.
Our employees are represented by one of the 203 labour unions in Brazil, which consist of banking labour unions in various localities in which we operate.
Since 1986, the banking industry in Brazil has been the target of strikes organized by labor unions, usually during wage negotiations in the third quarter of each year. During a strike, part of the normal activities of our branches suffers from temporary disruptions. Despite the disruptions to our retail banking operations and, to a lesser extent, our corporate banking operations, we have not historically suffered significant losses due to strikes.
The FENABAN represents banking institutions, as employers and negotiates with the two entities representing the employees, the National Federation of Financial Industry Workers (Confederação Nacional dos Trabalhadores do Ramo Financeiro— CONTRAF), and the National Federation of Credit Industry Workers (Confederação Nacional dos Trabalhadores nas Empresas de Crédito— CONTEC). They carry out annual wage negotiations to update salaries, banks’ overtime pay levels and other benefits. The negotiation takes place in September of each year. We traditionally set the salary structure of our employees above these levels.
We seek to maintain good relationships with our employees and with the labor unions, which represent them.
Itaú Unibanco Holding, through sponsored enterprises, offers its employees 19 pension plans that are administered by nine entities described below, eight of which are closed pensions funds and one of which is an open pension fund. The plans’ main objective is to provide a supplement to Brazilian federal social security benefits. Twelve of the plans are defined benefit plans, under which the calculation of the benefit amount on retirement is determined by a set formula. Three are defined contribution plans, under which contribution amounts are fixed and the benefit amount is proportional to investment returns over time and four are variable contribution plans under which contribution amounts vary by participant and the benefit amount also depends on investment returns over time. New employees can participate in a defined contribution plan managed by Itaú Vida e Previdência S.A.
The plans are administered by the following entities (closed pension funds):
| · | Fundação Itaubanco manages the following plans: PAC, Itaubanco CD Plan, PBF, 002 plan, Itaulam defined benefit plan and variable contribution plan; |
| · | Funbep - Fundo de Pensão Multipatrocinado manages the following plans: Funbep I and Funbep II; |
| · | Prebeg - Caixa de Previdência dos Funcionários do BEG manages the PREBEG plan; |
| · | Fundação Bemgeprev manages the ACMV plan; |
| · | Itaubank Sociedade de Previdência Privada manages the Itaubank plan; |
| · | Itaú Fundo Multipatrocinado manages the following plans: Itaú defined benefit plan and Itaú defined contribution plan; |
| · | UBB PREV – Previdência Complementar manages the following plans Futuro Inteligente plan, basic plan and IJMS plan; |
| · | Fundação Banorte that manages the following plans: Plano I and Plano II; |
Our pension plans are managed in accordance with our corporate governance principles, which aim to ensure that participants receive superior retirement benefits through plan management. As required by Brazilian regulatory agencies, actuarial valuations are made by the actuary responsible for each plan each year. During 2011 we made contributions to the pension plans at levels required by actuarial standards. We made contributions to our pension plans of approximately R$42 million in 2011.
Training and Development
Personnel development is one of our main values, and we make an effort to train high performance teams engaged and motivated by sustainable development. The Itaú Unibanco Business School, provides continuing education in three areas: business (knowledge management of different business areas), leadership (knowledge management for development of leaders) and corporate skills (knowledge management of general application and certification preparation programs). The continuing education of our teams and leaders promotes a high level of discussion on themes such as ethics, sustainability, meritocracy and efficiency.
Except for the stock indirectly owned by our controlling shareholders (owned through their participation in IUPAR and Itaúsa), the members of our board of directors and our board of officers, on an individual basis and as a group, beneficially own less than 1.0% of the shares of our common stock and less than 1.0% of the shares of our preferred stock.
Stock Based Compensation Plans
We have been issuing stock options as compensation since 1995. Accordingly, part of our management’s variable compensation is in the form of stock options, which we believe reinforces their commitment to our performance. Our stock option plan has been instituted with the purpose of integrating officers into our medium and long-term development. Our shareholders, at the general extraordinary meetings, held on April 24, 2009 and April 26, 2010, included the board of directors, senior employees of Itaú Unibanco Holding and senior employees and management members of its controlled companies as beneficiaries of the plan. We believe that this will allow them to benefit from additional value that their work created for Itaú Unibanco Holding. Our stock option plan is designed to retain the services of directors and officers and to obtain highly qualified employees.
Our stock option plan is governed by the personnel committee, whose members are appointed by our board of directors. The personnel committee periodically designates members of our management to whom stock options are granted in the quantities specified. Stock options may also be granted to the members of management of controlled companies or to senior employees of Itaú Unibanco Holding or such controlled companies. Our board of directors may modify the decisions of the personnel committee in their first meeting after the date the options are granted. If not modified, the options granted by the personnel committee are confirmed. The personnel committee may only grant options if our profits are sufficient to permit the distribution of the mandatory dividend in accordance with Brazilian Corporate Law. The amount of options granted in any given year may not exceed 0.5% of our total shares at the end of the relevant fiscal year. If in a specific fiscal year, the amount of stock options granted during such year is below the 0.5% maximum limit of the total number of shares, the difference may be added to options granted in any one of seven subsequent fiscal years.
The options have an exercise period of between five and ten years from the date of their issuance and they may only be exercised after a vesting period determined by the personnel committee and outside blackout periods. The vesting period varies, at the personnel committee’s discretion, from one to seven years from the date of issuance of the options. Blackout periods are time periods during which the CVM forbids management from trading shares of the company with person with which they are affiliated and therefore no options may be exercised.
The exercise price of an option is determined by the personnel committee at the time of the grant and can be restated up to the month prior to the exercise of the option. In determining the exercise price, the personnel committee considers the average prices of our preferred shares of BM&FBOVESPA during the last three months prior to the issuance of the option. An adjustment of up to 20.0% more or less than the average price is permitted.
At the general extraordinary meeting held on April 24, 2009, our shareholders also approved the assumption by Itaú Unibanco Holding of all the rights and obligations that Unibanco and Unibanco Holdings had under their respective stock option plans. After this assumption, the options held by the respective beneficiaries to acquire shares issued by Unibanco and Unibanco Holdings were exchanged for options to acquire shares of Itaú Unibanco Holding at the same exchange ratio used for the Association.
The general extraordinary meeting held on April 24, 2009 also created a new mechanism for the granting of options to beneficiaries who are considered to have had outstanding performance and have potential according to the criteria established by the personnel committee and through the use of performance and leadership evaluation tools. The personnel committee may grant options for which the strike price is paid through the obligation of the beneficiary to invest up to 20.0% of the portion of his or her bonus that is tied to profits and results in shares of Itaú Unibanco Holding. The beneficiaries to whom these options are granted must keep ownership of the shares unaltered and with no encumbrances of any nature from the date the option is granted until the exercise of the option. This mechanism was expanded at the general extraordinary meeting held on April 26, 2010 in order to (i) permit a portion or the full net amount of the bonus to be invested in shares and (ii) allow the personnel committee to impose additional conditions on the exercise of the shares.
In addition, the general extraordinary meeting held on April 26, 2010, established that the shares which the beneficiaries receive through the exercise of options may be subject to additional restrictions in accordance with resolutions adopted by the personnel committee such as minimum holding periods.
On April 25, 2011, our shareholders approved modifications to the Stock Option Plan in order to (i) adjust the rule for termination of the beneficiary holding options; (ii) adjust the term for defining the price of simple options; and (iii) expressly provide that the beneficiaries, upon investing their bonuses in the stock option program and thereby receiving bonus options, may acquire stock directly from our treasury.
See note 21 of our consolidated financial statements as of and for the year ended December 31, 2011, for additional information on our stock option plan and the issuance of options.
Our model of compensation of directors and officers described above is expected to change in view of the requirements of Resolution No 3,921, issued on November 25, 2010 by the CMN. Resolution No 3,921 establishes new rules related to the compensation of directors and officers of financial institutions. The compensation may be fixed or variable. Variable compensation may be based on specific criteria set forth in Resolution No. 3,921 and is required to be compatible with the financial institution’s risk management policies. At least 50.0% of the variable compensation must be paid in stock or stock-based instruments and at least 40.0% of the variable compensation must be deferred for future payment by at least three years and is subject to claw-backs, based on the result of the institution and business unit during the period of deferral. These rules took effect on January 1, 2012 and are applicable to compensation based on the services rendered during the year of 2012. In addition, financial institutions that are publicly-held companies or required by the Central Bank to establish an audit committee must also establish a compensation committee prior to the first shareholders’ meeting of 2012. Such committee must follow the requirements set forth in Resolution No. 3,921.
As of December 31, 2011, we had 69,845,113 options to be exercised by our officers and employees, comprising 443 beneficiaries of simple options (including Itaú Unibanco and the original Unibanco stock option plans) and 216 beneficiaries of partner options (including Itaú Unibanco, Itaú BBA and Unibanco’s original stock option plans).
In 2011, 14,447,900 options were granted under the Stock Option Plan. The granting dates were February 28, April 19, August 19 and November 4, 2011.
ITEM 7 MAJOR SHAREHOLDERS AND RELATED PARTY TRANSACTIONS
7A. Major Shareholders
In accordance with our bylaws, our capital stock is divided into two classes of shares: common shares (ações ordinárias) and preferred shares (ações preferenciais). Each common share entitles its holder to one vote at meetings of our shareholders, and there are no differences in the voting rights conferred by each of our common shares. The preferred shares are non-voting.
The following table sets forth certain information as of February 29, 2012, with respect to (i) any person known to us to be the beneficial owner of more than 5.0% of our outstanding common shares; and (ii) any person known to us to be the beneficial owner of more than 5.0% of our outstanding preferred shares.
| | | Common shares | | | Preferred shares | | | Total | |
| | | | | | % | | | | | | % | | | | | | % | |
| Iupar - Itaú Unibanco Participações S.A. | | | 1,167,536,100 | | | | 51.00 | | | | 0 | | | | 0.00 | | | | 1,167,536,100 | | | | 25.54 | |
| Itaúsa - Investimentos Itaú S.A. | | | 885,142,900 | | | | 38.66 | | | | 77,100 | | | | 0.00 | | | | 885,220,000 | | | | 19.37 | |
| BlackRock | | | 0 | | | | 0.00 | | | | 159,335,737 | | | | 6.98 | | | | 159,335,737 | | | | 3.48 | |
| Others | | | 236,605,300 | | | | 10.34 | | | | 2,068,410,813 | | | | 90.65 | | | | 2,305,016,113 | | | | 50.43 | |
| Subtotal | | | 2,289,284,300 | | | | 100.00 | | | | 2,227,823,650 | | | | 97.64 | | | | 4,517,107,950 | | | | 98.82 | |
| Treasury stock (*) | | | 2,100 | | | | 0.00 | | | | 53,826,050 | | | | 2.36 | | | | 53,828,150 | | | | 1.18 | |
| TOTAL | | | 2,289,286,400 | | | | 100.00 | | | | 2,281,649,700 | | | | 100.00 | | | | 4,570,936,100 | | | | 100.00 | |
(*) Does not include Itaú Unibanco stock held by Itaubanco defined contribution plan in excess of the individual accounts of participants in the amount of 1,500,000 common shares.
Itaú Unibanco Holding is controlled by IUPAR, a holding company controlled by Itaúsa, which is a holding company controlled by the Egydio de Souza Aranha family, holds 50.0% of the common stock and 100.0% of the preferred stock of IUPAR and also directly holds 38.66% of our common stock, and E. Johnston, a holding company controlled by the Moreira Salles family, which holds 50.0% of the common stock of IUPAR. Three of our directors, Alfredo Egydio Arruda Villela Filho, Roberto Egydio Setubal and Alfredo Egydio Setubal, are members of the Egydio de Souza Aranha family and two of our directors, Pedro Moreira Salles and Fernando Roberto Moreira Salles, are members of the Moreira Salles family.
On March 30, 2011, BlackRock, Inc. informed us, according to Article 12 of CVM Rule No. 358 that it owned preferred shares representing approximately 7% of the issued preferred shares of Itaú Unibanco Holding. In addition, BlackRock, Inc. informed us that it holds our shares for investment purposes only.
On April 25, 2011, our shareholders approved a reverse split of our common and preferred shares in the proportion of 100 shares to one share of the same type in order to adjust our shareholder base to reduce administrative costs and improve the efficiency of our book-entry system. Our shareholders also approved a simultaneous stock split of one share to 100 shares, which will maintain the market price of our shares at an appropriate level to ensure liquidity. The transaction, which was ratified by the Central Bank, was completed on November 21, 2011.
The table below contains information regarding our shares and American Depository Shares (“ADS”) according to our internal share record as of February 29, 2012:
| | | Number | |
| | | of Shares | |
| Common Shares | | | 2,289,286,400 | |
| Preferred Shares | | | 2,281,649,700 | |
| Preferred Shares Represented by ADS | | | 874,916,831 | |
| Total | | | 5,445,852,931 | |
Shareholders’ Agreement
Itaúsa and E. Johnston
Itaúsa, a holding company controlled by the Egydio de Souza Aranha family, and E. Johnston, a holding company controlled by the Moreira Salles family, have a shareholders’ agreement that governs their relationship regarding IUPAR, Itaú Unibanco Holding and its subsidiaries. Its main provisions are described below.
Corporate Governance
The board of directors of IUPAR is composed of four members: two appointed by Itaúsa and two by E. Johnston, and its board of officers is composed of four officers: two appointed by Itaúsa and two by E. Johnston. The board of directors of Itaú Unibanco Holding is composed of up to fourteen members, out of which six are jointly appointed by Itaúsa and E. Johnston.
Lock-up Period, Right of First Refusal and Tag-Along Rights
The shares issued by IUPAR may not be transferred by its shareholders to third parties until November 3, 2018. After this period, in case one of the parties decides to transfer shares of IUPAR, the other party may choose to (i) exercise its right of first refusal to acquire the shares, (ii) exercise its tag-along right, in the exact same terms and conditions or (iii) waive both its rights of first refusal and tag-along. Itaúsa may freely transfer the shares issued by Itaú Unibanco Holding that are directly owned by it. In case the parties decide to jointly transfer the totality of their shares issued by IUPAR, Itaúsa may exercise its tag-along right in order to include all or part of the shares issued by Itaú Unibanco Holding that are directly owned by Itaúsa.
Term
The shareholders’ agreement is in effect for a period of twenty years from January 27, 2009, and may be automatically renewed for successive periods of ten years, unless otherwise terminated upon one year’s prior written notice by any of the shareholders.
Bank of America
On June 1, 2010, Bank of America Corporation or “BAC”, a shareholder of Itaú Unibanco Holding, offered, in the form of ADS (each ADS representing one preferred share issued by Itaú Unibanco Holding), all 188,424,758 preferred shares issued by Itaú Unibanco Holding and owned by BAC, corresponding to approximately 8.4% of the outstanding preferred shares issued by Itaú Unibanco Holding and 4.16% of its outstanding total capital stock. In addition, on June 11, 2010, Itaúsa purchased all 56,476,299 common shares issued by Itaú Unibanco Holding and owned by BAC, corresponding to approximately 2.5% of the outstanding common shares issued by Itaú Unibanco Holding and 1.2% of its outstanding total capital stock. As a result of such transactions, the previously existing shareholder agreement among Itaú Unibanco Holding, Itaúsa and BAC is no longer in effect and BAC no longer has the right to appoint one member of the board of directors of Itaú Unibanco Holding or, as a consequence, sell its Itaú Unibanco Holding shares in the event of a transfer of control (tag along).
| 7B. | Related Party Transactions |
Transactions between related parties are carried out at amounts, terms and average rates in accordance with normal market practices during the period, as well as under reciprocal conditions. See “note 34 – Related Parties” of our consolidated financial statements.
Transactions between companies included in the consolidation were eliminated in the consolidated financial statements and take into consideration the absence of risk. See “note 2.4a – Summary of Main Accounting Practices – Consolidation and Proportionate Consolidation” of our consolidated financial statements.
Unconsolidated related parties are the following:
| · | IUPAR and Itaúsa, parent companies of Itaú Unibanco Holding. |
| · | Non-financial subsidiaries of Itaúsa, especially: Itautec S.A., Duratex S.A., Elekeiroz S.A. and Itaúsa Empreendimentos S.A.. |
| · | Fundação Itaubanco, FUNBEP – Fundo de Pensão Multipatrocinado, Caixa de Previdência dos Funcionários do BEG (PREBEG), Fundação Bemgeprev, Itaubank Sociedade de Previdência Privada, UBB – Prev Previdência Complementar, and Fundação Banorte Manuel Baptista da Silva de Seguridade Social, closed-end private pension entities, that administer supplementary retirement plans sponsored by Itaú Unibanco Holding and/or our subsidiaries. |
| · | Fundação Itaú Social, Instituto Itaú Cultural, Instituto Unibanco, Instituto Assistencial Pedro Di Perna, Instituto Unibanco de Cinema, and Associação Clube “A”, entities sponsored by Itaú Unibanco Holding and subsidiaries to act in their respective areas of interest. |
| · | Investments in unconsolidated companies – Porto Seguro Itaú Unibanco Participações S.A., SERASA S.A. and Banco BPI, SA. See “note 12 – Investments in Unconsolidated Companies” of our consolidated financial statements. |
Additionally, there are transactions with entities under joint control, particularly Banco Investcred Unibanco S.A., Financeira Itaú CBD S.A. Crédito, Financiamento e Investimento, Luizacred S.A. Soc. Créd. Financiamento Investimento, FAI Financeira Americanas Itaú S.A. Crédito, Financiamento e Investimento, FIC Promotora de Vendas Ltda. and Ponto Frio Leasing S.A. Arrendamento Mercantil.
The transactions with these related parties are mainly as follows:
| · | interbank deposits, which are investments in other financial institutions; |
| · | deposits, which are funds received as deposits from other entities; |
| · | securities sold under repurchase agreements, which are funds received from security repurchase agreements for financial treasury bills, national treasury bills, national treasury notes, government securities abroad, Eurobonds, bank deposit certificates, debentures, swaps forwards, options and future contracts; |
| · | amounts receivable from (payable to) related parties, which arise from custody fees and risk management fees; |
| · | banking service fees (expenses), which arise from affiliate portfolio management fees, custody fees, risk management fees and social security and investment management fees; |
| · | rental revenues (expenses), which consist of rent for space used by not-for profit entities sponsored by us; |
| · | donation expenses, which consist of donations for investment in projects of not-for profit entities sponsored by us; and |
| · | data processing expenses, which consist of expenses for processing services, including expert technical assistance and maintenance of equipment, provided by Itautec. |
For more details on transactions with related parties see “note 34 – Related Parties” of our consolidated financial statements.
The granting of credit to our officers, directors or affiliates is subject to restrictions under Brazilian law. Under Brazilian law, financial institutions may not grant loans, advances or guarantees to:
| · | any individual, or the immediate family members of such individual, or entity that controls the financial institution or any entity under common control with the financial institution; |
| · | any officer, director or member of the fiscal council of the financial institution, or the immediate family members of such individual, or entity in which such individual directly or indirectly holds more than 10.0% of the capital stock; |
| · | any entity controlled by the financial institution; |
| · | any entity in which the financial institution directly or indirectly holds more than 10.0% of the capital stock or which directly or indirectly holds more than 10.0% of the financial institution’s capital stock; or |
| · | companies in which our officers hold a management position. |
In addition, Itaú Unibanco Holding has made regular donations to Fundação Itaú Social, a charitable foundation whose objectives are:
| · | to create the “Programa Itaú Social,” aimed at coordinating activities of interest to the community, supporting and developing social, scientific and cultural projects, mainly in the areas of education and health; |
| · | to support ongoing projects or initiatives, sustained or sponsored by entities qualified under the “Programa Itaú Social,” and |
| · | to act as a supplier of ancillary services to companies of the group. |
Itaú Unibanco Holding is the founding partner and sponsor of the Instituto Itaú Cultural – IIC, an entity whose purpose is the promotion and preservation of the Brazilian cultural heritage.
The donations to Instituto Itaú Cultural and services rendered by other entities such as:
| · | Fundação Itaubanco, Funbep — Fundo de Pensão Multipatrocinado, Fundação Bemgeprev, UBB PREV — Previdência Complementar, and Fundação Manoel Baptista da Silva de Seguridade Social, closed-end private pension entities, that administer supplementary retirement plans sponsored by Itaú Unibanco Holding and its subsidiaries; and |
| · | Instituto Itaú Cultural, Instituto Unibanco de Cinema and Associação Clube “A,” not-for-profit entities sponsored by Itaú Unibanco Holding and its subsidiaries. |
In addition to the aforementioned transactions, Itaú Unibanco and non-consolidated entities are parties to an agreement for apportionment of common costs, pursuant to which such subsidiaries pay Itaú Unibanco for certain shared structures provided by Itaú Unibanco. In connection with such agreement, the non-consolidated entities paid Itaú Unibanco R$ 8.0 million and R$ 16.6 million in 2011 and 2010, respectively.
| 7C. | Interests of Experts and Counsel |
Not applicable.
ITEM 8 FINANCIAL INFORMATION
| 8A. | Consolidated Financial Statements and Other Financial Information |
The information included in “Item 18. Financial Statements” of this annual report is referred to and incorporated by reference into this Item 8A.
Litigation
Overview
We are party to numerous lawsuits and administrative proceedings that arise during the normal course of our business. We are routinely involved in consumer complaints filed with SUSEP and the Central Bank, which do not constitute administrative proceedings. We are not defendants in any material administrative proceeding with the CVM, SUSEP, the Central Bank or any municipalities.
Our financial statements only include reserves for probable losses that can be reasonably estimated and expenses that we may incur in connection with pending litigation or administrative proceedings, or as otherwise required by Brazilian law. As of December 31, 2011, our provisions for such contingencies were R$15,990 million, of which R$ 8,645 million are related to tax contingencies, R$4,014million are related to labor contingencies, R$3,166 million are related to civil contingencies and R$165 million to other contingencies. See note 31 to our consolidated financial statements as of and for the year ended December 31, 2011. Our management believes that our provisions, including interest, for legal proceedings in which we are defendants are sufficient to cover probable losses that can be reasonably estimated in the event of unfavorable court decisions. It is currently not possible to estimate the amount of all potential costs that we may incur or penalties that may be imposed on us other than those amounts for which we have reserves. We believe that any potential liabilities related to these lawsuits and administrative proceedings will not have a material adverse effect on our financial condition or results. There are no material proceedings in which any of our directors, any member of our senior management or any of our affiliates is either a party adverse to us or to our subsidiaries or has a material interest adverse to us or our subsidiaries.
Civil Litigation
Litigation Arising from Government Monetary Stabilization Plans
From 1986 to 1994, the Brazilian federal government implemented several consecutive monetary stabilization plans to combat hyper-inflation. In order to implement these plans, the Brazilian federal government enacted several laws based on its power to regulate the monetary and financial systems as granted by the Brazilian federal constitution.
Holders of savings accounts during the periods when the monetary stabilization plans were implemented have challenged the constitutionality of the laws that implemented those plans, claiming from the banks where they held their savings accounts additional amounts of interest based on the inflation rates applied to savings accounts under the monetary stabilization plans.
We are defendants in numerous standardized lawsuits filed by individuals in respect of the monetary stabilization plans. We record provisions for such claims upon receipt of summons to present a defense based on statistical criteria. Each provision may be adjusted based on the balance in the savings account statements of each plaintiff during the relevant periods.
In addition, we are defendants in class actions, similar to the lawsuits by individuals, filed by either (i) consumer protection associations or (ii) public attorneys’ office (Ministério Público) on behalf of holders of savings accounts. Holders of savings accounts may collect any amount due based on such a decision. We record provisions when individual plaintiffs apply to enforce such decisions, using the same criteria used to determine provisions for individual lawsuits.
The Federal Supreme Court (Supremo Tribunal Federal) has issued some decisions in favor of the holders of savings accounts, but has not issued a final ruling with respect to the constitutionality of the monetary stabilization plans as applicable to savings accounts. In relation to a similar dispute with respect to the constitutionality of monetary stabilization plans as applicable to time deposits and other private agreements the Federal Supreme Court has decided that the laws were in accordance with the federal constitution. Due to this contradiction, theConfederação Nacional do Sistema Financeiro – Consif filed a special proceeding with the Federal Supreme Court (Arguição de Descumprimento de Preceito Fundamental nº 165, or ADPF, 165), in which the Central Bank has filed an amicus brief, arguing that holders of savings accounts did not incur actual damages and that the monetary stabilization plans as applicable to savings accounts were in accordance with the federal constitution.
Other Civil Litigation
In addition to litigation arising from government monetary stabilization plans, we are defendants in numerous civil lawsuits arising from the normal course of our business. We are not able to currently predict the total amounts involved in these claims, due to the nature of the matters disputed. However, we believe that any potential liabilities related to these lawsuits will not have a material adverse effect on our financial condition or results.
As of December 31, 2011, our total amount of provisions related to civil litigation, including the monetary stabilization plans, was R$3,166 million.
Tax Litigation
We have certain tax disputes that arise from our ordinary business activities, mainly relating to the constitutionality or legality of certain taxes imposed on us. For our accounting policy regarding contingent tax liabilities, and provision for such liabilities, see note 2.4 t to tour consolidated financial statements.
As of December, 31, 2011, our total amount of provisions related to taxes was R$ 8,645 million. See note 31 to our consolidated financial statements as of and for the year ended December 31, 2011, for details regarding the changes in the provisions and respective escrow deposits for tax and social security lawsuits.
The main types of tax disputes for which we have recognized provisions are as follows:
| · | PIS and COFINS: we claim those taxes should be levied on the revenue arising from sales of goods and services, instead of the total gross revenue. |
| · | CSLL: we claim that this tax should be levied at the regular rate of 9.0%, instead of the increased CSLL rate for financial and insurance companies of 15.0%, which we believe unconstitutional. |
| · | IRPJ and CSLL: we claim that the these taxes should be applied on profits earned abroad and argue the non-applicability of Normative Instruction of Federal Revenue Services (“SRF”) No. 213-02 to the extent it exceeds the legal text. |
| · | PIS: we claim that the effectiveness of Constitutional Amendments No. 10 and 17 should not apply retroactively to tax periods prior to its effectiveness, during which the tax provisions of preceding Supplementary Law No. 07 should apply. |
No provision is recognized in relation to tax litigation where the likelihood of prevailing is more likely than losing. The total actual estimated risk in such litigation is R$ 5,930 million, which reflects the amount under dispute where a loss is possible. The main types of such tax disputes are detailed below:
| · | IRPJ, CSLL, PIS and COFINS: we claim certain tax credits that we have offset against other tax liabilities, which have not been recognized by tax authorities. |
| · | IRPJ/CSLL: we defend that losses and discounts on receipt of credits are necessary operating expenses and therefore losses are deductible from loan operations and discounts are deductible upon their renegotiation and recovery. |
| · | ISS: we defend that certain banking transactions do not generate service fees or income, but rather only interest and commissions, and that certain revenues are not listed under the law, and are therefore not subject to the ISS tax. |
| · | INSS: we defend and claim that non-wage benefits, such as profit sharing, transportation voucher and flat bonus, are not subject social security taxes. |
| · | IRPJ, CSLL, PIS and COFINS: we discuss the adequate accounting and tax treatment for amounts received due to onerous usufruct constitution. |
| · | IRPJ, CSLL: we defend the deductibility of interest on capital declared to stockholders based on the Brazilian long-term interest rate (“TJLP”) levied on the stockholders interest on capital for the year and for prior years. |
In addition, we participated in the Program for Cash or Installment Payment of Federal Taxes established by Law No. 11,941 of May 27, 2009, which allowed litigating taxpayers who agreed to discontinue the litigation to pay only the principal amount under dispute without penalties and interest applicable to such amounts. Under this program, we paid part of the disputed amounts in our litigation regarding PIS and COFINS based on total gross revenue as set forth by paragraph 1 of Article 3 of Law No. 9,718 of November 27, 1998, and recognized them under Legal Tax Liability.
Labor Litigation
Labor unions and former employees file lawsuits against us seeking compensation for alleged violations of their labor contract or related statutory rights. As of December 31, 2011, there were approximately 44,600 labor claims filed against us. Individual labor lawsuits against us are primarily related to overtime pay and salary parity. Collective labor lawsuits against us are primarily related to maintenance of healthcare plans, security rules, strikes and salary differences resulting from monetary stabilization plans implemented by the Brazilian federal government. We are also defendants in labor lawsuits filed by the Public Labor Prosecutor Office related to union classification, outsourcing, occupational disease, health and safety, determination of working days, and compliance with minimum share of disabled personnel. For the fiscal year ended December 31, 2011, we paid approximately R$683 million in settlements with former employees and judgments imposed by the labor courts.
Dividend Policy and Dividends
General
Brazilian Corporate Law generally requires that the bylaws of each Brazilian corporation specify a minimum percentage of the distributable profit of the corporation (adjusted net profit, as defined in Article 202 of Brazilian Corporate Law), comprising normal dividends and interest on stockholders’ equity, that must be distributed to the shareholders as described below. Under our bylaws, we are required to distribute to our shareholders each fiscal year an amount equal to not less than 25.0% of our adjusted net profit. This is referred to as the mandatory dividend. Under Brazilian Corporate Law, the mandatory dividend may be paid in the form of normal dividends or in the form of interest on stockholders’ equity. Our board of directors may also declare the payment of interim dividends from retained earnings and profit reserves. Any payment of interim dividends or payment of interest on stockholders’ equity will be netted against the amount of the mandatory dividend for that fiscal year. In addition, under our bylaws, each share is entitled to a priority minimum annual dividend of R$0.022, which amount is reduced from the mandatory dividend payable.
The principal difference between dividends and interest on stockholders’ equity is their tax treatment. For tax purposes, interest on stockholders’ equity is limited to the daily average of the Brazilian long-term interest rate (Taxa de Juros de Longo Prazo or “TJLP”) as determined by the Central Bank, over the taxable year, and cannot exceed the greater of (i) 50.0% of adjusted net profit for the period in respect of which the payment is made (after the deduction of CSL, but before taking into account the amount of such interest on stockholders’ equity and the provision for IRPJ, as described in “Taxation”), and (ii) 50.0% of the sum of retained earnings and profit reserves. Any payment of interest on stockholders’ equity to holders of preferred shares, whether Brazilian residents or not, including holders of ADSs, is subject to Brazilian withholding tax at the rate of 15%, or 25% if the shareholder is a resident or domiciled in a tax haven jurisdiction or a privileged tax regime, pursuant to Normative Ruling No. 1,037 of 2010, as amended. The amount paid to shareholders as interest on stockholders’ equity, net of any withholding tax, may be included as part of the mandatory dividend. In such cases, we are required to distribute to shareholders an amount sufficient to ensure that the net amount received by shareholders, after the payment by us of applicable withholding taxes in respect of the distribution of interest on stockholders’ equity, is at least equal to the mandatory dividend. See “The Brazilian Financial System and Banking Regulation - Taxation on Financial Transactions – Corporate Income Tax and Social Contribution on Profits”.
Under Brazilian Corporate Law, a company is allowed to suspend payment of the mandatory dividend in respect of common shares and preferred shares if management reports to shareholders at a meeting that the distribution would be incompatible with the financial circumstances of the company and the shareholders ratify this decision at a meeting. In this case, the fiscal council must prepare and issue an opinion about the report of management and management must provide an explanation to the CVM within five days of the shareholders’ meeting, justifying the decision. The distributable amount that was not distributed will be recorded as a special reserve and, if not absorbed by losses in subsequent fiscal years, should be paid as dividends as soon as the company’s financial situation permits.
Payment of Dividends
We are required to hold an annual shareholders’ meeting by no later than April 30 of each year at which the annual dividend may be declared or ratified. Additionally, interim dividends may be declared by our board of directors. According to Brazilian Corporate Law, the payment of dividends must occur prior to the end of the fiscal year in which the dividend was declared. A shareholder has a three-year period from the dividend payment date to claim dividends in respect of its shares, after which we have no liability for that payment. Shareholders who do not reside in Brazil must generally register with the Central Bank to have dividends and interest on stockholders’ equity, sales proceeds or other amounts with respect to their shares eligible to be remitted in foreign currency outside of Brazil.
The preferred shares underlying the ADSs are held in Brazil by the custodian (as agent for the depositary), which is the registered owner on the records of the registrar of our preferred shares. The registrar is The Bank of New York Mellon. Payments of cash dividends and cash distributions, if any, on preferred shares underlying the ADSs will be made in Brazilian currency to the custodian or to the depositary, which will then convert or cause to be converted as promptly as practicable those proceeds into U.S. dollars. The custodian or the depositary will deliver the converted proceeds to the holders of our ADSs, in proportion to the number of ADSs representing the preferred shares held by holders; provided, however, that in the event that we, the custodian or the depositary are required to withhold from cash dividend or other cash distribution an amount of taxes or other governmental charges, the amount distributed to the holder of the ADSs shall be reduced accordingly.
Dividend Policy
We currently pay dividends and interest on stockholders’ equity equal to the mandatory dividend, subject to any determination by our board of directors that such distribution would be inadvisable in view of our financial condition and provided that our board of directors determines to pay solely the minimum, non-cumulative preferred dividend in respect of the preferred shares. We currently intend to pay a fixed amount of dividends monthly, which is equal to R$0.015 per share. At the end of a fiscal year, we intend to pay any difference between this monthly dividend and our minimum annual dividend of R$0.022 per share.
The record date in Brazil for the monthly payment is the last business day of the preceding month and in the United States the record date is three business days after the Brazilian record date. The payment of the dividend is the first business day of the following month.
On February 9, 2011, our Disclosure and Trading Committee approved a formal policy regarding dividends and interest on stockholders’ equity, as described above.
History of Dividend Payments
The following table sets forth the dividends and interest on stockholders’ equity paid to or declared for holders of our common shares and preferred shares since 2009.
| | | | Dividend | |
| Year | | | Amount
(In millions of R$) | | | Per Share
(R$) | |
| | | | | | | | |
| | 2011 | | | | 5,054 | | | | 1.12 | |
| | 2010 | | | | 4,482 | | | | 0.99 | |
| | 2009 | | | | 3,977 | | | | 0.92 | |
We also paid our shareholders a dividend of R$0.012 per share, net of taxes in Brazil, on February 1, 2012.
On February 6, 2012, our board of directors declared interest on equity in the amount of R$0.41640 per share (or R$0.35394 per share, net of taxes) and authorized payment of interest on equity declared on December 16, 2011 in the amount of R$0.2880 per share (or R$0.2448, net of taxes). All such amounts are expected be paid on March 13, 2012 and total R$0.59874 per share, net of taxes. In addition, on February 6, 2012, our board of directors approved a 25% increase (i.e., from R$0.12 to R$0.15 per share) in the monthly dividend included in the calculation of our mandatory dividend under Brazilian corporate law, beginning with the payment to be made on April 2, 2012 and calculated based on our final shareholder base as of February 29, 2012.
We are not aware of any significant changes bearing on the financial condition since the date of the consolidated financial statements included in this annual report.
ITEM 9 THE OFFER AND LISTING
| 9A. | Offer and Listing Details |
Our preferred shares trade on the NYSE, under the symbol “ITUB” in the form ADSs. We listed our ADSs on the NYSE and became a U.S. registered company on February 21, 2002 and have since that time complied with NYSE requirements, as well as and those of the SEC, which include disclosure of financial statements in U.S. GAAP until 2010, in IFRS since 2011, and compliance with U.S. legislative requirements, including the 2002 Sarbanes-Oxley Act. Each ADS represents one preferred share. The ADSs are evidenced by of American Depository Receipts, or ADRs, issued by The Bank of New York Mellon, as depositary, under a Deposit Agreement, dated as of May 31, 2001, as amended and restated as of February 20, 2002 and as of March 30, 2009, effective as of April 3, 2009, among us, the depositary and the owners and beneficial owners of ADSs from time to time.
We are a publicly held company with shares traded on the market since our founding in 1943. In 1944 we registered with the BM&FBOVESPA, which is the principal trading market for our preferred shares and common shares. Our shares trade on the BM&FBOVESPA under the symbol “ITUB4” for the preferred shares without par value and “ITUB3” for the common shares without par value.
As of December 31, 2011, there were an aggregate of 2,281,649,700 preferred shares issued, including 57,293,971 held as treasury shares, and 2,289,286,400 common shares issued, including 2,100 held as treasury shares. As of December 31, 2011, 5,330,971 common shares and 1,361,850,301 preferred shares were held by non-Brazilian investors (calculated based on the investors’ addresses indicated in our records related to the shares that are in our custody), representing 0.23% and 59.7%, respectively, of the total of each class outstanding.
We have registered one class of ADSs under a registration statement on Form F-6 pursuant to the Securities Act. As a result of a stock split effected on October 3, 2005, one ADS came to represent one preferred share without par value. As of December 31, 2011, there were approximately884.6 million ADSs outstanding, representing approximately 38.8% of the preferred shares. All of the ADSs were registered in the name of The Depository Trust Company and The Bank of New York Mellon. As of December 31, 2011, there were 82 registered holders of ADSs.
We also trade our preferred shares in the form of Argentine Certificates of Deposits (Certificados de Depósitos Argentinos), or CEDEARs, on the Argentine Stock Exchange (Bolsa de Comércio de Buenos Aires), or BCBA. Currently, one CEDEAR represents one preferred share without par value. As of December 31, 2010, there were approximately 5,141,300 CEDEARs outstanding.
The following table sets forth, for the periods indicated, the reported high and low sales prices for our preferred shares on the BM&FBOVESPA, inreais and U.S. dollars at the selling rate for the sale of U.S. dollars at the last day of each respective period. See “Item 3A. Selected Financial Data - Exchange Rates” for information with respect to exchange rates applicable during the periods set forth below. All information takes into account retroactively the effect of certain bonus shares and stock split.See “Item 3A. Selected Financial Data - IFRS Selected Financial Data”.
| | | R$ per | | | US$ per | |
| | | Preferred Share | | | Preferred Share | |
| Calendar Period | | High | | | Low | | | High | | | Low | |
| 2007 | | | 37.45 | | | | 24.55 | | | | 21.22 | | | | 11.48 | |
| 2008 | | | 38.09 | | | | 15.37 | | | | 23.07 | | | | 6.65 | |
| 2009 | | | 40.63 | | | | 18.47 | | | | 23.44 | | | | 7.63 | |
| 2010 | | | 43.72 | | | | 31.03 | | | | 25.90 | | | | 16.50 | |
| 2011 | | | 40.65 | | | | 25.15 | | | | 24.45 | | | | 14.36 | |
| | | | | | | | | | | | | | | | | |
| 2010 | | | | | | | | | | | | | | | | |
| 1st quarter | | | 40.49 | | | | 33.81 | | | | 23.49 | | | | 18.03 | |
| 2nd quarter | | | 40.27 | | | | 31.03 | | | | 22.91 | | | | 16.50 | |
| 3rd quarter | | | 40.47 | | | | 32.51 | | | | 23.89 | | | | 18.06 | |
| 4th quarter | | | 43.72 | | | | 37.66 | | | | 25.90 | | | | 22.05 | |
| | | | | | | | | | | | | | | | | |
| 2011 | | | | | | | | | | | | | | | | |
| 1st quarter | | | 40.65 | | | | 34.17 | | | | 24.32 | | | | 20.37 | |
| 2nd quarter | | | 39.47 | | | | 34.00 | | | | 24.45 | | | | 20.81 | |
| 3rd quarter | | | 36.89 | | | | 25.15 | | | | 23.68 | | | | 14.36 | |
| 4th quarter | | | 34.97 | | | | 27.51 | | | | 19.92 | | | | 14.59 | |
| | | | | | | | | | | | | | | | | |
| Share prices for the most recent six months are as follows: | | | | |
| | | | | | | | | | | | | | | | | |
| September 2011 | | | 31.13 | | | | 27.11 | | | | 19.41 | | | | 14.36 | |
| October 2011 | | | 34.22 | | | | 27.51 | | | | 19.92 | | | | 14.59 | |
| November 2011 | | | 33.16 | | | | 29.05 | | | | 19.07 | | | | 15.40 | |
| December 2011 | | | 34.97 | | | | 32.25 | | | | 19.19 | | | | 17.73 | |
| January 2012 | | | 37.41 | | | | 33.50 | | | | 21.18 | | | | 17.93 | |
| February 2012 | | | 37.56 | | | | 34.67 | | | | 21.88 | | | | 19.95 | |
| March 2012(1) | | | 38.94 | | | | 35.77 | | | | 22.02 | | | | 20.35 | |
Source: Economática System
(1) Until March 20, 2012.
The following table sets forth, for the periods indicated, the high and low sales prices in U.S. dollars for the ADSs in the over-the-counter market and NYSE during the period indicated.
| | | US$ per ADS | |
| Calendar Period | | High | | | Low | |
| 2007 | | | 21.37 | | | | 11.47 | |
| 2008 | | | 23.53 | | | | 6.09 | |
| 2009 | | | 23.95 | | | | 7.55 | |
| 2010 | | | 26.30 | | | | 16.33 | |
| 2011 | | | 24.77 | | | | 14.47 | |
| | | | | | | | | |
| 2010 | | | | | | | | |
| 1st quarter | | | 23.79 | | | | 17.86 | |
| 2nd quarter | | | 22.97 | | | | 16.33 | |
| 3rd quarter | | | 24.18 | | | | 17.93 | |
| 4th quarter | | | 26.30 | | | | 22.47 | |
| | | | | | | | | |
| 2011 | | | | | | | | |
| 1st quarter | | | 24.77 | | | | 20.61 | |
| 2nd quarter | | | 24.72 | | | | 20.93 | |
| 3rd quarter | | | 23.85 | | | | 14.47 | |
| 4th quarter | | | 20.09 | | | | 14.52 | |
| | | | | | | | | |
| Share prices for the most recent six months are as follows: |
| | | | | | | | | |
| September 2011 | | | 19.55 | | | | 14.47 | |
| October 2011 | | | 20.09 | | | | 14.52 | |
| November 2011 | | | 19.18 | | | | 15.60 | |
| December 2011 | | | 19.20 | | | | 17.53 | |
| January 2012 | | | 21.11 | | | | 18.51 | |
| February 2012 | | | 21.85 | | | | 20.02 | |
| March 2012(1) | | | 22.00 | | | | 20.22 | |
Source: Economática System
(1) Until March 20, 2012.
Not applicable.
9C. Markets
Trading on the Brazilian Stock Exchanges
In 2000, the Brazilian stock exchanges executed a memorandum of understanding, and from that date on all securities became to be traded only on the Bolsa de Mercadorias e Futuros, or BM&F and the São Paulo Stock Exchange, or BOVESPA, which have merged and now operate as BM&FBOVESPA, as described below, with the exception of electronically traded public debt securities and privatization auctions, which continued to be traded on the Rio de Janeiro Stock Exchange.
The principal trading market for our preferred shares and common shares is the BM&FBOVESPA, which is the largest stock trading center in Latin America. Settlement of transactions is effected three business days after the trade date. Delivery of and payment for shares are made through the facilities of separate clearing houses for each exchange, which maintain accounts for member brokerage firms. The seller is ordinarily required to deliver the shares to the clearing house on the second business day following the trade date.
Throughout its history, the BM&FBOVESPA has undergone changes in order to streamline its structure. On August 28, 2007, a corporate restructuring process resulted in the merger of BM&F and BOVESPA. The group underwent another restructuring process in November 28, 2008, as a result of which the holding company of the group, BOVESPA incorporated the wholly-owned subsidiaries, the Bovespa – Bolsa de Valores de São Paulo (“BVSP”), which was responsible for the operations of the stock exchange and the organized over-the-counter markets and the Brazilian Clearing and Depository Corporation (Companhia Brasileira de Liquidação e Custódia), which provided settlement, clearing and depository services.
These corporate restructurings have consolidated the demutualization process, thereby causing the access to trading and other services rendered by the stock exchange to be unpegged from the stock ownership. In the former operating format of the BM&FBOVESPA, only the brokers that were members of the stock exchange were allowed to trade.
The BM&FBOVESPA has four daily open outcry trading sessions in Electronic Trading System: Pre-Opening Fixing, to input orders for the calculation of the theoretical opening price; Continuous Trading Session, for all securities traded on all markets; Closing Call, for all the stocks traded on the cash market comprising the portfolio of the BOVESPA Index and options series with higher liquidity.; and After Market Trading Session for cancellation of bids and asks registered during the regular trading session.
In order to better control volatility, the BM&FBOVESPA adopted a “circuit breaker” system pursuant to which trading sessions may be suspended for a period of thirty minutes or one hour whenever the indices of the BOVESPA fall below the limits of 10% or 15%, respectively, as compared to the index registered in the previous trading session.
Trading on the BM&FBOVESPA by a holder not deemed to be domiciled in Brazil for Brazilian tax and regulatory purposes, or a non-Brazilian holder, is subject to certain limitations under Brazilian foreign investment legislation. With limited exceptions, non-Brazilian holders may only trade on Brazilian stock exchanges in accordance with the requirements of CMN Resolution No. 2,689. CMN. Resolution No. 2,689 requires that securities held by non-Brazilian holders be maintained in the custody of, or in deposit accounts with, financial institutions and be registered with a clearing house. Such financial institutions and clearing houses must be duly authorized to act as such by the Central Bank and the CVM. In addition, CMN Resolution No. 2,689 requires non-Brazilian holders to restrict their securities trading to transactions on Brazilian stock exchanges or qualified over-the-counter markets. With limited exceptions, non-Brazilian holders may not transfer the ownership of investments made under CMN Resolution No. 2,689 to other non-Brazilian holders through a private transaction. See “Item 10E. Taxation - Brazilian Tax Considerations” for a description of certain tax benefits extended to non-Brazilian holders who qualify under CMN Resolution No. 2,689.
Regulation of Brazilian Securities Markets
The Brazilian securities markets are regulated by the CVM, which has authority over stock exchanges and the securities markets generally, the CMN, and the Central Bank. The Central Bank, among other powers, has licensing authority over brokerage firms and regulatory authority over foreign investment and foreign exchange transactions.
Under Brazilian Corporate Law, a company is either public, acompanhia aberta, such as we are, or private, acompanhia fechada. All public companies are registered with the CVM and are subject to reporting requirements. A company registered with the CVM may have its securities traded either on the BM&FBOVESPA or in the Brazilian over-the-counter market. The shares of a public company may also be traded privately, subject to certain limitations. To be listed on the BM&FBOVESPA, a company must apply for registration with the CVM and the BM&FBOVESPA.
Trading in securities on the BM&FBOVESPA may be suspended at the request of a company in anticipation of a material announcement. Trading may also be suspended on the initiative of the BM&FBOVESPA or the CVM, based on or due to, among other reasons, a belief that a company has provided inadequate information regarding a material event or has provided inadequate responses to inquiries by the CVM or the BM&FBOVESPA.
Brazilian securities laws, the Brazilian Corporate Law and the laws and regulations issued by the CVM, the CMN and the Central Bank provide for, among other things, disclosure requirements applicable to issuers of traded securities, restrictions on insider trading and price manipulation, as well as protection of minority shareholders. On January 3, 2002, the CVM issued Rule No. 358 which amended the rules applicable to the disclosure of material facts, which became effective on April 18, 2002. In accordance with this regulation, we established internal policies applicable to the disclosure of relevant facts and the confidentiality of non-public information. See ““—Corporate Governance Practices” below. The CVM has also issued several rules regarding disclosure requirements, namely, Rules No. 361 and No. 400 for the regulation of public offerings, Rule No. 380 for the regulation of Internet offerings, Rule No. 381 for the regulation of independent auditors., Rule No. 480 for the regulation of registry of security issuers admitted to negotiation in regulated markets in Brazil, and Rule No. 481 for the regulation of information and public request of proxy for shareholders meeting. Rule No. 480 also requires that publicly traded companies file a reference form (Formulário de Referência) which is a regularly updated report containing certain information about the issuer as required by the form, to which supplementary information regarding notes or securities being offered are added at the time of each new public offering.
Corporate Governance Practices
In 2000, the BM&FBOVESPA introduced three special listing segments, known as Levels 1 and 2 of Differentiated Corporate Governance Practices and Novo Mercado aimed at fostering a secondary market for securities issued by Brazilian companies listed on the BM&FBOVESPA by prompting such companies to follow good corporate governance practices. The listing segments were designed for the trading of shares issued by companies voluntarily undertaking to abide by corporate governance practices and disclosure requirements in addition to those already imposed by Brazilian law. These listing segments increase shareholders’ rights and enhance the quality of information provided to shareholders.
To become a Level 1 (Nível 1) company, in addition to the obligations imposed by current Brazilian law, an issuer must, among other things, (i) ensure that shares of the issuer representing 25% of its total capital are effectively available for trading (free-float); (ii) adopt offering procedures that favor widespread ownership of shares when making a public offering; (iii) comply with minimum quarterly disclosure standards; (iv) follow stricter disclosure policies with respect to transactions by controlling shareholders, directors and officers involving securities issued by the issuer; (v) disclose the terms of agreements entered into with related parties; and (vi) make a schedule of corporate events available to shareholders.
To become a Level 2 (Nível 2) company, in addition to the obligations imposed by current Brazilian law, an issuer must, among other things, (i) comply with all of the listing requirements for Level 1 companies; (ii) grant tag-along rights for all shareholders in connection with a transfer of control of the company, offering the same price paid per share for the controlling block of common shares and 80% of the price paid per share of the controlling block of preferred shares; (iii) grant voting rights to holders of preferred shares in connection with certain corporate restructurings and related party transactions, such as (a) any conversion of the company into another corporate form, (b) merger, consolidation or spin-off of the company, (c) approval of transactions between the company and its controlling shareholder, including parties related to the controlling shareholder, (d) approval of any valuation of assets to be delivered to the company in payment for shares issued in a capital increase, (e) appointment of an expert firm to ascertain the fair value of the company in connection with any deregistration and delisting tender offer, and (f) changes to the aforementioned voting rights; (iv) have a board of directors comprised of at least five members at least 20% of whom are independent members as determined by the rules of Level 2, with a maximum two year term; (v) prepare annual financial statements in English, including cash flow statements, in accordance with international accounting standards, such as U.S. GAAP or IFRS; (vi) hold a tender offer by the company’s controlling shareholder if it elects to delist from the Level 2 segment (the minimum price of the shares to be offered will be determined by an appraisal process); and (vii) adhere exclusively to the rules of the BM&FBOVESPA Arbitration Chamber for resolution of disputes between the company and its investors.
To be listed in the Novo Mercado, an issuer must meet all of the requirements described above, in addition to (i) issuing only voting shares and; (ii) granting tag-along rights for all shareholders in connection with a transfer of control of the company, offering the same price paid per share for the controlling block of common shares.
Our goal is to create value for our shareholders. We believe that one of the ways of reaching this goal is to maintain good corporate governance practices, as a long-term continuous process, designed to ensure sustained growth of the company. For many years we have been following principles relating to disclosure, minority shareholders’ rights and transparency as part of our corporate governance initiatives. For example, we have been registered as a public company with the BM&FBOVESPA and have had our shares traded on the market since our founding in 1944. In February 2002, we listed our Level 2 ADRs on the NYSE and have therefore complied with NYSE requirements, as well as those of the SEC, which include disclosure of financial statements in U.S. GAAP and fulfilling U.S. legislative requirements, including the 2002 Sarbanes-Oxley Act.
Public meetings are one of the most important channels of communication and are highly appreciated by investors, analysts and shareholders. The opportunity to interact with members of our senior management and discuss strategies and profitability can be a decisive factor when making an investment decision. The BM&FBOVESPA requires companies listed on the Levels 1 and 2 of Differentiated Corporate Governance Practices to hold at least one meeting with investors every year. We have been holding public meetings at the regional offices of the Association of Capital Market Investment Analysts and Professionals (APIMEC) and making several presentations in the United States and Europe since 1996. When making these presentations, we have the opportunity to provide the financial community with details regarding our performance, strategies for adding value and perspectives for the future as well as other relevant issues. As a commitment to further strengthen our position in the Brazilian capital market, we have also made presentations at APIMEC’s regional offices in different cities covered by APIMEC since 2002. In 2011, we made various presentations at APIMEC, roadshows in the United States, Europe and Asia, teleconferences in Portuguese and teleconferences in English on quarterly reports and relevant facts among other presentations that were made in Brazil at seminars, conferences and congresses on a wide range of subjects related to our performance and the capital markets.
In November 2004, we became the first Brazilian company to voluntarily adopt treasury operational rules based on our review of best practices in the international markets and CVM Rule No. 10. Our senior management believes these rules provide a number of benefits such as decrease in operational, financial and strategic risk, reduced risk of market concentration or improper price formation, reinforcement of the strategy of repurchasing securities aimed at preserving liquidity and value for shareholders and corporate governance best practices, improving transparency for transactions.
On June 8, 2006, we became the first non-U.S. bank listed on the NYSE to comply with all of the requirements set forth in Section 404 of the Sarbanes-Oxley Act, regarding internal controls over financial reporting, one year before the deadline established by the SEC.
We were the first company in Brazil to adopt Brazilian Association of Listed Companies (Associação Brasileira das Companhias Abertas), or ABRASCA’s, Control and Disclosure of Relevant Information Guide in 2007.
In May 5, 2008, our board of directors accepted the proposal of our disclosure and trading committee to establish a Corporate Governance Policy, consolidating our corporate governance principles and practices. Our corporate governance policy is included as Exhibit 11.2 to this Annual Report. The key principle upon which our policy rests is excellence in corporate governance with a view of strengthening and creating the best conditions for the development of our company and subsidiaries. Since then, our Corporate Governance Policy has been amended to include the committees of the board of directors and their respective rules.
In line with best disclosure practices and international trends, we make available our financial statements prepared in accordance with IFRS and Brazilian GAAP.
For more information about the members of our board of directors, stock options plan, fiscal council, audit committee, and other committees of the board of directors and the board of officers, see “Item 6C. Board Practices.”
For more information on our corporate governance practices, including tag-along rights and our Code of Ethics, see “Item 10B. Memorandum and Articles of Association” and “Item 16B. Code of Ethics”.
Disclosure Requirements
Pursuant to the CVM Rule No. 358 of January 3, 2002, the CVM revised and consolidated the requirements regarding the disclosure and use of information related to material facts and acts of publicly held companies, including the disclosure of information in connection with trading and acquisition of securities issued by publicly held companies.
Such requirements include provisions that:
| · | establish the concept of a material fact that gives rise to reporting requirements. Material facts include decisions made by controlling shareholders, resolutions of the general meeting of shareholders and of management of the company, or any other facts related to the company’s business (whether occurring within the company or otherwise related thereto) that may influence the price of its publicly traded securities, or the decision of investors to trade such securities or to exercise any of such securities’ underlying rights; |
| · | specify examples of facts that are considered to be material, which include, among others, the execution of shareholders’ agreements providing for the transfer of control, the entry or withdrawal of shareholders that have any managing, financial, technological or administrative functions within or to the company, and any corporate restructuring undertaken among related companies; |
| · | oblige the investor relations officer, controlling shareholders, other officers, directors, members of the fiscal committee and other advisory boards to disclose material facts; |
| · | require simultaneous disclosure of material facts to all markets in which the corporation’s securities are admitted for trading; |
| · | require the acquirer of a controlling stake in a corporation to publish material facts, including its intentions as to whether or not to de-list the corporation’s shares, within one year; |
| · | establish disclosure requirements in the acquisition and disposal of a material shareholding stake; and |
| · | forbid the use of insider information. |
Pursuant to the CVM Rule No. 480 of December 7, 2009, the CVM expanded the quantity and improved the quality of information reported by issuers. This Rule represents a significant step forward in providing the market with greater transparency with respect to issuers. For that purpose, the Annual Information Report (IAN) was replaced by a reference form (Formulário de Referência), which comprised the information required by IAN and additional information required under CVM Rule 400 that was previously only subject to disclosure upon a public offering. Such reference form (Formulário de Referência) is in line with the Shelf Registration System recommended by the International Organization Securities Commission (IOSCO) and adopted in other countries (England and the United States, among others), by means of which the information regarding a specific issuer is consolidated into one document and is subject to periodic updates. This mechanism offers the investor the ability to analyze one single document for relevant information about the issuer.
CVM Rule No. 480 also created two groups of issuers by type of securities traded. Group A issuers are authorized to trade in any securities, whereas Group B issuers cannot trade in stocks, depositary receipts (BDRs, Units) and securities convertible or exchangeable into stocks or depositary receipts. The greater extent of Group A authorization is followed by more stringent disclosure and reporting requirements. As an issuer of stock, we are part of Group A.
CVM has also enacted Rule No. 481 of December 17, 2009 to regulate two key issues involving general meetings of shareholders in publicly held companies: (i) the extent of information and documents to be provided in support of call notices (subject to prior disclosure to shareholders); and (ii) proxy solicitation for exercise of voting rights. CVM Rule No. 481 is intended to (i) improve the quality of information disclosure by publicly held companies to shareholders and to the market in general, favoring the use of Internet as a disclosure mechanism; (ii) make the exercise of voting rights less costly and foster the participation of shareholders in general meetings, specially for companies with widely dispersed capital; and, consequently (iii) facilitate the oversight of corporate businesses.
Changes in the Brazilian Corporate Law
On October 31, 2001, Law No. 10,303, amended the Brazilian Corporate Law. The main goal of Law No. 10,303 was to broaden the rights of minority shareholders. In this sense, Law No. 10,303:
| · | obligates our controlling shareholders to make a tender offer for our shares if it increases their interest in our share capital to a level that materially and negatively affects the liquidity of our shares, as defined by the CVM; |
| · | requires any acquirer of control to make a tender offer for our common shares at a price equal to 80% of the per share price paid for the controlling block of shares; |
| · | authorizes us to redeem minority shareholders’ shares if, after a tender offer, our controlling shareholders increase their participation in our total share capital to more than 95%; |
| · | entitles dissenting or, in certain cases, non-voting shareholders to obtain redemption upon a decision to conduct a spin-off that results in (i) a change of our corporate purpose; (ii) a reduction in the mandatory dividend; or (iii) any participation in a group of companies (as defined by the Brazilian Corporate Law); |
| · | requires that the preferred shares have one of the following advantages in order to be listed and traded on a stock exchange: (i) priority in receipt of dividends corresponding to at least 3% of the book value per share (after this priority condition is met, equal conditions apply to common shares); (ii) dividends 10% higher than those paid for common shares; or (iii) a tag-along right at 80% of the price paid to the controlling shareholder in case of a transfer control. No withdrawal rights arise from such amendments made before December 31, 2002; |
| · | entitles shareholders that are not controlling shareholders but that together hold (i) preferred shares representing at least 10% of our total share capital; or (ii) common shares representing at least 15% of our voting capital, the right to appoint one member and an alternate to our board of directors. If no group of common or preferred shareholders meets the thresholds described above, shareholders holding preferred or common shares representing at least 10% of our total share capital are entitled to combine their holdings to appoint one member and an alternate to our board of directors. Board members elected pursuant to (i) above or by the combined holdings of holders of preferred and common shares are chosen from a list of three names proposed by the controlling shareholder. Any such members elected by the minority shareholders will have veto powers over the selection of our independent auditors; |
| · | requires controlling shareholders, shareholders that appoint members of our board of directors or fiscal council and members of our board of directors, board of officers or fiscal council to file immediately with the CVM and the BM&FBOVESPA (or the over-the-counter markets on which our securities are traded) a statement of any change in their shareholdings; and |
| · | requires us to send copies of the documentation we submit to our shareholders in connection with shareholders’ meetings to the BM&FBOVESPA. |
On July 13, 2007, the CVM issued Rule No. 457 to require listed companies to publish their consolidated financial statements according to IFRS starting with the year ending December 31, 2010. We have published such financial statements prior to such date.
On December 28, 2007, Law No. 11,638 amended numerous provisions of the Brazilian Corporate Law relating to accounting principles and authority to issue accounting standards. Law No. 11,638 sought to enable greater convergence between Brazilian GAAP and IFRS. To promote convergence, Law No. 11,638 modified certain accounting principles established in the Brazilian Corporate Law and required the CVM to issue accounting rules conforming such principles to the accounting standards adopted in international markets. Additionally, the statute acknowledged a role in the setting of accounting standards for the CPC, which is a committee of officials from the BM&FBOVESPA, industry representatives and academic bodies that has issued accounting guidance and pursued the improvement of accounting standards in Brazil. Law No. 11,638 allows the CVM and the Central Bank to rely on the accounting standards issued by the CPC in establishing accounting principles for regulated entities.
As a result of the issuance of Law No. 11,638, in a parallel process, CPC has issued approximately 40 standards with the objective of making Brazilian GAAP similar to IFRS as described above. In the case of Itaú Unibanco Holding, effectiveness of such standards issued by CPC depends on approval of the standards by the Central Bank. Standards issued by the CPC but not approved by the Central Bank are not required to be applied by Itaú Unibanco Holding.
Additionally, on May 27, 2009, Law No. 11,941 was enacted and, among other things, amended numerous provisions of the Brazilian Corporate Law and tax regulation, to further enable greater convergence between Brazilian GAAP and IFRS. The Law is currently subject to several accounting complementary regulations that affect, among others, the accounting of goodwill, deferred expenses, stocks, provisions, real state investments. Amendments provided additional criteria that financial statements are required to follow. The financial statements of Brazilian publicly held companies as of and for the year ended December 31, 2010 and December 31, 2011 were published according to new regulations.
Finally, on June 24, 2011, Law No. 12,431 amended the Brazilian Corporate Law, among other laws. Many of the changes in the Brazilian Corporate Law prescribed by, Law No.12,431, such as the possibility for shareholders of public companies to vote without being present at meetings and for physical shareholder registries to be replaced by electronic registries in public companies, still require further regulation by the CVM. Among other changes, the amended Brazilian Corporate Law no longer requires members of the board of directors to be shareholders of the company.
Not applicable.
Not applicable.
Not applicable.
ITEM 10 ADDITIONAL INFORMATION
Not applicable.
| 10B. | Memorandum and Articles of Association |
Set forth below is certain information concerning our capital stock and a brief summary of certain significant provisions of our bylaws and Brazilian Corporate Law. This description does not purport to be complete and is qualified by reference to our bylaws (an English translation of which has been filed with the SEC) and to the Brazilian Corporate Law.
Registration and Purpose
We are organized as a publicly held corporation for an unlimited period of time under the laws of Brazil. Our head offices are located in the city of São Paulo, Brazil. We are governed mainly by the Brazilian Corporate Law and our bylaws. Our Tax Payer´s Registry (CNPJ) is 60.872.504/0001-23 and we are registered with the São Paulo Commercial Registry (Junta Comercial do Estado de São Paulo) under NIRE. 35300010230.
Our corporate purpose, as set forth in Article 2 of our bylaws, is to perform banking activity in all its authorized forms, including foreign exchange transactions.
Shareholders’ Meetings
Under Brazilian Corporate Law, shareholders at a general meeting of shareholders may decide all matters relating to the business objectives and pass resolutions deemed necessary for the protection of our interests. Shareholders voting at a general meeting have the exclusive power, among others, to:
· amend the bylaws;
· appoint, elect and dismiss members of our board of directors at any time;
· appoint members of the fiscal council;
· receive the yearly accounts prepared by management and accept or reject management’s financial statements, including the appropriation of net income and the distributable amount for payment of the mandatory dividend and allocation to the various reserve accounts;
· accept or reject the valuation of assets contributed by a shareholder in consideration for the issuance of capital stock;
· pass resolutions to reorganize our legal form, merge, consolidate or split, dissolve and liquidate, appoint and dismiss our liquidators and examine our accounts;
· decide with respect to the financial statements and the distribution and allocation of profits;
· decide with respect to the management report and the board of executive officers’ accounts;
· establish the aggregate and annual compensation of the members of the board of directors and the board of officers, specifying the amount applicable to each one of these bodies;
· decide on retained profits or the constitution of reserves; and
· decide on plans for stock option grants of shares issued by the company or by its controlled companies.
It is the responsibility of our board of directors to call a shareholders’ meeting. The first notice of the shareholders’ meeting must be published no later than 15 days before the date of the meeting on the first call. Brazilian Corporate Law establishes that under specified circumstances, the meeting may also be convened by the fiscal council or any shareholder.
The notice of a shareholders’ meeting must be published three times, on different dates, in official newspapers widely circulated in São Paulo, Brazil, setting forth the place, date and time of the meeting, the day’s agenda and, in the event of an amendment to our bylaws, a description of the proposed change. In addition to the requirements of Brazilian Corporate Law, we also publish notices in three different languages (Portuguese, English and Spanish) on our website and email our subscribed investors and shareholders, as well as through CVM, BM&FBOVESPA, the SEC, the NYSE and the BCBA (Bolsa de Comercio de Buenos Aires).
As a general rule, Brazilian Corporate Law provides that a quorum for a shareholders’ meeting consists of shareholders representing at least 25% of a company’s issued and outstanding voting capital stock, on the first date the meeting is called for, and, if a quorum is not reached, any percentage of the company’s voting capital stock on a second date the meeting is called for.
Generally, our meetings are held with a quorum representing two thirds of our voting capital. In order to attend a shareholders’ meeting, a shareholder must present a document evidencing his identity and proof of deposit issued by the financial institution responsible for the bookkeeping of our stock.
A shareholder may be represented at a shareholders’ meeting by a proxy appointed less than a year before the meeting, which proxy must be our shareholder, any of our officers, a lawyer or a financial institution. An investment fund must be represented by its investment fund officer.
Board of Directors and Board of Officers - Powers
Pursuant to the Brazilian Corporate Law and our bylaws, our board of directors has powers to, among other things:
· establish our general business policies;
· elect and remove the members of our board of officers and establish their functions;
· appoint officers to comprise the boards of officers of certain controlled companies as specified;
· supervise the management of our board of officers, examine at any time company accounts and documents, request information on contracts already signed or to be signed and any other acts;
· convene shareholders’ meetings;
· approve the annual report and management’s financial statements to be submitted to the shareholders´ meetings;
· decide on budgets for results and investments and respective action plans;
· appoint and remove independent auditors;
· appoint and remove the members of our audit committee and approving the operational rules that the audit committee may establish for its own functioning;
· decide on the distribution of interim dividends and interest on stockholders’ equity;
· decide on buy-back transactions on a non-permanent basis;
· decide on the purchase and writing of put and call options supported by the shares issued by the company for the purposes of cancellation, holding as treasury stock or sale, with due observance of the limits set forth the applicable regulations;
· decide on the institution of committees to handle specific issues within the scope of the board of directors;
· elect and remove the members of our audit committee;
· approve the operational rules that our audit committee may establish for its own functioning and be aware of the committee’s activities through its reports;
· approve investments and divestments direct or indirect in corporate stakes for amounts higher than 15% of the book value of the company as registered in the last audited balance sheet; and
· decide on the increase of capital within the limits of our authorized capital.
Our board of directors may be composed of a minimum of ten and a maximum of fourteen directors elected by our shareholders at the annual shareholders’ meeting. The directors elect one chairman and three vice-chairmen from among their peers. The annual shareholders’ meeting held on April 25, 2011 reelected the thirteen members of our current board of directors for a term of one year, whose term ends upon the election of the directors at the annual shareholders’ meeting to be held in2012. Pursuant to our bylaws, the age limit for holding a position on our board of directors is 70 years old.
Our board of officers is responsible for our day-to-day management and representation of the company with respect to third parties. It may be composed of a minimum of five and a maximum of twenty members. Our board of directors on April 28, 2011 reelected twelve members of our current board of officers, which as of the date hereof consists of the president, two executive vice presidents, five executive officers and five officers, who collectively comprise our board of officers, all for a term of one year, whose term ends at the board meeting following the 2012 annual shareholders’ meeting. Additionally, Mr. Eduardo Hiroyuk Miyaki and Mr. Rogério Paulo Calderón Peres were elected as officers for a term of one year.Also, on September 21, 2011, Mr. Emerson Macedo Bortoloto was elected as officer for a term ending at the board meeting following the 2012 general shareholders’ meeting and took office on November 1, 2011. Mr. Bortoloto replaced Wagner Roberto Pugliese, who served as an officer of Itaú Unibanco Holding until June 3, 2011. In addition, on December 16, 2011, Mr. Rodrigo Luís Rosa Couto was elected as officer for a term ending at the investiture of the members to be elected on the board meeting following the 2012 general shareholders’ meeting. His election was approved by the Central Bank and he was invested in his position on January 10, 2012. Finally, Mr. Carlos Eduardo de Souza Lara and Mr. Jackson Ricardo Gomes stepped down from their positions as officers of Itaú Unibanco Holding on February 29, 2012 and March 6, 2012, respectively.
Certain Provisions of Brazilian Law
Under Brazilian law, financial institutions may not grant loans, advances or guarantees to (i) any individual, or the immediate family members of such individual, or entity that controls the financial institution or any entity under common control with the financial institution; (ii) any officer, director or member of the fiscal council of the financial institution, or the immediate family members of such individual, or entity in which such individual directly or indirectly holds more than 10.0% of the capital stock; (iii) any entity controlled by the financial institution; (iv) any entity in which the financial institution directly or indirectly holds more than 10.0% of the capital stock or which directly or indirectly holds more than 10.0% of the financial institution’s capital stock; or (v) companies in which our officers hold a management position.
In addition, directors and officers may not take part in any corporate transaction or deliberate with respect to any corporate transaction in which they have a conflict of interest with the company of which they are a director or officer. Any director or officer who believes he may have a conflict must inform the company’s other officers and/or directors, as the case may be, of the nature and extent of his interest in the transaction.
Directors and Officers Compensation
On November 25, 2010, the CMN issued Resolution No. 3,921, which established new rules related to the compensation of directors and officers of financial institutions. The compensation of directors and officers may be fixed or variable. Variable compensation may be based on specific criteria set forth in Resolution No. 3,921 and is required to be compatible with the financial institution’s risk management policies. At least 50.0% of variable compensation must be paid in stock or stock-based instruments and at least 40.0% of variable compensation must be deferred for future payment by at least 3 years and is subject to claw-backs, based on the result of the institution and business unit during the period of deferral. These new rules took effect on January 1, 2012 and are applicable to compensation of directors and officers based on the services rendered during the year of 2012. In addition, financial institutions that are publicly-held companies or required by the Central Bank to establish an audit committee must also establish a compensation committee prior to the first shareholders’ meeting of 2012. Such committee must follow the requirements set out in Resolution No. 3,921.
Audit Committee
See “Item 6C. Board Practices – Statutory Bodies – Audit Committee” for information regarding our Audit Committee.
Fiscal Council
See “Item 6C. Board Practices – Statutory Bodies – Fiscal Council” for information regarding our Fiscal Council.
Preferred Shares and Common Shares
General
Each common share entitles its holder to one vote at our shareholders meetings. Holders of common stock are not entitled to any preference relating to our dividends or other distributions or any preference upon our liquidation.
Each preferred share is non-voting except under limited circumstances and entitles its holder to (i) priority in the receipt of a non-cumulative dividend of not less than the dividend entitled to each common share; (ii) priority in the receipt of a minimum annual dividend of R$0.022 per share; and (iii) in the event of a sale of the company’s controlling stake, the right to be included in the public offering of shares, thus assuring such shares the right to a price equal to 80% (eighty percent) of the value paid per voting share to the controlling stockholders; and (iii) guarantee of a dividend at least equal to that of the common shares.
There are no redemption provisions associated with our common or preferred shares.
Preemptive Rights, Capital Increases and Payment for Subscribed Stock Shares
Each shareholder has a general preemptive right to subscribe for shares in any capital increase, in proportion to its equity interest, except in the event of the grant and exercise of any option to acquire shares of our capital. Our bylaws authorize our board of directors to increase our capital stock up to a limit of six billion shares, of which three billion must consist of common shares and three billion of preferred shares, without amending our bylaws. Up to the limit of our authorized capital, the issuance of our shares may be made without considering our shareholders preemptive rights if (i) made for the sale on a stock exchange; (ii) by a public subscription and exchange for our stock; or (iii) in a public offering for the acquisition of our control. Regardless of this provision, all increases in our capital stock must be ratified by our shareholders and the Central Bank.
Once a capital increase is duly approved, the shareholder must pay the amount corresponding to the subscribed shares in accordance with the terms of the subscription bulletin. If the shareholder fails to make such payment, the shareholder will be considered to be in default under the terms of the law.
In the event of a capital increase which would maintain or increase the proportion of our capital represented by preferred shares, holders of ADSs, except as described above, would have preemptive rights to subscribe only to newly issued preferred shares. In the event of a capital increase which would reduce the proportion of our capital represented by preferred shares, holders of ADSs, except as described above, would have preemptive rights to subscribe for preferred shares, in proportion to their shareholdings and for common shares only to the extent necessary to prevent dilution of their interest in us.
Liquidation
Pursuant to Brazilian Corporate Law, when a company’s bylaws do not have a provision concerning liquidation, its shareholders at an annual shareholder’s meeting shall determine the manner in which liquidation shall be conducted. Shareholders shall also appoint a liquidator and the fiscal council, which shall be installed during the period of liquidation, when liquidation occurs under the following circumstances: (i) due to the expiration of the company’s length of life; (ii) in cases set forth by the company’s bylaws; (iii) by resolution of the annual shareholders’ meeting; (iv) when a company’s stock is held by a single shareholder, except when the single shareholder is a Brazilian corporation, and a minimum of two shareholders is not reinstated by the following year; or (v) when a company’s authorization to operate is legally extinguished.
Before the completion of the liquidation process and after all creditors have been paid, our shareholders, at a shareholders’ meeting, may resolve to make a pro-rata distribution among them, as corporate assets are being calculated. The liquidator is responsible for, among other things, the winding up of the company’s businesses, sale of its assets, payment of liabilities and distribution of the remaining assets among shareholders.
Liability of Our Shareholders for Further Capital Calls
Brazilian Corporate Law does not provide for capital calls. If there is an increase in our capital, the ownership interest of our shareholders could be reduced if they elect not to exercise their preemptive rights to subscribe for shares in the capital stock increase.
Calculation of Net Profit
At each annual shareholders’ meeting, our board of directors is required to recommend how our earnings for the preceding fiscal year are to be allocated. For purposes of the Brazilian Corporate Law, a company’s net income after income taxes and social contribution taxes for that fiscal year, net of any accumulated losses from prior fiscal years and amounts allocated to employees’ and management’s participation in earnings, represents its “net income” for that fiscal year derived from financial statements prepared in accordance with Brazilian GAAP. In accordance with Brazilian Corporate Law, an amount equal to our net income as further (i) reduced by amounts allocated to the legal reserve, as explained below; (ii) reduced by amounts allocated to other reserves established by us in compliance with applicable law and (iii) increased by reversions of reserves constituted in prior years, will be available for distribution to shareholders (the “adjusted net income,” herein referred to as the “Net Profit”) in any particular year.
Under Brazilian Corporate Law, we are required to maintain a legal reserve to which we must allocate 5% of our net income for each fiscal year until the amount of the reserve equals 20% of our paid-in capital. Net losses, if any, may be charged against the legal reserve, after the deduction of the accrued earnings and profit reserves.
Pursuant to our bylaws, we are required to distribute to our shareholders in respect to each fiscal year an amount equal to not less than 25.0% Net Profit, or the mandatory dividend. See “Item 8A. Consolidated Financial Statements and Other Financial Information – Dividend Policy and Dividends.”
According to Brazilian Corporate Law, the payment of dividends must occur prior to the end of the fiscal year in which the dividend was declared. A shareholder has a three-year period from the dividend payment date to claim dividends in respect of its shares, after which we have no liability for that payment and the dividends will revert to our profit reserve. Shareholders who do not reside in Brazil must generally register with the Central Bank to have dividends and interest on stockholders’ equity, sales proceeds or other amounts with respect to their shares eligible to be remitted in foreign currency outside of Brazil.
Under Brazilian Corporate Law, we may establish other reserves as long as we specify their purpose, the criteria for determining the annual portion of the net income to be allocated to these reserves and their maximum limit.
Based on that, we have established in our bylaws that, in accordance with a proposal by our board of directors, our shareholders may decide on the creation of the following reserves:
· dividend equalization reserve (which has been created by shareholders), limited to 40% of the value of our capital stock, for the purpose of paying dividends, including interest on stockholders equity, with the objective of maintaining a payment flow to shareholders. This reserve will be allocated: (i) up to 50% of the fiscal year’s net income; (ii) up to 100% of the realized portion of reserves arising from revaluation of assets, recorded as retained earnings; (ii) up to 100% of the amount of the adjustments from previous fiscal years, recorded as retained earnings; and (iv) credits corresponding to the anticipation of dividends;
· reinforcement for working capital stock reserve (which has been created by shareholders), limited to 30% of the value of our capital, for the purpose of guaranteeing resources for our operations, to be allocated up to 20% of the fiscal year’s net income;
· reserve for capital increase in companies held by Itaú Unibanco Holding (which has been created by shareholders), limited to 30% of the value of our capital, for the purpose of guaranteeing the right of first refusal in capital increases of participating companies, and to be allocated up to 50% of the fiscal year’s net earnings. Upon the proposal of our board of directors, amounts will be regularly capitalized from these reserves so that its aggregate balance never exceeds the limit of 95% of our capital stock. The balance of these reserves together with the legal reserve may not exceed the value of our capital stock; and
· contingency reserve, which is a portion of our net income may also be allocated to a contingency reserve for an anticipated loss that our shareholders deem probable in future years. Any amount so allocated in a prior year must be either (i) reversed in the fiscal year in which the loss was anticipated if such loss does not in fact occur; or (ii) charged off in the event that the anticipated loss occurs.
We determine our calculation of net income and allocations to reserves for any fiscal year on the basis of financial statements prepared in accordance with Brazilian GAAP. On the other hand, our consolidated financial statements included in this annual report have been prepared in accordance with IFRS and, although our allocations to reserves and dividends will be reflected in these consolidated financial statements, you will be unable to calculate those allocations or required dividend amounts from our consolidated financial statements. Our consolidated statement of changes in stockholders’ equity presents the amount of dividends and interest on stockholders’ equity distributed in each of the years ended December 31, 2011 and 2010.
Brazilian Corporate Law provides that all discretionary allocations of net income are subject to approval by our shareholders at the annual meeting.
Interest on Stockholders’ Equity
We are allowed to pay interest on stockholders’ equity as an alternative form of payment to shareholders. For tax purposes, interest on stockholders’ equity is limited to the daily average of the Brazilian long-term interest rate, or TJLP, as determined by the Central Bank, over the taxable year, and cannot exceed the greater of (i) 50.0% of adjusted net income for the period in respect of which the payment is made; and (ii) 50.0% of the sum of retained earnings and profit reserves. Any payment of interest on stockholders’ equity to holders of preferred shares, whether Brazilian residents or not, including holders of ADSs, is subject to Brazilian withholding tax at the rate of 15%, or 25% if the shareholder is a resident or domiciled in a tax haven jurisdiction. The amount paid to shareholders as interest on stockholders’ equity, net of any withholding tax, may be included as part of the mandatory distribution. In such case, we are required to distribute to shareholders an amount sufficient to ensure that the net amount received by shareholders, after the payment by us of applicable withholding taxes in respect of the dividend of interest on stockholders’ equity, is at least equal to the mandatory dividend. See “Item 4B. Business Overview – Regulation and Supervision – Taxation – Corporate Income Tax and Social Contribution on Profits – Taxation of Profit Distribution.”
Voting Rights
Each common share entitles the holder thereof to one vote at our shareholders meetings. Holders of preferred shares are not entitled to vote at our shareholders’ meetings, except under certain limited circumstances.
Brazilian Corporate Law provides that non-voting preferred shares acquire voting rights when a company has failed for the term provided for in its bylaws (but no longer than a period of three consecutive fiscal years) to pay any fixed or minimum dividend to which such shares are entitled and continuing until payment thereof is made if those dividends are not cumulative or until those cumulative dividends are paid. Our bylaws establish a term of three fiscal years.
Any change in the preferences or rights of our preferred shares, or the creation of a class of shares having priority over the preferred shares, would require the approval of at least 50% of the voting shareholders with prior or future ratification of a majority of the preferred shares, voting as a class at a special meeting. This meeting, according to the Brazilian Corporate Law, would be called by publication of a notice three times, on different dates, in an official gazette and a newspaper of wide circulation in São Paulo, our principal place of business, with the first notice published at least 15 days prior to the meeting, but would not generally require any other form of notice. In addition to the requirements of Brazilian Corporate Law , we also publish notices in three different languages (Portuguese, English and Spanish) on our website and email our subscribed investors and shareholders, as well as thought CVM, BM&FBOVESPA, the SEC, the NYSE and the BCBA (Bolsa de Comercio de Buenos Aires).
Brazilian Corporate Law provides for multiple voting rights. Despite our bylaws being silent on the matter, a shareholder representing at least one tenth of our voting capital may request multiple voting rights. Once multiple voting rights have been duly requested within forty eight hours prior to the annual shareholders’ meeting, each share will be attributed as many votes as the number of directors and the shareholders right to accumulate votes for a single candidate or distribute them among various candidates will be recognized. Whenever the election of our board of directors is conducted through a multiple voting process and the holders of common or preferred stock elect a director, the shareholder or group of shareholders bound by a voting agreement holding more than 50% of our voting rights will be entitled to elect directors in a number equal to the number of directors elected by the other shareholders plus one, regardless of the number of directors that, pursuant to our bylaws, comprise the board. It is the responsibility of the presiding officials at a shareholders’ meeting to inform our shareholders in advance about the number of votes necessary for the election of each member of our board of directors.
As our bylaws do not provide for staggered intervals, our directors may be reelected consecutively without interruption. Whenever the election has been conducted through a multiple voting process, the removal from office of any of our directors by our shareholders, at an annual shareholders’ meeting will result in the removal from office of all of the remaining directors and a new election shall be arranged. In order not to affect the management of the company as a result of the removal of directors, Brazilian Corporate Law provides that despite the removal, the same directors may continue to exercise their functions until the newly elected board members take office.
Transfer of Control
Our bylaws do not contain any provision that would have the effect of delaying, deferring or preventing a change in our control or that would operate only with respect to a merger, acquisition or corporate restructuring involving us or any of our subsidiaries. However, Brazilian banking regulations require that any transfer of control of a financial institution follow certain specific procedures of, and be previously approved by, the Central Bank.
Additionally, Brazilian Corporate Law provides that acquisition of control of a publicly held company is contingent on tender offers for all outstanding common shares at a price equivalent to at least 80% of the price per share paid for the controlling block. Our bylaws provide that in the event of a change in our control, the acquirer will be required to pay the holders of our preferred shares 80% of the price per share paid to our controlling shareholders.
Brazilian Corporate Law also obliges our controlling shareholder to make a tender offer for all of our shares if it increases its interest in our capital stock to a level that materially and negatively affects the liquidity of our shares.
Withdrawal Rights
Neither our common shares nor our preferred shares are redeemable except upon delisting, as described below. A dissenting shareholder under the Brazilian Corporate Law may, however, seek to withdraw, subject to certain conditions, following a decision made at a shareholders’ meeting by shareholders representing at least 50% of the voting shares:
· to create preferred shares or increase disproportionately an existing class of preferred shares relative to the other types or classes of shares, unless this action is provided for or authorized by the bylaws;
· to modify a preference, privilege or condition of redemption or amortization conferred on one or more classes of preferred shares, or create a new class with greater privileges than the existing classes of preferred shares;
· to reduce the mandatory dividend;
· to change our corporate purposes;
· to transfer all of our stock to another company in order to make us a wholly -owned subsidiary of that company or vice versa (incorporação de ações);
· to acquire another company, the price of which exceeds certain limits set forth in Brazilian Corporate Law;
· to merge into another company, including if we are merged into one of our controlling companies, or to consolidate with another company;
· to participate in a group of companies as defined under Brazilian Corporate Law; or
· in the event that the entity resulting from (i) a transfer of all our stock to another company in order to make us a wholly owned subsidiary of that company or vice versa, as discussed in the fifth bullet point above, (ii) a spin-off, (iii) a merger or (iv) a consolidation of a Brazilian publicly held company, fails to become a Brazilian publicly held company within one hundred and twenty days of the annual shareholders’ meeting in which such decision was taken.
The right to withdraw in the circumstances discussed in the first and second bullet points above only applies to the holders of the affected shares.
In accordance with the Brazilian Corporate Law, the right to withdraw expires thirty days after publication of the minutes of the relevant shareholders’ meeting unless, in the first two bullet points above, the resolution is subject to confirmation by the preferred shareholders (which must be made at a special meeting to be held within one year), in which case the thirty -day term is counted from the date the minutes of the special meeting are published. We are entitled to reconsider any action giving rise to a stock redemption within ten days following the expiration of the thirty -day term mentioned above if such redemption would jeopardize our financial stability. In addition, the rights to withdrawal in the seventh and eighth bullet points above may only be exercised by holders of shares if those shares are not part of the BM&FBOVESPA Index and if less than 50% of our shares is outstanding.
Brazilian Corporate Law provides that common and preferred shares are redeemable under delisting of shares at a fair price determined upon the criteria provided thereof. If the shareholders’ meeting giving rise to withdrawal rights occurs more than sixty days after the date of the last approved balance sheet, a shareholder may demand that its shares be redeemed at a value on the basis of a new balance sheet that is dated within sixty days of that shareholders’ meeting. In such case, we will pay 80% of the value calculated according to the last approved balance sheet and, after the preparation of the new balance sheet, we will pay the balance within one hundred and twenty days from the date of the relevant shareholders’ meeting.
Other Aspects of Brazilian Corporate Law
The following are also significant aspects of Brazilian Corporate Law:
· preferred shares representing 10% of the outstanding shares not held by the controlling shareholders are entitled to appoint a representative to our board of directors;
· disputes among our shareholders as well as among our shareholders and us can be subject to arbitration, as provided for in the shareholders’ agreement with Itaúsa and E. Johnston (though not provided for in our bylaws);
· a tender offer at a purchase price equal to the fair value of all outstanding stock is required upon a delisting or a substantial reduction in liquidity of our stock as a result of purchases by controlling shareholders;
· a sale of control requires that shareholders tender for the minority shareholders’ common shares and, as provided for in our bylaws, for the minority shareholders’ preferred shares, at a purchase price equal to 80% of the price per share paid to the controlling shareholder;
· shareholders are entitled to withdraw upon a spin-off only if it entails a change in the corporate purpose, a reduction in mandatory dividends or participation of the company in a “group of companies” (grupo de sociedades);
· the controlling shareholders, the shareholders that appoint members to our board of directors and fiscal council, the members of our board of directors and fiscal council and our executive officers are required to disclose any purchase or sale of our stock to the CVM and the BM&FBOVESPA;
· we are permitted to satisfy our information disclosure requirements through the Internet; and
· direct or indirect controlling shareholders and shareholders that appoint members to our board of directors or fiscal council, as well as any natural person or corporate entity, or group of persons, acting jointly or representing the same interests, that reach a participation, directly or indirectly, corresponding to 5% or more of type or class of stock representative of the capital of a listed company, must notify the company and, as well as when such participation increases by 5% for the type or class of shares representative of the company’s capital stock. In cases when an acquisition results in or was effected for the purpose of altering the control or the management structure of the corporation, as well as in cases in which the acquisition creates an obligation to conduct a public offering, the acquirer must further publish a notice in the press containing the required legal information about the transaction. The investor relations officer is responsible for informing the CVM, and as the case may be, the BM&FBOVESPA or organized over-the-counter markets.
Form and Transfer
According to the Brazilian Corporate Law, all shares issued by Brazilian companies must be nominative and either registered within the companies’ registry books (Registro de Ações Nominativas) or placed under the custody of a financial institution specifically designated to perform custodial services by each company. The transfer of shares is effected by either an entry made by us in our books by debiting the share account of the transferor and crediting the share account of the transferee or by a book entry by the custodian in case the board of directors authorizes the maintenance of our shares under the custody of a financial institution specifically designated by the shareholders to perform book-entry services.
Under our bylaws, our shares are in the form of book-entry shares and the transfer of those shares is effected through an order to the financial institution, that controls the registration of those shares, Itaú Corretora.
Transfers of preferred shares by a foreign investor are made in the same way and executed by that investor’s local agent on the investor’s behalf except that, if the original investment was registered with the Central Bank pursuant to the Annex IV Regulations, the foreign investor also should seek amendment, if necessary, through its local agent, of the certificate of registration to reflect the new ownership.
The BM&FBOVESPA operates a central clearing system. A holder of our shares may choose, at its discretion, to participate in this system and all shares elected to be put into the system will be deposited in custody with the stock exchange (through a Brazilian institution that is duly authorized to operate by the Central Bank or by the CVM, as the case may be, having a clearing account with the stock exchange). The fact that these shares are subject to custody with the stock exchange will be reflected in our registry of shareholders.
Each participating shareholder will, in turn, be registered in our register of beneficial shareholders maintained by the stock exchange and will be treated in the same way as registered shareholders.
Limitations on Rights to Own Securities
Except as described above, there are no limitations under Brazilian law on the rights of non-residents or foreign shareholders to own non-voting preferred shares of Brazilian financial institutions, including the rights of such non-resident or foreign shareholders to hold or exercise voting rights due to future circumstances that may grant voting rights to such shareholders. Our bylaws reflect the nonexistence of such limitations in connection with our preferred shares.
Registered Capital
The amount of an investment in preferred shares held by a non-Brazilian holder who qualifies under the CMN Resolution No. 2,689 and obtains registration with the CVM or by the depositary representing that holder, is eligible for registration with the Central Bank. In addition to the repatriation of the principal amount invested, such registration (the amount so registered is referred to as registered capital) allows the remittance outside Brazil of foreign currency, converted at the commercial market rate, equivalent to the amount so distributed inreais in favor of those preferred shares. The registered capital for each preferred share purchased in Brazil, and deposited with the depositary, will be equal to its purchase price (in U.S. dollars). The registered capital for a preferred share that is withdrawn upon surrender of an ADS will be the U.S. dollar equivalent of (i) the average price of a preferred share on the Brazilian stock exchange on which the greatest number of such shares was sold on the day of withdrawal, or (ii) if no preferred shares were sold on that day, the average price on the Brazilian stock exchange on which the greatest number of preferred shares were sold in the fifteen trading sessions immediately preceding that withdrawal. The U.S. dollar value of the preferred shares is determined on the basis of the average commercial market rates quoted by the Central Bank on such date (or if the average price of preferred shares is determined under clause (ii) of the preceding sentence, the average of such quoted rates on the same fifteen dates used to determine the average price of the preferred shares).
A non-Brazilian holder of preferred shares may experience delays in effecting such registration, which may delay remittances abroad. Such a delay may adversely affect the amount, in U.S. dollars, received by the non-Brazilian holder. See “Item 3.D Risk Factors –Risks Relating to the Preferred Shares and the ADSs”.
American Depositary Receipts – ADR
The Bank of New York, as depositary, has executed and delivered the ADRs representing our preferred shares. Each ADR is a certificate evidencing a specific number of ADSs. Each ADS represents one preferred share (or a right to receive one preferred share) deposited with the principal São Paulo office of Itaú Unibanco, as custodian for the depositary in Brazil. Each ADS also represents any other securities, cash or other property which may be held by the depositary.
You may hold ADSs either directly (by having an ADR registered in your name) or indirectly through your broker or other financial institution. If you hold ADSs directly, you are an ADR holder. We do not treat ADR holders as our shareholders and ADR holders have no shareholder rights. The depositary is the holder of the preferred shares underlying the ADSs. Holders of ADRs have ADR holder rights. Brazilian law governs shareholder rights. A deposit agreement among us, the depositary and you, as an ADR holder, and the beneficial owners of ADRs sets out ADR holder rights as well as the rights and obligations of the depositary. New York law governs the deposit agreement and the ADRs.
10C. Material Contracts
None.
There are no restrictions on ownership of our stock by individual or legal entities domiciled outside Brazil. However, the right to convert dividend payments and proceeds from the sale of our shares into foreign currency and to remit such amounts abroad is subject to restrictions under foreign investment legislation which generally requires, among other things, that the relevant investment be registered with the Central Bank and the CVM. Foreign investors may register their direct investment in our shares under Law No. 4,131, dated September 3, 1962, or Resolution No 2,689, dated January 26, 2000.
Law 4,131 is the main legislation concerning foreign capital and direct equity investments in Brazilian companies and applies to any capital that enters the country in the form of foreign currency, goods and services. Except for registration of the capital inflow/outflow with the Central Bank, non-resident investors directly investing in equity of Brazilian companies do not need any specific authorization to make such investments.
Registration under Resolution No. 2,689 affords favorable tax treatment to non-resident investors who are not residents or domiciled in tax haven jurisdictions (i.e., countries that do not impose income tax or where the maximum income tax rate is lower than 20%), as defined by Brazilian tax laws. See “Item 10E. Taxation – Brazilian Tax Considerations” for more information.
Under Resolution No. 2,689 non-resident investors may invest in almost all financial assets and engage in almost all transactions available in the Brazilian financial and capital markets, provided that certain requirements are fulfilled. In accordance with Resolution No. 2,689, the definition of non-resident investor includes individuals, legal entities, mutual funds and other collective investment entities, domiciled or headquartered outside Brazil. Under Resolution No. 2,689, a non-resident investor must:
| · | appoint at least one representative in Brazil with powers to perform actions relating to its investment; |
| · | appoint an authorized custodian in Brazil for its investment; |
| · | register as a non-Brazilian investor with the CVM; and |
| · | register its foreign investment with the Central Bank. |
Additionally, the investor operating under the provisions of Resolution No. 2,689 must be registered with the Brazilian internal revenue service (Receita Federal) pursuant to the latter’s Regulatory Instructions No. 748, dated June 28, 2007 and 1,042, dated June 10, 2010. This registration process is undertaken by the investor’s legal representative in Brazil.
Pursuant to Resolution No. 2,689, securities and other financial assets held by foreign investors must be registered, safe kept or maintained in deposit accounts or under the custody of an entity duly licensed by the Central Bank or the CVM.
The trading of securities under the regime of Resolution No. 2,689 is restricted to transactions carried out in the stock exchanges or through organized over-the-counter markets licensed by the CVM, except for transactions resulting from subscriptions, stock dividends, conversion of debt securities into shares, securities-referenced indexes, purchase and sale of shares of opened-end investment funds in securities and, when previously authorized by the CVM, cases resulting from going private transactions, cancellation or suspension of trading, judicial settlements and trading of shares covered by shareholder agreements.
In addition, any transfer or ownership assignment of investments in securities or other financial instruments held by non-resident investors not foreseen by Resolution No. 2,689 is prohibited, except for transfers resulting from mergers, spin-off, and other corporate reorganizations carried out abroad, as well as the cases of hereditary succession.
This summary contains a description of the main Brazilian and U.S. federal income tax considerations of the acquisition, ownership and disposition of our preferred shares or ADSs, but it does not purport to be a comprehensive description of all the tax considerations that may be relevant to these matters. This summary is based upon tax laws of Brazil and the United States in effect as of the date hereof, which laws are subject to change and to differing interpretations (possibly with retroactive effect). Although there is at present no income tax treaty between Brazil and the United States, the tax authorities of the two countries have had discussions that may result in such a treaty. No assurance can be given, however, as to whether or when a treaty will enter into force or how it will affect a U.S. Holder (as defined below) of our preferred shares or ADSs.
Prospective purchasers of our preferred shares or ADSs should consult their own tax advisors as to the tax consequences of the acquisition, ownership and disposition of our preferred shares and ADSs, including, in particular, the effect of any non-U.S., non-resident, state or local tax laws.
Brazilian Tax Considerations
The following discussion summarizes the main Brazilian tax consequences related to the acquisition, ownership and disposition by holders of our preferred shares (who are registered with the Central Bank as U.S. dollar investors) or of ADSs, both not domiciled in Brazil for purposes of Brazilian taxation, or Non-Resident Holders.
Non-Resident Holders Resident or Domiciled in Tax Havens
In accordance with Brazilian law, as regulated by Article 1 of Normative Instruction No. 1,037 of June 4, 2010, as amended, a “tax haven” is defined as a country or location (a) that does not impose any income tax or where the maximum income tax rate is 20% or below or (b) where the local legislation imposes restrictions on disclosure regarding shareholder composition or investment ownership. A list of current tax havens has been published per such Normative Instruction. Non-Resident Holders resident or domiciled in tax havens may be subject to tax in Brazil at higher rates than Non-Resident Holders not resident or domiciled in tax havens, as described below.
Registration of Our Preferred Shares
Our preferred shares may be registered with the Brazilian Central Bank pursuant to CMN Resolution No. 2,689/00. CMN Resolution No. 2,689/00 allows foreign investors to invest in almost all financial assets and to enter into almost all transactions available in the Brazilian financial and capital markets, provided that certain requirements are fulfilled, such as appointing a representative in Brazil and registering with the Securities and Exchange Commission - CVM. The amount eligible for registration with respect to our preferred shares purchased in Brazil and deposited with the depositary shall be equal to the purchase price of such preferred shares (in U.S. Dollars). According to CMN Resolution No. 2,689/00, foreign investors include individuals, companies, mutual funds and other collective investment entities domiciled or headquartered outside Brazil. See “Item 10D. Exchange Controls” for more information.
A Non-Resident Holder of our preferred shares may encounter delays in registration, which may delay any remittances abroad. Such delays may also adversely affect the amount of U.S. Dollars received by such Non-Resident Holder.
Taxation of Dividends
Payment of dividends derived from profits generated after January 1, 1996, including dividends paid in kind, are not subject to withholding income tax in Brazil. Payment of dividends derived from profits generated before January 1, 1996 may be subject to Brazilian withholding income tax at varying rates, according to the year when the profits were generated.
Taxation of Interest on Net Equity
Law No. 9,249, dated December 26, 1995, as amended, allows a Brazilian corporation, such as ourselves, to make payments of interest on net equity instead of dividend distributions (see “Item 4B. Business Overview — Regulation and Supervision — Taxation” and “Item 10B. Memorandum and Articles of Association — Interest on Net Equity”). Payment of interest on net equity is generally subject to withholding income tax at the rate of 15%, or 25% in the case of a Non-Resident Holder that is resident or domiciled in a tax haven.
Taxation of Gains
(a) Sales or other dispositions of ADSs
Gains realized outside Brazil by a Non-Resident Holder from the sale or other disposition of ADSs to another Non-Resident Holder are not subject to Brazilian taxation. However, according to Law No. 10,833/03, the disposition of assets located in Brazil by a Non-Resident Holder may be subject to Brazilian withholding income tax at a general rate of 15% (a 25% rate may apply if the foreign beneficiary is resident or domiciled in a jurisdiction deemed to be a tax haven for Brazilian tax purposes). Although Law No. 10,833/03 is not completely clear with respect to what is considered to be an asset located in Brazil, ADSs generally should not be considered to be assets located in Brazil for purposes of such Law because they represent securities issued and negotiated in an offshore exchange market. It is important to note, however, that even if ADSs were considered to be assets located in Brazil, Non-Resident Holders not resident or domiciled in tax havens may still apply for exemption from capital gains tax according to Article 81 of Law No. 8,981/95.
(b) Conversion of our preferred shares into ADSs
The deposit by a Non-Resident Holder of our preferred shares with the depositary for conversion into ADSs may be subject to Brazilian capital gains tax, if such Non-Resident Holder is resident or domiciled in a tax haven or if such preferred shares were not registered with the Brazilian Central Bank according to CMN Resolution No. 2,689/00. In those cases, the difference between the acquisition cost of such preferred shares or the amount otherwise previously registered with the Brazilian Central Bank and the average price of such preferred shares, according to CMN Resolution 1.927/93, may be considered taxable capital gain, and may be subject to income tax at a general rate of 15%.
Non-Resident Holders that are resident or domiciled in tax havens may be subject to 25% capital gain tax on the sale or transfer of shares out of the financial markets upon such a conversion.
On the other hand, when Non-Resident Holders that are not resident or domiciled in tax havens deposit preferred shares registered according to CMN Resolution No. 2,689/00 in exchange for ADSs, such deposit should not be subject to capital gain tax.
(c) Sale or other disposition of our preferred shares
Non-Resident Holders not resident or domiciled in tax havens that register their portfolio according to CMN Resolution No. 2,689/00 benefit from a special tax treatment according to which any capital gain arising from the sale of securities within Brazilian stock exchanges is exempt from income tax. On the other hand, sale of shares not registered according to CMN Resolution No. 2,689/00 or made out of Brazilian stock exchanges is generally subject to 15% capital gain tax.
Such special treatment is not applicable to Non-Resident Holders resident or domiciled in tax havens, who are subject to general taxation rules applicable to Brazilian residents on the sale of their investments in financial markets, including stock exchanges and over-the-counter markets. The taxation rate is then generally 15%. If such Non-Resident Holders sell shares out of the financial markets, the income taxation rate shall raise to 25%. Any exercise of preemptive rights related to our preferred shares (and in connection with the ADS program) will not be subject to Brazilian taxation. The gains from the sale or assignment of preemptive rights will be subject to income tax according to rates that vary depending on the location of the Non-Resident Holder and the market in which such rights are sold. If the Non-Resident Holder is not resident or domiciled in a tax haven, the sale of preemptive rights is exempt from tax if made within the Brazilian stock exchange markets or is subject to 15% income tax if made beyond stock exchange market. If the Non-Resident Holder is resident or domiciled in a tax haven, the sale of preemptive rights is generally subject to 15% income tax if made within Brazilian financial markets or 25% tax if the rights are sold beyond such markets.
Tax on Foreign Exchange on Financial Transactions
Pursuant to Decree No. 6,306/07, and further amendments, tax on foreign transactions, or IOF/FX, may be levied on foreign exchange transactions, affecting either or both the inflow or outflow of investments. The IOF/FX rates are set by the Brazilian executive branch, and the highest applicable rate is 25.0% (See “Item 4B. Business Overview — Regulation and Supervision — Taxation”).
The rate of IOF/FX imposed on foreign exchange transactions carried out by a Non-Resident Holder for the purpose of investing in the financial and capital markets may vary from time to time as defined by the Brazilian government and the rates may be different based on the type of investment. The inflow of proceeds into Brazil for the acquisition of shares under CMN Resolution No. 2,689/00 is subject to 0.0% IOF/FX tax. IOF/FX rate is also zero in the outflow of foreign investment and on the payment of interest on net equity and dividends.
The acquisition of ADSs is not subject to IOF tax. The IOF/Securities tax is levied at a rate of 1.5% on the assignment of shares traded in the Brazilian stock exchange market in order to permit the issuance of depositary receipts to be negotiated overseas.
Other Brazilian Taxes
There are no Brazilian inheritance, gift or succession taxes applicable to the transfer of ownership or title (ownership without beneficial interest) of our preferred shares or ADSs or the vesting of free beneficial interest of such shares or ADSs outside Brazil by a Non-Resident Holder, except for gift, inheritance and legacy taxes that are levied by some states of Brazil if bestowed in such states of Brazil or abroad when the receiver is resident or domiciled in these states of Brazil. There is no Brazilian stamp, issue, registration, or similar taxes or duties payable by Non-Resident Holders of our preferred shares or ADSs.
U.S. Federal Income Tax Considerations
The following is a general discussion of certain U.S. federal income tax considerations relating to the purchase, ownership and disposition of our preferred shares or ADSs by U.S. Holders (as defined below) who hold such preferred shares or ADSs as capital assets within the meaning of section 1221 of the Internal Revenue Code of 1986, as amended, or the Code. This discussion does not address all of the tax considerations that may be relevant to U.S. Holders in light of their particular circumstances or to U.S. Holders subject to special rules under U.S. federal income tax laws, such as banks, insurance companies, retirement plans, regulated investment companies, real estate investment trusts, dealers in securities, brokers, tax-exempt entities, certain former citizens or residents of the United States, U.S. Holders who hold our preferred shares or ADSs as part of a “straddle,” “hedging,” “conversion” or other integrated transaction, U.S. Holders who mark their securities to market for U.S. federal income tax purposes, U.S. Holders whose functional currency is not the U.S. dollar, U.S. Holders that own (or are deemed to own) 10% or more (by voting power) of our stock or U.S. Holders that receive our preferred shares or ADSs as compensation. In addition, this discussion does not address the effect of any state, local or non-U.S. tax laws or any U.S. federal estate, gift or alternative minimum tax considerations.
This discussion is based on the Code, the Treasury Regulations promulgated thereunder and administrative and judicial pronouncements, all as in effect on the date hereof, and all of which are subject to change, possibly with retroactive effect. This discussion also assumes that each obligation in the deposit agreement and any related agreement will be performed in accordance with its terms.
For purposes of this discussion, the term “U.S. Holder” means a beneficial owner of our preferred shares or ADSs that is, for U.S. federal income tax purposes, (i) an individual citizen or resident of the United States, (ii) a corporation created or organised in or under the laws of the United States or of any state thereof or the District of Columbia, (iii) an estate the income of which is subject to U.S. federal income taxation regardless of its source, or (iv) a trust with respect to which a court within the United States is able to exercise primary supervision over its administration and one or more U.S. persons have the authority to control all of its substantial decisions, or certain electing trusts that were in existence on August 19, 1996 and were treated as domestic trusts on that date.
If an entity treated as a partnership for U.S. federal income tax purposes invests in our preferred shares or ADSs, the U.S. federal income tax considerations relating to such investment generally will depend in part upon the status and activities of such entity and its partners. Such an entity should consult its own tax advisor regarding the U.S. federal income tax considerations applicable to it and its partners of the purchase, ownership and disposition of such preferred shares or ADSs.
INVESTORS ARE ADVISED TO CONSULT THEIR OWN TAX ADVISORS AS TO THE U.S. FEDERAL INCOME AND OTHER TAX CONSIDERATIONS RELATING TO THE PURCHASE, OWNERSHIP AND DISPOSITION OF OUR PREFERRED SHARES OR ADSS IN LIGHT OF THEIR PARTICULAR CIRCUMSTANCES, AS WELL AS THE EFFECT OF ANY STATE, LOCAL OR NON-U.S. TAX LAWS.
Except where specifically described below, this discussion assumes that we are not a passive foreign investment company, or a PFIC, for U.S. federal income tax purposes. Please see the discussion under “Passive Foreign Investment Company Considerations” below.
Treatment of ADSs
A U.S. Holder of ADSs generally will be treated for U.S. federal income tax purposes as the owner of such U.S. Holder’s proportionate interest in our preferred shares held by the depositary that are represented and evidenced by such ADSs. Accordingly, any deposit or withdrawal of our preferred shares in exchange for ADSs generally will not result in the realisation of gain or loss to such U.S. Holder for U.S. federal income tax purposes.
Distributions
A U.S. Holder that receives a distribution with respect to our preferred shares (whether held through ADSs or directly), including distributions of interest on stockholders’ equity as described above under “—Brazilian Tax Considerations — Taxation of Interest on Net Equity,” generally will be required to include the amount of such distribution (without reduction for any Brazilian withholding tax with respect thereto) in gross income as a dividend to the extent of our current or accumulated earnings and profits (as determined for U.S. federal income tax purposes) on the date such U.S. Holder (or the depositary, in the case of ADSs) actually or constructively receives such distribution, and will not be eligible for the dividends received deduction allowed to corporations. A distribution on our preferred shares (whether held through ADSs or directly) in excess of current and accumulated earnings and profits will be treated as a non-taxable return of capital to the extent of the U.S. Holder’s basis in such preferred shares or ADSs, as the case may be, and thereafter as gain from the sale or exchange of such preferred shares or ADSs. We have not maintained and do not plan to maintain calculations of earnings and profits for U.S. federal income tax purposes. As a result, a U.S. Holder may need to include the entire amount of any such distribution in income as a dividend.
The U.S. dollar value of any distribution on our preferred shares made in Brazilianreais generally should be calculated by reference to the exchange rate between the U.S. dollar and the Brazilian real in effect on the date of receipt of such distribution by the U.S. Holder (or the depositary, in the case of ADSs), regardless of whether thereaisso received are in fact converted into U.S. dollars. If thereais so received are converted into U.S. dollars on the date of receipt, the U.S. Holder of the relevant preferred shares or ADSs generally should not recognise foreign currency gain or loss on such conversion. If thereais so received are not converted into U.S. dollars on the date of receipt, such U.S. Holder generally will have a basis in suchreais equal to the U.S. dollar value of such reais on the date of receipt. Any gain or loss on a subsequent conversion or other disposition of suchreais by such U.S. Holder generally will be treated as ordinary income or loss and generally will be income or loss from sources within the United States.
Distributions treated as dividends that are received by certain non-corporate U.S. persons (including individuals) through taxable years beginning on or before December 31, 2012 in respect of stock of a non-U.S. corporation (other than a corporation that is, in the taxable year during which the distributions are made or the preceding taxable year, a PFIC) that is readily tradable on an established securities market in the United States generally qualify for a 15% reduced maximum tax rate so long as certain holding period and other requirements are met. Since the ADSs will be listed on the NYSE, unless we are treated as a PFIC with respect to a U.S. Holder, dividends received by such a U.S. Holder in respect of the ADSs should qualify for the reduced rate. Based on existing guidance, it is not entirely clear whether dividends received by such a U.S. Holder of our preferred shares in respect of such shares will qualify for the reduced rate, because our preferred shares are not themselves listed on a United States exchange. Special rules apply for purposes of determining the recipient’s investment income (which may limit deductions for investment interest) and foreign income (which may affect the amount of U.S. foreign tax credit) and to certain extraordinary dividends. Each U.S. Holder that is a non-corporate taxpayer should consult its own tax advisor regarding the possible applicability of the reduced tax rate and the related restrictions and special rules.
Sale, Exchange or Other Disposition of Preferred Shares or ADSs
Upon a sale, exchange or other disposition of our preferred shares or ADSs, a U.S. Holder generally will recognise gain or loss equal to the difference between the amount realised on such sale, exchange or other disposition and such U.S. Holder’s tax basis in such preferred shares or ADSs. Such gain or loss generally will be long-term capital gain or loss if such U.S. Holder held such preferred shares or ADSs for more than one year at the time of disposition. Certain non-corporate U.S. Holders are entitled to preferential treatment for net long-term capital gains. The ability of a U.S. Holder to offset capital losses against ordinary income is limited.
A U.S. Holder that receives Brazilianreais from the sale, exchange or other disposition of our preferred shares generally will realise an amount equal to the U.S. dollar value of suchreaison the settlement date of such sale, exchange or other disposition if (i) such U.S. Holder is a cash basis or electing accrual basis taxpayer and our preferred shares are treated as being “traded on an established securities market” or (ii) such settlement date is also the date of such sale, exchange or other disposition. If thereais so received are converted into U.S. dollars on the settlement date, such U.S. Holder generally should not recognise foreign currency gain or loss on such conversion. If thereais so received are not converted into U.S. dollars on the settlement date, such U.S. Holder generally will have a basis in suchreais equal to the U.S. dollar value of suchreais on the settlement date. Any gain or loss on a subsequent conversion or other disposition of such reais by such U.S. Holder generally will be treated as ordinary income or loss and generally will be income or loss from sources within the United States. Each U.S. Holder should consult its own tax advisor regarding the U.S. federal income tax consequences of receivingreais from the sale, exchange or other disposition of our preferred shares in cases not described in the first sentence of this paragraph.
Foreign Tax Credit Considerations
Distributions on our preferred shares (whether held through ADSs or directly), including distributions of interest on stockholders’ equity as described above under “—Brazilian Tax Considerations — Taxation of Interest on Net Equity,” that are treated as dividends, before reduction for any Brazilian withholding taxes with respect thereto, will generally be included in the gross income of a U.S. Holder. Thus, such U.S. Holder may be required to report income for such purposes in an amount greater than the actual amount such U.S. Holder receives in cash. Distributions treated as dividends generally will constitute income from sources outside the United States and generally will be categorised for U.S. foreign tax credit purposes as “passive category income” or, in the case of some U.S. Holders, as “general category income.” Subject to applicable limitations and holding period requirements, a U.S. Holder may be eligible to elect to claim a U.S. foreign tax credit against its U.S. federal income tax liability for any such Brazilian withholding taxes. Under current law, gain resulting from a sale or other disposal of our preferred shares or ADSs may be subject to Brazilian income or withholding taxes. A U.S. Holder’s use of a foreign tax credit with respect to any such Brazilian income or withholding taxes could be limited, as such gain generally will constitute income from sources within the United States. Certain proposed Treasury regulations, if adopted in their current form, could affect the ability of U.S. Holders of ADSs to credit non-U.S. tax withheld on dividends against their U.S. federal income tax liability. A U.S. Holder that does not claim a U.S. foreign tax credit generally may instead claim a deduction for any such Brazilian taxes, but only for a taxable year in which such U.S. Holder elects to do so with respect to all non-U.S. income taxes. Foreign currency exchange gain or loss generally will constitute income from sources within the United States. The rules relating to foreign tax credits are very complex, and each U.S. Holder should consult its own tax advisor regarding the application of such rules.
Passive Foreign Investment Company Considerations
Special U.S. federal income tax rules apply to U.S. persons owning shares of a PFIC. A non-U.S. corporation generally will be classified as a PFIC for U.S. federal income tax purposes in any taxable year in which, after applying relevant look-through rules with respect to the income and assets of certain subsidiaries, either: at least 75% of its gross income is “passive income”, or on average at least 50% of the gross value of its assets is attributable to assets that produce passive income or are held for the production of passive income.
For this purpose, passive income generally includes, among other things, dividends, interest, rents, royalties, gains from the disposition of passive assets and gains from commodities transactions.
The application of the PFIC rules to banks is unclear under present U.S. federal income tax law. Banks generally derive a substantial part of their income from assets that are interest bearing or that otherwise could be considered passive under the PFIC rules. The United States Internal Revenue Service (or “IRS”), has issued a notice, and has proposed regulations, that exclude from passive income any income derived in the active conduct of a banking business by a qualifying foreign bank, also known as the Active Bank Exception. The IRS notice and proposed regulations have different requirements for qualifying as a foreign bank, and for determining the banking income that may be excluded from passive income under the Active Bank Exception. Moreover, the proposed regulations have been outstanding since 1994 and will not be effective unless finalised.
Based on estimates of our current and projected gross income and gross assets, we do not believe that we will be classified as a PFIC for our current or future taxable years. The determination of whether we are a PFIC, however, is made annually and is based upon the composition of our income and assets (including income and assets of entities in which we hold at least a 25% interest), and the nature of our activities (including our ability to qualify for the Active Bank Exception).
Because final regulations have not been issued and because the notice and the proposed regulations are inconsistent, our status under the PFIC rules is subject to considerable uncertainty. While we conduct, and intend to continue to conduct, a significant banking business, there can be no assurance that we will satisfy the specific requirements for the Active Bank Exception under either the IRS notice or the proposed regulations. Accordingly, U.S. Holders could be subject to U.S. federal income tax under the rules described below.
If we are treated as a PFIC for any taxable year during which a U.S. Holder owns our preferred shares or ADSs, any gain realised on a sale or other taxable disposition of such preferred shares or ADSs and certain “excess distributions” (generally distributions in excess of 125% of the average distribution over the prior three-year period, or if shorter, the holding period for such preferred shares or ADSs) will be treated as ordinary income and will be subject to tax as if (i) the excess distribution or gain had been realised ratably over the U.S. Holder’s holding period for such preferred shares or ADSs, (ii) the amount deemed realised in each year had been subject to tax in each such year at the highest marginal rate for such year (other than income allocated to the current period or any taxable period before we became a PFIC, which would be subject to tax at such U.S. Holder’s regular ordinary income rate for the current year and would not be subject to the interest charge discussed below), and (iii) the interest charge generally applicable to underpayments of tax had been imposed on the taxes deemed to have been payable in those years.
We do not expect to provide information that would allow U.S. Holders to avoid the foregoing consequences by making a “qualified electing fund” election.
If we are treated as a PFIC and, at any time, we invest in non-U.S. corporations that are classified as PFICs, or Subsidiary PFICs, U.S. Holders generally will be deemed to own, and also would be subject to the PFIC rules with respect to, their indirect ownership interest in any such Subsidiary PFIC. If we are treated as a PFIC, a U.S. Holder could incur liability for the deferred tax and interest charge described above if either (i) we receive a distribution from, or dispose of all or part of our interest in, any such Subsidiary PFIC or (ii) such U.S. Holder disposes of all or part of our preferred shares or ADSs.
A U.S. holder of stock in a PFIC (but possibly not a Subsidiary PFIC, as discussed below) may make a “mark-to-market” election, provided the PFIC stock is “marketable stock” as defined under applicable Treasury regulations (i.e., “regularly traded” on a “qualified exchange or other market”). Under applicable Treasury regulations, a “qualified exchange or other market” includes (i) a national securities exchange that is registered with the U.S. Securities and Exchange Commission or the national market system established under the Securities Exchange Act of 1934, as amended, or the Exchange Act, or (ii) a foreign securities exchange that is regulated or supervised by a governmental authority of the country in which the market is located and meets certain trading, listing, financial disclosure and other requirements set forth in applicable Treasury regulations. The NYSE constitutes a qualified exchange or other market. Although the IRS has not addressed whether the BM&FBOVESPA meets the requirements to be treated as a qualified exchange or other market, we believe that the BM&FBOVESPA should be so treated. PFIC stock traded on a qualified exchange or other market is regularly traded on such exchange or other market for any calendar year during which such stock is traded, other than in de minimis quantities, on at least 15 days during each calendar quarter. We cannot assure U.S. Holders that our preferred shares or ADSs will be treated as “marketable stock” for any taxable year.
The tax consequences that would apply if we were a PFIC would be different from those described above if a U.S. Holder validly makes a mark-to-market election as of the beginning of such U.S. Holder’s holding period. If such an election were made, such U.S. Holder generally would (i) include in gross income, entirely as ordinary income, an amount equal to the excess, if any, of the fair market value of our preferred shares or ADSs as of the close of each taxable year and such U.S. Holder’s adjusted tax basis in such preferred shares or ADSs, and (ii) deduct as an ordinary loss the excess, if any, of such U.S. Holder’s adjusted tax basis in such preferred shares or ADSs over the fair market value of such preferred shares or ADSs at the end of the taxable year, but only to the extent of the net amount previously included in gross income as a result of the mark-to-market election. Any gain from a sale, exchange or other disposition of our preferred shares or ADSs in a taxable year in which we were a PFIC would be treated as ordinary income, and any loss from such sale, exchange or other disposition would be treated first as ordinary loss (to the extent of any net mark-to-market gains previously included in income) and thereafter as capital loss. A U.S. Holder’s adjusted tax basis in such preferred shares or ADSs would increase or decrease by the amount of the gain or loss taken into account under the mark-to-market regime. Even if a U.S. Holder is eligible to make a mark-to-market election with respect to our preferred shares or ADSs, however, it is not clear whether or how such election would apply with respect to the stock of any Subsidiary PFIC that such U.S. Holder is treated as owning, because such Subsidiary PFIC stock might not be marketable stock. The mark-to-market election is made with respect to marketable stock in a PFIC on a stockholder-by-stockholder basis and, once made, can only be revoked with the consent of the IRS. Special rules would apply if the mark-to-market election is not made for the first taxable year in which a U.S. Holder owns any equity interest in us while we are a PFIC.
A U.S. Holder who owns our preferred shares or ADSs during any taxable year that we are treated as a PFIC generally would be required to file an information return with respect to us and any Subsidiary PFIC in which the U.S. Holder holds a direct or indirect interest. U.S. Holders should consult their own tax advisors regarding the application of the PFIC rules to our preferred shares or ADSs and the availability and advisability of making a mark-to-market election should we be considered a PFIC for any taxable year.
Backup Withholding and Information Reporting
Backup withholding and information reporting requirements generally apply to certain U.S. Holders with respect to payments made on or proceeds from the sale, exchange or other disposition of our preferred shares or ADSs. A U.S. Holder not otherwise exempt from backup withholding generally can avoid backup withholding by providing a properly executed IRS Form W-9. Any amounts withheld under the backup withholding rules will be allowed as a refund or a credit against the U.S. Holder’s U.S. federal income tax liability, provided the required information is timely furnished to the IRS.
Disclosure Requirements for Specified Foreign Financial Assets
Individual U.S. Holders (and certain U.S. entities specified in IRS guidance) who, during any taxable year, hold any interest in any “specified foreign financial asset” generally will be required to file with their U.S. federal income tax returns a statement setting forth certain information if the aggregate value of all such assets exceeds U.S.$50,000. “Specified foreign financial asset” generally includes any financial account maintained with a non-U.S. financial institution and may also include our preferred shares or ADSs if they are not held in an account maintained with a U.S. financial institution. Substantial penalties may be imposed, and the period of limitations on assessment and collection of U.S. federal income taxes may be extended, in the event of a failure to comply. U.S. Holders should consult their own tax advisors as to the possible application to them of this filing requirement.
Disclosure Requirements for Certain U.S. Holders Recognising Significant Losses
A U.S. Holder that claims significant losses in respect of our preferred shares or ADSs for U.S. federal income tax purposes (generally (i) U.S.$10 million or more in a taxable year or U.S.$20 million or more in any combination of taxable years for corporations or partnerships all of whose partners are corporations, (ii) U.S.$2 million or more in a taxable year or U.S.$4 million or more in any combination of taxable years for all other taxpayers, or (iii) U.S.$50,000 or more in a taxable year for individuals or trusts with respect to a foreign currency transaction) may be subject to certain disclosure requirements for “reportable transactions.” U.S. Holders should consult their own tax advisors concerning any possible disclosure obligation with respect to our preferred shares or ADSs.
| 10F. | Dividends and Paying Agents |
Not applicable.
Not applicable.
We are subject to the informational requirements for foreign private issuers of the Exchange Act. Accordingly, we are required to file reports and other information with the SEC, including annual reports on Form 20-F and reports on Form 6-K. You may inspect and copy reports and other information filed with the SEC at the public reference facilities maintained by the SEC at 100 F Street, N.W., Washington D.C. 20549 and at the SEC’s regional offices at 500 West Madison Street, Suite 1400, Chicago Illinois 60661, and 233 Broadway, New York, New York 10279. Copies of the materials may be obtained by mail from the Public Reference Room of the SEC at 100 F Street, N.W., Washington, D.C. 20549 at prescribed rates. The public may obtain information on the operation of the SEC’s Public Reference Room by calling the SEC in the United States at 1-800-SEC-0330. In addition, the SEC maintains an Internet website at http://www.sec.gov, from which you can electronically access those materials, including this annual report and the accompanying exhibits. We also file financial statements and other periodic reports with the CVM located at Rua Sete de Setembro, 111, Rio de Janeiro, Rio de Janeiro 20050-901, Brazil. The CVM maintains an Internet website athttp://www.cvm.gov.br.
Copies of our annual report on Form 20-F will be available for inspection upon request at our offices at Praça Alfredo Egydio de Souza Aranha 100 - São Paulo - SP - 04344-902 – Brazil.
| 10I. | Subsidiary Information |
Not required.
ITEM 11. Quantitative and Qualitative Disclosures about Market Risk
Derivative Instruments Qualifying for Hedge Accounting
Below we present an overview of the hedge strategies that are categorized as cash flow hedges and hedges of net investments under IFRS. For the accounting policy regarding these hedges we refer to note 2.4 g III of our consolidated financial statements.
Starting from 2008 we implemented our cash flow hedge strategy, to hedge the variability of future cash flows of interest payments, Itaú Unibanco Holding designed DI Futures contracts exchange-traded at BM&FBovespa with respect to certain real-denominated variable-interest liabilities and interest rate swaps with respect to US dollar-denominated redeemable preferred shares issued by one of our subsidiaries.
Our cash flow hedge strategies consist of the hedge of the exposure to the variability in cash flows on interest payments that are attributable to changes in interest rates with respect to recognized liabilities.
Itaú Unibanco Holding has applied cash flow hedge strategies as follows:
| · | Hedge of time deposits and repurchase agreements: hedge of the variability in cash flows of interest payments resulting from changes in the CDI interest rate. |
| · | Hedge of redeemable preferred shares: hedge of the variability in cash flows of interest payments resulting from changes in the LIBOR interest rate. |
| · | Hedge of subordinated certificates of deposit (CDB): hedge of the variability in the cash flow of interest payments resulting from changes in the CDI interest rate. |
The carrying amounts as of December 31, 2011 of time deposits and repurchase agreements, redeemable preferred shares and subordinated certificates of deposit (or hedged objects) was R$ 19,938 million and the notional amount of the related Derivatives (or hedging instruments) was R$ 19,937 million. These cash flow hedge strategies will mature between 2012 and 2017. For the specific maturities of the instruments we refer to note 8 of the financial statements included in Item 18.
During 2011 we implemented a hedging strategy for our net investments with a different functional currency. In connection with our hedge strategy for net investments in foreign operations, we designed DDI Futures contracts traded at BM&FBovespa, and Forward contracts or NDF contracts entered into by our subsidiaries abroad.
Our strategies of net investments in foreign operations consist of a hedge of the exposure in foreign currency arising from the functional currency of the foreign operation, upon translation to the functional currency of the head office.
The carrying amount as of December 31, 2011 of Hedge of investment in foreign operations was R$ 4,131 million and the notional amount of the related Derivatives was R$ 6,886 million. The notional amount of the derivatives includes the overhedge rate of 40% regarding taxes. This hedge strategy has no stated maturity unless on the sale of the investments abroad.
The fair value of the derivatives used for our hedging strategies our included in note 8 of our consolidated financial statements included in item 18.
Market Risk
Market risk is the possibility of losses resulting from fluctuations in the market values of positions held by a financial institution, including risks of transactions subject to variations in foreign exchange rates, interest rates, equities and commodities prices.
Market risk management is the process by which an institution plans, monitors and controls risks of variations in financial instruments market values, aiming optimisation of the risk-return ratio through adequate limits structure, models and management tools.
Itaú Unibanco uses proprietary systems to measure its consolidated market risk. The processing of these systems occurs mainly in São Paulo in a controlled access location with high availability, storage and data recovery, which has the infrastructure to ensure business continuity in case of a contingency (disaster recovery). We are currently assessing potential changes to our risk technology infrastructure to ensure continuing compliance with regulatory requirements and management guidelines.
The market risk control carried out by Itaú Unibanco covers all financial instruments contained in all portfolios of the companies controlled by Itaú Unibanco. In this respect, Itaú Unibanco’s market risk management policy is in line with the principles of CMN Resolution No. 3,464, of June 26, 2007, constituting a set of principles that guide the institution’s strategy of market risk control and management in all conglomerate business units and legal entities of the Itaú Unibanco group.
Itaú Unibanco’s strategy is based on a comprehensive and complementary use of methodologies as well as quantitative tools to estimate, monitor and manage risks, in line with best market practices.
In this context, Itaú Unibanco’s risk management strategy is aimed at balancing corporate business goals, taking into account:
| · | Political, economic and market conditions; |
| · | Market risk portfolio of the institution; and |
| · | Expertise to operate in specific markets. |
The market risk control is conducted by a group that is independent from the front office and that is responsible for performing the daily activities of risk measurement, evaluation and reporting by means of its control units established within the legal entities of the Itaú Unibanco group. Moreover, this independent group carries out the consolidated monitoring, evaluation and reporting of market risk information, including any extrapolations of risk limits, reporting of events to the responsible business unit and monitoring necessary actions to readjust a position or level of risk. For this purpose we have a structured process of communication and information in order to provide information to senior management committees and to ensure compliance with the requirements of Brazilian and foreign regulatory agencies.
The market risk management and control process is subject to periodic reviews, to ensure that it is aligned with best market practices and that it reflects continuous improvement processes implemented throughout Itaú Unibanco.
According to transaction classification criteria defined in CMN Resolution No. 3,464, of June 26, 2007, and in Central Bank Circular No. 3,354, of June 27, 2007, and the New Capital Accord – Basel II, Itaú Unibanco’s financial instruments, including all transactions with derivatives, are segregated in trading and banking portfolios. Market risk assessment is performed using this same portfolio segregation.
The trading portfolio consists of all transactions, including derivatives, held with intent to trade in the short term or to hedge other financial instruments of this portfolio, and that have no restriction on their trading. They are intended for obtaining profit from the changes in actual or expected prices in the short term or arbitrage execution.
The banking portfolio is composed of transactions that are not classified in the trading portfolio. The banking portfolio consists of transactions held without intent to trade in the short term and their respective hedges, as well as transactions executed for the active management of financial risks, which transactions may be executed with or without derivatives.
Itaú Unibanco hedges transactions with clients and proprietary positions, including its foreign investments, aiming to mitigate risks derived from price fluctuations of the relevant market risk factors to keep such transactions within the exposure limits in effect. Derivatives are the instruments commonly used for these hedging activities. When these transactions are classified as hedge accounting, specific supporting documentation is provided, including the continuous follow-up of the hedge effectiveness (retrospective and prospective) and other changes in the accounting process, as defined by the internal policies of Itaú Unibanco.
The market risk exposures that underlie various financial instruments, including derivatives, are decomposed in risk factors. A risk factor refers to a market parameter whose variation impacts an institution’s results. The main risk factors measured by Itaú Unibanco are as follows:
| · | Interest rates: risk of losses from transactions subject to interest rates variations, including: |
| o | Fixed income interest rates denominated in reais; and |
| o | Interest rate index linked interest rates. |
| · | Foreign exchange linked: risk of losses from positions in transactions subject to the foreign exchange linked interest rate; |
| · | Foreign exchange rates: risk of losses from positions in foreign currencies, in transactions subject to foreign exchange rate variation; |
| · | Price-index linked: risk of losses from transactions subject to the variations of price-index linked interest rates; and |
| · | Equities: risk of losses from transactions subject to equity price variations. |
The Itaú Unibanco market risk management process is subject to the governance and hierarchy of committees and limits are specifically approved for risk management support, from aggregated risk indicators to granulated limits, aimed at effectiveness and coverage of control. These limits are calibrated based on evaluations of projected results on future balance sheets, amount of shareholder’s equity and risk profile of each legal entity, and are defined in terms of risk measurement and used on the risk management process. These limits are monitored on a daily basis and results in excess of such limits are reported and discussed at the competent committees.
The limits structure is established and approved by the Superior Risk Policies Committee (“CSRisc”), after discussions and deliberations by the Superior Institutional Treasury Committee (“CSTI”) regarding metrics and market risk limits.
In the last quarter of 2011, Itaú Unibanco improved its market risk limits control structure by making it more granular and aligned its business structure, breaking metrics into groups of risk factors, according to business units. This new control structure is intended to:
| · | Demonstrate to all levels of executives that the assumption of market risk is in line with risk-return objectives of the bank, promoting disciplined and well-informed dialogue about Itaú Unibanco’s risk profile and its evolution; |
| · | Increase transparency on how the business attempts to optimise its results; |
| · | Provide early warning mechanisms to facilitate effective risk management, without obstructing business objectives; and |
| · | Limit concentration risk. |
In this control structure, limits are more granular than in the past, are monitored and trigger alerts starting discussions about the positions in question.
Market risk is analysed based on the following metrics:
| · | Statistical Value at Risk (VaR): statistical metric that quantifies the maximum expected potential economic loss in normal market conditions, considering a defined holding period and confidence interval. Applied to group of risk factors; |
| · | Losses in Stress Scenarios (Stress Test): simulation technique to evaluate the impact, in the assets and liabilities portfolio, of various risk factors in extreme market situations (based on prospective scenarios); |
| · | Stop Loss Alert: effective losses added to the potential maximum loss in bullish and bearish scenarios; |
| · | P&L to Be Realised (“RaR”): evaluation of the difference between accrual and mark-to-market values, in normal and stressed scenarios, reflecting accounting asymmetries. It is one of the risk measures used to evaluate the banking portfolio risk at the management level; and |
| · | Earnings at Risk (EaR): metric that quantifies the impact of adverse changes in interest rates on financial results. |
In addition to the risk metrics described above, sensitivity and loss control measures are also analysed. They include:
| · | Gap Analysis: accumulated exposure, by risk factor, of the cash flows, marked-to-market, positioned in their settlement dates; |
| · | Sensitivity (DV01): impact on the market value of cash flows when a 1.0 annual basis point change is applied to current interest rates; |
| · | Sensitivities to Various Risk Factors (Greek): partial derivatives of a portfolio of options on the price of the underlying asset, implied volatility, interest rate and time; and |
| · | Stop Loss: maximum loss that a portfolio classified in the trading book is authorised to reach. |
VaR – Consolidated Itaú Unibanco Holding S.A.
The internal VaR model used by Itaú Unibanco considers a one-day holding period and a 99% confidence level. Volatilities and correlations are estimated based on a methodology that confers higher weight to the most recent information.
The table below shows the Consolidated Global VaR, comprising the portfolios of Itaú Unibanco, Banco Itaú BBA International S.A. (“Banco Itaú BBA International”), Banco Itaú Argentina S.A. (“Banco Itaú Argentina”), Banco Itaú Chile S.A. (“Banco Itaú Chile”), Banco Itaú Uruguai S.A. (“Banco Itaú Uruguai”) and Banco Itaú Paraguai S.A. (“Banco Itaú Paraguai”); showing where there are higher concentrations of market risk.
The consolidated Itaú Unibanco Holding S.A., maintaining its conservative management and portfolio diversification, kept its policy of operating within lower limits in relation to its capital.
In 2011, our average global VaR was R$142.0 million, or 0.20% of our consolidated stockholders’ equity, as of December 31, 2011, compared to R$109.4 million in 2010, or 0.18% of our consolidated stockholders’ equity, as of December 31, 2010.
Global VaR
2011
| | | December 31 | | | Average | | | Minimum | | | Maximum | |
| | | (in millions of R$) | |
| Group of Risk Factor | | | | | | | | | | | | |
| Interest rate(*) | | | 114.8 | | | | 105.3 | | | | 27.0 | | | | 229.2 | |
| Foreign exchange linked | | | 23.6 | | | | 29.5 | | | | 12.6 | | | | 59.0 | |
| Foreign exchange rates | | | 29.0 | | | | 38.1 | | | | 14.2 | | | | 69.2 | |
| Price index linked | | | 21.1 | | | | 17.7 | | | | 2.5 | | | | 41.6 | |
| Equities | | | 4.4 | | | | 13.4 | | | | 3.7 | | | | 26.1 | |
| Banco Itaú BBA International | | | 1.5 | | | | 2.9 | | | | 0.4 | | | | 6.5 | |
| Banco Itaú Argentina | | | 3.7 | | | | 4.0 | | | | 1.6 | | | | 9.4 | |
| Banco Itaú Chile | | | 5.3 | | | | 5.3 | | | | 1.9 | | | | 10.3 | |
| Banco Itaú Uruguai | | | 0.7 | | | | 0.5 | | | | 0.2 | | | | 1.1 | |
| Banco Itaú Paraguai | | | 0.2 | | | | 0.6 | | | | 0.2 | | | | 1.7 | |
| Diversification effect(**) | | | (53.4 | ) | | | | | | | | | | | | |
| Global Risk | | | 150.9 | | | | 142.0 | | | | 74.0 | | | | 278.5 | |
| (*) | Adjusted to reflect the difference in Brazilian tax treatment of investments abroad and investments in Brazil. |
| (**) | Reduction of risk due to the combination of all risk factors. |
Global VaR
2010
| | | December 31 | | | Average | | | Minimum | | | Maximum | |
| | | (in millions of R$) | |
| Group of Risk Factor | | | | | | | | | | | | | | | | |
| Interest rate(*) | | | 123.7 | | | | 109.6 | | | | 70.6 | | | | 137.2 | |
| Foreign exchange linked | | | 17.3 | | | | 18.4 | | | | 6.0 | | | | 41.6 | |
| Foreign exchange rates | | | 34.0 | | | | 31.8 | | | | 9.1 | | | | 56.9 | |
| Price index linked | | | 18.6 | | | | 17.1 | | | | 6.4 | | | | 30.0 | |
| Equities | | | 14.4 | | | | 15.1 | | | | 5.1 | | | | 27.7 | |
| Banco Itaú BBA International | | | 0.6 | | | | 1.3 | | | | 0.5 | | | | 3.4 | |
| Banco Itaú Argentina | | | 1.6 | | | | 1.0 | | | | 0.4 | | | | 2.3 | |
| Banco Itaú Chile | | | 3.3 | | | | 5.1 | | | | 2.6 | | | | 9.4 | |
| Banco Itaú Uruguai | | | 0.2 | | | | 0.4 | | | | 0.2 | | | | 0.8 | |
| Banco Itaú Paraguai | | | 0.9 | | | | 0.6 | | | | 0.2 | | | | 1.6 | |
| Diversification effect(**) | | | (82.8 | ) | | | | | | | | | | | | |
| Global Risk | | | 131.9 | | | | 109.4 | | | | 61.6 | | | | 181.8 | |
| (*) | Adjusted to reflect the difference in Brazilian tax treatment of investments abroad and investments in Brazil. |
| (**) | Reduction of risk due to the combination of all risk factors. |
VaR – Institutional Treasury
The Institutional Treasury maintains its risk management segregated in Banking and Trading Desks.
Banking Desk
The Banking Desk, which has a portfolio composed of commercial transactions and related financial instruments, increased the Global VaR of its portfolio in 2011. Conservative management of the portfolio composition enabled the average Global VaR to remain at lower levels in comparison to the bank’s equity.
The average VaR of the Banking Desk portfolio was R$83.4 million as of December 31, 2011, compared to R$80.3 million as of December 31, 2010.
VaR of Banking Desk Portfolio
2011
| | | December 31 | | | Average | | | Minimum | | | Maximum | |
| | | (in millions of R$) | |
| Group of Risk Factor | | | | | | | | | | | | | | | | |
| Interest rate(*) | | | 95.2 | | | | 88.1 | | | | 22.7 | | | | 193.0 | |
| Foreign exchange linked | | | 23.6 | | | | 24.9 | | | | 8.6 | | | | 46.3 | |
| Foreign exchange rates | | | 4.9 | | | | 2.8 | | | | 0.0 | | | | 15.3 | |
| Price index linked | | | 17.9 | | | | 11.7 | | | | 2.4 | | | | 33.8 | |
| Equities | | | 5.0 | | | | 4.8 | | | | 2.7 | | | | 7.9 | |
| Diversification effect(**) | | | (49.2 | ) | | | | | | | | | | | | |
| Global Risk | | | 97.5 | | | | 83.4 | | | | 31.1 | | | | 171.5 | |
| (*) | Adjusted to reflect the difference in Brazilian tax treatment of investments abroad and investments in Brazil. |
| (**) | Reduction of risk due to the combination of all risk factors. |
VaR of Banking Desk Portfolio
2010
| | | December 31 | | | Average | | | Minimum | | | Maximum | |
| | | (in millions of R$) | |
| Group of Risk Factor | | | | | | | | | | | | | | | | |
| Interest rate(*) | | | 85.5 | | | | 92.6 | | | | 70.0 | | | | 110.5 | |
| Foreign exchange linked | | | 11.4 | | | | 6.2 | | | | 2.7 | | | | 11.4 | |
| Foreign exchange rates | | | 0.3 | | | | 3.0 | | | | 0.0 | | | | 23.2 | |
| Price index linked | | | 9.0 | | | | 10.4 | | | | 3.8 | | | | 22.1 | |
| Equities | | | 4.2 | | | | 4.7 | | | | 2.9 | | | | 12.5 | |
| Diversification effect(**) | | | (33.7 | ) | | | | | | | | | | | | |
| Global Risk | | | 76.6 | | | | 80.3 | | | | 54.5 | | | | 108.0 | |
| (*) | Adjusted to reflect the difference in Brazilian tax treatment of investments abroad and investments in Brazil. |
| (**) | Reduction of risk due to the combination of all risk factors. |
Since May 1, 2011, the VaR risk factors of the Overseas portfolio (i.e., transactions not booked in Brazil) are managed together with the Banking Desk portfolio. In 2010, the average Global VaR of Overseas portfolio was R$7.9 million.
Trading Desk
The Institutional Treasury Trading Desk takes positions aiming to optimise risk-weighted results.
Effective market risk control enabled Itaú Unibanco to manage efficiently market changes, as well as maintain the continuous improvement of diversification and sophistication of its transactions.
The Trading Desk seeks the best domestic and foreign market opportunities, within the pre-established limits, and is intended to create a well-diversified risk exposure.
In this context, the risk assumed by the Institutional Treasury did not change significantly, strengthening Itaú Unibanco’s tendency to incur only limited market risk exposures in relation to its capital.
To improve the management of their assets, the Flow Book Desk and Proprietary Trading Desk were unified, under the name Trading Desk, beginning June 1, 2011. In 2011, the average VaR of the Trading Desk portfolio was R$69.1 million, compared to an average VaR of the Flow Book Desk and Proprietary Trading Desk of R$9.5 million and R$46.3 million, respectively, in 2010.
VaR of Trading Desk Portfolio(**)
2011
| | | December 31 | | | Average | | | Minimum | | | Maximum | |
| | | (in millions of R$) | |
| Group of Risk Factor | | | | | | | | | | | | | | | | |
| Interest rate(*) | | | 28.3 | | | | 35.8 | | | | 12.4 | | | | 88.1 | |
| Foreign exchange linked | | | 7.5 | | | | 11.5 | | | | 5.5 | | | | 27.1 | |
| Foreign exchange rates | | | 32.7 | | | | 40.0 | | | | 21.4 | | | | 68.9 | |
| Price index linked | | | 4.7 | | | | 6.9 | | | | 0.9 | | | | 24.5 | |
| Equities | | | 3.3 | | | | 7.5 | | | | 1.5 | | | | 15.1 | |
| Diversification effect(***) | | | (22.6 | ) | | | | | | | | | | | | |
| Global Risk | | | 53.9 | | | | 69.1 | | | | 38.4 | | | | 125.0 | |
| (*) | Adjusted to reflect the difference in Brazilian tax treatment of investments abroad and investments in Brazil. |
| (**) | Desk created on June 1. 2011 (unifying the portfolios of the Flow Book Desk and Proprietary Trading Desk). |
| (***) | Reduction of risk due to the combination of all risk factors. |
VaR – Foreign Units
Itaú Unibanco’s foreign units are financial institutions based in different countries that operate with local treasuries whose market risk exposures are monitored by local risk control groups. These treasury and risk control groups report to equivalent structures of Itaú Unibanco Holding. These foreign units are “Banco Itaú BBA International”, “Banco Itaú Argentina”, “Banco Itaú Chile”, “Banco Itaú Uruguai” and “Banco Itaú Paraguai”.
In 2011, the average VaR of Banco Itaú BBA International was R$2.9 million, or 0.19% of Banco Itaú BBA International’s stockholders’ equity as of December 31, 2011 compared to R$1.3 million in 2010, or 0.09% of Banco Itaú BBA International’s stockholders’ equity as of December 31, 2010.
VaR of Banco Itaú BBA International
2011
| | | December 31 | | | Average | | | Minimum | | | Maximum | |
| | | (in millions of R$) | |
| Risk Factor | | | | | | | | | | | | �� | | | | |
| EURIBOR | | | 0.1 | | | | 0.6 | | | | 0.1 | | | | 2.6 | |
| LIBOR | | | 0.7 | | | | 0.7 | | | | 0.3 | | | | 1.5 | |
| Foreign exchange rates | | | 0.6 | | | | 1.7 | | | | 0.2 | | | | 5.6 | |
| Other | | | 0.3 | | | | 0.1 | | | | 0.0 | | | | 0.5 | |
| Diversification effect(*) | | | (0.2 | ) | | | | | | | | | | | | |
| Global Risk | | | 1.5 | | | | 2.9 | | | | 0.4 | | | | 6.5 | |
| (*) | Reduction of risk due to the combination of all risk factors. |
VaR of Banco Itaú BBA International
2010
| | | December 31 | | | Average | | | Minimum | | | Maximum | |
| | | (in millions of R$) | |
| Risk Factor | | | | | | | | | | | | | | | | |
| EURIBOR | | | 0.3 | | | | 0.5 | | | | 0.0 | | | | 1.2 | |
| LIBOR | | | 0.4 | | | | 0.7 | | | | 0.2 | | | | 1.9 | |
| Foreign exchange rates | | | 0.2 | | | | 0.3 | | | | 0.1 | | | | 1.3 | |
| Other | | | 0.2 | | | | 0.3 | | | | 0.0 | | | | 0.7 | |
| Diversification effect(*) | | | (0.5 | ) | | | | | | | | | | | | |
| Global Risk | | | 0.6 | | | | 1.3 | | | | 0.5 | | | | 3.4 | |
| (*) | Reduction of risk due to the combination of all risk factors. |
In 2011, the average VaR of Banco Itaú Argentina was R$4.0 million, or 1.33% of Banco Itaú Argentina’s stockholders’ equity, as of December 31, 2011, compared to R$1.0 million in 2010, or 0.67% of Banco Itaú Argentina’s stockholders’ equity, as of December 31, 2010.
VaR of Banco Itaú Argentina
2011
| | | December 31 | | | Average | | | Minimum | | | Maximum | |
| | | (in millions of R$) | |
| Risk Factor | | | | | | | | | | | | | | | | |
| Fixed income interest rate (Argentine peso) | | | 2.9 | | | | 4.2 | | | | 1.8 | | | | 10.0 | |
| Badlar(*) | | | 2.0 | | | | 0.7 | | | | 0.1 | | | | 2.1 | |
| Inflation index linked interest rate | | | 0.0 | | | | 0.0 | | | | 0.0 | | | | 0.2 | |
| LIBOR | | | 3.8 | | | | 1.8 | | | | 0.3 | | | | 7.3 | |
| Foreign exchange rates – Euros | | | 0.2 | | | | 0.2 | | | | 0.0 | | | | 1.1 | |
| Diversification effect(**) | | | (5.2 | ) | | | | | | | | | | | | |
| Global Risk | | | 3.7 | | | | 4.0 | | | | 1.6 | | | | 9.4 | |
| (*) Badlar is the average rate offered by commercial banks based on a survey by the Central Bank of Argentina for time deposits over 1 million pesos with a maturity of 30 to 35 days. |
| | | |
| (**) | Reduction of risk due to the combination of all risk factors. |
VaR of Banco Itaú Argentina
2010
| | | December 31 | | | Average | | | Minimum | | | Maximum | |
| | | (in millions of R$) | |
| Risk Factor | | | | | | | | | | | | | | | | |
| Fixed income interest rate (Argentine peso) | | | 1.8 | | | | 1.1 | | | | 0.3 | | | | 2.5 | |
| Badlar(*) | | | 0.1 | | | | 0.2 | | | | 0.1 | | | | 0.3 | |
| Inflation index linked interest rate | | | 0.0 | | | | 0.0 | | | | 0.0 | | | | 0.0 | |
| LIBOR | | | 0.5 | | | | 0.4 | | | | 0.1 | | | | 0.8 | |
| Foreign exchange rates – Euros | | | 0.3 | | | | 0.1 | | | | 0.0 | | | | 0.6 | |
| Diversification effect(**) | | | (1.2 | ) | | | | | | | | | | | | |
| Global Risk | | | 1.6 | | | | 1.0 | | | | 0.4 | | | | 2.3 | |
(*) Badlar is the average rate offered by commercial banks based on a survey by the Central Bank of Argentina for time deposits over 1 million pesos with a maturity of 30 to 35 days.
| (**) | Reduction of risk due to the combination of all risk factors. |
In 2011, the average VaR of Banco Itaú Chile was R$5.3 million, or 0.27% of Banco Itaú Chile’s stockholders’ equity, as of December 31, 2011, compared to R$5.1 million in 2010, or 0.36% of Banco Itaú Chile’s stockholders’ equity, as of December 31, 2010.
VaR of Banco Itaú Chile
2011
| | | December 31 | | | Average | | | Minimum | | | Maximum | |
| | | (in millions of R$) | |
| Risk Factor | | | | | | | | | | | | | | | | |
| Fixed income interest rate (Chilean peso) | | | 0.8 | | | | 1.5 | | | | 0.5 | | | | 2.8 | |
| Inflation index linked interest rate | | | 4.3 | | | | 4.4 | | | | 1.6 | | | | 8.5 | |
| Dollar linked interest rate | | | 1.9 | | | | 0.9 | | | | 0.3 | | | | 2.1 | |
| Diversification effect(*) | | | (1.8 | ) | | | | | | | | | | | | |
| Global Risk | | | 5.3 | | | | 5.3 | | | | 1.9 | | | | 10.3 | |
| (*) | Reduction of risk due to the combination of all risk factors. |
VaR of Banco Itaú Chile
2010
| | | December 31 | | | Average | | | Minimum | | | Maximum | |
| | | (in millions of R$) | |
| Risk Factor | | | | | | | | | | | | | | | | |
| Fixed income interest rate (Chilean peso) | | | 1.1 | | | | 1.5 | | | | 0.6 | | | | 4.7 | |
| Inflation index linked interest rate | | | 3.5 | | | | 4.9 | | | | 2.1 | | | | 8.1 | |
| Dollar linked interest rate | | | 0.3 | | | | 0.7 | | | | 0.3 | | | | 1.6 | |
| Diversification effect(*) | | | (1.5 | ) | | | | | | | | | | | | |
| Global Risk | | | 3.3 | | | | 5.1 | | | | 2.6 | | | | 9.4 | |
| (*) | Reduction of risk due to the combination of all risk factors. |
In 2011, the average VaR of Banco Itaú Uruguai was R$0.5 million, or 0.13% of Banco Itaú Uruguai’s stockholders’ equity, as of December 31, 2011, compared to R$0.4 million in 2010, or 0.13% of Banco Itaú Uruguai’s stockholders’ equity, as of December 31, 2010.
VaR of Banco Itaú Uruguai
2011
| | | December 31 | | | Average | | | Minimum | | | Maximum | |
| | | (in millions of R$) | |
| Risk Factor | | | | | | | | | | | | | | | | |
| Fixed income interest rate (Uruguayan peso) | | | 0.1 | | | | 0.0 | | | | 0.0 | | | | 0.1 | |
| Inflation index linked interest rate | | | 0.7 | | | | 0.4 | | | | 0.1 | | | | 1.0 | |
| Dollar linked interest rate | | | 0.1 | | | | 0.3 | | | | 0.1 | | | | 0.7 | |
| Foreign exchange rate | | | 0.0 | | | | 0.2 | | | | 0.0 | | | | 0.6 | |
| Diversification effect(*) | | | (0.2 | ) | | | | | | | | | | | | |
| Global Risk | | | 0.7 | | | | 0.5 | | | | 0.2 | | | | 1.1 | |
| (*) | Reduction of risk due to the combination of all risk factors. |
VaR of Banco Itaú Uruguai
2010
| | | December 31 | | | Average | | | Minimum | | | Maximum | |
| | | (in millions of R$) | |
| Risk Factor | | | | | | | | | | | | | | | | |
| Fixed income interest rate (Uruguayan peso) | | | 0.0 | | | | 0.1 | | | | 0.0 | | | | 0.2 | |
| Inflation index linked interest rate | | | 0.2 | | | | 0.2 | | | | 0.1 | | | | 0.3 | |
| Dollar linked interest rate | | | 0.1 | | | | 0.3 | | | | 0.0 | | | | 0.6 | |
| Foreign exchange rate | | | 0.2 | | | | 0.2 | | | | 0.0 | | | | 0.4 | |
| Diversification effect(*) | | | (0.2 | ) | | | | | | | | | | | | |
| Global Risk | | | 0.2 | | | | 0.4 | | | | 0.2 | | | | 0.8 | |
| (*) | Reduction of risk due to the combination of all risk factors. |
In 2011, the average VaR of Banco Itaú Paraguai was R$0.6 million, or 0.14% of Banco Itaú Paraguai’s stockholders’ equity, as of December 31, 2011, compared to R$0.6 million in 2010, or 0.17% of Banco Itaú Paraguai’s stockholders’ equity, as of December 31, 2010.
VaR of Banco Itaú Paraguai
2011
| | | December 31 | | | Average | | | Minimum | | | Maximum | |
| | | (in millions of R$) | |
| Risk Factor | | | | | | | | | | | | | | | | |
| Fixed income interest rate (guarani) | | | 0.0 | | | | 0.5 | | | | 0.0 | | | | 1.7 | |
| Dollar linked interest rate | | | 0.2 | | | | 0.2 | | | | 0.1 | | | | 0.5 | |
| Foreign exchange rate | | | 0.0 | | | | 0.0 | | | | 0.0 | | | | 0.3 | |
| Diversification effect(*) | | | (0.1 | ) | | | | | | | | | | | | |
| Global Risk | | | 0.2 | | | | 0.6 | | | | 0.2 | | | | 1.7 | |
| (*) | Reduction of risk due to the combination of all risk factors. |
VaR of Banco Itaú Paraguai
2010
| | | December 31 | | | Average | | | Minimum | | | Maximum | |
| | | (in millions of R$) | |
| Risk Factor | | | | | | | | | | | | | | | | |
| Fixed income interest rate (guarani) | | | 0.7 | | | | 0.5 | | | | 0.1 | | | | 1.6 | |
| Dollar linked interest rate | | | 0.2 | | | | 0.2 | | | | 0.1 | | | | 0.2 | |
| Foreign exchange rate | | | 0.2 | | | | 0.2 | | | | 0.1 | | | | 0.3 | |
| Diversification effect(*) | | | (0.3 | ) | | | | | | | | | | | | |
| Global Risk | | | 0.9 | | | | 0.6 | | | | 0.2 | | | | 1.6 | |
| (*) | Reduction of risk due to the combination of all risk factors. |
Backtesting
The effectiveness of the Value at Risk model is validated on a daily basis by the use of backtesting techniques that compare actual daily results with the percentage of cases where the results exceed pre-established limits of maximum potential loss. The number of violations to the VaR pre-established limits should be consistent, within an acceptable margin, with the hypothesis of 99% confidence intervals (i.e., there is a 1% probability that financial losses could be greater than the losses estimated by the model). For the backtesting analysis presented below, the number of violations should be not higher than 7.
In order to illustrate the reliability of risk measures generated from the models used by Itaú Unibanco, we present below the backtesting graphs of the global exposure of the Banking Desk portfolio and the fixed income interest rate risk factor of the Banking Desk portfolio (the most significant risk factor for the Banking Desk), as well as the backtesting graph of the total Trading Desk portfolio, in each case for the period of the last 12 months. Due to the limited importance of the VaR amounts of the international operations, the following backtesting analyses refer only to the portfolio related to domestic operations.
The graphs show the adequacy level of the market risk models used by Itaú Unibanco, presenting the risk (absolute value) x return pairs for the period considered. Since the diagonal line represents the threshold where risk equals results, all the dots below this line indicate violations to the estimated risk.
For the global VaR of the Banking Desk portfolio, financial losses exceeded the VaR estimated by the model on 2 days in the period, a result which is within the adopted confidence interval.
Backtest – Global VaR Banking Desk Portfolio
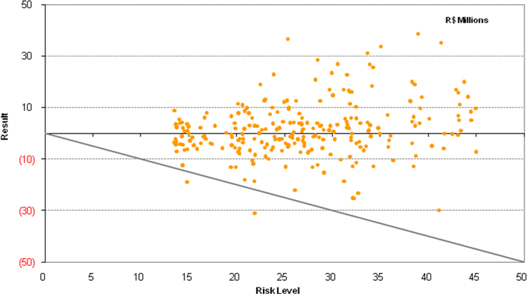
For the fixed income interest rate risk factor of the Banking Desk portfolio, financial losses exceeded the VaR estimated by the model on 3 days in the period, a result which is within the adopted confidence interval.
Backtest – Fixed Income Interest Rate Banking Desk Portfolio
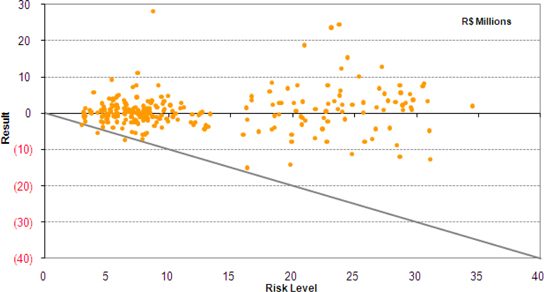
For the global VaR of the Trading Desk portfolio, financial losses exceeded the VaR estimated by the model on no days in the period, a result which is within the adopted confidence interval.
Backtest – Global VaR Trading Desk Portfolio
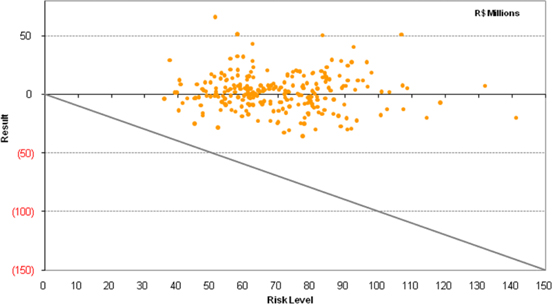
ITEM 12 DESCRIPTION OF SECURITIES OTHER THAN EQUITY SECURITIES
Not applicable.
Not applicable.
Not applicable.
| 12D. | American Depositary Shares |
In the United States, our preferred shares trade in the form of ADSs. Since 2005 each ADS represents one preferred share, issued by The Bank of New York Mellon, as depositary, under a Deposit Agreement, dated as of May 31, 2001, as amended and restated as of February 20, 2002 and as of March 30, 2009, effective as of April 3, 2009, among us, the depositary and the owners and beneficial owners of ADSs from time to time. The depositary’s principal executive office is located at One Wall Street, New York, New York 10286.
We do not treat ADR holders as our shareholders and ADS holders have no shareholder rights. Brazilian Corporate Law governs shareholder rights. The depositary is the holder of the preferred shares underlying the ADSs. Holders of ADSs have ADS holder rights.
Fees and Expenses
The following table summarizes the fees and expenses payable by holders of ADSs:
| Persons depositing preferred shares or ADR holders must pay: | | For: |
| US$5.00 (or less) per 100 ADSs (or portion thereof) plus any additional fees charged by any governmental authorities or other institutions for the execution and delivery or surrender of ADRs. | | Issuance of ADSs, including issuances resulting from a distribution of preferred shares or rights or other property. |
| | | Cancellation of ADSs for the purpose of withdrawal, including if the deposit agreement terminates. |
| US$0.02 (or less) per ADS (or portion thereof). | | Any cash distribution to you. |
| A fee equivalent to the fee that would be payable if securities distributed to you had been preferred shares and the shares had been deposited for issuance of ADSs. | | Distribution of securities by the depositary to ADS holders. |
| US$0.02 (or less) per ADS (or portion thereof) per calendar year (in addition to cash distribution fee of US$0.02 per ADS during the year). | | Depositary services. |
| Registration fees. | | Registration of transfers of preferred shares on our preferred share register to or from the name of the depositary or its agent when you deposit or withdraw preferred shares. |
| Foreign currency conversion expenses. | | Expenses of the depositary in converting foreign currency to U.S. dollars. |
| Expenses of the depositary. | | Cable, telex and facsimile transmissions (when expressly provided in the Deposit Agreement). |
| Taxes and other governmental charges the depositary or the custodian have to pay on any ADR or preferred share underlying an ADS, for example, stock transfer taxes, stamp duty or withholding taxes. | | As necessary. |
| Any other charges incurred by the depositary or its agents for servicing the deposited securities. | | No charges of this type are currently made in the Brazilian market. |
Payment of Taxes
The depositary may deduct the amount of any taxes owed from any payments to you. It may also sell deposited securities, by public or private sale, to pay any taxes owed. You will remain liable if the proceeds of the sale are not sufficient to pay the taxes. If the depositary sells deposited securities, it will, if appropriate, reduce the number of ADSs to reflect the sale and pay to you any proceeds, or send to you any property, remaining after it has paid the taxes.
Reimbursement of Fees
The Bank of New York Mellon, as depositary, has agreed to reimburse us for expenses we incur that are related to establishment and maintenance of the ADS program. The depositary has agreed to reimburse us for our continuing annual stock exchange listing fees. The depositary has also agreed to pay the standard out-of-pocket maintenance costs for the ADSs, which consist of the expenses of postage and envelopes for mailing annual and interim financial reports, printing and distributing dividend checks, electronic filing of United States federal tax information, mailing required tax forms, stationery, postage, facsimile, and telephone calls. It has also agreed to reimburse us annually for certain investor relationship programs or special investor relations promotional activities. In certain instances, the depositary has agreed to provide additional payments to us based on any applicable performance indicators relating to the ADS facility. There are limits on the amount of expenses for which the depositary will reimburse us, but the amount of reimbursement available to the Company is not necessarily tied to the amount of fees the depositary collects from investors.
The depositary collects its fees for delivery and surrender of ADSs directly from investors depositing shares or surrendering ADSs for the purpose of withdrawal or from intermediaries acting for them. The depositary collects fees for making distributions to investors by deducting those fees from the amounts distributed or by selling a portion of distributable property to pay the fees. The depositary may collect its annual fee for depositary services by deducting from cash distributions by directly billing investors or by charging the book-entry system accounts of participants acting for them. The depositary may generally refuse to provide fee-attracting services until its fees for those services have been paid.
Reimbursement of Fees Incurred in 2011
In 2011, the Company received from the depositary US$12.0 million for promoting and encouraging the ADR program in the market, out-of-pocket maintenance costs for the ADSs (consisting of the expenses of postage costs and envelopes for mailing annual and interim financial reports, printing and distributing dividend checks, electronic filing of U.S. Federal tax information, mailing required tax forms, stationery, postage, facsimile, telephone calls and international and national meetings with investment analysts and investors), any applicable performance indicators relating to the ADS facility, underwriting fees and legal fees.
PART II
ITEM 13 DEFAULTS, DIVIDEND ARREARAGES AND DELINQUENCIES
No matters to report.
ITEM 14 MATERIAL MODIFICATIONS TO THE RIGHTS OF SECURITY HOLDERS AND USE OF PROCEEDS
No matters to report.
ITEM 15 CONTROLS AND PROCEDURES
(a) Disclosure Controls and Procedures
We carried out an evaluation, under the supervision and with the participation of our management, including our chief executive officer, or CEO, and our chief financial officer, or CFO, of the effectiveness of our “disclosure controls and procedures” (as defined in the Exchange Act Rules 13a-15(e) and 15d-15(e)) as required by paragraph (b) of the Exchange Act Rules 13a-15 or 15d-15, as of December 31, 2011. A control system, no matter how well designed and operated, can provide only reasonable, not absolute, assurance that the control system’s objectives will be met. Therefore, our management does not expect that the controls will prevent all errors and all fraud.
Based upon the evaluation performed, our CEO and CFO have concluded that as of December 31, 2011, Itaú Unibanco Holding’s disclosure controls and procedures were effective to provide reasonable assurance that material information relating to Itaú Unibanco Holding and its consolidated subsidiaries is recorded, processed, summarized and reported within the time periods specified in the SEC’s rules and forms.
(b) Management’s Annual Report on Internal Control over Financial Reporting
Our management is responsible for establishing and maintaining adequate internal control over financial reporting as defined in Rules 13a-15(f) and 15d-15(f) under the Exchange Act. Our internal control was designed to provide reasonable assurance regarding the reliability of financial reporting and the preparation of financial statements for external purposes in accordance withInternational Financial Reporting Standards (“IFRSs”) as issued by the International Accounting Standards Board (“IASB”).
All internal control systems, no matter how well designed, have inherent limitations. Therefore, even those systems determined to be effective may not prevent or detect misstatements. Also, projections of any evaluation of effectiveness to future periods are subject to risk that controls may become inadequate because of changes in conditions, or that the degree of compliance with the policies or procedures may decline.
Our management assessed the effectiveness of our internal control over financial reporting as of December 31, 2011. In making this assessment, it used the criteria established by the Internal Control – Integrated Framework of the Committee of Sponsoring Organizations - COSO. Based on its evaluation and those criteria, our management has concluded that our internal control over financial reporting was effective as of December 31, 2011.
The effectiveness of internal control over financial reporting as of December 31, 2011, was audited by PricewaterhouseCoopers Auditores Independentes, an independent registered public accounting firm, as stated in their report appearing on page F-2 of this Form 20-F.
(c) Attestation Report of the Independent Registered Public Accounting Firm
For the report of PricewaterhouseCoopers Auditores Independentes, our independent registered public accounting firm, dated March 30, 2012, on the effectiveness of our internal control over financial reporting as of December 31, 2011, see “Item 18. Financial Statements.”
(d) Changes in Internal Control over Financial Reporting
In connection with the evaluation required by the Exchange Act Rule 13a-15(d), our management, including our CEO and CFO, concluded that the changes occurred during the year ended December 31, 2011 have not materially affected, or are not reasonably likely to materially affect, our internal controls over financial reporting.
ITEM 16 [RESERVED]
| 16A. | Audit Committee Financial Expert |
Our board of directors has determined that one member of our audit committee, Mr. Guy Almeida Andrade, is our audit committee financial expert and meets the requirements set forth by the SEC and the NYSE. Our audit committee financial expert, along with the other members of our audit committee, are independent pursuant to CMN Resolution No. 3,198, which requires that the members not be, or have been in the last year, an officer or employee of the company or its affiliates or an employee with managerial responsibilities in the internal audit division of the financial institution. Other members of our audit committee are financially literate and we believe the skills, experience and education of our audit committee members qualify them to carry out all of their duties as members of the audit committee, including overseeing the preparation of our IFRS financial statements. In addition, our audit committee has the ability to retain independent accountants, financial advisors or other consultants, advisors and experts whenever it deems appropriate.
We have adopted a Code of Ethics that applies to all of our employees, including directors, principal executive officers, principal financial officers, principal controllers, other officers and certain third parties, such as suppliers, who have relationship with us. Our board of directors approved our current code of ethics, which has been effective since February 2010. The full text of our Code of Ethics is published on our website, at the following address: http://ww13.itau.com.br/Portalri/HTML/ing/download/Codigo_Etica_2010.pdf
| 16C. | Principal Accountant Fees and Services |
PricewaterhouseCoopers Auditores Independentes acted as our independent registered public accounting firm for the fiscal years ended December 31, 2011, 2010 and 2009. The chart below sets forth the total amount billed to us by PricewaterhouseCoopers Auditores Independentes for services performed in the years 2011, 2010 and 2009, and breaks down these amounts by category of service in thousands ofreais:
| | | Total Fees | |
| | | (in thousands of R$) | |
| | | 2011 | | | 2010 | | | 2009 | |
| Audit Fees | | | 37,834 | | | | 41,614 | | | | 33,200 | |
| Audit-Related Fees | | | 2,489 | | | | 2,366 | | | | 4,973 | |
| Tax Fees | | | 181 | | | | 74 | | | | 135 | |
| All Other Fees | | | 1,030 | | | | 448 | | | | 13 | |
| Total | | | 41,534 | | | | 44,503 | | | | 38,320 | |
Audit Fees
Audit fees in 2011, 2010 and 2009 substantially refer to the audit of our annual consolidated financial statements, for the review of our quarterly financial statements, as well as the audit and review of financial statements of our subsidiaries, services relating to issuance of comfort letters in securities offerings and audit of internal controls in connection with the Sarbanes-Oxley Act.
Audit-Related Fees
Audit-related fees in 2011, 2010, and 2009 refer to services provided in connection with the preparation of accounting appraisal reports, assistance related to the preparation of documents to be sent to local and foreign regulatory bodies, including documents regarding compliance with legislation and regulations and audit of specific financial statements for management purposes, due diligence activities and issuance of special purpose reports.
Tax Fees
Tax fees in 2011, 2010 and 2009 were related to tax compliance, tax consulting and other consulting services.
All Other Fees
Other fees paid in 2011, 2010 and 2009 included compliance with Greenhouse Gas Emissions controls and policies, internet safety testing, evaluation of business continuity management, and consultancy for new projects, as well as use of electronic databases, technical materials, training, assistance in operations analysis and Global Investment Performance Standards - GIPS Project.
Pre-Approval Policies and Procedures
Among the audit committee’s responsibilities is the approval, on an annual basis, of policies and procedures regarding non-audit services that (i) can be provided by our external auditors, as well as the list of those services, which are pre-approved (ii) can not be provided by our external auditors, due to the fact that such services could affect the independence of the external auditors, and (iii) need to be previously approved by the audit committee. We enhanced our corporate governance ensuring its alignment with the Sarbanes-Oxley Act requirements.
| 16D. | Exemptions from the Listing Standards for Audit Committees |
Under the listed company audit committee rules of the NYSE and the SEC, we must comply with Rule 10A-3 of the Exchange Act (Listing Standards Relating to Audit Committees). Rule 10A-3 requires that we either establish an audit committee composed of members of the board of directors that meets specified requirements, or designate and empower a board of auditors or similar body to perform the role of the audit committee in reliance on the general exemption for audit committees of foreign private issuers set forth in Rule 10A-3(c)(3) of the Exchange Act.
In accordance with Central Bank regulations, we have established a body similar to the audit committee of the board of directors of a U.S. company, which we are required to call an “audit committee.” For more information, see “Item 6C. Board Practices — Statutory Bodies — Audit Committee.”
Our audit committee, to the extent permitted under Brazilian law, performs all the functions required of an audit committee under Rule 10A-3. As required by Brazilian law, our board of directors and audit committee are separate corporate bodies. Only one of the five members of our audit committee is also member of our board of directors. In addition, under Brazilian law, the function of hiring independent auditors is a power reserved exclusively for a company’s board of directors. Therefore, our board of directors acts as our audit committee, as permitted under Rule 10A-3(c)(3)(v) of the Exchange Act for the purpose of the appointment of our independent auditors.
Except in these respects, our audit committee is comparable to, and performs the functions of, an audit committee of the board of directors of a U.S. company. We believe that our audit committee is able to act independently in performing the responsibilities of an audit committee under Sarbanes-Oxley, satisfies the other requirements of the exemption of Rule 10A-3(c)(3) and therefore is in compliance with Rule 10A-3 of the Exchange Act.
| 16E. | Purchases of Equity Securities by the Issuer and Affiliated Purchasers |
| Period (1) | | (a) Total number of
preferred shares
purchased | | | (b) Average price paid per preferred share (2) | | | (c) Total number of
preferred shares
purchased as part of
publicly announced
plans or programs | | | (d) Maximum number of
preferred shares that
may yet be purchased
under the plans or
programs | |
| 01/03 to 01/31/2011 | | | | | | | | | | | - | | | | 56,700,000 | |
| 02/01 to 02/28/2011 | | | | | | | | | | | - | | | | 56,700,000 | |
| 03/01 to 03/31/2011 | | | | | | | | | | | - | | | | 56,700,000 | |
| 04/01 to 04/29/2011 | | | 4,000,000 | | | | 37.16 | | | | 4,000,000 | | | | 52,700,000 | |
| 05/02 to 05/31/2011 | | | 6,500,000 | | | | 35.72 | | | | 10,500,000 | | | | 46,200,000 | |
| 06/01 to 06/30/2011 | | | 5,000,000 | | | | 35.43 | | | | 15,500,000 | | | | 41,200,000 | |
| 07/01 to 07/29/2011 | | | 7,000,000 | | | | 32.98 | | | | 22,500,000 | | | | 34,200,000 | |
| 08/01 to 08/31/2011 | | | 18,470,900 | | | | 27.82 | | | | 40,970,900 | | | | 15,729,100 | |
| 09/01 to 09/30/2011 | | | | | | | | | | | 40,970,900 | | | | 15,729,100 | |
| 10/03 to 10/31/2011 | | | | | | | | | | | 40,970,900 | | | | 15,729,100 | |
| 11/01 to 11/30/2011 | | | | | | | | | | | 40,970,900 | | | | 56,700,000 | |
| 12/01 to 12/30/2011 | | | | | | | | | | | 40,970,900 | | | | 56,700,000 | |
(1) Our board of directors approved on November 01, 2010 the purchase of up to 56,700,000 of our book-entry preferred shares, maturing on November 4, 2011.
Our board of directors approved onOctober 31, 2011 the purchase of up to 56,700,000 of our book-entry preferred shares, maturing on November 5, 2012.
(2) Includes brokerage costs
| 16F. | Change in Registrant’s Certifying Accountant |
Not applicable.
Principal Differences Between Brazilian and U.S. Corporate Governance Practices
We are subject to the NYSE corporate governance listing standards. As a foreign private issuer, the standards applicable to us are considerably different than those applied to U.S. listed companies. Under the NYSE rules, we are only required to: (i) have an audit committee or audit board that meets certain requirements, as discussed below, (ii) provide certification by our chief executive officer to the NYSE each year that he is not aware of any violation by the company of NYSE corporate governance listing standards, (iii) submit an executed written affirmation annually to the NYSE and submit an interim written affirmation each time a change occurs to the board or any of its committees, subject to Section 303A of the NYSE rules, and (iv) provide a brief description of the significant differences between our corporate governance practices and the NYSE corporate governance practice required to be followed by U.S. listed companies. The discussion of the significant differences between our corporate governance practices and those required of U.S. listed companies follows below.
Majority of Independent Directors
The NYSE rules require that a majority of the board must consist of independent directors. Independence is defined by various criteria, including the absence of a material relationship between the director and the listed company.
Brazilian law does not have a similar requirement. Under Brazilian law, neither our board of directors nor our management is required to test the independence of directors before their election to the board. However, Brazilian Corporate Law, the Central Bank and the CVM have established rules that require directors to meet certain qualification requirements relating to professional qualifications and that address the compensation and duties and responsibilities of, as well as the restrictions applicable to, a company’s officers and directors and our directors meet the qualification requirements of Brazilian Corporate Law, the Central Bank and the CVM. Our corporate governance policy discloses the criteria used by our board of directors to determine if a director is independent. According to those criteria, three of our directors are considered independent. Brazilian Corporate Law requires that our directors be elected by our shareholders at an annual shareholders’ meeting. Three of our directors, Alfredo Egydio Arruda Villela Filho, Roberto Egydio Setubal and Alfredo Egydio Setubal, are members of the Egydio de Souza Aranha family and two of our directors, Pedro Moreira Salles and Fernando Roberto Moreira Salles, are members of the Moreira Salles family. The families are owners of IUPAR, the controlling shareholder for Itaú Unibanco Holding. Currently we have three independent directors: Alcides Lopes Tápias, Gustavo Jorge Laboissiere Loyola and Pedro Luiz Bodin de Moraes.
Executive Sessions
NYSE rules require that non-management directors meet at regularly scheduled executive sessions without the presence of management. Brazilian Corporate Law does not have a similar provision. According to Brazilian Corporate Law, up to one-third of the members of the board of directors can be elected from management. Our president Roberto Setubal, our executive vice presidents Alfredo Egydio Setubal and Candido Botelho Bracher and the executive officer of Itaú Unibanco, Ricardo Villela Marino, are members of our board of directors. There is no requirement that non-management directors meet regularly without management. As a result, the non-management directors do not typically meet in executive sessions. Our board of directors consists of nine non-management directors.
Committees
NYSE rules require that listed companies have a nominating and corporate governance committee and a compensation committee composed entirely of independent directors and governed by written charters addressing the committees’ required purposes and detailing their required responsibilities. The responsibilities of the nominating and corporate governance committee include, among other things, identifying and selecting qualified board member nominees and developing a set of corporate governance principles applicable to the company. The responsibilities of the compensation committee, in turn, include, among other things, reviewing and approving corporate goals and objectives relevant to the chief executive officer’s compensation, evaluating the chief executive officer’s performance, approving the chief executive officer’s compensation levels and recommending non-chief executive officer compensation, incentive-compensation and equity-based plans to the board.
We are not required under applicable Brazilian Corporate Law to have a nominating committee, corporate governance committee and compensation committee. However, we have an appointment and corporate governance committee, a personnel committee and a compensation committee. Pursuant to our bylaws, our directors are elected by our shareholders at an annual shareholders’ meeting. Aggregate compensation for our directors and officers is established by our shareholders.
Audit Committee and Audit Committee Additional Requirements
NYSE rules require that listed companies have an audit committee that (i) is composed of a minimum of three independent directors who are all financially literate; (ii) meets the SEC rules regarding audit committees for listed companies; (iii) has at least one member who has accounting or financial management expertise; and (iv) is governed by a written charter addressing the committee’s required purpose and annual performance evaluation of the audit committee and detailing its required responsibilities.
Brazilian banking law (Central Bank Resolution No. 3,198) requires us to have an audit committee of at least three members, and Brazilian Corporate Law requires us to have a fiscal council, which is composed of three to five members. Pursuant to Brazilian Corporate Law and Central Bank Resolution No. 3,198, the fiscal council members are elected at the annual shareholders’ meeting and the audit committee is elected by the board of directors among its members and independent members, one of which must be a financial expert, provided that, according to our bylaws, its chairman must be also a member of our board of directors.
The fiscal council operates independently from our management and from our external auditors. Its main function is to examine the financial statements for each fiscal year and provide a formal report to our shareholders. We have a fiscal council that consists of three members and three alternates and which meets once a month.
According to the SEC, foreign private issuers are exempt from the audit committee requirements if the issuer meets certain requirements. We believe that our audit committee is able to act independently in performing the responsibilities of an audit committee under Sarbanes-Oxley, satisfies the other requirements of the exemption of Rule 10A-3(c)(3) and therefore is in compliance with Rule 10A-3 of the Exchange Act. Our audit committee, to the extent permitted under Brazilian law, performs all the functions required of an audit committee under Rule 10A-3. As required by Brazilian law, our board of directors and audit committee are separate corporate bodies. In addition, under Brazilian law, the authority to hire independent auditors is reserved exclusively for a company’s board of directors. Therefore, our board of directors acts as our audit committee, as permitted under Rule 10A-3(c)(3)(v) of the Exchange Act, for the purpose of the appointment of our independent auditors. Our audit committee is currently composed of five members, one of whom is also member of our board of directors.
Shareholder Approval of Equity Compensation Plans
NYSE rules require that stockholders be given the opportunity to vote on all equity compensation plans and material revisions thereto, including material increases in the number of shares available under the plans, with limited exceptions. Under Brazilian Corporate Law, shareholders must approve all stock option plans. In addition, any issuance of new shares that exceeds our authorized share capital is subject to shareholder approval.
Corporate Governance Guidelines
NYSE rules require that listed companies adopt and disclose corporate governance guidelines. We comply with the corporate governance guidelines imposed by applicable Brazilian law. We believe the corporate governance guidelines applicable to us under Brazilian law are consistent with the guidelines established by the NYSE. We have adopted standards beyond what is required by applicable Brazilian law: we voluntarily adhere to BM&FBOVESPA’s Level 1 of Corporate Governance and have tag-along rights for all shareholders, regardless of their voting rights.
In addition, we have adopted (i) the Policy of Material Information Disclosure, which deals with the public disclosure of all relevant information as per CVM Rule No. 358 guidelines; and (ii) the Policy on Trading of Securities, which restricts the trading in securities during certain periods and requires management to publicly announce all transactions relating to our securities, and which was an optional device included in the CVM Rule No. 358. Going beyond the requirements of applicable Brazilian law, in July 2002 we created the disclosure and trading committees, which were unified in the disclosure and trading committee in April 2006.
Code of Business Conduct and Ethics
NYSE rules require that listed companies adopt and disclose a code of business conduct and ethics for directors, officers and employees, and promptly disclose any waivers of the code for directors or executive officers. Applicable Brazilian law does not have a similar requirement. However, we adopted a code of ethics in 2000 which regulates the conduct of our managers in connection with the registration and control of financial and accounting information and their access to privileged and non-public information. In 2004, we included a supplement to our code of ethics in order to comply with the requirements of Sarbanes-Oxley and the NYSE rules. In October 2005, we announced our newly and updated code of ethics, and this code was reviewed in February 2010 in connection with the Association.
Internal Audit
NYSE rules require that listed companies maintain an internal audit function to provide management and the audit committee with ongoing assessments of the company’s risk management processes and system of internal control.
Our internal auditing directorate has the independence from management to conduct methodologically structured examinations, analyses, surveys and fact-finding to evaluate the integrity, adequacy, effectiveness and efficiency of the information systems processes and internal controls related to our risk management. The directorate reports directly to our board of directors and interacts with the audit committee and, in carrying out its duties, the internal auditing directorate has access to all documents, records, systems, locations and people involved with the activities under review.
Sarbanes-Oxley Act of 2002
We maintain controls and procedures designed to ensure that we are able to collect the information we are required to disclose in the reports we file with the SEC, and to process, summarize and disclose this information within the time periods specified in the rules of the SEC.
PART III
ITEM 17 FINANCIAL STATEMENTS
We have responded to Item 18 in lieu of responding to this item.
ITEM 18 FINANCIAL STATEMENTS
The following financial statements, together with the report of the independent registered public accounting firm, are filed as part of this annual report:
Consolidated Financial Statements
| Management’s Report on Internal Control Over Financial Reporting. | F-1 |
| Report of Independent Registered Public Accounting Firm. | F-2 |
| Consolidated Balance Sheet as of December 31, 2011 and 2010 and January 01, 2010. | F-3 |
| Consolidated Statement of Income for the years ended December 31, 2011 and 2010. | F-5 |
| Consolidated Statement of Comprehensive Income for the years ended December 31, 2011 and 2010. | F-6 |
| Consolidated Statement of Changes in Shareholders’ Equity for the years ended December 31, 2011 and 2010. | F-7 |
| Consolidated Statement of Cash Flows for the years ended December 31, 2011and 2010. | F-8 |
| Notes to the Consolidated Financial Statements. | F-9 |
Management´s Report on Internal Control over Financial Reporting
The management of Itaú Unibanco Holding S.A is responsible for establishing and maintaining adequate internal control over financial reporting for the company.
The company’s internal control over financial reporting is a process designed to provide reasonable assurance regarding the reliability of financial reporting and the preparation of financial statements for external purposes in accordance with International Financial Reporting Standards (IFRSs) as issued by the International Accounting Standards Board (IASB). The company’s internal control over financial reporting includes those policies and procedures that: (i) pertain to the maintenance of records that, in reasonable detail, accurately and fairly reflect the transactions and disposals of the assets of the company; (ii) provide reasonable assurance that transactions are recorded as necessary to allow for the preparation of financial statements in accordance with generally accepted accounting principles, and that receipts and expenditures of the company are being made only in accordance with authorizations of management and directors of the company; and (iii) provide reasonable assurance regarding prevention or timely detection of unauthorized acquisition, use or disposition of the company’s assets that could have a material effect on the financial statements.
Because of its inherent limitations, internal control over financial reporting may not prevent or detect misstatements. Therefore even those systems determined to be effective can provide only reasonable assurance with respect to financial statement preparation and presentation. Also, projections of any evaluation of effectiveness to future periods are subject to the risk that controls may become inadequate because of changes in conditions, or that the degree of compliance with the policies or procedures may deteriorate.
Management assessed the effectiveness of the company’s internal control over financial reporting as of December 31, 2011, based on the criteria set forth by the COSO – Committee of Sponsoring Organization of the Treadway Commission in Internal Control – Integrated Framework.
Management's assessment included documenting, evaluating and testing of the design and operating effectiveness of its internal control over financial reporting. Based on that assessment, management has concluded that as of December 31, 2011 the company’s internal control over financial reporting is effective.
The effectiveness of the Company’s internal control over financial reporting as of December 31, 2011, has been audited by PricewaterhouseCoopers Auditores Independentes, an independent registered public accounting firm, as stated in their report which appears herein.
| /s/ Roberto Egydio Setubal | | /s/Sérgio Ribeiro da Costa Werlang | | /s/Caio Ibrahim David |
| Roberto Egydio Setubal | | Sérgio Ribeiro da Costa Werlang | | Caio Ibrahim David |
| Chief Executive Officer | | Chief Risk Officer | | Chief Financial Officer |
A signed original copy of this report has been provided to the registrant and will be retained by the registrant and furnished to the Securities and Exchange Commission or its staff upon request.
Date: March 30, 2012
Report of Independent Registered Public Accounting Firm
To the Board of Directors and Shareholders
Itaú Unibanco Holding S.A.
In our opinion, the accompanying consolidated balance sheets and the related consolidated statements of income, of comprehensive income, of cash flows and of changes in stockholders equity present fairly, in all material respects, the financial position of Itaú Unibanco Holding S.A. and its subsidiaries at December 31, 2011, December 31, 2010 and January 1, 2010 and the results of their operations and their cash flows for each of the two years in the period ended December 31, 2011, in conformity with International Financial Reporting Standards as issued by the International Accounting Standards Board. Also in our opinion, the Company maintained, in all material respects, effective internal control over financial reporting as of December 31, 2011, based on criteria established inInternal Control - Integrated Framework issued by the Committee of Sponsoring Organizations of the Treadway Commission (COSO). The Company's management is responsible for these financial statements, for maintaining effective internal control over financial reporting and for its assessment of the effectiveness of internal control over financial reporting, included in the accompanying “Management's Report on Internal Control over Financial Reporting”. Our responsibility is to express opinions on these financial statements and on the Company's internal control over financial reporting based on our audits (which was an integrated audit in 2011).We conducted our audits in accordance with the standards of the Public Company Accounting Oversight Board (United States) and International Standards on Auditing. Those standards require that we plan and perform the audits to obtain reasonable assurance about whether the financial statements are free of material misstatement and whether effective internal control over financial reporting was maintained in all material respects. Our audits of the financial statements included examining, on a test basis, evidence supporting the amounts and disclosures in the financial statements, assessing the accounting principles used and significant estimates made by management, and evaluating the overall financial statement presentation. Our audit of internal control over financial reporting included obtaining an understanding of internal control over financial reporting, assessing the risk that a material weakness exists, and testing and evaluating the design and operating effectiveness of internal control based on the assessed risk. Our audits also included performing such other procedures as we considered necessary in the circumstances. We believe that our audits provide a reasonable basis for our opinions.
A company’s internal control over financial reporting is a process designed to provide reasonable assurance regarding the reliability of financial reporting and the preparation of financial statements for external purposes in accordance with generally accepted accounting principles. A company’s internal control over financial reporting includes those policies and procedures that (i) pertain to the maintenance of records that, in reasonable detail, accurately and fairly reflect the transactions and dispositions of the assets of the company; (ii) provide reasonable assurance that transactions are recorded as necessary to permit preparation of financial statements in accordance with generally accepted accounting principles, and that receipts and expenditures of the company are being made only in accordance with authorizations of management and directors of the company; and (iii) provide reasonable assurance regarding prevention or timely detection of unauthorized acquisition, use, or disposition of the company’s assets that could have a material effect on the financial statements.
Because of its inherent limitations, internal control over financial reporting may not prevent or detect misstatements. Also, projections of any evaluation of effectiveness to future periods are subject to the risk that controls may become inadequate because of changes in conditions, or that the degree of compliance with the policies or procedures may deteriorate.
PricewaterhouseCoopers
Auditores Independentes
São Paulo, Brazil
March 30, 2012
| ITAÚ UNIBANCO HOLDING S.A. |
| Consolidated Balance Sheet |
| (In millions of Reais) |
| ASSETS | | NOTE | | | 12/31/2011 | | | 12/31/2010 | | | 01/01/2010 | |
| Cash and deposits on demand | | | 3 | | | | 10,668 | | | | 10,172 | | | | 10,671 | |
| Central Bank compulsory deposits | | | 4 | | | | 98,053 | | | | 85,776 | | | | 13,869 | |
| Interbank deposits | | | 5 | | | | 27,821 | | | | 14,835 | | | | 17,799 | |
| Securities purchased under agreements to resell | | | 5 | | | | 92,248 | | | | 88,682 | | | | 135,820 | |
| Financial assets held for trading | | | 6 | | | | 121,889 | | | | 115,497 | | | | 55,552 | |
| Pledged as collateral | | | | | | | 12,142 | | | | 54,400 | | | | 6,336 | |
| Other | | | | | | | 109,747 | | | | 61,097 | | | | 49,216 | |
| Financial assets designated at fair value through profit or loss | | | 6b | | | | 186 | | | | 306 | | | | 373 | |
| Derivatives | | | 7 and 8 | | | | 8,754 | | | | 7,777 | | | | 5,589 | |
| Available-for-sale financial assets | | | 9 | | | | 47,510 | | | | 44,539 | | | | 41,302 | |
| Pledged as collateral | | | | | | | 8,455 | | | | 8,825 | | | | 3,019 | |
| Other | | | | | | | 39,055 | | | | 35,714 | | | | 38,283 | |
| Held-to-maturity financial assets | | | 10 | | | | 3,105 | | | | 3,170 | | | | 2,429 | |
| Pledged as collateral | | | | | | | 230 | | | | 268 | | | | 124 | |
| Other | | | | | | | 2,875 | | | | 2,902 | | | | 2,305 | |
| Loan operations and lease operations, net | | | 11 | | | | 322,391 | | | | 274,843 | | | | 224,168 | |
| Loan operations and lease operations | | | | | | | 346,264 | | | | 294,837 | | | | 244,413 | |
| (-) Allowance for loan losses | | | | | | | (23,873 | ) | | | (19,994 | ) | | | (20,245 | ) |
| Other financial assets | | | 19a | | | | 40,254 | | | | 40,945 | | | | 26,931 | |
| Investments in unconsolidated companies | | | 12 | | | | 2,544 | | | | 2,948 | | | | 3,180 | |
| Fixed assets, net | | | 14 | | | | 5,358 | | | | 4,801 | | | | 4,178 | |
| Intangible assets, net | | | 15 | | | | 3,825 | | | | 2,934 | | | | 3,409 | |
| Tax assets | | | | | | | 26,088 | | | | 24,142 | | | | 26,937 | |
| Income tax and social contribution - current | | | | | | | 2,857 | | | | 3,534 | | | | 4,769 | |
| Income tax and social contribution - deferred | | | 26b | | | | 22,745 | | | | 20,169 | | | | 21,771 | |
| Other | | | | | | | 486 | | | | 439 | | | | 397 | |
| Assets held for sale | | | 35 | | | | 85 | | | | 78 | | | | 238 | |
| Other assets | | | 19a | | | | 7,357 | | | | 5,637 | | | | 5,762 | |
| TOTAL ASSETS | | | | | | | 818,136 | | | | 727,082 | | | | 578,207 | |
ITAÚ UNIBANCO HOLDING S.A.
Consolidated Balance Sheet
(In millions of Reais)
| LIABILITIES AND STOCKHOLDERS' EQUITY | | NOTE | | | 12/31/2011 | | | 12/31/2010 | | | 01/01/2010 | |
| Deposits | | | 16 | | | | 242,636 | | | | 202,688 | | | | 190,716 | |
| Securities sold under repurchase agreements | | | 18a | | | | 185,413 | | | | 199,657 | | | | 131,945 | |
| Financial liabilities held for trading | | | 17 | | | | 2,815 | | | | 1,335 | | | | 663 | |
| Derivatives | | | 7 and 8 | | | | 6,747 | | | | 5,671 | | | | 5,332 | |
| Interbank market debt | | | 18a | | | | 90,498 | | | | 62,599 | | | | 44,675 | |
| Institutional market debt | | | 18b | | | | 54,807 | | | | 44,513 | | | | 30,530 | |
| Other financial liabilities | | | 19b | | | | 44,119 | | | | 41,012 | | | | 26,825 | |
| Reserves for insurance and private pension | | | 29c lll | | | | 70,904 | | | | 56,864 | | | | 47,946 | |
| Liabilities for capitalization plans | | | | | | | 2,838 | | | | 2,603 | | | | 2,261 | |
| Provisions | | | 31 | | | | 15,990 | | | | 14,457 | | | | 13,628 | |
| Tax liabilities | | | | | | | 7,408 | | | | 12,110 | | | | 9,669 | |
| Income tax and social contribution - current | | | | | | | 1,872 | | | | 1,282 | | | | 1,265 | |
| Income tax and social contribution - deferred | | | 26b II | | | | 4,319 | | | | 5,365 | | | | 4,954 | |
| Other | | | | | | | 1,217 | | | | 5,463 | | | | 3,450 | |
| Other liabilities | | | 19b | | | | 18,625 | | | | 16,021 | | | | 15,327 | |
| Total liabilities | | | | | | | 742,800 | | | | 659,530 | | | | 519,517 | |
| Capital | | | 20a | | | | 45,000 | | | | 45,000 | | | | 45,000 | |
| Treasury shares | | | 20a | | | | (1,663 | ) | | | (628 | ) | | | (1,031 | ) |
| Additional paid-in capital | | | | | | | 738 | | | | 490 | | | | 356 | |
| Appropriated reserves | | | 20d | | | | 24,279 | | | | 16,904 | | | | 6,801 | |
| Unappropriated reserves | | | | | | | 5,561 | | | | 3,615 | | | | 5,219 | |
| Cumulative comprehensive income | | | | | | | 26 | | | | 494 | | | | 781 | |
| Total stockholders’ equity attributed to the owners of the parent company | | | | | | | 73,941 | | | | 65,875 | | | | 57,126 | |
| Non-controlling interests | | | | | | | 1,395 | | | | 1,677 | | | | 1,564 | |
| Total stockholders’ equity | | | | | | | 75,336 | | | | 67,552 | | | | 58,690 | |
| TOTAL LIABILITIES AND STOCKHOLDERS’ EQUITY | | | | | | | 818,136 | | | | 727,082 | | | | 578,207 | |
The accompanying notes are an integral part of these consolidated financial statements.
ITAÚ UNIBANCO HOLDING S.A.
Consolidated Statement of Income
Years ended December 31, 2011 and 2010
(In millions of Reais, except for earnings per share information)
| | | | NOTE | | | | 2011 | | | | 2010 | |
| Banking product | | | | | | | 74,276 | | | | 69,415 | |
| Interest and similar income | | | 22a | | | | 97,352 | | | | 77,818 | |
| Interest and similar expense | | | 22b | | | | (55,599 | ) | | | (36,840 | ) |
| Dividend income | | | | | | | 361 | | | | 326 | |
| Net gain (loss) from financial assets and liabilities | | | 22c | | | | 1,251 | | | | 2,862 | |
| Foreign exchange results and exchange variation on transactions | | | | | | | 4,998 | | | | 1,824 | |
| Banking service fees | | | 23 | | | | 19,410 | | | | 17,092 | |
| Income from insurance, private pension and capitalization operations before claim and selling expenses | | | | | | | 5,345 | | | | 4,923 | |
| Income from insurance and private pension | | | 29b III | | | | 17,169 | | | | 13,637 | |
| Change in reserves for insurance and private pension | | | | | | | (12,311 | ) | | | (9,143 | ) |
| Revenue from capitalization plans | | | | | | | 487 | | | | 429 | |
| Other income | | | 24 | | | | 1,158 | | | | 1,410 | |
| Losses on loans and claims | | | | | | | (16,072 | ) | | | (12,938 | ) |
| Expenses for allowance for loan losses | | | 11b | | | | (20,038 | ) | | | (15,547 | ) |
| Recovery of loans written off as loss | | | | | | | 5,477 | | | | 4,195 | |
| Expenses for claims | | | | | | | (1,511 | ) | | | (1,586 | ) |
| Operating margin | | | | | | | 58,204 | | | | 56,477 | |
| Other operating income (expenses) | | | | | | | (39,953 | ) | | | (38,447 | ) |
| General and administrative expenses | | | 25 | | | | (35,674 | ) | | | (34,632 | ) |
| Tax expenses | | | | | | | (4,166 | ) | | | (4,164 | ) |
| Share of comprehensive income of unconsolidated companies | | | 12 | | | | (113 | ) | | | 349 | |
| Income before income tax and social contribution | | | 26 | | | | 18,251 | | | | 18,030 | |
| Current income tax and social contribution | | | | | | | (6,956 | ) | | | (4,042 | ) |
| Deferred income tax and social contribution | | | | | | | 3,315 | | | | (1,494 | ) |
| NET INCOME | | | | | | | 14,610 | | | | 12,494 | |
| Net income attributable to owners of the parent company | | | 27 | | | | 13,837 | | | | 11,708 | |
| Net income attributable to non-controlling interests | | | | | | | 773 | | | | 786 | |
| EARNINGS PER SHARE - BASIC (in R$) | | | | | | | | | | | | |
| Common | | | | | | | 3.06 | | | | 2.58 | |
| Preferred | | | | | | | 3.06 | | | | 2.58 | |
| EARNINGS PER SHARE - DILUTED (in R$) | | | 27 | | | | | | | | | |
| Common | | | | | | | 3.05 | | | | 2.57 | |
| Preferred | | | | | | | 3.05 | | | | 2.57 | |
| WEIGHTED AVERAGE NUMBER OF SHARES OUTSTANDING - BASIC | | | 27 | | | | | | | | | |
| Common | | | | | | | 2,289,284,275 | | | | 2,289,284,273 | |
| Preferred | | | | | | | 2,240,026,557 | | | | 2,246,784,818 | |
| WEIGHTED AVERAGE NUMBER OF SHARES OUTSTANDING - DILUTED | | | 27 | | | | | | | | | |
| Common | | | | | | | 2,289,284,275 | | | | 2,289,284,273 | |
| Preferred | | | | | | | 2,251,061,836 | | | | 2,260,240,831 | |
The accompanying notes are an integral part of these consolidated financial statements.
ITAÚ UNIBANCO HOLDING S.A.
Consolidated Statement of Comprehensive Income
Years ended December 31, 2011 and 2010
(In millions of Reais)
| | | NOTE | | | 2011 | | | 2010 | |
| Net income | | | | | | | 14,610 | | | | 12,494 | |
| Available-for-sale financial assets | | | | | | | (226 | ) | | | 170 | |
| Change in fair value | | | | | | | 39 | | | | 434 | |
| (Gains)/losses transferred to income on disposal | | | 9 | | | | (444 | ) | | | (151 | ) |
| Income tax effect | | | 17 | | | | 179 | | | | (113 | ) |
| Cash flow hedge and hedge of net investment in foreign operation | | | 8 | | | | (445 | ) | | | (17 | ) |
| Change in fair value | | | | | | | (735 | ) | | | (28 | ) |
| Income tax effect | | | | | | | 290 | | | | 11 | |
| Foreign exchange differences on foreign investments | | | | | | | 392 | | | | (274 | ) |
| Share of other comprehensive income of unconsolidated companies - Available-for-sale financial assets | | | | | | | (189 | ) | | | (166 | ) |
| Total comprehensive income | | | | | | | 14,142 | | | | 12,207 | |
| Comprehensive income attributable to non-controlling interests | | | | | | | 773 | | | | 786 | |
| Comprehensive income attributable to controlling interests | | | | | | | 13,369 | | | | 11,421 | |
The accompanying notes are an integral part of these consolidated financial statements.
ITAÚ UNIBANCO HOLDING S.A.
Consolidated Statement of Changes in Stockholders’ Equity (Notes 20 and 21)
Years ended December 31, 2011 and 2010
(In millions of Reais)
| | | Attributed to owners of the parent company | | | | | | | | | | |
| | | | | | | | | | | | | | | | | | | | | Other comprehensive income | | | | | | | | | | |
| | | Capital | | | Treasury
shares | | | Additional paid-
in capital | | | Appropriated
reserves | | | Unappropriated
reserves | | | Retained
earnings | | | Available for
sale | | | Cumulative
translation
adjustments | | | Gains and
losses –
Cash flow
hedge | | | Total
stockholders’
equity – owners
of the parent
company | | | Total
stockholders’
equity – non-
controlling
interests | | | Total | |
| Balance at 01/01/2010 | | | 45,000 | | | | (1,031 | ) | | | 356 | | | | 6,801 | | | | 5,219 | | | | - | | | | 771 | | | | - | | | | 10 | | | | 57,126 | | | | 1,564 | | | | 58,690 | |
| Transactions with owners | | | - | | | | 403 | | | | 134 | | | | 1,304 | | | | (29 | ) | | | (4,484 | ) | | | - | | | | - | | | | - | | | | (2,672 | ) | | | (673 | ) | | | (3,345 | ) |
| Treasury shares - Granting of stock options – exercised options | | | - | | | | 403 | | | | 3 | | | | - | | | | - | | | | - | | | | - | | | | - | | | | - | | | | 406 | | | | - | | | | 406 | |
| Stock option plan – expenses recognized for the year | | | - | | | | - | | | | 131 | | | | - | | | | - | | | | - | | | | - | | | | - | | | | - | | | | 131 | | | | - | | | | 131 | |
| Acquisition/Increase of interest of controlling stockholders | | | - | | | | - | | | | - | | | | - | | | | - | | | | - | | | | - | | | | - | | | | - | | | | - | | | | (206 | ) | | | (206 | ) |
| Dividends and interest on capital (Note 20b) | | | - | | | | - | | | | - | | | | 1,308 | | | | - | | | | (4,484 | ) | | | - | | | | - | | | | - | | | | (3,176 | ) | | | (714 | ) | | | (3,890 | ) |
| Decrease of interest of controlling stockholders | | | - | | | | - | | | | - | | | | - | | | | - | | | | - | | | | - | | | | - | | | | - | | | | - | | | | 247 | | | | 247 | |
| Other | | | - | | | | - | | | | - | | | | (4 | ) | | | (29 | ) | | | - | | | | - | | | | - | | | | - | | | | (33 | ) | | | - | | | | (33 | ) |
| Total comprehensive income | | | - | | | | - | | | | - | | | | - | | | | - | | | | 11,708 | | | | 4 | | | | (274 | ) | | | (17 | ) | | | 11,421 | | | | 786 | | | | 12,207 | |
| Net income | | | - | | | | - | | | | - | | | | - | | | | - | | | | 11,708 | | | | - | | | | - | | | | - | | | | 11,708 | | | | 786 | | | | 12,494 | |
| Other comprehensive income for the year | | | - | | | | - | | | | - | | | | - | | | | - | | | | - | | | | 4 | | | | (274 | ) | | | (17 | ) | | | (287 | ) | | | - | | | | (287 | ) |
| Appropriations: | | | | | | | | | | | | | | | | | | | | | | | | | | | | | | | | | | | | | | | | | | | | | | | | |
| Legal reserve | | | - | | | | - | | | | - | | | | 514 | | | | - | | | | (514 | ) | | | - | | | | - | | | | - | | | | - | | | | - | | | | - | |
| Unrealized revenue reserve | | | - | | | | - | | | | - | | | | (358 | ) | | | - | | | | 358 | | | | - | | | | - | | | | - | | | | - | | | | - | | | | - | |
| Statutory reserve | | | - | | | | - | | | | - | | | | 8,643 | | | | (1,575 | ) | | | (7,068 | ) | | | - | | | | - | | | | - | | | | - | | | | - | | | | - | |
| Balance at 12/31/2010 | | | 45,000 | | | | (628 | ) | | | 490 | | | | 16,904 | | | | 3,615 | | | | - | | | | 775 | | | | (274 | ) | | | (7 | ) | | | 65,875 | | | | 1,677 | | | | 67,552 | |
| Change in the year | | | - | | | | 403 | | | | 134 | | | | 10,103 | | | | (1,604 | ) | | | - | | | | 4 | | | | (274 | ) | | | (17 | ) | | | 8,749 | | | | 113 | | | | 8,862 | |
| Balance at 01/01/2011 | | | 45,000 | | | | (628 | ) | | | 490 | | | | 16,904 | | | | 3,615 | | | | - | | | | 775 | | | | (274 | ) | | | (7 | ) | | | 65,875 | | | | 1,677 | | | | 67,552 | |
| Transactions with owners | | | - | | | | (1,035 | ) | | | 248 | | | | 539 | | | | (1 | ) | | | (5,054 | ) | | | - | | | | - | | | | - | | | | (5,303 | ) | | | (1,055 | ) | | | (6,358 | ) |
| Granting of stock options – exercised options | | | - | | | | 268 | | | | 85 | | | | - | | | | - | | | | - | | | | - | | | | - | | | | - | | | | 353 | | | | - | | | | 353 | |
| Acquisition of treasury shares | | | - | | | | (1,303 | ) | | | - | | | | - | | | | - | | | | - | | | | - | | | | - | | | | - | | | | (1,303 | ) | | | - | | | | (1,303 | ) |
| Granting of options recognized | | | - | | | | - | | | | 163 | | | | - | | | | - | | | | - | | | | - | | | | - | | | | - | | | | 163 | | | | - | | | | 163 | |
| Acquisition/Increase of interest of controlling stockholders | | | - | | | | - | | | | - | | | | - | | | | - | | | | - | | | | - | | | | - | | | | - | | | | - | | | | (391 | ) | | | (391 | ) |
| Dividends and interest on capital (Note 20b) | | | - | | | | - | | | | - | | | | 1,847 | | | | - | | | | (5,054 | ) | | | - | | | | - | | | | - | | | | (3,207 | ) | | | (664 | ) | | | (3,871 | ) |
| Dividends/Interest on capital paid in 2011 - Year 2010 (Note 2.5b Vlll) | | | - | | | | - | | | | - | | | | (1,308 | ) | | | - | | | | - | | | | - | | | | - | | | | - | | | | (1,308 | ) | | | - | | | | (1,308 | ) |
| Other | | | - | | | | - | | | | - | | | | - | | | | (1 | ) | | | - | | | | - | | | | - | | | | - | | | | (1 | ) | | | - | | | | (1 | ) |
| Total comprehensive income | | | - | | | | - | | | | - | | | | - | | | | - | | | | 13,837 | | | | (415 | ) | | | 392 | | | | (445 | ) | | | 13,369 | | | | 773 | | | | 14,142 | |
| Net income | | | - | | | | - | | | | - | | | | - | | | | - | | | | 13,837 | | | | - | | | | - | | | | - | | | | 13,837 | | | | 773 | | | | 14,610 | |
| Other comprehensive income for the year | | | - | | | | - | | | | - | | | | - | | | | - | | | | - | | | | (415 | ) | | | 392 | | | | (445 | ) | | | (468 | ) | | | - | | | | (468 | ) |
| Appropriations: | | | | | | | | | | | | | | | | | | | | | | | | | | | | | | | | | | | | | | | | | | | | | | | | |
| Legal reserve | | | - | | | | - | | | | - | | | | 594 | | | | - | | | | (594 | ) | | | - | | | | - | | | | - | | | | - | | | | - | | | | - | |
| Statutory reserve | | | - | | | | - | | | | - | | | | 6,242 | | | | 1,947 | | | | (8,189 | ) | | | - | | | | - | | | | - | | | | - | | | | - | | | | - | |
| Balance at 12/31/2011 | | | 45,000 | | | | (1,663 | ) | | | 738 | | | | 24,279 | | | | 5,561 | | | | - | | | | 360 | | | | 118 | | | | (452 | ) | | | 73,941 | | | | 1,395 | | | | 75,336 | |
| Change in the year | | | - | | | | (1,035 | ) | | | 248 | | | | 7,375 | | | | 1,946 | | | | - | | | | (415 | ) | | | 392 | | | | (445 | ) | | | 8,066 | | | | (282 | ) | | | 7,784 | |
The accompanying notes are an integral part of these consolidated financial statements.
ITAÚ UNIBANCO HOLDING S.A.
Consolidated Statement of Cash Flows
Years ended December 31, 2011 and 2010
(In millions of Reais)
| | | NOTE | | | 2011 | | | 2010 | |
| Net income | | | | | | | 14,610 | | | | 12,494 | |
| Adjustments to net income: | | | | | | | 28,572 | | | | 27,606 | |
| Granted options recognized | | | 21d | | | | 163 | | | | 131 | |
| Effects of changes in exchange rates on cash and cash equivalents | | | | | | | (2,168 | ) | | | 629 | |
| Expenses for allowance for loan losses | | | 11b | | | | 20,038 | | | | 15,547 | |
| Interest and foreign exchange expense from operations with subordinated debt | | | | | | | 4,441 | | | | 2,602 | |
| Interest expense from operations with debentures | | | | | | | 165 | | | | 224 | |
| Change in reserves for insurance and private pension | | | | | | | 12,311 | | | | 9,143 | |
| Revenue from capitalization plans | | | | | | | (487 | ) | | | (429 | ) |
| Depreciation and amortization | | | 14 and 15 | | | | 2,168 | | | | 2,143 | |
| Deferred taxes | | | | | | | (3,315 | ) | | | 1,494 | |
| Share of comprehensive income of unconsolidated companies | | | | | | | 113 | | | | (349 | ) |
| (Gain) loss from available-for-sale securities | | | 9 | | | | (444 | ) | | | (151 | ) |
| Interest and foreign exchange income from available-for-sale securities | | | | | | | (3,744 | ) | | | (2,895 | ) |
| Interest and foreign exchange income from held-to-maturity securities | | | | | | | (408 | ) | | | (445 | ) |
| (Gain) loss from sale of assets held for sale | | | 24 and 25 | | | | (36 | ) | | | (33 | ) |
| (Gain) loss from sale of investments | | | 24 and 25 | | | | (53 | ) | | | (28 | ) |
| (Gain) loss from sale of fixed assets | | | 24 and 25 | | | | (43 | ) | | | 7 | |
| (Gain) loss from termination of operations of intangible assets | | | | | | | (44 | ) | | | (56 | ) |
| Loss on impairment of fixed and intangible assets | | | 14 and 15 | | | | 45 | | | | 20 | |
| Other | | | | | | | (130 | ) | | | 52 | |
| CHANGE IN ASSETS AND LIABILITIES (*) | | | | | | | (50,622 | ) | | | (70,972 | ) |
| (Increase) decrease in interbank deposits | | | | | | | (1,354 | ) | | | 3,195 | |
| (Increase) decrease in securities purchased under agreements to resell | | | | | | | (23,218 | ) | | | 20,504 | |
| (Increase) decrease in compulsory deposits with the Central Bank of Brazil | | | | | | | (12,187 | ) | | | (71,945 | ) |
| (Increase) decrease in financial assets held for trading | | | | | | | (6,378 | ) | | | (60,023 | ) |
| (Increase) decrease in derivatives (assets/liabilities) | | | | | | | 98 | | | | (1,849 | ) |
| (Increase) decrease in financial assets designated at fair value | | | | | | | 120 | | | | 67 | |
| (Increase) decrease in loan operations | | | | | | | (66,850 | ) | | | (66,254 | ) |
| (Increase) decrease in other financial assets | | | | | | | 751 | | | | (14,015 | ) |
| (Increase) decrease in other tax assets | | | | | | | 1,377 | | | | 1,302 | |
| (Increase) decrease in other assets | | | | | | | (268 | ) | | | 1,080 | |
| (Decrease) increase in deposits | | | | | | | 38,607 | | | | 12,165 | |
| (Decrease) increase in deposits received under securities repurchase agreements | | | | | | | (14,252 | ) | | | 67,661 | |
| (Decrease) increase in financial liabilities held for trading | | | | | | | 1,480 | | | | 672 | |
| (Decrease) increase in funds from interbank markets | | | | | | | 27,853 | | | | 17,891 | |
| (Decrease) increase in other financial liabilities | | | | | | | 3,024 | | | | 14,200 | |
| (Decrease) increase in technical reserve for insurance and private pension | | | | | | | 1,729 | | | | (202 | ) |
| (Decrease) increase in liabilities for capitalization plans | | | | | | | 722 | | | | 771 | |
| (Decrease) increase in provisions | | | | | | | 593 | | | | (466 | ) |
| (Decrease) increase in tax liabilities | | | | | | | (645 | ) | | | 5,530 | |
| (Decrease) increase in other liabilities | | | | | | | 2,185 | | | | 1,852 | |
| Payment of income tax and social contribution | | | | | | | (4,009 | ) | | | (3,108 | ) |
| NET CASH FROM (USED IN) OPERATING ACTIVITIES | | | | | | | (7,440 | ) | | | (30,872 | ) |
| Interest on capital/dividends received from investments in unconsolidated companies | | | | | | | 70 | | | | 104 | |
| Cash received from sale of available-for-sale securities | | | | | | | 35,107 | | | | 17,517 | |
| Cash received from redemption of held-to-maturity securities | | | | | | | 533 | | | | 286 | |
| Cash upon sale of assets held for sale | | | | | | | 140 | | | | 368 | |
| Disposal of investment in Unibanco Saúde Seguradora S.A. | | | | | | | - | | | | 55 | |
| Disposal of investment in Unibanco Rodobens Adm. de Consórcios S.A. | | | | | | | - | | | | 41 | |
| Disposal of investments in Cia. Hipotecária Unibanco Rodobens | | | | | | | - | | | | 12 | |
| Cash upon sale of fixed assets | | | 14 | | | | 190 | | | | 71 | |
| Cash received from termination of contracts of intangible assets | | | 15 | | | | 184 | | | | 146 | |
| Purchase of available-for-sale securities | | | | | | | (33,600 | ) | | | (17,629 | ) |
| Purchase of held-to-maturity securities | | | | | | | (60 | ) | | | (582 | ) |
| Purchase of fixed assets | | | 14 | | | | (1,903 | ) | | | (1,924 | ) |
| Purchase of intangible assets | | | 15 | | | | (1,972 | ) | | | (582 | ) |
| NET CASH FROM (USED IN) INVESTING ACTIVITIES | | | | | | | (1,311 | ) | | | (2,117 | ) |
| Funding from institutional markets | | | | | | | 14,246 | | | | 12,953 | |
| Redemptions in institutional markets | | | | | | | (8,574 | ) | | | (1,796 | ) |
| Acquisition/Increase of interest of controlling stockholders | | | | | | | (391 | ) | | | (206 | ) |
| Decrease of interest of controlling stockholders | | | | | | | - | | | | 247 | |
| Granting of stock options - exercised options | | | | | | | 353 | | | | 406 | |
| Purchase of treasury shares | | | | | | | (1,303 | ) | | | - | |
| Dividends and interest on capital paid to non-controlling interests | | | | | | | (664 | ) | | | (714 | ) |
| Dividends and interest on capital paid | | | | | | | (4,588 | ) | | | (4,315 | ) |
| NET CASH FROM (USED IN) FINANCING ACTIVITIES | | | | | | | (921 | ) | | | 6,575 | |
| | | | | | | | | | | | | |
| NET INCREASE (DECREASE) IN CASH AND CASH EQUIVALENTS | | | 2.4c and 3 | | | | (9,672 | ) | | | (26,414 | ) |
| | | | | | | | | | | | | |
| Cash and cash equivalents at the beginning of the year | | | 3 | | | | 45,609 | | | | 72,652 | |
| Effects of changes in exchange rates on cash and cash equivalents | | | | | | | 2,168 | | | | (629 | ) |
| Cash and cash equivalents at the end of the year | | | 3 | | | | 38,105 | | | | 45,609 | |
| Additional information on cash flow | | | | | | | | | | | | |
| Interest received | | | | | | | 94,911 | | | | 79,799 | |
| Interest paid | | | | | | | 36,159 | | | | 40,484 | |
| Non-cash transactions | | | | | | | | | | | | |
| Loans transferred to assets held for sale | | | | | | | 4 | | | | 68 | |
| Dividends and interest on capital declared and not yet paid | | | | | | | 1,309 | | | | 1,447 | |
(*) Includes the amounts of interest received and paid as shown above.
The accompanying notes are an integral part of these consolidaded financial statements.
ITAÚ UNIBANCO HOLDING S.A.
Notes to the Consolidated Financial Statements
At December 31, 2011 and 2010 and January 1, 2010
(In millions of Reais, except per share information)
NOTE 01 – OVERVIEW
ITAÚ UNIBANCO HOLDING S.A. (ITAÚ UNIBANCO HOLDING) and its subsidiaries and affiliates) is a publicly-held company, organized and existing under the Laws of Brazil. The head office of ITAÚ UNIBANCO HOLDING is located at Praça Alfredo Egydio de Souza Aranha, n° 100, in the city of São Paulo, Brazil.
ITAÚ UNIBANCO HOLDING provides a wide range of credit and other financial services to a diverse customer base of individuals and companies in and outside Brazil, Brazilian-related and non-related customers, through its international branches, subsidiaries and associates. Such services are offered in Brazil to retail customers through the branch network of Itaú Unibanco S. A. (“Itaú Unibanco”) and to wholesale customers through Banco Itaú BBA S.A. (“Itaú BBA”), and overseas through branches in New York, Grand Cayman, Tokyo, and Nassau, and through subsidiaries mainly in Argentina, Chile, Uruguay, Paraguay, Cayman Islands, and Europe (Portugal and Luxembourg).
ITAÚ UNIBANCO HOLDING is a holding company controlled by Itaú Unibanco Participações S.A. (“IUPAR”), a holding company which owns 51% of our common shares, and which is jointly controlled by (i) Itaúsa Investimentos Itaú S.A. (“Itaúsa”), a holding company controlled by members of the Egydio de Souza Aranha family; and (ii) Companhia E. Johnston de Participações (“E. Johnston”), a holding company controlled by the Moreira Salles family. Itaúsa also directly holds 38.7% of ITAÚ UNIBANCO HOLDING common shares.
As described in Note 33, the operations of ITAÚ UNIBANCO HOLDING are divided into four operating and reportable segments: (1) Commercial Bank, which offers a wide range of banking services for individuals (retail banking, under several areas specialized in distribution and under several brands, such as Uniclass, Personnalité or Private Bank) and for companies (very small, small and medium-sized companies), including services such as asset management, investor services, insurance, private pension plans, capitalization plans, and credit cards issued to account holders; (2) Itaú BBA, which offers wholesale products and services to large companies, as well as investment bank activities; (3) Consumer Credit, which offers products and services to non-account holders, such as vehicle financing, credit card transactions and consumer financing; and (4) Corporate and Treasury, which generates interest income associated with capital surplus, subordinated debt surplus and the results of certain treasury activities, carries forward of the net balance of deferred tax assets and liabilities, the net interest income from the negotiation of financial assets, from the management of currency and interest rate gaps, fair value adjustments and other risks, from arbitrage opportunities in the foreign and domestic markets, and from the effect of marking-to-market of financial assets and liabilities.
These consolidated financial statements were approved by the board of directors on March 29, 2012.
NOTE 02 – SIGNIFICANT ACCOUNTING POLICIES
The significant accounting policies applied in the preparation of these consolidated financial statements are set out below.
2.1 BASIS OF PREPARATION
These consolidated financial statements of ITAÚ UNIBANCO HOLDING were prepared taking into consideration that the National Monetary Council (CMN) Resolution No. 3,786 established that starting December 31, 2010, annual consolidated financial statements shall be prepared in accordance with the International Financial Reporting Standards (IFRS), as issued by the International Accounting Standards Board (IASB).
For the purposes of the accompanying financial statements, ITAÚ UNIBANCO HOLDING elected January 1, 2010 as the date of transition from the accounting practices adopted in Brazil (“BRGAAP”) to IFRS. BRGAAP has been defined as the previous accounting practice (“Prior GAAP”), for purposes of IFRS 1 – “First-time Adoption of International Financial Reporting Standards”.
These consolidated financial statements are presented following the accounting practices described in this note.
In the preparation of these consolidated financial statements, ITAÚ UNIBANCO HOLDING adopted the criteria for recognition, measurement and disclosure established in the IFRS pronouncements issued by the IASB, and the interpretations of the International Financial Reporting Interpretations Committee (IFRIC) described in this note. For this reason, these consolidated financial statements are in full conformity with the pronouncements issued by the IASB, and the interpretations issued by the IFRIC, and represent the first complete financial statements prepared in accordance with IFRS.
The reconciliation between stockholders’ equity under BRGAAP, defined as the “Prior GAAP”, and IFRS at the transition date is presented in Note 2.5 (B) together with a description of the applicable exemptions and the mandatory exceptions, as defined by IFRS 1.
IFRS 1 is applied when an entity adopts the IFRS in the preparation of its annual financial statements for the first time, with an explicit and unreserved statement of compliance with IFRS. In general, IFRS 1 requires the entity to comply with each IFRS accounting standard effective at the date of preparation of its first IFRS consolidated financial statements.
IFRS 1 grants exemptions that provide limited relief from requirements in specific areas in which the cost of producing information could exceed the benefits to users of financial statements. In addition, IFRS 1 also prohibits the retrospective application of certain standards or criteria to some areas, particularly those in which the retrospective application could require Management to exercise judgment over conditions that did not exist at the time of the transactions.
The summary of the IFRS1 applicable exemptions and of the exceptions adopted by Management in the preparation of these consolidated financial statements is presented in Note 2.5 (A).
We also present in Note 2.5 (B) the reconciliation between stockholders’ equity and net income under BRGAAP and IFRS, on the base date December 31, 2010.
In accordance with Securities and Exchange Commission’s (SEC) requirements for the first-time filing of financial statements under IFRS of a foreign “private issuer”, we present in Note 2.5 (C) the reconciliation of the stockholders’ equity under USGAAP and IFRS on the transition date and stockholders’ equity and net income under USGAAP and IFRS at December 31, 2010. Also in Note 2.5 (C), we present the reconciliation of the balance sheet under USGAAP and IFRS at December 31, 2010, the adjustments made affecting the same lines on the balance sheet on the transition date.
The consolidated statement of cash flows shows the changes in cash and cash equivalents during the period from operating, investing and financing activities. Cash and cash equivalents include highly-liquid financial investments.
Cash flows from operating activities are presented under the indirect method. Consolidated net income is adjusted for non-monetary items, such as measurement gains and losses, changes in provisions and in receivables and liabilities balances. All income and expense arising from non-monetary transactions, attributable to investing and financing activities, are eliminated. Interest received or paid is classified as operating cash flows.
2.2 NEW PRONOUNCEMENTS, CHANGES TO AND INTERPRETATIONS OF EXISTING PRONOUNCEMENTS
| a) | Changes to accounting pronouncements applicable for the year ended December 31, 2011 |
| · | IFRIC 13 – “Customer Loyalty Programmes” – clarifies the concept of fair value in the event of granting credit as part of a customer loyalty programmes. This change in interpretation has not significantly impacted the consolidated financial statements. |
| · | IFRIC 14 – “IAS 19 : The limit on a defined benefit asset, minimum funding requirements and their interaction”- averts an unintentional consequence of IFRIC 14 related to voluntary prepayments of pension plans whenever there is a minimum funding requirement. This change in interpretation has not impacted the consolidated financial statements. |
| · | IFRIC 19 – “Extinguishing Financial Liabilities with Equity Instruments” – Addresses the accounting of extinguishing financial liabilities by issuing equity instruments. Clarifies that the gain or loss from extinguishing financial liabilities with equity instruments should be recorded in income. This change in interpretation has not impacted the consolidated financial statements. |
| · | IAS 1 – “Presentation of Financial Statements” – clarifies that an entity should disclose an analysis of other comprehensive income in the statement of changes in stockholders’ equity or in the notes to the financial statements. This change in the pronouncement has not significantly impacted the consolidated financial statements. |
| · | IAS 24 – “Related Party Disclosure” – addresses new requirements for relations with government agencies and excludes operations between affiliates. This change in the pronouncement has not impacted the consolidated financial statements. |
| · | IAS 27 – “Consolidated and Separate Financial Statements” – establishes that the loss of control of a subsidiary, loss of significant influence in an associate and loss of joint control in a joint venture are similar events and should be recorded and measured at fair value; any gains and losses should be recorded in income. This change in the pronouncement has not significantly impacted the consolidated financial statements. |
| · | IAS 32 – “Financial Instruments: Presentation” – establishes the conditions under which the issue of certain rights, in a functional currency other than the entity’s functional currency, may be classified as an equity instrument. This change in the pronouncement has not impacted the consolidated financial statements. |
| · | IAS 34 – “Interim Financial Reporting” – requires the disclosure of material transactions and events in interim financial statements. This change in the pronouncement has not impacted the consolidated financial statements. |
| · | IFRS 1 – “First-time Adoption of International Financial Reporting Standards” – addresses limited exemptions from the comparative disclosures of IFRS 7. This change in the pronouncement has not significantly impacted the consolidated financial statements. |
| · | IFRS 3 (R) – “Business Combinations” – addresses participation of non-controlling interests and acquired options. This change in the pronouncement has not significantly impacted the consolidated financial statements. |
| · | IFRS 7 – “Financial Instruments: Disclosures” – emphasizes the interaction between quantitative and qualitative disclosures on the nature and extent of risks associated with financial instruments, particularly pledged guarantees maintained. The new disclosure requirements for example regarding the financial effect of guarantees are presented in Note 35. |
| b) | Accounting pronouncements recently issued and applicable in future periods |
The following pronouncements will become applicable for periods after the date of these consolidated financial statements and were not early adopted:
| · | IAS 32 – “Financial Instruments: Presentation” – this change was issued to clarify the offsetting requirements for financial instruments in the balance sheet. The change is applicable for years beginning on January 1, 2014. Currently it is being analyzed if there will be any possible impact arising from the adoption of this change. |
| · | IFRS 7 – “Financial Instruments: Disclosures” – in October, 2010, a change was issued to this pronouncement requiring additional disclosures on transfers of assets (remaining risks) and transfers close to the balance sheet date. It is applicable for periods beginning after July 1, 2011. Additionally, in December 2011, a new change to the pronouncement was issued requiring additional disclosures on the offsetting process. These requirements are applicable for the years beginning after January 1, 2013. Currently it is being analyzed if there will be any possible impact arising from the adoption of this change. |
| · | IFRS 9 – “Financial Instruments” – the pronouncement is the first step in the process of replacing IAS 39 - “Financial Instruments: Recognition and Measurement”. IFRS 9 introduces new requirements for classifying and measuring financial assets, and it is expected to significant affect the accounting for financial instruments of ITAÚ UNIBANCO HOLDING. It is not applicable before January 1, 2015, although early adoption is permitted. |
| · | IAS 19 – “Employee Benefits” – it will not be possible to use the “corridor” method any longer, and all changes should be recorded in other cumulative comprehensive. It is applicable for years beginning after January 1, 2013. Currently it is being analyzed if there will be any possible impact arising from the adoption of this change. |
| · | IFRS 10 – “Consolidated Financial Statements” – the pronouncement changes the current principle, identifying the concept of control as a determining fact of when an entity should be consolidated. IFRS 10 provides additional guidance to assist in the determination of which entity controls another in certain cases where this judgment is complex. It is not effective until January 1, 2013. Currently it is being analyzed if there will be any possible impact arising from the adoption of this standard. |
| · | IFRS 11 – “Joint Arrangements” – the pronouncement provides a different approach for analyses of “Joint Arrangements” focused on the rights and obligations of the arrangements rather than on the legal form. IFRS 11 divides the “Joint Arrangements” into two types: “Joint Operations” and “Joint Ventures”, in accordance with the rights and obligations of the parties. For investments in Joint Ventures, proportionate consolidation is no longer permitted. Currently it is being analyzed if there will be any possible impact arising from the adoption of this standard. |
| · | IFRS 12 – “Disclosures of Interests in Other Entities” – the pronouncement includes new requirements for disclosure of all types of investments in other entities, such as joint arrangements, associates and special purpose entities. It is not effective until January 1, 2013. Currently it is being analyzed if there will be any possible impact arising from the adoption of this standard. |
| · | IFRS 13 – “Fair Value Measurement” – the purpose of this pronouncement is a better alignment between IFRS and USGAAP, increasing consistency and reducing the complexity of the disclosures by using consistent definitions of fair value. It is not effective until January 1, 2013. Currently it is being analyzed if there will be any possible impact arising from the adoption of this standard. |
2.3 ACCOUNTING ESTIMATES AND JUDGMENTS
The preparation of consolidated financial statements in accordance with IFRS requires Management to make estimates and assumptions that affect the reported amounts of assets, liabilities and contingent liabilities at the date of the consolidated financial statements, as well as the reported amounts of revenue, expenses, gains and losses over the reporting and subsequent periods, because actual results may differ from those determined in accordance with such estimates and assumptions.
All estimates and assumptions made by Management are in accordance with IFRS and represent the current best estimates made in conformity with the applicable rule standards. Estimates and judgments are evaluated on an ongoing basis, considering past experience and other factors.
The consolidated financial statements reflect a variety of estimates and assumptions. The critical accounting estimates and assumptions that have the most significant impact on the carrying amounts of assets and liabilities are described below:
| a) | Allowance for loan losses |
ITAÚ UNIBANCO HOLDING periodically reviews its portfolio of loans and receivables to evaluate the existence of impairment.
In order to determine the amount of the allowance for loan losses in the Consolidated Statement of Income with respect to certain receivables or a group of receivables, ITAÚ UNIBANCO HOLDING exercises its judgment to determine whether objective evidence indicates that an event of loss has occurred. These evidences may include observable data that indicates that an adverse change has occurred in relation to the expected cash inflows from the counterparty or the existence of a change in local or international economic conditions that correlates with impairment. Management uses estimates based on the history of loss experience in loan operations with similar characteristics and with similar objective evidence of impairment. The methodology and assumptions used for estimating future cash flows are regularly reviewed by Management, considering the adequacy of models and sufficiency of provision volumes in view of the experience of incurred loss.
At December 31, 2011, the allowance amounted to R$ 23,873 (R$ 19,994 at December 31, 2010 and R$ 20,245 at January 1, 2010).
If the present value of the estimated cash flows were to have a positive or negative variation of 1%, the allowance for loan losses would be increased or decreased by approximately R$ 3,224 at December 31, 2011 and R$ 2,748 December 31, 2010.
The details on the methodology and assumptions used by Management are disclosed in Note 2.4 (g) (VIII).
| b) | Deferred income tax and social contribution |
As explained in Note 2.4 (n), deferred tax assets are recognized only in relation to temporary differences and loss carryforwards to the extent that it is probable that ITAÚ UNIBANCO HOLDING will generate future taxable profit for their utilization. The expected realization of ITAÚ UNIBANCO HOLDING’s deferred tax asset is based on the projection of future income and other technical studies, as disclosed in Note 26. The carrying amount of deferred tax assets at December 31, 2011 is R$ 28,810 (R$ 25,920 at December 31, 2010 and R$ 26,794 at January 1, 2010).
| c) | Fair value of financial instruments, including derivatives |
Financial instruments recorded at fair value at December 31, 2011 are assets amounting to R$ 178,339 (R$ 168,119 at December 31, 2010 and R$ 102,816 at January 1, 2010), of which R$ 8,754 are derivatives (R$ 7,777 at December 31, 2010 and R$ 5,589 at January 1, 2010) and liabilities in the amount of R$ 9,562 (R$ 7,006 at December 31, 2010 and R$ 5,995 at January 1, 2010), of which R$ 6,747 are derivatives (R$ 5,671 at December 31, 2010 and R$ 5,332 at January 1, 2010). The fair value of financial instruments, including derivatives that are not traded in active markets, is calculated by using valuation techniques. This calculation is based on assumptions that take into consideration Management’s judgment about market information and conditions existing at the balance sheet date.
ITAÚ UNIBANCO HOLDING ranks the fair value measurements using a fair value hierarchy that reflects the significance and observability of inputs adopted in the measurement process. There are three broad levels related to the fair value hierarchy, detailed in Note 30.
ITAÚ UNIBANCO HOLDING believes that methodologies adopted are appropriate and consistent with market participants. Regardless of this fact, the adoption of other methodologies or use of different assumptions to estimate fair values may result in different fair value estimates.
The methodologies used to estimate the fair value of certain financial instruments are described in Note 30.
| d) | Defined benefit pension plan |
At December 31, 2011, an amount of R$ 97 (R$ 244 at December 31, 2010 and R$ 1,372 at January 1, 2010) was recognized as an asset related to pension plans. The current amount of the pension plan obligations is obtained from actuarial calculations that use a variety of assumptions. Among the assumptions used for estimating the net cost (income) of these plans is the discount rate. Any changes in these assumptions will affect the carrying amount of pension plan assets or liabilities.
ITAÚ UNIBANCO HOLDING determines the appropriate discount rate at the end of each year which is used for determining the present value of estimated future cash outflows necessary for settling the pension plan liabilities. In order to determine the appropriate discount rate, ITAÚ UNIBANCO HOLDING considers the interest rates of the Brazilian federal government bonds that are denominated in Brazilian reais, the currency in which the benefits will be paid, and that have maturity terms approximating the terms of the related liabilities.
Should the discount rate currently used be lower by 0.5% than Management’s estimates, the actuarial amount of the pension plan obligations would be increased by approximately R$ 578.
Other important assumptions for pension plan obligations are in part based on current market conditions. Additional information is disclosed in Note 28.
| e) | Contingent liabilities and provisions |
ITAÚ UNIBANCO HOLDING periodically reviews its contingencies. These contingencies are evaluated based on Management’s best estimates, taking into account the opinion of legal counsel, when there is a likelihood that financial resources will be required to settle the obligations and the amounts may be reasonably estimated.
Contingencies classified as probable losses are recognized in the balance sheet under “Provisions”.
Contingent amounts are measured using appropriate models and criteria, despite the uncertainty surrounding the ultimate timing and amounts, as detailed in Note 31.
The carrying amount of these contingencies at December 31, 2011 is R$ 15,990 (R$ 14,457 at December 31, 2010 and R$ 13,628 at January 1, 2010).
| f) | Technical provisions for insurance and pension plan |
Technical provisions are liabilities arising from obligations of ITAÚ UNIBANCO HOLDING to its policyholders and participants. These obligations may be short-term liabilities (property and casualty insurance) or medium and long-term liabilities (life insurance and pension plans).
The determination of the actuarial liability is subject to several uncertainties inherent in the coverage of insurance and pension contracts, such as the assumptions of persistence, mortality, disability, life expectancy, morbidity, expenses, frequency and severity of claims, conversion of benefits into annuities, redemptions and return on assets.
The estimates for these assumptions are based on the historical experience of ITAÚ UNIBANCO HOLDING, benchmarks and experience of the actuary, in order to comply with best market practices and the continuous review of the actuarial liability. The adjustments resulting from these continuous improvements, when necessary, are recognized in the statement of income for the corresponding period.
2.4 SUMMARY OF MAIN ACCOUNTING PRACTICES
| a) | CONSOLIDATION AND PROPORTIONATE CONSOLIDATION |
In accordance with IAS 27 – “Consolidated and Separate Financial Statements”, subsidiaries are entities in which ITAÚ UNIBANCO HOLDING has the power to govern the financial and operating policies so as to obtain benefits from its activities, and normally corresponding to ownership more than 50% of the voting capital.
| II- | Special Purpose Entities (SPEs) |
In accordance with SIC 12 – “Consolidation – Special Purpose Entities”, we consolidate special purpose entities, when the substance of the relationship between ITAÚ UNIBANCO HOLDING and the SPEs indicates that the SPEs are controlled by ITAÚ UNIBANCO HOLDING. The following circumstances may show evidence of control, in substance:
| · | the activities of the SPEs are being conducted on behalf of ITAÚ UNIBANCO HOLDING, according to its specific business needs so that ITAÚ UNIBANCO HOLDING obtains benefits from their operations. |
| · | ITAÚ UNIBANCO HOLDING has the decision-making powers to obtain the majority of the benefits of the activities of SPEs or ITAÚ UNIBANCO HOLDING has the ability to delegate such powers. |
| · | ITAÚ UNIBANCO HOLDING has the right to obtain the majority of the benefits of the SPEs and therefore may be exposed to risks incident to their activities. |
| · | ITAÚ UNIBANCO HOLDING retains the majority of the residual risks related to the SPEs or their assets in order to obtain benefits from their activities. |
IAS 31 – “Interests in Joint Ventures” defines joint ventures as entities jointly controlled by two or more unrelated entities (venturers). Joint ventures include contractual agreements in which two or more entities have joint-control over entities or over operations or over assets, so that the strategic financial and operating decisions that affect them require the unanimous decision of the venturers.
Also in accordance with IAS 31, the accounting treatment for investments in joint ventures can be either proportionate consolidation or the equity method. ITAÚ UNIBANCO HOLDING has elected to use proportionate consolidation.
The following table shows the main consolidated subsidiaries and proportionally consolidated joint ventures, as well as the interests of ITAÚ UNIBANCO HOLDING in their voting capital at December 31, 2011, December 31, 2010 and January 1, 2010:
| Subsidiaries | | Incorporation
country | | Activity | | Interest in voting
capital at
12/31/2011 | | | Interest in voting
capital at
12/31/2010 | | | Interest in voting
capital at
01/01/2010 | |
| Banco Dibens S.A. | | Brazil | | Bank | | | 100.00 | % | | | 100.00 | % | | | 100.00 | % |
| Banco Fiat S.A. | | Brazil | | Bank | | | 100.00 | % | | | 100.00 | % | | | 99.99 | % |
| Banco Itaú Argentina S.A. | | Argentina | | Bank | | | 100.00 | % | | | 100.00 | % | | | 100.00 | % |
| Banco Itaú BBA S.A. | | Brazil | | Bank | | | 99.99 | % | | | 99.99 | % | | | 99.99 | % |
| Banco Itaú Chile | | Chile | | Bank | | | 99.99 | % | | | 99.99 | % | | | 99.99 | % |
| Banco Itaú Europa Luxembourg S.A. | | Luxembourg | | Bank | | | 99.99 | % | | | 99.99 | % | | | 99.99 | % |
| Banco Itaú BBA International, S.A. | | Portugal | | Bank | | | 99.99 | % | | | 99.99 | % | | | 99.99 | % |
| Banco Itaú Paraguay S.A. | | Paraguay | | Bank | | | 99.99 | % | | | 99.99 | % | | | 99.99 | % |
| Banco Itaú Uruguay S.A. | | Uruguay | | Bank | | | 100.00 | % | | | 100.00 | % | | | 100.00 | % |
| Banco Itaucard S.A. | | Brazil | | Bank | | | 100.00 | % | | | 100.00 | % | | | 99.99 | % |
| Banco Itaucred Financiamentos S.A. | | Brazil | | Bank | | | 100.00 | % | | | 100.00 | % | | | 99.99 | % |
| Banco Itauleasing S.A. | | Brazil | | Bank | | | 100.00 | % | | | 100.00 | % | | | 99.99 | % |
| BIU Participações S.A. | | Brazil | | Holding Company of non-financial institutions | | | 66.15 | % | | | 66.15 | % | | | 66.15 | % |
| Cia. Itaú de Capitalização | | Brazil | | Capitalization | | | 99.99 | % | | | 99.99 | % | | | 99.99 | % |
| Dibens Leasing S.A. - Arrendamento Mercantil | | Brazil | | Leasing | | | 100.00 | % | | | 100.00 | % | | | 100.00 | % |
| Fiat Administradora de Consórcios Ltda | | Brazil | | Consortia administrator | | | 99.99 | % | | | 99.99 | % | | | 99.99 | % |
| Hipercard Banco Múltiplo S.A. | | Brazil | | Bank | | | 100.00 | % | | | 100.00 | % | | | 99.99 | % |
| Itaú Administradora de Consórcios Ltda. | | Brazil | | Consortia administrator | | | 99.99 | % | | | 99.99 | % | | | 99.99 | % |
| Itaú Ásia Securities Ltd | | Hong Kong | | Broker | | | 100.00 | % | | | 100.00 | % | | | 100.00 | % |
| Itau Bank, Ltd. | | Cayman Islands | | Bank | | | 100.00 | % | | | 100.00 | % | | | 100.00 | % |
| Itaú Companhia Securitizadora de Créditos Financeiros | | Brazil | | Securitization company | | | 99.99 | % | | | 99.99 | % | | | 99.99 | % |
| Itaú Corretora de Valores S.A. | | Brazil | | Broker | | | 100.00 | % | | | 100.00 | % | | | 99.99 | % |
| Itaú Distribuidora de Títulos e Valores Mobiliários Ltda | | Brazil | | Dealer | | | 100.00 | % | | | 100.00 | % | | | 99.99 | % |
| Itaú Japan Asset Management Limited | | Japan | | Asset management | | | 100.00 | % | | | 100.00 | % | | | - | |
| Itaú Middle East Securities Limited | | Arab Emirates | | Broker | | | 100.00 | % | | | 100.00 | % | | | 99.99 | % |
| Itaú Seguros S.A. | | Brazil | | Insurance | | | 100.00 | % | | | 100.00 | % | | | 100.00 | % |
| Itaú Unibanco S.A. | | Brazil | | Bank | | | 100.00 | % | | | 100.00 | % | | | 100.00 | % |
| Itaú USA Securities, INC. | | United States | | Broker | | | 100.00 | % | | | 100.00 | % | | | 99.99 | % |
| Itaú Vida e Previdência S.A. | | Brazil | | Pension plan | | | 100.00 | % | | | 100.00 | % | | | 100.00 | % |
| Orbitall Serviços e Processamento de Informações Comerciais S.A | | Brazil | | Technology services | | | 99.99 | % | | | 99.99 | % | | | 99.99 | % |
| Redecard S.A. | | Brazil | | Card administrator | | | 50.01 | % | | | 50.01 | % | | | 50.01 | % |
| Unibanco Cayman Bank Ltd. | | Cayman Islands | | Bank | | | 100.00 | % | | | 100.00 | % | | | 100.00 | % |
| Unibanco Participações Societárias S.A. | | Brazil | | Company | | | 100.00 | % | | | 100.00 | % | | | 100.00 | % |
| | | | | | | | | | | | | | | | | |
| Joint ventures | | | | | | | | | | | | | | | | |
| | | | | | | | | | | | | | | | | |
| Banco Investcred Unibanco S.A. | | Brazil | | Bank | | | 50.00 | % | | | 50.00 | % | | | 49.99 | % |
| FAI - Financeira Americanas Itaú S.A. Crédito, Financiamento e Investimento | | Brazil | | Consumer finance company | | | 50.00 | % | | | 50.00 | % | | | 49.99 | % |
| Financeira Itaú CBD S.A. Crédito, Financiamento e Investimento | | Brazil | | Consumer finance company | | | 50.00 | % | | | 50.00 | % | | | 50.00 | % |
| Luizacred S.A. Soc. Cred. Financiamento Investimento | | Brazil | | Consumer finance company | | | 50.00 | % | | | 50.00 | % | | | 49.99 | % |
Other information
The table below shows amounts included in the consolidated balance sheets and statements of income for jointly-controlled entities (Joint Ventures) proportionally consolidated by ITAÚ UNIBANCO HOLDING:
| | | 12/31/2011 | | | 12/31/2010 | | | 01/01/2010 | |
| Current assets | | | 3,869 | | | | 4,303 | | | | 3,474 | |
| Non-current assets | | | 393 | | | | 323 | | | | 65 | |
| Total assets | | | 4,262 | | | | 4,626 | | | | 3,539 | |
| Current liabilities | | | 3,537 | | | | 3,743 | | | | 2,909 | |
| Non-current liabilities | | | 31 | | | | 46 | | | | 92 | |
| Total liabilities | | | 3,568 | | | | 3,789 | | | | 3,001 | |
| Total income | | | 1,647 | | | | 1,605 | | | | 1,391 | |
| Total expenses | | | (1,600 | ) | | | (1,494 | ) | | | (1,353 | ) |
ITAÚ UNIBANCO HOLDING is committed to maintaining the minimum capital required by jointly-controlled entities. For the companies FIC - Financeira Itaú CBD S.A Crédito, Financiamento e Investimento and FAI - Financeira Americanas Itaú S.A. Crédito, Financiamento e Investimento, the minimum capital percentage is 25% higher than that required by the Central Bank of Brazil (Note 32).
Accounting for business combinations under IFRS 3 (R) is only applicable when a business is acquired. Under IFRS 3 (R), a business is defined as an integrated set of activities and assets that is conducted and managed for the purpose of providing a return to investors, or cost reduction or other economic benefits. In general, a business consists of inputs and processes applied to those inputs that are or will be used to generate income. If there is goodwill in a set of activities or transferred assets, this is presumed to be a business. For acquisitions that meet the definition of business combination, accounting under the purchase method is required. The acquisition cost is measured as the fair value of the assets delivered, equity instruments issued and liabilities incurred or assumed at the exchange date, plus costs directly attributable to the acquisition. Acquired assets and assumed liabilities and contingent liabilities identifiable in a business combination are initially measured at their fair value at the acquisition date, regardless of the existence of non-controlling interests. The excess of the acquisition cost, plus non-controlling interest, if any, over the fair value of identifiable net assets acquired is accounted for as goodwill. The treatment of goodwill is described in Note 2(k). If the acquisition cost, plus non-controlling interest, if any, is lower than the fair value of identifiable net assets acquired, the difference is recognized directly in income.
For each business combination, the purchaser should measure any non-controlling interest in the acquired company at the fair value or amount proportional to its interest in net assets of the acquired company.
| b) | FOREIGN CURRENCY TRANSLATION |
| I - | Functional and presentation currency |
The consolidated financial statements of ITAÚ UNIBANCO HOLDING are presented in Brazilian reais, which is its functional currency and the presentation currency of these consolidated financial statements. For each subsidiary, joint venture and investment in an unconsolidated company, ITAÚ UNIBANCO HOLDING has defined the functional currency.
IAS 21 – “The Effects of Changes in Foreign Exchange Rates” defines the functional currency as the currency of the primary economic environment in which the entity operates. If the indicators are mixed and the functional currency is not obvious, Management has to use its judgment to determine the functional currency that most faithfully represents the economic effects of the entity’s operations, focusing on the currency that mainly influences the pricing of transactions. Additional indicators are the currency in which financing or in which funds from operating activities are generated or received, as well as the nature of activities and the extent of transactions between the foreign subsidiaries and the other entities of the consolidated group.
The assets and liabilities of subsidiaries with a functional currency other than the Brazilian real are translated as follows:
| · | assets and liabilities are translated at the closing rate at the balance sheet date. |
| · | income and expenses are translated at monthly average exchange rates. |
| · | exchange differences arising from translation are recorded in other comprehensive income. |
| II- | Foreign currency transactions |
Foreign currency transactions are translated into the functional currency using the exchange rates prevailing at the dates of the transactions. Foreign exchange gains and losses resulting from the settlement of such transactions and from the translation at year-end exchange rates of monetary assets and liabilities denominated in foreign currencies are recognized in the consolidated statement of income as an integral part of “Foreign exchange results and exchange variation on transactions” and amount to R$ 2,186 for the year ended December 31, 2011 (R$ (814) for to the year ended December 31, 2010).
In the case of changes in the fair value of monetary assets denominated in foreign currency classified as available for sale, the exchange differences resulting from a change in the amortized cost of the instrument are separated from all other changes in the carrying amount of the instrument. The exchange differences resulting from a change in the amortized cost of the instrument are recognized in the income statement, while those resulting from other changes in the carrying amount, except impairment losses, are recognized in other comprehensive income until derecognition or impairment.
| c) | CASH AND CASH EQUIVALENTS |
ITAÚ UNIBANCO HOLDING defines cash and cash equivalents as cash and current accounts in banks (included in the heading “Cash and deposits on demand” in the consolidated balance sheet), interbank deposits and securities purchased under agreements to resell that have original maturities of 90 days or less, as shown in Note 3.
| d) | CENTRAL BANK COMPULSORY DEPOSITS |
The Central Banks of the countries in which ITAÚ UNIBANCO HOLDING operates currently impose a number of compulsory deposit requirements on financial institutions. Such requirements are applied to a wide range of banking activities and operations, such as demand, savings and time deposits. In the case of Brazil, the acquisition and deposit of Brazilian federal government securities is also required.
Compulsory deposits are initially recognized at fair value and subsequently at amortized cost, using the effective interest rate method, as detailed in Note 2.4 (g) (VI).
ITAÚ UNIBANCO HOLDING recognizes its interbank deposits in the balance sheet initially at fair value and subsequently at amortized cost using the effective interest method as detailed in Note 2.4 (g) (VI).
| f) | SECURITIES PURCHASED UNDER AGREEMENTS TO RESELL AND SOLD UNDER REPURCHASE AGREEMENTS |
ITAÚ UNIBANCO HOLDING has purchased transactions with resale agreements (“resale agreements”), and sold transactions with repurchase agreements ("repurchase agreements") of financial assets. Resale and repurchase agreements are accounted for under “Securities purchased under agreements to resell” and “Securities sold under repurchase agreements”, respectively.
The amounts invested in resale agreement transactions and borrowed in repurchase agreement transactions are recognized initially in the balance sheet at the amount advanced or raised, and subsequently measured at amortized cost. The difference between the sale and repurchase prices is treated as interest and recognized over the life of the agreements using the effective interest rate method. Interest earned on resale agreement transactions and incurred in repurchase agreement transactions is recognized in “Interest and similar income” and “Interest and similar expense”, respectively.
The financial assets accepted as collateral in our resale agreements can be used by us, if provided for in the agreements, as collateral for our repurchase agreements or can be sold.
In Brazil, control over custody of financial assets is centralized and the ownership of investments under resale and repurchase agreements is temporarily transferred to the buyer. We strictly monitor the fair value of financial assets received as collateral under our resale agreements and adjust the collateral amount when appropriate.
Financial assets pledged as collateral to counterparties are also recognized in the consolidated financial statements. When the counterparty has the right to sell or repledge such instruments, they are presented in the balance sheet under the appropriate class of financial assets as “Pledged as collateral”.
| g) | FINANCIAL ASSETS AND LIABILITIES |
In accordance with IAS 39, all financial assets and liabilities, including derivative financial instruments, shall be recognized in the balance sheet and measured based on the category in which the instrument is classified.
Financial assets and liabilities can be classified into the following categories:
| · | Financial assets and liabilities at fair value through profit or loss – held for trading. |
| · | Financial assets and liabilities at fair value through profit or loss – designated at fair value. |
| · | Available-for-sale financial assets. |
| · | Held-to-maturity investments. |
| · | Financial liabilities at amortized cost. |
The classification depends on the purpose for which financial assets were acquired or financial liabilities were assumed. Management determines the classification of financial instruments at initial recognition.
ITAÚ UNIBANCO HOLDING classified financial instruments into classes that reflect the nature and characteristics of these financial instruments.
ITAÚ UNIBANCO HOLDING classifies as loan and receivables the following classes of balance sheet headings: Cash and deposits on demand, Central Bank compulsory deposits, Interbank deposits (Note 2.4 (e)), Securities purchased under agreement to resell (Note 2.4 (f)), Loan operations (Note 2.4 (g) (VI)) and Other financial assets (Note 2.4 (g) (IX)).
Regular purchases and sales of financial assets are recognized and derecognized, respectively, on the trade date.
Financial assets are derecognized when the rights to receive cash flows from the asset have expired or when ITAÚ UNIBANCO HOLDING has transferred substantially all risks and rewards of ownership, and such transfer qualifies for derecognition, according to the requirements of IAS 39. Therefore, if the risks and rewards were not substantially transferred, ITAÚ UNIBANCO HOLDING evaluates the extent of control in order to determine whether the continuous involvement related to any retained control does not prevent derecognition. Financial liabilities are derecognized when discharged or extinguished.
Financial assets and liabilities are offset against each other and the net amount is reported in the balance sheet solely when there is a legally enforceable right to offset the recognized amounts and there is an intention to settle them on a net basis, or simultaneously realize the asset and settle the liability.
| I- | Financial assets and liabilities at fair value through profit or loss - held for trading |
These are assets and liabilities acquired or incurred principally for the purpose of selling them in the short term or when they are part of a portfolio of financial instruments that are managed together and for which there is evidence of a recent history of short-term profit taking. Derivatives are also classified as held for trading except for those designated and effective as hedging instruments. ITAÚ UNIBANCO HOLDING discloses derivatives in a separate line in the consolidated balance sheet (see item III below).
The financial assets and liabilities included in this category are initially and subsequently recognized at fair value. Transaction costs are directly recognized in the consolidated statement of income. Gains and losses arising from changes in fair value are directly included in the consolidated statement of income under “Net gain (loss) from financial assets and liabilities”. Interest income and expenses are recognized in “Interest and similar income” and “Interest and similar expense”, respectively.
| II- | Financial assets and liabilities at fair value through profit or loss – designated at fair value |
These are assets and liabilities designated at fair value through profit or loss upon initial recognition (fair value option). This designation cannot be subsequently changed. In accordance with IAS 39, the fair value option can only be applied if it reduces or eliminates an accounting mismatch when the financial instruments are part of a portfolio for which risk is managed and reported to Management based on its fair value or when these instruments consist of hosts and embedded derivatives that shall otherwise be separated.
The financial assets and liabilities included in this category are initially and subsequently recognized at fair value. Transaction costs are directly recognized in the consolidated statement of income. Gains and losses arising from changes in fair value are directly included in the consolidated statement of income under “Net gain (loss) from financial assets and liabilities”. Interest income and expenses are recognized in “Income and similar income” and “Interest and similar expense”, respectively.
ITAÚ UNIBANCO HOLDING designated certain assets at fair value through profit or loss upon their initial recognition, because they are reported to Management and their performance is evaluated daily based on their fair value.
Derivatives are initially recognized at fair value on the date a derivative contract is entered into and are subsequently remeasured at their fair value. All derivatives are recognized as assets when the fair value is positive, and as liabilities when negative.
Certain derivatives embedded in other financial instruments are treated as separate derivatives, when their economic characteristics and risks are not closely related to those of the host contract and the host contract is not recognized at fair value through profit or loss. These embedded derivatives are accounted for separately at fair value, with changes in fair value recognized in the consolidated statement of income in “Net gain (loss) from financial assets and liabilities – Financial assets and liabilities held for trading and derivatives” - except when ITAÚ UNIBANCO HOLDING designates these hybrid contracts as a whole as fair value through profit or loss.
Derivatives can be designated and qualify as hedging instruments under hedge accounting and, in the event they qualify, depending upon the nature of the hedged item, the method for recognizing gains or losses from changes in fair value will be different. These derivatives, which are used to hedge exposures to risk or modify the characteristics of financial assets and liabilities, and that meet IAS 39 criteria, are recognized as hedge accounting.
In accordance with IAS 39, to qualify for hedge accounting, all of the following conditions should be met:
| · | at the inception of the hedge there is formal designation and documentation of the hedging relationship and the entity’s risk management objective and strategy for undertaking the hedge. |
| · | the hedge is expected to be highly effective in offsetting changes in fair value or cash flows attributable to the hedged risk, consistent with the originally documented risk management strategy for that particular hedging relationship. |
| · | for a cash flow hedge, a forecast transaction that is the subject of the hedge must be highly probable and must present an exposure to variations in cash flows that could ultimately affect profit or loss. |
| · | the effectiveness of the hedge can be reliably measured, i.e. the fair value or cash flows of the hedged item that are attributable to the hedged risk and the fair value of the hedging instrument can be reliably measured. |
| · | the hedge is assessed on an ongoing basis and it is determined that the hedge has in fact been highly effective throughout the periods for which the hedge was designated. |
IAS 39 defines three hedge accounting categories: fair value hedge, cash flow hedge and hedge of net investment in a foreign operations.
ITAÚ UNIBANCO HOLDING uses derivatives as hedging instruments under cash flow hedge strategies and hedge of net investments, as detailed in Note 8.
Cash flow hedge
For derivatives that are designated and qualify as cash flow hedges, the effective portion of derivative gains or losses are recognized in “Other Comprehensive Income – Gains and Losses – Cash Flow Hedge”, and reclassified to income in the same period or periods in which the hedged transaction affects income. The portion of gain or loss on derivatives that represents the ineffective portion or the hedge components excluded from the assessment of effectiveness is recognized immediately in income. Amounts originally recorded in other comprehensive income and subsequently reclassified to income are recorded in the corresponding income or expense lines in which the related hedged item is reported.
When a hedging instrument expires or is sold, or when a hedge no longer meets the criteria for hedge accounting and also when ITAÚ UNIBANCO HOLDING dedesignates a hedge, any cumulative gain or loss existing in other comprehensive income at the time remains in other comprehensive income and is recognized in income when the hedge item is ultimately reconized in the income statement. When a forecast transaction is no longer expected to occur, the cumulative gain or loss recognised in other comprehensive income is immediately transferred to the income statement.
Hedge of net investments in foreign operations
A hedge of a net investment in a foreign operation, including a hedge of a monetary item that is accounted for as part of the net investment, is accounted for in a manner similar to a cash flow hedge:
a) the portion of gain or loss on the hedge instrument determined as effective is recognized in other comprehensive income.
b) the ineffective portion is recognized in the statement of income.
Gains or losses on the hedging instrument related to the effective portion of the hedge which is recognized in other comprehensive income is reclassified to the income statement upon the disposal of the investment in the foreign operation.
| IV - | Available-for-sale financial assets |
In accordance with IAS 39, financial assets are classified as available for sale when, in Management’s judgment, they can be sold in response to or in anticipation of changes in market conditions, and were not classified into the categories of financial assets at fair value through profit or loss, loans and receivables or held to maturity.
Available-for-sale financial assets are initially and subsequently recognized in the consolidated balance sheet at fair value, plus transaction costs. Unrealized gains and losses (except losses for impairment, foreign exchange differences, dividends and interest income) are recognized, net of applicable taxes, in other comprehensive income. Interest, including the amortization of premiums and discounts, are recognized in the consolidated statement of income under “Interest and similar income”. The average cost is used to determine the realized gains and losses on disposal of available-for-sale financial assets, which are recorded in the consolidated statement of income under “Net gain (loss) from financial assets and liabilities". Dividends on available-for-sale assets are recognized in the consolidated statement of income as “Dividend Income” when ITAÚ UNIBANCO HOLDING is entitled to receive such dividends, and inflows of economic benefits.
ITAÚ UNIBANCO HOLDING assesses at each balance sheet date whether there is objective evidence that a financial asset or a group of financial assets is impaired. In the case of equity securities classified as available for sale, a significant or prolonged decline in the fair value of the security below its cost is evidence of an impairment, resulting in the recognition of an impairment loss. If any impairment evidence exists for available-for-sale financial assets, the cumulative loss, measured as the difference between the acquisition cost and the current fair value, less any impairment loss on that financial asset previously recognized in income, is recognized in the consolidated statement of income as a reclassification adjustment from other comprehensive income.
Impairment losses recognized in the consolidated statement of income on equity instruments are not reversed through the statement of income. However, if in a subsequent period the fair value of a debt instrument classified as an available-for-sale financial asset increases and such increase can be objectively related to an event that occurred after the loss recognition, such loss is reversed through the statement of income.
| V- | Held-to-maturity financial assets |
In accordance with IAS 39, the financial assets classified into the held-to-maturity category are non-derivative financial assets that Management has the positive intention and ability to hold to maturity.
These assets are initially recognized at fair value, plus transaction costs, and subsequently measured at amortized cost, using the effective interest rate method (as detailed in item VI below). Interest income, including the amortization of premiums and discounts, is recognized in the consolidated statement of income under “Interest and similar income”.
When there is impairment of held-to-maturity financial assets, the loss is recorded as a reduction in the carrying amount through the use of an allowance account and recognized in the consolidated statement of income. If, in a subsequent period, the amount of the impairment loss decreases and the decrease can be related objectively to an event occurring after the loss was recognized, the previously recognized loss is reversed. The reversal amount is also recognized in the consolidated statement of income.
Loan operations are initially recognized at fair value, plus transaction costs and are subsequently measured at amortized cost using the effective interest rate method.
The effective interest rate approach is a method of calculating the amortized cost of a financial asset or liability and of allocating the interest income or expense over the relevant period. The effective interest rate is the discount rate that is applied to future payments or receipts through the expected life of the financial instrument that results in an amount equal to the net carrying amount of the financial asset or liability. When calculating the effective interest rate, ITAÚ UNIBANCO HOLDING estimates cash flows considering all contractual terms of the financial instrument, but does not consider future credit losses. The calculation includes all commissions paid or received between parties to the contract, transaction costs, and all other premiums or discounts.
A loan operation is classified as on nonaccrual status if the payment of principal or interest has been in default for 60 days or more. When a loan is placed on nonaccrual status, the accrual of interest of the loan is discontinued.
When a financial asset or group of similar financial assets is impaired and its carrying amount is reduced through an allowance for loan losses, the subsequent interest income is recognized on the reduced carrying amount using the interest rate used to discount the future cash flows for purposes of measuring the allowance for loan losses.
The Individuals portfolio consists primarily of vehicle financing to individuals, credit card, personal loans (including mainly consumer finance and overdrafts) and residential mortgage loans. The Corporate portfolio includes loans made to large corporate clients. The Small/ Medium Businesses Portfolio corresponds to loans to a variety of customers from small to medium-sized companies. The Foreign Loans Latin America is substantially comprised of loans granted to individuals in Argentina, Chile, Paraguay and Uruguay.
At a corporate level, ITAÚ UNIBANCO HOLDING has two groups (independent from the business areas): the credit risk group and the finance group, which are responsible for defining the methodologies used to measure the allowance for loan losses and for performing the corresponding calculations on a recurring basis.
The credit risk group and the finance group, at the corporate level, monitor the trends observed in the allowance for loan losses at the portfolio segment level, in addition to establishing an initial understanding of the variables that may trigger changes in the allowance for loan losses, the probability of default or the loss given default.
Once the trends have been identified and an initial assessment of the variables has been made at the corporate level, the business areas are responsible for further analyzing these observed trends at a detailed level and for each portfolio by understanding the underlying reasons for the trends observed and deciding whether changes are required in our credit policies.
| VII- | Lease operations (as lessor) |
When assets are subject to a finance lease, the present value of lease payments is recognized as a receivable in the consolidated balance sheet under “Loan Operations”.
Initial direct costs when incurred by ITAÚ UNIBANCO HOLDING are included in the initial measurement of the lease receivable, reducing the amount of income to be recognized over the lease period. Such initial costs usually include commissions and legal fees.
The recognition of interest income reflects a constant return rate on the net investment of ITAÚ UNIBANCO HOLDING and is recognized in the consolidated statement of income under “Interest and similar income”.
| VIII- | Allowance for loan losses |
General
ITAÚ UNIBANCO HOLDING periodically assesses whether there is any objective evidence that a receivable or group of receivables is impaired. A receivable or group of receivables is impaired and there is a need for recognizing an impairment loss if there is objective evidence of impairment as a result of one or more events that occurred after the initial recognition of the asset (a ‘loss event’) and that loss event (or events) has an impact on the estimated future cash flows that can be reliably estimated.
The allowance for loan losses is recognized for probable losses inherent in the portfolio at the balance sheet date. The determination of the level of the allowance rests upon various judgments and assumptions, including current economic conditions, loan portfolio composition, prior loan and lease loss experience and evaluation of credit risk related to individual loans. Our process for determining the allowance for loan losses includes Management's judgment and the use of estimates. The adequacy of the allowance is regularly analyzed by Management.
The criteria adopted by ITAÚ UNIBANCO HOLDING for determining whether there is objective evidence of impairment include the following:
| • | default in principal or interest payment. |
| • | financial difficulties of the debtor and other objective evidence that results in the deterioration of the financial position of the debtor (for example, debt-to-equity ratio, percentage of net sales or other indicators obtained through processes adopted to monitor credit, particularly for retail portfolios). |
| • | breach of loan clauses or terms. |
| • | entering into bankruptcy. |
| • | loss of competitive position of the debtor. |
The estimated period between the loss event and its identification is defined by Management for each identified portfolio of similar receivables. The periods adopted by Management are of twelve months, considering that the observed period for homogenous receivables portfolios vary, depending upon the specific portfolio, between nine and twelve months. Management determined the period between the loss events and their identification for receivables individually tested for impairment is also twelve months.
Assessment
ITAÚ UNIBANCO HOLDING first assesses whether objective evidence of impairment exists for receivables that are individually significant, and individually or collectively for receivables that are not individually significant.
To determine the amount of the allowance for individually significant receivables with objective evidence of impairment, it is used methodologies that consider both the quality of the client and the nature of the transaction, including its collateral, to estimate the cash flows expected from these loans.
If no objective evidence of impairment exists for an individually assessed receivable, whether significant or not, the asset is included in a group of receivables with similar credit risk characteristics and such group is collectively assessed for impairment. Receivables that are individually assessed for impairment and for which an impairment loss is recognized are not included in the collective assessment. The amount of loss is measured as the difference between the asset’s carrying amount and the present value of estimated future cash flows (excluding future credit losses that have not been incurred) discounted at the financial asset’s original effective interest rate.
For collectively assessed loans, the calculation of the present value of the estimated future cash flows for which there is a collateral reflects the historical performance of the foreclosure and recovery of fair value, considering the cash flows that may arise from foreclosure less costs for obtaining and selling that collateral.
For the purpose of a collective evaluation of impairment, receivables are grouped on the basis of similar credit risk characteristics. The characteristics are relevant to the estimation of future cash flows for such receivables by being indicative of the debtors’ ability to pay all amounts due, according to the contractual terms of the receivables being evaluated. Future cash flows in a group of receivables that are collectively evaluated for purposes of identifying the need for recognizing impairment are estimated on the basis of the contractual cash flows of the group of receivables and the historical loss experience for receivables with similar credit risk characteristics. The historical loss experience is adjusted on the basis of current observable data to reflect the effects of current conditions that did not affect the period on which the historical loss experience is based and to remove the effects of conditions in the historical period that do not exist currently.
For individually significant receivables with no objective evidence of impairment, these loans are classified into certain rating categories based on several qualitative and quantitative factors applied through internally developed models. Considering the size and the different risk characteristics of each contract, the rating category determined according to internal models may be reviewed and modified by our Corporate Credit Committee, the members of which are executives and experts in corporate credit risk. We estimate inherent losses for each rating category considering an internally developed approach for low-default portfolios, that uses our historical experience for building internal models, that are used both to estimate the PD (probability of default) and to estimate the LGD (Loss given default).
To determine the amount of the allowance for individually non-significant items loans are segregated into classes considering the underlying risks and characteristics of each group. The allowance for loan losses is determined for each of those classes through a process that considers historical delinquency and loan loss experience over the most recent years.
Measurement
The methodology used to measure the allowance for loan losses was developed internally by the credit risk and finance areas at the corporate level. In those areas and considering the different characteristics of the portfolios, different areas are responsible for defining the methodology to measure the allowance for each of the portfolio segments: Corporate (including loan operations with objective evidence of impairment and individually significant loan operations but with no objective evidence of impairment), Individuals, Small and Medium Businesses and Foreign Units Latin America. Each of the four portfolio segments responsible for defining the methodology to measure the allowance for loan losses is further divided into groups, including groups that develop the methodology and groups that validate the methodology. A centralized group in the credit risk area is responsible for measuring the allowance on a recurring basis following the methodologies developed and approved for each of the four segments.
This methodology is based on two components to determine the amount of the allowance: the probability of default by the client or counterparty (PD), and the potential and expected timing for recovery on defaulted credits (LGD) which are applied to the outstanding balance of the loan. Measurement and assessment of these risk components are part of the process for granting credit and for managing the portfolio. The estimated amounts of PD and LGD are measured based on statistical models that consider a significant number of variables which are different for each class and include, among others, income, equity, past loan experiences, level of indebtedness, economic sectors that affect collectability and other attributes of each counterparty and of the economic environment. These models are updated regularly for changes in economic and business conditions.
A model updating process is started when the modeling area identifies that it is not capturing significant effects of the changes in economic conditions, in the performance of the portfolio or when a change is made to the methodology for calculating the allowance for loan losses. When a change in the model is made, the model is validated through back-testing, and statistics methods are used to measure its performance through detailed analysis of its documentation, by describing step-by-step how the process is carried out. The models are validated by an area independent from the one developing it, by issuing a technical report on the assumptions used (integrity, consistency, and replicability of the bases) and on the mathematical methodology used. The technical report is subsequently submitted to CTAM (Model assessment technical committee), which is the highest level for approval of model reviews.
Considering the different characteristics of the loans in each of the four portfolio segments (Corporate (with no objective evidence of impairment), Individuals, Small and Medium Businesses and Foreign Units Latin America), different areas within the corporate credit risk area are responsible for developing and approving the methodologies for loans in each of those four portfolio segments. Management believes that the fact that different areas focus on each of the four portfolio segments results in increased knowledge, specialization and awareness of the teams as to the factors that are more relevant for each portfolio segment in measuring the loan losses. Also, considering such different characteristics and other factors, different inputs and information are used to estimate the PD and LGD as further detailed below:
| • | Corporate (with no objective evidence of impairment) - Factors considered and inputs used are mainly the history of the customer relationship with us, the results of analysis of the costumer’s financial statements and the information obtained through frequent contacts with its officers, aiming at understanding the strategy and the quality of its management. Additionally, industry and macroeconomic factors are also included in the analysis. All those factors (which are both quantitative and qualitative) are used as inputs to the internal model developed to determine the corresponding rating category. This approach is also applied to the corporate credit portfolio outside Brazil. |
| • | Individuals – Factors considered and inputs used are mainly the history of the customer relationship with us and information available through credit bureaus (negative information). |
| • | Small/Medium Businesses – Factors considered and inputs used include, in addition to the history of the customer relationship and credit bureau information about the customer’s revenues, industry expertise and information about its shareholders and officers, among others. |
| • | Foreign Units – Latin America - Considering the relative smaller size of this portfolio and its more recent nature, the models are simpler and use the past due status and an internal rating of the customer as the main factors. |
Reversal, Write-off and Renegotiation
If, in a subsequent period, the amount of the impairment loss decreases and the decrease is objectively related to an event occurring after the impairment was recognized (such as an improvement in the debtor’s credit rating), the previously recognized impairment is reversed. The amount of reversal is recognized in the consolidated statement of income under “Expense for allowance for loan losses”.
When a loan is uncollectible, it is written off in the balance sheet under Allowance for loan losses. Loans are written off 360 days after such loans being past due or 540 days of being past due in the case of loans with original maturities over 36 months.
Renegotiated loans are not considered to be in default. In subsequent periods, the asset is considered and disclosed as a non-performing loan, when the renegotiated terms are not met.
| IX- | Other financial assets |
ITAÚ UNIBANCO HOLDING presents these assets, which composition is detailed in Note 19 (a), in the balance sheet initially at fair value and subsequently at amortized cost using the effective interest method.
Interest income is recognized in the consolidated statement of income under “Interest and similar income”.
| X- | Financial liabilities at amortized cost |
The financial liabilities that are not classified as at fair value through profit or loss are classified into this category and initially recognized at fair value and subsequently measured at amortized cost using the effective interest rate method. Interest expense is presented in the consolidated statement of income under “Interest and similar expense”.
The following financial liabilities are presented in the Consolidated balance sheet and recognized at amortized cost:
| · | Deposits. (See Note 16); |
| · | Securities sold under repurchase agreements (as previously described in item (f) above. |
| · | Funds from interbank markets. |
| · | Funds from institutional markets. |
| · | Liabilities for capitalization plans. |
| · | Other financial liabilities. (See Note 19 (b)). |
| h) | INVESTMENTS IN UNCONSOLIDATED COMPANIES |
Unconsolidated companies (the term we use for associates under IAS 38) are those companies in which the investor has significant influence, but does not have control. Significant influence is usually presumed to exist when an interest in voting capital from 20% to 50% is held. Investments in these companies are initially recognized at cost of acquisition and subsequently accounted for on the equity method. Investments in unconsolidated companies include the goodwill identified upon acquisition, net of any cumulative impairment loss.
ITAÚ UNIBANCO HOLDING share in profits or losses of its unconsolidated companies after acquisition is recognized in the consolidated statement of income. Its share of the changes in the reserves of corresponding stockholders’ equity of its unconsolidated companies is recognized in its own reserves in stockholders’ equity. The cumulative changes after acquisition are adjusted against the carrying amount of the investment. When the ITAÚ UNIBANCO HOLDING share of losses of an unconsolidated company is equal or above its interest in the unconsolidated company, including any other receivables, ITAÚ UNIBANCO HOLDING does not recognize additional losses, unless it has incurred any obligations or made payments on behalf of the unconsolidated company.
Unrealized profits on transactions between ITAÚ UNIBANCO HOLDING and its unconsolidated companies are eliminated to the extent of the interest of ITAÚ UNIBANCO HOLDING. Unrealized losses are also eliminated, unless the transaction provides evidence of impairment of the transferred asset. The accounting policies of unconsolidated companies are consistent with the policies adopted by ITAÚ UNIBANCO HOLDING.
If the interest in the unconsolidated company decreases, but ITAÚ UNIBANCO HOLDING retains significant influence, only the proportional amount of the previously recognized amounts in other comprehensive income is reclassified to income, when appropriate.
Gains and losses from dilution arising from investments in unconsolidated companies are recognized in the consolidated statement of income.
| i) | LEASE COMMITMENTS (as lessee) |
As a lessee, ITAÚ UNIBANCO HOLDING has finance and operating lease agreements.
ITAÚ UNIBANCO HOLDING leases certain fixed assets. Leases of fixed assets in which ITAÚ UNIBANCO HOLDING substantially holds all risks and rewards incidental to the ownership are classified as finance leases. They are capitalized on the commencement date of the leases at the lower of the fair value of the asset and the present value of the lease future minimum payments.
Each lease installment is allocated part to the liability and part to financial charges, so that a constant rate is obtained for the outstanding debt balance. The corresponding obligations, net of future financial charges, are included in “Other financial liabilities”. The interest expense is recognized in the consolidated statement of income over the lease term, to produce a constant periodic rate of interest on the remaining balance of the liability for each period. Fixed assets acquired through finance lease are depreciated over their useful lives.
Expenses of operating leases are recognized in the consolidated statement of income, on a straight-line basis, over the period of the lease.
When an operating lease is terminated before the end of the lease term, any payment to be made to the lessor as a penalty is recognized as an expense in the period the termination occurs.
In accordance with IAS 16 – “Property, Plant and Equipment”, fixed assets are recognized at the cost of acquisition less accumulated depreciation, calculated using the straight-line method and rates based on the estimated useful lives of these assets. Such rates are presented in Note 14.
The residual values and useful lives of assets are reviewed and adjusted, if appropriate, at the end of each year.
ITAÚ UNIBANCO HOLDING reviews its assets in order to identify whether any indications of impairment exist. If such indications are identified, fixed assets are tested for impairment. In accordance with IAS 36 – “Impairment of assets”, impairment losses are recognized for the difference between the carrying and recoverable amount of an asset (or group of assets), in the consolidated statement of income. The recoverable amount of an asset is defined as the higher of its fair value less costs to sell and its value in use. For purposes of assessing impairment, assets are grouped at the lowest level for which independent cash flows can be identified (cash-generating units). The assessment may be made at an individual asset level when the fair value less the cost to sell may be determined reliably. In the period ended December 31, 2011, impairment losses related to fixed assets were recognized due to the results achieved being lower than the expected economic benefits by R$ 15. No impairment losses, on fixed assets were recognized at December 31, 2010 or January 1, 2010.
Gains and losses on disposals of fixed assets are recognized in the consolidated statement of income under “Other income” or “General and administrative expenses”.
In accordance with IFRS 3 (R) - "Business Combinations", goodwill may arise on an acquisition and represents the excess of the consideration transferred plus non-controlling interest over the net fair value of the net identifiable assets, liabilities and contingent liabilities of the acquiree. Goodwill is not amortized, but its recoverable amount is tested for impairment annually or when there is any indication of impairment, using an approach that involves the identification of cash-generating units and estimates of fair value less cost to sell and/or value in use.
As defined in IAS 36, a cash-generating unit is the lowest identifiable group of assets that generates cash inflows that are independent of the cash inflows from other assets or groups of assets. Goodwill is allocated to cash-generating units for the purpose of impairment testing. The allocation is made to those cash-generating units that are expected to benefit from the business combination.
IAS 36 determines that an impairment loss shall be recognized for a cash-generating unit if the recoverable amount of the cash-generating unit is less than its carrying amount. The loss shall be allocated first to reduce the carrying amount of any goodwill allocated to the cash-generating unit, and then to the other assets of the unit on a pro rata basis applied to the carrying amount of each asset. The loss cannot reduce the carrying amount of an asset below the higher of its fair value less costs to sell and its value in use. The impairment loss of goodwill cannot be reversed. At December 31, 2011 and 2010 and January 1, 2010, we did not have any goodwill balance in our consolidated financial statements.
Goodwill of unconsolidated companies is reported as part of the investments in the consolidated balance sheet under “Investments in unconsolidated companies, and the impairment test is carried out in relation to the total balance of the investments (including goodwill).
Intangible assets are non-physical assets, including software and other assets, and are initially recognized at cost. Intangible assets are recognized when they arise from legal or contractual rights, their costs can be reliably measured, and in the case of intangible assets not arising from separate acquisitions or business combinations, it is probable that future economic benefits may arise from their use. The balance of intangible assets refers to acquired assets or those internally generated.
Intangible assets may have finite or indefinite useful lives. Intangible assets with finite useful lives are amortized using the straight-line method over their estimated useful lives. Intangible assets with indefinite useful lives are not amortized, but are tested periodically in order to identify any impairment.
ITAÚ UNIBANCO HOLDING semiannually assesses its intangible assets in order to identify whether any indications of impairment exist, as well as any possible reversal of previous impairment losses. If such indications are found, intangible assets are tested for impairment. In accordance with IAS 36, impairment losses are recognized as the difference between the carrying and the recoverable amount of an asset (or group of assets), and recognized in the consolidated statement of income. The recoverable amount of an asset is defined as the higher of its fair value less costs to sell and its value in use. For purposes of assessing an impairment, assets are grouped into the minimum level for which cash flows can be identified. The assessment can be made at an individual asset level when the fair value less its cost to sell can be determined reliably.
In the year ended December 31, 2011, ITAÚ UNIBANCO HOLDING recognized impairment losses of R$ 30 (R$ 20 at December 31, 2010) related to acquisition of rights to credit payroll and rights for the promotion and offer of financial products and services, caused by rescissions of agreements and results below those projected. As provided for in IAS 38, ITAÚ UNIBANCO HOLDING chose the cost model to measure its intangible assets after initial recognition.
Assets held for sale are recognized in the consolidated balance sheet when they are actually repossessed or there is an intention to sell. These assets are initially recorded at their fair value.
Subsequent reductions in the carrying value of the asset are recorded as a loss due to decreases in fair value less costs to sell, in the consolidated statement of income under General and administrative expenses. In the case of recovery of the fair value less cost to sell, the recognized losses can be reversed.
| n) | INCOME TAX AND SOCIAL CONTRIBUTION |
There are two components of the provision for income tax and social contribution: current and deferred.
Current income tax expense approximates taxes to be paid or recovered for the applicable period. Current assets and liabilities are recorded in the balance sheet under Tax assets – Income tax and social contribution credits and Tax liabilities – current, respectively.
Deferred income tax and social contribution represented by deferred tax assets and liabilities are calculated based on the differences between the tax bases of assets and liabilities and the amounts reported in the financial statements at each year end. The tax benefit of tax loss carryforwards is recognized as an asset. Deferred tax assets are only recognized when it is probable that future taxable income will be available for offset. Deferred tax assets and liabilities are recognized in the balance sheet under Tax assets – income tax and social contribution – deferred and Tax liabilities – income tax and social contribution - deferred, respectively.
Income tax and social contribution expense is recognized in the consolidated statement of income under Income tax and social contribution, except when it refers to items directly recognized in other comprehensive income, such as: deferred tax on fair value measurement of available-for-sale financial assets, and tax on cash flow hedges. Deferred taxes of such items are initially recognized in other comprehensive income and subsequently recognized in Income together with the recognition of the gain/loss originally deferred.
Changes in tax legislation and rates are recognized in the consolidated statement of income under Income tax and social contribution in the period in which they are enacted. Interest and fines are recognized in the consolidated statement of income under General and administrative expenses. Income tax and social contribution are calculated at the rates shown below, considering the respective taxable bases, based on the current legislation related to each tax, which, in the case of the operations in Brazil, are for all the reporting periods as follows:
| | | 12/31/2011 | |
| Income tax | | | 15 | % |
| Additional income tax | | | 10 | % |
| Social contribution | | | 15 | % |
To determine the proper level of provisions for taxes to be maintained for uncertain tax positions, a two-phased approach was applied, according to which a tax benefit is recognized if it is more probable than not that a position can be sustained. The benefit amount is then measured to be the highest tax benefit which probability of realization is over 50%. Interest and fines on income tax and social contribution are treated as General and administrative expenses.
| o) | INSURANCE CONTRACTS AND PRIVATE PENSION |
IFRS 4 – “Insurance contracts” defines insurance contracts as contracts under which the issuer accepts a significant insurance risk from the counterparty, by agreeing to compensate it if a specified uncertain future event adversely affects it.
ITAÚ UNIBANCO HOLDING, through its subsidiaries, issues contracts to clients that have insurance risks, financial risks or a combination of both. A contract under which ITAÚ UNIBANCO HOLDING accepts significant insurance risks from its clients and agrees to compensate them upon the occurrence of a specified uncertain future event is classified as an insurance contract. The insurance contract may also transfer a financial risk, but is accounted for as an insurance contract, should the insurance risk be significant.
Investment contracts are those that transfer a significant financial risk. Financial risk is the risk of a future change in one or more variables, such as interest rate, price of financial assets, price of commodities, foreign exchange rate, index of prices or rates, credit risk rating, credit index or other variable.
Investment contracts may be reclassified as insurance contracts after their initial classification should the insurance risk become significant.
Investment contracts with discretionary participation features are financial instruments, but they are treated as insurance contracts, as established by IFRS 4.
Once the contract is classified as an insurance contract, it remains as such until the end of its life, even if the insurance risk is significantly reduced during such period, unless all rights and obligations are extinguished or expire.
Note 29 presents a detailed description of all products classified as insurance contracts.
Private pension plans
In accordance with IFRS 4, an insurance contract is one that exposes its issuer to a significant insurance risk. An insurance risk is significant only if the insured event could cause an issuer to pay significant additional benefits in any scenario, except for those that do not have commercial substance. Additional benefits refer to amounts that exceed those that would be payable if no insured event occurred.
Contracts that contemplate retirement benefits after an accumulation period (known as PGBL, VGBL and FGB) assure, at the commencement date of the contract, the basis for calculating the retirement benefit (mortality table and minimum interest). The contracts specify the annuity fees, and, therefore, the contract transfers the insurance risk to the issuer at the commencement date, and they are classified as insurance contracts.
The payment of additional benefits is considered significant in all scenarios with commercial substance, since survival of the beneficiary may exceed the survival estimates in the actuarial table used to define the benefit agreed in the contract. The option of conversion into a fixed amount to be paid for the life of the beneficiary is not available and all contracts give the right to the counterparty to choose a life annuity benefit.
Insurance premiums
Insurance premiums are recognized over the period of the contracts in proportion to the amount of the insurance coverage. Insurance premiums are recognized as income in the consolidated statement of income.
If there is evidence of impairment losses with respect to receivables for insurance premiums, ITAÚ UNIBANCO HOLDING recognizes a provision, sufficient to cover this loss, based on the risk analysis of realization of insurance premiums receivable with installments overdue for over 60 days.
Reinsurance
Reinsurance premiums are recognized in income over the same period in which the related insurance premiums are recognized in the consolidated statement of income.
In the ordinary course of business, ITAÚ UNIBANCO HOLDING reinsures a portion of the risks underwritten, particularly property and casualty risks that exceed the maximum limits of responsibility that we determine to be appropriate for each segment and product (after a study which considers size, experience, specificities and the necessary capital to support these limits). These reinsurance agreements allow the recovery of a portion of the losses from the reinsurer, although they do not release the insurer from the main obligation as direct insurer of the risks contemplated in the reinsurance.
Reinsurance assets are valued according to consistent basis of risk assignment contracts, and in the event of losses effectively paid these are revalued after 365 days elapse in relation to the possibility of non-recovery of such losses. In the event of doubt, these assets are reduced based on the provision recognized for credit risk associated to reinsurance.
Acquisition costs
Acquisition costs include direct and indirect costs related to the origination of insurance. These costs, except for the commissions paid to brokers and others, are expensed directly in income as incurred. Commissions, on the other hand, are deferred and expensed in proportion to the recognition of the premium revenue, i.e. over the period of the corresponding insurance contract.
Liabilities
Reserves for claims are established based on historical experience, claims in process of payment, estimated amounts of claims incurred but not yet reported and other factors relevant to the required reserve levels. A liability for premium deficiencies is recognized if the estimated amount of premium deficiencies exceeds deferred acquisition costs. Expenses related to recognition of liabilities for insurance contracts are recognized in the consolidated statement of income under, “Change in reserves for insurance and private pension”.
Embedded derivatives
ITAÚ UNIBANCO HOLDING analyzes all contracts in order to check for any embedded derivatives. In the cases where these derivatives meet the definition of insurance contracts on their own, we do not separate them. We have not identified any embedded derivatives in our insurance contracts, which may be separated or measured at fair value in accordance with IFRS 4 requirements.
Liability adequacy test
IFRS 4 requires that insurance companies analyze the adequacy of their insurance liabilities in each reporting period through a minimum adequacy test. The liability adequacy test for IFRS is conducted by adopting the current actuarial assumptions for future cash flows of all insurance contracts in force on the balance sheet date.
As a result of this test, if the assessment shows that the carrying amount of the insurance liabilities (less related deferred acquisition costs of contracts and related intangible assets) is lower than the value of the estimated future cash flows, any identified deficiency (after recording the deferred acquisition costs and intangible assets related to deficit portfolios, in compliance with the accounting policy) will have to be recognized in income for the period. In order to perform the adequacy test, insurance contracts are grouped in portfolios that are broadly subject to similar risks and, for which risks are jointly managed as a single portfolio.
The assumptions used to conduct the liability adequacy test are detailed in Note 29.
ITAÚ UNIBANCO HOLDING sells capitalization certificates, in which clients deposit specific amounts, depending on the plan, which are redeemable at the original amount plus interest. Clients enter, during the term of the plan, into raffles of cash prizes.
While for regulatory purposes in Brazil they are regulated by the insurance regulator, these plans do not meet the definition of an insurance contract under IFRS 4, and therefore are classified as a financial liability at amortized cost under IAS 39.
Revenue from capitalization plans is recognized during the period of the contract and measured as the difference between the amount deposited by the client and the amount that ITAÚ UNIBANCO HOLDING has to reimburse.
ITAÚ UNIBANCO HOLDING is required to make contributions to government social security and labor indemnity plans, in Brazil and in other countries where it operates, which are expensed in the consolidated statement of income as an integral part of “General and administrative expenses”, when incurred. These contributions totaled R$ 1,429 for the year ended December 31, 2011 (R$ 1,415 for the year ended December 31, 2010).
Additionally, ITAÚ UNIBANCO HOLDING also sponsors defined benefit plans and defined contribution plans, accounted for pursuant to IAS 19 – “Employee benefits”.
Pension plans - defined benefit plans
The liability (or asset, as the case may be) recognized in the consolidated balance sheet with respect to defined benefit plans corresponds to the present value of the defined benefit obligations on the balance sheet date less the fair value of the plan assets. The defined benefit obligation is calculated annually by an independent actuarial company using the projected unit credit method. The present value of the defined benefit obligation is determined by discounting the estimated amount of future cash flows of benefit payments based on the Brazilian government securities denominated in reais and with maturity periods similar to the term of the pension plan liabilities.
Actuarial gains and losses are fully recognized in income in the period in which they arise under “General and administrative expenses – Retirement plans and post-employment benefits”.
The following amounts are recognized in the consolidated statement of income:
| · | The expected return on plan assets, and gains or losses corresponding to the difference between expected and effective. |
| · | Actuarial gains and losses that are defined as those that result from differences between the previous actuarial assumptions and what has actually occurred, and include the effects of changes in actuarial assumptions. |
| · | Current service cost – defined as the increase in the present value of obligations resulting from employee service in the current period. |
| · | Past service cost –representing the change in the present value of defined benefit obligations caused by employee service in prior periods,and that affect the current period. |
| · | Interest cost - defined as the increase during the year in the present value of obligations which arises from the passage of time. |
In accordance with IAS 19, a curtailment is an event that significantly decreases the years of future service by current employees or that eliminates or reduces, for a significant number of employees, the qualification for benefits for all or part of future services. Settlement is a transaction in which an irrevocable action relieves the employer (or plan) of the primary responsibility for a pension or post-retirement benefit, and therefore eliminates significant risks related to the obligation and to the related assets.
A gain or loss from the curtailment of a plan is the sum of two elements: (a) the recognition in income of deferred past service cost associated with the years of service that no longer will have to be provided; and (b) the change in the defined benefit obligation. If the curtailment causes the reduction of the defined benefit obligation, the result will be a curtailment gain. If the curtailment causes the increase of the defined benefit obligation, the result will be a curtailment loss.
Upon a settlement, a gain or loss will be recognized.
Pension plans - defined contribution
For defined contribution plans, contributions to plans made by ITAÚ UNIBANCO HOLDING are recognized as an expense when due.
Other post-employment benefit obligations
Certain companies merged into ITAÚ UNIBANCO HOLDING over the past few years were sponsors of post-employment healthcare benefit plans, and ITAÚ UNIBANCO HOLDING is committed as per the acquisition contracts to maintain such benefits for specific periods. Such benefits are also accounted for in accordance with IAS 19, in a manner similar to defined benefit plans.
| r) | STOCK-BASED COMPENSATION |
Stock based compensation is accounted for in accordance with IFRS 2 - “Share-based payment” which requires the entity to measure the value of equity instruments granted, based on their fair value at the option grant date. This cost is recognized during the vesting period of the right to exercise the instruments.
The total amount to be expensed is determined by reference to the fair value of the options granted excluding the impact of any service and non-market performance vesting conditions (notably remaining an employee of the entity over a specified time period). The fulfillment of non-market vesting conditions is included in the assumptions about the number of options that are expected to be exercised. At the end of each period, ITAÚ UNIBANCO HOLDING revises its estimates for the number of options that are expected to be exercised based on non-market vesting conditions. It recognizes the impact of the revision of the original estimates, if any, in the consolidated statement of income, with a corresponding adjustment to stockholders’ equity.
When the options are exercised, the ITAÚ UNIBANCO HOLDING treasury shares are generally delivered to the beneficiaries.
The fair value of stock options is estimated by using option pricing models that take into account the exercise price of the option, the current stock price, the risk-free interest rate, the expected volatility of the stock price and the life of the option.
All stock-based compensation plans established by ITAÚ UNIBANCO HOLDING correspond to plans that can be settled exclusively through the delivery of shares.
In accordance with IAS 39, the issuer of a financial guarantee contract has an obligation and should recognize it initially at its fair value. Subsequently, this obligation should be measured at: (i) the amount initially recognized less accumulated amortization and; (ii) the amount determined pursuant to IAS 37 – “Provisions, contingent liabilities and contingent assets”, whichever is higher.
ITAÚ UNIBANCO HOLDING recognizes the fair value of the guarantees issued in the consolidated balance sheet under “Other liabilities”. Fair value is generally represented by the fee charged to the client for issuing the guarantee. This amount at the issuance date is amortized over the life of the guarantee issued and recognized in the consolidated statement of income under “Banking service fees”.
After issuance, if based on the best estimate we conclude that the occurrence of a loss regarding a guarantee issued is probable, and if the loss amount is higher than the initial fair value less cumulative amortization of the guarantee, a provision is recognized for such amount.
| t) | PROVISIONS, CONTINGENCIES ASSETS AND CONTINGENT LIABILITIES |
These are assessed, recognized and disclosed in accordance with IAS 37. Contingent assets and contingent liabilities are rights and obligations arising from past events for which materialization depends on future events.
Contingent assets are not recognized in the consolidated financial statements, except when the Management of ITAÚ UNIBANCO HOLDING understands that realization is virtually certain which generally corresponds to lawsuits with favorable rulings in final and unappealable judgments, withdrawal from lawsuits as a result of a payment in settlement or as a result of an agreement to offsett against an existing liability.
Contingent liabilities mainly arise from administrative proceedings and lawsuits, inherent in the ordinary course of business, filed by third parties, former employees and governmental bodies, in connection with civil, labor, and tax and social security claims.
These contingencies are evaluated based on Management’s best estimates, taking into account the opinion of legal counsel when there is a likelihood that financial resources are required to settle the obligations and the amounts can be estimated with reasonable certainty.
Contingent losses are classified as:
| · | Probable: in which case liabilities are recognized in the consolidated balance sheet under “Provisions”. |
| · | Possible: in which case they are disclosed in the financial statements but no provision is recorded. |
| · | Remote: which require neither a provision nor disclosure. |
Contingent liabilities recorded under “Provisions” and those disclosed as possible are measured using best estimates through the use of models and criteria which allow their appropriate measurement even if there is uncertainty as to their ultimate timing and amount, and the criteria are detailed in Note 31.
The amount of court escrow deposits is updated in accordance with current legislation.
Contingent liabilities guaranteed by indemnity clauses provided by third parties, such as in business combinations carried out before the transition date to IFRS, are recognized when a claim is asserted, and a receivable is recognized simultaneously subject to its collectability. For business combinations carried out after the transition date, indemnification assets are recognized at the same time and measured on the same basis as the indemnified item, subject to collectability or contractual limitations on the indemnified amount.
Common and preferred shares, which are substantially common shares but without voting rights are classified in stockholders’ equity. The additional costs directly attributable to the issue of new shares are included in Stockholders’ Equity as a deduction from the proceeds, net of taxes.
Common and preferred shares repurchased are recorded in stockholders’ equity under “Treasury shares” at their average purchase price.
Shares that are subsequently sold, such as those sold to grantees under our stock option plans, are recorded as a reduction in treasury shares, measured at the average price of treasury stock held at such date.
The difference between the sale price and the average price of the treasury shares is recorded as a reduction or increase in “Additional paid-in capital”. The cancellation of treasury shares is recorded as a reduction in treasury shares against “Appropriated reserves”, at the average price of treasury shares at the cancellation date.
| x) | DIVIDENDS AND INTEREST ON CAPITAL |
Pursuant to the Company's bylaws, stockholders are entitled to a mandatory minimum dividend of 25% of net income for the year as determined in accordance with the corporate law. Minimum dividend amounts established in the bylaws are recorded as liabilities at the end of each year. Any other amount above the mandatory minimum dividend is accounted for as a liability when approved by the stockholders at a Stockholder’s Meeting. Since January 1, 1996, Brazilian companies have been permitted to attribute a tax-deductible nominal interest rate charge on net equity (called interest on capital).
Interest on capital is treated for accounting purposes as a dividend, and it is presented as a reduction of stockholders' equity in the consolidated financial statements. The related tax benefit is recorded in the consolidated statement of income.
Dividends have been and continue to be calculated and paid based on the financial statements prepared under BRGAAP and not based on these IFRS financial statements.
Earnings per share are computed by dividing net income attributable to the owners of ITAÚ UNIBANCO HOLDING by the weighted average number of common and preferred shares outstanding for each reporting year. Weighted average shares are computed based on the periods for which the shares were outstanding.
Earnings per share are presented based on the two types of shares issued by ITAÚ UNIBANCO HOLDING. Both types, common and preferred, participate in dividends on substantially the same basis, except that preferred shares are entitled to a priority non-cumulative minimum annual dividend of R$ 0.022 per share. Earnings per share are computed based on the distributed earnings (dividends and interest on capital) and undistributed earnings of ITAÚ UNIBANCO HOLDING after giving effect to the preference indicated above, without regard to whether the earnings will ultimately be fully distributed. Earnings per share amounts have been determined as if all earnings were distributed and computed following the requirements of IAS 33 – “Earnings per share”.
ITAÚ UNIBANCO HOLDING grants stock-based compensation whose dilutive effect is reflected in diluted earnings per share, with the application of the treasury stock method. Under the treasury stock method, earnings per share are calculated as if shares under stock-based compensation plans had been issued and as if the assumed proceeds (funds to be received upon exercise of the stock options and the amount of compensation cost attributed to future services and not yet recognized) were used to purchase shares of ITAÚ UNIBANCO HOLDING.
ITAÚ UNIBANCO HOLDING provides a number of services to its clients, such as investment management, credit card services, investment banking services and certain commercial bank services.
Services related to current accounts are offered to clients either in the format of packages or individually. These revenues are recognized when such services are provided.
Revenue from certain services such as fees from funds management, performance, collection for retail clients, custody and those related to credit cards is recognized over the life of the related contracts on a straight-line basis.
The breakdown of the banking service fees is detailed in Note 23.
IFRS 8 – “Operating Segments” requires that operating segments are disclosed consistently with information provided to the chief operating decision maker, who is the person or group of persons that allocates resources to the segments and assesses their performance. ITAÚ UNIBANCO HOLDING considers that its Board of Directors is the chief operating decision maker.
ITAÚ UNIBANCO HOLDING has four reportable segments: (i) Commercial Bank; (ii) Itaú BBA; (iii) Consumer Credit; and (iv) Corporate and Treasury.
Segment information is presented in Note 33.
As mentioned in Note 2.1, the transition to IFRS was made in accordance with IFRS 1 and the transition date chosen was January 1, 2010. As a result, the accounting policies of ITAÚ UNIBANCO HOLDING for these consolidated financial statements were changed on January 1, 2010, for the purpose of complying with IFRS, from the accounting policies applied for BRGAAP purposes.
Changes in accounting policies arising from the transition to IFRS and the reconciliation of the effects of this transition are presented below. ITAÚ UNIBANCO HOLDING prepared its opening balance sheet on January 1, 2010 applying the accounting policies, standards and measurement bases described in Note 2.4, and applied the following exemptions and used all mandatory exceptions set forth in IFRS 1.
| a) | Summary of the IFRS 1 voluntary exemptions and mandatory exceptions applied by Management in the preparation of these consolidated financial statements |
| a.I) | Business combinations, past acquisition of investments in associates and scope of consolidation |
IFRS 1 permits that business combinations and acquisition of investments in associates that were recognized before the transition date or an earlier date are not restated, retrospectively, by applying IFRS 3 (R). This exemption permits companies that are first-time adopters to maintain the accounting treatment adopted in the prior accounting practices, BRGAAP in this case. ITAÚ UNIBANCO HOLDING applied this exemption up to August 1, 2009, and, accordingly, it applied IFRS 3 (R) or IAS 28, as appropriate, to account for business combinations or the acquisition of investments in associates after such date.
In accordance with the exemption allowed by IFRS 1, the accounting policies used for initial recognition and subsequent measurement of goodwill and intangible assets generated by the acquisitions prior to August 1, 2009 under BRGAAP were maintained. Under BRGAAP, goodwill was fully amortized at the time such acquisitions took place. Intangible assets arising from acquisitions prior to the transition date were not recognized under BRGAAP.
IFRS 1 also requires that if ITAÚ UNIBANCO HOLDING had not consolidated a subsidiary acquired under BRGAAP, the carrying amount of assets and liabilities of this acquired subsidiary would have to be adjusted in accordance with IFRS. However, in the case of ITAÚ UNIBANCO HOLDING, there were no significant subsidiaries that had not been consolidated in BRGAAP before the transition to IFRS.
| a.II) | Fair value as deemed cost |
In accordance with IFRS 1, an entity may, on the transition date to IFRS, measure a fixed asset at its fair value and this amount will be considered the deemed cost of this asset, from such date. ITAÚ UNIBANCO HOLDING did not apply this exemption of IFRS 1. The cost of fixed assets was determined based on the historical cost under BRGAAP and adjusted for inflation for the years when Brazil was considered hyperinflationary in accordance with IAS 29.
ITAÚ UNIBANCO HOLDING applied this IFRS 1 exemption, under which all actuarial gains and losses accrued to the transition date, related to defined benefit plans sponsored by ITAÚ UNIBANCO HOLDING and its subsidiaries, were recognized in retained earnings at the transition date.
| a.IV) | Cumulative differences on the translation of balance sheets of foreign subsidiaries and investments in unconsolidated companies |
ITAÚ UNIBANCO HOLDING applied this exemption by which all gains and losses from translation of subsidiaries and investments in unconsolidated companies on the transition date were set to zero. The effects of application of IAS 21 to the translation of these subsidiaries and investments in unconsolidated companies with a functional currency other than Brazilian real will be applied prospectively. These effects are recorded in other comprehensive income and accumulate in a separate reserve in equity only from the transition date.
| a.V) | Compound financial instruments |
IAS 32 – “Financial Instruments: Presentation” requires that the components of compound financial instruments, as defined by IAS 32, be separated and classified as debt instruments and equity instruments. This classification is made based on circumstances, economic substance and specific terms of these instruments on the date they are issued. IFRS 1 allows a company to not bifurcate these two components, if the debt component is no longer outstanding on the transition date. This exemption did not have any impact on ITAÚ UNIBANCO HOLDING.
| a.VI) | Assets and liabilities of subsidiaries, unconsolidated companies and joint ventures |
IFRS 1 recognizes that there may be situations in which the controlling entity of a group and its subsidiaries adopt IFRS on different dates. The IFRS 1 exemption permitted us to use the financial statements of the subsidiaries that made the transition to IFRS before January 1, 2010. On consolidation, the amounts in the IFRS financial statements of subsidiaries and unconsolidated companies of ITAÚ UNIBANCO HOLDING that had already applied IFRS before January 1, 2010, were used.
| a.VII) | Designation of financial instruments previously recognized |
IAS 39 permits an entity to designate financial instruments as financial assets or liabilities at fair value through profit or loss, or available-for-sale financial assets, on the date of acquisition or issue of the financial instrument. In accordance with this IFRS 1 exemption, the designation may be made on the transition date, even if the instrument has originally been designated in another category. ITAÚ UNIBANCO HOLDING did not apply this exemption permitted by IFRS 1 and it did not change the designation of financial assets existing on the transition date, keeping the designation existing under BRGAAP on January 1, 2010.
| a.VIII) | Share-based payment transactions |
IFRS 1 encourages, but does not require, that an entity applies IFRS 2 for employee benefits in the form of share-based payment that were granted before November 7, 2002 and also for benefits that were granted after November 7, 2002, but for which vesting conditions had been met before January 1, 2010. On the other hand, if Management decides to apply IFRS 2 retrospectively, it can only do so if the entity has already disclosed the fair value of the relevant share-based instruments, determined on the measurement dates. ITAÚ UNIBANCO HOLDING applied IFRS 2 for all share-based payments, since it has already disclosed the fair value of these instruments.
a.IX) Insurance contracts
IFRS 1 permits companies that issue insurance contracts to change certain insurance accounting policies on the transition date to IFRS, provided that some minimum procedures are followed. ITAÚ UNIBANCO HOLDING decided not to change its accounting policies for insurance contracts; however, it has applied the minimum requirements of IFRS 4, including the classification of contracts as insurance contracts or investment contracts (as defined by IAS 39 and IFRS 4) and the minimum liability adequacy tests for insurance contracts, as defined by IFRS 4, and further detailed in Note 2.4.(o).
| a.X) | Liabilities arising from decommissioning, restoration of assets and similar liabilities |
IFRIC 1 - “Changes in Existing Decommissioning, Restoration and Similar Liabilities” requires specific changes in these liabilities. An entity that applies IFRS for the first time does not need to meet these requirements for changes that occurred before the transition date to IFRS. This exemption did not have any impact on ITAÚ UNIBANCO HOLDING.
a.XI) Leases
An entity that applies IFRS for the first time may opt to apply the specific transition rules of IFRIC 4 - “Determining Whether an Arrangement Contains a Lease”, and it may determine if there is a lease agreement on the transition date to IFRS based on the facts and circumstances existing on the transition date. The application of IFRIC 4 did not have any impact on ITAÚ UNIBANCO HOLDING on the transition date to IFRS since no contracts that should be accounted for as lease agreements, pursuant to IFRIC 4, have been identified.
a.XII) Fair value measurement of financial assets and liabilities on the transition date
IFRS 1 determines that an entity should apply the specific requirements of IAS 39 for fair value measurement of financial assets and liabilities on the transition date to IFRS. IAS 39 requires that valuation techniques of financial assets and liabilities at fair value incorporate all factors that a market participant would consider in setting a price when using consistent and accepted economic methodologies for pricing such financial instruments. Additionally, IAS 39 establishes rules for situations in which an entity may recognize an initial gain or loss when purchasing a financial asset or liability ("day one profit or loss"). As a consequence of this requirement, IAS 39 requires that a gain or loss generated in the initial purchase or subsequent changes in the fair value of a financial instrument be recognized immediately only if the fair value calculation methodology included only data and quotations directly observable in the market on the fair value assessment date.
IFRS 1 requires that these criteria be applied on a mandatory and prospective basis to transactions with asset or liability financial instruments entered into after October 25, 2002 or prospectively for transactions entered into after January 1, 2004.
a.XIII) Borrowing costs
IFRS 1 permits an entity to apply IAS 23 for borrowing costs related to the qualifying assets for which the capitalization initial date is the same or subsequent to the transition (January 1, 2010), or designate a date prior to the transition date and apply IAS 23 to the borrowing costs related to qualifying assets for which the capitalization initial date is the same or subsequent to that date. ITAÚ UNIBANCO HOLDING did not apply this exemption.
a.XIV) Derecognition of financial assets and financial liabilities
IFRS 1 requires that an entity that applies IFRS for the first time applies the derecognition standards (asset derecognition, as defined by IAS 39) of financial assets and liabilities prospectively for transactions after January 1, 2004. Accordingly, should ITAÚ UNIBANCO HOLDING have derecognized, pursuant to BRGAAP, a non-derivative financial asset or liability resulting from a transaction before January 1, 2004, it shall not recognize this asset or liability on the transition to IFRS. Additionally, IFRS 1 permits the application of standards of derecognition of financial assets and liabilities retrospectively, from a date elected by the entity, provided that the information needed to apply such standards had already been obtained at the time of the transaction that gave rise to the derecognition. This exemption did not have any impact on ITAÚ UNIBANCO HOLDING as no significant financial asset or liability was derecognized under BRGAAP.
a.XV) Hedge accounting
IAS 39 requires the valuation of all derivative financial instruments at fair value, as well as the elimination of deferred gains or losses, recognized as assets or liabilities under BRGAAP prior to IFRS. Additionally, an entity should not apply hedge accounting (as defined by IAS 39) in its consolidated balance sheet at the transition date if the instrument did not qualify as a hedge in accordance with IAS 39. As a result of this requirement, hedge accounting was not applied for IFRS purposes on the transition date to certain hedge relationships that meet the criteria for hedge accounting in BRGAAP, but that do not meet all requirements of IAS 39 as of such date.
a.XVI) Estimates
IFRS 1 requires that the estimates used by management for IFRS purposes at the transition date to IFRSs are consistent with estimates made as of the same date under BRGAAP, unless there is evidence of errors in the preparation of the estimates in BRGAAP as compared to IFRS. ITAÚ UNIBANCO HOLDING considered that the estimates used for BRGAAP, except for the differences in the methodology for the calculation of the allowance for loan losses, as described in Note 2.3(a), are consistent with those used on the transition date to IFRS. No information regarding the estimates made in accordance with BRGAAP was obtained on a date subsequent to the transition date that should be accounted for under IAS 10.
a.XVII) Non-controlling interests
IFRS 1 requires that the entity that adopts IFRS for the first time applies certain requirements of IAS 27 prospectively from the transition date. However, these requirements did not have an impact on ITAÚ UNIBANCO HOLDING.
| b) | RECONCILIATION BETWEEN BRGAAP AND IFRS APPLICABLE TO THE STOCKHOLDERS' EQUITY OF ITAÚ UNIBANCO HOLDING AT JANUARY 1 AND DECEMBER 31, 2010 AND TO THE NET INCOME OF ITAÚ UNIBANCO HOLDING FROM JANUARY 1 TO DECEMBER 31, 2010 |
| | | | | 12/31/2010 | | | 01/01/2010 | | | 01/01 to
12/31/2010 | |
| | | Reference | | Stockholders’ equity | | | Income | |
| In accordance with BRGAAP (stockholders’ equity attributed to the owners of the parent company, excluding non-controlling interest) | | | | | 60,879 | | | | 50,683 | | | | 13,323 | |
| | | | | | | | | | | | | | | |
| Adjustments that affect stockholders’ equity between BR GAAP and IFRS | | | | | 4,996 | | | | 6,443 | | | | (1,615 | ) |
| Allowance for loan losses | | b.I | | | 2,025 | | | | 3,458 | | | | (1,434 | ) |
| Recognition of total deferred tax assets | | b.II | | | 1,631 | | | | 2,367 | | | | (660 | ) |
| Pension and health care plans | | b.III | | | - | | | | 1,410 | | | | - | |
| Adjustment to market value of shares | | b.IV | | | 1,162 | | | | 970 | | | | 14 | |
| Acquisition of interest in Porto Seguro Itaú Unibanco Participações S.A. | | b.V | | | 896 | | | | 936 | | | | (40 | ) |
| Provision for Itaú Unibanco merger expenses | | b.VI | | | - | | | | 844 | | | | (844 | ) |
| Translation of foreign subsidiaries and unconsolidated companies abroad | | b.VII | | | - | | | | - | | | | 275 | |
| Provision for dividends payable not yet declared | | b.VIII | | | 1,308 | | | | - | | | | - | |
| Effective interest rate | | b.IX | | | (819 | ) | | | (841 | ) | | | 22 | |
| Other adjustments | | b.X | | | 70 | | | | (95 | ) | | | 236 | |
| Income tax and social contribution on all IFRS adjustments | | b.XI | | | (1,277 | ) | | | (2,606 | ) | | | 816 | |
| In accordance with IFRS – attributable to controlling stockholders | | | | | 65,875 | | | | 57,126 | | | | 11,708 | |
| In accordance with IFRS – attributable to non-controlling interest | | | | | 1,677 | | | | 1,564 | | | | 786 | |
| In accordance with IFRS – attributable to controlling stockholders and non-controlling interest | | | | | 67,552 | | | | 58,690 | | | | 12,494 | |
| Adjustments that affect comprehensive income | | | | | | | | | | | | | | |
| Available-for-sale financial assets | | | | | | | | | | | | | 170 | |
| Cash flow hedge | | | | | | | | | | | | | (17 | ) |
| Foreign exchange variation on investments abroad | | | | | | | | | | | | | (274 | ) |
| Share of other comprehensive income of investments in unconsolidated companies | | | | | | | | | | | | | (166 | ) |
| Total | | | | | | | | | | | | | 12,207 | |
Adoption of IFRS has not changed ITAÚ UNIBANCO HOLDING’s actual cash flows since under BRGAAP we were already required to apply the Brazilian equivalent of IAS 7, and there are no significant differences in the statement of cash flows prepared under BRGAAP and that presented in these financial statements.
Summary of the main differences between BRGAAP and IFRS
Below is presented a description of the main accounting practices applicable to ITAÚ UNIBANCO HOLDING, which differ significantly between BRGAAP and IFRS and are presented in the reconciliations above:
| b.I) | Allowance for loan losses |
In BRGAAP, the allowance for loan losses is measured considering an analysis of the risk of non-realization of receivables, at an amount considered sufficient to cover expected losses, following the rules established by BACEN. Pursuant to these rules, the allowance is created from the date loans are granted, based on the client’s risk rating and on a periodic quality evaluation of clients and industries, and not only when default actually occurs. Under BRGAAP, the allowance cannot be less than the minimum required by the regulatory authorities, but an additional allowance can be recorded when the minimum allowance is not considered sufficient. At December 31, 2008, considering the economic scenario and the related uncertainties, the criteria for recognition of an allowance for loan losses additional to the required regulatory minimum allowance were revised, including an allowance for risks associated with a more pessimistic scenario. During 2009, there was an improvement in the economic situation, causing a reduction in the ratio of the allowance for loan losses to the loan portfolio. In 2010, a change in the criteria under BRGAAP was adopted which resulted in a reduction in the allowance for loan losses. The criteria were adopted considering new Basel III guidelines (not yet applicable), which require counter-cyclical effects should be considered.
IAS 39 determines that the entity should assess, on each reporting date, whether there is objective evidence that the loan operation or group of loan operations is impaired. A loan or group of loans is impaired if there is objective evidence of impairment as a consequence of one or more events that occurred after the initial recognition of the loan (loss event), this event or events impact the future cash flow and it can be reliably estimated.
The amount of the loss is measured as the difference between the carrying amount and the present value of estimated future cash flows (excluding future credit losses that have not been incurred) discounted at the original effective interest rate of the loan.
Initially, it is necessary to assess, on an individual basis, if there is objective evidence of impairment for exposures that are individually significant, or individually and collectively significant for exposures that are not individually significant. If there is no objective evidence for an exposures individually assessed, be it significant or not, it should be included in a group of exposures with similar characteristics and assessed collectively. The exposures that are individually assessed and for which a loss has been recorded should not be included in the collective assessment.
The differences between BRGAAP and IFRS resulted in differing amounts of the allowance for loan losses and, accordingly, an adjustment has been recognized.
| b.II) | Recognition of total deferred tax assets |
Under Law No. 11,727/2008, the social contribution (CSLL) rate for private insurance, capitalization companies and financial institutions, was increased from 9% to 15%, for taxable events that occurred after May 1, 2008. As a result of a lawsuit claiming unconstitutionality of the increase of the CSLL rate that was filed on June 26, 2008, by the National Confederation of the Financial System (CONSIF), deferred tax assets were recorded under BRGAAP only up to the amount of the increase in tax liabilities and did not considering the increased rate of 15%.
IAS 12 prescribes that deferred tax assets should be measured using substantively enacted tax rates. IAS 12 also prescribes that deferred tax assets should be recognized when the generation of future taxable income is probable, allowing the realization of the assets.
ITAÚ UNIBANCO HOLDING recognized, in these consolidated financial statements, deferred tax assets using the substantively enacted tax rate of 15% for CSLL.
| b.III) | Pension and healthcare plans |
Up to December 31, 2009, under BRGAAP, ITAÚ UNIBANCO HOLDING did not recognize assets resulting from the difference between the fair value of plan assets and their actuarial liabilities. The measurement basis of plan obligations and plan assets was similar to IFRS. However, differences existed in the criteria for recognizing the funded status when it resulted in a net asset.
Actuarial calculations for certain plans of ITAÚ UNIBANCO HOLDING resulted in net assets, for which an asset is recognized in accordance with IAS 19. As ITAÚ UNIBANCO HOLDING has an economic benefit available through reductions in future contributions, the asset was recognized as of December 31, 2009, measured taking into consideration the asset ceiling, prescribed by IAS 19 and IFRIC 14.
As from December 31, 2010, ITAÚ UNIBANCO HOLDING, pursuant to CVM Resolution No. 600/09, recognizes as assets the difference, when positive, between the fair value of plan assets and actuarial liabilities. CVM Resolution No. 600/09 is equivalent to IAS 19, and, accordingly, this adjustment is no longer necessary as from such date.
| b.IV) | Adjustment to market value of shares |
For purposes of BRGAAP, shares classified as permanent investments are recognized at historical cost and adjusted only for provision for permanent impairment. Increases in value over acquisition cost are not recognized.
Under IFRS, ITAÚ UNIBANCO HOLDING classified these shares as available-for-sale financial assets, in accordance with IAS 39, and recorded them at fair value, with gains and losses recognized in other comprehensive income.
| b.V) | Acquisition of interest in unconsolidated company - Porto Seguro Itaú Unibanco Participações S.A. (PSIUPAR) |
Under BRGAAP, there are no specific rules for the recognition of transactions where a subsidiary is exchanged for an unconsolidated company (associate); this kind of transaction is generally recognized at the carrying amount of the subsidiary transferred.
Under IFRS, consideration received (an interest in PSIUPAR acquired on November 30, 2009) in connection with the loss of control of a subsidiary is accounted for at fair value.
This difference in the basis of our investment in PSIUPAR is adjusted in the reconciliation.
| b.VI) | Provision for Itaú Unibanco merger expenses |
As a consequence of the acquisition of Unibanco, a provision to cover expenses related to communication to clients, changes in systems and personnel was recognized under BRGAAP, as the amount of the provision could be reasonably estimated.
Under IFRS, this provision did not meet at the transition date the requirements of IAS 19 and IAS 37, which are more restrictive than the requirements under BRGAAP and, accordingly, the provision was reversed at the transition date in these consolidated financial statements. During the year ended December 31, 2010, the provision recorded under BRGAAP was fully utilized.
| b.VII) | Translation of foreign subsidiaries and unconsolidated companies |
The process adopted by ITAÚ UNIBANCO HOLDING under BRGAAP for the translation of foreign subsidiaries and unconsolidated companies is similar to the requirements of IAS 21, except that the differences arising from the translation process are recorded in the statement of income. Accordingly, under BRGAAP, there is no specific reserve in stockholders’ equity where cumulative gains or losses arising from the translation of foreign subsidiaries and unconsolidated companies are recognized.
Under IFRS, the differences on translation of foreign subsidiaries and unconsolidated companies are reported in other comprehensive income.
| b.VIII) | Provision for dividends not yet declared |
Until 2010, in accordance with BRGAAP, the year-end financial statements should recognize a provision for dividends proposed by Management but not yet approved by the stockholders even if proposed dividends exceed the mandatory minimum dividend established in the bylaws.
In accordance with IAS 10 -“Events After The Balance Sheet Date”, if an entity declares dividends after the balance sheet date, it cannot recognize the amount of these dividends as a liability in the year-end financial statements.
From May 2011, ITAÚ UNIBANCO HOLDING, in conformity with Resolution No. 3,973/11, of the Central Bank of Brazil, no longer recognizes a provision (in liabilities) that exceeds the mandatory minimum dividends. The Resolution No. 3,973/11 is equivalent to IAS 10 and, therefore, from this date on, this adjustment is no longer necessary.
| b.IX) | Effective interest rate |
Under IAS 39, financial assets and liabilities measured at amortized cost should be recognized using the effective interest method, which consists of recognizing revenues and costs directly attributable to its acquisition, issue or disposal for the term of the operation.
Other differences between IFRS and BRGAAP have been recorded, which are not material either individually or in the aggregate.
| b.XI) | Income tax and social contribution on IFRS adjustments |
IAS 12 requires the recognition of deferred income tax and social contribution for all taxable or deductible temporary differences, except for deferred taxes arising from the initial recognition of goodwill, the initial recognition of an asset or liability in a transaction which is not a business combination, and that at the time of the transaction affects neither accounting profit nor taxable profit (tax loss). The adjustments of deferred income tax and social contribution were calculated on IFRS adjustments, when applicable.
| c) | RECONCILIATION BETWEEN USGAAP AND IFRS APPLICABLE TO THE STOCKHOLDERS' EQUITY OF ITAÚ UNIBANCO HOLDING AT JANUARY 1 AND DECEMBER 31, 2010 AND TO THE NET INCOME OF ITAÚ UNIBANCO HOLDING FROM JANUARY 1 TO DECEMBER 31, 2010 |
| | | | | 12/31/2010 | | | 1/1/2010 | | | 01/01 to
12/31/2010 | | | Class in IFRS
| |
| | | Reference | | Stockholders' Equity | | | Income | | | statement of Income | |
| In accordance with USGAAP (stockholders' equity attributed to the owners of the parent company, excluding non-controlling interest) | | | | | 76,625 | | | | 69,277 | | | | 11,067 | | | | |
| | | | | | | | | | | | | | | | | | |
| Adjustments that affect stockholders' equity between USGAAP and IFRS | | | | | (10,750 | ) | | | (12,151 | ) | | | 642 | | | | |
| Pension and healthcare plans | | c.I | | | (1,634 | ) | | | (1,049 | ) | | | (1,567 | ) | | General and administrative expenses | |
| Stock-based compensation | | c.II | | | 491 | | | | 584 | | | | 66 | | | General and administrative expenses | |
| Related to business combinations | | c.III | | | (10,579 | ) | | | (12,728 | ) | | | 2,150 | | | | |
| Full amortization of goodwill recognized under BRGAAP | | c.III i | | | (15,607 | ) | | | (15,607 | ) | | | - | | | | |
| Reversal of adjustment at fair value recognized under USGAAP for the price paid | | c.III ii | | | 4,576 | | | | 4,576 | | | | - | | | | |
| Reversal of amortization of intangible assets recognized under USGAAP | | c.III iii | | | 5,066 | | | | 1,476 | | | | 3,590 | | | General and administrative expenses | |
| Reversal of adjustment at fair value recognized under USGAAP of Unibanco's net assets | | c.III iv | | | (1,138 | ) | | | (89 | ) | | | (1,050 | ) | | Interest and similar income, General and administrative expenses | |
| Negative goodwill in the acquisition of Unibanco recognized under USGAAP | | c.III v | | | (830 | ) | | | (830 | ) | | | - | | | | |
| Difference in the investment base in Redecard as a result of remeasurement under USGAAP upon gaining control | | c. III vi | | | (4,530 | ) | | | (4,530 | ) | | | - | | | | |
| Recognition of total deferred tax assets on goodwill | | c. III vii | | | 1,250 | | | | 1,574 | | | | (323 | ) | | Deferred income tax and social contribution | |
| Other | | c.IV | | | 634 | | | | 702 | | | | (67 | ) | | Interest and similar income, General and administrative expenses | |
| Other adjustments | | c.IV | | | (269 | ) | | | (868 | ) | | | 378 | | | General and administrative expenses | |
| Income tax and social contribution over all IFRS adjustments | | c.V | | | 1,241 | | | | 1,910 | | | | (385 | ) | | Deferred income tax and social contribution | |
| In accordance with IFRS - attributable to controlling stockholders | | | | | 65,875 | | | | 57,126 | | | | 11,708 | | | | |
| | | | | | | | | | | | | | | | | | |
| In accordance with USGAAP- attributable to non-controlling interest | | | | | 13,076 | | | | 12,757 | | | | 824 | | | | |
| | | | | | | | | | | | | | | | | | |
| Redecard | | c.III vi | | | (10,915 | ) | | | (10,840 | ) | | | 75 | | | Net income attributable to non-controlling interests | |
| Deconsolidation of Joint Ventures | | c.VI | | | (366 | ) | | | (268 | ) | | | (98 | ) | | | |
| Other | | c.IV/cIII iv | | | (118 | ) | | | (85 | ) | | | (16 | ) | | | |
| | | | | | | | | | | | | | | | | | |
| In accordance with IFRS - attributable to non-controlling interest | | | | | 1,677 | | | | 1,564 | | | | 785 | | | | |
| | | | | | | | | | | | | | | | | | |
| In accordance with IFRS - attributable to controlling and non-controlling interest | | | | | 67,552 | | | | 58,690 | | | | 12,493 | | | | |
The adoption of IFRS has changed the statement of cash flows of ITAÚ UNIBANDO HOLDING, arising from the recognition of the effects shown in the table above, as well as from the differences in classification of Central Bank Compulsory Deposits, Securities Purchased under Agreements to Resell and Loan Operations, considered as investiment activities under USGAAP, while under IFRS, the same items are classified as operating activities and also from the differences in classification of Deposits, Securities sold under Repurchase Agreements, Interbank Market Debt and Reserves for Insurance and Private Pension, considered as financing activities under USGAAP, while under IFRS, the same items are classified as operating activities.
We are not presenting the Cumulative Comprehensive Income in the reconciliation above because there is no difference between USGAAP and IFRS.
| Balance Sheet on December 31, 2010 | | | | | | | | | | | | | | | | | | | | | | | | | | | | | | | | | | | | | | | | | | | | | | | | |
| ASSETS | | USGAAP | | | c.IX | | | c.I | | | c.II | | | c.i | | | c.III ii / c.III iii | | | c.III iv | | | c.III v | | | c.III vi | | | c.IV / c.III vii | | | c.V | | | c.VI | | | c.VII | | | c.VIII | | | c.IV | | | IFRS | |
| Cash and deposits on demand | | | 5,568 | | | | 4,585 | | | | - | | | | - | | | | - | | | | - | | | | - | | | | - | | | | - | | | | - | | | | - | | | | (5 | ) | | | - | | | | - | | | | 24 | | | | 10,172 | |
| Central Bank Compulsory Deposits | | | 85,790 | | | | - | | | | - | | | | - | | | | - | | | | - | | | | - | | | | - | | | | - | | | | - | | | | - | | | | - | | | | - | | | | - | | | | (14 | ) | | | 85,776 | |
| Interbank deposits | | | 57,566 | | | | (44,297 | ) | | | - | | | | - | | | | - | | | | - | | | | - | | | | - | | | | - | | | | - | | | | - | | | | 1,565 | | | | - | | | | - | | | | 1 | | | | 14,835 | |
| Securities purchased under agreements to resell | | | 34,734 | | | | 36,790 | | | | - | | | | - | | | | - | | | | - | | | | - | | | | - | | | | - | | | | - | | | | - | | | | (10 | ) | | | 17,158 | | | | - | | | | 10 | | | | 88,682 | |
| Financial assets held for trading | | | 140,003 | | | | (5,646 | ) | | | (1,340 | ) | | | - | | | | - | | | | - | | | | (2 | ) | | | - | | | | - | | | | - | | | | - | | | | (21 | ) | | | (17,219 | ) | | | - | | | | (278 | ) | | | 115,497 | |
| Financial assets designated at fair value through profit or loss | | | - | | | | 306 | | | | - | | | | - | | | | - | | | | - | | | | - | | | | - | | | | - | | | | - | | | | - | | | | - | | | | - | | | | - | | | | - | | | | 306 | |
| Derivatives | | | - | | | | 7,789 | | | | (48 | ) | | | - | | | | - | | | | - | | | | - | | | | - | | | | - | | | | - | | | | - | | | | - | | | | 37 | | | | - | | | | (1 | ) | | | 7,777 | |
| Available-for-sale financial assets | | | 44,636 | | | | 473 | | | | (184 | ) | | | - | | | | - | | | | - | | | | 32 | | | | - | | | | - | | | | - | | | | - | | | | - | | | | - | | | | - | | | | (418 | ) | | | 44,539 | |
| Held-to-maturity financial assets | | | 2,506 | | | | 845 | | | | - | | | | - | | | | - | | | | - | | | | (131 | ) | | | - | | | | - | | | | - | | | | - | | | | - | | | | - | | | | - | | | | (50 | ) | | | 3,170 | |
| Loan operations and lease operations, net | | | 278,031 | | | | - | | | | - | | | | - | | | | - | | | | - | | | | 390 | | | | - | | | | - | | | | - | | | | - | | | | (2,894 | ) | | | - | | | | - | | | | (684 | ) | | | 274,843 | |
| Loan operations and lease operations | | | 298,169 | | | | 1,240 | | | | - | | | | - | | | | - | | | | - | | | | (514 | ) | | | - | | | | - | | | | - | | | | - | | | | (3,411 | ) | | | - | | | | - | | | | (647 | ) | | | 294,837 | |
| (-) Allowance for loan losses | | | (20,138 | ) | | | (1,240 | ) | | | - | | | | - | | | | - | | | | - | | | | 904 | | | | - | | | | - | | | | - | | | | - | | | | 517 | | | | - | | | | - | | | | (37 | ) | | | (19,994 | ) |
| Other financial assets | | | - | | | | 40,517 | | | | - | | | | - | | | | - | | | | - | | | | - | | | | - | | | | - | | | | - | | | | - | | | | 973 | | | | 24 | | | | - | | | | (569 | ) | | | 40,945 | |
| Investments in unconsolidated companies | | | 3,597 | | | | (538 | ) | | | - | | | | - | | | | - | | | | - | | | | - | | | | - | | | | - | | | | - | | | | - | | | | (18 | ) | | | - | | | | - | | | | (94 | ) | | | 2,947 | |
| Fixed assets, net | | | 5,151 | | | | (638 | ) | | | - | | | | - | | | | - | | | | - | | | | 181 | | | | - | | | | - | | | | - | | | | - | | | | (11 | ) | | | - | | | | - | | | | 119 | | | | 4,802 | |
| Intangible assets, net | | | 18,148 | | | | (20,064 | ) | | | - | | | | - | | | | - | | | | 5,066 | | | | (61 | ) | | | - | | | | - | | | | - | | | | - | | | | (114 | ) | | | - | | | | - | | | | (41 | ) | | | 2,934 | |
| Goodwill, net | | | 14,664 | | | | 19,857 | | | | - | | | | - | | | | (22,762 | ) | | | 4,576 | | | | (2,835 | ) | | | (830 | ) | | | (14,206 | ) | | | 634 | | | | - | | | | - | | | | - | | | | - | | | | 902 | | | | - | |
| Tax assets | | | - | | | | 10,585 | | | | - | | | | - | | | | 7,155 | | | | - | | | | - | | | | - | | | | - | | | | 1,250 | | | | 1,241 | | | | (300 | ) | | | - | | | | 5,080 | | | | (869 | ) | | | 24,142 | |
| Assets held for sale | | | - | | | | 69 | | | | - | | | | - | | | | - | | | | - | | | | - | | | | - | | | | - | | | | - | | | | - | | | | (1 | ) | | | - | | | | - | | | | 10 | | | | 78 | |
| Other assets | | | 56,186 | | | | (50,633 | ) | | | (62 | ) | | | - | | | | - | | | | - | | | | 77 | | | | - | | | | - | | | | - | | | | - | | | | (75 | ) | | | - | | | | - | | | | 144 | | | | 5,637 | |
| TOTAL ASSETS | | | 746,580 | | | | - | | | | (1,634 | ) | | | - | | | | (15,607 | ) | | | 9,642 | | | | (2,349 | ) | | | (830 | ) | | | (14,206 | ) | | | 1,884 | | | | 1,241 | | | | (911 | ) | | | - | | | | 5,080 | | | | (1,808 | ) | | | 727,082 | |
| | | | | | | | | | | | | | | | | | | | | | | | | | | | | | | | | | | | | | | | | | | | | | | | | |
| LIABILITIES AND STOCKHOLDERS’ EQUITY | | USGAAP | | | c.IX | | | c.I | | | c.II | | | c.i | | | c.III ii / c.III iii | | | c.III iv | | | c.III v | | | c.III vi | | | c.IV / c.III vii | | | c.V | | | c.VI | | | c.VII | | | c.VIII | | | c.IV | | | IFRS | |
| Deposits | | | 202,660 | | | | - | | | | - | | | | - | | | | - | | | | - | | | | - | | | | - | | | | - | | | | - | | | | - | | | | (1 | ) | | | - | | | | - | | | | 29 | | | | 202,688 | |
| Securities sold under repurchase agreements | | | 97,972 | | | | 101,598 | | | | - | | | | - | | | | - | | | | - | | | | - | | | | - | | | | - | | | | - | | | | - | | | | - | | | | - | | | | - | | | | 87 | | | | 199,657 | |
| Financial liabilities held for trading | | | - | | | | 1,335 | | | | - | | | | - | | | | - | | | | - | | | | - | | | | - | | | | - | | | | - | | | | - | | | | - | | | | - | | | | - | | | | - | | | | 1,335 | |
| Derivatives | | | - | | | | 6,674 | | | | - | | | | - | | | | - | | | | - | | | | (694 | ) | | | - | | | | - | | | | - | | | | - | | | | - | | | | - | | | | - | | | | (309 | ) | | | 5,671 | |
| Interbank market debt | | | - | | | | 62,988 | | | | - | | | | - | | | | - | | | | - | | | | - | | | | - | | | | - | | | | - | | | | - | | | | - | | | | - | | | | - | | | | (389 | ) | | | 62,599 | |
| Institutional market debt | | | - | | | | 43,098 | | | | - | | | | - | | | | - | | | | - | | | | (7 | ) | | | - | | | | 1,239 | | | | - | | | | - | | | | - | | | | - | | | | - | | | | 183 | | | | 44,513 | |
| Short-term borrowings | | | 123,041 | | | | (123,041 | ) | | | - | | | | - | | | | - | | | | - | | | | - | | | | - | | | | - | | | | - | | | | - | | | | - | | | | - | | | | - | | | | - | | | | - | |
| Long-term debt | | | 84,768 | | | | (84,768 | ) | | | - | | | | - | | | | - | | | | - | | | | - | | | | - | | | | - | | | | - | | | | - | | | | - | | | | - | | | | - | | | | - | | | | - | |
| Other financial liabilities | | | - | | | | 41,902 | | | | - | | | | - | | | | - | | | | - | | | | - | | | | - | | | | - | | | | - | | | | - | | | | (346 | ) | | | - | | | | - | | | | (544 | ) | | | 41,012 | |
| Reserves for insurance and private pension | | | 60,463 | | | | (3,634 | ) | | | - | | | | - | | | | - | | | | - | | | | (74 | ) | | | - | | | | - | | | | - | | | | - | | | | - | | | | - | | | | - | | | | 109 | | | | 56,864 | |
| Liabilities for capitalization plans | | | - | | | | 2,603 | | | | - | | | | - | | | | - | | | | - | | | | - | | | | - | | | | - | | | | - | | | | - | | | | - | | | | - | | | | - | | | | - | | | | 2,603 | |
| Provisions | | | - | | | | 14,736 | | | | - | | | | - | | | | - | | | | - | | | | - | | | | - | | | | - | | | | - | | | | - | | | | (33 | ) | | | - | | | | - | | | | (247 | ) | | | 14,456 | |
| Tax liabilities | | | - | | | | 7,078 | | | | - | | | | - | | | | - | | | | - | | | | - | | | | - | | | | - | | | | - | | | | - | | | | (83 | ) | | | - | | | | 5,080 | | | | 35 | | | | 12,110 | |
| Other liabilities | | | 87,975 | | | | (70,569 | ) | | | - | | | | (491 | ) | | | - | | | | - | | | | (228 | ) | | | - | | | | - | | | | - | | | | - | | | | (82 | ) | | | - | | | | - | | | | (583 | ) | | | 16,022 | |
| Total liabilities | | | 656,879 | | | | - | | | | - | | | | (491 | ) | | | - | | | | - | | | | (1,003 | ) | | | - | | | | 1,239 | | | | - | | | | - | | | | (545 | ) | | | - | | | | 5,080 | | | | (1,629 | ) | | | 659,530 | |
| Total stockholders’ equity attributed to the owners of the parent company | | | 76,625 | | | | - | | | | (1,634 | ) | | | 491 | | | | (15,607 | ) | | | 9,642 | | | | (1,138 | ) | | | (830 | ) | | | (4,530 | ) | | | 1,884 | | | | 1,241 | | | | - | | | | - | | | | - | | | | (269 | ) | | | 65,875 | |
| Non-controlling interests | | | 13,076 | | | | - | | | | - | | | | - | | | | - | | | | - | | | | (208 | ) | | | - | | | | (10,915 | ) | | | - | | | | - | | | | (366 | ) | | | - | | | | - | | | | 90 | | | | 1,677 | |
| Total stockholders’ equity | | | 89,701 | | | | - | | | | (1,634 | ) | | | 491 | | | | (15,607 | ) | | | 9,642 | | | | (1,346 | ) | | | (830 | ) | | | (15,445 | ) | | | 1,884 | | | | 1,241 | | | | (366 | ) | | | - | | | | - | | | | (179 | ) | | | 67,552 | |
| TOTAL LIABILITIES AND STOCKHOLDERS’ EQUITY | | | 746,580 | | | | - | | | | (1,634 | ) | | | - | | | | (15,607 | ) | | | 9,642 | | | | (2,349 | ) | | | (830 | ) | | | (14,206 | ) | | | 1,884 | | | | 1,241 | | | | (911 | ) | | | - | | | | 5,080 | | | | (1,808 | ) | | | 727,082 | |
Summary of the main differences between USGAAP and IFRS
Below is a description of the main accounting practices applicable to ITAÚ UNIBANCO HOLDING, which differ significantly between USGAAP and IFRS and are presented in the reconciliations above:
| c.I) | Pension and healthcare plans |
Under IFRS and USGAAP, the sponsor of pension and healthcare plans should recognize both the deficit and surplus of a defined benefit plan as a liability or an asset in its balance sheet. In accordance with IFRS, whenever an entity has a surplus in a defined benefit plan, it should measure the asset by using the lower between: (a) the plan surplus; or (b) the asset ceiling defined as the present value of decreases in the employer’s future contributions.
The difference between USGAAP and IFRS is derived from the impact of this limitation in the recognition of the asset described above.
Another difference refers to the recognition of actuarial gains and losses, which are directly recorded in stockholders’ equity under USGAAP and in net income for the period under IFRS.
| c.II) | Stock-based compensation |
Under USGAAP, the cost of stock-based compensation plans considered liability awards is recognized as an expense, with a corresponding entry to liabilities. Certain options granted are considered liability awards under USGAAP and measured at each reporting date, since the exercise price is indexed to inflation rates.
Under IFRS, stock-based compensation is recognized at the fair value of options on the grant date, and they are not remeasured, since they are all classified as “equity awards”.
Both for USGAAP and IFRS, the cost of stock-based compensation plans is recognized over the vesting period.
| c.III) | Business combinations |
Under USGAAP, business combinations are accounted in a manner similar to the requirements of IFRS 3 (R), i.e., they are recognized under the purchase method.
IFRS 1 permits that business combinations and past acquisitions of investments in associates that occurred before the transition date are not reassessed on a retrospective basis, through the application of IFRS 3 (R) (Detailed on Note 2.5 (a)). This exemption allows first-time adopters of IFRS to basically maintain the accounting treatment adopted under the previous accounting practice, in this case previous GAAP. ITAÚ UNIBANCO HOLDING adopted this exemption up to August 1, 2009 and then adopted IFRS 3 (R) or IAS 28, as the case may be, to recognize only the business combinations and past acquisitions of investments in associates after that date (there were no business combinations after that date).
Pursuant to the exemption permitted by IFRS 1, the accounting policies adopted for initial recognition and subsequent measurement of goodwill generated in acquisitions before August 1, 2009 under previous GAAP were maintained.
On the transition date, the accounting treatment of these business combinations under IFRS is the same as the accounting treatment under previous GAAP. Accordingly, the following differences between USGAAP and previous GAAP (IFRS, at the transition date) are presented below:
| (i) | Under previous GAAP, we fully amortized, in the acquisition year, the goodwill amount determined in a business combination. For USGAAP purposes, the goodwill amount is determined under different criteria and it is not amortized, but tested for impairment, therefore reversing the full amortization of goodwill under previous GAAP. |
| (ii) | Under USGAAP, equity instruments issued as part of the purchase price are valued at their fair value on the acquisition date, whereas under previous GAAP equity instruments are recorded at the value agreed between the parties, as documented in the contractual agreements. |
| (iii) | UnderpreviousGAAP, intangible assets arising from a business combination are not recognized. Under USGAAP, intangible assets are recognized at the estimated fair value and they are amortized over the period of the future estimated benefit. |
| (iv) | Under previous GAAP, assets and liabilities from acquired businesses are recognized at book value and goodwill is computed as the difference between the purchase price and net assets at book value. Differences between book value and fair value of assets and liabilities are not recognized. Under USGAAP, the assets and liabilities acquired, including intangible assets, are recognized at the estimated fair value. |
| (v) | As a result of the difference in the criterion under previous GAAP and USGAAP to determine the goodwill, we recognized a negative goodwill in the transaction under USGAAP, which is reversed for previous GAAP purposes. |
| (vi) | Under previous GAAP, when a stockholder gains control over an entity by acquiring an additional interest previously recorded under the equity method, the investment amount is increased by the price paid for the additional interest. No gain or loss is recognized. Under USGAAP, the previously held interest is remeasured at the fair value on the date the control is acquired. Any difference between the book value and the fair value of the previously held interest is recognized as gain or loss in income. Additionally, upon the acquisition of control, non-controlling interests are also measured at their fair value. |
| (vii) | As described in item (i) above, we amortized under previous GAAP, in the acquisition year, the amount of goodwill established on business combination. On this amortization, we recognized deferred taxes related to social contribution at a 9% rate. For USGAAP and IFRS purposes, the recognition of the deferred tax should be at the effective rate, i.e., 15% in this case, as described in Note 2.5 (b) (II). The difference between USGAAP and IFRS in fact arises due to the effect of the increased social contribution rate levied on this goodwill, which was fully amortized for IFRS purposes. |
Includes differences between USGAAP and IFRS previously recorded, related to business combination, non-controlling shareholders and others, which are not material either individually or in the aggregate.
| c.V) | Income tax and social contribution on IFRS adjustments |
The USGAAP and IFRS requires the recognition of deferred income tax and social contribution for all taxable or deductible temporary differences, except for deferred taxes arising from the initial recognition of goodwill, the initial recognition of an asset or liability in a transaction which is not a business combination, and that at the time of the transaction affects neither accounting profit nor taxable profit (tax loss). The difference between USGAAP and IFRS refers to calculation of deferred income tax and social contribution levied on the differences of adjustments between both GAAPs.
c.VI) Difference in consolidation between Variable Interest Entities (VIEs) (USGAAP) and Joint Ventures (IFRS)
In accordance with USGAAP requirements, we record certain interests as VIEs, and we conclude that we are their primary beneficiary mainly because we are exposed to most of their risks and benefits. As the primary beneficiary of these entities, we should fully consolidate them in our financial statements.
Under IFRS, the interests held by an entity may not be defined as VIEs. We analyze these interests in accordance with IAS 31 requirements and conclude that these entities fall into the category of Joint Ventures (Note 2.4 (a)), because the main operating and financial decisions in these entities are made jointly with other stockholders. IAS 31 allows for Joint Ventures to be either proportionally consolidated or recorded under the equity method. We have opted for the proportional consolidation.
Therefore, the difference is due to the fact that these entities are fully consolidated under USGAAP and proportionally consolidated under IFRS.
c.VII) Consolidation of pension funds
Certain investment funds, exclusive for investment of funds arising from private pension products offered by ITAÚ UNIBANCO HOLDING to its clients, comply with consolidation requirements under IFRS. These funds are not consolidated, but rather treated as financial instruments in the financial statements under USGAAP.
c.VIII) Difference in the recognition of taxes
Under USGAAP, deferred tax assets and liabilities should be offset whenever they are attributable to the same tax authority, and not mandatorily by taxable entity.
Under IFRS, an entity should offset deferred tax assets and liabilities if and only if it is legally entitled to settle current tax assets and liabilities, and these deferred taxes are related to taxes on income required by the same tax authority, levied on the same taxable entity.
c.IX) Changes/ reclassifications in the balance sheet accounts
The presentation model for the balance sheet under IFRS adopted by ITAÚ UNIBANCO HOLDING is different from that under USGAAP. The main changes/ reclassifications are due to the different presentation of the following lines: Interbank Deposits (under USGAAP in Securities purchased under agreements to resell), Derivatives – Assets and Liabilities (under USGAAP in Assets Held for Trading and Other Liabilities), Liabilities for capitalization plans (considered under USGAAP in the Reserve for insurance, pension plan and capitalization line), Other Financial Assets and Liabilities (under USGAAP in Other Assets and Liabilities), Goodwill (considered under USGAAP in the Intangible Assets line arising from the allocation of fair value of assets and liabilities resulting from business combination), Tax Assets and Liabilities (under USGAAP in Other Assets and Liabilities), Interbank Markets and Institutional Markets (under USGAAP in Short-Term and Long-Term Borrowings) and Provisions (under USGAAP in Other Liabilities).
NOTE 03 - CASH AND CASH EQUIVALENTS
For purposes of consolidated statements of cash flows, cash and cash equivalents comprises the following items (amounts with original maturity terms equal to or less than 90 days):
| | | 12/31/2011 | | | 12/31/2010 | | | 1/1/2010 | |
| Cash and deposits on demand | | | 10,668 | | | | 10,172 | | | | 10,671 | |
| Interbank deposits | | | 18,921 | | | | 7,639 | | | | 7,304 | |
| Securities purchased under agreements to resell | | | 8,516 | | | | 27,798 | | | | 54,677 | |
| TOTAL | | | 38,105 | | | | 45,609 | | | | 72,652 | |
Amounts related to interbank deposits and securities purchased under agreements to resell over 90 days are R$ 8,900 (R$ 7,196 at December 31, 2010 and R$ 10,495 at January 1, 2010) and R$ 83,732 (R$ 60,884 at December 31, 2010 and R$ 81,143 at January 1, 2010), respectively.
NOTE 04 - CENTRAL BANK COMPULSORY DEPOSITS
| | | 12/31/2011 | | | 12/31/2010 | | | 1/1/2010 | |
| Non-interest bearing deposits | | | 5,730 | | | | 4,742 | | | | 4,042 | |
| Interest-bearing deposits | | | 92,323 | | | | 81,034 | | | | 9,827 | |
| TOTAL | | | 98,053 | | | | 85,776 | | | | 13,869 | |
NOTE 05 – INTERBANK DEPOSITS AND SECURITIES PURCHASED UNDER AGREEMENTS TO RESELL
| | | 12/31/2011 | |
| | | CURRENT | | | NON-CURRENT | | | TOTAL | |
| Interbank deposits | | | 25,384 | | | | 2,437 | | | | 27,821 | |
| Securities purchased under agreements to resell (*) | | | 92,248 | | | | - | | | | 92,248 | |
| TOTAL | | | 117,632 | | | | 2,437 | | | | 120,069 | |
(*) Of these securities R$ 7.046 are pledged in guarantee in conformity with the policies described in note 2.4f
| | | 12/31/2010 | |
| | | CURRENT | | | NON-CURRENT | | | TOTAL | |
| Interbank deposits | | | 14,315 | | | | 520 | | | | 14,835 | |
| Securities purchased under agreements to resell (*) | | | 82,094 | | | | 6,588 | | | | 88,682 | |
| TOTAL | | | 96,409 | | | | 7,108 | | | | 103,517 | |
(*) Of these securities R$ 8.670 are pledged in guarantee in conformity with the policies described in note 2.4f
| | | 1/1/2010 | |
| | | CURRENT | | | NON-CURRENT | | | TOTAL | |
| Interbank deposits | | | 17,262 | | | | 537 | | | | 17,799 | |
| Securities purchased under agreements to resell (*) | | | 124,227 | | | | 11,593 | | | | 135,820 | |
| TOTAL | | | 141,489 | | | | 12,130 | | | | 153,619 | |
(*) Of these securities R$ 9.288 are pledged in guarantee in conformity with the policies described in note 2.4f
NOTE 06 – FINANCIAL ASSETS HELD FOR TRADING AND DESIGNATED AT FAIR VALUE THROUGH PROFIT OR LOSS
a)Financial assets held for trading recognized at their fair value are presented in the following table:
| | | 12/31/2011 | | | 12/31/2010 | | | 1/1/2010 | |
| | | Cost/
amortized | | | Unrealized results | | | Fair | | | Cost/
amortized | | | Unrealized results | | | Fair | | | Cost/
amortized | | | Unrealized results | | | Fair | |
| | | cost | | | Gain | | | Loss | | | value | | | cost | | | Gain | | | Loss | | | value | | | cost | | | Gain | | | Loss | | | value | |
| Investment funds | | | 1,326 | | | | 35 | | | | (22 | ) | | | 1,339 | | | | 1,701 | | | | 49 | | | | (2 | ) | | | 1,748 | | | | 1,589 | | | | 32 | | | | (2 | ) | | | 1,619 | |
| Brazilian government securities (1a) | | | 93,914 | | | | 184 | | | | (184 | ) | | | 93,914 | | | | 86,636 | | | | 77 | | | | (14 | ) | | | 86,699 | | | | 36,099 | | | | 48 | | | | (12 | ) | | | 36,135 | |
| Brazilian external debt bonds (1b) | | | 868 | | | | 42 | | | | - | | | | 910 | | | | 653 | | | | 17 | | | | (4 | ) | | | 666 | | | | 222 | | | | - | | | | - | | | | 222 | |
| Government securities – abroad (1c) | | | 787 | | | | 28 | | | | (13 | ) | | | 802 | | | | 9,323 | | | | 38 | | | | (8 | ) | | | 9,353 | | | | 1,045 | | | | 25 | | | | (13 | ) | | | 1,057 | |
| Argentina | | | 226 | | | | 12 | | | | (13 | ) | | | 225 | | | | 295 | | | | 6 | | | | (8 | ) | | | 293 | | | | 179 | | | | 3 | | | | (3 | ) | | | 179 | |
| United States | | | 280 | | | | 12 | | | | - | | | | 292 | | | | 8,682 | | | | 32 | | | | - | | | | 8,714 | | | | 735 | | | | 22 | | | | (10 | ) | | | 747 | |
| Mexico | | | 201 | | | | 4 | | | | - | | | | 205 | | | | 29 | | | | - | | | | - | | | | 29 | | | | 10 | | | | - | | | | - | | | | 10 | |
| Russia | | | - | | | | - | | | | - | | | | - | | | | 45 | | | | - | | | | - | | | | 45 | | | | 77 | | | | - | | | | - | | | | 77 | |
| Chile | | | 50 | | | | - | | | | - | | | | 50 | | | | 248 | | | | - | | | | - | | | | 248 | | | | 30 | | | | - | | | | - | | | | 30 | |
| Uruguay | | | 27 | | | | - | | | | - | | | | 27 | | | | 24 | | | | - | | | | - | | | | 24 | | | | 14 | | | | - | | | | - | | | | 14 | |
| Other | | | 3 | | | | - | | | | - | | | | 3 | | | | - | | | | - | | | | - | | | | - | | | | - | | | | - | | | | - | | | | - | |
| Corporate securities (1d) | | | 24,965 | | | | 84 | | | | (125 | ) | | | 24,924 | | | | 16,941 | | | | 152 | | | | (62 | ) | | | 17,031 | | | | 16,279 | | | | 248 | | | | (8 | ) | | | 16,519 | |
| Shares | | | 2,325 | | | | 69 | | | | (97 | ) | | | 2,297 | | | | 3,161 | | | | 134 | | | | (47 | ) | | | 3,248 | | | | 2,476 | | | | 240 | | | | (6 | ) | | | 2,710 | |
| Securitized real estate loans | | | 23 | | | | 1 | | | | - | | | | 24 | | | | 587 | | | | 9 | | | | - | | | | 596 | | | | 33 | | | | 2 | | | | - | | | | 35 | |
| Bank deposit certificates | | | 7,820 | | | | - | | | | - | | | | 7,820 | | | | 8,932 | | | | - | | | | - | | | | 8,932 | | | | 9,490 | | | | - | | | | - | | | | 9,490 | |
| Debentures | | | 3,525 | | | | 2 | | | | (1 | ) | | | 3,526 | | | | 2,799 | | | | 1 | | | | - | | | | 2,800 | | | | 3,095 | | | | 2 | | | | (1 | ) | | | 3,096 | |
| Eurobonds and other | | | 1,446 | | | | 12 | | | | (27 | ) | | | 1,431 | | | | 1,459 | | | | 8 | | | | (15 | ) | | | 1,452 | | | | 624 | | | | 4 | | | | (1 | ) | | | 627 | |
| Financial credit bills | | | 8,973 | | | | - | | | | - | | | | 8,973 | | | | - | | | | - | | | | - | | | | - | | | | - | | | | - | | | | - | | | | - | |
| Other | | | 853 | | | | - | | | | - | | | | 853 | | | | 3 | | | | - | | | | - | | | | 3 | | | | 561 | | | | - | | | | - | | | | 561 | |
| TOTAL | | | 121,860 | | | | 373 | | | | (344 | ) | | | 121,889 | | | | 115,254 | | | | 333 | | | | (90 | ) | | | 115,497 | | | | 55,234 | | | | 353 | | | | (35 | ) | | | 55,552 | |
(1) Assets held for trading pledged as collateral of funding transactions of financial institutions and clients at December 31, 2011 were: a) R$ 12,010 (R$ 45,672 at 12/31/2010 and R$ 5,870 at 01/01/2010), b) R$ 0 (R$ 125 at 12/31/2010 and R$ 77 at 01/01/2010), c) R$ 84 (R$ 8,592 at 12/31/2010 and R$ 288 at 01/01/2010) and d) R$ 48 (R$ 11 at 12/31/2010 and R$ 101 at 01/01/2010), totaling R$ 12,142 (R$ 54,400 at 12/31/2010 and R$ 6,336 at 01/01/2010).
Realized gains and losses
| | | 01/01 to
12/31/2011 | | | 01/01 to
12/31/2010 | |
| Financial assets held for trading | | | | | | | | |
| Gains | | | 2,995 | | | | 1,668 | |
| Losses | | | (2,559 | ) | | | (1,266 | ) |
| TOTAL | | | 436 | | | | 402 | |
The cost/ amortized cost and fair value of financial assets held for trading by maturity are as follows:
| | | 12/31/2011 | | | 12/31/2010 | | | 1/1/2010 | |
| | | Cost/
amortized cost | | | Fair
value | | | Cost/
amortized cost | | | Fair
value | | | Cost/
amortized cost | | | Fair
value | |
| CURRENT | | | 37,701 | | | | 37,706 | | | | 58,534 | | | | 58,705 | | | | 26,039 | | | | 26,323 | |
| Non-stated maturity | | | 3,650 | | | | 3,635 | | | | 4,862 | | | | 4,996 | | | | 4,070 | | | | 4,334 | |
| Up to one year | | | 34,051 | | | | 34,071 | | | | 53,672 | | | | 53,709 | | | | 21,969 | | | | 21,989 | |
| NON-CURRENT | | | 84,159 | | | | 84,183 | | | | 56,720 | | | | 56,792 | | | | 29,195 | | | | 29,229 | |
| From one to five years | | | 72,064 | | | | 72,088 | | | | 49,392 | | | | 49,403 | | | | 26,131 | | | | 26,138 | |
| From five to ten years | | | 8,570 | | | | 8,550 | | | | 5,134 | | | | 5,177 | | | | 2,313 | | | | 2,332 | |
| After ten years | | | 3,525 | | | | 3,545 | | | | 2,194 | | | | 2,212 | | | | 751 | | | | 759 | |
| TOTAL | | | 121,860 | | | | 121,889 | | | | 115,254 | | | | 115,497 | | | | 55,234 | | | | 55,552 | |
Financial assets held for trading include assets with a fair value of R$ 57,734 (R$ 46,051 at 12/31/2010 and R$ 38,626 at 01/01/2010) that belong to investment funds wholly owned by Itaú Vida e Previdência S.A.. The return on those assets (positive or negative) is fully transferred to customers of our PGBL and VGBL private pension plans whose premiums (less fees charged by us) are used by our subsidiary to purchase quotas of those investment funds.
b) Financial assets designated at fair value through profit or loss are presented in the following table:
| | | 12/31/2011 | |
| | | Cost/
amortized | | | Unrealized results | | | Fair | |
| | | cost | | | Gain | | | Loss | | | value | |
| Brazilian external debt bonds | | | 182 | | | | 4 | | | | - | | | | 186 | |
| | | 12/31/2010 | |
| | | Cost/
amortized | | | Unrealized results | | | Fair | |
| | | cost | | | Gain | | | Loss | | | value | |
| Brazilian external debt bonds | | | 297 | | | | 9 | | | | - | | | | 306 | |
| | | 1/1/2010 | |
| | | Cost/
amortized | | | Unrealized results | | | Fair | |
| | | cost | | | Gain | | | Loss | | | value | |
| Brazilian external debt bonds | | | 368 | | | | 5 | | | | - | | | | 373 | |
Realized gain and loss
| | | 01/01 to
12/31/2011 | | | 01/01 to
12/31/2010 | |
| Designated at fair value through profit or loss | | | | | | | | |
| Gain | | | 20 | | | | - | |
| Loss | | | - | | | | (1 | ) |
| Total | | | 20 | | | | (1 | ) |
The cost or amortized cost and fair value by maturity of financial assets designated as fair value through profit or loss were as follows:
| | | 12/31/2011 | | | 12/31/2010 | | | 1/1/2010 | |
| | | Cost/
amortized cost | | | Fair
value | | | Cost/
amortized
cost | | | Fair
value | | | Cost/
amortized
cost | | | Fair
value | |
| NON-CURRENT | | | 182 | | | | 186 | | | | 297 | | | | 306 | | | | 368 | | | | 373 | |
| After ten years | | | 182 | | | | 186 | | | | 297 | | | | 306 | | | | 368 | | | | 373 | |
NOTE 07 – DERIVATIVES
ITAÚ UNIBANCO HOLDING enters into financial derivative instruments with various counterparties to manage its overall exposures and to assist its customers in managing their own exposures.
Futures - Interest rate and foreign currency futures contracts are commitments to buy or sell a financial instrument at a future date, at a contracted price or yield and may be settled in cash or through delivery. The notional amount represents the face value of the underlying instrument. Commodity futures contracts or financial instruments are commitments to buy or sell commodities (mainly gold, coffee and orange juice), at a future date, at a contracted price, which are settled in cash. The notional amount represents the quantity of such commodities multiplied by the future price at the contract date. Daily cash settlements of price movements are made for all instruments.
Forward - Interest forward contracts are agreements to exchange payments on a specified future date, based on a market change in interest rates from trade date to contract settlement date. Foreign exchange forward contracts represent agreements to exchange the currency of one country for the currency of another country at an agreed price, at an agreed settlement date. Financial instrument forward contracts are commitments to buy or sell a financial instrument on a future date at a contracted price and are settled in cash.
Swaps - Interest rate and foreign exchange swap contracts are commitments to settle in cash at a future date or dates, based on differentials between specified financial indices (either two different interest rates in a single currency or two different rates each in a different currency), as applied to a notional principal amount. Swap contracts presented in Other in the table below correspond substantially to inflation rate swap contracts.
Options - Option contracts give the purchaser, for a fee, the right, but not the obligation, to buy or sell within a limited time a financial instrument including a flow of interests, foreign currencies, commodities, or financial instruments at a contracted price that may also be settled in cash, based on differentials between specific indices.
Credit Derivatives – Credit derivatives are instruments with value relating to the credit risk associated to the debt issued by a third party (the reference entity), which permits that one party (the purchaser of the hedge) transfers the risk to the counterparty (the seller of the hedge). The seller of the hedge should make payments as set forth in the contract when the reference entity undergoes a credit event, such as bankruptcy, default or debt restructuring. The seller of the hedge receives a premium for the hedge, but, on the other hand, assumes the risk that the underlying asset referenced in the contract undergoing a credit event, and the seller would have to make the payment to the purchaser of the hedge, which could be the notional amount of the credit derivative.
The total value of margins pledged in guarantee for ITAÚ UNIBANCO HOLDING amounted to R$ 7,793 (R$ 8,061 at 12/31/2010 and R$ 12,252 at 01/01/2010) and was basically comprised of government securities.
The following table shows the composition of derivatives by index:
| | | Off-Balance Sheet
Notional amount | | | Amortized cost | | | Gains / Losses | | | Fair value | |
| | | 12/31/2011 | | | 12/31/2011 | | | 12/31/2011 | | | 12/31/2011 | |
| Futures contracts | | | 268,806 | | | | 75 | | | | (49 | ) | | | 26 | |
| Purchase commitments | | | 251,094 | | | | 75 | | | | 19 | | | | 94 | |
| Foreign currency | | | 59,087 | | | | (1 | ) | | | 12 | | | | 11 | |
| Interbank market | | | 144,154 | | | | 1 | | | | - | | | | 1 | |
| Indices | | | 41,365 | | | | 75 | | | | 7 | | | | 82 | |
| Securities | | | 6,338 | | | | - | | | | - | | | | - | |
| Commodities | | | 122 | | | | - | | | | - | | | | - | |
| Other | | | 28 | | | | - | | | | - | | | | - | |
| Commitments to sell | | | 17,712 | | | | - | | | | (68 | ) | | | (68 | ) |
| Foreign currency | | | 15,796 | | | | - | | | | (63 | ) | | | (63 | ) |
| Interbank market | | | 52 | | | | - | | | | - | | | | - | |
| Indices | | | 1,106 | | | | - | | | | - | | | | - | |
| Securities | | | 230 | | | | - | | | | (3 | ) | | | (3 | ) |
| Commodities | | | 513 | | | | - | | | | (2 | ) | | | (2 | ) |
| Other | | | 15 | | | | - | | | | - | | | | - | |
| Swap contracts | | | | | | | 72 | | | | (120 | ) | | | (48 | ) |
| Asset position | | | 94,806 | | | | 2,155 | | | | 595 | | | | 2,750 | |
| Foreign currency | | | 9,883 | | | | 605 | | | | 7 | | | | 612 | |
| Interbank market | | | 39,936 | | | | 545 | | | | 50 | | | | 595 | |
| Fixed rate | | | 16,808 | | | | 227 | | | | 241 | | | | 468 | |
| Floating rate | | | 3,809 | | | | 3 | | | | - | | | | 3 | |
| Indices | | | 23,995 | | | | 739 | | | | 312 | | | | 1,051 | |
| Securities | | | 28 | | | | 23 | | | | (26 | ) | | | (3 | ) |
| Commodities | | | 3 | | | | - | | | | - | | | | - | |
| Other | | | 344 | | | | 13 | | | | 11 | | | | 24 | |
| Liability position | | | 94,734 | | | | (2,083 | ) | | | (715 | ) | | | (2,798 | ) |
| Foreign currency | | | 11,171 | | | | (608 | ) | | | 22 | | | | (586 | ) |
| Interbank market | | | 24,958 | | | | (100 | ) | | | 10 | | | | (90 | ) |
| Fixed rate | | | 21,733 | | | | (325 | ) | | | (301 | ) | | | (626 | ) |
| Floating rate | | | 6,144 | | | | (133 | ) | | | 2 | | | | (131 | ) |
| Indices | | | 29,225 | | | | (816 | ) | | | (477 | ) | | | (1,293 | ) |
| Securities | | | 112 | | | | (85 | ) | | | 34 | | | | (51 | ) |
| Commodities | | | 108 | | | | (1 | ) | | | (4 | ) | | | (5 | ) |
| Other | | | 1,283 | | | | (15 | ) | | | (1 | ) | | | (16 | ) |
| Option contracts | | | 1,108,517 | | | | 576 | | | | (739 | ) | | | (163 | ) |
| Purchase commitments – long position | | | 237,863 | | | | 1,122 | | | | (373 | ) | | | 749 | |
| Foreign currency | | | 17,481 | | | | 887 | | | | (289 | ) | | | 598 | |
| Interbank market | | | 36,911 | | | | 65 | | | | (36 | ) | | | 29 | |
| Floating rate | | | 278 | | | | 1 | | | | (1 | ) | | | - | |
| Indices | | | 181,517 | | | | 124 | | | | (58 | ) | | | 66 | |
| Securities | | | 1,162 | | | | 31 | | | | 11 | | | | 42 | |
| Commodities | | | 501 | | | | 14 | | | | - | | | | 14 | |
| Other | | | 13 | | | | - | | | | - | | | | - | |
| Commitments to sell – long position | | | 354,697 | | | | 1,457 | | | | 237 | | | | 1,694 | |
| Foreign currency | | | 7,635 | | | | 149 | | | | (41 | ) | | | 108 | |
| Interbank market | | | 27,212 | | | | 293 | | | | (49 | ) | | | 244 | |
| Fixed rate | | | 2 | | | | - | | | | 1 | | | | 1 | |
| Floating rate | | | 218 | | | | 1 | | | | - | | | | 1 | |
| Indices | | | 315,903 | | | | 915 | | | | (2 | ) | | | 913 | |
| Securities | | | 2,821 | | | | 82 | | | | 317 | | | | 399 | |
| Commodities | | | 768 | | | | 14 | | | | - | | | | 14 | |
| Other | | | 138 | | | | 3 | | | | 11 | | | | 14 | |
| Purchase commitments – short position | | | 174,398 | | | | (778 | ) | | | 47 | | | | (731 | ) |
| Foreign currency | | | 10,325 | | | | (454 | ) | | | (97 | ) | | | (551 | ) |
| Interbank market | | | 23,954 | | | | (47 | ) | | | 11 | | | | (36 | ) |
| Indices | | | 139,248 | | | | (258 | ) | | | 144 | | | | (114 | ) |
| Securities | | | 795 | | | | (15 | ) | | | (13 | ) | | | (28 | ) |
| Commodities | | | 65 | | | | (4 | ) | | | 2 | | | | (2 | ) |
| Other | | | 11 | | | | - | | | | - | | | | - | |
| Commitments to sell – short position | | | 341,559 | | | | (1,225 | ) | | | (650 | ) | | | (1,875 | ) |
| Foreign currency | | | 10,757 | | | | (309 | ) | | | 113 | | | | (196 | ) |
| Interbank market | | | 35,433 | | | | (178 | ) | | | (239 | ) | | | (417 | ) |
| Fixed rate | | | 2 | | | | - | | | | (1 | ) | | | (1 | ) |
| Indices | | | 293,394 | | | | (647 | ) | | | (197 | ) | | | (844 | ) |
| Securities | | | 1,636 | | | | (79 | ) | | | (316 | ) | | | (395 | ) |
| Commodities | | | 197 | | | | (9 | ) | | | 1 | | | | (8 | ) |
| Other | | | 140 | | | | (3 | ) | | | (11 | ) | | | (14 | ) |
| | | Off-Balance Sheet
Notional amount | | | Amortized cost | | | Gains / Losses | | | Fair Value | |
| | | 12/31/2011 | | | 12/31/2011 | | | 12/31/2011 | | | 12/31/2011 | |
| Forwards operations (onshore) | | | 17,248 | | | | 1,092 | | | | (31 | ) | | | 1,061 | |
| Purchases receivable | | | 8,702 | | | | 921 | | | | (62 | ) | | | 859 | |
| Foreign currency | | | 7,883 | | | | 623 | | | | (62 | ) | | | 561 | |
| Interbank market | | | 520 | | | | - | | | | - | | | | - | |
| Fixed rate | | | - | | | | 35 | | | | - | | | | 35 | |
| Floating rate | | | 262 | | | | 262 | | | | - | | | | 262 | |
| Commodities | | | 37 | | | | 1 | | | | - | | | | 1 | |
| Purchases payable | | | 1,351 | | | | (324 | ) | | | (9 | ) | | | (333 | ) |
| Foreign currency | | | 1,218 | | | | (43 | ) | | | (8 | ) | | | (51 | ) |
| Floating rate | | | - | | | | (262 | ) | | | - | | | | (262 | ) |
| Commodities | | | 131 | | | | (19 | ) | | | (1 | ) | | | (20 | ) |
| Other | | | 2 | | | | - | | | | - | | | | - | |
| Sales receivable | | | 2,230 | | | | 1,013 | | | | 7 | | | | 1,020 | |
| Foreign currency | | | 1,181 | | | | 24 | | | | 9 | | | | 33 | |
| Interbank market | | | 48 | | | | 1 | | | | - | | | | 1 | |
| Fixed rate | | | 148 | | | | 148 | | | | (1 | ) | | | 147 | |
| Floating rate | | | 110 | | | | 110 | | | | - | | | | 110 | |
| Securities | | | 731 | | | | 726 | | | | (1 | ) | | | 725 | |
| Commodities | | | 12 | | | | 4 | | | | - | | | | 4 | |
| Sales deliverable | | | 4,965 | | | | (518 | ) | | | 33 | | | | (485 | ) |
| Foreign currency | | | 4,905 | | | | (342 | ) | | | 32 | | | | (310 | ) |
| Fixed rate | | | - | | | | (54 | ) | | | - | | | | (54 | ) |
| Floating rate | | | - | | | | (110 | ) | | | - | | | | (110 | ) |
| Commodities | | | 60 | | | | (12 | ) | | | 1 | | | | (11 | ) |
| Credit derivatives | | | 7,194 | | | | 153 | | | | 136 | | | | 289 | |
| Asset position | | | 3,659 | | | | 242 | | | | 157 | | | | 399 | |
| Foreign currency | | | 117 | | | | - | | | | 1 | | | | 1 | |
| Fixed rate | | | 1,820 | | | | 226 | | | | 134 | | | | 360 | |
| Floating rate | | | - | | | | 5 | | | | 11 | | | | 16 | |
| Indices | | | - | | | | 11 | | | | (1 | ) | | | 10 | |
| Securities | | | 1,721 | | | | - | | | | 12 | | | | 12 | |
| Other | | | 1 | | | | - | | | | - | | | | - | |
| Liability position | | | 3,535 | | | | (89 | ) | | | (21 | ) | | | (110 | ) |
| Foreign currency | | | 117 | | | | - | | | | (1 | ) | | | (1 | ) |
| Fixed rate | | | 2,900 | | | | (89 | ) | | | (8 | ) | | | (97 | ) |
| Securities | | | 517 | | | | - | | | | (12 | ) | | | (12 | ) |
| Other | | | 1 | | | | - | | | | - | | | | - | |
| Forwards operations (offshore) | | | 31,285 | | | | 69 | | | | 56 | | | | 125 | |
| Asset position | | | 16,257 | | | | 421 | | | | 30 | | | | 451 | |
| Foreign currency | | | 15,862 | | | | 415 | | | | 30 | | | | 445 | |
| Interbank market | | | 19 | | | | - | | | | - | | | | - | |
| Floating rate | | | 376 | | | | 6 | | | | - | | | | 6 | |
| Liability position | | | 15,028 | | | | (352 | ) | | | 26 | | | | (326 | ) |
| Foreign currency | | | 14,946 | | | | (348 | ) | | | 26 | | | | (322 | ) |
| Interbank market | | | 13 | | | | - | | | | - | | | | - | |
| Floating rate | | | 69 | | | | (1 | ) | | | - | | | | (1 | ) |
| Indices | | | - | | | | (1 | ) | | | - | | | | (1 | ) |
| Securities | | | - | | | | (2 | ) | | | - | | | | (2 | ) |
| Swap with target flow | | | 102 | | | | - | | | | (2 | ) | | | (2 | ) |
| Asset position - Interbank market | | | 51 | | | | - | | | | - | | | | - | |
| Liability position - Interbank market | | | 51 | | | | - | | | | (2 | ) | | | (2 | ) |
| Target flow of swap - Asset position - Foreign currency | | | 53 | | | | - | | | | 4 | | | | 4 | |
| Other derivative financial instruments | | | 4,894 | | | | 695 | | | | 20 | | | | 715 | |
| Asset position | | | 4,640 | | | | 769 | | | | 33 | | | | 802 | |
| Foreign currency | | | 608 | | | | 55 | | | | 31 | | | | 86 | |
| Fixed rate | | | 973 | | | | 521 | | | | - | | | | 521 | |
| Securities | | | 3,054 | | | | 193 | | | | 2 | | | | 195 | |
| Other | | | 5 | | | | - | | | | - | | | | - | |
| Liability position | | | 254 | | | | (74 | ) | | | (13 | ) | | | (87 | ) |
| Foreign currency | | | 118 | | | | (74 | ) | | | (11 | ) | | | (85 | ) |
| Securities | | | 75 | | | | - | | | | - | | | | - | |
| Other | | | 61 | | | | - | | | | (2 | ) | | | (2 | ) |
| | | | ASSETS | | | | 8,175 | | | | 579 | | | | 8,754 | |
| | | | LIABILITIES | | | | (5,443 | ) | | | (1,304 | ) | | | (6,747 | ) |
| | | | TOTAL | | | | 2,732 | | | | (725 | ) | | | 2,007 | |
| Derivative contracts mature as follows (in days): |
| Off-Balance Sheet - Notional amount | | 0 - 30 | | | 31 - 180 | | | 181 - 365 | | | Over 365 | | | 12/31/2011 | |
| Futures | | | 75,850 | | | | 67,789 | | | | 36,072 | | | | 89,095 | | | | 268,806 | |
| Swaps | | | 9,939 | | | | 16,691 | | | | 19,679 | | | | 46,342 | | | | 92,651 | |
| Options | | | 846,277 | | | | 58,377 | | | | 176,965 | | | | 26,898 | | | | 1,108,517 | |
| Forwards (onshore) | | | 3,393 | | | | 7,970 | | | | 3,626 | | | | 2,259 | | | | 17,248 | |
| Credit derivatives | | | 88 | | | | 1,902 | | | | 1,025 | | | | 4,179 | | | | 7,194 | |
| Forwards (offshore) | | | 6,636 | | | | 14,066 | | | | 6,899 | | | | 3,684 | | | | 31,285 | |
| Swaps with target flow | | | - | | | | - | | | | - | | | | 51 | | | | 51 | |
| Target flow of swap | | | - | | | | - | | | | - | | | | 53 | | | | 53 | |
| Other | | | 112 | | | | 1,372 | | | | 760 | | | | 2,650 | | | | 4,894 | |
| | | Off-Balance Sheet
Notional amount | | | Amortized cost | | | Gains / Losses | | | Fair value | |
| | | 12/31/2010 | | | 12/31/2010 | | | 12/31/2010 | | | 12/31/2010 | |
| Futures contracts | | | 292,049 | | | | 5 | | | | (60 | ) | | | (55 | ) |
| Purchase commitments | | | 127,499 | | | | (1 | ) | | | 174 | | | | 173 | |
| Foreign currency | | | 8,128 | | | | (1 | ) | | | 1 | | | | - | |
| Interbank market | | | 98,353 | | | | - | | | | 45 | | | | 45 | |
| Indices | | | 19,288 | | | | - | | | | 95 | | | | 95 | |
| Securities | | | 1,645 | | | | - | | | | - | | | | - | |
| Commodities | | | 84 | | | | - | | | | 33 | | | | 33 | |
| Other | | | 1 | | | | - | | | | - | | | | - | |
| Commitments to sell | | | 164,550 | | | | 6 | | | | (234 | ) | | | (228 | ) |
| Foreign currency | | | 13,057 | | | | 6 | | | | (20 | ) | | | (14 | ) |
| Interbank market | | | 113,173 | | | | - | | | | (45 | ) | | | (45 | ) |
| Indices | | | 32,033 | | | | - | | | | (127 | ) | | | (127 | ) |
| Securities | | | 4,230 | | | | - | | | | - | | | | - | |
| Commodities | | | 2,048 | | | | - | | | | (42 | ) | | | (42 | ) |
| Other | | | 9 | | | | - | | | | - | | | | - | |
| Swap contracts | | | | | | | 344 | | | | 580 | | | | 924 | |
| Asset position | | | 68,839 | | | | 2,160 | | | | 777 | | | | 2,937 | |
| Foreign currency | | | 7,330 | | | | (292 | ) | | | 238 | | | | (54 | ) |
| Interbank market | | | 34,370 | | | | 1,299 | | | | 161 | | | | 1,460 | |
| Fixed rate | | | 9,277 | | | | 326 | | | | 140 | | | | 466 | |
| Floating rate | | | 865 | | | | 2 | | | | 18 | | | | 20 | |
| Indices | | | 16,745 | | | | 819 | | | | 218 | | | | 1,037 | |
| Securities | | | 32 | | | | 3 | | | | - | | | | 3 | |
| Commodities | | | 219 | | | | 3 | | | | 2 | | | | 5 | |
| Other | | | 1 | | | | - | | | | - | | | | - | |
| Liability position | | | 68,495 | | | | (1,816 | ) | | | (197 | ) | | | (2,013 | ) |
| Foreign currency | | | 14,609 | | | | (310 | ) | | | (17 | ) | | | (327 | ) |
| Interbank market | | | 19,443 | | | | (358 | ) | | | 138 | | | | (220 | ) |
| Fixed rate | | | 7,835 | | | | (256 | ) | | | (133 | ) | | | (389 | ) |
| Floating rate | | | 3,272 | | | | (2 | ) | | | (1 | ) | | | (3 | ) |
| Indices | | | 23,122 | | | | (865 | ) | | | (181 | ) | | | (1,046 | ) |
| Securities | | | 29 | | | | (1 | ) | | | - | | | | (1 | ) |
| Commodities | | | 178 | | | | (24 | ) | | | (3 | ) | | | (27 | ) |
| Other | | | 7 | | | | - | | | | - | | | | - | |
| Option contracts | | | 2,330,950 | | | | (570 | ) | | | 235 | | | | (335 | ) |
| Purchase commitments – long position | | | 695,908 | | | | 1,182 | | | | (108 | ) | | | 1,074 | |
| Foreign currency | | | 24,905 | | | | 414 | | | | (104 | ) | | | 310 | |
| Interbank market | | | 530,428 | | | | 468 | | | | 2 | | | | 470 | |
| Floating rate | | | 314 | | | | 2 | | | | - | | | | 2 | |
| Indices | | | 138,085 | | | | 182 | | | | (53 | ) | | | 129 | |
| Securities | | | 1,534 | | | | 86 | | | | 27 | | | | 113 | |
| Commodities | | | 642 | | | | 30 | | | | 20 | | | | 50 | |
| Commitments to sell – long position | | | 526,323 | | | | 625 | | | | 53 | | | | 678 | |
| Foreign currency | | | 12,295 | | | | 339 | | | | 142 | | | | 481 | |
| Interbank market | | | 404,532 | | | | 128 | | | | (28 | ) | | | 100 | |
| Floating rate | | | 282 | | | | - | | | | - | | | | - | |
| Indices | | | 107,034 | | | | 109 | | | | (48 | ) | | | 61 | |
| Securities | | | 1,625 | | | | 40 | | | | (6 | ) | | | 34 | |
| Commodities | | | 555 | | | | 9 | | | | (7 | ) | | | 2 | |
| Purchase commitments – short position | | | 527,731 | | | | (1,587 | ) | | | 342 | | | | (1,245 | ) |
| Foreign currency | | | 26,547 | | | | (802 | ) | | | 341 | | | | (461 | ) |
| Interbank market | | | 376,482 | | | | (256 | ) | | | (7 | ) | | | (263 | ) |
| Indices | | | 123,221 | | | | (449 | ) | | | 50 | | | | (399 | ) |
| Securities | | | 864 | | | | (49 | ) | | | (27 | ) | | | (76 | ) |
| Commodities | | | 617 | | | | (31 | ) | | | (15 | ) | | | (46 | ) |
| Commitments to sell – short position | | | 580,988 | | | | (790 | ) | | | (52 | ) | | | (842 | ) |
| Foreign currency | | | 16,715 | | | | (451 | ) | | | (95 | ) | | | (546 | ) |
| Interbank market | | | 444,963 | | | | (196 | ) | | | 3 | | | | (193 | ) |
| Indices | | | 118,333 | | | | (71 | ) | | | 22 | | | | (49 | ) |
| Securities | | | 825 | | | | (58 | ) | | | 7 | | | | (51 | ) |
| Commodities | | | 152 | | | | (14 | ) | | | 11 | | | | (3 | ) |
| | | Off-Balance Sheet
Notional amount | | | Amortized cost | | | Gains / Losses | | | Fair value | |
| | | 12/31/2010 | | | 12/31/2010 | | | 12/31/2010 | | | 12/31/2010 | |
| Forwards operations (onshore) | | | 1,445 | | | | 1,432 | | | | (27 | ) | | | 1,405 | |
| Purchases receivable | | | 21 | | | | 57 | | | | 29 | | | | 86 | |
| Interbank market | | | - | | | | 36 | | | | - | | | | 36 | |
| Floating rate | | | 21 | | | | 21 | | | | 29 | | | | 50 | |
| Purchases payable - Floating rate | | | - | | | | (21 | ) | | | (29 | ) | | | (50 | ) |
| Sales receivable | | | 1,424 | | | | 1,397 | | | | 1 | | | | 1,398 | |
| Foreign currency | | | 4 | | | | 4 | | | | - | | | | 4 | |
| Securities | | | 1,419 | | | | 1,392 | | | | 1 | | | | 1,393 | |
| Commodities | | | 1 | | | | 1 | | | | - | | | | 1 | |
| Sales deliverable - Floating rate | | | - | | | | (1 | ) | | | (28 | ) | | | (29 | ) |
| Credit derivatives | | | 6,701 | | | | 125 | | | | 7 | | | | 132 | |
| Asset position | | | 2,902 | | | | 258 | | | | 3 | | | | 261 | |
| Foreign currency | | | 53 | | | | - | | | | 1 | | | | 1 | |
| Fixed rate | | | 2,622 | | | | 258 | | | | (2 | ) | | | 256 | |
| Securities | | | 227 | | | | - | | | | 4 | | | | 4 | |
| Liability position | | | 3,799 | | | | (133 | ) | | | 4 | | | | (129 | ) |
| Foreign currency | | | 22 | | | | - | | | | (1 | ) | | | (1 | ) |
| Fixed rate | | | 3,126 | | | | (133 | ) | | | 10 | | | | (123 | ) |
| Securities | | | 651 | | | | - | | | | (5 | ) | | | (5 | ) |
| Forwards operations (offshore) | | | 36,958 | | | | (522 | ) | | | 22 | | | | (500 | ) |
| Asset position | | | 13,832 | | | | 597 | | | | 15 | | | | 612 | |
| Foreign currency | | | 13,121 | | | | 548 | | | | 8 | | | | 556 | |
| Fixed rate | | | 3 | | | | 1 | | | | - | | | | 1 | |
| Floating rate | | | 509 | | | | 8 | | | | - | | | | 8 | |
| Commodities | | | 199 | | | | 40 | | | | 7 | | | | 47 | |
| Liability position | | | 23,126 | | | | (1,119 | ) | | | 7 | | | | (1,112 | ) |
| Foreign currency | | | 22,759 | | | | (1,098 | ) | | | 9 | | | | (1,089 | ) |
| Interbank market | | | 27 | | | | - | | | | (1 | ) | | | (1 | ) |
| Floating rate | | | 273 | | | | (3 | ) | | | - | | | | (3 | ) |
| Commodities | | | 67 | | | | (18 | ) | | | (1 | ) | | | (19 | ) |
| Swap with USD check | | | | | | | | | | | | | | | | |
| Asset position – Interbank market | | | 6 | | | | - | | | | - | | | | - | |
| Liability position – Interbank market | | | 6 | | | | - | | | | - | | | | - | |
| Check of swap – Liability position – Foreign currency | | | 25 | | | | - | | | | - | | | | - | |
| Other derivative financial instruments | | | 3,755 | | | | 626 | | | | (91 | ) | | | 535 | |
| Asset position | | | 3,395 | | | | 785 | | | | (54 | ) | | | 731 | |
| Foreign currency | | | 259 | | | | 189 | | | | 5 | | | | 194 | |
| Fixed rate | | | 698 | | | | 375 | | | | 2 | | | | 377 | |
| Floating rate | | | - | | | | - | | | | (3 | ) | | | (3 | ) |
| Securities | | | 2,438 | | | | 221 | | | | (58 | ) | | | 163 | |
| Liability position | | | 360 | | | | (159 | ) | | | (37 | ) | | | (196 | ) |
| | | | ASSETS | | | | 7,061 | | | | 716 | | | | 7,777 | |
| | | | LIABILITIES | | | | (5,621 | ) | | | (50 | ) | | | (5,671 | ) |
| | | | TOTAL | | | | 1,440 | | | | 666 | | | | 2,106 | |
| Derivative contracts mature as follows (in days): |
| Off-Balance Sheet - Notional Amount | | 0 - 30 | | | 31 - 180 | | | 181 - 365 | | | Over 365 | | | 12/31/2010 | |
| Futures | | | 108,359 | | | | 64,874 | | | | 49,747 | | | | 69,069 | | | | 292,049 | |
| Swaps | | | 5,318 | | | | 16,169 | | | | 8,225 | | | | 36,967 | | | | 66,679 | |
| Options | | | 1,292,156 | | | | 439,940 | | | | 506,039 | | | | 92,815 | | | | 2,330,950 | |
| Forwards (onshore) | | | 274 | | | | 1,143 | | | | 28 | | | | - | | | | 1,445 | |
| Credit derivatives | | | - | | | | 1,011 | | | | 592 | | | | 5,098 | | | | 6,701 | |
| Forwards (offshore) | | | 13,658 | | | | 13,233 | | | | 6,051 | | | | 4,016 | | | | 36,958 | |
| Swap with USD check | | | - | | | | - | | | | 6 | | | | - | | | | 6 | |
| Check of swap | | | 6 | | | | 16 | | | | 3 | | | | - | | | | 25 | |
| Other | | | 105 | | | | 927 | | | | 405 | | | | 2,318 | | | | 3,755 | |
| | | Off-Balance Sheet
Notional amount | | | Amortized cost | | | Gains / Losses | | | Fair value | |
| | | 1/1/2010 | | | 1/1/2010 | | | 1/1/2010 | | | 1/1/2010 | |
| Futures contracts | | | 216,786 | | | | (2 | ) | | | (24 | ) | | | (26 | ) |
| Purchase commitments | | | 94,210 | | | | (1 | ) | | | 30 | | | | 29 | |
| Foreign currency | | | 3,160 | | | | - | | | | 22 | | | | 22 | |
| Interbank market | | | 78,537 | | | | 1 | | | | 18 | | | | 19 | |
| Indices | | | 10,314 | | | | (2 | ) | | | 2 | | | | - | |
| Securities | | | 2,132 | | | | - | | | | - | | | | - | |
| Commodities | | | 64 | | | | - | | | | (12 | ) | | | (12 | ) |
| Other | | | 3 | | | | - | | | | - | | | | - | |
| Commitments to sell | | | 122,576 | | | | (1 | ) | | | (54 | ) | | | (55 | ) |
| Foreign currency | | | 18,939 | | | | (1 | ) | | | (25 | ) | | | (26 | ) |
| Interbank market | | | 82,302 | | | | 4 | | | | (21 | ) | | | (17 | ) |
| Indices | | | 11,843 | | | | (3 | ) | | | (4 | ) | | | (7 | ) |
| Securities | | | 3,144 | | | | - | | | | - | | | | - | |
| Commodities | | | 6,339 | | | | (1 | ) | | | (4 | ) | | | (5 | ) |
| Other | | | 9 | | | | - | | | | - | | | | - | |
| Swap contracts | | | | | | | 401 | | | | 64 | | | | 465 | |
| Asset position | | | 69,018 | | | | 2,128 | | | | 451 | | | | 2,579 | |
| Foreign currency | | | 7,098 | | | | 46 | | | | 56 | | | | 102 | |
| Interbank market | | | 31,371 | | | | 1,398 | | | | 20 | | | | 1,418 | |
| Fixed rate | | | 10,946 | | | | 261 | | | | 106 | | | | 367 | |
| Floating rate | | | 6,538 | | | | (2 | ) | | | 6 | | | | 4 | |
| Indices | | | 12,964 | | | | 416 | | | | 264 | | | | 680 | |
| Securities | | | 11 | | | | 5 | | | | (1 | ) | | | 4 | |
| Commodities | | | 89 | | | | 4 | | | | - | | | | 4 | |
| Other | | | 1 | | | | - | | | | - | | | | - | |
| Liability position | | | 68,617 | | | | (1,727 | ) | | | (387 | ) | | | (2,114 | ) |
| Foreign currency | | | 11,560 | | | | (285 | ) | | | (9 | ) | | | (294 | ) |
| Interbank market | | | 19,601 | | | | (795 | ) | | | 73 | | | | (722 | ) |
| Fixed rate | | | 15,387 | | | | (211 | ) | | | (183 | ) | | | (394 | ) |
| Floating rate | | | 6,473 | | | | (9 | ) | | | - | | | | (9 | ) |
| Indices | | | 15,433 | | | | (414 | ) | | | (267 | ) | | | (681 | ) |
| Commodities | | | 106 | | | | (13 | ) | | | (1 | ) | | | (14 | ) |
| Other | | | 57 | | | | - | | | | - | | | | - | |
| Option contracts | | | 1,728,321 | | | | (83 | ) | | | 61 | | | | (22 | ) |
| Purchase commitments – long position | | | 489,888 | | | | 1,421 | | | | (462 | ) | | | 959 | |
| Foreign currency | | | 67,850 | | | | 596 | | | | (418 | ) | | | 178 | |
| Interbank market | | | 330,854 | | | | 491 | | | | (94 | ) | | | 397 | |
| Floating rate | | | 33 | | | | - | | | | - | | | | - | |
| Indices | | | 90,111 | | | | 264 | | | | 50 | | | | 314 | |
| Securities | | | 801 | | | | 53 | | | | (6 | ) | | | 47 | |
| Commodities | | | 239 | | | | 17 | | | | 6 | | | | 23 | |
| Commitments to sell – long position | | | 442,926 | | | | 617 | | | | 250 | | | | 867 | |
| Foreign currency | | | 12,721 | | | | 319 | | | | 30 | | | | 349 | |
| Interbank market | | | 388,004 | | | | 185 | | | | (11 | ) | | | 174 | |
| Indices | | | 41,059 | | | | 98 | | | | 229 | | | | 327 | |
| Securities | | | 1,010 | | | | 3 | | | | (1 | ) | | | 2 | |
| Commodities | | | 132 | | | | 12 | | | | 3 | | | | 15 | |
| Purchase commitments – short position | | | 379,223 | | | | (1,433 | ) | | | 415 | | | | (1,018 | ) |
| Foreign currency | | | 48,514 | | | | (619 | ) | | | 414 | | | | (205 | ) |
| Interbank market | | | 246,600 | | | | (452 | ) | | | 71 | | | | (381 | ) |
| Indices | | | 83,355 | | | | (332 | ) | | | (80 | ) | | | (412 | ) |
| Securities | | | 616 | | | | (17 | ) | | | 4 | | | | (13 | ) |
| Commodities | | | 138 | | | | (13 | ) | | | 6 | | | | (7 | ) |
| Commitments to sell – short position | | | 416,284 | | | | (688 | ) | | | (142 | ) | | | (830 | ) |
| Foreign currency | | | 16,264 | | | | (316 | ) | | | (144 | ) | | | (460 | ) |
| Interbank market | | | 317,681 | | | | (182 | ) | | | 16 | | | | (166 | ) |
| Fixed rate | | | - | | | | (21 | ) | | | 10 | | | | (11 | ) |
| Indices | | | 82,089 | | | | (159 | ) | | | (175 | ) | | | (334 | ) |
| Securities | | | 147 | | | | 5 | | | | 140 | | | | 145 | |
| Commodities | | | 103 | | | | (15 | ) | | | 11 | | | | (4 | ) |
| | | Off-Balance Sheet
Notional amount | | | Amortized cost | | | Gains / Losses | | | Fair value | |
| | | 1/1/2010 | | | 1/1/2010 | | | 1/1/2010 | | | 1/1/2010 | |
| Forwards operations (onshore) | | | 68 | | | | 32 | | | | - | | | | 32 | |
| Purchases receivable | | | 49 | | | | 49 | | | | - | | | | 49 | |
| Foreign currency | | | - | | | | 1 | | | | - | | | | 1 | |
| Floating rate | | | 48 | | | | 48 | | | | - | | | | 48 | |
| Commodities | | | 1 | | | | - | | | | - | | | | - | |
| Purchases payable - Floating rate | | | - | | | | (48 | ) | | | - | | | | (48 | ) |
| Sales receivable | | | 19 | | | | 50 | | | | - | | | | 50 | |
| Interbank market | | | - | | | | 31 | | | | - | | | | 31 | |
| Floating rate | | | 19 | | | | 19 | | | | - | | | | 19 | |
| Sales deliverable - Floating rate | | | - | | | | (19 | ) | | | - | | | | (19 | ) |
| Credit derivatives | | | 4,532 | | | | (78 | ) | | | (13 | ) | | | (91 | ) |
| Asset position | | | 1,786 | | | | 19 | | | | (4 | ) | | | 15 | |
| Foreign currency | | | 137 | | | | 1 | | | | - | | | | 1 | |
| Fixed rate | | | 1,615 | | | | 18 | | | | (6 | ) | | | 12 | |
| Indices | | | 2 | | | | - | | | | - | | | | - | |
| Securities | | | 10 | | | | - | | | | 1 | | | | 1 | |
| Other | | | 22 | | | | - | | | | 1 | | | | 1 | |
| Liability position | | | 2,746 | | | | (97 | ) | | | (9 | ) | | | (106 | ) |
| Foreign currency | | | - | | | | (1 | ) | | | - | | | | (1 | ) |
| Interbank market | | | 50 | | | | - | | | | - | | | | - | |
| Fixed rate | | | 2,696 | | | | (96 | ) | | | (7 | ) | | | (103 | ) |
| Securities | | | - | | | | - | | | | (1 | ) | | | (1 | ) |
| Other | | | - | | | | - | | | | (1 | ) | | | (1 | ) |
| Forwards operations (offshore) | | | 13,723 | | | | (94 | ) | | | - | | | | (94 | ) |
| Asset position | | | 6,609 | | | | 313 | | | | - | | | | 313 | |
| Foreign currency | | | 5,584 | | | | 279 | | | | - | | | | 279 | |
| Interbank market | | | 213 | | | | 20 | | | | - | | | | 20 | |
| Fixed rate | | | 532 | | | | 4 | | | | - | | | | 4 | |
| Securities | | | 27 | | | | - | | | | - | | | | - | |
| Other | | | 253 | | | | 10 | | | | - | | | | 10 | |
| Liability position | | | 7,114 | | | | (407 | ) | | | - | | | | (407 | ) |
| Foreign currency | | | 6,659 | | | | (393 | ) | | | - | | | | (393 | ) |
| Interbank market | | | 2 | | | | - | | | | - | | | | - | |
| Fixed rate | | | 94 | | | | (10 | ) | | | - | | | | (10 | ) |
| Floating rate | | | 348 | | | | (3 | ) | | | - | | | | (3 | ) |
| Indices | | | 11 | | | | (1 | ) | | | - | | | | (1 | ) |
| Swap with USD check | | | 1,935 | | | | 17 | | | | (58 | ) | | | (41 | ) |
| Asset position | | | 976 | | | | 80 | | | | (31 | ) | | | 49 | |
| Foreign currency | | | 505 | | | | 31 | | | | (30 | ) | | | 1 | |
| Interbank market | | | 399 | | | | 49 | | | | (1 | ) | | | 48 | |
| Fixed rate | | | 72 | | | | - | | | | - | | | | - | |
| Liability position | | | 959 | | | | (63 | ) | | | (27 | ) | | | (90 | ) |
| Foreign currency | | | 641 | | | | (41 | ) | | | (17 | ) | | | (58 | ) |
| Interbank market | | | 292 | | | | (21 | ) | | | (10 | ) | | | (31 | ) |
| Fixed rate | | | 26 | | | | (1 | ) | | | - | | | | (1 | ) |
| Check of swap | | | 3,160 | | | | (102 | ) | | | 148 | | | | 46 | |
| Asset position | | | 2,451 | | | | 122 | | | | 64 | | | | 186 | |
| Foreign currency | | | 2,447 | | | | 122 | | | | 64 | | | | 186 | |
| Indices | | | 4 | | | | - | | | | - | | | | - | |
| Liability position - Floating rate | | | 709 | | | | (224 | ) | | | 84 | | | | (140 | ) |
| Other derivative financial instruments | | | 11,936 | | | | 14 | | | | (26 | ) | | | (12 | ) |
| Asset position | | | 7,548 | | | | 557 | | | | (35 | ) | | | 522 | |
| Foreign currency | | | 3,234 | | | | 425 | | | | - | | | | 425 | |
| Interbank market | | | 2,270 | | | | - | | | | - | | | | - | |
| Securities | | | 1,890 | | | | 114 | | | | (36 | ) | | | 78 | |
| Commodities | | | 154 | | | | 18 | | | | 1 | | | | 19 | |
| Liability position | | | 4,388 | | | | (543 | ) | | | 9 | | | | (534 | ) |
| Foreign currency | | | 4,287 | | | | (506 | ) | | | 9 | | | | (497 | ) |
| Fixed rate | | | 30 | | | | (29 | ) | | | - | | | | (29 | ) |
| Commodities | | | 71 | | | | (8 | ) | | | - | | | | (8 | ) |
| | | | ASSETS | | | | 5,356 | | | | 233 | | | | 5,589 | |
| | | | LIABILITIES | | | | (5,251 | ) | | | (81 | ) | | | (5,332 | ) |
| | | | TOTAL | | | | 105 | | | | 152 | | | | 257 | |
| Derivative contracts mature as follows (in days): |
| Off-Balance Sheet - Notional Amount | | 0 - 30 | | | 31 - 180 | | | 181 - 365 | | | Over 365 | | | 1/1/2010 | |
| Futures | | | 62,714 | | | | 52,906 | | | | 30,269 | | | | 70,897 | | | | 216,786 | |
| Swaps | | | 19,085 | | | | 14,918 | | | | 11,131 | | | | 21,756 | | | | 66,890 | |
| Options | | | 539,139 | | | | 266,126 | | | | 573,715 | | | | 349,341 | | | | 1,728,321 | |
| Forwards (onshore) | | | 67 | | | | 1 | | | | - | | | | - | | | | 68 | |
| Credit derivatives | | | 469 | | | | 1,259 | | | | 663 | | | | 2,141 | | | | 4,532 | |
| Forwards (offshore) | | | 5,336 | | | | 5,631 | | | | 1,654 | | | | 1,102 | | | | 13,723 | |
| Swaps with USD Check | | | 446 | | | | 19 | | | | - | | | | 431 | | | | 896 | |
| Check of swap | | | 369 | | | | 151 | | | | 68 | | | | 2,572 | | | | 3,160 | |
| Other | | | 3,791 | | | | 4,067 | | | | 1,689 | | | | 2,389 | | | | 11,936 | |
Derivative financial instruments
The composition of the Derivative Financial Instruments portfolio (assets and liabilities) by type of instrument, stated fair value and by maturity.
| | | 12/31/2011 | |
| | | Fair Value | | | % | | | 0-30
days | | | 31-90
days | | | 91-180
days | | | 181-365
days | | | 366-720
days | | | Over 720
days | |
| ASSETS | | | | | | | | | | | | | | | | | | | | | | | | | | | | | | | | |
| Futures | | | 26 | | | | 0.4 | | | | 1 | | | | 51 | | | | 5 | | | | (1 | ) | | | (3 | ) | | | (27 | ) |
| BM&F Bovespa | | | 31 | | | | 0.4 | | | | 1 | | | | 57 | | | | 5 | | | | (1 | ) | | | (4 | ) | | | (27 | ) |
| Financial institutions | | | (4 | ) | | | 0.0 | | | | - | | | | (2 | ) | | | - | | | | (2 | ) | | | - | | | | - | |
| Companies | | | (1 | ) | | | 0.0 | | | | - | | | | (4 | ) | | | - | | | | 2 | | | | 1 | | | | - | |
| Option premiums | | | 2,443 | | | | 27.9 | | | | 1,252 | | | | 182 | | | | 223 | | | | 660 | | | | 113 | | | | 13 | |
| BM&F Bovespa | | | 1,689 | | | | 19.3 | | | | 1,162 | | | | 11 | | | | 35 | | | | 471 | | | | 10 | | | | - | |
| Financial institutions | | | 286 | | | | 3.3 | | | | 45 | | | | 67 | | | | 59 | | | | 87 | | | | 27 | | | | 1 | |
| Companies | | | 468 | | | | 5.3 | | | | 45 | | | | 104 | | | | 129 | | | | 102 | | | | 76 | | | | 12 | |
| Forwards (onshore) | | | 1,879 | | | | 21.3 | | | | 644 | | | | 384 | | | | 156 | | | | 209 | | | | 146 | | | | 340 | |
| BM&F Bovespa | | | 727 | | | | 8.3 | | | | 461 | | | | 219 | | | | 47 | | | | - | | | | - | | | | - | |
| Financial institutions | | | 80 | | | | 0.9 | | | | 74 | | | | - | | | | 1 | | | | 2 | | | | 3 | | | | - | |
| Companies | | | 1,072 | | | | 12.1 | | | | 109 | | | | 165 | | | | 108 | | | | 207 | | | | 143 | | | | 340 | |
| Swaps – Difference receivable | | | 2,750 | | | | 31.4 | | | | 230 | | | | 351 | | | | 168 | | | | 502 | | | | 534 | | | | 965 | |
| BM&F Bovespa | | | 332 | | | | 3.8 | | | | 13 | | | | 25 | | | | 31 | | | | 61 | | | | 22 | | | | 180 | |
| Financial institutions | | | 259 | | | | 3.0 | | | | 29 | | | | 63 | | | | 13 | | | | 28 | | | | 49 | | | | 77 | |
| Companies | | | 2,155 | | | | 24.6 | | | | 187 | | | | 262 | | | | 122 | | | | 413 | | | | 463 | | | | 708 | |
| Individuals | | | 4 | | | | 0.0 | | | | 1 | | | | 1 | | | | 2 | | | | - | | | | - | | | | - | |
| Credit derivatives | | | 399 | | | | 4.6 | | | | - | | | | 15 | | | | 17 | | | | 6 | | | | 52 | | | | 309 | |
| Financial institutions | | | 95 | | | | 1.1 | | | | - | | | | 15 | | | | 17 | | | | 2 | | | | 2 | | | | 59 | |
| Companies | | | 304 | | | | 3.5 | | | | - | | | | - | | | | - | | | | 4 | | | | 50 | | | | 250 | |
| Forwards (offshore) | | | 451 | | | | 5.2 | | | | 96 | | | | 101 | | | | 73 | | | | 67 | | | | 44 | | | | 70 | |
| Financial institutions | | | 279 | | | | 3.2 | | | | 83 | | | | 73 | | | | 45 | | | | 31 | | | | 8 | | | | 39 | |
| Companies | | | 172 | | | | 2.0 | | | | 13 | | | | 28 | | | | 28 | | | | 36 | | | | 36 | | | | 31 | |
| Swaps with target flow - Companies | | | 4 | | | | 0.0 | | | | - | | | | - | | | | - | | | | - | | | | - | | | | 4 | |
| Other | | | 802 | | | | 9.2 | | | | 54 | | | | 470 | | | | 3 | | | | 30 | | | | 74 | | | | 171 | |
| Financial institutions | | | 778 | | | | 8.9 | | | | 54 | | | | 467 | | | | 1 | | | | 11 | | | | 74 | | | | 171 | |
| Companies | | | 24 | | | | 0.3 | | | | - | | | | 3 | | | | 2 | | | | 19 | | | | - | | | | - | |
| Total (*) | | | 8,754 | | | | 100.0 | | | | 2,277 | | | | 1,554 | | | | 645 | | | | 1,473 | | | | 960 | | | | 1,845 | |
| % per maturity term | | | | | | | | | | | 26.0 | % | | | 17.8 | % | | | 7.4 | % | | | 16.8 | % | | | 11.0 | % | | | 21.1 | % |
(*) Of the total asset portfolio of Derivative Financial Instruments, R$ 5,949 refers to current and R$ 2,805 to non-current.
| | | 12/31/2010 | |
| | | Fair value | | | % | | | 0-30
days | | | 31-90
days | | | 91-180
days | | | 181-365
days | | | 366-720
days | | | Over 720
days | |
| ASSETS | | | | | | | | | | | | | | | | | | | | | | | | | | | | | | | | |
| Option premiums | | | 1,752 | | | | 22.5 | | | | 213 | | | | 230 | | | | 222 | | | | 405 | | | | 106 | | | | 576 | |
| BM&F Bovespa | | | 1,305 | | | | 16.7 | | | | 746 | | | | 72 | | | | 123 | | | | 287 | | | | 77 | | | | - | |
| Financial institutions | | | 364 | | | | 4.7 | | | | 24 | | | | 116 | | | | 90 | | | | 106 | | | | 22 | | | | 6 | |
| Companies | | | 83 | | | | 1.1 | | | | (557 | ) | | | 42 | | | | 9 | | | | 12 | | | | 7 | | | | 570 | |
| Forwards (onshore) | | | 1,484 | | | | 19.1 | | | | 323 | | | | 1,071 | | | | 64 | | | | 26 | | | | - | | | | - | |
| BM&F Bovespa | | | 1,398 | | | | 18.0 | | | | 251 | | | | 1,059 | | | | 62 | | | | 26 | | | | - | | | | - | |
| Financial institutions | | | 86 | | | | 1.1 | | | | 72 | | | | 12 | | | | 2 | | | | - | | | | - | | | | - | |
| Swaps - Difference receivable | | | 2,937 | | | | 37.8 | | | | 286 | | | | 249 | | | | 191 | | | | 655 | | | | 621 | | | | 935 | |
| BM&F Bovespa | | | 271 | | | | 3.5 | | | | 5 | | | | 8 | | | | 14 | | | | 55 | | | | 63 | | | | 126 | |
| Financial institutions | | | 441 | | | | 5.7 | | | | 167 | | | | 44 | | | | 3 | | | | 73 | | | | 21 | | | | 133 | |
| Companies | | | 2,203 | | | | 28.3 | | | | 112 | | | | 193 | | | | 163 | | | | 524 | | | | 536 | | | | 675 | |
| Individuals | | | 22 | | | | 0.3 | | | | 2 | | | | 4 | | | | 11 | | | | 3 | | | | 1 | | | | 1 | |
| Credit derivatives | | | 261 | | | | 3.4 | | | | - | | | | 22 | | | | 1 | | | | 2 | | | | 1 | | | | 235 | |
| Financial institutions | | | 77 | | | | 1.0 | | | | - | | | | 22 | | | | 1 | | | | 1 | | | | 1 | | | | 52 | |
| Companies | | | 184 | | | | 2.4 | | | | - | | | | - | | | | - | | | | 1 | | | | - | | | | 183 | |
| Forwards (offshore) | | | 612 | | | | 7.8 | | | | 273 | | | | 128 | | | | 96 | | | | 96 | | | | 13 | | | | 6 | |
| Financial institutions | | | 151 | | | | 1.9 | | | | 64 | | | | 39 | | | | 21 | | | | 19 | | | | 4 | | | | 4 | |
| Companies | | | 460 | | | | 5.9 | | | | 209 | | | | 88 | | | | 75 | | | | 77 | | | | 9 | | | | 2 | |
| Individuals | | | 1 | | | | 0.0 | | | | - | | | | 1 | | | | - | | | | - | | | | - | | | | - | |
| Other | | | 731 | | | | 9.4 | | | | 50 | | | | 326 | | | | - | | | | 130 | | | | 12 | | | | 213 | |
| Financial institutions | | | 724 | | | | 9.3 | | | | 50 | | | | 326 | | | | - | | | | 130 | | | | 5 | | | | 213 | |
| Companies | | | 7 | | | | 0.1 | | | | - | | | | - | | | | - | | | | - | | | | 7 | | | | - | |
| Total (*) | | | 7,777 | | | | 100.0 | | | | 1,145 | | | | 2,026 | | | | 574 | | | | 1,314 | | | | 753 | | | | 1,965 | |
| % per maturity term | | | | | | | | | | | 14.7 | % | | | 26.1 | % | | | 7.4 | % | | | 16.9 | % | | | 9.7 | % | | | 25.3 | % |
(*) Of the total asset portfolio of Derivative Financial Instruments, R$ 5,059 refers to current and R$ 2,718 to non-current.
| | | 1/1/2010 | |
| | | Fair value | | | % | | | 0-30
days | | | 31-90
days | | | 91-180
days | | | 181-365
days | | | 366-720
days | | | Over 720
days | |
| ASSETS | | | | | | | | | | | | | | | | | | | | | | | | | | | | | | | | |
| Option premiums | | | 1,826 | | | | 32.7 | | | | 750 | | | | 201 | | | | 156 | | | | 331 | | | | 385 | | | | 3 | |
| BM&F Bovespa | | | 1,573 | | | | 28.1 | | | | 723 | | | | 101 | | | | 93 | | | | 281 | | | | 374 | | | | 1 | |
| Financial institutions | | | 216 | | | | 3.9 | | | | 7 | | | | 93 | | | | 60 | | | | 47 | | | | 7 | | | | 2 | |
| Companies | | | 37 | | | | 0.7 | | | | 20 | | | | 7 | | | | 3 | | | | 3 | | | | 4 | | | | - | |
| Forwards (onshore) | | | 99 | | | | 1.8 | | | | 67 | | | | - | | | | 32 | | | | - | | | | - | | | | - | |
| Financial institutions | | | 70 | | | | 1.3 | | | | 38 | | | | - | | | | 32 | | | | - | | | | - | | | | - | |
| Companies | | | 29 | | | | 0.5 | | | | 29 | | | | - | | | | - | | | | - | | | | - | | | | - | |
| Swaps - Difference receivable | | | 2,579 | | | | 46.2 | | | | 407 | | | | 206 | | | | 274 | | | | 455 | | | | 469 | | | | 768 | |
| BM&F Bovespa | | | 256 | | | | 4.6 | | | | 3 | | | | 8 | | | | 37 | | | | 100 | | | | 31 | | | | 77 | |
| Financial institutions | | | 741 | | | | 13.3 | | | | 223 | | | | 34 | | | | 114 | | | | 154 | | | | 68 | | | | 148 | |
| Companies | | | 1,552 | | | | 27.8 | | | | 177 | | | | 158 | | | | 111 | | | | 198 | | | | 368 | | | | 540 | |
| Individuals | | | 30 | | | | 0.5 | | | | 4 | | | | 6 | | | | 12 | | | | 3 | | | | 2 | | | | 3 | |
| Credit derivatives | | | 15 | | | | 0.3 | | | | 1 | | | | 6 | | | | 2 | | | | 1 | | | | 1 | | | | 4 | |
| Financial institutions | | | 15 | | | | 0.3 | | | | 1 | | | | 6 | | | | 2 | | | | 1 | | | | 1 | | | | 4 | |
| Forwards (offshore) | | | 313 | | | | 5.6 | | | | 88 | | | | 81 | | | | 105 | | | | 27 | | | | 7 | | | | 5 | |
| Financial institutions | | | 227 | | | | 4.1 | | | | 61 | | | | 55 | | | | 87 | | | | 17 | | | | 2 | | | | 5 | |
| Companies | | | 86 | | | | 1.5 | | | | 27 | | | | 26 | | | | 18 | | | | 10 | | | | 5 | | | | - | |
| Swaps with USD Check | | | 49 | | | | 0.9 | | | | 45 | | | | 1 | | | | 1 | | | | 1 | | | | 1 | | | | - | |
| Check of swap – Financial institutions | | | 186 | | | | 3.3 | | | | - | | | | - | | | | - | | | | 2 | | | | 135 | | | | 49 | |
| Other | | | 522 | | | | 9.2 | | | | 25 | | | | 103 | | | | 102 | | | | 25 | | | | 126 | | | | 141 | |
| Financial institutions | | | 316 | | | | 5.6 | | | | 1 | | | | - | | | | 52 | | | | 1 | | | | 122 | | | | 140 | |
| Companies | | | 206 | | | | 3.6 | | | | 24 | | | | 103 | | | | 50 | | | | 24 | | | | 4 | | | | 1 | |
| Total (*) | | | 5,589 | | | | 100.0 | | | | 1,383 | | | | 598 | | | | 672 | | | | 842 | | | | 1,124 | | | | 970 | |
| % per maturity term | | | | | | | | | | | 24.7 | % | | | 10.7 | % | | | 12.0 | % | | | 15.1 | % | | | 20.1 | % | | | 17.4 | % |
(*) Of the total asset portfolio of Derivative Financial Instruments, R$ 3,495 refers to current and R$ 2,094 to non-current.
| | | 12/31/2011 | |
| | | Fair value | | | % | | | 0-30
days | | | 31-90
days | | | 91-180
days | | | 181-365
days | | | 366-720
days | | | Over 720
days | |
| LIABILITIES | | | | | | | | | | | | | | | | | | | | | | | | | | | | | | | | |
| Option premiums | | | (2,606 | ) | | | 38.6 | | | | (1,205 | ) | | | (289 | ) | | | (235 | ) | | | (712 | ) | | | (153 | ) | | | (12 | ) |
| BM&F Bovespa | | | (1,768 | ) | | | 26.2 | | | | (1,114 | ) | | | (87 | ) | | | (20 | ) | | | (484 | ) | | | (63 | ) | | | - | |
| Financial institutions | | | (687 | ) | | | 10.2 | | | | (86 | ) | | | (185 | ) | | | (180 | ) | | | (162 | ) | | | (63 | ) | | | (11 | ) |
| Companies | | | (151 | ) | | | 2.2 | | | | (5 | ) | | | (17 | ) | | | (35 | ) | | | (66 | ) | | | (27 | ) | | | (1 | ) |
| Forwards (onshore) | | | (818 | ) | | | 12.1 | | | | (42 | ) | | | (92 | ) | | | (194 | ) | | | (56 | ) | | | (99 | ) | | | (335 | ) |
| Financial institutions | | | (67 | ) | | | 1.0 | | | | (6 | ) | | | (31 | ) | | | (30 | ) | | | - | | | | - | | | | - | |
| Companies | | | (751 | ) | | | 11.1 | | | | (36 | ) | | | (61 | ) | | | (164 | ) | | | (56 | ) | | | (99 | ) | | | (335 | ) |
| Swaps - Difference payable | | | (2,798 | ) | | | 41.5 | | | | (211 | ) | | | (177 | ) | | | (116 | ) | | | (534 | ) | | | (497 | ) | | | (1,263 | ) |
| BM&F Bovespa | | | (518 | ) | | | 7.7 | | | | (6 | ) | | | (11 | ) | | | (24 | ) | | | (131 | ) | | | (102 | ) | | | (244 | ) |
| Financial institutions | | | (682 | ) | | | 10.1 | | | | (134 | ) | | | (75 | ) | | | (13 | ) | | | (41 | ) | | | (110 | ) | | | (309 | ) |
| Companies | | | (1,557 | ) | | | 23.1 | | | | (70 | ) | | | (89 | ) | | | (73 | ) | | | (342 | ) | | | (274 | ) | | | (709 | ) |
| Individuals | | | (41 | ) | | | 0.6 | | | | (1 | ) | | | (2 | ) | | | (6 | ) | | | (20 | ) | | | (11 | ) | | | (1 | ) |
| Credit derivatives | | | (110 | ) | | | 1.7 | | | | - | | | | (5 | ) | | | (9 | ) | | | (7 | ) | | | (8 | ) | | | (81 | ) |
| Financial institutions | | | (106 | ) | | | 1.6 | | | | - | | | | (5 | ) | | | (9 | ) | | | (5 | ) | | | (7 | ) | | | (80 | ) |
| Companies | | | (4 | ) | | | 0.1 | | | | - | | | | - | | | | - | | | | (2 | ) | | | (1 | ) | | | (1 | ) |
| Forwards (offshore) | | | (326 | ) | | | 4.8 | | | | (68 | ) | | | (67 | ) | | | (61 | ) | | | (49 | ) | | | (47 | ) | | | (34 | ) |
| Financial institutions | | | (246 | ) | | | 3.6 | | | | (55 | ) | | | (51 | ) | | | (40 | ) | | | (33 | ) | | | (38 | ) | | | (29 | ) |
| Companies | | | (80 | ) | | | 1.2 | | | | (13 | ) | | | (16 | ) | | | (21 | ) | | | (16 | ) | | | (9 | ) | | | (5 | ) |
| Swaps with target flow - Companies | | | (2 | ) | | | 0.0 | | | | - | | | | - | | | | - | | | | - | | | | - | | | | (2 | ) |
| Other | | | (87 | ) | | | 1.3 | | | | - | | | | - | | | | - | | | | (6 | ) | | | (81 | ) | | | - | |
| Financial institutions | | | (80 | ) | | | 1.2 | | | | - | | | | - | | | | - | | | | - | | | | (80 | ) | | | - | |
| Companies | | | (7 | ) | | | 0.1 | | | | - | | | | - | | | | - | | | | (6 | ) | | | (1 | ) | | | - | |
| Total (*) | | | (6,747 | ) | | | 100.0 | | | | (1,526 | ) | | | (630 | ) | | | (615 | ) | | | (1,364 | ) | | | (885 | ) | | | (1,727 | ) |
| % per maturity term | | | | | | | | | | | 22.6 | % | | | 9.3 | % | | | 9.1 | % | | | 20.2 | % | | | 13.1 | % | | | 25.6 | % |
(*) Of the total liability portfolio of Derivative Financial Instruments, R$ (4,135) refers to current and R$ (2,612) to non-current.
| | | 12/31/2010 | |
| | | Fair Value | | | % | | | 0-30
days | | | 31-90
days | | | 91-180
days | | | 181-365
days | | | 366-720
days | | | Over 720
days | |
| LIABILITIES | | | | | | | | | | | | | | | | | | | | | | | | | | | | | | | | |
| Futures | | | (55 | ) | | | 0.9 | | | | (22 | ) | | | (52 | ) | | | (12 | ) | | | 12 | | | | 16 | | | | 3 | |
| BM&F Bovespa | | | (59 | ) | | | 0.9 | | | | (25 | ) | | | (50 | ) | | | (14 | ) | | | 11 | | | | 16 | | | | 3 | |
| Companies | | | 4 | | | | 0.0 | | | | 3 | | | | (2 | ) | | | 2 | | | | 1 | | | | - | | | | - | |
| Option premiums | | | (2,087 | ) | | | 36.8 | | | | (812 | ) | | | (414 | ) | | | (231 | ) | | | (413 | ) | | | (207 | ) | | | (10 | ) |
| BM&F Bovespa | | | (1,677 | ) | | | 29.6 | | | | (756 | ) | | | (298 | ) | | | (108 | ) | | | (349 | ) | | | (163 | ) | | | (3 | ) |
| Financial institutions | | | (299 | ) | | | 5.3 | | | | (17 | ) | | | (93 | ) | | | (114 | ) | | | (45 | ) | | | (27 | ) | | | (3 | ) |
| Companies | | | (110 | ) | | | 1.9 | | | | (39 | ) | | | (23 | ) | | | (8 | ) | | | (19 | ) | | | (17 | ) | | | (4 | ) |
| Individuals | | | (1 | ) | | | 0.0 | | | | - | | | | - | | | | (1 | ) | | | - | | | | - | | | | - | |
| Forwards (onshore) | | | (79 | ) | | | 1.4 | | | | (50 | ) | | | - | | | | - | | | | - | | | | - | | | | (29 | ) |
| Financial institutions | | | (50 | ) | | | 0.9 | | | | (50 | ) | | | - | | | | - | | | | - | | | | - | | | | - | |
| Companies | | | (29 | ) | | | 0.5 | | | | - | | | | - | | | | - | | | | - | | | | - | | | | (29 | ) |
| Swaps - Difference payable | | | (2,013 | ) | | | 35.4 | | | | (92 | ) | | | (96 | ) | | | (139 | ) | | | (598 | ) | | | (442 | ) | | | (646 | ) |
| BM&F Bovespa | | | (388 | ) | | | 6.8 | | | | (6 | ) | | | (9 | ) | | | (40 | ) | | | (60 | ) | | | (112 | ) | | | (161 | ) |
| Financial institutions | | | (396 | ) | | | 7.0 | | | | (14 | ) | | | (29 | ) | | | (3 | ) | | | (149 | ) | | | (26 | ) | | | (175 | ) |
| Companies | | | (1,170 | ) | | | 20.6 | | | | (70 | ) | | | (50 | ) | | | (73 | ) | | | (364 | ) | | | (303 | ) | | | (310 | ) |
| Individuals | | | (59 | ) | | | 1.0 | | | | (2 | ) | | | (8 | ) | | | (23 | ) | | | (25 | ) | | | (1 | ) | | | - | |
| Credit derivatives | | | (129 | ) | | | 2.3 | | | | (7 | ) | | | (6 | ) | | | (2 | ) | | | (3 | ) | | | (8 | ) | | | (103 | ) |
| Financial institutions | | | (126 | ) | | | 2.2 | | | | (7 | ) | | | (6 | ) | | | (2 | ) | | | (2 | ) | | | (8 | ) | | | (101 | ) |
| Companies | | | (3 | ) | | | 0.1 | | | | - | | | | - | | | | - | | | | (1 | ) | | | - | | | | (2 | ) |
| Forwards (offshore) | | | (1,112 | ) | | | 19.6 | | | | (176 | ) | | | (267 | ) | | | (205 | ) | | | (317 | ) | | | (87 | ) | | | (60 | ) |
| Financial institutions | | | (629 | ) | | | 11.1 | | | | (88 | ) | | | (201 | ) | | | (106 | ) | | | (138 | ) | | | (46 | ) | | | (50 | ) |
| Companies | | | (482 | ) | | | 8.5 | | | | (88 | ) | | | (66 | ) | | | (99 | ) | | | (179 | ) | | | (41 | ) | | | (9 | ) |
| Individuals | | | (1 | ) | | | 0.0 | | | | - | | | | - | | | | - | | | | - | | | | - | | | | (1 | ) |
| Other | | | (196 | ) | | | 3.6 | | | | 46 | | | | (2 | ) | | | 3 | | | | (89 | ) | | | (15 | ) | | | (139 | ) |
| Financial institutions | | | (173 | ) | | | 3.1 | | | | - | | | | - | | | | - | | | | (87 | ) | | | - | | | | (86 | ) |
| Companies | | | (23 | ) | | | 0.5 | | | | 46 | | | | (2 | ) | | | 3 | | | | (2 | ) | | | (15 | ) | | | (53 | ) |
| Total (*) | | | (5,671 | ) | | | 100.0 | | | | (1,113 | ) | | | (837 | ) | | | (586 | ) | | | (1,408 | ) | | | (743 | ) | | | (984 | ) |
| % per maturity term | | | | | | | | | | | 19.6 | % | | | 14.8 | % | | | 10.3 | % | | | 24.8 | % | | | 13.1 | % | | | 17.4 | % |
(*) Of the total liability portfolio of Derivative Financial Instruments, R$ (3,944) refers to current and R$ (1,727) to non-current.
| | | 1/1/2010 | |
| | | Fair value | | | % | | | 0-30
days | | | 31-90
days | | | 91-180
days | | | 181-365
days | | | 366-720
days | | | Over 720
days | |
| LIABILITIES | | | | | | | | | | | | | | | | | | | | | | | | | | | | | | | | |
| Futures | | | (26 | ) | | | 0.5 | | | | 7 | | | | 8 | | | | (9 | ) | | | (2 | ) | | | 1 | | | | (31 | ) |
| BM&F Bovespa | | | (31 | ) | | | 0.5 | | | | 5 | | | | 5 | | | | (9 | ) | | | (2 | ) | | | 1 | | | | (31 | ) |
| Companies | | | 5 | | | | 0.0 | | | | 2 | | | | 3 | | | | - | | | | - | | | | - | | | | - | |
| Option premiums | | | (1,848 | ) | | | 34.7 | | | | (628 | ) | | | (200 | ) | | | (152 | ) | | | (385 | ) | | | (480 | ) | | | (3 | ) |
| BM&F Bovespa | | | (1,630 | ) | | | 30.6 | | | | (586 | ) | | | (107 | ) | | | (124 | ) | | | (342 | ) | | | (470 | ) | | | (1 | ) |
| Financial institutions | | | (337 | ) | | | 6.3 | | | | (35 | ) | | | (86 | ) | | | (25 | ) | | | (41 | ) | | | (148 | ) | | | (2 | ) |
| Companies | | | 119 | | | | (2.2 | ) | | | (7 | ) | | | (7 | ) | | | (3 | ) | | | (2 | ) | | | 138 | | | | - | |
| Forwards (onshore) | | | (67 | ) | | | 1.2 | | | | (67 | ) | | | - | | | | - | | | | - | | | | - | | | | - | |
| Financial institutions | | | (38 | ) | | | 0.7 | | | | (38 | ) | | | - | | | | - | | | | - | | | | - | | | | - | |
| Companies | | | (29 | ) | | | 0.5 | | | | (29 | ) | | | - | | | | - | | | | - | | | | - | | | | - | |
| Swaps - Difference payable | | | (2,114 | ) | | | 39.6 | | | | (241 | ) | | | (71 | ) | | | (578 | ) | | | (286 | ) | | | (382 | ) | | | (556 | ) |
| BM&F Bovespa | | | (308 | ) | | | 5.8 | | | | (10 | ) | | | (5 | ) | | | (9 | ) | | | (73 | ) | | | (52 | ) | | | (159 | ) |
| Financial institutions | | | (769 | ) | | | 14.4 | | | | (152 | ) | | | (13 | ) | | | (67 | ) | | | (137 | ) | | | (93 | ) | | | (307 | ) |
| Companies | | | (1,009 | ) | | | 18.9 | | | | (71 | ) | | | (49 | ) | | | (498 | ) | | | (73 | ) | | | (229 | ) | | | (89 | ) |
| Individuals | | | (28 | ) | | | 0.5 | | | | (8 | ) | | | (4 | ) | | | (4 | ) | | | (3 | ) | | | (8 | ) | | | (1 | ) |
| Credit derivatives | | | (106 | ) | | | 2.0 | | | | (9 | ) | | | (6 | ) | | | (5 | ) | | | (5 | ) | | | (3 | ) | | | (78 | ) |
| Financial institutions | | | (106 | ) | | | 2.0 | | | | (9 | ) | | | (6 | ) | | | (5 | ) | | | (5 | ) | | | (3 | ) | | | (78 | ) |
| Forwards (offshore) | | | (407 | ) | | | 7.7 | | | | (90 | ) | | | (118 | ) | | | (91 | ) | | | (95 | ) | | | (9 | ) | | | (4 | ) |
| Financial institutions | | | (175 | ) | | | 3.3 | | | | (37 | ) | | | (56 | ) | | | (43 | ) | | | (37 | ) | | | (1 | ) | | | (1 | ) |
| Companies | | | (232 | ) | | | 4.4 | | | | (53 | ) | | | (62 | ) | | | (48 | ) | | | (58 | ) | | | (8 | ) | | | (3 | ) |
| Swaps with USD check | | | (90 | ) | | | 1.7 | | | | (1 | ) | | | - | | | | - | | | | - | | | | (14 | ) | | | (75 | ) |
| Check of swap | | | (140 | ) | | | 2.6 | | | | (2 | ) | | | (5 | ) | | | (9 | ) | | | (2 | ) | | | (50 | ) | | | (72 | ) |
| Financial institutions | | | (18 | ) | | | 0.3 | | | | (2 | ) | | | (5 | ) | | | (9 | ) | | | (2 | ) | | | - | | | | - | |
| Companies | | | (122 | ) | | | 2.3 | | | | - | | | | - | | | | - | | | | - | | | | (50 | ) | | | (72 | ) |
| Other | | | (534 | ) | | | 10.0 | | | | (46 | ) | | | (57 | ) | | | (116 | ) | | | (75 | ) | | | (159 | ) | | | (81 | ) |
| Financial institutions | | | (239 | ) | | | 4.5 | | | | (1 | ) | | | (1 | ) | | | (45 | ) | | | (15 | ) | | | (97 | ) | | | (80 | ) |
| Companies | | | (273 | ) | | | 5.2 | | | | (35 | ) | | | (49 | ) | | | (67 | ) | | | (59 | ) | | | (62 | ) | | | (1 | ) |
| Individuals | | | (22 | ) | | | 0.3 | | | | (10 | ) | | | (7 | ) | | | (4 | ) | | | (1 | ) | | | - | | | | - | |
| Total (*) | | | (5,332 | ) | | | 100.0 | | | | (1,077 | ) | | | (449 | ) | | | (960 | ) | | | (850 | ) | | | (1,096 | ) | | | (900 | ) |
| % per maturity term | | | | | | | | | | | 20.2 | % | | | 8.4 | % | | | 18.0 | % | | | 15.9 | % | | | 20.6 | % | | | 16.9 | % |
(*) Of the total liability portfolio of Derivative Financial Instruments, R$ (3,336) refers to current and R$ (1,996) to non-current.
Realized and unrealized gains and losses in the portfolio of derivatives
| | | 01/01 to
12/31/2011 | | | 01/01 to
12/31/2010 | |
| | | | | | | |
| Swap | | | (476 | ) | | | 169 | |
| Forwards | | | (139 | ) | | | 29 | |
| Futures | | | 91 | | | | 1,370 | |
| Options | | | 323 | | | | 924 | |
| Credit derivatives | | | 185 | | | | 87 | |
| Other | | | 367 | | | | (269 | ) |
| Total | | | 351 | | | | 2,310 | |
a) Information on credit derivatives
ITAÚ UNIBANCO HOLDING buys and sells credit protection mainly related to securities of the Brazilian government and securities of Brazilian listed companies in order to meet the needs of its customers. When ITAÚ UNIBANCO HOLDING sells contracts for credit protection, the exposure for a given reference entity may be partially or totally offset by a credit protection purchase contract of another counterparty for the same reference entity or similar entity. The credit derivatives for which ITAÚ UNIBANCO HOLDING is protection sellers are credit default swaps, total return swaps and credit-linked notes. At December 31, 2011, December 31, 2010 and January 1, 2010, ITAÚ UNIBANCO HOLDING did not have open contracts for credit protection in the form of credit-linked notes.
Credit Default Swaps – CDS
CDS are credit derivatives in which, upon a credit event related to the reference entity pursuant to the terms of the contract, the protection buyer is entitled to receive, from the protection seller, the amount equivalent to the difference between the face value of the CDS contract and the fair value of the liability on the date the contract was settled, also known as the recovered amount. The protection buyer does not need to hold the debt instrument of the reference entity for it to receive the amounts due pursuant to the CDS contract terms when a credit event occurs.
Total Return Swap – TRS
TRS is a transaction in which a party swaps the total return of a reference entity or of a basket of assets for regular cash flows, usually interest and a guarantee against capital loss. In a TRS contract, the parties do not transfer the ownership of the assets.
The table below presents the portfolio of credit derivatives in which ITAÚ UNIBANCO HOLDING sells protection to third parties, by maturity, and the maximum potential of future payments, gross of any guarantees, as well as its classification by instrument, risk and reference entity.
| | | 12/31/2011 | |
| | | Maximum potential | | | | | | From 1 | | | From 3 | | | | | | | |
| | | of future payments, | | | Before 1 | | | to 3 | | | to 5 | | | After 5 | | | | |
| | | gross | | | year | | | years | | | years | | | years | | | Fair value | |
| By instrument | | | | | | | | | | | | | | | | | | | | | | | | |
| CDS | | | 3,526 | | | | 1,290 | | | | 1,106 | | | | 990 | | | | 140 | | | | (101 | ) |
| TRS | | | 9 | | | | - | | | | - | | | | 9 | | | | - | | | | (9 | ) |
| Total by instrument | | | 3,535 | | | | 1,290 | | | | 1,106 | | | | 999 | | | | 140 | | | | (110 | ) |
| By risk rating | | | | | | | | | | | | | | | | | | | | | | | | |
| Investment grade | | | 3,535 | | | | 1,290 | | | | 1,106 | | | | 999 | | | | 140 | | | | (110 | ) |
| Total by risk | | | 3,535 | | | | 1,290 | | | | 1,106 | | | | 999 | | | | 140 | | | | (110 | ) |
| By reference entity | | | | | | | | | | | | | | | | | | | | | | | | |
| Private entities | | | 3,535 | | | | 1,290 | | | | 1,106 | | | | 999 | | | | 140 | | | | (110 | ) |
| Total by entity | | | 3,535 | | | | 1,290 | | | | 1,106 | | | | 999 | | | | 140 | | | | (110 | ) |
| | | 12/31/2010 | |
| | | Maximum potential | | | | | | From 1 | | | From 3 | | | | | | | |
| | | of future payments, | | | Before 1 | | | to 3 | | | to 5 | | | After 5 | | | Fair | |
| | | gross | | | year | | | years | | | years | | | years | | | value | |
| By instrument | | | | | | | | | | | | | | | | | | | | | | | | |
| CDS | | | 3,375 | | | | 541 | | | | 1,234 | | | | 1,184 | | | | 416 | | | | (121 | ) |
| TRS | | | 424 | | | | 416 | | | | - | | | | 8 | | | | - | | | | (8 | ) |
| Total by instrument | | | 3,799 | | | | 957 | | | | 1,234 | | | | 1,192 | | | | 416 | | | | (129 | ) |
| By risk rating | | | | | | | | | | | | | | | | | | | | | | | | |
| Investment grade | | | 3,799 | | | | 957 | | | | 1,234 | | | | 1,192 | | | | 416 | | | | (129 | ) |
| Total by risk | | | 3,799 | | | | 957 | | | | 1,234 | | | | 1,192 | | | | 416 | | | | (129 | ) |
| By reference entity | | | | | | | | | | | | | | | | | | | | | | | | |
| Private entities | | | 3,799 | | | | 957 | | | | 1,234 | | | | 1,192 | | | | 416 | | | | (129 | ) |
| Total by entity | | | 3,799 | | | | 957 | | | | 1,234 | | | | 1,192 | | | | 416 | | | | (129 | ) |
| | | 01/01/2010 | |
| | | Maximum potential | | | | | | From 1 | | | From 3 | | | | | | | |
| | | of future payments, | | | Before 1 | | | to 3 | | | to 5 | | | Over 5 | | | Fair | |
| | | gross | | | year | | | years | | | years | | | years | | | value | |
| By instrument | | | | | | | | | | | | | | | | | | | | | | | | |
| CDS | | | 2,746 | | | | 844 | | | | 712 | | | | 685 | | | | 505 | | | | (106 | ) |
| Total by instrument | | | 2,746 | | | | 844 | | | | 712 | | | | 685 | | | | 505 | | | | (106 | ) |
| By risk rating | | | | | | | | | | | | | | | | | | | | | | | | |
| Investment grade | | | 2,746 | | | | 844 | | | | 712 | | | | 685 | | | | 505 | | | | (106 | ) |
| Total by risk | | | 2,746 | | | | 844 | | | | 712 | | | | 685 | | | | 505 | | | | (106 | ) |
| By reference entity | | | | | | | | | | | | | | | | | | | | | | | | |
| Private entities | | | 2,746 | | | | 844 | | | | 712 | | | | 685 | | | | 505 | | | | (106 | ) |
| Total by entity | | | 2,746 | | | | 844 | | | | 712 | | | | 685 | | | | 505 | | | | (106 | ) |
ITAÚ UNIBANCO HOLDING assesses the risk of a credit derivative based on the credit ratings attributed to the reference entity, by independent credit rating agencies. Investment grade are those entities for which credit risk is rated as Baa3 or higher, as rated by Moody's, and BBB- or higher, according to the ratings of Standard & Poor’s and Fitch Ratings. The maximum potential loss that may be incurred with the credit derivative is based on the notional amount of the derivative. ITAÚ UNIBANCO HOLDING believes, based on its historical experience, that the amount of the maximum potential loss does not represent the actual level of loss. This is so because, should there be an event of loss, the amount of maximum potential loss should be reduced from the notional amount by the recoverable amount.
The credit derivatives sold are not covered by guarantees, and during this period, ITAÚ UNIBANCO HOLDING has not incurred in any loss related to credit derivative contracts.
The following table presents the notional amount of purchased credit derivatives whose the underlying amounts are identical to those for which ITAÚ UNIBANCO HOLDING operates as seller of the credit protection:
| | | 12/31/2011 | |
| | | | | | Notional amount of credit | | | | |
| | | Notional amount of | | | protection purchased with | | | | |
| | | credit protection sold | | | identical underlying amount | | | Net position | |
| CDS | | | (3,526 | ) | | | 2,471 | | | | (1,055 | ) |
| TRS | | | (9 | ) | | | 1,188 | | | | 1,179 | |
| Total | | | (3,535 | ) | | | 3,659 | | | | 124 | |
| | | 12/31/2010 | |
| | | | | | Notional amount of credit | | | | |
| | | Notional amount of | | | protection purchased with | | | | |
| | | credit protection sold | | | identical underlying amount | | | Net position | |
| CDS | | | (3,375 | ) | | | 2,902 | | | | (473 | ) |
| TRS | | | (424 | ) | | | - | | | | (424 | ) |
| Total | | | (3,799 | ) | | | 2,902 | | | | (897 | ) |
| | | 1/1/2010 | |
| | | | | | Notional amount of credit | | | | |
| | | Notional amount of | | | protection purchased with | | | | |
| | | credit protection sold | | | identical underlying amount | | | Net position | |
| CDS | | | (2,746 | ) | | | 1,785 | | | | (961 | ) |
| TRS | | | - | | | | 1 | | | | 1 | |
| Total | | | (2,746 | ) | | | 1,786 | | | | (960 | ) |
NOTE 08 – HEDGE ACCOUNTING
Hedge accounting varies depending on the nature of the hedged item and of the transaction. Derivatives may qualify as hedging instrument for accounting purposes if they are designated as hedging instruments under fair value hedges, cash flow hedges or hedges of net investment in foreign operations.
To hedge the variability of future cash flows of interest payments, ITAÚ UNIBANCO HOLDING uses DI Futures contracts exchange-traded at BM&FBovespa with respect to certain real-denominated variable-interest liabilities and interest rate swaps with respect to US dollar-denominated redeemable preferred shares issued by one of our subsidiaries.
Under a DI Futures contract, a net payment (receipt) is made for the difference between a normal amount multiplied by the CDI rate and an amount computed and multiplied by a fixed rate. Under interest rate swap, a net payment (receipt) is made for the difference between an amount computed and multiplied by LIBOR and a notional amount and multiplied by a fixed rate.
Our cash flow hedge strategies consist of the hedge of the exposure to the variability in cash flows on interest payments that are attributable to changes in interest rates with respect to recognized liabilities.
ITAÚ UNIBANCO HOLDING has applied cash flow hedge strategies as follows:
| · | Hedge of time deposits and repurchase agreements: hedge of the variability in cash flows of interest payments resulting from changes in the CDI interest rate. |
| · | Hedge of redeemable preferred shares: hedge of the variability in cash flows of interest payments resulting from changes in the LIBOR interest rate. |
| · | Hedge of subordinated certificates of deposit (CDB): hedge of the variability in the cash flow of interest payments resulting from changes in the CDI interest rate. |
To evaluate the effectiveness and to measure the ineffectiveness of such strategies, ITAÚ UNIBANCO HOLDING uses the hypothetical derivative method. The hypothetical derivative method is based on a comparison of the change in the fair value of a hypothetical derivative with terms identical to the critical terms of the variable-rate liability, and this change in the fair value of a hypothetical derivative is considered a proxy of the present value of the cumulative change in the future cash flow expected for the hedged liability.
Hedge relationships were designated in 2008 (subordinated CDB hedge), 2009 (hedge of redeemable preferred shares) and 2010 (hedge of deposits denominated in Brazilian reais and agreements to resell), and related derivatives will mature between 2012 and 2017. Periods in which expected cash flows should be paid and affect the statement of income are as follows:
| · | Hedge of time deposits and agreements to resell: interest paid/ received daily. |
| · | Hedge of reedeemable preferred shares: interest paid/ received every half year. |
| · | CDB subordinated hedge: interest paid/ received at the end of the operation. |
ITAÚ UNIBANCO HOLDING strategies of net investments in foreign operations consist of a hedge of the exposure in foreign currency arising from the functional currency of the foreign operation, with respect to the functional currency of the head office.
To hedge the changes of future cash flows of exchange variation of net investments in foreign operations, ITAÚ UNIBANCO HOLDING uses DDI Futures contracts traded at BM&FBovespa, and Forward contracts or NDF contracts entered into by our subsidiaries abroad.
In DDI Futures contracts, the gain (loss) from exchange variation is computed as the difference between two periods of market quotation between the US dollar and Real. In the Forward or NDF contracts, the gain (loss) from exchange variation is computed as the difference between two periods of market quotation between the functional currency and the US dollar.
ITAÚ UNIBANCO HOLDING applies the hedge of net investment in foreign operations as follows:
| · | To hedge the risk of variation in the investment amount, when measured in Brazilian reais (head office’s functional currency), arising from changes in exchange rates between the functional currency of the investment abroad and the Brazilian real. |
To evaluate the effectiveness and to measure the ineffectiveness of such strategies, ITAÚ UNIBANCO HOLDING uses the Dollar Offset Method. The Dollar Offset Method is based on a comparison of the change in fair value (cash flow) of the hedge instrument, attributable to changes in exchange rate and gain (loss) arising from the variation in exchange rates, on the amount of investment abroad designated as a hedged item.
Hedge relationships were designated in 2011 and the derivatives will mature on the sale of investment abroad, which will be in the period when the cash flows of exchange variation are expected to occur and affect the statement of income.
The amounts in the following tables are presented in millions of Brazilian reais:
| | | 12/31/2011 | | | 12/31/2010 | |
| | | Gain or (loss) accumulated | | | | | Gain or (loss) | | | Gain or (loss) accumulated | | | | | Gain or (loss) | |
| | | recognized in other | | | | | recognized in | | | recognized in other | | | | | recognized in | |
| | | comprehensive Income and | | | Line Item where the ineffective | | derivatives | | | comprehensive Income and | | | Line Item where the ineffective | | derivatives | |
| Derivatives used in | | cash flow hedge (effective | | | portion is recognized in the | | (ineffective portion) | | | cash flow hedge (effective | | | portion is recognized in the | | (ineffective portion) | |
| cash flow hedge | | portion) | | | statement of income | | (*) | | | portion) | | | statement of income | | (*) | |
| Interest rate futures | | | (282 | ) | | Net gain (loss) from financial assets and liabilities | | | 1 | | | | 8 | | | Net gain (loss) from financial assets and liabilities | | | 1 | |
| Interest rate swap | | | (30 | ) | | Net gain (loss) from financial assets and liabilities | | | - | | | | (20 | ) | | Net gain (loss) from financial assets and liabilities | | | - | |
| Total | | | (312 | ) | | | | | 1 | | | | (12 | ) | | | | | 1 | |
(*) At December 31, 2011, the gain (loss) related to the cash flow hedge expected to be reclassified from Comprehensive Income to Income in the following 12 months is R$ 167 (R$ 1 at December 31, 2010).
| 12/31/2011 |
| | | Gain or (loss) accumulated | | | | | | |
| | | recognized in other | | | | | Other gain or (loss) | |
| Derivatives used in hedge of | | comprehensive Income and | | | Line item where the ineffective | | recognized in | |
| net investment in foreign | | cash flow hedge (effective | | | portion is recognized in the | | derivatives | |
| operations | | portion) | | | statement of income | | (ineffective portion) | |
| | | | | | | | | |
| DDI Futures (1) | | | (890 | ) | | Net gain (loss) from financial assets and liabilities | | | 42 | |
| Forwards | | | 120 | | | Net gain (loss) from financial assets and liabilities | | | 19 | |
| NDF (2) | | | 335 | | | Net gain (loss) from financial assets and liabilities | | | 2 | |
| | | | | | | | | | | |
| Total | | | (435 | ) | | | | | 63 | |
(1) DDI Futures is a Futures contract in which participants may trade a clean coupon for any period between the first maturity of the futures contract of foreign currency coupon (DDI) and a later maturity;
(2) NDF (Non Deliverable Forward), or Forward Contract of Currency without Physical Delivery is a derivative traded on over-the-counter market, which has the foreign exchange rate of a given currency as its subject.
The table below presents, for each strategy, the notional amount and the fair value of derivatives and the carrying amount of the hedged item and beginning of maturities of the derivatives at:
| | | 12/31/2011 | | | 12/31/2010 | | | 1/1/2010 | |
| | | Derivatives | | | Hedged item | | | Derivatives | | | Hedged item | | | Derivatives | | | Hedged item | |
| | | Notional | | | | | | | | | Notional | | | | | | | | | Notional | | | | | | | |
| Strategies | | amount | | | Fair value | | | Carrying value | | | amount | | | Fair value | | | Carrying value | | | amount | | | Fair value | | | Carrying value | |
| Hedge of deposits and repurchase agreements | | | 19,113 | | | | (4 | ) | | | 19,083 | | | | 9,092 | | | | (10 | ) | | | 9,117 | | | | - | | | | - | | | | - | |
| Hedge of redeemable preferred shares | | | 737 | | | | (37 | ) | | | 737 | | | | 655 | | | | (27 | ) | | | 655 | | | | 684 | | | | (2 | ) | | | 684 | |
| Hedge of subordinated CDB | | | 87 | | | | - | | | | 118 | | | | 350 | | | | - | | | | 419 | | | | 350 | | | | - | | | | 382 | |
| Hedge of net investment in foreign operations (*) | | | 6,886 | | | | 31 | | | | 4,131 | | | | - | | | | - | | | | - | | | | - | | | | - | | | | - | |
(*) Hedge instruments include the overhedge rate of 40% regarding taxes.
With the purpose of extending the maturities of subordinated CDBs, ITAÚ UNIBANCO HOLDING partially discontinued the hedge operations of Subordinated CDBs by carrying out a debt roll-over (settlement of prior operation and issue of a new operation), which resulted in an effect of R$ 3 in income statement during 2011.
| | | Strategies | |
| | | Hedge of deposits and | | | Hedge of redeemable | | | | | | Hedge of net investment | | | | |
| Maturity | | repurchase agreements | | | preferred shares | | | Hedge of subordinated CDB | | | in foreign operations | | | Total | |
| | | | | | | | | | | | | | | | |
| 2012 | | | 4,448 | | | | - | | | | - | | | | 6,886 | | | | 11,334 | |
| 2013 | | | 8,652 | | | | - | | | | - | | | | - | | | | 8,652 | |
| 2014 | | | 5,263 | | | | - | | | | 87 | | | | - | | | | 5,350 | |
| 2015 | | | - | | | | 737 | | | | - | | | | - | | | | 737 | |
| 2016 | | | - | | | | - | | | | - | | | | - | | | | - | |
| 2017 | | | 750 | | | | - | | | | - | | | | - | | | | 750 | |
| Total | | | 19,113 | | | | 737 | | | | 87 | | | | 6,886 | | | | 26,823 | |
NOTE 09 – AVAILABLE-FOR-SALE FINANCIAL ASSETS
The fair value and corresponding cost or amortized cost of available-for-sale financial assets are as follows:
| | | 12/31/2011 | | | 12/31/2010 | | | 1/1/2010 | |
| | | Cost/
amortized | | | Unrealized results | | | Fair | | | Cost/
amortized | | | Unrealized results | | | Fair | | | Cost/
amortized | | | Unrealized results | | | Fair | |
| | | cost | | | Gain | | | Loss | | | value | | | cost | | | Gain | | | Loss | | | value | | | cost | | | Gain | | | Loss | | | value | |
| | | | | | | | | | | | | | | | | | | | | | | | | | | | | | | | | | | | | |
| Investment funds | | 802 | | | 4 | | | - | | | 806 | | | 756 | | | 14 | | | - | | | 770 | | | 1,260 | | | 13 | | | - | | | 1,273 | |
| Brazilian government securities (1a) | | | 12,296 | | | | 183 | | | | (55 | ) | | | 12,424 | | | | 9,949 | | | | 130 | | | | - | | | | 10,079 | | | | 13,631 | | | | 87 | | | | - | | | | 13,718 | |
| Brazilian external debt bonds (1b) | | | 5,667 | | | | 240 | | | | (1 | ) | | | 5,906 | | | | 4,584 | | | | 181 | | | | (45 | ) | | | 4,720 | | | | 1,783 | | | | 197 | | | | - | | | | 1,980 | |
| Government securities – abroad (1c) | | | 4,327 | | | | 5 | | | | (15 | ) | | | 4,317 | | | | 4,736 | | | | 4 | | | | (181 | ) | | | 4,559 | | | | 7,259 | | | | 25 | | | | (43 | ) | | | 7,241 | |
| Portugal | | | - | | | | - | | | | - | | | | - | | | | - | | | | - | | | | - | | | | - | | | | 26 | | | | - | | | | - | | | | 26 | |
| United States | | | - | | | | - | | | | - | | | | - | | | | 679 | | | | - | | | | - | | | | 679 | | | | 17 | | | | - | | | | - | | | | 17 | |
| Austria | | | - | | | | - | | | | - | | | | - | | | | - | | | | - | | | | - | | | | - | | | | 212 | | | | 1 | | | | - | | | | 213 | |
| Mexico | | | 10 | | | | 1 | | | | - | | | | 11 | | | | - | | | | - | | | | - | | | | - | | | | - | | | | - | | | | - | | | | - | |
| Denmark | | | 1,949 | | | | - | | | | - | | | | 1,949 | | | | 2,108 | | | | - | | | | (92 | ) | | | 2,016 | | | | 1,995 | | | | 6 | | | | (30 | ) | | | 1,971 | |
| Spain | | | 418 | | | | - | | | | - | | | | 418 | | | | 777 | | | | - | | | | (43 | ) | | | 734 | | | | 1,090 | | | | 3 | | | | - | | | | 1,093 | |
| Korea | | | 295 | | | | - | | | | - | | | | 295 | | | | 262 | | | | - | | | | (26 | ) | | | 236 | | | | 1,748 | | | | 12 | | | | (5 | ) | | | 1,755 | |
| Chile | | | 992 | | | | 4 | | | | (1 | ) | | | 995 | | | | 454 | | | | 1 | | | | (2 | ) | | | 453 | | | | 1,278 | | | | 3 | | | | (7 | ) | | | 1,274 | |
| Paraguay | | | 358 | | | | - | | | | (14 | ) | | | 344 | | | | 272 | | | | 2 | | | | (18 | ) | | | 256 | | | | 417 | | | | - | | | | - | | | | 417 | |
| Uruguay | | | 268 | | | | - | | | | - | | | | 268 | | | | 184 | | | | 1 | | | | - | | | | 185 | | | | 476 | | | | - | | | | (1 | ) | | | 475 | |
| Other | | | 37 | | | | - | | | | - | | | | 37 | | | | - | | | | - | | | | - | | | | - | | | | - | | | | - | | | | - | | | | - | |
| Corporate securities (1d) | | | 23,174 | | | | 1,699 | | | | (816 | ) | | | 24,057 | | | | 22,865 | | | | 1,734 | | | | (188 | ) | | | 24,411 | | | | 16,006 | | | | 1,217 | | | | (133 | ) | | | 17,090 | |
| Shares | | | 3,458 | | | | 698 | | | | (178 | ) | | | 3,978 | | | | 3,889 | | | | 1,395 | | | | (160 | ) | | | 5,124 | | | | 3,700 | | | | 1,024 | | | | (30 | ) | | | 4,694 | |
| Securitized real estate loans | | | 7,806 | | | | 707 | | | | (499 | ) | | | 8,014 | | | | 6,799 | | | | 190 | | | | (14 | ) | | | 6,975 | | | | 4,275 | | | | 107 | | | | (88 | ) | | | 4,294 | |
| Bank deposit certificates | | | 274 | | | | - | | | | - | | | | 274 | | | | 559 | | | | - | | | | - | | | | 559 | | | | 99 | | | | - | | | | - | | | | 99 | |
| Debentures | | | 7,165 | | | | 139 | | | | (68 | ) | | | 7,236 | | | | 6,597 | | | | 40 | | | | (3 | ) | | | 6,634 | | | | 4,522 | | | | 25 | | | | (13 | ) | | | 4,534 | |
| Eurobonds and others | | | 3,554 | | | | 152 | | | | (68 | ) | | | 3,638 | | | | 3,745 | | | | 109 | | | | (11 | ) | | | 3,843 | | | | 1,765 | | | | 61 | | | | (2 | ) | | | 1,824 | |
| Promissory notes | | | 646 | | | | - | | | | - | | | | 646 | | | | 1,265 | | | | - | | | | - | | | | 1,265 | | | | 1,626 | | | | - | | | | - | | | | 1,626 | |
| Other | | | 271 | | | | 3 | | | | (3 | ) | | | 271 | | | | 11 | | | | - | | | | - | | | | 11 | | | | 19 | | | | - | | | | - | | | | 19 | |
| TOTAL | | | 46,266 | | | | 2,131 | | | | (887 | ) | | | 47,510 | | | | 42,890 | | | | 2,063 | | | | (414 | ) | | | 44,539 | | | | 39,939 | | | | 1,539 | | | | (176 | ) | | | 41,302 | |
(1) Available-for-sale assets pledged as collateral of funding of financial institutions and clients at December 31, 2011 were: a) R$ 2,208 (R$ 3,396 at December 31, 2010 and R$ 2,594 at January 1, 2010), b) R$ 3,880 (R$ 3,267 at December 31, 2010), c) R$ 12 (R$ 13 at December 31, 2010 and R$ 42 at January 1, 2010) and d) R$ 2,355 (R$ 2,149 at December 31, 2010 and R$ 383 at January 1, 2010), totaling R$ 8,455 (R$ 8,825 at 12/31/2010 and R$ 3,019 at 01/01/2010).
Realized gains and losses
| | | 01/01 to
12/31/2011 | | | 01/01 to
12/31/2010 | |
| Available-for-sale financial assets | | | | | | | | |
| Gain | | | 597 | | | | 230 | |
| Loss | | | (153 | ) | | | (79 | ) |
| TOTAL | | | 444 | | | | 151 | |
The cost or amortized cost and fair value of available-for-sale financial assets by maturity are as follows:
| | | 12/31/2011 | | | 12/31/2010 | | | 01/01/2010 | |
| | | Cost/ | | | | | | Cost/ | | | | | | Cost/ | | | | |
| | | amortized | | | | | | amortized | | | | | | amortized | | | | |
| | | cost | | | Fair value | | | cost | | | Fair value | | | cost | | | Fair value | |
| CURRENT | | | 13,239 | | | | 13,904 | | | | 18,424 | | | | 19,566 | | | | 19,982 | | | | 21,012 | |
| Non-stated maturity | | | 4,257 | | | | 4,779 | | | | 4,645 | | | | 5,894 | | | | 4,955 | | | | 5,962 | |
| Up to one year | | | 8,982 | | | | 9,125 | | | | 13,779 | | | | 13,672 | | | | 15,027 | | | | 15,050 | |
| NON-CURRENT | | | 33,027 | | | | 33,606 | | | | 24,466 | | | | 24,973 | | | | 19,957 | | | | 20,290 | |
| From one to five years | | | 16,875 | | | | 17,042 | | | | 12,060 | | | | 12,228 | | | | 13,560 | | | | 13,737 | |
| From five to ten years | | | 9,792 | | | | 9,655 | | | | 7,281 | | | | 7,400 | | | | 2,637 | | | | 2,689 | |
| After ten years | | | 6,360 | | | | 6,909 | | | | 5,125 | | | | 5,345 | | | | 3,760 | | | | 3,864 | |
| TOTAL | | | 46,266 | | | | 47,510 | | | | 42,890 | | | | 44,539 | | | | 39,939 | | | | 41,302 | |
During the year ended December 31, 2011, December 31, 2010 and January 1, 2010, ITAÚ UNIBANCO HOLDING has not recognized any impairment losses on available-for-sale financial assets.
NOTE 10 - HELD-TO-MATURITY FINANCIAL ASSETS
The amortized cost of held-to-maturity financial assets is as follows:
| | | 12/31/2011 | | | 12/31/2010 | | | 01/01/2010 | |
| | | Amortized cost | | | Amortized cost | | | Amortized cost | |
| Brazilian government securities | | | 2,812 | | | | 2,764 | | | | 1,942 | |
| Brazilian external debt bonds (1a) | | | 196 | | | | 226 | | | | 238 | |
| Government securities – abroad | | | - | | | | 16 | | | | 17 | |
| Corporate securities (1b) | | | 97 | | | | 164 | | | | 232 | |
| Debentures | | | 30 | | | | 30 | | | | 45 | |
| Eurobonds and others | | | 65 | | | | 130 | | | | 182 | |
| Securitized real estate loans | | | 2 | | | | 4 | | | | 5 | |
| Total | | | 3,105 | | | | 3,170 | | | | 2,429 | |
(1) Held-to-maturity financial assets pledged as collateral of funding transactions of financial institutions and clients at December 31, 2011 were: a) R$ 189 and b) R$ 41 (R$ 268 at 12/31/2010 and R$ 124 at 01/01/2010) totaling R$ 230 (R$ 268 at 12/31/2010 and R$ 124 at 01/01/2010).
The result from held-to-maturity financial assets by maturity was R$ 360 (R$ 456 from 01/01 to 12/31/2010).
The fair value of held-to-maturity financial assets is disclosed in Note 30.
The amortized cost of held-to-maturity financial assets by maturity is as follows:
| | | 12/31/2011 | | | 12/31/2010 | | | 1/1/2010 | |
| | | Amortized cost | | | Amortized cost | | | Amortized cost | |
| CURRENT | | | 120 | | | | 284 | | | | 41 | |
| Up to one year | | | 120 | | | | 284 | | | | 41 | |
| NON-CURRENT | | | 2,985 | | | | 2,886 | | | | 2,388 | |
| From one to five years | | | 242 | | | | 344 | | | | 616 | |
| From five to ten years | | | 1,077 | | | | 77 | | | | 79 | |
| After ten years | | | 1,666 | | | | 2,465 | | | | 1,693 | |
| Total | | | 3,105 | | | | 3,170 | | | | 2,429 | |
During the years ended December 31, 2011, December 31, 2010 and January 1, 2010, there were no impairment losses recognized with respect to held-to-maturity financial assets.
NOTE 11 - LOAN OPERATIONS AND LEASE OPERATIONS PORTFOLIO
| a) | Composition of loan operations and lease operations |
Below is the composition of the carrying amoutn of loan operations and lease operations by type, sector of debtor, maturity and concentration:
| Loan operations and lease operations, by type | | 12/31/2011 | | | 12/31/2010 | | | 01/01/2010 | |
| | | | | | | | | | |
| Individuals | | | 148,127 | | | | 124,787 | | | | 107,032 | |
| Credit card | | | 38,961 | | | | 33,041 | | | | 27,748 | |
| Personal loan | | | 35,253 | | | | 23,528 | | | | 21,187 | |
| Vehicles | | | 60,463 | | | | 60,151 | | | | 52,849 | |
| Mortgage loans | | | 13,450 | | | | 8,067 | | | | 5,248 | |
| | | | | | | | | | | | | |
| Corporate | | | 93,229 | | | | 76,583 | | | | 50,428 | |
| | | | | | | | | | | | | |
| Small and medium businesses | | | 85,649 | | | | 79,950 | | | | 75,924 | |
| | | | | | | | | | | | | |
| Foreign loans and Latin America | | | 19,259 | | | | 13,517 | | | | 11,029 | |
| Total loan operations and lease operations | | | 346,264 | | | | 294,837 | | | | 244,413 | |
| | | | | | | | | | | | | |
| Allowance for loan losses | | | (23,873 | ) | | | (19,994 | ) | | | (20,245 | ) |
| | | | | | | | | | | | | |
| Total loan operations and lease operations, net of allowance for loan losses | | | 322,391 | | | | 274,843 | | | | 224,168 | |
| By sector of debtor | | 12/31/2011 | | | 12/31/2010 | | | 01/01/2010 | |
| Public sector | | | 1,990 | | | | 1,138 | | | | 1,620 | |
| Industry and commerce | | | 99,859 | | | | 84,997 | | | | 67,902 | |
| Services | | | 70,642 | | | | 60,295 | | | | 48,657 | |
| Primary sector | | | 16,109 | | | | 13,933 | | | | 13,299 | |
| Other sectors | | | 1,497 | | | | 2,185 | | | | 1,278 | |
| Individuals | | | 156,167 | | | | 132,289 | | | | 111,657 | |
| Total loan operations and lease operations | | | 346,264 | | | | 294,837 | | | | 244,413 | |
| By maturity | | 12/31/2011 | | | 12/31/2010 | | | 01/01/2010 | |
| Overdue as from 1 day | | | 14,879 | | | | 12,229 | | | | 12,910 | |
| Falling due up to 3 months | | | 95,449 | | | | 82,609 | | | | 74,467 | |
| Falling due more than 3 months but less than 1 year | | | 85,438 | | | | 77,354 | | | | 65,667 | |
| Falling due after 1 year | | | 150,498 | | | | 122,645 | | | | 91,369 | |
| Total loan operations and lease operations | | | 346,264 | | | | 294,837 | | | | 244,413 | |
| By concentration | | 12/31/2011 | | | 12/31/2010 | | | 01/01/2010 | |
| Largest debtor | | | 2,331 | | | | 1,620 | | | | 2,161 | |
| 10 largest debtors | | | 13,613 | | | | 11,313 | | | | 10,521 | |
| 20 largest debtors | | | 21,603 | | | | 18,313 | | | | 16,520 | |
| 50 largest debtors | | | 35,504 | | | | 31,831 | | | | 28,126 | |
| 100 largest debtors | | | 48,280 | | | | 42,949 | | | | 38,445 | |
The accretion of the net present value on impaired loan operations and lease operations and the respective allowance for loan losses are not presented using their gross amounts in the statement of income but on a net basis within interest and similar income. If they were presented at gross amounts, there would be an increase of R$ 1,914 million and R$ 1,548 million in interest and similar income in 2011 and 2010, respectively, with the same impact on the allowance for loan losses expenses
| b) | Allowance for loan losses |
The changes in the allowance for loan losses are shown in the table below:
| | | | | | | | | Net increase/ | | | | |
| | | Opening | | | Write-offs | | | (reversal) | | | Closing | |
| | | balance | | | 01/01 to | | | 01/01 to | | | balance | |
| Composition of the carrying amount by class of assets | | 12/31/2010 | | | 12/31/2011 | | | 12/31/2011 | | | 12/31/2011 | |
| Individuals | | | 10,619 | | | | (8,631 | ) | | | 11,641 | | | | 13,629 | |
| Credit card | | | 3,306 | | | | (3,558 | ) | | | 4,077 | | | | 3,825 | |
| Personal loans | | | 3,492 | | | | (2,959 | ) | | | 4,810 | | | | 5,343 | |
| Vehicles | | | 3,709 | | | | (2,041 | ) | | | 2,747 | | | | 4,415 | |
| Mortgage loans | | | 112 | | | | (73 | ) | | | 7 | | | | 46 | |
| Corporate | | | 1,071 | | | | (294 | ) | | | (19 | ) | | | 758 | |
| Small and medium businesses | | | 8,041 | | | | (7,001 | ) | | | 8,157 | | | | 9,197 | |
| Foreign loans and Latin America | | | 263 | | | | (233 | ) | | | 259 | | | | 289 | |
| Total | | | 19,994 | | | | (16,159 | ) | | | 20,038 | | | | 23,873 | |
| | | | | | | | | Net increase/ | | | | |
| | | Opening | | | Write-offs | | | (reversal) | | | Closing | |
| | | balance | | | 01/01 to | | | 01/01 to | | | balance | |
| Composition of the carrying amount by class of assets | | 01/01/2010 | | | 12/31/2010 | | | 12/31/2010 | | | 12/31/2010 | |
| Individuals | | | 12,969 | | | | (9,091 | ) | | | 6,741 | | | | 10,619 | |
| Credit card | | | 4,173 | | | | (2,731 | ) | | | 1,864 | | | | 3,306 | |
| Personal loans | | | 4,491 | | | | (3,908 | ) | | | 2,909 | | | | 3,492 | |
| Vehicles | | | 4,022 | | | | (2,377 | ) | | | 2,064 | | | | 3,709 | |
| Mortgage loans | | | 283 | | | | (75 | ) | | | (96 | ) | | | 112 | |
| Corporate | | | 1,244 | | | | (466 | ) | | | 293 | | | | 1,071 | |
| Small and medium businesses | | | 5,646 | | | | (5,793 | ) | | | 8,188 | | | | 8,041 | |
| Foreign loans and Latin America | | | 386 | | | | (448 | ) | | | 325 | | | | 263 | |
| Total | | | 20,245 | | | | (15,798 | ) | | | 15,547 | | | | 19,994 | |
The composition of the allowance for loan losses by customers sector is shown in the following table:
| | | 12/31/2011 | | | 12/31/2010 | | | 01/01/2010 | |
| Public sector | | | 1 | | | | 16 | | | | 57 | |
| Industry and commerce | | | 6,266 | | | | 5,658 | | | | 4,258 | |
| Services | | | 3,476 | | | | 3,020 | | | | 2,185 | |
| Primary sector | | | 273 | | | | 318 | | | | 529 | |
| Other sectors | | | 32 | | | | 123 | | | | 64 | |
| Individuals | | | 13,825 | | | | 10,859 | | | | 13,152 | |
| Total | | | 23,873 | | | | 19,994 | | | | 20,245 | |
ITAÚ UNIBANCO HOLDING assesses the objective evidence of impairment for loan operations and lease operations on an individual basis for financial assets that are individually significant, and in the aggregate for financial assets that are not individually significant. (Note 2.4.g.VIII).
The composition of the allowance for loan losses by type of assessment of objective evidence of impairment is shown in the following table:
| | | 12/31/2011 | |
| | | Impaired | | | Not Impaired | | | Total | |
| | | Loan | | | Allowance | | | Loan | | | Allowance | | | Loan | | | Allowance | |
| I – Individually evaluated | | | | | | | | | | | | | | | | | | | | | | | | |
| | | | | | | | | | | | | | | | | | | | | | | | | |
| Corporate (*) | | | 1,033 | | | | 430 | | | | 92,196 | | | | 328 | | | | 93,229 | | | | 758 | |
| | | | | | | | | | | | | | | | | | | | | | | | | |
| II - Collectivelly evaluated | | | | | | | | | | | | | | | | | | | | | | | | |
| | | | | | | | | | | | | | | | | | | | | | | | | |
| Individuals | | | 10,986 | | | | 6,738 | | | | 137,141 | | | | 6,891 | | | | 148,127 | | | | 13,629 | |
| Credit card | | | 3,083 | | | | 1,918 | | | | 35,878 | | | | 1,907 | | | | 38,961 | | | | 3,825 | |
| Personal loans | | | 3,455 | | | | 2,087 | | | | 31,798 | | | | 3,256 | | | | 35,253 | | | | 5,343 | |
| Vehicles | | | 4,329 | | | | 2,707 | | | | 56,134 | | | | 1,708 | | | | 60,463 | | | | 4,415 | |
| Mortgage loans | | | 119 | | | | 26 | | | | 13,331 | | | | 20 | | | | 13,450 | | | | 46 | |
| | | | | | | | | | | | | | | | | | | | | | | | | |
| Small and medium businesses | | | 6,770 | | | | 4,808 | | | | 78,879 | | | | 4,389 | | | | 85,649 | | | | 9,197 | |
| | | | | | | | | | | | | | | | | | | | | | | | | |
| Foreign loans and Latin America | | | 63 | | | | 36 | | | | 19,196 | | | | 253 | | | | 19,259 | | | | 289 | |
| | | | | | | | | | | | | | | | | | | | | | | | | |
| Total | | | 18,852 | | | | 12,012 | | | | 327,412 | | | | 11,861 | | | | 346,264 | | | | 23,873 | |
| | | 12/31/2010 | |
| | | Impaired | | | Not impaired | | | Total | |
| | | Loan | | | Allowance | | | Loan | | | Allowance | | | Loan | | | Allowance | |
| I – Individually evaluated | | | | | | | | | | | | | | | | | | | | | | | | |
| | | | | | | | | | | | | | | | | | | | | | | | | |
| Corporate (*) | | | 884 | | | | 394 | | | | 75,699 | | | | 677 | | | | 76,583 | | | | 1,071 | |
| | | | | | | | | | | | | | | | | | | | | | | | | |
| II – Collectively evaluated | | | | | | | | | | | | | | | | | | | | | | | | |
| | | | | | | | | | | | | | | | | | | | | | | | | |
| Individuals | | | 8,086 | | | | 4,839 | | | | 116,701 | | | | 5,780 | | | | 124,787 | | | | 10,619 | |
| Credit card | | | 2,411 | | | | 1,458 | | | | 30,630 | | | | 1,848 | | | | 33,041 | | | | 3,306 | |
| Personal loans | | | 2,195 | | | | 1,380 | | | | 21,333 | | | | 2,112 | | | | 23,528 | | | | 3,492 | |
| Vehicles | | | 3,315 | | | | 1,938 | | | | 56,836 | | | | 1,771 | | | | 60,151 | | | | 3,709 | |
| Mortgage loans | | | 165 | | | | 63 | | | | 7,902 | | | | 49 | | | | 8,067 | | | | 112 | |
| | | | | | | | | | | | | | | | | | | | | | | | | |
| Small and medium businesses | | | 4,856 | | | | 3,412 | | | | 75,094 | | | | 4,629 | | | | 79,950 | | | | 8,041 | |
| | | | | | | | | | | | | | | | | | | | | | | | | |
| Foreign loans and Latin America | | | 52 | | | | 35 | | | | 13,465 | | | | 228 | | | | 13,517 | | | | 263 | |
| | | | | | | | | | | | | | | | | | | | | | | | | |
| Total | | | 13,878 | | | | 8,680 | | | | 280,959 | | | | 11,314 | | | | 294,837 | | | | 19,994 | |
| | | 01/01/2010 | |
| | | Impaired | | | Not impaired | | | Total | |
| | | Loan | | | Allowance | | | Loan | | | Allowance | | | Loan | | | Allowance | |
| I – Individually evaluated | | | | | | | | | | | | | | | | | | | | | | | | |
| | | | | | | | | | | | | | | | | | | | | | | | | |
| Corporate (*) | | | 631 | | | | 172 | | | | 49,797 | | | | 1,072 | | | | 50,428 | | | | 1,244 | |
| | | | | | | | | | | | | | | | | | | | | | | | | |
| II – Collectively evaluated | | | | | | | | | | | | | | | | | | | | | | | | |
| | | | | | | | | | | | | | | | | | | | | | | | | |
| Individuals | | | 8,527 | | | | 6,873 | | | | 98,505 | | | | 6,096 | | | | 107,032 | | | | 12,969 | |
| Credit card | | | 2,446 | | | | 2,350 | | | | 25,302 | | | | 1,823 | | | | 27,748 | | | | 4,173 | |
| Personal loans | | | 2,686 | | | | 2,173 | | | | 18,501 | | | | 2,318 | | | | 21,187 | | | | 4,491 | |
| Vehicles | | | 3,206 | | | | 2,273 | | | | 49,643 | | | | 1,749 | | | | 52,849 | | | | 4,022 | |
| Mortgage loans | | | 189 | | | | 77 | | | | 5,059 | | | | 206 | | | | 5,248 | | | | 283 | |
| | | | | | | | | | | | | | | | | | | | | | | | | |
| Small and medium businesses | | | 4,796 | | | | 3,410 | | | | 71,128 | | | | 2,236 | | | | 75,924 | | | | 5,646 | |
| | | | | | | | | | | | | | | | | | | | | | | | | |
| Foreign loans and Latin America | | | 73 | | | | 3 | | | | 10,956 | | | | 383 | | | | 11,029 | | | | 386 | |
| | | | | | | | | | | | | | | | | | | | | | | | | |
| Total | | | 14,027 | | | | 10,458 | | | | 230,386 | | | | 9,787 | | | | 244,413 | | | | 20,245 | |
(*) As detailed in Note 2.4.g.VIII, corporate loans are first evaluated on an individual basis. In the event there is no objective indication of impairment, these are subsequently evaluated on an aggregate basis in accordance with the characteristics of the operation. As a result, an allowance for loan losses for corporate loans is recognized, both in the individual and the aggregate evaluation.
| c) | Present value of lease operations |
Below is the analysis of the present value of minimum payments receivable from finance leases by maturity basically composed of individual operations - vehicles:
| | | 12/31/2011 | |
| | | Minimum future
payments | | | Future financial
income | | | Present value | |
| Current | | | 15,244 | | | | (1,172 | ) | | | 14,072 | |
| Up to 1 year | | | 15,244 | | | | (1,172 | ) | | | 14,072 | |
| Non-current | | | 18,133 | | | | (5,361 | ) | | | 12,772 | |
| From 1 to 5 years | | | 17,901 | | | | (5,310 | ) | | | 12,591 | |
| Over 5 years | | | 232 | | | | (51 | ) | | | 181 | |
| Total | | | 33,377 | | | | (6,533 | ) | | | 26,844 | |
| | | 12/31/2010 | |
| | | Minimum future
payments | | | Future financial
income | | | Present value | |
| Current | | | 19,462 | | | | (2,047 | ) | | | 17,415 | |
| Up to 1 year | | | 19,462 | | | | (2,047 | ) | | | 17,415 | |
| Non-current | | | 29,611 | | | | (8,879 | ) | | | 20,732 | |
| From 1 to 5 years | | | 28,793 | | | | (8,693 | ) | | | 20,100 | |
| Over 5 years | | | 818 | | | | (186 | ) | | | 632 | |
| Total | | | 49,073 | | | | (10,926 | ) | | | 38,147 | |
| | | 1/1/2010 | |
| | | Minimum future
payments | | | Future financial
income | | | Present value | |
| Current | | | 25,155 | | | | (3,056 | ) | | | 22,099 | |
| Up to 1 year | | | 25,155 | | | | (3,056 | ) | | | 22,099 | |
| Non-current | | | 38,549 | | | | (12,531 | ) | | | 26,018 | |
| From 1 to 5 years | | | 37,302 | | | | (12,404 | ) | | | 24,898 | |
| Over 5 years | | | 1,247 | | | | (127 | ) | | | 1,120 | |
| Total | | | 63,704 | | | | (15,587 | ) | | | 48,117 | |
The allowance for loan loses related to the lease portfolio, amounts to: R$ 2,020 (at 12/31/2011), R$ 2,752 (at 12/31/2010) and R$ 3,010 (at 01/01/2010).
NOTE 12 – INVESTMENTS IN UNCONSOLIDATED COMPANIES
| | | Interest % at
12/31/2011 | | | 12/31/2011 | | | 12/31/2010 | | | 01/01/2010 | |
| | | Total | | | Voting | | | Stockholders’
equity | | | Net
income | | | Investment | | | Share of
comprehensive
income | | | Market
value | | | Stockholders’
equity | | | Net
income | | | Investment | | | Share of
comprehensive
income | | | Market
value | | | Stockholders’
equity | | | Investment | | | Market
value | |
| | | | | | | | | | | | | | | | | | | | | | | | | | | | | | | | | | | | | | | | | | | | | | |
| Porto Seguro Itaú Unibanco Participações S.A. (a) | | | 42.93 | | | | 42.93 | | | | 2,681 | | | | 415 | | | | 2,014 | | | | 144 | | | | 2,094 | | | | 2,494 | | | | 466 | | | | 1,968 | | | | 161 | | | | 2,782 | | | | 2,212 | | | | 1,886 | | | | 1,941 | |
| Banco BPI S.A. (b) (c) | | | 19.01 | | | | 19.01 | | | | 1,151 | | | | (1,880 | ) | | | 219 | | | | (343 | ) | | | 219 | | | | 3,589 | | | | 442 | | | | 682 | | | | 75 | | | | 524 | | | | 4,803 | | | | 914 | | | | 903 | |
| Serasa S.A. (d) | | | 16.14 | | | | 16.14 | | | | 1,119 | | | | 310 | | | | 273 | | | | 102 | | | | - | | | | 1,052 | | | | 301 | | | | 256 | | | | 80 | | | | - | | | | 1,007 | | | | 250 | | | | - | |
| Outros (e) | | | - | | | | - | | | | - | | | | - | | | | 38 | | | | (16 | ) | | | - | | | | - | | | | - | | | | 42 | | | | 33 | | | | - | | | | - | | | | 130 | | | | - | |
| Total | | | - | | | | - | | | | - | | | | - | | | | 2,544 | | | | (113 | ) | | | - | | | | - | | | | - | | | | 2,948 | | | | 349 | | | | - | | | | - | | | | 3,180 | | | | - | |
(a) For purposes of market value, the quoted share price of Porto Seguro S.A. was taken into account. The investment included the amounts of R$ 862 at December 31, 2011, R$ 897 at December 31, 2010 and R$ 936 at January 1, 2010 that correspond to the difference between the interest in the net assets at fair value of Porto Seguro Itaú Unibanco Participações S.A. and the investment cost.
(b) At 12/31/2011, impairment of R$ 277 was recognized in relation to that investment.
(c) Investment recorded under the equity method due to significant influence exerted by management members on the conduction of business.
(d) Indirect interest of ITAÚ UNIBANCO HOLDING as a result of its 66% interest in BIU Participações S.A. which holds 24% of Serasa S.A.’s voting capital.
(e) At 12/31/2011, includes interest in total capital and voting capital of the following companies: Compañia Uruguaya de Medios de Procesamiento S.A. (26.88% total and voting capital); Latosol Empreendimentos e Participação Ltda (32.11% total and voting capital); Redebanc SRL (20.00% total and voting capital) and Tecnologia Bancária S.A. (24.81% total capital and voting capital).
The table below shows the summary of the proportional interest on the aggregate financial information of the investees under the equity method of accounting.
| | | 12/31/2011 | | | 12/31/2010 | | | 01/01/2010 | |
| Total assets (*) | | | 107,783 | | | | 107,250 | | | | 120,798 | |
| Total liabilities (*) | | | 102,831 | | | | 100,114 | | | | 112,783 | |
| Total income (*) | | | 8,739 | | | | 8,275 | | | | - | |
| Total expense (*) | | | (9,894 | ) | | | (7,066 | ) | | | - | |
(*) Basically represented by Banco BPI S.A., in the amount of R$ 103,696 (R$ 103,472 at December 31, 2010 and R$ 117,362 at January 01, 2010) related to assets, R$ 102,544 (R$ 99,883 at December 31, 2010 and R$ 112,566 at January 01, 2010) related to liabilities, R$ 7,081 (R$ 6,428 at December 31, 2010) related to income, and R$ 8,961 (R$ 5,986 at December 31, 2010) related to expenses.
The investees do not have contingent liabilities to which ITAÚ UNIBANCO HOLDING is significantly exposed.
NOTE 13 – LEASE COMMITMENTS AS LESSEE
ITAÚ UNIBANCO HOLDING is the lessee in finance lease contracts of data processing equipment, with the option of purchase or extension, without contingent rental payments or imposed restrictions. The net carrying amount of these assets is R$ 339 (R$ 210 at 12/31/2010 and R$ 109 at 01/01/2010).
The table below shows the total future minimum payments:
| | | 12/31/2011 | | | 12/31/2010 | | | 01/01/2010 | |
| Current | | | 220 | | | | 129 | | | | 63 | |
| Up to 1 year | | | 220 | | | | 129 | | | | 63 | |
| Non-Current | | | 120 | | | | 83 | | | | 46 | |
| From 1 to 5 years | | | 120 | | | | 83 | | | | 46 | |
| Total future minimum payments | | | 340 | | | | 212 | | | | 109 | |
| Future interest | | | 1 | | | | 2 | | | | - | |
| Present value | | | 339 | | | | 210 | | | | 109 | |
ITAÚ UNIBANCO HOLDING leases many properties, for use in its operations, under standard real estate leases that normally can be cancelled at its option and include renewal options and price escalation clauses. No lease agreement imposes any restriction on our ability to pay dividends, engage in debt or equity financing transactions, or enter into further lease agreements, and there are no contingent payments related to the agreements.
Minimum payments for services provided by third parties and rents under operating and capital lease agreements with non-cancelable initial and remaining lease terms of more than one year were as follows:
| | | 12/31/2011 | | | 12/31/2010 | | | 01/01/2010 | |
| Current | | | 882 | | | | 823 | | | | - | |
| Up to 1 year | | | 882 | | | | 823 | | | | - | |
| Non-current | | | 3,131 | | | | 3,311 | | | | 3,392 | |
| From 1 to 5 years | | | 2,537 | | | | 2,571 | | | | 2,646 | |
| Over 5 years | | | 595 | | | | 740 | | | | 746 | |
| Total future minimum payments | | | 4,013 | | | | 4,134 | | | | 3,392 | |
NOTE 14 – FIXED ASSETS
| | | Annual | | | | | | CHANGES | | | | |
| | | depreciation | | | Balance at | | | | | | Depreciation | | | | | | | | | Exchange | | | | | | Balance at | |
| FIXED ASSETS (1) | | rates | | | 01/01/2011 | | | Acquisitions | | | expense | | | Impairment | | | Disposals | | | variation | | | Other | | | 12/31/2011 | |
| REAL ESTATE IN USE (2) | | | | | | | 1,844 | | | | 248 | | | | (96 | ) | | | - | | | | (60 | ) | | | (11 | ) | | | 16 | | | | 1,941 | |
| Land | | | | | | | 1,045 | | | | 167 | | | | - | | | | - | | | | (20 | ) | | | 2 | | | | (10 | ) | | | 1,184 | |
| Buildings | | | | | | | 799 | | | | 81 | | | | (96 | ) | | | - | | | | (40 | ) | | | (13 | ) | | | 26 | | | | 757 | |
| Cost | | | | | | | 2,321 | | | | 81 | | | | - | | | | - | | | | (67 | ) | | | (11 | ) | | | 16 | | | | 2,340 | |
| Accumulated depreciation | | | 4 | | | | (1,522 | ) | | | - | | | | (96 | ) | | | - | | | | 27 | | | | (2 | ) | | | 10 | | | | (1,583 | ) |
| OTHER FIXED ASSETS | | | | | | | 2,957 | | | | 1,655 | | | | (1,088 | ) | | | (15 | ) | | | (87 | ) | | | 17 | | | | (22 | ) | | | 3,417 | |
| Improvements | | | | | | | 626 | | | | 229 | | | | (242 | ) | | | - | | | | (4 | ) | | | (5 | ) | | | 34 | | | | 638 | |
| Cost | | | | | | | 1,116 | | | | 229 | | | | - | | | | - | | | | (131 | ) | | | (1 | ) | | | 32 | | | | 1,245 | |
| Accumulated depreciation | | | 10 | | | | (490 | ) | | | - | | | | (242 | ) | | | - | | | | 127 | | | | (4 | ) | | | 2 | | | | (607 | ) |
| Installations | | | | | | | 267 | | | | 179 | | | | (53 | ) | | | - | | | | (1 | ) | | | 8 | | | | (10 | ) | | | 390 | |
| Cost | | | | | | | 770 | | | | 179 | | | | - | | | | - | | | | (18 | ) | | | 5 | | | | 1 | | | | 937 | |
| Accumulated depreciation | | | 10 to 20 | | | | (503 | ) | | | - | | | | (53 | ) | | | - | | | | 17 | | | | 3 | | | | (11 | ) | | | (547 | ) |
| Furniture and equipment | | | | | | | 433 | | | | 220 | | | | (63 | ) | | | (15 | ) | | | (21 | ) | | | (19 | ) | | | (47 | ) | | | 488 | |
| Cost | | | | | | | 863 | | | | 220 | | | | - | | | | (15 | ) | | | (165 | ) | | | (13 | ) | | | (42 | ) | | | 848 | |
| Accumulated depreciation | | | 10 to 20 | | | | (430 | ) | | | - | | | | (63 | ) | | | - | | | | 144 | | | | (6 | ) | | | (5 | ) | | | (360 | ) |
| EDP systems (3) | | | | | | | 1,404 | | | | 942 | | | | (677 | ) | | | - | | | | (56 | ) | | | 28 | | | | 3 | | | | 1,644 | |
| Cost | | | | | | | 4,746 | | | | 942 | | | | - | | | | - | | | | (671 | ) | | | 39 | | | | (68 | ) | | | 4,988 | |
| Accumulated depreciation | | | 20 to 50 | | | | (3,342 | ) | | | - | | | | (677 | ) | | | - | | | | 615 | | | | (11 | ) | | | 71 | | | | (3,344 | ) |
| | | | | | | | | | | | | | | | | | | | | | | | | | | | | | | | | | | | | |
| Other (communication, security and transportation) | | | | | | | 227 | | | | 85 | | | | (53 | ) | | | - | | | | (5 | ) | | | 5 | | | | (2 | ) | | | 257 | |
| Cost | | | | | | | 529 | | | | 85 | | | | - | | | | - | | | | (66 | ) | | | 3 | | | | (3 | ) | | | 548 | |
| Accumulated depreciation | | | 10 to 20 | | | | (302 | ) | | | - | | | | (53 | ) | | | - | | | | 61 | | | | 2 | | | | 1 | | | | (291 | ) |
| TOTAL FIXED ASSETS | | | | | | | 4,801 | | | | 1,903 | | | | (1,184 | ) | | | (15 | ) | | | (147 | ) | | | 6 | | | | (6 | ) | | | 5,358 | |
| Cost | | | | | | | 11,390 | | | | 1,903 | | | | - | | | | (15 | ) | | | (1,138 | ) | | | 24 | | | | (74 | ) | | | 12,090 | |
| Accumulated depreciation | | | | | | | (6,589 | ) | | | - | | | | (1,184 | ) | | | - | | | | 991 | | | | (18 | ) | | | 68 | | | | (6,732 | ) |
(1) Includes a contractual commitment for the purchase of fixed assets in the amount of R$ 166;
(2) Includes the amount of R$ 2 related to attached real estate; fixed assets under construction in the amount of R$ 131, consisting of R$ 56 in real estate in use; R$ 51 in improvements, and R$ 24 in equipment;
(3) Includes lease contracts, mainly related to data processing equipment, which are accounted for as finance lease operations. The asset and the liability are recognized in the Financial Statements.
| | | | Annual | | | | | | | CHANGES | | | | | |
| | | | depreciation | | | | Balance at | | | | | | | | Depreciation | | | | | | | | | | | | Exchange | | | | | | | | Balance at | |
| FIXED ASSETS (1) | | | rates (%) | | | | 01/01/2010 | | | Acquisitions | | | | expense | | | | Impairment | | | | Disposals | | | | variation | | | | Other | | | | 12/31/2010 | |
| REAL ESTATE IN USE (2) | | | | | | | 1,754 | | | | 208 | | | | (102 | ) | | | - | | | | (9 | ) | | | 8 | | | | (15 | ) | | | 1,844 | |
| Land | | | | | | | 959 | | | | 90 | | | | - | | | | - | | | | (3 | ) | | | - | | | | (1 | ) | | | 1,045 | |
| Buildings | | | | | | | 795 | | | | 118 | | | | (102 | ) | | | - | | | | (6 | ) | | | 8 | | | | (14 | ) | | | 799 | |
| Cost | | | | | | | 2,218 | | | | 118 | | | | - | | | | - | | | | (8 | ) | | | (3 | ) | | | (4 | ) | | | 2,321 | |
| Accumulated depreciation | | | 4 | | | | (1,423 | ) | | | - | | | | (102 | ) | | | - | | | | 2 | | | | 11 | | | | (10 | ) | | | (1,522 | ) |
| OTHER FIXED ASSETS | | | | | | | 2,424 | | | | 1,716 | | | | (1,064 | ) | | | - | | | | (69 | ) | | | (25 | ) | | | (25 | ) | | | 2,957 | |
| Improvements | | | | | | | 592 | | | | 225 | | | | (208 | ) | | | - | | | | (3 | ) | | | 11 | | | | 9 | | | | 626 | |
| Cost | | | | | | | 1,084 | | | | 225 | | | | - | | | | - | | | | (161 | ) | | | 8 | | | | (40 | ) | | | 1,116 | |
| Accumulated depreciation | | | 10 | | | | (492 | ) | | | - | | | | (208 | ) | | | - | | | | 158 | | | | 3 | | | | 49 | | | | (490 | ) |
| Installations | | | | | | | 296 | | | | 145 | | | | (191 | ) | | | - | | | | - | | | | 5 | | | | 12 | | | | 267 | |
| Cost | | | | | | | 606 | | | | 145 | | | | - | | | | - | | | | (146 | ) | | | 4 | | | | 161 | | | | 770 | |
| Accumulated depreciation | | | 10 to 20 | | | | (310 | ) | | | - | | | | (191 | ) | | | - | | | | 146 | | | | 1 | | | | (149 | ) | | | (503 | ) |
| Furniture and equipment | | | | | | | 383 | | | | 275 | | | | (49 | ) | | | - | | | | (3 | ) | | | (30 | ) | | | (143 | ) | | | 433 | |
| Cost | | | | | | | 763 | | | | 275 | | | | - | | | | - | | | | (9 | ) | | | (31 | ) | | | (135 | ) | | | 863 | |
| Accumulated depreciation | | | 10 to 20 | | | | (380 | ) | | | - | | | | (49 | ) | | | - | | | | 6 | | | | 1 | | | | (8 | ) | | | (430 | ) |
| EDP systems (3) | | | | | | | 951 | | | | 954 | | | | (570 | ) | | | - | | | | (60 | ) | | | 22 | | | | 107 | | | | 1,404 | |
| Cost | | | | | | | 4,015 | | | | 954 | | | | - | | | | - | | | | (414 | ) | | | 11 | | | | 180 | | | | 4,746 | |
| Accumulated depreciation | | | 20 to 50 | | | | (3,064 | ) | | | - | | | | (570 | ) | | | - | | | | 354 | | | | 11 | | | | (73 | ) | | | (3,342 | ) |
| Other (communication, security and transportation) | | | | | | | 202 | | | | 117 | | | | (46 | ) | | | - | | | | (3 | ) | | | (33 | ) | | | (10 | ) | | | 227 | |
| Cost | | | | | | | 509 | | | | 117 | | | | - | | | | - | | | | (12 | ) | | | (55 | ) | | | (30 | ) | | | 529 | |
| Accumulated depreciation | | | 10 to 20 | | | | (307 | ) | | | - | | | | (46 | ) | | | - | | | | 9 | | | | 22 | | | | 20 | | | | (302 | ) |
| TOTAL FIXED ASSETS | | | | | | | 4,178 | | | | 1,924 | | | | (1,166 | ) | | | - | | | | (78 | ) | | | (17 | ) | | | (40 | ) | | | 4,801 | |
| Cost | | | | | | | 10,154 | | | | 1,924 | | | | - | | | | - | | | | (753 | ) | | | (66 | ) | | | 131 | | | | 11,390 | |
| Accumulated depreciation | | | | | | | (5,976 | ) | | | - | | | | (1,166 | ) | | | - | | | | 675 | | | | 49 | | | | (171 | ) | | | (6,589 | ) |
(1) There are no contractual commitments for the purchase of new fixed assets.
(2) Includes the amount of R$ 2 related to attached real estate; fixed assets under construction in the amount of R$ 166, consisting of R$ 27 in real estate in use; R$ 113 in improvements, and R$ 26 in equipment;
(3) Includes lease contracts, mainly related to data processing equipment, which are accounted for as finance lease operations. The asset and the liability are recognized in the Financial Statements.
NOTE 15 – INTANGIBLE ASSETS
| | | | | | | | CHANGES | | | | |
| INTANGIBLE ASSETS (1) | | Amortization
period (2) | | Balance at
01/01/2011 | | | Acquisitions | | | Amortization
expense | | | Impairment (3) | | | Terminated
agreements/
Write off | | | Exchange
variation | | | Other | | | Balance at
12/31/2011 | |
| ACQUISITION OF RIGHTS TO CREDIT PAYROLL | | | | | 1,130 | | | | 366 | | | | (603 | ) | | | (24 | ) | | | (112 | ) | | | - | | | | (6 | ) | | | 751 | |
| Cost | | | | | 2,415 | | | | 366 | | | | - | | | | (24 | ) | | | (1,097 | ) | | | - | | | | (12 | ) | | | 1,648 | |
| Accumulated amortization | | Up to 9 | | | (1,285 | ) | | | - | | | | (603 | ) | | | - | | | | 985 | | | | - | | | | 6 | | | | (897 | ) |
| OTHER INTANGIBLE ASSETS | | | | | 1,804 | | | | 1,606 | | | | (381 | ) | | | (6 | ) | | | (28 | ) | | | 28 | | | | 51 | | | | 3,074 | |
| Association for the promotion and offer of financial products and services | | | | | 1,115 | | | | 318 | | | | (114 | ) | | | (6 | ) | | | (28 | ) | | | 1 | | | | 3 | | | | 1,289 | |
| Cost | | | | | 1,171 | | | | 318 | | | | - | | | | (6 | ) | | | (94 | ) | | | 1 | | | | 10 | | | | 1,400 | |
| Accumulated amortization | | Up to 5 | | | (56 | ) | | | - | | | | (114 | ) | | | - | | | | 66 | | | | - | | | | (7 | ) | | | (111 | ) |
| Expenditures on acquisition/ developement of software | | | | | 532 | | | | 981 | | | | (208 | ) | | | - | | | | - | | | | 10 | | | | 23 | | | | 1,338 | |
| Cost | | | | | 1,327 | | | | 981 | | | | - | | | | - | | | | (116 | ) | | | 16 | | | | (75 | ) | | | 2,133 | |
| Accumulated amortization | | 20 | | | (795 | ) | | | - | | | | (208 | ) | | | - | | | | 116 | | | | (6 | ) | | | 98 | | | | (795 | ) |
| Other intangible assets | | | | | 157 | | | | 307 | | | | (59 | ) | | | - | | | | - | | | | 17 | | | | 25 | | | | 447 | |
| Cost | | | | | 271 | | | | 307 | | | | - | | | | - | | | | (7 | ) | | | 25 | | | | 25 | | | | 621 | |
| Accumulated amortization | | 10 to 20 | | | (114 | ) | | | - | | | | (59 | ) | | | - | | | | 7 | | | | (8 | ) | | | - | | | | (174 | ) |
| TOTAL INTANGIBLE ASSETS | | | | | 2,934 | | | | 1,972 | | | | (984 | ) | | | (30 | ) | | | (140 | ) | | | 28 | | | | 45 | | | | 3,825 | |
| Cost | | | | | 5,184 | | | | 1,972 | | | | - | | | | (30 | ) | | | (1,314 | ) | | | 42 | | | | (52 | ) | | | 5,802 | |
| Accumulated amortization | | | | | (2,250 | ) | | | - | | | | (984 | ) | | | - | | | | 1,174 | | | | (14 | ) | | | 97 | | | | (1,977 | ) |
(1) There are no contractual commitments for the purchase of new intangible assets;
(2) All intangible assets have a defined useful life.
(3) Note 2.4.l.
| | | | | | | CHANGES | | |
| | | | | | | | | | | | | Terminated | | | | | | |
| | | Amortization | | Balance at | | | | Amortization | | | | agreements/ | | Exchange | | | | Balance at |
| INTANGIBLE ASSETS (1) | | period (2) | | 01/01/2010 | | Acquisitions | | expense | | Impairment (3) | | Write off | | variation | | Other | | 12/31/2010 |
| ACQUISITION OF RIGHTS TO CREDIT PAYROLL | | | | | | | 1,684 | | | | 182 | | | | (649 | ) | | | (17 | ) | | | (70 | ) | | | - | | | | - | | | | 1,130 | |
| Cost | | | | | | | 2,598 | | | | 182 | | | | - | | | | (17 | ) | | | (348 | ) | | | - | | | | - | | | | 2,415 | |
| Accumulated amortization | | | Up to 9 | | | | (914 | ) | | | - | | | | (649 | ) | | | - | | | | 278 | | | | - | | | | - | | | | (1,285 | ) |
| OTHER INTANGIBLE ASSETS | | | | | | | 1,725 | | | | 400 | | | | (328 | ) | | | (3 | ) | | | (20 | ) | | | (10 | ) | | | 40 | | | | 1,804 | |
| Association for the promotion and offer of financial products and services | | | | | | | 1,076 | | | | 195 | | | | (133 | ) | | | (3 | ) | | | (20 | ) | | | - | | | | - | | | | 1,115 | |
| Cost | | | | | | | 1,091 | | | | 195 | | | | - | | | | (3 | ) | | | (112 | ) | | | - | | | | - | | | | 1,171 | |
| Accumulated amortization | | | Up to 5 | | | | (15 | ) | | | - | | | | (133 | ) | | | - | | | | 92 | | | | - | | | | - | | | | (56 | ) |
| Expenditures on acquisition/ developement of software | | | | | | | 457 | | | | 205 | | | | (165 | ) | | | - | | | | - | | | | (8 | ) | | | 43 | | | | 532 | |
| Cost | | | | | | | 1,173 | | | | 205 | | | | - | | | | - | | | | (158 | ) | | | (18 | ) | | | 125 | | | | 1,327 | |
| Accumulated amortization | | | 20 | | | | (716 | ) | | | - | | | | (165 | ) | | | - | | | | 158 | | | | 10 | | | | (82 | ) | | | (795 | ) |
| Other Intangible Assets | | | | | | | 192 | | | | - | | | | (30 | ) | | | - | | | | - | | | | (2 | ) | | | (3 | ) | | | 157 | |
| Cost | | | | | | | 256 | | | | - | | | | - | | | | - | | | | - | | | | 17 | | | | (2 | ) | | | 271 | |
| Accumulated amortization | | | 10 to 20 | | | | (64 | ) | | | - | | | | (30 | ) | | | - | | | | - | | | | (19 | ) | | | (1 | ) | | | (114 | ) |
| TOTAL INTANGIBLE ASSETS | | | | | | | 3,409 | | | | 582 | | | | (977 | ) | | | (20 | ) | | | (90 | ) | | | (10 | ) | | | 40 | | | | 2,934 | |
| Cost | | | | | | | 5,118 | | | | 582 | | | | - | | | | (20 | ) | | | (618 | ) | | | (1 | ) | | | 123 | | | | 5,184 | |
| Accumulated amortization | | | | | | | (1,709 | ) | | | - | | | | (977 | ) | | | - | | | | 528 | | | | (9 | ) | | | (83 | ) | | | (2,250 | ) |
(1) There are no contractual commitments for the purchase of new intangible assets;
(2) All intangible assets have a defined useful life.
(3) Note 2.4.l.
NOTE 16 – DEPOSITS
The table below shows the breakdown of deposits:
| | | 12/31/2011 | | | 12/31/2010 | | | 01/01/2010 | |
| | | CURRENT | | | NON-
CURRENT | | | TOTAL | | | CURRENT | | | NON-
CURRENT | | | TOTAL | | | CURRENT | | | NON-
CURRENT | | | TOTAL | |
| Interest-bearing deposits | | | 130,523 | | | | 83,181 | | | | 213,704 | | | | 114,017 | | | | 63,134 | | | | 177,151 | | | | 97,006 | | | | 68,829 | | | | 165,835 | |
| Time deposits | | | 61,560 | | | | 82,909 | | | | 144,469 | | | | 53,522 | | | | 62,894 | | | | 116,416 | | | | 45,944 | | | | 68,680 | | | | 114,624 | |
| Interbank deposits | | | 1,793 | | | | 272 | | | | 2,065 | | | | 1,689 | | | | 240 | | | | 1,929 | | | | 1,843 | | | | 149 | | | | 1,992 | |
| Investment deposits | | | - | | | | - | | | | - | | | | 906 | | | | - | | | | 906 | | | | 997 | | | | - | | | | 997 | |
| Savings deposits | | | 67,170 | | | | - | | | | 67,170 | | | | 57,900 | | | | - | | | | 57,900 | | | | 48,222 | | | | - | | | | 48,222 | |
| Non-interest bearing deposits | | | 28,932 | | | | - | | | | 28,932 | | | | 25,537 | | | | - | | | | 25,537 | | | | 24,881 | | | | - | | | | 24,881 | |
| Demand deposits | | | 28,932 | | | | - | | | | 28,932 | | | | 25,349 | | | | - | | | | 25,349 | | | | 24,664 | | | | - | | | | 24,664 | |
| Other deposits | | | - | | | | - | | | | - | | | | 188 | | | | - | | | | 188 | | | | 217 | | | | - | | | | 217 | |
| Total | | | 159,455 | | | | 83,181 | | | | 242,636 | | | | 139,554 | | | | 63,134 | | | | 202,688 | | | | 121,887 | | | | 68,829 | | | | 190,716 | |
NOTE 17 - FINANCIAL LIABILITIES HELD FOR TRADING
Financial liabilities held for trading are presented in the following table:
| | | 12/31/2011 | | | 12/31/2010 | | | 01/01/2010 | |
| Finacial liabilities held for trading | | | | | | | | | | | | |
| Structured notes | | | 2,815 | | | | 1,335 | | | | 663 | |
| Total | | | 2,815 | | | | 1,335 | | | | 663 | |
The change in fair value of financial liabilities held for trading was R$ 1,480 (R$ 672 at December 31, 2010).
The effect of the changes in credit risk of these instruments is not significant for years ended at December 31, 2011 and 2010.
The balance is comprised of short position in shares in the amount of R$ 1,666 (R$ 928 at 12/31/2010) and debt securities in the amount of R$ 1,149 (R$ 407 at 12/31/2010). For shares, in view of the characteristics of the instrument, there is no definite value to be paid at the maturity date. For debt securities, the amount to be paid at maturity comprises several exchange rates and indices, and there is no contractual amount for settlement.
The fair value of Financial liabilities held for trading by maturity is as follows:
| | | 12/31/2011 | | | 12/31/2010 | | | 01/01/2010 | |
| CURRENT | | | 1,803 | | | | 658 | | | | 231 | |
| Up to one year | | | 1,803 | | | | 658 | | | | 231 | |
| NON-CURRENT | | | 1,012 | | | | 677 | | | | 432 | |
| From one to five years | | | 909 | | | | 632 | | | | 395 | |
| From five to ten years | | | 89 | | | | 32 | | | | 37 | |
| After ten years | | | 14 | | | | 13 | | | | - | |
| TOTAL | | | 2,815 | | | | 1,335 | | | | 663 | |
NOTE 18 - SECURITIES SOLD UNDER REPURCHASE AGREEMENTS AND INTERBANK AND INSTITUTIONAL MARKET DEBTS
| a) | Securities sold under repurchase agreements and Interbank market debt |
The table below shows the breakdown of funds:
| | | 12/31/2011 | | 12/31/2010 | | 01/01/2010 |
| | | CURRENT | | NON-
CURRENT | | TOTAL | | CURRENT | | NON-
CURRENT | | TOTAL | | CURRENT | | NON-
CURRENT | | TOTAL |
| Securities sold under repurchase agreements | | | 78,408 | | | | 107,005 | | | | 185,413 | | | | 122,445 | | | | 77,212 | | | | 199,657 | | | | 88,420 | | | | 43,525 | | | | 131,945 | |
| Interbank market debt | | | 47,265 | | | | 43,233 | | | | 90,498 | | | | 32,551 | | | | 30,048 | | | | 62,599 | | | | 22,641 | | | | 22,034 | | | | 44,675 | |
| Mortgage notes | | | 37 | | | | 207 | | | | 244 | | | | 48 | | | | 254 | | | | 302 | | | | 144 | | | | 368 | | | | 512 | |
| Real estate credit bills | | | 14,470 | | | | 1,281 | | | | 15,751 | | | | 8,259 | | | | 477 | | | | 8,736 | | | | 5,711 | | | | 158 | | | | 5,869 | |
| Agribusiness credit bills | | | 1,422 | | | | 1,862 | | | | 3,284 | | | | 2,660 | | | | 114 | | | | 2,774 | | | | 2,383 | | | | 61 | | | | 2,444 | |
| Financial credit bills | | | 2,544 | | | | 11,764 | | | | 14,308 | | | | - | | | | 2,466 | | | | 2,466 | | | | - | | | | - | | | | - | |
| Import and export financing | | | 17,755 | | | | 3,697 | | | | 21,452 | | | | 11,815 | | | | 3,640 | | | | 15,455 | | | | 8,434 | | | | 3,794 | | | | 12,228 | |
| Onlending - domestic | | | 11,037 | | | | 24,422 | | | | 35,459 | | | | 9,769 | | | | 21,920 | | | | 31,689 | | | | 5,969 | | | | 16,387 | | | | 22,356 | |
| Other | | | - | | | | - | | | | - | | | | - | | | | 1,177 | | | | 1,177 | | | | - | | | | 1,266 | | | | 1,266 | |
Funding for import and export financing represents credit facilities available for financing of imports and exports of Brazilian companies, in general denominated in foreign currency. The interest rate for each one of the operations (p.a.) is presented in the table below:
| | | Brazil | | | Foreign | |
| Securities sold under repurchase agreements | | 50% CDI to 16.68% | | | 0.37% to 5.28% | |
| Mortgage notes | | - | | | 2.70% to 7.50% | |
| Real estate credit bills | | 82% to 100% CDI | | | - | |
| Financial credit bills | | IGPM to 112.75% CDI | | | - | |
| Agribusiness credit bills | | 20% to 95% CDI | | | - | |
| Import and export financing | | 0.20% to 105.25% CDI | | | 0,86% to 11.75% | |
| Onlending - domestic | | 0.50% to 10.50% TJLP | | | - | |
In “Securities sold under repurchase agreements”, are presented the liabilities in transactions in which ITAÚ UNIBANCO HOLDING sells to customers in exchange for cash debt securities issued by its consolidated subsidiaries previously held in treasury, and where it undertakes to repurchase them at any time after the sale up to a repurchase deadline, at which time they must be repurchased by ITAÚ UNIBANCO HOLDING. The repurchase price is computed as the price paid on the sale date plus interest at rates ranging from 50% CDI and 16.68%. The deadline for repurchase expires in January 2027.
| b) | Institutional market debt |
The table below presents the breakdown of funds obtained in Institutional markets:
| | | 12/31/2011 | | | 12/31/2010 | | | 01/01/2010 | |
| | | CURRENT | | | NON-
CURRENT | | | TOTAL | | | CURRENT | | | NON-
CURRENT | | | TOTAL | | | CURRENT | | | NON-
CURRENT | | | TOTAL | |
| Subordinated debt | | | 10,719 | | | | 28,996 | | | | 39,715 | | | | 979 | | | | 33,508 | | | | 34,487 | | | | 42 | | | | 22,684 | | | | 22,726 | |
| Debentures | | | 1,039 | | | | - | | | | 1,039 | | | | 293 | | | | 1,091 | | | | 1,384 | | | | 237 | | | | 2,527 | | | | 2,764 | |
| Foreign borrowings through securities | | | 8,143 | | | | 5,910 | | | | 14,053 | | | | 2,659 | | | | 5,983 | | | | 8,642 | | | | 1,716 | | | | 3,324 | | | | 5,040 | |
| Total | | | 19,901 | | | | 34,906 | | | | 54,807 | | | | 3,931 | | | | 40,582 | | | | 44,513 | | | | 1,995 | | | | 28,535 | | | | 30,530 | |
The interest rate for each one of the operations (p.a.) is presented in the table below:
| | | Brazil | | | Foreign |
| Subordinated debt | | CDI + 0.35% to IPCA + 7.80% | | | 3.04% to 6.20% |
| Debentures | | CDI +0.35% | | | - |
| Foreign borrowings through securities | | 1.40% to 9.50% | | | 1.52% to 11.00% |
NOTE 19 - OTHER ASSETS AND LIABILITIES
| | | 12/31/2011 | | | 12/31/2010 | | | 01/01/2010 | |
| | | CURRENT | | | NON-
CURRENT | | | TOTAL | | | CURRENT | | | NON-
CURRENT | | | TOTAL | | | CURRENT | | | NON-
CURRENT | | | TOTAL | |
| Financial (1) | | | 28,952 | | | | 11,302 | | | | 40,254 | | | | 30,720 | | | | 10,225 | | | | 40,945 | | | | 17,160 | | | | 9,771 | | | | 26,931 | |
| Receivables from credit card issuers | | | 18,317 | | | | - | | | | 18,317 | | | | 18,061 | | | | - | | | | 18,061 | | | | 9,520 | | | | - | | | | 9,520 | |
| Insurance and reinsurance operations | | | 3,590 | | | | - | | | | 3,590 | | | | 3,093 | | | | - | | | | 3,093 | | | | 2,638 | | | | - | | | | 2,638 | |
| Deposits in guarantee for contingent liabilities (Note 31) | | | 2,211 | | | | 10,632 | | | | 12,843 | | | | 2,397 | | | | 9,508 | | | | 11,905 | | | | 1,444 | | | | 9,153 | | | | 10,597 | |
| Deposits in guarantee for foreign borrowing programs | | | 601 | | | | - | | | | 601 | | | | 1,876 | | | | - | | | | 1,876 | | | | 411 | | | | - | | | | 411 | |
| Negotiation and intermediation of securities | | | 1,734 | | | | - | | | | 1,734 | | | | 3,290 | | | | - | | | | 3,290 | | | | 1,059 | | | | - | | | | 1,059 | |
| Receivables from reimbursement of contingent liabilities (Note 31c) | | | 626 | | | | - | | | | 626 | | | | 763 | | | | 140 | | | | 903 | | | | 805 | | | | 78 | | | | 883 | |
| Receivables from services provided | | | 1,260 | | | | - | | | | 1,260 | | | | 1,140 | | | | - | | | | 1,140 | | | | 943 | | | | - | | | | 943 | |
| Amounts receivable from FCVS – Salary Variations Compensation Fund (2) | | | - | | | | 670 | | | | 670 | | | | - | | | | 577 | | | | 577 | | | | 11 | | | | 522 | | | | 533 | |
| Foreign exchange portfolio | | | 268 | | | | - | | | | 268 | | | | - | | | | - | | | | - | | | | - | | | | - | | | | - | |
| Operations without credit granting characteristics | | | 345 | | | | - | | | | 345 | | | | 100 | | | | - | | | | 100 | | | | 329 | | | | 18 | | | | 347 | |
| Non-financial | | | 5,872 | | | | 1,485 | | | | 7,357 | | | | 4,653 | | | | 984 | | | | 5,637 | | | | 4,221 | | | | 1,541 | | | | 5,762 | |
| Prepaid expenses | | | 2,335 | | | | 1,485 | | | | 3,820 | | | | 1,340 | | | | 984 | | | | 2,324 | | | | 1,125 | | | | 1,541 | | | | 2,666 | |
| Retirement plan assets (Notes 28b and c) | | | 1,785 | | | | - | | | | 1,785 | | | | 1,536 | | | | - | | | | 1,536 | | | | 1,534 | | | | - | | | | 1,534 | |
| Sundry-domestic | | | 897 | | | | - | | | | 897 | | | | 1,087 | | | | - | | | | 1,087 | | | | 581 | | | | - | | | | 581 | |
| Sundry-foreign | | | 113 | | | | - | | | | 113 | | | | 88 | | | | - | | | | 88 | | | | 187 | | | | - | | | | 187 | |
| Other | | | 742 | | | | - | | | | 742 | | | | 602 | | | | - | | | | 602 | | | | 794 | | | | - | | | | 794 | |
(1) In this period, there were no impairment losses for other financial assets.
(2) The Salary Variations Compensation Fund – FCVS was established through Resolution No. 25, of June 16, 1967, of the Board of the former BNH (National Housing Bank), and its purpose is to settle balances remaining after the end of real estate financing contracted up to March 1990, relating to agreements financed under the SFH (National Housing System), and provided that they are covered by FCVS.
| | | 12/31/2011 | | | 12/31/2010 | | | 01/01/2010 | |
| | | CURRENT | | | NON-
CURRENT | | | TOTAL | | | CURRENT | | | NON-
CURRENT | | | TOTAL | | | CURRENT | | | NON-
CURRENT | | | TOTAL | |
| Financial | | | 43,999 | | | | 120 | | | | 44,119 | | | | 40,881 | | | | 131 | | | | 41,012 | | | | 26,764 | | | | 60 | | | | 26,825 | |
| Credit card operations | | | 41,195 | | | | - | | | | 41,195 | | | | 37,282 | | | | 23 | | | | 37,305 | | | | 25,337 | | | | - | | | | 25,337 | |
| Foreign exchange portfolio | | | - | | | | - | | | | - | | | | 320 | | | | - | | | | 320 | | | | 154 | | | | - | | | | 154 | |
| Negotiation and intermediation of securities | | | 2,504 | | | | - | | | | 2,504 | | | | 3,099 | | | | - | | | | 3,099 | | | | 1,135 | | | | - | | | | 1,135 | |
| Finance leases (Note 13a) | | | 219 | | | | 120 | | | | 339 | | | | 128 | | | | 82 | | | | 210 | | | | 82 | | | | 27 | | | | 109 | |
| Funds from consortia participants | | | 81 | | | | - | | | | 81 | | | | 52 | | | | 26 | | | | 78 | | | | 56 | | | | 33 | | | | 90 | |
| Non-financial | | | 17,939 | | | | 686 | | | | 18,625 | | | | 15,771 | | | | 250 | | | | 16,021 | | | | 14,987 | | | | 340 | | | | 15,327 | |
| Collection and payment of taxes and contributions | | | 868 | | | | - | | | | 868 | | | | 694 | | | | - | | | | 694 | | | | 468 | | | | - | | | | 468 | |
| Sundry creditors - domestic | | | 1,228 | | | | - | | | | 1,228 | | | | 848 | | | | - | | | | 848 | | | | 814 | | | | - | | | | 814 | |
| Funds for clients in transit | | | 6,092 | | | | - | | | | 6,092 | | | | 5,126 | | | | - | | | | 5,126 | | | | 3,805 | | | | - | | | | 3,805 | |
| Provision for sundry payments | | | 1,574 | | | | 570 | | | | 2,144 | | | | 2,080 | | | | 226 | | | | 2,306 | | | | 2,006 | | | | 273 | | | | 2,279 | |
| Social and statutory | | | 2,891 | | | | 85 | | | | 2,976 | | | | 3,132 | | | | 24 | | | | 3,156 | | | | 4,229 | | | | - | | | | 4,229 | |
| Related to insurance operations | | | 914 | | | | - | | | | 914 | | | | 753 | | | | - | | | | 753 | | | | 1,029 | | | | - | | | | 1,029 | |
| Liabilities for official agreements and rendering of payment services | | | 1,507 | | | | - | | | | 1,507 | | | | 735 | | | | - | | | | 735 | | | | 415 | | | | - | | | | 415 | |
| Provision for retirement plan benefits (Notes 28b and d) | | | 343 | | | | 31 | | | | 374 | | | | 228 | | | | - | | | | 228 | | | | 169 | | | | 67 | | | | 236 | |
| Personnel provision | | | 1,113 | | | | - | | | | 1,113 | | | | 1,040 | | | | - | | | | 1,040 | | | | 892 | | | | - | | | | 892 | |
| Provision for health insurance | | | 623 | | | | - | | | | 623 | | | | 606 | | | | - | | | | 606 | | | | 596 | | | | - | | | | 596 | |
| Deferred income | | | 570 | | | | - | | | | 570 | | | | 311 | | | | - | | | | 311 | | | | 284 | | | | - | | | | 284 | |
| Other | | | 216 | | | | - | | | | 216 | | | | 218 | | | | - | | | | 218 | | | | 280 | | | | - | | | | 280 | |
NOTE 20 – STOCKHOLDERS’ EQUITY
At the Extraordinary Stockholders’ Meeting held on April 25, 2011 and as ratified by the Brazilian Central Bank on August 22, 2011, the stockholders approved a 100 to 1 reverse stock split and simultaneously a 1 to 100 stock split. This required cancellation of 75 common shares and 44 preferred shares, all of which are book entry shares of ITAÚ UNIBANCO HOLDING and existing in treasury, with no capital reduction.
Capital comprises 4,570,936,100 book-entry shares with no par value, of which 2,289,286,400 are common shares and 2,281,649,700 are preferred shares without voting rights; preferred shares have tag-along rights, in the event of a change in control, at a price equal to 80% of the amount per share paid for the controlling common shares. Capital stock amounts to R$ 45,000 (R$ 45,000 at December 31, 2010), of which R$ 31,552 (R$ 31,547 at December 31, 2010) refers to stockholders resident in Brazil and R$ 13,448 (R$ 13,453 at December 31, 2010) refers to stockholders resident abroad.
The table below shows the breakdown of and change in shares of paid-in capital and reconciliation of balances at the beginning and end of the year:
| | | 12/31/2011 |
| | | NUMBER | | | |
| | | Common | | Preferred | | | Total | | | Amount | |
| Residents in Brazil at 12/31/2010 | | 2,286,135,621 | | | 918,287,035 | | | | 3,204,422,656 | | | | | |
| Residents abroad at 12/31/2010 | | 3,150,854 | | | 1,363,362,709 | | | | 1,366,513,563 | | | | | |
| Shares of capital stock at 12/31/2010 | | 2,289,286,475 | | | 2,281,649,744 | | | | 4,570,936,219 | | | | | |
| Cancellation of shares – ESM of 04/25/2011 – Approved on 08/22/2011 | | (75) | | | (44 | ) | | | (119 | ) | | | | |
| Shares of capital stock at 12/31/2011 | | 2,289,286,400 | | | 2,281,649,700 | | | | 4,570,936,100 | | | | | |
| Residents in Brazil at 12/31/2011 | | 2,283,888,835 | | | 921,023,218 | | | | 3,204,912,053 | | | | | |
| Residents abroad at 12/31/2011 | | 5,397,565 | | | 1,360,626,482 | | | | 1,366,024,047 | | | | | |
| Treasury shares at 12/31/2010 (*) | | 2,202 | | | 26,566,015 | | | | 26,568,217 | | | | (628 | ) |
| Purchase of shares | | - | | | 40,970,900 | | | | 40,970,900 | | | | (1,303 | ) |
| Exercised options - Granting of stock options – Simple and Partner options | | - | | | (5,977,962 | ) | | | (5,977,962 | ) | | | 117 | |
| Disposals – stock option plan | | (27) | | | (4,264,938 | ) | | | (4,264,965 | ) | | | 151 | |
| (-) Cancellation of shares – ESM of 04/25/2011 | | (75) | | | (44 | ) | | | (119 | ) | | | - | |
| Treasury shares at 12/31/2011 (*) | | 2,100 | | | 57,293,971 | | | | 57,296,071 | | | | (1,663 | ) |
| Shares outstanding at 12/31/2011 | | 2,289,284,300 | | | 2,224,355,729 | | | | 4,513,640,029 | | | | | |
| Shares outstanding at 12/31/2010 | | 2,289,284,273 | | | 2,255,083,729 | | | | 4,544,368,002 | | | | | |
| | | 12/31/2010 |
| | | Number | | | |
| | | Common | | Preferred | | | Total | | Amount | |
| Residents in Brazil at 01/01/2010 | | 2,286,135,621 | | | 918,287,035 | | | 3,204,422,656 | | | | |
| Residents abroad at 01/01/2010 | | 3,150,854 | | | 1,363,362,709 | | | 1,366,513,563 | | | | |
| Shares of capital stock at 01/01/2010 | | 2,289,286,475 | | | 2,281,649,744 | | | 4,570,936,219 | | | | |
| Treasury shares at 01/01/2010 (*) | | 2,202 | | | 43,588,307 | | | 43,590,509 | | | (1,031 | ) |
| Exercised options - Granting of stock options – Simple and Partner options | | - | | | (13,379,117 | ) | | (13,379,117 | ) | | 317 | |
| Disposals – stock option plan | | - | | | (3,643,175 | ) | | (3,643,175 | ) | | 86 | |
| Treasury shares at 12/31/2010 (*) | | 2,202 | | | 26,566,015 | | | 26,568,217 | | | (628 | ) |
| Shares outstanding at 12/31/2010 | | 2,289,284,273 | | | 2,255,083,729 | | | 4,544,368,002 | | | | |
| Shares outstanding at 01/01/2010 | | 2,289,284,273 | | | 2,238,061,437 | | | 4,527,345,710 | | | | |
(*) Own shares, purchased based on authorization of the Board of Directors, to be held in Treasury for subsequent cancellation or replacement in the market.
We detail below the costs of shares purchased in the period, as well as the average cost of treasury shares and their market price (in Brazilian reais per share):
| | | 01/01 to 12/31/2011 | |
| Cost/market value | | Common | | | Preferred | |
| Minimum | | | - | | | | 26.20 | |
| Weighted average | | | - | | | | 31.79 | |
| Maximum | | | - | | | | 37.40 | |
| Treasury shares | | | | | | | | |
| Average cost | | | 9.65 | | | | 29.03 | |
| Market value at 12/31/2011 | | | 27.01 | | | | 33.99 | |
| | | 01/01 to 12/31/2010 | |
| Cost/market value | | Common | | | Preferred | |
| Treasury shares | | | | | | | | |
| Average cost | | | 9.65 | | | | 23.66 | |
| Market value at 12/31/2010 | | | 31.00 | | | | 39.79 | |
Stockholders are entitled to an annual mandatory minimum dividend of not less than 25% of adjusted profit, pursuant to the provisions of the Brazilian Corporate Law. Both common and preferred shares participate equally, after common shares have received dividends equal to the annual minimum priority dividend of R$ 0.022 per share to be paid on preferred shares.
The calculation of the monthly advance of the mandatory minimum dividend is based on the share position on the last day of the prior month, with payment being made on the first business day of the subsequent month, in the amount of R$ 0.012 per share. The amount per share was determined according to a resolution adopted at the A/ESM held on April 24,2009.
Additionally, interest on capital was declared after December 31, 2011, segregated into stockholders' equity in special revenue reserves in the amount of R$ 1,847 - R$ 0.4092 per share, which, net of withholding income tax, totals R$ 1,570 (R$ 1,308 - R$ 0.2879 per share, which, net of withholding income tax, totals R$ 1,112 to December 31,2010).
Payments/Provision for interest on capital and dividends
| | | 12/31/2011 | |
| | | Gross | | | WTF | | | Net | |
| Paid / Prepaid | | | 1,820 | | | | (183 | ) | | | 1,637 | |
| Dividends - 11 monthly installments of R$ 0.012 per share paid from February to December 2011 | | | 598 | | | | - | | | | 598 | |
| Interest on capital - R$ 0.2706 per share, paid on August 22, 2011 | | | 1,222 | | | | (183 | ) | | | 1,039 | |
| | | | | | | | | | | | | |
| Declared before December 31, 2011 (Recorded in Other Liabilities) | | | 1,387 | | | | (200 | ) | | | 1,187 | |
| Dividends - 1 monthly installment of R$ 0.012 per share, paid on January 2, 2012 | | | 54 | | | | - | | | | 54 | |
| Interest on capital - R$ 0.2880 per share, credited on December 29, 2011 to be paid by April 30, 2012 | | | 1,300 | | | | (195 | ) | | | 1,105 | |
| Interest on capital - R$ 0.0072 per share to be paid by April 30, 2012 | | | 33 | | | | (5 | ) | | | 28 | |
| | | | | | | | | | | | | |
| Declared after December 31, 2011 (Recorded in Revenue Reserve - Unrealized profits) | | | 1,847 | | | | (277 | ) | | | 1,570 | |
| Interest on capital - R$ 0.4092 per share to be paid by April 30, 2012 | | | 1,847 | | | | (277 | ) | | | 1,570 | |
| | | | | | | | | | | | | |
| Total from 01/01 to 12/31/2011 - R$ 0.9727 net per share | | | 5,054 | | | | (660 | ) | | | 4,394 | |
Payments/Provision of interest on capital and dividends
| | | 12/31/2010 | |
| | | Gross | | | WTF | | | Net | |
| Paid / Prepaid | | | 1,716 | | | | (168 | ) | | | 1,548 | |
| Dividends - 11 monthly installments of R$ 0.012 per share paid from February to December 2010 | | | 598 | | | | - | | | | 598 | |
| Interest on capital - R$ 0.2465 per share, paid on 08/20/2010 | | | 1,118 | | | | (168 | ) | | | 950 | |
| | | | | | | | | | | | | |
| Declared until December 31, 2010 (Recorded in Other Liabilities) | | | 1,460 | | | | (210 | ) | | | 1,250 | |
| Dividends - 1 monthly installment of R$ 0.012 per share, paid on 01/02/2011 | | | 55 | | | | - | | | | 55 | |
| Interest on capital - R$ 0.2150 per share, credited at 12/30/2010 to be paid up to 04/30/2011 | | | 977 | | | | (147 | ) | | | 830 | |
| Interest on capital - R$ 0.0943 per share to be paid up to 04/30/2011 | | | 428 | | | | (63 | ) | | | 365 | |
| Declared after December 31, 2010 (Recorded in Revenue Reserve) | | | 1,308 | | | | (196 | ) | | | 1,112 | |
| Interest on capital - R$ 0.2879 per share to be paid by April 30, 2011 | | | 1,308 | | | | (196 | ) | | | 1,112 | |
| | | | | | | | | | | | | |
| Total from 01/01 to 12/31/2010 - R$ 0.8605 net per share | | | 4,484 | | | | (574 | ) | | | 3,910 | |
| c) | Additional paid-in capital |
Additional paid-in capital corresponds to: (i) the difference between the proceeds from the sale of treasury shares and the average cost of such shares, and (ii) the compensation expenses recognized in accordance with the stock option plan.
| | | 12/31/2011 | | | 12/31/2010 | | | 01/01/2010 | |
| CAPITAL RESERVES (1) | | | 285 | | | | 285 | | | | 285 | |
| Premium on subscription of shares | | | 284 | | | | 284 | | | | 284 | |
| Reserves from tax incentives and restatement of equity securities and other | | | | | | | | | | | | |
| | | | 1 | | | | 1 | | | | 1 | |
| REVENUE RESERVES | | | 23,994 | | | | 16,619 | | | | 6,516 | |
| Legal (2) | | | 3,848 | | | | 3,254 | | | | 2,740 | |
| Statutory | | | 18,299 | | | | 13,365 | | | | 3,418 | |
| Dividends equalization (3) | | | 3,751 | | | | 3,403 | | | | 1,062 | |
| Working capital increase (4) | | | 5,257 | | | | 3,963 | | | | 1,414 | |
| Increase in capital of investees(5) | | | 9,291 | | | | 5,999 | | | | 942 | |
| Unrealized profits (6) | | | 1,847 | | | | - | | | | - | |
| Unrealized income (7) | | | - | | | | - | | | | 358 | |
| Total reserves at parent company | | | 24,279 | | | | 16,904 | | | | 6,801 | |
| (1) | Refers to amounts received by Itaú Unibanco Holding that were not included in the statement of income, since they do not refer to compensation for the provision of goods or services. |
| (2) | Legal Reserve - may be used to increase capital or to absorb losses, but it cannot be distributed as dividends. |
| (3) | Reserve for Dividends Equalization - its purpose is to reserve funds for the payment or advances of dividends, including interest on capital, to maintain the flow of the stockholders' compensation. |
| (4) | Reserve for Working Capital - its purpose is to guarantee funds for operations. |
| (5) | Reserve for Increase in Capital of Investees - its purpose is to guarantee the preemptive right in the capital increases of investees. |
| (6) | Refers to Interest on Capital declared after December 31, 2011. |
| (7) | Refers to the excess of the mandatory minimum dividend in relation to portion of net income realised. |
| e) | Unappropriated reserves |
Refers to the balance of profit remaining after the distribution of dividends and interest on capital and appropriations to statutory reserves in the statutory accounts of ITAÚ UNIBANCO HOLDING.
NOTE 21 – STOCK OPTION PLAN
| a) | Purpose and Guidelines of the Plan |
The Group has a stock option plan for its executives. This program aims at involving the members of management in the medium and long-term corporate development process, by granting simple stock options or bonus options, that are personal and cannot be pledged or transferred, entitling the holder to subscribe one authorized capital share or, at the discretion of the management, one treasury share which has been acquired for the purpose of reselling.
Such options may only be granted in years in which there are sufficient profits to enable the distribution of mandatory dividends to stockholders and at a quantity that does not exceed the limit of 0.5% of the total shares held by the stockholders at the base date of the year-end balance sheet. ITAÚ UNIBANCO HOLDING’s Personnel Committee is responsible for defining the quantity, the beneficiaries, the type of option, the life of the option under each series, which may vary between a minimum of 5 years and a maximum of 10 years, and the vesting and lookup periods for exercising the options. The executive officers and member of the Board of Directors of ITAÚ UNIBANCO HOLDING and of its subsidiaries as well as employees may participate in this program, based on assessment of potential and performance.
ITAÚ UNIBANCO HOLDING settles the benefits under this plan by delivering its own shares, which are held in treasury until the effective exercise of the options by the beneficiaries.
| b) | Characteristics of the Programs |
I – Simple Options
Prior Programs
Before the merger, both Itaú and Unibanco each had Stock Option Plans (Prior Programs). The eligible beneficiaries of the program were granted simple options, depending upon individual performance. The exercise price is calculated based on the average prices of preferred shares at the BM&FBOVESPA trading sessions over the period of at least one and at the most three months prior to the option issue date; the price is, subject to a positive or negative adjustment of up to 20%, and restated until the last business day of the month prior to the option exercise date based either on the IGP-M or IPCA, in its absence, based on the index determined by the Committee. Options are no longer granted under this model.
Post-merger Program
The eligible beneficiaries of the program are granted simple options, depending upon the individual employee performance. The exercise price is calculated based on the average prices of preferred shares at the BM&FBOVESPA in the last three months of the year prior to the grating date or alternatively, subject to the positive or negative adjustments of up to 20% in the period of at least one. The exercise price is adjusted based on the IGPM or, in its absence, based on the index determined by the committee.
The vesting period is from one to seven years, as from the issue date.
II – Partner options
Executives selected to participate in the program may invest a percentage of their bonus to acquire shares or they have the right to receive shares (“Share-Based Instrument”). Title to the shares acquired, as well as the share-based instruments, should be held by the executives for a period from three to five years and they are subject to market fluctuation. At the times they acquire own shares and/or share-based instruments, partner options are granted in accordance with the classification of executives. Vesting periods of partner options or share-based instruments are from 1 to 7 years. Share-based instruments and partner options are converted into shares of ITAÚ UNIBANCO HOLDING in the ratio of one preferred share for each instrument after the respective vesting period, with no payment of exercise price in cash.
The acquisition price of own shares and Share-Based Instruments is established every six months and is equivalent to the average preferred share quotation at the BM&FBOVESPA trading sessions in the 30 days prior to the determination of said price.
Title to the shares received after the vesting period of the Partner Options should be held, without any liens or encumbrances, for periods from five to eight years, as from the acquisition date of the shares.
The weighted average of the fair value of share-based instruments on the grant date was estimated for shares purchased in the fiscal year ended December 31, 2011 – R$ 37.00 per share (R$ 39.90 per share at December 31, 2010).
The fair value of Share-Based Instrument is the market price at the grant date for the preferred shares of ITAÚ UNIBANCO HOLDING, less the cash price paid by the beneficiaries. The amount received for the purchase of Share-Based Instruments was R$ 48 in 2011 (R$ 62 in 2010).
Summary of changes in the plan
| | | | | | | | | Restated | | Exercised options | | Number of shares | |
| Granting | | Vesting period | | Exercise | | exercise | | Exercise price | | Market value | | Prior balance | | | | | | Forfeited (*) / | | To be exercised | |
| No. | | Date | | until | | deadline | | price (R$1) | | weighted average | | weighted average | | 12/31/2010 | | Granted | | Exercised | | Cancelled | | at 12/31/2011 | |
| | | | | | | | | | | | | | | | | | | | | | | | |
| Simple Options | | | | | | | | | | | | | | | | | | | | | | | | | | | | | | | | | |
| 10th | | 02/16/2004 | | 12/31/2008 | | | 12/31/2011 | | | | 13.46 | | | | 13.23 | | | | 35.17 | | | | 712,942 | | | | - | | | | 712,942 | | | | - | | | - | |
| 27th | | 02/01/2005 | | 05/05/2009 | | | 01/31/2011 | | | | 16.52 | | | | 16.42 | | | | 39.50 | | | | 12,650 | | | | - | | | | 12,650 | | | | - | | | - | |
| 11th | | 02/21/2005 | | 12/31/2009 | | | 12/31/2012 | | | | 18.94 | | | | 18.39 | | | | 34.88 | | | | 2,877,600 | | | | - | | | | 1,912,825 | | | | 27,500 | | | 937,275 | |
| 11th | | 08/01/2005 | | 12/31/2009 | | | 12/31/2012 | | | | 18.94 | | | | 18.39 | | | | 34.88 | | | | 27,500 | | | | - | | | | 27,500 | | | | - | | | - | |
| 11th | | 08/06/2007 | | 12/31/2009 | | | 12/31/2012 | | | | 18.94 | | | | - | | | | - | | | | 11,357 | | | | - | | | | - | | | | - | | | 11,357 | |
| 27th | | 02/01/2005 | | 02/01/2010 | | | 01/31/2011 | | | | 16.52 | | | | 16.42 | | | | 39.50 | | | | 16,389 | | | | - | | | | 16,389 | | | | - | | | - | |
| 34th | | 03/21/2007 | | 03/21/2010 | | | 03/20/2011 | | | | 35.34 | | | | - | | | | - | | | | 75,901 | | | | - | | | | - | | | | 75,901 | | | - | |
| 35th | | 03/22/2007 | | 03/22/2010 | | | 03/21/2011 | | | | 35.31 | | | | - | | | | - | | | | 29,518 | | | | - | | | | - | | | | 29,518 | | | - | |
| 30th | | 07/04/2006 | | 07/04/2010 | | | 07/03/2011 | | | | 28.49 | | | | 28.45 | | | | 36.48 | | | | 52,710 | | | | - | | | | 52,710 | | | | - | | | - | |
| 29th | | 09/19/2005 | | 09/19/2010 | | | 09/18/2011 | | | | 21.77 | | | | 21.30 | | | | 38.45 | | | | 12,650 | | | | - | | | | 12,650 | | | | - | | | - | |
| 12th | | 02/21/2006 | | 12/31/2010 | | | 12/31/2013 | | | | 28.18 | | | | 27.30 | | | | 36.42 | | | | 8,025,250 | | | | - | | | | 1,110,385 | | | | 60,500 | | | 6,854,365 | |
| 12th | | 08/06/2007 | | 12/31/2010 | | | 12/31/2013 | | | | 28.18 | | | | - | | | | - | | | | 15,867 | | | | - | | | | - | | | | - | | | 15,867 | |
| 16th | | 08/10/2009 | | 12/31/2010 | | | 12/31/2014 | | | | 32.05 | | | | - | | | | - | | | | 874,167 | | | | - | | | | - | | | | - | | | 874,167 | |
| 34th | | 03/21/2007 | | 03/21/2011 | | | 03/20/2012 | | | | 36.85 | | | | - | | | | - | | | | 75,901 | | | | - | | | | - | | | | - | | | 75,901 | |
| 35th | | 03/22/2007 | | 03/22/2011 | | | 03/21/2012 | | | | 36.80 | | | | - | | | | - | | | | 29,518 | | | | - | | | | - | | | | - | | | 29,518 | |
| 36th | | 05/14/2008 | | 05/14/2011 | | | 05/13/2012 | | | | 45.79 | | | | - | | | | - | | | | 25,301 | | | | - | | | | - | | | | - | | | 25,301 | |
| 30th | | 07/04/2006 | | 07/04/2011 | | | 07/03/2012 | | | | 29.21 | | | | - | | | | - | | | | 52,707 | | | | - | | | | - | | | | - | | | 52,707 | |
| 33rd | | 08/30/2006 | | 08/30/2011 | | | 08/29/2012 | | | | 32.34 | | | | - | | | | - | | | | 21,083 | | | | - | | | | - | | | | - | | | 21,083 | |
| 13th | | 02/14/2007 | | 12/31/2011 | | | 12/31/2014 | | | | 35.89 | | | | 34.82 | | | | 36.93 | | | | 8,546,975 | | | | - | | | | 507,375 | | | | 306,625 | | | 7,732,975 | |
| 13th | | 08/06/2007 | | 12/31/2011 | | | 12/31/2014 | | | | 35.89 | | | | - | | | | - | | | | 30,649 | | | | - | | | | - | | | | - | | | 30,649 | |
| 13th | | 10/28/2009 | | 12/31/2011 | | | 12/31/2014 | | | | 35.89 | | | | - | | | | - | | | | 45,954 | | | | - | | | | - | | | | - | | | 45,954 | |
| Total options to be exercised | | | | | | | | 21.84 | | | | 35.62 | | | | 21,572,589 | | | | - | | | | 4,365,426 | | | | 500,044 | | | 16,707,119 | |
| 34th | | 03/21/2007 | | 03/21/2012 | | | 03/20/2013 | | | | 36.85 | | | | - | | | | - | | | | 75,901 | | | | - | | | | - | | | | - | | | 75,901 | |
| 35th | | 03/22/2007 | | 03/22/2012 | | | 03/21/2013 | | | | 36.80 | | | | - | | | | - | | | | 29,514 | | | | - | | | | - | | | | - | | | 29,514 | |
| 36th | | 05/14/2008 | | 05/14/2012 | | | 05/13/2013 | | | | 45.79 | | | | - | | | | - | | | | 25,300 | | | | - | | | | - | | | | - | | | 25,300 | |
| 17th | | 09/23/2009 | | 09/23/2012 | | | 12/31/2014 | | | | 37.02 | | | | - | | | | - | | | | 29,551 | | | | - | | | | - | | | | - | | | 29,551 | |
| 14th | | 02/11/2008 | | 12/31/2012 | | | 12/31/2015 | | | | 41.37 | | | | - | | | | - | | | | 10,846,487 | | | | - | | | | - | | | | 1,580,421 | | | 9,266,066 | |
| 14th | | 05/05/2008 | | 12/31/2012 | | | 12/31/2015 | | | | 41.37 | | | | - | | | | - | | | | 20,625 | | | | - | | | | - | | | | - | | | 20,625 | |
| 14th | | 10/28/2009 | | 12/31/2012 | | | 12/31/2015 | | | | 41.37 | | | | - | | | | - | | | | 45,954 | | | | - | | | | - | | | | - | | | 45,954 | |
| 36th | | 05/14/2008 | | 05/14/2013 | | | 05/13/2014 | | | | 45.79 | | | | - | | | | - | | | | 25,300 | | | | - | | | | - | | | | - | | | 25,300 | |
| 15th | | 03/03/2009 | | 12/31/2013 | | | 12/31/2016 | | | | 27.06 | | | | 26.97 | | | | 33.88 | | | | 15,067,330 | | | | - | | | | 804,770 | | | | 147,620 | | | 14,114,940 | |
| 15th | | 10/28/2009 | | 12/31/2013 | | | 12/31/2016 | | | | 27.06 | | | | - | | | | - | | | | 45,954 | | | | - | | | | - | | | | - | | | 45,954 | |
| 18th | | 04/17/2010 | | 12/31/2014 | | | 12/31/2017 | | | | 43.95 | | | | - | | | | - | | | | 6,126,609 | | | | - | | | | - | | | | 74,386 | | | 6,052,223 | |
| 18th | | 05/11/2010 | | 12/31/2014 | | | 12/31/2017 | | | | 43.95 | | | | - | | | | - | | | | 1,206,340 | | | | - | | | | - | | | | 42,421 | | | 1,163,919 | |
| 37th | | 04/19/2011 | | 12/31/2015 | | | 12/31/2018 | | | | 42.93 | | | | - | | | | - | | | | - | | | | 9,863,110 | | | | - | | | | 93,678 | | | 9,769,432 | |
| Total options outstanding | | | | | | | | 26.97 | | | | 33.88 | | | | 33,544,865 | | | | 9,863,110 | | | | 804,770 | | | | 1,938,526 | | | 40,664,679 | |
| Total simple options | | | | | | | | 22.64 | | | | 35.35 | | | | 55,117,454 | | | | 9,863,110 | | | | 5,170,196 | | | | 2,438,570 | | | 57,371,798 | |
| | | | | | | | | | | | | | | | | | | | | | | | | | | | | | | | | | | | | | | | |
| Partner options | | | | | | | | | | | | | | | | | | | | | | | | | | | | | | | | | | | |
| 4th | | 03/03/2008 | | 03/03/2011 | | | - | | | | - | | | | - | | | | 37.22 | | | | 416,487 | | | | - | | | | 376,581 | | | | - | | | 39,906 | |
| 5th | | 09/03/2008 | | 09/03/2011 | | | - | | | | - | | | | - | | | | 28.83 | | | | 490,624 | | | | - | | | | 431,185 | | | | 12,729 | | | 46,710 | |
| Total options to be exercised | | | | | | | | - | | | | 37.22 | | | | 907,111 | | | | - | | | | 807,766 | | | | 12,729 | | | 86,616 | |
| 6th | | 03/06/2009 | | 03/06/2012 | | | - | | | | - | | | | - | | | | - | | | | 740,362 | | | | - | | | | - | | | | 21,339 | | | 719,023 | |
| 7th | | 06/19/2009 | | 03/06/2012 | | | - | | | | - | | | | - | | | | - | | | | 79,446 | | | | - | | | | - | | | | - | | | 79,446 | |
| 1st | | 09/03/2007 | | 09/03/2012 | | | - | | | | - | | | | - | | | | - | | | | 329,181 | | | | - | | | | - | | | | 19,673 | | | 309,508 | |
| 3rd | | 02/29/2008 | | 09/03/2012 | | | - | | | | - | | | | - | | | | - | | | | 33,474 | | | | - | | | | - | | | | - | | | 33,474 | |
| 4th | | 03/03/2008 | | 03/03/2013 | | | - | | | | - | | | | - | | | | - | | | | 415,930 | | | | - | | | | - | | | | 27,498 | | | 388,432 | |
| 8th | | 08/17/2010 | | 08/16/2013 | | | - | | | | - | | | | - | | | | - | | | | 376,916 | | | | - | | | | - | | | | 37,284 | | | 339,632 | |
| 9th | | 08/30/2010 | | 08/16/2013 | | | - | | | | - | | | | - | | | | - | | | | 359,991 | | | | - | | | | - | | | | 30,280 | | | 329,711 | |
| 11th | | 09/30/2010 | | 08/16/2013 | | | - | | | | - | | | | - | | | | - | | | | 17,717 | | | | - | | | | - | | | | - | | | 17,717 | |
| 5th | | 09/03/2008 | | 09/03/2013 | | | - | | | | - | | | | - | | | | - | | | | 490,126 | | | | - | | | | - | | | | 40,684 | | | 449,442 | |
| 10th | | 09/30/2010 | | 09/29/2013 | | | - | | | | - | | | | - | | | | - | | | | 1,940,987 | | | | - | | | | - | | | | 78,578 | | | 1,862,409 | |
| 12th | | 02/28/2011 | | 02/28/2014 | | | - | | | | - | | | | - | | | | - | | | | - | | | | 1,585,541 | | | | - | | | | 26,957 | | | 1,558,584 | |
| 6th | | 03/06/2009 | | 03/06/2014 | | | - | | | | - | | | | - | | | | - | | | | 739,608 | | | | - | | | | - | | | | 35,004 | | | 704,604 | |
| 7th | | 06/19/2009 | | 03/06/2014 | | | - | | | | - | | | | - | | | | - | | | | 79,445 | | | | - | | | | - | | | | - | | | 79,445 | |
| 14th | | 04/11/2011 | | 08/18/2014 | | | | | | | | | | | | | | | | | | | - | | | | 509 | | | | - | | | | - | | | 509 | |
| 13th | | 08/19/2011 | | 08/19/2014 | | | | | | | - | | | | - | | | | - | | | | - | | | | 706,397 | | | | - | | | | - | | | 706,397 | |
| 8th | | 08/17/2010 | | 08/16/2015 | | | - | | | | - | | | | - | | | | - | | | | 376,876 | | | | - | | | | - | | | | 37,953 | | | 338,923 | |
| 9th | | 08/30/2010 | | 08/16/2015 | | | - | | | | - | | | | - | | | | - | | | | 359,962 | | | | - | | | | - | | | | 30,810 | | | 329,152 | |
| 11th | | 09/30/2010 | | 08/16/2015 | | | - | | | | - | | | | - | | | | - | | | | 17,712 | | | | - | | | | - | | | | - | | | 17,712 | |
| 10th | | 09/30/2010 | | 09/29/2015 | | | - | | | | - | | | | - | | | | - | | | | 1,940,951 | | | | - | | | | - | | | | 82,433 | | | 1,858,518 | |
| 12th | | 02/28/2011 | | 02/28/2016 | | | - | | | | - | | | | - | | | | - | | | | - | | | | 1,585,497 | | | | - | | | | 28,282 | | | 1,557,215 | |
| 13th | | 08/19/2011 | | 08/19/2016 | | | | | | | - | | | | - | | | | - | | | | - | | | | 706,338 | | | | - | | | | - | | | 706,338 | |
| 14th | | 04/11/2011 | | 08/18/2016 | | | | | | | - | | | | - | | | | - | | | | - | | | | 508 | | | | - | | | | - | | | 508 | |
| Total options outstanding | | | | | | | | | | | - | | | | - | | | | 8,298,684 | | | | 4,584,790 | | | | - | | | | 496,775 | | | 12,386,699 | |
| Total partner options | | | | | | | | | | | - | | | | 37.22 | | | | 9,205,795 | | | | 4,584,790 | | | | 807,766 | | | | 509,504 | | | 12,473,315 | |
| | | | | | | | | | | | | | | | | | | | | | | | | | | | | | | | | | | | | | | | |
| TOTAL SIMPLE/PARTNER OPTIONS | | | | | | | | 22.84 | | | | 32.92 | | | | 64,323,249 | | | | 14,447,900 | | | | 5,977,962 | | | | 2,948,074 | | | 69,845,113 | |
(*) Refers to non-exercise due to the beneficiary’s option.
Summary of changes in the plan
| | | | | | | | | Restated | | Exercised options | | Number of shares | |
| Granting | | Vesting period | | Exercise | | exercise | | Exercise price | | Market value | | Prior balance | | | | | | Forfeited / | | To be exercised | |
| No. | | Date | | until | | deadline | | price (R$1) | | weighted average | | weighted average | | 01/01/2010 | | Granted | | Exercised | | Cancelled | | at 12/31/2010 | |
| | | | | | | | | | | | | | | | | | | | | | | | |
| Simple Options | | | | | | | | | | | | | | | | | | | |
| 9th | | 03/10/2003 | | 12/31/2007 | | 12/31/2010 | | - | | 7.85 | | 38.55 | | 570,500 | | - | | 570,500 | | - | | - | |
| 9th | | 05/02/2005 | | 12/31/2007 | | 12/31/2010 | | - | | 7.85 | | 38.55 | | 6,187 | | - | | 6,187 | | - | | - | |
| 16th | | 09/02/2003 | | 09/02/2008 | | 02/25/2010 | | - | | 7.77 | | 36.03 | | 38,263 | | - | | 38,263 | | - | | - | |
| 10th | | 02/16/2004 | | 12/31/2008 | | 12/31/2011 | | 12.70 | | 12.15 | | 39.34 | | 1,886,792 | | - | | 1,173,850 | | - | | 712,942 | |
| 24th | | 07/19/2004 | | 01/13/2009 | | 05/05/2010 | | - | | 12.58 | | 39.59 | | 29,516 | | - | | 29,516 | | - | | - | |
| 25th | | 08/04/2004 | | 01/13/2009 | | 05/05/2010 | | - | | 6.76 | | 39.65 | | 329,506 | | - | | 329,506 | | - | | - | |
| 27th | | 02/01/2005 | | 02/01/2009 | | 05/05/2010 | | - | | 15.76 | | 36.97 | | 206,342 | | - | | 206,342 | | - | | - | |
| 27th | | 02/01/2005 | | 05/05/2009 | | 01/31/2011 | | 16.38 | | - | | - | | 12,650 | | - | | - | | - | | 12,650 | |
| 30th | | 07/04/2006 | | 07/04/2009 | | 07/03/2010 | | - | | 26.73 | | 32.50 | | 52,710 | | - | | 52,710 | | - | | - | |
| 33re | | 08/30/2006 | | 08/30/2009 | | 08/29/2010 | | - | | 29.62 | | 38.45 | | 21,084 | | - | | 21,084 | | - | | - | |
| 29th | | 09/19/2005 | | 09/19/2009 | | 09/18/2010 | | - | | 20.14 | | 38.33 | | 12,650 | | - | | 12,650 | | - | | - | |
| 11th | | 02/21/2005 | | 12/31/2009 | | 12/31/2012 | | 17.88 | | 16.69 | | 39.49 | | 7,082,200 | | - | | 4,204,600 | | - | | 2,877,600 | |
| 11th | | 08/01/2005 | | 12/31/2009 | | 12/31/2012 | | 17.88 | | - | | - | | 27,500 | | - | | - | | - | | 27,500 | |
| 11th | | 08/06/2007 | | 12/31/2009 | | 12/31/2012 | | 17.88 | | - | | - | | 11,357 | | - | | - | | - | | 11,357 | |
| 27th | | 02/01/2005 | | 02/01/2010 | | 01/31/2011 | | 16.38 | | 15.76 | | 36.97 | | 1,068,901 | | - | | 999,802 | | 52,710 | | 16,389 | |
| 34th | | 03/21/2007 | | 03/21/2010 | | 03/20/2011 | | 34.60 | | - | | - | | 75,901 | | - | | - | | - | | 75,901 | |
| 35th | | 03/22/2007 | | 03/22/2010 | | 03/21/2011 | | 34.56 | | - | | - | | 29,518 | | - | | - | | - | | 29,518 | |
| 30th | | 07/04/2006 | | 07/04/2010 | | 07/03/2011 | | 27.42 | | - | | - | | 52,710 | | - | | - | | - | | 52,710 | |
| 33 rd | | 08/30/2006 | | 08/30/2010 | | 08/29/2011 | | - | | 29.62 | | 38.45 | | 21,084 | | - | | 21,084 | | - | | - | |
| 29th | | 09/19/2005 | | 09/19/2010 | | 09/18/2011 | | 20.78 | | 20.14 | | 38.33 | | 25,300 | | - | | 12,650 | | - | | 12,650 | |
| 12th | | 02/21/2006 | | 12/31/2010 | | 12/31/2013 | | 26.60 | | 25.68 | | 39.83 | | 9,579,384 | | - | | 1,554,134 | | - | | 8,025,250 | |
| 12th | | 08/06/2007 | | 12/31/2010 | | 12/31/2013 | | 26.60 | | - | | - | | 15,867 | | - | | - | | - | | 15,867 | |
| 16th | | 08/10/2009 | | 12/31/2010 | | 12/31/2014 | | 30.25 | | - | | - | | 874,167 | | - | | - | | - | | 874,167 | |
| Total options to be exercised | | | | | | 16.67 | | 39.08 | | 22,030,089 | | - | | 9,232,878 | | 52,710 | | 12,744,501 | |
| 34th | | 03/21/2007 | | 03/21/2011 | | 03/20/2012 | | 34.60 | | - | | - | | 75,901 | | - | | - | | - | | 75,901 | |
| 35th | | 03/22/2007 | | 03/22/2011 | | 03/21/2012 | | 34.56 | | - | | - | | 29,518 | | - | | - | | - | | 29,518 | |
| 36th | | 05/14/2008 | | 05/14/2011 | | 05/13/2012 | | 42.99 | | - | | - | | 25,301 | | - | | - | | - | | 25,301 | |
| 30th | | 07/04/2006 | | 07/04/2011 | | 07/03/2012 | | 27.42 | | - | | - | | 52,707 | | - | | - | | - | | 52,707 | |
| 33 rd | | 08/30/2006 | | 08/30/2011 | | 08/29/2012 | | 30.37 | | - | | - | | 21,083 | | - | | - | | - | | 21,083 | |
| 13th | | 02/14/2007 | | 12/31/2011 | | 12/31/2014 | | 33.87 | | 31.99 | | 38.98 | | 10,220,925 | | - | | 1,660,200 | | 13,750 | | 8,546,975 | |
| 13th | | 08/06/2007 | | 12/31/2011 | | 12/31/2014 | | 33.87 | | - | | - | | 30,649 | | - | | - | | - | | 30,649 | |
| 13th | | 10/28/2009 | | 12/31/2011 | | 12/31/2014 | | 33.87 | | - | | - | | 45,954 | | - | | - | | - | | 45,954 | |
| 34th | | 03/21/2007 | | 03/21/2012 | | 03/20/2013 | | 34.60 | | - | | - | | 75,901 | | - | | - | | - | | 75,901 | |
| 35th | | 03/22/2007 | | 03/22/2012 | | 03/21/2013 | | 34.56 | | - | | - | | 29,514 | | - | | - | | - | | 29,514 | |
| 36th | | 05/14/2008 | | 05/14/2012 | | 05/13/2013 | | 42.99 | | - | | - | | 25,300 | | - | | - | | - | | 25,300 | |
| 17th | | 09/23/2009 | | 09/23/2012 | | 12/31/2014 | | 34.94 | | - | | - | | 29,551 | | - | | - | | - | | 29,551 | |
| 14th | | 02/11/2008 | | 12/31/2012 | | 12/31/2015 | | 39.05 | | 38.12 | | 41.31 | | 11,485,485 | | - | | 612,599 | | 26,399 | | 10,846,487 | |
| 14th | | 05/05/2008 | | 12/31/2012 | | 12/31/2015 | | 39.05 | | - | | - | | 20,625 | | - | | - | | - | | 20,625 | |
| 14th | | 10/28/2009 | | 12/31/2012 | | 12/31/2015 | | 39.05 | | - | | - | | 45,954 | | - | | - | | - | | 45,954 | |
| 36th | | 05/14/2008 | | 05/14/2013 | | 05/13/2014 | | 42.99 | | - | | - | | 25,300 | | - | | - | | - | | 25,300 | |
| 15th | | 03/03/2009 | | 12/31/2013 | | 12/31/2016 | | 25.54 | | 24.80 | | 40.27 | | 16,829,780 | | - | | 1,533,100 | | 229,350 | | 15,067,330 | |
| 15th | | 10/28/2009 | | 12/31/2013 | | 12/31/2016 | | 25.54 | | - | | - | | 45,954 | | - | | - | | - | | 45,954 | |
| 18th | | 04/17/2010 | | 12/31/2014 | | 12/31/2017 | | 41.48 | | - | | - | | - | | 6,258,877 | | - | | 132,268 | | 6,126,609 | |
| 18th | | 05/11/2010 | | 12/31/2014 | | 12/31/2017 | | 41.48 | | - | | - | | - | | 1,290,289 | | - | | 83,949 | | 1,206,340 | |
| Total options in the vesting period | | | | | | 30.08 | | 39.87 | | 39,115,402 | | 7,549,166 | | 3,805,899 | | 485,716 | | 42,372,953 | |
| Total simple options | | | | | | | | | | 61,145,491 | | 7,549,166 | | 13,038,777 | | 538,426 | | 55,117,454 | |
| Weighted Average Price – Simple Options | | | | | | 20.59 | | 39.31 | | 25.46 | | 41.48 | | | | 31.92 | | 31.38 | |
| | | | | | | | | | | | | | | | | | | | | | | | |
| Bonus options | | | | | | | | | | | | | | | | | | | | | |
| 1st | | 09/03/2007 | | 09/03/2010 | | - | | - | | - | | 37.85 | | 342,502 | | - | | 340,340 | | 2,162 | | - | |
| 3rd | | 02/29/2008 | | 09/03/2010 | | - | | - | | - | | - | | 33,474 | | - | | - | | 33,474 | | - | |
| Total options to be exercised | | | | | | | | 37.85 | | 375,976 | | - | | 340,340 | | 35,636 | | - | |
| 4th | | 03/03/2008 | | 03/03/2011 | | - | | - | | - | | - | | 423,212 | | - | | - | | 6,725 | | 416,487 | |
| 5th | | 09/03/2008 | | 09/03/2011 | | - | | - | | - | | - | | 502,189 | | - | | - | | 11,565 | | 490,624 | |
| 6th | | 03/06/2009 | | 03/06/2012 | | - | | - | | - | | - | | 769,830 | | - | | - | | 29,468 | | 740,362 | |
| 7th | | 06/19/2009 | | 03/06/2012 | | - | | - | | - | | - | | 79,446 | | - | | - | | - | | 79,446 | |
| 1st | | 09/03/2007 | | 09/03/2012 | | - | | - | | - | | - | | 342,479 | | - | | - | | 13,298 | | 329,181 | |
| 3rd | | 02/29/2008 | | 09/03/2012 | | - | | - | | - | | - | | 33,474 | | - | | - | | - | | 33,474 | |
| 4th | | 03/03/2008 | | 03/03/2013 | | - | | - | | - | | - | | 423,190 | | - | | - | | 7,260 | | 415,930 | |
| 8th | | 08/17/2010 | | 08/16/2013 | | - | | - | | - | | - | | - | | 384,961 | | - | | 8,045 | | 376,916 | |
| 9th | | 08/30/2010 | | 08/16/2013 | | - | | - | | - | | - | | - | | 359,991 | | - | | - | | 359,991 | |
| 11th | | 09/30/2010 | | 08/16/2013 | | - | | - | | - | | - | | - | | 17,717 | | - | | - | | 17,717 | |
| 5th | | 09/03/2008 | | 09/03/2013 | | - | | - | | - | | - | | 502,164 | | - | | - | | 12,038 | | 490,126 | |
| 10th | | 09/30/2010 | | 09/29/2013 | | - | | - | | - | | - | | - | | 1,940,987 | | - | | - | | 1,940,987 | |
| 6th | | 03/06/2009 | | 03/06/2014 | | - | | - | | - | | - | | 769,807 | | - | | - | | 30,199 | | 739,608 | |
| 7th | | 06/19/2009 | | 03/06/2014 | | - | | - | | - | | - | | 79,445 | | - | | - | | - | | 79,445 | |
| 8th | | 08/17/2010 | | 08/16/2015 | | - | | - | | - | | - | | - | | 384,920 | | - | | 8,044 | | 376,876 | |
| 9th | | 08/30/2010 | | 08/16/2015 | | - | | - | | - | | - | | - | | 359,962 | | - | | - | | 359,962 | |
| 11th | | 09/30/2010 | | 08/16/2015 | | - | | - | | - | | - | | - | | 17,712 | | - | | - | | 17,712 | |
| 10th | | 09/30/2010 | | 09/29/2015 | | - | | - | | - | | - | | - | | 1,940,951 | | - | | - | | 1,940,951 | |
| Total options outstanding | | | | | | - | | - | | 3,925,236 | | 5,407,201 | | - | | 126,642 | | 9,205,795 | |
| Total bonus options | | | | | | - | | 37.85 | | 4,301,212 | | 5,407,201 | | 340,340 | | 162,278 | | 9,205,795 | |
| | | | | | | | | | | | | | | | | | | | |
| TOTAL SIMPLE/BONUS OPTIONS | | | | | | 20.59 | | 39.28 | | 65,446,703 | | 12,956,367 | | 13,379,117 | | 700,704 | | 64,323,249 | |
(*) Refers to non-exercise due to the beneficiary’s option.
Summary of Changes in Share-Based Instruments (SBI)
| Number | | Vesting period | | Prior
balance
12/31/2010 | | New SBI’s | | Converted
into shares | | Cancelled | | Balance at 12/31/2011 | |
| 1st | | 08/17/2010 | | 08/16/2011 | | | 114,980 | | | - | | | 110,598 | | | 4,382 | | - | |
| 1st | | 08/17/2010 | | 08/16/2012 | | | 114,969 | | | - | | | - | | | 4,381 | | 110,588 | |
| 1st | | 08/17/2010 | | 08/16/2013 | | | 114,958 | | | - | | | - | | | 4,381 | | 110,577 | |
| 1st | | 08/30/2010 | | 08/16/2011 | | | 10,221 | | | - | | | 10,221 | | | - | | - | |
| 1st | | 08/30/2010 | | 08/16/2012 | | | 10,216 | | | - | | | - | | | - | | 10,216 | |
| 1st | | 08/30/2010 | | 08/16/2013 | | | 10,212 | | | - | | | - | | | - | | 10,212 | |
| 1st | | 09/30/2010 | | 08/16/2011 | | | 3,972 | | | - | | | 3,972 | | | - | | - | |
| 1st | | 09/30/2010 | | 08/16/2012 | | | 3,971 | | | - | | | - | | | - | | 3,971 | |
| 1st | | 09/30/2010 | | 08/16/2013 | | | 3,970 | | | - | | | - | | | - | | 3,970 | |
| 2nd | | 09/30/2010 | | 09/29/2011 | | | 424,172 | | | - | | | 424,172 | | | - | | - | |
| 2nd | | 09/30/2010 | | 09/29/2012 | | | 424,163 | | | - | | | - | | | - | | 424,163 | |
| 2nd | | 09/30/2010 | | 09/29/2013 | | | 424,154 | | | - | | | - | | | - | | 424,154 | |
| 3rd | | 02/28/2011 | | 02/27/2011 | | | - | | | 444,040 | | | - | | | - | | 444,040 | |
| 3rd | | 02/28/2011 | | 02/27/2012 | | | - | | | 444,030 | | | - | | | - | | 444,030 | |
| 3rd | | 02/28/2011 | | 02/27/2013 | | | - | | | 444,020 | | | - | | | - | | 444,020 | |
| Total | | | | | | | 1,659,958 | | | 1,332,090 | | | 548,963 | | | 13,144 | | 2,429,941 | |
| Number | | Vesting period | | | | New SBI’s | | Converted
into shares | | Cancelled | | Balance at 12/31/2010 | |
| 1st | | 08/17/2010 | | 08/16/2011 | | | | | | | 123,231 | | | - | | 8,251 | | 114,980 | |
| 1st | | 08/17/2010 | | 08/16/2012 | | | | | | | 123,220 | | | - | | 8,251 | | 114,969 | |
| 1st | | 08/17/2010 | | 08/16/2013 | | | | | | | 123,209 | | | - | | 8,251 | | 114,958 | |
| 1st | | 08/30/2010 | | 08/16/2011 | | | | | | | 10,221 | | | - | | - | | 10,221 | |
| 1st | | 08/30/2010 | | 08/16/2012 | | | | | | | 10,216 | | | - | | - | | 10,216 | |
| 1st | | 08/30/2010 | | 08/16/2013 | | | | | | | 10,212 | | | - | | - | | 10,212 | |
| 1st | | 09/30/2010 | | 08/16/2011 | | | | | | | 3,972 | | | - | | - | | 3,972 | |
| 1st | | 09/30/2010 | | 08/16/2012 | | | | | | | 3,971 | | | - | | - | | 3,971 | |
| 1st | | 09/30/2010 | | 08/16/2013 | | | | | | | 3,970 | | | - | | - | | 3,970 | |
| 2nd | | 09/30/2010 | | 09/29/2011 | | | | | | | 424,172 | | | - | | - | | 424,172 | |
| 2nd | | 09/30/2010 | | 09/29/2012 | | | | | | | 424,163 | | | - | | - | | 424,163 | |
| 2nd | | 09/30/2010 | | 09/29/2013 | | | | | | | 424,154 | | | - | | - | | 424,154 | |
| Total | | | | | | | | | | | 1,684,711 | | | - | | 24,753 | | 1,659,958 | |
| c) | Fair value and economic assumptions for cost recognition |
ITAÚ UNIBANCO HOLDING recognizes, at the grant date, the fair value of options through the Binomial method for simple options and the Black & Scholes method for bonus options. Economic assumptions used are as follows:
Exercise price: for the option exercise price, the exercise price previously agreed-upon at the time the option was issued is adopted, adjusted by the IGP-M variation.
Price of the underlying asset: the share price of ITAÚ UNIBANCO HOLDING (ITUB4) used for calculation is the closing price at BM&FBOVESPA on the calculation base date.
Expected dividends the average annual return rate for the last three years, of the dividends, plus interest on capital of the ITUB4 share.
Risk-free interest rate: the risk-free rate uses is the IGP-M coupon rate at the expiration date of the option plan.
Expected volatility: calculated based on the standard deviation from the history of the last 84 monthly returns of closing prices of the ITUB4 share, released by BM&FBOVESPA, adjusted by the IGP-M variation.
| Granting | | Vesting | | Exercise | | Price of the
underlying | | | | Expected | | | Risk-free | | | Expected | |
| No. | | Date | | period | | period until | | asset | | Fair value | | dividends | | | interest rate | | | volatility | |
| | | | | | | | | | | | | | | | | | | | |
| Simple Options | | | | | | | | | | | | | | | | | | | | | | | | |
| 37th | | 04/19/2011 | | 12/31/2015 | | | 12/31/2018 | | | | 37.26 | | | 11.02 | | | | 2.97 | % | | | 5.80 | % | | 30.53 | % |
| | | | | | | | | | | | | | | | | | | | | | | | | | | |
| Bonus Options (*) | | | | | | | | | | | | | | | | | | | | | | | | |
| 12th | | 02/28/2011 | | 02/28/2014 | | | - | | | | 37.00 | | | 33.85 | | | | 2.97 | % | | | - | | | - | |
| 12th | | 02/28/2011 | | 02/28/2016 | | | - | | | | 37.00 | | | 31.83 | | | | 2.97 | % | | | - | | | - | |
| 13th | | 8/19/2011 | | 8/19/2014 | | | - | | | | 26.65 | | | 24.39 | | | | 2.97 | % | | | - | | | - | |
| 13th | | 8/19/2011 | | 8/19/2016 | | | - | | | | 26.65 | | | 22.98 | | | | 2.97 | % | | | - | | | - | |
| 14th | | 04/11/2011 | | 8/18/2014 | | | - | | | | 32.62 | | | 30.04 | | | | 2.97 | % | | | - | | | - | |
| 14th | | 04/11/2011 | | 8/18/2016 | | | - | | | | 32.62 | | | 28.30 | | | | 2.97 | % | | | - | | | - | |
(*) The fair value of bonus options is measured based on the fair value of ITAÚ UNIBANCO HOLDING share at the granting date.
| d) | Accounting effects arising from options |
The exercise of stock options, pursuant to the plan’s regulation, resulted in the sale of preferred shares held in treasury. The accounting entries related to the plan are recorded during the vesting period, at the portion of the fair value of options granted with effect on income, and during the exercise of options, at the amount received from the option exercise price, reflected in stockholders’ equity.
The effect on income was R$ 163 (R$ 131 for the year end December 31, 2010), with a correspondence to "Additional Paid-in Capital – Granted Options Recognized".
In the stockholders’ equity, the effect was as follows:
| | | 12/31/2011 | | | 12/31/2010 | |
| Amount received for the sale of shares – exercised options | | | 353 | | | | 406 | |
| (-) Cost of treasury shares sold | | | (268 | ) | | | (403 | ) |
| Effect of sale (*) | | | 85 | | | | 3 | |
(*) Recorded in "Additional Paid-in Capital".
NOTE 22 - INTEREST AND SIMILAR INCOME AND EXPENSE AND NET GAIN (LOSS) FROM FINANCIAL ASSETS AND LIABILITIES
| a) | Interest and similar income |
| | | 01/01 to 12/31/2011 | | | 01/01 to 12/31/2010 | |
| Central Bank compulsory deposits | | | 9,182 | | | | 4,025 | |
| Interbank deposits | | | 890 | | | | 824 | |
| Securities purchased under agreements to resell | | | 9,961 | | | | 9,940 | |
| Financial assets held for trading | | | 14,676 | | | | 8,028 | |
| Available-for-sale financial assets | | | 2,888 | | | | 2,997 | |
| Held-to-maturity financial assets | | | 360 | | | | 456 | |
| Loan and lease operations | | | 58,492 | | | | 50,693 | |
| Other financial assets | | | 903 | | | | 855 | |
| Total | | | 97,352 | | | | 77,818 | |
| b) | Interest and similar expense |
��
| | | 01/01 to 12/31/2011 | | | 01/01 to 12/31/2010 | |
| Securities sold under repurchase agreements | | | (22,133 | ) | | | (15,774 | ) |
| Deposits | | | (14,757 | ) | | | (12,245 | ) |
| Financial expense from reserves for insurance and private pension | | | (5,239 | ) | | | (4,038 | ) |
| Interbank market debt | | | (5,536 | ) | | | (2,100 | ) |
| Institutional market debt | | | (7,934 | ) | | | (2,683 | ) |
| Total | | | (55,599 | ) | | | (36,840 | ) |
| c) | Net gain (loss) from financial assets and liabilities |
| | | 01/01 to 12/31/2011 | | | 01/01 to 12/31/2010 | |
| Financial assets and liabilities held for trading, including the innefective portion of hedge accounting related derivatives | | | 787 | | | | 2,712 | |
| Financial assets designated at fair value through profit or loss | | | 20 | | | | (1 | ) |
| Available-for-sale financial assets | | | 444 | | | | 151 | |
| Total | | | 1,251 | | | | 2,862 | |
NOTE 23 - BANKING SERVICE FEES
| | | 01/01 to
12/31/2011 | | | 01/01 to
12/31/2010 | |
| Current account services | | | 5,445 | | | | 4,275 | |
| Asset management fees | | | 2,745 | | | | 2,570 | |
| Collection commissions | | | 1,047 | | | | 1,076 | |
| Fees from credit card services | | | 7,446 | | | | 6,408 | |
| Fees for guarantees issued and credit lines | | | 1,393 | | | | 1,422 | |
| Brokerage commission | | | 361 | | | | 471 | |
| Other | | | 973 | | | | 870 | |
| Total | | | 19,410 | | | | 17,092 | |
NOTE 24 - OTHER INCOME
| | | 01/01 to 12/31/2011 | | | 01/01 to 12/31/2010 | |
| Gains on sale of assets held for sale, fixed assets and investments in unconsolidated companies | | | 271 | | | | 280 | |
| Recovery of expenses | | | 184 | | | | 214 | |
| Reversal of provisions | | | 366 | | | | 338 | |
| Other | | | 337 | | | | 578 | |
| Total | | | 1,158 | | | | 1,410 | |
NOTE 25 – GENERAL AND ADMINISTRATIVE EXPENSES
| | | 01/01 to 12/31/2011 | | | 01/01 to 12/31/2010 | |
| Personnel expenses | | | (13,373 | ) | | | (13,006 | ) |
| Compensation | | | (5,910 | ) | | | (5,585 | ) |
| Charges | | | (2,036 | ) | | | (1,978 | ) |
| Welfare benefits | | | (1,479 | ) | | | (1,442 | ) |
| Retirement plans and post-employment benefits (Note 28) | | | 82 | | | | (129 | ) |
| Defined benefit | | | (192 | ) | | | (1,170 | ) |
| Defined contribution | | | 274 | | | | 1,041 | |
| Stock option plan | | | (163 | ) | | | (131 | ) |
| Training | | | (259 | ) | | | (233 | ) |
| Employee profit sharing | | | (2,316 | ) | | | (2,285 | ) |
| Dismissals | | | (398 | ) | | | (343 | ) |
| Provision for labor claims (Note 31) | | | (894 | ) | | | (880 | ) |
| Administrative expenses | | | (12,490 | ) | | | (12,351 | ) |
| Data processing and telecommunications | | | (3,450 | ) | | | (3,271 | ) |
| Third-party services | | | (3,014 | ) | | | (2,734 | ) |
| Installations | | | (1,135 | ) | | | (1,281 | ) |
| Advertising, promotions and publications | | | (981 | ) | | | (1,235 | ) |
| Rent | | | (916 | ) | | | (861 | ) |
| Transportation | | | (583 | ) | | | (596 | ) |
| Materials | | | (460 | ) | | | (456 | ) |
| Financial services | | | (438 | ) | | | (443 | ) |
| Security | | | (482 | ) | | | (451 | ) |
| Utilities | | | (295 | ) | | | (283 | ) |
| Travel | | | (189 | ) | | | (168 | ) |
| Other | | | (547 | ) | | | (572 | ) |
| Depreciation | | | (1,184 | ) | | | (1,166 | ) |
| Amortization | | | (984 | ) | | | (977 | ) |
| Insurance acquisition expenses | | | (1,268 | ) | | | (1,330 | ) |
| Other expenses | | | (6,375 | ) | | | (5,802 | ) |
| Expenses related to credit cards | | | (1,796 | ) | | | (1,697 | ) |
| Reimbursement related to acquisitions | | | (148 | ) | | | (116 | ) |
| Losses with third party frauds | | | (753 | ) | | | (558 | ) |
| Loss on Sale of Assets Held for Sale, fixed assets and investments in unconsolidated companies | | | (139 | ) | | | (226 | ) |
| Provision for civil lawsuits (Note 31) | | | (1,616 | ) | | | (1,327 | ) |
| Provision for tax and social security lawsuits | | | (1,038 | ) | | | (1,170 | ) |
| Refund of interbank costs | | | (195 | ) | | | (186 | ) |
| Impairment (Notes 14 and 15) | | | (45 | ) | | | (20 | ) |
| Other | | | (645 | ) | | | (502 | ) |
| Total | | | (35,674 | ) | | | (34,632 | ) |
NOTE 26 - INCOME TAX AND SOCIAL CONTRIBUTION
ITAÚ UNIBANCO HOLDING and each of its subsidiaries file separate corporate income tax returns for each fiscal year. Income tax in Brazil comprises federal income tax and social contribution on net income, which is a federal tax on income additional to federal income tax.
| a) | Composition of income tax and social contribution expense |
The amounts recorded as income tax and social contribution expense in the consolidated financial statements are reconciled to the statutory rates, as follows:
| Current income tax and social contribution | | 01/01 to
12/31/2011 | | | 01/01 to
12/31/2010 | |
| Income before income tax and social contribution | | | 18,251 | | | | 18,030 | |
| Charges (income tax and social contribution) at the rates in effect (Note 2.4n) | | | (7,300 | ) | | | (7,212 | ) |
| Increase/decrease to income tax and social contribution charges arising from: | | | 3,659 | | | | 1,676 | |
| Share of comprehensive income of unconsolidated companies, net | | | 45 | | | | 113 | |
| Foreign exchange variation on assets and liabilities abroad | | | 916 | | | | (255 | ) |
| Interest on capital | | | 1,662 | | | | 1,496 | |
| Dividends, interest on external debt bonds and tax incentives | | | 269 | | | | 289 | |
| Other (*) | | | 767 | | | | 33 | |
| Total income tax and social contribution | | | (3,641 | ) | | | (5,536 | ) |
(*) Includes the Program for Cash Settlement or Installment Payment of Federal Taxes – Law No. 11,941/09.
I - The deferred tax asset balance and respective changes are as follows:
| | | | | | Realization / | | | | | | | |
| | | 12/31/2010 | | | Reversal | | | Increase | | | 12/31/2011 | |
| Reflected in income | | | 25,788 | | | | (10,948 | ) | | | 13,626 | | | | 28,466 | |
| Related to income tax and social contribution loss carryforwards | | | 2,998 | | | | (1,330 | ) | | | 2,520 | | | | 4,188 | |
| Allowance for loan losses | | | 10,423 | | | | (4,318 | ) | | | 6,784 | | | | 12,889 | |
| Adjustment to market value of derivative financial instruments | | | 22 | | | | (39 | ) | | | 319 | | | | 302 | |
| Goodwill on purchase of investments | | | 5,905 | | | | (2,896 | ) | | | 1,252 | | | | 4,261 | |
| Legal liabilities – tax and social security | | | 1,313 | | | | (39 | ) | | | 143 | | | | 1,417 | |
| Provision for contingent liabilities | | | 2,418 | | | | (1,024 | ) | | | 1,372 | | | | 2,766 | |
| Civil lawsuits | | | 1,038 | | | | (349 | ) | | | 496 | | | | 1,185 | |
| Labor claims: | | | 884 | | | | (608 | ) | | | 708 | | | | 984 | |
| Tax and social security contributions | | | 462 | | | | (53 | ) | | | 168 | | | | 577 | |
| Other | | | 34 | | | | (14 | ) | | | - | | | | 20 | |
| Adjustments of operations carried out in futures settlement market | | | 47 | | | | (45 | ) | | | 9 | | | | 11 | |
| Provision related to health insurance operations | | | 242 | | | | - | | | | 7 | | | | 249 | |
| Other | | | 2,420 | | | | (1,257 | ) | | | 1,220 | | | | 2,383 | |
| Reflected in other comprehensive income | | | 132 | | | | (66 | ) | | | 278 | | | | 344 | |
| Total (*) | | | 25,920 | | | | (11,014 | ) | | | 13,904 | | | | 28,810 | |
(*) Deferred income tax and social contribution assets and liabilities are recorded in the balance sheet offset by taxable entity and total R$ 22,745 and R$ 4,319.
| | | | | | Realization / | | | | | | | |
| | | 01/01/2010 | | | Reversal | | | Increase | | | 12/31/2010 | |
| Reflected in income | | | 26,711 | | | | (9,330 | ) | | | 8,407 | | | | 25,788 | |
| Related to income tax and social contribution loss carryforwards | | | 3,204 | | | | (418 | ) | | | 212 | | | | 2,998 | |
| Allowance for loan losses | | | 9,264 | | | | (4,132 | ) | | | 5,291 | | | | 10,423 | |
| Adjustment to market value of derivative financial instruments | | | 208 | | | | (217 | ) | | | 31 | | | | 22 | |
| Goodwill on purchase of investments | | | 7,704 | | | | (1,870 | ) | | | 71 | | | | 5,905 | |
| Legal liabilities – tax and social security | | | 1,868 | | | | (632 | ) | | | 77 | | | | 1,313 | |
| Provision for contingent liabilities | | | 2,321 | | | | (958 | ) | | | 1,055 | | | | 2,418 | |
| Civil lawsuits | | | 897 | | | | (639 | ) | | | 780 | | | | 1,038 | |
| Labor claims: | | | 843 | | | | (119 | ) | | | 160 | | | | 884 | |
| Tax and social security contributions | | | 477 | | | | (130 | ) | | | 115 | | | | 462 | |
| Other | | | 104 | | | | (70 | ) | | | - | | | | 34 | |
| Adjustments of operations carried out in futures settlement market | | | 12 | | | | - | | | | 35 | | | | 47 | |
| Provision related to health insurance operations | | | 238 | | | | - | | | | 4 | | | | 242 | |
| Other | | | 1,892 | | | | (1,103 | ) | | | 1,631 | | | | 2,420 | |
| Reflected in other comprehensive income | | | 83 | | | | (46 | ) | | | 95 | | | | 132 | |
| Total (*) | | | 26,794 | | | | (9,376 | ) | | | 8,502 | | | | 25,920 | |
(*) Deferred income tax and social contribution assets and liabilities are recorded in the balance sheet offset by taxable entity and total R$ 20,169 and R$ 5,365.
II - Provision for deferred tax liability balance and respective changes are shown as follows:
| | | | | | Realization / | | | | | | | |
| | | 12/31/2010 | | | Reversal | | | Increase | | | 12/31/2011 | |
| Reflected in income | | | 10,395 | | | | (2,919 | ) | | | 2,409 | | | | 9,885 | |
| Depreciation in excess – finance lease | | | 8,295 | | | | (2,365 | ) | | | 1,630 | | | | 7,560 | |
| Taxation of results abroad – capital gains | | | 34 | | | | - | | | | 44 | | | | 78 | |
| Adjustments of operations carried out in futures settlement market | | | 43 | | | | (3 | ) | | | 43 | | | | 83 | |
| Adjustment to market value of securities and derivative financial instruments | | | 264 | | | | (264 | ) | | | 175 | | | | 175 | |
| Restatement of escrow deposits and contingent liabilities | | | 701 | | | | (157 | ) | | | 262 | | | | 806 | |
| Pension plans | | | 543 | | | | - | | | | 51 | | | | 594 | |
| Other | | | 515 | | | | (130 | ) | | | 204 | | | | 589 | |
| Reflected in other comprehensive income | | | 721 | | | | (474 | ) | | | 252 | | | | 499 | |
| Total (*) | | | 11,116 | | | | (3,393 | ) | | | 2,661 | | | | 10,384 | |
(*) Deferred income tax and social contribution assets and liabilities are recorded in the balance sheet offset by taxable entity and total R$ 22,745 and R$ 4,319.
| | | | | | Realization / | | | | | | | |
| | | 01/01/2010 | | | Reversal | | | Increase | | | 12/31/2010 | |
| Reflected in income | | | 9,458 | | | | (2,437 | ) | | | 3,374 | | | | 10,395 | |
| Depreciation in excess – finance lease | | | 7,568 | | | | (2,075 | ) | | | 2,802 | | | | 8,295 | |
| Taxation of results abroad – capital gains | | | 27 | | | | - | | | | 7 | | | | 34 | |
| Adjustments of operations carried out in futures settlement market | | | 36 | | | | (7 | ) | | | 14 | | | | 43 | |
| Adjustment to market value of securities and derivative financial instruments | | | 131 | | | | (131 | ) | | | 264 | | | | 264 | |
| Restatement of escrow deposits and contingent liabilities | | | 585 | | | | (109 | ) | | | 225 | | | | 701 | |
| Pension plans | | | 564 | | | | (21 | ) | | | - | | | | 543 | |
| Other | | | 547 | | | | (94 | ) | | | 62 | | | | 515 | |
| Reflected in other comprehensive income | | | 519 | | | | (9 | ) | | | 211 | | | | 721 | |
| Total (*) | | | 9,977 | | | | (2,446 | ) | | | 3,585 | | | | 11,116 | |
(*) Deferred income tax and social contribution assets and liabilities are recorded in the balance sheet offset by taxable entity and total R$ 20,169 and R$ 5,365 at December 31, 2010.
| III - | The estimates of realization and present value of deferred tax assets for offset, arising from Provisional Measure No. 2,158-35 of August 24, 2001, and deferred tax liabilities at December 31, 2011, in accordance with the expected generation of future taxable income, based on the history of profitability and technical feasibility studies, are: |
| | | Deferred tax assets | | | | | | | |
| | | | | | Tax loss/social | | | | | | | | | | |
| | | Temporary | | | contribution on loss | | | | | | Deferred tax | | | Net deferred | |
| | | differences | | | carryforwards | | | Total | | | liabilities | | | taxes | |
| 2012 | | | 8,567 | | | | 1,058 | | | | 9,625 | | | | (2,695 | ) | | | 6,930 | |
| 2013 | | | 5,235 | | | | 1,230 | | | | 6,465 | | | | (2,927 | ) | | | 3,538 | |
| 2014 | | | 3,418 | | | | 1,136 | | | | 4,554 | | | | (2,083 | ) | | | 2,471 | |
| 2015 | | | 2,478 | | | | 698 | | | | 3,176 | | | | (978 | ) | | | 2,198 | |
| 2016 | | | 1,738 | | | | 46 | | | | 1,784 | | | | (614 | ) | | | 1,170 | |
| after 2016 | | | 3,186 | | | | 20 | | | | 3,206 | | | | (1,087 | ) | | | 2,119 | |
| Total | | | 24,622 | | | | 4,188 | | | | 28,810 | | | | (10,384 | ) | | | 18,426 | |
| Present value (*) | | | 21,523 | | | | 3,764 | | | | 25,287 | | | | (9,127 | ) | | | 16,160 | |
(*) The average funding rate, net of tax effects, was used to determine the present value.
The projections of future taxable income include estimates related to macroeconomic variables, exchange rates, interest rates, volume of financial operations and services fees and others which can vary in relation to actual data and amounts.
Net income in the financial statements is not directly related to taxable income, due to differences between accounting criteria and tax legislation, besides corporate aspects. Accordingly, it is recommended that the trend of the realization of deferred tax assets arising from temporary differences, and tax loss carryforwards should be not used as an indication of future net income.
There are no deferred tax assets and liabilities which have not been recognized.
NOTE 27 – EARNINGS PER SHARE
Basic and diluted earnings per share were computed as shown in the table below for the periods indicated. Basic earnings per share are computed by dividing the net income attributable to the stockholders of ITAÚ UNIBANCO HOLDING by the average number of shares for the period, and by excluding the number of shares purchased and held as treasury shares. Diluted earnings per share are computed in a similar way, but with the adjustment made in the denominator when assuming the conversion of all shares that may dilute earnings.
Net income attributable to owners of the parent company – Basic earnings per
share | | 01/01 to
12/31/2011 | | | 01/01 to
12/31/2010 | |
| Net income | | | 13,837 | | | | 11,708 | |
| Minimum non-cumulative dividend on preferred shares in accordance with our bylaws | | | (49 | ) | | | (49 | ) |
| Subtotal | | | 13,788 | | | | 11,659 | |
| Retained earnings to be distributed to common equity owners in an amount per share equal to the minimum dividend payable to preferred equity owners | | | (50 | ) | | | (50 | ) |
| Subtotal | | | 13,738 | | | | 11,609 | |
| | | | | | | | | |
| Retained earnings to be distributed to common and preferred equity owners on a pro-rata basis | | | | | | | | |
| To common equity owners | | | 6,944 | | | | 5,859 | |
| To preferred equity owners | | | 6,794 | | | | 5,750 | |
| | | | | | | | | |
| Total net income available to common equity owners | | | 6,994 | | | | 5,909 | |
| Total net income available to preferred equity owners | | | 6,843 | | | | 5,799 | |
| | | | | | | | | |
| Weighted average number of shares outstanding | | | | | | | | |
| Common shares | | | 2,289,284,275 | | | | 2,289,284,273 | |
| Preferred shares | | | 2,240,026,557 | | | | 2,246,784,818 | |
| | | | | | | | | |
| Earnings per share - Basic – R$ | | | | | | | | |
| Common shares | | | 3.06 | | | | 2.58 | |
| Preferred shares | | | 3.06 | | | | 2.58 | |
Net income attributable to owners of the parent company – Diluted
earnings per share | | 01/01 to
12/31/2011 | | | 01/01 to
12/31/2010 | |
| Total net income available to preferred equity owners | | | 6,843 | | | | 5,799 | |
| Dividend on preferred shares after dilution effects | | | 17 | | | | 17 | |
| Net income available to preferred equity owners considering preferred shares after the dilution effect | | | 6,860 | | | | 5,816 | |
| | | | | | | | | |
| Total net income available to common equity owners | | | 6,994 | | | | 5,909 | |
| Dividend on preferred shares after dilution effects | | | (17 | ) | | | (17 | ) |
| Net income available to common equity owners considering preferred shares after the dilution effect | | | 6,977 | | | | 5,892 | |
| | | | | | | | | |
| Adjusted weighted average number of shares | | | | | | | | |
| Common shares | | | 2,289,284,275 | | | | 2,289,284,273 | |
| Preferred shares | | | 2,251,061,836 | | | | 2,260,240,831 | |
| Preferred shares | | | 2,240,026,557 | | | | 2,246,784,818 | |
| | | | | | | | | |
| Incremental shares from stock options granted under our Stock Option Plan | | | 11,035,279 | | | | 13,456,013 | |
| | | | | | | | | |
| Earnings per share - Diluted – R$ | | | | | | | | |
| Common shares | | | 3.05 | | | | 2.57 | |
| Preferred shares | | | 3.05 | | | | 2.57 | |
Potential anti-dilution effects of shares under our stock option plan, which were excluded from the calculation of diluted earnings per share totaled 11,846,655 preferred shares at December 31, 2011 and 3,549,386 preferred shares at December 31, 2010.
NOTE 28 –EMPLOYEE BENEFITS
As prescribed in IAS 19, we present the policies of ITAÚ UNIBANCO HOLDING and its subsidiaries regarding employee benefits, as well as the accounting procedures adopted:
ITAÚ UNIBANCO HOLDING and some of its subsidiaries sponsor defined benefit plans, including variable contribution plans, the basic purpose of which is to provide benefits that, in general, represent a life annuity benefit, and may be converted into survivorship annuities, according to the plan's regulation. They also sponsor defined contribution plans, the benefit of which is calculated based on the accumulated balance of individual accounts at the eligibility date, according to the plan’s regulation, one does not require an actuarial calculation.
Employees hired up to July 31, 2002, by Itaú, and up to February 27, 2009, by Unibanco, are beneficiaries of the above-mentioned plans. As regards the employees hired after these dates, they have the option to voluntarily participate in a defined contribution plan (PGBL), managed by Itaú Vida e Previdência S.A.
| a) | Description of the plans |
| Entity | | Name of Benefit plan |
| Fundação Itaubanco | | Supplementary retirement plan – PAC (1) |
| | | Franprev benefit plan - PBF (1) |
| | | 002 benefit plan - PB002 (1) |
| | | Itaulam basic plan - PBI (1) |
| | | Itaulam Supplementary Plan - PSI (2) |
| | | Itaubanco CD Plan (3) (4) |
| | | |
| Fundação Bemgeprev | | Supplementary Retirement Plan – Flexible Premium Annuity (ACMV) (1) |
| | | |
| Funbep Fundo de Pensão Multipatrocinado | | Funbep I Benefit Plan (1) |
| | | Funbep II Benefit Plan (2) |
| | | |
| Caixa de Previdência dos Funcionários do Banco Beg - Prebeg | | Prebeg Benefit Plan (1) |
| | | |
| Itaú Fundo Multipatrocinado | | Itaú Defined Benefit Plan (1) |
| | | Itaú Defined Contribution Plan (2) |
| | | |
| Múltipla - Multiempresas de Previdência Complementar | | Redecard Basic Retirement Plan (1) |
| | | Redecard Supplementary Retirement Plan (2) Redecard Supplementary Plan (3) (5) |
| | | |
| Itaubank Sociedade de Previdência Privada | | Itaubank Retirement Plan (3) |
| | | |
| UBB-PREV - Previdência Complementar | | Unibanco Pension Plan (3) |
| | | Basic Plan (1) |
| | | IJMS Plan (1) |
| | | |
| Banorte Fundação Manoel Baptista da Silva de Seguridade Social | | Benefit Plan II (1) |
(1) Defined benefit plan.
(2) Variable contribution plan.
(3) Defined contribution plan.
(4) The Itaubanco Defined Contribution Plan was set up as a result of the partial spin-off of the Supplementary retirement plan - PAC, and has been offered to former participants of the latter, which are not receiving supplementary retirement benefits from PAC. The participants who have not joined the Itaubanco Defined Contribution Plan, as well as those contributing to the PAC, will remain in this latter, without any continuity, and will have their vested rights guaranteed. As set forth in the Itaubanco Defined Contribution Plan regulation, the migration period ended on May 8, 2010.
5) Redecard Pension Plan was changed in January 2011 from Defined Benefit - BD to Defined Contribution - CD, with adhesion of 95% of employees. This plan enables the employee to contribute monthly with a defined percentage to be deducted from the monthly compensation and, additionally, the company contributes with 100% of the option chosen by the employees, limited to 9% of their income.
| I - | Main assumptions used in actuarial valuation of Retirement Plans |
| | | 12/31/2011 | | 12/31/2010 | | 01/01/2010 | |
| Discount rate | | 9.72% p.a. | | 9.72% p.a. | | 10.24% p.a. | |
| Expected return rate on assets | | 11.32% p.a. | | 12.32% p.a. | | 12.32% p.a. | |
| Mortality table (1) | | AT-2000 | | AT-2000 | | AT-2000 | |
| Turnover (2) | | Itaú Exp. 2008/2010 | | Itaú Exp. 2003/2004 | | Itaú Exp. 2003/2004 | |
| Future salary growth | | 7.12% p.a. | | 7.12% p.a. | | 7.12% p.a. | |
| Growth of the pension fund and social security benefits | | 4.00% p.a. | | 4.00% p.a. | | 4.00% p.a. | |
| Inflation | | 4.00% p.a. | | 4.00% p.a. | | 4.00% p.a. | |
| Actuarial method (3) | | Projected Unit Credit | | Projected Unit Credit | | Projected Unit Credit | |
(1) The mortality tables adopted correspond to those disclosed by SOA – Society of Actuaries, the North-American Entity which corresponds to IBA – Brazilian Institute of Actuarial Science, which reflects a 10% increase in the probabilities of survival as compared to the respective basic tables.
The life expectancy in years by the AT-2000 mortality table for participants of 55 years of age is 27 and 31 years for men and women, respectively.
(2) The turnover assumption is based on the effective experience of active participants linked to ITAÚ UNIBANCO HOLDING, resulting in the average of 2.4 % p.a. based on the 2008/2010 experience.
(3) Using the Projected Unit Credit method, the mathematical reserve is calculated as the current projected benefit amount multiplied by the ratio between the length of service at the assessment date and the length of service that will be reached at the date when the benefit is granted. The cost is determined taking into account the current projected benefit amount distributed over the years that each participant is employed.
| II – | Management of defined benefit plan assets |
The management of the funds of the closed-end private pension entities seeks to achieve the long-term balance between pension assets and liabilities by exceeding the actuarial goals.
As regards the assets guaranteeing mathematical reserves, management should ensure the payment capacity of benefits in the long-term by avoiding the risk of mismatching assets and liabilities in each pension plan.
The allocation of plan assets and the allocation target by type of asset are as follows:
| | | At | | | % Allocation | |
| Types | | 12/31/2011 | | | 12/31/2010 | | | 01/01/2010 | | | 12/31/2011 | | | 12/31/2010 | | | 01/01/2010 | | | 2012 Target | |
| | | | | | | | | | | | | | | | | | | | | | | | | | | | | |
| Fixed income securities | | | 10,341 | | | | 9,818 | | | | 12,909 | | | | 87.85 | % | | | 87.43 | % | | | 87.12 | % | | | 53% to 100% | |
| Variable income securities | | | 1,051 | | | | 1,005 | | | | 1,533 | | | | 8.93 | % | | | 8.95 | % | | | 10.35 | % | | | 0% to 25% | |
| Structured investments | | | 14 | | | | 11 | | | | 13 | | | | 0.11 | % | | | 0.10 | % | | | 0.09 | % | | | 0% to 10% | |
| Foreign investments | | | - | | | | 4 | | | | 4 | | | | 0.00 | % | | | 0.04 | % | | | 0.03 | % | | | 0% to 3% | |
| Real estate | | | 344 | | | | 368 | | | | 335 | | | | 2.92 | % | | | 3.28 | % | | | 2.25 | % | | | 0% to 6% | |
| Loans to participants | | | 23 | | | | 23 | | | | 23 | | | | 0.19 | % | | | 0.20 | % | | | 0.16 | % | | | 0% to 5% | |
| Total | | | 11,773 | | | | 11,229 | | | | 14,817 | | | | 100.00 | % | | | 100.00 | % | | | 100.00 | % | | | | |
The defined benefit plan assets include shares of ITAÚ UNIBANCO HOLDING, its main parent company (ITAÚSA) and of subsidiaries of the latter, with a fair value of R$ 531 (R$ 542 at December 31, 2010 and R$ 1,077 at January 1, 2010) and real estate rented to Group companies, with a fair value of R$ 298 (R$ 309 at December 31, 2010 and R$ 301 at January 1, 2010).
The expected income from portfolios of benefit plan assets is based on projections of returns for each of the asset types detailed above. For the fixed-income segment, the interest rates adopted were taken from long-term securities included in the portfolios, and the interest-rates practiced in the market at the balance sheet date. For the variable-income segment, the 12-month expected returns of the market for this segment were adopted. For the real estate segment, the cash inflows of expected rental payments for the following 12 months were adopted. For all segments, the basis adopted was the portfolio positions at the balance sheet date.
| III- | Net amount recognized in the balance sheet |
We present below the calculation of the net amount recognized in the balance sheet:
| | | 12/31/2011 | | | 12/31/2010 | | | 01/01/2010 | |
| 1 - Net assets of the plans | | | 11,773 | | | | 11,229 | | | | 14,817 | |
| 2 - Actuarial liabilities | | | (10,413 | ) | | | (9,871 | ) | | | (11,233 | ) |
| 3- Surplus (1-2) | | | 1,360 | | | | 1,358 | | | | 3,584 | |
| 4- Asset ceiling (*) | | | (1,263 | ) | | | (1,114 | ) | | | (2,212 | ) |
| 5 - Net amount recognized in the balance sheet (3-4) | | | 97 | | | | 244 | | | | 1,372 | |
| Amount recognized in assets (Note 19a) | | | 342 | | | | 367 | | | | 1,508 | |
| Amount recognized in liabilities | | | (245 | ) | | | (123 | ) | | | (136 | ) |
(*) Corresponds to the excess of present value of the available economic benefit, in conformity with item 58 of IAS 19.
In conformity with the exemption prescribed in IFRS 1, gains and losses accumulated through January 1, 2010 were recognized in retained earnings, net of tax effects, and taking into account the adjustments in subsidiaries. The actuarial gains and losses for the year were recognized in income under “General and administrative expenses”.
| IV - | Change in plan assets, defined benefit obligation, and surplus |
| | | 12/31/2011 | | | 12/31/2010 | | | 01/01/2010 | |
| | | Plan assets | | | Defined benefit
obligation | | | Surplus | | | Plan assets | | | Defined benefit
obligation | | | Surplus | | | Plan assets | | | Defined benefit
obligation | | | Surplus | |
| Present value – beginning of the year | | | 11,229 | | | | (9,871 | ) | | | 1,358 | | | | 14,817 | | | | (11,233 | ) | | | 3,584 | | | | 12,493 | | | | (11,264 | ) | | | 1,229 | |
| Effects of the partial spin-off of PAC (1) | | | - | | | | - | | | | - | | | | (5,147 | ) | | | 2,710 | | | | (2,437 | ) | | | - | | | | 880 | | | | 880 | |
| Inclusion of Redecard Plan | | | - | | | | - | | | | - | | | | - | | | | - | | | | - | | | | 60 | | | | (53 | ) | | | 7 | |
| Inclusion of Itaú Defined Benefit Plan | | | - | | | | - | | | | - | | | | - | | | | - | | | | - | | | | 131 | | | | (123 | ) | | | 8 | |
| Inclusion of Itaú Defined Contribution Plan | | | 12 | | | | (13 | ) | | | (1 | ) | | | - | | | | - | | | | - | | | | - | | | | - | | | | - | |
| Effects of the partial spin-off of Redercard (2) | | | (44 | ) | | | 42 | | | | (2 | ) | | | - | | | | - | | | | - | | | | - | | | | - | | | | - | |
| Expected return on assets (4) | | | 1,342 | | | | - | | | | 1,342 | | | | 1,342 | | | | - | | | | 1,342 | | | | 1,539 | | | | - | | | | 1,539 | |
| Cost of current service | | | - | | | | (91 | ) | | | (91 | ) | | | - | | | | (87 | ) | | | (87 | ) | | | - | | | | (237 | ) | | | (237 | ) |
| Interest cost | | | - | | | | (930 | ) | | | (930 | ) | | | - | | | | (943 | ) | | | (943 | ) | | | - | | | | (1,140 | ) | | | (1,140 | ) |
| Benefits paid | | | (601 | ) | | | 601 | | | | - | | | | (568 | ) | | | 568 | | | | - | | | | (541 | ) | | | 541 | | | | - | |
| Contributions of sponsors | | | 42 | | | | - | | | | 42 | | | | 42 | | | | - | | | | 42 | | | | 34 | | | | - | | | | 34 | |
| Contributions of participants | | | 9 | | | | - | | | | 9 | | | | 40 | | | | - | | | | 40 | | | | 34 | | | | - | | | | 34 | |
| Actuarial gain/(loss) (3) (4) | | | (216 | ) | | | (151 | ) | | | (367 | ) | | | 703 | | | | (886 | ) | | | (183 | ) | | | 1,067 | | | | 162 | | | | 1,229 | |
| End of the year | | | 11,773 | | | | (10,413 | ) | | | 1,360 | | | | 11,229 | | | | (9,871 | ) | | | 1,358 | | | | 14,817 | | | | (11,234 | ) | | | 3,583 | |
(1) Corresponds to the effect of the partial spin-off of the PAC and creation of the Plano Itaubanco CD, which migration process resulted in the curtailment and partial settlement of PAC obligations. The curtailment which implied a reduction in obligations and thus in actuarial liabilities, made on December 31, 2009, is already adjusted in the opening balance (January 1, 2010). At March 31, 2010, the PAC participants who opted for the voluntary migration to the Plano Itaubanco CD had all of their obligations settled by PAC through the initial contribution of the assets previously held by PAC to individual accounts corresponding to the Plano Itaubanco CD. PAC is no longer responsible for any retirement benefit at the PAC level related to these participants. After the partial settlement of PAC, assets were transferred from PAC to Plano Itaubanco CD.
(2) During the fiscal year 2011, a process for migration of participants from Redecard Retirement Plan, structured as a defined benefit plan, to the Redecard Pension Plan, which is structured as a defined contribution plan, was carried out. For those participants who migrated to the Redecard Pension Plan, the accumulation of future benefit is now performed as a defined contribution, and therefore there is no replacement for the same type of benefit.
(3) Gains (losses) recorded in plan assets correspond to the income earned above/below the expected return rate of assets.
(4) The actual return on assets was R$ 1,126 (R$ 2,045 at December 31, 2010 and R$ 2,606 at January 1, 2010).
The history of actuarial gains and losses is as follows:
| | | 12/31/2011 | | | 12/31/2010 | | | 12/31/2009 | | | 12/31/2008 | | | 12/31/2007 | |
| Plan net assets | | | 11,773 | | | | 11,229 | | | | 14,817 | | | | 12,493 | | | | 12,583 | |
| Defined benefit obligation | | | (10,413 | ) | | | (9,871 | ) | | | (11,234 | ) | | | (11,264 | ) | | | (9,441 | ) |
| Surplus | | | 1,360 | | | | 1,358 | | | | 3,583 | | | | 1,229 | | | | 3,142 | |
| Experience adjustments in plan net assets | | | (216 | ) | | | 703 | | | | 1,067 | | | | (979 | ) | | | 1,060 | |
| Experience adjustments in defined benefit obligation | | | (151 | ) | | | (886 | ) | | | 162 | | | | (823 | ) | | | (186 | ) |
The amounts for 2007 to 2009, calculated based on the Brazilian standards equivalent to IAS 19, are presented only for change effects, considering that in conformity with the exemption set forth in IFRS 1, assets, liabilities, and gains and losses were recognized at 01/01/2010.
| V- | Total revenue (expenses) recognized in income for the year |
Total expenses recognized for defined benefit plans include the following components:
| | | 12/31/2011 | | | 12/31/2010 | |
| Cost of current service | | | (91 | ) | | | (87 | ) |
| Interest cost | | | (930 | ) | | | (943 | ) |
| Expected return on the plan assets | | | 1,342 | | | | 1,342 | |
| Effects of the partial spin-off of PAC | | | - | | | | (2,437 | ) |
| Effects of the partial spin-off of Redecard | | | (1 | ) | | | - | |
| Effect on asset ceiling | | | (154 | ) | | | 1,098 | |
| Gain/(loss) for the year | | | (367 | ) | | | (183 | ) |
| Contributions of participants | | | 9 | | | | 40 | |
| Total revenue (expenses) recognized in income for the year | | | (192 | ) | | | (1,170 | ) |
During the year, contributions made totaled R$ 42 (R$ 42 from 01/01 to 12/31/2010). The contribution rate increases based on the beneficiary’s salary.
In 2012, contribution to the defined benefit retirement plans sponsored by ITAÚ UNIBANCO HOLDING is expected to amount to R$ 39.
The estimate for payment of benefits for the next 10 years is as follows:
| | | Payment
estimate | |
| 2012 | | | 646 | |
| 2013 | | | 673 | |
| 2014 | | | 697 | |
| 2015 | | | 721 | |
| 2016 | | | 746 | |
| 2017 to 2021 | | | 4,119 | |
| c) | Defined contribution plans |
The defined contribution plans have assets relating to sponsors’ contributions not yet included in the participant’s account balance due to loss of eligibility to a plan benefit, as well as by resources from the migration from the defined benefit plans. The fund will be used for future contributions to the individual participants' accounts, according to the rules of the respective benefit plan regulation.
The amount recognized in assets is R$ 1,443 ( R$ 1,169 at 12/31/2010) (Note 19a).
Total revenue recognized for defined contribution plans includes the following components:
| | | 12/31/2011 | | | 12/31/2010 | |
| Effect of the partial spin-off of PAC | | | - | | | | 1,477 | |
| Contribution | | | (144 | ) | | | (111 | ) |
| Actuarial gain/(loss) | | | 150 | | | | 256 | |
| Effect on asset ceiling | | | 268 | | | | (581 | ) |
| Total revenue recognized in income for the year | | | 274 | | | | 1,041 | |
In conformity with the exemption prescribed in IFRS 1, gains and losses accumulated through January 1, 2010 were recognized in retained earnings, net of tax effects, and taking into account the adjustments in subsidiaries. The actuarial gains and losses for the period were recognized in income “General and administrative expenses”.
During the year, contributions to the defined contribution plans, including PGBL, totaled R$ 193 (R$ 153 at December 31, 2010), of which R$ 144 (R$ 111 at December 31, 2010) were pension funds.
| d) | Other post-employment benefits |
ITAÚ UNIBANCO HOLDING and its subsidiaries do not offer other post-employment benefits, except in those cases arising from obligations under the acquisition agreements signed by ITAÚ UNIBANCO HOLDING, in accordance with the terms and conditions established, in which health plans are totally or partially sponsored for former workers and beneficiaries.
Based on the report prepared by an independent actuary, the changes in obligations for these other projected benefits and the amounts recognized in the balance sheet, under liabilities, of ITAÚ UNIBANCO HOLDING are as follows:
| | | 12/31/2011 | | | 12/31/2010 | |
| At the beginning of the year | | | (105 | ) | | | (100 | ) |
| Interest cost | | | (10 | ) | | | (10 | ) |
| Benefits paid | | | 6 | | | | 5 | |
| Actuarial (loss) | | | (11 | ) | | | - | |
| At the end of the year | | | (120 | ) | | | (105 | ) |
In conformity with the exemption prescribed in IFRS 1, gains and losses accumulated through January 1, 2010 were recognized in retained earnings, net of tax effects, and taking into account the adjustments in subsidiaries. The actuarial gains and losses for the period were recognized in income as “General and administrative expenses”.
The estimate for payment of benefits for the next 10 years is as follows:
| Period | | Payment
estimate | |
| 2012 | | | 6 | |
| 2013 | | | 7 | |
| 2014 | | | 7 | |
| 2015 | | | 8 | |
| 2016 | | | 8 | |
| 2017 to 2021 | | | 50 | |
| II- | Assumptions and sensitivity at 1% |
For calculation of projected benefit obligations in addition to the assumptions for the defined benefit plans (Note 28b I), an 8.16% p.a. increase in medical costs is assumed.
Assumptions about medical care cost trends have a significant impact on the amounts recognized in income. A change of one percentage point in the medical care cost rates would have the following effects:
| | | 1.0% increase | | | 1.0% decrease | |
| Effects on service cost and interest cost | | | 2 | | | | (1 | ) |
| Effects on present value of obligation | | | 17 | | | | (14 | ) |
NOTE 29 – INSURANCE CONTRACTS
ITAÚ UNIBANCO HOLDING, through its subsidiaries, offers to the market insurance and private pension. Products are offered through insurance brokers (third parties operating in the market and its own brokers), Itaú Unibanco branches and electronic channels, according to their characteristics and regulatory requirements.
In all segments, a new product is created when new demands and opportunities arise in the market or from a specific negotiation.
The products developed are submitted to a committee, coordinated and controlled by the Governance of Products, in which all flows comprising the operational, commercial, legal, accounting, financial, internal control and technology aspects are analyzed, discussed and approved by the various areas involved.
The governance process of product evaluation is regulated by the Corporate Policy on Product and Operations Evaluation, and requires the integration of activities between product and evaluation areas, forming an organized group of activities that aims to add value to customers and to promote competitive differentials.
Internal rules provide for and support product evaluation and approval flows, attribution of responsibilities, provisions for carrying out processes, and also maximum and minimum balance limits, contribution, minimum premium and other, which aim at preserving the consistency of the process and product results.
There are also policies on underwriting risks in each segment, such as technical actuarial limits per insurance line and coverage, which are controlled systemically or operationally.
This product creation process involves the following steps:
| · | Development of the product by managers in order to meet a market demand. |
| · | Submission of the detailed product characteristics to Governance. |
| · | Parameterization of new products in IT systems with the concomitant evaluation of the need for developing new implementation process. |
| · | Launch of the product after authorization from the Product Governance Committee. |
For private pension products, registration with the Brazilian Securities and Exchange Commission (CVM) and approval of actuarial technical notes and rules from SUSEP for sales is also required. It is also possible to custom minimum amounts, fund management and entry fees, actuarial table and interest upon negotiation with evaluation of an internal pricing model agreed in a specific contract.
There are policies on minimum appropriate balances and contributions to each negotiation. Risk benefits, considered ancillary coverage, follow their own and specific conditions, such as coverage limits, target audience and proof of good health, among others, according to each agreement. In addition, increased risks may excess of loss coverage through reinsurance.
Each product has rules according to the channel and segment to which it will be sold. Pricing policies are determined according to internal models, in compliance with the corporate standard pricing model developed by the Risk and Financial Controls Area, in the context of the Governance of product evaluation.
The cost management of insurance and private pension products includes the groups of administrative, operating and selling expenses, where administrative expenses based on the recognition by cost centers, are allocated to products and sales channels according to the definition of the respective activities, following the corporate managerial model of ITAÚ UNIBANCO HOLDING. Operating and selling expenses are based on the line for product identification and policy segmentation in order to define the sales channel.
ITAÚ UNIBANCO HOLDING, through its insurance companies, supplies the market with insurance products with the purpose of assuming risks and restoring the economic balance of the assets of the policyholder if damaged.
In this segment, clients are mainly divided into the Individual (Retail, UniClass, Personnalité and Private) and Corporate (Companies, Corporate and Condominium) markets.
The contract entered into between the parties aims at protecting the client’s assets. Upon payment of a premium, the policyholder is protected through previously agreed replacement or indemnification clauses for damages. ITAÚ UNIBANCO HOLDING insurance companies recognize technical reserves administered by themselves, through specialized areas within the conglomerate, with the objective of indemnifying the policyholder’s loss in the event of claims for insured risks.
The insurance risks sold by insurance companies of ITAÚ UNIBANCO HOLDING are divided into property and casualty, and life insurance.
| · | Property and casualty insurance: covers losses, damages or liabilities for assets or persons, excluding from this classification life insurance lines. |
| · | Life insurance: include coverage for death and personal accidents. |
| | | Loss ratio | | | Sales ratio | |
| Main insurance lines | | % | | | % | |
| | | 01/01 to
12/31/2011 | | | 01/01 to
12/31/2010 | | | 01/01 to
12/31/2011 | | | 01/01 to
12/31/2010 | |
| Mandatory insurance for personal injury caused by motor vehicles (DPVAT) | | | 86.4 | | | | 87.0 | | | | 1.5 | | | | 1.4 | |
| Group life | | | 39.0 | | | | 41.5 | | | | 11.5 | | | | 12.8 | |
| Individual accident | | | 29.0 | | | | 28.8 | | | | 12.3 | | | | 17.6 | |
| General liability | | | 33.9 | | | | 42.7 | | | | 9.2 | | | | 13.3 | |
| Credit life | | | 21.8 | | | | 25.8 | | | | 25.2 | | | | 29.4 | |
| Extended guarantee - assets | | | 19.5 | | | | 21.1 | | | | 65.4 | | | | 68.5 | |
| Group accident insurance | | | 6.3 | | | | 7.8 | | | | 45.3 | | | | 43.9 | |
| Petroleum risks | | | 6.2 | | | | 3.2 | | | | 3.2 | | | | 1.8 | |
| Multiple risks | | | 5.3 | | | | 16.2 | | | | 59.4 | | | | 50.0 | |
Developed as a solution to ensure the maintenance of the quality of life of participants, as a supplement to the government pension, through long-term investments, private pension products are divided into three major groups:
| · | PGBL (Plan Generator of Benefits): the main objective of this plan is the accumulation of financial resources, but it can be purchased with additional risk coverage. Recommended for clients that file the full version of income tax return (rather than the simplified pension), because they can deduct contributions paid for tax purposes up to 12% of the annual taxable gross income. |
| · | VGBL (Redeemable Life Insurance): this is an insurance structured as a pension plan. Its taxation differs from the PGBL; in this case, the tax basis is the earned income. |
| · | FGB (Fund Generator of Benefits): this is a pension plan with minimum income guarantee, and possibility of receiving earnings from asset performance. Once recognized the distribution of earnings at a certain percentage, as established by the FGB policy, it is not at management´s discretion, but instead represent an obligation to ITAÚ UNIBANCO HOLDING. Although there are plans still in existence, they are no longer sold. |
| III- | Income from insurance and private pension |
The revenue from the main insurance and private pension products is as follows:
| | | Premiums and contributions
direct issue | | | Reinsurance | | | Retained premiums and
contributions | |
| | | 01/01 to
12/31/2011 | | | 01/01 to
12/31/2010 | | | 01/01 to
12/31/2011 | | | 01/01 to
12/31/2010 | | | 01/01 to
12/31/2011 | | | 01/01 to
12/31/2010 | |
| VGBL | | 10,010 | | | 7,036 | | | - | | | - | | | 10,010 | | | 7,036 | |
| PGBL | | | 1,424 | | | | 1,247 | | | | (1 | ) | | | - | | | | 1,423 | | | | 1,247 | |
| Warranty extension - assets | | | 1,365 | | | | 1,158 | | | | - | | | | - | | | | 1,365 | | | | 1,158 | |
| Group life | | | 1,165 | | | | 1,150 | | | | (24 | ) | | | (17 | ) | | | 1,141 | | | | 1,133 | |
| Group accident insurance | | | 661 | | | | 625 | | | | (1 | ) | | | - | | | | 660 | | | | 625 | |
| Specified and operational risk | | | 480 | | | | 360 | | | | (384 | ) | | | (209 | ) | | | 96 | | | | 151 | |
| Credit life | | | 461 | | | | 424 | | | | - | | | | (1 | ) | | | 461 | | | | 423 | |
| Traditional | | | 369 | | | | 391 | | | | - | | | | - | | | | 369 | | | | 391 | |
| DPVAT | | | 308 | | | | 284 | | | | - | | | | - | | | | 308 | | | | 284 | |
| Petroleum risks | | | 257 | | | | 61 | | | | (220 | ) | | | (43 | ) | | | 37 | | | | 18 | |
| Multiple risks | | | 207 | | | | 238 | | | | (36 | ) | | | (34 | ) | | | 171 | | | | 204 | |
| General civil liability | | | 80 | | | | 87 | | | | (27 | ) | | | (38 | ) | | | 53 | | | | 49 | |
| Engineering | | | 72 | | | | 88 | | | | (64 | ) | | | (74 | ) | | | 8 | | | | 14 | |
| Aeronautical | | | 49 | | | | 56 | | | | (49 | ) | | | (47 | ) | | | - | | | | 9 | |
| Other lines | | | 1,271 | | | | 1,034 | | | | (204 | ) | | | (139 | ) | | | 1,067 | | | | 895 | |
| | | | 18,179 | | | | 14,239 | | | | (1,010 | ) | | | (602 | ) | | | 17,169 | | | | 13,637 | |
| c) | Technical reserves for insurance and private pension |
Technical reserves for insurance and private pension are recognized according to the criteria established by the National Council of Private Insurance (CNSP) Resolution No. 162 of December 26, 2006 and subsequent amendments.
| · | Reserve for unearned premiums –recognized based on premiums issued, calculated on a “pro rata” basis, and represents the portion of premium corresponding to the policy period not yet elapsed. The reserve for unearned premiums for risks in force but not yet issued is recognized based on a technical actuarial note, and has the objective of estimating a portion of unearned premiums related to risks assumed by insurance companies and that are for policies that are still in the process of issuance. |
| · | Reserve for premium deficiency –recognized according to a technical actuarial note if a premium deficiency is found. |
| · | Reserve for unsettled claims -recognized based on claims of loss in an amount sufficient to cover future commitments. In order to determine the amount to be provided for claims awaiting judicial decision, court-appointed experts and legal advisors make assessments based on the insured amounts and technical rules, taking into consideration the likelihood of an unfavorable outcome for the insurance company. |
| · | Reserve for claims incurred but not reported (IBNR) –recognized for the estimated amount of claims occurred for risks assumed in the portfolio but not yet reported. |
| · | Other provisions –recognized based on the technical provision for extension of warranty in the extended warranty line, and the calculation is made over the period from the date the insurance contract becomes effective and the risk initial coverage date, the amount to be recognized being equal to the retained commercial premium. |
II – Private pension:
The mathematical reserves represent amounts of obligations assumed as insurance for benefits, retirement plans, disability, pension and annuity and are calculated according to the method of accounting provided for in the contract.
| · | Mathematical reserves for benefits to be granted and benefits granted –correspond to commitments assumed with participants, but for which benefits are not yet due, and to those receiving the benefits, respectively. |
| · | Provision for insufficient contribution –recognized when insufficient premiums or contribution are determined. |
| · | Reserve for unexpired risks –recognized to reflect the estimate of risks in force but not expired. |
| · | Reserve for claims incurred but not reported (IBNR) –recognized based on the estimated amount of claims incurred but not reported. |
| · | Reserve for financial surplus –refers to the difference between the contributions adjusted daily by the gains/losses in the investment portfolio and the accumulated fund recorded. |
| · | Other reserves –mainly refer to the reserve for administrative expenses recognized according to an actuarial technical note to cover expenses arising from the payment of benefits provided for in the plan, in view of the claims incurred and to be incurred. It also includes the heading Redemptions and/or Other Policy Benefits that refers to amounts not yet paid through the balance sheet date. |
III - Change in reserves for insurance and private pension
The details about the changes in balances of reserves for insurance and private pension operations are as follows:
| | | 12/31/2011 | | | 12/31/2010 | |
| | | Property,
individuals and
life insurance | | | Private pension | | | Life with
Survivor
benefits | | | Total | | | Property,
individuals and
life insurance | | | Private
pension | | | Life with
Survivor
benefits | | | Total | |
| | | | | | | | | | | | | | | | | | | | | | | | | |
| Opening balance | | | 5,527 | | | | 18,296 | | | | 33,041 | | | | 56,864 | | | | 4,758 | | | | 16,053 | | | | 27,135 | | | | 47,946 | |
| (+) Additions arising from premiums/contribution | | | 16,681 | | | | 1,706 | | | | 9,936 | | | | 28,323 | | | | 11,861 | | | | 1,621 | | | | 6,975 | | | | 20,457 | |
| (-) Deferral of risk | | | (15,694 | ) | | | - | | | | - | | | | (15,694 | ) | | | (11,709 | ) | | | - | | | | - | | | | (11,709 | ) |
| (-) Payment of claims/benefits | | | (1,508 | ) | | | (103 | ) | | | (6 | ) | | | (1,617 | ) | | | (1,556 | ) | | | (118 | ) | | | (53 | ) | | | (1,727 | ) |
| (+) Reported claims | | | 2,020 | | | | - | | | | - | | | | 2,020 | | | | 2,029 | | | | - | | | | - | | | | 2,029 | |
| (-) Redemptions | | | (152 | ) | | | (917 | ) | | | (3,745 | ) | | | (4,814 | ) | | | - | | | | (907 | ) | | | (3,240 | ) | | | (4,147 | ) |
| (+/-) Net portability | | | (115 | ) | | | 152 | | | | (14 | ) | | | 23 | | | | - | | | | 139 | | | | (180 | ) | | | (41 | ) |
| (+) Adjustment of reserves and financial surplus | | | 1 | | | | 1,658 | | | | 3,362 | | | | 5,021 | | | | - | | | | 1,512 | | | | 2,352 | | | | 3,864 | |
| (+/-) Other (recognition/reversal) | | | 849 | | | | 101 | | | | (172 | ) | | | 778 | | | | 144 | | | | (4 | ) | | | 52 | | | | 192 | |
| Reserves for insurance and private pension | | | 7,609 | | | | 20,893 | | | | 42,402 | | | | 70,904 | | | | 5,527 | | | | 18,296 | | | | 33,041 | | | | 56,864 | |
| | | INSURANCE | | | PRIVATE PENSION | | | TOTAL | |
| | | 12/31/2011 | | | 12/31/2010 | | | 01/01/2010 | | | 12/31/2011 | | | 12/31/2010 | | | 01/01/2010 | | | 12/31/2011 | | | 12/31/2010 | | | 01/01/2010 | |
| | | | | | | | | | | | | | | | | | | | | | | | | | | | |
| Mathematical reserve for benefits to be granted and benefits granted | | | 17 | | | | 30 | | | | 33 | | | | 61,953 | | | | 50,070 | | | | 42,106 | | | | 61,970 | | | | 50,100 | | | | 42,139 | |
| Unearned premiums | | | 3,026 | | | | 1,354 | | | | 1,224 | | | | - | | | | - | | | | - | | | | 3,026 | | | | 1,354 | | | | 1,224 | |
| Unsettled claims (*) | | | 2,297 | | | | 2,163 | | | | 1,810 | | | | - | | | | - | | | | - | | | | 2,297 | | | | 2,163 | | | | 1,810 | |
| IBNR (*) | | | 712 | | | | 587 | | | | 568 | | | | 10 | | | | 9 | | | | 13 | | | | 722 | | | | 596 | | | | 581 | |
| Premium deficiency | | | 313 | | | | 273 | | | | 245 | | | | - | | | | - | | | | 103 | | | | 313 | | | | 273 | | | | 348 | |
| Insufficient contribution | | | - | | | | - | | | | - | | | | 692 | | | | 602 | | | | 390 | | | | 692 | | | | 602 | | | | 390 | |
| Financial surplus | | | 2 | | | | 2 | | | | 2 | | | | 475 | | | | 458 | | | | 452 | | | | 477 | | | | 460 | | | | 454 | |
| Other (Note 29c i) | | | 1,242 | | | | 1,118 | | | | 876 | | | | 165 | | | | 198 | | | | 124 | | | | 1,407 | | | | 1,316 | | | | 1,000 | |
| TOTAL | | | 7,609 | | | | 5,527 | | | | 4,758 | | | | 63,295 | | | | 51,337 | | | | 43,188 | | | | 70,904 | | | | 56,864 | | | | 47,946 | |
(*) The provision for unsettled claims and IBRN are detailed in Note 29e.
| d) | Deferred acquisition costs |
Deferred acquisition costs of insurance are direct and indirect costs incurred to sell, underwrite and originate a new insurance contract.
Direct costs are basically commissions paid for brokerage services, agency and prospecting efforts and are deferred for amortization in proportion to the recognition of revenue from earned premiums, that is, over the coverage period, for the term of effectiveness of contracts, according to the calculation rules in force.
Balances are recorded under gross reinsurance assets and changes are shown in the table below:
| | | Insurance | |
| Balance at 01/01/2011 | | | 1,649 | |
| Increase | | | 583 | |
| Amortization | | | (168 | ) |
| Balance at 12/31/2011 | | | 2,064 | |
| Balance to be amortized in up to 12 months | | | 1,495 | |
| Balance to be amortized after 12 months | | | 569 | |
| | | | | |
| Balance at 01/01/2010 | | | 1,650 | |
| Increase | | | 36 | |
| Amortization | | | (37 | ) |
| Balance at 12/31/2010 | | | 1,649 | |
| Balance to be amortized in up to 12 months | | | 1,339 | |
| Balance to be amortized after 12 months | | | 310 | |
The amounts of deferred selling expenses from reinsurance are stated in Note 29l.
| e) | Table of loss development |
Changes in the amount of obligations of ITAÚ UNIBANCO HOLDING may occur at the end of each annual reporting period. The table below shows the development by the claims incurred method.The first part of the table below shows how the final loss estimate changes through time.The second part of the table reconciles the amounts pending payment and the liability disclosed in the balance sheet.
The reserve for unsettled claims is comprised as follows, at December 31, 2011:
I –Gross of reinsurance
| Reserve for unsettled claims and of claims incurred but not reported | | 12/31/2011 | |
| Liability claims presented in the table development | | | 2,574 | |
| DPVAT operations | | | 282 | |
| Retrocession and other estimates | | | 163 | |
| Total reserve (*) | | | 3,019 | |
(*) The total reserve refers to unsettled claims and provision for claims incurred but not reported (IBNR), stated in Note 29c III.
| Date | | | 12/31/2005 | | | | 12/31/2006 | | | | 12/31/2007 | | | | 12/31/2008 | | | | 12/31/2009 | | | | 12/31/2010 | | | | 12/31/2011 | | | | TOTAL | |
| At the end of reporting year | | | 1,030 | | | | 1,906 | | | | 2,137 | | | | 1,768 | | | | 1,530 | | | | 1,890 | | | | 1,771 | | | | | |
| After 1 year | | | 1,030 | | | | 1,963 | | | | 2,140 | | | | 1,787 | | | | 1,590 | | | | 2,031 | | | | - | | | | | |
| After 2 years | | | 1,037 | | | | 2,036 | | | | 2,206 | | | | 1,778 | | | | 1,606 | | | | - | | | | - | | | | | |
| After 3 years | | | 1,046 | | | | 2,059 | | | | 2,212 | | | | 1,739 | | | | - | | | | - | | | | - | | | | | |
| After 4 years | | | 1,056 | | | | 2,052 | | | | 2,201 | | | | - | | | | - | | | | - | | | | - | | | | | |
| After 5 years | | | 1,056 | | | | 2,036 | | | | - | | | | - | | | | - | | | | - | | | | - | | | | | |
| After 6 years | | | 1,052 | | | | - | | | | - | | | | - | | | | - | | | | - | | | | - | | | | | |
| | | | | | | | | | | | | | | | | | | | | | | | | | | | | | | | | |
| Current estimate | | | 1,052 | | | | 2,036 | | | | 2,201 | | | | 1,739 | | | | 1,606 | | | | 2,031 | | | | 1,771 | | | | 12,436 | |
| Accumulated payments through base date | | | 1,006 | | | | 1,964 | | | | 2,078 | | | | 1,584 | | | | 1,319 | | | | 1,404 | | | | 852 | | | | 10,207 | |
| Liabilities recognized in the balance sheet | | | 46 | | | | 72 | | | | 123 | | | | 155 | | | | 287 | | | | 627 | | | | 919 | | | | 2,229 | |
| Liabilities in relation to years prior to 2005 | | | | | | | | | | | | | | | | | | | | | | | | | | | | | | | 345 | |
| Total liabilities included in balance sheet | | | | | | | | | | | | | | | | | | | | | | | | | | | | | | | 2,574 | |
II- Net of reinsurance
| Reserve for unsettled claims and for claims incurred but not reported | | 12/31/2011 | |
| Liability claims presented in the table development | | | 1,245 | |
| DPVAT operations | | | 282 | |
| Reinsurance, retrocession and other estimates | | | 1,492 | |
| Total reserve (*) | | | 3,019 | |
(*) The total reserve refers to unsettled claims and provision for claims incurred but not reported (IBNR), stated in Note 29c III.
| Date | | 12/31/2005 | | | 12/31/2006 | | | 12/31/2007 | | | 12/31/2008 | | | 12/31/2009 | | | 12/31/2010 | | | 12/31/2011 | | | TOTAL | |
| At the end of reporting year | | | 808 | | | | 865 | | | | 1,027 | | | | 1,157 | | | | 1,197 | | | | 1,269 | | | | 1,311 | | | | | |
| After 1 year | | | 808 | | | | 899 | | | | 1,044 | | | | 1,164 | | | | 1,188 | | | | 1,180 | | | | - | | | | | |
| After 2 years | | | 813 | | | | 921 | | | | 1,063 | | | | 1,161 | | | | 1,190 | | | | - | | | | - | | | | | |
| After 3 years | | | 820 | | | | 929 | | | | 1,071 | | | | 1,157 | | | | - | | | | - | | | | - | | | | | |
| After 4 years | | | 829 | | | | 928 | | | | 1,076 | | | | - | | | | - | | | | - | | | | - | | | | | |
| After 5 years | | | 827 | | | | 932 | | | | - | | | | - | | | | - | | | | - | | | | - | | | | | |
| After 6 years | | | 834 | | | | - | | | | - | | | | - | | | | - | | | | - | | | | - | | | | | |
| | | | | | | | | | | | | | | | | | | | | | | | | | | | | | | | | |
| Current estimate | | | 834 | | | | 932 | | | | 1,076 | | | | 1,157 | | | | 1,190 | | | | 1,180 | | | | 1,311 | | | | 7,680 | |
| Accumulated payments through base date | | | 796 | | | | 879 | | | | 1,002 | | | | 1,062 | | | | 1,084 | | | | 1,029 | | | | 743 | | | | 6,595 | |
| Liabilities recognized in the balance sheet | | | 38 | | | | 53 | | | | 74 | | | | 95 | | | | 106 | | | | 151 | | | | 568 | | | | 1,085 | |
| Liabilities in relation to years prior to 2005 | | | | | | | | | | | | | | | | | | | | | | | | | | | | | | | 160 | |
| Total liabilities included in balance sheet | | | | | | | | | | | | | | | | | | | | | | | | | | | | | | | 1,245 | |
Variations observed in the estimates of losses occurred in 2010 result mainly from atypical events, with gross amounts frequently higher than the average previously observed. However, as the percentages for reinsurance are high, the net analysis is not affected by this factor. In addition, in view of the high volatility inherent in the analysis of reinsurance gross data, particularly in all risks operations, the analysis of amounts net of reinsurance is recommended.
| f) | Liability adequacy test |
As established in IFRS 4 – “Insurance Contracts”, an insurance company must carry out the Liability Adequacy Test, comparing the amount recognized for its technical reserves with the current estimate of projected cash flow. The estimate should consider all cash flows related to the business, which is the minimum requirement for carrying out the adequacy test.
The assumptions used in the test were as follows:
| a) | The risk grouping criteria are based in compliance with the legislation force. |
| b) | The relevant structure of risk-free interest rate was obtained from the curve of securities deemed to be credit risk free, available in the Brazilian financial market and determined pursuant to an internal policy. |
| c) | The methodology for testing all products is based on the projection of cash flows. Specifically for insurance products, cash flows were projected using the method known as chain-ladder triangle of quarterly frequency. |
| d) | Cancellations, partial redemptions, future contributions, conversions into annuity income and administrative expenses are periodically reviewed pursuant to the best practices and analysis of the experience in the subsidiaries. Accordingly, they represent the current best estimates for projections. |
| e) | Mortality: biometric tables broken down by gender, adjusted according to life expectancy development (improvement). |
The liability adequacy test did not show insufficiency in any of presented year-ends.
| g) | Insurance risk – effect of changes on actuarial assumptions |
Property insurance is a short-lived insurance and the main actuarial assumptions involved in the management and pricing of the associated risks are claims frequency and severity. Volatility above the expected number of claims and amount of claim indemnities may result in unexpected losses.
Life insurance and pension plans are, in general, short- or long-lived products and the main risks involved in the business may be classified as biometric risk, financial risk and behavioral risk.
Biometric risk relates to: i) more than expected increase in life expectancies for products with survivorship coverage (mostly pension plans); ii) more than expected decrease in mortality rates for products with survivorship coverage (mostly life insurance.)
Products offering financial guarantee predetermined under contract involve financial risk inherent to the underwriting risk, with such risk being considered insurance risk.
Behavioral risk relates to a more than expected increase in the rates of conversion into annuity income, resulting in increased payments of retirement benefits.
The estimated actuarial assumptions are based on the historical evaluation of ITAÚ UNIBANCO HOLDING, market benchmarks and the experience of the actuaries.
Sensitivity analyses were carried out with the amounts of current estimates based on variations of the main actuarial assumptions. The results of LAT (liability adequacy test) sensitivity analysis were as follows:
| | | Impact on the result of LAT |
| Sensitivity analysis | | Gross of reinsurance | | Net of reinsurance |
| | | | | |
| 5% increase in mortality rates | | Without insufficiency | | Without insufficiency |
| 5% decrease in mortality rates | | Without insufficiency | | Without insufficiency |
| | | | | |
| 10bp increase in risk-free interest rates | | Without insufficiency | | Without insufficiency |
| 10bp decrease in risk-free interest rates | | Without insufficiency | | Without insufficiency |
| | | | | |
| 5% increase in conversion in income rates | | Without insufficiency | | Without insufficiency |
| 5% decrease in conversion in income rates | | Without insufficiency | | Without insufficiency |
| | | | | |
| 5% increase in claims | | Without insufficiency | | Without insufficiency |
| 5% decrease in claims | | Without insufficiency | | Without insufficiency |
| h) | Risks of insurance and private pension |
ITAÚ UNIBANCO HOLDING has specific committees to define the management of funds from technical reserves for insurance and private pension, issue guidelines for managing these funds with the objective of achieving long-term return and develop evaluation models, risk limits and strategies on allocation of funds to defined financial assets. Such committees are comprised not only of executives and those directly responsible for the business management process, but also of an equal number of professionals that head up or coordinate the commercial and financial areas.
Large risks products are distributed by brokers. In the case of the extended warranty product, this is marketed by the retail company that sells the product to the consumer. The DPVAT production results from the participation that the insurance companies of ITAÚ UNIBANCO HOLDING have in the Leading Insurance Company of the DPVAT consortium.
There is no product concentration in relation to insurance premiums, reducing the concentration risk of products and distribution channels. For large risks products, the strategy of lower retention is adopted, in accordance with certain lines shown below:
| | | 12/31/2011 | | | 12/31/2010 | |
| | | Insurance
premiums | | | Retained
premium | | | Retention (%) | | | Insurance
premiums | | | Retained
premium | | | Retention (%) | |
| | | | | | | | | | | | | | | | | | | |
| PROPERTY AND CASUALTY | | | | | | | | | | | | | | | | | | | | | | | | |
| Extended warranty | | | 1,365 | | | | 1,365 | | | | 100.0 | | | | 1,158 | | | | 1,158 | | | | 100.0 | |
| Credit life | | | 461 | | | | 461 | | | | 100.0 | | | | 424 | | | | 423 | | | | 99.8 | |
| Mandatory personal injury caused by motor vehicle (DPVAT) | | | 308 | | | | 308 | | | | 100.0 | | | | 284 | | | | 284 | | | | 100.0 | |
| Multiple risks | | | 207 | | | | 171 | | | | 82.6 | | | | 238 | | | | 204 | | | | 85.7 | |
| | | | | | | | | | | | | | | | | | | | | | | | | |
| INDIVIDUALS | | | | | | | | | | | | | | | | | | | | | | | | |
| Group life | | | 1,165 | | | | 1,141 | | | | 97.9 | | | | 1,150 | | | | 1,141 | | | | 99.2 | |
| Group accident insurance | | | 661 | | | | 660 | | | | 99.8 | | | | 625 | | | | 625 | | | | 100.0 | |
| Individual accident | | | 109 | | | | 108 | | | | 99.1 | | | | 118 | | | | 117 | | | | 99.2 | |
| Individual life | | | 20 | | | | 19 | | | | 95.0 | | | | 23 | | | | 22 | | | | 95.7 | |
| | | | | | | | | | | | | | | | | | | | | | | | | |
| LARGE RISKS | | | | | | | | | | | | | | | | | | | | | | | | |
| Specified and operational risks | | | 480 | | | | 96 | | | | 20.0 | | | | 360 | | | | 151 | | | | 41.9 | |
| Petroleum risks | | | 257 | | | | 37 | | | | 14.4 | | | | 61 | | | | 18 | | | | 29.5 | |
| Engeneering | | | 72 | | | | 8 | | | | 11.1 | | | | 88 | | | | 14 | | | | 15.9 | |
| Aeronautical | | | 49 | | | | - | | | | - | | | | 56 | | | | 9 | | | | 16.1 | |
| i) | Underwriting risk management structure |
| · | Centralized control over underwriting risk |
The control of risk the insurance company is centralized by the independent executive area responsible for risk control, while the management of risk is the responsibility of the business units exposed to underwriting risk and the risk management area of ITAÚ UNIBANCO HOLDING insurance subsidiaries.
| · | Decentralized management of underwriting risk |
The underwriting risk management is the responsibility of the business area coordinated by the risk management area of ITAÚ UNIBANCO HOLDING insurance subsidiaries with the participation of the institutional actuarial area and product units and managers. These units, in their daily operations, accept risks based on the profitability of their businesses.
| j) | Duties and responsibilities |
| I- | Independent executive area responsible for risk control |
This area has the following attributes:
| · | Validation and control of underwriting risk models. |
| · | Control and evaluation of changes in the policies of insurance and private pension. |
| · | Monitoring the performance of the insurance and private pension portfolios. |
| · | Construction of underwriting risk models. |
| · | Risk assessment of insurance and private pension products when created and on an ongoing basis. |
| �� | Establishment and publication of the underwriting risk management structure. |
| · | Adoption of remuneration policies that discourage behaviors incompatible with a risk level considered prudent in the policies and long-term strategies established by ITAÚ UNIBANCO HOLDING. |
| II- | Executive area responsible for operational and efficiency risk |
| · | Devise methods for identifying, assessing, monitoring, controlling and mitigating operational risk. |
| · | Report, on a timely basis, operational risks events to the independent executive area responsible for risk control. |
| · | Respond to requests from the Central Bank of Brazil, and other Brazilian regulatory authorities related to operational risk management, as well as monitor the adherence of business units and control areas the ITAÚ UNIBANCO HOLDING under the coordination of the legal compliance area to the regulation of the legal oversight authorities. |
| III- | Business units exposed to underwriting risk |
| · | Set out and/or adjust products to the requirements of the independent executive area responsible for risk control and the risk management area of ITAÚ UNIBANCO HOLDING insurance subsidiaries. |
| · | Respond to requests of the independent executive area responsible for risk control, preparing or providing databases and information for preparation of managerial reports or specific studies, when available. |
| · | Guarantee the quality of the information used in probability of loss models and claim losses. |
| · | Guarantee an appropriate level of knowledge about the concepts of risks for their identification and classification, ensuring the proper understanding for modeling by the independent executive area responsible for risk control and the risk management area of the insurance company. |
IV - Reinsurance area
| · | Formulate policies on access to reinsurance markets, regulating the underwriting operations aligned with the underwriting credit rating by the independent executive area responsible for risk control and the risk management area of ITAÚ UNIBANCO HOLDING insurance subsidiaries. |
| · | Guarantee an appropriate level of knowledge about the concepts of risks for their identification and classification, ensuring the proper understanding for modeling by the independent executive area responsible for risk control and the risk management area of ITAÚ UNIBANCO HOLDING insurance subsidiaries. |
| · | Submit the managerial reports to the Independent executive area responsible for risk control and the risk management area of ITAÚ UNIBANCO HOLDING insurance subsidiaries. |
| · | Guarantee the update, reach, scope, accuracy and timeliness of information on reinsurance. |
| V- | Risk management area of ITAÚ UNIBANCO HOLDING insurance subsidiaries |
| · | Formulate policies and underwriting procedures that address the entire underwriting cycle. |
| · | Develop strategic indicators, informing about possible gaps to higher levels. |
| · | Submit managerial reports to the independent executive area responsible for risk control. |
| · | Guarantee an appropriate level of knowledge about the concepts of risks for their identification and classification, ensuring the proper understanding and modeling by the independent executive area responsible for risk control. |
| · | Monitor the risks incurred by business units exposed to underwriting risk. |
| · | Report with quality and speed the required information under its responsibility to the Brazilian regulatory authorities. |
| · | Construct and improve models of Provisions and Reserves and submit them duly documented to the independent executive area responsible for risk control and the risk management area of ITAÚ UNIBANCO HOLDING insurance subsidiaries. |
| · | Submit managerial reports to the independent executive area responsible for risk control. |
| · | Guarantee the reach, scope, accuracy and timeliness of information related to operations for which the accounting reconciliation was properly carried out. |
| · | Guarantee an appropriate level of knowledge about the concepts of risks for their identification and classification, ensuring the proper understanding and modeling by the independent executive area responsible for risk control. |
VII- Internal controls area
| · | Check, on a regular basis, the adequacy of the internal controls system. |
| · | Conduct periodic reviews of the risk process of Insurance operations to ensure completeness, accuracy and reasonableness. |
VIII- Internal audit
Carry out independent and periodic checks as to the effectiveness of the risk control process of insurance and private pension operations, according to the guidelines of the Audit Committee.
Insurance and private pension managers work together with the investment manager to ensure that assets backing long-term products, with guaranteed minimum returns are managed according to the characteristics of the liabilities aiming at actuarial balance and long-term solvency.
A detailed mapping of the liabilities of long-term products that result in payment flows of projected future benefits is performed annually. This mapping is carried out in accordance with actuarial assumptions.
The investment manager, having this information, uses Asset Liability Management models to determine the best asset portfolio composition that enables the mitigation of risks entailed in this type of product, considering its long-term economic and financial feasibility. The portfolio of backing assets is periodically balanced based on fluctuations in market prices of assets, liquidity needs, and changes in the characteristics of liabilities.
| k) | Market, credit and liquidity risk |
Market risk
Market risk is the possibility of incurring losses due to fluctuations in the market values of positions held by a financial institution, including risks of transactions subject to variations in foreign exchange and interest rates, share values and commodity prices.
The market risk limits are structured in accordance with the guidelines established by the Superior Risk Committee (CSRisc), by evaluating the projected results, the amount of stockholders’ equity and the risk profile of each legal entity, and are defined within risk metrics used by management.
The market risk is controlled by an area independent from the business areas, which is responsible for daily assessment and also reporting activities.
Market risk is analyzed based on the following metrics:
| · | Statistical Value at Risk (VaR - Value at Risk): statistical metric that estimates the expected maximum potential economic loss under normal market conditions, taking into consideration a defined time horizon and confidence level (Note 35). |
| · | Losses in Stress Scenarios (Stress Test): simulation technique to assess the behavior of assets and liabilities of a portfolio when various risk factors are subject to extreme market situations (based on prospective scenarios) in the portfolio. |
| · | Sensitivity (DV01): in relation to insurance operations, the impact on the cash flows market value when submitted to an one annual basis point increase in the current interest rates. |
| | | 12/31/2011 | | | 12/31/2010 | |
| Class | | Account balance | | | DV01 | | | Account balance | | | DV01 | |
| Government securities | | | | | | | | | | | | | | | | |
| NTN-C | | | 2,766 | | | | (2.7 | ) | | | 2,648 | | | | (2.8 | ) |
| NTN-B | | | 1,400 | | | | (1.3 | ) | | | 667 | | | | (1.0 | ) |
| NTN-F | | | 28 | | | | - | | | | 57 | | | | - | |
| | | | | | | | | | | | | | | | | |
| Private securities | | | | | | | | | | | | | | | | |
| Indexed to IGPM | | | 141 | | | | - | | | | 137 | | | | - | |
| Indexed to IPCA | | | 224 | | | | (0.2 | ) | | | 122 | | | | (0.1 | ) |
| Indexed to PRE | | | 93 | | | | - | | | | - | | | | - | |
| | | | | | | | | | | | | | | | | |
| Floating assets | | | 5,607 | | | | - | | | | 5,013 | | | | - | |
| | | | | | | | | | | | | | | | | |
| Under agreements to resell - over | | | 6,433 | | | | - | | | | 4,408 | | | | - | |
| | | | | | | | | | | | | | | | | |
| Total | | | 16,692 | | | | (4.20 | ) | | | 13,052 | | | | (3.90 | ) |
The column DV01 is the impact for a movement of + 0.01% (BPS) in the index rate. In this case, as they are asset positions, the positive impact on the rate contributes negatively for income.
Liquidity risk
Liquidity risk is the risk that ITAÚ UNIBANCO HOLDING may have insufficient net funds available to honor its current obligations at a given moment. The liquidity risk is managed continuously based on the monitoring of payment flows related to its liabilities vis a vis the inflows generated by its operations and financial assets portfolio. Additionally, according to the principles of prudence and conservative accounting, ITAÚ UNIBANCO HOLDING has funds invested in short-term assets, available on demand, to cover its regular needs and any liquidity contingencies.
| Liabilities | | 12/31/2011 | | | 12/31/2010 | | | Assets | | 12/31/2011 | | | 12/31/2010 | |
| Technical provision | | Amount | | | DU (*) | | | Amount | | | DU (*) | | | Backing asset | | Amount | | | DU (*) | | | Amount | | | DU (*) | |
| PPNG, PPNG-RVNE, PCP and OPT (1) | | | 1,690 | | | | 12 | | | | 1,232 | | | | 13 | | | LFT, Repurchase Agreements, NTN-B, CDB, LF and Debentures | | | 1,690 | | | | 7 | | | | 1,232 | | | | 5 | |
| Reserve for premium deficiency | | | 233 | | | | 187 | | | | 199 | | | | 172 | | | LFT, Repurchase Agreements, NTN-B, CDB, LF and Debentures | | | 233 | | | | 7 | | | | 199 | | | | 4 | |
| IBNR and Provision for unsettled claims (2) | | | 1,401 | | | | 19 | | | | 1,077 | | | | 20 | | | LFT, Repurchase Agreements, NTN-B, CDB, LF and Debentures | | | 1,401 | | | | 7 | | | | 1,077 | | | | 5 | |
| Other Reserves | | | 303 | | | | - | | | | 299 | | | | - | | | LFT, Repurchase Agreements, NTN-B, CDB and Debentures | | | 303 | | | | - | | | | 299 | | | | - | |
| Subtotal | | | 3,627 | | | | | | | | 2,807 | | | | | | | Subtotal | | | 3,627 | | | | | | | | 2,807 | | | | | |
| Reserves | | | | | | | | | | | | | | | | | | | | | | | | | | | | | | | | | | |
| Administrative expenses | | | 43 | | | | 125 | | | | 32 | | | | 128 | | | LFT, Repurchase Agreements, NTN-B, CDB, LF and Debentures | | | 43 | | | | 7 | | | | 32 | | | | 3 | |
| Mathematical reserve for benefits granted | | | 977 | | | | 126 | | | | 860 | | | | 128 | | | LFT, Repurchase Agreements, LTN, LTN-B, NTN-C, NTN-F, CDB, LF and Debentures | | | 977 | | | | 124 | | | | 860 | | | | 130 | |
| Mathematical reserve for benefits to be granted – PGBL/ VGBL | | | 57,626 | | | | 109 | | | | 46,037 | | | | 116 | | | LFT, Repurchase Agreements, LTN, LTN-B, NTN-C, NTN-F, CDB, LF and Debentures (3) | | | 57,626 | | | | 8 | | | | 46,037 | | | | 5 | |
| Mathematical reserve for benefits to be granted – Traditional | | | 3,365 | | | | 116 | | | | 3,205 | | | | 109 | | | LFT, Repurchase Agreements, NTN-B, NTN-C and Debentures | | | 3,365 | | | | 109 | | | | 3,205 | | | | 101 | |
| Insufficient contribution | | | 692 | | | | 109 | | | | 603 | | | | 109 | | | LFT, Repurchase Agreements, NTN-B, CDB, LF and Debentures | | | 692 | | | | 109 | | | | 603 | | | | 101 | |
| Financial surplus | | | 477 | | | | 109 | | | | 461 | | | | 109 | | | LFT, Repurchase Agreements, NTN-B, CDB, LF and Debentures | | | 477 | | | | 109 | | | | 461 | | | | 101 | |
| Subtotal | | | 63,180 | | | | | | | | 51,198 | | | | | | | Subtotal | | | 63,180 | | | | | | | | 51,198 | | | | | |
| Total technical reserves | | | 66,807 | | | | | | | | 54,005 | | | | | | | Total backing assets | | | 66,807 | | | | | | | | 54,005 | | | | | |
(*) DU – Duration in months.
(1) Net Amount of Credit Right.
(2) Net of escrow deposits and reserves retained IRB.
(3) Excluding PGBL/VGBL reserves allocated in variable income.
Credit risk
For reinsurance operations, the internal policy prohibits excess concentration in only one reinsurer. At present the reinsurer with the largest share of our operations represents less than 37.22% of the total. In addition, we follow the SUSEP rules about reinsurers with which we operate, mainly with respect to “solvency rating, issued by a rating agency”, with the following minimum levels:
| Rating agency | | Minimum required level |
| Standard & Poor's | | BBB- |
| Fitch | | BBB- |
| Moody´s | | Baa3 |
| AM Best | | B+ |
Expenses and revenue from reinsurance premiums transferred are recognized on accrual basis, with no offset of assets and liabilities related to reinsurance except if there is a contractual provision for the offset of accounts between the parties. Analyses of reinsurance required are made to meet the current needs of ITAÚ UNIBANCO HOLDING, maintaining the necessary flexibility to comply with changes in management strategy in response to the various scenarios to which it may be exposed.
With the approval of Supplementary Law No. 126 of January 15, 2007, the reinsurance market was opened up to competition with the creation of three categories of companies authorized to operate in Brazil: local, admitted and occasional (the two latter being foreign reinsurance companies respectively with, or without, a representative office in Brazil). The transition to the new market was made progressively, maintaining the right of local reinsurance companies to 60% of premiums transferred insurance companies until January 2010; after that period, this percentage may be reduced to 40%. From March 31, 2011, this percentage of 40% must obligatorily be transferred to local reinsurance companies.
Reinsurance assets
Reinsurance assets represent the estimated amounts recoverable from reinsurers in connection with losses incurred. Such assets are recorded based on risk assignment contracts, and for cases of losses effectively paid, they are reassessed after 365 days as to the possibility of impairment, in case of doubts, such assets are reduced by recognizing an allowance for losses on reinsurance.
Reinsurance transferred
ITAÚ UNIBANCO HOLDING transfers, in the normal course of its businesses, reinsurance premiums to cover losses on underwriting risks to its policyholders and is in compliance with the operational limits established by the regulatory authority. In addition to proportional contracts, non-proportional contracts are also entered into in order to transfer a portion of the responsibility to the reinsurance company for losses that exceed a certain level of losses in the portfolio. Non-proportional reinsurance premiums are included in “other assets - prepaid expenses” and amortized to “other operating expenses” over the effectiveness period of the contract on a daily accrual basis.
I – Changes in balances of transactions with reinsurance companies
| | | Credits | | | Debits | |
| | | 12/31/2011 | | | 12/31/2010 | | | 12/31/2011 | | | 12/31/2010 | |
| Opening balance | | | 176 | | | | 253 | | | | 106 | | | | 302 | |
| Issued contracts | | | - | | | | - | | | | 926 | | | | 561 | |
| Recovered claims | | | 52 | | | | 29 | | | | - | | | | - | |
| Prepayments/Payments to Reinsurer | | | 32 | | | | (82 | ) | | | (751 | ) | | | (754 | ) |
| Monetary adjustment and interest of claims | | | - | | | | - | | | | 32 | | | | (3 | ) |
| Other increase/ reversal | | | (46 | ) | | | (24 | ) | | | - | | | | - | |
| Closing balance | | | 214 | | | | 176 | | | | 313 | | | | 106 | |
II – Balances of reserves with reinsurance assets
| | | 12/31/2011 | | | 12/31/2010 | | | 1/1/2010 | |
| Reinsurance claims | | | 1,394 | | | | 1,185 | | | | 886 | |
| Reinsurance premiums | | | 535 | | | | 404 | | | | 529 | |
| Reinsurance commission | | | (58 | ) | | | (59 | ) | | | (59 | ) |
| Closing balance | | | 1,871 | | | | 1,530 | | | | 1,356 | |
III – Changes in balances of reserves for reinsurance claims
| | | 12/31/2011 | | | 12/31/2010 | |
| Opening balance | | | 1,185 | | | | 886 | |
| Reported claims | | | 615 | | | | 713 | |
| Paid claims | | | (101 | ) | | | (390 | ) |
| Other increase/ reversal | | | (305 | ) | | | (24 | ) |
| Closing balance | | | 1,394 | | | | 1,185 | |
IV - Changes in balances of reserves for reinsurance premiums
| | | 12/31/2011 | | | 12/31/2010 | |
| Opening balance | | | 404 | | | | 529 | |
| Receipts | | | 814 | | | | 614 | |
| Payments | | | (683 | ) | | | (739 | ) |
| Closing balance | | | 535 | | | | 404 | |
V - Changes in balances of reserves for reinsurance commission
| | | 12/31/2011 | | | 12/31/2010 | |
| Opening balance | | | (59 | ) | | | (59 | ) |
| Receipts | | | (50 | ) | | | (54 | ) |
| Payments | | | 51 | | | | 54 | |
| Closing balance | | | (58 | ) | | | (59 | ) |
Insurance and private pension operations are regulated by the National Council of Private Insurance (CNSP) and the Superintendency of Private Insurance (SUSEP). These authorities are responsible for regulating the market, and consequently for assisting in the mitigation of risks inherent in the business.
The National Council of Private Insurance (CNSP) is the regulatory authority of insurance activities in Brazil, created by Decree-Law No. 73, of November 21, 1966. The main attribution of CNSP, at the time of its creation, was to set out the guidelines and rules of government policy on private insurance segments, and with the enactment of Law No. 6,435, of July 15, 1977 (revoked by Supplementary Law No. 109/01), its attributions included private pension of public companies.
The Superintendency of Private Insurance (SUSEP) is the authority responsible for controlling and overseeing the insurance, private pension and reinsurance markets. An agency of the Ministry of Finance, it was created by Decree-Law No. 73, of November 21, 1966, which also created the National System of Private Insurance, comprising the National Council of Private Insurance (CNSP), IRB Brasil Resseguros S.A. (IRB Brasil), the companies authorized to have private pension plans and the open-ended private pension companies.
| n) | Capital requirements for insurance activity |
The National Council of Private Insurance (CNSP), following the worldwide trend towards the strengthening of the insurance market, disclosed on December 6, 2010, CNSP Resolution No. 227 (which revoked Resolutions Nos. 178 of December 28, 2007 and 200 of December 16, 2008), and Circular No. 411 of December 22, 2010. These documents define the rules on the regulatory capital required for authorization and operation of insurance and private pension companies, and rules for the allocation of capital to underwriting risk for the various insurance lines. In January 2011, CNSP Resolution No. 228 of December 6, 2010, which provides for the criteria for establishment of additional capital based on the credit risk of the supervised companies, came into effect.
The adjusted stockholders’ equity of ITAÚ UNIBANCO HOLDING companies exclusively engaged in insurance and private pension activities is higher than the required regulatory capital in Itaú Seguros S.A., R$ 2,049 (R$ 1,436 at 12/31/2010, R$ 898 at 01/01/2010) and in Itaú Vida e Previdência S.A., R$ 1,565 (R$ 1,199 at 12/31/2010, R$ 733 at 01/01/2010).
NOTE 30 – FAIR VALUE OF FINANCIAL INSTRUMENTS
In cases where market prices are not available, fair values are based on estimates using discounted cash flows or other valuation techniques. These techniques are significantly affected by the assumptions adopted, including the discount rate and estimate of future cash flows. The estimated fair value achieved through these techniques cannot be substantiated by comparison with independent markets and, in many cases, it cannot be realized in the immediate settlement of the instrument.
The following table summarizes the carrying and estimated fair values for financial instruments:
| | | 12/31/2011 | | | 12/31/2010 | | | 1/1/2010 | |
| | | Carrying value | | | Estimated
fair value | | | Carrying value | | | Estimated
fair value | | | Carrying value | | | Estimated
fair value | |
| Financial assets | | | | | | | | | | | | | | | | | | | | | | | | |
| Cash and deposits on demand and Central Bank compulsory deposits | | | 108,721 | | | | 108,721 | | | | 95,948 | | | | 95,948 | | | | 24,540 | | | | 24,540 | |
| Interbank deposits | | | 27,821 | | | | 27,849 | | | | 14,835 | | | | 14,842 | | | | 17,799 | | | | 17,806 | |
| Securities purchased under agreements to resell | | | 92,248 | | | | 92,248 | | | | 88,682 | | | | 88,682 | | | | 135,820 | | | | 135,820 | |
| Financial assets held for trading (*) | | | 121,889 | | | | 121,889 | | | | 115,497 | | | | 115,497 | | | | 55,552 | | | | 55,552 | |
| Financial assets designated at fair value through profit or loss (*) | | | 186 | | | | 186 | | | | 306 | | | | 306 | | | | 373 | | | | 373 | |
| Derivatives (*) | | | 8,754 | | | | 8,754 | | | | 7,777 | | | | 7,777 | | | | 5,589 | | | | 5,589 | |
| Available-for-sale financial assets (*) | | | 47,510 | | | | 47,510 | | | | 44,539 | | | | 44,539 | | | | 41,302 | | | | 41,302 | |
| Held-to-maturity financial assets | | | 3,105 | | | | 3,713 | | | | 3,170 | | | | 3,787 | | | | 2,429 | | | | 2,792 | |
| Loan operations and lease operations | | | 322,391 | | | | 323,021 | | | | 274,843 | | | | 275,684 | | | | 224,168 | | | | 225,009 | |
| Other financial assets | | | 40,254 | | | | 40,254 | | | | 40,945 | | | | 40,945 | | | | 26,931 | | | | 26,931 | |
| Financial liabilities | | | | | | | | | | | | | | | | | | | | | | | | |
| Deposits | | | 242,636 | | | | 242,554 | | | | 202,688 | | | | 202,607 | | | | 190,716 | | | | 190,636 | |
| Securities sold under repurchase agreements | | | 185,413 | | | | 185,413 | | | | 199,657 | | | | 199,657 | | | | 131,945 | | | | 131,945 | |
| Financial liabilities held for trading (*) | | | 2,815 | | | | 2,815 | | | | 1,335 | | | | 1,335 | | | | 663 | | | | 663 | |
| Derivatives (*) | | | 6,747 | | | | 6,747 | | | | 5,671 | | | | 5,671 | | | | 5,332 | | | | 5,332 | |
| Interbank market debt | | | 90,498 | | | | 90,350 | | | | 62,599 | | | | 62,542 | | | | 44,675 | | | | 43,398 | |
| Institutional market debt | | | 54,807 | | | | 54,681 | | | | 44,513 | | | | 44,419 | | | | 30,530 | | | | 31,702 | |
| Liabilities for capitalization plans | | | 2,838 | | | | 2,838 | | | | 2,603 | | | | 2,603 | | | | 2,261 | | | | 2,261 | |
| Other financial liabilities. | | | 44,119 | | | | 44,119 | | | | 41,012 | | | | 41,012 | | | | 26,825 | | | | 26,825 | |
(*) These assets and liabilities are recorded in the balance sheet at their fair value.
Financial instruments not included in the Balance Sheet (Note 35) are represented by Standby Letters of Credit and Guarantees Provided, which amount recorded in memorandum account totals R$ 51,530(R$38,374 at December 31, 2010 and R$32,431 at January 1, 2010) and estimated fair value of R$ 695(R$537at December 31, 2010 and R$417 at January 1, 2010).
The methods and assumptions adopted to estimate the fair value are defined below:
| a) | Cash and Deposits on Demand, Central Bank Compulsory Deposits, Securities Purchased under Agreements to Resell and Other Financial Assets- the carrying amounts for these instruments approximate their fair values. |
| b) | Interbank Deposits– ITAÚ UNIBANCO HOLDING estimates the fair values of interbank investments by discounting the estimated cash flows and adopting the market interest rates. |
| c) | Financial Assets Held for Trading, including Derivatives (Assets and Liabilities), Financial Assets designated at Fair Value through Profit or Loss, Available-for-sale Financial Assets and Held-to-Maturity Financial Assets– under normal conditions, market prices are the best indicators of the fair values of financial instruments. However, not all instruments have liquidity or quoted market prices and, in such cases, the adoption of present value estimates and other pricing techniques are required. The fair values of government securities are determined based on the interest rates provided by third parties in the market and they are validated by comparing them with the information disclosed by ANDIMA. The fair values of corporate debt securities are computed by adopting criteria similar to those applied to interbank deposits, as described above. The fair value of shares are computed based on their prices quoted in the market. The fair values of derivative financial instruments were determined as follows: |
| · | Swaps: the cash flows are discounted to present value based on yield curves that reflect the appropriate risk factors. These yield curves may be drawn mainly based on the exchange price of derivatives at BM&F, of Brazilian government securities in the secondary market or derivatives and securities traded abroad. These yield curves may be used to obtain the fair value of currency swaps, interest rate swaps and swaps based on other risk factors (commodities, stock exchange indices, etc.) |
| · | Futures and forwards quoted market prices on exchanges or criteria identical to those applied to swaps; |
| · | Options: The fair values are determined based on mathematical models (such as Black & Scholes) that are fed with implicit volatility data, interest rate yield curve and fair value of the underlying asset. Current market prices of options are used to compute the implicit volatilities. All these data are obtained from different sources (usually Bloomberg). |
| · | Credit Risk: inversely related to the probability of default (allowance for loan losses) in a financial instrument subject to credit risk. The process of adjusting the market price of these spreads is based on the differences between the yield curves with no risk and the yield curves adjusted for credit risk. |
| d) | Loan operations and lease operations– the fair value is estimated based on groups of loans with similar financial and risk characteristics, using valuation models. The fair value of fixed-rate loans was determined by discounting estimated cash flows, applying interest rates close to ITAÚ UNIBANCO HOLDING current rates for similar loans. For the majority of loans at floating rate, the carrying amount was considered close to their fair value. The fair value of loan and lease operations not overdue was calculated by discounting the expected payments of principal and interest through maturity, at the aforementioned rates. The fair value of overdue loan and lease transactions was based on the discount of estimated cash flows, using a rate proportional to the risk associated with the estimated cash flows, or on the underlying collateral. The assumptions related to cash flows and discount rates are determined using information available in the market and the borrower’s specific information of the debtor. |
| e) | Interest-bearing and non-interest bearing financial liabilities which include: Deposits, Securities Sold under Repurchase Agreements, Financial Liabilities Held for Trading, Interbank and Institutional Market Debt, Liabilities for Capitalization Plans and Other Financial Liabilities |
And for:
| · | Non-interest bearing deposits- the fair value of demand deposits is equal to the carrying amount. |
| · | Interest-bearing financial liabilities– the fair value of time deposits with a floating rate approximates their carrying amount. The fair value of time deposits at fixed rate was estimated using discounted cash flow, with the adoption of the interest rate offered by ITAÚ UNIBANCO HOLDING on the respective balance sheet date. The carrying amount of deposits received under securities repurchase agreements, commercial lines and other short-term loan liabilities are close to the fair value of such instruments. The fair value of other long-term liabilities is estimated using cash flows discounted at the interest rates offered in the market for similar instruments. These interest rates are obtained from different sources (usually Bloomberg), from which the risk-free yield curve and the risk-free spread traded for similar instruments are derived. |
| f) | Off-balance sheet financial instruments– the fair value of commitments to grant credit was estimated based on the rates currently charged for similar agreements, considering the remaining term of the agreement and the credit quality of the counterparties. The fair value of standby letters of credit, commercial letters and guarantees was based on commissions currently charged for similar agreements or at the cost estimated to settle the agreements, or otherwise settle the obligations with the counterparties. The fair value of derivatives includes financial assets/liabilities at fair value through profit or loss or in other liabilities, as described in Note 2.4.g and presented in Note 7. See Notes 7 and 30 for the notional amount and estimated fair value of our derivative financial instruments. |
In accordance with IFRS ITAÚ UNIBANCO HOLDING classifies fair value measurements in a fair value hierarchy that reflects the significance of inputs adopted in the measurement process.
Level 1: Observable inputs that reflect quoted prices (unadjusted) for identical assets or liabilities in active markets. An active market is a market in which transactions for the asset or liability being measured occur often enough and with sufficient volume to provide pricing information on an ongoing basis.
Level 2: Inputs other than quoted prices included in Level 1 that are observable for the asset or liability either directly or indirectly. Level 2 generally includes: (i) quoted prices for similar assets or liabilities in active markets; (ii) quoted prices for identical or similar assets or liabilities in markets that are not active, that is, markets in which there are few transactions for the asset or liability, the prices are not current, or quoted price vary substantially either over time or among market makers, or in which little information is released publicly; (iii) inputs other than quoted prices that are observable for the asset or liability (for example, interest rates and yield curves observable at commonly quoted intervals, volatilities, etc.); (iv) inputs that are mainly derived from or corroborated by observable market data through correlation or by other means.
Level 3: Inputs are unobservable for the asset or liability. Unobservable information shall be used to measure fair value to the extent that observable information is not available, thus allowing for situations in which there is little, if any, market activity for the asset or liability at the measurement date.
Financial Assets Held for Trading, Available for Sale, and Designated at Fair Value through Profit or Loss:
Level 1: highly-liquid securities with prices available in an active market are classified into Level 1 of the fair value hierarchy. This classification level includes most of the Brazilian Government Securities (mainly LTN, LFT, NTN-B, NTN-C and NTN-F), securities of foreign governments, shares and debentures traded on stock exchanges and other securities traded in an active market.
Level 2: when the pricing information is not available for a specific security, the assessment is usually based on prices quoted in the market for similar instruments, pricing information obtained for pricing services, such as Bloomberg, Reuters and brokers (only when the prices represent actual transactions) or discounted cash flows, which use information for assets actively traded in an active market. These securities are classified into Level 2 of the fair value hierarchy and are comprised of certain Brazilian government securities, debentures and some government securities quoted in a less-liquid market in relation to those classified into Level 1, and some share prices in investment funds. ITAÚ UNIBANCO HOLDING does not hold positions in alternative investment funds or private equity funds.
Level 3: when no pricing information in an active market, ITAÚ UNIBANCO HOLDING uses internally developed models, from curves generated according to the proprietary model. Level 3 classification includes some Brazilian government securities (mainly NTN-I, NTN-A1, CRIs and TDA falling due after 2025, and CVS), promissory notes and securities that are not usually traded in an active market.
Derivatives:
Level 1: derivatives traded on stock exchanges are classified in Level 1 of the hierarchy.
Level 2: for derivatives not traded on stock exchanges, ITAÚ UNIBANCO HOLDING estimates the fair value by adopting a variety of techniques, such as Black & Scholes, Garman & Kohlhagen, Monte Carlo or even the discounted cash flow models usually adopted in the financial market. Derivatives included in Level 2 are credit default swaps, cross currency swaps, interest rates swaps, plain vanilla options, certain forwards and generally all swaps. All models adopted by ITAÚ UNIBANCO HOLDING are widely accepted in the financial services industry and reflect all derivative contractual terms. Considering that many of these models do not require a high level of subjectivity, since the methodologies adopted in the models do not require major decisions and information for the model are readily observed in the actively quotation markets, these products were classified in Level 2 of the measurement hierarchy.
Level 3: the derivatives with fair values based on non-observable information in an active market were classified into Level 3 of the fair value hierarchy, and are comprised of non-standard options, certain swaps indexed to non-observable information, and swaps with other products, such as swap with option and USD Check, credit derivatives and futures of certain commodities. These operations have their pricing derived from a range of volatility using the basis of historical volatility.
All aforementioned valuation methodologies may result in a fair value that may not be an indicative of the net realizable value or future fair values. However, ITAÚ UNIBANCO HOLDING believes that all methodologies used are appropriate and consistent with other market participants. However, the adoption of other methodologies or different those used by to estimate fair value may result in different fair value estimates at the balance sheet date.
Distribution by level
The following table presents the breakdown of risk levels at December 31, 2011, 2010 and January 1, 2010 for held for trading and available-for-sale financial assets.
| | | 12/31/2011 | | | 12/31/2010 | | | 1/1/2010 | |
| | | Level 1 | | | Level 2 | | | Level 3 | | | Total | | | Level 1 | | | Level 2 | | | Level 3 | | | Total | | | Level 1 | | | Level 2 | | | Level 3 | | | Total | |
| Financial assets held for trading | | | 100,041 | | | | 21,558 | | | | 290 | | | | 121,889 | | | | 100,445 | | | | 14,893 | | | | 159 | | | | 115,497 | | | | 40,665 | | | | 14,326 | | | | 561 | | | | 55,552 | |
| Investment funds | | | - | | | | 1,339 | | | | - | | | | 1,339 | | | | - | | | | 1,748 | | | | - | | | | 1,748 | | | | - | | | | 1,619 | | | | - | | | | 1,619 | |
| Brazilian government securities | | | 93,727 | | | | 187 | | | | - | | | | 93,914 | | | | 86,422 | | | | 277 | | | | - | | | | 86,699 | | | | 35,328 | | | | 807 | | | | - | | | | 36,135 | |
| Brazilian external debt bonds | | | 910 | | | | - | | | | - | | | | 910 | | | | 666 | | | | - | | | | - | | | | 666 | | | | 222 | | | | - | | | | - | | | | 222 | |
| Government securities – other countries | | | 722 | | | | 80 | | | | - | | | | 802 | | | | 9,036 | | | | 317 | | | | - | | | | 9,353 | | | | 936 | | | | 121 | | | | - | | | | 1,057 | |
| Argentina | | | 225 | | | | - | | | | - | | | | 225 | | | | 293 | | | | - | | | | - | | | | 293 | | | | 179 | | | | - | | | | - | | | | 179 | |
| United States | | | 292 | | | | - | | | | - | | | | 292 | | | | 8,714 | | | | - | | | | - | | | | 8,714 | | | | 747 | | | | - | | | | - | | | | 747 | |
| Mexico | | | 205 | | | | - | | | | - | | | | 205 | | | | 29 | | | | - | | | | - | | | | 29 | | | | 10 | | | | - | | | | - | | | | 10 | |
| Chile | | | - | | | | 50 | | | | - | | | | 50 | | | | - | | | | 248 | | | | - | | | | 248 | | | | - | | | | 77 | | | | - | | | | 77 | |
| Uruguay | | | - | | | | 27 | | | | - | | | | 27 | | | | - | | | | 24 | | | | - | | | | 24 | | | | - | | | | 30 | | | | - | | | | 30 | |
| Russia | | | - | | | | - | | | | - | | | | - | | | | - | | | | 45 | | | | - | | | | 45 | | | | - | | | | - | | | | - | | | | - | |
| Other | | | - | | | | 3 | | | | - | | | | 3 | | | | - | | | | - | | | | - | | | | - | | | | - | | | | 14 | | | | - | | | | 14 | |
| Corporate securities | | | 4,682 | | | | 19,952 | | | | 290 | | | | 24,924 | | | | 4,321 | | | | 12,551 | | | | 159 | | | | 17,031 | | | | 4,179 | | | | 11,779 | | | | 561 | | | | 16,519 | |
| Shares | | | 2,241 | | | | 56 | | | | - | | | | 2,297 | | | | 3,208 | | | | 40 | | | | - | | | | 3,248 | | | | 2,641 | | | | 69 | | | | - | | | | 2,710 | |
| Securitized real estate loans | | | - | | | | 24 | | | | - | | | | 24 | | | | - | | | | 439 | | | | 157 | | | | 596 | | | | - | | | | 35 | | | | - | | | | 35 | |
| Bank deposit certificates | | | - | | | | 7,820 | | | | - | | | | 7,820 | | | | - | | | | 8,932 | | | | - | | | | 8,932 | | | | - | | | | 9,490 | | | | - | | | | 9,490 | |
| Debentures | | | 2,434 | | | | 1,092 | | | | - | | | | 3,526 | | | | 1,112 | | | | 1,688 | | | | - | | | | 2,800 | | | | 1,536 | | | | 1,560 | | | | - | | | | 3,096 | |
| Eurobonds and others | | | 7 | | | | 1,424 | | | | - | | | | 1,431 | | | | - | | | | 1,452 | | | | - | | | | 1,452 | | | | 2 | | | | 625 | | | | - | | | | 627 | |
| Promissory notes | | | - | | | | - | | | | 290 | | | | 290 | | | | - | | | | - | | | | - | | | | - | | | | - | | | | - | | | | 561 | | | | 561 | |
| Financial credit bills | | | - | | | | 8,973 | | | | - | | | | 8,973 | | | | - | | | | - | | | | - | | | | - | | | | - | | | | - | | | | - | | | | - | |
| Other | | | - | | | | 563 | | | | - | | | | 563 | | | | 1 | | | | - | | | | 2 | | | | 3 | | | | - | | | | - | | | | - | | | | - | |
| Available-for-sale financial assets | | | 20,988 | | | | 24,926 | | | | 1,596 | | | | 47,510 | | | | 18,898 | | | | 23,994 | | | | 1,647 | | | | 44,539 | | | | 17,839 | | | | 21,374 | | | | 2,089 | | | | 41,302 | |
| Investment funds | | | - | | | | 806 | | | | - | | | | 806 | | | | - | | | | 770 | | | | - | | | | 770 | | | | - | | | | 1,273 | | | | - | | | | 1,273 | |
| Brazilian government securities | | | 12,120 | | | | 45 | | | | 259 | | | | 12,424 | | | | 9,753 | | | | 6 | | | | 320 | | | | 10,079 | | | | 13,370 | | | | 14 | | | | 334 | | | | 13,718 | |
| Brazilian external debt bonds | | | 5,906 | | | | - | | | | - | | | | 5,906 | | | | 4,720 | | | | - | | | | - | | | | 4,720 | | | | 1,980 | | | | - | | | | - | | | | 1,980 | |
| Government securities – other countries | | | 11 | | | | 4,306 | | | | - | | | | 4,317 | | | | 679 | | | | 3,880 | | | | - | | | | 4,559 | | | | 17 | | | | 7,224 | | | | - | | | | 7,241 | |
| United States | | | - | | | | - | | | | - | | | | - | | | | 679 | | | | - | | | | - | | | | 679 | | | | 17 | | | | - | | | | - | | | | 17 | |
| Austria | | | - | | | | - | | | | - | | | | - | | | | - | | | | - | | | | - | | | | - | | | | - | | | | 213 | | | | - | | | | 213 | |
| Denmark | | | - | | | | 1,949 | | | | - | | | | 1,949 | | | | - | | | | 2,016 | | | | - | | | | 2,016 | | | | - | | | | 1,971 | | | | - | | | | 1,971 | |
| Spain | | | - | | | | 418 | | | | - | | | | 418 | | | | - | | | | 734 | | | | - | | | | 734 | | | | - | | | | 1,093 | | | | - | | | | 1,093 | |
| Korea | | | - | | | | 295 | | | | - | | | | 295 | | | | - | | | | 236 | | | | - | | | | 236 | | | | - | | | | 1,755 | | | | - | | | | 1,755 | |
| Mexico | | | 11 | | | | - | | | | - | | | | 11 | | | | - | | | | - | | | | - | | | | - | | | | - | | | | - | | | | - | | | | - | |
| Chile | | | - | | | | 995 | | | | - | | | | 995 | | | | - | | | | 453 | | | | - | | | | 453 | | | | - | | | | 1,274 | | | | - | | | | 1,274 | |
| Paraguay | | | - | | | | 344 | | | | - | | | | 344 | | | | - | | | | 256 | | | | - | | | | 256 | | | | - | | | | 417 | | | | - | | | | 417 | |
| Portugal | | | - | | | | - | | | | - | | | | - | | | | - | | | | - | | | | - | | | | - | | | | - | | | | 26 | | | | - | | | | 26 | |
| Uruguay | | | - | | | | 268 | | | | - | | | | 268 | | | | - | | | | 185 | | | | - | | | | 185 | | | | - | | | | 475 | | | | - | | | | 475 | |
| Other | | | - | | | | 37 | | | | - | | | | 37 | | | | - | | | | - | | | | - | | | | - | | | | - | | | | - | | | | - | | | | - | |
| Corporate securities | | | 2,951 | | | | 19,769 | | | | 1,337 | | | | 24,057 | | | | 3,746 | | | | 19,338 | | | | 1,327 | | | | 24,411 | | | | 2,472 | | | | 12,863 | | | | 1,755 | | | | 17,090 | |
| Shares | | | 808 | | | | 3,170 | | | | - | | | | 3,978 | | | | 624 | | | | 4,500 | | | | - | | | | 5,124 | | | | 463 | | | | 4,231 | | | | - | | | | 4,694 | |
| Securitized real estate loans | | | - | | | | 7,323 | | | | 691 | | | | 8,014 | | | | - | | | | 6,913 | | | | 62 | | | | 6,975 | | | | - | | | | 4,168 | | | | 126 | | | | 4,294 | |
| Bank deposit certificates | | | - | | | | 274 | | | | - | | | | 274 | | | | - | | | | 559 | | | | - | | | | 559 | | | | - | | | | 99 | | | | - | | | | 99 | |
| Debentures | | | 2,103 | | | | 5,133 | | | | - | | | | 7,236 | | | | 3,122 | | | | 3,512 | | | | - | | | | 6,634 | | | | 1,883 | | | | 2,651 | | | | - | | | | 4,534 | |
| Eurobonds and others | | | 40 | | | | 3,598 | | | | - | | | | 3,638 | | | | - | | | | 3,843 | | | | - | | | | 3,843 | | | | 126 | | | | 1,698 | | | | - | | | | 1,824 | |
| Promissory notes | | | - | | | | - | | | | 646 | | | | 646 | | | | - | | | | - | | | | 1,265 | | | | 1,265 | | | | - | | | | - | | | | 1,626 | | | | 1,626 | |
| Other | | | - | | | | 271 | | | | - | | | | 271 | | | | - | | | | 11 | | | | - | | | | 11 | | | | - | | | | 16 | | | | 3 | | | | 19 | |
| Financial assets designated at fair value through profit or loss | | | - | | | | 186 | | | | - | | | | 186 | | | | - | | | | 306 | | | | - | | | | 306 | | | | - | | | | 373 | | | | - | | | | 373 | |
| Brazilian government securities | | | - | | | | 186 | | | | - | | | | 186 | | | | - | | | | 306 | | | | - | | | | 306 | | | | - | | | | 373 | | | | - | | | | 373 | |
| Financial liabilities designated at fair value | | | - | | | | (2,815 | ) | | | - | | | | (2,815 | ) | | | - | | | | (1,335 | ) | | | - | | | | (1,335 | ) | | | - | | | | (663 | ) | | | - | | | | (663 | ) |
| Structured notes | | | - | | | | (2,815 | ) | | | - | | | | (2,815 | ) | | | - | | | | (1,335 | ) | | | - | | | | (1,335 | ) | | | - | | | | (663 | ) | | | - | | | | (663 | ) |
The following table presents the breakdown of risk levels at December 31, 2011, 2010 and January 1, 2010 for our derivative assets and liabilities.
| | | 12/31/2011 | | | 12/31/2010 | | | 1/1/2010 | |
| | | Level 1 | | | Level 2 | | | Level 3 | | | Total | | | Level 1 | | | Level 2 | | | Level 3 | | | Total | | | Level 1 | | | Level 2 | | | Level 3 | | | Total | |
| Derivatives - Assets | | | 17 | | | | 7,832 | | | | 905 | | | | 8,754 | | | | - | | | | 7,292 | | | | 485 | | | | 7,777 | | | | - | | | | 5,085 | | | | 504 | | | | 5,589 | |
| Options | | | - | | | | 1,755 | | | | 688 | | | | 2,443 | | | | - | | | | 1,696 | | | | 56 | | | | 1,752 | | | | - | | | | 1,649 | | | | 177 | | | | 1,826 | |
| Forwards | | | - | | | | 2,326 | | | | 4 | | | | 2,330 | | | | - | | | | 2,096 | | | | - | | | | 2,096 | | | | - | | | | 412 | | | | - | | | | 412 | |
| Swap – Differential receivable | | | - | | | | 2,732 | | | | 18 | | | | 2,750 | | | | - | | | | 2,932 | | | | 5 | | | | 2,937 | | | | - | | | | 2,579 | | | | - | | | | 2,579 | |
| Swap with USD Check | | | - | | | | 4 | | | | - | | | | 4 | | | | - | | | | - | | | | - | | | | - | | | | - | | | | - | | | | 49 | | | | 49 | |
| Check of swap | | | - | | | | - | | | | - | | | | - | | | | - | | | | - | | | | - | | | | - | | | | - | | | | - | | | | 186 | | | | 186 | |
| Credit derivatives | | | - | | | | 399 | | | | - | | | | 399 | | | | - | | | | - | | | | 261 | | | | 261 | | | | - | | | | - | | | | 15 | | | | 15 | |
| Futures | | | 17 | | | | 9 | | | | - | | | | 26 | | | | - | | | | - | | | | - | | | | - | | | | - | | | | - | | | | - | | | | - | |
| Other derivatives | | | - | | | | 607 | | | | 195 | | | | 802 | | | | - | | | | 568 | | | | 163 | | | | 731 | | | | - | | | | 445 | | | | 77 | | | | 522 | |
| Derivatives - Liabilities | | | - | | | | (6,047 | ) | | | (700 | ) | | | (6,747 | ) | | | (46 | ) | | | (5,290 | ) | | | (335 | ) | | | (5,671 | ) | | | (9 | ) | | | (4,694 | ) | | | (629 | ) | | | (5,332 | ) |
| Options | | | - | | | | (1,930 | ) | | | (676 | ) | | | (2,606 | ) | | | - | | | | (1,899 | ) | | | (188 | ) | | | (2,087 | ) | | | - | | | | (1,599 | ) | | | (249 | ) | | | (1,848 | ) |
| Forwards | | | - | | | | (1,136 | ) | | | (8 | ) | | | (1,144 | ) | | | - | | | | (1,191 | ) | | | - | | | | (1,191 | ) | | | - | | | | (474 | ) | | | - | | | | (474 | ) |
| Swap – Differential payable | | | - | | | | (2,782 | ) | | | (16 | ) | | | (2,798 | ) | | | - | | | | (2,007 | ) | | | (6 | ) | | | (2,013 | ) | | | - | | | | (2,108 | ) | | | (6 | ) | | | (2,114 | ) |
| Swap with USD Check | | | - | | | | - | | | | - | | | | - | | | | - | | | | - | | | | - | | | | - | | | | - | | | | - | | | | (90 | ) | | | (90 | ) |
| Check of swap | | | - | | | | (2 | ) | | | - | | | | (2 | ) | | | - | | | | - | | | | - | | | | - | | | | - | | | | - | | | | (140 | ) | | | (140 | ) |
| Credit derivatives | | | - | | | | (110 | ) | | | - | | | | (110 | ) | | | - | | | | (10 | ) | | | (119 | ) | | | (129 | ) | | | - | | | | - | | | | (106 | ) | | | (106 | ) |
| Futures | | | - | | | | - | | | | - | | | | - | | | | (46 | ) | | | - | | | | (9 | ) | | | (55 | ) | | | (9 | ) | | | (8 | ) | | | (9 | ) | | | (26 | ) |
| Other derivatives | | | - | | | | (87 | ) | | | - | | | | (87 | ) | | | - | | | | (183 | ) | | | (13 | ) | | | (196 | ) | | | - | | | | (505 | ) | | | (29 | ) | | | (534 | ) |
Level 3 recurring fair value measurements
The tables below show the changes in the balance sheet, for financial instruments classified by ITAÚ UNIBANCO HOLDING in Level 3 of the fair value hierarchy:
Distribution by level
| | | Fair value at
12/31/2010 | | | Total gains
or losses
(realized/
unrealized) | | | Purchases
and issues | | | Settlements | | | Transfers in
and/or out of
Level 3 | | | Fair value at
12/31/2011 | | | Total gains
(losses) related to
assets and
liabilities still held
at 12/31/2011 | |
| Financial assets held for trading | | | 159 | | | | 89 | | | | 1,422 | | | | (1,391 | ) | | | 11 | | | | 290 | | | | - | |
| Corporate securities | | | 159 | | | | 89 | | | | 1,422 | | | | (1,391 | ) | | | 11 | | | | 290 | | | | - | |
| Securitized real estate loans | | | 157 | | | | 85 | | | | 562 | | | | (804 | ) | | | - | | | | - | | | | - | |
| Promissory notes | | | - | | | | 3 | | | | 697 | | | | (410 | ) | | | - | | | | 290 | | | | - | |
| Other | | | 2 | | | | 1 | | | | 163 | | | | (177 | ) | | | 11 | | | | - | | | | - | |
| Available-for-sale financial assets | | | 1,647 | | | | 767 | | | | 3,217 | | | | (3,530 | ) | | | (505 | ) | | | 1,596 | | | | 266 | |
| Brazilian government securities | | | 320 | | | | - | | | | 38 | | | | (64 | ) | | | (35 | ) | | | 259 | | | | (100 | ) |
| Corporate securities | | | 1,327 | | | | 767 | | | | 3,179 | | | | (3,466 | ) | | | (470 | ) | | | 1,337 | | | | 366 | |
| Shares | | | - | | | | - | | | | 227 | | | | - | | | | (227 | ) | | | - | | | | - | |
| Securitized real estate loans | | | 62 | | | | 686 | | | | 1,125 | | | | (1,103 | ) | | | (79 | ) | | | 691 | | | | 366 | |
| Promissory notes | | | 1,265 | | | | 78 | | | | 1,666 | | | | (2,363 | ) | | | - | | | | 646 | | | | - | |
| Other | | | - | | | | 3 | | | | 161 | | | | - | | | | (164 | ) | | | - | | | | - | |
| | | Fair value at
12/31/2010 | | | Total gains
or losses
(realized/
unrealized) | | | Purchases
and issues | | | Settlements | | | Transfers in
and/or out of
Level 3 | | | Fair value at
12/31/2011 | | | Total gains
(losses) related to
assets and
liabilities still held
at 12/31/2011 | |
| Derivatives - Assets | | | 485 | | | | 811 | | | | 835 | | | | (1,226 | ) | | | - | | | | 905 | | | | (93 | ) |
| Options | | | 56 | | | | 89 | | | | 690 | | | | (147 | ) | | | - | | | | 688 | | | | (63 | ) |
| Swap – Differential receivable | | | 5 | | | | (15 | ) | | | 28 | | | | - | | | | - | | | | 18 | | | | 3 | |
| Swap with USD Check | | | - | | | | - | | | | 4 | | | | - | | | | - | | | | 4 | | | | - | |
| Credit derivatives | | | 261 | | | | 57 | | | | 104 | | | | (422 | ) | | | - | | | | - | | | | - | |
| Other derivatives | | | 163 | | | | 680 | | | | 9 | | | | (657 | ) | | | - | | | | 195 | | | | (33 | ) |
| Derivatives - Liabilities | | | (335 | ) | | | 130 | | | | (166 | ) | | | (329 | ) | | | - | | | | (700 | ) | | | (316 | ) |
| Options | | | (188 | ) | | | 82 | | | | (110 | ) | | | (460 | ) | | | - | | | | (676 | ) | | | (302 | ) |
| Forwards | | | - | | | | - | | | | (8 | ) | | | - | | | | - | | | | (8 | ) | | | - | |
| Swap – Differential payable | | | (6 | ) | | | (13 | ) | | | (16 | ) | | | 19 | | | | - | | | | (16 | ) | | | (14 | ) |
| Credit derivatives | | | (119 | ) | | | 55 | | | | (5 | ) | | | 69 | | | | - | | | | - | | | | - | |
| Futures | | | (9 | ) | | | 6 | | | | (27 | ) | | | 30 | | | | - | | | | - | | | | - | |
| Other derivatives | | | (13 | ) | | | - | | | | - | | | | 13 | | | | - | | | | - | | | | - | |
| | | Fair value at
01/01/2010 | | | Total gains
or losses
(realized/
unrealized) | | | Purchases
and issues | | | Settlements | | | Transfers in
and/or out of
Level 3 | | | Fair value at
12/31/2010 | | | Total gains
(losses) related to
assets and
liabilities still held
at 12/31/2010 | |
| Financial assets held for trading | | | 561 | | | | 1 | | | | 159 | | | | (562 | ) | | | - | | | | 159 | | | | 2 | |
| Corporate securities | | | 561 | | | | 1 | | | | 159 | | | | (562 | ) | | | - | | | | 159 | | | | 2 | |
| Securitized real estate loans | | | - | | | | - | | | | 157 | | | | - | | | | - | | | | 157 | | | | 2 | |
| Promissory notes | | | 561 | | | | 1 | | | | - | | | | (562 | ) | | | - | | | | - | | | | - | |
| Other | | | - | | | | - | | | | 2 | | | | - | | | | - | | | | 2 | | | | - | |
| Available-for-sale financial assets | | | 2,089 | | | | 81 | | | | 1,275 | | | | (1,798 | ) | | | - | | | | 1,647 | | | | (1 | ) |
| Brazilian government securities | | | 334 | | | | 74 | | | | - | | | | (88 | ) | | | - | | | | 320 | | | | (1 | ) |
| Corporate securities | | | 1,755 | | | | 7 | | | | 1,275 | | | | (1,710 | ) | | | - | | | | 1,327 | | | | - | |
| Securitized real estate loans | | | 127 | | | | 5 | | | | 14 | | | | (82 | ) | | | - | | | | 64 | | | | - | |
| Promissory notes | | | 1,628 | | | | 2 | | | | 1,261 | | | | (1,628 | ) | | | - | | | | 1,263 | | | | - | |
| | | Fair value at
01/01/2010 | | | Total gains
or losses
(realized/
unrealized) | | | Purchases
and issues | | | Settlements | | | Transfers in
and/or out of
Level 3 | | | Fair value at
12/31/2010 | | | Total gains
(losses) related to
assets and
liabilities still held
at 12/31/2010 | |
| Derivatives - Assets | | | 504 | | | | 56 | | | | 408 | | | | (483 | ) | | | - | | | | 485 | | | | (55 | ) |
| Options | | | 177 | | | | 30 | | | | 36 | | | | (187 | ) | | | - | | | | 56 | | | | - | |
| Swap – Differential receivable | | | - | | | | - | | | | 5 | | | | - | | | | - | | | | 5 | | | | - | |
| Check of swap | | | 186 | | | | - | | | | - | | | | (186 | ) | | | - | | | | - | | | | - | |
| Swap with USD Check | | | 49 | | | | - | | | | - | | | | (49 | ) | | | - | | | | - | | | | - | |
| Credit derivatives | | | 15 | | | | 87 | | | | 256 | | | | (97 | ) | | | - | | | | 261 | | | | 3 | |
| Other derivatives | | | 77 | | | | (61 | ) | | | 111 | | | | 36 | | | | - | | | | 163 | | | | (58 | ) |
| Derivatives - Liabilities | | | (629 | ) | | | 372 | | | | (294 | ) | | | 216 | | | | - | | | | (335 | ) | | | 10 | |
| Options | | | (249 | ) | | | 83 | | | | (151 | ) | | | 129 | | | | - | | | | (188 | ) | | | 45 | |
| Swap – Differential payable | | | (6 | ) | | | - | | | | - | | | | - | | | | - | | | | (6 | ) | | | (5 | ) |
| Check of swap | | | (140 | ) | | | - | | | | - | | | | 140 | | | | - | | | | - | | | | - | |
| Swap with USD Check | | | (90 | ) | | | - | | | | - | | | | 90 | | | | - | | | | - | | | | - | |
| Credit derivatives | | | (106 | ) | | | 80 | | | | (134 | ) | | | 41 | | | | - | | | | (119 | ) | | | (6 | ) |
| Futures | | | (9 | ) | | | 227 | | | | (9 | ) | | | (218 | ) | | | - | | | | (9 | ) | | | (11 | ) |
| Other derivatives | | | (29 | ) | | | (18 | ) | | | - | | | | 34 | | | | - | | | | (13 | ) | | | (13 | ) |
Derivative financial instruments classified in Level 3 mainly correspond to other derivatives – credit default swaps linked to shares.
There were no significant transfers between Level 1 and Level 2 during the years ended December 31, 2011 and 2010.
There were transfers from Level 3 to Level 2 in view of the extension of curves verified in the market.
Sensitivity analyses for Level 3 operations
The fair value of financial instruments classified in Level 3 is measured through assessment techniques comprising assumptions not evidenced by current transaction prices in active markets, as explained in item f above. The table below shows the sensitivity of these fair values in scenarios in which it is reasonably likely that changes will occur in the prices of assets, interest rates or in scenarios mixing shocks in prices with shocks in volatility for non-linear assets (volatility arising from lack of alignment between the derivative and underlying asset prices).
| Types | | I | | | II | | | III | |
| Interest rate | | | (1 | ) | | | (17 | ) | | | (34 | ) |
| Impact on income | | | - | | | | (1 | ) | | | (2 | ) |
| Impact on stockholders' equity | | | (1 | ) | | | (16 | ) | | | (32 | ) |
| Currencies, Commodities and Ratios | | | (1 | ) | | | (1 | ) | | | - | |
| Impact on income | | | (1 | ) | | | (1 | ) | | | - | |
| Impact on stockholders' equity | | | - | | | | - | | | | - | |
| Non Linear | | | (30 | ) | | | (56 | ) | | | - | |
| Impact on income | | | (30 | ) | | | (56 | ) | | | - | |
| Impact on stockholders' equity | | | - | | | | - | | | | - | |
| TOTAL | | | (32 | ) | | | (74 | ) | | | (34 | ) |
| Impact on income | | | (31 | ) | | | (58 | ) | | | (2 | ) |
| Impact on stockholders' equity | | | (1 | ) | | | (16 | ) | | | (32 | ) |
The following scenarios are used to measure the sensitivity:
Interest rate
Shocks at 1, 25 and 50 base points (scenarios I, II and III respectively) in the interest curves, both for increase and decrease, considering the largest losses resulting in each scenario.
Currencies, Commodities and Ratios
Shocks at 5 and 10 percentage points (scenarios I and II respectively) in prices of currencies, commodities and ratios, both for increase and decrease, considering the largest losses resulting in each scenario.
Non Linear
Scenario I: Combined shocks at 5 percentage points in prices and 25 percentage points in volatility, both for increase and decrease, considering the largest losses resulting in each scenario.
Scenario II: Combined shocks at 10 percentage points in prices and 25 percentage points in volatility, both for increase and decrease, considering the largest losses resulting in each scenario.
NOTE 31 – PROVISIONS, CONTINGENCIES AND OTHER COMMITMENTS
| Provision | | 12/31/2011 | | | 12/31/2010 | | | 1/1/2010 | |
| | | | | | | | | | |
| Civil | | | 3,166 | | | | 2,974 | | | | 2,394 | |
| Labor | | | 4,014 | | | | 3,986 | | | | 3,156 | |
| Tax and social security | | | 8,645 | | | | 7,324 | | | | 7,886 | |
| Other | | | 165 | | | | 173 | | | | 192 | |
| Total | | | 15,990 | | | | 14,457 | | | | 13,628 | |
| Current | | | 3,140 | | | | 2,720 | | | | 2,410 | |
| Non-current | | | 12,850 | | | | 11,736 | | | | 11,218 | |
In the ordinary course of its businesses, ITAÚ UNIBANCO HOLDING is subject to contingencies that may be classified as follows.
a) Contingent assets:there are no contingent assets recorded.
b) Provisions and contingencies:the criteria to quantify contingencies are appropriate to the specific characteristics of civil, labor and tax litigation, as well as other risks.
Collective lawsuits (related to claims of a similar nature and with individual amounts not considered significant): contingencies are determined on a monthly basis and the expected amount of losses is accrued according to statistical references that take into account the type of lawsuit and the characteristics of the court (Small Claims Court or Regular Court).
Individual lawsuits (related to claims with unusual characteristics or involving significant amounts): determined periodically, based on the amount claimed and the likelihood of loss, which, in turn, is estimated according to the factual and legal characteristics related to such lawsuit. The amounts considered as probable losses are recorded as provisions.
Contingencies generally arise from revision of contracts and compensation for damages and pain and suffering; most of these lawsuits are filed in the Small Claims Court and therefore limited to 40 minimum monthly wages. ITAÚ UNIBANCO HOLDING is also party to specific lawsuits over alleged understated inflation adjustments to savings accounts in connection with economic plans implemented by the Brazilian government.
The case law at the Federal Supreme Court is favorable to banks in relation to economic phenomena similar to savings, as in the case of adjustment to time deposits and contracts in general. Additionally, the Federal Supreme Court has recently decided that the term for filing public civil actions over understated inflation is five years. In view of such decision, some of the lawsuits may be dismissed because they were filed after the five-year period.
No amount is recognized in the financial statements in relation to civil lawsuits which represent possible losses and which have a total estimated risk of R$ 603; these refer to claims for compensation or collection, the individual amounts of which are not significant and in this total there are no values resulting from interest in joint ventures.
Collective lawsuits (related to claims of a similar nature and with individual amounts not considered significant): the expected amount of loss is determined and accrued monthly based on the moving average of payments in relation to lawsuits settled in the last 12 months, plus the average cost of legal fees. These are adjusted for the amounts deposited as guarantee for their execution when realized.
Individual lawsuits (related to claims with unusual characteristics or involving significant amounts): determined periodically, based on the amount claimed and the likelihood of loss, which, in turn, is estimated according to the factual and legal characteristics related to such lawsuit. The amounts considered as probable losses are recorded as provisions.
Contingencies are related to lawsuits in which alleged labor rights based on labor legislation, such as overtime, salary equalization, reinstatement, transfer allowance, pension plan supplement and other are claimed;
There are no off balance sheet contingencies regarding labor claims.
These are quantified and recorded as provisions mainly based on the evaluation of agribusiness credit transactions with joint obligation and FCVS (salary variations compensation fund) credits transferred to Banco Nacional.
The table below shows the changes in the balances of provisions for contingent liabilities and the respective escrow deposits:
| | | 01/01 to 12/31/2011 | |
| | | Civil | | | Labor | | | Other | | | Total | |
| Opening balance | | | 2,974 | | | | 3,986 | | | | 173 | | | | 7,133 | |
| (-) Contingencies guaranteed by indemnity clauses (Note 2.4t) | | | (309 | ) | | | (1,113 | ) | | | - | | | | (1,422 | ) |
| Subtotal | | | 2,665 | | | | 2,873 | | | | 173 | | | | 5,711 | |
| Interest | | | 113 | | | | 110 | | | | - | | | | 223 | |
| Changes in the year reflected in results | | | 1,503 | | | | 784 | | | | (8 | ) | | | 2,279 | |
| Increase (*) | | | 1,981 | | | | 992 | | | | 12 | | | | 2,985 | |
| Reversal | | | (478 | ) | | | (208 | ) | | | (20 | ) | | | (706 | ) |
| Payment | | | (1,252 | ) | | | (683 | ) | | | - | | | | (1,935 | ) |
| Subtotal | | | 3,029 | | | | 3,084 | | | | 165 | | | | 6,278 | |
| (+) Contingencies guaranteed by indemnity clause (Note 2.4t) | | | 137 | | | | 930 | | | | - | | | | 1,067 | |
| Closing balance | | | 3,166 | | | | 4,014 | | | | 165 | | | | 7,345 | |
| Escrow deposits at 12/31/2011 | | | 2,023 | | | | 2,409 | | | | - | | | | 4,432 | |
(*) Civil provisions include the provision for economic plans amounting to R$ 431.
| | | 01/01 to 12/31/2010 | |
| | | Civil | | | Labor | | | Other | | | Total | |
| Opening balance | | | 2,394 | | | | 3,156 | | | | 192 | | | | 5,742 | |
| (-) Contingencies guaranteed by indemnity clauses (Note 2.4t) | | | (98 | ) | | | (573 | ) | | | - | | | | (671 | ) |
| Subtotal | | | 2,296 | | | | 2,583 | | | | 192 | | | | 5,071 | |
| Interest | | | 142 | | | | 77 | | | | - | | | | 219 | |
| Changes in the year reflected in results | | | 1,185 | | | | 803 | | | | (19 | ) | | | 1,969 | |
| Increase (*) | | | 1,801 | | | | 905 | | | | - | | | | 2,706 | |
| Reversal | | | (616 | ) | | | (102 | ) | | | (19 | ) | | | (737 | ) |
| Payment | | | (958 | ) | | | (590 | ) | | | - | | | | (1,548 | ) |
| Subtotal | | | 2,665 | | | | 2,873 | | | | 173 | | | | 5,711 | |
| (+) Contingencies guaranteed by indemnity clause (Note 2.4t) | | | 309 | | | | 1,113 | | | | - | | | | 1,422 | |
| Closing balance | | | 2,974 | | | | 3,986 | | | | 173 | | | | 7,133 | |
| Escrow deposits at 12/31/2010 | | | 1,619 | | | | 2,318 | | | | - | | | | 3,937 | |
(*) Civil provisions include the provision for economic plans amounting to R$ 708.
| - | Tax and social security lawsuits |
Contingencies are equivalent to the principal amount of taxes involved in tax, administrative or judicial disputes, subject to tax assessment notices, plus interest and, when applicable, fines and charges. The amount is recorded as a provision when it involves a legal liability, regardless of the likelihood of loss, that is, a favorable outcome is dependent upon the recognition of the unconstitutionality of the applicable law in force. In other cases, a provision is set up whenever the loss is considered probable.
The table below shows the changes in the balances of provisions and respective escrow deposits for tax and social security lawsuits:
| Provision | | 01/01 to
12/31/2011 | | | 01/01 to
12/31/2010 | |
| Opening balance | | | 7,324 | | | | 7,886 | |
| (-) Contingencies guaranteed by indemnity clause | | | (44 | ) | | | (35 | ) |
| Subtotal | | | 7,280 | | | | 7,851 | |
| Interest | | | 548 | | | | 400 | |
| Changes in the year reflected in results | | | 917 | | | | 1,074 | |
| Increase | | | 1,046 | | | | 1,728 | |
| Reversal (1) | | | (129 | ) | | | (654 | ) |
| Payment (1) | | | (157 | ) | | | (2,045 | ) |
| Subtotal | | | 8,588 | | | | 7,280 | |
| (+) Contingencies guaranteed by indemnity clause | | | 57 | | | | 44 | |
| Closing balance (Notes 13c and 14c) (2) | | | 8,645 | | | | 7,324 | |
(1) ITAÚ UNIBANCO HOLDING and its subsidiaries adhered to the Program for Cash settlement or Installment Payment of Federal Taxes, established by Law No. 11,941, of May 27, 2009. In the first half of 2010, taxes administered by the Federal Reserve Service of Brazil were included, mainly relating to the increase of the calculation basis of PIS and COFINS, set forth in paragraph 1 of article 3 of Law No. 9,718, of November 27, 1998.
(2) Includes amounts arising from investments in joint ventures of R$ 3.
| Escrow Deposits | | 01/01 to
12/31/2011 | | | 01/01 to
12/31/2010 | |
| Opening balance | | | 4,677 | | | | 5,076 | |
| Appropriation of interest | | | 365 | | | | 296 | |
| Changes in the period | | | 136 | | | | (696 | ) |
| Deposits made | | | 265 | | | | 496 | |
| Withdrawals | | | (115 | ) | | | (1,146 | ) |
| Deposits released | | | (14 | ) | | | (46 | ) |
| Closing balance | | | 5,178 | | | | 4,676 | |
The main discussions related to “Provisions” for tax are described as follows:
| · | PIS and COFINS – Calculation basis – R$ 2,885: we are claiming that those contributions on revenue should be applied only to the revenue from sales of assets and services. The escrow deposit balance totals R$ 1,043; |
| · | CSLL – Isonomy – R$ 1,346: the law increased the CSLL rate for financial and insurance companies to 15%, we argue that there is no constitutional support for this measure and, due to the principle of isonomy, we believe we should only pay the regular rate of 9%. The escrow deposit balance totals R$ 231; |
| · | IRPJ and CSLL –Taxation of profits earned abroad – R$ 491: we are challenging the calculation basis for these taxes on profits earned abroad and argue that Regulatory Instruction SRF No. 213-02 is not applicable since it goes beyond the text oh the law. The escrow deposit balance totals R$ 491. |
| · | PIS – R$ 375 – Principles of anteriority over 90 days and non-retroactivity: we request the rejection of Constitutional Amendments No. 10/96 and No. 17/97 in view of the principles of anteriority and non-retroactivity, seeking authorization to make payment based on Supplementary Law No. 07/70. The corresponding escrow deposit balance totals R$ 129. |
Contingencies for tax not recognized in the balance sheet -In the accounting records no amount is recognized in relation to tax and social security lawsuits with likelihood of loss possible, which total an estimated risk of R$ 5,930. The main discussions are as follows:
| · | IRPJ, CSLL, PIS and COFINS – request for offset dismissed - R$ 1,097: cases in which the liquidity and the offset of credits are discussed. |
| · | INSS – Non-compensatory amounts – R$ 632: we defend the non-taxation of these amounts, mainly profit sharing, transportation vouchers and sole bonus. |
| · | IRPJ/CSLL - Losses and discounts granted on receipt of credits – R$ 459: we defend that these are necessary operating expenses and deductible as losses on loan operations and discounts upon their renegotiation and recovery, as provided by law. |
| · | ISS – Banking Institutions – R$ 450: these are banking operations, the revenue from which cannot be interpreted as compensation per service rendered and/or arise from activities not listed in a Supplementary Law. |
| · | IRPJ, CSLL, PIS and COFINS – Usufruct of quotas and shares - R$ 372: we discuss the proper accounting and tax treatment for the amount received due to the onerous recognition of usufruct. |
| · | IRPJ, CSLL - Interest on capital - R$ 358: we defend the deductibility of interest on capital declared to stockholders based on the Brazilian long-term interest rate applied to stockholders’ equity for the year and prior years. |
| c) | Receivables - Reimbursement of contingencies |
The receivables balance arising from reimbursements of contingencies totals R$ 626 (R$ 903 at December 31, 2010) (Note 19a), basically represented by the guarantee received in the Banco Banerj S.A. privatization process of 1997, whereby the State of Rio de Janeiro created a fund to guarantee the equity recomposition with respect to civil, labor and tax contingencies.
| d) | Assets pledged as collateral for contingencies |
Assets pledged as collateral for lawsuits involving contingent liabilities are restricted or deposited as shown below:
| | | 12/31/2011 | | | 12/31/2010 | |
| Securities (basically Financial Treasury Bills) | | | 1,512 | | | | 1,516 | |
| Deposits in guarantee | | | 3,233 | | | | 3,292 | |
In general ITAÚ UNIBANCO HOLDING litigation provisions are long term liabilities considering the time required to conclude legal cases through the court system in Brazil. Due to this fact, we note that it is difficult to make accurate estimates regarding the specific year that a legal case will be concluded, particularly in the earlier stages of a case. For this reason, the ITAÚ UNIBANCO HOLDING has not included estimates regarding future settlement date for the most significant provisions resulting from litigation.
In the opinion of the legal advisors, ITAÚ UNIBANCO HOLDING and its subsidiaries are not parties to any other administrative proceedings or legal lawsuits that could significantly impact the results of their operations.
NOTE 32 – REGULATORY CAPITAL
ITAÚ UNIBANCO HOLDING is subject to regulation by the Central Bank of Brazil which issues rules and instructions regarding currency and credit policies for financial institutions operating in Brazil. The Central Bank also determines minimum capital requirements, fixed assets limits, lending limits, accounting practices and compulsory deposit requirements, and requires banks to comply with regulation based on the Basel Accord as regards to capital adequacy. Furthermore, the National Council of Private Insurance and SUSEP issue regulations on capital requirements which affect our insurance, private pension and capitalization operations.
The Basel Accord requires banks to have a ratio of regulatory capital to risk exposure assets of a minimum of 8%. The regulatory capital is basically comprises of two tiers:
| · | Tier I: in general, certain capital, reserves and retained earnings, less certain intangibles. |
| · | Tier II: includes, among other items and subject to certain limitations, asset revaluation reserves, general allowance for losses and subordinated debt, and is limited to the amount of Tier I Capital. |
However, the Basel Accord allows the regulatory authorities of each country to establish their own parameters for regulatory capital composition and to determine the portions exposed to risk. Among the main differences arising from the adoption of own parameter pursuant to the Brazilian legislation are the following: (i) the requirement of a ratio of regulatory capital to risk-weighted assets at a minimum of 11%; (ii) certain risk-weighted factors attributed to certain assets and other exposures; (iii) the requirement that banks allocate a portion of their equity to cover operational risks, ranging from 12% to 18% of the average gross income from financial operations. In addition, in accordance with Central Bank rules, banks can calculate compliance with the minimum requirement:
| · | Based on the consolidation of all financial subsidiaries supervised by the Central Bank, including branches and investments abroad, or |
| · | Based on full consolidation, considering all companies which are statutorily or operationally controlled by ITAÚ UNIBANCO HOLDING, regardless of whether they are supervised or not by the Central Bank. |
Management manages capital with the intention to meet the minimal capital required by the Central Bank of Brazil. During the period we complied with all externally imposed capital requirements to which we are subject.
The following table summarizes the rules of regulatory capital, the minimum capital required and the Basel ratio computed in accordance with the Central Bank of Brazil, both on a financial institution consolidation basis and on a full consolidation basis.
| | | 12/31/2011 | | | 12/31/2010 | | | 1/1/2010 | |
| | | Financial
institutions
(partial
consolidation) | | | Full
consolidation | | | Financial
institutions
(partial
consolidation) | | | Full
consolidation | | | Financial
institutions
(partial
consolidation) | | | Full
consolidation | |
| Regulatory capital | | | | | | | | | | | | | | | | | | | | | | | | |
| Tier I | | | 71,052 | | | | 71,601 | | | | 60,192 | | | | 62,240 | | | | 55,624 | | | | 57,705 | |
| Tier II | | | 21,564 | | | | 21,565 | | | | 18,652 | | | | 18,652 | | | | 12,837 | | | | 12,837 | |
| Other deductions required by Central Bank of Brazil | | | (55 | ) | | | (55 | ) | | | (173 | ) | | | (173 | ) | | | (28 | ) | | | (28 | ) |
| Total | | | 92,561 | | | | 93,111 | | | | 78,671 | | | | 80,719 | | | | 68,433 | | | | 70,514 | |
| Requirement for Coverage of Risk Exposures: | | | | | | | | | | | | | | | | | | | | | | | | |
| Credit | | | 59,189 | | | | 57,629 | | | | 50,979 | | | | 53,442 | | | | 41,734 | | | | 43,949 | |
| Market | | | 1,079 | | | | 1,076 | | | | 997 | | | | 954 | | | | 682 | | | | 681 | |
| Operational | | | 3,460 | | | | 3,851 | | | | 2,746 | | | | 3,129 | | | | 1,882 | | | | 1,882 | |
| Minimum Regulatory Capital Required | | | 63,728 | | | | 62,556 | | | | 54,722 | | | | 57,525 | | | | 44,298 | | | | 46,512 | |
| Excess of Regulatory Capital over Minimum Regulatory Capital Required | | | 28,833 | | | | 30,555 | | | | 23,949 | | | | 23,194 | | | | 24,135 | | | | 24,002 | |
| Exposure Weighted by Risk | | | 579,338 | | | | 568,693 | | | | 497,468 | | | | 522,952 | | | | 402,713 | | | | 422,840 | |
| Capital to risk-weighted assets ratio - % | | | 16.0 | | | | 16.4 | | | | 15.8 | | | | 15.4 | | | | 17.0 | | | | 16.7 | |
The funds obtained through the issue of subordinated debt securities are considered Capital Tier II for purposes of capital to risk-weighted assets ratio, as follows:
| Name of security | | Issue | | | Maturity | | | Return p.a. | | Principal
R$ | |
| Subordinated CDB | | | | | | | | | | | | | | |
| | | | 2007 | | | | 2012 | | | 103.5% to 104% of CDI | | | 4,970 | |
| | | | | | | | | | 100% of CDI + 0.35% to 0.45% | | | 732 | |
| | | | | | | | | | IGPM + 7.31 to 7.35% | | | 278 | |
| | | | 2002 | | | | 2012 | | | 102.5% of CDI | | | 200 | |
| | | | 2008 | | | | 2013 | | | 100% of CDI + 0.5% to 0.6% | | | 1,558 | |
| | | | | | | | | | 106% to 107% of CDI | | | 48 | |
| | | | 2003 | | | | 2013 | | | 102% of CDI | | | 40 | |
| | | | 2007 | | | | 2014 | | | 100% of CDI + 0.35% to 0.6% | | | 1,865 | |
| | | | 2007 | | | | 2014 | | | IGPM 7.35% | | | 33 | |
| | | | 2008 | | | | 2014 | | | 112% of CDI | | | 1,000 | |
| | | | 2008 | | | | 2015 | | | 119.8% of CDI | | | 400 | |
| | | | 2010 | | | | 2015 | | | 113% of CDI | | | 50 | |
| | | | 2006 | | | | 2016 | | | 100% of CDI + 0.47% (*) | | | 466 | |
| | | | 2010 | | | | 2016 | | | 110% to 114% of CDI | | | 2,664 | |
| | | | 2010 | | | | 2016 | | | IPCA + 7.33% | | | 123 | |
| | | | 2010 | | | | 2017 | | | IPCA + 7.45% | | | 367 | |
| | | | | | | | | | TOTAL | | | 14,793 | |
| | | | | | | | | | | | | | | |
| Subordinated financial credit bills | | | | | | | | | | | | | | |
| | | | 2010 | | | | 2016 | | | 100% of CDI + 1.35% to 1.36% | | | 365 | |
| | | | 2010 | | | | 2016 | | | 112% to 112.5% of CDI | | | 1,873 | |
| | | | 2010 | | | | 2016 | | | IPCA + 7% | | | 30 | |
| | | | 2010 | | | | 2017 | | | IPCA + 6.95% to 7.2% | | | 206 | |
| | | | 2011 | | | | 2017 | | | 108% to 112% of CDI | | | 3,011 | |
| | | | 2011 | | | | 2017 | | | IPCA + 6.15% to 7.8% | | | 343 | |
| | | | 2011 | | | | 2017 | | | IGPM + 6.55% to 7.6% | | | 55 | |
| | | | 2011 | | | | 2017 | | | 100% of CDI + 1.29% to 1.52% | | | 3,650 | |
| | | | 2011 | | | | 2018 | | | IGPM + 7% | | | 42 | |
| | | | 2011 | | | | 2018 | | | IPCA + 7.53% to 7.7% | | | 30 | |
| | | | 2011 | | | | 2019 | | | 109% of 109.7% to CDI | | | 1 | |
| | | | 2011 | | | | 2021 | | | 109.25 of 110.5% to CDI | | | 6 | |
| | | | | | | | | | TOTAL | | | 9,612 | |
| | | | | | | | | | | | | | | |
| Subordinated euronotes | | | | | | | | | | | | | | |
| | | | 2010 | | | | 2020 | | | 6.2% | | | 1,731 | |
| | | | 2010 | | | | 2021 | | | 5.8% | | | 1,694 | |
| | | | 2011 | | | | 2021 | | | 5.8% | | | 401 | |
| | | | 2011 | | | | 2021 | | | 6.2% | | | 765 | |
| | | | | | | | | | TOTAL | | | 4,591 | |
| | | | | | | | | | | | | | | |
| Preferred shares | | | | | | | | | | | | | | |
| | | | 2002 | | | | 2015 | | | 3.04% | | | 1,389 | |
(*) Subordinated CDBs may be redeemed from November 2011;
NOTE 33 – SEGMENT INFORMATION
ITAÚ UNIBANCO HOLDING is a banking institution that offers to its customers a wide range of financial products and services.
The four operational and reporting segments of ITAÚ UNIBANCO HOLDING are: Commercial Bank, Itaú BBA, Consumer Credit, and Corporate and Treasury, which are described below:
| · | Itaú Unibanco – Commercial Bank |
The Commercial Bank segment provides a broad range of banking services to a diversified client base of individuals and companies, among which are the following: retail clients (individuals and very small companies), high net worth clients, private banking clients, and small and medium-sized companies.
The products and services provided by the Commercial Bank include insurance, private pension and capitalization plans, credit cards, asset management and loans, among others. The segment provides solutions specifically developed to meet the needs of clients, devising marketing strategies appropriate to each of the different profiles and using the most convenient distribution channels. Accordingly, ITAÚ UNIBANCO HOLDING is constantly seeking to increase the number of products provided to clients, diversifying the sources of income. The segment is an important source of funding for the operations and provides significant interest and banking services income.
| · | Itaú Unibanco - Itaú BBA |
Itaú BBA is the segment responsible for banking operations of large companies and investment banking services. Itaú BBA offers a wide range of products and services to the largest economic groups of Brazil. The management model of Itaú BBA is focused on the development of close relationships with its clients, gaining an in-depth knowledge of their needs and providing customized solutions. The investment banking activities comprise lending to the corporate segment that are funds through fixed and variable income instruments. In addition, it performs activities related to mergers and acquisitions.
| · | Itaú Unibanco – Consumer Credit |
The Consumer Credit segment is responsible for the development of the strategy of increasing the range of financial products and services beyond the universe of clients who are account holders. Thus the consumer credit segment comprises vehicle financing services provided by units other than the branch network, credit cards to clients who are not account holders, and credit to low income individuals. The business of vehicle financing comprises: new vehicles, used vehicles, heavy vehicles and motorcycles. The credit approval process of vehicle operations is based on scoring models that provides prompt approval of credit proposals for the clients, using the Internet to process these proposals with security and efficiency.
| · | Itaú Unibanco – Corporate and Treasury |
The Corporate and Treasury segment basically manages the interest income associated with ITAÚ UNIBANCO HOLDING capital surplus, subordinated debt surplus and the net balance of tax credits and debits, as well as the net interest income from the trading of financial assets through proprietary positions (desks), management of currency interest rate gaps, and other risk factors, arbitrage opportunities in the foreign and domestic markets, and mark-to-market of financial assets. In this segment, it is also presented the effect of non-recurring items that are not considered in the managerial statement of income.
Basis of presentation of segment information
Segment information is prepared based on the reports used by top management to assess the performance and to make decisions regarding the allocation of funds for investment and other purposes.
The top management of ITAÚ UNIBANCO HOLDING uses a variety of information for such purposes including financial and non-financial information that are measured on different bases as well as the information prepared based on accounting practices adopted in Brazil.
The segment information has been prepared following accounting practices adopted in Brazil modified for the adjustments described below. Financial segment information differs from accounting practices adopted in Brazil because: (i) it includes recognition of the impact related to allocated capital using a proprietary model; (ii) it presents net interest income using certain management criteria. The main impacts are described below:
Capital allocation to each segment
The book value of stockholders' equity and subordinated debt were replaced by funding at estimated market price, and interest income and expense were allocated to the segments, based on Tier I Capital, following a proprietary model, with surplus capital and subordinated debt being allocated to the Corporate and Treasury segment. The tax effects of payments of interest on capital by each segment have been reversed and reallocated to the segments in amounts proportional to the amount of the Tier I capital. Share of income of unconsolidated companies which are not related to segment and non-controlling interest were allocated to the Corporate and Treasury segment.
Net interest income
ITAÚ UNIBANCO HOLDING adopts a strategy to manage the foreign exchange risk of subsidiaries outside Brazil in order to economically hedge against impacts on the results arising from variation in exchange rates. In order to achieve this objective, it is used derivative instruments to hedge against such foreign currency risk. Hedge accounting is not applied for those derivatives, they are recorded instead at fair value with gains and losses included in income.
The hedging strategy considers all tax effects, either the ones not related to taxes or to the non-deductibility of the exchange variation on the investments abroad, or the gains and losses on derivative financial instruments used. When the parity of the Brazilian Real against foreign currencies is considerable, there is a significant impact on interest income and expense.
As a result of the above, it is adopted a managerial statement of income to report segment information. The managerial statement of income is prepared by making reclassifications to the financial statements in accordance with the accounting practices adopted in Brazil. Tax effects of the hedge of these investments abroad, which are presented in tax expenses (PIS and COFINS) and income tax and social contribution expense were reclassified for the segment information.
Additionally, the managerial financial margin includes, for each operation, allocation of its opportunity cost.
In the adjustments and reclassifications column, it is presented the effects of the differences between the accounting principles followed for the presentation of segment information, which are substantially in line with the accounting practices adopted in Brazil, except as described above, and the policies used in the preparation of these consolidated financial statements according to IFRS.
| ITAÚ UNIBANCO HOLDING S.A. |
| From January 1 to December 31, 2011 |
| (In millions of Reais, except per share information) |
| |
| Consolidated Statement of Income | | COMMERCIAL
BANK | | | ITAÚ BBA | | | CONSUMER
CREDIT | | | CORPORATE +
TREASURY | | | ITAÚ
UNIBANCO | | | ADJUSTMENTS | | | IFRS
CONSOLIDATED | |
| Banking product | | | 48,236 | | | | 6,897 | | | | 14,102 | | | | 5,109 | | | | 74,257 | | | | 19 | | | | 74,276 | |
| Interest margin (1) | | | 31,584 | | | | 4,896 | | | | 8,356 | | | | 4,801 | | | | 49,601 | | | | (1,238 | ) | | | 48,363 | |
| Banking service fees | | | 10,915 | | | | 2,123 | | | | 5,719 | | | | 309 | | | | 19,048 | | | | 362 | | | | 19,410 | |
| Income from insurance, private pension and capitalization operations before claim and selling expenses | | | 5,229 | | | | - | | | | (13 | ) | | | (1 | ) | | | 5,215 | | | | 130 | | | | 5,345 | |
| Other income | | | 508 | | | | (122 | ) | | | 40 | | | | - | | | | 393 | | | | 765 | | | | 1,158 | |
| Losses on loans and claims | | | (11,011 | ) | | | (134 | ) | | | (4,270 | ) | | | (521 | ) | | | (15,936 | ) | | | (136 | ) | | | (16,072 | ) |
| Expenses for allowance for loan losses | | | (13,845 | ) | | | (266 | ) | | | (5,270 | ) | | | (531 | ) | | | (19,912 | ) | | | (126 | ) | | | (20,038 | ) |
| Recovery of loans written-off as loss | | | 4,346 | | | | 132 | | | | 1,000 | | | | 10 | | | | 5,488 | | | | (11 | ) | | | 5,477 | |
| Expenses for claims | | | (1,512 | ) | | | - | | | | - | | | | - | | | | (1,512 | ) | | | 1 | | | | (1,511 | ) |
| Operating margin | | | 37,225 | | | | 6,763 | | | | 9,832 | | | | 4,588 | | | | 58,321 | | | | (117 | ) | | | 58,204 | |
| Other operating income (expenses) | | | (25,829 | ) | | | (2,911 | ) | | | (7,911 | ) | | | (390 | ) | | | (37,025 | ) | | | (2,928 | ) | | | (39,953 | ) |
| Non-interest expenses (2) | | | (23,315 | ) | | | (2,605 | ) | | | (6,948 | ) | | | (935 | ) | | | (33,787 | ) | | | (1,887 | ) | | | (35,674 | ) |
| Tax expenses for ISS, PIS and COFINS and Other | | | (2,596 | ) | | | (341 | ) | | | (953 | ) | | | 51 | | | | (3,839 | ) | | | (327 | ) | | | (4,166 | ) |
| Share of comprehensive income of unconsolidated companies, net | | | (43 | ) | | | 6 | | | | - | | | | 447 | | | | 410 | | | | (523 | ) | | | (113 | ) |
| Other | | | 125 | | | | 29 | | | | (10 | ) | | | 47 | | | | 191 | | | | (191 | ) | | | - | |
| Income before income tax and social contribution | | | 11,396 | | | | 3,852 | | | | 1,921 | | | | 4,198 | | | | 21,296 | | | | (3,045 | ) | | | 18,251 | |
| Income tax and social contribution | | | (3,833 | ) | | | (1,287 | ) | | | (477 | ) | | | (244 | ) | | | (5,841 | ) | | | 2,200 | | | | (3,641 | ) |
| Non-controlling interest in subsidiaries | | | - | | | | - | | | | - | | | | (885 | ) | | | (814 | ) | | | 41 | | | | (773 | ) |
| NET INCOME | | | 7,563 | | | | 2,565 | | | | 1,444 | | | | 3,069 | | | | 14,641 | | | | (804 | ) | | | 13,837 | |
| (1) Includes net interest and similar income and expenses of R$ 41,753, dividend income of R$ 361, net gain (loss) from financial assets and liabilities of R$ 1,251 and foreign exchange results and exchange variation on transactions of R$ 4,998. |
| (2) Refers to general and administrative expenses including depreciation expenses of R$ 1,184 and amortization expenses of R$ 984. |
| Total assets (1) | | | 571,315 | | | | 191,620 | | | | 101,453 | | | | 115,171 | | | | 851,332 | | | | (33,196 | ) | | | 818,136 | |
| Total liabilities | | | 542,701 | | | | 181,226 | | | | 91,820 | | | | 90,325 | | | | 777,845 | | | | (35,045 | ) | | | 742,800 | |
| (1) Includes: | | | | | | | | | | | | | | | | | | | | | | | | | | | | |
| Investments in unconsolidated companies | | | - | | | | 3 | | | | - | | | | 1,681 | | | | 1,684 | | | | 860 | | | | 2,544 | |
| Fixed assets, net | | | 4,454 | | | | 366 | | | | 467 | | | | - | | | | 5,287 | | | | 71 | | | | 5,358 | |
| Intangible assets, net | | | 2,803 | | | | 339 | | | | 668 | | | | - | | | | 3,810 | | | | 15 | | | | 3,825 | |
The Consolidated figures do not represent the sum of the segments because there are intercompany transactions that were eliminated only in the consolidated financial statements. Segments are assessed by top management, net of income and expenses between related parties.
The management reviews the financial margin on a net basis.
| ITAÚ UNIBANCO HOLDING S.A. |
| From January 1 to December 31, 2010 |
| (In millions of Reais, except per share information) |
| |
| Consolidated Statement of Income | | COMMERCIAL BANK | | | ITAÚ BBA | | | CONSUMER CREDIT | | | CORPORATE + TREASURY | | | ITAÚ
UNIBANCO | | | ADJUSTMENTS | | | IFRS CONSOLIDATED | |
| Banking product | | | 41,238 | | | | 6,400 | | | | 15,148 | | | | 3,657 | | | | 66,390 | | | | 3,025 | | | | 69,415 | |
| Interest margin (1) | | | 27,068 | | | | 4,601 | | | | 9,044 | | | | 3,356 | | | | 44,050 | | | | 1,940 | | | | 45,990 | |
| Banking service fees | | | 9,246 | | | | 1,932 | | | | 5,765 | | | | 182 | | | | 17,101 | | | | (9 | ) | | | 17,092 | |
| Income from insurance, private pension and capitalization operations before claim and selling expenses | | | 4,469 | | | | - | | | | 254 | | | | (12 | ) | | | 4,711 | | | | 212 | | | | 4,923 | |
| Other income | | | 455 | | | | (133 | ) | | | 85 | | | | 131 | | | | 528 | | | | 882 | | | | 1,410 | |
| Losses on loans and claims | | | (9,523 | ) | | | 186 | | | | (3,754 | ) | | | (2 | ) | | | (13,093 | ) | | | 155 | | | | (12,938 | ) |
| Expenses for allowance for loan losses | | | (10,808 | ) | | | (182 | ) | | | (4,702 | ) | | | (2 | ) | | | (15,694 | ) | | | 147 | | | | (15,547 | ) |
| Recovery of loans written-off as loss | | | 2,893 | | | | 368 | | | | 948 | | | | - | | | | 4,209 | | | | (14 | ) | | | 4,195 | |
| Expenses for claims | | | (1,608 | ) | | | - | | | | - | | | | - | | | | (1,608 | ) | | | 22 | | | | (1,586 | ) |
| Operating margin | | | 31,715 | | | | 6,586 | | | | 11,394 | | | | 3,655 | | | | 53,297 | | | | 3,180 | | | | 56,477 | |
| Other operating income (expenses) | | | (22,927 | ) | | | (2,721 | ) | | | (7,826 | ) | | | (860 | ) | | | (34,327 | ) | | | (4,120 | ) | | | (38,447 | ) |
| Non-interest expenses (2) | | | (20,827 | ) | | | (2,379 | ) | | | (6,857 | ) | | | (1,005 | ) | | | (31,062 | ) | | | (3,570 | ) | | | (34,632 | ) |
| Tax expenses for ISS, PIS and COFINS and Other | | | (2,139 | ) | | | (387 | ) | | | (969 | ) | | | (274 | ) | | | (3,769 | ) | | | (395 | ) | | | (4,164 | ) |
| Share of comprehensive income of unconsolidated companies, net | | | 19 | | | | (6 | ) | | | - | | | | 409 | | | | 423 | | | | (74 | ) | | | 349 | |
| Other | | | 20 | | | | 51 | | | | - | | | | 10 | | | | 81 | | | | (81 | ) | | | - | |
| Income before income tax and social contribution | | | 8,788 | | | | 3,865 | | | | 3,568 | | | | 2,795 | | | | 18,970 | | | | (940 | ) | | | 18,030 | |
| Income tax and social contribution | | | (2,509 | ) | | | (1,023 | ) | | | (1,054 | ) | | | (495 | ) | | | (5,081 | ) | | | (455 | ) | | | (5,536 | ) |
| Non-controlling interest in subsidiaries | | | 2 | | | | - | | | | - | | | | (914 | ) | | | (866 | ) | | | 80 | | | | (786 | ) |
| NET INCOME | | | 6,281 | | | | 2,842 | | | | 2,514 | | | | 1,386 | | | | 13,023 | | | | (1,315 | ) | | | 11,708 | |
| (1) Includes net interest and similar income and expenses of R$ 40,978. dividend income of R$ 326, net gain (loss) from financial assets and liabilities of R$ 2,862 and foreign exchange results and exchange variation on transactions of R$ 1,824. |
| |
| (2) Refers to general and administrative expenses including depreciation expenses R$ 1,166 and amortization R$ 977. |
| Total assets (1) | | | 532,928 | | | | 209,988 | | | | 92,125 | | | | 66,287 | | | | 751,443 | | | | (24,361 | ) | | | 727,082 | |
| Total liabilities | | | 511,868 | | | | 197,266 | | | | 84,214 | | | | 43,589 | | | | 687,052 | | | | (27,522 | ) | | | 659,530 | |
| | | | | | | | | | | | | | | | | | | | | | | | | | | | | |
| (1)Includes: | | | | | | | | | | | | | | | | | | | | | | | | | | | | |
| Investments in unconsolidated companies | | | - | | | | 1 | | | | - | | | | 2,058 | | | | 2,059 | | | | 889 | | | | 2,948 | |
| Fixed assets, net | | | 3,661 | | | | 232 | | | | 835 | | | | - | | | | 4,728 | | | | 73 | | | | 4,801 | |
| Intangible assets, net | | | 2,321 | | | | 11 | | | | 602 | | | | - | | | | 2,934 | | | | - | | | | 2,934 | |
The Consolidated figures do not represent the sum of the segments because there are intercompany transactions that were eliminated only in the consolidated financial statements. Segments are assessed by top management, net of income and expenses between related parties.
The management reviews the financial margin on a net basis.
Information on Income from financial operation by geographical area is as follows:
| | | 01/01 to 12/31/2011 | | | 01/01 to 12/31/2010 | |
| | | Brazil | | | Foreign | | | Total | | | Brazil | | | Foreign | | | Total | |
| Income from financial operations (*) | | | 99,083 | | | | 4,879 | | | | 103,962 | | | | 79,236 | | | | 3,594 | | | | 82,830 | |
| Non-current assets | | | 8,487 | | | | 696 | | | | 9,183 | | | | 7,145 | | | | 590 | | | | 7,735 | |
| (*) Includes interest and similar income, dividend income, net gain (loss) from financial assets and liabilities, foreign exchange results and exchange variation on transactions. |
NOTE 34 – RELATED PARTIES
| a) | Transactions between related parties are carried out at amounts, terms and average rates in accordance with normal market practices during the period, as well as under reciprocal conditions. |
Transactions between companies included in the consolidation (Note 2.4a) were eliminated in the consolidated financial statements and take into consideration the absence of risk.
The unconsolidated related parties are the following:
| · | Itaú Unibanco Participações S.A. (IUPAR) and ITAÚSA, parent companies of ITAÚ UNIBANCO HOLDING. |
| · | The non-financial subsidiaries of ITAÚSA, especially: Itautec S.A., Duratex S.A., Elekeiroz S.A. and Itaúsa Empreendimentos S.A.. |
| · | Fundação Itaubanco, FUNBEP – Fundo de Pensão Multipatrocinado, Caixa de Previdência dos Funcionários do BEG (PREBEG), Fundação Bemgeprev, Itaubank Sociedade de Previdência Privada, UBB – Prev Previdência Complementar, and Fundação Banorte Manuel Baptista da Silva de Seguridade Social, closed-end private pension entities, that administer supplementary retirement plans sponsored by ITAÚ UNIBANCO HOLDING and/or its subsidiaries. |
| · | Fundação Itaú Social, Instituto Itaú Cultural, Instituto Unibanco, Instituto Assistencial Pedro Di Perna, Instituto Unibanco de Cinema, and Associação Clube “A”, entities sponsored by ITAÚ UNIBANCO and subsidiaries to act in their respective areas of interest. |
| · | Investments in unconsolidated companies (Note 12) – Porto Seguro Itaú Unibanco Participações S.A., SERASA S.A. and Banco BPI, SA.. |
Additionally, there are operations with entities under joint control, particularly Banco Investcred Unibanco S.A., Financeira Itaú CBD S.A. Crédito, Financiamento e Investimento, Luizacred S.A. Soc. Créd. Financiamento Investimento, FAI Financeira Americanas Itaú S.A. Crédito, Financiamento e Investimento, FIC Promotora de Vendas Ltda. and Ponto Frio Leasing S.A. Arrendamento Mercantil.
The transactions with these related parties are mainly as follows:
| | | | | ITAÚ UNIBANCO HOLDING CONSOLIDATED | |
| | | | | ASSETS/(LIABILITIES) | | | REVENUE/(EXPENSES) | |
| | Annual Rate | | 12/31/2011 | | | 12/31/2010 | | | 1/1/2010 | | | 01/01 to
12/31/2011 | | | 01/01 to
12/31/2010 | |
| Interbank deposits | | | | | 1,836 | | | | 726 | | | | 1,123 | | | | 189 | | | | 112 | |
| Financeira Itaú CBD S.A. Crédito, Financiamento e Investimento | | 103.90% of CDI10.58% to 13.79% Pre-fixed average 12.00% Pre-fixed | | | 619 | | | | 427 | | | | 338 | | | | 56 | | | | 35 | |
| FAI - Financeira Americanas Itaú S.A. Crédito, Financiamento e Investimento | | 103.90 of CDI 10.81% to 13.25% Pre-fixed average 11.94% Pre-fixed | | | 236 | | | | 282 | | | | 212 | | | | 31 | | | | 18 | |
| Luizacred S.A. Sociedade de Crédito, Financiamento e Investimento | | 103.90 of CDI 11.63% to 12.11% Pre-fixed average 11.92% Pre-fixed | | | 981 | | | | - | | | | 573 | | | | 102 | | | | 59 | |
| Other | | | | | - | | | | 17 | | | | - | | | | - | | | | - | |
| Deposits | | | | | (77 | ) | | | (93 | ) | | | (59 | ) | | | - | | | | (16 | ) |
| Duratex S.A. | | | | | (2 | ) | | | (46 | ) | | | (18 | ) | | | - | | | | - | |
| Elekeiroz S.A. | | | | | - | | | | (31 | ) | | | - | | | | - | | | | - | |
| Itautec S.A. | | | | | - | | | | (8 | ) | | | - | | | | - | | | | - | |
| Porto Seguro S.A. | | | | | - | | | | (2 | ) | | | - | | | | - | | | | (16 | ) |
| Financeira Itaú CBD S.A. Crédito, Financiamento e Investimento | | | | | (57 | ) | | | - | | | | - | | | | - | | | | - | |
| FAI Financeira Americanas Itaú S.A. Crédito, Financiamento e Investimento | | | | | (18 | ) | | | - | | | | - | | | | - | | | | - | |
| Ponto Frio Leasing S.A. Arrendamento Mercantil | | | | | - | | | | (5 | ) | | | - | | | | - | | | | - | |
| ITH Zux Cayman Company Ltd. | | | | | - | | | | - | | | | (41 | ) | | | - | | | | - | |
| Other | | | | | - | | | | (1 | ) | | | - | | | | - | | | | - | |
| Securities sold under repurchase agreements | | | | | (100 | ) | | | (104 | ) | | | (109 | ) | | | (21 | ) | | | (18 | ) |
| Maxfácil Participações S.A. | | 100% to the SELIC | | | (64 | ) | | | - | | | | - | | | | (7 | ) | | | - | |
| Itaúsa Empreendimentos S.A. | | | | | - | | | | (52 | ) | | | (48 | ) | | | - | | | | - | |
| Duratex S.A. | | | | | - | | | | (8 | ) | | | (19 | ) | | | (4 | ) | | | (2 | ) |
| Elekeiroz S.A. | | | | | - | | | | - | | | | (10 | ) | | | (3 | ) | | | (2 | ) |
| Itautec S.A. | | | | | - | | | | (18 | ) | | | - | | | | - | | | | - | |
| FIC Promotora de Venda Ltda. | | 100% to the SELIC | | | (6 | ) | | | (6 | ) | | | (4 | ) | | | (1 | ) | | | - | |
| Facilita Promotora S.A. | | 100% to the SELIC | | | (7 | ) | | | - | | | | (4 | ) | | | (1 | ) | | | - | |
| Olimpia Promoção e Serviços S.A. | | 100% to the SELIC | | | (2 | ) | | | (9 | ) | | | (13 | ) | | | - | | | | - | |
| Banco Investcred Unibanco S.A. | | 10,90%Pre-fixed | | | (14 | ) | | | (9 | ) | | | (2 | ) | | | (1 | ) | | | (1 | ) |
| Other | | 10,90%Pre-fixed | | | (7 | ) | | | (2 | ) | | | (9 | ) | | | (4 | ) | | | (13 | ) |
| Amounts receivable from (payable to) related companies | | | | | (98 | ) | | | (79 | ) | | | (65 | ) | | | - | | | | - | |
| Itaúsa Investimentos S.A. | | | | | - | | | | - | | | | (73 | ) | | | - | | | | - | |
| Porto Seguro S.A. | | | | | 11 | | | | 39 | | | | - | | | | - | | | | - | |
| Financeira Itaú CBD S.A. Crédito, Financiamento e Investimento | | | | | - | | | | 6 | | | | 2 | | | | - | | | | - | |
| FAI Financeira Americanas Itaú S.A. Crédito, Financiamento e Investimento | | | | | (1 | ) | | | (1 | ) | | | (2 | ) | | | - | | | | - | |
| Luizacred S.A. Sociedade de Crédito, Financiamento e Investimento | | | | | (1 | ) | | | (25 | ) | | | 2 | | | | - | | | | - | |
| Caixa de Prev.dos Func. do Banco Beg - PREBEG | | | | | (9 | ) | | | - | | | | - | | | | - | | | | - | |
| Fundação Bemgeprev | | | | | (3 | ) | | | (13 | ) | | | - | | | | - | | | | - | |
| UBB Prev Previdência Complementar | | | | | (19 | ) | | | (17 | ) | | | - | | | | - | | | | - | |
| Fundação Banorte Manuel Baptista da Silva de Seguridade Social | | | | | (76 | ) | | | (79 | ) | | | - | | | | - | | | | - | |
| Other | | | | | - | | | | 11 | | | | 6 | | | | - | | | | - | |
| Banking service fees (expenses) | | | | | - | | | | - | | | | - | | | | (16 | ) | | | 4 | |
| Fundação Itaubanco | | | | | - | | | | - | | | | - | | | | 21 | | | | 10 | |
| FUNBEP - Fundo de Pensão Multipatrocinado | | | | | - | | | | - | | | | - | | | | 5 | | | | 3 | |
| Itaúsa Investimentos S.A. | | | | | - | | | | - | | | | - | | | | 1 | | | | 1 | |
| Financeira Itaú CBD S.A. Crédito, Financiamento e Investimento | | | | | - | | | | - | | | | - | | | | (20 | ) | | | 2 | |
| FAI Financeira Americanas Itaú S.A. Crédito, Financiamento e Investimento | | | | | - | | | | - | | | | - | | | | (2 | ) | | | - | |
| Porto Seguro S.A. | | | | | - | | | | - | | | | - | | | | (26 | ) | | | (18 | ) |
| UBB Prev Previdência Complementar | | | | | - | | | | - | | | | - | | | | 1 | | | | 3 | |
| Other | | | | | - | | | | - | | | | - | | | | 4 | | | | 3 | |
| Rental revenues (expenses) | | | | | - | | | | - | | | | - | | | | (37 | ) | | | (29 | ) |
| Itaúsa Investimentos S.A. | | | | | - | | | | - | | | | - | | | | - | | | | (1 | ) |
| Fundação Itaubanco | | | | | - | | | | - | | | | - | | | | (27 | ) | | | (15 | ) |
| FUNBEP - Fundo de Pensão Multipatrocinado | | | | | - | | | | - | | | | - | | | | (10 | ) | | | (8 | ) |
| Paraná Companhia de Seguros | | | | | - | | | | - | | | | - | | | | - | | | | (4 | ) |
| Other | | | | | - | | | | - | | | | - | | | | - | | | | (1 | ) |
| Donation expenses | | | | | - | | | | - | | | | - | | | | (57 | ) | | | (45 | ) |
| Instituto Itaú Cultural | | | | | - | | | | - | | | | - | | | | (56 | ) | | | (44 | ) |
| Other | | | | | - | | | | - | | | | - | | | | (1 | ) | | | (1 | ) |
| Data processing expenses | | | | | - | | | | - | | | | - | | | | (315 | ) | | | (296 | ) |
| Itautec S.A. | | | | | - | | | | - | | | | - | | | | (315 | ) | | | (296 | ) |
| Other revenues | | | | | - | | | | - | | | | - | | | | 48 | | | | - | |
| Itaúsa | | | | | - | | | | - | | | | - | | | | 48 | | | | - | |
In addition to the aforementioned operations, ITAÚ UNIBANCO HOLDING and non-consolidated related parties, as an integral part of ITAÚ UNIBANCO HOLDING Agreement for Apportionment of Common Costs, recorded in General and Administrative Expenses - Other, the amount of R$ 8 (R$ 17 from 01/01 to 12/31/2010) due to of the use of the common structure.
Pursuant to the current rules, financial institutions cannot grant loans and leases to the following:
a) any individuals or companies that control the Institution or any entity under common control with the institution, or any executive officer, director, member of the fiscal council, or the immediate family members of these individuals;
b) any entity controlled by the institution; or
c) any entity in which the institution directly or indirectly holds more than 10% of the capital stock.
Therefore, no loans and leases were granted to any subsidiary, executive officer, director or their family members.
ITAÚ UNIBANCO HOLDING has made donations regularly to Fundação Itaú Social, a charitable foundation whose objectives are: to create the “Programa Itaú Social” (Itaú Social Program), aimed at coordinating activities of interest to the community, supporting and developing social, scientific and cultural projects, mainly in the elementary education and healthcare areas; to support ongoing projects or initiatives, supported or sponsored by entities qualified under "Programa Itaú Social”. ITAÚ UNIBANCO HOLDING is the founding partner and maintainer of Instituto Itaú Cultural - IIC, an entity whose purpose is the promotion and preservation of the Brazilian cultural heritage.
| b) | Compensation of the key management personnel |
Compensation for the period paid to key management members of ITAÚ UNIBANCO HOLDING consisted of:
| | | 01/01 to
12/31/2011 | | | 01/01 to
12/31/2010 | |
| Compensation | | | 271 | | | | 294 | |
| Board of Directors | | | 5 | | | | 3 | |
| Executives | | | 266 | | | | 291 | |
| Profit sharing | | | 192 | | | | 261 | |
| Board of Directors | | | 1 | | | | 2 | |
| Executives | | | 191 | | | | 259 | |
| Contributions to pension plans | | | 5 | | | | 8 | |
| Board of Directors | | | - | | | | 1 | |
| Executives | | | 5 | | | | 7 | |
| Stock option plan – Management members | | | 150 | | | | 128 | |
| Total | | | 618 | | | | 691 | |
NOTE 35 – MANAGEMENT OF FINANCIAL RISKS
Credit Risk
Credit risk is defined as the possibility of incurring financial losses in connection with: (i) the breach by the borrower or counterparty of their respective financial obligations under agreed conditions, (ii) the loss of value of a financial asset as result of the downgrade of the counterparty’s risk rating, (iii) the reduction in gains or income, concessions given on renegotiation of the financial assets and (iv) the costs of recovery.
ITAÚ UNIBANCO HOLDING manages credit risk with the objective of maximizing the risk and return ratio of its assets, maintaining the credit portfolio quality at levels appropriate to each market segment in which it operates. The strategy is aimed at creating value for stockholders greater than the minimum risk-adjusted return.
ITAÚ UNIBANCO HOLDING establishes its credit policies based on internal and external factors. Among the internal factors, we highlight the client rating criteria, analysis of evolution of the portfolios, observed levels of default, actual rates of return rates, the quality of the portfolio and allocated economic capital. External factors are related to the economic environment in Brazil and abroad, including factors such as market share, interest rates, market default indicators, inflation, and increase (or decrease) in levels of consumer spending.
The process for making decisions and establishing the credit policy of ITAÚ UNIBANCO HOLDING is designed to achieve coordinated credit actions and optimization of business opportunities, through a structure of committees and commissions. With respect to retail lending, decisions about granting and managing the credit portfolio are made based on scoring models that are continuously monitored. With respect to wholesale lending, several committees are subordinated to the Management Committee responsible for credit risk management through a structure of levels of approval that ensures detailed analysis of the risk of the transaction, as well as provides the necessary timeliness and flexibility for the approval process.
| 1. | Credit risk measurement |
| 1.1 | Loans to customers and interbank deposits |
ITAÚ UNIBANCO HOLDING takes into account three components to quantify the credit risk: the probability of default by the client or counterparty (PD), the estimated exposure in the event of default (EAD), and the potential for recovery on defaulted credits (LGD). Measurement and assessment of these risk components is part of the process for granting credit and for managing the portfolio.
The credit risk rating of customers and of economic groups reflect their probability of default, and is a fundamental element in the process for measuring risk, because it is used to determine the credit limits. The following table shows the relationship between the risk levels of the internal models (Strong, Satisfactory, Higher Risk, Impairment) of the Group and the probability of default associated with each of these levels.
| Internal Rating | | PD |
| Strong | | Lower than 4.44% |
| | | |
| Satisfactory | | From 4.44% up to 25.95% |
| | | |
| Higher Risk | | Higher than 25.95% |
| | | |
| Impairment | | Corporate operations with PD higher than 31.84% |
| | Operations past due for over 90 days |
| | Renegotiated operations past due for over 60 days |
The credit rating in corporate transactions is based on information such as economic and financial condition of the potential borrower, its cash-generating capabilities, the economic group to which it belongs, the current and prospective situation of the economic sector in which it operates, the collateral offered and the use of proceeds.
With respect to retail transactions (individuals and small and medium businesses), the rating is assigned based on statistical models of credit and behavior scoring in line with the Basel Committee requirements. Occasionally, an individual analysis of specific cases may be performed, in which case credit approval follows the applicable approval levels.
| 1.2 | | Government securities and other debt instruments |
Government securities and other debt instruments are classified according to their credit quality with the purpose of managing the credit risk exposures.
Itaú Unibanco Holding maintains control of credit risk on a centralized basis, whereas credit risk is managed on a decentralized basis by each business unit.
The centralized management of portfolios is maintained by an independent executive area responsible for controlling credit risk, which uses risk and performance indicators to analyze the credit portfolio on an aggregate basis, by business line, segment, product and other variables that it deems relevant.
This process aims at aligning the strategies established by the organization considering changes in the credit scenario.
The decentralized management of portfólios, focused on management, is performed by all credit áreas of the business units, which assess the portfólios on a detailed level.
The group strictly controls the credit exposure of clients and counterparties, taking action to address situations in which the actual exposure exceeds the desired one. For that purpose, the loan contracts include provisions in certain circumstances such as right to demand early payment or requirement of additional collateral.
| 3. | Collaterals and policies for mitigating credit risk |
ITAÚ UNIBANCO HOLDING manages collateral in order to reduce the amount of losses on transactions that present credit risk. Collaterals are used in order to enhance the potential for credit recovery in the event of default and not to reduce the exposure from clients or counterparties.
Collaterals are an important credit risk management tool, and for this reason, they are only accepted when they meet the criteria established by the Group.
ITAÚ UNIBANCO HOLDING ensures that any collateral kept is sufficient, legally valid (effective), enforceable and periodically reassessed.
ITAÚ UNIBANCO HOLDING also uses credit derivatives, such as single name CDS, to mitigate the risk of its portfolios of loans and securities; these instruments are priced based on models that use the fair value of market inputs, such as credit spreads, recovery rates, correlations and interest rates.
Commitments to grant credit (e.g. overdraft limits, pre-approved limits, commitments to grant credit, standby letters of credit, and other guarantees) represent undrawn amounts of loans available. The maximum exposure, considering the total utilization of the limits, is shown in the table below. The limits are continually monitored and changed according to customer behavior. Thus, the potential loss values represent a fraction of the amount available.
| 4. | Policy on the recognition of the allowance for loan losses |
The policies for recognition of the allowance for loan losses adopted by ITAÚ UNIBANCO HOLDING are aligned with the guidelines of IFRS and the Basel Accord. As a result, an allowance for loan losses is recognized as from moment when there are indications of the impairment of the portfolio and take into account a horizon of loss appropriate for each type of transaction. We consider as impaired loans overdue for more than 90 days, renegotiated loans overdue more than 60 days and corporate loans below a specific internal rating. Loans are written-down 360 days after such loans become past due or 540 days of being past due in the case of loans with original maturities over 36 months.
| | | 12/31/2011 | | | 12/31/2010 | | | 1/1/2010 | |
| | | Brazil | | | Abroad | | | Total | | | Brazil | | | Abroad | | | Total | | | Brazil | | | Abroad | | | Total | |
| Interbank deposits | | | 9,820 | | | | 18,001 | | | | 27,821 | | | | 4,684 | | | | 10,151 | | | | 14,835 | | | | 1,361 | | | | 16,438 | | | | 17,799 | |
| Securities purchased under agreements to resell | | | 91,643 | | | | 605 | | | | 92,248 | | | | 87,396 | | | | 1,286 | | | | 88,682 | | | | 135,026 | | | | 794 | | | | 135,820 | |
| Financial assets held for trading | | | 116,615 | | | | 5,274 | | | | 121,889 | | | | 101,815 | | | | 13,682 | | | | 115,497 | | | | 51,124 | | | | 4,428 | | | | 55,552 | |
| Financial assets designated at fair value through profit or loss | | | - | | | | 186 | | | | 186 | | | | - | | | | 306 | | | | 306 | | | | - | | | | 373 | | | | 373 | |
| Derivatives | | | 5,864 | | | | 2,890 | | | | 8,754 | | | | 5,571 | | | | 2,206 | | | | 7,777 | | | | 4,560 | | | | 1,029 | | | | 5,589 | |
| Available-for-sale financial assets | | | 7,323 | | | | 40,187 | | | | 47,510 | | | | 19,602 | | | | 24,937 | | | | 44,539 | | | | 23,407 | | | | 17,895 | | | | 41,302 | |
| Held-to-maturity financial assets | | | 2,500 | | | | 605 | | | | 3,105 | | | | 2,478 | | | | 692 | | | | 3,170 | | | | 1,643 | | | | 786 | | | | 2,429 | |
| Loan operations and lease operations | | | 251,034 | | | | 71,357 | | | | 322,391 | | | | 220,835 | | | | 54,008 | | | | 274,843 | | | | 187,032 | | | | 37,136 | | | | 224,168 | |
| Off balance sheet | | | 254,711 | | | | 14,830 | | | | 269,541 | | | | 214,962 | | | | 7,074 | | | | 222,036 | | | | 186,710 | | | | 4,273 | | | | 190,983 | |
| Endorsements and sureties | | | 48,908 | | | | 2,622 | | | | 51,530 | | | | 36,510 | | | | 1,864 | | | | 38,374 | | | | 31,055 | | | | 1,376 | | | | 32,431 | |
| Letters of credit | | | 11,172 | | | | - | | | | 11,172 | | | | 8,628 | | | | - | | | | 8,628 | | | | 5,704 | | | | - | | | | 5,704 | |
| Commitments to be released | | | 194,631 | | | | 12,208 | | | | 206,839 | | | | 169,824 | | | | 5,210 | | | | 175,034 | | | | 149,951 | | | | 2,897 | | | | 152,848 | |
| Mortgage loans | | | 14,308 | | | | - | | | | 14,308 | | | | 9,064 | | | | - | | | | 9,064 | | | | 6,291 | | | | - | | | | 6,291 | |
| Overdraft accounts | | | 91,904 | | | | - | | | | 91,904 | | | | 82,299 | | | | - | | | | 82,299 | | | | 54,744 | | | | - | | | | 54,744 | |
| Credit cards | | | 83,767 | | | | 489 | | | | 84,256 | | | | 72,034 | | | | 522 | | | | 72,556 | | | | 68,891 | | | | 506 | | | | 69,397 | |
| Other pre-approved limits | | | 4,652 | | | | 11,719 | | | | 16,371 | | | | 6,427 | | | | 4,688 | | | | 11,115 | | | | 20,025 | | | | 2,391 | | | | 22,416 | |
| Total | | | 739,510 | | | | 153,935 | | | | 893,445 | | | | 657,343 | | | | 114,342 | | | | 771,685 | | | | 590,863 | | | | 83,152 | | | | 674,015 | |
The table presents the maximum exposure at December 31, 2011 and 2010, without considering any collateral received or other additional credits improvements.
For assets recognized in the balance sheet, the exposures presented are based on net carrying amounts. This analysis includes only financial assets subject to credit risk and excludes non-financial assets.
The contractual amounts of endorsements and sureties and letters of credit represent the maximum potential of credit risk in the event the counterparty does not meet the terms of the agreement. The vast majority of commitments (real estate loans, overdraft accounts, credit card and other pré-approved limits) mature without being drawn, since they are renewed monthly and we have the power to cancel them at any time. As a result, the total contractual amount does not represent our effective future exposure to credit risk or the liquidity needs arising from such commitments.
As shown in the table, the most significant exposures correspond to loan operations, financial assets held for trading and securities purchased under agreements to resell, in addition to sureties, endorsements and other commitments..
The maximum exposure to the quality of the financial assets presented highlights that:
| · | 78% of total loan operations and other financial assets exposure (Tables 6.1 and 6.1.2) are categorized as low probability of default in accordance with our internal rating, further more. |
| · | only 7.3% of the total loans exposure (Table 6.1) is represented by overdue credits not impaired. |
| · | 5.4% of the total loans exposure (Table 6.1) corresponds to overdue loans impaired. |
| 5.1) | Maximum exposure of financial assets segregated by business sector |
| a) | Loan operations and lease operations |
| | | 12/31/2011 | | | % | | | 12/31/2010 | | | % | | | 1/1/2010 | | | % | |
| Public sector | | | 1,990 | | | | 0.57 | % | | | 1,138 | | | | 0.39 | % | | | 1,620 | | | | 0.66 | % |
| Industry and commerce | | | 99,859 | | | | 28.85 | % | | | 84,997 | | | | 28.82 | % | | | 67,902 | | | | 27.78 | % |
| Services | | | 70,642 | | | | 20.40 | % | | | 60,295 | | | | 20.45 | % | | | 48,657 | | | | 19.91 | % |
| Primary sector | | | 16,109 | | | | 4.65 | % | | | 13,933 | | | | 4.73 | % | | | 13,299 | | | | 5.44 | % |
| Individuals | | | 156,167 | | | | 45.10 | % | | | 132,289 | | | | 44.86 | % | | | 111,657 | | | | 45.69 | % |
| Other sectors | | | 1,497 | | | | 0.43 | % | | | 2,185 | | | | 0.75 | % | | | 1,278 | | | | 0.52 | % |
| Total | | | 346,264 | | | | 100.00 | % | | | 294,837 | | | | 100.00 | % | | | 244,413 | | | | 100.00 | % |
| b) | Other financial assets (*) |
| | | 12/31/2011 | | | % | | | 12/31/2010 | | | % | | | 1/1/2010 | | | % | |
| Primary sector | | | 1,029 | | | | 0.34 | % | | | 581 | | | | 0.21 | % | | | 1,572 | | | | 0.61 | % |
| Public sector | | | 88,174 | | | | 29.26 | % | | | 85,364 | | | | 31.07 | % | | | 52,709 | | | | 20.37 | % |
| Industry and commerce | | | 5,381 | | | | 1.78 | % | | | 5,614 | | | | 2.04 | % | | | 2,932 | | | | 1.13 | % |
| Services | | | 72,281 | | | | 23.97 | % | | | 72,491 | | | | 26.38 | % | | | 44,872 | | | | 17.33 | % |
| Other sectors | | | 14,574 | | | | 4.83 | % | | | 7,218 | | | | 2.63 | % | | | 3,130 | | | | 1.21 | % |
| Individuals | | | 5 | | | | 0.00 | % | | | 21 | | | | 0.01 | % | | | 30 | | | | 0.01 | % |
| Financial | | | 120,069 | | | | 39.82 | % | | | 103,517 | | | | 37.66 | % | | | 153,619 | | | | 59.34 | % |
| Total | | | 301,513 | | | | 100.00 | % | | | 274,806 | | | | 100.00 | % | | | 258,864 | | | | 100.00 | % |
(*) Includes financial assets held for trading, derivatives, assets designated at fair value through profit or loss, available-for-sale financial assets, held-to-maturity financial assets, interbank deposits and securities purchased under agreements to resell.
| c) | The credit risks of "off balance sheet" items (endorsements and sureties, letters of credit and commitments to be released) are not categorized or managed by business sector. |
6. Credit quality of financial assets
6.1 The following table shows the breakdown of loans considering: loans neither overdue nor impaired and loans overdue not impaired and loans impaired:
| | | 12/31/2011 | | | 12/31/2010 | | | 01/01/2010 | |
| Internal Rating | | Loans neither overdue nor impaired | | | Loans overdue not impaired | | | Loans impaired | | | Total loans | | | Loans neither overdue nor impaired | | | Loans overdue not impaired | | | Loans
impaired | | | Total loans | | | Loans neither overdue nor impaired | | | Loans overdue not impaired | | | Loans
impaired | | | Total loans | |
| Lower Risk | | | 221,315 | | | | 5,800 | | | | - | | | | 227,115 | | | | 195,988 | | | | 4,346 | | | | - | | | | 200,334 | | | | 142,004 | | | | 9,763 | | | | - | | | | 151,767 | |
| Satisfactory | | | 63,763 | | | | 10,921 | | | | - | | | | 74,684 | | | | 52,561 | | | | 8,053 | | | | - | | | | 60,614 | | | | 57,677 | | | | 3,580 | | | | - | | | | 61,257 | |
| Higher Risk | | | 16,910 | | | | 8,703 | | | | - | | | | 25,613 | | | | 13,663 | | | | 6,348 | | | | - | | | | 20,011 | | | | 12,259 | | | | 5,103 | | | | - | | | | 17,362 | |
| Impairment | | | - | | | | - | | | | 18,852 | | | | 18,852 | | | | - | | | | - | | | | 13,878 | | | | 13,878 | | | | - | | | | - | | | | 14,027 | | | | 14,027 | |
| Total | | | 301,988 | | | | 25,424 | | | | 18,852 | | | | 346,264 | | | | 262,212 | | | | 18,747 | | | | 13,878 | | | | 294,837 | | | | 211,940 | | | | 18,446 | | | | 14,027 | | | | 244,413 | |
| % | | | 87.3 | % | | | 7.3 | % | | | 5.4 | % | | | 100.0 | % | | | 88.9 | % | | | 6.4 | % | | | 4.7 | % | | | 100 | % | | | 86.8 | % | | | 7.5 | % | | | 5.7 | % | | | 100 | % |
The following table shows the breakdown of loans by portfolios of segments and classes, based on indicators of credit quality:
| | | 12/31/2011 | | | 12/31/2010 | | | 01/01/2010 | |
| | | Lower Risk | | | Satisfactory | | | Higher Risk | | | Impairment | | | TOTAL | | | Lower Risk | | | Satisfactory | | | Higher Risk | | | Impairment | | | TOTAL | | | Lower Risk | | | Satisfactory | | | Higher Risk | | | Impairment | | | TOTAL | |
| Individuals | | | 73,354 | | | | 49,320 | | | | 14,467 | | | | 10,986 | | | | 148,127 | | | | 65,564 | | | | 41,080 | | | | 10,057 | | | | 8,086 | | | | 124,787 | | | | 58,831 | | | | 26,924 | | | | 12,750 | | | | 8,527 | | | | 107,032 | |
| Credit cards | | | 19,332 | | | | 13,061 | | | | 3,485 | | | | 3,083 | | | | 38,961 | | | | 15,538 | | | | 12,142 | | | | 2,950 | | | | 2,411 | | | | 33,041 | | | | 12,627 | | | | 10,571 | | | | 2,104 | | | | 2,446 | | | | 27,748 | |
| Personal | | | 7,765 | | | | 15,985 | | | | 8,048 | | | | 3,455 | | | | 35,253 | | | | 10,129 | | | | 7,001 | | | | 4,203 | | | | 2,195 | | | | 23,528 | | | | 6,593 | | | | 7,018 | | | | 4,890 | | | | 2,686 | | | | 21,187 | |
| Vehicles | | | 33,934 | | | | 19,357 | | | | 2,843 | | | | 4,329 | | | | 60,463 | | | | 32,321 | | | | 21,666 | | | | 2,849 | | | | 3,315 | | | | 60,151 | | | | 37,011 | | | | 7,493 | | | | 5,139 | | | | 3,206 | | | | 52,849 | |
| Mortgage loans | | | 12,323 | | | | 917 | | | | 91 | | | | 119 | | | | 13,450 | | | | 7,576 | | | | 271 | | | | 55 | | | | 165 | | | | 8,067 | | | | 2,600 | | | | 1,842 | | | | 617 | | | | 189 | | | | 5,248 | |
| | | | | | | | | | | | | | | | | | | | | | | | | | | | | | | | | | | | | | | | | | | | | | | | | | | | | | | | | | | | | |
| Corporate | | | 88,353 | | | | 3,500 | | | | 343 | | | | 1,033 | | | | 93,229 | | | | 73,051 | | | | 2,505 | | | | 143 | | | | 884 | | | | 76,583 | | | | 47,484 | | | | 2,084 | | | | 229 | | | | 631 | | | | 50,428 | |
| | | | | | | | | | | | | | | | | | | | | | | | | | | | | | | | | | | | | | | | | | | | | | | | | | | | | | | | | | | | | |
| Small and Medium Businesses | | | 51,548 | | | | 17,444 | | | | 9,887 | | | | 6,770 | | | | 85,649 | | | | 48,254 | | | | 17,029 | | | | 9,811 | | | | 4,856 | | | | 79,950 | | | | 38,565 | | | | 28,947 | | | | 3,616 | | | | 4,796 | | | | 75,924 | |
| | | | | | | | | | | | | | | | | | | | | | | | | | | | | | | | | | | | | | | | | | | | | | | | | | | | | | | | | | | | | |
| Foreign Loans and Latin America | | | 13,860 | | | | 4,420 | | | | 916 | | | | 63 | | | | 19,259 | | | | 13,465 | | | | - | | | | - | | | | 52 | | | | 13,517 | | | | 6,887 | | | | 3,302 | | | | 767 | | | | 73 | | | | 11,029 | |
| Total | | | 227,115 | | | | 74,684 | | | | 25,613 | | | | 18,852 | | | | 346,264 | | | | 200,334 | | | | 60,614 | | | | 20,011 | | | | 13,878 | | | | 294,837 | | | | 151,767 | | | | 61,257 | | | | 17,362 | | | | 14,027 | | | | 244,413 | |
| % | | | 65.6 | % | | | 21.6 | % | | | 7.4 | % | | | 5.4 | % | | | 100.0 | % | | | 67.9 | % | | | 20.6 | % | | | 6.8 | % | | | 4.7 | % | | | 100.0 | % | | | 62.1 | % | | | 25.1 | % | | | 7.1 | % | | | 5.7 | % | | | 100.0 | % |
The following table shows the breakdown of loans neither overdue nor impaired, by portfolios of segments and classes, based on indicators of credit quality:
| | | 12/31/2011 | | | 12/31/2010 | | | 01/01/2010 | |
| | | Lower Risk | | | Satisfactory | | | Higher Risk | | | Total | | | Lower Risk | | | Satisfactory | | | Higher Risk | | | Total | | | Lower Risk | | | Satisfactory | | | Higher Risk | | | Total | |
| I – Individually-evaluated | | | | | | | | | | | | | | | | | | | | | | | | | | | | | | | | | | | | | | | | | | | | | | | | |
| | | | | | | | | | | | | | | | | | | | | | | | | | | | | | | | | | | | | | | | | | | | | | | | | |
| Corporate | | | 86,992 | | | | 3,423 | | | | 314 | | | | 90,729 | | | | 72,602 | | | | 2,499 | | | | 134 | | | | 75,235 | | | | 47,017 | | | | 1,998 | | | | 200 | | | | 49,215 | |
| | | | | | | | | | | | | | | | | | | | | | | | | | | | | | | | | | | | | | | | | | | | | | | | | |
| II – Collectively-evaluated | | | | | | | | | | | | | | | | | | | | | | | | | | | | | | | | | | | | | | | | | | | | | | | | |
| | | | | | | | | | | | | | | | | | | | | | | | | | | | | | | | | | | | | | | | | | | | | | | | | |
| Individuals | | | 70,501 | | | | 40,321 | | | | 8,952 | | | | 119,774 | | | | 62,956 | | | | 33,892 | | | | 6,256 | | | | 103,104 | | | | 51,361 | | | | 25,400 | | | | 8,826 | | | | 85,587 | |
| Credit card | | | 19,245 | | | | 12,580 | | | | 2,503 | | | | 34,328 | | | | 15,447 | | | | 11,571 | | | | 2,083 | | | | 29,101 | | | | 11,971 | | | | 10,049 | | | | 1,600 | | | | 23,620 | |
| Personal loans | | | 7,648 | | | | 14,893 | | | | 5,870 | | | | 28,411 | | | | 9,816 | | | | 6,447 | | | | 3,178 | | | | 19,441 | | | | 6,076 | | | | 6,808 | | | | 3,793 | | | | 16,677 | |
| Vehicles | | | 31,516 | | | | 12,248 | | | | 565 | | | | 44,329 | | | | 30,327 | | | | 15,752 | | | | 976 | | | | 47,055 | | | | 30,793 | | | | 6,857 | | | | 2,992 | | | | 40,642 | |
| Mortgage loans | | | 12,092 | | | | 600 | | | | 14 | | | | 12,706 | | | | 7,366 | | | | 122 | | | | 19 | | | | 7,507 | | | | 2,521 | | | | 1,686 | | | | 441 | | | | 4,648 | |
| | | | | | | | | | | | | | | | | | | | | | | | | | | | | | | | | | | | | | | | | | | | | | | | | |
| Small and medium businesses | | | 50,774 | | | | 15,899 | | | | 6,828 | | | | 73,501 | | | | 47,789 | | | | 16,170 | | | | 7,273 | | | | 71,232 | | | | 37,241 | | | | 27,214 | | | | 2,663 | | | | 67,118 | |
| | | | | | | | | | | | | | | | | | | | | | | | | | | | | | | | | | | | | | | | | | | | | | | | | |
| Foreign loans and Latin America | | | 13,048 | | | | 4,120 | | | | 816 | | | | 17,984 | | | | 12,641 | | | | - | | | | - | | | | 12,641 | | | | 6,385 | | | | 3,065 | | | | 570 | | | | 10,020 | |
| | | | | | | | | | | | | | | | | | | | | | | | | | | | | | | | | | | | | | | | | | | | | | | | | |
| Total | | | 221,315 | | | | 63,763 | | | | 16,910 | | | | 301,988 | | | | 195,988 | | | | 52,561 | | | | 13,663 | | | | 262,212 | | | | 142,004 | | | | 57,677 | | | | 12,259 | | | | 211,940 | |
6.1.1 Loan operations overdue not impaired, by portfolios of segments and classes, are classified by maturity as follows:
| | | 12/31/2011 | | | 12/31/2010 | | | 01/01/2010 | |
| | | Overdue up to 30 days | | | Overdue from 31 to 60 days | | | Overdue from 61 to 90 days | | | Total | | | Overdue up to 30 days | | | Overdue from 31 to 60 days | | | Overdue from 61 to 90 days | | | Total | | | Overdue up to 30 days | | | Overdue from 31 to 60 days | | | Overdue from 61 to 90 days | | | Total | |
| Individuals | | | 11,764 | | | | 4,112 | | | | 1,491 | | | | 17,367 | | | | 9,234 | | | | 3,280 | | | | 1,091 | | | | 13,605 | | | | 8,576 | | | | 3,129 | | | | 1,215 | | | | 12,920 | |
| Credit cards | | | 805 | | | | 344 | | | | 401 | | | | 1,550 | | | | 871 | | | | 352 | | | | 306 | | | | 1,529 | | | | 1,013 | | | | 346 | | | | 323 | | | | 1,682 | |
| Personal | | | 2,056 | | | | 871 | | | | 460 | | | | 3,387 | | | | 1,227 | | | | 507 | | | | 202 | | | | 1,936 | | | | 1,194 | | | | 465 | | | | 218 | | | | 1,877 | |
| Vehicles | | | 8,456 | | | | 2,760 | | | | 589 | | | | 11,805 | | | | 6,851 | | | | 2,331 | | | | 564 | | | | 9,746 | | | | 6,106 | | | | 2,203 | | | | 640 | | | | 8,949 | |
| Mortgage loans | | | 447 | | | | 137 | | | | 41 | | | | 625 | | | | 285 | | | | 90 | | | | 19 | | | | 394 | | | | 263 | | | | 115 | | | | 34 | | | | 412 | |
| | | | | | | | | | | | | | | | | | | | | | | | | | | | | | | | | | | | | | | | | | | | | | | | | |
| Corporate | | | 1,232 | | | | 185 | | | | 51 | | | | 1,468 | | | | 367 | | | | 55 | | | | 42 | | | | 464 | | | | 281 | | | | 140 | | | | 161 | | | | 582 | |
| | | | | | | | | | | | | | | | | | | | | | | | | | | | | | | | | | | | | | | | | | | | | | | | | |
| Small and Medium Businesses | | | 3,433 | | | | 1,349 | | | | 596 | | | | 5,378 | | | | 2,275 | | | | 1,114 | | | | 473 | | | | 3,862 | | | | 2,763 | | | | 846 | | | | 399 | | | | 4,008 | |
| | | | | | | | | | | | | | | | | | | | | | | | | | | | | | | | | | | | | | | | | | | | | | | | | |
| Foreign Loans and Latin America | | | 1,144 | | | | 41 | | | | 26 | | | | 1,211 | | | | 771 | | | | 31 | | | | 14 | | | | 816 | | | | 824 | | | | 80 | | | | 32 | | | | 936 | |
| Total | | | 17,573 | | | | 5,687 | | | | 2,164 | | | | 25,424 | | | | 12,647 | | | | 4,480 | | | | 1,620 | | | | 18,747 | | | | 12,444 | | | | 4,195 | | | | 1,807 | | | | 18,446 | |
6.1.2 The table below shows other financial assets, individually evaluated, classified by rating:
| | | 12/31/2011 | |
| Internal Rating | | Interbank deposits and securities purchased under agreements to resell | | | Held for trading financial assets | | | Financial assets designated at fair value through profit or loss | | | Derivatives assets | | | Available-for- sale financial assets | | | Held-to-maturity financial assets | | | Total | |
| Lower Risk | | | 120,069 | | | | 111,938 | | | | 186 | | | | 4,750 | | | | 26,849 | | | | 3,101 | | | | 266,893 | |
| Satisfactory | | | - | | | | 9,197 | | | | - | | | | 3,742 | | | | 20,580 | | | | 4 | | | | 33,523 | |
| Higher Risk | | | - | | | | 754 | | | | - | | | | 262 | | | | 81 | | | | - | | | | 1,097 | |
| Total | | | 120,069 | | | | 121,889 | | | | 186 | | | | 8,754 | | | | 47,510 | | | | 3,105 | | | | 301,513 | |
| % | | | 39.8 | % | | | 40.4 | % | | | 0.1 | % | | | 2.9 | % | | | 15.8 | % | | | 1.0 | % | | | 100.0 | % |
| | | 12/31/2010 | |
| Internal Rating | | Interbank deposits and securities purchased under agreements to
resell | | | Held for trading financial assets | | | Financial assets designated at fair value through profit or loss | | | Derivatives assets | | | Available-for- sale financial assets | | | Held-to-maturity financial assets | | | Total | |
| Lower Risk | | | 103,517 | | | | 107,798 | | | | 306 | | | | 5,140 | | | | 22,055 | | | | 3,163 | | | | 241,979 | |
| Satisfactory | | | - | | | | 7,564 | | | | - | | | | 2,577 | | | | 22,428 | | | | 7 | | | | 32,576 | |
| Higher Risk | | | - | | | | 135 | | | | - | | | | 60 | | | | 56 | | | | - | | | | 251 | |
| Total | | | 103,517 | | | | 115,497 | | | | 306 | | | | 7,777 | | | | 44,539 | | | | 3,170 | | | | 274,806 | |
| % | | | 37.7 | % | | | 42.0 | % | | | 0.1 | % | | | 2.8 | % | | | 16.2 | % | | | 1.2 | % | | | 100.0 | % |
| | | 01/01/2010 | |
| Internal Rating | | Interbank deposits and securities purchased under agreements to
resell | | | Held for trading financial assets | | | Financial assets designated at fair value through profit or loss | | | Derivatives assets | | | Available-for- sale financial assets | | | Held-to-maturity financial assets | | | Total | |
| Lower Risk | | | 153,619 | | | | 27,565 | | | | 373 | | | | 377 | | | | 23,439 | | | | 2,358 | | | | 207,731 | |
| Satisfactory | | | - | | | | 24,319 | | | | - | | | | 5,212 | | | | 17,710 | | | | 71 | | | | 47,312 | |
| Higher Risk | | | - | | | | 3,668 | | | | - | | | | - | | | | 153 | | | | - | | | | 3,821 | |
| Total | | | 153,619 | | | | 55,552 | | | | 373 | | | | 5,589 | | | | 41,302 | | | | 2,429 | | | | 258,864 | |
| % | | | 59.3 | % | | | 21.5 | % | | | 0.1 | % | | | 2.2 | % | | | 16.0 | % | | | 0.9 | % | | | 100.0 | % |
6.1.3 Collateral held for loan and lease operations
| | | 12/31/2011 | | | 12/31/2010 | | | 1/1/2010 | |
| Financial effect of collateral | | (I) Over-collateralised assets | | | (II) Under-collateralised assets | | | (I) Over-collateralised assets | | | (II) Under-collateralised assets | | | (I) Over-collateralised assets | | | (II) Under-collateralised assets | |
| | | Carrying value
of the assets | | | Fair value of
collateral | | | Carrying value
of the assets | | | Fair value of
collateral | | | Carrying value
of the assets | | | Fair value of
collateral | | | Carrying value
of the assets | | | Fair value of
collateral | | | Carrying value
of the assets | | | Fair value of
collateral | | | Carrying value
of the assets | | | Fair value of
collateral | |
| Loans to individuals | | | 75,802 | | | | 152,646 | | | | 30 | | | | 19 | | | | 70,111 | | | | 98,605 | | | | 12 | | | | 10 | | | | 54,425 | | | | 67,384 | | | | 2 | | | | 1 | |
| Personal Loans | | | 1,136 | | | | 2,735 | | | | 25 | | | | 15 | | | | 85 | | | | 303 | | | | 12 | | | | 10 | | | | 258 | | | | 568 | | | | 2 | | | | 1 | |
| Vehicles | | | 61,274 | | | | 88,881 | | | | 5 | | | | 4 | | | | 62,910 | | | | 79,866 | | | | - | | | | - | | | | 50,152 | | | | 56,268 | | | | - | | | | - | |
| Mortgage Loans | | | 13,392 | | | | 61,030 | | | | - | | | | - | | | | 7,116 | | | | 18,436 | | | | - | | | | - | | | | 4,015 | | | | 10,548 | | | | - | | | | - | |
| | | | | | | | | | | | | | | | | | | | | | | | | | | | | | | | | | | | | | | | | | | | | | | | | |
| Companies | | | 146,817 | | | | 269,179 | | | | 30,373 | | | | 12,504 | | | | 120,279 | | | | 246,473 | | | | 6,774 | | | | 5,018 | | | | 108,538 | | | | 232,544 | | | | 5,819 | | | | 3,011 | |
| | | | | | | | | | | | | | | | | | | | | | | | | | | | | | | | | | | | | | | | | | | | | | | | | |
| Argentina/Chile/Uruguay/Paraguay | | | - | | | | - | | | | 19,259 | | | | 13,497 | | | | - | | | | - | | | | 13,509 | | | | 12,479 | | | | - | | | | - | | | | 11,015 | | | | 8,523 | |
| | | | | | | | | | | | | | | | | | | | | | | | | | | | | | | | | | | | | | | | | | | | | | | | | |
| Total of collateral and loans and lease operations | | | 222,619 | | | | 421,825 | | | | 49,662 | | | | 26,020 | | | | 190,390 | | | | 345,078 | | | | 20,295 | | | | 17,507 | | | | 162,963 | | | | 299,928 | | | | 16,836 | | | | 11,535 | |
The difference between the total loan portfolio and the collateralized loan portfolio is generated by noncollateralized loans amounting to R$ 73,983 as of 12/31/2011 (R$ 84,152 as of 12/31/2010 and R$ 64,614 as of 01/01/2010).
ITAÚ UNIBANCO HOLDING uses collateral to reduce the occurrence of losses in operations with credit risk, manages and regularly reviews its collateral with the objective that collateral held is sufficient, legally exercisable (effective) and feasible. Thus, collateral is used to maximize the recuperability potential of impaired loans and not to reduce the exposure value of customers and counterparties.
Loans to individuals
Personal Loans - This category of credit products usually requires collaterals, focusing on endorsements and sureties.
Vehicles - For this type of operation clientes assets server as collateral, which is also the leased assets in leasing operations.
Mortgage Loans - Buildings themselves are given in guarantee.
Companies - For those operations it can be used any collateral within the credit policy of ITAÚ UNIBANCO HOLDING (Chattel Mortgage, Assignment Trust, Surety/debtor outreach, Mortgage and others).
Argentina/Chile/Uruguay/Paraguay - For those operations it can be used any collateral within the credit policy of ITAÚ UNIBANCO HOLDING (Chattel Mortgage, Assignment Trust, Surety/debtor outresch, Mortgage and others).
7. Renegotiated loan operations
Renegotiation activities include agreements for changes in maturities, payment schedules and deferral of payments. After the restructuring, the client status (previously overdue) is no longer considered to be past due and is rated (considering all available information including the renegotiation) in the appropriate rating category. Renegotiated credit operations that would otherwise be overdue totaled R$ 14,570 (R$ 9,032 at December 31, 2010 and R$ 7,669 at January 1, 2010).
8. Repossessed assets
Repossessed assets are recognized as assets when possession is effectively obtained.
Assets received from the foreclosure of loans, including real estate, are initially recorded at the lower of: (i) the fair value of the asset less the estimated selling expenses, and (ii) the carrying amount of the loan.
Further impairment of assets is recorded as a provision, with a corresponding charge to income. The maintenance costs of these assets are expensed as incurred.
The policy for sales of these assets (assets not for use) includes periodic auctions that are announced in advance and considers that the assets cannot be held for more than one year as stipulated by the BACEN. This period may be extended at the discretion of BACEN.
The amounts below represent total assets repossessed in the periods January 1 to December 31, 2011 and 2010.
| | | 01/01 to
12/31/2011 | | | 01/01 to
12/31/2010 | |
| Real estate not for own use | | | 8 | | | | 3 | |
| Residential properties – mortgage loans | | | 34 | | | | 21 | |
| Vehicles – linked to loan operations | | | 4 | | | | 68 | |
| Other (vehicles/real estate/equipment) – payment in kind | | | 1 | | | | 2 | |
| Total | | | 47 | | | | 94 | |
Market risk
Market risk is the possibility of losses resulting from fluctuations in the market values of positions held by a financial institution, including risks of transactions subject to variations in foreign exchange and interest rates, share and commodity prices.
Market risk management is the process through which the institution plans, monitors and controls risks arising from changes in market prices of financial instruments, aiming at maximizing the risk-return ratio through adequate limit structure, models and management tools.
ITAÚ UNIBANCO HOLDING uses proprietary systems to measure the consolidated market risk. The processing of these systems basically takes place in São Paulo, in an access-controlled, of high availability, environment, with data safekeeping and recovery processes, and counts on such an infrastructure to ensure the continuity of business in contingency (disaster recovery) situations. The use of market solutions is currently in analysis to supplement the risk technology architecture as part of the evolutionary process that will meet any future regulatory and managerial requirements.
The market risk control exercised by ITAÚ UNIBANCO HOLDING includes all financial instruments of its subsidiaries. Accordingly, its market risk management policy is in line with the principles of CMN Resolution No. 3,464, of June 26, 2007, comprising a set of principles that drive the institution’s strategy of control and management of market risks in all business units and legal entities of ITAÚ UNIBANCO HOLDING.
The guidelines set forth by the internal policy on market risk management may be viewed on the websitewww.itau-unibanco.com.br/ri, in the section Corporate Governance/Rules and Policies/Public Access Report - Market Risk.
The strategy of ITAÚ UNIBANCO HOLDING is based on the comprehensive and complementary use of methods, as well as quantitative tools to estimate, monitor and manage risks, based on the best market practices.
In this context, the risk management strategy of ITAÚ UNIBANCO HOLDING aims at achieving a balance between business objectives, considering the following:
| · | Political, economic and market context. |
| · | Market risk portfolio of the institution. |
| · | Expertise to operate in specific markets. |
The market risk is controlled by an area independent from the business areas, which is responsible for carrying out daily measurement, assessment and reporting activities through control units operating in the different legal entities OF ITAÚ UNIBANCO HOLDING. Moreover, it also carries out the consolidated monitoring, assessment and reporting of market risk information, including possible exceeding risk limits, by reporting any such event to the business unit in charge and following up the actions required for adjusting the position and/or risk level. For that purpose, the bank has a structured reporting and information process, with the objective of providing input for the follow-up by senior-level committees and complying with the requirements of Brazilian and foreign regulatory agencies.
The market risk control and management process is periodically reviewed with the purpose of keeping the process aligned with best market practices and complying with continuous improvement processes at ITAÚ UNIBANCO HOLDING.
According to the criteria for classification of operations provided for in BACEN Resolution No. 3,464 of June 26, 2007, and Circular No. 3,354, of June 27, 2007, and the New Capital Accord – Basel II, the financial instruments, including all transactions with derivatives, are segmented into Trading and Banking portfolios. Market risk measurement is performed observing this segmentation.
The trading portfolio consists of all transactions, including derivatives, which are entered into with the intention of trading or hedging other financial instruments of this portfolio, and which are not subject to trading restrictions. These are transactions expected to benefit from changes in expected or actual prices in the short term, or for entering into arbitrage activities.
The banking portfolio consists of all transactions not classified in the trading book. These are transactions not intended for trading in the short term and their respective hedges, as well as transactions entered into for the active management of financial risks that may or may not be carried out with derivatives.
ITAÚ UNIBANCO HOLDING hedges transactions with clients and proprietary positions, including foreign investments, aiming at mitigating risks arising from fluctuations in significant market factors and adjusting the transactions into the current exposure limits. Derivatives are the most frequently used instruments for these hedges. When these transactions are designated for as hedge accounting, specific supporting documentation is prepared, including the continuous review of the hedge effectiveness and other changes in the accounting process (retrospective and prospective) and other changes in the accounting process, as defined by ITAÚ UNIBANCO HOLDING internal policies.
The exposures to market risks of products, including derivatives, are broken down into risk factors. A risk factor refers to a market benchmark whose change results in an impact on income, and the main risk factors measured by ITAÚ UNIBANCO HOLDING are:
| · | Interest rates risk: risk of financial losses on operations subject to changes in interest rates, including the following: |
| - | Fixed rates in Brazilian reais. |
| - | Rates of interest rate coupon. |
| · | Foreign exchange linked interest rate: risk of losses on positions in operations subject to foreign currency coupon rate. |
| · | Foreign exchange: risk of losses on positions in foreign currency in operations subject to foreign exchange variation. |
| · | Price indices: risk of financial losses on operations subject to changes in price index coupon rates. |
| · | Shares: risk of loss on transactions subject to changes in share prices. |
The process for managing market risks of ITAÚ UNIBANCO HOLDING occurs within the governance and hierarchy of committees and limits approved specifically for this purpose, and that covers from the monitoring of aggregate indicators of risk, to the monitoring of granular limits, assuring effectiveness and coverage of control. These limits are dimensioned considering the projected results of the balance sheet, the level of equity and the profile of risk of each legal entity, which are defined in terms of risk measures used by management. Limits are monitored daily and excesses are reported and discussed in the corresponding committees.
In this last quarter, ITAÚ UNIBANCO HOLDING improved its structure to control market risk limits, by making it more detailed and aligned with the business structure, segregating metrics into risk factors groups, according to the business areas. This new limit control structure aims at:
| · | providing more assurance to all executive levels that the assumption of market risks is in line with the bank’s and the risk-return objective, by conducting an organized and educated dialogue on the risk profile and its development. |
| · | increasing transparency on the way the business seeks the optimization of results. |
| · | providing early warning mechanisms in order to make the effective risk management easier, without jeopardizing the business purposes. |
| · | avoiding risk concentration. |
In this control structure, the limits, now even more detailed, are monitored and the limit reached warning trigger decision-making discussions on positions.
Market risk is analyzed based on the following metrics:
| · | Statistical value at risk (VaR - Value at Risk): statistical metric that estimates the expected maximum potential economic loss under normal market conditions, taking into consideration a defined time horizon and confidence level; Aplied to the risk factors group. |
| · | Losses in stress scenarios (Stress Test): simulation technique to assess the behavior of assets and liabilities of a portfolio when several risk factors are taken to extreme market situations (based in prospective scenarios) in the portfolio. |
| · | Stop loss alert: effective losses added to the potential maximum loss in optimistic and pessimistic scenarios. |
| · | Unrealized result analysis (RaR): assessment of the difference between the accrued interest amount and the fair value, in normal and stress scenarios, reflecting the accounting asymmetries. It is the risk measure used to evaluate the banking portfolio risk at management level. |
| · | Earnings at Risk (EaR): a measure quantifying the impact on earnings in the balance sheet in adverse situations of changes in interest rates. |
In addition to the risk measures, sensitivity and loss control measures are also analyzed. They include:
| · | Gap analysis: accumulated exposure, by risk factor, of cash flows expressed at market value, allocated at the maturity dates. |
| · | Sensitivity (DV01- Discount Value): the impact on the cash flows market value when submitted to an one annual basis point increase in the current interest rates; Applied to the risk factors group. |
| · | Sensitivity to the Several Risk Factors (Gregas) – partial derivatives of an options portfolio in relation to the underlying asset price, implicit volatility, interest rate and timing. |
| · | Stop loss: the maximum loss that transactions classified in the trading book may reach. |
VaR - Consolidated ITAÚ UNIBANCO HOLDING
The internal VaR model used by ITAÚ UNIBANCO HOLDING considers a one-day holding period and a 99% confidence level. Volatilities and correlations are estimated based on a methodology that give greater weight to the most recent information.
The Consolidated Global VaR table provides an analysis of the exposure to market risk of ITAÚ UNIBANCO HOLDING portfolios, as of its foreign subsidiaries (Banco Itaú BBA International S.A., Banco Itaú Argentina S.A., Banco Itaú Chile S.A., Banco Itaú Uruguay S.A. and Banco Itaú Paraguay S.A.); by showing where the largest concentrations of market risk are found.
The consolidated ITAÚ UNIBANCO HOLDING, maintaining its conservative management and portfolio diversification, continued with its policy of operating within low limits in relation to its capital.
In this period, the average global VaR was R$ 142.0 million or 0.19% of total stockholders’ equity (throughout 2010 it was R$ 109,4 million or 0.16%).
| (in R$ million) |
| VaR Global (*) |
| | | Average | | | Minimum(**) | | | Maximum(**) | | | 12/31/2011 | | | Average | | | Minimum(**) | | | Maximum(**) | | | 12/31/2010 | | | 1/1/2010 | |
| | | | | | | | | | | | | | | | |
| Risk factor group | | | | | | | | | | | | | | | | | | | | | | | | | | | | | | | | | | | | |
| Interest rate | | | 105.3 | | | | 27.0 | | | | 229.2 | | | | 114.8 | | | | 109.5 | | | | 47.3 | | | | 207.8 | | | | 123.7 | | | | 86.4 | |
| Foreign exchange linked interest rate | | | 29.5 | | | | 12.6 | | | | 59.0 | | | | 23.6 | | | | 18.4 | | | | 3.7 | | | | 50.8 | | | | 17.3 | | | | 13.5 | |
| Foreign exchange | | | 38.1 | | | | 14.2 | | | | 69.2 | | | | 29.0 | | | | 31.8 | | | | 3.3 | | | | 98.1 | | | | 33.9 | | | | 20.5 | |
| Prices index linked interest rate | | | 17.7 | | | | 2.5 | | | | 41.6 | | | | 21.1 | | | | 17.1 | | | | 6.4 | | | | 30.0 | | | | 18.6 | | | | 16.2 | |
| Equities | | | 13.4 | | | | 3.7 | | | | 26.1 | | | | 4.4 | | | | 15.1 | | | | 5.1 | | | | 27.7 | | | | 14.4 | | | | 7.4 | |
| | | | | | | | | | | | | | | | | | | | | | | | | | | | | | | | | | | | | |
| Foreign units | | | | | | | | | | | | | | | | | | | | | | | | | | | | | | | | | | | | |
| Itaú BBA International | | | 2.9 | | | | 0.4 | | | | 6.5 | | | | 1.5 | | | | 1.3 | | | | 0.5 | | | | 3.4 | | | | 0.6 | | | | 1.7 | |
| Itaú Argentina | | | 4.0 | | | | 1.6 | | | | 9.4 | | | | 3.7 | | | | 1.0 | | | | 0.4 | | | | 2.3 | | | | 1.6 | | | | 1.4 | |
| Itaú Chile | | | 5.3 | | | | 1.9 | | | | 10.3 | | | | 5.3 | | | | 5.1 | | | | 2.6 | | | | 9.4 | | | | 3.3 | | | | 0.8 | |
| Itaú Uruguay | | | 0.5 | | | | 0.2 | | | | 1.1 | | | | 0.7 | | | | 0.4 | | | | 0.2 | | | | 0.8 | | | | 0.2 | | | | 0.3 | |
| Itaú Paraguay | | | 0.6 | | | | 0.2 | | | | 1.7 | | | | 0.2 | | | | 0.6 | | | | 0.2 | | | | 1.6 | | | | 0.9 | | | | - | |
| | | | | | | | | | | | | | | | | | | | | | | | | | | | | | | | | | | | | |
| Effect of diversification | | | | | | | | | | | | | | | (53.4 | ) | | | | | | | | | | | | | | | (82.8 | ) | | | (61.1 | ) |
| Risk Global | | | 142.0 | | | | 74.0 | | | | 278.5 | | | | 150.9 | | | | 109.4 | | | | 61.6 | | | | 181.8 | | | | 131.9 | | | | 87.2 | |
(*) Adjusted to reflect the tax treatment of individual classes of assets.
(**) Determined in local currency and converted into Brazilian reais at the closing price on the reporting date.
Interest rate
Management of interest rate risk is performed based on mark-to-market amounts at maturity of several products, grouping them by common dates, calculating the sensitivity to interst rates and applying shocks in the interest rates. The table on the position of accounts subject to interest rate risk shows a different view, grouping them by products, book value of accounts distributed by maturity. This table is not used directly to manage interest rate risks; it is mostly used to enable the assessment of mismatchings between accounts and products associated thereto and to identify possible risk concentration.
The following table sets forth our interest-earning assets and interest-bearing liabilities and therefore does not reflect interest rate gap positions that may exist as of any given date. In addition, variations in interest rate sensitivity may exist within the repricing periods presented due to differing repricing dates within the period
Position of accounts subject to interest rate risk (1)
| | | 12/31/2011 | | | 12/31/2010 | | | 1/1/2010 | |
| | | 0-30
days | | | 31-180
days | | | 181-365
days | | | 1-3
years | | | Over 3
years | | | Total | | | 0-30
days | | | 31-180
days | | | 181-365
days | | | 1-3
years | | | Over 3
years | | | Total | | | 0-30
days | | | 31-180
days | | | 181-365
days | | | 1-3
years | | | Over 3
years | | | Total | |
| Interest-bearing assets | | | 236,921 | | | | 142,241 | | | | 90,272 | | | | 164,644 | | | | 111,752 | | | | 745,830 | | | | 222,161 | | | | 145,250 | | | | 69,989 | | | | 151,046 | | | | 66,973 | | | | 655,419 | | | | 185,406 | | | | 110,533 | | | | 62,486 | | | | 116,286 | | | | 42,435 | | | | 517,146 | |
| Interbank deposits | | | 18,911 | | | | 3,226 | | | | 3,247 | | | | 2,122 | | | | 315 | | | | 27,821 | | | | 8,209 | | | | 2,954 | | | | 3,153 | | | | 518 | | | | 1 | | | | 14,835 | | | | 8,836 | | | | 4,020 | | | | 4,406 | | | | 528 | | | | 9 | | | | 17,799 | |
| Securities purchased under agreements to resell | | | 50,131 | | | | 40,462 | | | | 1,655 | | | | - | | | | - | | | | 92,248 | | | | 47,929 | | | | 32,267 | | | | 1,898 | | | | 5,165 | | | | 1,423 | | | | 88,682 | | | | 102,959 | | | | 20,125 | | | | 1,143 | | | | 5,350 | | | | 6,243 | | | | 135,820 | |
| Central Bank compulsory deposits | | | 98,053 | | | | - | | | | - | | | | - | | | | - | | | | 98,053 | | | | 85,776 | | | | - | | | | - | | | | - | | | | - | | | | 85,776 | | | | 13,869 | | | | - | | | | - | | | | - | | | | - | | | | 13,869 | |
| Financial assets held for trading | | | 7,188 | | | | 3,369 | | | | 27,149 | | | | 49,914 | | | | 34,269 | | | | 121,889 | | | | 28,366 | | | | 19,403 | | | | 10,936 | | | | 29,507 | | | | 27,285 | | | | 115,497 | | | | 9,284 | | | | 8,136 | | | | 8,527 | | | | 17,314 | | | | 12,291 | | | | 55,552 | |
| Financial assets held for trading and designated at fair value through profit or loss | | | 186 | | | | - | | | | - | | | | - | | | | - | | | | 186 | | | | 306 | | | | - | | | | - | | | | - | | | | - | | | | 306 | | | | 373 | | | | - | | | | - | | | | - | | | | - | | | | 373 | |
| Available-for-sale financial assets | | | 6,139 | | | | 3,997 | | | | 3,768 | | | | 13,221 | | | | 20,385 | | | | 47,510 | | | | 6,809 | | | | 8,098 | | | | 4,659 | | | | 8,249 | | | | 16,724 | | | | 44,539 | | | | 8,756 | | | | 6,727 | | | | 5,529 | | | | 10,058 | | | | 10,232 | | | | 41,302 | |
| Held-to-maturity financial assets | | | 87 | | | | - | | | | 33 | | | | 190 | | | | 2,795 | | | | 3,105 | | | | 4 | | | | 144 | | | | 136 | | | | 295 | | | | 2,591 | | | | 3,170 | | | | 5 | | | | 11 | | | | 25 | | | | 414 | | | | 1,974 | | | | 2,429 | |
| Derivatives | | | 2,277 | | | | 2,199 | | | | 1,473 | | | | 1,531 | | | | 1,274 | | | | 8,754 | | | | 1,142 | | | | 2,602 | | | | 1,315 | | | | 1,212 | | | | 1,506 | | | | 7,777 | | | | 1,382 | | | | 1,270 | | | | 842 | | | | 1,469 | | | | 626 | | | | 5,589 | |
| Loan and lease operations | | | 53,949 | | | | 88,988 | | | | 52,947 | | | | 97,666 | | | | 52,714 | | | | 346,264 | | | | 43,620 | | | | 79,782 | | | | 47,892 | | | | 106,100 | | | | 17,443 | | | | 294,837 | | | | 39,942 | | | | 70,244 | | | | 42,014 | | | | 81,153 | | | | 11,060 | | | | 244,413 | |
| Interest-bearing liabilities | | | 167,707 | | | | 69,188 | | | | 47,978 | | | | 167,503 | | | | 104,446 | | | | 556,822 | | | | 172,825 | | | | 58,287 | | | | 49,042 | | | | 135,939 | | | | 77,436 | | | | 493,529 | | | | 136,355 | | | | 48,951 | | | | 30,153 | | | | 107,801 | | | | 57,981 | | | | 381,241 | |
| Savings deposits | | | 67,170 | | | | - | | | | - | | | | - | | | | - | | | | 67,170 | | | | 57,900 | | | | - | | | | - | | | | - | | | | - | | | | 57,900 | | | | 48,222 | | | | - | | | | - | | | | - | | | | - | | | | 48,222 | |
| Time deposits | | | 30,918 | | | | 19,167 | | | | 11,475 | | | | 41,702 | | | | 41,207 | | | | 144,469 | | | | 15,332 | | | | 16,714 | | | | 21,476 | | | | 33,002 | | | | 29,892 | | | | 116,416 | | | | 16,332 | | | | 15,437 | | | | 14,175 | | | | 43,817 | | | | 24,863 | | | | 114,624 | |
| Interbank deposits | | | 665 | | | | 683 | | | | 445 | | | | 242 | | | | 30 | | | | 2,065 | | | | 348 | | | | 836 | | | | 505 | | | | 203 | | | | 37 | | | | 1,929 | | | | 570 | | | | 730 | | | | 543 | | | | 84 | | | | 65 | | | | 1,992 | |
| Investment deposits | | | - | | | | - | | | | - | | | | - | | | | - | | | | - | | | | 906 | | | | - | | | | - | | | | - | | | | - | | | | 906 | | | | 997 | | | | - | | | | - | | | | - | | | | - | | | | 997 | |
| Deposits received under securities repurchase agreements | | | 55,866 | | | | 11,403 | | | | 11,139 | | | | 83,623 | | | | 23,382 | | | | 185,413 | | | | 89,010 | | | | 21,369 | | | | 12,067 | | | | 60,200 | | | | 17,011 | | | | 199,657 | | | | 64,843 | | | | 16,128 | | | | 7,449 | | | | 30,272 | | | | 13,253 | | | | 131,945 | |
| Interbank market | | | 5,904 | | | | 24,588 | | | | 16,773 | | | | 30,133 | | | | 13,100 | | | | 90,498 | | | | 4,905 | | | | 16,209 | | | | 11,438 | | | | 20,897 | | | | 9,150 | | | | 62,599 | | | | 4,120 | | | | 12,160 | | | | 6,361 | | | | 15,546 | | | | 6,488 | | | | 44,675 | |
| Institutional market | | | 2,772 | | | | 11,248 | | | | 5,881 | | | | 9,565 | | | | 25,341 | | | | 54,807 | | | | 658 | | | | 1,419 | | | | 1,857 | | | | 20,261 | | | | 20,318 | | | | 44,513 | | | | 192 | | | | 718 | | | | 654 | | | | 16,547 | | | | 12,419 | | | | 30,530 | |
| Derivatives | | | 1,526 | | | | 1,245 | | | | 1,364 | | | | 1,541 | | | | 1,071 | | | | 6,747 | | | | 1,113 | | | | 1,423 | | | | 1,408 | | | | 1,090 | | | | 637 | | | | 5,671 | | | | 1,077 | | | | 1,409 | | | | 850 | | | | 1,477 | | | | 519 | | | | 5,332 | |
| Financial liabilities held for trading | | | 48 | | | | 854 | | | | 901 | | | | 697 | | | | 315 | | | | 2,815 | | | | 50 | | | | 317 | | | | 291 | | | | 286 | | | | 391 | | | | 1,335 | | | | 2 | | | | 108 | | | | 121 | | | | 58 | | | | 374 | | | | 663 | |
| Liabilities for capitalization plans | | | 2,838 | | | | - | | | | - | | | | - | | | | - | | | | 2,838 | | | | 2,603 | | | | - | | | | - | | | | - | | | | - | | | | 2,603 | | | | - | | | | 2,261 | | | | - | | | | - | | | | - | | | | 2,261 | |
| Difference asset/ liability (2) | | | 69,214 | | | | 73,053 | | | | 42,294 | | | | (2,859 | ) | | | 7,306 | | | | 189,008 | | | | 49,336 | | | | 86,963 | | | | 20,947 | | | | 15,107 | | | | (10,463 | ) | | | 161,890 | | | | 49,051 | | | | 61,582 | | | | 32,333 | | | | 8,485 | | | | (15,546 | ) | | | 135,905 | |
| Cumulative difference | | | 69,214 | | | | 142,267 | | | | 184,561 | | | | 181,702 | | | | 189,008 | | | | | | | | 49,336 | | | | 136,299 | | | | 157,246 | | | | 172,353 | | | | 161,890 | | | | | | | | 49,051 | | | | 110,633 | | | | 142,966 | | | | 151,451 | | | | 135,905 | | | | | |
| Ratio of cumulative difference to total interest-bearing assets | | | 9.3 | % | | | 19.1 | % | | | 24.7 | % | | | 24.4 | % | | | 25.3 | % | | | | | | | 7.5 | % | | | 20.8 | % | | | 24.0 | % | | | 26.3 | % | | | 24.7 | % | | | | | | | 9.5 | % | | | 21.4 | % | | | 27.6 | % | | | 29.3 | % | | | 26.3 | % | | | | |
(1) Remaining contractual terms.
(2) The difference arises from the mismatch between the maturities of all remunerated assets and liabilities, at the respective base date, considering the contractually agreed terms.
Position of accounts subject to currency risk
| | | 12/31/2011 | |
| ASSETS | | Dollar | | | Euro | | | Yen | | | Other | | | Total | |
| Cash and deposits on demand | | | 2,560 | | | | 323 | | | | 64 | | | | 2,221 | | | | 5,168 | |
| Central Bank compulsory deposits | | | - | | | | 13 | | | | - | | | | 2,098 | | | | 2,111 | |
| Interbank deposits | | | 15,681 | | | | 1,274 | | | | 2 | | | | 1,044 | | | | 18,001 | |
| Securities purchased under agreements to resell | | | 478 | | | | - | | | | - | | | | 127 | | | | 605 | |
| Held-for-trading financial assets | | | 4,327 | | | | 643 | | | | - | | | | 304 | | | | 5,274 | |
| Financial assets designated at fair value through profit or loss | | | - | | | | 186 | | | | - | | | | - | | | | 186 | |
| Derivatives | | | 2,018 | | | | 614 | | | | - | | | | 258 | | | | 2,890 | |
| Available-for-sale financial assets | | | 37,880 | | | | 98 | | | | - | | | | 2,209 | | | | 40,187 | |
| Held-to-maturity financial assets | | | 605 | | | | - | | | | - | | | | - | | | | 605 | |
| Loan operations, net | | | 40,494 | | | | 5,338 | | | | 2,832 | | | | 22,693 | | | | 71,357 | |
| TOTAL ASSETS | | | 104,043 | | | | 8,489 | | | | 2,898 | | | | 30,954 | | | | 146,384 | |
| | | 12/31/2011 | |
| LIABILITIES | | Dollar | | | Euro | | | Yen | | | Other | | | Total | |
| Deposits | | | 36,830 | | | | 2,390 | | | | 409 | | | | 19,438 | | | | 59,067 | |
| Deposits received under securities repurchase agreements | | | 7,228 | | | | - | | | | - | | | | 176 | | | | 7,404 | |
| Financial liabilities held for trading | | | - | | | | 2,815 | | | | - | | | | - | | | | 2,815 | |
| Derivatives | | | 1,684 | | | | 537 | | | | - | | | | 137 | | | | 2,358 | |
| Interbank market debts | | | 28,022 | | | | 643 | | | | 2 | | | | 2,015 | | | | 30,682 | |
| Institutional market debts | | | 47,643 | | | | 3,530 | | | | - | | | | 1,230 | | | | 52,403 | |
| TOTAL LIABILITIES | | | 121,407 | | | | 9,915 | | | | 411 | | | | 22,996 | | | | 154,729 | |
| | | | | | | | | | | | | | | | | | | | | |
| NET POSITION | | | (17,364 | ) | | | (1,426 | ) | | | 2,487 | | | | 7,958 | | | | (8,345 | ) |
The exposure to share price risk is disclosed in Note 6 related to financial assets held for trading and Note 9, related to available-for-sale financial assets.
Position of accounts subject to currency risk
| | | 12/31/2010 | |
| ASSETS | | Dollar | | | Euro | | | Yen | | | Other | | | Total | |
| Cash and deposits on demand | | | 3,433 | | | | 124 | | | | 130 | | | | 1,154 | | | | 4,841 | |
| Central Bank compulsory deposits | | | - | | | | 8 | | | | - | | | | 898 | | | | 906 | |
| Interbank deposits | | | 6,726 | | | | 2,724 | | | | - | | | | 701 | | | | 10,151 | |
| Securities purchased under agreements to resell | | | 1,177 | | | | - | | | | - | | | | 109 | | | | 1,286 | |
| Held-for-trading financial assets | | | 12,447 | | | | 694 | | | | - | | | | 541 | | | | 13,682 | |
| Financial assets designated at fair value through profit or loss | | | - | | | | 306 | | | | - | | | | - | | | | 306 | |
| Derivatives | | | 1,974 | | | | 111 | | | | - | | | | 121 | | | | 2,206 | |
| Available-for-sale financial assets | | | 22,320 | | | | 47 | | | | - | | | | 2,570 | | | | 24,937 | |
| Held-to-maturity financial assets | | | 692 | | | | - | | | | - | | | | - | | | | 692 | |
| Loan operations, net | | | 30,558 | | | | 4,158 | | | | 2,511 | | | | 16,781 | | | | 54,008 | |
| TOTAL ASSETS | | | 79,327 | | | | 8,172 | | | | 2,641 | | | | 22,875 | | | | 113,015 | |
| | | 12/31/2010 | |
| LIABILITIES | | Dollar | | | Euro | | | Yen | | | Other | | | Total | |
| Deposits | | | 21,603 | | | | 1,435 | | | | 274 | | | | 13,822 | | | | 37,134 | |
| Deposits received under securities repurchase agreements | | | 15,327 | | | | - | | | | - | | | | 259 | | | | 15,586 | |
| Financial liabilities held for trading | | | - | | | | 1,335 | | | | - | | | | - | | | | 1,335 | |
| Derivatives | | | 1,684 | | | | 119 | | | | - | | | | 130 | | | | 1,933 | |
| Interbank market debts | | | 25,013 | | | | 712 | | | | 1 | | | | 1,360 | | | | 27,086 | |
| Institutional market debts | | | 27,355 | | | | 1,333 | | | | - | | | | 932 | | | | 29,620 | |
| TOTAL LIABILITIES | | | 90,982 | | | | 4,934 | | | | 275 | | | | 16,503 | | | | 112,694 | |
| | | | | | | | | | | | | | | | | | | | | |
| NET POSITION | | | (11,655 | ) | | | 3,238 | | | | 2,366 | | | | 6,372 | | | | 321 | |
The exposure to share price risk is disclosed in Note 6 related to financial assets held for trading and Note 9, related to available-for-sale financial assets.
Position of accounts subject to currency risk
| | | 01/01/2010 | |
| ASSETS | | Dollar | | | Euro | | | Yen | | | Other | | | Total | |
| Cash and deposits on demand | | | 4,993 | | | | 120 | | | | 90 | | | | 980 | | | | 6,183 | |
| Central Bank compulsory deposits | | | 32 | | | | 81 | | | | - | | | | 1,195 | | | | 1,308 | |
| Interbank deposits | | | 13,183 | | | | 2,585 | | | | 2 | | | | 668 | | | | 16,438 | |
| Securities purchased under agreements to resell | | | 657 | | | | - | | | | - | | | | 137 | | | | 794 | |
| Held-for-trading financial assets | | | 3,441 | | | | 686 | | | | - | | | | 301 | | | | 4,428 | |
| Financial assets designated at fair value through profit or loss | | | 4 | | | | 360 | | | | - | | | | 9 | | | | 373 | |
| Derivatives | | | 762 | | | | 109 | | | | - | | | | 158 | | | | 1,029 | |
| Available-for-sale financial assets | | | 15,113 | | | | 361 | | | | - | | | | 2,421 | | | | 17,895 | |
| Held-to-maturity financial assets | | | 786 | | | | - | | | | - | | | | - | | | | 786 | |
| Loan operations, net | | | 18,670 | | | | 4,229 | | | | 33 | | | | 14,204 | | | | 37,136 | |
| TOTAL ASSETS | | | 57,641 | | | | 8,531 | | | | 125 | | | | 20,073 | | | | 86,370 | |
| | | 01/01/2010 | |
| LIABILITIES | | Dollar | | | Euro | | | Yen | | | Other | | | Total | |
| Deposits | | | 17,732 | | | | 2,154 | | | | 216 | | | | 11,995 | | | | 32,097 | |
| Deposits received under securities repurchase agreements | | | 1,232 | | | | - | | | | - | | | | 343 | | | | 1,575 | |
| Financial liabilities held for trading | | | - | | | | - | | | | - | | | | - | | | | - | |
| Derivatives | | | 809 | | | | 137 | | | | - | | | | 150 | | | | 1,096 | |
| Interbank market debts | | | 17,982 | | | | 859 | | | | - | | | | 1,272 | | | | 20,113 | |
| Institutional market debts | | | 16,140 | | | | 1,226 | | | | - | | | | 136 | | | | 17,502 | |
| TOTAL LIABILITIES | | | 53,895 | | | | 4,376 | | | | 216 | | | | 13,896 | | | | 72,383 | |
| | | | | | | | | | | | | | | | | | | | | |
| NET POSITION | | | 3,746 | | | | 4,155 | | | | (91 | ) | | | 6,177 | | | | 13,987 | |
The exposure to share price risk is disclosed in Note 6 related to financial assets held for trading and Note 9, related to available-for-sale financial assets.
Liquidity risk
Liquidity risk is defined as the existence of imbalances between marketable assets and liabilities due – “mismatching” between payments and receipts - which may affect the institution’s payment capacity, taking into consideration the different currencies and payment terms and the respective rights and obligations.
Policies and procedures
Management of liquidity risk seeks to adopt best practices to avoid having insufficient cash available and to avoid difficulties in meeting obligations as they fall due.
ITAÚ UNIBANCO HOLDING has a structure dedicated to improve the monitoring, control and analysis, through models of projections of the variables that affect cash flows and the level of reserves in local and foreign currencies.
Additionally, ITAÚ UNIBANCO HOLDING establishes guidelines and limits. Compliance with these guidelines and limits is periodically analyzed in technical committees, and their purpose is to provide an additional safety margin to the minimum projected needs. The liquidity management policies and the respective limits are established based on prospective scenarios periodically reviewed and on the definitions of the top management.
These scenarios may be reviewed as necessary, considering the cash requirements, due to atypical market situations or arising from strategic decisions.
In compliance with the requirements of BACEN Resolution 2,804/00 and Circular 3,393/08 of the Central Bank of Brazil, a Statement of Liquidity Risk is sent monthly to the Central Bank, and periodically the following items are sent to top management for monitoring and support to the decision-making process:
| · | Different scenarios projected for changes in liquidity. |
| · | Contingency plans for crisis situations. |
| · | Reports and charts that describe the risk positions. |
| · | Assessment of funding costs and alternative sources of funding. |
| · | Monitoring of changes in funding through a constant control over sources of funding, considering the type of investor and maturities, among other factors. |
Primary sources of funding
ITAÚ UNIBANCO HOLDING has different sources of funding, of which a significant portion is from the retail segment. Total funding from clients reached R$ 448.1 billion reais in 2011, particularly funding from time deposits. A considerable portion of these funds – 30.2% of total, or R$ 135.5 billion – is available on demand to the client. However, the historical behavior of the accumulated balance of the two largest items in this group – demand and savings deposits - is relatively consistent with the balances increasing over time and inflows exceeding outflows for monthly average amounts.
| | | 12/31/2011 | | | 12/31/2010 | | | 1/1/2010 | |
| Funding from clients | | 0-30
days | | | Total | | | % | | | 0-30
days | | | Total | | | % | | | 0-30
days | | | Total | | | % | |
| Deposits | | | 127,686 | | | | 242,638 | | | | | | | | 100,018 | | | | 202,688 | | | | | | | | 91,011 | | | | 190,773 | | | | | |
| Demand deposits | | | 28,933 | | | | 28,933 | | | | 6.5 | | | | 25,537 | | | | 25,537 | | | | 7.0 | | | | 24,837 | | | | 24,837 | | | | 8.4 | |
| Savings deposits | | | 67,170 | | | | 67,170 | | | | 15.0 | | | | 57,899 | | | | 57,899 | | | | 16.0 | | | | 48,222 | | | | 48,222 | | | | 16.3 | |
| Time deposits | | | 30,917 | | | | 144,469 | | | | 32.2 | | | | 15,333 | | | | 116,417 | | | | 32.1 | | | | 16,374 | | | | 114,671 | | | | 38.7 | |
| Other | | | 666 | | | | 2,066 | | | | 0.5 | | | | 1,249 | | | | 2,835 | | | | 0.8 | | | | 1,578 | | | | 3,043 | | | | 1.0 | |
| Funds from acceptances and issuance of securities (1) | | | 4,862 | | | | 51,557 | | | | 11.5 | | | | 3,408 | | | | 25,592 | | | | 6.7 | | | | 2,303 | | | | 17,320 | | | | 5.8 | |
| Funds from own issue (2) | | | 2,913 | | | | 114,155 | | | | 25.5 | | | | 3,983 | | | | 101,284 | | | | 27.9 | | | | 4,170 | | | | 65,457 | | | | 22.1 | |
| Subordinated debt | | | 60 | | | | 39,715 | | | | 8.9 | | | | 28 | | | | 34,488 | | | | 9.5 | | | | 13 | | | | 22,726 | | | | 7.7 | |
| Total | | | 135,521 | | | | 448,065 | | | | | | | | 107,437 | | | | 364,052 | | | | | | | | 97,497 | | | | 296,275 | | | | | |
(1) Includes mortgage notes, real estate credit bills, agribusiness and financial credit bills recorded in interbank and institutional market debts and liabilities for Issue of debentures and foreign borrowings and securities recorded in funds from institutional markets.
(2) Refer to deposits received under securities repurchase agreements with securities from own issue.
Control over liquidity
ITAÚ UNIBANCO HOLDING manages its liquidity reserves based on estimates of funds that will be available for investment, considering the continuity of business in normal conditions.
During 2011, ITAÚ UNIBANCO HOLDING maintained appropriate levels of liquidity in Brazil and abroad. Liquid assets (cash and deposits on demand, funded positions of securities purchased under agreements to resell and government securities available) totaled R$ 80.8 billion and accounted for 59.6% of the short-term redeemable obligations, 18.0% of total funding, and 15.4% of total assets.
The table below shows the indicators used by ITAÚ UNIBANCO HOLDING in the management of liquidity risk:
| Liquidity Indicators | | % | |
| Net assets / funds within 30 days | | | 59.6 | |
| Net assets / total funds | | | 18.0 | |
| Net assets / total assets | | | 15.4 | |
The following table presents assets and liabilities according to their remaining contractual maturities, considering their undiscounted flows.
R$ Million
| Undiscounted future flows except for derivatives | | 12/31/2011 | | | 12/31/2010 | | | 01/01/2010 | |
| ASSETS (1) | | 0 - 30
days | | | 31 - 365
days | | | 366-720
days | | | Over 720
days | | | Total | | | 0 - 30
days | | | 31 - 365
days | | | 366-720
days | | | Over 720
days | | | Total | | | 0 - 30
days | | | 31 - 365
days | | | 366-720
days | | | Over 720
days | | | Total | |
| Cash and deposits on demand | | | 10,633 | | | | - | | | | - | | | | - | | | | 10,633 | | | | 10,097 | | | | - | | | | - | | | | - | | | | 10,097 | | | | 10,594 | | | | - | | | | - | | | | - | | | | 10,594 | |
| | | | | | | | | | | | | | | | | | | | | | | | | | | | | | | | | | | | | | | | | | | | | | | | | | | | | | | | | | | | | |
| Interbank investments | | | 68,277 | | | | 36,721 | | | | 2,295 | | | | 287 | | | | 107,580 | | | | 50,739 | | | | 24,031 | | | | 469 | | | | 172 | | | | 75,411 | | | | 110,149 | | | | 17,079 | | | | 487 | | | | 213 | | | | 127,928 | |
| Securities purchased under agreements to resell - Funded position (2) | | | 25,438 | | | | - | | | | - | | | | - | | | | 25,438 | | | | 24,773 | | | | - | | | | - | | | | - | | | | 24,773 | | | | 52,577 | | | | - | | | | - | | | | - | | | | 52,577 | |
| Securities purchased under agreements to resell - Financed position | | | 23,948 | | | | 29,706 | | | | - | | | | - | | | | 53,654 | | | | 17,764 | | | | 17,617 | | | | - | | | | - | | | | 35,381 | | | | 48,988 | | | | 8,312 | | | | - | | | | - | | | | 57,300 | |
| Interbank deposits | | | 18,891 | | | | 7,015 | | | | 2,295 | | | | 287 | | | | 28,488 | | | | 8,202 | | | | 6,414 | | | | 469 | | | | 172 | | | | 15,257 | | | | 8,584 | | | | 8,767 | | | | 487 | | | | 213 | | | | 18,051 | |
| | | | | | | | | | | | | | | | | | | | | | | | | | | | | | | | | | | | | | | | | | | | | | | | | | | | | | | | | | | | | |
| Securities | | | 50,127 | | | | 5,368 | | | | 3,979 | | | | 54,096 | | | | 113,570 | | | | 50,962 | | | | 25,808 | | | | 5,130 | | | | 58,920 | | | | 140,820 | | | | 29,065 | | | | 6,766 | | | | 3,912 | | | | 15,715 | | | | 55,458 | |
| Government securities - available | | | 44,741 | | | | - | | | | - | | | | - | | | | 44,741 | | | | 23,473 | | | | - | | | | - | | | | - | | | | 23,473 | | | | 17,177 | | | | - | | | | - | | | | - | | | | 17,177 | |
| Government securities - subject to repurchase commitments | | | 686 | | | | 1,779 | | | | 916 | | | | 23,210 | | | | 26,591 | | | | 21,488 | | | | 19,063 | | | | 3,694 | | | | 38,588 | | | | 82,833 | | | | 5,604 | | | | 855 | | | | 1,220 | | | | 2,218 | | | | 9,897 | |
| Private securities - available | | | 4,693 | | | | 3,299 | | | | 2,332 | | | | 28,648 | | | | 38,972 | | | | 5,954 | | | | 6,193 | | | | 1,411 | | | | 17,748 | | | | 31,306 | | | | 6,254 | | | | 5,681 | | | | 2,458 | | | | 13,222 | | | | 27,615 | |
| Private securities - Subject to repurchase commitments | | | 7 | | | | 290 | | | | 731 | | | | 2,238 | | | | 3,266 | | | | 47 | | | | 552 | | | | 25 | | | | 2,584 | | | | 3,208 | | | | 30 | | | | 230 | | | | 234 | | | | 275 | | | | 769 | |
| | | | | | | | | | | | | | | | | | | | | | | | | | | | | | | | | | | | | | | | | | | | | | | | | | | | | | | | | | | | | |
| Derivative financial instruments | | | 2,277 | | | | 3,672 | | | | 960 | | | | 1,845 | | | | 8,754 | | | | 1,145 | | | | 3,914 | | | | 753 | | | | 1,965 | | | | 7,777 | | | | 1,383 | | | | 2,112 | | | | 1,124 | | | | 970 | | | | 5,589 | |
| | | | | | | | | | | | | | | | | | | | | | | | | | | | | | | | | | | | | | | | | | | | | | | | | | | | | | | | | | | | | |
| Loan and lease operations (3) | | | 48,966 | | | | 133,015 | | | | 78,609 | | | | 110,750 | | | | 371,340 | | | | 41,720 | | | | 116,494 | | | | 62,832 | | | | 99,394 | | | | 320,440 | | | | 39,587 | | | | 102,113 | | | | 46,525 | | | | 74,703 | | | | 262,928 | |
| | | | | | | | | | | | | | | | | | | | | | | | | | | | | | | | | | | | | | | | | | | | | | | | | | | | | | | | | | | | | |
| | | | 180,280 | | | | 178,776 | | | | 85,843 | | | | 166,978 | | | | 611,877 | | | | 154,663 | | | | 170,247 | | | | 69,184 | | | | 160,451 | | | | 554,545 | | | | 190,778 | | | | 128,070 | | | | 52,048 | | | | 91,601 | | | | 462,497 | |
(1) The assets portfolio does not take into consideration the balance of compulsory deposits in Central Bank, amounting to R$ 98,053 (R$ 85,776 at December 31, 2010 and R$ 27,087 at January 1, 2010), which release of funds is linked to the maturity of the liability portfolios. The amounts of PGBL and VGBL are not considered in the assets portfolio because they are covered in Note 29.
(2) Net of R$ 7,227 (R$ 8,670 at 12/31/2010 and R$ 9,288 at 01/01/2010) which securities are restricted to guarantee transactions at BM&FBovespa S.A. and the Central Bank of Brazil.
(3) Net of payment to merchants R$25,749 (R$18,758 at 12/31/2010 and R$14,714 at 01/01/2010).
R$ Million
| Undiscounted future flows except for derivatives | | 12/31/2011 | | | 12/31/2010 | | | 1/1/2010 | |
| LIABILITIES | | 0 - 30
days | | | 31- 365
days | | | 365- 720
days | | | Over 720
days | | | Total | | | 0-30
days | | | 31-365
days | | | 365- 720
days | | | Over 720
days | | | Total | | | 0 - 30
days | | | 31 - 365
days | | | 365- 720
days | | | Over 720 days | | | Total | |
| | | | | | | | | | | | | | | | | | | | | | | | | | | | | | | | | | | | | | | | | | | | | | |
| Deposits | | | 122,173 | | | | 38,410 | | | | 33,101 | | | | 67,913 | | | | 261,597 | | | | 100,235 | | | | 43,094 | | | | 18,217 | | | | 63,733 | | | | 225,279 | | | | 91,067 | | | | 30,240 | | | | 32,072 | | | | 52,393 | | | | 205,772 | |
| Demand deposits | | | 28,933 | | | | - | | | | - | | | | - | | | | 28,933 | | | | 25,537 | | | | - | | | | - | | | | - | | | | 25,537 | | | | 24,837 | | | | - | | | | - | | | | - | | | | 24,837 | |
| Savings deposits | | | 67,170 | | | | - | | | | - | | | | - | | | | 67,170 | | | | 57,899 | | | | - | | | | - | | | | - | | | | 57,899 | | | | 48,222 | | | | - | | | | - | | | | - | | | | 48,222 | |
| Time deposit | | | 25,423 | | | | 37,239 | | | | 32,903 | | | | 67,806 | | | | 163,371 | | | | 15,531 | | | | 41,687 | | | | 18,159 | | | | 63,534 | | | | 138,911 | | | | 16,429 | | | | 28,863 | | | | 31,989 | | | | 52,255 | | | | 129,536 | |
| Interbank deposit | | | 647 | | | | 1,171 | | | | 198 | | | | 107 | | | | 2,123 | | | | 362 | | | | 1,407 | | | | 58 | | | | 199 | | | | 2,026 | | | | 582 | | | | 1,377 | | | | 83 | | | | 138 | | | | 2,180 | |
| Other deposits | | | - | | | | - | | | | - | | | | - | | | | - | | | | 906 | | | | - | | | | - | | | | - | | | | 906 | | | | 997 | | | | - | | | | - | | | | - | | | | 997 | |
| | | | | | | | | | | | | | | | | | | | | | | | | | | | | | | | | | | | | | | | | | | | | | | | | | | | | | | | | | | | | |
| Compulsory Deposits | | | (39,562 | ) | | | (15,790 | ) | | | (13,951 | ) | | | (28,750 | ) | | | (98,053 | ) | | | (31,547 | ) | | | (18,323 | ) | | | (7,981 | ) | | | (27,925 | ) | | | (85,776 | ) | | | (19,331 | ) | | | (1,979 | ) | | | (2,194 | ) | | | (3,583 | ) | | | (27,087 | ) |
| Demand deposits | | | (9,939 | ) | | | - | | | | - | | | | - | | | | (9,939 | ) | | | (8,210 | ) | | | - | | | | - | | | | - | | | | (8,210 | ) | | | (5,679 | ) | | | - | | | | - | | | | - | | | | (5,679 | ) |
| Savings deposits | | | (18,843 | ) | | | - | | | | - | | | | - | | | | (18,843 | ) | | | (16,511 | ) | | | - | | | | - | | | | - | | | | (16,511 | ) | | | (12,525 | ) | | | - | | | | - | | | | - | | | | (12,525 | ) |
| Time deposit | | | (10,780 | ) | | | (15,790 | ) | | | (13,951 | ) | | | (28,750 | ) | | | (69,271 | ) | | | (6,826 | ) | | | (18,323 | ) | | | (7,981 | ) | | | (27,925 | ) | | | (61,055 | ) | | | (1,127 | ) | | | (1,979 | ) | | | (2,194 | ) | | | (3,583 | ) | | | (8,883 | ) |
| | | | | | | | | | | | | | | | | | | | | | | | | | | | | | | | | | | | | | | | | | | | | | | | | | | | | | | | | | | | | |
| Securities sold under repurchase agreements (1) | | | 56,618 | | | | 24,205 | | | | 45,139 | | | | 91,587 | | | | 217,549 | | | | 89,375 | | | | 35,558 | | | | 27,096 | | | | 62,490 | | | | 214,519 | | | | 65,036 | | | | 24,671 | | | | 47,564 | | | | 4,325 | | | | 141,596 | |
| | | | | | | | | | | | | | | | | | | | | | | | | | | | | | | | | | | | | | | | | | | | | | | | | | | | | | | | | | | | | |
| Funds from acceptances and issuance of securities (2) | | | 4,365 | | | | 25,714 | | | | 12,998 | | | | 13,274 | | | | 56,351 | | | | 3,455 | | | | 11,825 | | | | 5,854 | | | | 6,224 | | | | 27,358 | | | | 2,319 | | | | 8,276 | | | | 3,833 | | | | 3,560 | | | | 17,988 | |
| | | | | | | | | | | | | | | | | | | | | | | | | | | | | | | | | | | | | | | | | | | | | | | | | | | | | | | | | | | | | |
| Borrowings and onlending (3) | | | 3,339 | | | | 25,276 | | | | 10,617 | | | | 24,484 | | | | 63,716 | | | | 2,372 | | | | 19,742 | | | | 17,343 | | | | 16,935 | | | | 56,392 | | | | 2,059 | | | | 12,592 | | | | 15,516 | | | | 11,171 | | | | 41,338 | |
| | | | | | | | | | | | | | | | | | | | | | | | | | | | | | | | | | | | | | | | | | | | | | | | | | | | | | | | | | | | | |
| Subordinated debt (4) | | | 69 | | | | 11,338 | | | | 3,174 | | | | 40,941 | | | | 55,522 | | | | 28 | | | | 2,039 | | | | 14,801 | | | | 29,396 | | | | 46,264 | | | | 13 | | | | 941 | | | | 1,234 | | | | 27,770 | | | | 29,958 | |
| | | | | | | | | | | | | | | | | | | | | | | | | | | | | | | | | | | | | | | | | | | | | | | | | | | | | | | | | | | | | |
| Derivative financial instruments | | | 1,526 | | | | 2,609 | | | | 885 | | | | 1,727 | | | | 6,747 | | | | 1,113 | | | | 2,831 | | | | 743 | | | | 984 | | | | 5,671 | | | | 1,077 | | | | 2,259 | | | | 1,096 | | | | 900 | | | | 5,332 | |
| | | | | | | | | | | | | | | | | | | | | | | | | | | | | | | | | | | | | | | | | | | | | | | | | | | | | | | | | | | | | |
| | | | 148,528 | | | | 111,762 | | | | 91,963 | | | | 211,176 | | | | 563,429 | | | | 165,031 | | | | 96,766 | | | | 76,073 | | | | 151,837 | | | | 489,707 | | | | 142,240 | | | | 77,000 | | | | 99,121 | | | | 96,536 | | | | 414,897 | |
(1) Includes Own and Third Parties’ Portfolios.
(2) Includes mortgage notes, real estate credit bills, agribusiness and financial bills recorded in interbank and institutional market funds and liabilities for Issue of debentures and foreign securities recorded in funds from institutional markets.
(3) Recorded in funds from Interbank Markets.
(4) Recorded in funds from Institutional Markets.
The above table does not include the financial effect on liquidity of endorsements, sureties and other loans commitments because these have a 0,03% probability of materialization, in accordance with historical data. For the notional amounts we refer to Note 35.5.
NOTE 36 – TRANSACTION WITH CARREFOUR
On April 14, 2011, ITAÚ UNIBANCO HOLDING entered into with Carrefour Comércio e Indústria Ltda. ("Carrefour Brazil"), an Agreement for Purchase and Sale of Shares to acquire 49% of Banco CSF S.A. (Banco Carrefour) for R$ 725 million, corresponding to a 2010 price/earnings ratio of 11.6. The completion of this transaction depends on the approval from the Central Bank of Brazil.
NOTE 37 – SUBSEQUENT EVENTS
Transaction with Redecard
Itaú Unibanco Holding communicated to its stockholders and announced to the market, on February 7, 2012, as a Material Fact, its intention to acquire, directly or through its subsidiary companies, the shares held by non-controlling shareholders of Redecard S.A., within the scope of a unified public offering and subsequently cancel the registration of Redecard as a public company and withdrawal thereof from theNovo Mercado segment of BM&FBOVESPA S.A. - Brazilian Mercantile and Futures Exchange (“Novo Mercado” segment).
The Public Offering will target 336,390.251 common shares issued by Redecard, which represent 49.9859% of Redecard’s capital. The cap price to be tendered will be R$35.00 (thirty-five Brazilian reais) per share, payable in national currency.
The performance of the aforesaid public offering is subject to approval by regulatory authorities and the other terms and conditions of the offering will be disclosed to the market in due course, according to the applicable rules.
ITEM 19 EXHIBITS
| Exhibit | | | | |
| | | | | |
| Number | | Description | | |
| | | | | |
| 1.1 | | Bylaws of Itaú Unibanco Holding S.A. (unofficial English translation). | | (4) |
| 2.(a) | | Amended and Restated Deposit Agreement among the Registrant, The Bank of New York, as depositary, and the Holders from time to time of American Depositary Shares issued thereunder, including the form of American Depositary Receipts. | | (1) |
| 4.(a)1 | | Share Purchase and Sale Agreement, dated November 4, 2002, among Fernão Carlos Botelho Bracher, Antonio Beltran Martinez and Banco Itaú S.A. | | (2) |
| 4.(a)2 | | Shareholders’ Agreement, dated as of January 27, 2009, between Itaúsa — Investimentos Itaú S.A. and the Moreira Salles family (unofficial English translation). | | (3) |
| 6 | | See note 27 to our consolidated financial statements explaining how earnings per share information was calculated under IFRS. See “Item 3A. Selected Financial Data – Earnings and Dividend per Share Information” for information explaining how earnings per share information was calculated under Brazilian Corporate Law. | | * |
| 8.1 | | List of subsidiaries. | | * |
| 11.1 | | Code of Ethics (unofficial English translation) | | (3) |
| 11.2 | | Corporate Governance Policy (unofficial English translation) | | (3) |
| 12.1 | | Chief Executive Officer Certification pursuant to Section 302 of the Sarbanes-Oxley Act of 2002. | | * |
| 12.2 | | Chief Risk Officer and Chief Financial Officer Certification pursuant to Section 302 of the Sarbanes-Oxley Act of 2002. | | * |
| 13 | | Chief Executive Officer, Chief Risk Officer and Chief Financial Officer Certification pursuant to 18 U.S.C. Section 1350 as Enacted Pursuant to Section 906 of the Sarbanes-Oxley Act of 2002. | | * |
We hereby agree to furnish to the SEC copies of any of our long term debt instruments and agreements as the SEC requests.
| (1) | Incorporated herein by reference to our annual report on F-6 filed with the Commission on February 20, 2009. |
| (2) | Incorporated herein by reference to our annual report on Form 20-F filed with the Commission on June 30, 2003. |
| (3) | Incorporated herein by reference to our annual report on Form 20-F filed with the Commission on May 17, 2010. |
| (4) | Incorporated herein by reference to our annual report on Form 20-F filed with the Commission on June 27, 2011. |
SIGNATURES
Pursuant to the requirements of Section 12 of the Securities Exchange Act, as amended, the registrant certifies that it meets all of the requirements for filing this annual report on Form 20-F and has duly caused this annual report to be signed on its behalf by the undersigned, thereunto duly authorized.
| | ITAÚ UNIBANCO HOLDING S.A. |
| | |
| | By: | /s/ Roberto Egydio Setubal |
| | Name: Roberto Egydio Setubal |
| | Title: Chief Executive Officer |
| | |
| | By: | /s/ Sérgio Ribeiro da Costa Werlang |
| | Name: Sérgio Ribeiro da Costa Werlang |
| | Title: Chief Risk Officer |
| | |
| | By: | /s/ Caio Ibrahim David |
| | Name: Caio Ibrahim David |
| | Title: Chief Financial Officer |
Dated: March 30, 2012