MANAGEMENT REPORT – January to September 2013
To our Stockholders
We present the Management Report and the Financial Statements of Itaú Unibanco Holding S.A. (Itaú Unibanco) and its subsidiaries for the period from January to September 2013, in accordance with the regulations established by the Brazilian Corporate Law, the National Monetary Council (CMN), the Central Bank of Brazil (BACEN), the Brazilian Securities and Exchange Commission (CVM), the Superintendency of Private Insurance (SUSEP), and the National Council of Private Insurance (CNSP).
The information included in this material is available in the Investor Relations’ website of Itaú Unibanco: www.itau-unibanco.com.br/ri > Financial Information > Financial Statements > BRGAAP > 2013. Our results may also be accessed on mobile devices and tablets, and through our application “Itaú RI” (APP).
| 1) | ECONOMIC ENVIRONMENT |
In the USA the improvement in the labor market has remained, in spite of the tax squeeze in progress: approximately 180 thousand jobs have been created per month since the beginning of the year. Europe recorded a 0.29% growth in the second quarter of 2013, after six quarters of recession. In spite of the improvement in the developed countries, emerging countries still slow down, even though China has started to record signs of stabilization in the pace of its economy.
In its September meeting, the FED, the US central bank, decided to maintain its monetary incentives. This decision has brought liquidity relief for the emerging markets.
In the domestic scenario, even though the economy posted a good performance in the second quarter, the economic fundamentals point towards a GDP growth between 2.0% and 2.5% in 2013, lower than expected in the beginning of the year.
After the US dollar was traded at a level higher than 2.40 R$/US$ in mid-August, the Real appreciated at the end of the quarter as a result of interventions by BACEN and the FED’s decision to postpone the reduction in incentives, and it is now traded close to the 2.20 R$/US$.
Inflation measured by IPCA fell, but continues to be under pressure. The impact of a more depreciated Real over prices should make up for the decrease in the food inflation and the IPCA should close at about 6% in 2013.
In view of the inflationary pressures, BACEN started a cycle of increases in the Selic rate, which in the beginning of October reached 9.50%.
| 2) | HIGHLIGHTS |
| 2.1) | Corporate Events/Partnerships |
Repurchase of shares –in the third quarter of 2013, we acquired over 14.5 million preferred shares of own issue in the total amount of R$ 406.3 million at the average price of R$ 28.02 per share. In the year-to-date, we acquired 23.5 million preferred shares of own issue at the average price of R$ 28.18. On a voluntary basis and aiming at having transparency with the capital market agents, we monthly disclose the volumes traded and prices practiced in such trading. To obtain further information, please access www.itau-unibanco.com.br/ri > Corporate Governance > Acquisition of Own Shares.
Itaú Unibanco and Fiat Agreement – on August 20 we renewed, for another 10 years, the commercial cooperation agreement we have with Fiat car maker, the leader in sales of vehicles in the Brazilian market. This agreement sets forth the exclusive financing offer in promotional campaigns held by Fiat in connection with the sale of new automobiles and the exclusive use of the Fiat brand in vehicle-financing related activities.
Tax Assessment Notice issued by the Federal Reserve Service of Brazil (RFB) – in August we reported to the market that the RFB had issued a tax assessment notice in the approximate amount of R$ 18 billion related to the Itaú and Unibanco corporate association operation.
RFB disagrees with the type of business organization adopted to unify Itaú’s and Unibanco’s operations. However, the operation format suggested by RFB fails to be supported by the standards applicable to financial institutions in Brazil. Accordingly, we have challenged said tax assessment notice, by claiming that the operations carried out were adequate and that RFB's understanding that there was undue tax gain was flawed. We consider remote the risk of a loss associated to said tax procedure, and this understanding is supported by our lawyers and external advisors.
We reinforce that the operations carried out in 2008 were legitimate, and approved by the management bodies of the involved companies and respective stockholders and subsequently by the applicable authorities, that is, CVM, BACEN and the Administrative Council for Economic Defense (CADE).
| 2.2) | Approval by Regulatory Bodies |
The following were approved in the third quarter of 2013:
| § | IRB – Brasil Resseguros S.A. Stockholders’ Agreement, by SUSEP, in connection with the privatization process; |
| § | Agreement with Banco Citibank S.A. for purchase of Credicard and Citifinancial, by CADE (pending approval by BACEN). |
| 2.3) | Technology |
The civil works of our new data center, under construction in the interior of São Paulo (SP), is progressing as planned and it should be completed in the first quarter of 2014. This new data center will be one of the largest technology centers in the world, with capacity to support the bank’s expanded operations in the coming decades, keeping our commitment to ensure the availability of financial services and always searching for the continuous improvement of quality, agility and satisfaction of our clients.
Our functionalities were made available in our digital channels, with investments dedicated to the improvement and designing of new tools to serve the increasing expansion of these channels, such as internet banking and mobile banking, thus providing quality operations on an expeditious, modern and secure basis. They include:
Biometrics– we made available more advantages for registered clients. Besides withdrawal operations, clients are now able to check current account balances and statements without using a card and password. Biometrics enable carrying out operations with just a fingerprint identification, without the need for typing a password, providing more security and convenience to our clients. To use biometrics, it is enough to register with any Itaú branch.
Itaú Conta Certa (Itaú right account) – in August we launched this new type of current account for Itaú corporate customers, which permits the customization of service packages by choosing the number of deposit slips, credit order documents (DOC), available electronic transfer (TED), and custody of checks, among other, in accordance with their needs. The clients themselves choose, simulate and contract them at any moment, however and whenever they need them, always on the internet.
| 2.4) | Launch |
| Redecard is now Rede – we have built a new brand, a new positioning and a new business strategy. Rede, a plainer and more direct name – meaning network – summarizes the company’s key attributes, evoking technology, agility and modernity, in addition to creating a young and connected personality. The company’s focus was reviewed, and we will continue serving the merchant, but we are also concerned with the end clients and therefore we will make a closer, quicker and more technology-based service available through digital and mobile media. |  |
Accomplishing the purpose of being the main partner of sellers of goods and services that seek to expand their business potential, Rede offers its customers a series of products that follow the latest market trends. These include: Mobile Rede (transaction capture through a device coupled to a smartphone or tablet for card reading, or by entering purchase data and customer's signature) and e-Rede (in only one platform, a quick, efficient, fast and complete solution for online payments using a strong anti-fraud security system).
Approximately 300 people will reinforce the commercial team to support this operation. In the last two years, approximately R$ 500 million were invested in the update and standardization of 75% of all readers (of which 50% are wireless readers – POS). By the end of the first half, there were over 1 million merchants affiliated with Rede and over 1.7 million terminals, spread across 89% of Brazilian cities. Its total transactions exceeded 1.6 billion.
New Hiper Brand– we disclosed the launch of our new credit card brand available for all Brazilian consumers, Hiper, accepted in over one million establishments accredited by Rede throughout the Brazilian territory. Hiper is an evolution from Hipercard, the largest Brazilian card brand, and arrives to serve consumers searching for a product with immediate benefits. The first issuer of this brand will be Itaucard, for both the bank’s account holders and non-account holders. Among the benefits, we highlight the following:
(i) conversion of 120% of the annuity amount into bonus for mobile phone, applicable to all telephony operators working with such bonus system;
(ii) cards with the Itaucard 2.0 concept.
ETF in Chile – in September we launched the first ETF (Exchange Traded Fund) in Chile, namedIt Now IPSA, which replicates the profitability of the most significant 40 shares in the Chilean market. ETF is an investment fund traded on stock exchanges that may be purchased or sold at any moment, like any other company's share. Last year we achieved the right to the exclusive use of the IPSA, IGPA and Inter-10 trademarks for a ten-year period, thus permitting the creation, trading and dealing ETFs of the main indices of the Santiago Stock Exchange.
| 2.5) | Awards and Recognition |
The best of Dinheiro 2013 (as Melhores da Dinheiro 2013) – promoted by Isto É Dinheiro magazine, this ranking awards the best companies of the year by using management criteria, this is: financial sustainability, human resources, innovation and quality, social and environmental responsibility and corporate governance. We also won the banking sector ranking for the seventh time.
Época NEGÓCIOS 360º– organized by Época magazine, this guide is organized in partnership with Dom Cabral Foundation, which carries out a thorough assessment of the largest Brazilian companies by considering as criteria: financial performance, corporate governance, human resources practices, innovation, vision of future and social and environmental responsibility. Once again, we achieved the first place in the bank sector in this guide, which is already in its second edition.
The 1,000 Best Investment Funds of 2013 (1000 Melhores Fundos de Investimento 2013) – promoted by the Exame Guide of Personal Investments, in a survey conducted by the Center of Finance Studies of FGV (GVCef-FGV), we were elected the Best Manager of the Year. This award which highlighted the best managers for retail, high-end clients, companies and institutional investors. Among 1,000 open-end funds analyzed, we were also elected in the Best Manager categories:
| § | Funds in which investors invest between R$ 50,000 and R$ 250,000 (selective retail); |
| § | Interbank rate (DI) and short-term funds; |
| § | Indexed equity funds; and |
| § | Multimarket investment funds. |
Latin American Executive Team 2013 – organized by the Institutional Investor Magazine, thisranking is achieved based on a survey conducted with over 800 managers of investment and pension funds (buy side analysts), brokers and investment banks (sell side analysts) operating in Latin America. It was disclosed on August 20, when we were the winners in six out of the eight ranking categories: Best Investor Relations by the Sell and Buy Sides; the BestCEO by the Sell and Buy Sides; the Best Bank CFO by the Buy Side and the Best Investor Relations Professional by the Buy Side.
Latin America Research Team 2013 – for the first time Itaú BBA was ranked as the number one Research team of Latin America.
Best Cash Management Bank in Brazil – we were recognized for the sixth consecutive year by Euromoney magazine, one of the most important financial market publications.
| 3) | OPERATIONS |
Commercial Banking - Retail
We offer a wide range of banking products and services to a diversified base of individuals and companies, the bank’s account holders and non-account holders. We have over 40 million clients and 32.9 thousand points of service throughout Brazil and abroad, by means of 4.1 thousand branches, 870 service centers (PABs) and over 27.9 thousand ATMs. In addition, we also provide, throughItaú 30 horas, a means of accessing and checking accounts, making payments, investments and other banking transactions, with no need to turn to a manager. Our products portfolio includes loans and a number of investment, insurance, foreign exchange and brokerage options, among others.
In the retail segment, we provide five Itaú Uniclass exclusive services, with dedicated managers, investment advisory services, exclusive cashiers, managerial telephone service and higher credit limits. We offer expert services to our high-end clients by means of Itaú Personnalité and, with over 20 years of experience in wealth management, we provide Itaú Private Bank, the largest private bank in Latin America. To meet the needs of our corporate clients, we provide Itaú Empresas. In which the very small, small and medium-market companies are served through a dedicated structure, with specific products and services.
Wholesale and Investment Banking
Our banking operations in the corporate banking segment are carried out by Itaú BBA, which operates with a multidisciplinary team, with agility to carry out operations that are traditional for a commercial bank and transactions in capital markets, mergers and acquisitions, offering full services to over 3 thousand of the largest business groups of Brazil, Argentina, Chile, Colombia and Peru. It also serves approximately 700 institutional investors, ensuring full coverage for the head offices of international clients through the Europe, New York and Shangai units.
In October we included another 20 thousand clients to the Wholesale Banking. These companies, with yearly revenues over R$ 30 million and which were previously served by our Retail sector, may now count on a more specialized structure, thus achieving a customized service. By means of this structure, we offer the same products and services available for the Corporate segment, including those provided by the Investment Banking for strategic mergers and acquisitions or companies going public.
Insurance
Our insurance business basically operates in the lines of life and accident, extended warranty and property damages for individuals and corporate solutions for legal entities. Focused on streamlining the portfolio of products and the efficiency in the engaging processes, our insurance policies are sold, among other channels, in our branches, via telemarketing, internet, ATMs, self-service terminals, local independent brokers and multinational brokers.
We hold 30% of capital of the Porto Seguro Group, the insurance company leading the residence and automobile insurance segment in Brazil. We have an operating agreement with the Porto Seguro Group to offer and distribute, on an exclusive basis, residence and automobile insurance products to clients in our network in Brazil and Uruguay.
External Units
We are present in 19 countries other than Brazil, in commercial banking and institutional client operations, and investment, corporate and private banking activities. Seven of these countries are in South America, which is our priority in terms of international expansion. Our operations also comprise North America, Central America, Europe, Asia and Middle East. In the period from January to September, our business abroad reached a recurring net income of approximately R$ 1.4 billion, with total assets of R$ 241.4 billion, equivalent to 12.3% and 22.3% of the bank’s total, respectively.
| 4) | PERFORMANCE |
| 4.1) | Indices |
We present below the performance of the main financial indicators:
| % | bps | |||||||||||
| Performance Ratios | September 30, 2013 | September 30, 2012 | Change | |||||||||
| Recurring return on average equity - annualized | 19.8 | 19.4 | 40 | |||||||||
| Return on average equity - annualized | 19.6 | 18.2 | 140 | |||||||||
| Risk-Adjusted Efficiency Ratio(1) | 71.1 | 74.5 | -340 | |||||||||
| Recurring return on average assets - annualized | 1.4 | 1.5 | -10 | |||||||||
| Return on average assets - annualized | 1.4 | 1.5 | -10 | |||||||||
| Nonperforming Loans Index (NPL over 90 days) | 3.9 | 5.1 | -120 | |||||||||
| Basel ratio - economic financial consolidated | 17.5 | 17.5 | 0 | |||||||||
| Fixed assets ratio - financial conglomerate | 49.8 | 45.5 | 430 | |||||||||
(1) Calculated based on international criteria defined in the Management’s Discussion & Analysis Report.
4.2) Income
| R$ billion | % | |||||||||||
| Statement of Income for the Period(1) | Jan to Sep/13 | Jan to Sep/12 | Change(2) | |||||||||
| Gross income from financial operations | 22.6 | 23.9 | -5.1 | |||||||||
| Expenses for allowance for loan losses | (14.4 | ) | (18.0 | ) | -19.9 | |||||||
| Income from recovery of credits written off as loss | 3.6 | 3.5 | 4.8 | |||||||||
| Banking service fees and income from bank charges | 17.5 | 15.1 | 15.8 | |||||||||
| Income from insurance, pension plan and capitalization operations | 2.6 | 2.1 | 24.9 | |||||||||
| Personnel, other administrative and operating expenses | (25.9 | ) | (24.6 | ) | 5.2 | |||||||
| Tax expenses | (3.3 | ) | (3.3 | ) | -0.7 | |||||||
| Income tax and social contribution | (2.8 | ) | (2.5 | ) | 12.3 | |||||||
| Recurring net income | 11.2 | 10.5 | 5.8 | |||||||||
| Net income | 11.0 | 10.1 | 9.4 | |||||||||
| Dividends and interest on capital (net of taxes) | 1.9 | 2.0 | -2.4 | |||||||||
(1) Excludes the non-recurring effects of each period.
(2) Change is calculated based on actual figures.
Net income for the period from January to September 2013 reached R$ 11.0 billion, with annualized return of 19.6% on average equity (18.2% in the same period of the previous year). Recurring net income was R$ 11.2 billion, with annualized return of 19.8%. The increase of 15.8% in banking service fees and income from banking charges, the increase of 24.9% in income from insurance, pension plan and capitalization operations, and the decrease of 19.9% in expenses for allowance for loan losses, as compared to the same period of 2012, contributed to the increased net income. We also highlight the increase of 9.3% in the loan portfolio, and noteworthy are the areas of payroll advance loans, mortgage, corporate and foreign operations, as drivers of income through lower risks and provisions. Gross income from financial operations decreased 5.1% and reflects our strategy to prioritize lower risk portfolios.
The risk-adjusted efficiency ratio reached 71.1% at the end of September, as compared to 74.5% recorded for the same period of 2012.
4.3) Asset Data
| R$ billion | % | |||||||||||
| Balance Sheet | September 30, 2013 | September 30, 2012 | Change(1) | |||||||||
| Total assets | 1,082.8 | 960.2 | 12.8 | |||||||||
| Loan portfolio with endorsements and sureties | 456.6 | 417.6 | 9.3 | |||||||||
| Free, raised and managed own assets | 1,570.3 | 1,349.0 | 16.4 | |||||||||
| Subordinated debt | 54.4 | 48.5 | 12.1 | |||||||||
| Stockholders’ equity | 78.3 | 79.0 | -0.9 | |||||||||
| Referential equity (economic-financial consolidated) | 116.0 | 110.8 | 4.7 | |||||||||
(1) Change is calculated based on actual figures.
| 4.3.1) | Assets |
Total consolidated assets reached R$ 1.08 trillion at the end of September 2013, which represented a growth of 12.8% when compared to the same period of the previous year. Noteworthy is the 17.6% increase in the institution’s liquidity (cash and cash equivalents added to interbank investments, current).
The diversification of our business is reflected in the composition of our funding and loan portfolio, reducing risks to specific segments, which may be more impacted by the volatility in economy, as follows:
| R$ million | % | |||||||||||
| Loan Portfolio | September 30, 2013 | September 30, 2012 | Change | |||||||||
| Brazil | 420,208 | 390,149 | 7.7 | |||||||||
| Individuals | 156,198 | 148,174 | 5.4 | |||||||||
| Credit cards | 43,078 | 36,699 | 17.4 | |||||||||
| Personal credit | 27,293 | 28,195 | -3.2 | |||||||||
| Payroll advance loans | 20,579 | 12,547 | 64.0 | |||||||||
| Vehicles | 42,733 | 54,046 | -20.9 | |||||||||
| Mortgage loan | 22,515 | 16,687 | 34.9 | |||||||||
| Companies | 264,010 | 241,975 | 9.1 | |||||||||
| Corporate | 178,228 | 152,527 | 16.9 | |||||||||
| Very small, small and middle-market companies | 85,782 | 89,448 | -4.1 | |||||||||
| Latin America | 36,354 | 27,454 | 32.4 | |||||||||
| Total with endorsements and sureties | 456,561 | 417,603 | 9.3 | |||||||||
| Corporate – Private securities | 24,455 | 20,030 | 22.1 | |||||||||
| Total with endorsements, sureties and private securities | 481,017 | 437,632 | 9.9 | |||||||||
| Total with endorsements, sureties and private securities (former Vehicles) | 438,284 | 383,587 | 14.3 | |||||||||
On September 30, 2013 the balance of the loan portfolio, including endorsements and sureties, reached R$ 456.6 billion, an increase of 9.3% as compared to September 30, 2012. If we also consider the risks associated to the credits we borrow in the private securities modality, this increase will reach 9.9%. In Brazil, the balance of our loan portfolio to individuals reflects our strategy to prioritize portfolios with lower risks. Highlights:
| Brazil | |
| Individuals | |
Credit Card (Itaucard, Hipercard and partnerships) | We are leaders in the credit card segment in Brazil. From January to September 2013, the transacted amount in debit and credit cards reached R$ 181.5 billion, a 11.8% increase as compared to the same period of 2012. The balance of the loan portfolio reached R$ 43.1 billion, an increase of 17.4% as compared to the same period of the previous year. |
Payroll advance loans | Our payroll advance loans portfolio recorded a 64.0% increase when compared to September 30, 2012. The portfolio reached 4.5% of total achieved by the bank, reaching R$ 20.6 billion Banco Itaú BMG Consignado S.A. started operations in December 2012 and is present throughout the Brazilian territory, reaching R$ 5.6 billion of the estimated R$ 12 billion expected for the next 2 years, when the new institution was announced. |
| Vehicles | In September, we regained leadership in financing granted for brand new vehicles. Since last year, we have reduced the risk in this segment, which enabled us to improve the portfolio quality, with better credit results. We ended this period with a balance of R$ 42.7 billion, 20.9% lower than in the previous period. In the third quarter of 2013, new financing, lease and Finame granted totaled R$ 5.2 billion, a 3.5% increase as compared to the same period of the previous year. |
| Mortgage loans | We are the leaders in mortgage loans to individuals among the Brazilian private banks. Our offer is made by the network of branches, development companies, real estate agencies and partnerships. By the end of September, we had carried out approximately 27.0 thousand mortgage loans, a 34% increase when compared to the same period of the previous year. Mortgage loans reached R$ 32.0 billion, a growth of 33.1% as compared to September 2012, and noteworthy was the 34.9% increase in financing to individuals. |
| Companies | |
| Wholesale Banking | The Corporate portfolio, managed by Itaú BBA, is composed of loans in national and foreign currency, mandatory loans (BNDES onlending, Rural Credit and Mortgage Loans) and guarantees. In the period from January to September, noteworthy are the transactions in foreign currency that posted a 10.6% growth, particularly due exchange devaluation, and mandatory loans, which increase was 28.7% as compared to the same period of the previous year. Among Itaú BBA's activities, derivatives stand out. The focus was on operations hedging the exposures to foreign currencies, interest rates and commodities with clients that export or with prices pegged to the movements of international markets. The volume of operations contracted from January through September 2013 was 33.9% higher than in the same period of the previous year. |
| Latin America | |
| Argentina, Chile, Colombia, Paraguay and Uruguay | Our loan portfolio recorded a significant increase of 32.4% (not considering the effect of exchange variation) in relation to September 2012. We highlight the increase of loan portfolios in the companies segment in Chile, Uruguay and Argentina, which increased 32.7%, 55.4% and 35.1% respectively. In the individuals segment, the 27.1% increase in the Chile portfolio as compared to the same period of the previous year. |
Default
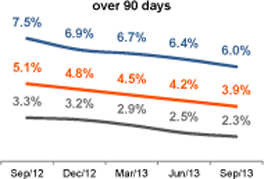 |  |
In line with our credit granting policy, the total default ratio, considering the balance of transactions overdue for over 90 days, reached 3.9% on September 30, 2013, posting a decrease of 120 bps as compared to September 30, 2012. This ratio has recorded the lowest level since Itaú Unibanco merger in 2008, mainly impacted by the change in the credit profile of our portfolio. This ratio reached 6.0% for the individuals and 2.3% for companies’ portfolio at the end of September 2013, dropping 150 and 100 basis points, respectively, in relation to the same period of the previous year.
Short-term default, measured by the balance of transactions overdue from 15 to 90 days, also recorded a decrease in relation to the same period of the previous year. The reduction of 120 bps in the bank’s total portfolio was mainly due to the decrease of 180 bps in the ratio for individuals.
4.3.2) Funding
Free, raised and managed assets totaled R$ 1.57 trillion on September 30, 2013, a 16.4% growth as compared to the same period of 2012. Of this total, 45.9% refer to investment funds, managed portfolios and technical provisions for insurance, pension plan and capitalization, 25.5% to deposits, debentures, and funds from bills, 24.4% to Free assets and other liabilities, and 4.2% to Onlending, interbank deposits and Foreign borrowings through securities.
As compared to September 2012, we recorded a 26.9% increase in demand deposits added to savings deposits, which are funded at a lower cost, showing the attractiveness of our brand. The increase in funding (net of Compulsory deposits and Cash and cash equivalents) provided improvement in the Loan portfolio and funding ratio, reaching 76.5% on September 30, 2013.
4.3.3) Capital Strength
Basel Ratio –At the end of September 2013, the ratio reached 17.5%, remaining unchanged as compared to the same period of 2012, an event that evidences our strength in the capital base.
Rating Agency – in the beginning of October, Moody’s changed the outlook of the Brazilian sovereign rating from positive to stable, based on the following considerations: (i) the main credit metrics are deteriorating; (ii) the economy is going through an extended low-growth period and (iii) deterioration in the reporting quality of government accounts.
As a consequence of this change, the rating agency downgraded from positive to stable the outlook of the ratings (i) of the issuer and long-term deposit on a global scale and local currency (ii) of long-term deposit, senior and subordinated debt in foreign currency of Itaú Unibanco Holding S.A.
Additionally, in view of the reassessment conducted by the agency on the Brazilian government’s capability to provide system support to the financial system, Moody’s downgraded the ratings: (i) of the long-term issuer on a global scale and local currency, and (ii) of long-term programs/senior debt on a global scale and foreign currency of Itaú Unibanco Holding S.A.
For additional information on ratings, access www.itau-unibanco.com.br/ri > Market Opinion > Ratings.
| 4.4) | Services |
| Asset Management | In September 2013, we reached R$ 376.3 billion in assets under management, according to the ANBIMA management ranking, accounting for 15.5% of the market. We posted a 9.6% growth in total, particularly in multimarket funds and DI Funds. In addition to this strong local presence, the area has been expanding to the international field, with professionals strategically allocated, seeking adequate investment opportunities and solutions to global clients. |
| Custody Services | In the custody market, we hold R$ 930.6 billion in assets, according to the ANBIMA management ranking on September, 2013, which represents a 2% increase as compared to the same period of the previous year. In the segment of share bookkeeping services, we account for 63.5% of total companies listed on the BM&FBOVESPA. |
| Kinea | The investments management company controlled by Itaú Unibanco, holder of R$ 5.5 billion in managed assets, ranked among the largest managers in Brazil of real estate funds, hedge funds and private equity. |
| Insurance | The change in retained insurance premiums was 10.9% in the first nine months of the previous year, reaching R$ 4,303 million (not including our share in Porto Seguro, in which we hold 30% of capital). The Individual Life and Accident products were outstanding in the third quarter, with record sales as a result of a campaign in the branch network. The card protection insurance also posted a representative growth both in the opening of accounts and in ATMs, with increases of 122% and 81%, respectively, as compared to the third quarter of 2012. Technical provisions for insurance reached R$ 9.7 billion on September 30, 2013. |
| Pension Plan | The increase in future interest rates in the beginning of the quarter affected fixed-income funds of the pension plan market. Total funding from pension plans totaled R$ 12.8 billion year to date, a 5.2% drop as compared to the same period of the previous year. Revenues from management fees increased 17.3% in the same period, totaling R$ 826.3 million. Technical provisions increased 13.4% in relation to September 2012, totaling R$ 86.0 billion at the end of the period. |
| Capitalization | Technical provisions for capitalization reached R$ 3.0 billion on September 30, 2013, with a 3.2% increase in the twelve-month period. The collection from capitalization securities reached R$ 1.758 million from January to September, a 18.8% increase when compared to the same period of 2012. |
| Consortium | A self-financing system for the installment payment of properties and vehicles, the consortium supplements our product portfolio. As it is a service provision, consortium administration does not give rise to default risk or allocation of loan capital for the institution. Consortium income from January to September 2013 reached R$ 274 million, a growth of 79.8% in relation to the same period of the previous year. |
| Electronic Payment Means (Rede and Hipercard) | Our business is one of the largest in the multi-brand accreditation and merchant acquisition of credit, debt, benefit cards (voucher) and stores (private label) in Brazil. In addition, we carry out the capture, transmission, processing and financial settlement of transactions involving credit and debit cards, factoring, availability of terminals, inquiry on checks, e-commerce, and loyalty programs with partners, and electronic statement, among others. As from the second half of 2013, Rede started to capture transactions from Hipercard. Thus, Hipercard currently has the capture structure and equipment network of Rede in the whole country, increasing its operating efficiency and presence in the domestic level. |
| Investment Banking | Between January and September 2013, our Merger & Acquisition operation, which provided financial advisory to 26 transactions, totaling US$ 9.6 billion, was outstanding. In fixed income, we took part in operations of debentures, promissory notes and securitization, which totaled R$ 10.7 billion in the period from January to September 2013. In international issues of fixed income, we acted as the joint bookrunner of offerings with a total volume of US$ 18.8 billion. In capital markets, we reached the 1st position in the Origination ranking of ANBIMA of September 2013, with a volume of operations of R$ 3.2 billion. |
| 4.5) | Stock Market |
Market value – At the end of the third quarter of 2013, Itaú Unibanco was ranked as the 22ndlargest bank in the world based on the market value criterion (R$ 156.4 billion), according to the Bloomberg ranking.
Traded volume –We daily traded R$ 676.8 million on the stock exchanges where our shares are traded, with a daily average volume of R$ 333.5 million (ITUB3 and ITUB4) on BM&FBOVESPA and R$ 343.3 million (ITUB) on the New York Stock Exchange (NYSE), in the year to date.
Dividends/Interest on Capital –In the year to date, we paid or provided for R$ 1,912.6 million in dividends and interest on capital, net of taxes. Net payout for the last twelve months was 30.7%.
Relations with the market –We took part in 20 conferences and road shows in Brazil and abroad, and held 19 out of the 22 Apimec (Association of Capital Market Analysts and Investment Professionals) meetings scheduled for 2013, thus strengthening our relations with stockholders, analysts and investors of the capital markets. We take the opportunity to strengthen our invitation to our relationship audience for the next Apimec meeting in São Paulo, to be held on November 12.
| R$ | % | |||||||||||
| Shares | September 30, 2013 | September 30, 2012 | Change | |||||||||
| Recurring net income per share(1) | 2.25 | 2.12 | 5.9 | |||||||||
| Net income per share(1) | 2.22 | 2.03 | 9.4 | |||||||||
| Book value per share(1) | 15.79 | 15.89 | -0.6 | |||||||||
| Number of outstanding shares (in thousands)(2) | 4,956,804 | 4,970,068 | -0.3 | |||||||||
| Dividends/Interest on capital, net per share | 0.39 | 0.39 | -0.5 | |||||||||
| Price of preferred share (ITUB4)(2)(3) | 31.56 | 27.85 | 13.3 | |||||||||
| Price of common share (ITUB3)(2)(3) | 30.17 | 24.96 | 20.9 | |||||||||
| Price of preferred share (PN)(3)/Net income per share | 14.19 | 13.70 | 3.6 | |||||||||
| Price of preferred share (PN)(3)/Stockholders’ equity per share | 2.00 | 1.75 | 14.1 | |||||||||
| Market value (in billions) (4)(5) | 156.4 | 138.4 | 13.0 | |||||||||
(1) Calculated based on the weighted average of the number of shares;
(2) The number of outstanding shares and the price of share were adjusted to reflect the 10% bonus on May 20, 2013;
(3) Based on the closing quotation on the last day of the period;
(4) Calculated based on the average quotation of preferred shares on the last day of the period (quotation of average PN multiplied by the number of outstanding shares at the end of the period);
(5) R$ 152,6 billion considering the closing quotation of common and preferred (ON and PN) shares multiplied by total outstanding shares of each type of shares.
| 5) | PEOPLE |
Itaú Unibanco had approximately 94.3 thousand people at the end of the third quarter of 2013, including over 6 thousand employees in foreign units. The employee’s fixed compensation plus charges and benefits totaled R$ 7.8 billion for this period.
We started the selection process for the Trainee Program 2014, which counted this year on 18.3 thousand enrollments. Among those enrolled, we have youths coming from throughout Brazil, in addition to our interns and employees eligible for the program. The final outcome is expected to be disclosed to the candidates in November.
On October 11, 2013 a collective bargaining agreement was signed in connection with the 2013/2014 collective bargaining process, which resulted in an 8% addition to the salaries of banking sector employees, in addition to other benefits.
| 6) | SUSTAINABILITY |
Itaú Unibanco was selected for the 14th consecutive year to make up the Dow Jones Sustainability World Index (DJSI) portfolio, the main sustainability index in the world, in its 2013/2014 edition. Accordingly, it is the only Latin American bank to be part of the index since its creation. In this edition, we achieved the best rate in the banking sector in the criteria “Policies/Anti-crime actions”, “Brand management” and “Financial Stability and Systemic Risk”. The new portfolio includes only eight Brazilian companies, among them two related companies (Itaú Unibanco and Itaúsa). This shows the significance of the corporate sustainability in our organizational culture and long-term vision.
We were elected as one of the companies with the best environmental practices in Brazil in the Época Empresa Verde (Green Company Época) Award (Época magazine), as one of the leading companies in the Empresário Amigo do Esporte 2013 (Entrepreneur Friend of Sport) Award (Ministry of Sport), and we are one of the companies that invested more in this sector under the Sports Incentive Law by supporting sports and para-sports projects.
In this last quarter we published the Itaú Social Welfare 2013 index. Designed by our economy research team, this index takes into consideration human conditions and income distribution in Brazil, in addition to economy conditions.
In the beginning of 2013 we launched the “#issomudaomundo” (change the world) platform, aimed at forging a bond between our purpose of being a transformation agent in the lives of people, our causes and the several projects receiving investments from Itaú in connection with the education, culture, sports and urban mobility pillars. After the Bike Rio, Bike Sampa, Bike PoA and Bike PE (biking in Rio de Janeiro, biking in São Paulo, biking in Porto Alegre and biking in Pernambuco), now comes the time for Bike Salvador (biking in Salvador) in another partnership with the Government of Bahia, which was launched last month.
In October we redesigned the national campaign to encourage reading among children. In this action, adults will be invited to read for children and, to support this invitation, Itaú will offer 4.4 million children’s books free of charge. The purpose is to mobilize society for the importance of reading to a child, showing how this gesture may contribute to ensuring their rights, develop their capacity to learn, and express themselves, in addition to strengthening the affective bond between the child and the adult and developing the taste for reading from an early age. Since 2010, over 30 million books were delivered by the program.
| 7) | INDEPENDENT AUDITORS – CVM Instruction No. 381 |
Procedures adopted by the Company
The policy adopted by Itaú Unibanco Holding S.A., its subsidiaries, and parent company to engage in non-audit related services from our independent auditors is based on the applicable regulations and internationally accepted principles that preserve the auditor’s independence. These principles include the following: (a) an auditor cannot audit his or her own work, (b) an auditor cannot function in the role of management in companies where he or she provides external audit services; and (c) an auditor cannot promote the interests of his or her client.
During the period from January to September 2013, the independent auditors and related parties did not provide non-audit related services in excess of 5% of total external audit fees.
According to CVM Instruction No. 381, we list below the engaged services and related dates:
| § | January 7, March 20, July 31 and August 28 – acquisition of technical material; |
| § | February 28 – review of aspects related to the business continuity program. |
Summary of the Independent Auditors’ justification - PricewaterhouseCoopers
The provision of the above described non-audit related professional services do not affect the independence or the objectivity of the external audit of Itaú Unibanco, its parent and subsidiary/affiliated companies. The policy adopted for providing non-audit related services to Itaú Unibanco is based on principles that preserve the independence of Independent Auditors, all of which were considered in the provision of the referred services, including the approval by the Audit Committee.
| 8) | BACEN - Circular No. 3,068/01 |
Itaú Unibanco hereby represents to have the financial capacity and the intention to hold to maturity securities classified under the line “held-to-maturity securities” in the balance sheet, in the amount of R$ 3,7 billion, corresponding to 1,3% of total securities held.
| 9) | IFRS (International Financial Reporting Standards)/BRGAAP |
We disclosed the consolidated financial statements in accordance with the international financial reporting standards (IFRS), at the same date of this publication, pursuant to CVM/SEP Circular Letter 01/13.
| 10) | ACKNOWLEDGMENTS |
We thank our employees for their determination and skills which have been essential to reaching consistent and differentiated results, and our stockholders and clients for their trust.
(Approved at the Board of Directors' Meeting of October 28, 2013).
ITAÚ UNIBANCO HOLDING S.A.
| BOARD OF DIRECTORS | EXECUTIVE BOARD | |
| Chairman | Chief Executive Officer | |
| Pedro Moreira Salles | Roberto Egydio Setubal | |
| Vice-Chairmen | Executive Vice-Presidents | |
| Alfredo Egydio Arruda Villela Filho | Alfredo Egydio Setubal (*) | |
| Roberto Egydio Setubal | Candido Botelho Bracher | |
| Members | Executive Directors | |
| Alfredo Egydio Setubal | Caio Ibrahim David | |
| Candido Botelho Bracher | Claudia Politanski | |
| Demosthenes Madureira de Pinho Neto | Eduardo Mazzilli de Vassimon | |
| Gustavo Jorge Laboissière Loyola | Ricardo Baldin | |
| Henri Penchas | ||
| Israel Vainboim | ||
| Nildemar Secches | ||
| Pedro Luiz Bodin de Moraes | Directors | |
| Ricardo Villela Marino | Alexsandro Broedel Lopes | |
| Ana Tereza de Lima e Silva Prandini | ||
| Eduardo Hiroyuki Miyaki | ||
| Emerson Macedo Bortoloto | ||
| AUDIT COMMITTEE | Robert George Stribling | |
| President | Rodrigo Luis Rosa Couto | |
| Gustavo Jorge Laboissière Loyola | Rogério Paulo Calderón Peres | |
| Members | ||
| Alkimar Ribeiro Moura | (*) Investor Relations Director | |
| Eduardo Augusto de Almeida Guimarães | ||
| Geraldo Travaglia Filho | ||
| Guy Almeida Andrade | ||
| Luiz Alberto Fiore | ||
| FISCAL COUNCIL | ||
| President | ||
| Iran Siqueira Lima | ||
| Members | ||
| Alberto Sozin Furuguem | Accountant | |
| Luiz Alberto de Castro Falleiros | Reginaldo José Camilo | |
| CRC-1SP – 114.497/O-9 |
ITAÚ UNIBANCO S.A.
| Chief Executive Officer and General Manager | Directors (continued) | |
| Roberto Egydio Setubal | Fernando Barçante Tostes Malta | |
| Fernando Della Torre Chagas | ||
| Executive Vice-Presidents | Fernando José Costa Teles | |
| Alexandre de Barros | Fernando Mattar Beyruti | |
| Alfredo Egydio Setubal | Flávio Delfino Junior | |
| Caio Ibrahim David | Francisco Vieira Cordeiro Neto | |
| Claudia Politanski | Gabriel Amado de Moura | |
| Eduardo Mazzilli de Vassimon | Guilherme Martins Vasconcelos | |
| José Castro Araújo Rudge | Henrique Pinto Echenique | |
| Márcio de Andrade Schettini | João Antonio Dantas Bezerra Leite | |
| Marco Ambrogio Crespi Bonomi | Jorge Luiz Viegas Ramalho | |
| Ricardo Villela Marino | José Félix Valencia Ríos | |
| José Isern | ||
| Executive Directors | José Virgilio Vita Neto | |
| André Sapoznik | Leila Cristiane Barboza Braga de Melo | |
| Carlos Eduardo Monico | Luís Eduardo Gross Siqueira Cunha | |
| Fernando Marsella Chacon Ruiz | Luis Tadeu Mantovani Sassi | |
| Flavio Augusto Aguiar de Souza | Luiz Antonio Nogueira de França | |
| Gustavo Adolfo Funcia Murgel | Luiz Eduardo Loureiro Veloso | |
| Luis Antonio Rodrigues | Luiz Fernando Butori Reis dos Santos | |
| Luís Fernando Staub | Luiz Severiano Ribeiro | |
| Milton Maluhy Filho | Marcello Siniscalchi | |
| Marcelo Boock | ||
| Directors | Marcelo da Costa Lourenço | |
| Adilso Martins de Lima | Marcelo Luis Orticelli | |
| Adriano Cabral Volpini | Marco Antonio Sudano | |
| Alberto Fernandes | Marcos Antônio Vaz de Magalhães | |
| Alexandre Jadallah Aoude | Marcos Vanderlei Belini Ferreira | |
| Alexsandro Broedel Lopes | Mario Luiz Amabile | |
| Álvaro de Alvarenga Freire Pimentel | Messias dos Santos Esteves | |
| Ana Carla Abrão Costa | Osvaldo José Dal Fabbro | |
| Ana Tereza de Lima e Silva Prandini | Paulo Meirelles de Oliveira Santos | |
| Andréa Matteucci Pinotti Cordeiro | Renata Helena de Oliveira Tubini | |
| Carlos Eduardo de Castro | Ricardo Lima Soares | |
| Carlos Eduardo Maccariello | Ricardo Orlando | |
| Carlos Henrique Donegá Aidar | Ricardo Ribeiro Mandacaru Guerra | |
| Carlos Orestes Vanzo | Ricardo Urquijo Lazcano | |
| Cesar Padovan | Roberto Fernando Vicente | |
| Cícero Marcus de Araújo | Rodrigo Luis Rosa Couto | |
| Cintia Carbonieri Araújo | Rogério Carvalho Braga | |
| Claudio César Sanches | Rogério Paulo Calderón Peres | |
| Claudio José Coutinho Arromate | Romildo Gonçalves Valente | |
| Cristiane Magalhães Teixeira Portella | Rooney Silva | |
| Cristina Cestari Spada | Sergio Guillinet Fajerman | |
| Daniel Luiz Gleizer | Sergio Souza Fernandes Júnior | |
| Edilson Pereira Jardim | Wagner Bettini Sanches | |
| Fabiana Pascon Bastos |
| BANCO ITAÚ BBA S.A. | ||
| BOARD OF DIRECTORS | ||
| Chairman | Directors | |
| Roberto Egydio Setubal | Alberto Zoffmann do Espírito Santo | |
| Alexandre Enrico Silva Figliolino | ||
| Vice-Chairmen | André Carvalho Whyte Gailey | |
| Alfredo Egydio Setubal | André Ferrari | |
| Candido Botelho Bracher | Antonio José Calheiros Ribeiro Ferreira | |
| Caio Ibrahim David | ||
| Members | Cristiano Rogério Cagne | |
| Antonio Carlos Barbosa de Oliveira | Eduardo Cardoso Armonia | |
| Caio Ibrahim David | Eduardo Corsetti | |
| Eduardo Mazzilli de Vassimon | Elaine Cristina Zanatta Rodrigues Vasquinho | |
| Henri Penchas | Emerson Savi Junqueira | |
| João Dionísio Filgueira Barreto Amoêdo | Fabio Massashi Okumura | |
| Flávio Delfino Junior | ||
| Gilberto Frussa | ||
| EXECUTIVE BOARD | Ilan Goldfajn | |
| Chief Executive Officer | João Carlos de Gênova | |
| Candido Botelho Bracher | Luiz Felipe Monteiro Arcuri Trevisan | |
| Marcello Peccinini de Chiaro | ||
| Managing Vice-Presidents | Marcelo Ariel Rosenhek | |
| Alberto Fernandes | Marco Antônio Sudano | |
| Daniel Luiz Gleizer | Mário Lúcio Gurgel Pires | |
| Jean-Marc Robert Nogueira Baptista Etlin | Mário Luís Brugnetti | |
| José Roberto Haym | Rodrigo Pastor Faceiro Lima | |
| Thales Ferreira Silva | ||
| Executive Directors | Vanessa Lopes Reisner | |
| Alexandre Jadallah Aoude | ||
| Álvaro de Alvarenga Freire Pimentel | ||
| André Luís Teixeira Rodrigues | ||
| Fernando Fontes Iunes | ||
| José Augusto Durand |
| ITAÚ SEGUROS S.A. | |
| Chief Executive Officer | |
| Fernando José Costa Teles | |
| Directors | |
| Adriano Cabral Volpini | |
| Alexsandro Broedel Lopes | |
| Antonio Eduardo Márquez de Figueiredo Trindade | |
| Cláudio José Coutinho Arromate | |
| Fernando Barçante Tostes Malta (*) | |
| Henrique Pinto Echenique | |
| Mario Luiz Amabile | |
| (*) Elected at O/EGM on August 14, 2013. Awaiting Susep approval. | |
ITAÚ UNIBANCO HOLDING S.A.
Consolidated Balance Sheet (Note 2a)
(In thousands of Reais)
| Assets | Note | 09/30/2013 | 09/30/2012 | |||||||
| Current assets | 793,348,881 | 706,038,456 | ||||||||
| Cash and cash equivalents | 14,466,493 | 13,103,962 | ||||||||
| Interbank investments | 4b and 6 | 192,458,860 | 162,895,073 | |||||||
| Money market | 169,580,802 | 142,631,765 | ||||||||
| Money market – Assets Guaranteeing Technical Provisions - SUSEP | 11b | 3,107,401 | 2,550,201 | |||||||
| Interbank deposits | 19,770,657 | 17,713,107 | ||||||||
| Securities and derivative financial instruments | 4c, 4d and 7 | 203,098,781 | 180,685,791 | |||||||
| Own portfolio | 62,556,363 | 50,363,127 | ||||||||
| Subject to repurchase commitments | 27,293,249 | 29,028,595 | ||||||||
| Pledged in guarantee | 6,976,675 | 6,061,433 | ||||||||
| Securities under resale agreements with free movement | 46,674 | 88,986 | ||||||||
| Deposited with the Central Bank | 12,983,586 | 12,591,352 | ||||||||
| Derivative financial instruments | 7,140,410 | 6,289,799 | ||||||||
| Assets guaranteeing technical provisions - PGBL/VGBL fund quotas | 11b | 79,779,392 | 69,856,629 | |||||||
| Assets guaranteeing technical provisions – other securities | 11b | 6,322,432 | 6,405,870 | |||||||
| Interbank accounts | 73,070,551 | 68,050,957 | ||||||||
| Pending settlement | 6,015,643 | 3,642,547 | ||||||||
| Central Bank deposits | 67,001,420 | 64,359,216 | ||||||||
| National Housing System (SFH) | 1,599 | 1,106 | ||||||||
| Correspondents | 51,889 | 32,654 | ||||||||
| Interbank onlending | - | 15,434 | ||||||||
| Interbranch accounts | 98,045 | 45,053 | ||||||||
| Loan, lease and other credit operations | 8 | 199,763,834 | 190,369,182 | |||||||
| Operations with credit granting characteristics | 4e | 213,468,759 | 205,865,976 | |||||||
| (Allowance for loan losses) | 4f | (13,704,925 | ) | (15,496,794 | ) | |||||
| Other receivables | 107,643,952 | 87,441,291 | ||||||||
| Foreign exchange portfolio | 9 | 52,982,235 | 40,328,553 | |||||||
| Income receivable | 1,599,211 | 1,278,004 | ||||||||
| Transactions with credit card issuers | 4e | 19,978,743 | 17,466,525 | |||||||
| Receivables from insurance and reinsurance operations | 4m I and 11b | 4,636,052 | 3,832,954 | |||||||
| Negotiation and intermediation of securities | 3,281,112 | 2,612,552 | ||||||||
| Sundry | 13a | 25,166,599 | 21,922,703 | |||||||
| Other assets | 4g | 2,748,365 | 3,447,147 | |||||||
| Assets held for sale | 168,304 | 151,515 | ||||||||
| (Valuation allowance) | (47,482 | ) | (42,148 | ) | ||||||
| Unearned premiums of reinsurance | 4m I | 714,658 | 703,734 | |||||||
| Prepaid expenses | 4g and 13b | 1,912,885 | 2,634,046 | |||||||
| Long-term receivables | 274,873,312 | 231,030,307 | ||||||||
| Interbank investments | 4b and 6 | 804,451 | 447,218 | |||||||
| Money market | 387 | 5 | ||||||||
| Interbank deposits | 804,064 | 447,213 | ||||||||
| Securities and derivative financial instruments | 4c, 4d and 7 | 69,011,104 | 53,870,599 | |||||||
| Own portfolio | 42,407,993 | 33,015,876 | ||||||||
| Subject to repurchase commitments | 16,569,334 | 11,117,179 | ||||||||
| Pledged in guarantee | 545,104 | 611,621 | ||||||||
| Derivative financial instruments | 4,722,572 | 4,755,155 | ||||||||
| Assets guaranteeing technical provisions – other securities | 11b | 4,766,101 | 4,370,768 | |||||||
| Interbank accounts - National Housing System (SFH) | 709,581 | 665,268 | ||||||||
| Loan, lease and other credit operations | 8 | 161,623,237 | 141,758,683 | |||||||
| Operations with credit granting characteristics | 4e | 173,570,855 | 153,944,316 | |||||||
| (Allowance for loan losses) | 4f | (11,947,618 | ) | (12,185,633 | ) | |||||
| Other receivables | 40,442,889 | 32,944,074 | ||||||||
| Foreign exchange portfolio | 9 | 6,688 | 621,334 | |||||||
| Sundry | 13a | 40,436,201 | 32,322,740 | |||||||
| Other assets | 4g | 2,282,050 | 1,344,465 | |||||||
| Unearned premiums of reinsurance | 4m I | 269,443 | - | |||||||
| Prepaid expenses | 4g and 13b | 2,012,607 | 1,344,465 | |||||||
| Permanent assets | 14,564,629 | 23,147,466 | ||||||||
| Investments | 4h and 15a Il | 3,067,996 | 3,324,158 | |||||||
| Investments in affiliates and jointly controlled entities | 2,345,214 | 2,365,544 | ||||||||
| Other investments | 996,570 | 1,163,906 | ||||||||
| (Allowance for losses) | (273,788 | ) | (205,292 | ) | ||||||
| Real estate in use | 4i and 15b | 6,108,484 | 5,330,113 | |||||||
| Real estate in use | 3,814,520 | 3,367,455 | ||||||||
| Other fixed assets | 9,862,468 | 9,177,275 | ||||||||
| (Accumulated depreciation) | (7,568,504 | ) | (7,214,617 | ) | ||||||
| Goodwill | 4j and 15b | 44,983 | 10,068,929 | |||||||
| Intangible assets | 4k and 15b | 5,343,166 | 4,424,266 | |||||||
| Acquisition of rights to credit payroll | 1,202,565 | 1,668,789 | ||||||||
| Other intangible assets | 6,092,547 | 4,812,760 | ||||||||
| (Accumulated amortization) | (1,951,946 | ) | (2,057,283 | ) | ||||||
| Total assets | 1,082,786,822 | 960,216,229 | ||||||||
The accompanying notes are an integral part of these financial statements.
ITAÚ UNIBANCO HOLDING S.A.
Consolidated Balance Sheet (Note 2a)
(In thousands of Reais)
| Liabilities | Note | 09/30/2013 | 09/30/2012 | |||||||
| Current liabilities | 596,435,351 | 498,055,041 | ||||||||
| Deposits | 4b and 10b | 192,810,585 | 159,641,813 | |||||||
| Demand deposits | 37,816,640 | 29,817,694 | ||||||||
| Savings deposits | 98,227,575 | 77,413,953 | ||||||||
| Interbank deposits | 7,324,006 | 9,261,769 | ||||||||
| Time deposits | 49,442,364 | 43,148,397 | ||||||||
| Deposits received under securities repurchase agreements | 4b and 10c | 175,113,985 | 134,124,016 | |||||||
| Own portfolio | 73,630,824 | 67,401,791 | ||||||||
| Third-party portfolio | 100,216,519 | 66,487,407 | ||||||||
| Free portfolio | 1,266,642 | 234,818 | ||||||||
| Funds from acceptances and issuance of securities | 4b and 10d | 25,775,077 | 32,853,856 | |||||||
| Real estate, mortgage, credit and similar notes | 19,651,889 | 23,008,711 | ||||||||
| Debentures | 220 | 2,616,549 | ||||||||
| Foreign borrowings through securities | 6,122,968 | 7,228,596 | ||||||||
| Interbank accounts | 7,625,626 | 4,303,979 | ||||||||
| Pending settlement | 5,099,684 | 3,167,626 | ||||||||
| Correspondents | 2,525,942 | 1,136,353 | ||||||||
| Interbranch accounts | 5,365,585 | 4,055,688 | ||||||||
| Third-party funds in transit | 5,330,107 | 4,048,132 | ||||||||
| Internal transfer of funds | 35,478 | 7,556 | ||||||||
| Borrowings and onlending | 4b and 10e | 37,607,335 | 30,292,811 | |||||||
| Borrowings | 25,431,043 | 18,623,732 | ||||||||
| Onlending | 12,176,292 | 11,669,079 | ||||||||
| Derivative financial instruments | 4d and 7h | 5,040,150 | 5,036,698 | |||||||
| Technical provision for insurance, pension plan and capitalization | 4m II and 11a | 11,457,411 | 11,478,348 | |||||||
| Other liabilities | 135,639,597 | 116,267,832 | ||||||||
| Collection and payment of taxes and contributions | 4,430,366 | 4,517,450 | ||||||||
| Foreign exchange portfolio | 9 | 53,308,271 | 40,495,090 | |||||||
| Social and statutory | 16b II | 2,385,194 | 2,335,915 | |||||||
| Tax and social security contributions | 4n 4o and 14c | 7,843,061 | 8,375,074 | |||||||
| Negotiation and intermediation of securities | 6,703,864 | 5,099,896 | ||||||||
| Credit card operations | 4e | 42,172,662 | 38,979,670 | |||||||
| Subordinated debt | 10f | 4,347,233 | 4,631,588 | |||||||
| Sundry | 13c | 14,448,946 | 11,833,149 | |||||||
| Long-term liabilities | 405,164,984 | 381,248,470 | ||||||||
| Deposits | 4b and 10b | 59,468,640 | 72,277,542 | |||||||
| Interbank deposits | 355,763 | 254,083 | ||||||||
| Time deposits | 59,112,877 | 72,023,459 | ||||||||
| Deposits received under securities repurchase agreements | 4b and 10c | 120,022,467 | 111,147,697 | |||||||
| Own portfolio | 91,064,610 | 94,345,489 | ||||||||
| Free portfolio | 28,957,857 | 16,802,208 | ||||||||
| Funds from acceptances and issuance of securities | 4b and 10d | 24,896,558 | 24,190,179 | |||||||
| Real estate, mortgage, credit and similar notes | 14,624,349 | 16,814,606 | ||||||||
| Foreign borrowings through securities | 10,272,209 | 7,375,573 | ||||||||
| Borrowings and onlending | 4b and 10e | 35,693,745 | 26,560,967 | |||||||
| Borrowings | 6,515,533 | 3,370,086 | ||||||||
| Onlending | 29,178,212 | 23,190,881 | ||||||||
| Derivative financial instruments | 4d and 7g | 4,165,030 | 4,088,688 | |||||||
| Technical provision for insurance, pension plan and capitalization | 4m II and 11a | 87,300,193 | 75,802,710 | |||||||
| Other liabilities | 73,618,351 | 67,180,687 | ||||||||
| Foreign exchange portfolio | 9 | 6,794 | 629,586 | |||||||
| Tax and social security contributions | 4n, 4o and 14c | 12,769,661 | 13,041,071 | |||||||
| Subordinated debt | 10f | 50,046,294 | 43,912,152 | |||||||
| Sundry | 13c | 10,795,602 | 9,597,878 | |||||||
| Deferred income | 4p | 1,085,103 | 812,922 | |||||||
| Minority interest in subsidiaries | 16e | 1,841,757 | 1,121,285 | |||||||
| Stockholders' equity | 16 | 78,259,627 | 78,978,511 | |||||||
| Capital | 60,000,000 | 45,000,000 | ||||||||
| Capital reserves | 854,358 | 812,352 | ||||||||
| Revenue reserves | 20,138,600 | 33,503,773 | ||||||||
| Asset valuation adjustment | 4c, 4d and 7d | (815,451 | ) | 1,189,720 | ||||||
| (Treasury shares) | (1,917,880 | ) | (1,527,334 | ) | ||||||
| Total liabilities and stockholders' equity | 1,082,786,822 | 960,216,229 | ||||||||
The accompanying notes are an integral part of these financial statements.
ITAÚ UNIBANCO HOLDING S.A.
Consolidated Statement of Income (Note 2a)
(In thousands of Reais)
| Note | 01/01 to 09/30/2013 | 01/01 to 09/30/2012 | ||||||||
| Income from financial operations | 67,629,290 | 76,334,176 | ||||||||
| Loan, lease and other credit operations | 43,313,370 | 45,900,362 | ||||||||
| Securities and derivative financial instruments | 18,009,052 | 19,557,163 | ||||||||
| Financial income from insurance, pension plan and capitalization operations | 11c | 2,241,423 | 5,314,080 | |||||||
| Foreign exchange operations | 991,670 | 1,001,844 | ||||||||
| Compulsory deposits | 3,073,775 | 4,560,727 | ||||||||
| Expenses of financial operations | (34,242,170 | ) | (37,989,523 | ) | ||||||
| Money market | (29,829,253 | ) | (31,515,987 | ) | ||||||
| Financial expenses on technical provisions for insurance, pension plan and capitalization | 11c | (1,901,022 | ) | (4,803,337 | ) | |||||
| Borrowings and onlending | (2,511,895 | ) | (1,670,199 | ) | ||||||
| Income from financial operations before loan and losses | 33,387,120 | 38,344,653 | ||||||||
| Result of allowance for loan losses | 8d I | (10,739,752 | ) | (14,482,032 | ) | |||||
| Expenses for allowance for loan losses | (14,384,990 | ) | (17,959,140 | ) | ||||||
| Income from recovery of credits written off as loss | 3,645,238 | 3,477,108 | ||||||||
| Gross income from financial operations | 22,647,368 | 23,862,621 | ||||||||
| Other operating revenues (expenses) | (8,501,804 | ) | (10,278,068 | ) | ||||||
| Banking service fees | 13d | 12,228,791 | 10,767,367 | |||||||
| Asset management | 2,641,025 | 2,232,894 | ||||||||
| Current account services | 544,602 | 453,188 | ||||||||
| Credit cards | 5,535,078 | 4,748,607 | ||||||||
| Sureties and credits granted | 1,278,990 | 1,165,739 | ||||||||
| Receipt services | 1,060,583 | 1,051,608 | ||||||||
| Other | 1,168,513 | 1,115,331 | ||||||||
| Income from bank charges | 13e | 5,275,810 | 4,348,110 | |||||||
| Result from insurance, pension plan and capitalization operations | 11c | 2,649,825 | 2,121,522 | |||||||
| Personnel expenses | 13f | (11,236,674 | ) | (10,286,591 | ) | |||||
| Other administrative expenses | 13g | (10,749,334 | ) | (10,549,893 | ) | |||||
| Tax expenses | 4o and 14a II | (3,295,589 | ) | (3,317,217 | ) | |||||
| Equity in earnings of affiliates, jointly controlled entities and other investments | 15a lll | 264,694 | 189,878 | |||||||
| Other operating revenues | 13h | 240,989 | 193,633 | |||||||
| Other operating expenses | 13i | (3,880,316 | ) | (3,744,877 | ) | |||||
| Operating income | 14,145,564 | 13,584,553 | ||||||||
| Non-operating income | 23,828 | (285,951 | ) | |||||||
| Income before taxes on income and profit sharing | 14,169,392 | 13,298,602 | ||||||||
| Income tax and social contribution | 4o and 14a I | (2,842,971 | ) | (2,531,032 | ) | |||||
| Due on operations for the period | (6,648,155 | ) | (6,769,073 | ) | ||||||
| Related to temporary differences | 3,805,184 | 4,238,041 | ||||||||
| Profit sharing – Management Members - Statutory - Law No. 6,404 of 12/15/1976 | (181,748 | ) | (122,972 | ) | ||||||
| Minority interest in subsidiaries | 16e | (94,735 | ) | (542,453 | ) | |||||
| Net income | 11,049,937 | 10,102,145 | ||||||||
| Weighted average of the number of outstanding shares | 16a | 4,968,122,233 | 4,969,731,087 | |||||||
| Net income per share – R$ | 2.22 | 2.03 | ||||||||
| Book value per share - R$ (outstanding at 09/30) | 15.79 | 15.89 | ||||||||
| Supplementary information | ||||||||||
| Exclusion of nonrecurring effects | 2a and 22k | 105,587 | 438,832 | |||||||
| Net income without nonrecurring effects | 11,155,524 | 10,540,977 | ||||||||
| Net income per share – R$ | 2.25 | 2.12 | ||||||||
The accompanying notes are an integral part of these financial statements.
ITAÚ UNIBANCO HOLDING S.A.
Consolidated Statement of Cash Flows
(In thousands of Reais)
| NOTE | 01/01 to 09/30/2013 | 01/01 to 09/30/2012 | ||||||||
| Adjusted net income | 21,053,196 | 27,687,716 | ||||||||
| Net income | 11,049,937 | 10,102,145 | ||||||||
| Adjustments to net income: | 10,003,259 | 17,585,571 | ||||||||
| Granted options recognized | 165,422 | 151,500 | ||||||||
| Adjustment to market value of securities and derivative financial instruments (assets/liabilities) | 7h | 268,713 | (930,095 | ) | ||||||
| Effects of changes in exchange rates on cash and cash equivalents | (1,482,945 | ) | (1,246,762 | ) | ||||||
| Allowance for loan losses | 14,384,990 | 17,959,140 | ||||||||
| Interest and foreign exchange expense from operations with subordinated debt | 3,093,938 | 3,310,483 | ||||||||
| Interest expense from operations with debentures | 41,463 | 132,004 | ||||||||
| Financial expenses on technical provisions for pension plan and capitalization | 1,901,022 | 4,803,337 | ||||||||
| Depreciation and amortization | 15b | 1,731,928 | 1,645,983 | |||||||
| Adjustment to legal liabilities – tax and social security | (814,063 | ) | 634,853 | |||||||
| Adjustment to provision for contingent liabilities | 519,636 | 335,811 | ||||||||
| Deferred taxes | (3,805,184 | ) | (4,238,041 | ) | ||||||
| Equity in earnings of affiliates, jointly controlled entities and other investments | 15a lll | (264,694 | ) | (189,878 | ) | |||||
| Interest and foreign exchange income from available-for-sale securities | (5,684,236 | ) | (3,706,845 | ) | ||||||
| Interest and foreign exchange income from held-to-maturity securities | (336,502 | ) | (401,047 | ) | ||||||
| (Gain) loss from sale of available-for-sale financial assets | 7i | 262,747 | (879,625 | ) | ||||||
| (Gain) loss from sale of investments | (60,430 | ) | (235,252 | ) | ||||||
| (Gain) loss from sale of foreclosed assets | (10,141 | ) | (15,774 | ) | ||||||
| (Gain) loss from sale of fixed assets | (2,416 | ) | 6,641 | |||||||
| Minority interest | 94,735 | 542,453 | ||||||||
| Other | (725 | ) | (93,315 | ) | ||||||
| Change in assets and liabilities | 416,009 | 20,395,014 | ||||||||
| (Increase) decrease in assets | (35,431,267 | ) | (46,859,056 | ) | ||||||
| Interbank investments | (1,823,198 | ) | (28,416,038 | ) | ||||||
| Securities and derivative financial instruments (assets/liabilities) | (2,789,192 | ) | (25,386,620 | ) | ||||||
| Compulsory deposits with the Central Bank of Brazil | (3,300,048 | ) | (643,477 | ) | ||||||
| Interbank and interbranch accounts (assets/liabilities) | 2,043,628 | 35,116,322 | ||||||||
| Loan, lease and other credit operations | (34,272,449 | ) | (30,427,169 | ) | ||||||
| Other receivables and other assets | 2,716,401 | 743,097 | ||||||||
| Foreign exchange portfolio and negotiation and intermediation of securities (assets/liabilities) | 1,993,591 | 2,154,829 | ||||||||
| (Decrease) increase in liabilities | 35,847,276 | 67,254,070 | ||||||||
| Deposits | 9,087,417 | (10,717,067 | ) | |||||||
| Deposits received under securities repurchase agreements | 6,353,523 | 56,453,176 | ||||||||
| Funds for issuance of securities | (2,867,111 | ) | 3,909,068 | |||||||
| Borrowings and onlending | 14,175,873 | 251,718 | ||||||||
| Credit card operations (assets/liabilities) | (3,438,676 | ) | (1,256,209 | ) | ||||||
| Technical provision for insurance, pension plan and capitalization | 3,135,945 | 8,329,215 | ||||||||
| Collection and payment of taxes and contributions | 4,014,553 | 3,661,475 | ||||||||
| Other liabilities | 5,454,869 | 6,645,983 | ||||||||
| Deferred income | (69,117 | ) | (23,289 | ) | ||||||
| Payment of income tax and social contribution | (5,055,257 | ) | (5,611,052 | ) | ||||||
| Net cash provided by (used in) operating activities | 16,413,948 | 42,471,678 | ||||||||
| Interest on capital / dividends received from affiliated companies | 79,154 | 15,577 | ||||||||
| Funds received from sale of available-for-sale securities | 28,553,997 | 15,267,052 | ||||||||
| Funds received from redemption of held-to-maturity securities | 360,937 | 342,820 | ||||||||
| Disposal of assets not for own use | 88,295 | 71,676 | ||||||||
| Disposal of investments | 208,428 | 386,866 | ||||||||
| Sale of fixed assets | 41,863 | 214,731 | ||||||||
| Termination of intangible asset agreements | 63,137 | (643 | ) | |||||||
| Purchase of available-for-sale securities | (22,219,754 | ) | (26,975,859 | ) | ||||||
| Purchase of held-to-maturity securities | (531,438 | ) | (205 | ) | ||||||
| Purchase of investments | (80,038 | ) | (897,123 | ) | ||||||
| Purchase of fixed assets | 15b | (1,707,499 | ) | (1,258,799 | ) | |||||
| Purchase of intangible assets | 15b | (1,239,099 | ) | (1,228,698 | ) | |||||
| Net cash provided by (used in) invesment activities | 3,617,982 | (14,062,605 | ) | |||||||
| Increase in subordinated debt | - | 16,579,927 | ||||||||
| Decrease in subordinated debt | (3,072,536 | ) | (10,321,154 | ) | ||||||
| Increase in debentures | - | 1,500,000 | ||||||||
| Decrease in debentures | (1,610,296 | ) | (54,251 | ) | ||||||
| Change in minority interest | 16e | 362,893 | 348,314 | |||||||
| Acquisition of minority interest in Redecard S.A. | - | (10,807,152 | ) | |||||||
| Granting of stock options | 147,440 | 197,888 | ||||||||
| Purchase of treasury shares | (662,215 | ) | (99,045 | ) | ||||||
| Dividends and interest on capital paid to minority interests | (9,532 | ) | (682,058 | ) | ||||||
| Dividends and interest on capital paid | (5,145,831 | ) | (5,003,160 | ) | ||||||
| Net cash provided by (used in) financing activities | (9,990,077 | ) | (8,340,691 | ) | ||||||
| Net increase (decrease) in cash and cash equivalents | 10,041,853 | 20,068,382 | ||||||||
| Cash and cash equivalents at the beginning of the period | 40,935,830 | 37,616,895 | ||||||||
| Effects of changes in exchange rates on cash and cash equivalents | 1,482,945 | 1,246,762 | ||||||||
| Cash and cash equivalents at the end of the period | 4a and 5 | 52,460,628 | 58,932,039 | |||||||
The accompanying notes are an integral part of these financial statements.
ITAÚ UNIBANCO HOLDING S.A.
Consolidated Statement of Added Value
(In thousands of Reais)
| Note | 01/01 to 09/30/2013 | 01/01 to 09/30/2012 | ||||||||||||||||
| Income | 77,308,781 | 78,996,825 | ||||||||||||||||
| Financial operations | 67,629,290 | 76,334,176 | ||||||||||||||||
| Banking services | 17,504,601 | 15,115,477 | ||||||||||||||||
| Result from insurance, pension plan and capitalization operations | 2,649,825 | 2,121,522 | ||||||||||||||||
| Result of loan losses | 8d | (10,739,752 | ) | (14,482,032 | ) | |||||||||||||
| Other | 264,817 | (92,318 | ) | |||||||||||||||
| Expenses | (38,122,486 | ) | (41,734,400 | ) | ||||||||||||||
| Financial operations | (34,242,170 | ) | (37,989,523 | ) | ||||||||||||||
| Other | (3,880,316 | ) | (3,744,877 | ) | ||||||||||||||
| Inputs purchased from third parties | (8,570,618 | ) | (8,614,088 | ) | ||||||||||||||
| Materials, energy and others | 13g | (262,531 | ) | (298,436 | ) | |||||||||||||
| Third-party services | 13g | (2,427,884 | ) | (2,423,464 | ) | |||||||||||||
| Other | (5,880,203 | ) | (5,892,188 | ) | ||||||||||||||
| Data processing and telecommunications | 13g | (2,661,544 | ) | (2,625,572 | ) | |||||||||||||
| Advertising, promotions and publication | 13g | (729,413 | ) | (674,094 | ) | |||||||||||||
| Installations | (883,292 | ) | (955,478 | ) | ||||||||||||||
| Transportation | 13g | (339,510 | ) | (376,322 | ) | |||||||||||||
| Security | 13g | (408,427 | ) | (384,744 | ) | |||||||||||||
| Travel expenses | 13g | (139,939 | ) | (139,182 | ) | |||||||||||||
| Other | (718,078 | ) | (736,796 | ) | ||||||||||||||
| Gross added value | 30,615,677 | 28,648,337 | ||||||||||||||||
| Depreciation and amortization | 13g | (1,388,241 | ) | (1,217,863 | ) | |||||||||||||
| Net added value produced by the company | 29,227,436 | 27,430,474 | ||||||||||||||||
| Added value received from transfer | 15a lll | 264,694 | 189,878 | |||||||||||||||
| Total added value to be distributed | 29,492,130 | 27,620,352 | ||||||||||||||||
| Distribution of added value | 29,492,130 | 27,620,352 | ||||||||||||||||
| Personnel | 10,198,758 | 34.6 | % | 9,206,415 | 33.3 | % | ||||||||||||
| Compensation | 8,138,992 | 27.6 | % | 7,544,363 | 27.3 | % | ||||||||||||
| Benefits | 1,575,454 | 5.3 | % | 1,126,465 | 4.1 | % | ||||||||||||
| FGTS – government severance pay fund | 484,312 | 1.6 | % | 535,587 | 1.9 | % | ||||||||||||
| Taxes, fees and contributions | 7,358,224 | 24.9 | % | 7,051,397 | 25.5 | % | ||||||||||||
| Federal | 6,695,043 | 22.7 | % | 6,499,197 | 23.5 | % | ||||||||||||
| State | 9,997 | 0.0 | % | 18,290 | 0.1 | % | ||||||||||||
| Municipal | 653,184 | 2.2 | % | 533,910 | 1.9 | % | ||||||||||||
| Return on third parties’ assets - Rent | 790,475 | 2.7 | % | 717,942 | 2.6 | % | ||||||||||||
| Return on own assets | 11,144,672 | 37.8 | % | 10,644,598 | 38.5 | % | ||||||||||||
| Dividends and interest on capital | 2,137,760 | 7.2 | % | 2,201,800 | 8.0 | % | ||||||||||||
| Retained earnings (loss) for the period | 8,912,177 | 30.2 | % | 7,900,345 | 28.6 | % | ||||||||||||
| Minority interest in retained earnings | 94,735 | 0.3 | % | 542,453 | 2.0 | % | ||||||||||||
The accompanying notes are an integral part of these financial statements.
ITAÚ UNIBANCO HOLDING S.A.
Balance Sheet
(In thousands of Reais)
| Assets | Note | 09/30/2013 | 09/30/2012 | |||||||
| Current assets | 12,215,047 | 25,146,990 | ||||||||
| Cash and cash equivalents | 45,720 | 15,773 | ||||||||
| Interbank investments | 4b and 6 | 184,405 | 24,007,541 | |||||||
| Money market | 68,892 | 134,362 | ||||||||
| Interbank deposits | 115,513 | 23,873,179 | ||||||||
| Securities and derivative financial instruments | 4c, 4d and 7 | 11,358,780 | 23,455 | |||||||
| Own portfolio | 11,358,780 | 23,455 | ||||||||
| Other receivables | 621,165 | 1,096,828 | ||||||||
| Income receivable | 15a I | - | 24,736 | |||||||
| Sundry | 13a | 621,165 | 1,072,092 | |||||||
| Other assets – prepaid expenses | 4g | 4,977 | 3,393 | |||||||
| Long-term receivables | 39,086,112 | 21,226,554 | ||||||||
| Interbank invesments – interbank deposits | 4b and 6 | 38,338,051 | 14,571,634 | |||||||
| SECURITIES AND DERIVATIVE FINANCIAL INSTRUMENTS | 4c, 4d and 7 | - | 6,462,126 | |||||||
| Own portfolio | - | 6,462,126 | ||||||||
| Other receivables - sundry | 13a | 748,061 | 192,794 | |||||||
| Permanent assets | 56,004,913 | 57,202,675 | ||||||||
| Investments | 56,004,791 | 57,202,478 | ||||||||
| Investments in subsidiaries | 4h and 15a I | 56,004,791 | 57,202,478 | |||||||
| Real estate in use | 4i | 122 | 197 | |||||||
| Total assets | 107,306,072 | 103,576,219 | ||||||||
| Liabilities | ||||||||||
| Current liabilities | 840,582 | 5,974,293 | ||||||||
| Deposits - interbank deposits | 4b and 10b | 104,110 | 5,154,518 | |||||||
| Funds from acceptance and issuance of securities | 4b and 10d | 18,667 | 18,667 | |||||||
| Other liabilities | 717,805 | 801,108 | ||||||||
| Social and statutory | 16b II | 286,569 | 518,960 | |||||||
| Tax and social security contributions | 4n, 4o and 14c | 151,120 | 85,773 | |||||||
| Subordinated debt | 10f | 247,740 | 150,988 | |||||||
| Sundry | 32,376 | 45,387 | ||||||||
| Long-term liabilities | 19,130,706 | 13,441,549 | ||||||||
| Funds from acceptance and issuance of securities | 4b and 10d | 500,000 | 500,000 | |||||||
| Other liabilities | 18,630,706 | 12,941,549 | ||||||||
| Tax and social security contributions | 4n, 4o and 14c | 1,297,293 | 945,131 | |||||||
| Subordinated debt | 10f | 17,315,721 | 11,979,856 | |||||||
| Sundry | 17,692 | 16,562 | ||||||||
| Stockholders' equity | 16 | 87,334,784 | 84,160,377 | |||||||
| Capital | 60,000,000 | 45,000,000 | ||||||||
| Capital reserves | 854,358 | 812,352 | ||||||||
| Revenue reserves | 29,213,757 | 38,685,639 | ||||||||
| Asset valuation adjustment | 4c, 4d and 7d | (815,451 | ) | 1,189,720 | ||||||
| (Treasury shares) | (1,917,880 | ) | (1,527,334 | ) | ||||||
| Total liabilities and stockholders' equity | 107,306,072 | 103,576,219 | ||||||||
The accompanying notes are an integral part of these financial statements.
ITAÚ UNIBANCO HOLDING S.A.
Statement of Income
(In thousands of Reais)
| Note | 01/01 to 09/30/2013 | 01/01 to 09/30/2012 | ||||||||
| Income from financial operations | 2,524,558 | 2,350,694 | ||||||||
| Securities and derivative financial instruments | 2,524,558 | 2,350,694 | ||||||||
| Expenses of financial operations | (750,676 | ) | (747,201 | ) | ||||||
| Money market | (750,676 | ) | (747,201 | ) | ||||||
| Gross income from financial operations | 1,773,882 | 1,603,493 | ||||||||
| Other operating revenues (expenses) | 5,719,218 | 5,836,411 | ||||||||
| Personnel expenses | (175,727 | ) | (153,606 | ) | ||||||
| Other administrative expenses | (26,703 | ) | (30,420 | ) | ||||||
| Tax expenses | 14a II | (171,431 | ) | (162,726 | ) | |||||
| Equity in earnings of subsidiaries | 15a I | 6,133,477 | 6,233,593 | |||||||
| Other operating revenues (expenses) | (40,398 | ) | (50,430 | ) | ||||||
| Operating income | 7,493,100 | 7,439,904 | ||||||||
| Non-operating income | 18,857 | 18,383 | ||||||||
| Income before taxes on income and profit sharing | 7,511,957 | 7,458,287 | ||||||||
| Income tax and social contribution | 4p | 551,962 | 791,970 | |||||||
| Due on operations for the period | (62,566 | ) | 52,052 | |||||||
| Related to temporary differences | 614,528 | 739,918 | ||||||||
| Profit sharing – Management Members - Statutory - Law No. 6,404 of 12/15/1976 | (10,679 | ) | (2,065 | ) | ||||||
| Net income | 8,053,240 | 8,248,192 | ||||||||
| Weighted average of the number of outstanding shares | 16a | 4,968,122,233 | 4,969,731,087 | |||||||
| Net income per share – R$ | 1.62 | 1.66 | ||||||||
| Book value per share - R$ (outstanding at 09/30) | 17.62 | 16.93 | ||||||||
| Supplementary information | ||||||||||
| Exclusion of nonrecurring effects | 2a and 22k | 105,587 | 438,832 | |||||||
| Net income without nonrecurring effects | 8,158,827 | 8,687,024 | ||||||||
| Net income per share – R$ | 1.64 | 1.75 | ||||||||
The accompanying notes are an integral part of these financial statements.
ITAÚ UNIBANCO HOLDING S.A.
Statement of Changes in Stockholders’ Equity (Note 16)
(In thousands of Reais)
| Capital | Capital reserves | Revenue reserves | Asset valuation adjustment (Note 7d) | Retained earnings | (Treasury shares) | Total | ||||||||||||||||||||||
| Balance at 01/01/2012 | 45,000,000 | 763,413 | 34,422,444 | (139,142 | ) | - | (1,663,562 | ) | 78,383,153 | |||||||||||||||||||
| Purchase of treasury shares | - | - | - | - | - | (99,045 | ) | (99,045 | ) | |||||||||||||||||||
| Granting of stock options | - | (102,561 | ) | 65,176 | - | - | 235,273 | 197,888 | ||||||||||||||||||||
| Granting of options recognized | - | 151,500 | - | - | - | - | 151,500 | |||||||||||||||||||||
| Addition to interest on capital paid on 03/13/2012 - year 2011 | - | - | (1,450 | ) | - | - | - | (1,450 | ) | |||||||||||||||||||
| Payment of interest on capital on 03/13/2012 – declared after 12/31/2011 | - | - | (1,846,923 | ) | - | - | - | (1,846,923 | ) | |||||||||||||||||||
| Asset valuation adjustment: | ||||||||||||||||||||||||||||
| Change in adjustment to market value | - | - | - | 1,328,862 | - | - | 1,328,862 | |||||||||||||||||||||
| Net income | - | - | - | - | 8,248,192 | - | 8,248,192 | |||||||||||||||||||||
| Appropriations: | ||||||||||||||||||||||||||||
| Legal reserve | - | - | 412,410 | - | (412,410 | ) | - | - | ||||||||||||||||||||
| Statutory reserves | - | - | 5,633,982 | - | (5,633,982 | ) | - | - | ||||||||||||||||||||
| Dividends and interest on capital | - | - | - | - | (2,201,800 | ) | - | (2,201,800 | ) | |||||||||||||||||||
| Balance at 09/30/2012 | 45,000,000 | 812,352 | 38,685,639 | 1,189,720 | - | (1,527,334 | ) | 84,160,377 | ||||||||||||||||||||
| Changes in the period | - | 48,939 | 4,263,195 | 1,328,862 | - | 136,228 | 5,777,224 | |||||||||||||||||||||
| Balance at 01/01/2013 | 45,000,000 | 843,694 | 39,993,495 | 1,506,889 | - | (1,523,500 | ) | 85,820,578 | ||||||||||||||||||||
| Reserve Capitalization - ESM 04/19/2013 | 15,000,000 | - | (15,000,000 | ) | - | - | - | - | ||||||||||||||||||||
| Purchase of treasury shares | - | - | - | - | - | (662,215 | ) | (662,215 | ) | |||||||||||||||||||
| Granting of stock options | - | (154,758 | ) | 34,363 | - | - | 267,835 | 147,440 | ||||||||||||||||||||
| Granting of options recognized | - | 165,422 | - | - | - | - | 165,422 | |||||||||||||||||||||
| Addition to interest on capital paid on 03/14/2013 - year 2012 | - | - | (1,977 | ) | - | - | - | (1,977 | ) | |||||||||||||||||||
| Payment of interest on capital on 03/14/2013 – declared after 12/31/2012 - R$ 0,3824 per share | - | - | (1,727,604 | ) | - | - | - | (1,727,604 | ) | |||||||||||||||||||
| Asset valuation adjustment: | ||||||||||||||||||||||||||||
| Change in adjustment to market value | - | - | - | (2,336,840 | ) | - | - | (2,336,840 | ) | |||||||||||||||||||
| Actuarial gain/loss in liabilities of post-employment benefits | - | - | - | 14,500 | - | - | 14,500 | |||||||||||||||||||||
| Net income | - | - | - | - | 8,053,240 | - | 8,053,240 | |||||||||||||||||||||
| Appropriations: | ||||||||||||||||||||||||||||
| Legal reserve | - | - | 402,662 | - | (402,662 | ) | - | - | ||||||||||||||||||||
| Statutory reserves | - | - | 5,512,818 | - | (5,512,818 | ) | - | - | ||||||||||||||||||||
| Dividends and interest on capital | - | - | - | - | (2,137,760 | ) | - | (2,137,760 | ) | |||||||||||||||||||
| Balance at 09/30/2013 | 60,000,000 | 854,358 | 29,213,757 | (815,451 | ) | - | (1,917,880 | ) | 87,334,784 | |||||||||||||||||||
| Changes in the period | 15,000,000 | 10,664 | (10,779,738 | ) | (2,322,340 | ) | - | (394,380 | ) | 1,514,206 | ||||||||||||||||||
The accompanying notes are an integral part of these financial statements.
ITAÚ UNIBANCO HOLDING S.A.
Statement of Cash Flows
(In thousands of Reais)
| Note | 01/01 to 09/30/2013 | 01/01 to 09/30/2012 | ||||||||
| Adjusted net income | 3,750,454 | 2,293,992 | ||||||||
| Net income | 8,053,240 | 8,248,192 | ||||||||
| Adjustments to net income: | (4,302,786 | ) | (5,954,200 | ) | ||||||
| Granting of options recognized | 165,422 | 151,500 | ||||||||
| Interest and foreign exchange expense from operations with subordinated debt | 2,243,647 | 826,593 | ||||||||
| Deferred taxes | (614,528 | ) | (739,918 | ) | ||||||
| Equity in earnings of subsidiaries | 15a I | (6,133,477 | ) | (6,233,593 | ) | |||||
| Amortization of goodwill | 43,308 | 43,308 | ||||||||
| Effects of changes in exchange rates on cash and cash equivalents | (7,225 | ) | (2,147 | ) | ||||||
| Other | 67 | 57 | ||||||||
| Change in assets and liabilities | 612,480 | 567,551 | ||||||||
| (Increase) decrease in other receivables and other assets | 44,898 | 137,208 | ||||||||
| (Decrease) increase in other liabilities | 567,582 | 430,343 | ||||||||
| Net cash provided by (used in) operating activities | 4,362,934 | 2,861,543 | ||||||||
| Interest on capital / dividends received | 8,166,995 | 8,762,626 | ||||||||
| (Increase) decrease in interbank investments | (5,049,564 | ) | (6,802,463 | ) | ||||||
| (Increase) decrease in securities and derivative financial instruments (assets / liabilities) | (944,075 | ) | (6,471,950 | ) | ||||||
| (Purchase) sale of investments | (259,985 | ) | (201,451 | ) | ||||||
| (Purchase) sale of fixed assets | 10 | (11 | ) | |||||||
| Net cash provided by (used in) investment activities | 1,913,381 | (4,713,249 | ) | |||||||
| Increase (decrease) in deposits | 104,110 | 322,074 | ||||||||
| Increase in subordinated debt | - | 6,447,155 | ||||||||
| Decrease in subordinated debt | (767,071 | ) | (340,352 | ) | ||||||
| (Increase) decrease in funds for issuance of securities | 13,125 | 13,125 | ||||||||
| Granting of stock options | 147,440 | 197,888 | ||||||||
| Purchase of treasury shares | (662,215 | ) | (99,045 | ) | ||||||
| Dividends and interest on capital paid | (5,145,831 | ) | (5,003,160 | ) | ||||||
| Net cash provided by (used in) financing activities | (6,310,442 | ) | 1,537,685 | |||||||
| Net increase (decrease) in cash and cash equivalents | (34,127 | ) | (314,021 | ) | ||||||
| Cash and cash equivalents at the beginning of the period | 141,514 | 462,009 | ||||||||
| Effects of changes in exchange rates on cash and cash equivalents | 7,225 | 2,147 | ||||||||
| Cash and cash equivalents at the end of the period | 4a and 5 | 114,612 | 150,135 | |||||||
The accompanying notes are an integral part of these financial statements.
ITAÚ UNIBANCO HOLDING S.A.
Statement of Added Value
(In thousands of Reais)
| Note | 01/01 to 09/30/2013 | 01/01 to 09/30/2012 | ||||||||
| Income | 3,116,406 | 3,111,025 | ||||||||
| Financial operations | 2,524,558 | 2,350,694 | ||||||||
| Other | 591,848 | 760,331 | ||||||||
| Expenses | (750,676 | ) | (747,201 | ) | ||||||
| Financial operations | (750,676 | ) | (747,201 | ) | ||||||
| Inputs purchased from third parties | (26,344 | ) | (30,083 | ) | ||||||
| Third-party services | (11,407 | ) | (12,924 | ) | ||||||
| Advertising, promotions and publication | (1,248 | ) | (1,726 | ) | ||||||
| Expenses for financial system services | (3,196 | ) | (3,175 | ) | ||||||
| Insurance | (2,639 | ) | (3,314 | ) | ||||||
| Other | (7,854 | ) | (8,944 | ) | ||||||
| Gross added value | 2,339,386 | 2,333,741 | ||||||||
| Deprecitation and amortization | (67 | ) | (57 | ) | ||||||
| Net added value produced by the company | 2,339,319 | 2,333,684 | ||||||||
| Added value received from transfer | 15a I | 6,133,477 | 6,233,593 | |||||||
| Total added value to be distributed | 8,472,796 | 8,567,277 | ||||||||
| Distribution of added value | 8,472,796 | 8,567,277 | ||||||||
| Personnel | 183,759 | 152,617 | ||||||||
| Compensation | 182,279 | 150,643 | ||||||||
| Benefits | 1,136 | 1,549 | ||||||||
| FGTS – government severance pay fund | 344 | 425 | ||||||||
| Taxes, fees and contributions | 235,506 | 166,188 | ||||||||
| Federal | 235,468 | 166,172 | ||||||||
| Municipal | 38 | 16 | ||||||||
| Return on third parties’ assets - rent | 291 | 280 | ||||||||
| Return on own assets | 8,053,240 | 8,248,192 | ||||||||
| Dividends and interest on capital | 2,137,760 | 2,201,800 | ||||||||
| Retained earnings (loss) for the period | 5,915,480 | 6,046,392 | ||||||||
The accompanying notes are an integral part of these financial statements.
ITAÚ UNIBANCO HOLDING S.A.
Notes to the Financial Statements
From January 1 to September 30, 2013 and 2012
(In thousands of Reais)
Note 1 - Operations
Itaú Unibanco Holding S.A.(ITAÚ UNIBANCO HOLDING) is a publicly-held company which, together with its subsidiaries and affiliated companies, operates in Brazil and abroad, with all types of banking activities, through itscommercial, investment, real estate loan, finance and investment credit, and lease portfolios, including foreign exchange operations, and other complementary activities, with emphasis on Insurance, Private Pension Plans, Capitalization, Securities Brokerage and Administration of Credit Cards, Consortia, Investment Funds and Managed Portfolios.
Note 2 – Presentation of the financial statements
| a) | Presentation of the financial statements |
The financial statements of ITAÚ UNIBANCO HOLDING and of its subsidiaries (ITAÚ UNIBANCO HOLDING CONSOLIDATED) have been prepared in accordance with accounting principles established by the Brazilian Corporate Law, including the amendments introduced by Laws No. 11,638, of December 28, 2007, and No. 11,941, of May 27, 2009, in conformity, when applicable, with instructions issued by the Central Bank of Brazil (BACEN), the National Monetary Council (CMN), the Brazilian Securities and Exchange Commission (CVM), the Superintendence of Private Insurance (SUSEP), and the National Council of Private Insurance (CNSP), which include the use of estimates necessary to calculate accounting provisions and valuation of financial assets.
In order to enable the analysis of the net income, the heading “Net income without nonrecurring effects” is presented below the Consolidated Statement of Income, and this effect is highlighted in a heading called “Exclusion of nonrecurring effects” (Note 22k).
As set forth in the sole paragraph of article 7 of BACEN Circular No. 3,068, of November 8, 2001, securities classified as trading securities (Note 4c) are presented in the Balance Sheet under Current Assets regardless of their maturity dates.
Lease Operations are presented, at present value, in the Balance Sheet, and the related income and expenses, which represent the financial result of these operations, are presented, grouped together, under loan, lease and other loan operations in the Statement of Income. Advances on exchange contracts are reclassified from Other Liabilities – Foreign exchange portfolio to Loan Operations. The foreign exchange result is presented on an adjusted basis, with the reclassification of expenses and income, in order to represent exclusively the impact of variations and differences of rates on the balance sheet accounts denominated in foreign currencies.
| b) | Consolidation |
As set forth in paragraph 1, article 2, of BACEN Circular Letter No. 2,804, of February 11, 1998, the financial statements of ITAÚ UNIBANCO HOLDING comprise the consolidation of its foreign branches and subsidiaries.
Intercompany transactions and balances and results have been eliminated on consolidation. The investment funds in which ITAÚ UNIBANCO HOLDING’s companies are the main beneficiaries or holders of principal obligations are consolidated. The investments in these fund portfolios are classified by type of transaction and were distributed by type of security, in the same categories in which these securities had been originally allocated. The effects of the foreign exchange variation on investments abroad are classified in the heading Securities and Derivative Financial Instruments in the Statement of Income.
The difference of Net Income and Stockholders’ Equity between ITAÚ UNIBANCO HOLDING and ITAÚ UNIBANCO HOLDING CONSOLIDATED (Note 16d) results from the adoption of different criteria for the amortization of goodwill originated on purchase of investments and in the record of transactions with minority stockholders where there is no change of control (Note 4q), net of the respective deferred tax assets.
In ITAÚ UNIBANCO HOLDING, the goodwill recorded in subsidiaries, mainly originated from the ITAÚ UNIBANCO merger, is being amortized based on the expected future profitability and appraisal reports or upon realization of the investment, according to the rules and guidance of CMN and BACEN.
In ITAÚ UNIBANCO HOLDING CONSOLIDATED, from January 1, 2010, the goodwill originated from the purchase of investments is no longer fully amortized in the consolidated financial statements (Note 4j). By 12/31/2009, goodwill generated had been fully amortized in the periods investments were made.
The consolidated financial statements comprise ITAÚ UNIBANCO HOLDING and its direct and indirect subsidiaries, among which we highlight:
| Interest in voting capital at | Interest in total capital at | |||||||||||||||||||||
| Incorporation country | Activity | 09/30/2013 | 09/30/2012 | 09/30/2013 | 09/30/2012 | |||||||||||||||||
| Banco Dibens S.A. | Brazil | Financial institution | 100.00 | % | 100.00 | % | 100.00 | % | 100.00 | % | ||||||||||||
| Banco Itaú Veículos S.A. | (1) | Brazil | Financial institution | 100.00 | % | 100.00 | % | 100.00 | % | 99.99 | % | |||||||||||
| Banco Investcred Unibanco S.A. | (2) | Brazil | Financial institution | 50.00 | % | 50.00 | % | 50.00 | % | 50.00 | % | |||||||||||
| Banco Itaú Argentina S.A. | Argentina | Financial institution | 100.00 | % | 100.00 | % | 100.00 | % | 99.99 | % | ||||||||||||
| Banco Itaú BBA International S.A. | (3) | Portugal | Financial institution | 0.00 | % | 99.99 | % | 0.00 | % | 99.99 | % | |||||||||||
| Banco Itaú BBA S.A. | Brazil | Financial institution | 99.99 | % | 99.99 | % | 99.99 | % | 99.99 | % | ||||||||||||
| Banco Itaú Chile | Chile | Financial institution | 99.99 | % | 99.99 | % | 99.99 | % | 99.99 | % | ||||||||||||
| Banco Itaú BMG Consignado S.A | (4) (Note 2c) | Brazil | Financial institution | 70.00 | % | 100.00 | % | 70.00 | % | 100.00 | % | |||||||||||
| Banco Itaú Europa Luxembourg S.A. | Luxembourg | Financial institution | 99.99 | % | 99.99 | % | 99.99 | % | 99.99 | % | ||||||||||||
| Banco Itaú Paraguay S.A. | Paraguay | Financial institution | 99.99 | % | 99.99 | % | 99.99 | % | 99.99 | % | ||||||||||||
| Banco Itaú Suisse S.A. | Switzerland | Financial institution | 100.00 | % | 99.99 | % | 100.00 | % | 99.99 | % | ||||||||||||
| Banco Itaú Uruguay S.A. | Uruguay | Financial institution | 100.00 | % | 100.00 | % | 100.00 | % | 100.00 | % | ||||||||||||
| Banco Itaucard S.A. | Brazil | Financial institution | 100.00 | % | 100.00 | % | 100.00 | % | 100.00 | % | ||||||||||||
| Banco Itaucred Financiamentos S.A. | (5) | Brazil | Financial institution | 0.00 | % | 100.00 | % | 0.00 | % | 100.00 | % | |||||||||||
| Banco Itauleasing S.A. | Brazil | Financial institution | 100.00 | % | 100.00 | % | 100.00 | % | 100.00 | % | ||||||||||||
| BIU Participações S.A. | (6) | Brazil | Holding company | 0.00 | % | 66.15 | % | 0.00 | % | 66.15 | % | |||||||||||
| Cia. Itaú de Capitalização | Brazil | Capitalization | 100.00 | % | 99.99 | % | 100.00 | % | 99.99 | % | ||||||||||||
| Dibens Leasing S.A. - Arrendamento Mercantil | Brazil | Leasing | 100.00 | % | 100.00 | % | 100.00 | % | 100.00 | % | ||||||||||||
| Itaú Unibanco Veículos Administradora de Consórcios Ltda. | (7) | Brazil | Consortia administrator | 100.00 | % | 99.99 | % | 100.00 | % | 99.99 | % | |||||||||||
| Financeira Itaú CBD S.A. Crédito, Financiamento e Investimento | (2) | Brazil | Consumer Finance Credit | 50.00 | % | 50.00 | % | 50.00 | % | 50.00 | % | |||||||||||
| Hipercard Banco Múltiplo S.A. | Brazil | Financial institution | 100.00 | % | 100.00 | % | 100.00 | % | 100.00 | % | ||||||||||||
| Itaú Administradora de Consórcios Ltda. | Brazil | Consortia administrator | 100.00 | % | 99.99 | % | 100.00 | % | 99.99 | % | ||||||||||||
| Itaú Ásia Securities Ltd | Hong Kong | Broker | 100.00 | % | 100.00 | % | 100.00 | % | 100.00 | % | ||||||||||||
| Itau Bank, Ltd. | (8) | Cayman Islands | Financial institution | 100.00 | % | 100.00 | % | 100.00 | % | 100.00 | % | |||||||||||
| Itau BBA Colombia S.A. Corporación Financiera | Colombia | Financial institution | 99.99 | % | 99.99 | % | 99.99 | % | 99.99 | % | ||||||||||||
| Itaú BBA International PLC | United Kingdom | Financial institution | 99.99 | % | 99.99 | % | 99.99 | % | 99.99 | % | ||||||||||||
| Itaú BBA USA Securities Inc. | United States | Broker | 100.00 | % | 100.00 | % | 100.00 | % | 100.00 | % | ||||||||||||
| Itaú Companhia Securitizadora de Créditos Financeiros | Brazil | Securitization | 100.00 | % | 99.99 | % | 99.98 | % | 99.98 | % | ||||||||||||
| Itaú Corretora de Valores S.A. | Brazil | Broker | 100.00 | % | 100.00 | % | 100.00 | % | 100.00 | % | ||||||||||||
| Itaú Distribuidora de Títulos e Valores Mobiliários S.A. | Brazil | Dealer | 100.00 | % | 100.00 | % | 99.99 | % | 99.99 | % | ||||||||||||
| Itaú Japan Asset Management Limited | Japan | Asset Management | 100.00 | % | 100.00 | % | 100.00 | % | 100.00 | % | ||||||||||||
| Itaú Middle East Limited | Arabe Emirates | Advisory | 100.00 | % | 100.00 | % | 100.00 | % | 100.00 | % | ||||||||||||
| Itaú Seguros S.A. | Brazil | Insurance | 100.00 | % | 100.00 | % | 100.00 | % | 100.00 | % | ||||||||||||
| Itaú Unibanco Financeira S.A. - Crédito, Financiamento e Investimento | (9) (Note 2c) | Brazil | Consumer Finance Credit | 100.00 | % | 50.00 | % | 100.00 | % | 50.00 | % | |||||||||||
| Itaú Unibanco S.A. | Brazil | Financial institution | 100.00 | % | 100.00 | % | 100.00 | % | 100.00 | % | ||||||||||||
| Itaú Unibanco Serviços e Processamento de Informações Comerciais Ltda. | Brazil | Technology services | 100.00 | % | 100.00 | % | 100.00 | % | 100.00 | % | ||||||||||||
| Itaú Vida e Previdência S.A. | Brazil | Pension Plan | 100.00 | % | 100.00 | % | 100.00 | % | 100.00 | % | ||||||||||||
| Luizacred S.A. Soc. Cred. Financiamento Investimento | (2) | Brazil | Consumer Finance Credit | 50.00 | % | 50.00 | % | 50.00 | % | 50.00 | % | |||||||||||
| Redecard S.A. | Brazil | Acquirer | 100.00 | % | 94.45 | % | 100.00 | % | 94.45 | % | ||||||||||||
| Tarjetas Unisoluciones S. A. de Capital Variable | Mexico | Credit Card administrator | 100.00 | % | 100.00 | % | 100.00 | % | 100.00 | % | ||||||||||||
| Unibanco Participações Societárias S.A. | (10) | Brazil | Holding company | 0.00 | % | 99.95 | % | 0.00 | % | 99.99 | % | |||||||||||
(1) New company name of Banco Fiat S.A.
(2) Joint ventures previously proportionately consolidated, became fully consolidated as of 01/01/2013.
(3) Company merged in 02/01/2013 by Itaú BBA International Limited.
(4) New company name of Banco Banerj S.A..
(5) Company merged in 07/31/2013 by Itaú Unibanco S.A.
(6) Company merged on 11/30/2012 proportinately by its shareholders Itaú Unibanco S.A. and Dibens Leasing S.A. - Arrendamento Mercantil.
(7)New company name of Fiat Administradora de Consórcios Ltda.
(8) Does not include Redeemable Preferred Shares (Note 10f).
(9) New company name of FAI - Financeira Americana Itaú S.A. - Crédito, Financiamento e Investimento.
(10) Company merged in 10/31/2012 by Unibanco Negócios Imobiliários Ltda. controlled by Dibens Leasing S.A. - Arrendamento Mercantil.
| c) | Business development |
BSF Holding S.A. (“Banco Carrefour”)
On April 23, 2012 the Central Bank of Brazil approved the Agreement for Purchase and Sale of Sharer entered into on April 14, 2011 by ITAÚ UNIBANCO HOLDING and Carrefour Comércio e Indústria Ltda (“Carrefour Brasil”) in order to acquire 49% of BSF Holding S.A. (“Banco Carrefour”), for the amount of R$ 816,255 million, giving rise to a goodwill of R$ 580,301, through the transfer of shares on May 31, 2012.
FAI - Financeira Americanas Itaú S.A. Crédito, Financiamento e Investimento (“FAI”)
On August 9, 2012, ITAÚ UNIBANCO HOLDING S.A. informed that it would terminate its partnership with Lojas Americanas S.A. (“LASA”), entered into in 2005, for the offering, distribution and sale, on an exclusive basis by FAI (entity jointly controlled by ITAÚ UNIBANCO HOLDING S.A. and LASA), of financial, insurance and pension plan products and services to customers of LASA and its affiliated companies.
As a consequence of said termination, ITAÚ UNIBANCO HOLDING S.A. and LASA entered into, on this date, a purchase agreement and other covenants under which LASA has agreed (i) to sell to ITAÚ UNIBANCO HOLDING S.A. the total interest it held in the capital of FAI for the amount of R$ 95 million; and (ii) to acquire the operating rights held by FAI with respect to the offering, distribution and sale, on an exclusive basis, of financial products and services through the distribution channels of LASA and/or its affiliates, at the approximate amount of R$ 112 million. The completion of the transaction was subject to approval of the Central Bank of Brazil, which was obtained on December 27, 2012.
As a result of this transaction, FAI is no longer an entity controlled jointly by ITAÚ UNIBANCO HOLDING S.A. and LASA, becoming a whole-owned subsidiary of ITAÚ UNIBANCO HOLDING S.A.. At December 31, 2012 the balance of FAI’s balance sheet accounts were fully consolidated; the net income for 2012, however, was partially consolidated.
Redecard
On September 24, 2012, ITAÚ UNIBANCO HOLDING S.A. completed the auction of the Tender Public Offer (OPA) to cancel Redecard’s listed company register, pursuant to the OPA call notice published on August 23, 2012.
As a result of the auction and acquisition private, ITAÚ UNIBANCO HOLDING S.A. purchased, up to September 30, 2012, through its subsidiary Banestado Participações, Administração e Serviços Ltda., 298,989,237 common shares issued by Redecard, representing 44.4% of its capital, and as of now it holds 635,474,593 common shares, representing 94.4% of its capital. The shares were purchased for the unit price of R$ 35.00, totaling R$ 10,469,234 (including charges and brokerage).
With the purpose of completing the purchase of the remaining minority interest, ITAÚ UNIBANCO HOLDING acquired, by way of its subsidiary Banestado Participações, Administração e Serviços Ltda., 36,423,856 common shares (24,207,582 in October 2012; 9,893,659 in November 2012; and 2,322,615 in December 2012) for the amount, offered at the OPA of September 24, 2012, of R$ 35.00, plus SELIC variation for the period, redeemed 999,884 common shares and canceled 72,372 treasury shares, thus increasing its interest in the capital, from 94.4% to 100.0%, totaling the amount of R$ 1,282,959 (including fees and brokerage).
On October 18, 2012, the Securities and Exchange Commission (CVM) cancelled Redecard’s register as a publicly-held company.
Changes in ownership interest in a subsidiary, which do not result in loss of control, are accounted for as capital transactions and any difference between the amount paid and the amount corresponding to minority stockholders should be recognized directly in consolidated stockholders' equity - caption Revenue Reserve.
Association agreement with Banco BMG S.A.
On July 9, 2012 ITAÚ UNIBANCO HOLDING entered into an Association Agreement with Banco BMG S.A. ("BMG"), aiming at the offering, distribution and commercialization of payroll debit loans through the incorporation of a financial institution, the Banco Itaú BMG Consignado S.A. (“Itaú BMG Consignado”). After obtaining the previous approval required for starting operations, issued by the Administrative Council for Economic Defense (CADE) on October 17, 2012, the final documents were signed on December 13, 2012 and Banco BMG has been a stockholder of Itaú BMG Consignado since January 7, 2013. The completion of the operation was subject to the approval of the Central Bank of Brazil, which was obtained on April 18, 2013.
Credicard
On May 14, 2013, Itaú Unibanco Holding, signed with Banco Citibank, a Share and Quotas Purchase Agreement for the acquisition of Banco Citicard S.A. and Citifinancial Promotora de Negócios e Cobranças Ltda., for the amount of R$ 2,767 million, including “Credicard” brand.
Banco Credicard and Citifinancial are those entities responsible for the supply and distribution of financial products and services under “Credicard” brand, principally personal loans and credit cards. The operation has a credit portfolio (gross amount) worth R$ 7.3 billion (as of the baseline date of December 31, 2012) and with a credit card base of 4.8 million.
The conclusion of this operation and the effective payment shall be contingent on the approval of the appropriate regulators and will not result in significant impacts on consolidated financial statements.
Cencosud S.A.
On June 17, 2013, Itaú Unibanco Holding, signed a Memorandum of Understanding with Cencosud S.A. (“Cencosud”), a Chilean retail chain, whereby the parties have agreed to a strategic alliance, to be implemented, for a period of 15 years.
The purpose of the association will be to offer financial services and products to the consumer through Cenconsud’s retail business in Chile and Argentina, more particularly services and products related to credit card issue and operations (“Transaction”). The association’s activities will be carried out of specific purpose entities in Chile and Argentina, whose equity stock will be held by Itaú Unibanco and Cencosud, at 51% and 49% respectively. At present, Cencosud’s credit portfolio in Chile and Argentina associated with consumer credit activities amount to approximately US$ 1.3 billion.
In the light of the Transaction, Itaú Unibanco will pay the amount of approximately US$ 307 million to Cencosud. The Transaction is not expected to have any significant accounting impact on the results of Itaú Unibanco Holding, which will consolidate the association in its financial statements.
The implementation of the Transaction is contingent on compliance with certain conditions precedent including the approval of the appropriate regulatory authorities.
BMG Seguradora S.A.
On June 25, 2013, Itaú Unibanco Holding, whereby Banco Itaú BMG Consignado S.A. (“JV”), which is a entity indirectly controlled by Itaú Unibanco signed a Share Purchase Agreement with controlling shareholders of Banco BMG S.A. (“Sellers”) whereby JV agreed to acquire 99.996% of the shares issued by BMG Seguradora S.A..
Following the fulfillment of certain conditions precedent, including the approval of this transaction by the appropriate regulatory authorities, the JV will acquire such shares through one of its controlled entities and pay approximately R$ 85 million to Sellers. BMG Seguradora generated R$ 62.6 million in retained premiums during 2012 and, from January to May 2013, a retained premiums’ volume of R$ 42.4 million, 77% higher than the volume generated during the same period of 2012.
BMG Seguradora will execute exclusivity agreements with Banco BMG S.A and the JV for the purpose of distributing insurance products to be offered jointly with the products distributed by such financial institutions.
Such acquisition is not expected to have any significant accounting impact on the results of Itaú Unibanco Holding, which will consolidate the transaction in its financial statements.
Citibank N.A. Uruguay Branch
On June 28, 2013, Itau Unibanco Holding, whereby its subsidiary Banco Itaú Uruguay S.A. (“BIU”) executed hereof a binding agreement with Citibank N.A. Uruguay Branch (“Citi”) establishing the rules for the acquisition by BIU of the retail business conducted by Citi in Uruguay.
As result of this transaction, BIU will assume a portfolio of more than 15,000 clients in Uruguay related to the retail business (bank accounts, saving and term deposits). The acquired assets include mainly the credit card operations conducted by Citi in Uruguay under the Visa, Mastercard and Diners brand, which is represented in 2012 slightly more than 6% of the Uruguayan market share.
The amount involved in the transaction is not material for Itaú Unibanco Holding and, therefore, will not cause any material accounting effect in its results.
The closing of the transaction is subject to this fulfillment of certain conditions precedent, including the approval by competent regulatory authorities.
Partnership with Fiat
On August 20, 2013, ITAU UNIBANCO HOLDING informed that it renewed for another 10 years, by means of its subsidiary Itaú Unibanco S.A., the commercial cooperation agreement entered into with Fiat Group Automobiles S.p.A. and Fiat Automóveis S.A. (“Fiat”). This agreement sets forth: (i) exclusive financing offer in promotional campaigns held by Fiat car maker Fiat for the sale of new automobiles; and (ii) the exclusive use of Fiat brand in vehicle-financing related activities.
This operation is not expected to have significant effects on the results of ITAU UNIBANCO HOLDING.
Note 3 – Requirements of capital and fixed asset limits
a) Basel and fixed asset ratios
The main indicators at September 30, 2013, according to present regulation, are as follows:
| Financial | Economic-financial | |||||||
| conglomerate(1) | consolidated(2) | |||||||
| Referential equity(3) | 122,937,961 | 115,991,201 | ||||||
| Basel ratio | 18.0 | % | 17.5 | % | ||||
| Tier I | 12.5 | % | 11.8 | % | ||||
| Tier II | 5.5 | % | 5.7 | % | ||||
| Fixed assets ratio(4) | 49.8 | % | 14.5 | % | ||||
| Excess capital in relation to fixed assets | 219,169 | 41,200,919 | ||||||
| (1) | Consolidated financial statements including financial companies only; |
| (2) | Consolidated financial statements comprising all direct and indirect subsidiary companies, including insurance, pension plan, capitalization companies and other non-financial companies, as provided for in CMN Resolution No. 2,723 of June 1, 2000, amended by CMN Resolution No. 2,743, of June 28, 2000; |
| (3) | The CMN, through Resolution No. 3,444, of February 28, 2007, determined the Referential Equity (PR), for purposes of calculating operating limits, as being the sum of both Tier I and Tier II levels, following the international experience, each of them comprising items from stockholders' equity, as well as subordinated debt and hybrid capital and debt instruments; |
| (4) | The difference between the fixed asset ratio of the financial conglomerate and the economic-financial consolidated arises from the inclusion of non-financial subsidiary companies, which provide high liquidity and low level of fixed asset ratio, with a consequent decrease in the fixed asset ratio of the economic-financial consolidated amounts, enabling, when necessary, the distribution of funds to the financial companies. |
Management considers the current Basel ratio (17.5%, based on Economic-financial consolidated) to be adequate, taking into account the following:
| a) | It exceeds by 6.5 percent the minimum required by the authorities (11.0 %); and |
| b) | In view of the realizable values of assets (Note 18) and the additional provision (exceeding the minimum required) (Note 8c) the ratio would increase to 18.4%. |
CMN Resolution No. 3,490, of August 29, 2007, provides for the criteria for computation of the Required Referential Equity (PRE). For calculation of the risk portions, the procedures of Circular No. 3,360, of September 12, 2007 and Circular No 3,644, of March 04, 2013 for credit risk, of Circulars Nos. 3,361, 3,362, 3,363, 3,364, 3,366 and 3,368, of September 12, 2007, 3,388, of June 4, 2008, and 3,389, of June 25, 2008, 3,498, of June 28, 2010 and 3,568, of December 21, 2011, and Circular Letters Nos. 3,310, of April 15, 2008 and 3,498, of April 08, 2011 for market risk, and Circulars Nos. 3,383, of April 30, 2008 and 3,476, of December 28, 2009 and Circular Letters Nos. 3,315 and 3,316, of April 30, 2008, for operational risk were followed. For the operational risk portion, ITAÚ UNIBANCO HOLDING opted for the use of the Alternative Standardized Approach.
Circular No. 3,608, of August 17, 2012, changes the procedures for calculating the portion of Required Referential Equity (PRE) related to the foreign currency risk (Pcam), mentioned in Circular No. 3,568.
Up to December 31, 2013, in the event these exposures are equal to or lower than 2.0% of the PR, the Pcam value will be equal to zero. Should the new rules already be applicable, the ratios would be reduced by about 0.2%.
The referential equity used for calculation of ratios and composition of risk exposures at September 30, 2013, are as follows:
| Financial conglomerate | Economic-financial consolidated | |||||||||||||||
| Stockholders' equity ITAÚ UNIBANCO HOLDING S.A. (consolidated) | 78,259,627 | 78,259,627 | ||||||||||||||
| Minority interest in subsidiaries | 1,761,793 | 1,260,999 | ||||||||||||||
| Corporate reorganizations | 6,445,478 | - | ||||||||||||||
| Consolidated stockholders’ equity (BACEN) | 86,466,898 | 79,520,626 | ||||||||||||||
| Deferred tax assets excluded from Tier I | (584,390 | ) | (584,944 | ) | ||||||||||||
| Deferred permanent assets excluded from Tier I | (177,014 | ) | (176,934 | ) | ||||||||||||
| Adjustments to market value – securities and derivative financial instruments excluded from Tier I | 829,951 | 829,951 | ||||||||||||||
| Preferred shares with clause of redemption excluded from Tier I | (876,589 | ) | (876,603 | ) | ||||||||||||
| Tier I | 85,658,856 | 78,712,096 | ||||||||||||||
| Subordinated debt | 38,425,361 | 38,425,361 | ||||||||||||||
| Preferred shares with clause of redemption | 175,318 | 175,318 | ||||||||||||||
| Adjustments to market value -securities and derivative financial instruments | (829,951 | ) | (829,951 | ) | ||||||||||||
| Tier II | 37,770,728 | 37,770,728 | ||||||||||||||
| Tier I + Tier II | 123,429,584 | 116,482,824 | ||||||||||||||
| Exclusions: | ||||||||||||||||
| Funding instruments issued by financial institutions | (491,623 | ) | (491,623 | ) | ||||||||||||
| Referential equity | 122,937,961 | 115,991,201 | ||||||||||||||
| Risk exposure: | ||||||||||||||||
| Exposure weighted by credit risk (EPR) | 621,386,227 | 594,723,309 | ||||||||||||||
| Portion required for credit risk coverage (PEPR) | 68,352,485 | 91.2 | % | 65,419,564 | 89.9 | % | ||||||||||
| a) Per weighting factor (FPR): | ||||||||||||||||
| FPR at 20% | 617,134 | 0.8 | % | 1,170,225 | 1.6 | % | ||||||||||
| FPR at 35% | 691,116 | 0.9 | % | 691,116 | 0.9 | % | ||||||||||
| FPR at 50% | 3,728,993 | 5.0 | % | 4,396,685 | 6.0 | % | ||||||||||
| FPR at 75% | 24,190,210 | 32.3 | % | 23,840,672 | 32.7 | % | ||||||||||
| FPR at 100% | 34,049,894 | 45.4 | % | 30,113,203 | 41.4 | % | ||||||||||
| FPR at 150% | 2,287,512 | 3.1 | % | 2,282,126 | 3.1 | % | ||||||||||
| FPR at 300% | 2,185,577 | 2.9 | % | 2,323,488 | 3.2 | % | ||||||||||
| Derivatives – potential future gain | 602,049 | 0.8 | % | 602,049 | 0.8 | % | ||||||||||
| b) Per type: | ||||||||||||||||
| Securities | 3,858,890 | 5.1 | % | 3,894,547 | 5.3 | % | ||||||||||
| Loan operations - retail | 10,180,638 | 13.6 | % | 9,928,892 | 13.6 | % | ||||||||||
| Loan operations – non-retail | 24,247,148 | 32.3 | % | 24,247,559 | 33.3 | % | ||||||||||
| Joint obligations - retail | 31,447 | 0.0 | % | 31,447 | 0.0 | % | ||||||||||
| Joint obligations – non-retail | 6,175,833 | 8.2 | % | 6,171,165 | 8.5 | % | ||||||||||
| Loan commitments - retail | 2,740,626 | 3.7 | % | 2,641,962 | 3.6 | % | ||||||||||
| Loan commitments – non-retail | 1,807,135 | 2.4 | % | 1,807,524 | 2.5 | % | ||||||||||
| Other exposures | 19,310,768 | 25.8 | % | 16,696,468 | 22.9 | % | ||||||||||
| Portion required for operational risk coverage (POPR) | 4,053,186 | 5.4 | % | 4,869,743 | 6.7 | % | ||||||||||
| Retail | 704,308 | 0.9 | % | 704,308 | 1.0 | % | ||||||||||
| Commercial | 1,260,066 | 1.7 | % | 1,260,066 | 1.7 | % | ||||||||||
| Corporate finance | 113,908 | 0.2 | % | 113,908 | 0.2 | % | ||||||||||
| Negotiation and sales | 1,283,127 | 1.7 | % | 1,283,127 | 1.8 | % | ||||||||||
| Payments and settlements | 299,597 | 0.4 | % | 299,597 | 0.4 | % | ||||||||||
| Financial agent services | 175,453 | 0.2 | % | 175,453 | 0.2 | % | ||||||||||
| Asset management | 211,832 | 0.3 | % | 211,832 | 0.3 | % | ||||||||||
| Retail brokerage | 4,895 | 0.0 | % | 4,895 | 0.0 | % | ||||||||||
| Business plans | - | 0.0 | % | - | 0.0 | % | ||||||||||
| Conef additional | - | 0.0 | % | 816,557 | 1.1 | % | ||||||||||
| Portion required for market risk coverage: | 2,565,194 | 3.4 | % | 2,510,685 | 3.4 | % | ||||||||||
| Gold, foreign currency and operations subject to foreign exchange variation (PCAM) | - | 0.0 | % | - | 0.0 | % | ||||||||||
| Operations subject to interest rate variation (PJUR) | 2,152,828 | 2.9 | % | 2,098,319 | 2.9 | % | ||||||||||
| Fixed rate denominated in Real (PJUR1) | 369,726 | 0.5 | % | 385,985 | 0.5 | % | ||||||||||
| Foreign currency coupon (PJUR2) | 1,006,068 | 1.3 | % | 935,300 | 1.3 | % | ||||||||||
| Price index coupon (PJUR3) | 714,997 | 1.0 | % | 714,997 | 1.0 | % | ||||||||||
| Interest rate coupon (PJUR 4) | 62,037 | 0.1 | % | 62,037 | 0.1 | % | ||||||||||
| Operations subject to commodity price variation (PCOM) | 195,207 | 0.3 | % | 195,207 | 0.3 | % | ||||||||||
| Operations subject to stock price variation (PACS) | 217,159 | 0.3 | % | 217,159 | 0.3 | % | ||||||||||
| Required referential equity | 74,970,865 | 100.0 | % | 72,799,992 | 100.0 | % | ||||||||||
| Excess capital in relation to required referential equity | 47,967,096 | 64.0 | % | 43,191,209 | 59.3 | % | ||||||||||
| Total exposure weighted by risk [EPR + (1/0.11 X (POPR + PCAM + PJUR + PCOM + PACS) | 681,553,319 | 661,818,113 | ||||||||||||||
| Ratio (%) | 18.0 | 17.5 | ||||||||||||||
| Referential equity calculated for covering the interest rate risk of operations not classified into the trading portfolio (RBAN) | 2,527,139 | 2,815,347 | ||||||||||||||
During this period, the effects of the changes in legislation and balances were as follows:
| Financial conglomerate | Economic-financial consolidated | |||||||||||||||||||||||
| Changes in the Basel Ratio | Referential equity | Weighted exposure | Effect | Referential equity | Weighted exposure | Effect | ||||||||||||||||||
| Ratio at 12/31/2012 | 119,945,380 | 661,796,536 | 18.1 | % | 109,420,835 | 654,872,105 | 16.7 | % | ||||||||||||||||
| Net income for the period | 9,747,282 | - | 1.5 | % | 11,054,802 | - | 1.7 | % | ||||||||||||||||
| Interest on capital and dividends | (3,867,341 | ) | - | -0.6 | % | (3,867,341 | ) | - | -0.6 | % | ||||||||||||||
| Benefits to employees - CVM Resolution No. 695, December 13, 2012 | 14,500 | - | 0.0 | % | 14,500 | - | 0.0 | % | ||||||||||||||||
| Granting of options recognized | 165,422 | - | 0.0 | % | 165,422 | - | 0.0 | % | ||||||||||||||||
| Corporate reorganizations | - | - | 0.0 | % | (470,886 | ) | - | -0.1 | % | |||||||||||||||
| Granting of stock options – exercised options in the period | 147,440 | - | 0.0 | % | 147,440 | - | 0.0 | % | ||||||||||||||||
| Asset valuation adjustment | (2,336,840 | ) | - | -0.4 | % | (2,336,840 | ) | - | -0.4 | % | ||||||||||||||
| Treasury Shares | (662,215 | ) | - | -0.1 | % | (662,215 | ) | - | -0.1 | % | ||||||||||||||
| Subordinated debt and redeemable preferred shares | (546,708 | ) | - | -0.1 | % | 2,274,270 | - | 0.4 | % | |||||||||||||||
| Deferred assets excluded from Tier I of referential equity | (37,545 | ) | (37,545 | ) | 0.0 | % | (37,798 | ) | (37,798 | ) | 0.0 | % | ||||||||||||
| Other changes in referential equity | 368,586 | - | 0.1 | % | 289,012 | - | 0.0 | % | ||||||||||||||||
| Changes in risk exposure | - | 19,794,328 | -0.5 | % | - | 6,983,806 | -0.2 | % | ||||||||||||||||
| Ratio at 09/30/2013 | 122,937,961 | 681,553,319 | 18.0 | % | 115,991,201 | 661,818,113 | 17.5 | % | ||||||||||||||||
b) Capital for insurance activity
CNSP – Conselho Nacional de Seguros Privados (National Council for Private Insurance) published on February 18, 2013 rules No. 280 (revoked Resolution No. 411 of December 22, 2010), No. 282 (revoked Resolution No. 227 of December 06, 2010), No. 283 and No. 284. These rules establish general guidelines for the operation of insurance companies and capital requirements for underwriting and operational risk. In January 2011, CNSP Resolution No. 228 of December 6, 2010 provided criteria for additional credit risk capital requirements for insurance companies.
Note 4 – Summary of the main accounting practices
a) Cash and cash equivalents -For purposes of Consolidated Statement of Cash Flows, this item includes cash and current accounts in banks (considered in the heading cash and cash equivalents), interbank deposits and securities purchased under agreements to resell – funded position that have original maturities of up to 90 days or less.
| b) | Interbank investments, remunerated restricted credits – Brazilian Central Bank, remunerated deposits, deposits received under securities repurchase agreements, funds from acceptance and issuance of securities, borrowings and onlending, subordinated debt and other receivables and payables –Transactions subject to monetary correction and foreign exchange variation and operations with fixed charges are recorded at present value, net of the transaction costs incurred, calculated “pro rata die” based on the effective rate of transactions, according to CVM Resolution No. 649 of December 16, 2010. |
| c) | Securities -Recorded at cost of acquisition restated by the index and/or effective interest rate and presented in the Balance Sheet, according to BACEN Circular No. 3,068, of November 8, 2001. Securities are classified into the following categories: |
| · | Trading securities – acquired to be actively and frequently traded, and adjusted to market value, with a contra-entry to the results for the period; |
| · | Available-for-sale securities – securities that can be negotiated but are not acquired to be actively and frequently traded. They are adjusted to their market value with a contra-entry to an account disclosed in stockholders’ equity; |
| · | Held-to-maturity securities – securities, except for non-redeemable shares, for which the bank has the financial condition and intends or is required to hold them in the portfolio up to their maturity, are recorded at cost of acquisition, or market value, whenever these are transferred from another category. The securities are adjusted using the accrual method through their maturity date, not being adjusted to market value. |
Gains and losses on available-for-sale securities, when realized, are recognized at the trading date in the statement of income, with a contra-entry to a specific stockholders’ equity account.
Decreases in the market value of available-for-sale and held-to-maturity securities below their related costs, resulting from non-temporary reasons, are recorded in results as realized losses.
| d) | Derivative financial instruments -these are classified on the date of their acquisition, according to management's intention of using them either as a hedge or not, according to BACEN Circular No. 3,082, of January 30, 2002. Transactions involving financial instruments, carried out upon the client’s request, for their own account, or which do not comply with the hedging criteria (mainly derivatives used to manage the overall risk exposure), are stated at market value, including realized and unrealized gains and losses, which are recorded directly in the statement of income. |
The derivatives used for protection against risk exposure or to modify the characteristics of financial assets and liabilities, which have changes in market value highly associated with those of the items being protected at the beginning and throughout the duration of the contract, and which are found effective to reduce the risk related to the exposure being protected, are classified as a hedge, in accordance with their nature:
| · | Market Risk Hedge –financial assets and liabilities, as well as their related financial instruments, are accounted for at their market value plus realized and unrealized gains and losses, which are recorded directly in the statement of income. |
| · | Cash Flow Hedge-the effective amount of the hedge of financial assets and liabilities, as well as their related financial instruments, are accounted for at their market value plus realized and unrealized gains and losses, net of tax effects, when applicable, and recorded in a specific account in stockholders’ equity. The ineffective portion of the hedge is recorded directly in the statement of income. |
e) Loan, lease and other credit operations (operations with credit granting characteristics) –These transactions are recorded at present value and calculated “pro rata die” based on the variation of the contracted index and interest rate, and are recorded on the accrual basis until the 60th day overdue in financial companies, according to the estimate of receipt. After the 60th day, income is recognized upon the effective receipt of installments. Credit card operations include receivables arising from the purchases made by cardholders. The funds related to these amounts are recorded in Other Liabilities – Credit Card Operations, which also include funds arising from other credits related to transactions with credit card issuers.
f) Allowance for loan losses -the balance of the allowance for loan losses was recorded based on a credit risk analysis, at an amount considered sufficient to cover loan losses according to the rules determined by CMN Resolution No. 2,682 of December 21, 1999, among which are:
| · | Provisions are recorded from the date loans are granted, based on the client’s risk rating and on the periodic quality evaluation of clients and industries, and not only in the event of default; |
| · | Taking into account default exclusively, the write-off as losses occur after 360 days of credits have matured or after 540 daysfor operations that mature after a period of 36 months. |
| g) | Other assets -these assets are mainly comprised of assets held for sale relating to real estate available for sale, own real estate not in use and real estate received as payment in kind, which are adjusted to market value through the set-up of a provision, according to current regulations, reinsurance unearned premiums (Note 4m I); and prepaid expenses, corresponding to disbursements, the benefit of which will occur in future periods. |
h) Investments –investments in subsidiary and affiliated companies are accounted for under the equity method. The consolidated financial statements of foreign branches and subsidiaries are adapted to comply with Brazilian accounting practices and converted into Reais. Other investments are recorded at cost and adjusted to market value by setting up a provision in accordance with current standards.
| i) | Fixed assets -These assets are stated at cost of acquisition or construction, less accumulated depreciation, adjusted to market value until December 31, 2007, when applicable. For insurance, pension plan and capitalization operations, property and equipment are adjusted to market value supported by appraisal reports. They correspond to rights related to tangible assets intended for maintenance of the company’s operations or exercised for such purpose, including assets arising from transactions that transfer to the company their benefits, risks and controls. The items acquired through Lease contracts are recorded according to CVM Resolution No. 554, of November 12, 2008, as contra-entry to Lease obligations. Depreciation is calculated using the straight-line method, based on monetarily restated cost. |
| j) | Goodwill –corresponds to the amount paid in excess for the purchase of investments and is amortized based on expected future profitability or as realized. It is annually tested for impairment. |
| k) | Intangible assets –correspond to rights acquired whose subjects are intangible assets intended for maintenance of the company or which are exercised for such purpose, according to the CMN Resolution No. 3,642, of November 26, 2008. They are composed of (i) the goodwill amount paid on acquisition of the company, transferred to intangible assets in view of the transfer of the adquirer’s equity by the acquired, as set forth by Law No. 9532/97, to be amortized based on the period defined in appraisal reports; (ii) rights acquired to credit payrolls and partnership agreements, amortized over the agreement terms, and (iii) soft ware and customer portfolios, amortized over a term varying from five to ten years. |
| l) | Impairment of assets –a loss is recognized when there is clear evidence that assets are stated at a non-recoverable value. This procedure is adopted semiannually. |
| m) | Insurance, pension plan and capitalization operations -Insurance premiums, acceptance coinsurance and selling expenses are accounted for in accordance with the insurance effectiveness term, through the recognition and reversal of the provision for unearned premiums and deferred selling expenses. Interest arising from fractioning of insurance premiums is accounted for as incurred.Revenues from social security contributions, gross revenue from capitalization certificates and respective technical provisions are recognized upon receipt. |
| I - | Credits from operations and other assets related to insurance and reinsurance operations: |
| · | Insurance premiums receivable - Refer to installments of insurance premiums receivable, current and past due, in accordance with insurance policies issued; |
| · | Reinsurance recoverable amounts – Refer to claims paid to the insured party pending recovery from Reinsurer, installments of unsettled claims and incurred but not reported claims - Reinsurance (IBNR), classified in assets in accordance with the criteria established by CNSP Resolution No. 162, of December 26, 2006, as amended by CNSP Resolution No. 195, of December 16, 2008, and SUSEP Circular No. 464, of March 1, 2013; |
| · | Reinsurance unearned premiums – Recognized to determine the portion of reinsurance unearned premiums, calculated “pro rata die”, and for risks of policies not issued computed based on estimates, based on the actuarial technical study and in compliance with the criteria established by CNSP current legislation as amended by CNSP Resolution No. 195, of December 16, 2008, and SUSEP Circular No. 464, of March 1, 2013. |
| II - | The technical provisions of insurance, pension plan and capitalization are recognized according to the technical notes approved by SUSEP and criteria established by current legislation. |
| II.I- | Insurance and pension plan: |
| · | Provision for unearned premiums – it is recognized for the coverage of amounts payable related to claims and expenses to be incurred, throughout the terms to be elapsed, in connection with the risks assumed at the calculation base date. The provision includes an estimate for effective and not issued risks (PPNG-RVNE). |
| · | Provision for unsettled claims - it is recognized for the coverage of expected unsettled amounts related to single payments and income overdue, of claims reported up to the calculation base date, including accepted coinsurance operations, gross of reinsurance operations, and net of ceded coinsurance operations. The provision should include, whenever required, IBNER (claims incurred but not sufficiently reported) for the aggregate development of claims reported but not paid, which amounts may be changed throughout the process up to the final settlement. |
| · | Provision for claims incurred and not reported (IBNR) –it is recognized for the coverage of expected unsettled amounts related to claims incurred but not reported up to the calculation base date, including accepted coinsurance operations, gross of reinsurance operations, and net of ceded coinsurance operations. |
| · | Mathematical provisions for benefits to be granted -it is recognized until the event triggering the benefit occurs, for coverage of the commitments assumed with the participants or insured, and it is calculated in accordance with methodologies approved in the technical actuarial note of the plan or product. |
| · | Mathematical provisions for granted benefits -it is recognized after the event that triggering the benefit occurs, for coverage of the commitments assumed with the participants or insured, and it is calculated in accordance with methodologies approved in the technical actuarial note of the plan or product. |
| · | Provision for financial surplus – recognized to ensure the amounts intended for distribution of financial surplus, in accordance with regulation in force, in the event it is stated in the agreement. |
| · | Other technical provisions – recognized when insufficiency of premiums or contributions are identified related to payments of claims and benefits. |
| · | Provision for redemptions and other amounts to regularize –it comprises the amounts related to redemptions to regularize, returns of premiums or funds, portability requested but, for any reason, not yet transferred to the insurance company or open private pension entity beneficiary, and premiums received but not quoted. |
| · | Provision for related expenses - recognized for the coverage of expected amounts related to expenses with claims and benefits. |
| II.II - | Capitalization: |
| · | Mathematical provision for capitalization – recognized until the event triggering the benefit occurs, and comprises the portion of the amounts collected for capitalization. It includes monetary restatement and interest, as from the beginning of the validity date. |
| · | Provision for redemption –recognized as from the date of the event triggering the redemption of the certificate and/or the event triggering the distribution of the bonus until the date of the financial settlement or the date the evidence of payment of the obligation is received |
| · | Provision for raffles unrealized – comprises the portion of the amounts collected for raffles for each certificate, which raffles have been cost, but that, at the recognition date, have not yet been realized. |
| · | Provision for rafflespayable – recognized as from the date the raffle is drawn until the date of the financial settlement or the date the evidence of payment of the obligation is received, or in conformity with other cases provided by law. |
| · | Supplementary provision for raffles– recognized to supplement the Provision for Raffles to be Drawn, and is used for coverage of possible insufficient amounts related to the expected amount of raffles to be drawn. |
| · | Provision for administrative- recognized for the coverage of expected amounts related to administrative expenses with capitalization plans. |
| n) | Contingent assets and liabilities and legal liabilities – tax and social security - assessed, recognized and disclosed according to the provisions set forth in CMN Resolution No. 3,823 of December 16, 2009, and BACEN Circular Letter No. 3,429 of February 11, 2010. |
| I - | Contingent assets and liabilities |
Refer to potential rights and obligations arising from past events, the occurrence of which is dependent upon future events.
| · | Contingent assets - not recognized, except upon evidence ensuring a high reliability level of realization, usually represented by claims awarded a final and unappealable judgment and confirmation of the recoverability of the claim through receipt of amounts or offset against another liability; |
| · | Contingent liabilities - basically arise from administrative proceedings and lawsuits, inherent in the normal course of business, filed by third parties, former employees and governmental bodies, in connection with civil, labor, tax and social security lawsuits and other risks.These contingencies are calculated based on conservative practices, being usually recorded based on the opinion of legal advisors and considering the probability that financial resources shall be required for settling the obligation, the amount of which may be estimated with sufficient certainty.Contingencies are classified either as probable, for which provisions are recognized; possible, which are disclosed but not recognized; and remote, for which recognition or disclosure are not required.Any contingent amounts are measured through the use of models and criteria which allow their adequate measurement, in spite of the uncertainty of their term and amounts. |
Escrow deposits are restated in accordance with the current legislation.
Contingencies guaranteed by indemnity clauses in privatization processes and with liquidity are only recognized upon judicial notification with simultaneous recognition of receivables, without any effect on results.
| II - | Legal liabilities – tax and social security |
Represented by amounts payable related to tax liabilities, the legality or constitutionality of which are subject to judicial defense, recognized at the full amount under discussion.
Liabilities and related escrow deposits are adjusted in accordance with the current legislation.
| o) | Taxes -these provisions are calculated according to current legislation at the rates shown below, using the related calculation bases. |
| Income tax | 15.00 | % | ||
| Additional income tax | 10.00 | % | ||
| Social contribution(1) | 15.00 | % | ||
| PIS(2) | 0.65 | % | ||
| COFINS(2) | 4.00 | % | ||
| ISS up to | 5.00 | % |
| (1) | For ITAÚ UNIBANCO HOLDING and its financial subsidiaries and equivalent companies, the rate corresponds to 15.00%. For non-financial and pension plan subsidiaries, the rate is 9.00%. |
| (2) | For non-financial subsidiaries that fall into the non-cumulative calculation system, the PIS rate is 1.65% and COFINS rate is 7.60%. |
The changes introduced by Laws No. 11,638 and No. 11,941 (articles 37 and 38), which modified the criterion for recognizing revenues, costs and expenses, computed to determine the net income for the year, did not produce effects for purposes of determining the taxable income of companies that opt for the Transition Tax Regime (RTT), so for tax purposes the rules effective on December 31, 2007 were followed. The tax effect arising from the adoption of such rules is recorded, for accounting purposes, in the corresponding deferred assets and liabilities.
| p) | Deferred income –this refers to: (i) unexpired interest received in advance that is recognized in income as earned, and (ii) the negative goodwill on acquisition of investments arising from expected future losses, which has not been absorbed in the consolidation process. |
| q) | Transactions with minority stockholders -Changes in ownership interest in a subsidiary, which do not result in loss of control, are accounted for as capital transactions and any difference between the amount paid and the amount corresponding to minority stockholders is recognized directly in consolidated stockholders' equity. |
| r) | Post-employments benefits |
Pension plans - defined benefit plans
The liability (or asset, as the case may be) recognized in the consolidated balance sheet with respect to the defined benefit plan corresponds to the present value of the defined benefit obligations on the balance sheet date less the fair value of the plan assets. The defined benefit obligation is annually calculated by an independent actuarial consulting company using the projected unit credit method. The present value of the defined benefit obligation is determined by discounting the estimated amount of future cash flows of benefit payments based on the Brazilian treasury long term securities denominated in reais and with maturity periods similar to the term of the pension plan liabilities.
The following amounts are recognized in the consolidated statement of income:
| · | current service cost – defined as the increase in the present value of obligations resulting from employee service in the current period; |
| · | interest on the net amount of assets (liabilities) of defined benefit plans is the change, during the period, in the net amount recognized in assets and liabilities, due to the time elapsed, which comprises the interest income on plan assets, interest expense on the obligations of the defined benefit plan and interest on the asset ceiling effects. |
Actuarial gains and losses arise from the non-realization of the actuarial assumptions established in the latest actuarial evaluation as compared to those effectively carried out, as well as the effects from changes in such assumptions. Gains and losses are fully recognized in Other Comprehensive Income.
Pension plans - defined contribution
For defined contribution plans, contributions to plans made by ITAÚ UNIBANCO HOLDING, through pension plan funds, are recognized as an expense when due.
Other post-employment benefit obligations
Certain companies that merged into ITAÚ UNIBANCO HOLDING over the past few years were sponsors of post-employment healthcare benefit plans and ITAÚ UNIBANCO HOLDING is committed as per the acquisition contracts to maintain such benefits over specific periods, as well as in relation to the benefits granted due to a judicial sentence. Such benefits are also accounted for in accordance with CVM Resolution No. 695 of 12/31/2012, in a manner similar to defined benefit plans.
Note 5 - Cash and cash equivalents
For purposes of Statement of Cash Flows, cash and cash equivalents of ITAÚ UNIBANCO HOLDING CONSOLIDATED are composed of the following:
| 09/30/2013 | 09/30/2012 | |||||||
| Cash and cash equivalents | 14,466,493 | 13,103,962 | ||||||
| Interbank deposits | 12,407,063 | 7,133,667 | ||||||
| Securities purchased under agreements to resell – Funded position | 25,587,072 | 38,694,410 | ||||||
| Total | 52,460,628 | 58,932,039 | ||||||
In ITAÚ UNIBANCO HOLDING it is composed of the following:
| 09/30/2013 | 09/30/2012 | |||||||
| Cash and cash equivalents | 45,720 | 15,773 | ||||||
| Securities purchased under agreements to resell – Funded position | 68,892 | 134,362 | ||||||
| Total | 114,612 | 150,135 | ||||||
Note 6 - Interbank investments
| 09/30/2013 | 09/30/2012 | |||||||||||||||||||||||||||||||
| 0 - 30 | 31 - 180 | 181 - 365 | Over 365 | Total | % | Total | % | |||||||||||||||||||||||||
| Money market | 89,720,337 | 74,860,468 | 4,999,997 | 387 | 169,581,189 | 87.8 | 142,631,770 | 87.3 | ||||||||||||||||||||||||
| Funded position (*) | 28,250,334 | 5,187,898 | 1,892,769 | 387 | 35,331,388 | 18.3 | 59,375,019 | 36.3 | ||||||||||||||||||||||||
| Financed position | 61,470,003 | 42,061,869 | - | - | 103,531,872 | 53.6 | 66,487,167 | 40.7 | ||||||||||||||||||||||||
| With free movement | 10,963,703 | 42,061,869 | - | - | 53,025,572 | 27.5 | 4,799,734 | 2.9 | ||||||||||||||||||||||||
| Without free movement | 50,506,300 | - | - | - | 50,506,300 | 26.1 | 61,687,433 | 37.8 | ||||||||||||||||||||||||
| Short position | - | 27,610,701 | 3,107,228 | - | 30,717,929 | 15.9 | 16,769,584 | 10.3 | ||||||||||||||||||||||||
| Money market – Assets Guaranteeing Technical Provisions - SUSEP | 3,107,401 | - | - | - | 3,107,401 | 1.6 | 2,550,201 | 1.6 | ||||||||||||||||||||||||
| Interbank deposits | 12,567,088 | 1,875,691 | 5,327,878 | 804,064 | 20,574,721 | 10.6 | 18,160,320 | 11.1 | ||||||||||||||||||||||||
| Total | 105,394,826 | 76,736,159 | 10,327,875 | 804,451 | 193,263,311 | 163,342,291 | ||||||||||||||||||||||||||
| % per maturity term | 54.6 | 39.7 | 5.3 | 0.4 | ||||||||||||||||||||||||||||
| Total – 09/30/2012 | 120,713,331 | 36,520,186 | 5,661,556 | 447,218 | 163,342,291 | |||||||||||||||||||||||||||
| % per maturity term | 73.8 | 22.4 | 3.5 | 0.3 | ||||||||||||||||||||||||||||
| (*) | Includes R$ 3,916,589 (R$ 10,143,039 at 09/30/2012) related to money market with free movement, in which securities are basically restricted to guarantee transactions at the BM&FBovespa S.A. - Bolsa de Valores, Mercadorias e Futuros (Securities, Commodities and Futures Exchange) and the Central Bank of Brazil (BACEN). |
In ITAÚ UNIBANCO HOLDING the portfolio is composed of Money market – Funded position falling due in up to 30 days amounting to R$ 68,892 (R$ 134,362 at 09/30/2012) and Interbank deposits with maturity of 31 to 180 days amounting to R$ 115,364 (R$ 23.703.002 at 09/30/2012), of 181 to 365 days amounting to R$ 149 (R$ 170,177 at 09/30/2012) and over 365 days amounting to R$ 38.338,051 (R$ 14,571,634 at 09/30/2012).
Note 7 – Securities and derivative financial instruments (assets and liabilities)
See below the composition by Securities and Derivatives type, maturity and portfolio already adjusted to their respective market values.
a) Summary per maturity
| 09/30/2013 | 09/30/2012 | |||||||||||||||||||||||||||||||||||||||||||||||
| Provision for adjustment to market value reflected in: | ||||||||||||||||||||||||||||||||||||||||||||||||
| Cost | Results | Stockholders’ equity | Market value | % | 0 - 30 | 31- 90 | 91- 180 | 181-365 | 366-720 | Over 720 days | Market value | |||||||||||||||||||||||||||||||||||||
| Government securities - domestic | 122,621,802 | (800,481 | ) | (1,602,070 | ) | 120,219,251 | 44.2 | 614,156 | 8,054 | 7,901,874 | 24,419,998 | 32,067,478 | 55,207,691 | 101,716,979 | ||||||||||||||||||||||||||||||||||
| Financial treasury bills | 28,065,660 | 4,090 | 223 | 28,069,973 | 10.3 | - | - | 4,030,217 | 5,009,615 | 14,407,213 | 4,622,928 | 29,421,923 | ||||||||||||||||||||||||||||||||||||
| National treasury bills | 31,754,507 | (301,610 | ) | (114,535 | ) | 31,338,362 | 11.5 | 609,015 | - | 1,563,182 | 13,707,595 | 11,924,363 | 3,534,207 | 22,065,082 | ||||||||||||||||||||||||||||||||||
| National treasury notes | 41,473,726 | (524,359 | ) | (517,038 | ) | 40,432,329 | 14.9 | 5,134 | 6,832 | 2,101,047 | 5,544,941 | 4,497,972 | 28,276,403 | 33,309,375 | ||||||||||||||||||||||||||||||||||
| National treasury/securitization | 283,391 | (4 | ) | (3,838 | ) | 279,549 | 0.1 | 7 | 1,222 | 90 | 1,721 | 2,804 | 273,705 | 319,402 | ||||||||||||||||||||||||||||||||||
| Brazilian external debt bonds | 21,044,518 | 21,402 | (966,882 | ) | 20,099,038 | 7.4 | - | - | 207,338 | 156,126 | 1,235,126 | 18,500,448 | 16,600,702 | |||||||||||||||||||||||||||||||||||
| Other | - | - | - | - | 0.0 | - | - | - | - | - | - | 495 | ||||||||||||||||||||||||||||||||||||
| Government securities - abroad | 9,265,891 | (628 | ) | (77,276 | ) | 9,187,987 | 3.4 | 61,398 | 1,331,459 | 1,991,495 | 225,764 | 4,158,705 | 1,419,166 | 7,877,347 | ||||||||||||||||||||||||||||||||||
| Argentina | 96,625 | (2,079 | ) | - | 94,546 | 0.0 | 55 | - | 72,535 | 6 | 9,800 | 12,150 | 140,896 | |||||||||||||||||||||||||||||||||||
| Denmark | 2,979,908 | - | - | 2,979,908 | 1.1 | - | 832,425 | 1,125,747 | - | 1,021,736 | - | 1,721,478 | ||||||||||||||||||||||||||||||||||||
| Korea | 2,455,010 | - | - | 2,455,010 | 0.9 | - | - | - | - | 2,455,010 | - | 1,672,080 | ||||||||||||||||||||||||||||||||||||
| Chile | 937,487 | (37 | ) | 1,431 | 938,881 | 0.4 | 41,306 | 337,441 | 508,242 | 22,897 | 19,411 | 9,584 | 1,941,527 | |||||||||||||||||||||||||||||||||||
| Paraguay | 596,167 | - | (51,072 | ) | 545,095 | 0.2 | 10,474 | 141,628 | 104,487 | 73,807 | 101,694 | 113,005 | 287,305 | |||||||||||||||||||||||||||||||||||
| Uruguay | 471,707 | (827 | ) | (20,023 | ) | 450,857 | 0.2 | 9,563 | 14,149 | 87,890 | 111,698 | 152,390 | 75,167 | 360,526 | ||||||||||||||||||||||||||||||||||
| United States | 803,032 | 7,675 | (6,787 | ) | 803,920 | 0.3 | - | - | 92,592 | 17,356 | 333,935 | 360,037 | 827,819 | |||||||||||||||||||||||||||||||||||
| Mexico | 263,110 | (4,075 | ) | - | 259,035 | 0.1 | - | - | 2 | - | - | 259,033 | 618,430 | |||||||||||||||||||||||||||||||||||
| Colombia | 294,481 | 84 | - | 294,565 | 0.1 | - | 5,816 | - | - | - | 288,749 | 170,454 | ||||||||||||||||||||||||||||||||||||
| Belgium | 186,135 | (1,437 | ) | 415 | 185,113 | 0.1 | - | - | - | - | 49,082 | 136,031 | 68,138 | |||||||||||||||||||||||||||||||||||
| France | 83,901 | - | 415 | 84,316 | 0.0 | - | - | - | - | 15,620 | 68,696 | 27,028 | ||||||||||||||||||||||||||||||||||||
| Netherlands | 58,452 | - | (356 | ) | 58,096 | 0.0 | - | - | - | - | - | 58,096 | - | |||||||||||||||||||||||||||||||||||
| Germany | 31,091 | - | (1,045 | ) | 30,046 | 0.0 | - | - | - | - | - | 30,046 | - | |||||||||||||||||||||||||||||||||||
| Other | 8,785 | 68 | (254 | ) | 8,599 | 0.0 | - | - | - | - | 27 | 8,572 | 41,666 | |||||||||||||||||||||||||||||||||||
| Corporate securities | 50,751,273 | 8,527 | 300,473 | 51,060,273 | 18.7 | 5,500,646 | 1,065,477 | 1,821,349 | 6,807,305 | 10,145,598 | 25,719,898 | 44,060,481 | ||||||||||||||||||||||||||||||||||||
| Eurobonds and others | 5,399,206 | (12,473 | ) | 103,477 | 5,490,210 | 2.0 | 81,059 | 86,438 | 71,427 | 304,995 | 1,229,108 | 3,717,183 | 6,987,398 | |||||||||||||||||||||||||||||||||||
| Bank deposit certificates | 1,800,231 | - | (1,173 | ) | 1,799,058 | 0.7 | 401,707 | 242,623 | 418,913 | 722,893 | 4,311 | 8,611 | 809,011 | |||||||||||||||||||||||||||||||||||
| Shares | 3,131,056 | (11,095 | ) | 17,997 | 3,137,958 | 1.2 | 3,137,958 | - | - | - | - | - | 3,185,439 | |||||||||||||||||||||||||||||||||||
| Debentures | 15,827,659 | 6,309 | 299,655 | 16,133,623 | 6.0 | 92,843 | 228,670 | 462,814 | 1,183,505 | 519,456 | 13,646,335 | 11,973,995 | ||||||||||||||||||||||||||||||||||||
| Promissory notes | 1,192,351 | - | (6,522 | ) | 1,185,829 | 0.4 | 106,906 | 349,368 | 309,268 | 399,639 | - | 20,648 | 1,681,019 | |||||||||||||||||||||||||||||||||||
| Rural product note | 655,923 | - | (18,503 | ) | 637,420 | 0.2 | 95,791 | 32,510 | 78,162 | 103,504 | 36,749 | 290,704 | 797,143 | |||||||||||||||||||||||||||||||||||
| Fund quotas | 1,138,236 | 25,208 | 6,143 | 1,169,587 | 0.4 | 1,165,316 | - | - | - | 4,271 | - | 2,492,036 | ||||||||||||||||||||||||||||||||||||
| Fixed income | 684,518 | (5,754 | ) | (8 | ) | 678,756 | 0.2 | 674,485 | - | - | - | 4,271 | - | 1,127,444 | ||||||||||||||||||||||||||||||||||
| Credit rights | 253,089 | - | - | 253,089 | 0.1 | 253,089 | - | - | - | - | - | 1,123,205 | ||||||||||||||||||||||||||||||||||||
| Variable income | 200,629 | 30,962 | 6,151 | 237,742 | 0.1 | 237,742 | - | - | - | - | - | 241,387 | ||||||||||||||||||||||||||||||||||||
| Securitized real estate loans | 8,917,896 | 576 | (92,590 | ) | 8,825,882 | 3.2 | 49,686 | 61,799 | 122,984 | 667,524 | 792,407 | 7,131,482 | 8,694,601 | |||||||||||||||||||||||||||||||||||
| Financial bills | 12,041,778 | (3 | ) | (2,877 | ) | 12,038,898 | 4.4 | 369,380 | 64,069 | 352,514 | 3,425,245 | 7,335,999 | 491,691 | 7,189,461 | ||||||||||||||||||||||||||||||||||
| Other | 646,937 | 5 | (5,134 | ) | 641,808 | 0.2 | - | - | 5,267 | - | 223,297 | 413,244 | 250,378 | |||||||||||||||||||||||||||||||||||
| PGBL/VGBL fund quotas(1) | 79,779,392 | - | - | 79,779,392 | 29.3 | 79,779,392 | - | - | - | - | - | 69,856,629 | ||||||||||||||||||||||||||||||||||||
| Subtotal - securities | 262,418,358 | (792,582 | ) | (1,378,873 | ) | 260,246,903 | 95.6 | 85,955,592 | 2,404,990 | 11,714,718 | 31,453,067 | 46,371,781 | 82,346,755 | 223,511,436 | ||||||||||||||||||||||||||||||||||
| Trading securities | 173,532,047 | (792,582 | ) | - | 172,739,465 | 63.4 | 83,712,903 | 187,524 | 7,726,017 | 16,683,017 | 35,488,031 | 28,941,973 | 156,835,230 | |||||||||||||||||||||||||||||||||||
| Available-for-sale securities | 85,177,062 | - | (1,378,873 | ) | 83,798,189 | 30.9 | 2,190,581 | 2,217,466 | 3,988,701 | 14,770,050 | 10,823,913 | 49,807,478 | 63,512,801 | |||||||||||||||||||||||||||||||||||
| Held-to-maturity securities(2) | 3,709,249 | - | - | 3,709,249 | 1.3 | 52,108 | - | - | - | 59,837 | 3,597,304 | 3,163,405 | ||||||||||||||||||||||||||||||||||||
| Derivative financial instruments | 9,928,381 | 1,921,851 | 12,750 | 11,862,982 | 4.4 | 2,311,542 | 1,855,240 | 1,442,600 | 1,531,028 | 2,137,638 | 2,584,934 | 11,044,954 | ||||||||||||||||||||||||||||||||||||
| Total securities and derivative financial instruments (assets) | 272,346,739 | 1,129,269 | (1,366,123 | ) | 272,109,885 | 100.0 | 88,267,134 | 4,260,230 | 13,157,318 | 32,984,095 | 48,509,419 | 84,931,689 | 234,556,390 | |||||||||||||||||||||||||||||||||||
| Derivative financial instruments (liabilities) | (7,716,578 | ) | (1,488,602 | ) | - | (9,205,180 | ) | 100.0 | (1,725,183 | ) | (687,579 | ) | (1,009,832 | ) | (1,617,556 | ) | (1,292,974 | ) | (2,872,056 | ) | (9,125,386 | ) | ||||||||||||||||||||||||||
| (1) | The PGBL and VGBL plans securities portfolios, the ownership and embedded risks of which are the customer’s responsibility, are recorded as securities – trading securities, with a contra-entry to long-term liabilities in Pension Plan Technical Provisions account, as determined by SUSEP. |
| (2) | Unrecorded positive adjustment to market value in the amount of R$ 742,646 (R$ 1,192,772at 09/30/2012), according to Note 7e. |
b) Summary by portfolio
| 09/30/2013 | ||||||||||||||||||||||||||||||||
| Restricted to | ||||||||||||||||||||||||||||||||
| Own portfolio | Repurchase agreements | Pledged guarantees (*) | Free portfolio | Central Bank | Derivative financial instruments | Assets guaranteeing technical provisions (Note 11b) | Total | |||||||||||||||||||||||||
| Government securities - domestic | 54,996,915 | 41,130,968 | 5,632,720 | 12 | 12,983,586 | - | 5,475,050 | 120,219,251 | ||||||||||||||||||||||||
| Financial treasury bills | 9,105,541 | 3,368,932 | 2,117,459 | 12 | 12,932,968 | - | 545,061 | 28,069,973 | ||||||||||||||||||||||||
| National treasury bills | 19,373,336 | 8,612,917 | 3,301,491 | - | 50,618 | - | - | 31,338,362 | ||||||||||||||||||||||||
| National treasury notes | 17,374,300 | 17,914,270 | 213,770 | - | - | - | 4,929,989 | 40,432,329 | ||||||||||||||||||||||||
| National treasury/securitization | 279,549 | - | - | - | - | - | - | 279,549 | ||||||||||||||||||||||||
| Brazilian external debt bonds | 8,864,189 | 11,234,849 | - | - | - | - | - | 20,099,038 | ||||||||||||||||||||||||
| Government securities - abroad | 7,450,874 | 99,314 | 1,565,304 | 46,662 | - | - | 25,833 | 9,187,987 | ||||||||||||||||||||||||
| Argentina | 14,160 | 69,619 | 10,767 | - | - | - | - | 94,546 | ||||||||||||||||||||||||
| Denmark | 1,540,975 | - | 1,438,933 | - | - | - | - | 2,979,908 | ||||||||||||||||||||||||
| Korea | 2,455,010 | - | - | - | - | - | - | 2,455,010 | ||||||||||||||||||||||||
| Chile | 880,075 | 29,695 | 3,278 | - | - | - | 25,833 | 938,881 | ||||||||||||||||||||||||
| Paraguay | 545,095 | - | - | - | - | - | - | 545,095 | ||||||||||||||||||||||||
| Uruguay | 448,479 | - | 2,378 | - | - | - | - | 450,857 | ||||||||||||||||||||||||
| United States | 693,972 | - | 109,948 | - | - | - | - | 803,920 | ||||||||||||||||||||||||
| Mexico | 259,035 | - | - | - | - | - | - | 259,035 | ||||||||||||||||||||||||
| Colombia | 247,903 | - | - | 46,662 | - | - | - | 294,565 | ||||||||||||||||||||||||
| Belgium | 185,113 | - | - | - | - | - | - | 185,113 | ||||||||||||||||||||||||
| France | 84,316 | - | - | - | - | - | - | 84,316 | ||||||||||||||||||||||||
| Netherlands | 58,096 | - | - | - | - | - | - | 58,096 | ||||||||||||||||||||||||
| Germany | 30,046 | - | - | - | - | - | - | 30,046 | ||||||||||||||||||||||||
| Other | 8,599 | - | - | - | - | - | - | 8,599 | ||||||||||||||||||||||||
| Corporate securities | 42,516,567 | 2,632,301 | 323,755 | - | - | - | 5,587,650 | 51,060,273 | ||||||||||||||||||||||||
| Eurobonds and other | 3,123,510 | 2,366,700 | - | - | - | - | - | 5,490,210 | ||||||||||||||||||||||||
| Bank deposit certificates | 1,449,348 | 265,601 | 1,287 | - | - | - | 82,822 | 1,799,058 | ||||||||||||||||||||||||
| Shares | 3,132,184 | - | 5,774 | - | - | - | - | 3,137,958 | ||||||||||||||||||||||||
| Debentures | 14,582,422 | - | 316,673 | - | - | - | 1,234,528 | 16,133,623 | ||||||||||||||||||||||||
| Promissory notes | 1,185,829 | - | - | - | - | - | - | 1,185,829 | ||||||||||||||||||||||||
| Rural product note | 637,420 | - | - | - | - | - | - | 637,420 | ||||||||||||||||||||||||
| Fund quotas | 774,533 | - | 21 | - | - | - | 395,033 | 1,169,587 | ||||||||||||||||||||||||
| Fixed income | 367,998 | - | 21 | - | - | - | 310,737 | 678,756 | ||||||||||||||||||||||||
| Credit rights | 168,793 | - | - | - | - | - | 84,296 | 253,089 | ||||||||||||||||||||||||
| Variable income | 237,742 | - | - | - | - | - | - | 237,742 | ||||||||||||||||||||||||
| Securitized real estate loans | 8,820,275 | - | - | - | - | - | 5,607 | 8,825,882 | ||||||||||||||||||||||||
| Financial bills | 8,169,238 | - | - | - | - | - | 3,869,660 | 12,038,898 | ||||||||||||||||||||||||
| Other | 641,808 | - | - | - | - | - | - | 641,808 | ||||||||||||||||||||||||
| PGBL/VGBL fund quotas | - | - | - | - | - | - | 79,779,392 | 79,779,392 | ||||||||||||||||||||||||
| Subtotal - securities | 104,964,356 | 43,862,583 | 7,521,779 | 46,674 | 12,983,586 | - | 90,867,925 | 260,246,903 | ||||||||||||||||||||||||
| Trading securities | 49,122,905 | 21,947,166 | 2,617,938 | 46,674 | 12,932,651 | - | 86,072,131 | 172,739,465 | ||||||||||||||||||||||||
| Available-for-sale securities | 55,343,215 | 21,867,472 | 4,903,841 | - | 50,935 | - | 1,632,726 | 83,798,189 | ||||||||||||||||||||||||
| Held-to-maturity securities | 498,236 | 47,945 | - | - | - | - | 3,163,068 | 3,709,249 | ||||||||||||||||||||||||
| Derivative financial instruments | - | - | - | - | - | 11,862,982 | - | 11,862,982 | ||||||||||||||||||||||||
| Total securities and derivative financial instruments (assets) | 104,964,356 | 43,862,583 | 7,521,779 | 46,674 | 12,983,586 | 11,862,982 | 90,867,925 | 272,109,885 | ||||||||||||||||||||||||
| Total securities and derivative financial instruments (assets) – 09/30/2012 | 83,379,003 | 40,145,774 | 6,673,054 | 88,986 | 12,591,352 | 11,044,954 | 80,633,267 | 234,556,390 | ||||||||||||||||||||||||
| (*) | Represent securities deposited with Contingent Liabilities (Note 12b), Stock Exchanges and the Clearing House for the Custody and Financial Settlement of Securities. |
c) Trading securities
See below the composition of the portfolio of trading securities by type, stated at cost and market value and by maturity term.
| 09/30/2013 | 09/30/2012 | |||||||||||||||||||||||||||||||||||||||||||
| Cost | Adjustment to market value (in results) | Market value | % | 0 - 30 | 31 - 90 | 91 - 180 | 181- 365 | 366- 720 | Over 720 days | Market value | ||||||||||||||||||||||||||||||||||
| Government securities - domestic | 82,368,038 | (800,481 | ) | 81,567,557 | 47.4 | 614,136 | 7,883 | 7,380,752 | 16,078,486 | 31,877,051 | 25,609,249 | 75,867,459 | ||||||||||||||||||||||||||||||||
| Financial treasury bills | 27,040,883 | 4,090 | 27,044,973 | 15.8 | - | - | 3,569,878 | 4,796,107 | 14,400,586 | 4,278,402 | 26,408,534 | |||||||||||||||||||||||||||||||||
| National treasury bills | 23,586,791 | (301,610 | ) | 23,285,181 | 13.5 | 609,014 | - | 1,563,182 | 5,654,415 | 11,924,363 | 3,534,207 | 22,065,082 | ||||||||||||||||||||||||||||||||
| National treasury notes | 29,455,997 | (524,359 | ) | 28,931,638 | 16.8 | 5,115 | 6,661 | 2,093,931 | 5,544,020 | 4,349,603 | 16,932,308 | 25,282,335 | ||||||||||||||||||||||||||||||||
| National treasury/securitization | 9,326 | (4 | ) | 9,322 | 0.0 | 7 | 1,222 | 90 | 1,721 | 2,804 | 3,478 | 14,871 | ||||||||||||||||||||||||||||||||
| Brazilian external debt bonds | 2,275,041 | 21,402 | 2,296,443 | 1.3 | - | - | 153,671 | 82,223 | 1,199,695 | 860,854 | 2,096,637 | |||||||||||||||||||||||||||||||||
| Government securities - abroad | 1,117,718 | (628 | ) | 1,117,090 | 0.6 | 4,738 | 19,438 | 89,290 | 4,642 | 363,845 | 635,137 | 1,462,517 | ||||||||||||||||||||||||||||||||
| Argentina | 96,623 | (2,079 | ) | 94,544 | 0.1 | 53 | - | 72,535 | 6 | 9,800 | 12,150 | 140,896 | ||||||||||||||||||||||||||||||||
| Chile | 17,595 | (37 | ) | 17,558 | 0.0 | - | - | 11,461 | - | - | 6,097 | 136,326 | ||||||||||||||||||||||||||||||||
| Uruguay | 49,172 | (827 | ) | 48,345 | 0.0 | 4,685 | 13,622 | 5,292 | 4,636 | 20,110 | - | 38,871 | ||||||||||||||||||||||||||||||||
| United States | 326,260 | 7,675 | 333,935 | 0.2 | - | - | - | - | 333,935 | - | 316,324 | |||||||||||||||||||||||||||||||||
| Mexico | 263,110 | (4,075 | ) | 259,035 | 0.1 | - | - | 2 | - | - | 259,033 | 618,430 | ||||||||||||||||||||||||||||||||
| Colombia | 294,482 | 84 | 294,566 | 0.2 | - | 5,816 | - | - | - | 288,750 | 170,454 | |||||||||||||||||||||||||||||||||
| Belgium | 67,921 | (1,437 | ) | 66,484 | 0.0 | - | - | - | - | - | 66,484 | - | ||||||||||||||||||||||||||||||||
| Other | 2,555 | 68 | 2,623 | - | - | - | - | - | - | 2,623 | 41,216 | |||||||||||||||||||||||||||||||||
| Corporate securities | 10,266,899 | 8,527 | 10,275,426 | 5.8 | 3,314,637 | 160,203 | 255,975 | 599,889 | 3,247,135 | 2,697,587 | 8,816,029 | |||||||||||||||||||||||||||||||||
| Eurobonds and other | 1,422,051 | (12,473 | ) | 1,409,578 | 0.8 | 3,659 | 26,832 | 2,240 | 35,961 | 291,936 | 1,048,950 | 1,634,964 | ||||||||||||||||||||||||||||||||
| Bank deposit certificates | 102,227 | - | 102,227 | 0.1 | - | 63,860 | 19,022 | 6,423 | 4,311 | 8,611 | 360,234 | |||||||||||||||||||||||||||||||||
| Shares | 1,916,851 | (11,095 | ) | 1,905,756 | 1.1 | 1,905,756 | - | - | - | - | - | 1,088,351 | ||||||||||||||||||||||||||||||||
| Debentures | 1,789,430 | 6,309 | 1,795,739 | 1.0 | 92,842 | 67,753 | 105,500 | 238,397 | 163,560 | 1,127,687 | 1,363,351 | |||||||||||||||||||||||||||||||||
| Promissory notes | 20,648 | - | 20,648 | 0.0 | - | - | - | - | - | 20,648 | 305,214 | |||||||||||||||||||||||||||||||||
| Fund quotas | 917,792 | 25,208 | 943,000 | 0.5 | 943,000 | - | - | - | - | - | 786,505 | |||||||||||||||||||||||||||||||||
| Fixed income | 667,141 | (5,754 | ) | 661,387 | 0.4 | 661,387 | - | - | - | - | - | 266,869 | ||||||||||||||||||||||||||||||||
| Credit rights | 84,356 | - | 84,356 | 0.0 | 84,356 | - | - | - | - | - | 315,597 | |||||||||||||||||||||||||||||||||
| Variable income | 166,295 | 30,962 | 197,257 | 0.1 | 197,257 | - | - | - | - | - | 204,039 | |||||||||||||||||||||||||||||||||
| Securitized real estate loans | 17,022 | 576 | 17,598 | 0.0 | - | - | - | 567 | 17,031 | - | 24,863 | |||||||||||||||||||||||||||||||||
| Financial bills | 4,049,966 | (3 | ) | 4,049,963 | 2.3 | 369,380 | 1,758 | 129,213 | 318,541 | 2,739,380 | 491,691 | 3,252,547 | ||||||||||||||||||||||||||||||||
| Others | 30,912 | 5 | 30,917 | 0.0 | - | - | - | - | 30,917 | - | - | |||||||||||||||||||||||||||||||||
| PGBL/VGBL fund quotas | 79,779,392 | - | 79,779,392 | 46 | 79,779,392 | - | - | - | - | - | 70,689,225 | |||||||||||||||||||||||||||||||||
| Cotas de Fundos de PGBL / VGBL | 173,532,047 | (792,582 | ) | 172,739,465 | 100.0 | 83,712,903 | 187,524 | 7,726,017 | 16,683,017 | 35,488,031 | 28,941,973 | 156,835,230 | ||||||||||||||||||||||||||||||||
| % per maturity term | 48.4 | 0.1 | 4.5 | 9.7 | 20.5 | 16.8 | ||||||||||||||||||||||||||||||||||||||
| Total – 09/30/2012 | 156,144,500 | 690,730 | 156,835,230 | 100.0 | 72,903,654 | 339,744 | 2,845,008 | 7,768,649 | 21,106,806 | 51,871,369 | ||||||||||||||||||||||||||||||||||
| % per maturity term | 46.5 | 0.2 | 1.8 | 5.0 | 13.5 | 33.0 | ||||||||||||||||||||||||||||||||||||||
At September 30, 2013, ITAÚ UNIBANCO HOLDING’s portfolio is composed of Corporate Securities – Bank deposit certificates amounting to R$ 11,358,780 with maturity over 720 days (R$ 6,485,581 of Corporate securities - Bank deposit certificates at 09/30/2012 of which R$ 23,455 with maturity of 31 to 180 days and R$ 6,462,126 with maturity over 720 days).
d) Available-for-sale securities
See below the composition of the portfolio of available-for-sale securities by type, stated at cost and market value and by maturity term.
| 09/30/2013 | 09/30/2012 | |||||||||||||||||||||||||||||||||||||||||||
| Cost | Adjustments to market value (in stockholders' equity) | Market value | % | 0- 30 | 31- 90 | 91- 180 | 181- 365 | 366- 720 | Over 720 days | Market value | ||||||||||||||||||||||||||||||||||
| Government securities - domestic | 36,618,379 | (1,602,070 | ) | 35,016,309 | 41.7 | 18 | 171 | 521,122 | 8,341,512 | 143,568 | 26,009,918 | 22,760,125 | ||||||||||||||||||||||||||||||||
| Financial treasury bills | 1,024,777 | 223 | 1,025,000 | 1.2 | - | - | 460,339 | 213,508 | 6,627 | 344,526 | 3,013,389 | |||||||||||||||||||||||||||||||||
| National treasury bills | 8,167,715 | (114,535 | ) | 8,053,180 | 9.6 | - | - | - | 8,053,180 | - | - | - | ||||||||||||||||||||||||||||||||
| National treasury notes | 8,382,345 | (517,038 | ) | 7,865,307 | 9.4 | 18 | 171 | 7,116 | 921 | 101,510 | 7,755,571 | 5,057,555 | ||||||||||||||||||||||||||||||||
| National treasury/securitization | 274,065 | (3,838 | ) | 270,227 | 0.3 | - | - | - | - | - | 270,227 | 304,531 | ||||||||||||||||||||||||||||||||
| Brazilian external debt bonds | 18,769,477 | (966,882 | ) | 17,802,595 | 21.2 | - | - | 53,667 | 73,903 | 35,431 | 17,639,594 | 14,384,155 | ||||||||||||||||||||||||||||||||
| Other | - | - | - | 0.0 | - | - | - | - | - | - | 495 | |||||||||||||||||||||||||||||||||
| Government securities - abroad | 8,126,950 | (77,276 | ) | 8,049,674 | 9.7 | 56,660 | 1,312,021 | 1,902,205 | 221,122 | 3,781,882 | 775,784 | 6,395,283 | ||||||||||||||||||||||||||||||||
| Denmark | 2,979,908 | - | 2,979,908 | 3.6 | - | 832,425 | 1,125,747 | - | 1,021,736 | - | 1,721,478 | |||||||||||||||||||||||||||||||||
| Korea | 2,455,010 | - | 2,455,010 | 2.9 | - | - | - | - | 2,455,010 | - | 1,672,080 | |||||||||||||||||||||||||||||||||
| Chile | 919,892 | 1,431 | 921,323 | 1.1 | 41,306 | 337,441 | 496,781 | 22,897 | 19,411 | 3,487 | 1,805,201 | |||||||||||||||||||||||||||||||||
| Paraguay | 596,168 | (51,072 | ) | 545,096 | 0.7 | 10,475 | 141,628 | 104,487 | 73,807 | 101,694 | 113,005 | 287,305 | ||||||||||||||||||||||||||||||||
| Uruguay | 401,323 | (20,023 | ) | 381,300 | 0.5 | 4,879 | 527 | 82,598 | 107,062 | 119,302 | 66,932 | 302,323 | ||||||||||||||||||||||||||||||||
| United States | 476,772 | (6,787 | ) | 469,985 | 0.6 | - | - | 92,592 | 17,356 | - | 360,037 | 511,495 | ||||||||||||||||||||||||||||||||
| Belgium | 118,214 | 415 | 118,629 | 0.1 | - | - | - | - | 49,082 | 69,547 | 68,138 | |||||||||||||||||||||||||||||||||
| France | 83,901 | 415 | 84,316 | 0.1 | - | - | - | - | 15,620 | 68,696 | 27,028 | |||||||||||||||||||||||||||||||||
| Netherlands | 58,452 | (356 | ) | 58,096 | 0.1 | - | - | - | - | - | 58,096 | - | ||||||||||||||||||||||||||||||||
| Germany | 31,091 | (1,045 | ) | 30,046 | 0.0 | - | - | - | - | - | 30,046 | - | ||||||||||||||||||||||||||||||||
| Other | 6,219 | (254 | ) | 5,965 | 0.0 | - | - | - | - | 27 | 5,938 | 235 | ||||||||||||||||||||||||||||||||
| Corporate securities | 40,431,733 | 300,473 | 40,732,206 | 48.6 | 2,133,903 | 905,274 | 1,565,374 | 6,207,416 | 6,898,463 | 23,021,776 | 34,357,393 | |||||||||||||||||||||||||||||||||
| Eurobonds and other | 3,924,514 | 103,477 | 4,027,991 | 4.9 | 25,293 | 59,606 | 69,187 | 269,034 | 937,172 | 2,667,699 | 5,300,959 | |||||||||||||||||||||||||||||||||
| Bank deposit certificate | 1,698,005 | (1,173 | ) | 1,696,832 | 2.0 | 401,708 | 178,763 | 399,891 | 716,470 | - | - | 448,777 | ||||||||||||||||||||||||||||||||
| Shares | 1,214,205 | 17,997 | 1,232,202 | 1.5 | 1,232,202 | - | - | - | - | - | 2,097,088 | |||||||||||||||||||||||||||||||||
| Debentures | 14,038,228 | 299,655 | 14,337,883 | 17.1 | - | 160,917 | 357,314 | 945,108 | 355,896 | 12,518,648 | 10,610,272 | |||||||||||||||||||||||||||||||||
| Promissory notes | 1,171,703 | (6,522 | ) | 1,165,181 | 1.4 | 106,906 | 349,368 | 309,268 | 399,639 | - | - | 1,375,805 | ||||||||||||||||||||||||||||||||
| Rural product note | 655,924 | (18,503 | ) | 637,421 | 0.8 | 95,792 | 32,510 | 78,162 | 103,504 | 36,749 | 290,704 | 797,143 | ||||||||||||||||||||||||||||||||
| Fund quotas | 220,444 | 6,143 | 226,587 | 0.2 | 222,316 | - | - | - | 4,271 | - | 872,935 | |||||||||||||||||||||||||||||||||
| Fixed income | 17,377 | (8 | ) | 17,369 | 0.0 | 13,098 | - | - | - | 4,271 | - | 27,979 | ||||||||||||||||||||||||||||||||
| Credit rights | 168,733 | - | 168,733 | 0.2 | 168,733 | - | - | - | - | - | 807,608 | |||||||||||||||||||||||||||||||||
| Variable income | 34,334 | 6,151 | 40,485 | 0.0 | 40,485 | - | - | - | - | - | 37,348 | |||||||||||||||||||||||||||||||||
| Securitized real estate loans | 8,900,874 | (92,590 | ) | 8,808,284 | 10.5 | 49,686 | 61,799 | 122,984 | 666,957 | 775,376 | 7,131,482 | 8,667,122 | ||||||||||||||||||||||||||||||||
| Financial nills | 7,991,812 | (2,877 | ) | 7,988,935 | 9.5 | - | 62,311 | 223,301 | 3,106,704 | 4,596,619 | - | 3,936,914 | ||||||||||||||||||||||||||||||||
| Other | 616,024 | (5,134 | ) | 610,890 | 0.7 | - | - | 5,267 | - | 192,380 | 413,243 | 250,378 | ||||||||||||||||||||||||||||||||
| Total | 85,177,062 | (1,378,873 | ) | 83,798,189 | 100.0 | 2,190,581 | 2,217,466 | 3,988,701 | 14,770,050 | 10,823,913 | 49,807,478 | 63,512,801 | ||||||||||||||||||||||||||||||||
| Adjustments of securities reclassified in prior years to the held-to-maturity category | 9,032 | 2.6 | 2.6 | 4.8 | 17.6 | 12.9 | 59.4 | |||||||||||||||||||||||||||||||||||||
| Deferred taxes | 508,592 | |||||||||||||||||||||||||||||||||||||||||||
| Minority interest in subsidiaries | 2,223 | |||||||||||||||||||||||||||||||||||||||||||
| Accounting adjustment - hedge - Circular No. 3,082 | 29,075 | |||||||||||||||||||||||||||||||||||||||||||
| Others | 14,500 | |||||||||||||||||||||||||||||||||||||||||||
| Adjustment to market value – securities – 09/30/2013 | (815,451 | ) | ||||||||||||||||||||||||||||||||||||||||||
| Total – 09/30/2012 | 61,081,416 | 2,431,385 | 63,512,801 | 100.0 | 4,565,108 | 1,962,358 | 5,696,073 | 5,190,248 | 6,472,215 | 39,626,799 | ||||||||||||||||||||||||||||||||||
| Adjustments of securities reclassified in prior years to the held-to-maturity category | 10,042 | 7.2 | 3.1 | 9.0 | 8.2 | 10.2 | 62.4 | |||||||||||||||||||||||||||||||||||||
| Accounting adjustment - hedge - Circular No. 3,082 | (424,811 | ) | ||||||||||||||||||||||||||||||||||||||||||
| Deferred taxes | (827,295 | ) | ||||||||||||||||||||||||||||||||||||||||||
| Adjustments of securities of unconsolidated affiliates | 399 | |||||||||||||||||||||||||||||||||||||||||||
| Adjustment to market value – securities – 09/30/2012 | 1,189,720 | |||||||||||||||||||||||||||||||||||||||||||
e) Held-to-maturity securities
See below the composition of the portfolio of held-to-maturity securities by type, stated at cost and by maturity term. Included in the carrying value at Setember 30, 2013, not considered in results, are the amounts of R$ 9,032 (R$ 10,042 at 09/30/2012) relating to the market adjustment of the reclassified securities at December 31, 2003. Securities classified under this type, if stated at market value, would present a positive adjustment of R$ 742,646 (R$ 1,192,772 at 09/30/2012).
| 09/30/2013 | 09/30/2012 | |||||||||||||||||||||||||||||||||||
| Carrying value | % | 0 - 30 | 31 - 90 | 91 - 180 | 181 - 365 | 366 - 720 | Over 720 days | Carrying value | ||||||||||||||||||||||||||||
| Government securities - domestic | 3,635,383 | 98.0 | - | - | - | - | 46,859 | 3,588,524 | 3,089,395 | |||||||||||||||||||||||||||
| National treasury notes(*) | 3,635,383 | 98.0 | - | - | - | - | 46,859 | 3,588,524 | 2,969,485 | |||||||||||||||||||||||||||
| Brazilian external debt bonds | - | 0.0 | - | - | - | - | - | - | 119,910 | |||||||||||||||||||||||||||
| Government securities - abroad | 21,224 | 0.6 | - | - | - | - | 12,978 | 8,246 | 19,547 | |||||||||||||||||||||||||||
| Uruguay | 21,213 | 0.6 | - | - | - | - | 12,978 | 8,235 | 19,332.00 | |||||||||||||||||||||||||||
| Other | 11 | 0.0 | - | - | - | - | - | 11 | 215 | |||||||||||||||||||||||||||
| Corporate securities | 52,642 | 1.4 | 52,108 | - | - | - | - | 534 | 54,463 | |||||||||||||||||||||||||||
| Eurobonds and other | 52,642 | 1.4 | 52,108 | - | - | - | - | 534 | 51,475 | |||||||||||||||||||||||||||
| Debentures (*) | - | - | - | - | - | - | - | - | 372 | |||||||||||||||||||||||||||
| Securitized real estate loans (*) | - | - | - | - | - | - | - | - | 2,616 | |||||||||||||||||||||||||||
| Total | 3,709,249 | 100.0 | 52,108 | - | - | - | 59,837 | 3,597,304 | 3,163,405 | |||||||||||||||||||||||||||
| % per maturity term | 1.4 | - | 0.0 | 0.0 | 1.6 | 97.0 | ||||||||||||||||||||||||||||||
| Total – 09/30/2012 | 3,163,405 | 100.0 | 1,666 | 372 | 2,821 | 142,116 | 46,143 | 2,970,287 | ||||||||||||||||||||||||||||
| % per maturity term | 0.0 | 0.0 | 0.1 | 4.5 | 1.5 | 93.9 | ||||||||||||||||||||||||||||||
| (*) | Includes investments of Itaú Vida e Previdência S.A. in the amount of R$ 2,225,135 (R$ 2,129,305 at 09/30/2012). |
| f) | Reclassification of securities (article 5 of BACEN Circular No. 3,068, of 11/08/2001) |
Management sets forth guidelines to classify securities. The classification of the current portfolio of securities, as well as the securities purchased in the period, is periodically and systematically evaluated based on such guidelines.
As set forth in Article 5 of BACEN Circular No. 3,068, of November 8, 2001, the revaluation regarding the classification of securities can only be made upon preparation of trial balances for six-month periods. In addition, the transfer from “held-to-maturity” to the other categories can only occur in view of an isolated, unusual, nonrecurring and unexpected event, which has occurred after the classification date.
No reclassifications or changes to the existing guidelines have been made in the period.
g) Derivative financial Instruments
The globalization of the markets in recent years has resulted in a high level of sophistication in the financial products used. As a result of this process, there has been an increasing demand for derivative financial instruments to manage market risks, mainly arising from fluctuations in interest and exchange rates, commodities and other asset prices. Accordingly, ITAU UNIBANCO HOLDING and its subsidiaries operate in the derivative markets for meeting the growing needs of their clients, as well as carrying out their risk management policy. Such policy is based on the use of derivative instruments to minimize the risks resulting from commercial and financial operations.
The derivative financial instruments’ business with clients is carried out after the approval of credit limits. The process of limit approval takes into consideration potential stress scenarios.
Knowing the client, the sector in which it operates and its risk appetite profile, in addition to providing information on the risks involved in the transaction and the negotiated conditions, ensures transparency in the relationship between the parties and the supply of a product that better meets the needs of the client.
The derivative transactions carried out by ITAÚ UNIBANCO HOLDING and its subsidiaries with clients are neutralized in order to eliminate market risks.
The derivative contracts traded by the institution with clients in Brazil are swap, forward, option and futures contracts, which are registered at the BM&FBOVESPA or at the CETIP S.A. OTC Clearing House (CETIP). Overseas transactions are carried out with futures, forwards (onshore), options and swaps with registration mainly in the Chicago, New York and London Exchanges. It should be emphasized that there are over-the-counter operations, but their risks are low as compared to the institutions’ total. Noteworthy is also the fact that there are no structured operations based on subprime assets and all operations are based on risk factors traded at stock exchanges.
The main risk factors of the derivatives, assumed at September 30, 2013, were related to the foreign exchange rate, interest rate, commodities, U.S. dollar coupon, Reference Rate coupon, Libor and variable income. The management of these and other market risk factors is supported by sophisticated statistical and deterministic models. Based on this management model, the institution, with the use of transactions involving derivatives, has been able to optimize the risk-return ratios, even under highly volatile situations.
Most derivatives included in the institution’s portfolio are traded at stock exchanges. The prices disclosed by stock exchanges are used for these derivatives, except in cases in which the low representativeness of price due to liquidity of a specific contract is identified. Derivatives typically precified like this are futures contracts. Likewise, there are other instruments whose quotations (fair prices) are directly disclosed by independent institutions and which are precified based on this direct information. A great part of the Brazilian government securities, highly-liquid international (public and private) securities and shares fit into this situation.
For derivatives whose prices are not directly disclosed by stock exchanges, fair prices are obtained by pricing models which use market information, deducted based on prices disclosed for higher liquidity assets. Interest and market volatility curves which provide entry data for the models are extracted from those prices. Over- the-counter derivatives, forward contracts and securities without much liquidity are in this situation.
The total value of margins pledged in guarantee was R$ 4,858,968 (R$ 3,416,789 at September 30, 2012) and was basically composed of government securities.
I - Derivatives by index
| Memorandum account Notional amount | Balance sheet account receivable / (received) (payable) paid | Adjustment to market value (in results / stockholders' equity) | Market value | |||||||||||||||||||||
| 09/30/2013 | 09/30/2012 | 09/30/2013 | 09/30/2013 | 09/30/2013 | 09/30/2012 | |||||||||||||||||||
| Futures contracts | 351,331,473 | 430,314,716 | 224,835 | 33,354 | 258,189 | (95,671 | ) | |||||||||||||||||
| Purchase commitments | 99,848,103 | 195,443,460 | (336,876 | ) | 83,215 | (253,661 | ) | (15,715 | ) | |||||||||||||||
| Foreign currency | 8,762,348 | 9,049,308 | (87,242 | ) | 83,823 | (3,419 | ) | 6,830 | ||||||||||||||||
| Interbank market | 63,906,427 | 163,059,568 | (27,796 | ) | (1,014 | ) | (28,810 | ) | (15,940 | ) | ||||||||||||||
| Indexes | 20,143,266 | 19,035,959 | (221,457 | ) | 406 | (221,051 | ) | (6,406 | ) | |||||||||||||||
| Securities | 6,817,543 | 3,860,877 | (156 | ) | - | (156 | ) | 56 | ||||||||||||||||
| Commodities | 214,072 | 433,258 | (225 | ) | - | (225 | ) | (255 | ) | |||||||||||||||
| Other | 4,447 | 4,490 | - | - | - | - | ||||||||||||||||||
| Commitments to sell | 251,483,370 | 234,871,256 | 561,711 | (49,861 | ) | 511,850 | (79,956 | ) | ||||||||||||||||
| Foreign currency | 73,492,433 | 51,634,452 | 112,095 | (47,835 | ) | 64,260 | (71,118 | ) | ||||||||||||||||
| Interbank market | 142,196,630 | 147,528,216 | 42,558 | 1,760 | 44,318 | 4,566 | ||||||||||||||||||
| Fixed rates | 79,834 | - | - | (1,289 | ) | (1,289 | ) | - | ||||||||||||||||
| Indexes | 28,879,501 | 29,203,325 | 406,980 | (2,409 | ) | 404,571 | (11,813 | ) | ||||||||||||||||
| Securities | 6,796,942 | 5,984,049 | - | (88 | ) | (88 | ) | (128 | ) | |||||||||||||||
| Commodities | 38,030 | 518,330 | 78 | - | 78 | (1,463 | ) | |||||||||||||||||
| Other | - | 2,884 | - | - | - | - | ||||||||||||||||||
| Swap contracts | (997,997 | ) | 340,808 | (657,189 | ) | (926,170 | ) | |||||||||||||||||
| Asset position | 162,589,965 | 123,300,649 | 2,245,840 | 1,774,157 | 4,019,997 | 3,497,304 | ||||||||||||||||||
| Foreign currency | 11,137,655 | 13,245,593 | 807,351 | 214,741 | 1,022,092 | 721,048 | ||||||||||||||||||
| Interbank market | 55,011,617 | 43,896,180 | 186,251 | 575,184 | 761,435 | 394,129 | ||||||||||||||||||
| Fixed rates | 54,197,010 | 33,772,668 | 392,054 | 639,254 | 1,031,308 | 720,637 | ||||||||||||||||||
| Floating rate | 2,024,063 | 4,060,415 | 46,214 | 35,937 | 82,151 | 13,962 | ||||||||||||||||||
| Indexes | 39,960,077 | 27,745,017 | 813,845 | 305,785 | 1,119,630 | 1,577,268 | ||||||||||||||||||
| Securities | 255,736 | 576,751 | 18 | 1,238 | 1,256 | 66,907 | ||||||||||||||||||
| Commodities | 3,176 | 3,980 | 61 | 174 | 235 | 43 | ||||||||||||||||||
| Other | 631 | 45 | 46 | 1,844 | 1,890 | 3,310 | ||||||||||||||||||
| Liability position | 163,587,962 | 123,696,153 | (3,243,837 | ) | (1,433,349 | ) | (4,677,186 | ) | (4,423,474 | ) | ||||||||||||||
| Foreign currency | 18,768,161 | 18,499,605 | (1,123,356 | ) | (112,697 | ) | (1,236,053 | ) | (1,117,780 | ) | ||||||||||||||
| Interbank market | 46,739,505 | 26,893,936 | 9,265 | (498,515 | ) | (489,250 | ) | (91,572 | ) | |||||||||||||||
| Fixed rates | 50,415,256 | 36,746,908 | (634,947 | ) | (511,218 | ) | (1,146,165 | ) | (967,164 | ) | ||||||||||||||
| Floating rate | 3,979,254 | 6,174,979 | (54,746 | ) | (76,490 | ) | (131,236 | ) | (66,415 | ) | ||||||||||||||
| Indexes | 43,384,342 | 34,788,265 | (1,329,497 | ) | (261,826 | ) | (1,591,323 | ) | (2,100,682 | ) | ||||||||||||||
| Securities | 136,490 | 510,580 | (94,799 | ) | 21,149 | (73,650 | ) | (79,189 | ) | |||||||||||||||
| Commodities | 14,665 | 52,776 | (72 | ) | 4 | (68 | ) | (672 | ) | |||||||||||||||
| Other | 150,289 | 29,104 | (15,685 | ) | 6,244 | (9,441 | ) | - | ||||||||||||||||
| Option contracts | 994,969,349 | 1,402,563,048 | 1,078,385 | (106,625 | ) | 971,760 | 585,918 | |||||||||||||||||
| Purchase commitments - long position | 153,656,502 | 376,144,694 | 1,184,388 | (105,881 | ) | 1,078,507 | 308,932 | |||||||||||||||||
| Foreign currency | 24,124,300 | 18,257,149 | 837,475 | (206,099 | ) | 631,376 | 146,478 | |||||||||||||||||
| Interbank market | 17,986,129 | 60,637,492 | 39,289 | 45,479 | 84,768 | 5,935 | ||||||||||||||||||
| Floating rate | 91,297 | 271,663 | 1,124 | (1,120 | ) | 4 | 37 | |||||||||||||||||
| Indexes | 109,269,123 | 295,681,221 | 237,538 | 5,035 | 242,573 | 84,351 | ||||||||||||||||||
| Securities | 967,606 | 644,996 | 52,862 | 47,072 | 99,934 | 53,367 | ||||||||||||||||||
| Commodities | 1,149,169 | 577,074 | 15,670 | 854 | 16,524 | 14,886 | ||||||||||||||||||
| Other | 68,878 | 75,099 | 430 | 2,898 | 3,328 | 3,878 | ||||||||||||||||||
| Commitments to sell - long position | 367,193,261 | 373,375,184 | 1,571,452 | (48,982 | ) | 1,522,470 | 2,034,050 | |||||||||||||||||
| Foreign currency | 15,452,557 | 8,365,688 | 247,066 | 57,367 | 304,433 | 104,022 | ||||||||||||||||||
| Interbank market | 20,239,378 | 43,647,368 | 27,490 | (16,852 | ) | 10,638 | 142,438 | |||||||||||||||||
| Floating rate | 588,363 | 951,336 | 1,182 | (574 | ) | 608 | 1,211 | |||||||||||||||||
| Indexes | 326,804,783 | 315,525,306 | 260,026 | (181,285 | ) | 78,741 | 730,089 | |||||||||||||||||
| Securities | 3,672,596 | 3,208,066 | 1,025,220 | 87,931 | 1,113,151 | 1,035,134 | ||||||||||||||||||
| Commodities | 379,896 | 1,523,149 | 8,260 | 1,745 | 10,005 | 7,563 | ||||||||||||||||||
| Other | 55,688 | 154,271 | 2,208 | 2,686 | 4,894 | 13,593 | ||||||||||||||||||
| Purchase commitments - short position | 110,743,570 | 188,042,007 | (1,076,499 | ) | (48,677 | ) | (1,125,176 | ) | (416,349 | ) | ||||||||||||||
| Foreign currency | 20,955,046 | 8,827,921 | (883,890 | ) | 193,073 | (690,817 | ) | (196,206 | ) | |||||||||||||||
| Interbank market | 6,210,780 | 32,185,649 | (22,341 | ) | (39,352 | ) | (61,693 | ) | (12,358 | ) | ||||||||||||||
| Indexes | 82,656,632 | 146,217,473 | (152,830 | ) | (172,506 | ) | (325,336 | ) | (135,397 | ) | ||||||||||||||
| Securities | 718,236 | 581,395 | (10,976 | ) | (27,284 | ) | (38,260 | ) | (56,352 | ) | ||||||||||||||
| Commodities | 133,998 | 154,470 | (6,032 | ) | 290 | (5,742 | ) | (12,158 | ) | |||||||||||||||
| Other | 68,878 | 75,099 | (430 | ) | (2,898 | ) | (3,328 | ) | (3,878 | ) | ||||||||||||||
| Commitments to sell - short position | 363,376,016 | 465,001,163 | (600,956 | ) | 96,915 | (504,041 | ) | (1,340,715 | ) | |||||||||||||||
| Foreign currency | 11,465,182 | 6,655,222 | (206,526 | ) | 38,668 | (167,858 | ) | (74,120 | ) | |||||||||||||||
| Interbank market | 40,503,911 | 94,627,703 | (76,361 | ) | 53,409 | (22,952 | ) | (209,515 | ) | |||||||||||||||
| Floating rate | - | - | - | (82 | ) | (82 | ) | 149 | ||||||||||||||||
| Indexes | 309,211,098 | 361,744,748 | (172,785 | ) | 58,833 | (113,952 | ) | (795,491 | ) | |||||||||||||||
| Securities | 1,808,792 | 1,632,838 | (134,771 | ) | (48,527 | ) | (183,298 | ) | (240,309 | ) | ||||||||||||||
| Commodities | 333,575 | 186,482 | (8,305 | ) | (2,700 | ) | (11,005 | ) | (7,836 | ) | ||||||||||||||
| Other | 53,458 | 154,170 | (2,208 | ) | (2,686 | ) | (4,894 | ) | (13,593 | ) | ||||||||||||||
| Forward contracts | 43,170,928 | 14,800,773 | 1,381,284 | 46,925 | 1,428,209 | 1,253,371 | ||||||||||||||||||
| Purchases receivable | 9,121,204 | 5,214,283 | 1,093,146 | 57,596 | 1,150,742 | 970,332 | ||||||||||||||||||
| Foreign currency | 8,348,026 | 4,483,203 | 365,235 | 57,681 | 422,916 | 262,516 | ||||||||||||||||||
| Fixed rates | 271,103 | 277,822 | 271,028 | - | 271,028 | 277,792 | ||||||||||||||||||
| Floating rate | 454,822 | 429,495 | 455,132 | - | 455,132 | 429,195 | ||||||||||||||||||
| Securities | - | 8 | - | - | - | 8 | ||||||||||||||||||
| Commodities | 47,253 | 23,710 | 1,751 | (85 | ) | 1,666 | 778 | |||||||||||||||||
| Other | - | 45 | - | - | - | 43 | ||||||||||||||||||
| Purchases payable | 5,539,214 | 2,864,403 | (930,757 | ) | 3,002 | (927,755 | ) | (746,705 | ) | |||||||||||||||
| Foreign currency | 5,459,193 | 2,786,712 | (198,155 | ) | 2,537 | (195,618 | ) | (34,139 | ) | |||||||||||||||
| Fixed rates | - | - | (271,028 | ) | - | (271,028 | ) | (277,792 | ) | |||||||||||||||
| Floating rate | - | - | (455,132 | ) | - | (455,132 | ) | (429,195 | ) | |||||||||||||||
| Securities | - | - | - | - | - | (8 | ) | |||||||||||||||||
| Commodities | 80,021 | 77,691 | (6,442 | ) | 465 | (5,977 | ) | (5,571 | ) | |||||||||||||||
| Sales receivable | 11,620,556 | 4,067,968 | 2,174,824 | 7,999 | 2,182,823 | 1,616,145 | ||||||||||||||||||
| Foreign currency | 6,762,091 | 2,420,794 | 327,958 | 9,207 | 337,165 | 22,319 | ||||||||||||||||||
| Interbank market | 2,950,451 | 8,558 | 1,054 | 416 | 1,470 | 8,488 | ||||||||||||||||||
| Fixed rates | 385,661 | 284,881 | 385,712 | (882 | ) | 384,830 | 284,533 | |||||||||||||||||
| Floating rate | 321,626 | 260,059 | 321,632 | - | 321,632 | 259,961 | ||||||||||||||||||
| Indexes | 163 | 2,176 | 159 | - | 159 | 2,147 | ||||||||||||||||||
| Securities | 1,155,186 | 1,044,492 | 1,130,509 | (140 | ) | 1,130,369 | 1,035,123 | |||||||||||||||||
| Commodities | 45,378 | 47,008 | 7,800 | (602 | ) | 7,198 | 3,574 | |||||||||||||||||
| Sales deliverable | 16,889,954 | 2,654,119 | (955,929 | ) | (21,672 | ) | (977,601 | ) | (586,401 | ) | ||||||||||||||
| Foreign currency | 5,835,097 | 2,578,707 | (297,278 | ) | (21,998 | ) | (319,276 | ) | (73,902 | ) | ||||||||||||||
| Interbank market | 11,049,372 | - | - | (2,595 | ) | (2,595 | ) | - | ||||||||||||||||
| Fixed rates | - | - | (333,926 | ) | - | (333,926 | ) | (250,361 | ) | |||||||||||||||
| Floating rate | - | - | (321,632 | ) | - | (321,632 | ) | (259,961 | ) | |||||||||||||||
| Securities | - | - | - | - | - | (67 | ) | |||||||||||||||||
| Commodities | 5,485 | 75,412 | (3,093 | ) | 2,921 | (172 | ) | (2,110 | ) | |||||||||||||||
| Memorandum account / Notional amount | Balance sheet account receivable / (received) (payable) / paid | Adjustments to market value (in results / stockholders' equity) | Market value | |||||||||||||||||||||
| 09/30/2013 | 09/30/2012 | 09/30/2013 | 09/30/2013 | 09/30/2013 | 09/30/2012 | |||||||||||||||||||
| Credit derivatives | 15,713,517 | 5,964,119 | 101,570 | 7,605 | 109,175 | 522,755 | ||||||||||||||||||
| Asset position | 8,040,315 | 2,060,742 | 338,349 | 37,589 | 375,938 | 606,803 | ||||||||||||||||||
| Fixed rate | 7,374,833 | 1,215,923 | 338,003 | 29,203 | 367,206 | 601,318 | ||||||||||||||||||
| Securities | 478,639 | 621,404 | 213 | 5,722 | 5,935 | 3,397 | ||||||||||||||||||
| Other | 186,843 | 223,415 | 133 | 2,664 | 2,797 | 2,088 | ||||||||||||||||||
| Liability position | 7,673,202 | 3,903,377 | (236,779 | ) | (29,984 | ) | (266,763 | ) | (84,048 | ) | ||||||||||||||
| Fixed rate | 6,417,940 | 3,512,938 | (237,106 | ) | 13,229 | (223,877 | ) | (71,191 | ) | |||||||||||||||
| Securities | 1,242,194 | 306,186 | 324 | (42,746 | ) | (42,422 | ) | (12,171 | ) | |||||||||||||||
| Other | 13,068 | 84,253 | 3 | (467 | ) | (464 | ) | (686 | ) | |||||||||||||||
| Forwards operations | 40,591,382 | 35,958,421 | 104,247 | 46,842 | 151,089 | 51,647 | ||||||||||||||||||
| Asset position | 21,435,785 | 18,693,858 | 361,504 | 38,221 | 399,725 | 388,395 | ||||||||||||||||||
| Foreign currency | 21,254,986 | 18,269,420 | 356,038 | 38,221 | 394,259 | 379,789 | ||||||||||||||||||
| Interbank market | 15,893 | - | 194 | - | 194 | - | ||||||||||||||||||
| Floating rate | - | 407,136 | - | - | - | 7,587 | ||||||||||||||||||
| Indexes | 161,305 | 17,302 | 5,093 | - | 5,093 | 1,019 | ||||||||||||||||||
| Securities | 3,601 | - | 179 | - | 179 | - | ||||||||||||||||||
| Liability position | 19,155,597 | 17,264,563 | (257,257 | ) | 8,621 | (248,636 | ) | (336,748 | ) | |||||||||||||||
| Foreign currency | 19,150,261 | 17,249,108 | (257,244 | ) | 8,621 | (248,623 | ) | (336,274 | ) | |||||||||||||||
| Interbank market | - | 13,985 | - | - | - | (472 | ) | |||||||||||||||||
| Indexes | 5,336 | 1,470 | (13 | ) | - | (13 | ) | (2 | ) | |||||||||||||||
| Swap with target flow | 1,598,736 | 1,084,705 | (69,416 | ) | (38,438 | ) | (107,854 | ) | (33,101 | ) | ||||||||||||||
| Asset position | 764,660 | 541,791 | - | - | - | - | ||||||||||||||||||
| Interbank market | 764,660 | 530,730 | - | - | - | - | ||||||||||||||||||
| Fixed rate | - | 11,061 | - | - | - | - | ||||||||||||||||||
| Liability position | 834,076 | 542,914 | (69,416 | ) | (38,438 | ) | (107,854 | ) | (33,101 | ) | ||||||||||||||
| Foreign currency | 767,877 | 465,652 | (69,076 | ) | (37,460 | ) | (106,536 | ) | (31,016 | ) | ||||||||||||||
| Interbank market | 66,199 | 66,192 | (340 | ) | (978 | ) | (1,318 | ) | (1,937 | ) | ||||||||||||||
| Target flow of swap - asset position - foreign currency | 843,325 | 549,661 | - | 71,467 | 71,467 | 38,012 | ||||||||||||||||||
| Other derivative financial instruments | 7,068,672 | 7,194,755 | 388,895 | 44,061 | 432,956 | 522,807 | ||||||||||||||||||
| Asset position | 5,971,305 | 5,912,247 | 734,043 | 69,081 | 803,124 | 1,584,981 | ||||||||||||||||||
| Foreign currency | 608,225 | 709,889 | 28,821 | 6,404 | 35,225 | 219,434 | ||||||||||||||||||
| Fixed rate | 1,463,604 | 1,622,896 | 390,310 | 21,372 | 411,682 | 812,898 | ||||||||||||||||||
| Securities | 3,864,331 | 3,212,798 | 314,944 | 40,388 | 355,332 | 298,157 | ||||||||||||||||||
| Other | 35,145 | 82,939 | (32 | ) | 917 | 885 | 585 | |||||||||||||||||
| Liability position | 1,097,367 | 1,282,508 | (345,148 | ) | (25,020 | ) | (370,168 | ) | (1,062,174 | ) | ||||||||||||||
| Foreign currency | 404,506 | 319,013 | (6,856 | ) | (17,012 | ) | (23,868 | ) | (109,282 | ) | ||||||||||||||
| Fixed rate | - | - | (312,074 | ) | (1,302 | ) | (313,376 | ) | (610,967 | ) | ||||||||||||||
| Securities | 528,095 | 738,069 | (26,133 | ) | (4,969 | ) | (31,102 | ) | (52,959 | ) | ||||||||||||||
| Other | 164,766 | 225,426 | (85 | ) | (1,737 | ) | (1,822 | ) | (2,152 | ) | ||||||||||||||
| Asset | 9,928,381 | 1,934,601 | 11,862,982 | 11,044,954 | ||||||||||||||||||||
| Liabilities | (7,716,578 | ) | (1,488,602 | ) | (9,205,180 | ) | (9,125,386 | ) | ||||||||||||||||
| Total | 2,211,803 | 445,999 | 2,657,802 | 1,919,568 | ||||||||||||||||||||
| Derivative contracts mature as follows (in days): | ||||||||||||||||||||||||
| Memorandum account/notional amount | 0 - 30 | 31 - 180 | 181 - 365 | Over 365 | 09/30/2013 | 09/30/2012 | ||||||||||||||||||
| Futures | 47,077,927 | 132,049,343 | 53,106,470 | 119,097,733 | 351,331,473 | 430,314,716 | ||||||||||||||||||
| Swaps | 4,462,023 | 22,064,110 | 23,648,021 | 110,169,971 | 160,344,125 | 121,207,347 | ||||||||||||||||||
| Options | 71,338,392 | 877,085,556 | 31,544,462 | 15,000,939 | 994,969,349 | 1,402,563,048 | ||||||||||||||||||
| Forwards (onshore) | 10,187,055 | 22,922,855 | 5,867,354 | 4,193,664 | 43,170,928 | 14,800,773 | ||||||||||||||||||
| Credit derivatives | 244,185 | 1,346,436 | 546,187 | 13,576,709 | 15,713,517 | 5,964,119 | ||||||||||||||||||
| Forwards (offshore) | 12,780,549 | 18,488,965 | 7,229,519 | 2,092,349 | 40,591,382 | 35,958,421 | ||||||||||||||||||
| Swaps with target flow | - | 14,325 | - | 750,335 | 764,660 | 541,791 | ||||||||||||||||||
| Target flow of swap | - | 17,840 | - | 825,485 | 843,325 | 549,661 | ||||||||||||||||||
| Other derivative financial instruments | 9,363 | 573,782 | 1,638,009 | 4,847,518 | 7,068,672 | 7,194,755 | ||||||||||||||||||
II - Derivatives by counterparty
See below the composition of the Derivative Financial Instruments portfolio (assets and liabilities) by type of instrument, stated at cost, market value, and maturity term.
| 09/30/2013 | 09/30/2012 | |||||||||||||||||||||||||||||||||||||||||||
| Cost | Adjustments to market value (in results / stockholders' equity) | Market value | % | 0 - 30 | 31 - 90 | 91 - 180 | 181 - 365 | 366- 720 | Over 720 days | Market value | ||||||||||||||||||||||||||||||||||
| Asset | ||||||||||||||||||||||||||||||||||||||||||||
| Futures - BM&F Bovespa | 224,835 | 33,354 | 258,189 | 2 | 101,108 | 78,570 | 13,664 | 31,180 | - | 33,667 | - | |||||||||||||||||||||||||||||||||
| Swaps - adjustment receivable | 2,245,840 | 1,774,157 | 4,019,997 | 33.8 | 93,672 | 303,987 | 587,636 | 303,479 | 837,803 | 1,893,420 | 3,497,304 | |||||||||||||||||||||||||||||||||
| BM&F Bovespa | 276,638 | 90,647 | 367,285 | 3.1 | 2,140 | 5,108 | 47,090 | 74,966 | 43,519 | 194,462 | 450,811 | |||||||||||||||||||||||||||||||||
| Financial institutions | 260,676 | 349,423 | 610,099 | 5.1 | 65,621 | 13,842 | 97,029 | 13,588 | 159,666 | 260,353 | 431,729 | |||||||||||||||||||||||||||||||||
| Companies | 1,675,749 | 1,089,597 | 2,765,346 | 23.3 | 24,763 | 279,336 | 438,626 | 204,346 | 448,619 | 1,369,656 | 2,572,774 | |||||||||||||||||||||||||||||||||
| Individuals | 32,777 | 244,490 | 277,267 | 2.3 | 1,148 | 5,701 | 4,891 | 10,579 | 185,999 | 68,949 | 41,990 | |||||||||||||||||||||||||||||||||
| Option premiums | 2,755,840 | (154,863 | ) | 2,600,977 | 21.9 | 229,833 | 293,207 | 423,333 | 492,060 | 1,057,704 | 104,840 | 2,342,982 | ||||||||||||||||||||||||||||||||
| BM&FBOVESPA | 2,185,940 | (320,547 | ) | 1,865,393 | 15.7 | 129,332 | 192,162 | 318,696 | 291,356 | 933,547 | 300 | 978,555 | ||||||||||||||||||||||||||||||||
| Financial institutions | 347,169 | 124,539 | 471,708 | 4.0 | 94,934 | 86,910 | 64,861 | 138,313 | 63,501 | 23,189 | 242,802 | |||||||||||||||||||||||||||||||||
| Companies | 222,634 | 41,228 | 263,862 | 2.2 | 5,567 | 14,135 | 39,762 | 62,391 | 60,656 | 81,351 | 1,121,625 | |||||||||||||||||||||||||||||||||
| Individuals | 97 | (83 | ) | 14 | 0.0 | - | - | 14 | - | - | - | - | ||||||||||||||||||||||||||||||||
| Forwards (onshore) | 3,267,970 | 65,595 | 3,333,565 | 28.1 | 1,810,672 | 725,460 | 319,901 | 274,080 | 108,019 | 95,433 | 2,586,477 | |||||||||||||||||||||||||||||||||
| BM&FBOVESPA | 1,183,904 | (603 | ) | 1,183,301 | 10.0 | 314,077 | 602,178 | 150,888 | 116,007 | 151 | - | 1,046,063 | ||||||||||||||||||||||||||||||||
| Financial institutions | 1,683,451 | 7,494 | 1,690,945 | 14.2 | 1,395,416 | 23,857 | 113,634 | 62,726 | 56,897 | 38,415 | 298,245 | |||||||||||||||||||||||||||||||||
| Companies | 399,287 | 58,297 | 457,584 | 3.9 | 101,179 | 99,425 | 54,745 | 95,347 | 49,870 | 57,018 | 1,241,187 | |||||||||||||||||||||||||||||||||
| Individuals | 1,328 | 407 | 1,735 | 0.0 | - | - | 634 | - | 1,101 | - | 982 | |||||||||||||||||||||||||||||||||
| Credit derivatives | 338,349 | 37,589 | 375,938 | 3.2 | - | 366,030 | 60 | 721 | 2,065 | 7,062 | 606,803 | |||||||||||||||||||||||||||||||||
| Financial institutions | 338,349 | 37,589 | 375,938 | 3.2 | - | 366,030 | 60 | 721 | 2,065 | 7,062 | 606,711 | |||||||||||||||||||||||||||||||||
| Companies | - | - | - | 0.0 | - | - | - | - | - | - | 92 | |||||||||||||||||||||||||||||||||
| Forwards (offshore) | 361,504 | 38,221 | 399,725 | 3.4 | 76,231 | 86,069 | 92,327 | 104,178 | 27,227 | 13,693 | 388,395 | |||||||||||||||||||||||||||||||||
| Financial institutions | 206,714 | 3,631 | 210,345 | 1.8 | 47,752 | 39,066 | 57,103 | 64,056 | 1,858 | 510 | 217,470 | |||||||||||||||||||||||||||||||||
| Companies | 145,726 | 32,945 | 178,671 | 1.5 | 27,768 | 41,401 | 34,491 | 36,462 | 25,366 | 13,183 | 170,670 | |||||||||||||||||||||||||||||||||
| Individuals | 9,064 | 1,645 | 10,709 | 0.1 | 711 | 5,602 | 733 | 3,660 | 3 | - | 255 | |||||||||||||||||||||||||||||||||
| Target flow of swap - companies | - | 71,467 | 71,467 | 0.6 | - | - | 170 | - | 4,137 | 67,160 | 38,012 | |||||||||||||||||||||||||||||||||
| Other derivative financial instruments | 734,043 | 69,081 | 803,124 | 6.8 | 26 | 1,917 | 5,509 | 325,330 | 100,683 | 369,659 | 1,584,981 | |||||||||||||||||||||||||||||||||
| BM&FBOVESPA | - | - | - | 0.0 | - | - | - | - | - | - | 83,198 | |||||||||||||||||||||||||||||||||
| Financial institutions | 508,431 | 35,781 | 544,212 | 4.6 | - | 1,768 | 183 | 298,116 | 36,740 | 207,405 | 779,460 | |||||||||||||||||||||||||||||||||
| Companies | 225,612 | 33,300 | 258,912 | 2.2 | 26 | 149 | 5,326 | 27,214 | 63,943 | 162,254 | 722,323 | |||||||||||||||||||||||||||||||||
| Total | 9,928,381 | 1,934,601 | 11,862,982 | 100.0 | 2,311,542 | 1,855,240 | 1,442,600 | 1,531,028 | 2,137,638 | 2,584,934 | 11,044,954 | |||||||||||||||||||||||||||||||||
| % per maturity term | 19.5 | 15.6 | 12.2 | 12.9 | 18.0 | 21.8 | ||||||||||||||||||||||||||||||||||||||
| Total at 09/30/2012 | 9,252,503 | 1,792,451 | 11,044,954 | 100.0 | 1,063,938 | 1,791,957 | 2,304,428 | 1,129,476 | 923,419 | 3,831,736 | ||||||||||||||||||||||||||||||||||
| % per maturity term | 9.6 | 16.2 | 20.9 | 10.2 | 8.4 | 34.7 | ||||||||||||||||||||||||||||||||||||||
| 09/30/2013 | 09/30/2012 | |||||||||||||||||||||||||||||||||||||||||||
| Cost | Adjustments to market value (in results / stockholders' equity) | Market value | % | 0 - 30 | 31 - 90 | 91 - 180 | 181 -365 | 366 - 720 | Over 720 days | Market value | ||||||||||||||||||||||||||||||||||
| Liabilities | ||||||||||||||||||||||||||||||||||||||||||||
| Futures | - | - | - | - | - | - | - | - | - | - | (95,671 | ) | ||||||||||||||||||||||||||||||||
| BM&FBovespa | - | - | - | - | - | - | - | - | - | - | (95,577 | ) | ||||||||||||||||||||||||||||||||
| Financial institutions | - | - | - | - | - | - | - | - | - | - | (65 | ) | ||||||||||||||||||||||||||||||||
| Companies | - | - | - | - | - | - | - | - | - | - | (29 | ) | ||||||||||||||||||||||||||||||||
| Swaps - difference payable | (3,243,837 | ) | (1,433,349 | ) | (4,677,186 | ) | 50.8 | (56,271 | ) | (193,328 | ) | (373,911 | ) | (660,357 | ) | (917,856 | ) | (2,475,463 | ) | (4,423,474 | ) | |||||||||||||||||||||||
| BM&FBovespa | (395,765 | ) | (138,809 | ) | (534,574 | ) | 5.8 | (11,529 | ) | (1,283 | ) | (81,043 | ) | (62,554 | ) | (163,397 | ) | (214,768 | ) | (734,128 | ) | |||||||||||||||||||||||
| Financial institutions | (417,678 | ) | (254,488 | ) | (672,166 | ) | 7.3 | (19,531 | ) | (13,924 | ) | (20,221 | ) | (38,451 | ) | (184,458 | ) | (395,581 | ) | (1,134,695 | ) | |||||||||||||||||||||||
| Companies | (2,100,177 | ) | (902,777 | ) | (3,002,954 | ) | 32.6 | (23,761 | ) | (172,503 | ) | (271,569 | ) | (558,709 | ) | (444,049 | ) | (1,532,363 | ) | (2,507,244 | ) | |||||||||||||||||||||||
| Individuals | (330,217 | ) | (137,275 | ) | (467,492 | ) | 5.1 | (1,450 | ) | (5,618 | ) | (1,078 | ) | (643 | ) | (125,952 | ) | (332,751 | ) | (47,407 | ) | |||||||||||||||||||||||
| Option premiums | (1,677,455 | ) | 48,238 | (1,629,217 | ) | 17.7 | (134,875 | ) | (230,069 | ) | (451,099 | ) | (484,761 | ) | (216,042 | ) | (112,371 | ) | (1,757,064 | ) | ||||||||||||||||||||||||
| BM&FBovespa | (1,067,470 | ) | 118,986 | (948,484 | ) | 10.3 | (83,964 | ) | (153,023 | ) | (344,732 | ) | (305,493 | ) | (61,272 | ) | - | (1,161,257 | ) | |||||||||||||||||||||||||
| Financial institutions | (553,054 | ) | (1,343 | ) | (554,397 | ) | 6.0 | (48,752 | ) | (70,812 | ) | (89,675 | ) | (139,670 | ) | (116,128 | ) | (89,360 | ) | (456,335 | ) | |||||||||||||||||||||||
| Companies | (56,630 | ) | (69,600 | ) | (126,230 | ) | 1.4 | (2,159 | ) | (6,223 | ) | (16,597 | ) | (39,598 | ) | (38,642 | ) | (23,011 | ) | (139,472 | ) | |||||||||||||||||||||||
| Individuals | (301 | ) | 195 | (106 | ) | - | - | (11 | ) | (95 | ) | - | - | - | - | |||||||||||||||||||||||||||||
| Forwards (onshore) | (1,886,686 | ) | (18,670 | ) | (1,905,356 | ) | 20.7 | (1,448,252 | ) | (92,119 | ) | (127,051 | ) | (111,302 | ) | (83,573 | ) | (43,059 | ) | (1,333,106 | ) | |||||||||||||||||||||||
| BM&FBovespa | - | (2,595 | ) | (2,595 | ) | - | (898 | ) | - | (1,237 | ) | (460 | ) | - | - | - | ||||||||||||||||||||||||||||
| Financial institutions | (1,567,599 | ) | 2,358 | (1,565,241 | ) | 17.0 | (1,404,706 | ) | (28,911 | ) | (51,952 | ) | (55,781 | ) | (23,891 | ) | - | (261,675 | ) | |||||||||||||||||||||||||
| Companies | (319,087 | ) | (18,433 | ) | (337,520 | ) | 3.7 | (42,648 | ) | (63,208 | ) | (73,862 | ) | (55,061 | ) | (59,682 | ) | (43,059 | ) | (1,071,431 | ) | |||||||||||||||||||||||
| Credit derivatives | (236,779 | ) | (29,984 | ) | (266,763 | ) | 2.9 | - | (123,085 | ) | (6,662 | ) | (1,928 | ) | (30,928 | ) | (104,160 | ) | (84,048 | ) | ||||||||||||||||||||||||
| Financial institutions | (231,767 | ) | (29,189 | ) | (260,956 | ) | 2.8 | - | (123,085 | ) | (6,662 | ) | (1,928 | ) | (30,928 | ) | (98,353 | ) | (83,983 | ) | ||||||||||||||||||||||||
| Companies | (5,012 | ) | (795 | ) | (5,807 | ) | 0.1 | - | - | - | - | - | (5,807 | ) | (65 | ) | ||||||||||||||||||||||||||||
| Forwards (offshore) | (257,257 | ) | 8,621 | (248,636 | ) | 2.7 | (85,677 | ) | (47,784 | ) | (48,433 | ) | (30,749 | ) | (20,598 | ) | (15,395 | ) | (336,748 | ) | ||||||||||||||||||||||||
| Financial institutions | (144,362 | ) | 246 | (144,116 | ) | 1.6 | (72,239 | ) | (32,657 | ) | (28,045 | ) | (9,769 | ) | (1,406 | ) | - | (252,698 | ) | |||||||||||||||||||||||||
| Companies | (112,468 | ) | 8,406 | (104,062 | ) | 1.1 | (13,432 | ) | (14,701 | ) | (20,387 | ) | (20,955 | ) | (19,192 | ) | (15,395 | ) | (83,841 | ) | ||||||||||||||||||||||||
| Individuals | (427 | ) | (31 | ) | (458 | ) | - | (6 | ) | (426 | ) | (1 | ) | (25 | ) | - | - | (209 | ) | |||||||||||||||||||||||||
| Swaps with target flow - companies | (69,416 | ) | (38,438 | ) | (107,854 | ) | 1.2 | - | - | (99 | ) | - | (8,934 | ) | (98,821 | ) | (33,101 | ) | ||||||||||||||||||||||||||
| Other derivative financial instruments | (345,148 | ) | (25,020 | ) | (370,168 | ) | 4.0 | (108 | ) | (1,194 | ) | (2,577 | ) | (328,459 | ) | (15,043 | ) | (22,787 | ) | (1,062,174 | ) | |||||||||||||||||||||||
| Financial institutions | (316,424 | ) | (4,144 | ) | (320,568 | ) | 3.5 | - | - | - | (313,376 | ) | (5,974 | ) | (1,218 | ) | (685,855 | ) | ||||||||||||||||||||||||||
| Companies | (28,724 | ) | (20,876 | ) | (49,600 | ) | 0.5 | (108 | ) | (1,194 | ) | (2,577 | ) | (15,083 | ) | (9,069 | ) | (21,569 | ) | (376,319 | ) | |||||||||||||||||||||||
| Total | (7,716,578 | ) | (1,488,602 | ) | (9,205,180 | ) | 100.0 | (1,725,183 | ) | (687,579 | ) | (1,009,832 | ) | (1,617,556 | ) | (1,292,974 | ) | (2,872,056 | ) | (9,125,386 | ) | |||||||||||||||||||||||
| % per maturity term | 18.7 | 7.5 | 11.0 | 17.6 | 14.0 | 31.2 | ||||||||||||||||||||||||||||||||||||||
| Total at 09/30/2012 | (6,970,890 | ) | (2,154,496 | ) | (9,125,386 | ) | 100.0 | (564,463 | ) | (764,552 | ) | (2,215,991 | ) | (1,491,692 | ) | (1,046,744 | ) | (3,041,944 | ) | |||||||||||||||||||||||||
| % per maturity term | 6.2 | 8.4 | 24.3 | 16.3 | 11.5 | 33.3 | ||||||||||||||||||||||||||||||||||||||
III - Derivatives by notional amount
See below the composition of the Derivative Financial Instruments portfolio by type of instrument, stated at their notional amounts, per trading location (organized or over-the-counter market) and counterparties.
| 09/30/2013 | ||||||||||||||||||||||||||||||||||||
| Futures | Swaps | Options | Forwards (onshore) | Credit derivatives | Forwards (offshore) | Swap with target flow | Target flow of swap | Other derivative financial instruments | ||||||||||||||||||||||||||||
| BM&FBOVESPA | 261,961,562 | 6,616,700 | 944,418,917 | 15,207,358 | - | - | - | - | - | |||||||||||||||||||||||||||
| Overt-the-counter market | 89,369,911 | 153,727,425 | 50,550,432 | 27,963,570 | 15,713,517 | 40,591,382 | 764,660 | 843,325 | 7,068,672 | |||||||||||||||||||||||||||
| Financial institutions | 57,439,436 | 43,881,695 | 40,997,259 | 11,729,861 | 15,602,017 | 33,042,607 | - | - | 3,741,678 | |||||||||||||||||||||||||||
| Companies | 31,930,475 | 70,856,947 | 9,495,688 | 16,221,186 | 111,500 | 7,385,608 | 764,660 | 843,325 | 3,326,994 | |||||||||||||||||||||||||||
| Individuals | - | 38,988,783 | 57,485 | 12,523 | - | 163,167 | - | - | - | |||||||||||||||||||||||||||
| Total | 351,331,473 | 160,344,125 | 994,969,349 | 43,170,928 | 15,713,517 | 40,591,382 | 764,660 | 843,325 | 7,068,672 | |||||||||||||||||||||||||||
| Total – 09/30/2012 | 430,314,716 | 121,207,347 | 1,402,563,048 | 14,800,773 | 5,964,119 | 35,958,421 | 541,791 | 549,661 | 7,194,755 | |||||||||||||||||||||||||||
IV - Credit derivatives
See below the composition of the Credit Derivatives (assets and liabilities) portfolio stated at notional amount, and their effect on calculation of Required Referential Equity.
| 09/30/2013 | 09/30/2012 | |||||||||||||||||||||||
| Notional amount of credit protection sold | Notional amount of credit protection purchased with identical underlying amount | Net position | Notional amount of credit protection sold | Notional amount of credit protection purchased with identical underlying amount | Net position | |||||||||||||||||||
| Credit swaps | (8,280,167 | ) | 6,030,834 | (2,249,333 | ) | (3,993,837 | ) | 906,997 | (3,086,840 | ) | ||||||||||||||
| Total return rate swaps | (1,402,516 | ) | - | (1,402,516 | ) | (1,063,285 | ) | - | (1,063,285 | ) | ||||||||||||||
| Total (*) | (9,682,683 | ) | 6,030,834 | (3,651,849 | ) | (5,057,122 | ) | 906,997 | (4,150,125 | ) | ||||||||||||||
| (*) | In the period we aligned the procedures for disclosing credit derivative information in order to state the position in the same disclosure standard as that of the risk management (BACEN Circular No. 3,477, of December 28, 2009). |
The effect on the referential equity (Note 3) was R$ 199,537 (R$ 98,235 at 09/30/2012).
During the period, there was no occurrence of a credit event as defined in the agreements.
V - Accounting hedge
The effectiveness computed for hedge portfolio was in conformity with the provisions of BACEN Circular No. 3,082 of January 30, 2002.
| a) | Cash flow - the purpose of the hedge relationship of ITAÚ UNIBANCO HOLDING is to protect the cash flows of payment of debt interest (CDB / Redeemable preferred shares) related to its variable interest rate risk (CDI / LIBOR), making the cash flow constant (fixed rate) and regardless of the variations of DI Cetip Over and LIBOR. |
| 09/30/2013 | 09/30/2012 | |||||||||||||||||||||||
| Hedge Instrument | Hedge assets | Hedge Instruments | Hedge assets | |||||||||||||||||||||
| Strategies | Nominal value | Adjustment to market value (*) | Book value | Nominal value | Adjustment to market value(*) | Book value | ||||||||||||||||||
| Hedge of deposits and securities purchased under agreements to resell | 55,890,665 | 9,795 | 56,760,825 | 47,850,456 | (241,075 | ) | 46,094,837 | |||||||||||||||||
| Hedge of preferred shares | 876,551 | 8,415 | 876,551 | 798,172 | (21,028 | ) | 798,172 | |||||||||||||||||
| Hedge of subordinated CDB | 158,304 | - | 136,495 | 147,593 | - | 126,629 | ||||||||||||||||||
| Total | 56,925,520 | 18,210 | 57,773,871 | 48,796,221 | (262,103 | ) | 47,019,638 | |||||||||||||||||
| (*) | Market Value net of tax effects recorded in stockholders’ equity |
The gains or losses related to the accounting hedge of cash flows that we expect to recognize in Results in the following 12 months amount to R$ (81,455) (R$ (485,579) at September 30, 2012).
To protect the future cash flows of debt against exposure to variable interest rate (CDI), ITAÚ UNIBANCO HOLDING negotiated DI Futures agreements at BM&FBOVESPA with maturity between 2013 and 2018.
To protect the future cash flows of debt against exposure to variable interest rate (LIBOR), ITAÚ UNIBANCO HOLDING negotiated swap contracts with maturity in 2015.
| b) | Market risk – The hedging strategy against market risk of ITAÚ UNIBANCO HOLDING consists in hedging the exposure to variation in market risk, receipt of interest, which are attributable to changes in interest rates related to recognized assets. |
| 09/30/2013 | ||||||||||||||||
| Hedge instrument | Hedge assets | |||||||||||||||
| Strategies | Nominal value | Adjustment to market value(*) | Nominal value | Adjustment to market value(*) | ||||||||||||
| Hedge of loans | 1,553,930 | (8,511 | ) | 1,553,930 | 8,638 | |||||||||||
| Total | 1,553,930 | (8,511 | ) | 1,553,930 | 8,638 | |||||||||||
| 09/30/2012 | ||||||||||||||||
| Hedge instrument | Hedge assets | |||||||||||||||
| Strategies | Nominal value | Adjustment to market value(*) | Nominal value | Adjustment to market value (*) | ||||||||||||
| Hedge of loans | 477,305 | (2,814 | ) | 477,305 | (2,783 | ) | ||||||||||
| Total | 477,305 | (2,814 | ) | 477,305 | (2,783 | ) | ||||||||||
| (*) | Market value net of tax effects recorded in stockholders’ equity |
To hedge the variation in market risk in the receipt of interest, ITAÚ UNIBANCO HOLDING uses interest rate swap contracts Hedge assets are related to fixed-rate assets expressed in unidad de fomento (CLF) and expressed in euros, issued by subsidiaries in Chile and London, respectively and with maturities between 2016 and 2028.
Receipts (payments) of interest flows are expected to occur and will affect the statement of income in monthly periods.
c)We present below the maturity terms of cash flow hedge and market risk hedge strategies:
| 09/30/2013 | 09/30/2012 | |||||||||||||||||||||||
| Maturity term | Hedge of deposits and securities purchased under agreements to resell | Hedge of preferred shares | Hedge of subordinated CDB | Hedge of loans | Total | Total | ||||||||||||||||||
| 2012 | - | - | - | - | - | 10,510,537 | ||||||||||||||||||
| 2013 | 26,196,317 | - | - | - | 26,196,317 | 30,013,509 | ||||||||||||||||||
| 2014 | 20,568,380 | - | 158,304 | - | 20,726,684 | 6,586,584 | ||||||||||||||||||
| 2015 | 5,728,988 | 876,551 | - | - | 6,605,539 | 798,172 | ||||||||||||||||||
| 2016 | 539,519 | - | - | 241,473 | 780,992 | - | ||||||||||||||||||
| 2017 | 2,455,517 | - | - | 120,737 | 2,576,254 | 887,419 | ||||||||||||||||||
| 2018 | 401,944 | - | - | 150,921 | 552,865 | - | ||||||||||||||||||
| 2020 | - | - | - | 43,367 | 43,367 | - | ||||||||||||||||||
| 2022 | - | - | - | 201,524 | 201,524 | - | ||||||||||||||||||
| 2023 | - | - | - | 190,122 | 190,122 | - | ||||||||||||||||||
| 2025 | - | - | - | 46,483 | 46,483 | - | ||||||||||||||||||
| 2027 | - | - | - | 164,779 | 164,779 | 477,305 | ||||||||||||||||||
| 2028 | - | - | - | 394,524 | 394,524 | - | ||||||||||||||||||
| Total | 55,890,665 | 876,551 | 158,304 | 1,553,930 | 58,479,450 | 49,273,526 | ||||||||||||||||||
| d) | Related operations - the swap operations contracted in a negotiation associated with the funding and/or investment in the amount of R$ 2,911 (R$ 35,239 at September 30, 2012) are recorded at amounts restated in accordance with variations occurred in respective ratios (curve) and are not valued at their market value, as permitted by BACEN Circular No. 3,150, of September 11, 2002. |
h) Changes in adjustment to unrealized (*) market value for the period
| 01/01 to 09/30/2013 | 01/01 to 09/30/2012 | |||||||
| Opening balance | 2,406,079 | (160,343 | ) | |||||
| Adjustments with impact on: | ||||||||
| Results | (268,713 | ) | 930,095 | |||||
| Trading securities | (1,167,513 | ) | 664,032 | |||||
| Derivative financial instruments | 898,800 | 266,063 | ||||||
| Stockholders’ equity | (3,846,497 | ) | 1,565,505 | |||||
| Available-for-sale | (4,162,015 | ) | 1,712,787 | |||||
| Accounting hedge – derivative financial instruments | 315,518 | (147,282 | ) | |||||
| Futures | 293,005 | (145,559 | ) | |||||
| Swap | 22,513 | (1,723 | ) | |||||
| Closing balance | (1,709,131 | ) | 2,335,257 | |||||
| Adjustment to market value | (1,709,131 | ) | 2,335,257 | |||||
| Trading securities | (792,582 | ) | 690,730 | |||||
| Available-for-sale securities | (1,378,873 | ) | 2,431,386 | |||||
| Derivative financial instruments | 462,324 | (786,859 | ) | |||||
| Trading securities | 433,249 | (362,048 | ) | |||||
| Accounting hedge | 29,075 | (424,811 | ) | |||||
| Futures | 16,325 | (392,950 | ) | |||||
| Swap | 12,750 | (31,861 | ) | |||||
| (*) | The term unrealized in the context of Circular nº. 3.068 of 11/08/2001, of Central Bank means not converted into cash. |
i) Realized gain of securities portfolio and derivatives financial instruments
| 01/01 to 09/30/2013 | 01/01 to 09/30/2012 | |||||||
| Gain (loss) – trading securities | (897,086 | ) | 1,324,846 | |||||
| Gain (loss) – available-for-sale securities | (262,747 | ) | 879,625 | |||||
| Gain (loss) – derivatives | (4,802,363 | ) | (2,611,399 | ) | ||||
| Gain (loss) – foreign exchange variation on investments abroad | 2,031,684 | 1,519,278 | ||||||
| Total | (3,930,512 | ) | 1,112,350 | |||||
| j) | Sensitivity analysis (trading and banking portfolios) |
In compliance with CVM Instruction No. 475 of December 17, 2008, ITAÚ UNIBANCO HOLDING carried out a sensitivity analysis by market risk factors considered relevant to which it was exposed. The biggest losses arising, by risk factor, in each scenario, were stated with impact on result, net of tax effects, by providing a vision of the ITAÚ UNIBANCO HOLDING exposure under exceptional scenarios.
Measurement of market risk segregates operations in trading portfolio and banking portfolio, pursuant to the criteria set forth in the Capital Accord and subsequent amendments.
The sensitivity analyses of non-trading and trading portfolio shown in this report are an evaluation of an instant position of the portfolio exposure and, therefore, do not consider the management’s quick response capacity (treasury and control areas), which triggers risk mitigating measures, whenever a situation of high loss or risk is identified by minimizing the sensitivity towards significant losses. In addition, we point out that the presented results do not necessarily translate into accounting results, because the study's sole purpose is to disclose the exposure to risks and the respective protective actions, taking into account the fair value of financial instruments, irrespective of the accounting practices adopted by the ITAÚ UNIBANCO HOLDING.
| Trading portfolio | Exposures | 09/30/2013 (*) | ||||||||||||
| Scenarios | ||||||||||||||
| Risk factors | Risk of variation in: | I | II | III | ||||||||||
| Fixed rate | Fixed rates in reais | (847 | ) | (21,159 | ) | (42,278 | ) | |||||||
| Foreign exchange | Rates of foreign currency coupon | 604 | (15,226 | ) | (30,695 | ) | ||||||||
| Foreign currency | Exchange variation | 3,079 | (76,976 | ) | (153,953 | ) | ||||||||
| Price indices | Rates of price index coupon | (582 | ) | (14,458 | ) | (28,751 | ) | |||||||
| Reference rate | Rate of TR coupon | 77 | (1,951 | ) | (3,934 | ) | ||||||||
| Shares | Share price | 5,269 | (131,735 | ) | (263,469 | ) | ||||||||
| Total without correlation | 7,601 | (261,504 | ) | (523,080 | ) | |||||||||
| Total with correlation | 6,374 | (219,271 | ) | (438,601 | ) | |||||||||
| (*) | Amounts net of tax effects. |
| Trading and Banking portfolios | Exposures | 09/30/2012 (*) | ||||||||||||
| Scenarios | ||||||||||||||
| Risk factors | Risk of variation in: | I | II | III | ||||||||||
| Fixed rate | Fixed rates in reais | (3,392 | ) | (84,628 | ) | (168,886 | ) | |||||||
| Foreign exchange | Rates of foreign currency coupon | 377 | (9,398 | ) | (18,740 | ) | ||||||||
| Foreign currency | Exchange variation | 1,120 | (27,995 | ) | (55,989 | ) | ||||||||
| Price indices | Rates of price index coupon | (3,407 | ) | (83,677 | ) | (164,335 | ) | |||||||
| Reference rate | Rate of TR coupon | (2,070 | ) | (50,992 | ) | (100,421 | ) | |||||||
| Shares | Share price | 5,677 | (141,921 | ) | (283,842 | ) | ||||||||
| Total without correlation | (1,696 | ) | (398,611 | ) | (792,212 | ) | ||||||||
| Total with correlation | (1,422 | ) | (334,235 | ) | (664,269 | ) | ||||||||
| (*) | Amounts net of tax effects. |
The following scenarios are used to measure the sensitivity:
| · | Scenario I: Addition of 1 base point in interest rates and associated indexes, and 1 percentage point in currency and share prices, which is based on market information (BM&FBOVESPA, Andima, etc); |
| · | Scenario II: Shocks at 25 base points in interest rates and associated indexes, and 25 percentage points in currency and share prices, both for growth and fall, considering the largest resulting losses per risk factor; |
| · | Scenario III: Shocks at 50 base points in interest rates and associated indexes, and 50 percentage points in currency and share prices, both for growth and fall, considering the largest resulting losses per risk factor. |
Derivative financial instruments engaged by ITAÚ UNIBANCO HOLDING are shown in the item Derivative financial instruments in this note.
Note 8 - Loan, lease and other credit operations
a) Composition of the portfolio with credit granting characteristics
I – By type of operations and risk level
| 09/30/2013 | 09/30/2012 | |||||||||||||||||||||||||||||||||||||||||||
| Risk levels | AA | A | B | C | D | E | F | G | H | Total | Total | |||||||||||||||||||||||||||||||||
| Loan operations | 170,100,940 | 73,082,227 | 34,736,569 | 16,209,138 | 7,818,465 | 2,953,272 | 2,286,521 | 3,005,856 | 10,127,876 | 320,320,864 | 294,643,034 | |||||||||||||||||||||||||||||||||
| Loans and discounted trade receivables | 54,969,675 | 55,129,608 | 25,505,909 | 10,776,689 | 6,446,763 | 2,210,842 | 1,799,963 | 2,527,834 | 7,711,390 | 167,078,673 | 158,501,420 | |||||||||||||||||||||||||||||||||
| Financing | 78,642,611 | 10,536,569 | 8,120,500 | 4,982,570 | 1,238,648 | 638,199 | 460,536 | 446,615 | 2,323,000 | 107,389,248 | 101,100,038 | |||||||||||||||||||||||||||||||||
| Farming and agribusiness financing | 5,735,330 | 862,747 | 556,018 | 141,047 | 47,251 | 54,230 | 243 | 2,550 | 41,712 | 7,441,128 | 5,794,965 | |||||||||||||||||||||||||||||||||
| Real estate financing | 30,753,324 | 6,553,303 | 554,142 | 308,832 | 85,803 | 50,001 | 25,779 | 28,857 | 51,774 | 38,411,815 | 29,246,611 | |||||||||||||||||||||||||||||||||
| Lease operations | 6,513,450 | 1,179,270 | 1,653,995 | 720,160 | 437,992 | 177,823 | 131,059 | 129,660 | 658,987 | 11,602,396 | 19,134,295 | |||||||||||||||||||||||||||||||||
| Credit card operations | - | 38,080,214 | 2,340,733 | 1,146,077 | 613,910 | 410,212 | 396,568 | 379,463 | 2,359,008 | 45,726,185 | 38,471,584 | |||||||||||||||||||||||||||||||||
| Advance on exchange contracts(1) | 3,524,005 | 521,376 | 521,576 | 259,826 | 8,122 | 4,908 | - | 1,797 | 5,439 | 4,847,049 | 5,520,329 | |||||||||||||||||||||||||||||||||
| Other sundry receivables(2) | 33,109 | 4,257,572 | 3,261 | 146,974 | 1,818 | 1,182 | 1,308 | 31,497 | 66,399 | 4,543,120 | 2,041,050 | |||||||||||||||||||||||||||||||||
| Total operations with credit granting characteristics | 180,171,504 | 117,120,659 | 39,256,134 | 18,482,175 | 8,880,307 | 3,547,397 | 2,815,456 | 3,548,273 | 13,217,709 | 387,039,614 | 359,810,292 | |||||||||||||||||||||||||||||||||
| Endorsements and sureties(3) | 69,521,632 | 57,792,446 | ||||||||||||||||||||||||||||||||||||||||||
| Total with endorsements and sureties | 180,171,504 | 117,120,659 | 39,256,134 | 18,482,175 | 8,880,307 | 3,547,397 | 2,815,456 | 3,548,273 | 13,217,709 | 456,561,246 | 417,602,738 | |||||||||||||||||||||||||||||||||
| Total – 09/30/2012 | 123,572,187 | 139,518,196 | 39,062,662 | 20,747,937 | 11,862,494 | 4,073,336 | 3,229,304 | 2,845,738 | 14,898,438 | 359,810,292 | ||||||||||||||||||||||||||||||||||
| (1) | Includes Advances on Exchange Contracts and Income Receivable from Advances Granted, reclassified from Liabilities – Foreign Exchange Portfolio/Other Receivables (Note 2a); |
| (2) | Includes Securities and Credits Receivable, Debtors for Purchase of Assets and Endorsements and Sureties paid; |
| (3) | Recorded in Memorandum Accounts. |
II – By maturity and risk level
| 09/30/2013 | 09/30/2012 | |||||||||||||||||||||||||||||||||||||||||||
| AA | A | B | C | D | E | F | G | H | Total | Total | ||||||||||||||||||||||||||||||||||
| Overdue Operations(1) (2) | ||||||||||||||||||||||||||||||||||||||||||||
| Falling due installments | - | - | 2,401,394 | 2,609,717 | 1,744,222 | 1,230,544 | 1,074,798 | 1,158,202 | 5,113,400 | 15,332,277 | 20,004,772 | |||||||||||||||||||||||||||||||||
| 01 to 30 | - | - | 126,088 | 141,079 | 83,899 | 52,793 | 44,953 | 53,942 | 282,111 | 784,865 | 1,254,560 | |||||||||||||||||||||||||||||||||
| 31 to 60 | - | - | 93,227 | 103,923 | 70,582 | 44,291 | 35,180 | 47,241 | 197,600 | 592,044 | 731,525 | |||||||||||||||||||||||||||||||||
| 61 to 90 | - | - | 93,539 | 104,672 | 70,536 | 43,798 | 35,857 | 47,106 | 199,340 | 594,848 | 750,761 | |||||||||||||||||||||||||||||||||
| 91 to 180 | - | - | 265,158 | 309,867 | 196,459 | 131,893 | 109,247 | 139,553 | 601,390 | 1,753,567 | 2,157,231 | |||||||||||||||||||||||||||||||||
| 181 to 365 | - | - | 470,632 | 558,993 | 351,192 | 238,806 | 201,351 | 247,539 | 1,057,440 | 3,125,953 | 3,889,673 | |||||||||||||||||||||||||||||||||
| Over 365 | - | - | 1,352,750 | 1,391,183 | 971,554 | 718,963 | 648,210 | 622,821 | 2,775,519 | 8,481,000 | 11,221,022 | |||||||||||||||||||||||||||||||||
| Overdue installments | - | - | 738,534 | 738,582 | 761,541 | 721,017 | 724,844 | 1,043,861 | 5,774,585 | 10,502,964 | 11,886,628 | |||||||||||||||||||||||||||||||||
| 01 to 14 | - | - | 11,014 | 75,848 | 45,096 | 24,544 | 19,579 | 25,523 | 106,517 | 308,121 | 405,904 | |||||||||||||||||||||||||||||||||
| 15 to 30 | - | - | 709,669 | 99,542 | 78,857 | 43,284 | 28,684 | 33,826 | 191,656 | 1,185,518 | 1,153,366 | |||||||||||||||||||||||||||||||||
| 31 to 60 | - | - | 17,851 | 545,045 | 154,961 | 106,619 | 82,806 | 106,489 | 270,145 | 1,283,916 | 1,560,370 | |||||||||||||||||||||||||||||||||
| 61 to 90 | - | - | - | 12,040 | 457,278 | 120,800 | 115,952 | 129,023 | 300,543 | 1,135,636 | 1,295,483 | |||||||||||||||||||||||||||||||||
| 91 to 180 | - | - | - | 6,107 | 25,349 | 413,991 | 455,051 | 720,936 | 1,108,648 | 2,730,082 | 3,100,907 | |||||||||||||||||||||||||||||||||
| 181 to 365 | - | - | - | - | - | 11,779 | 22,772 | 28,064 | 3,643,761 | 3,706,376 | 4,246,563 | |||||||||||||||||||||||||||||||||
| Over 365 | - | - | - | - | - | - | - | - | 153,315 | 153,315 | 124,035 | |||||||||||||||||||||||||||||||||
| Subtotal | - | - | 3,139,928 | 3,348,299 | 2,505,763 | 1,951,561 | 1,799,642 | 2,202,063 | 10,887,985 | 25,835,241 | 31,891,400 | |||||||||||||||||||||||||||||||||
| Specific allowance | - | - | (31,399 | ) | (100,449 | ) | (250,577 | ) | (585,468 | ) | (899,821 | ) | (1,541,444 | ) | (10,887,985 | ) | (14,297,143 | ) | (16,314,969 | ) | ||||||||||||||||||||||||
Subtotal - 09/30/2012 | - | - | 3,967,060 | 4,460,614 | 4,022,402 | 2,730,666 | 2,230,967 | 2,250,447 | 12,229,244 | 31,891,400 | ||||||||||||||||||||||||||||||||||
| Non-overdue operations | ||||||||||||||||||||||||||||||||||||||||||||
| Falling due installments | 179,844,481 | 115,919,964 | 35,784,448 | 14,995,840 | 6,305,861 | 1,566,481 | 999,994 | 1,312,654 | 2,291,168 | 359,020,891 | 324,819,028 | |||||||||||||||||||||||||||||||||
| 01 to 30 | 12,361,070 | 25,995,927 | 6,510,111 | 3,495,728 | 1,236,221 | 253,809 | 111,405 | 197,740 | 411,778 | 50,573,789 | 48,053,813 | |||||||||||||||||||||||||||||||||
| 31 to 60 | 13,135,788 | 11,354,561 | 3,717,291 | 1,286,623 | 298,109 | 69,259 | 37,043 | 84,845 | 173,388 | 30,156,907 | 28,787,623 | |||||||||||||||||||||||||||||||||
| 61 to 90 | 7,716,905 | 8,216,346 | 2,608,432 | 842,110 | 459,086 | 45,690 | 45,066 | 23,849 | 115,546 | 20,073,030 | 18,840,906 | |||||||||||||||||||||||||||||||||
| 91 to 180 | 19,999,604 | 13,922,945 | 4,987,815 | 1,214,349 | 384,232 | 128,946 | 96,849 | 66,543 | 221,169 | 41,022,452 | 36,793,391 | |||||||||||||||||||||||||||||||||
| 181 to 365 | 27,682,709 | 15,140,416 | 5,674,739 | 1,956,199 | 755,963 | 341,814 | 140,731 | 118,757 | 293,530 | 52,104,858 | 49,620,001 | |||||||||||||||||||||||||||||||||
| Over 365 | 98,948,405 | 41,289,769 | 12,286,060 | 6,200,831 | 3,172,250 | 726,963 | 568,900 | 820,920 | 1,075,757 | 165,089,855 | 142,723,294 | |||||||||||||||||||||||||||||||||
| Overdue up to 14 days | 327,023 | 1,200,695 | 331,758 | 138,036 | 68,683 | 29,355 | 15,820 | 33,556 | 38,556 | 2,183,482 | 3,099,864 | |||||||||||||||||||||||||||||||||
| Subtotal | 180,171,504 | 117,120,659 | 36,116,206 | 15,133,876 | 6,374,544 | 1,595,836 | 1,015,814 | 1,346,210 | 2,329,724 | 361,204,373 | 327,918,892 | |||||||||||||||||||||||||||||||||
| Generic allowance | - | (585,609 | ) | (361,167 | ) | (454,021 | ) | (637,459 | ) | (478,751 | ) | (507,907 | ) | (942,347 | ) | (2,329,724 | ) | (6,296,985 | ) | (6,309,043 | ) | |||||||||||||||||||||||
| Subtotal - 09/30/2012 | 123,572,187 | 139,518,196 | 35,095,602 | 16,287,323 | 7,840,092 | 1,342,670 | 998,337 | 595,291 | 2,669,194 | 327,918,892 | ||||||||||||||||||||||||||||||||||
| Grand total | 180,171,504 | 117,120,659 | 39,256,134 | 18,482,175 | 8,880,307 | 3,547,397 | 2,815,456 | 3,548,273 | 13,217,709 | 387,039,614 | 359,810,292 | |||||||||||||||||||||||||||||||||
| Existing allowance | - | (585,609 | ) | (392,566 | ) | (1,501,650 | ) | (2,663,209 | ) | (1,773,344 | ) | (1,970,538 | ) | (3,547,918 | ) | (13,217,709 | ) | (25,652,543 | ) | (27,682,427 | ) | |||||||||||||||||||||||
| Minimum allowance required | - | (585,609 | ) | (392,566 | ) | (554,470 | ) | (888,036 | ) | (1,064,219 | ) | (1,407,728 | ) | (2,483,791 | ) | (13,217,709 | ) | (20,594,128 | ) | (22,624,012 | ) | |||||||||||||||||||||||
| Additional allowance(3) | - | - | - | (947,180 | ) | (1,775,173 | ) | (709,125 | ) | (562,810 | ) | (1,064,127 | ) | - | (5,058,415 | ) | (5,058,415 | ) | ||||||||||||||||||||||||||
| Grand total - 09/30/2012 | 123,572,187 | 139,518,196 | 39,062,662 | 20,747,937 | 11,862,494 | 4,073,336 | 3,229,304 | 2,845,738 | 14,898,438 | 359,810,292 | ||||||||||||||||||||||||||||||||||
| Existing allowance | - | (697,591 | ) | (390,626 | ) | (996,305 | ) | (3,557,562 | ) | (2,036,261 | ) | (2,260,190 | ) | (2,845,454 | ) | (14,898,438 | ) | (27,682,427 | ) | |||||||||||||||||||||||||
| Minimum allowance required | - | (697,591 | ) | (390,626 | ) | (622,438 | ) | (1,186,249 | ) | (1,222,001 | ) | (1,614,652 | ) | (1,992,017 | ) | (14,898,438 | ) | (22,624,012 | ) | |||||||||||||||||||||||||
| Additional allowance(3) | - | - | - | (373,867 | ) | (2,371,313 | ) | (814,260 | ) | (645,538 | ) | (853,437 | ) | - | (5,058,415 | ) | ||||||||||||||||||||||||||||
| (1) | Operations with overdue installments for more than 14 days or under responsibility of bankruptcy or in process of bankruptcy companies; |
| (2) | The balance of non-accrual operations amounts to R$ 17,981,644 (R$ 22,200,624at 09/30/2012); |
| (3) | Allocated to each level of risk in order to explain the additional volume required for alignment to the amount of the expected loss. |
III – By business sector
| 09/30/2013 | % | 09/30/2012 | % | |||||||||||||
| Public Sector | 3,420,365 | 0.9 | % | 926,771 | 0.3 | % | ||||||||||
| Energy | 99,236 | 0.0 | % | 269,838 | 0.1 | % | ||||||||||
| Petrochemical and chemical | 3,136,061 | 0.8 | % | 446,109 | 0.1 | % | ||||||||||
| Sundry | 185,068 | 0.0 | % | 210,824 | 0.1 | % | ||||||||||
| Private sector | 383,619,249 | 99.1 | % | 358,883,521 | 99.7 | % | ||||||||||
| Companies | 214,030,343 | 55.3 | % | 200,834,820 | 55.8 | % | ||||||||||
| Sugar and alcohol | 8,479,167 | 2.2 | % | 7,655,762 | 2.1 | % | ||||||||||
| Agribusiness and fertilizers | 13,076,654 | 3.4 | % | 11,233,122 | 3.1 | % | ||||||||||
| Food and beverage | 11,015,882 | 2.8 | % | 9,980,001 | 2.8 | % | ||||||||||
| Banks and other financial institutions | 3,768,366 | 1.0 | % | 4,352,083 | 1.2 | % | ||||||||||
| Capital assets | 7,979,733 | 2.1 | % | 7,200,822 | 2.0 | % | ||||||||||
| Pulp and paper | 3,088,233 | 0.8 | % | 2,884,579 | 0.8 | % | ||||||||||
| Publishing and printing | 1,513,749 | 0.4 | % | 1,643,991 | 0.5 | % | ||||||||||
| Electronic and IT | 5,035,059 | 1.3 | % | 5,057,889 | 1.4 | % | ||||||||||
| Packaging | 2,350,489 | 0.6 | % | 1,825,825 | 0.5 | % | ||||||||||
| Energy and sewage | 6,006,839 | 1.6 | % | 5,517,196 | 1.5 | % | ||||||||||
| Education | 1,248,051 | 0.3 | % | 1,144,439 | 0.3 | % | ||||||||||
| Pharmaceuticals and cosmetics | 4,228,860 | 1.1 | % | 3,907,760 | 1.1 | % | ||||||||||
| Real estate agents | 16,558,321 | 4.3 | % | 13,141,711 | 3.7 | % | ||||||||||
| Entertainment and tourism | 3,388,424 | 0.9 | % | 3,356,340 | 0.9 | % | ||||||||||
| Wood and furniture | 3,087,064 | 0.8 | % | 3,168,817 | 0.9 | % | ||||||||||
| Construction material | 5,338,548 | 1.4 | % | 5,073,193 | 1.4 | % | ||||||||||
| Steel and metallurgy | 9,044,663 | 2.3 | % | 8,074,963 | 2.2 | % | ||||||||||
| Media | 884,984 | 0.2 | % | 845,037 | 0.2 | % | ||||||||||
| Mining | 2,741,946 | 0.7 | % | 2,835,491 | 0.8 | % | ||||||||||
| Infrastructure work | 4,807,699 | 1.2 | % | 4,811,868 | 1.3 | % | ||||||||||
| Oil and gas | 3,600,774 | 0.9 | % | 2,962,724 | 0.8 | % | ||||||||||
| Petrochemical and chemical | 6,100,795 | 1.6 | % | 5,889,323 | 1.6 | % | ||||||||||
| Health care | 1,750,571 | 0.5 | % | 1,744,683 | 0.5 | % | ||||||||||
| Insurance and reinsurance and pension plans | 4,483 | 0.0 | % | 5,727 | 0.0 | % | ||||||||||
| Telecommucations | 1,174,599 | 0.3 | % | 1,094,526 | 0.3 | % | ||||||||||
| Third sector | 88,643 | 0.0 | % | 112,769 | 0.0 | % | ||||||||||
| Trading | 1,949,862 | 0.5 | % | 2,318,729 | 0.6 | % | ||||||||||
| Transportation | 17,403,385 | 4.5 | % | 16,581,251 | 4.6 | % | ||||||||||
| Domestic appliances | 2,489,315 | 0.6 | % | 2,671,066 | 0.7 | % | ||||||||||
| Vehicles and autoparts | 13,096,590 | 3.4 | % | 12,759,065 | 3.5 | % | ||||||||||
| Clothing and shoes | 5,199,365 | 1.3 | % | 5,167,014 | 1.4 | % | ||||||||||
| Commerce - sundry | 13,729,330 | 3.5 | % | 14,337,047 | 4.0 | % | ||||||||||
| Industry - sundry | 3,494,835 | 0.9 | % | 4,848,372 | 1.3 | % | ||||||||||
| Sundry services | 17,055,641 | 4.4 | % | 16,995,210 | 4.7 | % | ||||||||||
| Sundry | 13,249,424 | 3.4 | % | 9,636,425 | 2.7 | % | ||||||||||
| Individuals | 169,588,906 | 43.8 | % | 158,048,701 | 43.9 | % | ||||||||||
| Credit cards | 44,911,893 | 11.6 | % | 37,508,670 | 10.4 | % | ||||||||||
| Real estate financing | 28,320,719 | 7.3 | % | 21,362,662 | 5.9 | % | ||||||||||
| Consumer loans / overdraft | 52,831,011 | 13.7 | % | 45,130,996 | 12.5 | % | ||||||||||
| Vehicles | 43,525,283 | 11.2 | % | 54,046,373 | 15.0 | % | ||||||||||
| Grand total | 387,039,614 | 100.0 | % | 359,810,292 | 100.0 | % | ||||||||||
b) Credit concentration
| 09/30/2013 | 09/30/2012 | |||||||||||||||
| Loan, lease and other credit operations(*) | Risk | % of total | Risk | % of total | ||||||||||||
| Largest debtor | 4,957,801 | 1.1 | 4,332,994 | 1.0 | ||||||||||||
| 10 largest debtors | 29,132,158 | 6.4 | 26,374,842 | 6.3 | ||||||||||||
| 20 largest debtors | 45,247,287 | 9.9 | 42,361,640 | 10.1 | ||||||||||||
| 50 largest debtors | 73,873,845 | 16.2 | 66,155,639 | 15.8 | ||||||||||||
| 100 largest debtors | 100,741,258 | 22.1 | 86,982,805 | 20.8 | ||||||||||||
(*) The amounts include endorsements and sureties.
| 09/30/2013 | 09/30/2012 | |||||||||||||||
| Loan, lease and other credit operations and securities of companies and financial institutions(*) | Risk | % of total | Risk | % of total | ||||||||||||
| Largest debtor | 5,159,556 | 1.0 | 4,962,447 | 1.1 | ||||||||||||
| 10 largest debtors | 38,515,434 | 7.4 | 36,220,393 | 7.7 | ||||||||||||
| 20 largest debtors | 60,618,190 | 11.7 | 58,564,465 | 12.4 | ||||||||||||
| 50 largest debtors | 98,273,629 | 18.9 | 91,801,941 | 19.4 | ||||||||||||
| 100 largest debtors | 132,315,749 | 25.5 | 119,037,368 | 25.2 | ||||||||||||
(*) The amounts include endorsements and sureties.
c) Changes in allowance for loan losses
| 01/01 to 09/30/2013 | 01/01 to 09/30/2012 | |||||||
| Opening balance | (27,744,938 | ) | (25,771,727 | ) | ||||
| Effect of change in consolidation criteria (Note 2b) | (483,210 | ) | - | |||||
| Net increase for the period | (14,384,990 | ) | (17,959,140 | ) | ||||
| Required by Resolution No. 2,682/99 | (14,384,990 | ) | (17,959,140 | ) | ||||
| Additional allowance | - | - | ||||||
| Write-Off | 16,960,595 | 16,048,440 | ||||||
| Closing balance(1) | (25,652,543 | ) | (27,682,427 | ) | ||||
| Required by Resolution No. 2,682/99 | (20,594,128 | ) | (22,624,012 | ) | ||||
| Specific allowance(2) | (14,297,143 | ) | (16,314,969 | ) | ||||
| Generic allowance(3) | (6,296,985 | ) | (6,309,043 | ) | ||||
| Additional allowance(4) | (5,058,415 | ) | (5,058,415 | ) | ||||
| (1) | The allowance for loan losses related to the lease portfolio amounts to: R$ (956,783) (R$ (1,589,831) at Setember 30, 2012. |
| (2) | Operations with overdue installments for more than 14 days or under responsibility of bankruptcy or in process of bankruptcy companies. |
| (3) | For operations not covered in the previous item due to the classification of the client or operation. |
| (4) | Refers to the provision in excess of the minimum required percentage by CMN Resolution No. 2,682 of December 21, 1999, based on the expected loss methodology adopted in the institution’s credit risk management, which also considers the potential losses in revolving credit. |
At Setember 30, 2013, the balance of the allowance in relation to the loan portfolio is equivalent to 6.6% (7.7% at 09/30/2012).
| d) | Recovery and renegotiation of credits |
I - Composition of the result of allowance for loan losses
| 01/01 to 09/30/2013 | 01/01 to 09/30/2012 | |||||||
| Expenses for allowance for loan losses | (14,384,990 | ) | (17,959,140 | ) | ||||
| Income from recovery of credits written off as loss | 3,645,238 | 3,477,108 | ||||||
| Result of allowance for loan losses(*) | (10,739,752 | ) | (14,482,032 | ) | ||||
(*) The amounts related to the lease portfolio from 01/01 to 09/30/2013 are: Expenses for allowance for loan losses R$ (652,635) (R$ (892,699) from 01/01 to 09/30/2012) and Income from recovery of credits written off as loss R$ 372,864 (R$ 592,757 from 01/01 to 09/30/2012).
II - Renegotiated loan operations
| 09/30/2013 | 09/30/2012 | |||||||||||||||||||||||
| Portfolio (1) | Allowance for Loan Losses | % | Portfolio (1) | Allowance for Loan Losses | % | |||||||||||||||||||
| Amended Credit Agreements | 18,252,209 | (8,170,526 | ) | 44.8 | % | 19,523,667 | (8,673,811 | ) | 44.4 | % | ||||||||||||||
| (-) Amended Operations non-overdue(2) | (4,958,994 | ) | 1,372,710 | 27.7 | % | (5,070,604 | ) | 1,503,848 | 29.7 | % | ||||||||||||||
| Renegotiated loan operations | 13,293,215 | (6,797,816 | ) | 51.1 | % | 14,453,063 | (7,169,963 | ) | 49.6 | % | ||||||||||||||
| (1) | The amounts related to the lease portfolio are R$ 770,741 (R$ 1,031,722 at Setember,30 2012). |
| (2) | Resulting from transations non-overdue or a delay of less than 30 days, reflex of changes in the original contractual terms. |
| e) | Restricted operations on assets |
See below the information related to the restricted operations on assets, in accordance with CMN Resolution No. 2,921, of January 17, 2002.
| 09/30/2013 | 01/01 to 09/30/2013 | 09/30/2012 | 01/01 to 09/30/2012 | |||||||||||||||||||||||||||||
| 0 - 30 | 31 - 180 | 181 - 365 | Over 365 days | Total | Income (expenses) | Total | Income (expenses) | |||||||||||||||||||||||||
| Restricted operations on assets | ||||||||||||||||||||||||||||||||
| Loan operations | 813 | 85 | 51 | 155,455 | 156,404 | 16,653 | 119,630 | 15,548 | ||||||||||||||||||||||||
| Liabilities - restricted operations on assets | ||||||||||||||||||||||||||||||||
| Foreign borrowings through securities | 813 | 85 | - | 155,455 | 156,353 | (16,650 | ) | 119,630 | (15,548 | ) | ||||||||||||||||||||||
| Net revenue from restricted operations | 3 | - | ||||||||||||||||||||||||||||||
At September 30, 2013, and 2012 there were no balances in default.
| f) | Operations of sale or transfers and acquisitions of financial assets |
| I. | Credit assignments (transfers of receivables) carried out through December 2011 were recorded in accordance with current regulation together with income recognition at the time of the assignment, regardless of the risks and benefits being retained or not. |
In compliance with CMN Resolution No. 3,809, of October 28, 2009, the amount of operations assigned with joint obligation, at September 30, 2013 where the entity significantly retained the related risks and benefits is R$ 322,176 (R$ 449,063 at 09/30/2012), composed of real estate financing of R$ 304,938 (R$ 429,700 at 09/30/2012) and farming financing of R$ 17,238 (R$ 19,363 at 09/30/2012).
| II. | Beginning January 2012, as provided for by CMN Resolution No. 3,533/08, of January 31, 2008 and supplementary regulation, accounting records take into consideration the retention or non-retention of risks and benefits on sale or transfers of financial assets. |
Sales or transfers of financial assets without risk and benefit retention totaling R$ 667,664 with effect on results of R$ 1,881, net of Allowance for Loan Losses.
Acquisitions of loan portfolios with the retention of assignor’s risks carried out as from January 2012 to September 30, 2013 totals R$ 4,371,840, and the total amount of acquired portfolios is R$ 4,824,684, at September 30, 2013.
In 2013, there was an increase of R$ 1,531,552 in the total amount of loan portfolio acquired with risk retention of the assignor.
Note 9 - Foreign exchange portfolio
| 09/30/2013 | 09/30/2012 | |||||||
| Assets - other receivables | 52,988,923 | 40,949,887 | ||||||
| Exchange purchase pending settlement – foreign currency | 28,610,238 | 22,941,184 | ||||||
| Bills of exchange and term documents – foreign currency | 5,210 | - | ||||||
| Exchange sale rights – local currency | 24,800,446 | 18,489,047 | ||||||
| (Advances received) – local currency | (426,971 | ) | (480,344 | ) | ||||
| Liabilities – other liabilities (Note 2a) | 53,315,065 | 41,124,676 | ||||||
| Exchange sales pending settlement – foreign currency | 25,341,639 | 18,472,885 | ||||||
| Liabilities from purchase of foreign currency – local currency | 27,966,291 | 22,646,922 | ||||||
| Other | 7,135 | 4,869 | ||||||
| Memorandum accounts | 1,106,140 | 1,405,574 | ||||||
| Outstanding import credits – foreign currency | 1,083,417 | 1,337,564 | ||||||
| Confirmed export credits – foreign currency | 22,723 | 68,010 | ||||||
Note 10 – Funding and borrowings and onlending
| a) | Summary |
| 09/30/2013 | 09/30/2012 | |||||||||||||||||||||||||||||||
| 0-30 | 31-180 | 181-365 | Over 365 days | Total | % | Total | % | |||||||||||||||||||||||||
| Deposits | 155,124,138 | 27,842,675 | 9,843,772 | 59,468,640 | 252,279,225 | 34.7 | 231,919,355 | 36.2 | ||||||||||||||||||||||||
| Deposits received under securities repurchase agreements | 145,242,600 | 15,524,689 | 14,346,696 | 120,022,467 | 295,136,452 | 40.6 | 245,271,713 | 38.3 | ||||||||||||||||||||||||
| Funds from acceptance and issuance of securities | 3,192,882 | 14,769,607 | 7,812,588 | 24,896,558 | 50,671,635 | 7.0 | 57,044,035 | 8.9 | ||||||||||||||||||||||||
| Borrowings and onlending | 4,205,855 | 16,155,881 | 17,245,599 | 35,693,745 | 73,301,080 | 10.1 | 56,853,778 | 8.9 | ||||||||||||||||||||||||
| Subordinated debt(*) | 251,720 | 569,820 | 3,525,732 | 50,922,844 | 55,270,116 | 7.6 | 49,342,036 | 7.7 | ||||||||||||||||||||||||
| Total | 308,017,195 | 74,862,672 | 52,774,387 | 291,004,254 | 726,658,508 | 640,430,917 | ||||||||||||||||||||||||||
| % per maturity term | 42.4 | 10.3 | 7.3 | 40.0 | ||||||||||||||||||||||||||||
| Total – 09/30/2012 | 242,826,539 | 66,734,015 | 51,983,654 | 278,886,709 | 640,430,917 | |||||||||||||||||||||||||||
| % per maturity term | 38.0 | 10.4 | 8.1 | 43.5 | ||||||||||||||||||||||||||||
(*) Includes R$ 876,589 (R$ 798,296 at 09/30/2012) of Redeemable Preferred Shares classified under Minority Interest in Balance Sheet.
| b) | Deposits |
| 09/30/2013 | 09/30/2012 | |||||||||||||||||||||||||||||||
| 0-30 | 31-180 | 181-365 | Over 365 days | Total | % | Total | % | |||||||||||||||||||||||||
| Demand deposits | 37,816,640 | - | - | - | 37,816,640 | 15.0 | 29,817,694 | 12.9 | ||||||||||||||||||||||||
| Savings accounts | 98,227,575 | - | - | - | 98,227,575 | 38.9 | 77,413,953 | 33.4 | ||||||||||||||||||||||||
| Interbank | 1,850,621 | 3,451,294 | 2,022,091 | 355,763 | 7,679,769 | 3.0 | 9,515,852 | 4.0 | ||||||||||||||||||||||||
| Time deposits | 17,229,302 | 24,391,381 | 7,821,681 | 59,112,877 | 108,555,241 | 43.1 | 115,171,856 | 49.7 | ||||||||||||||||||||||||
| Total | 155,124,138 | �� | 27,842,675 | 9,843,772 | 59,468,640 | 252,279,225 | 231,919,355 | |||||||||||||||||||||||||
| % per maturity term | 61.5 | 11.0 | 3.9 | 23.6 | ||||||||||||||||||||||||||||
| Total – 09/30/2012 | 127,105,134 | 20,818,387 | 11,718,292 | 72,277,542 | 231,919,355 | |||||||||||||||||||||||||||
| % per maturity term | 54.8 | 9.0 | 5.1 | 31.1 | ||||||||||||||||||||||||||||
ITAÚ UNIBANCO HOLDING’s portfolio is composed of interbank deposits in the amount of R$ 104,110 at 09/30/2013 with maturity of 31 to 180 days (R$ 5,154,518 at 09/30/2012, with maturity of 31 to 180 days).
| c) | Deposits received under securities repurchase agreements |
| 09/30/2013 | 09/30/2012 | |||||||||||||||||||||||||||||||
| 0 - 30 | 31 - 180 | 181 - 365 | Over 365 days | Total | % | Total | % | |||||||||||||||||||||||||
| Own portfolio | 44,977,468 | 14,323,305 | 14,330,051 | 91,064,610 | 164,695,434 | 55.8 | 161,747,280 | 65.9 | ||||||||||||||||||||||||
| Government securities | 28,988,986 | 355,665 | 12,430 | 2,837 | 29,359,918 | 9.9 | 28,283,422 | 11.5 | ||||||||||||||||||||||||
| Own issue | 2,022,018 | 13,967,640 | 14,317,621 | 91,061,773 | 121,369,052 | 41.1 | 121,776,968 | 49.6 | ||||||||||||||||||||||||
| Foreign | 13,966,464 | - | - | - | 13,966,464 | 4.8 | 11,686,890 | 4.8 | ||||||||||||||||||||||||
| Third-party portfolio | 100,213,945 | 2,574 | - | - | 100,216,519 | 34.0 | 66,487,407 | 27.2 | ||||||||||||||||||||||||
| Free portfolio | 51,187 | 1,198,810 | 16,645 | 28,957,857 | 30,224,499 | 10.2 | 17,037,026 | 6.9 | ||||||||||||||||||||||||
| Total | 145,242,600 | 15,524,689 | 14,346,696 | 120,022,467 | 295,136,452 | 245,271,713 | ||||||||||||||||||||||||||
| % per maturity term | 49.2 | 5.3 | 4.9 | 40.6 | ||||||||||||||||||||||||||||
| Total – 09/30/2012 | 108,261,853 | 10,884,385 | 14,977,778 | 111,147,697 | 245,271,713 | |||||||||||||||||||||||||||
| % per maturity term | 44.1 | 4.4 | 6.1 | 45.4 | ||||||||||||||||||||||||||||
| d) | Funds from acceptance and issuance of securities |
| 09/30/2013 | 09/30/2012 | |||||||||||||||||||||||||||||||
| 0-30 | 31-180 | 181-365 | Over 365 days | Total | % | Total | % | |||||||||||||||||||||||||
| Funds from bills: | 2,435,540 | 11,765,012 | 5,451,337 | 14,624,349 | 34,276,238 | 67.6 | 39,823,317 | 69.8 | ||||||||||||||||||||||||
| Financial | 441,971 | 4,428,827 | 2,340,464 | 9,421,846 | 16,633,108 | 32.8 | 19,256,162 | 33.7 | ||||||||||||||||||||||||
| Of real estate loans | 1,022,609 | 5,157,853 | 1,666,122 | 1,981,932 | 9,828,516 | 19.4 | 15,444,447 | 27.1 | ||||||||||||||||||||||||
| Bill of credit related to agribusiness | 962,869 | 2,168,647 | 1,422,850 | 3,068,595 | 7,622,961 | 15.0 | 4,880,619 | 8.6 | ||||||||||||||||||||||||
| Mortgage notes | 8,091 | 9,685 | 21,901 | 151,976 | 191,653 | 0.4 | 242,089 | 0.4 | ||||||||||||||||||||||||
| Debentures | 220 | - | - | - | 220 | 0.0 | 2,616,549 | 4.6 | ||||||||||||||||||||||||
| Foreign securities | 757,122 | 3,004,595 | 2,361,251 | 10,272,209 | 16,395,177 | 32.4 | 14,604,169 | 25.6 | ||||||||||||||||||||||||
| Non-trade related – issued abroad | 757,122 | 3,004,595 | 2,361,251 | 10,272,209 | 16,395,177 | 32.4 | 14,604,169 | 25.6 | ||||||||||||||||||||||||
| Brazil risk note programme | 641,787 | 1,894,902 | 1,340,245 | 2,639,042 | 6,515,976 | 12.9 | 7,309,069 | 12.8 | ||||||||||||||||||||||||
| Structure note issued | 91,257 | 451,991 | 697,625 | 3,229,781 | 4,470,654 | 8.8 | 3,863,460 | 6.8 | ||||||||||||||||||||||||
| Bonds | 4,426 | 50,250 | 53,675 | 2,896,493 | 3,004,844 | 5.9 | 1,778,818 | 3.1 | ||||||||||||||||||||||||
| Fixed rate notes | 18,218 | 533,279 | 98,743 | 1,271,135 | 1,921,375 | 3.8 | 1,248,721 | 2.2 | ||||||||||||||||||||||||
| Eurobonds | 1,434 | 14,780 | - | 120,958 | 137,172 | 0.3 | 306,486 | 0.5 | ||||||||||||||||||||||||
| Other | - | 59,393 | 170,963 | 114,800 | 345,156 | 0.7 | 97,615 | 0.2 | ||||||||||||||||||||||||
| Total | 3,192,882 | 14,769,607 | 7,812,588 | 24,896,558 | 50,671,635 | 57,044,035 | ||||||||||||||||||||||||||
| % per maturity term | 6.3 | 29.2 | 15.4 | 49.1 | ||||||||||||||||||||||||||||
| Total – 09/30/2012 | 3,711,197 | 18,897,422 | 10,245,237 | 24,190,179 | 57,044,035 | |||||||||||||||||||||||||||
| % per maturity term | 6.5 | 33.1 | 18.0 | 42.4 | ||||||||||||||||||||||||||||
ITAÚ UNIBANCO HOLDING’s portfolio is composed of Brazil Risk Note Programme with maturity of 31 days to 180 days in the amount of R$ 18,667 (R$ 18,667 at 09/30/2012) and over 365 days in the amount of R$ 500,000 (R$ 500,000 at 09/30/2012), totaling R$ 518,667 (R$ 518,667 at 09/30/2012).
| e) | Borrowings and onlending |
| 09/30/2013 | 09/30/2012 | |||||||||||||||||||||||||||||||
| 0-30 | 31-180 | 181-365 | Over 365 days | Total | % | Total | % | |||||||||||||||||||||||||
| Borrowings | 3,117,990 | 10,797,689 | 11,515,364 | 6,515,533 | 31,946,576 | 43.6 | 21,993,818 | 38.7 | ||||||||||||||||||||||||
| Domestic | 375,430 | 62,577 | 156,407 | 191,371 | 785,785 | 1.1 | 413,787 | 0.7 | ||||||||||||||||||||||||
| Foreign(*) | 2,742,560 | 10,735,112 | 11,358,957 | 6,324,162 | 31,160,791 | 42.5 | 21,580,031 | 38.0 | ||||||||||||||||||||||||
| Onlending | 1,087,865 | 5,358,192 | 5,730,235 | 29,178,212 | 41,354,504 | 56.4 | 34,859,960 | 61.3 | ||||||||||||||||||||||||
| Domestic – official institutions | 1,087,865 | 4,892,166 | 5,730,235 | 29,012,166 | 40,722,432 | 55.6 | 34,255,869 | 60.3 | ||||||||||||||||||||||||
| BNDES | 374,302 | 1,172,656 | 1,476,781 | 9,173,202 | 12,196,941 | 16.6 | 10,303,634 | 18.1 | ||||||||||||||||||||||||
| FINAME | 647,952 | 3,481,616 | 4,110,840 | 19,671,802 | 27,912,210 | 38.1 | 23,553,949 | 41.4 | ||||||||||||||||||||||||
| Other | 65,611 | 237,894 | 142,614 | 167,162 | 613,281 | 0.8 | 398,286 | 0.7 | ||||||||||||||||||||||||
| Foreign | - | 466,026 | - | 166,046 | 632,072 | 0.9 | 604,091 | 1.1 | ||||||||||||||||||||||||
| Total | 4,205,855 | 16,155,881 | 17,245,599 | 35,693,745 | 73,301,080 | 56,853,778 | ||||||||||||||||||||||||||
| % per maturity term | 5.8 | 22.0 | 23.5 | 48.7 | ||||||||||||||||||||||||||||
| Total – 09/30/2012 | 2,581,440 | 12,750,347 | 14,961,024 | 26,560,967 | 56,853,778 | |||||||||||||||||||||||||||
| % per maturity term | 4.5 | 22.4 | 26.3 | 46.7 | ||||||||||||||||||||||||||||
(*) Foreign borrowings are basically represented by foreign exchange transactions related to export pre-financing and import financing.
| f) | Subordinated debt |
| 09/30/2013 | 09/30/2012 | |||||||||||||||||||||||||||||||
| 0-30 | 31-180 | 181-365 | Over 365 days | Total | % | Total | % | |||||||||||||||||||||||||
| CDB | - | 127,830 | 3,507,305 | 8,198,429 | 11,833,564 | 21.4 | 15,373,772 | 31.2 | ||||||||||||||||||||||||
| Financial treasury bills | 181,758 | 257,620 | 9,494 | 24,349,483 | 24,798,355 | 44.9 | 20,712,197 | 42.0 | ||||||||||||||||||||||||
| Euronotes | 63,369 | 184,370 | - | 17,376,621 | 17,624,360 | 31.9 | 12,175,570 | 24.7 | ||||||||||||||||||||||||
| Bonds | 6,593 | - | 8,894 | 182,661 | 198,148 | 0.4 | 326,927 | 0.7 | ||||||||||||||||||||||||
| (-) Transaction costs incurred (Note 4b) | - | - | - | (60,900 | ) | (60,900 | ) | (0.1 | ) | (44,726 | ) | (0.1 | ) | |||||||||||||||||||
| Total Other Liabilities | 251,720 | 569,820 | 3,525,693 | 50,046,294 | 54,393,527 | 48,543,740 | ||||||||||||||||||||||||||
| Redeemable preferred shares | - | - | 39 | 876,550 | 876,589 | 1.6 | 798,296 | 1.6 | ||||||||||||||||||||||||
| Grand total(*) | 251,720 | 569,820 | 3,525,732 | 50,922,844 | 55,270,116 | 49,342,036 | ||||||||||||||||||||||||||
| % per maturity term | 0.5 | 1.0 | 6.4 | 92.1 | ||||||||||||||||||||||||||||
| Total – 09/30/2012 | 1,166,915 | 3,383,474 | 81,323 | 44,710,324 | 49,342,036 | |||||||||||||||||||||||||||
| % per maturity term | 2.4 | 6.9 | 0.2 | 90.6 | ||||||||||||||||||||||||||||
(*) The amount of R$ 53,949,412(R$ 44,980,135 at 09/30/2012) is included in the Referential Equity, using the proportionalities set forth in CMN Resolution No. 3,444 of February 28, 2007 and changes made by CMN Resolution No. 3,532 of January 31, 2008.
| Description | ||||||||||||||||||
| Name of security / currency | Principal amount (original currency) | Issue | Maturity | Return p.a. | Account balance | |||||||||||||
| Subordinated CDB - BRL | ||||||||||||||||||
| 40,000 | 2003 | 2013 | 102% of CDI | 127,829 | ||||||||||||||
| 1,864,500 | 2007 | 2014 | 100% of CDI + 0.35% to 0.6 | 3,525,371 | ||||||||||||||
| 33,200 | IGPM + 7.22% | 73,787 | ||||||||||||||||
| 1,000,000 | 2008 | 2014 | 112% of CDI | 1,652,333 | ||||||||||||||
| 400,000 | 2008 | 2015 | 119.8% of CDI | 701,248 | ||||||||||||||
| 50,000 | 2010 | 2015 | 113% of CDI | 72,938 | ||||||||||||||
| 465,835 | 2006 | 2016 | 100% of CDI + 0.7% (*) | 947,161 | ||||||||||||||
| 2,719,268 | 2010 | 2016 | 110% to 114% of CDI | 3,965,632 | ||||||||||||||
| 122,500 | IPCA + 7.21% | 191,495 | ||||||||||||||||
| 366,830 | 2010 | 2017 | IPCA + 7.33% | 575,770 | ||||||||||||||
| Total | 11,833,564 | |||||||||||||||||
| Subordinated financial bills - BRL | ||||||||||||||||||
| 365,000 | 2010 | 2016 | 100% of CDI + 1.35% to 1.36% | 368,964 | ||||||||||||||
| 1,874,000 | 112% to 112.5% of CDI | 1,893,684 | ||||||||||||||||
| 30,000 | IPCA + 7% | 42,588 | ||||||||||||||||
| 206,000 | 2010 | 2017 | IPCA + 6.95% to 7.2% | 254,505 | ||||||||||||||
| 3,223,500 | 2011 | 2017 | 108% to 112% of CDI | 3,313,263 | ||||||||||||||
| 352,400 | IPCA + 6.15% to 7.8% | 436,860 | ||||||||||||||||
| 138,000 | IGPM + 6.55% to 7.6% | 176,678 | ||||||||||||||||
| 3,650,000 | 100% of CDI + 1.29% to 1.52% | 3,740,509 | ||||||||||||||||
| 500,000 | 2012 | 2017 | 100% of CDI + 1.12% | 515,732 | ||||||||||||||
| 42,000 | 2011 | 2018 | IGPM + 7% | 50,607 | ||||||||||||||
| 30,000 | IPCA + 7.53% to 7.7% | 35,523 | ||||||||||||||||
| 460,645 | 2012 | 2018 | IPCA + 4.40% to 6.58% | 537,674 | ||||||||||||||
| 3,782,100 | 100% of CDI + 1.01% to 1.32% | 3,891,213 | ||||||||||||||||
| 6,373,127 | 108% to 113% of CDI | 6,647,423 | ||||||||||||||||
| 112,000 | 9.95% to 11.95% | 126,491 | ||||||||||||||||
| 2,000 | 2011 | 2019 | 109% to 109.7% of CDI | 2,367 | ||||||||||||||
| 12,000 | 2012 | 2019 | 11.96% | 14,364 | ||||||||||||||
| 100,500 | IPCA + 4.70% to 6.30% | 114,752 | ||||||||||||||||
| 1,000 | 110% of CDI | 1,159 | ||||||||||||||||
| 20,000 | 2012 | 2020 | IPCA + 6.00% to 6.17% | 23,911 | ||||||||||||||
| 1,000 | 111% of CDI | 1,161 | ||||||||||||||||
| 6,000 | 2011 | 2021 | 109.25% to 110.50% of CDI | 7,268 | ||||||||||||||
| 2,306,500 | 2012 | 2022 | IPCA + 5.15% to 5.83% | 2,580,773 | ||||||||||||||
| 20,000 | IGPM + 4.63% | 20,886 | ||||||||||||||||
| Total | 24,798,355 | |||||||||||||||||
| Subordinated euronotes - USD | ||||||||||||||||||
| 1,000,000 | 2010 | 2020 | 6.2% | 2,286,834 | ||||||||||||||
| 1,000,000 | 2010 | 2021 | 5.75% | 2,247,853 | ||||||||||||||
| 750,000 | 2011 | 2021 | 5.75% to 6.2% | 1,713,483 | ||||||||||||||
| 550,000 | 2012 | 2021 | 6.2% | 1,239,457 | ||||||||||||||
| 2,625,000 | 2012 | 2022 | 5.50% to 5.65% | 5,823,808 | ||||||||||||||
| 1,870,000 | 2012 | 2023 | 5.13% | 4,252,025 | ||||||||||||||
| Total | 17,563,460 | |||||||||||||||||
| Subordinated bonds - CLP | 41,528,200 | 2008 | 2033 | 3.5% to 4.5% | 198,148 | |||||||||||||
| Preferred shares - USD | 393,072 | 2002 | 2015 | 3.04% | 876,589 | |||||||||||||
| �� | ||||||||||||||||||
| Total | 55,270,116 | |||||||||||||||||
(*) Subordinated CDBs may be redeemed as from November 2011.
ITAÚ UNIBANCO HOLDING’s portfolio is composed of Subordinated Euronotes with maturity of up to 30 days in the amount of R$ 62,732 (R$ 57,703 at 09/30/2012), with maturity of 31 to 180 days in the amount of R$ 184,370 (R$ 93,285 09/30/2012) and over 365 days in the amount of R$ 17,316,359 (R$ 11,979,856 at 09/30/2012), totaling R$ 17,563,461 (R$ 12,130,844 at 09/30/2012).
Note 11 - Insurance, pension plan and capitalization operations
| a) | Composition of the technical provisions per segment |
| Insurance | Pension plan | Capitalization | Total | |||||||||||||||||||||||||||||
| 09/30/2013 | 09/30/2012 | 09/30/2013 | 09/30/2012 | 09/30/2013 | 09/30/2012 | 09/30/2013 | 09/30/2012 | |||||||||||||||||||||||||
| Unearned premiums | 5,311,243 | 4,658,994 | 8,689 | 5,012 | - | - | 5,319,932 | 4,664,006 | ||||||||||||||||||||||||
| Mathematical provision of benefits to be granted and benefits granted | 18,626 | 19,312 | 84,537,923 | 74,396,741 | - | - | 84,556,549 | 74,416,053 | ||||||||||||||||||||||||
| Redemptions and Other Unsettled Amounts | 18,786 | 16,822 | 57,219 | 54,144 | - | - | 76,005 | 70,966 | ||||||||||||||||||||||||
| Financial surplus | 1,336 | 1,455 | 491,909 | 494,045 | - | - | 493,245 | 495,500 | ||||||||||||||||||||||||
| Unsettled claims | 3,032,555 | 2,497,174 | 93,790 | 89,305 | - | - | 3,126,345 | 2,586,479 | ||||||||||||||||||||||||
| Claims / events incurred but not reported (IBNR) | 845,090 | 827,812 | 12,188 | 11,937 | - | - | 857,278 | 839,749 | ||||||||||||||||||||||||
| Administrative and Related Expenses | 177,531 | 162,102 | 41,147 | 50,027 | 25,715 | 8,795 | 244,393 | 220,924 | ||||||||||||||||||||||||
| Mathematics for Capitalization and Redemptions | - | - | - | - | 2,936,922 | 2,846,963 | 2,936,922 | 2,846,963 | ||||||||||||||||||||||||
| Raffles Payable and To Be Held | - | - | - | - | 21,890 | 16,922 | 21,890 | 16,922 | ||||||||||||||||||||||||
| Complementary Raffles | - | - | - | - | 4,950 | 16,758 | 4,950 | 16,758 | ||||||||||||||||||||||||
| Other provisions | 336,813 | 357,753 | 779,269 | 737,926 | 4,013 | 11,059 | 1,120,095 | 1,106,738 | ||||||||||||||||||||||||
| Total(*) | 9,741,980 | 8,541,424 | 86,022,134 | 75,839,137 | 2,993,490 | 2,900,497 | 98,757,604 | 87,281,058 | ||||||||||||||||||||||||
(*) This table covers the amendments established by Susep Circular No. 462, of 03/01/2013, also for comparison purposes.
The Liability adequacy test did not show any deficiency in this period.
| b) | Assets guaranteeing technical provisions - SUSEP |
| Insurance | Pension plan | Capitalization | Total | |||||||||||||||||||||||||||||
| 09/30/2013 | 09/30/2012 | 09/30/2013 | 09/30/2012 | 09/30/2013 | 09/30/2012 | 09/30/2013 | 09/30/2012 | |||||||||||||||||||||||||
| Interbank investments – money market | 1,264,457 | 690,857 | 823,637 | 802,895 | 1,019,307 | 1,056,449 | 3,107,401 | 2,550,201 | ||||||||||||||||||||||||
| Securities and derivative financial instruments | 3,433,056 | 3,361,790 | 85,346,004 | 75,328,224 | 2,088,865 | 1,943,253 | 90,867,925 | 80,633,267 | ||||||||||||||||||||||||
| PGBL/VGBL fund quotas(1) | - | - | 79,779,392 | 69,856,629 | - | - | 79,779,392 | 69,856,629 | ||||||||||||||||||||||||
| Government securities - domestic | - | - | 54,364,276 | 46,518,109 | - | - | 54,364,276 | 46,518,109 | ||||||||||||||||||||||||
| National treasury bills | - | - | 27,138,210 | 12,143,413 | - | - | 27,138,210 | 12,143,413 | ||||||||||||||||||||||||
| National treasury notes | - | - | 25,682,006 | 29,353,009 | - | - | 25,682,006 | 29,353,009 | ||||||||||||||||||||||||
| Financial treasury bills | - | - | 1,544,060 | 5,021,687 | - | - | 1,544,060 | 5,021,687 | ||||||||||||||||||||||||
| Corporate securities | - | - | 25,101,742 | 23,015,851 | - | - | 25,101,742 | 23,015,851 | ||||||||||||||||||||||||
| Bank deposit certificates | - | - | 2,843,376 | 5,122,402 | - | - | 2,843,376 | 5,122,402 | ||||||||||||||||||||||||
| Debentures | - | - | 3,733,304 | 2,483,517 | - | - | 3,733,304 | 2,483,517 | ||||||||||||||||||||||||
| Shares | - | - | 1,093,063 | 1,469,220 | - | - | 1,093,063 | 1,469,220 | ||||||||||||||||||||||||
| Credit note | - | - | 245,618 | 806,749 | - | - | 245,618 | 806,749 | ||||||||||||||||||||||||
| Financial treasury bills | - | - | 17,183,832 | 13,128,335 | - | - | 17,183,832 | 13,128,335 | ||||||||||||||||||||||||
| Securitized real estate loans | - | - | 2,549 | 5,628 | - | - | 2,549 | 5,628 | ||||||||||||||||||||||||
| PGBL/VGBL fund quotas | - | - | 324,138 | 389,174 | - | - | 324,138 | 389,174 | ||||||||||||||||||||||||
| Derivative financial instruments | - | - | 71,318 | 25,634 | - | - | 71,318 | 25,634 | ||||||||||||||||||||||||
| Loans for Shares | - | - | (44,493 | ) | - | - | - | - | - | |||||||||||||||||||||||
| Accounts receivable / (payable) | - | - | (37,589 | ) | (92,139 | ) | - | - | (37,589 | ) | (92,139 | ) | ||||||||||||||||||||
| Other assets | 3,433,056 | 3,361,790 | 5,566,612 | 5,471,595 | 2,088,865 | 1,943,253 | 11,088,533 | 10,776,638 | ||||||||||||||||||||||||
| Government | 1,020,254 | 1,122,232 | 4,429,760 | 4,219,841 | 50,869 | 273,426 | 5,500,883 | 5,615,499 | ||||||||||||||||||||||||
| Private | 2,412,802 | 2,239,558 | 1,136,852 | 1,251,754 | 2,037,996 | 1,669,827 | 5,587,650 | 5,161,139 | ||||||||||||||||||||||||
| Receivables from insurance and reinsurance operations(2) | 5,368,212 | 4,578,916 | - | - | - | - | 5,368,212 | 4,578,916 | ||||||||||||||||||||||||
| Credit rights | 990,116 | 1,114,637 | - | - | - | - | 990,116 | 1,114,637 | ||||||||||||||||||||||||
| Commercial – extended guarantee | 1,307,185 | 1,290,864 | - | - | - | - | 1,307,185 | 1,290,864 | ||||||||||||||||||||||||
| Reinsurance | 3,070,911 | 2,173,415 | - | - | - | - | 3,070,911 | 2,173,415 | ||||||||||||||||||||||||
| Total | 10,065,725 | 8,631,563 | 86,169,641 | 76,131,119 | 3,108,172 | 2,999,702 | 99,343,538 | 87,762,384 | ||||||||||||||||||||||||
(1) The PGBL and VGBL plans securities portfolios, the ownership and embedded risks of which are the customer’s responsibility, are recorded as securities – trading securities, with a contra-entry to long-term liabilities in Pension Plan Technical Provisions account, as determined by SUSEP.
(2) Recorded under Other receivables and Other assets.
c) Financial and operating income per segment
| Insurance | Pension plan | Capitalization | Total | |||||||||||||||||||||||||||||||||||||||||||||||||||||||||||||
| 01/01 to 09/30/2013 | 01/01 to 09/30/2012 | 01/01 to 09/30/2013 | 01/01 to 09/30/2012 | 01/01 to | 01/01 to | 01/01 to | 01/01 to | |||||||||||||||||||||||||||||||||||||||||||||||||||||||||
| Direct | Reinsurance | Withheld | Direct | Reinsurance | Withheld | Direct | Reinsurance | Withheld | Direct | Reinsurance | Withheld | 09/30/2013 | 09/30/2012 | 09/30/2013 | 09/30/2012 | |||||||||||||||||||||||||||||||||||||||||||||||||
| Financial income from insurance, pension plan and capitalization operations | 117,350 | - | 117,350 | 250,789 | - | 250,789 | 165,748 | - | 165,748 | 161,185 | - | 161,185 | 57,303 | 98,769 | 340,401 | 510,743 | ||||||||||||||||||||||||||||||||||||||||||||||||
| Financial income | 178,746 | - | 178,746 | 277,635 | - | 277,635 | 1,897,736 | - | 1,897,736 | 4,819,833 | - | 4,819,833 | 164,941 | 216,612 | 2,241,423 | 5,314,080 | ||||||||||||||||||||||||||||||||||||||||||||||||
| Financial expenses | (61,396 | ) | - | (61,396 | ) | (26,846 | ) | - | (26,846 | ) | (1,731,988 | ) | - | (1,731,988 | ) | (4,658,648 | ) | - | (4,658,648 | ) | (107,638 | ) | (117,843 | ) | (1,901,022 | ) | (4,803,337 | ) | ||||||||||||||||||||||||||||||||||||
| Operating income from insurance, pension plan and capitalization operations | 2,535,789 | (403,750 | ) | 2,132,039 | 1,746,140 | (77,561 | ) | 1,668,579 | 146,485 | (4,505 | ) | 141,980 | 76,034 | (589 | ) | 75,445 | 375,806 | 377,498 | 2,649,825 | 2,121,522 | ||||||||||||||||||||||||||||||||||||||||||||
| Premiums and contributions | 6,006,548 | (1,152,513 | ) | 4,854,035 | 5,193,445 | (878,597 | ) | 4,314,848 | 11,838,065 | (5,198 | ) | 11,832,867 | 12,401,643 | (4,973 | ) | 12,396,670 | 1,755,894 | 1,503,479 | 18,442,796 | 18,214,997 | ||||||||||||||||||||||||||||||||||||||||||||
| Changes in technical provisions | (618,733 | ) | 260,436 | (358,297 | ) | (451,151 | ) | 147,096 | (304,055 | ) | (11,689,229 | ) | - | (11,689,229 | ) | (12,299,414 | ) | - | (12,299,414 | ) | (32,873 | ) | (5,575 | ) | (12,080,399 | ) | (12,609,044 | ) | ||||||||||||||||||||||||||||||||||||
| Expenses for claims, benefits, redemptions and raffles | (2,036,089 | ) | 439,892 | (1,596,197 | ) | (2,146,843 | ) | 607,346 | (1,539,497 | ) | 3,081 | - | 3,081 | (20,841 | ) | 4,384 | (16,457 | ) | (1,357,471 | ) | (1,122,974 | ) | (2,950,587 | ) | (2,678,928 | ) | ||||||||||||||||||||||||||||||||||||||
| Selling expenses | (800,009 | ) | 48,435 | (751,574 | ) | (804,810 | ) | 46,594 | (758,216 | ) | (2,818 | ) | - | (2,818 | ) | (2,077 | ) | - | (2,077 | ) | - | (2,431 | ) | (754,392 | ) | (762,724 | ) | |||||||||||||||||||||||||||||||||||||
| Other operating revenues and expenses | (15,928 | ) | - | (15,928 | ) | (44,501 | ) | - | (44,501 | ) | (2,614 | ) | 693 | (1,921 | ) | (3,277 | ) | - | (3,277 | ) | 10,256 | 4,999 | (7,593 | ) | (42,779 | ) | ||||||||||||||||||||||||||||||||||||||
| Total result from insurance, pension plan and capitalization operations | 2,653,139 | (403,750 | ) | 2,249,389 | 1,996,929 | (77,561 | ) | 1,919,368 | 312,233 | (4,505 | ) | 307,728 | 237,219 | (589 | ) | 236,630 | 433,109 | 476,267 | 2,990,226 | 2,632,265 | ||||||||||||||||||||||||||||||||||||||||||||
Note 12 – Contingent assets and liabilities and legal liabilities – tax and social security
In the ordinary course of its businesses, ITAÚ UNIBANCO HOLDING CONSOLIDATED is involved in contingencies that may be classified as follows.
a) Contingent Assets:there are no contingent assets recorded.
b) Provisions and contingencies:The criteria to quantify contingencies are adequate in relation to the specific characteristics of civil, labor and tax lawsuits portfolios, as well as other risks.
| - | Civil lawsuits: |
Collective lawsuits (related to claims considered similar and which each individual amount is not considered significant):contingencies are determined on a monthly basis and the expected amount of losses is accrued according to statistical references that take into account the type of lawsuit and the characteristics of the legal body (Small Claims Court or Regular Court).
Individual lawsuits (related to claims with unusual characteristics or involving significant amounts):determined from time to time, based on the amount claimed and the likelihood of loss, which, in turn, is estimated according to the “de facto” and “de jure” characteristics related to such lawsuit.The amounts of losses which likelihood of loss is considered probable are accrued.
Contingencies usually arise from revision of contracts and compensation for property damage and pain and suffering; most of these lawsuits are filed in the Small Claims Court and therefore limited to 40 minimum monthly wages.ITAÚ UNIBANCO HOLDING is also party to specific lawsuits over the charging of understated inflation adjustment to savings accounts in connection with economic plans.
The case law at the Federal Supreme Court is favorable to banks in relation to an economic phenomenon similar to savings, as in the case of adjustment to time deposits and contracts in general.Additionally, the Superior Court of Justice has decided that the term for filing public civil actions over understated inflation is five years.In view of such decision, some of the lawsuits may be dismissed because they were filed after the five-year period.
In the accounting books no amount is recognized in relation to Civil lawsuits which likelihood of loss is considered possible, which total estimated risk is R$ 1,893,223 (R$ 1,647,949 at September 30, 2012) and main natures of these lawsuits refer to claims form compensation or collections, the individual amounts of which are not significant.
| - | Labor claims |
Collective lawsuits (related to claims considered similar and which each individual amount is not considered significant):The expected amount of loss is determined and accrued monthly according to the statistical share pricing model, plus the average cost of fees.These are adjusted to the amounts deposited as guarantee for their execution when realized.
Individual lawsuits (related to claims with unusual characteristics or involving significant amounts):determined from time to time, based on the amount claimed and the likelihood of loss, which, in turn, is estimated according to the “de facto” and “de jure” characteristics related to such lawsuit.The amounts of losses which likelihood of loss is considered probable are accrued.
Contingencies are related to lawsuits in which alleged labor rights based on labor legislation specific to the related profession, such as overtime, salary equalization, reinstatement, transfer allowance, pension plan supplement and other, are discussed.
There are no labor claimsof significant amounts falling under the category of possible loss.
| - | Other Risks |
These are quantified and accrued mainly based on the evaluation of rural credit transactions with joint liability and FCVS (salary variations compensation fund) credits assigned to Banco Nacional.
The table below shows the changes in the respective provisions for contingent liabilities and the respective escrow deposits balances:
| 01/01 to 09/30/2013 | 01/01 to 09/30/2012 | |||||||||||||||||||
| Civil | Labor | Other | Total | Total | ||||||||||||||||
| Opening balance | 3,731,588 | 4,852,246 | 192,303 | 8,776,137 | 7,344,812 | |||||||||||||||
| Effect of change in consolidation criteria (Note 2b) | 13,105 | 14,043 | �� | 9 | 27,157 | - | ||||||||||||||
| (-) Contingencies guaranteed by indemnity clauses (Note 4n I) | (118,176 | ) | (948,237 | ) | - | (1,066,413 | ) | (1,066,563 | ) | |||||||||||
| Subtotal | 3,626,517 | 3,918,052 | 192,312 | 7,736,881 | 6,278,249 | |||||||||||||||
| Monetary restatement/charges | 144,200 | 150,801 | - | 295,001 | 188,553 | |||||||||||||||
| Changes in the period reflected in results (Notes 13f and 13i) | 1,160,289 | 1,076,956 | 22,952 | 2,260,197 | 2,160,763 | |||||||||||||||
| Increase(*) | 1,681,817 | 1,216,680 | 25,097 | 2,923,594 | 2,720,600 | |||||||||||||||
| Reversal | (521,528 | ) | (139,724 | ) | (2,145 | ) | (663,397 | ) | (559,837 | ) | ||||||||||
| Payment | (1,264,848 | ) | (946,101 | ) | - | (2,210,949 | ) | (1,938,586 | ) | |||||||||||
| Subtotal | 3,666,158 | 4,199,708 | 215,264 | 8,081,130 | 6,688,979 | |||||||||||||||
| (+) Contingencies guaranteed by indemnity clauses (Note 4n I) | 134,998 | 844,304 | - | 979,302 | 969,325 | |||||||||||||||
| Closing balance (Note 13c) | 3,801,156 | 5,044,012 | 215,264 | 9,060,432 | 7,658,304 | |||||||||||||||
| Closing balance at 09/30/2012 (Note 13c) | 3,249,751 | 4,229,566 | 178,987 | 7,658,304 | ||||||||||||||||
| Escrow deposits at 09/30/2013 (Note 13a) | 2,166,345 | 2,372,596 | - | 4,538,941 | ||||||||||||||||
| Escrow deposits at 09/30/2012 (Note 13a) | 2,048,533 | 2,437,948 | - | 4,486,481 | ||||||||||||||||
(*) Civil provisions include the provision for economic plans amounting to R$175,978(R$ 202,097from January 1 to September 30, 2012) (Note 22k).
| - | Tax and social security lawsuits |
Contingencies are equivalent to the principal amount of taxes involved in tax, administrative or judicial challenges, subject to tax assessment notices, plus interest and, when applicable, fines and charges. The amount is accrued when it involves legal obligation, regardless of the likelihood of loss, that is, a favorable outcome to the institution is dependent upon the recognition of the unconstitutionality of the applicable law in force. In other cases, the Bank recognizes a provision whenever the likelihood of loss is probable.
The table below shows the changes in the provisions and respective escrow deposits for Tax and Social Security lawsuits balances:
| 01/01 to 09/30/2013 | 01/01 to 09/30/2012 | |||||||||||||||
| Provisions | Legal obligation | Contingencies | Total | Total | ||||||||||||
| Opening balance | 7,612,614 | 2,820,991 | 10,433,605 | 8,644,552 | ||||||||||||
| Effect of change in consolidation criteria (Note 2b) | 7,870 | 1,590 | 9,460 | - | ||||||||||||
| (-) Contingencies guaranteed by indemnity clauses | - | (61,198 | ) | (61,198 | ) | (57,438 | ) | |||||||||
| Subtotal | 7,620,484 | 2,761,383 | 10,381,867 | 8,587,114 | ||||||||||||
| Monetary restatement/charges | 287,622 | 84,730 | 372,352 | 697,458 | ||||||||||||
| Changes in the period reflected in results | 242,592 | 83,001 | 325,593 | 351,434 | ||||||||||||
| Increase | 438,010 | 116,414 | 554,424 | 572,662 | ||||||||||||
| Reversal | (195,418 | ) | (33,413 | ) | (228,831 | ) | (221,228 | ) | ||||||||
| Payment | (393,802 | ) | (73,266 | ) | (467,068 | ) | (74,528 | ) | ||||||||
| Subtotal | 7,756,896 | 2,855,848 | 10,612,744 | 9,561,478 | ||||||||||||
| (+) Contingencies guaranteed by indemnity clauses | - | 55,814 | 55,814 | 60,516 | ||||||||||||
| Closing balance (Note 13c and 14c) | 7,756,896 | 2,911,662 | 10,668,558 | 9,621,994 | ||||||||||||
| Closing balance at 09/30/2012 (Notes 13c and 14c) | 7,290,675 | 2,331,319 | 9,621,994 | - | ||||||||||||
| 01/01 to 09/30/2013 | 01/01 to 09/30/2012 | |||||||||||||||
| Escrow deposits | Legal obligation | Contingencies | Total | Total | ||||||||||||
| Opening balance | �� | 4,196,129 | 360,710 | 4,556,839 | 5,178,313 | |||||||||||
| Effect of change in consolidation criteria (Note 2b) | 8,211 | - | 8,211 | - | ||||||||||||
| Appropriation of income | 172,035 | 26,204 | 198,239 | 269,626 | ||||||||||||
| Changes in the period | 778,099 | 10,453 | 788,552 | 180,688 | ||||||||||||
| Deposited | 1,379,027 | 32,686 | 1,411,713 | 229,759 | ||||||||||||
| Withdrawals | (10,312 | ) | - | (10,312 | ) | (41,396 | ) | |||||||||
| Reversals to income | (590,616 | ) | (22,233 | ) | (612,849 | ) | (7,675 | ) | ||||||||
| Closing balance | 5,154,474 | 397,367 | 5,551,841 | 5,628,627 | ||||||||||||
| Relocated to assets pledged in guarantee of contingencies (Note 12d) | - | 1,255 | 1,255 | (896,067 | ) | |||||||||||
| Closing balance after relocated (Note 13a) | 5,154,474 | 398,622 | 5,553,096 | 4,732,560 | ||||||||||||
| Closing balance at 09/30/2012 (Note 13a) | 4,362,295 | 370,265 | 4,732,560 | |||||||||||||
The main discussions related to legal obligations are described as follows:
| · | PIS and COFINS – Calculation basis – R$ 3,172,875:we defend the levy of contributions on revenue, understood as the revenue from sales of assets and services.The corresponding escrow deposit balance totals R$ 1,725,801. |
| · | CSLL – Isonomy – R$ 2,344,295: as the law increased the CSLL rate for financial and insurance companies to 15%, we discuss the lack of constitutional support for this measure and, due to the principle of isonomy, we defend the levy at the regular rate of 9%.The corresponding escrow deposit balance totals R$ 623,284. |
| · | IRPJ and CSLL – Taxation of profits earned abroad – R$ 531,403: we discuss the calculation basis for levy of these taxes on profits earned abroad and the non-applicability of Regulatory Instruction SRF No. 213-02 in which it exceeds the suitability of the legal text.The corresponding escrow deposit balance totals R$ 491,773. |
| · | PIS – Principles of anteriority over 90 days and non-retroactivity – R$ 419,084:we request the rejection of Constitutional Amendments No. 10/96 and 17/97 in view of the principle of anteriority and non-retroactivity, aiming at making payments based on Supplementary Law No. 07/70. The corresponding escrow deposit totals R$ 91,698. |
Off-balance sheet contingencies - The amounts related to Tax and Social Security Lawsuits considered to be as possible loss, which total estimated risk is R$ 11,158,527, are the following:
| · | INSS – Non-compensatory amounts – R$ 2,497,689: we defend the non-taxation of these amounts, mainly profit sharing, stock option, transportation vouchers and sole bonus. |
| · | IRPJ, CSLL, PIS and COFINS – Request for offset dismissed – R$ 1,455,400: cases in which the liquidity and the offset credit certainty are discussed. |
| · | IRPJ and CSLL - Interest on capital - R$1,102,878: we defend the deductibility of interest on capital declared to stockholders based on the Brazilian long-term interest rate (TJLP) on the stockholders’ equity for the year and for prior years. |
| · | IRPJ and CSLL –Goodwill – Deduction– R$ 616,279:deductibility of goodwill on acquisition of investments with future expected profitability. |
| · | ISS – Banking Institutions – R$ 569,880: these are banking operations, which revenue may not be interpreted as price per service rendered and/or arises from activities not listed under a Supplementary Law. |
| · | IRPJ and CSLL - Losses and discounts on receipt of credits – R$ 478,217: deductibility of effective losses as operating expense – credit assignment and renegotiation. |
| · | INSS – Prevention Accident Factor (FAP) – R$ 395,435: adequacy of Insurance of Occupational Accident - SAT multiplier, in conformity with the number of Occupational Accident Notices. |
| · | IRPJ and CSLL – Profit made available abroad – R$ 352,897:discussion of the calculation basis for levy of these taxes on profits earned abroad. |
| · | IRPJ – Disallowance - offset of tax paid abroad – R$ 320,746: Cases in which the liquidity and certainty of credits offset in connection with income tax paid abroad by branches, main branches, controlled and affilated companies are analyzed. |
| · | IRPJ, CSLL, PIS and COFINS – Transfer of Shares to the “Nova Bolsa” – R$ 306,050: tax demanded in view of the share transfer process to the “Nova Bolsa”. |
| c) | Receivables - reimbursement of contingencies |
The receivables balance arising from reimbursements of contingencies totals R$ 738,426 (R$ 671,220 at 09/30/2012) (Note 13a), basically represented by the guarantee in the Banco Banerj S.A. privatization process occurred in 1997, in which the State of Rio de Janeiro created a fund to guarantee the equity recomposition of civil, labor and tax contingencies.
| d) | Assets pledged as contingencies |
Assets pledged in guarantee for contingencies are related to liability contingencies and restricted or deposited as presented below:
| 09/30/2013 | 09/30/2012 | |||||||
| Securities (basically financial treasury bills – Note 7b) | 1,272,341 | 1,427,341 | ||||||
| Deposits in guarantee (Note 13a) | 3,897,544 | 4,041,708 | ||||||
Escrow deposits are generally required to be made with the court in connection with lawsuits in Brazil and they are held by the court until a decision is made by the relevant court. In case of a decision against ITAÚ UNIBANCO HOLDING, the deposited amount is released from escrow and transferred to the counterparty in the lawsuit. In case of a decision in favor of ITAÚ UNIBANCO HOLDING, the deposited amount is released at the full amount deposited updated.
In general, provisions related to lawsuits of ITAÚ UNIBANCO HOLDING are long term, considering the time required for the termination of these lawsuits in the Brazilian judicial system, reason why estimate for specific year in which these lawsuits will be terminated have not been disclosed.
According to the opinion of its legal advisors, ITAÚ UNIBANCO HOLDING and its subsidiaries are not involved in any other administrative or judicial proceedings that may significantly impact the results of their operations. The combined evaluation of all existing provisions for all contingent liabilities and legal obligations, which are recognized based on statistical models for claims involving small amounts and on individual evaluation by internal and external legal advisors of other cases, showed that the accrued amounts are sufficient, as provided for by CMN Resolution No. 3,823, of December 16, 2009, and BACEN Circular Letter No. 3,429, of February 11, 2010.
Note 13 - Breakdown of accounts
| a) | Other sundry receivables |
| 09/30/2013 | 09/30/2012 | |||||||
| Deferred tax assets (Note 14b I) | 39,140,693 | 31,462,518 | ||||||
| Social contribution for offset (Note 14b I) | 647,727 | 644,470 | ||||||
| Taxes and contributions for offset | 3,250,920 | 3,209,987 | ||||||
| Escrow deposits for legal liabilities and tax and social security contingencies (Note 12b) | 9,450,640 | 8,774,268 | ||||||
| Escrow deposits for legal liabilities – civil and labor (Note 12b) | 4,538,941 | 4,486,481 | ||||||
| Escrow deposits for foreign fund raising program | 733,690 | 707,106 | ||||||
| Receivables from reimbursement of contingent liabilities (Note 12c) | 738,426 | 671,220 | ||||||
| Sundry domestic debtors | 2,297,723 | 1,453,156 | ||||||
| Sundry foreign debtors | 507,910 | 110,242 | ||||||
| Retirement plan assets (Note 19) | 2,860,193 | 2,141,178 | ||||||
| Recoverable payments | 30,190 | 38,051 | ||||||
| Salary advances | 208,512 | 207,302 | ||||||
| Amounts receivable from related companies | 56,416 | 11,924 | ||||||
| Operations without credit granting characteristics | 210,739 | 139,668 | ||||||
| Securities and credits receivable | 523,608 | 528,951 | ||||||
| (Allowance for loan losses) | (312,869 | ) | (389,283 | ) | ||||
| Other | 930,080 | 187,872 | ||||||
| Total | 65,602,800 | 54,245,443 | ||||||
At ITAÚ UNIBANCO HOLDING, Other Sundry Receivables are basically composed of Taxes and Contributions for Offset of R$ 260,896 (R$ 153,185 at 09/30/2012) and Deferred Tax Assets of R$ 1,078,437 (R$ 1,072,951 at 09/30/2012) (Note 14b I).
| b) | Prepaid expenses |
| 09/30/2013 | 09/30/2012 | |||||||
| Commissions | 3,210,050 | 3,153,775 | ||||||
| Related to vehicle financing | 602,756 | 931,975 | ||||||
| Related to insurance and pension plan | 1,418,037 | 1,375,098 | ||||||
| Restricted to commissions/partnership agreements | 663,582 | 535,034 | ||||||
| Other | 525,675 | 311,668 | ||||||
| Brazilian deposit guarantee fund (*) | 11,996 | 199,180 | ||||||
| Advertising | 346,803 | 331,787 | ||||||
| Other | 356,643 | 293,769 | ||||||
| Total | 3,925,492 | 3,978,511 | ||||||
(*) Refers to spontaneous payment, equivalent to the prepayment of installments of the contribution to the Brazilian deposit guarantee fund (Fundo Garantidor de Crédito - FGC), according to BACEN Circular No. 3,416, of 10/24/2008.
| c) | Other sundry liabilities |
| 09/30/2013 | 09/30/2012 | |||||||
| Provisions for contingent liabilities (Note 12b) | 11,972,094 | 9,989,623 | ||||||
| Provisions for sundry payments | 1,939,311 | 1,901,358 | ||||||
| Personnel provision | 1,721,792 | 1,675,180 | ||||||
| Sundry creditors - local | 2,249,081 | 1,691,049 | ||||||
| Sundry creditors - foreign | 1,816,917 | 1,927,152 | ||||||
| Liabilities for official agreements and rendering of payment services | 729,000 | 554,725 | ||||||
| Related to insurance operations | 1,203,609 | 857,563 | ||||||
| Liabilities for purchase of assets and rights | 3,655 | 3,172 | ||||||
| Creditors of funds to be released | 1,334,816 | 979,472 | ||||||
| Funds from consortia participants | 27,843 | 84,097 | ||||||
| Provision for Retirement Plan Benefits (Note 19) | 627,939 | 348,435 | ||||||
| Provision for health insurance(*) | 648,076 | 632,641 | ||||||
| Expenses for lease interests (Note 4i) | 287,729 | 212,155 | ||||||
| Other | 682,686 | 574,405 | ||||||
| Total | 25,244,548 | 21,431,027 | ||||||
(*) Provision set up to cover possible future deficits up to the total discontinuance of the portfolio, arising from the difference of adjustments to monthly installments, authorized annually by the regulatory body, and the actual variation of hospital costs that affect the compensation of claims (Note 13i).
| d) | Banking service fees |
| 01/01 to 09/30/2013 | 01/01 to 09/30/2012 | |||||||
| Asset management | 2,641,025 | 2,232,894 | ||||||
| Funds management fees | 2,367,480 | 2,080,720 | ||||||
| Consortia management fee | 273,545 | 152,174 | ||||||
| Current account services | 544,602 | 453,188 | ||||||
| Credit cards | 5,535,078 | 4,748,607 | ||||||
| Relationship with stores | 5,464,210 | 4,574,652 | ||||||
| Credit card processing | 70,868 | 173,955 | ||||||
| Sureties and credits granted | 1,278,990 | 1,165,739 | ||||||
| Loan operations | 576,113 | 533,235 | ||||||
| Guarantees provided | 702,877 | 632,504 | ||||||
| Receipt services | 1,060,583 | 1,051,608 | ||||||
| Collection fees | 895,608 | 860,121 | ||||||
| Collection services | 164,975 | 191,487 | ||||||
| Other | 1,168,513 | 1,115,331 | ||||||
| Custody services and management of portfolio | 209,271 | 173,865 | ||||||
| Economic and financial advisory | 247,905 | 282,424 | ||||||
| Foreign exchange services | 74,607 | 76,830 | ||||||
| Other services | 636,730 | 582,212 | ||||||
| Total | 12,228,791 | 10,767,367 | ||||||
| e) | Income from bank charges |
| 01/01 to 09/30/2013 | 01/01 to 09/30/2012 | |||||||
| Loan operations/registration | 782,215 | 790,546 | ||||||
| Credit cards – annual fees and other services (*) | 1,619,941 | 1,352,986 | ||||||
| Deposit account | 94,649 | 111,362 | ||||||
| Transfer of funds | 126,825 | 115,419 | ||||||
| Income from securities brokerage(*) | 350,301 | 254,564 | ||||||
| Service package fees and other | 2,301,879 | 1,723,233 | ||||||
| Total | 5,275,810 | 4,348,110 | ||||||
(*) In compliance with BACEN Circular Letter No. 3,490.
| f) | Personnel expenses |
| 01/01 to 09/30/2013 | 01/01 to 09/30/2012 | |||||||
| Compensation | (4,705,897 | ) | (4,352,081 | ) | ||||
| Charges | (1,612,510 | ) | (1,572,154 | ) | ||||
| Welfare benefits (Note 19) | (1,447,210 | ) | (949,037 | ) | ||||
| Training | (128,244 | ) | (177,428 | ) | ||||
| Labor claims and termination of employees (Note 12b) | (1,338,859 | ) | (1,276,759 | ) | ||||
| Stock Option Plan | (147,337 | ) | (133,040 | ) | ||||
| Total | (9,380,057 | ) | (8,460,499 | ) | ||||
| Employees’ profit sharing | (1,856,617 | ) | (1,826,092 | ) | ||||
| Total with employees’ profit sharing | (11,236,674 | ) | (10,286,591 | ) | ||||
| g) | Other administrative expenses |
| 01/01 to 09/30/2013 | 01/01 to 09/30/2012 | |||||||
| Data processing and telecommunications | (2,661,544 | ) | (2,625,572 | ) | ||||
| Depreciation and amortization | (1,388,241 | ) | (1,217,863 | ) | ||||
| Installations | (1,673,767 | ) | (1,673,420 | ) | ||||
| Third-party services | (2,427,884 | ) | (2,423,464 | ) | ||||
| Financial system services | (342,379 | ) | (357,046 | ) | ||||
| Advertising, promotions and publication | (729,413 | ) | (674,094 | ) | ||||
| Transportation | (339,510 | ) | (376,322 | ) | ||||
| Materials | (262,531 | ) | (298,436 | ) | ||||
| Security | (408,427 | ) | (384,744 | ) | ||||
| Travel expenses | (139,939 | ) | (139,182 | ) | ||||
| Other | (375,699 | ) | (379,750 | ) | ||||
| Total | (10,749,334 | ) | (10,549,893 | ) | ||||
| h) | Other operating revenue |
| 01/01 to 09/30/2013 | 01/01 to 09/30/2012 | |||||||
| Reversal of operating provisions | 38,409 | 17,949 | ||||||
| Recovery of charges and expenses | 35,835 | 46,146 | ||||||
| Other | 166,745 | 129,538 | ||||||
| Total | 240,989 | 193,633 | ||||||
| i) | Other operating expenses |
| 01/01 to 09/30/2013 | 01/01 to 09/30/2012 | |||||||
| Provision for contingencies (Note 12b) | (1,295,868 | ) | (1,200,980 | ) | ||||
| Civil lawsuits | (1,160,289 | ) | (1,250,805 | ) | ||||
| Tax and social security contributions | (112,627 | ) | 63,509 | |||||
| Other | (22,952 | ) | (13,684 | ) | ||||
| Selling - credit cards | (1,350,167 | ) | (1,213,761 | ) | ||||
| Claims | (310,769 | ) | (449,332 | ) | ||||
| Provision for health insurance (Note 13c) | (13,485 | ) | (9,711 | ) | ||||
| Refund of interbank costs | (183,010 | ) | (175,418 | ) | ||||
| Other | (727,017 | ) | (695,675 | ) | ||||
| Total | (3,880,316 | ) | (3,744,877 | ) | ||||
| j) | Non operating income –From 01/01 at 09/30/2012, basically composed of the result of the full disposal of investment in Banco BPI, S.A. in the amount of R$ (302,921) and due to the partial disposal of one interest in Orbitall Serviços e Processamento de Informações Comerciais S.A. in the amount of R$ (17,596). |
Note 14 - Taxes
| a) | Composition of expenses for taxes and contributions |
| I - | Statement of calculation with income tax and social contribution: |
| 01/01 to 09/30/2013 | 01/01 to 09/30/2012 | |||||||
| Income before income tax and social contribution | 14,169,392 | 13,298,602 | ||||||
| Charges (income tax and social contribution) at the rates in effect (Note 4o) | (5,667,757 | ) | (5,319,441 | ) | ||||
| Increase/decrease to income tax and social contribution charges arising from: | ||||||||
| Investments in affiliates and jointly controlled entities | 75,556 | 69,601 | ||||||
| Foreign exchange variation on investments abroad | 860,013 | 537,865 | ||||||
| Interest on capital | 1,231,717 | 1,377,669 | ||||||
| Corporate reorganizations | 470,889 | - | ||||||
| Dividends and interest on external debt bonds | 119,950 | 163,644 | ||||||
| Other nondeductible expenses net of non taxable income | 66,661 | 315,482 | ||||||
| Deferred tax asset recognized from prior periods | - | 324,148 | ||||||
| Total income tax and social contribution | (2,842,971 | ) | (2,531,032 | ) | ||||
| II - | Composition of tax expenses: |
| 01/01 to 09/30/2013 | 01/01 to 09/30/2012 | |||||||
| PIS and COFINS | (2,400,774 | ) | (2,506,234 | ) | ||||
| ISS | (594,230 | ) | (477,710 | ) | ||||
| Other | (300,585 | ) | (333,273 | ) | ||||
| Total (Note 4o) | (3,295,589 | ) | (3,317,217 | ) | ||||
At ITAÚ UNIBANCO HOLDING tax expenses amount to R$ 171,431 (R$ 162,726 from 01/01 to 09/30/2012) are basically composed of PIS and COFINS.
| III - | Tax effects on foreign exchange management of investments abroad |
In order to minimize the effects on income in connection with the foreign exchange variation on investments abroad, net of respective tax effects, ITAÚ UNIBANCO HOLDING carries out derivative transactions in foreign currency (hedge), as mentioned in Note 22b.
Results of these transactions are considered in the calculation base of income tax and social contribution, according to their nature, while the foreign exchange variation on investments abroad is not included therein, pursuant to tax legislation in force.
| b) | Deferred taxes |
| I - | The deferred tax asset balance and its changes, segregated based on its origin and disbursements incurred, are represented as follows: |
| Provisions | Deferred Tax Assets | |||||||||||||||||||||||||||||||
| 09/30/2012 | 09/30/2013 | 12/31/2012 | Realization / Reversal | Effect of change in consolidation(1) | Increase | 09/30/2013 | 09/30/2012 | |||||||||||||||||||||||||
| Reflected in income and expense accounts | 31,568,064 | (8,243,627 | ) | 221,259 | 11,631,342 | 35,177,036 | 31,281,701 | |||||||||||||||||||||||||
| Related to income tax and social contribution loss carryforwards | 3,943,862 | (1,029,512 | ) | 58,908 | 3,194,818 | 6,168,076 | 4,978,577 | |||||||||||||||||||||||||
| Related to disbursed provisions | 18,133,301 | (5,096,329 | ) | 128,868 | 5,294,731 | 18,460,571 | 17,525,967 | |||||||||||||||||||||||||
| Allowance for loan losses | 14,963,203 | (3,919,592 | ) | 104,201 | 4,602,464 | 15,750,276 | 14,508,275 | |||||||||||||||||||||||||
| Adjustment to market value of securities and derivative financial instruments (assets/liabilities) | 277,873 | (277,873 | ) | - | 484,150 | 484,150 | 214,206 | |||||||||||||||||||||||||
| Allowance for real estate | 62,134 | (7,237 | ) | - | 111,378 | 166,275 | 63,479 | |||||||||||||||||||||||||
| Goodwill on purchase of investments | 2,695,741 | (859,012 | ) | 24,259 | 75,646 | 1,936,634 | 2,614,220 | |||||||||||||||||||||||||
| Other | 134,350 | (32,615 | ) | 408 | 21,093 | 123,236 | 125,787 | |||||||||||||||||||||||||
| Related to non-disbursed provisions(2) | 23,932,975 | 27,053,222 | 9,490,901 | (2,117,786 | ) | 33,483 | 3,141,793 | 10,548,389 | 8,777,158 | |||||||||||||||||||||||
| Related to the operation | 18,874,559 | 21,994,807 | 7,467,536 | (2,117,786 | ) | 33,483 | 3,141,793 | 8,525,024 | 7,057,296 | |||||||||||||||||||||||
| Legal liabilities – tax and social security | 2,992,976 | 3,342,231 | 1,645,264 | (39 | ) | - | 224,697 | 1,869,922 | 1,643,750 | |||||||||||||||||||||||
| Provision for contingent liabilities | 7,938,544 | 9,677,115 | 3,490,867 | (920,370 | ) | 14,023 | 1,051,488 | 3,636,007 | 2,976,410 | |||||||||||||||||||||||
| Civil lawsuits | 3,100,465 | 3,649,885 | 1,421,603 | (381,855 | ) | 5,329 | 395,506 | 1,440,583 | 1,222,458 | |||||||||||||||||||||||
| Labor claims | 2,845,989 | 3,496,537 | 1,229,129 | (512,044 | ) | 4,410 | 600,906 | 1,322,401 | 1,074,395 | |||||||||||||||||||||||
| Tax and social security contributions | 1,941,689 | 2,482,164 | 821,500 | (26,371 | ) | 4,183 | 55,076 | 854,388 | 660,174 | |||||||||||||||||||||||
| Other | 50,401 | 48,529 | 18,634 | (100 | ) | 101 | - | 18,635 | 19,383 | |||||||||||||||||||||||
| Adjustments of operations carried out in futures settlement market | 106,858 | 1,616,317 | 8,983 | (10,034 | ) | - | 630,953 | 629,902 | 41,457 | |||||||||||||||||||||||
| Provision related to health insurance operations | 632,641 | 648,076 | 253,837 | - | - | 5,394 | 259,231 | 253,056 | ||||||||||||||||||||||||
| Other non-deductible provisions | 7,203,540 | 6,711,068 | 2,068,584 | (1,187,343 | ) | 19,460 | 1,229,261 | 2,129,962 | 2,142,623 | |||||||||||||||||||||||
| Related to provisions exceeding the minimum required not disbursed – allowance for loan losses | 5,058,415 | 5,058,415 | 2,023,365 | - | - | - | 2,023,365 | 1,719,862 | ||||||||||||||||||||||||
| Reflected in stockholders’ equity accounts | ||||||||||||||||||||||||||||||||
| Corporate reorganizations | - | 9,765,876 | 3,791,284 | (470,886 | ) | - | - | 3,320,398 | - | |||||||||||||||||||||||
| Adjustment to market value of available-for-sale securities | 511,020 | 1,608,149 | 148,010 | (110,672 | ) | - | 605,921 | 643,259 | 180,817 | |||||||||||||||||||||||
| Total | 24,443,995 | 38,427,247 | 35,507,358 | (8,825,185 | ) | 221,259 | 12,237,263 | 39,140,693 | 31,462,518 | |||||||||||||||||||||||
| Social contribution for offset arising from Option established in article 8 of Provisional Measure No. 2,158-35 of 08/24/2001 | 658,941 | (11,214 | ) | - | - | 647,727 | 644,470 | |||||||||||||||||||||||||
(1) Effect of change in consolidation criteria (Note 2b).
(2) From a financial point of view, rather than recording the provision of R$ 27,053,222 (R$ 23,932,975 at 09/30/2012) and deferred tax assets of R$ 10,548,389 (R$ 8,777,158 at 09/30/2012), only the net provisions of the corresponding tax effects should be considered, which would reduce the total deferred tax assets from R$ 39,140,693 (R$ 31,462,518 at 09/30/2012) to R$ 28,592,304 (R$ 22,685,360 at 09/30/2012).
At ITAÚ UNIBANCO HOLDING, the deferred tax assets totaled R$ 1,078,437 (R$ 1,072,951 at 09/30/2012) and are basically represented by legal liabilities – tax and social security of R$ 523,298 (R$ 415,160 at 09/30/2012), which expected realization is dependent upon the progress of the lawsuit, and tax loss of R$ 551,567 (R$ 531,787 at 09/30/2012).
| II - | Provision for Deferred Income Tax and Social Contribution balance and its changes are shown as follows: |
| 12/31/2012 | Realization / Reversal | Increase(1) | 09/30/2013 | 09/30/2012 | ||||||||||||||||
| Reflected in income and expense accounts | 7,993,028 | (2,434,535 | ) | 1,977,012 | 7,535,505 | 8,439,259 | ||||||||||||||
| Depreciation in excess – leasing | 5,452,529 | (2,068,098 | ) | 1,352,817 | 4,737,248 | 5,921,881 | ||||||||||||||
| Restatement of escrow deposits and contingent liabilities | 1,044,702 | (140,589 | ) | 212,342 | 1,116,455 | 1,048,711 | ||||||||||||||
| Provision for pension plan benefits | 915,252 | - | 3,994 | 919,246 | 751,740 | |||||||||||||||
| Adjustment to market value of securities and derivative financial instruments | 186,037 | (186,037 | ) | 156,968 | 156,968 | 331,713 | ||||||||||||||
| Adjustments of operations carried out in future settlement market | 116,918 | - | 246,579 | 363,497 | 115,002 | |||||||||||||||
| Taxation of results abroad – capital gains | 96,426 | - | 4,312 | 100,738 | 92,954 | |||||||||||||||
| Other | 181,164 | (39,811 | ) | - | 141,353 | 177,258 | ||||||||||||||
| Reflected in stockholders’ equity accounts | 1,142,821 | (1,023,951 | ) | 18,333 | 137,203 | 998,130 | ||||||||||||||
| Adjustment to market value of available-for-sale securities | 1,142,821 | (1,023,951 | ) | 8,623 | 127,493 | 998,130 | ||||||||||||||
| Provision for pension plan benefits(2) | - | - | 9,710 | 9,710 | - | |||||||||||||||
| Total | 9,135,849 | (3,458,486 | ) | 1,995,345 | 7,672,708 | 9,437,389 | ||||||||||||||
(1) Effect of change in consolidation criteria (Note 2b) in the amount of R$ 2,079, refering to restatement of escrow deposits and contingent liabilities.
(2) Reflected in stockholders' equity, pursuant to CVM Resolution nº 695/12 (Note 19).
At ITAÚ UNIBANCO HOLDING, the provision for deferred income tax and social contribution totals R$ 3,936 (R$ 4,441 at 09/30/2012), basically represented by restatement of escrow deposits and contingent liabilities.
| III - | The estimate of realization and present value of deferred tax assets and social contribution for offset, arising from Provisional Measure No. 2,158-35 of August 24, 2001 and from the Provision for Deferred Income Tax and Social Contribution existing at September 30, 2013, in accordance with the expected generation of future taxable income, based on the history of profitability and technical feasibility studies, are: |
| Deferred tax assets | Provision for deferred | |||||||||||||||||||||||||||||||||||||||||||||||||
| Temporary differences | % | Tax loss/social contribution loss carryforwards | % | Total | % | Social contribution for offset | % | income tax and social contribution | % | Net deferred taxes | % | |||||||||||||||||||||||||||||||||||||||
| 2013 | 8,514,346 | 26 | % | 840,753 | 13 | % | 9,355,099 | 24 | % | 16 | 0 | % | (1,115,415 | ) | 15 | % | 8,239,700 | 26 | % | |||||||||||||||||||||||||||||||
| 2014 | 6,090,448 | 19 | % | 1,413,118 | 23 | % | 7,503,566 | 19 | % | 170,088 | 26 | % | (2,099,487 | ) | 27 | % | 5,574,167 | 17 | % | |||||||||||||||||||||||||||||||
| 2015 | 6,201,431 | 19 | % | 1,018,199 | 17 | % | 7,219,630 | 19 | % | 193,176 | 30 | % | (2,018,008 | ) | 26 | % | 5,394,798 | 17 | % | |||||||||||||||||||||||||||||||
| 2016 | 3,663,681 | 11 | % | 1,527,763 | 25 | % | 5,191,444 | 13 | % | 284,447 | 44 | % | (1,073,066 | ) | 14 | % | 4,402,825 | 14 | % | |||||||||||||||||||||||||||||||
| 2017 | 2,759,256 | 8 | % | 1,225,862 | 20 | % | 3,985,118 | 10 | % | - | 0 | % | (315,296 | ) | 4 | % | 3,669,822 | 11 | % | |||||||||||||||||||||||||||||||
| after 2017 | 5,743,455 | 17 | % | 142,381 | 2 | % | 5,885,836 | 15 | % | - | 0 | % | (1,051,436 | ) | 14 | % | 4,834,400 | 15 | % | |||||||||||||||||||||||||||||||
| Total | 32,972,617 | 100 | % | 6,168,076 | 100 | % | 39,140,693 | 100 | % | 647,727 | 100 | % | (7,672,708 | ) | 100 | % | 32,115,712 | 100 | % | |||||||||||||||||||||||||||||||
| Present value (*) | 29,591,392 | 5,612,391 | 35,203,783 | 589,613 | (6,923,861 | ) | 28,869,535 | |||||||||||||||||||||||||||||||||||||||||||
(*) The average funding rate, net of tax effects, was used to determine the present value.
The projections of future taxable income include estimates related to macroeconomic variables, exchange rates, interest rates, volume of financial operations and services fees and others which can vary in relation to actual data and amounts.
Net income in the financial statements is not directly related to taxable income for income tax and social contribution, due to differences existing between accounting criteria and tax legislation, besides corporate aspects. Accordingly, we recommend that the trend of the realization of deferred tax assets arising from temporary differences, income tax and social contribution loss carryforwards be not used as an indication of future net income.
| IV- | In view of the unconstitutionality lawsuit related to the increase in the social contribution rate, established by Articles 17 and 41 of Law No. 11,727 of June 24, 2008, filed on June 26, 2008 by the National Confederation of the Financial System (CONSIF), at 09/30/2012 deferred tax assets were recorded up to the amount added to the tax liabilities, while the amount of R$ 548,992 at the mentioned date. At 09/30/2013 there are none deferred tax assets unrecorded. |
| c) | Tax and social security contributions |
| 09/30/2013 | 09/30/2012 | |||||||
| Taxes and contributions on income payable | 3,769,798 | 3,430,481 | ||||||
| Taxes and contributions payable | 1,413,320 | 1,257,600 | ||||||
| Provision for deferred income tax and social contribution (Note 14b II) | 7,672,708 | 9,437,389 | ||||||
| Legal liabilities – tax and social security (Note 12b) | 7,756,896 | 7,290,675 | ||||||
| Total | 20,612,722 | 21,416,145 | ||||||
At ITAÚ UNIBANCO HOLDING, the balance of Tax and Social Security Contributions totals R$ 1,448,413 (R$ 1,030,904 at 09/30/2012) and is basically comprised of Legal Liabilities - Tax and Social Security of R$ 1,211,977 (R$ 940,949 at 09/30/2012), whose nature refers to PIS and COFINS – Calculation basis: we are claiming that those contributions on revenue should be applied only to the revenue from sales of assets and services.
| d) | Taxes paid or provided for and withheld from third parties |
The amount of taxes paid or provided for is basically levied on income, revenue and payroll. In relation to the amounts withheld and collected from third parties, the company takes into consideration the interest on capital and on the service provision, in addition to that levied on financial operation.
| 09/30/2013 | 09/30/2012 | |||||||
| Taxes paid or provided for | 12,233,129 | 12,617,698 | ||||||
| Taxes withheld and collected from third parties | 7,808,565 | 9,397,799 | ||||||
| Total | 20,041,694 | 22,015,497 | ||||||
Note 15 – Permanent Assets
| a) | Investment |
I - Change of relevant investments - ITAÚ UNIBANCO HOLDING
| Companies | Balances at 12/31/2012 | Amortization of goodwill | Subscriptions / acquisitions / sales | Dividends / interest on capital paid/provided for(1) | Equity in earnings of subsidiaries(2) | Adjustments in marketable securities of subsidiaries and other | Balance at 09/30/2013 | Balance at 09/30/2012 | Equity in earnings of subsidiaries from 01/01 to 09/30/2012 | |||||||||||||||||||||||||||||
| Domestic | 54,683,079 | (4,752 | ) | 318 | (6,233,221 | ) | 5,595,511 | (2,306,308 | ) | 51,734,627 | 54,057,764 | 5,809,660 | ||||||||||||||||||||||||||
| Itaú Unibanco S.A. | (3a)(4a)(5a) | 45,058,817 | (4,752 | ) | - | (3,284,596 | ) | 3,008,623 | (2,051,355 | ) | 42,726,737 | 44,400,735 | 2,339,118 | |||||||||||||||||||||||||
| Banco Itaú BBA S.A. | (5b) | 6,235,591 | - | - | (799,610 | ) | 1,295,705 | (254,209 | ) | 6,477,477 | 6,339,058 | 1,089,095 | ||||||||||||||||||||||||||
| Banco Itaucard S.A. | (4b)(5c)(6) | 2,463,241 | - | 300 | (2,151,873 | ) | 1,077,610 | (741 | ) | 1,388,537 | 2,323,080 | 2,127,733 | ||||||||||||||||||||||||||
| Itaú Corretora de Valores S.A. | (6) | 879,321 | - | - | - | 212,174 | (3 | ) | 1,091,492 | 944,790 | 251,591 | |||||||||||||||||||||||||||
| Itaú BBA Participações S.A. | 46,107 | - | - | 2,858 | 1,398 | - | 50,363 | 50,101 | 2,079 | |||||||||||||||||||||||||||||
| Itaú Seguros S.A. | (7) | - | - | 18 | - | 1 | - | 19 | - | - | ||||||||||||||||||||||||||||
| Itaú Soluções Previdenciárias Ltda. | 2 | - | - | - | - | - | 2 | - | - | |||||||||||||||||||||||||||||
| Redecard S.A. | - | - | - | - | - | - | - | - | 44 | |||||||||||||||||||||||||||||
| Foreign | 3,548,367 | (38,556 | ) | 259,667 | (21,249 | ) | 537,966 | (16,031 | ) | 4,270,164 | 3,144,714 | 423,933 | ||||||||||||||||||||||||||
| Itau Chile Holdings, INC. | (3b) | 2,982,642 | (33,931 | ) | 200,510 | - | 353,381 | 3,053 | 3,505,655 | 2,628,580 | 288,969 | |||||||||||||||||||||||||||
| Banco Itau Uruguay S.A. | (3c) | 390,621 | (3,534 | ) | 59,157 | - | 127,199 | (19,084 | ) | 554,359 | 359,839 | 91,851 | ||||||||||||||||||||||||||
| OCA S.A. | (3d) | 127,657 | (939 | ) | - | (21,249 | ) | 53,257 | - | 158,726 | 111,641 | 38,294 | ||||||||||||||||||||||||||
| OCA Casa Financeira S.A. | (3e) | 44,369 | (136 | ) | - | - | 4,163 | - | 48,396 | 41,877 | 4,670 | |||||||||||||||||||||||||||
| ACO Ltda. | (3f) | 3,078 | (16 | ) | - | - | (34 | ) | - | 3,028 | 2,777 | 149 | ||||||||||||||||||||||||||
| Grand total | 58,231,446 | (43,308 | ) | 259,985 | (6,254,470 | ) | 6,133,477 | (2,322,339 | ) | 56,004,791 | 57,202,478 | 6,233,593 | ||||||||||||||||||||||||||
(1) Dividends approved and not paid are recorded as Dividends receivable.
(2) At September 30, 2013, includes foreign exchange variation in the amount of R$ 253,375;
(3) At September 30, 2013, includes goodwill in the amounts of (a) R$ 32,206; (b) R$ 147,035; (c) R$ 15,313; (d) R$ 4,070; (e) R$ 591; (f) R$ 71;
(4) At September 30, 2013, includes Adjustments of unrealized results in the results of operations and in investments, respectively, in the amounts of: (a) R$ 81.943 and R$ (573,670); (b) R$ 20,621 and R$ (3,962).
(5) At September 30, 2013, includes adjustments to standardize procedures under the scope of the investor in the results of operations and investments, respectively, in the amounts of: (a) R$ (10,738) and R$ (31,211); (b) R$ 7,198 and R$ (40,395); and (c) R$ (436) and R$ (3,328).
(6) The investment and the equity in earnings reflect the different interest in preferred shares, profit sharing and dividends.
(7) On May 31, 2013, Itaú Unibanco Holding acquired equity securities of Itaú Seguros.
| Stockholders’ | Net income | Number of shares/quotas owned by ITAÚ UNIBANCO HOLDING | Equity share in | Equity share in | ||||||||||||||||||||||||||||
| Companies | Capital | equity | for the period | Common | Preferred | Quotas | voting capital (%) | capital (%) | ||||||||||||||||||||||||
| Domestic | ||||||||||||||||||||||||||||||||
| Itaú Unibanco S.A. | 39,676,320 | 43,250,267 | 2,937,428 | 2,081,169,523 | 2,014,258,290 | - | 100.00 | 100.00 | ||||||||||||||||||||||||
| Banco Itaú BBA S.A. | 4,224,086 | 6,517,872 | 1,288,507 | 5,284,526 | 5,284,526 | - | 99.99 | 99.99 | ||||||||||||||||||||||||
| Banco Itaucard S.A. | 15,564,076 | 17,777,739 | 1,169,409 | 3,596,744,163 | 1,277,933,118 | - | 1.51 | 2.04 | ||||||||||||||||||||||||
| Itaú Corretora de Valores S.A. | 1,046,841 | 2,304,532 | 234,845 | - | 811,503 | - | - | 1.94 | ||||||||||||||||||||||||
| Itaú BBA Participações S.A. | 35,196 | 50,363 | 1,398 | 12,953 | 25,906 | - | 100.00 | 100.00 | ||||||||||||||||||||||||
| Itaú Seguros S.A. | 5,414,295 | 8,084,349 | 584,489 | 450 | 1 | - | 0.00 | 0.00 | ||||||||||||||||||||||||
| Itaú Soluções Previdenciárias Ltda. | 306,880 | 340,796 | 13,934 | - | - | 22 | 0.00 | 0.00 | ||||||||||||||||||||||||
| Foreign | ||||||||||||||||||||||||||||||||
| Itau Chile Holdings, INC. | 2,893,913 | 3,358,620 | 65,041 | 100 | - | - | 100.00 | 100.00 | ||||||||||||||||||||||||
| Banco Itau Uruguay S.A. | 326,662 | 539,046 | 152,330 | 3,193,173,911 | - | - | 100.00 | 100.00 | ||||||||||||||||||||||||
| OCA S.A. | 15,367 | 154,656 | 60,570 | 1,502,176,740 | - | - | 100.00 | 100.00 | ||||||||||||||||||||||||
| OCA Casa Financeira S.A. | 19,832 | 47,805 | 6,541 | 646 | - | - | 100.00 | 100.00 | ||||||||||||||||||||||||
| ACO Ltda. | 14 | 2,980 | 110 | - | - | 131 | 99.24 | 99.24 | ||||||||||||||||||||||||
| II - | Composition of investments |
| 09/30/2013 | 09/30/2012 | |||||||
| Investment in affiliates and jointly controlled entities | 2,345,214 | 2,365,544 | ||||||
| Domestic | 2,267,520 | 2,364,623 | ||||||
| Porto Seguro Itaú Unibanco Participações S.A. (*) | 1,359,779 | 1,254,314 | ||||||
| BSF Holding S.A. | 846,906 | 821,531 | ||||||
| Tecnologia Bancária S.A.(*) | 57,680 | 44,059 | ||||||
| Serasa S.A. | - | 244,642 | ||||||
| Other | 3,155 | 77 | ||||||
| Foreign | 77,694 | 921 | ||||||
| MCC Securities Inc. (Note 2b) | 58,040 | - | ||||||
| MCC Corredora de Bolsa (Note 2b) | 15,132 | - | ||||||
| Other | 4,522 | 921 | ||||||
| Other investments | 996,570 | 1,163,906 | ||||||
| Investments through tax incentives | 169,646 | 170,245 | ||||||
| Equity securities | 12,885 | 12,804 | ||||||
| Shares and quotas | 247,929 | 277,080 | ||||||
| Interest in Instituto de Resseguros do Brasil - IRB | 229,526 | 227,170 | ||||||
| Other | 336,584 | 476,607 | ||||||
| (Allowance for loan losses) | (273,788 | ) | (205,292 | ) | ||||
| Total | 3,067,996 | 3,324,158 | ||||||
(*) For the purpose of accounting for participation in earnings, the position at 08/31/2013 was used, as provided in Circular Letter nº 1,963 of 05/23/1991, of BACEN;
| III - | Equity in earnings of affiliates, jointly controlled entities and other investments |
| 01/01 to 09/30/2013 | 01/01 to 09/30/2012 | |||||||
| Investment in affiliates and jointly controlled entities – domestic | 231,117 | 196,877 | ||||||
| Investment in affiliates and jointly controlled entities – foreign | 3,247 | (101,525 | ) | |||||
| Dividends received from other investments | 36,448 | 88,966 | ||||||
| Result non arising from income controlled companies | (6,118 | ) | 5,560 | |||||
| Total | 264,694 | 189,878 | ||||||
| b) | Fixed assets, goodwill and intangible assets |
| I) | Fixed assets |
| Real Estate in Use(2) (3) | Other Fixed Assets(3) | |||||||||||||||||||||||||||||||
| Real estate in use(1) | Land | Buildings | Improvements | Installations | Furniture and equipment | EDP Systems (4) | Other (comunication, security and transportation) | Total | ||||||||||||||||||||||||
| Annual depreciation rates | 4 | % | 10 | % | 10 to 20% | 10 to 20% | 20 to 50% | 10 to 20% | ||||||||||||||||||||||||
| Cost | ||||||||||||||||||||||||||||||||
| Balances at 12/31/2012 | 959,160 | 2,471,850 | 1,252,190 | 871,511 | 928,553 | 5,490,063 | 607,655 | 12,580,982 | ||||||||||||||||||||||||
| Acquisitions | 77 | 420,559 | 112,242 | 108,214 | 108,264 | 901,235 | 56,908 | 1,707,499 | ||||||||||||||||||||||||
| Disposals | (7,793 | ) | (12,926 | ) | (187,406 | ) | (5,436 | ) | (10,593 | ) | (361,884 | ) | (2,140 | ) | (588,178 | ) | ||||||||||||||||
| Exchange variation | 228 | 2,115 | 10,164 | (213 | ) | 174 | (6,112 | ) | 557 | 6,913 | ||||||||||||||||||||||
| Other(5) | (1,852 | ) | (16,898 | ) | 16,152 | (383 | ) | (22,847 | ) | 8,546 | (4,013 | ) | (21,295 | ) | ||||||||||||||||||
| Balance at 09/30/2013 | 949,820 | 2,864,700 | 1,203,342 | 973,693 | 1,003,551 | 6,031,848 | 658,967 | 13,685,921 | ||||||||||||||||||||||||
| Depreciation | ||||||||||||||||||||||||||||||||
| Balances at 12/31/2012 | - | (1,607,294 | ) | (613,085 | ) | (357,777 | ) | (416,542 | ) | (3,663,894 | ) | (347,756 | ) | (7,006,348 | ) | |||||||||||||||||
| Depreciation expenses | - | (54,665 | ) | (181,526 | ) | (58,622 | ) | (61,206 | ) | (723,000 | ) | (46,917 | ) | (1,125,936 | ) | |||||||||||||||||
| Disposals | - | 9,995 | 187,406 | 3,533 | 4,958 | 341,120 | 1,719 | 548,731 | ||||||||||||||||||||||||
| Exchange variation | - | 734 | (2,749 | ) | 2,346 | 9,243 | (5,011 | ) | 202 | 4,765 | ||||||||||||||||||||||
| Other(5) | - | 15,590 | 238 | (11,783 | ) | 3,202 | 943 | 2,094 | 10,284 | |||||||||||||||||||||||
| Balance at 09/30/2013 | - | (1,635,640 | ) | (609,716 | ) | (422,303 | ) | (460,345 | ) | (4,049,842 | ) | (390,658 | ) | (7,568,504 | ) | |||||||||||||||||
| Impairment | ||||||||||||||||||||||||||||||||
| Balances at 12/31/2012 | - | - | - | - | (8,933 | ) | - | - | (8,933 | ) | ||||||||||||||||||||||
| Additions/ assumptions | - | - | - | - | - | - | - | - | ||||||||||||||||||||||||
| Reversals | - | - | - | - | - | - | - | - | ||||||||||||||||||||||||
| Balance at 09/30/2013 | - | - | - | - | (8,933 | ) | - | - | (8,933 | ) | ||||||||||||||||||||||
| Book value | ||||||||||||||||||||||||||||||||
| Balance at 09/30/2013 | 949,820 | 1,229,060 | 593,626 | 551,390 | 534,273 | 1,982,006 | 268,309 | 6,108,484 | ||||||||||||||||||||||||
| Balance at 09/30/2012 | 969,207 | 804,065 | 641,221 | 472,704 | 496,653 | 1,695,877 | 250,386 | 5,330,113 | ||||||||||||||||||||||||
(1) There are no contractual commitments for purchase of new fixed assets.
(2) Includes amounts pledged in guarantee of voluntary deposits (Nota 12b).
(3) Includes the amount of R$ 3,527 related to attached real estate; fixed assets under construction in the amount of R$ 753,703, consisting of R$ 637,455 in real estate in use; R$ 12,905 in improvements, and R$ 103,343 in equipment.
(4) Includes lease contracts, mainly related to data processing equipment, which are accounted for as finance leases. Pursuant to this method, assets and liabilities are accounted for in the financial statements, and assets are depreciated consistently with the depreciation criteria usually adopted for own assets. These contracts amount to R$ 262,885 at 09/30/2013.
(5) Basically includes the effect of change in consolidation criteria (Note 2b) in the amount of R$ 8,086.
II) Goodwill
| Changes | ||||||||||||||||||||||||||||||
| Amortization period | Balances at 12/31/2012 | Acquisitions | Amortization expenses | Impairment | Disposals (*) | Balance at 09/30/2013 | Balance at 09/30/2012 | |||||||||||||||||||||||
| Goodwill (Notes 2b and 4j) | 10 years | 101,424 | 1,850 | (3,231 | ) | - | (55,060 | ) | 44,983 | 10,068,929 | ||||||||||||||||||||
(*) Disposals relating to goodwill recorded in the acquisition of participation in companies MCC Securities and MCC Corredora, joint ventures previously proportionately consolidated, became registered as participation in earnings as of 01/01/2013.
III) Intangible assets
| Other intangible assets | ||||||||||||||||||||||||||||
| Intangible(1) | Rights for aquisition of payroll(2) | Association for the promotion and offer of financial products and services | Acquisition of software | Development of software | Goodwill on Acqusition (Note 4k) | Other Intangible Assets | Total | |||||||||||||||||||||
| Annual amortization rates | 20 | % | 8 | % | 20 | % | 20 | % | 20 | % | 10 to 20% | |||||||||||||||||
| Cost | ||||||||||||||||||||||||||||
| Balances at 12/31/2012 | 1,497,576 | 1,319,266 | 1,495,310 | 1,553,482 | 24,699 | 610,067 | 6,500,400 | |||||||||||||||||||||
| Acquisitions | 137,686 | 245,267 | 294,569 | 614,787 | - | - | 1,292,309 | |||||||||||||||||||||
| Disposals | (418,472 | ) | (22,692 | ) | (85,801 | ) | (49,872 | ) | - | (1,323 | ) | (578,160 | ) | |||||||||||||||
| Exchange variation | - | 751 | (11,127 | ) | - | - | 24,583 | 14,207 | ||||||||||||||||||||
| Other(3) | - | 110,682 | 16,851 | - | (3,087 | ) | 5 | 124,451 | ||||||||||||||||||||
| Balance at 09/30/2013 | 1,216,790 | 1,653,274 | 1,709,802 | 2,118,397 | 21,612 | 633,332 | 7,353,207 | |||||||||||||||||||||
| Amortization | ||||||||||||||||||||||||||||
| Balances at 12/31/2012 | (781,122 | ) | (176,423 | ) | (658,469 | ) | (10,792 | ) | (9,211 | ) | (253,666 | ) | (1,889,683 | ) | ||||||||||||||
| Amortization expenses(4) | (212,407 | ) | (99,925 | ) | (211,742 | ) | (25,312 | ) | (3,242 | ) | (50,133 | ) | (602,761 | ) | ||||||||||||||
| Disposals | 410,354 | 15,259 | 85,801 | - | - | 1,323 | 512,737 | |||||||||||||||||||||
| Exchange variation | - | (95 | ) | 14,925 | - | - | (14,342 | ) | 488 | |||||||||||||||||||
| Other(3) | - | (9,810 | ) | (650 | ) | - | 3,087 | (4 | ) | (7,377 | ) | |||||||||||||||||
| Balance at 09/30/2013 | (583,175 | ) | (270,994 | ) | (770,135 | ) | (36,104 | ) | (9,366 | ) | (316,822 | ) | (1,986,596 | ) | ||||||||||||||
| Impairment(5) | ||||||||||||||||||||||||||||
| Balances at 12/31/2012 | (18,251 | ) | (3,402 | ) | - | - | - | - | (21,653 | ) | ||||||||||||||||||
| Additions/ assumptions | - | (1,792 | ) | - | - | - | - | (1,792 | ) | |||||||||||||||||||
| Reversals | - | - | - | - | - | - | - | |||||||||||||||||||||
| Balance at 09/30/2013 | (18,251 | ) | (5,194 | ) | - | - | - | - | (23,445 | ) | ||||||||||||||||||
| Book value | ||||||||||||||||||||||||||||
| Balance at 09/30/2013 | 615,364 | 1,377,086 | 939,667 | 2,082,293 | 12,246 | 316,510 | 5,343,166 | |||||||||||||||||||||
| Balance at 09/30/2012 | 661,278 | 1,196,244 | 808,689 | 1,369,356 | 16,569 | 372,130 | 4,424,266 | |||||||||||||||||||||
(1) There are no contractual commitments for purchase of new intangible assets.
(2) Represents the recording of amounts paid for acquisition of rights to provide services of payment of salaries, proceeds, retirement and pension benefits, and similar benefits.
(3) Basically includes the effect of change in consolidation criteria (Note 2b) in the amount of R$ 99,703.
(4) Amortization expenses of the rights for acquisition of payrolls and associations are disclosed in the expenses on financial operations.
(5) Pursuant to BACEN Resolution No. 3,566, of May 29, 2001 (Note 13i).
Note 16 – Stockholders' equity
| a) | Shares |
The Extraordinary Stockholders’ Meeting of April 19, 2013 approved the increase of subscribed and paid-up capital by R$ 15,000,000, with the capitalization of the amounts recorded in Revenue Reserve – Statutory Reserve, with a 10% bonus shares. Bonus shares started being traded on May 21, 2013 and the process was approved by the Central Bank on May 6, 2013. Accordingly, capital stock was increased by 457,093,610 shares.
Capital comprises 5,028,029,710 book-entry shares with no par value, of which 2,518,215,040 are common and 2,509,814,670 are preferred shares without voting rights, but with tag-along rights, in the event of the public offer of common shares, at a price equal to 80% of the amount paid per share with voting rights in the controlling stake, as well as a dividend at least equal to that of the common shares. Capital stock amounts to R$ 60,000,000 (R$ 45,000,000 at 09/30/2012), of which R$ 41,652,325 (R$ 31,108,373 at 09/30/2012) refers to stockholders domiciled in the country and R$ 18,347,675 (R$ 13,891,627 at 09/30/2012) refers to stockholders domiciled abroad.
The table below shows the change in shares of capital stock and treasury shares during the period:
| Number | ||||||||||||||||
| Common | Preferred | Total | Amount | |||||||||||||
| Residents in Brazil at 12/31/2012 | 2,280,400,056 | 884,649,441 | 3,165,049,497 | |||||||||||||
| Residents abroad at 12/31/2012 | 8,886,344 | 1,397,000,259 | 1,405,886,603 | |||||||||||||
| Shares of capital stock at 12/31/2012 | 2,289,286,400 | 2,281,649,700 | 4,570,936,100 | |||||||||||||
| Bonus shares - Extraordinary Stockholders’ Meeting of April 19, 2013 – Made effective on May 21, 2013 | 228,928,640 | 228,164,970 | 457,093,610 | |||||||||||||
| Shares of capital stock at 09/30/2013 | 2,518,215,040 | 2,509,814,670 | 5,028,029,710 | |||||||||||||
| Residents in Brazil at 09/30/2013 | 2,502,347,646 | 988,137,793 | 3,490,485,439 | |||||||||||||
| Residents abroad at 09/30/2013 | 15,867,394 | 1,521,676,877 | 1,537,544,271 | |||||||||||||
| Treasury shares at 12/31/2012 | 2,100 | 52,554,239 | 52,556,339 | (1,523,500 | ) | |||||||||||
| Purchase of treasury shares | - | 23,500,000 | 23,500,000 | (662,215 | ) | |||||||||||
| Exercised – granting of stock options | - | (5,060,775 | ) | (5,060,775 | ) | 39,319 | ||||||||||
| Disposals – stock option plan | - | (4,477,121 | ) | (4,477,121 | ) | 228,516 | ||||||||||
| Bonus shares - Extraordinary Stockholders’ Meeting of April 19, 2013 – Made effective on May 21, 2013 | 210 | 4,706,907 | 4,707,117 | |||||||||||||
| Treasury shares at 09/30/2013(1) | 2,310 | 71,223,250 | 71,225,560 | (1,917,880 | ) | |||||||||||
| Outstanding shares at 09/30/2013 | 2,518,212,730 | 2,438,591,420 | 4,956,804,150 | |||||||||||||
| Outstanding shares at 09/30/2012 (2) | 2,518,212,730 | 2,451,855,761 | 4,970,068,491 | |||||||||||||
(1) Own shares, purchased based on authorization of the Board of Directors, to be held in Treasury for subsequent cancellation or replacement in the market.
(2) For better comparability, outstanding shares for the period ending September 30, 2012 were adjusted for the bonus of May 21, 2013.
We detail below the average cost of treasury shares and their market price at September 30, 2013:
| Cost/Market value | Common | Preferred | ||||||
| Minimum | - | 26.36 | ||||||
| Weighted average | - | 28.18 | ||||||
| Maximum | - | 29.24 | ||||||
| Treasury shares | ||||||||
| Average cost | 8.77 | 26.93 | ||||||
| Market value | 30.15 | 31.46 | ||||||
| b) | Dividends |
Stockholders are entitled to a mandatory dividend of not less than 25% of annual net income, which is adjusted according to the rules set forth in Brazilian Corporate Law. Both types of shares participate equally, after common shares have received dividends equal to the annual minimum priority dividend of R$ 0.022 per share to be paid to preferred shares.
The calculation of the monthly advance of mandatory minimum dividend is based on the share position on the last day of the prior month, taking into consideration that the payment is made on the first business day of the subsequent month, in the amount of R$ 0.015 per share.
I - Calculation
| Net income | 8,053,240 | |||||||
| Adjustments: | ||||||||
| (-) Legal reserve | (402,662 | ) | ||||||
| Dividend calculation basis | 7,650,578 | |||||||
| Mandatory dividend | 1,912,644 | |||||||
| Dividend – paid/provided for | 1,912,644 | 25.0 | % |
II – Payments/provision of interest on capital and dividends
| Gross | WTS | Net | ||||||||||
| Paid / Prepaid | 1,938,819 | (206,423 | ) | 1,732,396 | ||||||||
| Dividends - 8 monthly installments of R$ 0.015 per share paid in February to September 2013 | 562,667 | - | 562,667 | |||||||||
| Interest on capital - R$ 0.2774 per share, paid on 08/21/2013 | 1,376,152 | (206,423 | ) | 1,169,729 | ||||||||
| Provision (recorded in other liabilities – Social and Statutory) | 198,941 | (18,693 | ) | 180,248 | ||||||||
| Dividends - 1 monthly installment of R$ 0.015 per share paid on 10/01/2013 | 74,321 | - | 74,321 | |||||||||
| Interest on capital - R$ 0.0251 per share | 124,620 | (18,693 | ) | 105,927 | ||||||||
| Total from 01/01 to 09/30/2013 - R$ 0.3921 net per share | 2,137,760 | (225,116 | ) | 1,912,644 | ||||||||
| Total from 01/01 to 09/30/2012 - R$ 0.3942 net per share | 2,201,800 | (242,854 | ) | 1,958,946 | ||||||||
| c) | Capital and revenue reserves |
| 09/30/2013 | 09/30/2012 | |||||||
| Capital reserves | 854,358 | 812,352 | ||||||
| Premium on subscription of shares | 283,512 | 283,512 | ||||||
| Granted options recognized – Law No. 11,638 and Share-based instruments | 569,741 | 527,735 | ||||||
| Reserves from tax incentives and restatement of equity securities and other | 1,105 | 1,105 | ||||||
| Revenue reserves | 29,213,757 | 38,685,639 | ||||||
| Legal | 4,790,665 | 4,260,435 | ||||||
| Statutory: | 24,423,092 | 34,425,204 | ||||||
| Dividends equalization(1) | 8,866,267 | 10,291,315 | ||||||
| Working capital increase(2) | 6,652,127 | 10,381,519 | ||||||
| Increase in capital of investees(3) | 8,904,698 | 13,752,370 | ||||||
| (1) | Reserve for Dividends Equalization – its purpose is to guarantee funds for the payment of advances of dividends, including interest on capital, to maintain the flow of the stockholders’ compensation. |
| (2) | Reserve for Working Capital Increase – its purpose is to guarantee funds for the company’s operations. |
| (3) | Reserve for Increase in Capital of Investees – its purpose is to guarantee the preferred subscription right in the capital increases of investees. |
| d) | Conciliation of net income and stockholders’ equity (Note 2b) |
| Net income | Stockholders’ equity | |||||||||||||||
| 01/01 to 09/30/2013 | 01/01 to 09/30/2012 | 09/30/2013 | 09/30/2012 | |||||||||||||
| ITAÚ UNIBANCO HOLDING | 8,053,240 | 8,248,192 | 87,334,784 | 84,160,377 | ||||||||||||
| Amortization of goodwill | 1,611,738 | 1,853,953 | (2,629,678 | ) | (5,181,866 | ) | ||||||||||
| Corporate reorganizations | 1,384,959 | - | (6,445,479 | ) | - | |||||||||||
| ITAÚ UNIBANCO HOLDING CONSOLIDATED | 11,049,937 | 10,102,145 | 78,259,627 | 78,978,511 | ||||||||||||
| e) | Minority interest in subsidiaries |
| Stockholders’ equity | Net Income | |||||||||||||||
| 09/30/2013 | 09/30/2012 | 01/01 to 09/30/2013 | 01/01 to 09/30/2012 | |||||||||||||
| Itau Bank, Ltd.(1) | 876,589 | 798,296 | - | - | ||||||||||||
| Financeira Itaú CBD S.A. Crédito, Financiamento e Investimento (Note 2b) | 348,094 | - | (41,446 | ) | - | |||||||||||
| Banco Itaú BMG Consignado S.A. (Note 2b) | 295,053 | - | 8,124 | - | ||||||||||||
| Luizacred S.A. Soc. Cred. Financiamento Investimento (Note 2b) | 213,554 | - | (47,886 | ) | - | |||||||||||
| IGA Participações S.A.(2) | 50,781 | 55,421 | (1,306 | ) | (1,499 | ) | ||||||||||
| Investimentos Bemge S.A. | 20,487 | 19,546 | (731 | ) | (809 | ) | ||||||||||
| Banco Investcred Unibanco S.A. (Note 2b) | 19,111 | - | (539 | ) | - | |||||||||||
| Biogeração de Energia S.A. | 10,711 | 9,335 | (4,599 | ) | (3,053 | ) | ||||||||||
| Redecard S.A. | - | 110,381 | - | (517,427 | ) | |||||||||||
| Biu Participações S.A. (Note 2b) | - | 119,716 | - | (16,066 | ) | |||||||||||
| Outras | 7,377 | 8,590 | (6,352 | ) | (3,599 | ) | ||||||||||
| Total | 1,841,757 | 1,121,285 | (94,735 | ) | (542,453 | ) | ||||||||||
(1) Represented by redeemable preferred shares issued on December 31, 2002 by Itau Bank Ltd., in the amount of US$ 393,072, with maturity on March 31, 2015 and semiannual dividends calculated based on LIBOR plus 1.25% p.a..
(2) New company name of Itaú Gestão de Ativos S.A.
| f) | Stock option plan |
I – Purpose and guidelines of the plan
The ITAÚ UNIBANCO HOLDING has a stock option plan for its executives. This program aims at involving the management members in the medium and long-term corporate development process, by granting simple stock options or partner options, personal, not pledgeable or transferable, which entitle to the subscription of one authorized capital share or, at the discretion of the management, one treasury share which has been acquired for replacement purposes.
Such options may only be granted in years in which there are sufficient profits to enable the distribution of mandatory dividends to stockholders and at a quantity that does not exceed the limit of 0.5% of the total shares held by the stockholders at the base date of the year-end balance sheet. The ITAÚ UNIBANCO HOLDING’s Personnel Committee is responsible for defining the total quantity, the beneficiaries, the type of option, the life of the option under each series, which may range from a minimum of 5 and a maximum of 10 years, and the vesting period for exercising the options and the period the acquired shares are unavailable due to the exercise of the options. The executive officers and Board of Directors members of ITAÚ UNIBANCO HOLDING and of its subsidiaries and employees may participate in this program, based on assessment of potential and performance.
Currently, ITAÚ UNIBANCO HOLDING settles the benefits under this PLAN only by delivering its own shares, which are held in treasury until the effective exercise of the options by the beneficiaries.
II - Characteristics of the programs
II.I – Simple options
Prior programs
Before the merger, Itaú and Unibanco each had Stock Option Plans (Prior Programs). The eligible beneficiaries of the program were granted simple options, depending upon the individual employee performance. The exercise price is calculated based on the average prices of preferred shares at the BM&FBOVESPA trading sessions over the period of at least one (1) and at the most three (3) months prior to the option issue date; alternatively, subject to the positive or negative adjustment of up to 20%, and restated until the last business day of the month prior to the option exercise date based either on the IGP-M or IPCA, in its absence, based on the index determined by the committee. Options are no longer granted under this model.
Post-merger program
The eligible beneficiaries of the program are granted simple options, dependent upon the individual employee performance. The exercise price is calculated based on the average prices of preferred shares at the BM&FBOVESPA in the last three months of the year prior to the granting date or, alternatively, subject to the positive or negative adjustment of up to 20%. The exercise price is adjusted based on the IGPM or, in its absence, based on the index determined by the committee.
The vesting period is from one (1) to seven (7) years, counted from the issue date.
II.II – Partners plan
Executives selected to participate in the program may invest a percentage of their bonus to acquire shares or they have the right to receive shares (“Share-Based Instrument”). Title to the shares acquired, as well as the share-based instruments, should be held by the executives for a period of 3 to 5 years and they are subject to market fluctuation. At the time they acquire own shares and/or share-based instruments, Partner Options are granted in accordance with the classification of executives. Vesting period of Partners Options or share-based instruments is from 1 to 7 years. Share-based instruments and Partner options are converted into own shares of ITAÚ UNIBANCO HOLDING in the ratio of one preferred share for each instrument after the respective vesting period, with no payment of amounts in legal tender during the exercise.
The acquisition price of own shares and Share-Based Instruments is established every six months and it is equivalent to the average preferred share quotation at the BM&FBOVESPA trading sessions in the 30 days prior to the determination of said price.
Title to the shares received after the vesting period of the Partners Options should be held, without any liens or encumbrances, for periods from 5 to 8 years, counted from the date of acquisition of own shares.
The weighted average fair value of the Share-Based Instruments at the granting date was estimated for the shares purchased in the period ended September 30, 2013 – R$ 34.66 per share (at September 30, 2012 - R$ 36.00 per share).
The fair value of the Share-Based Instruments is the market price quoted at the granting date for preferred shares of ITAÚ UNIBANCO HOLDING less the cash price paid by the beneficiaries. Amount received for the purchase of Share-Based Instruments for the period ended September 30, 2013 - R$ 15,215 (at September 30, 2012 - R$ 50,361).
Summary of changes in the plan
| Restated | Exercised options | Number of shares | ||||||||||||||||||||||||||||||||||||||||||||||
| Granting | Vesting period | Exercise | exercise | Weighted average | Weighted average | Prior balance | Forfeited(*) / | To be exercised at | To be exercised at | |||||||||||||||||||||||||||||||||||||||
| No. | Date | until | until | price (R$ 1) | exercise price | market price | 12/31/2012 | Granted | Exercised | cancelled | 09/30/2013 | 09/30/2012 | ||||||||||||||||||||||||||||||||||||
| Simple options | ||||||||||||||||||||||||||||||||||||||||||||||||
| 12th | 02/21/2006 | 12/31/2010 | 12/31/2013 | 28.19 | 27.83 | 34.09 | 5,398,671 | - | (772,435 | ) | (30,250 | ) | 4,595,986 | 5,398,671 | ||||||||||||||||||||||||||||||||||
| 12th | 08/06/2007 | 12/31/2010 | 12/31/2013 | 28.19 | - | - | 17,454 | - | - | - | 17,454 | 17,454 | ||||||||||||||||||||||||||||||||||||
| 16th | 08/10/2009 | 12/31/2010 | 12/31/2014 | 32.05 | 31.57 | 35.99 | 961,583 | - | (11,000 | ) | - | 950,583 | 961,583 | |||||||||||||||||||||||||||||||||||
| 13th | 02/14/2007 | 12/31/2011 | 12/31/2014 | 35.89 | - | - | 6,866,761 | - | - | (367,538 | ) | 6,499,223 | 6,974,147 | |||||||||||||||||||||||||||||||||||
| 13th | 08/06/2007 | 12/31/2011 | 12/31/2014 | 35.89 | - | - | 33,714 | - | - | - | 33,714 | 33,714 | ||||||||||||||||||||||||||||||||||||
| 13th | 10/28/2009 | 12/31/2011 | 12/31/2014 | 35.89 | - | - | 50,549 | - | - | - | 50,549 | 50,549 | ||||||||||||||||||||||||||||||||||||
| 34th | 03/21/2007 | 03/21/2012 | 03/20/2013 | 36.08 | - | - | 83,491 | - | - | (83,491 | ) | - | 83,491 | |||||||||||||||||||||||||||||||||||
| 35th | 03/22/2007 | 03/22/2012 | 03/21/2013 | 36.05 | - | - | 32,465 | - | - | (32,465 | ) | - | 32,465 | |||||||||||||||||||||||||||||||||||
| 36th | 05/14/2008 | 05/14/2012 | 05/13/2013 | 45.23 | - | - | 27,830 | - | - | (27,830 | ) | - | 27,830 | |||||||||||||||||||||||||||||||||||
| 17th | 09/23/2009 | 09/23/2012 | 12/31/2014 | 37.03 | - | - | 32,506 | - | - | - | 32,506 | 32,506 | ||||||||||||||||||||||||||||||||||||
| 14th | 02/11/2008 | 12/31/2012 | 12/31/2015 | 41.38 | - | - | 7,885,831 | - | - | (348,438 | ) | 7,537,393 | 8,014,539 | |||||||||||||||||||||||||||||||||||
| 14th | 05/05/2008 | 12/31/2012 | 12/31/2015 | 41.38 | - | - | 22,688 | - | - | - | 22,688 | 22,688 | ||||||||||||||||||||||||||||||||||||
| 14th | 10/28/2009 | 12/31/2012 | 12/31/2015 | 41.38 | - | - | 50,549 | - | - | - | 50,549 | 50,549 | ||||||||||||||||||||||||||||||||||||
| 36th | 05/14/2008 | 05/14/2013 | 05/13/2014 | 45.73 | - | - | 27,830 | - | - | - | 27,830 | 27,830 | ||||||||||||||||||||||||||||||||||||
| Quantity of options exercisable at the end of the period | 27.88 | 34.12 | 21,491,922 | - | (783,435 | ) | (890,012 | ) | 19,818,475 | 21,728,017 | ||||||||||||||||||||||||||||||||||||||
| 15th | 03/03/2009 | 12/31/2013 | 12/31/2016 | 27.26 | 26.69 | 34.11 | 13,904,836 | - | (654,731 | ) | (104,423 | ) | 13,145,682 | 13,904,836 | ||||||||||||||||||||||||||||||||||
| 15th | 10/28/2009 | 12/31/2013 | 12/31/2016 | 27.06 | - | - | 50,549 | - | - | - | 50,549 | 50,549 | ||||||||||||||||||||||||||||||||||||
| 18th | 04/17/2010 | 12/31/2014 | 12/31/2017 | 43.96 | - | - | 6,526,309 | - | - | (38,687 | ) | 6,487,622 | 6,621,140 | |||||||||||||||||||||||||||||||||||
| 18th | 05/11/2010 | 12/31/2014 | 12/31/2017 | 43.96 | - | - | 1,225,390 | - | - | (45,544 | ) | 1,179,846 | 1,239,725 | |||||||||||||||||||||||||||||||||||
| 37th | 04/19/2011 | 12/31/2015 | 12/31/2018 | 42.94 | - | - | 10,562,458 | - | - | (112,308 | ) | 10,450,150 | 10,632,885 | |||||||||||||||||||||||||||||||||||
| 37th | 01/13/2012 | 12/31/2015 | 12/31/2018 | 42.94 | - | - | 16,921 | - | - | - | 16,921 | 16,921 | ||||||||||||||||||||||||||||||||||||
| 38th | 01/13/2012 | 12/31/2016 | 12/31/2019 | 32.11 | - | - | 16,607 | - | - | (2,802 | ) | 13,805 | 16,607 | |||||||||||||||||||||||||||||||||||
| 38th | 04/27/2012 | 12/31/2016 | 12/31/2019 | 32.11 | - | - | 11,366,754 | - | - | (101,325 | ) | 11,265,429 | 11,385,364 | |||||||||||||||||||||||||||||||||||
| Total options outstanding not exercisable | 26.69 | 34.11 | 43,669,824 | - | (654,731 | ) | (405,089 | ) | 42,610,004 | 43,868,027 | ||||||||||||||||||||||||||||||||||||||
| Total simple options outstanding | 27.34 | 34.11 | 65,161,746 | - | (1,438,166 | ) | (1,295,101 | ) | 62,428,479 | 65,596,044 | ||||||||||||||||||||||||||||||||||||||
| Partners options | ||||||||||||||||||||||||||||||||||||||||||||||||
| 3rd | 02/29/2008 | 09/03/2012 | - | - | - | 28.41 | 36,821 | - | (36,821 | ) | - | - | 36,821 | |||||||||||||||||||||||||||||||||||
| 4th | 03/03/2008 | 03/03/2013 | - | - | - | 34.25 | 410,238 | - | (410,238 | ) | - | - | 426,322 | |||||||||||||||||||||||||||||||||||
| 8th | 08/17/2010 | 08/16/2013 | - | - | - | 29.20 | 361,356 | - | (355,192 | ) | (6,164 | ) | - | 361,356 | ||||||||||||||||||||||||||||||||||
| 9th | 08/30/2010 | 08/16/2013 | - | - | - | 29.20 | 354,151 | - | (347,250 | ) | (6,901 | ) | - | 356,859 | ||||||||||||||||||||||||||||||||||
| 11th | 09/30/2010 | 08/16/2013 | - | - | - | 31.59 | 19,485 | - | (19,485 | ) | - | - | 19,485 | |||||||||||||||||||||||||||||||||||
| 5th | 09/03/2008 | 09/03/2013 | - | - | - | 29.27 | 464,821 | - | (456,304 | ) | (8,517 | ) | - | 487,545 | ||||||||||||||||||||||||||||||||||
| 10th | 09/30/2010 | 09/29/2013 | - | - | - | 31.45 | 1,995,832 | - | (1,982,509 | ) | (13,323 | ) | - | 2,003,540 | ||||||||||||||||||||||||||||||||||
| Quantity of options exercisable at the end of the period | - | 31.03 | 3,642,704 | - | (3,607,799 | ) | (34,905 | ) | - | 3,691,928 | ||||||||||||||||||||||||||||||||||||||
| 17th | 06/14/2012 | 02/27/2014 | - | - | - | - | 8,570 | - | - | - | 8,570 | 8,570 | ||||||||||||||||||||||||||||||||||||
| 12th | 02/28/2011 | 02/28/2014 | - | - | - | - | 1,683,445 | - | - | (20,659 | ) | 1,662,786 | 1,686,845 | |||||||||||||||||||||||||||||||||||
| 6th | 03/06/2009 | 03/06/2014 | - | - | - | 27.85 | 725,342 | - | (14,810 | ) | (13,301 | ) | 697,231 | 762,529 | ||||||||||||||||||||||||||||||||||
| 7th | 06/19/2009 | 03/06/2014 | - | - | - | - | 87,390 | - | - | - | 87,390 | 87,390 | ||||||||||||||||||||||||||||||||||||
| 14th | 11/04/2011 | 08/18/2014 | - | - | - | - | 559 | - | - | - | 559 | 559 | ||||||||||||||||||||||||||||||||||||
| 17th | 06/14/2012 | 08/18/2014 | - | - | - | - | 2,780 | - | - | - | 2,780 | 2,780 | ||||||||||||||||||||||||||||||||||||
| 13th | 08/19/2011 | 08/19/2014 | - | - | - | - | 755,440 | - | - | (23,139 | ) | 732,301 | 755,440 | |||||||||||||||||||||||||||||||||||
| 17th | 06/14/2012 | 02/23/2015 | - | - | - | - | 9,005 | - | - | - | 9,005 | 9,005 | ||||||||||||||||||||||||||||||||||||
| 15th | 02/24/2012 | 02/24/2015 | - | - | - | - | 1,729,295 | - | - | (39,314 | ) | 1,689,981 | 1,734,436 | |||||||||||||||||||||||||||||||||||
| 16th | 02/24/2012 | 02/24/2015 | - | - | - | - | 76,072 | - | - | - | 76,072 | 76,072 | ||||||||||||||||||||||||||||||||||||
| 8th | 08/17/2010 | 08/16/2015 | - | - | - | - | 360,151 | - | - | (13,794 | ) | 346,357 | 360,151 | |||||||||||||||||||||||||||||||||||
| 9th | 08/30/2010 | 08/16/2015 | - | - | - | - | 353,341 | - | - | (14,493 | ) | 338,848 | 356,051 | |||||||||||||||||||||||||||||||||||
| 11th | 09/30/2010 | 08/16/2015 | - | - | - | - | 19,481 | - | - | - | 19,481 | 19,481 | ||||||||||||||||||||||||||||||||||||
| 10th | 09/30/2010 | 09/29/2015 | - | - | - | - | 1,989,317 | - | - | (28,050 | ) | 1,961,267 | 1,997,024 | |||||||||||||||||||||||||||||||||||
| 18th | 02/27/2013 | 02/26/2016 | - | - | - | - | - | 2,598,040 | - | (20,130 | ) | 2,577,910 | - | |||||||||||||||||||||||||||||||||||
| 17th | 06/14/2012 | 02/27/2016 | - | - | - | - | 8,569 | - | - | - | 8,569 | 8,569 | ||||||||||||||||||||||||||||||||||||
| 12th | 02/28/2011 | 02/28/2016 | - | - | - | - | 1,680,447 | - | - | (33,954 | ) | 1,646,493 | 1,683,848 | |||||||||||||||||||||||||||||||||||
| 14th | 11/04/2011 | 08/18/2016 | - | - | - | - | 559 | - | - | - | 559 | 559 | ||||||||||||||||||||||||||||||||||||
| 17th | 06/14/2012 | 08/18/2016 | - | - | - | - | 2,780 | - | - | - | 2,780 | 2,780 | ||||||||||||||||||||||||||||||||||||
| 13th | 08/19/2011 | 08/19/2016 | - | - | - | - | 754,954 | - | - | (31,419 | ) | 723,535 | 754,954 | |||||||||||||||||||||||||||||||||||
| 17th | 06/14/2012 | 02/23/2017 | - | - | - | - | 9,005 | - | - | - | 9,005 | 9,005 | ||||||||||||||||||||||||||||||||||||
| 15th | 02/24/2012 | 02/24/2017 | - | - | - | - | 1,728,899 | - | - | (46,322 | ) | 1,682,577 | 1,734,124 | |||||||||||||||||||||||||||||||||||
| 16th | 02/24/2012 | 02/24/2017 | - | - | - | - | 76,066 | - | - | - | 76,066 | 76,066 | ||||||||||||||||||||||||||||||||||||
| 18th | 02/27/2013 | 02/26/2018 | - | - | - | - | - | 2,597,968 | - | (20,555 | ) | 2,577,413 | - | |||||||||||||||||||||||||||||||||||
| Total options outstanding not exercisable | - | 27.85 | 12,061,467 | 5,196,008 | (14,810 | ) | (305,130 | ) | 16,937,535 | 12,126,237 | ||||||||||||||||||||||||||||||||||||||
| Total partners options | - | 31.02 | 15,704,171 | 5,196,008 | (3,622,609 | ) | (340,035 | ) | 16,937,535 | 15,818,165 | ||||||||||||||||||||||||||||||||||||||
| Total simple / partners options | 27.34 | 31.90 | 80,865,917 | 5,196,008 | (5,060,775 | ) | (1,635,136 | ) | 79,366,014 | 81,414,209 | ||||||||||||||||||||||||||||||||||||||
(*) Refers to the non exercise due to the beneficiary’s option.
Summary of changes in the share-based instruments
| No. | Vesting period | Balance at 12/31/2012 | New | Converted into shares | Cancelled | Balance at 09/30/2013 | ||||||||||||||||||||||
| 1st | 08/17/2010 | 08/16/2013 | 118,108 | - | (116,666 | ) | (1,442 | ) | - | |||||||||||||||||||
| 1st | 08/30/2010 | 08/16/2013 | 11,234 | - | (11,234 | ) | - | - | ||||||||||||||||||||
| 1st | 09/30/2010 | 08/16/2013 | 4,367 | - | (4,367 | ) | - | - | ||||||||||||||||||||
| 2nd | 09/30/2010 | 09/29/2013 | 453,549 | - | (453,549 | ) | - | - | ||||||||||||||||||||
| 3rd | 02/28/2011 | 02/27/2012 | 478,886 | - | (478,886 | ) | - | - | ||||||||||||||||||||
| 3rd | 02/28/2011 | 02/27/2013 | 478,876 | - | - | - | 478,876 | |||||||||||||||||||||
| 4th | 02/24/2012 | 02/24/2013 | 510,599 | - | (510,599 | ) | - | - | ||||||||||||||||||||
| 4th | 02/24/2012 | 02/24/2014 | 510,579 | - | - | - | 510,579 | |||||||||||||||||||||
| 4th | 02/24/2012 | 02/24/2015 | 510,566 | - | - | - | 510,566 | |||||||||||||||||||||
| 5th | 02/27/2013 | 02/26/2014 | - | 161,756 | - | - | 161,756 | |||||||||||||||||||||
| 5th | 02/27/2013 | 02/26/2015 | - | 161,745 | - | - | 161,745 | |||||||||||||||||||||
| 5th | 02/27/2013 | 02/26/2016 | - | 161,738 | - | - | 161,738 | |||||||||||||||||||||
| Total | 3,076,764 | 485,239 | (1,575,301 | ) | (1,442 | ) | 1,985,260 | |||||||||||||||||||||
| No. | Vesting period | Balance at 12/31/2011 | New | Converted into shares | Cancelled | Balance at 09/30/2012 | ||||||||||||||||||||||
| 1st | 08/17/2010 | 08/16/2012 | 121,647 | - | (119,976 | ) | (1,671 | ) | - | |||||||||||||||||||
| 1st | 08/17/2010 | 08/16/2013 | 121,635 | - | - | (3,527 | ) | 118,108 | ||||||||||||||||||||
| 1st | 08/30/2010 | 08/16/2012 | 11,238 | - | (11,238 | ) | - | - | ||||||||||||||||||||
| 1st | 08/30/2010 | 08/16/2013 | 11,233 | - | - | - | 11,233 | |||||||||||||||||||||
| 1st | 09/30/2010 | 08/16/2012 | 4,368 | - | (4,368 | ) | - | - | ||||||||||||||||||||
| 1st | 09/30/2010 | 08/16/2013 | 4,367 | - | - | - | 4,367 | |||||||||||||||||||||
| 2nd | 09/30/2010 | 09/29/2012 | 466,579 | - | (6,086 | ) | (13,017 | ) | 447,476 | |||||||||||||||||||
| 2nd | 09/30/2010 | 09/29/2013 | 466,569 | - | - | (13,017 | ) | 453,552 | ||||||||||||||||||||
| 3rd | 02/28/2011 | 02/27/2011 | 488,444 | - | (488,444 | ) | - | - | ||||||||||||||||||||
| 3rd | 02/28/2011 | 02/27/2012 | 488,433 | - | - | (9,547 | ) | 478,886 | ||||||||||||||||||||
| 3rd | 02/28/2011 | 02/27/2013 | 488,422 | - | - | (9,546 | ) | 478,876 | ||||||||||||||||||||
| 4th | 02/24/2012 | 02/24/2013 | - | 515,737 | - | (5,138 | ) | 510,599 | ||||||||||||||||||||
| 4th | 02/24/2012 | 02/24/2014 | - | 515,720 | - | (5,138 | ) | 510,582 | ||||||||||||||||||||
| 4th | 02/24/2012 | 02/24/2015 | - | 515,703 | - | (5,138 | ) | 510,565 | ||||||||||||||||||||
| Total | 2,672,935 | 1,547,160 | (630,112 | ) | (65,739 | ) | 3,524,244 | |||||||||||||||||||||
III – Fair value and economic assumptions for cost recognition
ITAÚ UNIBANCO HOLDING recognizes, at the granting date, the fair value of options through the Binomial method for Simple Options and the Black & Scholes method for Partners Options. Economic assumptions used are as follows:
Exercise price: for the option exercise price, the exercise price previously agreed upon at the option issue is adopted, adjusted by the IGP-M variation;
Price of the underlying asset: the share price of ITAÚ UNIBANCO HOLDING (ITUB4) used for calculation is the closing price at BM&FBOVESPA on the calculation base date;
Expected dividends: the average annual return rate for the last three years of the dividends paid, plus interest on capital of the ITUB4 share;
Risk-free interest rate: the applied risk-free rate is the IGP-M coupon rate at the expiration date of the option plan;
Expected volatility: calculated based on the standard deviation from the history of the last 84 monthly returns of closing prices of the ITUB4 share, released by BM&FBOVESPA, adjusted by the IGP-M variation.
| Granting | Vesting period | Exercise | Price of underlying | Fair | Expected | Risk-free | Expected | |||||||||||||||||||||||||
| No. | Date | until | period until | asset | value | dividends | interest rate | volatility | ||||||||||||||||||||||||
| Partners options (*) | ||||||||||||||||||||||||||||||||
| 18th | 02/27/2013 | 02/27/2016 | - | 34.66 | 28.87 | 2.91 | % | - | - | |||||||||||||||||||||||
| 18th | 02/27/2013 | 02/27/2018 | - | 34.66 | 27.25 | 2.91 | % | - | - | |||||||||||||||||||||||
(*) The fair value of option is measured based on the fair value of Itaú Unibanco share at the granting date.
IV - Accounting effects arising from options
The exercise of stock options, pursuant to the Plan’s regulation, resulted in the sale of preferred shares held in treasury thus far. The accounting entries related to the plan are recorded during the vesting period, at the deferral of the fair value of options granted with effect on Income, and during the exercise of options, at the amount received from the option exercise price, reflected in Stockholders’ Equity.
The effect of Income for the period from January 1 to September 30, 2013 was R$ (147,337) (R$ (133,040) from January 1 to September 30, 2012), as contra-entry to Capital Reserve – Granted Options Recognized – Law No. 11,638 (Note 16c).
In the Stockholders’ Equity, the effect was as follows:
| 09/30/2013 | 09/30/2012 | |||||||
| Amount received for the sale of shares – exercised options | 147,440 | 197,888 | ||||||
| (-) Cost of treasury shares sold | (267,835 | ) | (235,273 | ) | ||||
| (+) Write-off of cost recognized of exercised options | 154,758 | 102,561 | ||||||
| Effect on sale(*) | 34,363 | 65,176 | ||||||
(*) Recorded in revenue reserves.
Note 17 – Related parties
| a) | Transactions between related parties are disclosed in compliance with CVM Resolution n° 642, of October 7, 2010, and CMN Resolution n° 3,750 of June 30, 2009. These transactions are carried out at amounts, terms and average rates in accordance with normal market practices during the period, as well as under reciprocal conditions. |
Transactions between companies included in consolidation were eliminated from the consolidated financial statements and take into consideration the lack of risk.
The unconsolidated related parties are the following:
| · | Itaú Unibanco Participações S.A. (IUPAR) and ITAÚSA, parent companies of ITAÚ UNIBANCO HOLDING; |
| · | The non-financial subsidiaries of ITAÚSA, specially: Itautec S.A., Duratex S.A., Elekeiroz S.A. and Itaúsa Empreendimentos S.A.; |
| · | Fundação Itaú Unibanco, FUNBEP – Fundo de Pensão Multipatrocinado, Fundação Bemgeprev, UBB – Prev Previdência Complementar, and Fundação Banorte Manuel Baptista da Silva de Seguridade Social, closed-end supplementary pension entities that administer retirement plans sponsored by ITAÚ UNIBANCO HOLDING and/or its subsidiaries; and |
| · | Fundação Itaú Social, Instituto Itaú Cultural, Instituto Unibanco, Instituto Assistencial Pedro Di Perna, Instituto Unibanco de Cinema, and Associação Clube A, entities sponsored by ITAÚ UNIBANCO and subsidiaries to act in their respective areas of interest, as described in Notes 22e and 22j. |
| · | Investments in Porto Seguro Itaú Unibanco Participações S.A., SERASA S.A., BSF Holding S.A., Tecnologia Bancária S.A., MCC Securities Inc. and MCC Corredora de Bolsa S.A.. |
The transactions with these related parties are basically characterized by:
| ITAÚ UNIBANCO HOLDING | ITAÚ UNIBANCO HOLDING CONSOLIDATED | |||||||||||||||||||||||||||||||||
| Assets / (liabilities) | Revenue / (expense) | Assets / (liabilities) | Revenue / (expense) | |||||||||||||||||||||||||||||||
| 09/30/2013 | 09/30/2012 | 01/01 to 09/30/2013 | 01/01 to 09/30/2012 | Annual rate | 09/30/2013 | 09/30/2012 | 01/01 to 09/30/2013 | 01/01 to 09/30/2012 | ||||||||||||||||||||||||||
| Interbank investments | 38,522,456 | 38,557,254 | 2,114,772 | 2,233,198 | - | 1,137,373 | - | 77,335 | ||||||||||||||||||||||||||
| Itaú Unibanco S.A. | 31,698,967 | 32,299,984 | 1,806,561 | 1,949,795 | - | - | - | - | ||||||||||||||||||||||||||
| Grand Cayman Branch | 6,823,489 | 6,257,270 | 308,211 | 283,403 | - | - | - | - | ||||||||||||||||||||||||||
| Itaú Unibanco Financeira S.A. Crédito, Financiamento e Investimento (Note 2b) | - | - | - | - | - | 171,221 | - | 11,475 | ||||||||||||||||||||||||||
| Luizacred S.A. Sociedade de Crédito, Financiamento e Investimento | - | - | - | - | - | 966,152 | - | 65,860 | ||||||||||||||||||||||||||
| Securities and derivative financial instruments | 11,358,780 | 6,485,581 | 441,571 | 144,258 | - | - | - | - | ||||||||||||||||||||||||||
| Grand Cayman Branch | 11,358,780 | 6,485,581 | 441,571 | 144,258 | - | - | - | - | ||||||||||||||||||||||||||
| Deposits | (104,110 | ) | (5,154,518 | ) | (4,110 | ) | (322,075 | ) | (3,161 | ) | (1,271 | ) | - | (1,724 | ) | |||||||||||||||||||
| Itaú Unibanco S.A. | (104,110 | ) | (5,154,518 | ) | (4,110 | ) | (322,075 | ) | - | - | - | - | ||||||||||||||||||||||
| Duratex S.A. | - | - | - | - | (3,161 | ) | (1,016 | ) | - | (1,327 | ) | |||||||||||||||||||||||
| Elekeiroz S.A. | - | - | - | - | - | - | - | (303 | ) | |||||||||||||||||||||||||
| Itaú Unibanco Financeira S.A. Crédito, Financiamento e Investimento (Note 2b) | - | - | - | - | - | (255 | ) | - | (75 | ) | ||||||||||||||||||||||||
| Other | - | - | - | - | - | - | - | (19 | ) | |||||||||||||||||||||||||
| Securities sold under repurchase agreements | - | - | (802 | ) | - | (118,660 | ) | (291,145 | ) | (9,232 | ) | (6,787 | ) | |||||||||||||||||||||
| Itaú Unibanco S.A. | - | - | - | - | - | - | - | - | ||||||||||||||||||||||||||
| Itaúsa Empreendimentos S.A. | - | - | - | - | 100% of Selic | (41,517 | ) | (5,273 | ) | - | - | |||||||||||||||||||||||
| Duratex S.A. | - | - | - | - | 100% of Selic | (44,178 | ) | (199,725 | ) | (6,481 | ) | (1,497 | ) | |||||||||||||||||||||
| Elekeiroz S.A. | - | - | - | - | 100% of Selic | (25,798 | ) | - | (1,088 | ) | (543 | ) | ||||||||||||||||||||||
| Itautec S.A. | - | - | - | - | 100% of Selic | (7,167 | ) | (12,417 | ) | (1,663 | ) | - | ||||||||||||||||||||||
| Facilita Promotora S.A. | - | - | - | - | - | (3,797 | ) | - | (130 | ) | ||||||||||||||||||||||||
| Olimpia Promoção e Serviços S.A. | - | - | - | - | - | (1,906 | ) | - | (88 | ) | ||||||||||||||||||||||||
| Maxfácil Participações S.A | - | - | - | - | - | (68,010 | ) | - | (4,257 | ) | ||||||||||||||||||||||||
| Other | - | - | (802 | ) | - | - | (17 | ) | - | (272 | ) | |||||||||||||||||||||||
| Amounts receivable from (payable to) related companies | (241 | ) | - | - | - | (136,436 | ) | (121,415 | ) | - | - | |||||||||||||||||||||||
| Itaú Corretora de Valores S. A. | (241 | ) | - | - | - | - | - | - | - | |||||||||||||||||||||||||
| Itaúsa Investimentos Itaú S.A. | - | - | - | - | 87 | 56 | - | - | ||||||||||||||||||||||||||
| Porto Seguro S.A. | - | - | - | - | - | 8,940 | - | - | ||||||||||||||||||||||||||
| Itaú Unibanco Financeira S.A. Crédito, Financiamento e Investimento (Note 2b) | - | - | - | - | - | (1,574 | ) | - | - | |||||||||||||||||||||||||
| Olimpia Promoção e Serviços S.A. | - | - | - | - | - | (1,108 | ) | - | - | |||||||||||||||||||||||||
| Luizacred S.A. Sociedade de Crédito, Financiamento e Investimento | - | - | - | - | - | (1,578 | ) | - | - | |||||||||||||||||||||||||
| Maxfácil Participações S.A | - | - | - | - | - | (1,484 | ) | - | - | |||||||||||||||||||||||||
| Fundação Itaú Unibanco | - | - | - | - | (53,075 | ) | 1,308 | - | - | |||||||||||||||||||||||||
| FUNBEP - Fundo de Pensão Multipatrocinado | - | - | - | - | 269 | 259 | - | - | ||||||||||||||||||||||||||
| Caixa de Prev.dos Func. do Banco Beg - PREBEG | - | - | - | - | - | (6,913 | ) | - | - | |||||||||||||||||||||||||
| Fundação BEMGEPREV | - | - | - | - | 23 | (8,321 | ) | - | - | |||||||||||||||||||||||||
| UBB Prev Previdência Complementar | - | - | - | - | 5 | (24,825 | ) | - | - | |||||||||||||||||||||||||
| Fundação Banorte Manuel Baptista da Silva de Seguridade Social | - | - | - | - | (83,605 | ) | (87,266 | ) | - | - | ||||||||||||||||||||||||
| Outras | - | - | - | - | (140 | ) | 1,091 | - | - | |||||||||||||||||||||||||
| Banking service fees (expenses) | - | - | (2,412 | ) | (2,438 | ) | - | - | 31,710 | 42,389 | ||||||||||||||||||||||||
| Itaú Corretora de Valores S. A. | - | - | (2,412 | ) | (2,438 | ) | - | - | - | - | ||||||||||||||||||||||||
| Fundação Itaú Unibanco | - | - | - | - | - | - | 24,570 | 18,367 | ||||||||||||||||||||||||||
| FUNBEP - Fundo de Pensão Multipatrocinado | - | - | - | - | - | - | 4,029 | 3,822 | ||||||||||||||||||||||||||
| UBB Prev Previdência Complementar | - | - | - | - | - | - | 42 | 1,107 | ||||||||||||||||||||||||||
| Caixa de Prev.dos Func. do Banco Beg - PREBEG | - | - | - | - | - | - | - | 1,401 | ||||||||||||||||||||||||||
| Itaúsa Investimentos Itaú S.A. | - | - | - | - | - | - | 854 | 812 | ||||||||||||||||||||||||||
| Itaú Unibanco Financeira S.A. Crédito, Financiamento e Investimento (Note 2b) | - | - | - | - | - | - | - | 288 | ||||||||||||||||||||||||||
| Luizacred S.A. Sociedade de Crédito, Financiamento e Investimento | - | - | - | - | - | - | - | 4 | ||||||||||||||||||||||||||
| Olimpia Promoção e Serviços S.A. | - | - | - | - | - | - | - | (9,298 | ) | |||||||||||||||||||||||||
| Porto Seguro S.A. | - | - | - | - | - | - | - | 23,671 | ||||||||||||||||||||||||||
| Outras | - | - | - | - | - | - | 2,215 | 2,215 | ||||||||||||||||||||||||||
| Rent revenues (expenses) | - | - | (173 | ) | (193 | ) | - | - | (36,133 | ) | (24,882 | ) | ||||||||||||||||||||||
| Itaúsa Investimentos Itaú S.A. | - | - | (12 | ) | (45 | ) | - | - | (1,103 | ) | - | |||||||||||||||||||||||
| Itaú Seguros S.A. | - | - | (123 | ) | (113 | ) | - | - | - | - | ||||||||||||||||||||||||
| Fundação Itaú Unibanco | - | - | - | - | - | - | (27,787 | ) | (16,293 | ) | ||||||||||||||||||||||||
| FUNBEP - Fundo de Pensão Multipatrocinado | - | - | - | - | - | - | (7,243 | ) | (7,445 | ) | ||||||||||||||||||||||||
| Outras | - | - | (38 | ) | (35 | ) | - | - | - | (1,144 | ) | |||||||||||||||||||||||
| Donation expenses | - | - | - | - | - | - | (53,800 | ) | (48,200 | ) | ||||||||||||||||||||||||
| Instituto Itaú Cultural | - | - | - | - | - | - | (53,000 | ) | (47,400 | ) | ||||||||||||||||||||||||
| Associação Clube A | - | - | - | - | - | - | (800 | ) | (800 | ) | ||||||||||||||||||||||||
| Data processing expenses | - | - | - | - | - | - | (200,747 | ) | (207,462 | ) | ||||||||||||||||||||||||
| Itautec S.A. | - | - | - | - | - | - | (200,747 | ) | (207,462 | ) | ||||||||||||||||||||||||
In addition to the aforementioned operations, ITAÚ UNIBANCO HOLDING and non-consolidated related parties, as an integral part of the Agreement for apportionment of common costs of Itaú Unibanco, recorded in Other Administrative Expenses in the amount of R$ 3,373 (R$ 3,784 from 01/01 to 09/30/2012) in view of the use of common structure.
In accordance with the rules in effect, the financial institutions cannot grant loans or advances to the following:
a) any individual or company that control the Institution or any entity under common control with the institution, or any officer, director, fiscal council member or direct relative of such individuals;
b) any entity controlled by the Institution; or
c) any entity of which the bank directly or indirectly holds at least 10% of capital stock.
Therefore, no loans or advances are made to any subsidiaries, executive officers, Board of Directors members or their relatives.
| b) | Compensation of Management Key Personnel |
Resolution CMN n° 3,921, of November 25, 2010, sets forth that the management’s variable compensation should be consistent with the institution’s risk management policies, and at least fifty percent (50%) should be mandatorily paid in shares and be deferred for payment in at least three (3) years.
To comply with the Resolution on compensation, Itaú Unibanco Holding was authorized by CVM to transfer, on a private basis, shares of its own issue held in treasury to its management members and the management members of its subsidiaries.
In the period from January 1 to September 30, 2013, the accounting effect of the compensation is recorded in Compensation of Key Management Members in Compensation and Profit Sharing, in compliance with statutory limits.
The fees attributed in the period to ITAÚ UNIBANCO HOLDING management members are as follows:
| 01/01 to 09/30/2013 | 01/01 to 09/30/2012 | |||||||
| Compensation | 185,504 | 195,685 | ||||||
| Board of Directors | 10,025 | 6,291 | ||||||
| Management members | 175,479 | 189,394 | ||||||
| Profit sharing | 181,749 | 122,972 | ||||||
| Board of Directors | 7,864 | 1,500 | ||||||
| Management members | 173,885 | 121,472 | ||||||
| Contributions to pension plans | 2,549 | 6,947 | ||||||
| Board of Directors | 3 | 3 | ||||||
| Management members | 2,546 | 6,944 | ||||||
| Stock option plan – Management members | 130,669 | 120,370 | ||||||
| Total | 500,471 | 445,974 | ||||||
Information related to the granting of the stock option plan, benefits to employees and post-employment is detailed in Notes 16f IV and 19, respectively.
Note 18 - Market value
The financial statements are prepared in accordance with accounting principles which assume the normal continuity of the operations of ITAÚ UNIBANCO HOLDING and its subsidiaries.
The book value of each financial instrument, whether included or not in the balance sheet (comprises investments in affiliates and other investments), when compared to the value that might be obtained in an active market, or in the absence of such market, using the net present value of future cash flows adjusted based on the current market interest, is approximately equal to the market value, or does not have a market quotation available, except for the instruments in the table below:
| Unrealized income (loss)(1) | ||||||||||||||||||||||||||||||||
| Book value | Market | Results | Stockholders’ equity | |||||||||||||||||||||||||||||
| 09/30/2013 | 09/30/2012 | 09/30/2013 | 09/30/2012 | 09/30/2013 | 09/30/2012 | 09/30/2013 | 09/30/2012 | |||||||||||||||||||||||||
| Interbank deposits | 20,574,721 | 18,160,320 | 20,579,537 | 18,198,058 | 4,816 | 37,738 | 4,816 | 37,738 | ||||||||||||||||||||||||
| Securities and derivative financial instruments | 272,109,885 | 234,556,390 | 272,852,531 | 235,749,162 | (627,195 | ) | 3,634,199 | 742,646 | 1,192,772 | |||||||||||||||||||||||
| Adjustment of available-for-sale securities | (1,378,873 | ) | 2,431,385 | - | - | |||||||||||||||||||||||||||
| Adjustment of held-to-maturity securities | 751,678 | 1,202,814 | 742,646 | 1,192,772 | ||||||||||||||||||||||||||||
| Loan, lease and other credit operations | 361,387,071 | 332,127,865 | 362,426,448 | 334,134,110 | 1,039,377 | 2,006,245 | 1,039,377 | 2,006,245 | ||||||||||||||||||||||||
| Investments | ||||||||||||||||||||||||||||||||
| BM&FBovespa | 14,610 | 24,755 | 135,706 | 227,533 | 121,096 | 202,778 | 121,096 | 202,778 | ||||||||||||||||||||||||
| Cetip S.A. | - | 291 | - | 12,076 | - | 11,785 | - | 11,785 | ||||||||||||||||||||||||
| Porto Seguro Itaú Unibanco Participações S.A.(2) | 1,359,779 | 1,254,314 | 2,752,191 | 2,004,186 | 1,392,412 | 749,872 | 1,392,412 | 749,872 | ||||||||||||||||||||||||
| Serasa S.A. | - | 244,642 | - | 1,648,278 | - | 1,403,636 | - | 1,403,636 | ||||||||||||||||||||||||
| Parent company | - | 161,843 | - | 1,565,479 | - | 1,403,636 | - | 1,403,636 | ||||||||||||||||||||||||
| Minority stockholders(3) | - | 82,799 | - | 82,799 | - | - | - | - | ||||||||||||||||||||||||
| Fundings and borrowings(4) | 198,853,221 | 203,725,561 | 199,402,093 | 204,069,729 | (548,872 | ) | (344,168 | ) | (548,872 | ) | (344,168 | ) | ||||||||||||||||||||
| Subordinated debt (Note 10f) | 55,270,116 | 49,342,036 | 54,707,020 | 50,097,691 | 563,096 | (755,655 | ) | 563,096 | (755,655 | ) | ||||||||||||||||||||||
| Treasury shares | 1,917,880 | 1,527,334 | 2,240,753 | 1,611,842 | - | - | 322,873 | 84,508 | ||||||||||||||||||||||||
| Total unrealized | 1,944,730 | 6,946,430 | 3,637,444 | 4,589,511 | ||||||||||||||||||||||||||||
(1) This does not consider the corresponding tax effects.
(2) Parent company of Porto Seguro S.A.
(3) The investment held by minority stockholders does not affect the result of ITAÚ UNIBANCO HOLDING.
(4) Funding is represented by interbank and time deposits, funds from acceptance and issuance of securities and borrowings.
To obtain the market values for these financial instruments, the following criteria were adopted:
| · | Interbank investments were determined based on their nominal amounts, monetarily restated to maturity dates and discounted to present value using future market interest rates and swap market rates for fixed-rate securities and using market interest rates for fixed-rate securities, achieved at the closing of BM&FBOVESPA at the balance sheet date, for floating-rate securities; |
| · | Securities and derivative financial instruments, according to the rules established by Circulars No. 3,068 and 3,082 of November 8, 2001 and January 30, 2002, respectively, issued by the Central Bank of Brazil (BACEN), are recorded at their market value, except for those classified as Held to Maturity. Government securities allocated in this category have their market value calculated based on the rates obtained in the market, and validated through the comparison with information provided by the National Association of Financial Market Institutions (ANBIMA). Private securities included in this category have their market value calculated using a criterion similar to the one adopted for Investments in Interbank Deposits, as described above; |
| · | Loans with maturity over 90 days, when available, were calculated based on the net present value of future cash flows discounted at market interest rates effective on the balance sheet date, taking into account the effects ofhedges as well (swap contracts); |
| · | Investments - in companies BM&FBOVESPA and Porto Seguro at the share value in stock exchanges and Serasa S.A. based on the historical average of Price/Income ratio of its parent company. |
| · | Time and interbank deposits and funds from acceptance and issuance of securities and foreign borrowings through securities, when available, were calculated based on their present value determined by future cash flows discounted at market rates obtained at the closing of BM&FBOVESPA on the balance sheet date; |
| · | Subordinated debt, based on the net present value of future fixed or floating cash flows in foreign currency, net of the market interest rates effective on the balance sheet date and considering the credit risk of the issuer. The floating cash flows are estimated as from the interest curves of the indexation market places; |
| · | Treasury shares are valued according to the average quotation available on the last trading day of the month or, if this is not available, according to the most recent quotation on prior trading days, published in the daily bulletin of each Stock Exchange. |
Note 19 – Post-Employments Benefits
Pursuant to CVM Resolution No. 695, dated December 13, 2012, we present the policies adopted by ITAÚ UNIBANCO HOLDING and its subsidiaries regarding benefits to employees, as well as the accounting procedures adopted. The effects from adopting this Resolution, when applicable, are presented on a comparative basis in the notes to the financial statements; however, these effects have no impact on the financial statements of September 30,2012.
ITAÚ UNIBANCO HOLDING and some of its subsidiaries sponsor defined benefit and variable contribution plans, which basic purpose is granting benefits that, in general, provide a life annuity benefit, and may be converted into survivorship annuities, according to the plan's regulation. They also sponsor defined contribution plans, the benefit of which is calculated based on the accumulated balance at the eligibility date, according to the plan's regulation, which does not require actuarial calculation, except as described in Note 19c.
Employees hired until July 31, 2002, who come from Itaú, and until February 27, 2009, who come from Unibanco, are beneficiaries of the above-mentioned plans. As regards the employees hired after these dates, they have the option to voluntarily participate in a variable contribution plan (PGBL), managed by Itaú Vida e Previdência S.A..
a) Description of the Plans
Supplementary plans are managed by closed-end private pension entities with independent legal structures, as detailed below:
| Entity | Benefit plan | |
| Fundação Itaubanco - Previdência Complementar | Supplementary retirement plan – PAC(1) | |
| Franprev benefit plan - PBF(1) | ||
| 002 benefit plan - PB002(1) | ||
| Itaulam basic plan - PBI(1) | ||
| Itaulam Supplementary Plan - PSI(2) | ||
| Itaubanco Defined Contribution Plan(3) | ||
| Itaubank Retirement Plan(3) | ||
| Itaú Defined Benefit Plan(1) | ||
| Itaú Defined Contribution Plan(2) | ||
| Unibanco Pension Plan(3) | ||
| Prebeg benefit plan(1) | ||
| Fundação Bemgeprev | Supplementary Retirement Plan – Flexible Premium Annuity (ACMV)(1) | |
| Funbep Fundo de Pensão Multipatrocinado | Funbep I Benefit Plan(1) | |
| Funbep II Benefit Plan(2) | ||
| Múltipla - Multiempresas de Previdência Complementar | Redecard Basic Retirement Plan(1) | |
| Redecard Supplementary Retirement Plan(2) | ||
| Redecard Supplementary Plan(3) | ||
| UBB-PREV - Previdência Complementar | UBB PREV Defined Benefit Plan(1) (4) | |
| Banorte Fundação Manoel Baptista da Silva de Seguridade Social | Benefit Plan II(1) |
(1) Defined benefit plan;
(2) Variable contribution plan;
(3) Defined contribution plan;
(4) Plan arising from the process of merging the IJMS Plan by the Basic Plan, both managed by UBB Prev, approved by the Superintendency of Supplementary
Social Security(PREVIC) on December 28, 2012.
b) Governance
The closed-end private pension entities (EFPC) and benefit plans they manage are regulated in conformity with the related specific legislation. The EFPC are managed by the Executive Board, Advisory Council and Fiscal Council, with some members appointed by the sponsors and others appointed as representatives of active and other participants, pursuant to the respective Entity’s bylaws. The main purpose of the EFPC is to pay benefits to eligible participants, pursuant to the Plan Regulation, maintaining the plans assets invested separately and independently from ITAÚ UNIBANCO HOLDING.
c) Defined benefit plan
I - Main assumptions used in actuarial valuation of Retirement Plans
| 09/30/2013 | 09/30/2012 | ||||
| Discount rate(1) | 8.16% p.a. | 9.72% p.a. | |||
| Mortality table(2) | AT-2000 | AT-2000 | |||
| Turnover(3) | Itaú Exp. 2008/2010 | Itaú Exp. 2008/2010 | |||
| Future salary growth | 7.12 % p.a. | 7.12% p.a. | |||
| Growth of the pension fund and social security benefits | 4.00 % p.a. | 4.00% p.a. | |||
| Inflation | 4.00 % p.a. | 4.00% p.a. | |||
| Actuarial method(4) | Projected Unit Credit | Projected Unit Credit |
(1) The adoption of this assumption is based on a study that adopts the methodology of following up the interest rate of long-term securities issued by Brazilian Treasury, indexed to inflation rates, and on the analysis of changes in the interest curves up to the actuarial valuation base date. The Discount Rate assumption was changed in 2012 so as to be consistent with the economic scenario at the balance sheet date.
(2) The mortality tables adopted correspond to those disclosed by SOA – Society of Actuaries, the North-American Entity which corresponds to IBA – Brazilian Institute of Actuarial Science, which reflects a 10% increase in the probabilities of survival as compared to the respective basic tables.
The life expectancy in years by the AT-2000 mortality table for participants of 55 years of age is 27 and 31 years for men and women, respectively.
(3) The turnover assumption is based on the effective experience of ITAÚ UNIBANCO HOLDING, resulting in the average of 2.4% p.a. based on the 2008/2010 experience.
(4) Using the Projected Unit Credit, the mathematical reserve is determined by the current projected benefit amount multiplied by the ratio between the length of service in the company at the assessment date and the length of service that will be reached at the date when the benefit is granted. The cost is determined taking into account the current projected benefit amount distributed over the years that each participant is employed.
Actuarial assumptions adopted are consistent with the group of participants of each benefit plan, pursuant to the studies carried out by an independent external actuarial consulting company, for biometric/demographic assumptions, and studies coordinated by the Investment Officer of EFPC regarding the economic assumptions.
The basic difference between the assumptions above and those adopted upon determination of the actuarial liability of defined benefit plans, for purposes of recording in the balance sheet of the closed-end private pension entities that manage them, is the actuarial method. For this purpose, the Bank adopts the aggregate method, by which the mathematical reserve is defined based on the difference between the present value of the projected benefit and the present value of future contributions, subject to the methodology defined in the respective actuarial technical note.
II- Risk Exposure
Due to its defined benefit plans, ITAÚ UNIBANCO HOLDING is exposed to a number of risks, the most significant ones are:
- Volatility of assets
The actuarial liability is calculated by adopting a discount rate defined based on the income from securities issued by the Brazilian treasury (government securities). If the actual income from plan investments is lower than expected, this may give rise to a deficit. The plans have a significant percentage of fixed-income securities pegged to the plan commitments, aiming at minimizing volatility and the short and medium-term risk.
- Changes in investment income
A decrease in income from public securities will imply a decrease in discount rate and, therefore, will increase the plan actuarial liability. The effect will be partially offset by the recognition of these securities at market value.
- Inflation risk
Most of plan benefits are pegged to the inflation rates, and a higher inflation will lead to higher obligations. The effect will also be partially offset because a significant portion of the plan assets is pegged to government securities restated at the inflation rate.
- Life expectancy
Most of the plan obligations are to provide life benefits and therefore the increase in life expectancy will result in increased plan liabilities.
III –Management of defined benefit plan assets
The general purpose of managing EFPC funds is to search for a long-term balance between assets and obligations with payment of retirement benefits, by exceeding the actuarial targets (discount rate plus benefit adjustment index, established in the plan regulations).
Regarding the assets guaranteeing the actuarial liability reserves, management should ensure the payment capacity of retirement benefits in the long-term by avoiding the risk of mismatching assets and liabilities in each pension plan.
At September 30, 2013 and 2012 the allocation of plan assets and the allocation target for 2013, by type of asset, are as follows:
| Fair value | % Allocation | |||||||||||||||||||
| Types | 09/30/2013 | 09/30/2012 | 09/30/2013 | 09/30/2012 | 2013 Target | |||||||||||||||
| Fixed income securities | 14,242,212 | 11,380,887 | 92.28 | % | 91.37 | % | 53% to 100% | |||||||||||||
| Variable income securities | 635,257 | 694,127 | 4.12 | % | 5.57 | % | 0% to 20% | |||||||||||||
| Structured investments | 17,681 | 14,757 | 0.12 | % | 0.12 | % | 0% to 10% | |||||||||||||
| Foreign Investments | - | - | 0.00 | % | 0.00 | % | 0% to 5% | |||||||||||||
| Real estate | 513,019 | 340,965 | 3.32 | % | 2.74 | % | 0% to 7% | |||||||||||||
| Loans to participants | 26,398 | 24,525 | 0.17 | % | 0.20 | % | 0% to 5% | |||||||||||||
| Total | 15,434,567 | 12,455,261 | 100.00 | % | 100.00 | % | ||||||||||||||
The defined benefit plan assets include shares of ITAÚ UNIBANCO HOLDING, its main parent company (ITAÚSA) and of subsidiaries of the latter, with a fair value of R$ 522,297 (R$ 527,629 at 09/30/2012), and real estate rented to Group companies, with a fair value of R$ 510,216 (R$ 293,192 at 09/30/2012).
Fair value
The fair value of the plan assets is adjusted up to the report date, as follows:
Fixed-Income Securities and Structured Investments– accounted for at market value, considering the average trading price on the calculation date, net realizable value obtained upon the technical addition of pricing, considering, at least, the payment terms and maturity, credit risk and the indexing unit.
Variable income securities– accounted for at market value, being so understood the share average quotation at the last day of the month or at the closest date on the stock exchange on which the share has posted the highest liquidity rate.
Real Estate– stated at acquisition or construction cost, adjusted to market value upon reappraisals made in 2012 and 2013, supported by technical appraisal reports. Depreciation is calculated under the straight line method, considering the useful life of the real estate.
Loans to participants– adjusted up to the report date, in compliance with the respective agreements.
Fund Allocation Target
The fund allocation target is based on Investment Policies that are currently revised and approved by the Advisory Council of each EFPC, considering a five-year period, which establishes guidelines for investing funds guaranteeing Actuarial Liability and for classifying securities.
IV- Net amount recognized in the balance sheet
Following is the calculation of the net amount recognized in the balance sheet, corresponding to the defined benefit plan:
| 09/30/2013 | 09/30/2012 | |||||||
| 1 - Net assets of the plans | 15,434,567 | 12,455,261 | ||||||
| 2 - Actuarial liabilities | (13,178,033 | ) | (10,623,100 | ) | ||||
| 3- Surplus (1-2) | 2,256,534 | 1,832,161 | ||||||
| 4- Asset restriction (*) | (2,241,694 | ) | (1,400,700 | ) | ||||
| 5 - Net amount recognized in the balance sheet (3-4) | 14,840 | 431,461 | ||||||
| Amount recognized in Assets (Note 13a) | 483,654 | 655,350 | ||||||
| Amount recognized in Liabilities (Note 13c) | (468,814 | ) | (223,889 | ) | ||||
(*) Corresponds to the excess of present value of the available economic benefit, in conformity with item 64 of CVM Resolution nº 695.
V- Change in the net amount recognized in the balance sheet:
| 09/30/2013 | ||||||||||||||||||||
| Net assets | Actuarial liabilities | Surplus | Asset Ceiling | Recognized amount | ||||||||||||||||
| Value at beginning of the period | 15,072,202 | (12,905,894 | ) | 2,166,308 | (2,137,207 | ) | 29,101 | |||||||||||||
| Cost of current service | - | (74,732 | ) | (74,732 | ) | - | (74,732 | ) | ||||||||||||
| Net interest (1) | 901,166 | (768,153 | ) | 133,013 | (131,032 | ) | 1,981 | |||||||||||||
| Benefits paid | (547,835 | ) | 547,835 | - | - | - | ||||||||||||||
| Contributions of sponsor | 34,572 | - | 34,572 | - | 34,572 | |||||||||||||||
| Contributions of participants | 9,538 | - | 9,538 | - | 9,538 | |||||||||||||||
| Effects on asset ceiling | - | - | - | 30,851 | 30,851 | |||||||||||||||
| Actuarial gain/(loss)(3) (4) | (35,076 | ) | 22,911 | (12,165 | ) | (4,306 | ) | (16,471 | ) | |||||||||||
| Value at end of the period | 15,434,567 | (13,178,033 | ) | 2,256,534 | (2,241,694 | ) | 14,840 | |||||||||||||
| 09/30/2012 | ||||||||||||||||||||
| Net assets | Actuarial liabilities | Surplus | Asset Ceiling | Recognized amount | ||||||||||||||||
| Value at beginning of the period | 11,772,927 | (10,413,448 | ) | 1,359,479 | (1,262,610 | ) | 96,869 | |||||||||||||
| Cost of current service | - | (63,321 | ) | (63,321 | ) | - | (63,321 | ) | ||||||||||||
| Net interest(1) (2) | 976,864 | (738,716 | ) | 238,148 | (130,797 | ) | 107,351 | |||||||||||||
| Benefits paid | (504,592 | ) | 504,592 | - | - | - | ||||||||||||||
| Contributions of sponsor | 33,676 | - | 33,676 | - | 33,676 | |||||||||||||||
| Contributions of participants | 11,451 | - | 11,451 | - | 11,451 | |||||||||||||||
| Effects on asset ceiling | - | - | - | (138,090 | ) | (138,090 | ) | |||||||||||||
| Actuarial gain/(loss)(3) (4) | 164,935 | 87,793 | 252,728 | 130,797 | 383,525 | |||||||||||||||
| Value at end of the period | 12,455,261 | (10,623,100 | ) | 1,832,161 | (1,400,700 | ) | 431,461 | |||||||||||||
(1) Calculated based on the initial value of the period, less the average value of payments/receipts of benefits/contributions multiplied by the discount rate of 8.16% (9.72% at 12/31/2012).
(2) On 12/31/2012 it was used rate of 11.60% to calculate the expected return on plan net assets.
(3) Gains/losses recorded in net assets and asset ceiling correspond to the income earned above/below the expected return rate.
(4) The actual return on assets amounted to R$ 866,090 (R$ 1,141,799 at at September 30, 2012).
VI- Total amounts recognized in Income for the Period and Stockholders’ Equity – Asset valuation adjustment:
| Income | Stockholders’ Equity | |||||||||||||||
| 01/01 to 09/30/2013 | 01/01 to 09/30/2012 | 09/30/2013 | 09/30/2012 | |||||||||||||
| Cost of current service | (74,732 | ) | (63,321 | ) | - | - | ||||||||||
| Net interest | 1,981 | 107,351 | - | - | ||||||||||||
| Effects on asset ceiling | - | - | 30,851 | (138,090 | ) | |||||||||||
| Actuarial gain/(loss) | - | - | (6,933 | ) | 394,976 | |||||||||||
| Total Amounts Recognized | (72,751 | ) | 44,030 | 23,918 | 256,886 | |||||||||||
During the period, contributions made totaled R$ 34,572 (R$ 33,676 from January 1 to September 30, 2012). The contribution rate increases based on the beneficiary’s salary.
In 2013, the expected contribution to retirement plans sponsored by ITAÚ UNIBANCO HOLDING is R$ 35,494.
The estimate for payment of benefits for the next 10 years is as follows:
| Period | Estimated payment | |||
| 2013 | 708,111 | |||
| 2014 | 740,621 | |||
| 2015 | 761,722 | |||
| 2016 | 783,866 | |||
| 2017 | 806,162 | |||
| 2018 to 2022 | 4,399,475 | |||
VII- Sensitivity of defined benefit obligation
The impact of the change in the discount rate assumption by 0.5% on actuarial liability is as follows:
| Change in Assumption | Effect on Actuarial Liability | R$ | Percentage | |||||||
| - Decrease by 0.5% | Increase | 868,151 | 6.42 | % | ||||||
| - Increase by 0.5% | Decrease | (778,961 | ) | (6.04 | )% | |||||
d) Defined contribution plans
The defined contribution plans have pension funds set up by the portion of sponsors’ contributions not included in the participant’s accounts balance and by the loss of eligibility to a plan benefit, as well as by resources from the migration from the defined benefit plans. The fund will be used for future contributions to the individual participants' accounts, according to the rules of the respective benefit plan regulation.
I - Change in the net amount recognized in the balance sheet:
| 09/30/2013 | 09/30/2012 | |||||||||||||||||||||||
| Pension Plan Fund | Asset Ceiling | Recognized Amount | Pension Plan Fund | Asset Ceiling | Recognized Amount | |||||||||||||||||||
| Amount - beginning of the period | 2,645,829 | (317,834 | ) | 2,327,995 | 1,756,562 | (313,376 | ) | 1,443,186 | ||||||||||||||||
| Net interest | 154,486 | (19,402 | ) | 135,084 | 146,150 | (26,074 | ) | 120,076 | ||||||||||||||||
| Contribution | (93,609 | ) | - | (93,609 | ) | (102,680 | ) | - | (102,680 | ) | ||||||||||||||
| Effects on asset ceiling | - | - | - | - | (996 | ) | (996 | ) | ||||||||||||||||
| Financial Gain/(Loss) | 6,268 | 801 | 7,069 | 168 | 26,074 | 26,242 | ||||||||||||||||||
| Amount - end of the period (Note 13a) | 2,712,974 | (336,435 | ) | 2,376,539 | 1,800,200 | (314,372 | ) | 1,485,828 | ||||||||||||||||
II- Total amounts recognized in Income for the Period and Stockholders’ Equity – Asset valuation adjustment:
| Income | Stockholders’ Equity | |||||||||||||||
| 01/01 to 09/30/2013 | 01/01 to 09/30/2012 | 09/30/2013 | 09/30/2012 | |||||||||||||
| Contributions | (93,609 | ) | (102,680 | ) | - | - | ||||||||||
| Net interest | 135,084 | 120,076 | - | - | ||||||||||||
| Financial Gain/(Loss) | - | - | 7,069 | 26,242 | ||||||||||||
| Effects on asset ceiling | - | - | - | (996 | ) | |||||||||||
| Total Amounts Recognized | 41,475 | 17,396 | 7,069 | 25,246 | ||||||||||||
In the period, contributions to the defined contribution plans, including PGBL, totaled R$ 125,501 (R$ 133,805 from January 1 to September 30, 2012), of which R$ 93,609 (R$ 102,680 from January 1 to September 30, 2012) arises from pension funds.
| e) | Other post-employment benefits |
ITAÚ UNIBANCO HOLDING and its subsidiaries do not offer other post-employment benefits, except in those cases arising from obligations under acquisition agreements signed by ITAÚ UNIBANCO HOLDING, as well as in relation to the benefits granted due to a judicial sentence, in accordance with the terms and conditions established, in which health plans are totally or partially sponsored for specific groups of former workers and beneficiaries.
Based on the reported prepared by an independent actuary, the changes in obligations for these other projected benefits and the amounts recognized in the balance sheet, under liabilities, of Itaú Unibanco Holding are as follows:
I - Change in the net amount recognized in the balance sheet:
| 09/30/2013 | 09/30/2012 | |||||||
| At the beginning of the period | (148,523 | ) | (120,154 | ) | ||||
| Cost of interest | (9,320 | ) | (8,533 | ) | ||||
| Benefits paid | 5,546 | 4,141 | ||||||
| Actuarial loss | (6,828 | ) | - | |||||
| At the end of the period (Note 13c) | (159,125 | ) | (124,546 | ) | ||||
II- Total amounts recognized in Income for the Period and Stockholders’ Equity – Asset valuation adjustment:
| Income | Stockholders’ Equity | |||||||||||||||
| 01/01 to 09/30/2013 | 01/01 to 09/30/2012 | 09/30/2013 | 09/30/2012 | |||||||||||||
| Net interest | (9,320 | ) | (8,533 | ) | - | - | ||||||||||
| Benefits paid | 5,546 | 4,141 | - | - | ||||||||||||
| Actuarial loss | - | - | (6,828 | ) | - | |||||||||||
| Total Amounts Recognized | (3,774 | ) | (4,392 | ) | (6,828 | ) | - | |||||||||
The estimate for payment of benefits for the next 10 years is as follows:
| Period | Estimated payment | |||
| 2013 | 6,136 | |||
| 2014 | 6,671 | |||
| 2015 | 7,233 | |||
| 2016 | 7,796 | |||
| 2017 | 8,409 | |||
| 2018 to 2022 | 52,171 | |||
III - Sensitivity Analyses - Cost of Healthcare
For calculation of benefits obligations projected beyond the assumptions used for the defined benefit plans (Note 19c l), the 8.16% p.a. increase in medical costs assumption is adopted.
Assumptions for rates related to medical assistance costs have a significant impact on the amounts recognized in income. A change of one percentage point in the medical assistance cost rates would have the effects as follows:
| Recognition | 1.0% decrease | 1.0% decrease | ||||||||
| Service cost and cost of interest | Income | 2,161 | (1,699 | ) | ||||||
| Present value of obligation | Asset valuation adjustment | 26,486 | (20,819 | ) | ||||||
Note 20 – Information on foreign subsidiaries
| Foreign branches(1) | Latin America consolidated (2) | Itaú Europe consolidated(3) | Cayman consolidated(4) | Other foreign companies(5) | Foreign consolidated(6) | |||||||||||||||||||||||||||||||||||||||||||
| 09/30/2013 | 09/30/2012 | 09/30/2013 | 09/30/2012 | 09/30/2013 | 09/30/2012 | 09/30/2013 | 09/30/2012 | 09/30/2013 | 09/30/2012 | 09/30/2013 | 09/30/2012 | |||||||||||||||||||||||||||||||||||||
| Assets | ||||||||||||||||||||||||||||||||||||||||||||||||
| Current assets and long-term receivables | ||||||||||||||||||||||||||||||||||||||||||||||||
| Cash and cash equivalents | 3,251,891 | 2,450,306 | 3,206,234 | 2,715,234 | 339,787 | 313,089 | 547,038 | 1,249,698 | 1,148,507 | 1,471,707 | 7,802,265 | 6,532,264 | ||||||||||||||||||||||||||||||||||||
| Interbank investments | 12,334,662 | 10,959,762 | 2,510,455 | 1,461,185 | 3,434,475 | 2,297,957 | 7,363,791 | 7,977,439 | 241,910 | 345,688 | 16,628,144 | 8,155,451 | ||||||||||||||||||||||||||||||||||||
| Securities | 58,287,437 | 53,355,292 | 4,673,270 | 4,600,630 | 2,080,901 | 2,036,083 | 5,146,122 | 6,378,442 | 26,363 | 33,089 | 69,358,488 | 65,733,185 | ||||||||||||||||||||||||||||||||||||
| Loan, lease and other credit operations | 43,219,780 | 33,040,948 | 32,936,789 | 25,031,544 | 8,717,853 | 7,482,490 | 104,941 | 97,083 | 633 | 828 | 84,913,090 | 65,591,968 | ||||||||||||||||||||||||||||||||||||
| Foreign exchange portfolio | 49,693,277 | 32,030,420 | 425,870 | 420,265 | 4,434,977 | 3,636,363 | 1,539,407 | 494,140 | - | - | 53,076,520 | 35,995,919 | ||||||||||||||||||||||||||||||||||||
| Other assets | 2,033,681 | 1,765,532 | 4,714,184 | 3,198,994 | 364,604 | 286,393 | 1,303,099 | 1,037,628 | 545,050 | 230,452 | 8,799,896 | 6,387,946 | ||||||||||||||||||||||||||||||||||||
| Permanent assets | ||||||||||||||||||||||||||||||||||||||||||||||||
| Investments | 15,681 | 23,798 | 5,563 | 7,489 | 4,930 | 4,074 | 59,464 | 57,563 | 489,573 | 22,727 | 29,740 | 40,826 | ||||||||||||||||||||||||||||||||||||
| Other investments | 15,681 | 23,798 | 5,563 | 7,489 | 4,930 | 4,074 | 59,464 | 57,563 | 489,573 | 22,727 | 29,740 | 40,826 | ||||||||||||||||||||||||||||||||||||
| Fixed and intangible assets | 18,967 | 23,914 | 602,879 | 550,293 | 167,948 | 176,129 | 519 | 1,370 | 18,351 | 17,749 | 808,664 | 769,456 | ||||||||||||||||||||||||||||||||||||
| Total | 168,855,376 | 133,649,972 | 49,075,244 | 37,985,634 | 19,545,475 | 16,232,578 | 16,064,381 | 17,293,363 | 2,470,387 | 2,122,240 | 241,416,807 | 189,207,015 | ||||||||||||||||||||||||||||||||||||
| Liabilities | ||||||||||||||||||||||||||||||||||||||||||||||||
| Current and long-term liabilities | ||||||||||||||||||||||||||||||||||||||||||||||||
| Deposits | 40,311,436 | 38,283,618 | 32,520,307 | 25,823,927 | 7,598,523 | 5,884,682 | 835,875 | 4,966,378 | 149 | - | 73,354,824 | 63,271,408 | ||||||||||||||||||||||||||||||||||||
| Demand deposits | 8,143,188 | 7,907,647 | 9,073,268 | 6,716,836 | 4,714,021 | 2,937,874 | 546,633 | 361,107 | 149 | - | 21,786,066 | 16,250,499 | ||||||||||||||||||||||||||||||||||||
| Savings deposits | - | - | 4,650,484 | 3,508,265 | - | - | - | - | - | - | 4,650,484 | 3,508,265 | ||||||||||||||||||||||||||||||||||||
| Interbank deposits | 9,513,506 | 12,871,885 | 211,411 | 167,716 | 1,951,258 | 936,607 | 289,242 | 779,557 | - | - | 7,503,137 | 9,022,676 | ||||||||||||||||||||||||||||||||||||
| Time deposits | 22,654,742 | 17,504,086 | 18,585,144 | 15,431,110 | 933,244 | 2,010,201 | - | 3,825,714 | - | - | 39,415,137 | 34,489,968 | ||||||||||||||||||||||||||||||||||||
| Deposits received under securities repurchase agreements | 13,974,819 | 13,164,317 | 447,775 | 414,112 | - | - | 2,014,222 | 3,730,410 | - | - | 14,049,324 | 12,411,251 | ||||||||||||||||||||||||||||||||||||
| Funds from acceptance and issuance of securities | 4,514,227 | 4,818,423 | 3,541,499 | 2,118,348 | 4,364,199 | 3,993,093 | 2,272,806 | 2,683,632 | - | - | 14,665,300 | 13,585,496 | ||||||||||||||||||||||||||||||||||||
| Borrowings | 27,257,167 | 18,573,524 | 2,740,927 | 2,129,221 | 407 | 1,597 | 223 | 6,018 | - | - | 29,998,724 | 20,710,360 | ||||||||||||||||||||||||||||||||||||
| Derivative financial instruments | 2,103,136 | 2,366,444 | 344,253 | 293,228 | 534,817 | 660,145 | 515,573 | 715,338 | - | - | 3,020,220 | 3,423,230 | ||||||||||||||||||||||||||||||||||||
| Foreign exchange portfolio | 49,650,250 | 32,016,427 | 426,618 | 420,750 | 4,516,336 | 3,667,559 | 1,545,512 | 487,556 | - | - | 53,121,705 | 36,007,023 | ||||||||||||||||||||||||||||||||||||
| Other liabilities | 20,360,845 | 14,736,854 | 3,223,344 | 2,293,056 | 338,549 | 574,993 | 1,340,687 | 1,961,936 | 369,576 | 196,228 | 25,405,373 | 19,570,136 | ||||||||||||||||||||||||||||||||||||
| Deferred income | 96,550 | 60,886 | 2,423 | 5,780 | 25,372 | 19,773 | - | - | 1,336 | 1,224 | 125,681 | 87,663 | ||||||||||||||||||||||||||||||||||||
| Minority interest in subsidiaries | - | - | 239 | 245 | 17 | 67 | 876,589 | 798,296 | - | 3 | 876,846 | 798,607 | ||||||||||||||||||||||||||||||||||||
| Stockholders’ equity | ||||||||||||||||||||||||||||||||||||||||||||||||
| Capital and reserves | 9,530,976 | 8,487,285 | 5,307,018 | 4,115,024 | 2,155,644 | 1,628,543 | 6,872,048 | 1,952,279 | 2,105,604 | 2,141,852 | 25,424,180 | 18,253,492 | ||||||||||||||||||||||||||||||||||||
| Net income for the period | 1,055,970 | 1,142,194 | 520,841 | 371,943 | 11,611 | (197,874 | ) | (209,154 | ) | (8,480 | ) | (6,278 | ) | (217,067 | ) | 1,374,630 | 1,088,349 | |||||||||||||||||||||||||||||||
| Total | 168,855,376 | 133,649,972 | 49,075,244 | 37,985,634 | 19,545,475 | 16,232,578 | 16,064,381 | 17,293,363 | 2,470,387 | 2,122,240 | 241,416,807 | 189,207,015 | ||||||||||||||||||||||||||||||||||||
| Statement of Income | ||||||||||||||||||||||||||||||||||||||||||||||||
| Income from financial operations | 3,162,217 | 2,667,124 | 2,704,104 | 1,909,121 | 213,537 | 205,313 | (161,649 | ) | 299,210 | 10,332 | 9,326 | 5,795,471 | 4,913,384 | |||||||||||||||||||||||||||||||||||
| Expenses of financial operations | (1,796,984 | ) | (1,289,733 | ) | (1,044,031 | ) | (751,087 | ) | (83,801 | ) | (111,748 | ) | 19,811 | (205,841 | ) | (416 | ) | (225 | ) | (2,760,144 | ) | (2,192,351 | ) | |||||||||||||||||||||||||
| Result of loan losses | (221,166 | ) | (156,230 | ) | (253,153 | ) | (135,009 | ) | (10,447 | ) | 2,546 | - | - | (151 | ) | (65 | ) | (484,917 | ) | (288,758 | ) | |||||||||||||||||||||||||||
| Gross income from financial operations | 1,144,067 | 1,221,161 | 1,406,920 | 1,023,025 | 119,289 | 96,111 | (141,838 | ) | 93,369 | 9,765 | 9,036 | 2,550,410 | 2,432,275 | |||||||||||||||||||||||||||||||||||
| Other operating revenues (expenses) | (86,756 | ) | (78,764 | ) | (612,000 | ) | (538,257 | ) | (88,140 | ) | (126,565 | ) | (67,316 | ) | (101,849 | ) | (4,115 | ) | (58,579 | ) | (867,610 | ) | (895,055 | ) | ||||||||||||||||||||||||
| Operating income | 1,057,311 | 1,142,397 | 794,920 | 484,768 | 31,149 | (30,454 | ) | (209,154 | ) | (8,480 | ) | 5,650 | (49,543 | ) | 1,682,800 | 1,537,220 | ||||||||||||||||||||||||||||||||
| Non-operating income | - | (48 | ) | 5,613 | 1,898 | 54 | (148,502 | ) | - | - | 1,461 | (153,023 | ) | 5,842 | (300,576 | ) | ||||||||||||||||||||||||||||||||
| Income before taxes on income and profit sharing | 1,057,311 | 1,142,349 | 800,533 | 486,666 | 31,203 | (178,956 | ) | (209,154 | ) | (8,480 | ) | 7,111 | (202,566 | ) | 1,688,642 | 1,236,644 | ||||||||||||||||||||||||||||||||
| Income tax | (1,341 | ) | (155 | ) | (253,672 | ) | (114,559 | ) | (15,138 | ) | (15,826 | ) | - | - | (13,389 | ) | (14,501 | ) | (283,539 | ) | (145,040 | ) | ||||||||||||||||||||||||||
| Statutory participation in income | - | - | (25,988 | ) | (135 | ) | (4,454 | ) | (3,095 | ) | - | - | - | - | (30,441 | ) | (3,230 | ) | ||||||||||||||||||||||||||||||
| Minority interest in subsidiaries | - | - | (32 | ) | (29 | ) | - | 3 | - | - | - | - | (32 | ) | (25 | ) | ||||||||||||||||||||||||||||||||
| Net income (loss) | 1,055,970 | 1,142,194 | 520,841 | 371,943 | 11,611 | (197,874 | ) | (209,154 | ) | (8,480 | ) | (6,278 | ) | (217,067 | ) | 1,374,630 | 1,088,349 | |||||||||||||||||||||||||||||||
| (1) | Itaú Unibanco S.A. - Grand Cayman, New York and Tokyo branches, ITAÚ UNIBANCO HOLDING S.A - Grand Cayman Branch, Banco Itaú-BBA S.A - Nassau Branch. |
| (2) | Banco Itaú Argentina S.A, Itaú Asset Management S.A.Sociedad Gerente de Fondos Comunes de Inversión, Itrust Servicios Inmobiliarios S.A.C.I, Itaú Sociedad de Bolsa S.A., Itaú Chile Holdings Inc., BICSA Holdings LTD., Banco Itaú Chile S.A., Itaú Chile Inversiones, Servicios Y Administración S.A., Itaú BBA Corredor de Bolsa Limitada (new company name of Itaú Chile Corredor de Bolsa Ltda.), Itaú Chile Corredora de Seguros Ltda., Itaú Chile Administradora General de Fondos S.A., Recuperadora de Créditos Ltda, Itaú Chile Compañia de Seguros de Vida S.A., ACO Ltda., Banco Itaú Uruguay S.A., OCA Casa Financiera S.A., OCA S.A., Unión Capital AFAP S.A., Banco Itau Paraguay, Tarjetas Unisoluciones S. A. de Capital Variable, Proserv - Promociones Y Servicios S.A. de C. V ., MCC Asesorias Limitada (50%), MCC Securites INC. (50%), Itaú BBA SAS, MCC Corredora de Bolsa (50,0489%) and Itaú BBA Colômbia; only at 09/30/2012, EF Securitizadora S.A.; only at 09/30/2013, Fundo ETF IPSA. |
| (3) | IPI - Itaúsa Portugal Investimentos, SGPS Lda. (49%), Itaúsa Europa - Investimentos, SGPS, Lda., Itaú Europa, SGPS, Lda., Itaúsa Portugal - SGPS S.A.,Itau BBA International (Cayman) Ltd., Banco Itaú Europa Luxembourg S.A., BIE Cayman Ltd., Banco Itaú Europa International, Itaú Bank & Trust Bahamas Ltd., Itaú Europa Securities Inc., Itaú Bahamas Directors Ltd., Itaú Bahamas Nominees Ltd., Banco Itau Suisse S.A. and Itaú BBA International PLC; only at 09/30/2012, Banco Itau BBA International S.A . |
| (4) | Itau Bank Ltd., ITB Holding Ltd., Jasper International Investment LLC, Itaú Bank & Trust Cayman Ltd., Uni-Investments Inter. Corp., Rosefield Finance Ltd. (50%), UBT Finance S.A., Itaú Cayman Directors Ltd. and Itaú Cayman Nominees Ltd.; only at 09/30/2012, Unibanco Cayman Bank Ltd. and Unipart Partic. Internac. Ltd. |
| (5) | Afinco Americas Madeira, SGPS Soc. Unipessoal Ltda, Topaz Holding Ltd., Itaú USA Inc., Itaú International Investment LLC, Albarus S.A., Banco Del Paraná S.A., Garnet Corporation, Itau Global Asset Management, Mundostar S.A., Karen International Ltd., Nevada Woods S.A., Itaú Asia Securities Ltd., IPI - Itaúsa Portugal Investimentos, SGPS Lda. (51%), Itaú BBA USA Securities Inc., Itaú Middle East Limited, Unipart B2B Investments, S.L.,Itau BBA UK Securities Limited, Itaú Japan Asset Management Ltd., Itaú (Beijing) Investment Consultancy Limited, Itaú UK Asset Management Limited, Itaú Asia Limited and Itaú USA INC; only at 09/30/2012, Zux Cayman Company Ltd.; only at 09/30/2013, Itaú Singapore Securities Pte. Ltd. |
| (6) | Foreign consolidated information presents balances net of eliminations from consolidation. |
Note 21 – Risk and capital management
Risk management is considered by ITAÚ UNIBANCO HOLDING an essential tool for optimizing the use of resources and selecting the best business opportunities, in order to maximize shareholder value.
At ITAÚ UNIBANCO HOLDING, risk and capital management is the process in which:
| · | The existing and potential risks in ITAÚ UNIBANCO HOLDING's operations are identified and measured; |
| · | Norms, procedures and methodologies for risk management and control consistent with the Board of Directors’ guidelines and ITAÚ UNIBANCO HOLDING’s strategies are approved; |
| · | The ITAÚ UNIBANCO HOLDING’s risk portfolio is managed considering the best risk-return ratio; |
The purpose of risk identification is to map the risk events of internal and external nature that may affect the strategies of support and business units and the fulfillment of their objectives, with possibility of impact on ITAÚ UNIBANCO HOLDING’s income, capital, liquidity and reputation.
Risk management processes are spread throughout the whole institution, aligned with the guidelines of the Board of Directors and Executives that, through Committees of the Board of Directors and Senior Commissions, define the global objectives that are measured as goals and limits to the risk management units. Control and capital management units, in turn, support the ITAÚ UNIBANCO HOLDING’s management by monitoring and analyzing risk and capital.
In compliance with CMN Resolution No. 3,988, BACEN Circular No.º 3.547 and BACEN Circular Letter No. 3.565, ITAÚ UNIBANCO HOLDING implemented its capital management structure and itsInternal Capital Adequacy Assessment Process (ICAAP), having submitted its first ICAAP report to BACEN in September 2013, related to June 2013 reporting date.
ITAÚ UNIBANCO HOLDING adopts a prospective approach to its capital management, which is carried out in a process consisting of the following phases:
| · | Identification and analysis of material risks to which Itaú Unibanco is exposed and assessment of capital requirements to cover material risks; |
| · | Capital planning considering the strategic guidelines, economic environment and the guidelines of the Board of Directors; |
| · | Stress tests exercises, aiming at analyzing the impact of serious events on the capitalization level of ITAÚ UNIBANCO HOLDING; |
| · | Maintenance of a capital contingency plan for cases in which the capital sources turn out to be unfeasible or insufficient; |
| · | Internal capital adequacy assessment; |
| · | Preparation of periodic management reports on capital adequacy for top management and the Board of Directors. |
ITAÚ UNIBANCO HOLDING’s risk management organizational structure is compliant with the regulations in Brazil and abroad and in line with market best practices. The Market, Credit, Liquidity, Operational and Underwriting risks control is performed in a centralized way by an independent unit, aiming at assuring that ITAÚ UNIBANCO HOLDING’s risks are being managed in accordance with established policies, norms and procedures. This independent structure is also responsible for centralizing ITAÚ UNIBANCO HOLDING’s capital management. The purpose of centralizing control is to provide the Executives and the Board of Directors with an overview of ITAÚ UNIBANCO HOLDING’s risk exposure, as well as a prospective view on the adequacy of its capital so as to optimize and speed up corporate decision-making.
ITAÚ UNIBANCO HOLDING manages proprietary IT systems to fully meet the applicable rules on capital reserve, and also for risk measurement, in compliance with the models issued by the regulatory models in force. It also coordinates actions to check for adherence to qualitative and quantitative requirements established by the relevant authorities for compliance with the minimum mandatory capital requirement and risk monitoring.
Further information on risk management can be found on the websitewww.itau-unibanco.com.br/ri, under section Corporate Governance/Risk Management – Pillar 3.
I – Market risk
Market risk is the possibility of incurring losses arising from the variations in the market values of positions held by a financial institution, including the risks of transactions subject to the variations in foreign exchange and interest rates, and equities, of price indexes and commodity prices among other indexes on these risk factors.
The market risk management is the process through which the institution plans, monitors and controls the risks of variations in financial instruments market values due market changes, aiming at optimizing the risk-return ratio, by using an appropriate structure of Adequate management limits, models and tools.
TheITAÚ UNIBANCO HOLDING’s Market Risk Management Policy is in line with the principles of Resolution No. 3,464, issued by the National Monetary Council (CMN) (as amended), being a set of principles that drive the ITAÚ UNIBANCO HOLDING strategy towards control and management of market risk of all business units and legal entities of the ITAÚ UNIBANCO HOLDING.
The document that details the guidelines set out by the corporate guidelines on market risk control can be read on the websitewww.itau-unibanco.com.br/ri, in the section Corporate Governance, Rules and Policies, Public Access Report – Market Risk.
Itau Unibanco’s market risk management strategy is aimed at balancing corporate business goals, taking into account, among other things:
| · | Political, economic and market conditions; |
| · | The market risk profile of the portfolio; and |
| · | Expertise within the group to support operations in specific markets. |
The process for managing market risk of ITAÚ UNIBANCO HOLDING occurs within the governance and hierarchy of committees and limits approved specifically for this purpose, sensitizing different levels and classes of market risk. This framework limits that covers from the monitoring of aggregate indicators of risk (portfolio level) to the monitoring of granular limits (individual desks level), assuring effectiveness and coverage of control. These limits are dimensioned considering the projected results of the balance sheet, expected performance and risk appetite of the institution, the level of equity and the profile of risk of each organization unit, which are defined in terms of risk measures used by management. Limits are monitored and controlled daily and excesses are reported and discussed in the corresponding committees. Additionally, daily risk reports used by the business and control areas, are issued the top management.
The structure of limits and alerts follows the guidelines of the Board of Directors and is designed and approved by the Superior Risk Committee (CSRisc), after discussions and deliberations by the Superior Institutional Treasury Committee (CSTI).The review of this structure of limits is performed at least annually.
The purpose of this structure is:
| · | Providing more assurance to all executive levels that the assumption of market risks is in line with the ITAÚ UNIBANCO HOLDING and the risk-return objective; |
| · | Promoting the disciplined and educated discussion on the global risk profile and its evolution over time; |
| · | increasing transparency on the way the business seeks the optimization of results; |
| · | Providing early warning mechanisms in order to make the effective risk management easier, without jeopardizing the business purposes; and |
| · | Avoiding risk concentration. |
The market risk control and management process is submitted to periodic reviews aimed at keeping it aligned with the best market practices and adhering to the continuous improvement processes at ITAÚ UNIBANCO HOLDING.
The control of market risk is carried out by an area independent from the business and audit ones, and is responsible for carrying out daily measurement, assessment,analysis and report activitiesto the areas and relevant people, pursuant to governance establishedand monitoring the actions required to adjust the position and/or risk level, when necessary.For this purpose, the ITAÚ UNIBANCO HOLDING relies on a structured communication and information flow, aiming at providing feedback for the follow-up of the superior committees and compliance with the regulatory bodies in Brazil and regulatory agents abroad.
ITAÚ UNIBANCO HOLDING hedges transactions with clients and proprietary positions, including its foreign investments, in order to mitigate risk arising from fluctuations in relevant market risk factors and to prevent positions from breaching relevant limits. Derivatives are commonly used for these hedging activities. When these transactions are classified as hedges for accounting purposes, specific supporting documentation is provided, including ongoing follow-up of hedge effectiveness (retrospective and prospective) and other changes in the accounting process. The accounting and managerial hedging procedures are governed by the institutional polices of ITAÚ UNIBANCO HOLDING.
The market risk framework categorizes transactions as part of either the banking portfolio or the trading portfolio, in accordance with general criteria established by the Capital Accord and subsequent amendments.
The trading portfolio consists of all qualifying transactions (including derivatives) held with intent to trade or to hedge risk within this portfolio, and that have no restriction.
The banking portfolio is basically characterized by transactions from the banking business, such as funding and loans, and also includes derivatives with eligible clients and transactions related to the management of the balance sheet of the institution, including by way of derivatives. It has the no-intention of resale and medium- and long-term time horizons as general guidelines.
Market risk exposures inherent in various financial instruments, including derivatives, are composed of various risk factors. A risk factor refers to a market parameter whose variation impacts a position’s valuation. The main risk factors measured by ITAÚ UNIBANCO HOLDING are as follows:
| · | Interest rates: the risk of losses from transactions subject to interest rates variations; |
| · | Foreign exchange-linked: the risk of losses arising from positions in transactions which are subject to a foreign exchange-linked interest rate; |
| · | Foreign exchange rates: the risk of losses from positions subject to foreign exchange rate variation; |
| · | Price index-linked: the risk of losses from transactions subject to the variations in the price of index-linked interest rates; |
| · | Variable income: risk of loss subject to variation in prices of shares and commodities; |
The market risk analyses are conducted based on the following metrics:
| · | Value at risk (VaR): statistical measure that estimates the expected maximum potential economic loss under normal market conditions, considering a certain time horizon and confidence level; |
| · | Losses in stress scenarios: simulation technique to assess the behavior of assets and liabilities and derivatives of a portfolio when several risk factors are taken to extreme market situations (based on prospective scenarios); |
| · | Stop loss: metrics which purpose is to review positions, should losses accumulated in a certain period reach a certain amount; |
| · | Concentration: cumulative exposure of a certain asset or risk factor calculated at market value (“MtM – Mark to Market”); |
| · | Stressed VaR: statistical metric arising from VaR calculation, which purpose is to capture higher risk in simulations for the current portfolio, considering returns that can be seen in historical scenarios. |
In addition to the aforementioned risk measures, sensitivity and loss control measures are also analyzed. They comprise:
| · | Mismatching analysis (GAPS):graphic representation by risk factor of cash flows expressed at market value, allocated at the maturity dates; |
| · | Sensitivity (DV01- Delta Variation): impact on the market value of cash flows, when submitted to an one annual basis point increase in the current interest rates or index rate; |
| · | Sensitivity to several risk factors (Greeks): partial derivatives of an option portfolio in relation to the prices of underlying assets, implied volatilities, interest rates and time. |
ITAÚ UNIBANCO HOLDING uses proprietary systems to measure the consolidated market risk. The processing of these systems basically takes place in São Paulo, in an access-controlled, of high availability, environment, with data safekeeping and recovery processes, and counts on such an infrastructure to ensure the continuity of business in contingency (disaster recovery) situations.
ITAÚ UNIBANCO HOLDING, maintaining its conservative management and portfolio diversification, continued with its policy of operating within low limits in relation to its capital during the period.
In September 2013, ITAÚ UNIBANCO HOLDING recorded a Total Global VaR of R$ 211 million (R$ 218 million in September 2012).
II – Credit risk
Credit risk is the possibility of incurring losses in connection with: the breach by the borrower, issuer or counterparty of the respective agreed-upon financial obligations, the devaluation of loan agreement due to downgrading of the borrower’s, issuer’s or counterparty’s risk rating, the reduction in gains or compensation, the advantages given upon renegotiation and the recovery costs.
In line with the principles of CMN Resolution No. 3,721 of April 30, 2009, ITAÚ UNIBANCO HOLDING has a structure for and institutional norm on credit risk management, approved by its Board of Directors, applicable to the companies and subsidiaries in Brazil and abroad.
The document that outlines the guidelines set out by this internal policy on credit risk control can be read on the websitewww.itau-unibanco.com.br/ri, in the section Corporate Governance, Rules and Policies, Public Access Report – Credit Risk.
The purpose of ITAÚ UNIBANCO HOLDING’s credit risk management is to keep the quality of loan portfolio in levels suitable for each market segment in which it operations.
ITAÚ UNIBANCO HOLDING establishes its credit policy based on internal factors, such as the client rating criteria and portfolio development analysis, the registered default levels, the incurred return rates, and the allocated economic capital; and external factors, related to the economic environment in Brazil and abroad, including market share, interest rates, market default indicators, inflation, and consumption increase/decrease.
ITAÚ UNIBANCO HOLDING’s centralized process for making decisions and establishing a credit policy guarantees the synchrony of credit actions.
To protect the institution against losses arising from loan operations, ITAÚ UNIBANCO HOLDING considers all aspects that determine the client’s credit risk to define the provision level commensurate with the risk incurred in each operation. For each operation, the assessment and rating of the client or economic group, the operation rating, and the possible existence of past-due amounts are taken into account and the volume of the regulatory provision is determined.
ITAÚ UNIBANCO HOLDING recognizes a provision additional to that required by BACEN, aiming at ensuring a provision level compatible with the expected loss model adopted by the institution's credit risk management, based on internal models. This allowance is usually quantified in view of the past performance of loan portfolios, based on exposure, probabilities of default and expected recovery of transactions.
III – Operational risk
For ITAÚ UNIBANCO HOLDING operational risk is defined as the possibility that strategic, tactical or operational objectives are negatively impacted due to uncertain events caused by failures, personnel and systems, or external events. It includes the legal risk, associated with the inadequacy or deficiency in agreements signed by the institution, as well as sanctions for failing to meet legal provisions and compensation for damages to third parties arising from activities performed by ITAÚ UNIBANCO HOLDING.
The purposes of operational risk management is to identify, evaluate, measure and respond to the ITAÚ UNIBANCO HOLDING’s operational risks and monitor them for the purpose of maintaining losses and risks within the limits established by ITAÚ UNIBANCO HODLING and to ensure adherence to the internal guidelines and current regulation. The managers of the business and support areas use corporate methodologies that are built and made available by the operational risk and internal control and compliance areas to support the management process.
Within the governance of the operational risk management process, there are specific operational risk and control forums conducted by the internal control and compliance areas where the consolidated reports on risk monitoring, controls, action plans and operational losses are presented to the business areas executives.
The set of principles, governance, roles and responsibilities, methodologies and procedures that support the operational risk management process applied to products, services, activities, processes and systems is described and published in an operational risk management institutional norm. A summarized version of such policy is available on the websitewww.itau-unibanco.com.br/ri in the section Corporate Governance, Rules and Policies, Public Access Report – Operational risk.
On April 30, 2008, BACEN published Circular No. 3.383 and Circular Letters Nos. 3,315 and No. 3,316, which establish the criteria for calculation of PRE related to the operational risk (POPR), addressed by Resolution No. 3,490, July 1, 2008. Therefore, since this date, ITAÚ UNIBANCO HOLDING has allocated capital to Operational Risk using the Alternative Standardized Approach.
IV – Liquidity risk
Liquidity risk is defined as the institution’s possibility of not be being able to efficiently meeting its expected and unexpected obligations, both current and future, including those arising from the pledged guarantees, without affecting its daily operations and without incurring significant losses.
Liquidity risk control is carried out by an area independent from the business areas, and which is responsible for defining the constitution of a reserve, proposing assumptions for behavior of cash flow, identifying, assessing, monitoring, controlling and reporting, on a daily basis, the exposure to liquidity risks in different time horizons, proposing limits for liquidity risk and monitoring the established limits, informing on possible noncompliance, considering the liquidity risks individually in countries where ITAÚ UNIBANCO HOLDING operates, simulating the behavior of cash flow under stress conditions, assessing and previously reporting risks inherent in new products and transactions, and reporting information required by regulatory bodies. Every activity is subject to analysis by independent areas of validation, internal controls and audit.
The measurement of liquidity risk covers all financial transactions of ITAÚ UNIBANCO HOLDING companies, as well as possible contingent or unexpected exposures, such as those arising from settlement services, pledge of endorsements and sureties and credit facilities contracted and not used.
The document that expresses the guidelines set forth by the internal policy on liquidity risk management may be viewed on the websitewww.itau-unibanco.com.br/ri, in the section Corporate Governance, Rules and Policies, Public Access Report - Liquidity Risk.
V - Insurance, Pension Plan and Capitalization Risks
Products that make up the portfolios of ITAÚ UNIBANCO HOLDING’s insurance companies are related to the life, large risks, extended warranty, pension plan and capitalization. Thus, the main risks these portfolios are subject to are underwriting, market, counterparty credit and longevity risk, among others.
Regarding Insurance, Pension Plan and Capitalization, ITAÚ UNIBANCO HOLDING understands that:
| · | Underwriting risk is the possibility of losses occurring as a result of insurance, pension plan and capitalization operations that contradict the company’s expectations, directly or indirectly associated with technical and actuarial bases used to calculate premiums, contributions and provisions. |
| · | Market risk is the possibility of losses occurring as a result of variations in market values of assets and liabilities that make up actuarial reserves. |
| · | Counterparty credit risk is the possibility of noncompliance, by a certain counterparty, with obligations related to the settlement of operations that involve trading of financial assets or reinsurance. |
| · | Longevity risk is the possibility that pension plans have to pay pensions and superannuation for periods longer than those originally expected. |
The management process of insurance, pension plan and capitalization risks is based on responsibilities defined and communicated between the control and business areas, assuring independence between them.
Note 22 –Supplementary information
| a) | Insurance policy -ITAÚ UNIBANCO HOLDING and its subsidiaries, despite the low risk exposure due to a physical non-concentration of their assets, have the policy to guarantee their valuables and assets at amounts considered sufficient to cover possible claims. |
| b) | Foreign currency – The balances in Reais linked to the foreign currency were: |
| 09/30/2013 | 09/30/2012 | |||||||
| Permanent foreign investments | 26,798,810 | 19,341,841 | ||||||
| Net amount of other assets and liabilities indexed to foreign currency, including derivatives | (43,832,778 | ) | (31,369,739 | ) | ||||
| Net foreign exchange position | (17,033,968 | ) | (12,027,898 | ) | ||||
The net foreign exchange position, considering the tax effects on the net balance of other assets and liabilities indexed to foreign currency, reflects the low exposure to exchange variations.
| c) | Investment funds and managed portfolios -ITAÚ UNIBANCO HOLDING, through its subsidiaries, manages the following types of funds: privatization, fixed income, shares, open portfolio shares, investment clubs, customer portfolios and group portfolios, domestic and foreign, classified in memorandum accounts, distributed as follows: |
| Amount | Amount (*) | Number of funds | ||||||||||||||||||||||
| 09/30/2013 | 09/30/2012 | 09/30/2013 | 09/30/2012 | 09/30/2013 | 09/30/2012 | |||||||||||||||||||
| Investment funds | 458,160,572 | 367,803,287 | 458,160,572 | 367,803,287 | 2,189 | 3,681 | ||||||||||||||||||
| Fixed income | 420,122,023 | 343,064,874 | 420,122,023 | 343,064,874 | 1,821 | 2,976 | ||||||||||||||||||
| Shares | 38,038,549 | 24,738,413 | 38,038,549 | 24,738,413 | 368 | 705 | ||||||||||||||||||
| Managed portfolios | 239,777,056 | 212,328,838 | 164,286,979 | 151,723,673 | 15,414 | 15,877 | ||||||||||||||||||
| Customers | 121,024,203 | 111,815,836 | 79,250,773 | 79,672,242 | 15,354 | 15,817 | ||||||||||||||||||
| Itaú Group | 118,752,853 | 100,513,002 | 85,036,206 | 72,051,431 | 60 | 60 | ||||||||||||||||||
| Total | 697,937,628 | 580,132,125 | 622,447,551 | 519,526,960 | 17,603 | 19,558 | ||||||||||||||||||
(*) It refers to the distribution after elimination of double-counting of managed portfolios in investment funds.
| d) | Consortia funds |
| 09/30/2013 | 09/30/2012 | |||||||
| Monthly estimate of installments receivable from participants | 108,487 | 86,203 | ||||||
| Group liabilities by installments | 9,076,849 | 6,410,714 | ||||||
| Participants – assets to be delivered | 8,405,496 | 5,949,944 | ||||||
| Funds available for participants | 785,845 | 554,504 | ||||||
| (In units) | ||||||||
| Number of managed groups | 849 | 806 | ||||||
| Number of current participants | 350,808 | 264,503 | ||||||
| Number of assets to be delivered to participants | 205,445 | 153,320 | ||||||
| e) | Fundação Itaú Social -ITAÚ UNIBANCO HOLDING and its subsidiaries are the main sponsors of Fundação Itaú Social, the objectives of which are: 1) managing the “Itaú Social Program”, which aims at coordinating the organization’s role in projects of interest to the community by supporting or developing social, scientific and cultural projects, mainly in the elementary education and health areas; 2) supporting projects or initiatives in progress, supported or sponsored by entities qualified to work in the ”Programa Itaú Social” (Itaú Social Program). |
During the period from January 1 to September 30, 2013 and 2012 the consolidated companies made no donations and the Foundation’s social net assets totaled R$ 2,787,356 (R$ 3,005,736 at September 30, 2012). The income arising from its investments will be used to achieve the Foundation’s social purposes.
| f) | Instituto Itaú Cultural – IIC -ITAÚ UNIBANCO HOLDING and its subsidiaries are supporters of Instituto Itaú Cultural - IIC, an entity formed to grant incentives, promote and preserve Brazil’s cultural heritage. During the period, the consolidated companies donated the amount of R$ 53,000 (R$ 47,400 from January 1 to September 30, 2012). |
| g) | Instituto Unibanco -ITAÚ UNIBANCO HOLDING and its subsidiaries sponsor Instituto Unibanco, an entity whose objective is to support projects on social assistance, particularly education, culture, promotion of integration to labor market, and environmental protection, directly and/or supplementarily, through the civil society’s institutions. |
| h) | Instituto Unibanco de Cinema -ITAÚ UNIBANCO HOLDING and its subsidiaries sponsor Instituto Unibanco de Cinema, an entity whose objective is (i) the fostering of culture in general; and (ii) providing access of low-income population to cinematography, videography and similar productions, for which it shall maintain movie theaters owned or managed by itself, and theaters to screen films, videos, video-laser discs and other related activities, as well as to screen and divulge films of great importance, especially those produced in Brazil. |
| i) | Associação Clube “A” -ITAÚ UNIBANCO HOLDING and is subsidiaries sponsor Associação Clube “A”, an entity whose objective is the provision of social services for the welfare of beneficiaries, in the way and conditions established by its Internal Rules, and according to the funds available. These services may include, among others, the promotion of cultural, educational, sports, entertainment and health care activities. During the period from January 1 to September 30, 2013, the consolidated companies made donations to Clube “A” in the amount of R$ 800 (R$ 800 from January 1 to September 30, 2012). |
| j) | Instituto Assistencial Pedro di Perna -ITAÚ UNIBANCO HOLDING and its subsidiaries sponsor Instituto Assistencial Pedro di Perna, an entity whose objective is the provision of social services, stimulate sport activities, and promote recreation, aimed at the welfare of its members, in the way and conditions established by its Internal Rules, and according to the funds available. |
| k) | Exclusions of nonrecurring effects net of tax effects – Holding and Holding Consolidated |
| 01/01 to 09/30/2013 | 01/01 to 09/30/2012 | |||||||
| Provision for contingencies - Economic plans (Note 12) | (105,587 | ) | (133,385 | ) | ||||
| Market value based on the share price – BPI (Note 13j) | - | (305,447 | ) | |||||
| Total | (105,587 | ) | (438,832 | ) | ||||
| l) | Agreements for offset and settlement of liabilities in the scope of the National Financial System – Offset agreements were entered into in the scope of derivative contracts, as well as agreements for offset and settlement of receivables and payables pursuant to CMN Resolution No. 3.263, of February 24, 2005, which purpose is to enable the offset of credits and debits maintained with the same counterparty, and in which the maturity dates of receivables and payables can be advanced to the date an event of default by one of the parties occurs or in case of the bankruptcy of the debtor. |
| m) | Subsequent Event |
On October 1, 2013 ITAÚ UNIBANCO HOLDING carried out a credit assignment operation with risks and benefits held, in accordance with Resolution No. 3,533/08, totaling R$ 4.3 billion and regards agreements with securitized real estate loans as collateral, with no effect on the consolidated results.
Report on review of interim financial statements
To the Board of Directors and Stockholders
Itaú Unibanco Holding S.A.
Introduction
We have reviewed the accompanying interim financial statements of Itaú Unibanco Holding S.A. stand alone, which comprise the balance sheet as at September 30, 2013 and the related statements of income, changes in stockholders equity’s and cash flows for the nine-month period then ended, as well as the accompanying consolidated interim financial statements of Itaú Unibanco Holding S.A. and its subsidiaries (“Consolidated”), which comprise the consolidated balance sheet as at September 30, 2013 and the related consolidated statements of income and cash flows for the nine-month period then ended, and a summary of significant accounting policies and other explanatory information.
Management is responsible for the preparation and fair presentation of the stand alone and consolidated interim financial statements in accordance with accounting practices adopted in Brazil, applicable to institutions authorized to operate by the Brazilian Central Bank (BACEN). Our responsibility is to express a conclusion on these interim financial statements based on our review.
Scope of review
We conducted our review in accordance with Brazilian and International Standards on Review Engagements (ISRE 2410- Review of Interim Financial Information Performed by the Independent Auditor of the Entity). A review of interim financial statements consists of making inquiries, primarily of persons responsible for financial and accounting matters, and applying analytical and other review procedures. A review is substantially less in scope than an audit conducted in accordance with Brazilian and International Standards on Auditing and consequently does not enable us to obtain assurance that we would become aware of all significant matters that might be identified in an audit. Accordingly, we do not express an audit opinion.
Conclusion on the stand alone and Consolidated interim Financial Statements
Based on our review, nothing has come to our attention that causes us to believe that the stand alone and the Consolidated interim financial statements referred to above do not present fairly, in all material respects, the financial position of Itaú Unibanco Holding S.A. as at September 30, 2013, and the financial performance and cash flows, for the nine-month period then ended, in accordance with accounting practices adopted in Brazil, applicable to institutions authorized to operate by the Brazilian Central Bank (BACEN).
Other matters
Statement of value added
We also have reviewed the interim statements of value added of Itaú Unibanco Holding S.A. and Itaú Unibanco Holding S.A. and its subsidiaries for the nine-month period ended September 30, 2013, presented as supplementary information. These statements have been submitted to the same review procedures described in the second paragraph above and, based on our review, nothing has come to our attention that causes us to believe that these statements are not prepared consistently, in all material respects, with the interim financial statements taken as a whole.
São Paulo, October 28, 2013
PricewaterhouseCoopers
Auditores Independentes
CRC 2SP000160/O-5
Paulo Sergio Miron
Contador CRC 1SP173647/O-5
ITAÚ UNIBANCO HOLDING S.A.
| CNPJ. 60.872.504/0001-23 | Listed Company | NIRE. 35300010230 |
OPINION OF THE FISCAL COUNCIL
The members of the Fiscal Council of ITAÚ UNIBANCO HOLDING S.A., having examined the financial statements for the period from January to September 30, 2013, have verified the accuracy of all items examined and, in view of the unqualified opinion of PricewaterhouseCoopers Auditores Independentes, understand that they adequately reflect the company’s capital structure, financial position and the activities conducted during the period.
São Paulo, October 28, 2013.
ALBERTO SOZIN FURUGUEM
Member
LUIZ ALBERTO DE CASTRO FALLEIROS
Member
JOSÉ CARUZO CRUZ HENRIQUES
Alternate Member