Exhibt 99.1 Management Discussion & Analysis and Complete Financial Statements 1Q19 Itaú Unibanco Holding S.A. www.itau.com.br/investor-relations facebook.com/itauunibancori @itauunibanco_ri Exhibt 99.1 Management Discussion & Analysis and Complete Financial Statements 1Q19 Itaú Unibanco Holding S.A. www.itau.com.br/investor-relations facebook.com/itauunibancori @itauunibanco_ri
Contents Executive Summary 03 Management Income Statement and Balance Sheet Analysis 13 Discussion & Managerial Financial Margin 14 Analysis Cost of Credit 16 Credit Quality 18 Page 03 Commissions and Fees & Result from Insurance 21 Insurance, Pension Plan and Premium Bonds Operations 24 Non-interest Expenses 27 Balance Sheet 29 Credit Portfolio 30 Funding 32 Risk and Capital Management 33 Results by Business Segments 35 Results by Region - Brazil and Latin America 37 Activities Abroad 38 Additional Information 41 Itaú Unibanco Shares 42 Disclosure Criteria 43 Report of Independent Auditors 44 Complete Financial Statements Page 45 Contents Executive Summary 03 Management Income Statement and Balance Sheet Analysis 13 Discussion & Managerial Financial Margin 14 Analysis Cost of Credit 16 Credit Quality 18 Page 03 Commissions and Fees & Result from Insurance 21 Insurance, Pension Plan and Premium Bonds Operations 24 Non-interest Expenses 27 Balance Sheet 29 Credit Portfolio 30 Funding 32 Risk and Capital Management 33 Results by Business Segments 35 Results by Region - Brazil and Latin America 37 Activities Abroad 38 Additional Information 41 Itaú Unibanco Shares 42 Disclosure Criteria 43 Report of Independent Auditors 44 Complete Financial Statements Page 45

Management Discussion & Analysis Management Discussion & Analysis and Complete Financial Statements Management Discussion & Analysis Management Discussion & Analysis and Complete Financial Statements

(This page was intentionally left blank) Itaú Unibanco Holding S.A. 04 (This page was intentionally left blank) Itaú Unibanco Holding S.A. 04
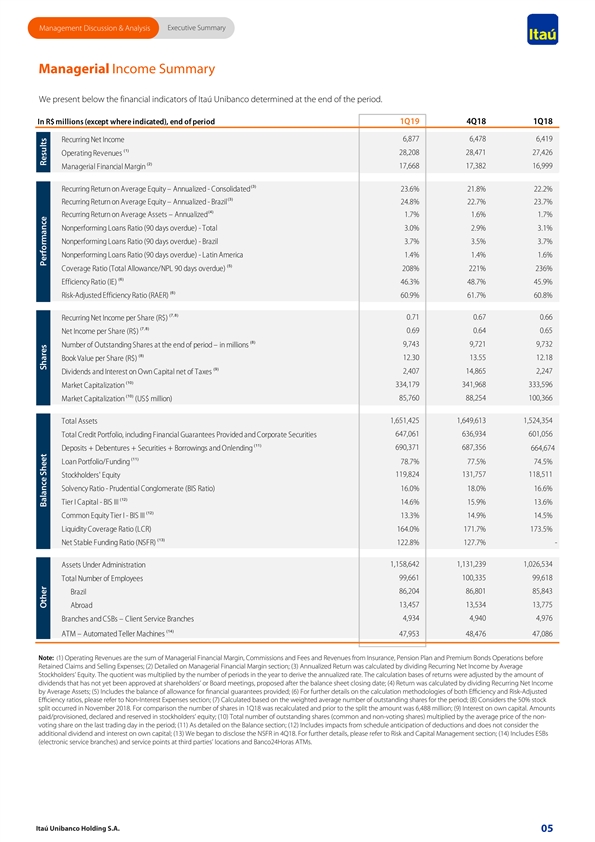
Executive Summary Management Discussion & Analysis Managerial Income Summary We present below the financial indicators of Itaú Unibanco determined at the end of the period. In R$ millions (except where indicated), end of period 1Q19 4Q18 1Q18 Recurring Net Income 6,877 6,478 6,419 (1) 28,208 28,471 27,426 Operating Revenues (2) 17,668 17,382 16,999 Managerial Financial Margin (3) Recurring Return on Average Equity – Annualized - Consolidated 23.6% 21.8% 22.2% (3) Recurring Return on Average Equity – Annualized - Brazil 24.8% 22.7% 23.7% (4) Recurring Return on Average Assets – Annualized 1.7% 1.6% 1.7% Nonperforming Loans Ratio (90 days overdue) - Total 3.0% 2.9% 3.1% Nonperforming Loans Ratio (90 days overdue) - Brazil 3.7% 3.5% 3.7% Nonperforming Loans Ratio (90 days overdue) - Latin America 1.4% 1.4% 1.6% (5) Coverage Ratio (Total Allowance/NPL 90 days overdue) 208% 221% 236% (6) Efficiency Ratio (IE) 46.3% 48.7% 45.9% (6) Risk-Adjusted Efficiency Ratio (RAER) 60.9% 61.7% 60.8% (7,8) Recurring Net Income per Share (R$) 0.71 0.67 0.66 (7,8) 0.69 0.64 0.65 Net Income per Share (R$) (8) Number of Outstanding Shares at the end of period – in millions 9,743 9,721 9,732 (8) 12.30 13.55 12.18 Book Value per Share (R$) (9) Dividends and Interest on Own Capital net of Taxes 2,407 14,865 2,247 (10) 334,179 341,968 333,596 Market Capitalization (10) Market Capitalization (US$ million) 85,760 88,254 100,366 1,651,425 1,649,613 1,524,354 Total Assets Total Credit Portfolio, including Financial Guarantees Provided and Corporate Securities 647,061 636,934 601,056 (11) 690,371 687,356 Deposits + Debentures + Securities + Borrowings and Onlending 664,674 (11) Loan Portfolio/Funding 78.7% 77.5% 74.5% 119,824 131,757 118,511 Stockholders' Equity Solvency Ratio - Prudential Conglomerate (BIS Ratio) 16.0% 18.0% 16.6% (12) Tier I Capital - BIS III 14.6% 15.9% 13.6% (12) Common Equity Tier I - BIS III 13.3% 14.9% 14.5% Liquidity Coverage Ratio (LCR) 164.0% 171.7% 173.5% (13) Net Stable Funding Ratio (NSFR) 122.8% 127.7% - 1,158,642 1,131,239 1,026,534 Assets Under Administration 99,661 100,335 99,618 Total Number of Employees 86,204 86,801 85,843 Brazil 13,457 13,534 13,775 Abroad Branches and CSBs – Client Service Branches 4,934 4,940 4,976 (14) ATM – Automated Teller Machines 47,953 48,476 47,086 Note: (1) Operating Revenues are the sum of Managerial Financial Margin, Commissions and Fees and Revenues from Insurance, Pension Plan and Premium Bonds Operations before Retained Claims and Selling Expenses; (2) Detailed on Managerial Financial Margin section; (3) Annualized Return was calculated by dividing Recurring Net Income by Average Stockholders’ Equity. The quotient was multiplied by the number of periods in the year to derive the annualized rate. The calculation bases of returns were adjusted by the amount of dividends that has not yet been approved at shareholders’ or Board meetings, proposed after the balance sheet closing date; (4) Return was calculated by dividing Recurring Net Income by Average Assets; (5) Includes the balance of allowance for financial guarantees provided; (6) For further details on the calculation methodologies of both Efficiency and Risk-Adjusted Efficiency ratios, please refer to Non-Interest Expenses section; (7) Calculated based on the weighted average number of outstanding shares for the period; (8) Considers the 50% stock split occurred in November 2018. For comparison the number of shares in 1Q18 was recalculated and prior to the split the amount was 6,488 million; (9) Interest on own capital. Amounts paid/provisioned, declared and reserved in stockholders’ equity; (10) Total number of outstanding shares (common and non-voting shares) multiplied by the average price of the non- voting share on the last trading day in the period; (11) As detailed on the Balance section; (12) Includes impacts from schedule anticipation of deductions and does not consider the additional dividend and interest on own capital; (13) We began to disclose the NSFR in 4Q18. For further details, please refer to Risk and Capital Management section; (14) Includes ESBs (electronic service branches) and service points at third parties’ locations and Banco24Horas ATMs. Itaú Unibanco Holding S.A. 05 Other Balance Sheet Shares Performance ResultsExecutive Summary Management Discussion & Analysis Managerial Income Summary We present below the financial indicators of Itaú Unibanco determined at the end of the period. In R$ millions (except where indicated), end of period 1Q19 4Q18 1Q18 Recurring Net Income 6,877 6,478 6,419 (1) 28,208 28,471 27,426 Operating Revenues (2) 17,668 17,382 16,999 Managerial Financial Margin (3) Recurring Return on Average Equity – Annualized - Consolidated 23.6% 21.8% 22.2% (3) Recurring Return on Average Equity – Annualized - Brazil 24.8% 22.7% 23.7% (4) Recurring Return on Average Assets – Annualized 1.7% 1.6% 1.7% Nonperforming Loans Ratio (90 days overdue) - Total 3.0% 2.9% 3.1% Nonperforming Loans Ratio (90 days overdue) - Brazil 3.7% 3.5% 3.7% Nonperforming Loans Ratio (90 days overdue) - Latin America 1.4% 1.4% 1.6% (5) Coverage Ratio (Total Allowance/NPL 90 days overdue) 208% 221% 236% (6) Efficiency Ratio (IE) 46.3% 48.7% 45.9% (6) Risk-Adjusted Efficiency Ratio (RAER) 60.9% 61.7% 60.8% (7,8) Recurring Net Income per Share (R$) 0.71 0.67 0.66 (7,8) 0.69 0.64 0.65 Net Income per Share (R$) (8) Number of Outstanding Shares at the end of period – in millions 9,743 9,721 9,732 (8) 12.30 13.55 12.18 Book Value per Share (R$) (9) Dividends and Interest on Own Capital net of Taxes 2,407 14,865 2,247 (10) 334,179 341,968 333,596 Market Capitalization (10) Market Capitalization (US$ million) 85,760 88,254 100,366 1,651,425 1,649,613 1,524,354 Total Assets Total Credit Portfolio, including Financial Guarantees Provided and Corporate Securities 647,061 636,934 601,056 (11) 690,371 687,356 Deposits + Debentures + Securities + Borrowings and Onlending 664,674 (11) Loan Portfolio/Funding 78.7% 77.5% 74.5% 119,824 131,757 118,511 Stockholders' Equity Solvency Ratio - Prudential Conglomerate (BIS Ratio) 16.0% 18.0% 16.6% (12) Tier I Capital - BIS III 14.6% 15.9% 13.6% (12) Common Equity Tier I - BIS III 13.3% 14.9% 14.5% Liquidity Coverage Ratio (LCR) 164.0% 171.7% 173.5% (13) Net Stable Funding Ratio (NSFR) 122.8% 127.7% - 1,158,642 1,131,239 1,026,534 Assets Under Administration 99,661 100,335 99,618 Total Number of Employees 86,204 86,801 85,843 Brazil 13,457 13,534 13,775 Abroad Branches and CSBs – Client Service Branches 4,934 4,940 4,976 (14) ATM – Automated Teller Machines 47,953 48,476 47,086 Note: (1) Operating Revenues are the sum of Managerial Financial Margin, Commissions and Fees and Revenues from Insurance, Pension Plan and Premium Bonds Operations before Retained Claims and Selling Expenses; (2) Detailed on Managerial Financial Margin section; (3) Annualized Return was calculated by dividing Recurring Net Income by Average Stockholders’ Equity. The quotient was multiplied by the number of periods in the year to derive the annualized rate. The calculation bases of returns were adjusted by the amount of dividends that has not yet been approved at shareholders’ or Board meetings, proposed after the balance sheet closing date; (4) Return was calculated by dividing Recurring Net Income by Average Assets; (5) Includes the balance of allowance for financial guarantees provided; (6) For further details on the calculation methodologies of both Efficiency and Risk-Adjusted Efficiency ratios, please refer to Non-Interest Expenses section; (7) Calculated based on the weighted average number of outstanding shares for the period; (8) Considers the 50% stock split occurred in November 2018. For comparison the number of shares in 1Q18 was recalculated and prior to the split the amount was 6,488 million; (9) Interest on own capital. Amounts paid/provisioned, declared and reserved in stockholders’ equity; (10) Total number of outstanding shares (common and non-voting shares) multiplied by the average price of the non- voting share on the last trading day in the period; (11) As detailed on the Balance section; (12) Includes impacts from schedule anticipation of deductions and does not consider the additional dividend and interest on own capital; (13) We began to disclose the NSFR in 4Q18. For further details, please refer to Risk and Capital Management section; (14) Includes ESBs (electronic service branches) and service points at third parties’ locations and Banco24Horas ATMs. Itaú Unibanco Holding S.A. 05 Other Balance Sheet Shares Performance Results
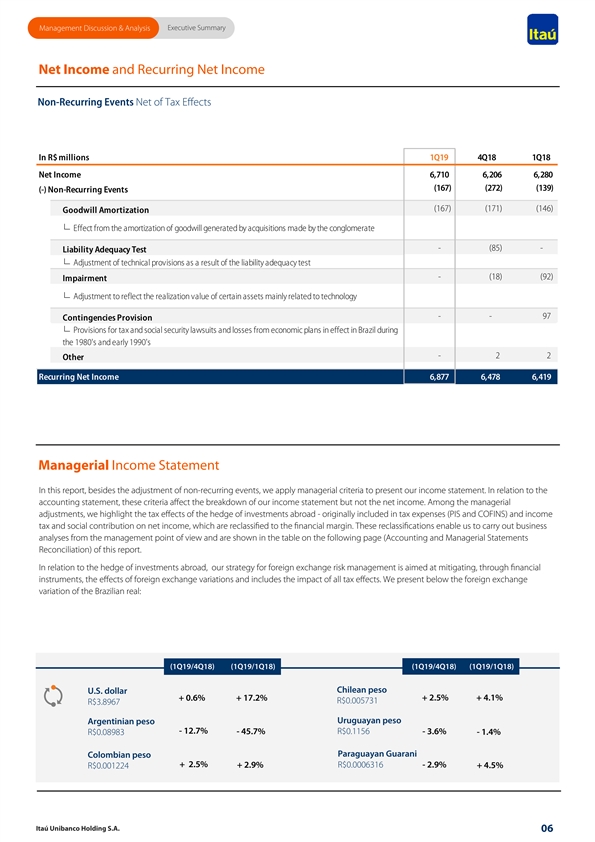
Executive Summary Management Discussion & Analysis Net Income and Recurring Net Income Non-Recurring Events Net of Tax Effects In R$ millions 1Q19 4Q18 1Q18 Net Income 6,710 6,206 6 ,280 (167) (272) (139) (-) Non-Recurring Events (167) (171) (146) Goodwill Amortization ∟ Effect from the amortization of goodwill generated by acquisitions made by the conglomerate - ( 85) - Liability Adequacy Test ∟ Adjustment of technical provisions as a result of the liability adequacy test - ( 18) ( 92) Impairment ∟ Adjustment to reflect the realization value of certain assets mainly related to technology - - 97 Contingencies Provision ∟ Provisions for tax and social security lawsuits and losses from economic plans in effect in Brazil during the 1980's and early 1990's - 2 2 Other Recurring Net Income 6,877 6,478 6 ,419 Managerial Income Statement In this report, besides the adjustment of non-recurring events, we apply managerial criteria to present our income statement. In relation to the accounting statement, these criteria affect the breakdown of our income statement but not the net income. Among the managerial adjustments, we highlight the tax effects of the hedge of investments abroad - originally included in tax expenses (PIS and COFINS) and income tax and social contribution on net income, which are reclassified to the financial margin. These reclassifications enable us to carry out business analyses from the management point of view and are shown in the table on the following page (Accounting and Managerial Statements Reconciliation) of this report. In relation to the hedge of investments abroad, our strategy for foreign exchange risk management is aimed at mitigating, through financial instruments, the effects of foreign exchange variations and includes the impact of all tax effects. We present below the foreign exchange variation of the Brazilian real: (1Q19/4Q18) (1Q19/1Q18) (1Q19/4Q18) (1Q19/1Q18) Chilean peso U.S. dollar + 0.6% + 17.2% + 2.5% + 4.1% R$0.005731 R$3.8967 Uruguayan peso Argentinian peso - 12.7% - 45.7% R$0.1156 - 3.6% R$0.08983 - 1.4% Paraguayan Guarani Colombian peso + 2.5% + 2.9% R$0.0006316 - 2.9% + 4.5% R$0.001224 Itaú Unibanco Holding S.A. 06 Executive Summary Management Discussion & Analysis Net Income and Recurring Net Income Non-Recurring Events Net of Tax Effects In R$ millions 1Q19 4Q18 1Q18 Net Income 6,710 6,206 6 ,280 (167) (272) (139) (-) Non-Recurring Events (167) (171) (146) Goodwill Amortization ∟ Effect from the amortization of goodwill generated by acquisitions made by the conglomerate - ( 85) - Liability Adequacy Test ∟ Adjustment of technical provisions as a result of the liability adequacy test - ( 18) ( 92) Impairment ∟ Adjustment to reflect the realization value of certain assets mainly related to technology - - 97 Contingencies Provision ∟ Provisions for tax and social security lawsuits and losses from economic plans in effect in Brazil during the 1980's and early 1990's - 2 2 Other Recurring Net Income 6,877 6,478 6 ,419 Managerial Income Statement In this report, besides the adjustment of non-recurring events, we apply managerial criteria to present our income statement. In relation to the accounting statement, these criteria affect the breakdown of our income statement but not the net income. Among the managerial adjustments, we highlight the tax effects of the hedge of investments abroad - originally included in tax expenses (PIS and COFINS) and income tax and social contribution on net income, which are reclassified to the financial margin. These reclassifications enable us to carry out business analyses from the management point of view and are shown in the table on the following page (Accounting and Managerial Statements Reconciliation) of this report. In relation to the hedge of investments abroad, our strategy for foreign exchange risk management is aimed at mitigating, through financial instruments, the effects of foreign exchange variations and includes the impact of all tax effects. We present below the foreign exchange variation of the Brazilian real: (1Q19/4Q18) (1Q19/1Q18) (1Q19/4Q18) (1Q19/1Q18) Chilean peso U.S. dollar + 0.6% + 17.2% + 2.5% + 4.1% R$0.005731 R$3.8967 Uruguayan peso Argentinian peso - 12.7% - 45.7% R$0.1156 - 3.6% R$0.08983 - 1.4% Paraguayan Guarani Colombian peso + 2.5% + 2.9% R$0.0006316 - 2.9% + 4.5% R$0.001224 Itaú Unibanco Holding S.A. 06
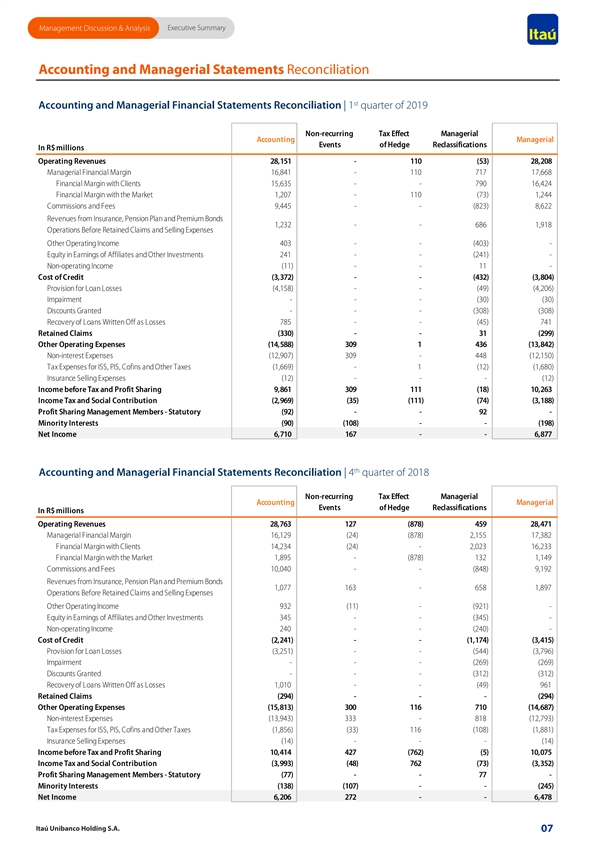
Executive Summary Management Discussion & Analysis Accounting and Managerial Statements Reconciliation st Accounting and Managerial Financial Statements Reconciliation | 1 quarter of 2019 Non-recurring Tax Effect Managerial Accounting Managerial Events of Hedge Reclassifications In R$ millions Operating Revenues 28,151 - 110 (53) 28,208 Managerial Financial Margin 16,841 - 110 717 17,668 Financial Margin with Clients 15,635 - - 790 16,424 Financial Margin with the Market 1,207 - 1 10 (73) 1,244 Commissions and Fees 9,445 - - (823) 8,622 Revenues from Insurance, Pension Plan and Premium Bonds 1,232 - - 686 1,918 Operations Before Retained Claims and Selling Expenses Other Operating Income 403 - - (403) - Equity in Earnings of Affiliates and Other Investments 241 - - (241) - Non-operating Income (11) - - 11 - Cost of Credit (3,372) - - (432) (3,804) Provision for Loan Losses (4,158) - - (49) (4,206) Impairment - - - (30) (30) Discounts Granted - - - (308) (308) Recovery of Loans Written Off as Losses 785 - - (45) 741 Retained Claims (330) - - 31 (299) Other Operating Expenses (14,588) 309 1 436 (13,842) Non-interest Expenses (12,907) 309 - 448 (12,150) Tax Expenses for ISS, PIS, Cofins and Other Taxes (1,669) - 1 (12) (1,680) Insurance Selling Expenses (12) - - - (12) Income before Tax and Profit Sharing 9,861 309 1 11 (18) 10,263 Income Tax and Social Contribution ( 2,969) (35) (111) (74) (3,188) Profit Sharing Management Members - Statutory (92) - - 92 - Minority Interests (90) (108) - - (198) Net Income 6,710 167 - - 6,877 th Accounting and Managerial Financial Statements Reconciliation | 4 quarter of 2018 Non-recurring Tax Effect Managerial Accounting Managerial Events of Hedge Reclassifications In R$ millions Operating Revenues 28,763 127 (878) 459 28,471 Managerial Financial Margin 16,129 (24) (878) 2,155 17,382 Financial Margin with Clients 14,234 (24) - 2,023 16,233 Financial Margin with the Market 1,895 - (878) 132 1,149 Commissions and Fees 10,040 - - (848) 9,192 Revenues from Insurance, Pension Plan and Premium Bonds 1,077 163 - 658 1,897 Operations Before Retained Claims and Selling Expenses Other Operating Income 932 (11) - (921) - Equity in Earnings of Affiliates and Other Investments 345 - - (345) - Non-operating Income 240 - - (240) - Cost of Credit ( 2,241) - - (1,174) (3,415) Provision for Loan Losses (3,251) - - (544) (3,796) Impairment - - - (269) (269) Discounts Granted - - - (312) (312) Recovery of Loans Written Off as Losses 1,010 - - (49) 961 Retained Claims (294) - - - (294) Other Operating Expenses (15,813) 300 1 16 710 (14,687) Non-interest Expenses (13,943) 333 - 818 (12,793) Tax Expenses for ISS, PIS, Cofins and Other Taxes (1,856) (33) 1 16 (108) (1,881) Insurance Selling Expenses (14) - - - (14) Income before Tax and Profit Sharing 10,414 427 (762) (5) 10,075 Income Tax and Social Contribution ( 3,993) (48) 7 62 (73) (3,352) Profit Sharing Management Members - Statutory (77) - - 77 - Minority Interests (138) (107) - - (245) Net Income 6,206 272 - - 6,478 Itaú Unibanco Holding S.A. 07 Executive Summary Management Discussion & Analysis Accounting and Managerial Statements Reconciliation st Accounting and Managerial Financial Statements Reconciliation | 1 quarter of 2019 Non-recurring Tax Effect Managerial Accounting Managerial Events of Hedge Reclassifications In R$ millions Operating Revenues 28,151 - 110 (53) 28,208 Managerial Financial Margin 16,841 - 110 717 17,668 Financial Margin with Clients 15,635 - - 790 16,424 Financial Margin with the Market 1,207 - 1 10 (73) 1,244 Commissions and Fees 9,445 - - (823) 8,622 Revenues from Insurance, Pension Plan and Premium Bonds 1,232 - - 686 1,918 Operations Before Retained Claims and Selling Expenses Other Operating Income 403 - - (403) - Equity in Earnings of Affiliates and Other Investments 241 - - (241) - Non-operating Income (11) - - 11 - Cost of Credit (3,372) - - (432) (3,804) Provision for Loan Losses (4,158) - - (49) (4,206) Impairment - - - (30) (30) Discounts Granted - - - (308) (308) Recovery of Loans Written Off as Losses 785 - - (45) 741 Retained Claims (330) - - 31 (299) Other Operating Expenses (14,588) 309 1 436 (13,842) Non-interest Expenses (12,907) 309 - 448 (12,150) Tax Expenses for ISS, PIS, Cofins and Other Taxes (1,669) - 1 (12) (1,680) Insurance Selling Expenses (12) - - - (12) Income before Tax and Profit Sharing 9,861 309 1 11 (18) 10,263 Income Tax and Social Contribution ( 2,969) (35) (111) (74) (3,188) Profit Sharing Management Members - Statutory (92) - - 92 - Minority Interests (90) (108) - - (198) Net Income 6,710 167 - - 6,877 th Accounting and Managerial Financial Statements Reconciliation | 4 quarter of 2018 Non-recurring Tax Effect Managerial Accounting Managerial Events of Hedge Reclassifications In R$ millions Operating Revenues 28,763 127 (878) 459 28,471 Managerial Financial Margin 16,129 (24) (878) 2,155 17,382 Financial Margin with Clients 14,234 (24) - 2,023 16,233 Financial Margin with the Market 1,895 - (878) 132 1,149 Commissions and Fees 10,040 - - (848) 9,192 Revenues from Insurance, Pension Plan and Premium Bonds 1,077 163 - 658 1,897 Operations Before Retained Claims and Selling Expenses Other Operating Income 932 (11) - (921) - Equity in Earnings of Affiliates and Other Investments 345 - - (345) - Non-operating Income 240 - - (240) - Cost of Credit ( 2,241) - - (1,174) (3,415) Provision for Loan Losses (3,251) - - (544) (3,796) Impairment - - - (269) (269) Discounts Granted - - - (312) (312) Recovery of Loans Written Off as Losses 1,010 - - (49) 961 Retained Claims (294) - - - (294) Other Operating Expenses (15,813) 300 1 16 710 (14,687) Non-interest Expenses (13,943) 333 - 818 (12,793) Tax Expenses for ISS, PIS, Cofins and Other Taxes (1,856) (33) 1 16 (108) (1,881) Insurance Selling Expenses (14) - - - (14) Income before Tax and Profit Sharing 10,414 427 (762) (5) 10,075 Income Tax and Social Contribution ( 3,993) (48) 7 62 (73) (3,352) Profit Sharing Management Members - Statutory (77) - - 77 - Minority Interests (138) (107) - - (245) Net Income 6,206 272 - - 6,478 Itaú Unibanco Holding S.A. 07
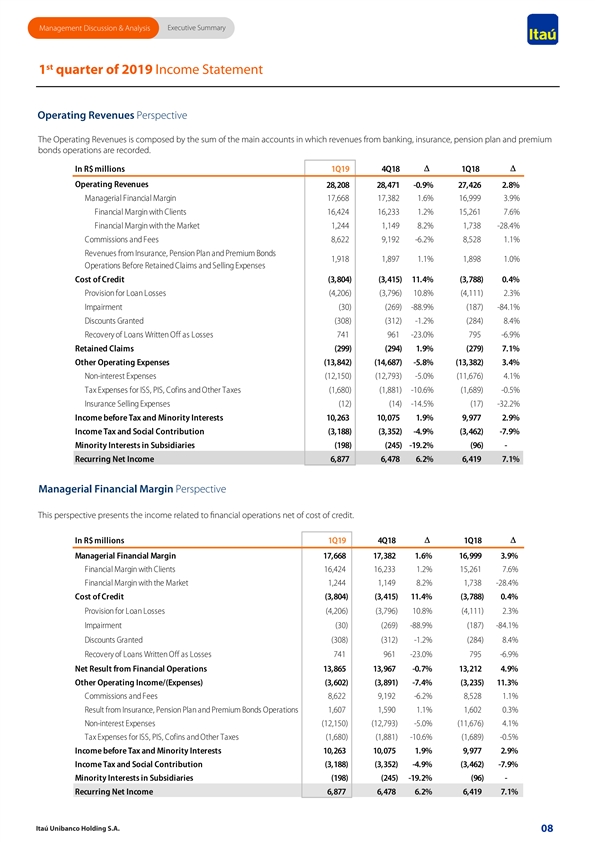
Executive Summary Management Discussion & Analysis st 1 quarter of 2019 Income Statement Operating Revenues Perspective The Operating Revenues is composed by the sum of the main accounts in which revenues from banking, insurance, pension plan and premium bonds operations are recorded. D'D' In R$ millions 1Q19 4Q18 1Q18 Operating Revenues 28,208 28,471 -0.9% 27,426 2.8% Managerial Financial Margin 17,668 17,382 1.6% 16,999 3.9% Financial Margin with Clients 16,424 16,233 1.2% 15,261 7.6% Financial Margin with the Market 1,244 1,149 8.2% 1,738 -28.4% Commissions and Fees 8,622 9,192 -6.2% 8,528 1.1% Revenues from Insurance, Pension Plan and Premium Bonds 1,918 1,897 1.1% 1,898 1.0% Operations Before Retained Claims and Selling Expenses Cost of Credit (3,804) (3,415) 11.4% (3,788) 0.4% Provision for Loan Losses (4,206) (3,796) 10.8% (4,111) 2.3% Impairment (30) (269) -88.9% (187) -84.1% Discounts Granted (308) (312) -1.2% (284) 8.4% Recovery of Loans Written Off as Losses 741 961 -23.0% 795 -6.9% Retained Claims (299) (294) 1.9% (279) 7.1% Other Operating Expenses (13,842) (14,687) -5.8% (13,382) 3.4% Non-interest Expenses (12,150) (12,793) -5.0% (11,676) 4.1% Tax Expenses for ISS, PIS, Cofins and Other Taxes (1,680) (1,881) -10.6% (1,689) -0.5% Insurance Selling Expenses (12) (14) -14.5% (17) -32.2% Income before Tax and Minority Interests 10,263 10,075 1.9% 9,977 2.9% Income Tax and Social Contribution (3,188) (3,352) -4.9% (3,462) -7.9% Minority Interests in Subsidiaries (198) (245) -19.2% (96) - Recurring Net Income 6,877 6,478 6.2% 6,419 7.1% Managerial Financial Margin Perspective This perspective presents the income related to financial operations net of cost of credit. In R$ millions 1Q19 4Q18 1QD' 18 D' Managerial Financial Margin 17,668 17,382 1.6% 16,999 3.9% Financial Margin with Clients 16,424 16,233 1.2% 15,261 7.6% Financial Margin with the Market 1,244 1,149 8.2% 1,738 -28.4% Cost of Credit (3,804) (3,415) 11.4% (3,788) 0.4% Provision for Loan Losses ( 4,206) (3,796) 10.8% (4,111) 2.3% Impairment (30) (269) -88.9% (187) -84.1% Discounts Granted (308) (312) -1.2% (284) 8.4% Recovery of Loans Written Off as Losses 7 41 961 -23.0% 795 -6.9% Net Result from Financial Operations 13,865 13,967 -0.7% 13,212 4.9% Other Operating Income/(Expenses) (3,602) (3,891) -7.4% (3,235) 11.3% Commissions and Fees 8,622 9,192 -6.2% 8,528 1.1% Result from Insurance, Pension Plan and Premium Bonds Operations 1,607 1,590 1.1% 1,602 0.3% Non-interest Expenses (12,150) (12,793) -5.0% (11,676) 4.1% Tax Expenses for ISS, PIS, Cofins and Other Taxes ( 1,680) (1,881) -10.6% (1,689) -0.5% Income before Tax and Minority Interests 10,263 10,075 1.9% 9 ,977 2.9% Income Tax and Social Contribution (3,188) (3,352) -4.9% (3,462) -7.9% Minority Interests in Subsidiaries (198) (245) -19.2% (9 6) - Recurring Net Income 6,877 6,478 6.2% 6 ,419 7.1% Itaú Unibanco Holding S.A. 08 Executive Summary Management Discussion & Analysis st 1 quarter of 2019 Income Statement Operating Revenues Perspective The Operating Revenues is composed by the sum of the main accounts in which revenues from banking, insurance, pension plan and premium bonds operations are recorded. D'D' In R$ millions 1Q19 4Q18 1Q18 Operating Revenues 28,208 28,471 -0.9% 27,426 2.8% Managerial Financial Margin 17,668 17,382 1.6% 16,999 3.9% Financial Margin with Clients 16,424 16,233 1.2% 15,261 7.6% Financial Margin with the Market 1,244 1,149 8.2% 1,738 -28.4% Commissions and Fees 8,622 9,192 -6.2% 8,528 1.1% Revenues from Insurance, Pension Plan and Premium Bonds 1,918 1,897 1.1% 1,898 1.0% Operations Before Retained Claims and Selling Expenses Cost of Credit (3,804) (3,415) 11.4% (3,788) 0.4% Provision for Loan Losses (4,206) (3,796) 10.8% (4,111) 2.3% Impairment (30) (269) -88.9% (187) -84.1% Discounts Granted (308) (312) -1.2% (284) 8.4% Recovery of Loans Written Off as Losses 741 961 -23.0% 795 -6.9% Retained Claims (299) (294) 1.9% (279) 7.1% Other Operating Expenses (13,842) (14,687) -5.8% (13,382) 3.4% Non-interest Expenses (12,150) (12,793) -5.0% (11,676) 4.1% Tax Expenses for ISS, PIS, Cofins and Other Taxes (1,680) (1,881) -10.6% (1,689) -0.5% Insurance Selling Expenses (12) (14) -14.5% (17) -32.2% Income before Tax and Minority Interests 10,263 10,075 1.9% 9,977 2.9% Income Tax and Social Contribution (3,188) (3,352) -4.9% (3,462) -7.9% Minority Interests in Subsidiaries (198) (245) -19.2% (96) - Recurring Net Income 6,877 6,478 6.2% 6,419 7.1% Managerial Financial Margin Perspective This perspective presents the income related to financial operations net of cost of credit. In R$ millions 1Q19 4Q18 1QD' 18 D' Managerial Financial Margin 17,668 17,382 1.6% 16,999 3.9% Financial Margin with Clients 16,424 16,233 1.2% 15,261 7.6% Financial Margin with the Market 1,244 1,149 8.2% 1,738 -28.4% Cost of Credit (3,804) (3,415) 11.4% (3,788) 0.4% Provision for Loan Losses ( 4,206) (3,796) 10.8% (4,111) 2.3% Impairment (30) (269) -88.9% (187) -84.1% Discounts Granted (308) (312) -1.2% (284) 8.4% Recovery of Loans Written Off as Losses 7 41 961 -23.0% 795 -6.9% Net Result from Financial Operations 13,865 13,967 -0.7% 13,212 4.9% Other Operating Income/(Expenses) (3,602) (3,891) -7.4% (3,235) 11.3% Commissions and Fees 8,622 9,192 -6.2% 8,528 1.1% Result from Insurance, Pension Plan and Premium Bonds Operations 1,607 1,590 1.1% 1,602 0.3% Non-interest Expenses (12,150) (12,793) -5.0% (11,676) 4.1% Tax Expenses for ISS, PIS, Cofins and Other Taxes ( 1,680) (1,881) -10.6% (1,689) -0.5% Income before Tax and Minority Interests 10,263 10,075 1.9% 9 ,977 2.9% Income Tax and Social Contribution (3,188) (3,352) -4.9% (3,462) -7.9% Minority Interests in Subsidiaries (198) (245) -19.2% (9 6) - Recurring Net Income 6,877 6,478 6.2% 6 ,419 7.1% Itaú Unibanco Holding S.A. 08
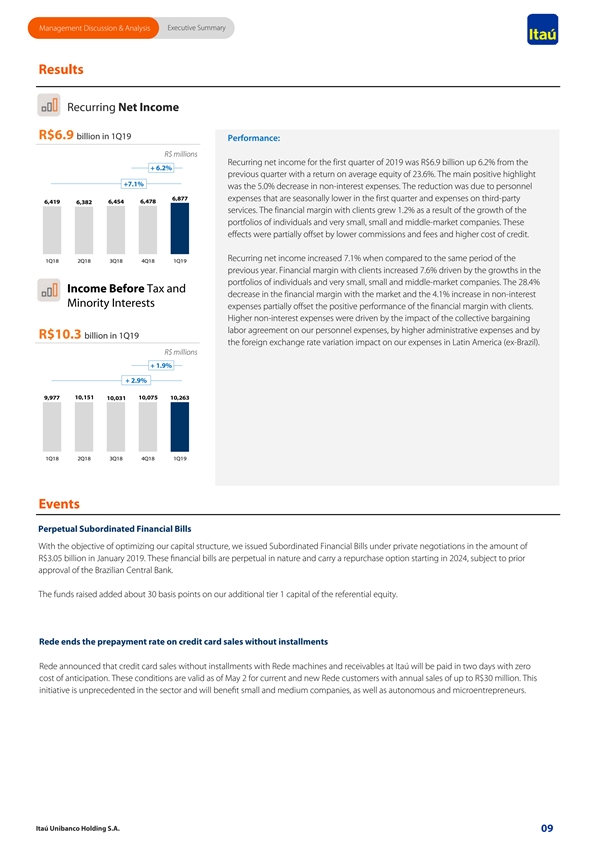
Executive Summary Management Discussion & Analysis Results Recurring Net Income R$6.9 billion in 1Q19 Performance: R$ millions Recurring net income for the first quarter of 2019 was R$6.9 billion up 6.2% from the + 6.2% previous quarter with a return on average equity of 23.6%. The main positive highlight +7.1% was the 5.0% decrease in non-interest expenses. The reduction was due to personnel 6,877 expenses that are seasonally lower in the first quarter and expenses on third-party 6,478 6,419 6,382 6,454 services. The financial margin with clients grew 1.2% as a result of the growth of the portfolios of individuals and very small, small and middle-market companies. These effects were partially offset by lower commissions and fees and higher cost of credit. Recurring net income increased 7.1% when compared to the same period of the 1Q18 2Q18 3Q18 4Q18 1Q19 previous year. Financial margin with clients increased 7.6% driven by the growths in the portfolios of individuals and very small, small and middle-market companies. The 28.4% Income Before Tax and decrease in the financial margin with the market and the 4.1% increase in non-interest Minority Interests expenses partially offset the positive performance of the financial margin with clients. Higher non-interest expenses were driven by the impact of the collective bargaining labor agreement on our personnel expenses, by higher administrative expenses and by R$10.3 billion in 1Q19 the foreign exchange rate variation impact on our expenses in Latin America (ex-Brazil). R$ millions + 1.9% + 2.9% 10,151 9,977 10,031 10,075 10,263 1Q18 2Q18 3Q18 4Q18 1Q19 Events Perpetual Subordinated Financial Bills With the objective of optimizing our capital structure, we issued Subordinated Financial Bills under private negotiations in the amount of R$3.05 billion in January 2019. These financial bills are perpetual in nature and carry a repurchase option starting in 2024, subject to prior approval of the Brazilian Central Bank. The funds raised added about 30 basis points on our additional tier 1 capital of the referential equity. Rede ends the prepayment rate on credit card sales without installments Rede announced that credit card sales without installments with Rede machines and receivables at Itaú will be paid in two days with zero cost of anticipation. These conditions are valid as of May 2 for current and new Rede customers with annual sales of up to R$30 million. This initiative is unprecedented in the sector and will benefit small and medium companies, as well as autonomous and microentrepreneurs. Itaú Unibanco Holding S.A. 09 Executive Summary Management Discussion & Analysis Results Recurring Net Income R$6.9 billion in 1Q19 Performance: R$ millions Recurring net income for the first quarter of 2019 was R$6.9 billion up 6.2% from the + 6.2% previous quarter with a return on average equity of 23.6%. The main positive highlight +7.1% was the 5.0% decrease in non-interest expenses. The reduction was due to personnel 6,877 expenses that are seasonally lower in the first quarter and expenses on third-party 6,478 6,419 6,382 6,454 services. The financial margin with clients grew 1.2% as a result of the growth of the portfolios of individuals and very small, small and middle-market companies. These effects were partially offset by lower commissions and fees and higher cost of credit. Recurring net income increased 7.1% when compared to the same period of the 1Q18 2Q18 3Q18 4Q18 1Q19 previous year. Financial margin with clients increased 7.6% driven by the growths in the portfolios of individuals and very small, small and middle-market companies. The 28.4% Income Before Tax and decrease in the financial margin with the market and the 4.1% increase in non-interest Minority Interests expenses partially offset the positive performance of the financial margin with clients. Higher non-interest expenses were driven by the impact of the collective bargaining labor agreement on our personnel expenses, by higher administrative expenses and by R$10.3 billion in 1Q19 the foreign exchange rate variation impact on our expenses in Latin America (ex-Brazil). R$ millions + 1.9% + 2.9% 10,151 9,977 10,031 10,075 10,263 1Q18 2Q18 3Q18 4Q18 1Q19 Events Perpetual Subordinated Financial Bills With the objective of optimizing our capital structure, we issued Subordinated Financial Bills under private negotiations in the amount of R$3.05 billion in January 2019. These financial bills are perpetual in nature and carry a repurchase option starting in 2024, subject to prior approval of the Brazilian Central Bank. The funds raised added about 30 basis points on our additional tier 1 capital of the referential equity. Rede ends the prepayment rate on credit card sales without installments Rede announced that credit card sales without installments with Rede machines and receivables at Itaú will be paid in two days with zero cost of anticipation. These conditions are valid as of May 2 for current and new Rede customers with annual sales of up to R$30 million. This initiative is unprecedented in the sector and will benefit small and medium companies, as well as autonomous and microentrepreneurs. Itaú Unibanco Holding S.A. 09
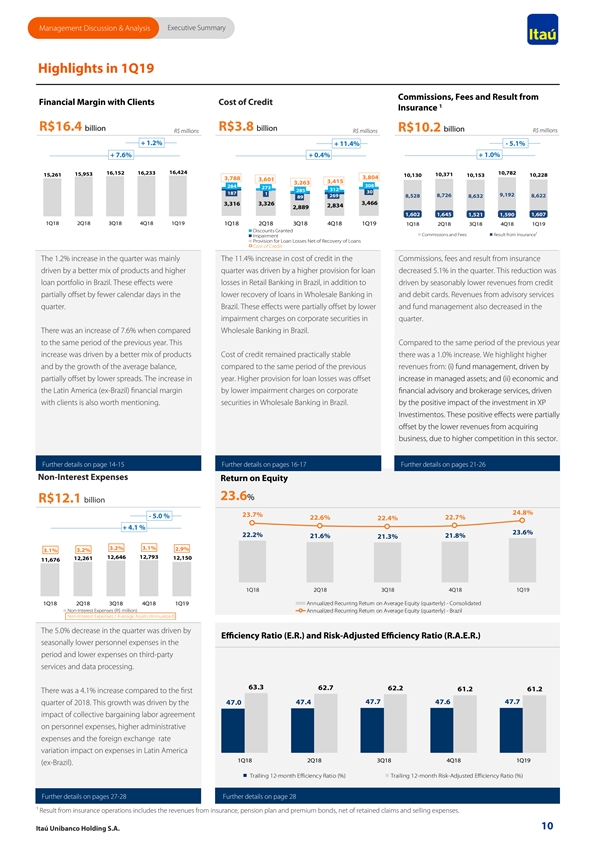
Executive Summary Management Discussion & Analysis Highlights in 1Q19 Commissions, Fees and Result from Financial Margin with Clients Cost of Credit 1 Insurance R$16.4 billion R$3.8 billion R$10.2 billion R$ millions R$ millions R$ millions + 1.2% + 11.4% - 5.1% + 7.6% + 0.4% + 1.0% 16,424 16,152 16,233 10,782 15,953 10,371 15,261 10,130 10,153 10,228 3,804 3,788 3,601 3,415 3,263 308 284 273 312 285 30 187 1 269 8,726 9,192 8,528 8,632 8,622 89 3,466 3,316 3,326 2,834 2,889 1,602 1,645 1,590 1,607 1,521 1Q18 2Q18 3Q18 4Q18 1Q19 1Q18 2Q18 3Q18 4Q18 1Q19 1Q18 2Q18 3Q18 4Q18 1Q19 Discounts Granted Commissions and Fees Result from Insurance¹ Impairment Provision for Loan Losses Net of Recovery of Loans Cost of Credit The 1.2% increase in the quarter was mainly The 11.4% increase in cost of credit in the Commissions, fees and result from insurance driven by a better mix of products and higher quarter was driven by a higher provision for loan decreased 5.1% in the quarter. This reduction was loan portfolio in Brazil. These effects were losses in Retail Banking in Brazil, in addition to driven by seasonably lower revenues from credit partially offset by fewer calendar days in the lower recovery of loans in Wholesale Banking in and debit cards. Revenues from advisory services quarter. Brazil. These effects were partially offset by lower and fund management also decreased in the impairment charges on corporate securities in quarter. There was an increase of 7.6% when compared Wholesale Banking in Brazil. to the same period of the previous year. This Compared to the same period of the previous year increase was driven by a better mix of products Cost of credit remained practically stable there was a 1.0% increase. We highlight higher and by the growth of the average balance, compared to the same period of the previous revenues from: (i) fund management, driven by partially offset by lower spreads. The increase in year. Higher provision for loan losses was offset increase in managed assets; and (ii) economic and the Latin America (ex-Brazil) financial margin by lower impairment charges on corporate financial advisory and brokerage services, driven with clients is also worth mentioning. securities in Wholesale Banking in Brazil. by the positive impact of the investment in XP Investimentos. These positive effects were partially offset by the lower revenues from acquiring business, due to higher competition in this sector. Further details on page 14-15 Further details on pages 16-17 Further details on pages 21-26 Non-Interest Expenses Return on Equity 23.6% R$12.1 billion 24.8% 23.7% - 5.0 % 22.6% 22.4% 22.7% + 4.1 % 23.6% 22.2% 21.6% 21.8% 21.3% 3.2% 3.1% 2.9% 3.1% 3.2% 12,646 12,793 12,261 12,150 11,676 1Q18 2Q18 3Q18 4Q18 1Q19 1Q18 2Q18 3Q18 4Q18 1Q19 Annualized Recurring Return on Average Equity (quarterly) - Consolidated Non-Interest Expenses (R$ million) Annualized Recurring Return on Average Equity (quarterly) - Brazil Non-Interest Expenses / Average Assets (Annualized) The 5.0% decrease in the quarter was driven by Efficiency Ratio (E.R.) and Risk-Adjusted Efficiency Ratio (R.A.E.R.) seasonally lower personnel expenses in the period and lower expenses on third-party services and data processing. 63.3 62.7 62.2 61.2 61.2 There was a 4.1% increase compared to the first 47.4 47.7 47.6 47.7 quarter of 2018. This growth was driven by the 47.0 impact of collective bargaining labor agreement on personnel expenses, higher administrative expenses and the foreign exchange rate variation impact on expenses in Latin America 1Q18 2Q18 3Q18 4Q18 1Q19 (ex-Brazil). Trailing 12-month Efficiency Ratio (%) Trailing 12-month Risk-Adjusted Efficiency Ratio (%) Further details on pages 27-28 Further details on page 28 ¹ Result from insurance operations includes the revenues from insurance, pension plan and premium bonds, net of retained claims and selling expenses. 10 Itaú Unibanco Holding S.A. Executive Summary Management Discussion & Analysis Highlights in 1Q19 Commissions, Fees and Result from Financial Margin with Clients Cost of Credit 1 Insurance R$16.4 billion R$3.8 billion R$10.2 billion R$ millions R$ millions R$ millions + 1.2% + 11.4% - 5.1% + 7.6% + 0.4% + 1.0% 16,424 16,152 16,233 10,782 15,953 10,371 15,261 10,130 10,153 10,228 3,804 3,788 3,601 3,415 3,263 308 284 273 312 285 30 187 1 269 8,726 9,192 8,528 8,632 8,622 89 3,466 3,316 3,326 2,834 2,889 1,602 1,645 1,590 1,607 1,521 1Q18 2Q18 3Q18 4Q18 1Q19 1Q18 2Q18 3Q18 4Q18 1Q19 1Q18 2Q18 3Q18 4Q18 1Q19 Discounts Granted Commissions and Fees Result from Insurance¹ Impairment Provision for Loan Losses Net of Recovery of Loans Cost of Credit The 1.2% increase in the quarter was mainly The 11.4% increase in cost of credit in the Commissions, fees and result from insurance driven by a better mix of products and higher quarter was driven by a higher provision for loan decreased 5.1% in the quarter. This reduction was loan portfolio in Brazil. These effects were losses in Retail Banking in Brazil, in addition to driven by seasonably lower revenues from credit partially offset by fewer calendar days in the lower recovery of loans in Wholesale Banking in and debit cards. Revenues from advisory services quarter. Brazil. These effects were partially offset by lower and fund management also decreased in the impairment charges on corporate securities in quarter. There was an increase of 7.6% when compared Wholesale Banking in Brazil. to the same period of the previous year. This Compared to the same period of the previous year increase was driven by a better mix of products Cost of credit remained practically stable there was a 1.0% increase. We highlight higher and by the growth of the average balance, compared to the same period of the previous revenues from: (i) fund management, driven by partially offset by lower spreads. The increase in year. Higher provision for loan losses was offset increase in managed assets; and (ii) economic and the Latin America (ex-Brazil) financial margin by lower impairment charges on corporate financial advisory and brokerage services, driven with clients is also worth mentioning. securities in Wholesale Banking in Brazil. by the positive impact of the investment in XP Investimentos. These positive effects were partially offset by the lower revenues from acquiring business, due to higher competition in this sector. Further details on page 14-15 Further details on pages 16-17 Further details on pages 21-26 Non-Interest Expenses Return on Equity 23.6% R$12.1 billion 24.8% 23.7% - 5.0 % 22.6% 22.4% 22.7% + 4.1 % 23.6% 22.2% 21.6% 21.8% 21.3% 3.2% 3.1% 2.9% 3.1% 3.2% 12,646 12,793 12,261 12,150 11,676 1Q18 2Q18 3Q18 4Q18 1Q19 1Q18 2Q18 3Q18 4Q18 1Q19 Annualized Recurring Return on Average Equity (quarterly) - Consolidated Non-Interest Expenses (R$ million) Annualized Recurring Return on Average Equity (quarterly) - Brazil Non-Interest Expenses / Average Assets (Annualized) The 5.0% decrease in the quarter was driven by Efficiency Ratio (E.R.) and Risk-Adjusted Efficiency Ratio (R.A.E.R.) seasonally lower personnel expenses in the period and lower expenses on third-party services and data processing. 63.3 62.7 62.2 61.2 61.2 There was a 4.1% increase compared to the first 47.4 47.7 47.6 47.7 quarter of 2018. This growth was driven by the 47.0 impact of collective bargaining labor agreement on personnel expenses, higher administrative expenses and the foreign exchange rate variation impact on expenses in Latin America 1Q18 2Q18 3Q18 4Q18 1Q19 (ex-Brazil). Trailing 12-month Efficiency Ratio (%) Trailing 12-month Risk-Adjusted Efficiency Ratio (%) Further details on pages 27-28 Further details on page 28 ¹ Result from insurance operations includes the revenues from insurance, pension plan and premium bonds, net of retained claims and selling expenses. 10 Itaú Unibanco Holding S.A.
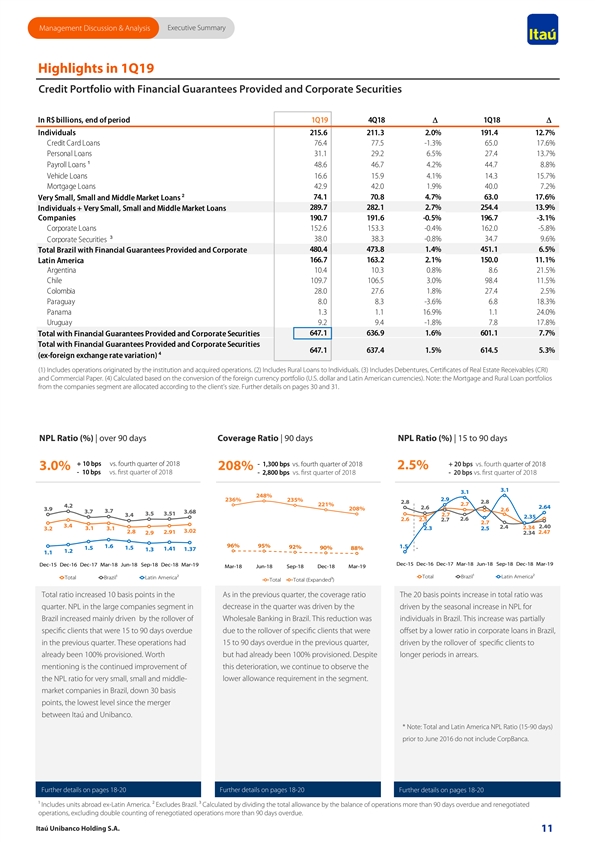
Executive Summary Management Discussion & Analysis Highlights in 1Q19 Credit Portfolio with Financial Guarantees Provided and Corporate Securities In R$ billions, end of period 1Q19 4Q18 D' 1Q18D' Individuals 215.6 2 11.3 2.0% 191.4 12.7% Credit Card Loans 76.4 77.5 -1.3% 65.0 17.6% Personal Loans 31.1 29.2 6.5% 27.4 13.7% 1 Payroll Loans 48.6 46.7 4.2% 44.7 8.8% Vehicle Loans 16.6 15.9 4.1% 14.3 15.7% Mortgage Loans 42.9 42.0 1.9% 40.0 7.2% 2 Very Small, Small and Middle Market Loans 74.1 70.8 4.7% 63.0 17.6% 289.7 282.1 2.7% 254.4 13.9% Individuals + Very Small, Small and Middle Market Loans Companies 190.7 191.6 -0.5% 196.7 -3.1% Corporate Loans 1 52.6 153.3 -0.4% 162.0 -5.8% 3 38.0 38.3 -0.8% 34.7 9.6% Corporate Securities 480.4 473.8 1.4% 451.1 6.5% Total Brazil with Financial Guarantees Provided and Corporate 166.7 163.2 2.1% 150.0 11.1% Latin America Argentina 10.4 10.3 0.8% 8.6 21.5% Chile 109.7 106.5 3.0% 98.4 11.5% Colombia 28.0 27.6 1.8% 27.4 2.5% Paraguay 8.0 8.3 -3.6% 6.8 18.3% Panama 1.3 1.1 16.9% 1.1 24.0% Uruguay 9.2 9.4 -1.8% 7.8 17.8% Total with Financial Guarantees Provided and Corporate Securities 647.1 6 36.9 1.6% 601.1 7.7% Total with Financial Guarantees Provided and Corporate Securities 647.1 6 37.4 1.5% 614.5 5.3% 4 (ex-foreign exchange rate variation) (1) Includes operations originated by the institution and acquired operations. (2) Includes Rural Loans to Individuals. (3) Includes Debentures, Certificates of Real Estate Receivables (CRI) and Commercial Paper. (4) Calculated based on the conversion of the foreign currency portfolio (U.S. dollar and Latin American currencies). Note: the Mortgage and Rural Loan portfolios from the companies segment are allocated according to the client’s size. Further details on pages 30 and 31. NPL Ratio (%) | over 90 days Coverage Ratio | 90 days NPL Ratio (%) | 15 to 90 days + 10 bps vs. fourth quarter of 2018 - 1,300 bps vs. fourth quarter of 2018 + 20 bps vs. fourth quarter of 2018 2.5% 3.0% 208% - 10 bps vs. first quarter of 2018 - 2,800 bps vs. first quarter of 2018 - 20 bps vs. first quarter of 2018 3.1 3.1 248% 2.9 236% 235% 2.8 2.8 221% 2.7 4.2 2.6 2.64 3.9 208% 2.6 3.7 3.7 3.68 3.5 3.51 2.7 3.4 2.35 2.6 2.5 2.6 2.7 2.7 3.4 2.40 2.4 2.34 3.1 3.1 2.3 2.5 3.2 3.02 2.8 2.91 2.47 2.9 2.34 1.6 96% 95% 1.5 92% 1.5 1.5 90% 88% * 1.3 1.41 1.37 1.2 1.1 Dec-15 Dec-16 Dec-17 Mar-18 Jun-18 Sep-18 Dec-18 Mar-19 Dec-15 Dec-16 Dec-17 Mar-18 Jun-18 Sep-18 Dec-18 Mar-19 Mar-18 Jun-18 Sep-18 Dec-18 Mar-19 Total Brazil¹ Latin America² Total Brazil¹ Latin America² Total Total (Expanded³) Total ratio increased 10 basis points in the As in the previous quarter, the coverage ratio The 20 basis points increase in total ratio was quarter. NPL in the large companies segment in decrease in the quarter was driven by the driven by the seasonal increase in NPL for Brazil increased mainly driven by the rollover of Wholesale Banking in Brazil. This reduction was individuals in Brazil. This increase was partially specific clients that were 15 to 90 days overdue due to the rollover of specific clients that were offset by a lower ratio in corporate loans in Brazil, in the previous quarter. These operations had 15 to 90 days overdue in the previous quarter, driven by the rollover of specific clients to already been 100% provisioned. Worth but had already been 100% provisioned. Despite longer periods in arrears. mentioning is the continued improvement of this deterioration, we continue to observe the the NPL ratio for very small, small and middle- lower allowance requirement in the segment. market companies in Brazil, down 30 basis points, the lowest level since the merger between Itaú and Unibanco. * Note: Total and Latin America NPL Ratio (15-90 days) prior to June 2016 do not include CorpBanca. Further details on pages 18-20 Further details on pages 18-20 Further details on pages 18-20 ¹ Includes units abroad ex-Latin America. ² Excludes Brazil. ³ Calculated by dividing the total allowance by the balance of operations more than 90 days overdue and renegotiated operations, excluding double counting of renegotiated operations more than 90 days overdue. Itaú Unibanco Holding S.A. 11 Executive Summary Management Discussion & Analysis Highlights in 1Q19 Credit Portfolio with Financial Guarantees Provided and Corporate Securities In R$ billions, end of period 1Q19 4Q18 D' 1Q18D' Individuals 215.6 2 11.3 2.0% 191.4 12.7% Credit Card Loans 76.4 77.5 -1.3% 65.0 17.6% Personal Loans 31.1 29.2 6.5% 27.4 13.7% 1 Payroll Loans 48.6 46.7 4.2% 44.7 8.8% Vehicle Loans 16.6 15.9 4.1% 14.3 15.7% Mortgage Loans 42.9 42.0 1.9% 40.0 7.2% 2 Very Small, Small and Middle Market Loans 74.1 70.8 4.7% 63.0 17.6% 289.7 282.1 2.7% 254.4 13.9% Individuals + Very Small, Small and Middle Market Loans Companies 190.7 191.6 -0.5% 196.7 -3.1% Corporate Loans 1 52.6 153.3 -0.4% 162.0 -5.8% 3 38.0 38.3 -0.8% 34.7 9.6% Corporate Securities 480.4 473.8 1.4% 451.1 6.5% Total Brazil with Financial Guarantees Provided and Corporate 166.7 163.2 2.1% 150.0 11.1% Latin America Argentina 10.4 10.3 0.8% 8.6 21.5% Chile 109.7 106.5 3.0% 98.4 11.5% Colombia 28.0 27.6 1.8% 27.4 2.5% Paraguay 8.0 8.3 -3.6% 6.8 18.3% Panama 1.3 1.1 16.9% 1.1 24.0% Uruguay 9.2 9.4 -1.8% 7.8 17.8% Total with Financial Guarantees Provided and Corporate Securities 647.1 6 36.9 1.6% 601.1 7.7% Total with Financial Guarantees Provided and Corporate Securities 647.1 6 37.4 1.5% 614.5 5.3% 4 (ex-foreign exchange rate variation) (1) Includes operations originated by the institution and acquired operations. (2) Includes Rural Loans to Individuals. (3) Includes Debentures, Certificates of Real Estate Receivables (CRI) and Commercial Paper. (4) Calculated based on the conversion of the foreign currency portfolio (U.S. dollar and Latin American currencies). Note: the Mortgage and Rural Loan portfolios from the companies segment are allocated according to the client’s size. Further details on pages 30 and 31. NPL Ratio (%) | over 90 days Coverage Ratio | 90 days NPL Ratio (%) | 15 to 90 days + 10 bps vs. fourth quarter of 2018 - 1,300 bps vs. fourth quarter of 2018 + 20 bps vs. fourth quarter of 2018 2.5% 3.0% 208% - 10 bps vs. first quarter of 2018 - 2,800 bps vs. first quarter of 2018 - 20 bps vs. first quarter of 2018 3.1 3.1 248% 2.9 236% 235% 2.8 2.8 221% 2.7 4.2 2.6 2.64 3.9 208% 2.6 3.7 3.7 3.68 3.5 3.51 2.7 3.4 2.35 2.6 2.5 2.6 2.7 2.7 3.4 2.40 2.4 2.34 3.1 3.1 2.3 2.5 3.2 3.02 2.8 2.91 2.47 2.9 2.34 1.6 96% 95% 1.5 92% 1.5 1.5 90% 88% * 1.3 1.41 1.37 1.2 1.1 Dec-15 Dec-16 Dec-17 Mar-18 Jun-18 Sep-18 Dec-18 Mar-19 Dec-15 Dec-16 Dec-17 Mar-18 Jun-18 Sep-18 Dec-18 Mar-19 Mar-18 Jun-18 Sep-18 Dec-18 Mar-19 Total Brazil¹ Latin America² Total Brazil¹ Latin America² Total Total (Expanded³) Total ratio increased 10 basis points in the As in the previous quarter, the coverage ratio The 20 basis points increase in total ratio was quarter. NPL in the large companies segment in decrease in the quarter was driven by the driven by the seasonal increase in NPL for Brazil increased mainly driven by the rollover of Wholesale Banking in Brazil. This reduction was individuals in Brazil. This increase was partially specific clients that were 15 to 90 days overdue due to the rollover of specific clients that were offset by a lower ratio in corporate loans in Brazil, in the previous quarter. These operations had 15 to 90 days overdue in the previous quarter, driven by the rollover of specific clients to already been 100% provisioned. Worth but had already been 100% provisioned. Despite longer periods in arrears. mentioning is the continued improvement of this deterioration, we continue to observe the the NPL ratio for very small, small and middle- lower allowance requirement in the segment. market companies in Brazil, down 30 basis points, the lowest level since the merger between Itaú and Unibanco. * Note: Total and Latin America NPL Ratio (15-90 days) prior to June 2016 do not include CorpBanca. Further details on pages 18-20 Further details on pages 18-20 Further details on pages 18-20 ¹ Includes units abroad ex-Latin America. ² Excludes Brazil. ³ Calculated by dividing the total allowance by the balance of operations more than 90 days overdue and renegotiated operations, excluding double counting of renegotiated operations more than 90 days overdue. Itaú Unibanco Holding S.A. 11
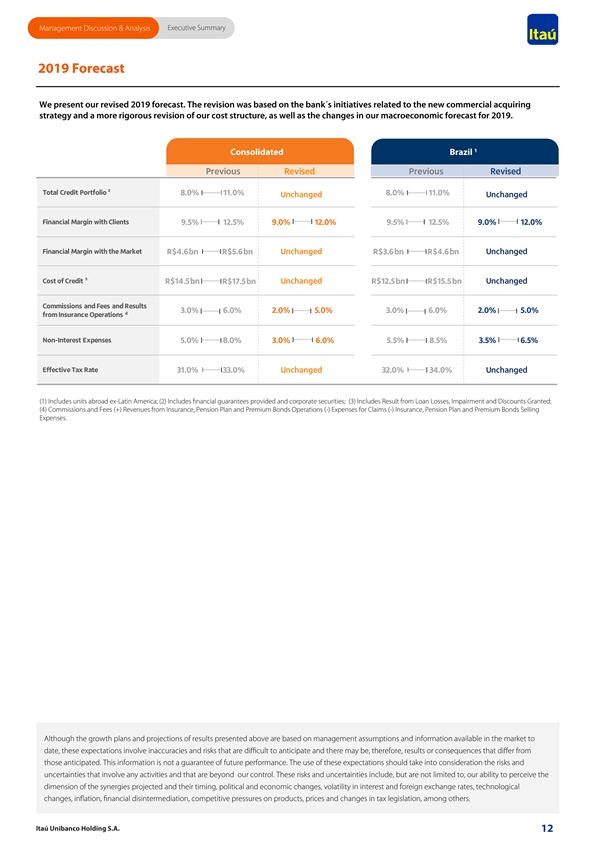
Executive Summary Management Discussion & Analysis 2019 Forecast We present our revised 2019 forecast. The revision was based on the bank´s initiatives related to the new commercial acquiring strategy and a more rigorous revision of our cost structure, as well as the changes in our macroeconomic forecast for 2019. 1 Consolidated Brazil Previous Revised Previous Revised Total Credit Portfolio ² 8.0% 11.0% 8.0% 11.0% Unchanged Unchanged Financial Margin with Clients 9.5% 12.5% 9.0% 12.0% 9.5% 12.5% 9.0% 12.0% Financial Margin with the Market R$4.6 bn R$5.6 bn Unchanged R$3.6 bn R$4.6 bn Unchanged Cost of Credit ³ R$14.5 bn R$17.5 bn Unchanged R$12.5 bn R$15.5 bn Unchanged Commissions and Fees and Results 3.0% 6.0% 2.0% 5.0% 3.0% 6.0% 2.0% 5.0% 4 from Insurance Operations Non-Interest Expenses 5.0% 8.0% 3.0% 6.0% 5.5% 8.5% 3.5% 6.5% Effective Tax Rate 31.0% 33.0% Unchanged 32.0% 34.0% Unchanged (1) Includes units abroad ex-Latin America; (2) Includes financial guarantees provided and corporate securities; (3) Includes Result from Loan Losses, Impairment and Discounts Granted; (4) Commissions and Fees (+) Revenues from Insurance, Pension Plan and Premium Bonds Operations (-) Expenses for Claims (-) Insurance, Pension Plan and Premium Bonds Selling Expenses. Although the growth plans and projections of results presented above are based on management assumptions and information available in the market to date, these expectations involve inaccuracies and risks that are difficult to anticipate and there may be, therefore, results or consequences that differ from those anticipated. This information is not a guarantee of future performance. The use of these expectations should take into consideration the risks and uncertainties that involve any activities and that are beyond our control. These risks and uncertainties include, but are not limited to, our ability to perceive the dimension of the synergies projected and their timing, political and economic changes, volatility in interest and foreign exchange rates, technological changes, inflation, financial disintermediation, competitive pressures on products, prices and changes in tax legislation, among others. Itaú Unibanco Holding S.A. 12 Executive Summary Management Discussion & Analysis 2019 Forecast We present our revised 2019 forecast. The revision was based on the bank´s initiatives related to the new commercial acquiring strategy and a more rigorous revision of our cost structure, as well as the changes in our macroeconomic forecast for 2019. 1 Consolidated Brazil Previous Revised Previous Revised Total Credit Portfolio ² 8.0% 11.0% 8.0% 11.0% Unchanged Unchanged Financial Margin with Clients 9.5% 12.5% 9.0% 12.0% 9.5% 12.5% 9.0% 12.0% Financial Margin with the Market R$4.6 bn R$5.6 bn Unchanged R$3.6 bn R$4.6 bn Unchanged Cost of Credit ³ R$14.5 bn R$17.5 bn Unchanged R$12.5 bn R$15.5 bn Unchanged Commissions and Fees and Results 3.0% 6.0% 2.0% 5.0% 3.0% 6.0% 2.0% 5.0% 4 from Insurance Operations Non-Interest Expenses 5.0% 8.0% 3.0% 6.0% 5.5% 8.5% 3.5% 6.5% Effective Tax Rate 31.0% 33.0% Unchanged 32.0% 34.0% Unchanged (1) Includes units abroad ex-Latin America; (2) Includes financial guarantees provided and corporate securities; (3) Includes Result from Loan Losses, Impairment and Discounts Granted; (4) Commissions and Fees (+) Revenues from Insurance, Pension Plan and Premium Bonds Operations (-) Expenses for Claims (-) Insurance, Pension Plan and Premium Bonds Selling Expenses. Although the growth plans and projections of results presented above are based on management assumptions and information available in the market to date, these expectations involve inaccuracies and risks that are difficult to anticipate and there may be, therefore, results or consequences that differ from those anticipated. This information is not a guarantee of future performance. The use of these expectations should take into consideration the risks and uncertainties that involve any activities and that are beyond our control. These risks and uncertainties include, but are not limited to, our ability to perceive the dimension of the synergies projected and their timing, political and economic changes, volatility in interest and foreign exchange rates, technological changes, inflation, financial disintermediation, competitive pressures on products, prices and changes in tax legislation, among others. Itaú Unibanco Holding S.A. 12
Income Statement and Balance Sheet Analysis Management Discussion & Analysis and Complete Financial Statements Income Statement and Balance Sheet Analysis Management Discussion & Analysis and Complete Financial Statements
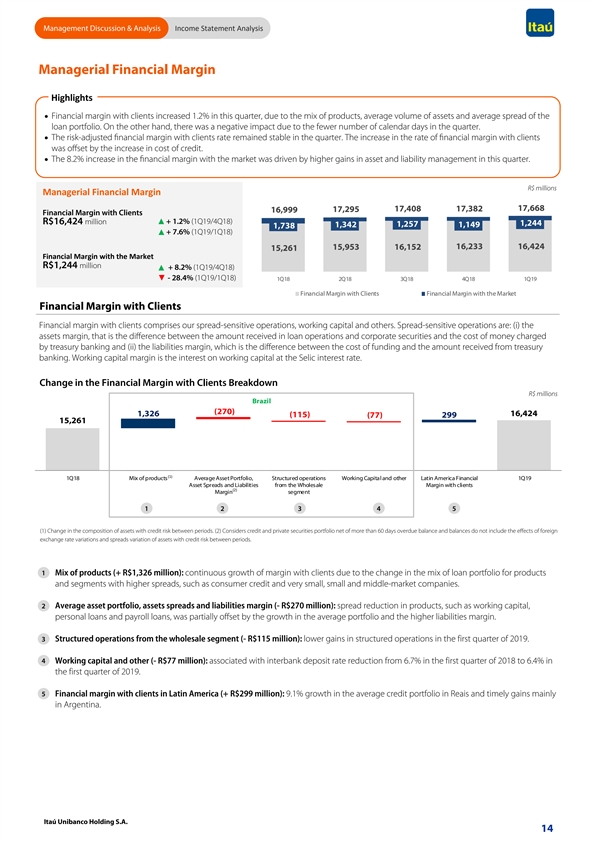
Management Discussion & Anal ysis Income Statement Analysis Managerial Financial Margin Highlights · Financial margin with clients increased 1.2% in this quarter, due to the mix of products, average volume of assets and average spread of the loan portfolio. On the other hand, there was a negative impact due to the fewer number of calendar days in the quarter. · The risk-adjusted financial margin with clients rate remained stable in the quarter. The increase in the rate of financial margin with clients was offset by the increase in cost of credit. · The 8.2% increase in the financial margin with the market was driven by higher gains in asset and liability management in this quarter. R$ millions Managerial Financial Margin 17,668 17,295 17,408 17,382 16,999 Financial Margin with Clients R$16,424 million + 1.2% (1Q19/4Q18) 1,244 1,342 1,257 1,149 1,738 + 7.6% (1Q19/1Q18) 16,233 16,424 15,953 16,152 15,261 Financial Margin with the Market R$1,244 million + 8.2% (1Q19/4Q18) - 28.4% (1Q19/1Q18) 1Q18 2Q18 3Q18 4Q18 1Q19 Financial Margin with Clients Financial Margin with the Market Financial Margin with Clients Financial margin with clients comprises our spread-sensitive operations, working capital and others. Spread-sensitive operations are: (i) the assets margin, that is the difference between the amount received in loan operations and corporate securities and the cost of money charged by treasury banking and (ii) the liabilities margin, which is the difference between the cost of funding and the amount received from treasury banking. Working capital margin is the interest on working capital at the Selic interest rate. Change in the Financial Margin with Clients Breakdown R$ millions Brazil (270) 1,326 16,424 (115) (77) 299 15,261 (1) 1Q18 Mix of products Average Asset Portfolio, Structured operations Working Capital and other Latin America Financial 1Q19 Asset Spreads and Liabilities from the Wholesale Margin with clients (2) Margin segment 1 2 3 4 5 (1) Change in the composition of assets with credit risk between periods. (2) Considers credit and private securities portfolio net of more than 60 days overdue balance and balances do not include the effects of foreign exchange rate variations and spreads variation of assets with credit risk between periods. 1 Mix of products (+ R$1,326 million): continuous growth of margin with clients due to the change in the mix of loan portfolio for products and segments with higher spreads, such as consumer credit and very small, small and middle-market companies. 2 Average asset portfolio, assets spreads and liabilities margin (- R$270 million): spread reduction in products, such as working capital, personal loans and payroll loans, was partially offset by the growth in the average portfolio and the higher liabilities margin. 3 Structured operations from the wholesale segment (- R$115 million): lower gains in structured operations in the first quarter of 2019. 4 Working capital and other (- R$77 million): associated with interbank deposit rate reduction from 6.7% in the first quarter of 2018 to 6.4% in the first quarter of 2019. 5 Financial margin with clients in Latin America (+ R$299 million): 9.1% growth in the average credit portfolio in Reais and timely gains mainly in Argentina. Itaú Unibanco Holding S.A. 14 Management Discussion & Anal ysis Income Statement Analysis Managerial Financial Margin Highlights · Financial margin with clients increased 1.2% in this quarter, due to the mix of products, average volume of assets and average spread of the loan portfolio. On the other hand, there was a negative impact due to the fewer number of calendar days in the quarter. · The risk-adjusted financial margin with clients rate remained stable in the quarter. The increase in the rate of financial margin with clients was offset by the increase in cost of credit. · The 8.2% increase in the financial margin with the market was driven by higher gains in asset and liability management in this quarter. R$ millions Managerial Financial Margin 17,668 17,295 17,408 17,382 16,999 Financial Margin with Clients R$16,424 million + 1.2% (1Q19/4Q18) 1,244 1,342 1,257 1,149 1,738 + 7.6% (1Q19/1Q18) 16,233 16,424 15,953 16,152 15,261 Financial Margin with the Market R$1,244 million + 8.2% (1Q19/4Q18) - 28.4% (1Q19/1Q18) 1Q18 2Q18 3Q18 4Q18 1Q19 Financial Margin with Clients Financial Margin with the Market Financial Margin with Clients Financial margin with clients comprises our spread-sensitive operations, working capital and others. Spread-sensitive operations are: (i) the assets margin, that is the difference between the amount received in loan operations and corporate securities and the cost of money charged by treasury banking and (ii) the liabilities margin, which is the difference between the cost of funding and the amount received from treasury banking. Working capital margin is the interest on working capital at the Selic interest rate. Change in the Financial Margin with Clients Breakdown R$ millions Brazil (270) 1,326 16,424 (115) (77) 299 15,261 (1) 1Q18 Mix of products Average Asset Portfolio, Structured operations Working Capital and other Latin America Financial 1Q19 Asset Spreads and Liabilities from the Wholesale Margin with clients (2) Margin segment 1 2 3 4 5 (1) Change in the composition of assets with credit risk between periods. (2) Considers credit and private securities portfolio net of more than 60 days overdue balance and balances do not include the effects of foreign exchange rate variations and spreads variation of assets with credit risk between periods. 1 Mix of products (+ R$1,326 million): continuous growth of margin with clients due to the change in the mix of loan portfolio for products and segments with higher spreads, such as consumer credit and very small, small and middle-market companies. 2 Average asset portfolio, assets spreads and liabilities margin (- R$270 million): spread reduction in products, such as working capital, personal loans and payroll loans, was partially offset by the growth in the average portfolio and the higher liabilities margin. 3 Structured operations from the wholesale segment (- R$115 million): lower gains in structured operations in the first quarter of 2019. 4 Working capital and other (- R$77 million): associated with interbank deposit rate reduction from 6.7% in the first quarter of 2018 to 6.4% in the first quarter of 2019. 5 Financial margin with clients in Latin America (+ R$299 million): 9.1% growth in the average credit portfolio in Reais and timely gains mainly in Argentina. Itaú Unibanco Holding S.A. 14
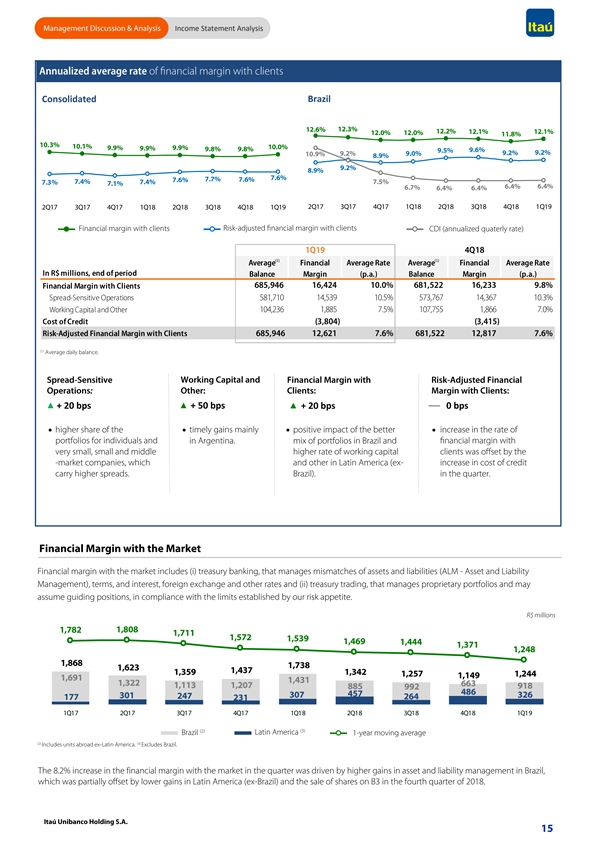
Management Discussion & Anal ysis Income Statement Analysis Annualized average rate of financial margin with clients Consolidated Brazil 12.3% 12.6% 12.2% 12.1% 12.1% 12.0% 12.0% 11.8% 10.3% 10.1% 10.0% 9.9% 9.9% 9.9% 9.8% 9.8% 9.6% 9.5% 9.2% 9.2% 10.9% 9.2% 9.0% 8.9% 9.2% 8.9% 7.6% 7.6% 7.7% 7.6% 7.4% 7.4% 7.5% 7.3% 7.1% 6.4% 6.4% 6.7% 6.4% 6.4% 2Q17 3Q17 4Q17 1Q18 2Q18 3Q18 4Q18 1Q19 2Q17 3Q17 4Q17 1Q18 2Q18 3Q18 4Q18 1Q19 Financial margin with clients Risk-adjusted financial margin with clients CDI (annualized quaterly rate) 1Q19 4Q18 (1) (1) Average Financial Average Rate Average Financial Average Rate In R$ millions, end of period Balance Margin (p.a.) Balance Margin (p.a.) 685,946 16,424 10.0% 681,522 16,233 9.8% Financial Margin with Clients Spread-Sensitive Operations 581,710 14,539 10.5% 573,767 14,367 10.3% Working Capital and Other 104,236 1,885 7.5% 107,755 1,866 7.0% Cost of Credit (3,804) (3,415) Risk-Adjusted Financial Margin with Clients 685,946 12,621 7.6% 681,522 12,817 7.6% (1) Average daily balance. Spread-Sensitive Working Capital and Financial Margin with Risk-Adjusted Financial Operations: Other: Clients: Margin with Clients: + 20 bps + 50 bps + 20 bps 0 bps · higher share of the · positive impact of the better · increase in the rate of · timely gains mainly portfolios for individuals and financial margin with in Argentina. mix of portfolios in Brazil and very small, small and middle higher rate of working capital clients was offset by the -market companies, which and other in Latin America (ex- increase in cost of credit carry higher spreads. in the quarter. Brazil). Financial Margin with the Market Financial margin with the market includes (i) treasury banking, that manages mismatches of assets and liabilities (ALM - Asset and Liability Management), terms, and interest, foreign exchange and other rates and (ii) treasury trading, that manages proprietary portfolios and may assume guiding positions, in compliance with the limits established by our risk appetite. 5,000 2,500 R$ millions 4,500 1,808 1,782 4,000 2,000 1,711 1,572 1,539 3,500 1,469 1,444 1,371 3,000 1,248 1,500 2,500 1,868 1,738 2,000 1,000 1,623 1,437 1,359 1,342 1,257 1,244 1,500 1,149 1,691 1,431 1,322 663 1,000 500 1,113 1,207 885 918 992 486 500 457 301 307 326 247 264 177 231 - - 1Q17 2Q17 3Q17 4Q17 1Q18 2Q18 3Q18 4Q18 1Q19 (3) (2) Brazil Latin America 1-year moving average (2) (3) Includes units abroad ex-Latin America. Excludes Brazil. The 8.2% increase in the financial margin with the market in the quarter was driven by higher gains in asset and liability management in Brazil, which was partially offset by lower gains in Latin America (ex-Brazil) and the sale of shares on B3 in the fourth quarter of 2018. Itaú Unibanco Holding S.A. 15 Management Discussion & Anal ysis Income Statement Analysis Annualized average rate of financial margin with clients Consolidated Brazil 12.3% 12.6% 12.2% 12.1% 12.1% 12.0% 12.0% 11.8% 10.3% 10.1% 10.0% 9.9% 9.9% 9.9% 9.8% 9.8% 9.6% 9.5% 9.2% 9.2% 10.9% 9.2% 9.0% 8.9% 9.2% 8.9% 7.6% 7.6% 7.7% 7.6% 7.4% 7.4% 7.5% 7.3% 7.1% 6.4% 6.4% 6.7% 6.4% 6.4% 2Q17 3Q17 4Q17 1Q18 2Q18 3Q18 4Q18 1Q19 2Q17 3Q17 4Q17 1Q18 2Q18 3Q18 4Q18 1Q19 Financial margin with clients Risk-adjusted financial margin with clients CDI (annualized quaterly rate) 1Q19 4Q18 (1) (1) Average Financial Average Rate Average Financial Average Rate In R$ millions, end of period Balance Margin (p.a.) Balance Margin (p.a.) 685,946 16,424 10.0% 681,522 16,233 9.8% Financial Margin with Clients Spread-Sensitive Operations 581,710 14,539 10.5% 573,767 14,367 10.3% Working Capital and Other 104,236 1,885 7.5% 107,755 1,866 7.0% Cost of Credit (3,804) (3,415) Risk-Adjusted Financial Margin with Clients 685,946 12,621 7.6% 681,522 12,817 7.6% (1) Average daily balance. Spread-Sensitive Working Capital and Financial Margin with Risk-Adjusted Financial Operations: Other: Clients: Margin with Clients: + 20 bps + 50 bps + 20 bps 0 bps · higher share of the · positive impact of the better · increase in the rate of · timely gains mainly portfolios for individuals and financial margin with in Argentina. mix of portfolios in Brazil and very small, small and middle higher rate of working capital clients was offset by the -market companies, which and other in Latin America (ex- increase in cost of credit carry higher spreads. in the quarter. Brazil). Financial Margin with the Market Financial margin with the market includes (i) treasury banking, that manages mismatches of assets and liabilities (ALM - Asset and Liability Management), terms, and interest, foreign exchange and other rates and (ii) treasury trading, that manages proprietary portfolios and may assume guiding positions, in compliance with the limits established by our risk appetite. 5,000 2,500 R$ millions 4,500 1,808 1,782 4,000 2,000 1,711 1,572 1,539 3,500 1,469 1,444 1,371 3,000 1,248 1,500 2,500 1,868 1,738 2,000 1,000 1,623 1,437 1,359 1,342 1,257 1,244 1,500 1,149 1,691 1,431 1,322 663 1,000 500 1,113 1,207 885 918 992 486 500 457 301 307 326 247 264 177 231 - - 1Q17 2Q17 3Q17 4Q17 1Q18 2Q18 3Q18 4Q18 1Q19 (3) (2) Brazil Latin America 1-year moving average (2) (3) Includes units abroad ex-Latin America. Excludes Brazil. The 8.2% increase in the financial margin with the market in the quarter was driven by higher gains in asset and liability management in Brazil, which was partially offset by lower gains in Latin America (ex-Brazil) and the sale of shares on B3 in the fourth quarter of 2018. Itaú Unibanco Holding S.A. 15
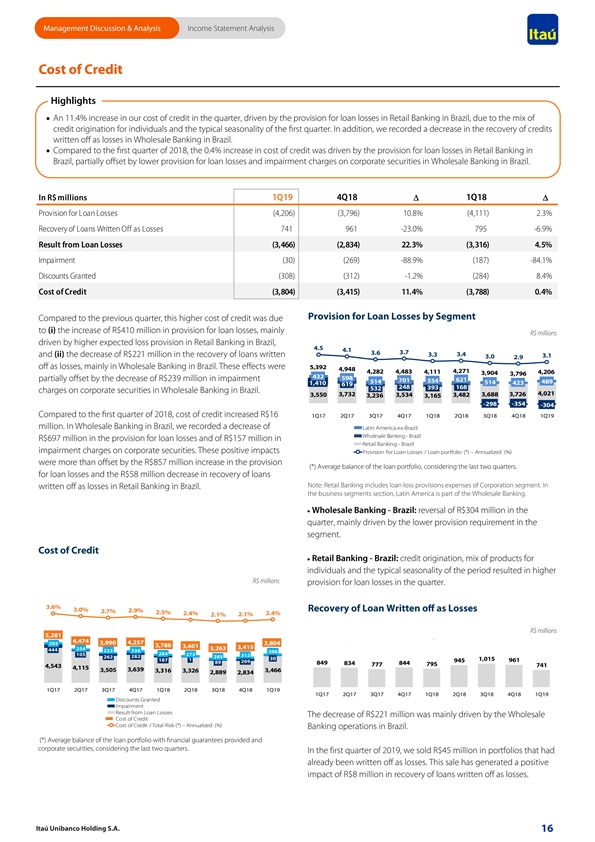
Management Discussion & Analysis Income Statement Analysis Cost of Credit Highlights · An 11.4% increase in our cost of credit in the quarter, driven by the provision for loan losses in Retail Banking in Brazil, due to the mix of credit origination for individuals and the typical seasonality of the first quarter. In addition, we recorded a decrease in the recovery of credits written off as losses in Wholesale Banking in Brazil. · Compared to the first quarter of 2018, the 0.4% increase in cost of credit was driven by the provision for loan losses in Retail Banking in Brazil, partially offset by lower provision for loan losses and impairment charges on corporate securities in Wholesale Banking in Brazil. In R$ millions 1Q19 4Q18 1Q18 D D Provision for Loan Losses (4,206) (3,796) 10.8% (4,111) 2.3% Recovery of Loans Written Off as Losses 741 961 -23.0% 795 -6.9% Result from Loan Losses (3,466) (2,834) 22.3% (3,316) 4.5% Impairment (30) (269) -88.9% (187) -84.1% Discounts Granted (308) (312) -1.2% (284) 8.4% Cost of Credit (3,804) (3,415) 11.4% (3,788) 0.4% Provision for Loan Losses by Segment Compared to the previous quarter, this higher cost of credit was due to (i) the increase of R$410 million in provision for loan losses, mainly R$ millions driven by higher expected loss provision in Retail Banking in Brazil, 4.5 4.1 3.7 3.6 3.4 and (ii) the decrease of R$221 million in the recovery of loans written 3.3 3.1 3.0 2.9 off as losses, mainly in Wholesale Banking in Brazil. These effects were 5,392 4,948 4,271 4,282 4,483 4,111 4,206 3,904 3,796 432 598 partially offset by the decrease of R$239 million in impairment 701 621 554 514 514 489 1,410 423 619 248 168 393 532 charges on corporate securities in Wholesale Banking in Brazil. 3,732 3,688 3,726 4,021 3,550 3,534 3,482 3,236 3,165 -298 -354 -304 Compared to the first quarter of 2018, cost of credit increased R$16 1Q17 2Q17 3Q17 4Q17 1Q18 2Q18 3Q18 4Q18 1Q19 million. In Wholesale Banking in Brazil, we recorded a decrease of Latin America ex-Brazil Wholesale Banking - Brazil R$697 million in the provision for loan losses and of R$157 million in Retail Banking - Brazil impairment charges on corporate securities. These positive impacts Provision for Loan Losses / Loan portfolio (*) – Annualized (%) were more than offset by the R$857 million increase in the provision (*) Average balance of the loan portfolio, considering the last two quarters. for loan losses and the R$58 million decrease in recovery of loans Note: Retail Banking includes loan loss provisions expenses of Corporation segment. In written off as losses in Retail Banking in Brazil. the business segments section, Latin America is part of the Wholesale Banking. · Wholesale Banking - Brazil: reversal of R$304 million in the quarter, mainly driven by the lower provision requirement in the segment. Cost of Credit · Retail Banking - Brazil: credit origination, mix of products for individuals and the typical seasonality of the period resulted in higher R$ millions provision for loan losses in the quarter. 3.6% 3.0% 2.9% Recovery of Loan Written off as Losses 2.7% 2.5% 2.4% 2.4% 2.1% 2.1% R$ millions 5,281 ' 4,474 ' 293 3,990 4,257 3,804 3,788 3,601 3,415 254 3,263 444 223 336 308 284 105 273 312 282 285 262 30 1 1,015 187 961 ' 269 945 ' 89 849 834 844 777 795 741 4,543 4,115 3,505 3,639 3,466 3,316 3,326 2,889 2,834 1Q17 2Q17 3Q17 4Q17 1Q18 2Q18 3Q18 4Q18 1Q19 1Q17 2Q17 3Q17 4Q17 1Q18 2Q18 3Q18 4Q18 1Q19 Discounts Granted Impairment Result from Loan Losses The decrease of R$221 million was mainly driven by the Wholesale Cost of Credit Cost of Credit / Total Risk (*) – Annualized (%) Banking operations in Brazil. (*) Average balance of the loan portfolio with financial guarantees provided and corporate securities, considering the last two quarters. In the first quarter of 2019, we sold R$45 million in portfolios that had already been written off as losses. This sale has generated a positive impact of R$8 million in recovery of loans written off as losses. Itaú Unibanco Holding S.A. 16 Management Discussion & Analysis Income Statement Analysis Cost of Credit Highlights · An 11.4% increase in our cost of credit in the quarter, driven by the provision for loan losses in Retail Banking in Brazil, due to the mix of credit origination for individuals and the typical seasonality of the first quarter. In addition, we recorded a decrease in the recovery of credits written off as losses in Wholesale Banking in Brazil. · Compared to the first quarter of 2018, the 0.4% increase in cost of credit was driven by the provision for loan losses in Retail Banking in Brazil, partially offset by lower provision for loan losses and impairment charges on corporate securities in Wholesale Banking in Brazil. In R$ millions 1Q19 4Q18 1Q18 D D Provision for Loan Losses (4,206) (3,796) 10.8% (4,111) 2.3% Recovery of Loans Written Off as Losses 741 961 -23.0% 795 -6.9% Result from Loan Losses (3,466) (2,834) 22.3% (3,316) 4.5% Impairment (30) (269) -88.9% (187) -84.1% Discounts Granted (308) (312) -1.2% (284) 8.4% Cost of Credit (3,804) (3,415) 11.4% (3,788) 0.4% Provision for Loan Losses by Segment Compared to the previous quarter, this higher cost of credit was due to (i) the increase of R$410 million in provision for loan losses, mainly R$ millions driven by higher expected loss provision in Retail Banking in Brazil, 4.5 4.1 3.7 3.6 3.4 and (ii) the decrease of R$221 million in the recovery of loans written 3.3 3.1 3.0 2.9 off as losses, mainly in Wholesale Banking in Brazil. These effects were 5,392 4,948 4,271 4,282 4,483 4,111 4,206 3,904 3,796 432 598 partially offset by the decrease of R$239 million in impairment 701 621 554 514 514 489 1,410 423 619 248 168 393 532 charges on corporate securities in Wholesale Banking in Brazil. 3,732 3,688 3,726 4,021 3,550 3,534 3,482 3,236 3,165 -298 -354 -304 Compared to the first quarter of 2018, cost of credit increased R$16 1Q17 2Q17 3Q17 4Q17 1Q18 2Q18 3Q18 4Q18 1Q19 million. In Wholesale Banking in Brazil, we recorded a decrease of Latin America ex-Brazil Wholesale Banking - Brazil R$697 million in the provision for loan losses and of R$157 million in Retail Banking - Brazil impairment charges on corporate securities. These positive impacts Provision for Loan Losses / Loan portfolio (*) – Annualized (%) were more than offset by the R$857 million increase in the provision (*) Average balance of the loan portfolio, considering the last two quarters. for loan losses and the R$58 million decrease in recovery of loans Note: Retail Banking includes loan loss provisions expenses of Corporation segment. In written off as losses in Retail Banking in Brazil. the business segments section, Latin America is part of the Wholesale Banking. · Wholesale Banking - Brazil: reversal of R$304 million in the quarter, mainly driven by the lower provision requirement in the segment. Cost of Credit · Retail Banking - Brazil: credit origination, mix of products for individuals and the typical seasonality of the period resulted in higher R$ millions provision for loan losses in the quarter. 3.6% 3.0% 2.9% Recovery of Loan Written off as Losses 2.7% 2.5% 2.4% 2.4% 2.1% 2.1% R$ millions 5,281 ' 4,474 ' 293 3,990 4,257 3,804 3,788 3,601 3,415 254 3,263 444 223 336 308 284 105 273 312 282 285 262 30 1 1,015 187 961 ' 269 945 ' 89 849 834 844 777 795 741 4,543 4,115 3,505 3,639 3,466 3,316 3,326 2,889 2,834 1Q17 2Q17 3Q17 4Q17 1Q18 2Q18 3Q18 4Q18 1Q19 1Q17 2Q17 3Q17 4Q17 1Q18 2Q18 3Q18 4Q18 1Q19 Discounts Granted Impairment Result from Loan Losses The decrease of R$221 million was mainly driven by the Wholesale Cost of Credit Cost of Credit / Total Risk (*) – Annualized (%) Banking operations in Brazil. (*) Average balance of the loan portfolio with financial guarantees provided and corporate securities, considering the last two quarters. In the first quarter of 2019, we sold R$45 million in portfolios that had already been written off as losses. This sale has generated a positive impact of R$8 million in recovery of loans written off as losses. Itaú Unibanco Holding S.A. 16
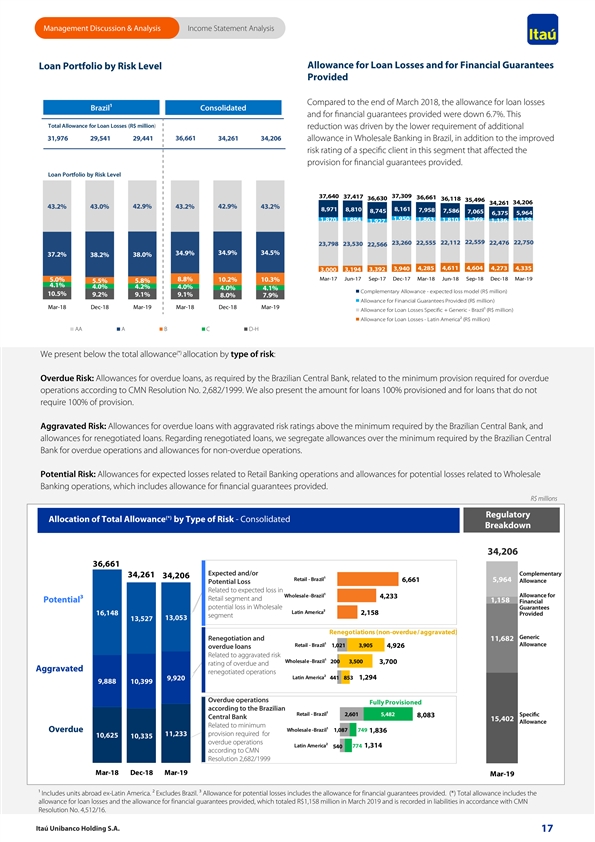
Management Discussion & Analysis Income Statement Analysis Allowance for Loan Losses and for Financial Guarantees Loan Portfolio by Risk Level Provided Compared to the end of March 2018, the allowance for loan losses Brazil1 Consolidated and for financial guarantees provided were down 6.7%. This Total Allowance for Loan Losses (R$ million) reduction was driven by the lower requirement of additional 31,976 29,541 29,441 36,661 34,261 34,206 allowance in Wholesale Banking in Brazil, in addition to the improved risk rating of a specific client in this segment that affected the provision for financial guarantees provided. Loan Portfolio by Risk Level 37,640 37,309 37,417 36,661 36,630 36,118 35,496 34,206 34,261 43.2% 43.0% 42.9% 43.2% 42.9% 43.2% 8,971 8,161 8,810 7,958 8,745 7,586 7,065 6,375 5,964 1,950 1,269 1,870 1,884 1,863 1,810 1,136 1,158 1,927 22,559 23,260 22,555 22,112 22,476 22,750 23,798 23,530 22,566 34.9% 34.9% 34.5% 37.2% 38.2% 38.0% 4,285 4,611 4,604 4,273 4,335 3,194 3,392 3,940 3,000 8.8% Mar-17 Jun-17 Sep-17 Dec-17 Mar-18 Jun-18 Sep-18 Dec-18 Mar-19 5.0% 10.2% 10.3% 5.5% 5.8% 4.1% 4.0% 4.2% 4.0% 4.0% 4.1% Complementary Allowance - expected loss model (R$ million) 10.5% 9.2% 9.1% 9.1% 8.0% 7.9% Allowance for Financial Guarantees Provided (R$ million) Mar-18 Dec-18 Mar-19 Mar-18 Dec-18 Mar-19 Allowance for Loan Losses Specific + Generic - Brazil¹ (R$ million) Allowance for Loan Losses - Latin America² (R$ million) AA A B C D-H (*) We present below the total allowance allocation by type of risk: Overdue Risk: Allowances for overdue loans, as required by the Brazilian Central Bank, related to the minimum provision required for overdue operations according to CMN Resolution No. 2,682/1999. We also present the amount for loans 100% provisioned and for loans that do not require 100% of provision. Aggravated Risk: Allowances for overdue loans with aggravated risk ratings above the minimum required by the Brazilian Central Bank, and allowances for renegotiated loans. Regarding renegotiated loans, we segregate allowances over the minimum required by the Brazilian Central Bank for overdue operations and allowances for non-overdue operations. Potential Risk: Allowances for expected losses related to Retail Banking operations and allowances for potential losses related to Wholesale Banking operations, which includes allowance for financial guarantees provided. R$ millions Regulatory (*) Allocation of Total Allowance by Type of Risk - Consolidated Breakdown 34,206 36,661 Expected and/or Complementary 34,261 34,206 Retail - Brazil1 6,661 5,964 Allowance Potential Loss Related to expected loss in Allowance for Wholesale -Brazil1 4,233 Retail segment and Potential3 1,158 Financial potential loss in Wholesale Guarantees Latin America2 16,148 2,158 Provided segment 13,053 13,527 Renegotiations (non-overdue / aggravated) Generic Renegotiation and 11,682 Allowance Retail - Brazil1 1,021 3,905 4,926 overdue loans Related to aggravated risk Wholesale -Brazil1 200 3,500 3,700 rating of overdue and Aggravated renegotiated operations Latin America2 441 853 1,294 9,920 9,888 10,399 Overdue operations Fully Provisioned according to the Brazilian Retail - Brazil1 2,601 5,482 8,083 Specific Central Bank 15,402 Allowance Related to minimum Overdue Wholesale -Brazil1 1,087 749 1,836 11,233 provision required for 10,625 10,335 overdue operations Latin America2 540 774 1,314 according to CMN Resolution 2,682/1999 Mar-18 Dec-18 Mar-19 Mar-19 ¹ Includes units abroad ex-Latin America. ² Excludes Brazil. ³ Allowance for potential losses includes the allowance for financial guarantees provided. (*) Total allowance includes the allowance for loan losses and the allowance for financial guarantees provided, which totaled R$1,158 million in March 2019 and is recorded in liabilities in accordance with CMN Resolution No. 4,512/16. Itaú Unibanco Holding S.A. 17 Management Discussion & Analysis Income Statement Analysis Allowance for Loan Losses and for Financial Guarantees Loan Portfolio by Risk Level Provided Compared to the end of March 2018, the allowance for loan losses Brazil1 Consolidated and for financial guarantees provided were down 6.7%. This Total Allowance for Loan Losses (R$ million) reduction was driven by the lower requirement of additional 31,976 29,541 29,441 36,661 34,261 34,206 allowance in Wholesale Banking in Brazil, in addition to the improved risk rating of a specific client in this segment that affected the provision for financial guarantees provided. Loan Portfolio by Risk Level 37,640 37,309 37,417 36,661 36,630 36,118 35,496 34,206 34,261 43.2% 43.0% 42.9% 43.2% 42.9% 43.2% 8,971 8,161 8,810 7,958 8,745 7,586 7,065 6,375 5,964 1,950 1,269 1,870 1,884 1,863 1,810 1,136 1,158 1,927 22,559 23,260 22,555 22,112 22,476 22,750 23,798 23,530 22,566 34.9% 34.9% 34.5% 37.2% 38.2% 38.0% 4,285 4,611 4,604 4,273 4,335 3,194 3,392 3,940 3,000 8.8% Mar-17 Jun-17 Sep-17 Dec-17 Mar-18 Jun-18 Sep-18 Dec-18 Mar-19 5.0% 10.2% 10.3% 5.5% 5.8% 4.1% 4.0% 4.2% 4.0% 4.0% 4.1% Complementary Allowance - expected loss model (R$ million) 10.5% 9.2% 9.1% 9.1% 8.0% 7.9% Allowance for Financial Guarantees Provided (R$ million) Mar-18 Dec-18 Mar-19 Mar-18 Dec-18 Mar-19 Allowance for Loan Losses Specific + Generic - Brazil¹ (R$ million) Allowance for Loan Losses - Latin America² (R$ million) AA A B C D-H (*) We present below the total allowance allocation by type of risk: Overdue Risk: Allowances for overdue loans, as required by the Brazilian Central Bank, related to the minimum provision required for overdue operations according to CMN Resolution No. 2,682/1999. We also present the amount for loans 100% provisioned and for loans that do not require 100% of provision. Aggravated Risk: Allowances for overdue loans with aggravated risk ratings above the minimum required by the Brazilian Central Bank, and allowances for renegotiated loans. Regarding renegotiated loans, we segregate allowances over the minimum required by the Brazilian Central Bank for overdue operations and allowances for non-overdue operations. Potential Risk: Allowances for expected losses related to Retail Banking operations and allowances for potential losses related to Wholesale Banking operations, which includes allowance for financial guarantees provided. R$ millions Regulatory (*) Allocation of Total Allowance by Type of Risk - Consolidated Breakdown 34,206 36,661 Expected and/or Complementary 34,261 34,206 Retail - Brazil1 6,661 5,964 Allowance Potential Loss Related to expected loss in Allowance for Wholesale -Brazil1 4,233 Retail segment and Potential3 1,158 Financial potential loss in Wholesale Guarantees Latin America2 16,148 2,158 Provided segment 13,053 13,527 Renegotiations (non-overdue / aggravated) Generic Renegotiation and 11,682 Allowance Retail - Brazil1 1,021 3,905 4,926 overdue loans Related to aggravated risk Wholesale -Brazil1 200 3,500 3,700 rating of overdue and Aggravated renegotiated operations Latin America2 441 853 1,294 9,920 9,888 10,399 Overdue operations Fully Provisioned according to the Brazilian Retail - Brazil1 2,601 5,482 8,083 Specific Central Bank 15,402 Allowance Related to minimum Overdue Wholesale -Brazil1 1,087 749 1,836 11,233 provision required for 10,625 10,335 overdue operations Latin America2 540 774 1,314 according to CMN Resolution 2,682/1999 Mar-18 Dec-18 Mar-19 Mar-19 ¹ Includes units abroad ex-Latin America. ² Excludes Brazil. ³ Allowance for potential losses includes the allowance for financial guarantees provided. (*) Total allowance includes the allowance for loan losses and the allowance for financial guarantees provided, which totaled R$1,158 million in March 2019 and is recorded in liabilities in accordance with CMN Resolution No. 4,512/16. Itaú Unibanco Holding S.A. 17
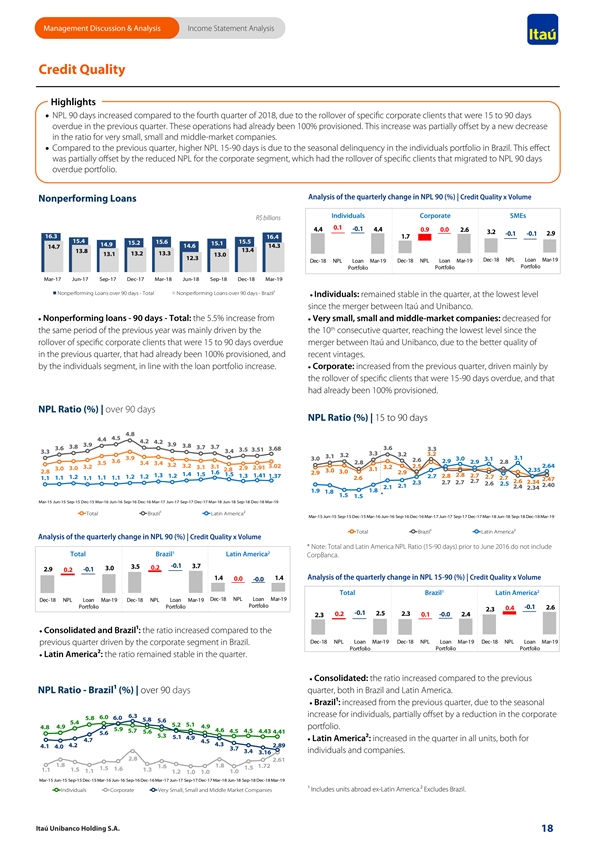
Management Discussion & Analysis Income Statement Analysis Credit Quality Highlights · NPL 90 days increased compared to the fourth quarter of 2018, due to the rollover of specific corporate clients that were 15 to 90 days overdue in the previous quarter. These operations had already been 100% provisioned. This increase was partially offset by a new decrease in the ratio for very small, small and middle-market companies. · Compared to the previous quarter, higher NPL 15-90 days is due to the seasonal delinquency in the individuals portfolio in Brazil. This effect was partially offset by the reduced NPL for the corporate segment, which had the rollover of specific clients that migrated to NPL 90 days overdue portfolio. Analysis of the quarterly change in NPL 90 (%) | Credit Quality x Volume Nonperforming Loans Individuals Corporate SMEs R$ billions 0.1 -0.1 4.4 4.4 0.9 0.0 2.6 3.2 -0.1 -0.1 2.9 16.3 16.4 1.7 15.4 15.6 15.5 15.2 15.1 14.9 14.6 14.3 14.7 13.4 13.8 13.3 13.1 13.2 13.0 12.3 Dec-18 NPL Loan Mar-19 Dec-18 NPL Loan Mar-19 Dec-18 NPL Loan Mar-19 Portfolio Portfolio Portfolio Mar-17 Jun-17 Sep-17 Dec-17 Mar-18 Jun-18 Sep-18 Dec-18 Mar-19 Nonperforming Loans over 90 days - Total Nonperforming Loans over 90 days - Brazil¹ · Individuals: remained stable in the quarter, at the lowest level since the merger between Itaú and Unibanco. · Nonperforming loans - 90 days - Total: the 5.5% increase from · Very small, small and middle-market companies: decreased for th the same period of the previous year was mainly driven by the the 10 consecutive quarter, reaching the lowest level since the rollover of specific corporate clients that were 15 to 90 days overdue merger between Itaú and Unibanco, due to the better quality of in the previous quarter, that had already been 100% provisioned, and recent vintages. by the individuals segment, in line with the loan portfolio increase. · Corporate: increased from the previous quarter, driven mainly by the rollover of specific clients that were 15-90 days overdue, and that had already been 100% provisioned. NPL Ratio (%) | over 90 days NPL Ratio (%) | 15 to 90 days 4.8 4.5 4.4 4.2 4.2 3.9 3.9 3.8 3.8 3.7 3.7 3.6 3.6 3.68 3.3 3.5 3.51 3.4 3.3 3.3 3.2 3.2 3.2 3.1 3.9 3.1 3.0 3.0 3.1 2.6 3.6 2.9 2.8 2.9 2.8 3.5 3.4 3.4 3.2 3.2 3.02 2.5 2.64 3.2 3.1 3.1 3.2 3.0 2.9 2.91 3.0 2.8 3.1 2.35 3.0 2.8 1.6 3.0 2.9 2.9 1.4 1.5 1.5 1.3 1.41 2.8 1.2 1.3 1.37 2.7 2.8 2.7 1.2 1.2 1.2 2.7 1.1 1.1 1.1 1.1 1.1 2.6 2.7 2.47 2.7 2.6 2.7 2.7 2.34 2.3 2.6 2.5 2.40 2.1 2.1 2.4 2.34 1.8 1.9 1.8 * 1.5 1.5 Mar-15 Jun-15 Sep-15 Dec-15 Mar-16 Jun-16 Sep-16 Dec-16 Mar-17 Jun-17 Sep-17 Dec-17 Mar-18 Jun-18 Sep-18 Dec-18 Mar-19 Total Brazil¹ Latin America² Mar-15 Jun-15 Sep-15 Dec-15 Mar-16 Jun-16 Sep-16 Dec-16 Mar-17 Jun-17 Sep-17 Dec-17 Mar-18 Jun-18 Sep-18 Dec-18 Mar-19 Total Brazil¹ Latin America² Analysis of the quarterly change in NPL 90 (%) | Credit Quality x Volume * Note: Total and Latin America NPL Ratio (15-90 days) prior to June 2016 do not include 1 2 Total Brazil Latin America CorpBanca. -0.1 3.7 3.5 3.0 0.2 2.9 0.2 -0.1 1.4 1.4 Analysis of the quarterly change in NPL 15-90 (%) | Credit Quality x Volume 0.0 -0.0 1 2 Total Brazil Latin America Dec-18 NPL Loan Mar-19 Dec-18 NPL Loan Mar-19 Dec-18 NPL Loan Mar-19 Portfolio Portfolio Portfolio -0.1 0.4 2.6 2.3 -0.1 0.2 2.5 2.3 2.4 2.3 0.1 -0.0 · Consolidated and Brazil1: the ratio increased compared to the Dec-18 NPL Loan Mar-19 Dec-18 NPL Loan Mar-19 Dec-18 NPL Loan Mar-19 previous quarter driven by the corporate segment in Brazil. Portfolio Portfolio Portfolio · Latin America2: the ratio remained stable in the quarter. · Consolidated: the ratio increased compared to the previous NPL Ratio - Brazil1 (%) | over 90 days quarter, both in Brazil and Latin America. · Brazil1: increased from the previous quarter, due to the seasonal increase for individuals, partially offset by a reduction in the corporate 6.3 6.0 5.8 6.0 5.8 5.6 5.4 5.2 5.1 4.9 4.8 4.9 portfolio. 5.9 4.6 5.7 4.5 4.5 4.43 5.6 4.41 5.6 5.3 5.1 4.9 · Latin America2: increased in the quarter in all units, both for 4.7 4.5 4.3 4.2 2.89 4.1 4.0 3.7 3.4 individuals and companies. 3.16 2.8 2.61 1.8 1.6 1.8 1.72 1.5 1.5 1.6 1.1 1.5 1.3 1.1 1.0 1.2 1.0 1.0 Mar-15 Jun-15 Sep-15 Dec-15 Mar-16 Jun-16 Sep-16 Dec-16 Mar-17 Jun-17 Sep-17 Dec-17 Mar-18 Jun-18 Sep-18 Dec-18 Mar-19 Individuals Corporate Very Small, Small and Middle Market Companies ¹ Includes units abroad ex-Latin America.² Excludes Brazil. Itaú Unibanco Holding S.A. 18 Management Discussion & Analysis Income Statement Analysis Credit Quality Highlights · NPL 90 days increased compared to the fourth quarter of 2018, due to the rollover of specific corporate clients that were 15 to 90 days overdue in the previous quarter. These operations had already been 100% provisioned. This increase was partially offset by a new decrease in the ratio for very small, small and middle-market companies. · Compared to the previous quarter, higher NPL 15-90 days is due to the seasonal delinquency in the individuals portfolio in Brazil. This effect was partially offset by the reduced NPL for the corporate segment, which had the rollover of specific clients that migrated to NPL 90 days overdue portfolio. Analysis of the quarterly change in NPL 90 (%) | Credit Quality x Volume Nonperforming Loans Individuals Corporate SMEs R$ billions 0.1 -0.1 4.4 4.4 0.9 0.0 2.6 3.2 -0.1 -0.1 2.9 16.3 16.4 1.7 15.4 15.6 15.5 15.2 15.1 14.9 14.6 14.3 14.7 13.4 13.8 13.3 13.1 13.2 13.0 12.3 Dec-18 NPL Loan Mar-19 Dec-18 NPL Loan Mar-19 Dec-18 NPL Loan Mar-19 Portfolio Portfolio Portfolio Mar-17 Jun-17 Sep-17 Dec-17 Mar-18 Jun-18 Sep-18 Dec-18 Mar-19 Nonperforming Loans over 90 days - Total Nonperforming Loans over 90 days - Brazil¹ · Individuals: remained stable in the quarter, at the lowest level since the merger between Itaú and Unibanco. · Nonperforming loans - 90 days - Total: the 5.5% increase from · Very small, small and middle-market companies: decreased for th the same period of the previous year was mainly driven by the the 10 consecutive quarter, reaching the lowest level since the rollover of specific corporate clients that were 15 to 90 days overdue merger between Itaú and Unibanco, due to the better quality of in the previous quarter, that had already been 100% provisioned, and recent vintages. by the individuals segment, in line with the loan portfolio increase. · Corporate: increased from the previous quarter, driven mainly by the rollover of specific clients that were 15-90 days overdue, and that had already been 100% provisioned. NPL Ratio (%) | over 90 days NPL Ratio (%) | 15 to 90 days 4.8 4.5 4.4 4.2 4.2 3.9 3.9 3.8 3.8 3.7 3.7 3.6 3.6 3.68 3.3 3.5 3.51 3.4 3.3 3.3 3.2 3.2 3.2 3.1 3.9 3.1 3.0 3.0 3.1 2.6 3.6 2.9 2.8 2.9 2.8 3.5 3.4 3.4 3.2 3.2 3.02 2.5 2.64 3.2 3.1 3.1 3.2 3.0 2.9 2.91 3.0 2.8 3.1 2.35 3.0 2.8 1.6 3.0 2.9 2.9 1.4 1.5 1.5 1.3 1.41 2.8 1.2 1.3 1.37 2.7 2.8 2.7 1.2 1.2 1.2 2.7 1.1 1.1 1.1 1.1 1.1 2.6 2.7 2.47 2.7 2.6 2.7 2.7 2.34 2.3 2.6 2.5 2.40 2.1 2.1 2.4 2.34 1.8 1.9 1.8 * 1.5 1.5 Mar-15 Jun-15 Sep-15 Dec-15 Mar-16 Jun-16 Sep-16 Dec-16 Mar-17 Jun-17 Sep-17 Dec-17 Mar-18 Jun-18 Sep-18 Dec-18 Mar-19 Total Brazil¹ Latin America² Mar-15 Jun-15 Sep-15 Dec-15 Mar-16 Jun-16 Sep-16 Dec-16 Mar-17 Jun-17 Sep-17 Dec-17 Mar-18 Jun-18 Sep-18 Dec-18 Mar-19 Total Brazil¹ Latin America² Analysis of the quarterly change in NPL 90 (%) | Credit Quality x Volume * Note: Total and Latin America NPL Ratio (15-90 days) prior to June 2016 do not include 1 2 Total Brazil Latin America CorpBanca. -0.1 3.7 3.5 3.0 0.2 2.9 0.2 -0.1 1.4 1.4 Analysis of the quarterly change in NPL 15-90 (%) | Credit Quality x Volume 0.0 -0.0 1 2 Total Brazil Latin America Dec-18 NPL Loan Mar-19 Dec-18 NPL Loan Mar-19 Dec-18 NPL Loan Mar-19 Portfolio Portfolio Portfolio -0.1 0.4 2.6 2.3 -0.1 0.2 2.5 2.3 2.4 2.3 0.1 -0.0 · Consolidated and Brazil1: the ratio increased compared to the Dec-18 NPL Loan Mar-19 Dec-18 NPL Loan Mar-19 Dec-18 NPL Loan Mar-19 previous quarter driven by the corporate segment in Brazil. Portfolio Portfolio Portfolio · Latin America2: the ratio remained stable in the quarter. · Consolidated: the ratio increased compared to the previous NPL Ratio - Brazil1 (%) | over 90 days quarter, both in Brazil and Latin America. · Brazil1: increased from the previous quarter, due to the seasonal increase for individuals, partially offset by a reduction in the corporate 6.3 6.0 5.8 6.0 5.8 5.6 5.4 5.2 5.1 4.9 4.8 4.9 portfolio. 5.9 4.6 5.7 4.5 4.5 4.43 5.6 4.41 5.6 5.3 5.1 4.9 · Latin America2: increased in the quarter in all units, both for 4.7 4.5 4.3 4.2 2.89 4.1 4.0 3.7 3.4 individuals and companies. 3.16 2.8 2.61 1.8 1.6 1.8 1.72 1.5 1.5 1.6 1.1 1.5 1.3 1.1 1.0 1.2 1.0 1.0 Mar-15 Jun-15 Sep-15 Dec-15 Mar-16 Jun-16 Sep-16 Dec-16 Mar-17 Jun-17 Sep-17 Dec-17 Mar-18 Jun-18 Sep-18 Dec-18 Mar-19 Individuals Corporate Very Small, Small and Middle Market Companies ¹ Includes units abroad ex-Latin America.² Excludes Brazil. Itaú Unibanco Holding S.A. 18
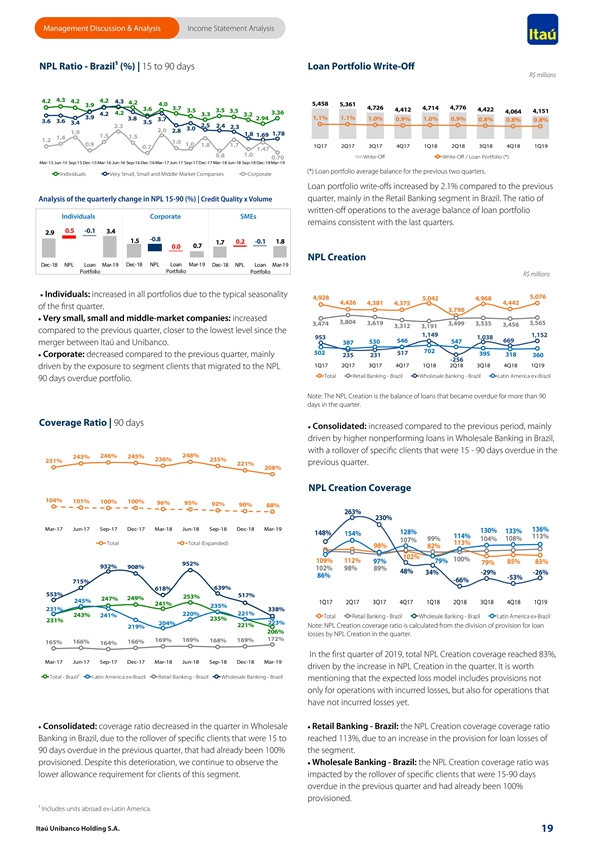
Management Discussion & Analysis Income Statement Analysis NPL Ratio - Brazil1 (%) | 15 to 90 days Loan Portfolio Write-Off R$ millions 4.3 4.2 4.2 4.2 4.3 4.2 4.0 5,458 5,361 3.9 3.7 4,726 4,714 4,776 3.6 3.5 4,412 4,422 3.5 3.5 4,151 4,064 4.2 3.36 4.2 3.3 3.2 3.9 2.94 1.1% 1.1% 3.8 3.7 1.0% 0.9% 1.0% 0.9% 0.8% 0.8% 0.8% 3.6 3.6 3.5 3.4 2.3 2.5 2.4 2.3 3.0 2.0 2.8 1.9 1.8 1.78 1.69 1.5 1.5 1.4 1.2 1.0 0.9 1.0 1.8 1.7 1Q17 2Q17 3Q17 4Q17 1Q18 2Q18 3Q18 4Q18 1Q19 0.7 1.47 1.0 0.8 Write-Off Write-Off / Loan Portfolio (*) 0.70 Mar-15 Jun-15 Sep-15 Dec-15 Mar-16 Jun-16 Sep-16 Dec-16 Mar-17 Jun-17 Sep-17 Dec-17 Mar-18 Jun-18 Sep-18 Dec-18 Mar-19 (*) Loan portfolio average balance for the previous two quarters. Individuals Very Small, Small and Middle Market Companies Corporate Loan portfolio write-offs increased by 2.1% compared to the previous quarter, mainly in the Retail Banking segment in Brazil. The ratio of Analysis of the quarterly change in NPL 15-90 (%) | Credit Quality x Volume written-off operations to the average balance of loan portfolio Individuals Corporate SMEs remains consistent with the last quarters. 0.5 -0.1 3.4 2.9 -0.8 1.5 0.2 -0.1 1.8 1.7 0.7 0.0 NPL Creation Dec-18 NPL Loan Mar-19 Dec-18 NPL Loan Mar-19 Dec-18 NPL Loan Mar-19 Portfolio Portfolio Portfolio R$ millions · Individuals: increased in all portfolios due to the typical seasonality 5,076 4,928 5,042 4,968 4,426 4,381 4,375 4,442 of the first quarter. 3,790 · Very small, small and middle-market companies: increased 3,804 3,619 3,565 3,474 3,499 3,535 3,456 3,312 3,191 compared to the previous quarter, closer to the lowest level since the 1,149 1,152 1,038 953 546 669 530 547 merger between Itaú and Unibanco. 387 702 502 517 395 · Corporate: decreased compared to the previous quarter, mainly 235 231 318 360 -256 1Q17 2Q17 3Q17 4Q17 1Q18 2Q18 3Q18 4Q18 1Q19 driven by the exposure to segment clients that migrated to the NPL Total Retail Banking - Brazil Wholesale Banking - Brazil Latin America ex-Brazil 90 days overdue portfolio. Note: The NPL Creation is the balance of loans that became overdue for more than 90 days in the quarter. Coverage Ratio | 90 days · Consolidated: increased compared to the previous period, mainly driven by higher nonperforming loans in Wholesale Banking in Brazil, with a rollover of specific clients that were 15 - 90 days overdue in the 246% 245% 248% 243% 236% 235% 231% previous quarter. 221% 208% NPL Creation Coverage 104% 101% 100% 100% 96% 95% 92% 90% 88% 263% 230% Mar-17 Jun-17 Sep-17 Dec-17 Mar-18 Jun-18 Sep-18 Dec-18 Mar-19 136% 130% 133% 128% 148% 154% 114% 113% 99% 104% 108% 107% Total Total (Expanded) 113% 98% 82% 102% 100% 109% 112% 79% 97% 85% 83% 79% 952% 932% 908% 102% 98% 89% 48% 34% -29% -26% 86% -53% -66% 715% 639% 618% 553% 517% 253% 249% 247% 245% 1Q17 2Q17 3Q17 4Q17 1Q18 2Q18 3Q18 4Q18 1Q19 241% 235% 231% 338% 220% 221% 243% 241% Total Retail Banking - Brazil Wholesale Banking - Brazil Latin America ex-Brazil 235% 231% 204% 223% 221% Note: NPL Creation coverage ratio is calculated from the division of provision for loan 219% 206% losses by NPL Creation in the quarter. 172% 169% 169% 169% 168% 165% 166% 166% 164% In the first quarter of 2019, total NPL Creation coverage reached 83%, Mar-17 Jun-17 Sep-17 Dec-17 Mar-18 Jun-18 Sep-18 Dec-18 Mar-19 driven by the increase in NPL Creation in the quarter. It is worth Total - Brazil¹ Latin America ex-Brazil Retail Banking - Brazil Wholesale Banking - Brazil mentioning that the expected loss model includes provisions not only for operations with incurred losses, but also for operations that have not incurred losses yet. · Consolidated: coverage ratio decreased in the quarter in Wholesale · Retail Banking - Brazil: the NPL Creation coverage coverage ratio Banking in Brazil, due to the rollover of specific clients that were 15 to reached 113%, due to an increase in the provision for loan losses of 90 days overdue in the previous quarter, that had already been 100% the segment. provisioned. Despite this deterioration, we continue to observe the · Wholesale Banking - Brazil: the NPL Creation coverage ratio was lower allowance requirement for clients of this segment. impacted by the rollover of specific clients that were 15-90 days overdue in the previous quarter and had already been 100% provisioned. ¹ Includes units abroad ex-Latin America. Itaú Unibanco Holding S.A. 19 Management Discussion & Analysis Income Statement Analysis NPL Ratio - Brazil1 (%) | 15 to 90 days Loan Portfolio Write-Off R$ millions 4.3 4.2 4.2 4.2 4.3 4.2 4.0 5,458 5,361 3.9 3.7 4,726 4,714 4,776 3.6 3.5 4,412 4,422 3.5 3.5 4,151 4,064 4.2 3.36 4.2 3.3 3.2 3.9 2.94 1.1% 1.1% 3.8 3.7 1.0% 0.9% 1.0% 0.9% 0.8% 0.8% 0.8% 3.6 3.6 3.5 3.4 2.3 2.5 2.4 2.3 3.0 2.0 2.8 1.9 1.8 1.78 1.69 1.5 1.5 1.4 1.2 1.0 0.9 1.0 1.8 1.7 1Q17 2Q17 3Q17 4Q17 1Q18 2Q18 3Q18 4Q18 1Q19 0.7 1.47 1.0 0.8 Write-Off Write-Off / Loan Portfolio (*) 0.70 Mar-15 Jun-15 Sep-15 Dec-15 Mar-16 Jun-16 Sep-16 Dec-16 Mar-17 Jun-17 Sep-17 Dec-17 Mar-18 Jun-18 Sep-18 Dec-18 Mar-19 (*) Loan portfolio average balance for the previous two quarters. Individuals Very Small, Small and Middle Market Companies Corporate Loan portfolio write-offs increased by 2.1% compared to the previous quarter, mainly in the Retail Banking segment in Brazil. The ratio of Analysis of the quarterly change in NPL 15-90 (%) | Credit Quality x Volume written-off operations to the average balance of loan portfolio Individuals Corporate SMEs remains consistent with the last quarters. 0.5 -0.1 3.4 2.9 -0.8 1.5 0.2 -0.1 1.8 1.7 0.7 0.0 NPL Creation Dec-18 NPL Loan Mar-19 Dec-18 NPL Loan Mar-19 Dec-18 NPL Loan Mar-19 Portfolio Portfolio Portfolio R$ millions · Individuals: increased in all portfolios due to the typical seasonality 5,076 4,928 5,042 4,968 4,426 4,381 4,375 4,442 of the first quarter. 3,790 · Very small, small and middle-market companies: increased 3,804 3,619 3,565 3,474 3,499 3,535 3,456 3,312 3,191 compared to the previous quarter, closer to the lowest level since the 1,149 1,152 1,038 953 546 669 530 547 merger between Itaú and Unibanco. 387 702 502 517 395 · Corporate: decreased compared to the previous quarter, mainly 235 231 318 360 -256 1Q17 2Q17 3Q17 4Q17 1Q18 2Q18 3Q18 4Q18 1Q19 driven by the exposure to segment clients that migrated to the NPL Total Retail Banking - Brazil Wholesale Banking - Brazil Latin America ex-Brazil 90 days overdue portfolio. Note: The NPL Creation is the balance of loans that became overdue for more than 90 days in the quarter. Coverage Ratio | 90 days · Consolidated: increased compared to the previous period, mainly driven by higher nonperforming loans in Wholesale Banking in Brazil, with a rollover of specific clients that were 15 - 90 days overdue in the 246% 245% 248% 243% 236% 235% 231% previous quarter. 221% 208% NPL Creation Coverage 104% 101% 100% 100% 96% 95% 92% 90% 88% 263% 230% Mar-17 Jun-17 Sep-17 Dec-17 Mar-18 Jun-18 Sep-18 Dec-18 Mar-19 136% 130% 133% 128% 148% 154% 114% 113% 99% 104% 108% 107% Total Total (Expanded) 113% 98% 82% 102% 100% 109% 112% 79% 97% 85% 83% 79% 952% 932% 908% 102% 98% 89% 48% 34% -29% -26% 86% -53% -66% 715% 639% 618% 553% 517% 253% 249% 247% 245% 1Q17 2Q17 3Q17 4Q17 1Q18 2Q18 3Q18 4Q18 1Q19 241% 235% 231% 338% 220% 221% 243% 241% Total Retail Banking - Brazil Wholesale Banking - Brazil Latin America ex-Brazil 235% 231% 204% 223% 221% Note: NPL Creation coverage ratio is calculated from the division of provision for loan 219% 206% losses by NPL Creation in the quarter. 172% 169% 169% 169% 168% 165% 166% 166% 164% In the first quarter of 2019, total NPL Creation coverage reached 83%, Mar-17 Jun-17 Sep-17 Dec-17 Mar-18 Jun-18 Sep-18 Dec-18 Mar-19 driven by the increase in NPL Creation in the quarter. It is worth Total - Brazil¹ Latin America ex-Brazil Retail Banking - Brazil Wholesale Banking - Brazil mentioning that the expected loss model includes provisions not only for operations with incurred losses, but also for operations that have not incurred losses yet. · Consolidated: coverage ratio decreased in the quarter in Wholesale · Retail Banking - Brazil: the NPL Creation coverage coverage ratio Banking in Brazil, due to the rollover of specific clients that were 15 to reached 113%, due to an increase in the provision for loan losses of 90 days overdue in the previous quarter, that had already been 100% the segment. provisioned. Despite this deterioration, we continue to observe the · Wholesale Banking - Brazil: the NPL Creation coverage ratio was lower allowance requirement for clients of this segment. impacted by the rollover of specific clients that were 15-90 days overdue in the previous quarter and had already been 100% provisioned. ¹ Includes units abroad ex-Latin America. Itaú Unibanco Holding S.A. 19
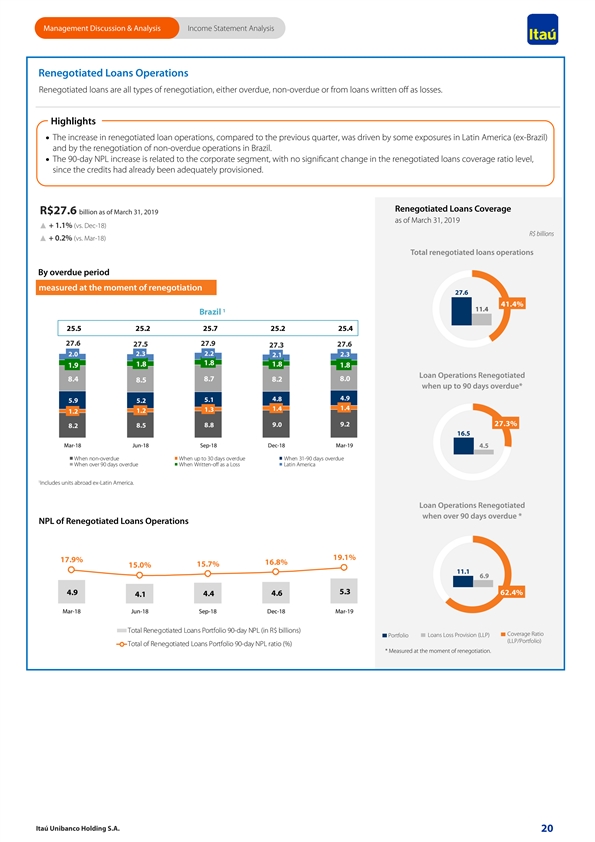
Management Discussion & Analysis Income Statement Analysis Renegotiated Loans Operations Renegotiated loans are all types of renegotiation, either overdue, non-overdue or from loans written off as losses. Highlights · The increase in renegotiated loan operations, compared to the previous quarter, was driven by some exposures in Latin America (ex-Brazil) and by the renegotiation of non-overdue operations in Brazil. · The 90-day NPL increase is related to the corporate segment, with no significant change in the renegotiated loans coverage ratio level, since the credits had already been adequately provisioned. Renegotiated Loans Coverage R$27.6 billion as of March 31, 2019 as of March 31, 2019 + 1.1% (vs. Dec-18) R$ billions + 0.2% (vs. Mar-18) Total renegotiated loans operations By overdue period measured at the moment of renegotiation 27.6 41.4% 11.4 1 Brazil 25.5 25.2 25.7 25.2 25.4 27.6 27.9 27.5 27.6 27.3 2.0 2.3 2.2 2.1 2.3 1.8 1.8 1.8 1.9 1.8 Loan Operations Renegotiated 8.4 8.7 8.0 8.5 8.2 when up to 90 days overdue* 4.8 4.9 5.1 5.9 5.2 1.4 1.4 1.3 1.2 1.2 27.3% 8.8 9.0 9.2 8.2 8.5 16.5 Mar-18 Jun-18 Sep-18 Dec-18 Mar-19 4.5 When non-overdue When up to 30 days overdue When 31-90 days overdue When over 90 days overdue When Written-off as a Loss Latin America 1 Includes units abroad ex-Latin America. Loan Operations Renegotiated when over 90 days overdue * NPL of Renegotiated Loans Operations 19.1% 17.9% 16.8% 15.7% 15.0% 11.1 6.9 5.3 4.9 62.4% 4.4 4.6 4.1 Mar-18 Jun-18 Sep-18 Dec-18 Mar-19 Total Renegotiated Loans Portfolio 90-day NPL (in R$ billions) Coverage Ratio Portfolio Loans Loss Provision (LLP) (LLP/Portfolio) Total of Renegotiated Loans Portfolio 90-day NPL ratio (%) * Measured at the moment of renegotiation. Itaú Unibanco Holding S.A. 20 Management Discussion & Analysis Income Statement Analysis Renegotiated Loans Operations Renegotiated loans are all types of renegotiation, either overdue, non-overdue or from loans written off as losses. Highlights · The increase in renegotiated loan operations, compared to the previous quarter, was driven by some exposures in Latin America (ex-Brazil) and by the renegotiation of non-overdue operations in Brazil. · The 90-day NPL increase is related to the corporate segment, with no significant change in the renegotiated loans coverage ratio level, since the credits had already been adequately provisioned. Renegotiated Loans Coverage R$27.6 billion as of March 31, 2019 as of March 31, 2019 + 1.1% (vs. Dec-18) R$ billions + 0.2% (vs. Mar-18) Total renegotiated loans operations By overdue period measured at the moment of renegotiation 27.6 41.4% 11.4 1 Brazil 25.5 25.2 25.7 25.2 25.4 27.6 27.9 27.5 27.6 27.3 2.0 2.3 2.2 2.1 2.3 1.8 1.8 1.8 1.9 1.8 Loan Operations Renegotiated 8.4 8.7 8.0 8.5 8.2 when up to 90 days overdue* 4.8 4.9 5.1 5.9 5.2 1.4 1.4 1.3 1.2 1.2 27.3% 8.8 9.0 9.2 8.2 8.5 16.5 Mar-18 Jun-18 Sep-18 Dec-18 Mar-19 4.5 When non-overdue When up to 30 days overdue When 31-90 days overdue When over 90 days overdue When Written-off as a Loss Latin America 1 Includes units abroad ex-Latin America. Loan Operations Renegotiated when over 90 days overdue * NPL of Renegotiated Loans Operations 19.1% 17.9% 16.8% 15.7% 15.0% 11.1 6.9 5.3 4.9 62.4% 4.4 4.6 4.1 Mar-18 Jun-18 Sep-18 Dec-18 Mar-19 Total Renegotiated Loans Portfolio 90-day NPL (in R$ billions) Coverage Ratio Portfolio Loans Loss Provision (LLP) (LLP/Portfolio) Total of Renegotiated Loans Portfolio 90-day NPL ratio (%) * Measured at the moment of renegotiation. Itaú Unibanco Holding S.A. 20
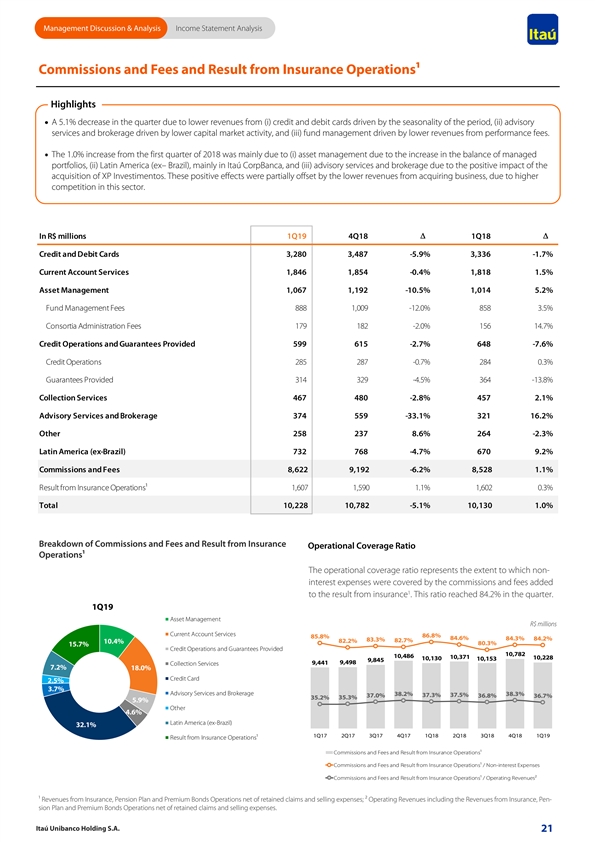
Management Discussion & Analysis Income Statement Analysis Commissions and Fees and Result from Insurance Operations1 Highlights · A 5.1% decrease in the quarter due to lower revenues from (i) credit and debit cards driven by the seasonality of the period, (ii) advisory services and brokerage driven by lower capital market activity, and (iii) fund management driven by lower revenues from performance fees. · The 1.0% increase from the first quarter of 2018 was mainly due to (i) asset management due to the increase in the balance of managed portfolios, (ii) Latin America (ex– Brazil), mainly in Itaú CorpBanca, and (iii) advisory services and brokerage due to the positive impact of the acquisition of XP Investimentos. These positive effects were partially offset by the lower revenues from acquiring business, due to higher competition in this sector. In R$ millions 1Q19 4Q18 D 1Q18 D Credit and Debit Cards 3,280 3,487 -5.9% 3,336 -1.7% Current Account Services 1,846 1,854 -0.4% 1,818 1.5% Asset Management 1,067 1,192 -10.5% 1,014 5.2% Fund Management Fees 888 1,009 -12.0% 8 58 3.5% Consortia Administration Fees 179 182 -2.0% 156 14.7% Credit Operations and Guarantees Provided 599 615 -2.7% 648 -7.6% Credit Operations 285 287 -0.7% 284 0.3% Guarantees Provided 314 329 -4.5% 364 -13.8% Collection Services 467 480 -2.8% 457 2.1% Advisory Services and Brokerage 374 559 -33.1% 321 16.2% Other 258 237 8.6% 264 -2.3% Latin America (ex-Brazil) 732 768 -4.7% 670 9.2% Commissions and Fees 8,622 9,192 -6.2% 8,528 1.1% Result from Insurance Operations¹ 1,607 1,590 1.1% 1,602 0.3% Total 10, 228 10,782 -5.1% 10,130 1.0% Breakdown of Commissions and Fees and Result from Insurance Operational Coverage Ratio Operations1 The operational coverage ratio represents the extent to which non- interest expenses were covered by the commissions and fees added 1 to the result from insurance . This ratio reached 84.2% in the quarter. 1Q19 Asset Management R$ millions Current Account Services 86.8% 85.8% 84.6% 84.3% 84.2% 83.3% 82.7% 82.2% 10.4% 80.3% 15.7% Credit Operations and Guarantees Provided 10,782 10,486 10,371 10,130 10,228 10,153 9,845 9,498 9,441 Collection Services 7.2% 18.0% Credit Card 2.5% 3.7% Advisory Services and Brokerage 38.2% 38.3% 37.3% 37.5% 37.0% 36.8% 36.7% 35.3% 35.2% 5.9% Other 4.6% Latin America (ex-Brazil) 32.1% 1Q17 2Q17 3Q17 4Q17 1Q18 2Q18 3Q18 4Q18 1Q19 Result from Insurance Operations¹ Commissions and Fees and Result from Insurance Operations¹ Commissions and Fees and Result from Insurance Operations¹ / Non-interest Expenses Commissions and Fees and Result from Insurance Operations¹ / Operating Revenues² ¹ Revenues from Insurance, Pension Plan and Premium Bonds Operations net of retained claims and selling expenses; ² Operating Revenues including the Revenues from Insurance, Pen- sion Plan and Premium Bonds Operations net of retained claims and selling expenses. Itaú Unibanco Holding S.A. 21 Management Discussion & Analysis Income Statement Analysis Commissions and Fees and Result from Insurance Operations1 Highlights · A 5.1% decrease in the quarter due to lower revenues from (i) credit and debit cards driven by the seasonality of the period, (ii) advisory services and brokerage driven by lower capital market activity, and (iii) fund management driven by lower revenues from performance fees. · The 1.0% increase from the first quarter of 2018 was mainly due to (i) asset management due to the increase in the balance of managed portfolios, (ii) Latin America (ex– Brazil), mainly in Itaú CorpBanca, and (iii) advisory services and brokerage due to the positive impact of the acquisition of XP Investimentos. These positive effects were partially offset by the lower revenues from acquiring business, due to higher competition in this sector. In R$ millions 1Q19 4Q18 D 1Q18 D Credit and Debit Cards 3,280 3,487 -5.9% 3,336 -1.7% Current Account Services 1,846 1,854 -0.4% 1,818 1.5% Asset Management 1,067 1,192 -10.5% 1,014 5.2% Fund Management Fees 888 1,009 -12.0% 8 58 3.5% Consortia Administration Fees 179 182 -2.0% 156 14.7% Credit Operations and Guarantees Provided 599 615 -2.7% 648 -7.6% Credit Operations 285 287 -0.7% 284 0.3% Guarantees Provided 314 329 -4.5% 364 -13.8% Collection Services 467 480 -2.8% 457 2.1% Advisory Services and Brokerage 374 559 -33.1% 321 16.2% Other 258 237 8.6% 264 -2.3% Latin America (ex-Brazil) 732 768 -4.7% 670 9.2% Commissions and Fees 8,622 9,192 -6.2% 8,528 1.1% Result from Insurance Operations¹ 1,607 1,590 1.1% 1,602 0.3% Total 10, 228 10,782 -5.1% 10,130 1.0% Breakdown of Commissions and Fees and Result from Insurance Operational Coverage Ratio Operations1 The operational coverage ratio represents the extent to which non- interest expenses were covered by the commissions and fees added 1 to the result from insurance .. This ratio reached 84.2% in the quarter. 1Q19 Asset Management R$ millions Current Account Services 86.8% 85.8% 84.6% 84.3% 84.2% 83.3% 82.7% 82.2% 10.4% 80.3% 15.7% Credit Operations and Guarantees Provided 10,782 10,486 10,371 10,130 10,228 10,153 9,845 9,498 9,441 Collection Services 7.2% 18.0% Credit Card 2.5% 3.7% Advisory Services and Brokerage 38.2% 38.3% 37.3% 37.5% 37.0% 36.8% 36.7% 35.3% 35.2% 5.9% Other 4.6% Latin America (ex-Brazil) 32.1% 1Q17 2Q17 3Q17 4Q17 1Q18 2Q18 3Q18 4Q18 1Q19 Result from Insurance Operations¹ Commissions and Fees and Result from Insurance Operations¹ Commissions and Fees and Result from Insurance Operations¹ / Non-interest Expenses Commissions and Fees and Result from Insurance Operations¹ / Operating Revenues² ¹ Revenues from Insurance, Pension Plan and Premium Bonds Operations net of retained claims and selling expenses; ² Operating Revenues including the Revenues from Insurance, Pen- sion Plan and Premium Bonds Operations net of retained claims and selling expenses. Itaú Unibanco Holding S.A. 21
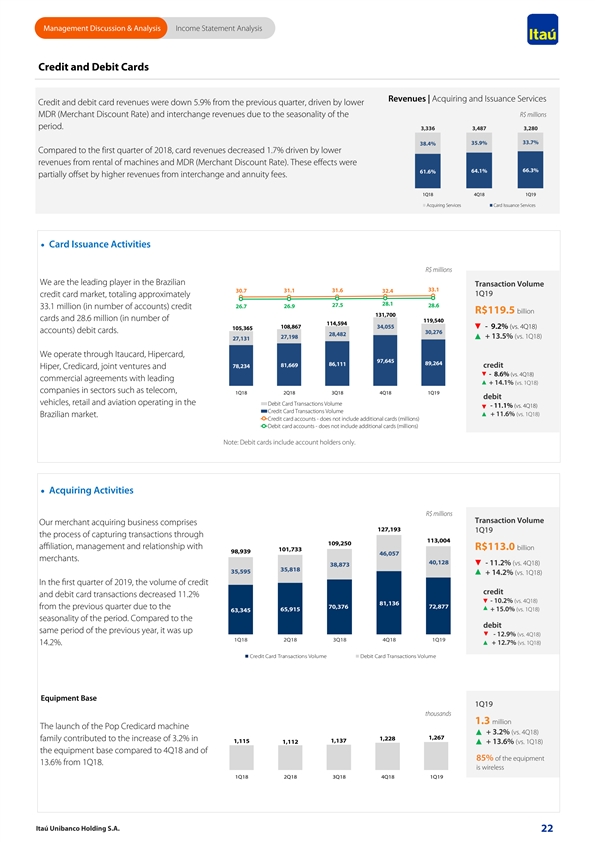
Management Discussion & Analysis Income Statement Analysis Credit and Debit Cards Revenues | Acquiring and Issuance Services Credit and debit card revenues were down 5.9% from the previous quarter, driven by lower MDR (Merchant Discount Rate) and interchange revenues due to the seasonality of the R$ millions period. 3,336 3,487 3,280 33.7% 35.9% 38.4% Compared to the first quarter of 2018, card revenues decreased 1.7% driven by lower revenues from rental of machines and MDR (Merchant Discount Rate). These effects were 66.3% 64.1% 61.6% partially offset by higher revenues from interchange and annuity fees. 1Q18 4Q18 1Q19 Acquiring Services Card Issuance Services · Card Issuance Activities R$ millions We are the leading player in the Brazilian Transaction Volume 33.1 31.6 30.7 31.1 32.4 1Q19 credit card market, totaling approximately 28.1 27.5 28.6 26.7 26.9 33.1 million (in number of accounts) credit R$119.5 billion 131,700 cards and 28.6 million (in number of 119,540 114,594 108,867 34,055 - 9.2% (vs. 4Q18) 105,365 accounts) debit cards. 30,276 28,482 27,198 + 13.5% (vs. 1Q18) 27,131 We operate through Itaucard, Hipercard, 97,645 89,264 86,111 81,669 78,234 credit Hiper, Credicard, joint ventures and - 8.6% (vs. 4Q18) commercial agreements with leading + 14.1% (vs. 1Q18) companies in sectors such as telecom, 1Q18 2Q18 3Q18 4Q18 1Q19 debit vehicles, retail and aviation operating in the Debit Card Transactions Volume - 11.1% (vs. 4Q18) Credit Card Transactions Volume + 11.6% (vs. 1Q18) Brazilian market. Credit card accounts - does not include additional cards (millions) Debit card accounts - does not include additional cards (millions) Note: Debit cards include account holders only. · Acquiring Activities R$ millions Transaction Volume Our merchant acquiring business comprises 127,193 1Q19 the process of capturing transactions through 113,004 109,250 affiliation, management and relationship with R$113.0 billion 101,733 98,939 46,057 merchants. 40,128 - 11.2% (vs. 4Q18) 38,873 35,818 35,595 + 14.2% (vs. 1Q18) In the first quarter of 2019, the volume of credit credit and debit card transactions decreased 11.2% - 10.2% (vs. 4Q18) 81,136 from the previous quarter due to the 70,376 72,877 65,915 + 15.0% (vs. 1Q18) 63,345 seasonality of the period. Compared to the debit same period of the previous year, it was up - 12.9% (vs. 4Q18) 1Q18 2Q18 3Q18 4Q18 1Q19 14.2%. + 12.7% (vs. 1Q18) Credit Card Transactions Volume Debit Card Transactions Volume Equipment Base 1Q19 thousands 1.3 million The launch of the Pop Credicard machine + 3.2% (vs. 4Q18) 1,267 family contributed to the increase of 3.2% in 1,228 1,115 1,137 1,112 + 13.6% (vs. 1Q18) the equipment base compared to 4Q18 and of 85% of the equipment 13.6% from 1Q18. is wireless 1Q18 2Q18 3Q18 4Q18 1Q19 Itaú Unibanco Holding S.A. 22 Management Discussion & Analysis Income Statement Analysis Credit and Debit Cards Revenues | Acquiring and Issuance Services Credit and debit card revenues were down 5.9% from the previous quarter, driven by lower MDR (Merchant Discount Rate) and interchange revenues due to the seasonality of the R$ millions period. 3,336 3,487 3,280 33.7% 35.9% 38.4% Compared to the first quarter of 2018, card revenues decreased 1.7% driven by lower revenues from rental of machines and MDR (Merchant Discount Rate). These effects were 66.3% 64.1% 61.6% partially offset by higher revenues from interchange and annuity fees. 1Q18 4Q18 1Q19 Acquiring Services Card Issuance Services · Card Issuance Activities R$ millions We are the leading player in the Brazilian Transaction Volume 33.1 31.6 30.7 31.1 32.4 1Q19 credit card market, totaling approximately 28.1 27.5 28.6 26.7 26.9 33.1 million (in number of accounts) credit R$119.5 billion 131,700 cards and 28.6 million (in number of 119,540 114,594 108,867 34,055 - 9.2% (vs. 4Q18) 105,365 accounts) debit cards. 30,276 28,482 27,198 + 13.5% (vs. 1Q18) 27,131 We operate through Itaucard, Hipercard, 97,645 89,264 86,111 81,669 78,234 credit Hiper, Credicard, joint ventures and - 8.6% (vs. 4Q18) commercial agreements with leading + 14.1% (vs. 1Q18) companies in sectors such as telecom, 1Q18 2Q18 3Q18 4Q18 1Q19 debit vehicles, retail and aviation operating in the Debit Card Transactions Volume - 11.1% (vs. 4Q18) Credit Card Transactions Volume + 11.6% (vs. 1Q18) Brazilian market. Credit card accounts - does not include additional cards (millions) Debit card accounts - does not include additional cards (millions) Note: Debit cards include account holders only. · Acquiring Activities R$ millions Transaction Volume Our merchant acquiring business comprises 127,193 1Q19 the process of capturing transactions through 113,004 109,250 affiliation, management and relationship with R$113.0 billion 101,733 98,939 46,057 merchants. 40,128 - 11.2% (vs. 4Q18) 38,873 35,818 35,595 + 14.2% (vs. 1Q18) In the first quarter of 2019, the volume of credit credit and debit card transactions decreased 11.2% - 10.2% (vs. 4Q18) 81,136 from the previous quarter due to the 70,376 72,877 65,915 + 15.0% (vs. 1Q18) 63,345 seasonality of the period. Compared to the debit same period of the previous year, it was up - 12.9% (vs. 4Q18) 1Q18 2Q18 3Q18 4Q18 1Q19 14.2%. + 12.7% (vs. 1Q18) Credit Card Transactions Volume Debit Card Transactions Volume Equipment Base 1Q19 thousands 1.3 million The launch of the Pop Credicard machine + 3.2% (vs. 4Q18) 1,267 family contributed to the increase of 3.2% in 1,228 1,115 1,137 1,112 + 13.6% (vs. 1Q18) the equipment base compared to 4Q18 and of 85% of the equipment 13.6% from 1Q18. is wireless 1Q18 2Q18 3Q18 4Q18 1Q19 Itaú Unibanco Holding S.A. 22
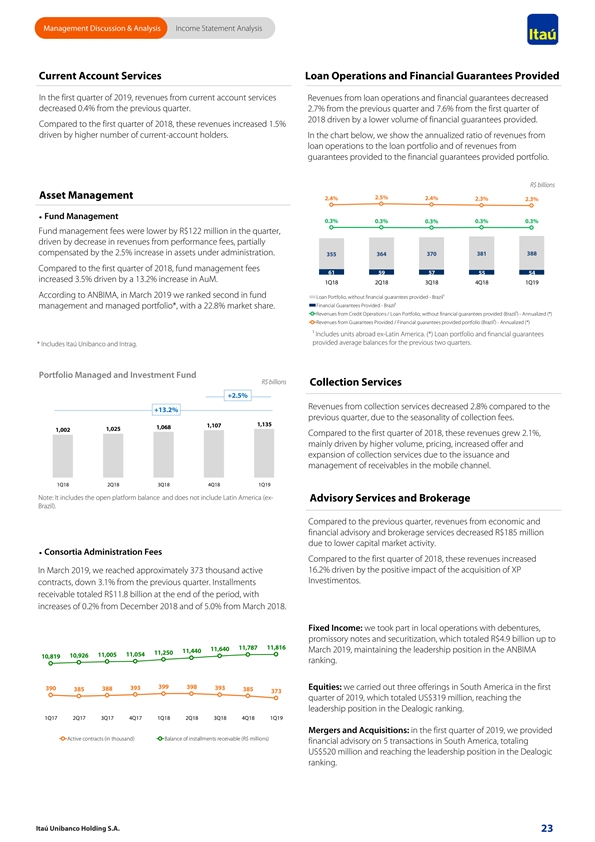
Management Discussion & Analysis Income Statement Analysis Current Account Services Loan Operations and Financial Guarantees Provided In the first quarter of 2019, revenues from current account services Revenues from loan operations and financial guarantees decreased decreased 0.4% from the previous quarter. 2.7% from the previous quarter and 7.6% from the first quarter of 2018 driven by a lower volume of financial guarantees provided. Compared to the first quarter of 2018, these revenues increased 1.5% driven by higher number of current-account holders. In the chart below, we show the annualized ratio of revenues from loan operations to the loan portfolio and of revenues from guarantees provided to the financial guarantees provided portfolio. R$ billions Asset Management 2.4% 2.5% 2.4% 2.3% 2.3% · Fund Management 0.3% 0.3% 0.3% 0.3% 0.3% Fund management fees were lower by R$122 million in the quarter, driven by decrease in revenues from performance fees, partially compensated by the 2.5% increase in assets under administration. 355 364 370 381 388 Compared to the first quarter of 2018, fund management fees 61 59 57 55 54 increased 3.5% driven by a 13.2% increase in AuM. 1Q18 2Q18 3Q18 4Q18 1Q19 According to ANBIMA, in March 2019 we ranked second in fund Loan Portfolio, without financial guarantees provided - Brazil¹ Financial Guarantees Provided - Brazil¹ management and managed portfolio*, with a 22.8% market share. Revenues from Credit Operations / Loan Portfolio, without financial guarantees provided (Brazil¹) - Annualized (*) Revenues from Guarantees Provided / Financial guarantees provided portfolio (Brazil¹) - Annualized (*) ¹ Includes units abroad ex-Latin America. (*) Loan portfolio and financial guarantees provided average balances for the previous two quarters. * Includes Itaú Unibanco and Intrag. Portfolio Managed and Investment Fund R$ billions Collection Services +2.5% Revenues from collection services decreased 2.8% compared to the +13.2% previous quarter, due to the seasonality of collection fees. 1,135 1,107 1,068 1,025 1,002 Compared to the first quarter of 2018, these revenues grew 2.1%, mainly driven by higher volume, pricing, increased offer and expansion of collection services due to the issuance and management of receivables in the mobile channel. 1Q18 2Q18 3Q18 4Q18 1Q19 Note: It includes the open platform balance and does not include Latin America (ex- Advisory Services and Brokerage Brazil). Compared to the previous quarter, revenues from economic and financial advisory and brokerage services decreased R$185 million due to lower capital market activity. · Consortia Administration Fees Compared to the first quarter of 2018, these revenues increased In March 2019, we reached approximately 373 thousand active 16.2% driven by the positive impact of the acquisition of XP Investimentos. contracts, down 3.1% from the previous quarter. Installments receivable totaled R$11.8 billion at the end of the period, with increases of 0.2% from December 2018 and of 5.0% from March 2018. Fixed Income: we took part in local operations with debentures, promissory notes and securitization, which totaled R$4.9 billion up to 11,787 11,816 11,640 11,440 March 2019, maintaining the leadership position in the ANBIMA 11,250 11,005 11,054 10,926 10,819 ranking. 399 398 390 393 393 Equities: we carried out three offerings in South America in the first 385 388 385 373 quarter of 2019, which totaled US$319 million, reaching the leadership position in the Dealogic ranking. 1Q17 2Q17 3Q17 4Q17 1Q18 2Q18 3Q18 4Q18 1Q19 Mergers and Acquisitions: in the first quarter of 2019, we provided Active contracts (in thousand) Balance of installments receivable (R$ millions) financial advisory on 5 transactions in South America, totaling US$520 million and reaching the leadership position in the Dealogic ranking. Itaú Unibanco Holding S.A. 23 Management Discussion & Analysis Income Statement Analysis Current Account Services Loan Operations and Financial Guarantees Provided In the first quarter of 2019, revenues from current account services Revenues from loan operations and financial guarantees decreased decreased 0.4% from the previous quarter. 2.7% from the previous quarter and 7.6% from the first quarter of 2018 driven by a lower volume of financial guarantees provided. Compared to the first quarter of 2018, these revenues increased 1.5% driven by higher number of current-account holders. In the chart below, we show the annualized ratio of revenues from loan operations to the loan portfolio and of revenues from guarantees provided to the financial guarantees provided portfolio. R$ billions Asset Management 2.4% 2.5% 2.4% 2.3% 2.3% · Fund Management 0.3% 0.3% 0.3% 0.3% 0.3% Fund management fees were lower by R$122 million in the quarter, driven by decrease in revenues from performance fees, partially compensated by the 2.5% increase in assets under administration. 355 364 370 381 388 Compared to the first quarter of 2018, fund management fees 61 59 57 55 54 increased 3.5% driven by a 13.2% increase in AuM. 1Q18 2Q18 3Q18 4Q18 1Q19 According to ANBIMA, in March 2019 we ranked second in fund Loan Portfolio, without financial guarantees provided - Brazil¹ Financial Guarantees Provided - Brazil¹ management and managed portfolio*, with a 22.8% market share. Revenues from Credit Operations / Loan Portfolio, without financial guarantees provided (Brazil¹) - Annualized (*) Revenues from Guarantees Provided / Financial guarantees provided portfolio (Brazil¹) - Annualized (*) ¹ Includes units abroad ex-Latin America. (*) Loan portfolio and financial guarantees provided average balances for the previous two quarters. * Includes Itaú Unibanco and Intrag. Portfolio Managed and Investment Fund R$ billions Collection Services +2.5% Revenues from collection services decreased 2.8% compared to the +13.2% previous quarter, due to the seasonality of collection fees. 1,135 1,107 1,068 1,025 1,002 Compared to the first quarter of 2018, these revenues grew 2.1%, mainly driven by higher volume, pricing, increased offer and expansion of collection services due to the issuance and management of receivables in the mobile channel. 1Q18 2Q18 3Q18 4Q18 1Q19 Note: It includes the open platform balance and does not include Latin America (ex- Advisory Services and Brokerage Brazil). Compared to the previous quarter, revenues from economic and financial advisory and brokerage services decreased R$185 million due to lower capital market activity. · Consortia Administration Fees Compared to the first quarter of 2018, these revenues increased In March 2019, we reached approximately 373 thousand active 16.2% driven by the positive impact of the acquisition of XP Investimentos. contracts, down 3.1% from the previous quarter. Installments receivable totaled R$11.8 billion at the end of the period, with increases of 0.2% from December 2018 and of 5.0% from March 2018. Fixed Income: we took part in local operations with debentures, promissory notes and securitization, which totaled R$4.9 billion up to 11,787 11,816 11,640 11,440 March 2019, maintaining the leadership position in the ANBIMA 11,250 11,005 11,054 10,926 10,819 ranking. 399 398 390 393 393 Equities: we carried out three offerings in South America in the first 385 388 385 373 quarter of 2019, which totaled US$319 million, reaching the leadership position in the Dealogic ranking. 1Q17 2Q17 3Q17 4Q17 1Q18 2Q18 3Q18 4Q18 1Q19 Mergers and Acquisitions: in the first quarter of 2019, we provided Active contracts (in thousand) Balance of installments receivable (R$ millions) financial advisory on 5 transactions in South America, totaling US$520 million and reaching the leadership position in the Dealogic ranking. Itaú Unibanco Holding S.A. 23
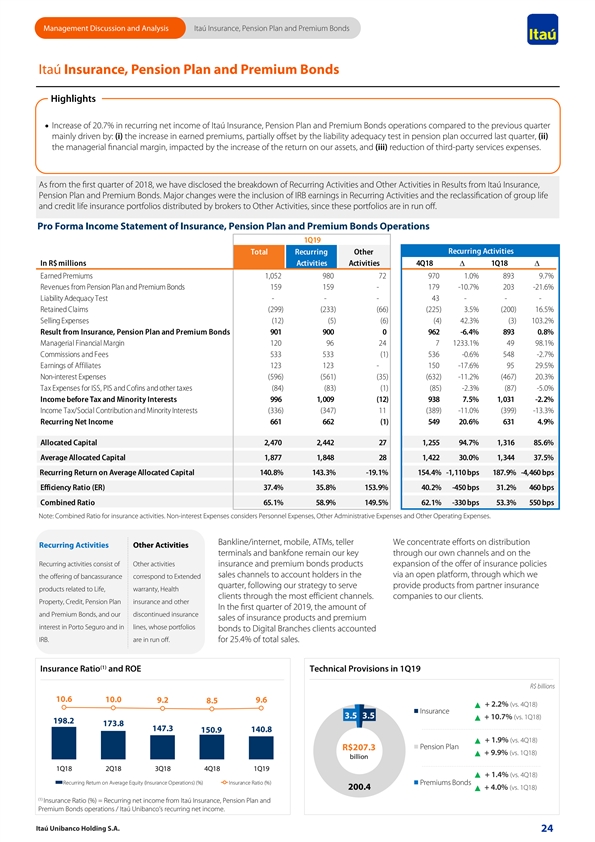
Management Discussion and Analysis Itaú Insurance, Pension Plan and Premium Bonds Itaú Insurance, Pension Plan and Premium Bonds Highlights · Increase of 20.7% in recurring net income of Itaú Insurance, Pension Plan and Premium Bonds operations compared to the previous quarter mainly driven by: (i) the increase in earned premiums, partially offset by the liability adequacy test in pension plan occurred last quarter, (ii) the managerial financial margin, impacted by the increase of the return on our assets, and (iii) reduction of third-party services expenses. As from the first quarter of 2018, we have disclosed the breakdown of Recurring Activities and Other Activities in Results from Itaú Insurance, Pension Plan and Premium Bonds. Major changes were the inclusion of IRB earnings in Recurring Activities and the reclassification of group life and credit life insurance portfolios distributed by brokers to Other Activities, since these portfolios are in run off. Pro Forma Income Statement of Insurance, Pension Plan and Premium Bonds Operations 1Q19 Recurring Activities Total Recurring Other In R$ millions Activities Activities 4Q18D 1Q18D Earned Premiums 1,052 9 80 72 970 1.0% 893 9.7% Revenues from Pension Plan and Premium Bonds 159 1 59 - 179 -10.7% 203 -21.6% Liability Adequacy Test - - - 43 - - - Retained Claims (299) (233) (66) (225) 3.5% (200) 16.5% Selling Expenses (12) (5) (6) (4) 42.3% (3) 103.2% Result from Insurance, Pension Plan and Premium Bonds 901 900 0 962 -6.4% 893 0.8% Managerial Financial Margin 120 96 24 7 1233.1% 49 98.1% Commissions and Fees 533 533 (1) 536 -0.6% 548 -2.7% Earnings of Affiliates 123 123 - 150 -17.6% 95 29.5% Non-interest Expenses (596) (561) (35) (632) -11.2% (467) 20.3% Tax Expenses for ISS, PIS and Cofins and other taxes (84) (83) (1) (85) -2.3% (87) -5.0% Income before Tax and Minority Interests 996 1,009 (12) 938 7.5% 1,031 -2.2% Income Tax/Social Contribution and Minority Interests (336) (347) 11 (389) -11.0% (399) -13.3% Recurring Net Income 661 6 62 (1) 549 20.6% 631 4.9% Allocated Capital 2,470 2,442 27 1,255 94.7% 1,316 85.6% Average Allocated Capital 1,877 1,848 28 1,422 30.0% 1,344 37.5% Recurring Return on Average Allocated Capital 140.8% 143.3% -19.1% 154.4% -1,110 bps 187.9% -4,460 bps Efficiency Ratio (ER) 37.4% 35.8% 153.9% 40.2% -450 bps 31.2% 460 bps Combined Ratio 65.1% 58.9% 149.5% 62.1% -330 bps 53.3% 550 bps Note: Combined Ratio for insurance activities. Non-interest Expenses considers Personnel Expenses, Other Administrative Expenses and Other Operating Expenses. Bankline/internet, mobile, ATMs, teller We concentrate efforts on distribution Recurring Activities Other Activities terminals and bankfone remain our key through our own channels and on the Recurring activities consist of Other activities insurance and premium bonds products expansion of the offer of insurance policies sales channels to account holders in the via an open platform, through which we the offering of bancassurance correspond to Extended quarter, following our strategy to serve provide products from partner insurance products related to Life, warranty, Health clients through the most efficient channels. companies to our clients. Property, Credit, Pension Plan insurance and other In the first quarter of 2019, the amount of and Premium Bonds, and our discontinued insurance sales of insurance products and premium interest in Porto Seguro and in lines, whose portfolios bonds to Digital Branches clients accounted IRB. are in run off. for 25.4% of total sales. (1) Insurance Ratio and ROE Technical Provisions in 1Q19 R$ billions 10.6 10.0 9.2 8.5 9.6 + 2.2% (vs. 4Q18) Insurance 3.5 3.5 + 10.7% (vs. 1Q18) 198.2 173.8 147.3 140.8 150.9 + 1.9% (vs. 4Q18) Pension Plan R$207.3 + 9.9% (vs. 1Q18) billion 1Q18 2Q18 3Q18 4Q18 1Q19 + 1.4% (vs. 4Q18) Recurring Return on Average Equity (Insurance Operations) (%) Insurance Ratio (%) Premiums Bonds 200.4 + 4.0% (vs. 1Q18) (1) Insurance Ratio (%) = Recurring net income from Itaú Insurance, Pension Plan and Premium Bonds operations / Itaú Unibanco’s recurring net income. Itaú Unibanco Holding S.A. 24 Management Discussion and Analysis Itaú Insurance, Pension Plan and Premium Bonds Itaú Insurance, Pension Plan and Premium Bonds Highlights · Increase of 20.7% in recurring net income of Itaú Insurance, Pension Plan and Premium Bonds operations compared to the previous quarter mainly driven by: (i) the increase in earned premiums, partially offset by the liability adequacy test in pension plan occurred last quarter, (ii) the managerial financial margin, impacted by the increase of the return on our assets, and (iii) reduction of third-party services expenses. As from the first quarter of 2018, we have disclosed the breakdown of Recurring Activities and Other Activities in Results from Itaú Insurance, Pension Plan and Premium Bonds. Major changes were the inclusion of IRB earnings in Recurring Activities and the reclassification of group life and credit life insurance portfolios distributed by brokers to Other Activities, since these portfolios are in run off. Pro Forma Income Statement of Insurance, Pension Plan and Premium Bonds Operations 1Q19 Recurring Activities Total Recurring Other In R$ millions Activities Activities 4Q18D 1Q18D Earned Premiums 1,052 9 80 72 970 1.0% 893 9.7% Revenues from Pension Plan and Premium Bonds 159 1 59 - 179 -10.7% 203 -21.6% Liability Adequacy Test - - - 43 - - - Retained Claims (299) (233) (66) (225) 3.5% (200) 16.5% Selling Expenses (12) (5) (6) (4) 42.3% (3) 103.2% Result from Insurance, Pension Plan and Premium Bonds 901 900 0 962 -6.4% 893 0.8% Managerial Financial Margin 120 96 24 7 1233.1% 49 98.1% Commissions and Fees 533 533 (1) 536 -0.6% 548 -2.7% Earnings of Affiliates 123 123 - 150 -17.6% 95 29.5% Non-interest Expenses (596) (561) (35) (632) -11.2% (467) 20.3% Tax Expenses for ISS, PIS and Cofins and other taxes (84) (83) (1) (85) -2.3% (87) -5.0% Income before Tax and Minority Interests 996 1,009 (12) 938 7.5% 1,031 -2.2% Income Tax/Social Contribution and Minority Interests (336) (347) 11 (389) -11.0% (399) -13.3% Recurring Net Income 661 6 62 (1) 549 20.6% 631 4.9% Allocated Capital 2,470 2,442 27 1,255 94.7% 1,316 85.6% Average Allocated Capital 1,877 1,848 28 1,422 30.0% 1,344 37.5% Recurring Return on Average Allocated Capital 140.8% 143.3% -19.1% 154.4% -1,110 bps 187.9% -4,460 bps Efficiency Ratio (ER) 37.4% 35.8% 153.9% 40.2% -450 bps 31.2% 460 bps Combined Ratio 65.1% 58.9% 149.5% 62.1% -330 bps 53.3% 550 bps Note: Combined Ratio for insurance activities. Non-interest Expenses considers Personnel Expenses, Other Administrative Expenses and Other Operating Expenses. Bankline/internet, mobile, ATMs, teller We concentrate efforts on distribution Recurring Activities Other Activities terminals and bankfone remain our key through our own channels and on the Recurring activities consist of Other activities insurance and premium bonds products expansion of the offer of insurance policies sales channels to account holders in the via an open platform, through which we the offering of bancassurance correspond to Extended quarter, following our strategy to serve provide products from partner insurance products related to Life, warranty, Health clients through the most efficient channels. companies to our clients. Property, Credit, Pension Plan insurance and other In the first quarter of 2019, the amount of and Premium Bonds, and our discontinued insurance sales of insurance products and premium interest in Porto Seguro and in lines, whose portfolios bonds to Digital Branches clients accounted IRB. are in run off. for 25.4% of total sales. (1) Insurance Ratio and ROE Technical Provisions in 1Q19 R$ billions 10.6 10.0 9.2 8.5 9.6 + 2.2% (vs. 4Q18) Insurance 3.5 3.5 + 10.7% (vs. 1Q18) 198.2 173.8 147.3 140.8 150.9 + 1.9% (vs. 4Q18) Pension Plan R$207.3 + 9.9% (vs. 1Q18) billion 1Q18 2Q18 3Q18 4Q18 1Q19 + 1.4% (vs. 4Q18) Recurring Return on Average Equity (Insurance Operations) (%) Insurance Ratio (%) Premiums Bonds 200.4 + 4.0% (vs. 1Q18) (1) Insurance Ratio (%) = Recurring net income from Itaú Insurance, Pension Plan and Premium Bonds operations / Itaú Unibanco’s recurring net income. Itaú Unibanco Holding S.A. 24
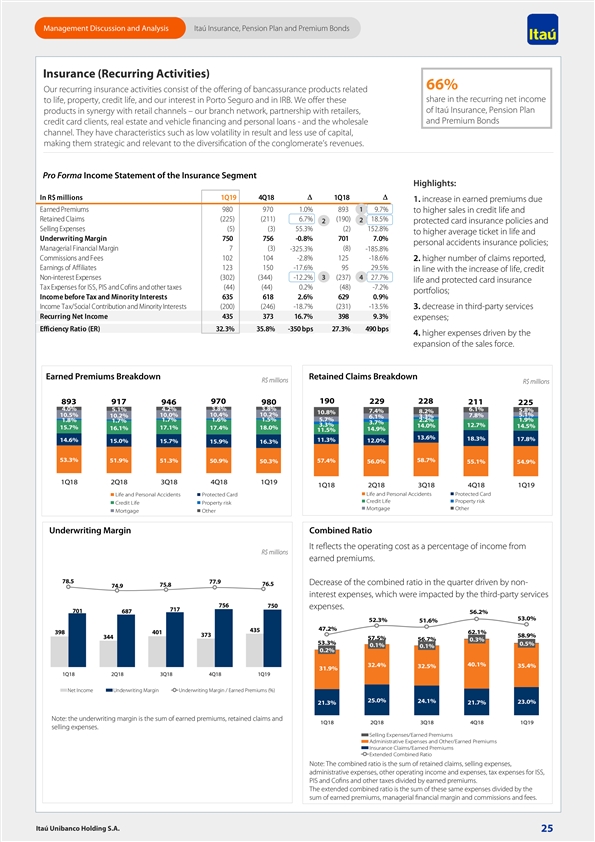
Management Discussion and Analysis Itaú Insurance, Pension Plan and Premium Bonds Insurance (Recurring Activities) 66% Our recurring insurance activities consist of the offering of bancassurance products related share in the recurring net income to life, property, credit life, and our interest in Porto Seguro and in IRB. We offer these of Itaú Insurance, Pension Plan products in synergy with retail channels – our branch network, partnership with retailers, and Premium Bonds credit card clients, real estate and vehicle financing and personal loans - and the wholesale channel. They have characteristics such as low volatility in result and less use of capital, making them strategic and relevant to the diversification of the conglomerate’s revenues. Pro Forma Income Statement of the Insurance Segment Highlights: In R$ millions 1Q19 4Q18 1Q D 18 D 1. increase in earned premiums due Earned Premiums 980 970 1.0% 893 1 9.7% to higher sales in credit life and Retained Claims (225) (211) 6.7% (190) 2 18.5% 2 protected card insurance policies and Selling Expenses (5) (3) 55.3% (2) 152.8% to higher average ticket in life and Underwriting Margin 750 756 -0.8% 701 7.0% personal accidents insurance policies; Managerial Financial Margin 7 (3) -325.3% (8) -185.8% Commissions and Fees 1 02 104 -2.8% 125 -18.6% 2. higher number of claims reported, Earnings of Affiliates 123 150 -17.6% 95 29.5% in line with the increase of life, credit Non-interest Expenses (302) (344) -12.2% 3 (237) 4 27.7% life and protected card insurance Tax Expenses for ISS, PIS and Cofins and other taxes (44) (44) 0.2% (48) -7.2% portfolios; Income before Tax and Minority Interests 635 618 2.6% 629 0.9% Income Tax/Social Contribution and Minority Interests (200) (246) -18.7% (231) -13.5% 3. decrease in third-party services Recurring Net Income 435 373 16.7% 398 9.3% expenses; Efficiency Ratio (ER) 32.3% 35.8% -350 bps 27.3% 490 bps 4. higher expenses driven by the expansion of the sales force. Retained Claims Breakdown Earned Premiums Breakdown R$ millions R$ millions 893 917 970 190 229 228 946 980 211 225 4.0% 5.1% 4.2% 3.8% 3.8% 6.1% 5.8% 7.4% 8.2% 10.8% 10.5% 10.0% 10.4% 10.2% 7.8% 5.1% 10.2% 3.3% 6.1% 1.8% 1.7% 1.6% 1.5% 5.7% 2.2% 1.9% 1.7% 3.7% 3.3% 12.7% 14.0% 14.5% 15.7% 16.1% 17.1% 17.4% 18.0% 14.9% 11.5% 13.6% 18.3% 17.8% 14.6% 11.3% 15.0% 15.7% 12.0% 15.9% 16.3% 53.3% 58.7% 51.9% 51.3% 50.9% 50.3% 57.4% 56.0% 55.1% 54.9% 1Q18 2Q18 3Q18 4Q18 1Q19 1Q18 2Q18 3Q18 4Q18 1Q19 Life and Personal Accidents Protected Card Life and Personal Accidents Protected Card Credit Life Property risk Credit Life Property risk Mortgage Other Mortgage Other Underwriting Margin Combined Ratio It reflects the operating cost as a percentage of income from R$ millions earned premiums. 78.5 77.9 Decrease of the combined ratio in the quarter driven by non- 76.5 75.8 74.9 interest expenses, which were impacted by the third-party services 756 750 expenses. 717 701 687 56.2% 53.0% 52.3% 51.6% 47.2% 435 398 401 62.1% 373 58.9% 344 57.5% 56.7% 0.3% 53.3% 0.5% 0.1% 0.1% 0.2% 40.1% 32.4% 32.5% 35.4% 31.9% 1Q18 2Q18 3Q18 4Q18 1Q19 Net Income Underwriting Margin Underwriting Margin / Earned Premiums (%) 25.0% 24.1% 23.0% 21.3% 21.7% Note: the underwriting margin is the sum of earned premiums, retained claims and 1Q18 2Q18 3Q18 4Q18 1Q19 selling expenses. Selling Expenses/Earned Premiums Administrative Expenses and Other/Earned Premiums Insurance Claims/Earned Premiums Extended Combined Ratio Note: The combined ratio is the sum of retained claims, selling expenses, administrative expenses, other operating income and expenses, tax expenses for ISS, PIS and Cofins and other taxes divided by earned premiums. The extended combined ratio is the sum of these same expenses divided by the sum of earned premiums, managerial financial margin and commissions and fees. Itaú Unibanco Holding S.A. 25 Management Discussion and Analysis Itaú Insurance, Pension Plan and Premium Bonds Insurance (Recurring Activities) 66% Our recurring insurance activities consist of the offering of bancassurance products related share in the recurring net income to life, property, credit life, and our interest in Porto Seguro and in IRB. We offer these of Itaú Insurance, Pension Plan products in synergy with retail channels – our branch network, partnership with retailers, and Premium Bonds credit card clients, real estate and vehicle financing and personal loans - and the wholesale channel. They have characteristics such as low volatility in result and less use of capital, making them strategic and relevant to the diversification of the conglomerate’s revenues. Pro Forma Income Statement of the Insurance Segment Highlights: In R$ millions 1Q19 4Q18 1Q D 18 D 1. increase in earned premiums due Earned Premiums 980 970 1.0% 893 1 9.7% to higher sales in credit life and Retained Claims (225) (211) 6.7% (190) 2 18.5% 2 protected card insurance policies and Selling Expenses (5) (3) 55.3% (2) 152.8% to higher average ticket in life and Underwriting Margin 750 756 -0.8% 701 7.0% personal accidents insurance policies; Managerial Financial Margin 7 (3) -325.3% (8) -185.8% Commissions and Fees 1 02 104 -2.8% 125 -18.6% 2. higher number of claims reported, Earnings of Affiliates 123 150 -17.6% 95 29.5% in line with the increase of life, credit Non-interest Expenses (302) (344) -12.2% 3 (237) 4 27.7% life and protected card insurance Tax Expenses for ISS, PIS and Cofins and other taxes (44) (44) 0.2% (48) -7.2% portfolios; Income before Tax and Minority Interests 635 618 2.6% 629 0.9% Income Tax/Social Contribution and Minority Interests (200) (246) -18.7% (231) -13.5% 3. decrease in third-party services Recurring Net Income 435 373 16.7% 398 9.3% expenses; Efficiency Ratio (ER) 32.3% 35.8% -350 bps 27.3% 490 bps 4. higher expenses driven by the expansion of the sales force. Retained Claims Breakdown Earned Premiums Breakdown R$ millions R$ millions 893 917 970 190 229 228 946 980 211 225 4.0% 5.1% 4.2% 3.8% 3.8% 6.1% 5.8% 7.4% 8.2% 10.8% 10.5% 10.0% 10.4% 10.2% 7.8% 5.1% 10.2% 3.3% 6.1% 1.8% 1.7% 1.6% 1.5% 5.7% 2.2% 1.9% 1.7% 3.7% 3.3% 12.7% 14.0% 14.5% 15.7% 16.1% 17.1% 17.4% 18.0% 14.9% 11.5% 13.6% 18.3% 17.8% 14.6% 11.3% 15.0% 15.7% 12.0% 15.9% 16.3% 53.3% 58.7% 51.9% 51.3% 50.9% 50.3% 57.4% 56.0% 55.1% 54.9% 1Q18 2Q18 3Q18 4Q18 1Q19 1Q18 2Q18 3Q18 4Q18 1Q19 Life and Personal Accidents Protected Card Life and Personal Accidents Protected Card Credit Life Property risk Credit Life Property risk Mortgage Other Mortgage Other Underwriting Margin Combined Ratio It reflects the operating cost as a percentage of income from R$ millions earned premiums. 78.5 77.9 Decrease of the combined ratio in the quarter driven by non- 76.5 75.8 74.9 interest expenses, which were impacted by the third-party services 756 750 expenses. 717 701 687 56.2% 53.0% 52.3% 51.6% 47.2% 435 398 401 62.1% 373 58.9% 344 57.5% 56.7% 0.3% 53.3% 0.5% 0.1% 0.1% 0.2% 40.1% 32.4% 32.5% 35.4% 31.9% 1Q18 2Q18 3Q18 4Q18 1Q19 Net Income Underwriting Margin Underwriting Margin / Earned Premiums (%) 25.0% 24.1% 23.0% 21.3% 21.7% Note: the underwriting margin is the sum of earned premiums, retained claims and 1Q18 2Q18 3Q18 4Q18 1Q19 selling expenses. Selling Expenses/Earned Premiums Administrative Expenses and Other/Earned Premiums Insurance Claims/Earned Premiums Extended Combined Ratio Note: The combined ratio is the sum of retained claims, selling expenses, administrative expenses, other operating income and expenses, tax expenses for ISS, PIS and Cofins and other taxes divided by earned premiums. The extended combined ratio is the sum of these same expenses divided by the sum of earned premiums, managerial financial margin and commissions and fees. Itaú Unibanco Holding S.A. 25
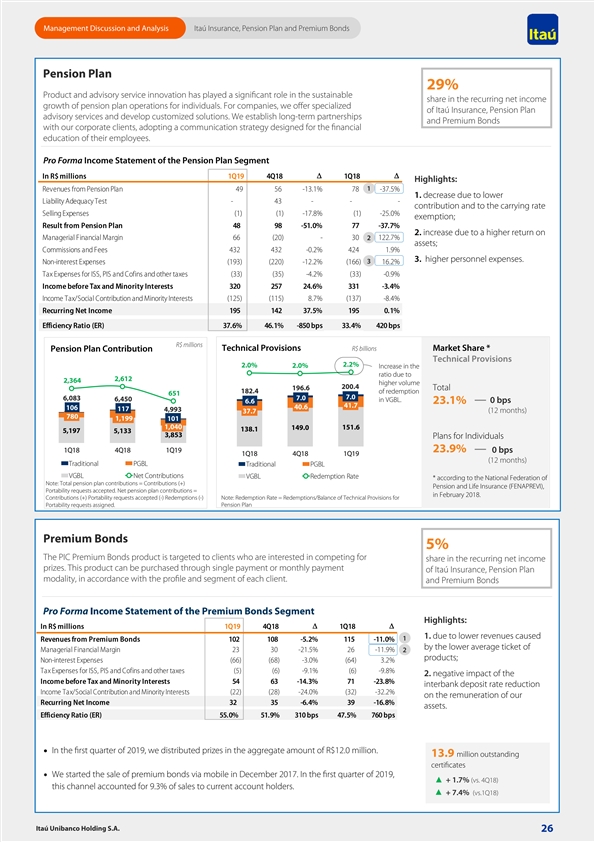
Management Discussion and Analysis Itaú Insurance, Pension Plan and Premium Bonds Pension Plan 29% Product and advisory service innovation has played a significant role in the sustainable share in the recurring net income growth of pension plan operations for individuals. For companies, we offer specialized of Itaú Insurance, Pension Plan advisory services and develop customized solutions. We establish long-term partnerships and Premium Bonds with our corporate clients, adopting a communication strategy designed for the financial education of their employees. Pro Forma Income Statement of the Pension Plan Segment D D In R$ millions 1Q19 4Q18 1Q18 Highlights: 1 Revenues from Pension Plan 49 56 -13.1% 78 -37.5% 1. decrease due to lower Liability Adequacy Test - 43 - - - contribution and to the carrying rate Selling Expenses (1) (1) -17.8% (1) -25.0% exemption; Result from Pension Plan 48 98 -51.0% 77 -37.7% 2. increase due to a higher return on Managerial Financial Margin 66 (20) - 30 2 122.7% assets; Commissions and Fees 432 432 -0.2% 424 1.9% 3. higher personnel expenses. Non-interest Expenses (193) (220) -12.2% (166) 3 16.2% Tax Expenses for ISS, PIS and Cofins and other taxes (33) (35) -4.2% (33) -0.9% Income before Tax and Minority Interests 320 257 24.6% 3 31 -3.4% Income Tax/Social Contribution and Minority Interests (125) (115) 8.7% (137) -8.4% Recurring Net Income 195 142 37.5% 1 95 0.1% Efficiency Ratio (ER) 37.6% 46.1% -850 bps 33.4% 420 bps R$ millions Technical Provisions R$ billions Market Share * Pension Plan Contribution Technical Provisions 2.2% 2.0% 2.0% Increase in the ratio due to 2,612 2,364 higher volume 200.4 196.6 Total 182.4 of redemption 651 7.0 7.0 6,083 6,450 in VGBL. 0 bps 6.6 23.1% 41.7 40.6 106 117 4,993 (12 months) 37.7 780 1,199 101 1,040 149.0 151.6 138.1 5,197 5,133 3,853 Plans for Individuals 23.9% 1Q18 4Q18 1Q19 0 bps 1Q18 4Q18 1Q19 (12 months) Traditional PGBL Traditional PGBL VGBL Net Contributions VGBL Redemption Rate * according to the National Federation of Note: Total pension plan contributions = Contributions (+) Pension and Life Insurance (FENAPREVI), Portability requests accepted. Net pension plan contributions = in February 2018. Contributions (+) Portability requests accepted (-) Redemptions (-) Note: Redemption Rate = Redemptions/Balance of Technical Provisions for Portability requests assigned. Pension Plan Premium Bonds 5% The PIC Premium Bonds product is targeted to clients who are interested in competing for share in the recurring net income prizes. This product can be purchased through single payment or monthly payment of Itaú Insurance, Pension Plan modality, in accordance with the profile and segment of each client. and Premium Bonds Pro Forma Income Statement of the Premium Bonds Segment Highlights: In R$ millions 1Q19 4Q18 1Q D 18 D 1. due to lower revenues caused 1 Revenues from Premium Bonds 102 108 -5.2% 115 -11.0% by the lower average ticket of Managerial Financial Margin 23 30 -21.5% 26 -11.9% 2 products; Non-interest Expenses (66) (68) -3.0% (64) 3.2% Tax Expenses for ISS, PIS and Cofins and other taxes (5) (6) -9.1% (6) -9.8% 2. negative impact of the Income before Tax and Minority Interests 54 63 -14.3% 71 -23.8% interbank deposit rate reduction Income Tax/Social Contribution and Minority Interests (22) (28) -24.0% (32) -32.2% on the remuneration of our Recurring Net Income 32 35 -6.4% 39 -16.8% assets. Efficiency Ratio (ER) 55.0% 51.9% 310 bps 47.5% 760 bps · In the first quarter of 2019, we distributed prizes in the aggregate amount of R$12.0 million. 13.9 million outstanding certificates · We started the sale of premium bonds via mobile in December 2017. In the first quarter of 2019, + 1.7% (vs. 4Q18) this channel accounted for 9.3% of sales to current account holders. + 7.4% (vs.1Q18) Itaú Unibanco Holding S.A. 26 Management Discussion and Analysis Itaú Insurance, Pension Plan and Premium Bonds Pension Plan 29% Product and advisory service innovation has played a significant role in the sustainable share in the recurring net income growth of pension plan operations for individuals. For companies, we offer specialized of Itaú Insurance, Pension Plan advisory services and develop customized solutions. We establish long-term partnerships and Premium Bonds with our corporate clients, adopting a communication strategy designed for the financial education of their employees. Pro Forma Income Statement of the Pension Plan Segment D D In R$ millions 1Q19 4Q18 1Q18 Highlights: 1 Revenues from Pension Plan 49 56 -13.1% 78 -37.5% 1. decrease due to lower Liability Adequacy Test - 43 - - - contribution and to the carrying rate Selling Expenses (1) (1) -17.8% (1) -25.0% exemption; Result from Pension Plan 48 98 -51.0% 77 -37.7% 2. increase due to a higher return on Managerial Financial Margin 66 (20) - 30 2 122.7% assets; Commissions and Fees 432 432 -0.2% 424 1.9% 3. higher personnel expenses. Non-interest Expenses (193) (220) -12.2% (166) 3 16.2% Tax Expenses for ISS, PIS and Cofins and other taxes (33) (35) -4.2% (33) -0.9% Income before Tax and Minority Interests 320 257 24.6% 3 31 -3.4% Income Tax/Social Contribution and Minority Interests (125) (115) 8.7% (137) -8.4% Recurring Net Income 195 142 37.5% 1 95 0.1% Efficiency Ratio (ER) 37.6% 46.1% -850 bps 33.4% 420 bps R$ millions Technical Provisions R$ billions Market Share * Pension Plan Contribution Technical Provisions 2.2% 2.0% 2.0% Increase in the ratio due to 2,612 2,364 higher volume 200.4 196.6 Total 182.4 of redemption 651 7.0 7.0 6,083 6,450 in VGBL. 0 bps 6.6 23.1% 41.7 40.6 106 117 4,993 (12 months) 37.7 780 1,199 101 1,040 149.0 151.6 138.1 5,197 5,133 3,853 Plans for Individuals 23.9% 1Q18 4Q18 1Q19 0 bps 1Q18 4Q18 1Q19 (12 months) Traditional PGBL Traditional PGBL VGBL Net Contributions VGBL Redemption Rate * according to the National Federation of Note: Total pension plan contributions = Contributions (+) Pension and Life Insurance (FENAPREVI), Portability requests accepted. Net pension plan contributions = in February 2018. Contributions (+) Portability requests accepted (-) Redemptions (-) Note: Redemption Rate = Redemptions/Balance of Technical Provisions for Portability requests assigned. Pension Plan Premium Bonds 5% The PIC Premium Bonds product is targeted to clients who are interested in competing for share in the recurring net income prizes. This product can be purchased through single payment or monthly payment of Itaú Insurance, Pension Plan modality, in accordance with the profile and segment of each client. and Premium Bonds Pro Forma Income Statement of the Premium Bonds Segment Highlights: In R$ millions 1Q19 4Q18 1Q D 18 D 1. due to lower revenues caused 1 Revenues from Premium Bonds 102 108 -5.2% 115 -11.0% by the lower average ticket of Managerial Financial Margin 23 30 -21.5% 26 -11.9% 2 products; Non-interest Expenses (66) (68) -3.0% (64) 3.2% Tax Expenses for ISS, PIS and Cofins and other taxes (5) (6) -9.1% (6) -9.8% 2. negative impact of the Income before Tax and Minority Interests 54 63 -14.3% 71 -23.8% interbank deposit rate reduction Income Tax/Social Contribution and Minority Interests (22) (28) -24.0% (32) -32.2% on the remuneration of our Recurring Net Income 32 35 -6.4% 39 -16.8% assets. Efficiency Ratio (ER) 55.0% 51.9% 310 bps 47.5% 760 bps · In the first quarter of 2019, we distributed prizes in the aggregate amount of R$12.0 million. 13.9 million outstanding certificates · We started the sale of premium bonds via mobile in December 2017. In the first quarter of 2019, + 1.7% (vs. 4Q18) this channel accounted for 9.3% of sales to current account holders. + 7.4% (vs.1Q18) Itaú Unibanco Holding S.A. 26
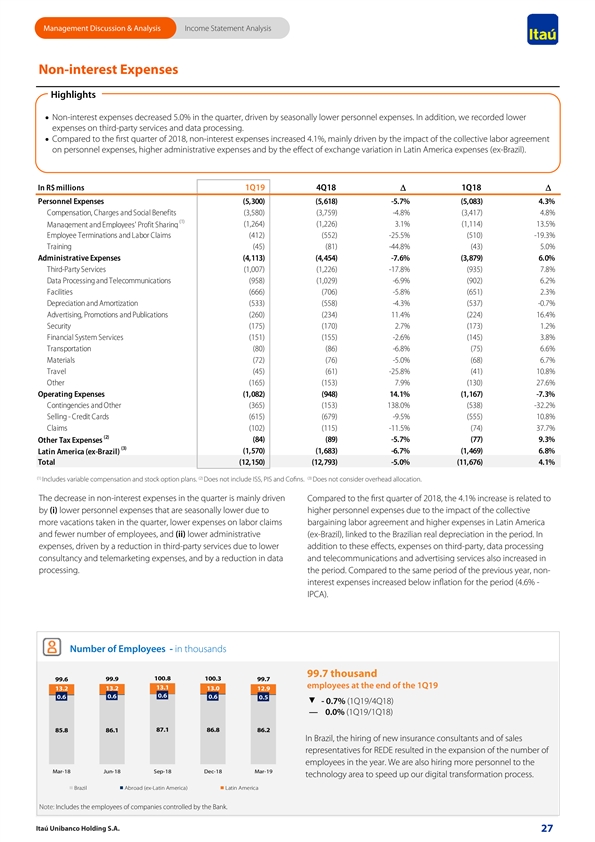
Management Discussion & Analysis Income Statement Analysis Non-interest Expenses Highlights · Non-interest expenses decreased 5.0% in the quarter, driven by seasonally lower personnel expenses. In addition, we recorded lower expenses on third-party services and data processing. · Compared to the first quarter of 2018, non-interest expenses increased 4.1%, mainly driven by the impact of the collective labor agreement on personnel expenses, higher administrative expenses and by the effect of exchange variation in Latin America expenses (ex-Brazil). 1Q19 4Q18 1Q18 In R$ millions D D Personnel Expenses (5,300) (5,618) -5.7% ( 5,083) 4.3% Compensation, Charges and Social Benefits (3,580) (3,759) -4.8% (3,417) 4.8% (1) Management and Employees' Profit Sharing (1,264) (1,226) 3.1% (1,114) 13.5% Employee Terminations and Labor Claims (412) (552) -25.5% (510) -19.3% Training (45) (81) -44.8% (43) 5.0% Administrative Expenses (4,113) (4,454) -7.6% ( 3,879) 6.0% Third-Party Services (1,007) (1,226) -17.8% (935) 7.8% Data Processing and Telecommunications (958) (1,029) -6.9% (902) 6.2% Facilities (666) (706) -5.8% (651) 2.3% Depreciation and Amortization (533) (558) -4.3% (537) -0.7% Advertising, Promotions and Publications (260) (234) 11.4% (224) 16.4% Security (175) (170) 2.7% (173) 1.2% Financial System Services (151) (155) -2.6% (145) 3.8% Transportation (80) (86) -6.8% (75) 6.6% Materials (72) (76) -5.0% (68) 6.7% Travel (45) (61) -25.8% (41) 10.8% Other (165) (153) 7.9% (130) 27.6% Operating Expenses (1,082) (948) 14.1% ( 1,167) -7.3% Contingencies and Other (365) (153) 138.0% (538) -32.2% Selling - Credit Cards (615) (679) -9.5% (555) 10.8% Claims (102) (115) -11.5% (74) 37.7% (2) (84) (89) -5.7% (77) 9.3% Other Tax Expenses (3) (1,570) (1,683) -6.7% ( 1,469) 6.8% Latin America (ex-Brazil) Total (12,150) (12,793) -5.0% (11,676) 4.1% (1) (2) (3) Includes variable compensation and stock option plans. Does not include ISS, PIS and Cofins. Does not consider overhead allocation. The decrease in non-interest expenses in the quarter is mainly driven Compared to the first quarter of 2018, the 4.1% increase is related to by (i) lower personnel expenses that are seasonally lower due to higher personnel expenses due to the impact of the collective more vacations taken in the quarter, lower expenses on labor claims bargaining labor agreement and higher expenses in Latin America and fewer number of employees, and (ii) lower administrative (ex-Brazil), linked to the Brazilian real depreciation in the period. In expenses, driven by a reduction in third-party services due to lower addition to these effects, expenses on third-party, data processing consultancy and telemarketing expenses, and by a reduction in data and telecommunications and advertising services also increased in processing. the period. Compared to the same period of the previous year, non- interest expenses increased below inflation for the period (4.6% - IPCA). Number of Employees - in thousands 99.7 thousand 100.8 99.6 99.9 100.3 99.7 employees at the end of the 1Q19 13.1 13.2 13.0 13.2 12.9 0.6 0.6 0.6 0.6 0.5 - 0.7% (1Q19/4Q18) — 0.0% (1Q19/1Q18) 85.8 86.1 87.1 86.8 86.2 In Brazil, the hiring of new insurance consultants and of sales representatives for REDE resulted in the expansion of the number of employees in the year. We are also hiring more personnel to the Mar-18 Jun-18 Sep-18 Dec-18 Mar-19 technology area to speed up our digital transformation process. Brazil Abroad (ex-Latin America) Latin America Note: Includes the employees of companies controlled by the Bank. Itaú Unibanco Holding S.A. 27 Management Discussion & Analysis Income Statement Analysis Non-interest Expenses Highlights · Non-interest expenses decreased 5.0% in the quarter, driven by seasonally lower personnel expenses. In addition, we recorded lower expenses on third-party services and data processing. · Compared to the first quarter of 2018, non-interest expenses increased 4.1%, mainly driven by the impact of the collective labor agreement on personnel expenses, higher administrative expenses and by the effect of exchange variation in Latin America expenses (ex-Brazil). 1Q19 4Q18 1Q18 In R$ millions D D Personnel Expenses (5,300) (5,618) -5.7% ( 5,083) 4.3% Compensation, Charges and Social Benefits (3,580) (3,759) -4.8% (3,417) 4.8% (1) Management and Employees' Profit Sharing (1,264) (1,226) 3.1% (1,114) 13.5% Employee Terminations and Labor Claims (412) (552) -25.5% (510) -19.3% Training (45) (81) -44.8% (43) 5.0% Administrative Expenses (4,113) (4,454) -7.6% ( 3,879) 6.0% Third-Party Services (1,007) (1,226) -17.8% (935) 7.8% Data Processing and Telecommunications (958) (1,029) -6.9% (902) 6.2% Facilities (666) (706) -5.8% (651) 2.3% Depreciation and Amortization (533) (558) -4.3% (537) -0.7% Advertising, Promotions and Publications (260) (234) 11.4% (224) 16.4% Security (175) (170) 2.7% (173) 1.2% Financial System Services (151) (155) -2.6% (145) 3.8% Transportation (80) (86) -6.8% (75) 6.6% Materials (72) (76) -5.0% (68) 6.7% Travel (45) (61) -25.8% (41) 10.8% Other (165) (153) 7.9% (130) 27.6% Operating Expenses (1,082) (948) 14.1% ( 1,167) -7.3% Contingencies and Other (365) (153) 138.0% (538) -32.2% Selling - Credit Cards (615) (679) -9.5% (555) 10.8% Claims (102) (115) -11.5% (74) 37.7% (2) (84) (89) -5.7% (77) 9.3% Other Tax Expenses (3) (1,570) (1,683) -6.7% ( 1,469) 6.8% Latin America (ex-Brazil) Total (12,150) (12,793) -5.0% (11,676) 4.1% (1) (2) (3) Includes variable compensation and stock option plans. Does not include ISS, PIS and Cofins. Does not consider overhead allocation. The decrease in non-interest expenses in the quarter is mainly driven Compared to the first quarter of 2018, the 4.1% increase is related to by (i) lower personnel expenses that are seasonally lower due to higher personnel expenses due to the impact of the collective more vacations taken in the quarter, lower expenses on labor claims bargaining labor agreement and higher expenses in Latin America and fewer number of employees, and (ii) lower administrative (ex-Brazil), linked to the Brazilian real depreciation in the period. In expenses, driven by a reduction in third-party services due to lower addition to these effects, expenses on third-party, data processing consultancy and telemarketing expenses, and by a reduction in data and telecommunications and advertising services also increased in processing. the period. Compared to the same period of the previous year, non- interest expenses increased below inflation for the period (4.6% - IPCA). Number of Employees - in thousands 99.7 thousand 100.8 99.6 99.9 100.3 99.7 employees at the end of the 1Q19 13.1 13.2 13.0 13.2 12.9 0.6 0.6 0.6 0.6 0.5 - 0.7% (1Q19/4Q18) — 0.0% (1Q19/1Q18) 85.8 86.1 87.1 86.8 86.2 In Brazil, the hiring of new insurance consultants and of sales representatives for REDE resulted in the expansion of the number of employees in the year. We are also hiring more personnel to the Mar-18 Jun-18 Sep-18 Dec-18 Mar-19 technology area to speed up our digital transformation process. Brazil Abroad (ex-Latin America) Latin America Note: Includes the employees of companies controlled by the Bank. Itaú Unibanco Holding S.A. 27
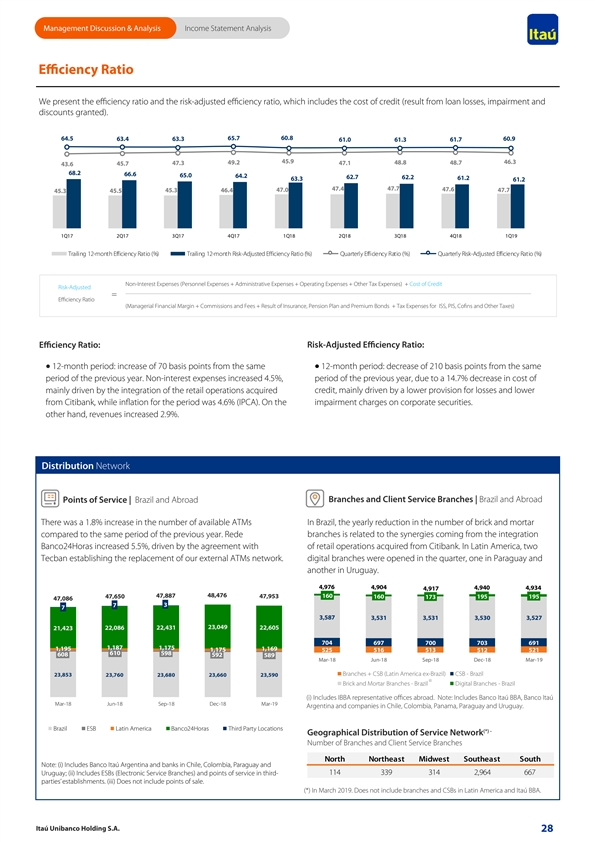
Management Discussion & Analysis Income Statement Analysis Efficiency Ratio We present the efficiency ratio and the risk-adjusted efficiency ratio, which includes the cost of credit (result from loan losses, impairment and discounts granted). 65.7 60.8 64.5 63.4 63.3 60.9 61.0 61.3 61.7 45.9 46.3 47.3 49.2 47.1 48.8 48.7 43.6 45.7 68.2 66.6 65.0 64.2 62.7 62.2 61.2 63.3 61.2 47.4 47.7 47.6 45.3 46.4 47.0 47.7 45.3 45.5 1Q17 2Q17 3Q17 4Q17 1Q18 2Q18 3Q18 4Q18 1Q19 Trailing 12-month Efficiency Ratio (%) Trailing 12-month Risk-Adjusted Efficiency Ratio (%) Quarterly Efficiency Ratio (%) Quarterly Risk-Adjusted Efficiency Ratio (%) Non-Interest Expenses (Personnel Expenses + Administrative Expenses + Operating Expenses + Other Tax Expenses) + Cost of Credit Risk-Adjusted = Efficiency Ratio (Managerial Financial Margin + Commissions and Fees + Result of Insurance, Pension Plan and Premium Bonds + Tax Expenses for ISS, PIS, Cofins and Other Taxes) Efficiency Ratio: Risk-Adjusted Eciency ffi Ratio: · 12-month period: increase of 70 basis points from the same · 12-month period: decrease of 210 basis points from the same period of the previous year. Non-interest expenses increased 4.5%, period of the previous year, due to a 14.7% decrease in cost of mainly driven by the integration of the retail operations acquired credit, mainly driven by a lower provision for losses and lower from Citibank, while inflation for the period was 4.6% (IPCA). On the impairment charges on corporate securities. other hand, revenues increased 2.9%. Distribution Network Branches and Client Service Branches | Brazil and Abroad Points of Service | Brazil and Abroad There was a 1.8% increase in the number of available ATMs In Brazil, the yearly reduction in the number of brick and mortar compared to the same period of the previous year. Rede branches is related to the synergies coming from the integration Banco24Horas increased 5.5%, driven by the agreement with of retail operations acquired from Citibank. In Latin America, two Tecban establishing the replacement of our external ATMs network. digital branches were opened in the quarter, one in Paraguay and another in Uruguay. 4,976 4,904 4,940 4,934 4,917 48,476 47,887 47,953 160 47,650 160 173 195 195 47,086 7 3 7 3,587 3,531 3,531 3,530 3,527 23,049 21,423 22,086 22,431 22,605 704 697 700 703 691 1,187 1,175 1,195 1,169 1,175 525 516 513 512 521 610 598 608 592 589 Mar-18 Jun-18 Sep-18 Dec-18 Mar-19 Branches + CSB (Latin America ex-Brazil) CSB - Brazil 23,853 23,760 23,680 23,660 23,590 (i) Brick and Mortar Branches - Brazil Digital Branches - Brazil (i) Includes IBBA representative offices abroad. Note: Includes Banco Itaú BBA, Banco Itaú Mar-18 Jun-18 Sep-18 Dec-18 Mar-19 Argentina and companies in Chile, Colombia, Panama, Paraguay and Uruguay. Brazil ESB Latin America Banco24Horas Third Party Locations (*) - Geographical Distribution of Service Network Number of Branches and Client Service Branches North Northeast Midwest Southeast South Note: (i) Includes Banco Itaú Argentina and banks in Chile, Colombia, Paraguay and Uruguay; (ii) Includes ESBs (Electronic Service Branches) and points of service in third- 114 339 314 2,964 667 parties’ establishments. (iii) Does not include points of sale. (*) In March 2019. Does not include branches and CSBs in Latin America and Itaú BBA. Itaú Unibanco Holding S.A. 28 Management Discussion & Analysis Income Statement Analysis Efficiency Ratio We present the efficiency ratio and the risk-adjusted efficiency ratio, which includes the cost of credit (result from loan losses, impairment and discounts granted). 65.7 60.8 64.5 63.4 63.3 60.9 61.0 61.3 61.7 45.9 46.3 47.3 49.2 47.1 48.8 48.7 43.6 45.7 68.2 66.6 65.0 64.2 62.7 62.2 61.2 63.3 61.2 47.4 47.7 47.6 45.3 46.4 47.0 47.7 45.3 45.5 1Q17 2Q17 3Q17 4Q17 1Q18 2Q18 3Q18 4Q18 1Q19 Trailing 12-month Efficiency Ratio (%) Trailing 12-month Risk-Adjusted Efficiency Ratio (%) Quarterly Efficiency Ratio (%) Quarterly Risk-Adjusted Efficiency Ratio (%) Non-Interest Expenses (Personnel Expenses + Administrative Expenses + Operating Expenses + Other Tax Expenses) + Cost of Credit Risk-Adjusted = Efficiency Ratio (Managerial Financial Margin + Commissions and Fees + Result of Insurance, Pension Plan and Premium Bonds + Tax Expenses for ISS, PIS, Cofins and Other Taxes) Efficiency Ratio: Risk-Adjusted Eciency ffi Ratio: · 12-month period: increase of 70 basis points from the same · 12-month period: decrease of 210 basis points from the same period of the previous year. Non-interest expenses increased 4.5%, period of the previous year, due to a 14.7% decrease in cost of mainly driven by the integration of the retail operations acquired credit, mainly driven by a lower provision for losses and lower from Citibank, while inflation for the period was 4.6% (IPCA). On the impairment charges on corporate securities. other hand, revenues increased 2.9%. Distribution Network Branches and Client Service Branches | Brazil and Abroad Points of Service | Brazil and Abroad There was a 1.8% increase in the number of available ATMs In Brazil, the yearly reduction in the number of brick and mortar compared to the same period of the previous year. Rede branches is related to the synergies coming from the integration Banco24Horas increased 5.5%, driven by the agreement with of retail operations acquired from Citibank. In Latin America, two Tecban establishing the replacement of our external ATMs network. digital branches were opened in the quarter, one in Paraguay and another in Uruguay. 4,976 4,904 4,940 4,934 4,917 48,476 47,887 47,953 160 47,650 160 173 195 195 47,086 7 3 7 3,587 3,531 3,531 3,530 3,527 23,049 21,423 22,086 22,431 22,605 704 697 700 703 691 1,187 1,175 1,195 1,169 1,175 525 516 513 512 521 610 598 608 592 589 Mar-18 Jun-18 Sep-18 Dec-18 Mar-19 Branches + CSB (Latin America ex-Brazil) CSB - Brazil 23,853 23,760 23,680 23,660 23,590 (i) Brick and Mortar Branches - Brazil Digital Branches - Brazil (i) Includes IBBA representative offices abroad. Note: Includes Banco Itaú BBA, Banco Itaú Mar-18 Jun-18 Sep-18 Dec-18 Mar-19 Argentina and companies in Chile, Colombia, Panama, Paraguay and Uruguay. Brazil ESB Latin America Banco24Horas Third Party Locations (*) - Geographical Distribution of Service Network Number of Branches and Client Service Branches North Northeast Midwest Southeast South Note: (i) Includes Banco Itaú Argentina and banks in Chile, Colombia, Paraguay and Uruguay; (ii) Includes ESBs (Electronic Service Branches) and points of service in third- 114 339 314 2,964 667 parties’ establishments. (iii) Does not include points of sale. (*) In March 2019. Does not include branches and CSBs in Latin America and Itaú BBA. Itaú Unibanco Holding S.A. 28
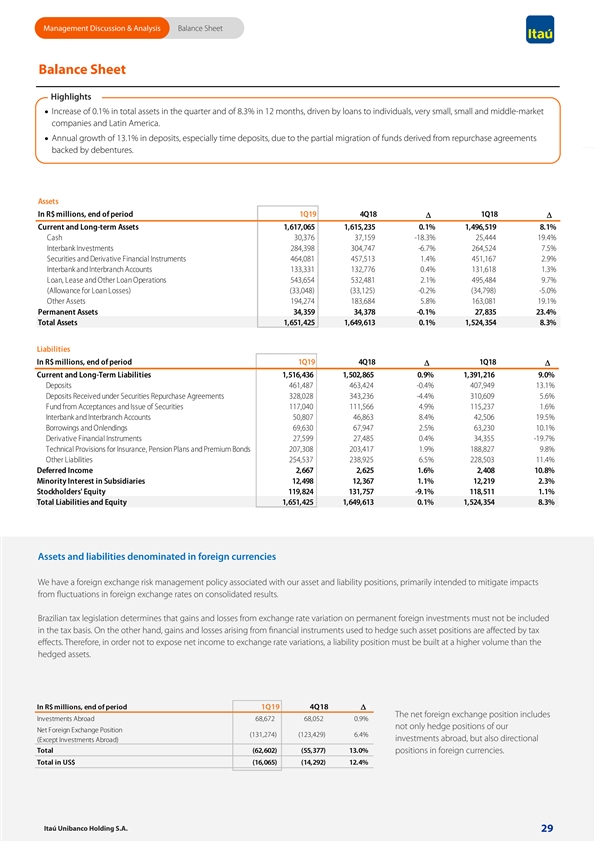
Management Discussion & Analysis Balance Sheet Balance Sheet Highlights · Increase of 0.1% in total assets in the quarter and of 8.3% in 12 months, driven by loans to individuals, very small, small and middle-market companies and Latin America. · Annual growth of 13.1% in deposits, especially time deposits, due to the partial migration of funds derived from repurchase agreements backed by debentures. Assets In R$ millions, end of period 1Q19 4Q18 1Q18 D'D' Current and Long-term Assets 1,617,065 1,615,235 0.1% 1,496,519 8.1% Cash 30,376 37,159 -18.3% 25,444 19.4% Interbank Investments 284,398 304,747 -6.7% 264,524 7.5% Securities and Derivative Financial Instruments 464,081 457,513 1.4% 451,167 2.9% Interbank and Interbranch Accounts 133,331 132,776 0.4% 131,618 1.3% Loan, Lease and Other Loan Operations 543,654 532,481 2.1% 495,484 9.7% (Allowance for Loan Losses) (33,048) (33,125) -0.2% (34,798) -5.0% Other Assets 194,274 183,684 5.8% 163,081 19.1% Permanent Assets 34,359 34,378 -0.1% 27,835 23.4% Total Assets 1,651,425 1,649,613 0.1% 1,524,354 8.3% Liabilities In R$ millions, end of period 1Q19 4Q18 1Q18 D'D' Current and Long-Term Liabilities 1,516,436 1,502,865 0.9% 1,391,216 9.0% Deposits 461,487 463,424 -0.4% 407,949 13.1% Deposits Received under Securities Repurchase Agreements 328,028 343,236 -4.4% 310,609 5.6% Fund from Acceptances and Issue of Securities 117,040 111,566 4.9% 115,237 1.6% Interbank and Interbranch Accounts 50,807 46,863 8.4% 42,506 19.5% Borrowings and Onlendings 69,630 67,947 2.5% 63,230 10.1% Derivative Financial Instruments 27,599 27,485 0.4% 34,355 -19.7% Technical Provisions for Insurance, Pension Plans and Premium Bonds 207,308 203,417 1.9% 188,827 9.8% Other Liabilities 254,537 238,925 6.5% 228,503 11.4% Deferred Income 2,667 2,625 1.6% 2,408 10.8% Minority Interest in Subsidiaries 12,498 12,367 1.1% 12,219 2.3% Stockholders' Equity 119,824 131,757 -9.1% 118,511 1.1% Total Liabilities and Equity 1,651,425 1,649,613 0.1% 1,524,354 8.3% Assets and liabilities denominated in foreign currencies We have a foreign exchange risk management policy associated with our asset and liability positions, primarily intended to mitigate impacts from fluctuations in foreign exchange rates on consolidated results. Brazilian tax legislation determines that gains and losses from exchange rate variation on permanent foreign investments must not be included in the tax basis. On the other hand, gains and losses arising from financial instruments used to hedge such asset positions are affected by tax effects. Therefore, in order not to expose net income to exchange rate variations, a liability position must be built at a higher volume than the hedged assets. In R$ millions, end of period 1Q19 4Q18 D' The net foreign exchange position includes Investments Abroad 68,672 68,052 0.9% not only hedge positions of our Net Foreign Exchange Position (131,274) (123,429) 6.4% investments abroad, but also directional (Except Investments Abroad) Total ( 62,602) (55,377) 13.0% positions in foreign currencies. Total in US$ ( 16,065) (14,292) 12.4% Itaú Itaú U Un nib iban anc co o H Ho old lding ing S. S.A. A. 29 Management Discussion & Analysis Balance Sheet Balance Sheet Highlights · Increase of 0.1% in total assets in the quarter and of 8.3% in 12 months, driven by loans to individuals, very small, small and middle-market companies and Latin America. · Annual growth of 13.1% in deposits, especially time deposits, due to the partial migration of funds derived from repurchase agreements backed by debentures. Assets In R$ millions, end of period 1Q19 4Q18 1Q18 D'D' Current and Long-term Assets 1,617,065 1,615,235 0.1% 1,496,519 8.1% Cash 30,376 37,159 -18.3% 25,444 19.4% Interbank Investments 284,398 304,747 -6.7% 264,524 7.5% Securities and Derivative Financial Instruments 464,081 457,513 1.4% 451,167 2.9% Interbank and Interbranch Accounts 133,331 132,776 0.4% 131,618 1.3% Loan, Lease and Other Loan Operations 543,654 532,481 2.1% 495,484 9.7% (Allowance for Loan Losses) (33,048) (33,125) -0.2% (34,798) -5.0% Other Assets 194,274 183,684 5.8% 163,081 19.1% Permanent Assets 34,359 34,378 -0.1% 27,835 23.4% Total Assets 1,651,425 1,649,613 0.1% 1,524,354 8.3% Liabilities In R$ millions, end of period 1Q19 4Q18 1Q18 D'D' Current and Long-Term Liabilities 1,516,436 1,502,865 0.9% 1,391,216 9.0% Deposits 461,487 463,424 -0.4% 407,949 13.1% Deposits Received under Securities Repurchase Agreements 328,028 343,236 -4.4% 310,609 5.6% Fund from Acceptances and Issue of Securities 117,040 111,566 4.9% 115,237 1.6% Interbank and Interbranch Accounts 50,807 46,863 8.4% 42,506 19.5% Borrowings and Onlendings 69,630 67,947 2.5% 63,230 10.1% Derivative Financial Instruments 27,599 27,485 0.4% 34,355 -19.7% Technical Provisions for Insurance, Pension Plans and Premium Bonds 207,308 203,417 1.9% 188,827 9.8% Other Liabilities 254,537 238,925 6.5% 228,503 11.4% Deferred Income 2,667 2,625 1.6% 2,408 10.8% Minority Interest in Subsidiaries 12,498 12,367 1.1% 12,219 2.3% Stockholders' Equity 119,824 131,757 -9.1% 118,511 1.1% Total Liabilities and Equity 1,651,425 1,649,613 0.1% 1,524,354 8.3% Assets and liabilities denominated in foreign currencies We have a foreign exchange risk management policy associated with our asset and liability positions, primarily intended to mitigate impacts from fluctuations in foreign exchange rates on consolidated results. Brazilian tax legislation determines that gains and losses from exchange rate variation on permanent foreign investments must not be included in the tax basis. On the other hand, gains and losses arising from financial instruments used to hedge such asset positions are affected by tax effects. Therefore, in order not to expose net income to exchange rate variations, a liability position must be built at a higher volume than the hedged assets. In R$ millions, end of period 1Q19 4Q18 D' The net foreign exchange position includes Investments Abroad 68,672 68,052 0.9% not only hedge positions of our Net Foreign Exchange Position (131,274) (123,429) 6.4% investments abroad, but also directional (Except Investments Abroad) Total ( 62,602) (55,377) 13.0% positions in foreign currencies. Total in US$ ( 16,065) (14,292) 12.4% Itaú Itaú U Un nib iban anc co o H Ho old lding ing S. S.A. A. 29

Management Discussion & Analysis Balance Sheet Credit Portfolio Highlights · Practically all individual loans grew in the quarter, except for credit cards, which is seasonally lower in the first quarter of the year, and rural loans. The growth of other individuals' portfolios was due to the higher demand from clients. · The growth in companies portfolio in Brazil was concentrated in the very small, small and middle-market loans and is also related to the greater demand from clients. Credit Portfolio by Product In R$ billions, end of period 1Q19 4Q18 D 1Q18 D (1 ) Individuals - Brazil 214.7 210.4 2.0% 190.5 12.7% Credit Card Loans 76.4 77.5 -1.3% 65.0 17.6% Personal Loans 30.1 28.2 6.8% 26.4 14.1% (2 ) Payroll Loans 48.6 46.7 4.2% 44.7 8.8% Vehicle Loans 16.6 15.9 4.1% 14.3 15.7% Mortgage Loans 42.9 42.0 1.9% 40.0 7.2% Rural Loans 0.1 0.1 -6.1% 0.1 -24.2% (1 ) Companies - Brazil 173.6 170.2 2.0% 164.4 5.6% (3 ) Working Capital 95.8 93.5 2.4% 82.9 15.4% BNDES/Onlending 14.9 16.9 -11.5% 20.7 -28.0% Export / Import Financing 42.3 40.4 4.9% 41.3 2.5% Vehicle Loans 5.1 4.3 18.2% 2.8 79.8% Mortgage Loans 5.7 6.3 -9.5% 7.8 -26.7% Rural Loans 9.8 8.9 10.2% 8.9 10.1% (4 ) Latin America 155.4 151.9 2.3% 140.6 10.6% Total without Financial Guarantees Provided 543.7 532.5 2.1% 495.5 9.7% Financial Guarantees Provided 65.4 66.1 -1.1% 70.9 -7.8% Total with Financial Guarantees Provided 609.0 598.6 1.7% 566.4 7.5% (5 ) Corporate Securities 38.0 38.3 -0.8% 34.7 9.6% Total Risk 647.1 636.9 1.6% 601.1 7.7% (1) Includes units abroad ex-Latin America. (2) Includes operations originated by the institution and acquired operations. (3) Also includes Overdraft, Receivables, Hot Money, Leasing, and other. (4) Includes Argentina, Chile, Colombia, Panama, Paraguay and Uruguay. (5) Includes Debentures, Certificates of Real Estate Receivables (CRI) and Commercial Paper. Credit Concentration Companies Credit Portfolio by Business Sector With Financial Guarantees Provided As of March 31, 2019 In R$ billions, end of period 1Q19 4Q18 D Only 16.4% of the credit risk is concentrated on the 100 largest debtors. Public Sector 2.8 3.6 -22.7% % of total % of total * Risk Private Sector 330.2 324.3 1.8% In R$ billions credits Assets Real Estate 21.4 19.6 9.5% Largest Debtor 5.1 0.8 0.3 10 Largest Debtors 31.3 5.1 1.9 Food and beverage 19.3 18.6 4.0% 20 Largest Debtors 47.3 7.8 2.9 Agribusiness and fertilizers 18.4 17.7 3.7% 50 Largest Debtors 74.8 12.3 4.5 Transportation 17.2 16.9 1.6% 100 Largest Debtors 99.9 16.4 6.1 Energy and water treatment 16.7 15.8 6.1% * Including financial guarantees provided Vehicles and auto parts 12.9 13.2 -1.9% Credit Portfolio without Financial Banks and other financial institutions 12.4 11.4 8.8% Guarantees Provided by Vintage Infrastructure work 11.3 11.3 -0.2% In R$ billions Petrochemical and chemical 11.2 10.1 11.2% 495 532 544 Mining 10.9 10.4 5.5% Steel and metallurgy 9.6 8.9 8.2% Telecommunications 9.2 9.5 -3.0% 36.5% 36.2% 40.1% Pharmaceutical and cosmetics 7.9 7.9 0.2% Oil and gas 6.8 7.6 -10.6% Capital Assets 6.2 6.3 -1.1% 4.6% 4.6% 4.2% 6.2% 7.2% Electronic and IT 6.1 6.0 2.6% 6.9% 8.5% 8.0% Sugar and Alcohol 6.0 6.2 -2.6% 7.1% 10.1% 10.8% Entertainment and tourism 5.7 5.3 6.4% 10.6% Construction Material 5.6 5.6 -0.6% Services - Other 43.4 42.6 1.9% 34.0% 33.2% 31.0% Commerce - Other 20.1 20.0 0.9% Industry - Other 9.9 9.6 2.7% Other 41.8 43.9 -4.8% 1Q18 4Q18 1Q19 Actual Quarter (q) q-1 q-2 q-3 q-4 q=<-5 Total 333.0 327.9 1.6% Itaú Unibanco Holding S.A. 30 Management Discussion & Analysis Balance Sheet Credit Portfolio Highlights · Practically all individual loans grew in the quarter, except for credit cards, which is seasonally lower in the first quarter of the year, and rural loans. The growth of other individuals' portfolios was due to the higher demand from clients. · The growth in companies portfolio in Brazil was concentrated in the very small, small and middle-market loans and is also related to the greater demand from clients. Credit Portfolio by Product In R$ billions, end of period 1Q19 4Q18 D 1Q18 D (1 ) Individuals - Brazil 214.7 210.4 2.0% 190.5 12.7% Credit Card Loans 76.4 77.5 -1.3% 65.0 17.6% Personal Loans 30.1 28.2 6.8% 26.4 14.1% (2 ) Payroll Loans 48.6 46.7 4.2% 44.7 8.8% Vehicle Loans 16.6 15.9 4.1% 14.3 15.7% Mortgage Loans 42.9 42.0 1.9% 40.0 7.2% Rural Loans 0.1 0.1 -6.1% 0.1 -24.2% (1 ) Companies - Brazil 173.6 170.2 2.0% 164.4 5.6% (3 ) Working Capital 95.8 93.5 2.4% 82.9 15.4% BNDES/Onlending 14.9 16.9 -11.5% 20.7 -28.0% Export / Import Financing 42.3 40.4 4.9% 41.3 2.5% Vehicle Loans 5.1 4.3 18.2% 2.8 79.8% Mortgage Loans 5.7 6.3 -9.5% 7.8 -26.7% Rural Loans 9.8 8.9 10.2% 8.9 10.1% (4 ) Latin America 155.4 151.9 2.3% 140.6 10.6% Total without Financial Guarantees Provided 543.7 532.5 2.1% 495.5 9.7% Financial Guarantees Provided 65.4 66.1 -1.1% 70.9 -7.8% Total with Financial Guarantees Provided 609.0 598.6 1.7% 566.4 7.5% (5 ) Corporate Securities 38.0 38.3 -0.8% 34.7 9.6% Total Risk 647.1 636.9 1.6% 601.1 7.7% (1) Includes units abroad ex-Latin America. (2) Includes operations originated by the institution and acquired operations. (3) Also includes Overdraft, Receivables, Hot Money, Leasing, and other. (4) Includes Argentina, Chile, Colombia, Panama, Paraguay and Uruguay. (5) Includes Debentures, Certificates of Real Estate Receivables (CRI) and Commercial Paper. Credit Concentration Companies Credit Portfolio by Business Sector With Financial Guarantees Provided As of March 31, 2019 In R$ billions, end of period 1Q19 4Q18 D Only 16.4% of the credit risk is concentrated on the 100 largest debtors. Public Sector 2.8 3.6 -22.7% % of total % of total * Risk Private Sector 330.2 324.3 1.8% In R$ billions credits Assets Real Estate 21.4 19.6 9.5% Largest Debtor 5.1 0.8 0.3 10 Largest Debtors 31.3 5.1 1.9 Food and beverage 19.3 18.6 4.0% 20 Largest Debtors 47.3 7.8 2.9 Agribusiness and fertilizers 18.4 17.7 3.7% 50 Largest Debtors 74.8 12.3 4.5 Transportation 17.2 16.9 1.6% 100 Largest Debtors 99.9 16.4 6.1 Energy and water treatment 16.7 15.8 6.1% * Including financial guarantees provided Vehicles and auto parts 12.9 13.2 -1.9% Credit Portfolio without Financial Banks and other financial institutions 12.4 11.4 8.8% Guarantees Provided by Vintage Infrastructure work 11.3 11.3 -0.2% In R$ billions Petrochemical and chemical 11.2 10.1 11.2% 495 532 544 Mining 10.9 10.4 5.5% Steel and metallurgy 9.6 8.9 8.2% Telecommunications 9.2 9.5 -3.0% 36.5% 36.2% 40.1% Pharmaceutical and cosmetics 7.9 7.9 0.2% Oil and gas 6.8 7.6 -10.6% Capital Assets 6.2 6.3 -1.1% 4.6% 4.6% 4.2% 6.2% 7.2% Electronic and IT 6.1 6.0 2.6% 6.9% 8.5% 8.0% Sugar and Alcohol 6.0 6.2 -2.6% 7.1% 10.1% 10.8% Entertainment and tourism 5.7 5.3 6.4% 10.6% Construction Material 5.6 5.6 -0.6% Services - Other 43.4 42.6 1.9% 34.0% 33.2% 31.0% Commerce - Other 20.1 20.0 0.9% Industry - Other 9.9 9.6 2.7% Other 41.8 43.9 -4.8% 1Q18 4Q18 1Q19 Actual Quarter (q) q-1 q-2 q-3 q-4 q=<-5 Total 333.0 327.9 1.6% Itaú Unibanco Holding S.A. 30
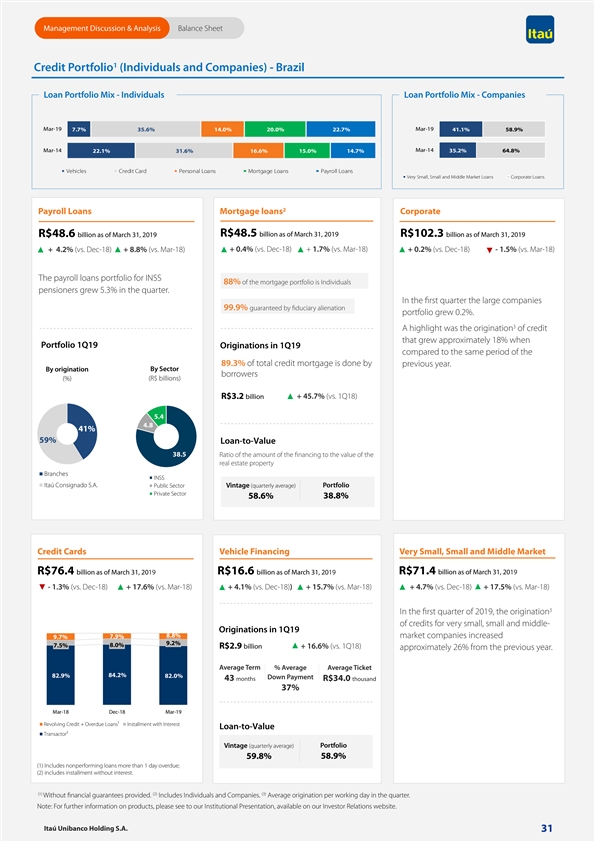
Management Discussion & Analysis Balance Sheet 1 Credit Portfolio (Individuals and Companies) - Brazil Loan Portfolio Mix - Individuals Loan Portfolio Mix - Companies Mar-19 Mar-19 41.1% 58.9% 7.7% 35.6% 14.0% 20.0% 22.7% Mar-14 Mar-14 35.2% 64.8% 22.1% 31.6% 16.6% 15.0% 14.7% Vehicles Credit Card Personal Loans Mortgage Loans Payroll Loans Very Small, Small and Middle Market Loans Corporate Loans 2 Payroll Loans Mortgage loans Corporate R$48.6 billion as of March 31, 2019 R$48.5 billion as of March 31, 2019 R$102.3 billion as of March 31, 2019 + 4.2% (vs. Dec-18) + 8.8% (vs. Mar-18) + 0.4% (vs. Dec-18) + 1.7% (vs. Mar-18) + 0.2% (vs. Dec-18) - 1.5% (vs. Mar-18) The payroll loans portfolio for INSS 88% of the mortgage portfolio is Individuals pensioners grew 5.3% in the quarter. In the first quarter the large companies 99.9% guaranteed by fiduciary alienation portfolio grew 0.2%. 3 A highlight was the origination of credit that grew approximately 18% when Portfolio 1Q19 Originations in 1Q19 compared to the same period of the 89.3% of total credit mortgage is done by previous year. By Sector By origination borrowers (%) (R$ billions) R$3.2 billion + 45.7% (vs. 1Q18) 5.4 4.8 41% 59% Loan-to-Value 38.5 Ratio of the amount of the financing to the value of the real estate property Branches INSS Itaú Consignado S.A. Public Sector Vintage (quarterly average) Portfolio Private Sector 58.6% 38.8% Credit Cards Vehicle Financing Very Small, Small and Middle Market R$71.4 billion as of March 31, 2019 R$76.4 billion as of March 31, 2019 R$16.6 billion as of March 31, 2019 - 1.3% (vs. Dec-18) + 17.6% (vs. Mar-18) + 4.1% (vs. Dec-18)) + 15.7% (vs. Mar-18) + 4.7% (vs. Dec-18) + 17. 5% (vs. Mar-18) 3 In the first quarter of 2019, the origination of credits for very small, small and middle- Originations in 1Q19 7.9% 8.8% market companies increased 9.7% 9.2% 8.0% 7.5% R$2.9 billion + 16.6% (vs. 1Q18) approximately 26% from the previous year. Average Term % Average Average Ticket 84.2% 82.9% 82.0% Down Payment 43 months R$34.0 thousand 37% Mar-18 Dec-18 Mar-19 Revolving Credit + Overdue Loans¹ Installment with Interest Loan-to-Value Transactor² Vintage (quarterly average) Portfolio 59.8% 58.9% (1) Includes nonperforming loans more than 1 day overdue; (2) includes installment without interest. (1) (2) (3) Without financial guarantees provided. Includes Individuals and Companies. Average origination per working day in the quarter. Note: For further information on products, please see to our Institutional Presentation, available on our Investor Relations website. Itaú Unibanco Holding S.A. 31 Management Discussion & Analysis Balance Sheet 1 Credit Portfolio (Individuals and Companies) - Brazil Loan Portfolio Mix - Individuals Loan Portfolio Mix - Companies Mar-19 Mar-19 41.1% 58.9% 7.7% 35.6% 14.0% 20.0% 22.7% Mar-14 Mar-14 35.2% 64.8% 22.1% 31.6% 16.6% 15.0% 14.7% Vehicles Credit Card Personal Loans Mortgage Loans Payroll Loans Very Small, Small and Middle Market Loans Corporate Loans 2 Payroll Loans Mortgage loans Corporate R$48.6 billion as of March 31, 2019 R$48.5 billion as of March 31, 2019 R$102.3 billion as of March 31, 2019 + 4.2% (vs. Dec-18) + 8.8% (vs. Mar-18) + 0.4% (vs. Dec-18) + 1.7% (vs. Mar-18) + 0.2% (vs. Dec-18) - 1.5% (vs. Mar-18) The payroll loans portfolio for INSS 88% of the mortgage portfolio is Individuals pensioners grew 5.3% in the quarter. In the first quarter the large companies 99.9% guaranteed by fiduciary alienation portfolio grew 0.2%. 3 A highlight was the origination of credit that grew approximately 18% when Portfolio 1Q19 Originations in 1Q19 compared to the same period of the 89.3% of total credit mortgage is done by previous year. By Sector By origination borrowers (%) (R$ billions) R$3.2 billion + 45.7% (vs. 1Q18) 5.4 4.8 41% 59% Loan-to-Value 38.5 Ratio of the amount of the financing to the value of the real estate property Branches INSS Itaú Consignado S.A. Public Sector Vintage (quarterly average) Portfolio Private Sector 58.6% 38.8% Credit Cards Vehicle Financing Very Small, Small and Middle Market R$71.4 billion as of March 31, 2019 R$76.4 billion as of March 31, 2019 R$16.6 billion as of March 31, 2019 - 1.3% (vs. Dec-18) + 17.6% (vs. Mar-18) + 4.1% (vs. Dec-18)) + 15.7% (vs. Mar-18) + 4.7% (vs. Dec-18) + 17. 5% (vs. Mar-18) 3 In the first quarter of 2019, the origination of credits for very small, small and middle- Originations in 1Q19 7.9% 8.8% market companies increased 9.7% 9.2% 8.0% 7.5% R$2.9 billion + 16.6% (vs. 1Q18) approximately 26% from the previous year. Average Term % Average Average Ticket 84.2% 82.9% 82.0% Down Payment 43 months R$34.0 thousand 37% Mar-18 Dec-18 Mar-19 Revolving Credit + Overdue Loans¹ Installment with Interest Loan-to-Value Transactor² Vintage (quarterly average) Portfolio 59.8% 58.9% (1) Includes nonperforming loans more than 1 day overdue; (2) includes installment without interest. (1) (2) (3) Without financial guarantees provided. Includes Individuals and Companies. Average origination per working day in the quarter. Note: For further information on products, please see to our Institutional Presentation, available on our Investor Relations website. Itaú Unibanco Holding S.A. 31
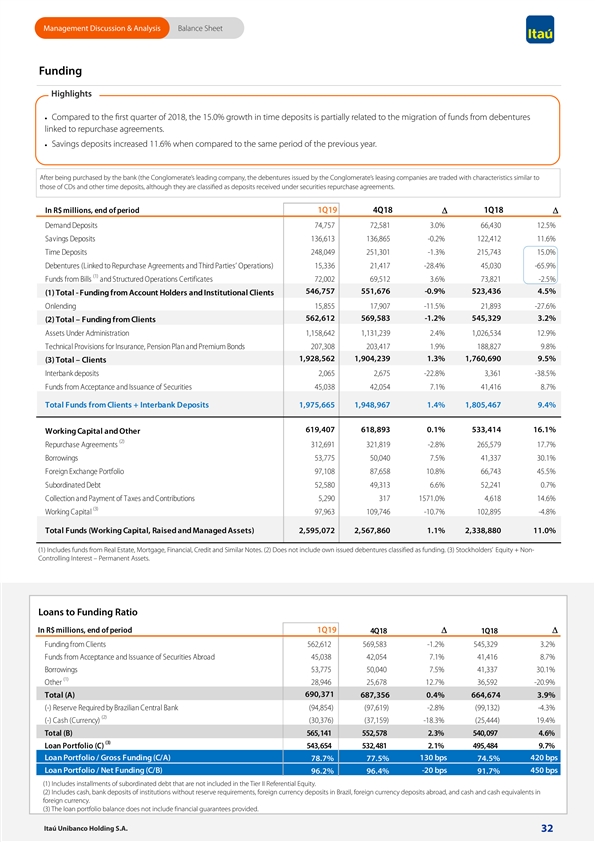
Management Discussion & Analysis Balance Sheet Funding Highlights · Compared to the first quarter of 2018, the 15.0% growth in time deposits is partially related to the migration of funds from debentures linked to repurchase agreements. · Savings deposits increased 11.6% when compared to the same period of the previous year. After being purchased by the bank (the Conglomerate’s leading company, the debentures issued by the Conglomerate’s leasing companies are traded with characteristics similar to those of CDs and other time deposits, although they are classified as deposits received under securities repurchase agreements. In R$ millions, end of period 1Q19 4Q18D 1Q18D Demand Deposits 74,757 72,581 3.0% 66,430 12.5% Savings Deposits 136,613 136,865 -0.2% 122,412 11.6% Time Deposits 248,049 251,301 -1.3% 215,743 15.0% Debentures (Linked to Repurchase Agreements and Third Parties’ Operations) 15,336 21,417 -28.4% 45,030 -65.9% (1) Funds from Bills and Structured Operations Certificates 72,002 69,512 3.6% 73,821 -2.5% 546,757 551,676 -0.9% 523,436 4.5% (1) Total - Funding from Account Holders and Institutional Clients Onlending 15,855 17,907 -11.5% 21,893 -27.6% 562,612 569,583 -1.2% 545,329 3.2% (2) Total – Funding from Clients Assets Under Administration 1,158,642 1,131,239 2.4% 1,026,534 12.9% Technical Provisions for Insurance, Pension Plan and Premium Bonds 207,308 203,417 1.9% 188,827 9.8% 1,928,562 1,904,239 1.3% 1,760,690 9.5% (3) Total – Clients Interbank deposits 2,065 2,675 -22.8% 3,361 -38.5% Funds from Acceptance and Issuance of Securities 45,038 42,054 7.1% 41,416 8.7% Total Funds from Clients + Interbank Deposits 1,975,665 1,948,967 1.4% 1,805,467 9.4% 619,407 618,893 0.1% 533,414 16.1% Working Capital and Other (2) Repurchase Agreements 312,691 321,819 -2.8% 265,579 17.7% Borrowings 53,775 50,040 7.5% 41,337 30.1% Foreign Exchange Portfolio 97,108 87,658 10.8% 66,743 45.5% Subordinated Debt 52,580 49,313 6.6% 52,241 0.7% Collection and Payment of Taxes and Contributions 5,290 317 1571.0% 4,618 14.6% (3) Working Capital 97,963 109,746 -10.7% 102,895 -4.8% Total Funds (Working Capital, Raised and Managed Assets) 2,595,072 2,567,860 1.1% 2,338,880 11.0% (1) Includes funds from Real Estate, Mortgage, Financial, Credit and Similar Notes. (2) Does not include own issued debentures classified as funding. (3) Stockholders’ Equity + Non- Controlling Interest – Permanent Assets. Loans to Funding Ratio In R$ millions, end of period 1Q19DD 4Q18 1Q18 Funding from Clients 5 62,612 569,583 -1.2% 545,329 3.2% Funds from Acceptance and Issuance of Securities Abroad 45,038 42,054 7.1% 41,416 8.7% Borrowings 53,775 50,040 7.5% 41,337 30.1% (1) Other 28,946 25,678 12.7% 36,592 -20.9% 690,371 Total (A) 687,356 0.4% 664,674 3.9% (-) Reserve Required by Brazilian Central Bank (94,854) (97,619) -2.8% (99,132) -4.3% (2) (-) Cash (Currency) (30,376) (37,159) -18.3% (25,444) 19.4% Total (B) 565,141 552,578 2.3% 540,097 4.6% (3) Loan Portfolio (C) 543,654 532,481 2.1% 495,484 9.7% Loan Portfolio / Gross Funding (C/A) 130 bps 420 bps 78.7% 77.5% 74.5% Loan Portfolio / Net Funding (C/B) -20 bps 450 bps 96.2% 96.4% 91.7% (1) Includes installments of subordinated debt that are not included in the Tier II Referential Equity. (2) Includes cash, bank deposits of institutions without reserve requirements, foreign currency deposits in Brazil, foreign currency deposits abroad, and cash and cash equivalents in foreign currency. (3) The loan portfolio balance does not include financial guarantees provided. Itaú Itaú U Un nib iban anc co o H Ho old lding ing S. S.A. A. 32 Management Discussion & Analysis Balance Sheet Funding Highlights · Compared to the first quarter of 2018, the 15.0% growth in time deposits is partially related to the migration of funds from debentures linked to repurchase agreements. · Savings deposits increased 11.6% when compared to the same period of the previous year. After being purchased by the bank (the Conglomerate’s leading company, the debentures issued by the Conglomerate’s leasing companies are traded with characteristics similar to those of CDs and other time deposits, although they are classified as deposits received under securities repurchase agreements. In R$ millions, end of period 1Q19 4Q18D 1Q18D Demand Deposits 74,757 72,581 3.0% 66,430 12.5% Savings Deposits 136,613 136,865 -0.2% 122,412 11.6% Time Deposits 248,049 251,301 -1.3% 215,743 15.0% Debentures (Linked to Repurchase Agreements and Third Parties’ Operations) 15,336 21,417 -28.4% 45,030 -65.9% (1) Funds from Bills and Structured Operations Certificates 72,002 69,512 3.6% 73,821 -2.5% 546,757 551,676 -0.9% 523,436 4.5% (1) Total - Funding from Account Holders and Institutional Clients Onlending 15,855 17,907 -11.5% 21,893 -27.6% 562,612 569,583 -1.2% 545,329 3.2% (2) Total – Funding from Clients Assets Under Administration 1,158,642 1,131,239 2.4% 1,026,534 12.9% Technical Provisions for Insurance, Pension Plan and Premium Bonds 207,308 203,417 1.9% 188,827 9.8% 1,928,562 1,904,239 1.3% 1,760,690 9.5% (3) Total – Clients Interbank deposits 2,065 2,675 -22.8% 3,361 -38.5% Funds from Acceptance and Issuance of Securities 45,038 42,054 7.1% 41,416 8.7% Total Funds from Clients + Interbank Deposits 1,975,665 1,948,967 1.4% 1,805,467 9.4% 619,407 618,893 0.1% 533,414 16.1% Working Capital and Other (2) Repurchase Agreements 312,691 321,819 -2.8% 265,579 17.7% Borrowings 53,775 50,040 7.5% 41,337 30.1% Foreign Exchange Portfolio 97,108 87,658 10.8% 66,743 45.5% Subordinated Debt 52,580 49,313 6.6% 52,241 0.7% Collection and Payment of Taxes and Contributions 5,290 317 1571.0% 4,618 14.6% (3) Working Capital 97,963 109,746 -10.7% 102,895 -4.8% Total Funds (Working Capital, Raised and Managed Assets) 2,595,072 2,567,860 1.1% 2,338,880 11.0% (1) Includes funds from Real Estate, Mortgage, Financial, Credit and Similar Notes. (2) Does not include own issued debentures classified as funding. (3) Stockholders’ Equity + Non- Controlling Interest – Permanent Assets. Loans to Funding Ratio In R$ millions, end of period 1Q19DD 4Q18 1Q18 Funding from Clients 5 62,612 569,583 -1.2% 545,329 3.2% Funds from Acceptance and Issuance of Securities Abroad 45,038 42,054 7.1% 41,416 8.7% Borrowings 53,775 50,040 7.5% 41,337 30.1% (1) Other 28,946 25,678 12.7% 36,592 -20.9% 690,371 Total (A) 687,356 0.4% 664,674 3.9% (-) Reserve Required by Brazilian Central Bank (94,854) (97,619) -2.8% (99,132) -4.3% (2) (-) Cash (Currency) (30,376) (37,159) -18.3% (25,444) 19.4% Total (B) 565,141 552,578 2.3% 540,097 4.6% (3) Loan Portfolio (C) 543,654 532,481 2.1% 495,484 9.7% Loan Portfolio / Gross Funding (C/A) 130 bps 420 bps 78.7% 77.5% 74.5% Loan Portfolio / Net Funding (C/B) -20 bps 450 bps 96.2% 96.4% 91.7% (1) Includes installments of subordinated debt that are not included in the Tier II Referential Equity. (2) Includes cash, bank deposits of institutions without reserve requirements, foreign currency deposits in Brazil, foreign currency deposits abroad, and cash and cash equivalents in foreign currency. (3) The loan portfolio balance does not include financial guarantees provided. Itaú Itaú U Un nib iban anc co o H Ho old lding ing S. S.A. A. 32

Management Discussion & Analysis Risk and Capital Management Risk and Capital Management We believe risk management is an essential tool to optimize the use of resources and select the best business opportunities to maximize value creation for shareholders. In this context, the risk appetite defines the nature and the level of risks acceptable and the risk culture guides the attitudes required to manage them. With the aim of strengthening our values and aligning our employees' behavior with the guidelines established in risk management, we have adopted a number of initiatives to disseminate the risk culture. It strengthens the individual and collective responsibility of all employees in the management of the risks inherent to the performed activities, respecting our ethical way of doing business. We take a prospective stance in relation to capital management and, through our Internal Capital Adequacy Assessment Process (ICAAP), we assess the adequacy of our capital to face the incurred risks, composed by credit, market, operational and other material risks. The result of the last ICAAP – dated as of December 2018 – showed that, in addition to having enough capital to face all material risks, we have a significant cushion, thus ensuring the soundness of our equity position. Our risk management process includes: · Identification and measurement of · Alignment of institutional policies for risk · Management of our portfolio seeking existing and potential risks in our management control, procedures and optimal risk-return ratios. operations. methodologies according to the guidelines of the Board of Directors and our corporate strategies. For further information on the risk and capital management structure, please refer to the Investor Relations website at www.itau.com.br/investor-relations, section Reports - Pillar 3 and Global Systemically Important Banks. 1,2 Liquidity Coverage Ratio Value at Risk - VaR (LCR) It is a statistical metric that quantifies the maximum potential economic loss expected in normal market conditions. In R$ millions 1Q19 4Q18 HQLA 170,649 179,880 (2) (2) In R$ millions, end of period 1Q19 4Q18 Potential Cash Outflows 104,076 10 4,743 VaR by Risk Factor LCR (%) 164.0% 171.7% Brazilian Interest Rates 856.8 898.4 Currency 30.4 37.3 For 2019, the minimum ratio required by the Brazilian Shares of Stock Exchange 38.3 50.1 Central Bank is 100%. Commodities 1.3 1.0 Diversification Effect (553.2) (605.3) Total VaR 373.6 381.5 Net Stable Funding Ratio Maximum VaR in the quarter 471.9 397.0 (NSFR) Average VaR in the quarter 397.1 357.8 Minimum VaR in the quarter 360.7 303.0 In R$ millions 1Q19 4Q18 (1) Values represented above consider a 1-day time horizon and a 99% confidence level. 672,040 Available Stable Funding 691,550 (2) The VaR by risk factors includes foreign companies. Required Stable Funding 547,067 541,642 NSFR (%) 122.8% 127.7% Evolution of Itaú Unibanco’s VaR For 2019, the minimum ratio required by the Brazilian Central Bank is 100%. 604 525 491 476 433 431 472 397 376 384 397 382 295 374 These ratios are calculated based on the 358 methodology defined by the Brazilian 369 Central Bank, which is in line with Basel III 361 317 295 303 international guidelines. Mar-18 Jun-18 Sep-18 Dec-18 Mar-19 Note: For further information on these liquidity ratios, Total Maximum Average Minimum please access the Investor Relations website at www.itau.com.br/investor-relations, section Reports - Pillar 3 and Global Systemically Important Banks. Itaú Unibanco Holding S.A. 33 Management Discussion & Analysis Risk and Capital Management Risk and Capital Management We believe risk management is an essential tool to optimize the use of resources and select the best business opportunities to maximize value creation for shareholders. In this context, the risk appetite defines the nature and the level of risks acceptable and the risk culture guides the attitudes required to manage them. With the aim of strengthening our values and aligning our employees' behavior with the guidelines established in risk management, we have adopted a number of initiatives to disseminate the risk culture. It strengthens the individual and collective responsibility of all employees in the management of the risks inherent to the performed activities, respecting our ethical way of doing business. We take a prospective stance in relation to capital management and, through our Internal Capital Adequacy Assessment Process (ICAAP), we assess the adequacy of our capital to face the incurred risks, composed by credit, market, operational and other material risks. The result of the last ICAAP – dated as of December 2018 – showed that, in addition to having enough capital to face all material risks, we have a significant cushion, thus ensuring the soundness of our equity position. Our risk management process includes: · Identification and measurement of · Alignment of institutional policies for risk · Management of our portfolio seeking existing and potential risks in our management control, procedures and optimal risk-return ratios. operations. methodologies according to the guidelines of the Board of Directors and our corporate strategies. For further information on the risk and capital management structure, please refer to the Investor Relations website at www.itau.com.br/investor-relations, section Reports - Pillar 3 and Global Systemically Important Banks. 1,2 Liquidity Coverage Ratio Value at Risk - VaR (LCR) It is a statistical metric that quantifies the maximum potential economic loss expected in normal market conditions. In R$ millions 1Q19 4Q18 HQLA 170,649 179,880 (2) (2) In R$ millions, end of period 1Q19 4Q18 Potential Cash Outflows 104,076 10 4,743 VaR by Risk Factor LCR (%) 164.0% 171.7% Brazilian Interest Rates 856.8 898.4 Currency 30.4 37.3 For 2019, the minimum ratio required by the Brazilian Shares of Stock Exchange 38.3 50.1 Central Bank is 100%. Commodities 1.3 1.0 Diversification Effect (553.2) (605.3) Total VaR 373.6 381.5 Net Stable Funding Ratio Maximum VaR in the quarter 471.9 397.0 (NSFR) Average VaR in the quarter 397.1 357.8 Minimum VaR in the quarter 360.7 303.0 In R$ millions 1Q19 4Q18 (1) Values represented above consider a 1-day time horizon and a 99% confidence level. 672,040 Available Stable Funding 691,550 (2) The VaR by risk factors includes foreign companies. Required Stable Funding 547,067 541,642 NSFR (%) 122.8% 127.7% Evolution of Itaú Unibanco’s VaR For 2019, the minimum ratio required by the Brazilian Central Bank is 100%. 604 525 491 476 433 431 472 397 376 384 397 382 295 374 These ratios are calculated based on the 358 methodology defined by the Brazilian 369 Central Bank, which is in line with Basel III 361 317 295 303 international guidelines. Mar-18 Jun-18 Sep-18 Dec-18 Mar-19 Note: For further information on these liquidity ratios, Total Maximum Average Minimum please access the Investor Relations website at www.itau.com.br/investor-relations, section Reports - Pillar 3 and Global Systemically Important Banks. Itaú Unibanco Holding S.A. 33
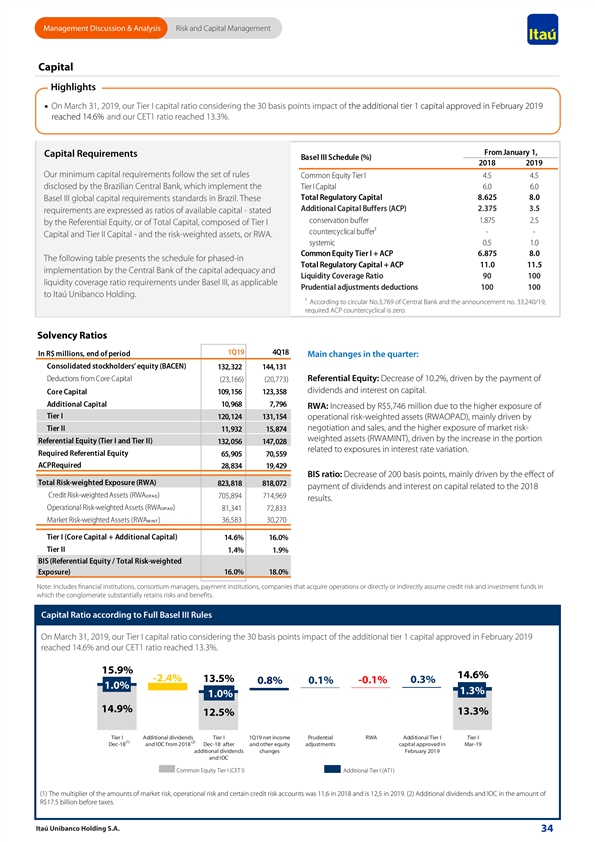
Management Discussion & Analysis Risk and Capital Management Capital Highlights · On March 31, 2019, our Tier I capital ratio considering the 30 basis points impact of the additional tier 1 capital approved in February 2019 reached 14.6% and our CET1 ratio reached 13.3%. From January 1, Capital Requirements Basel III Schedule (%) 2018 2019 Our minimum capital requirements follow the set of rules Common Equity Tier I 4.5 4.5 disclosed by the Brazilian Central Bank, which implement the Tier I Capital 6.0 6.0 Total Regulatory Capital 8.625 8.0 Basel III global capital requirements standards in Brazil. These Additional Capital Buffers (ACP) 2.375 3.5 requirements are expressed as ratios of available capital - stated conservation buffer 1.875 2.5 by the Referential Equity, or of Total Capital, composed of Tier I countercyclical buffer¹ - - Capital and Tier II Capital - and the risk-weighted assets, or RWA. systemic 0.5 1.0 Common Equity Tier I + ACP 6.875 8.0 The following table presents the schedule for phased-in Total Regulatory Capital + ACP 11.0 11.5 implementation by the Central Bank of the capital adequacy and Liquidity Coverage Ratio 90 100 liquidity coverage ratio requirements under Basel III, as applicable Prudential adjustments deductions 100 100 to Itaú Unibanco Holding. ¹ According to circular No.3,769 of Central Bank and the announcement no. 33,240/19, required ACP countercyclical is zero. Solvency Ratios 1Q19 4Q18 In R$ millions, end of period Main changes in the quarter: Consolidated stockholders’ equity (BACEN) 132,322 144,131 Deductions from Core Capital Referential Equity: Decrease of 10.2%, driven by the payment of (23,166) (20,773) dividends and interest on capital. Core Capital 109,156 123,358 Additional Capital 10,968 7,796 RWA: Increased by R$5,746 million due to the higher exposure of Tier I 120,124 131,154 operational risk-weighted assets (RWAOPAD), mainly driven by Tier II negotiation and sales, and the higher exposure of market risk- 11,932 15,874 weighted assets (RWAMINT), driven by the increase in the portion Referential Equity (Tier I and Tier II) 132,056 147,028 related to exposures in interest rate variation. Required Referential Equity 65,905 7 0,559 ACPRequired 28,834 19,429 BIS ratio: Decrease of 200 basis points, mainly driven by the effect of Total Risk-weighted Exposure (RWA) 823,818 818,072 payment of dividends and interest on capital related to the 2018 Credit Risk-weighted Assets (RWAC PAD) 705,894 714,969 results. Operational Risk-weighted Assets (RWAOPAD) 81,341 72,833 MI NT Market Risk-weighted Assets (RWA ) 36,583 30,270 Tier I (Core Capital + Additional Capital) 14.6% 16.0% Tier II 1.4% 1.9% BIS (Referential Equity / Total Risk-weighted Exposure) 16.0%18.0% Note: Includes financial institutions, consortium managers, payment institutions, companies that acquire operations or directly or indirectly assume credit risk and investment funds in which the conglomerate substantially retains risks and benefits. Capital Ratio according to Full Basel III Rules On March 31, 2019, our Tier I capital ratio considering the 30 basis points impact of the additional tier 1 capital approved in February 2019 reached 14.6% and our CET1 ratio reached 13.3%. 15.9% 14.6% -2.4% 13.5% -0.1% 0.3% 0.8% 0.1% 1.0% 1.3% 1.0% 14.9% 13.3% 12.5% Tier I Additional dividends Tier I 1Q19 net income Prudential RWA Additional Tier I Tier I (1) (2) Dec-18 and IOC from 2018 Dec-18 after and other equity adjustments capital approved in Mar-19 additional dividends changes February 2019 and IOC Common Equity Tier I (CET I) Additional Tier I (AT1) (1) The multiplier of the amounts of market risk, operational risk and certain credit risk accounts was 11,6 in 2018 and is 12,5 in 2019. (2) Additional dividends and IOC in the amount of R$17.5 billion before taxes. Itaú Unibanco Holding S.A. 34 Management Discussion & Analysis Risk and Capital Management Capital Highlights · On March 31, 2019, our Tier I capital ratio considering the 30 basis points impact of the additional tier 1 capital approved in February 2019 reached 14.6% and our CET1 ratio reached 13.3%. From January 1, Capital Requirements Basel III Schedule (%) 2018 2019 Our minimum capital requirements follow the set of rules Common Equity Tier I 4.5 4.5 disclosed by the Brazilian Central Bank, which implement the Tier I Capital 6.0 6.0 Total Regulatory Capital 8.625 8.0 Basel III global capital requirements standards in Brazil. These Additional Capital Buffers (ACP) 2.375 3.5 requirements are expressed as ratios of available capital - stated conservation buffer 1.875 2.5 by the Referential Equity, or of Total Capital, composed of Tier I countercyclical buffer¹ - - Capital and Tier II Capital - and the risk-weighted assets, or RWA. systemic 0.5 1.0 Common Equity Tier I + ACP 6.875 8.0 The following table presents the schedule for phased-in Total Regulatory Capital + ACP 11.0 11.5 implementation by the Central Bank of the capital adequacy and Liquidity Coverage Ratio 90 100 liquidity coverage ratio requirements under Basel III, as applicable Prudential adjustments deductions 100 100 to Itaú Unibanco Holding. ¹ According to circular No.3,769 of Central Bank and the announcement no. 33,240/19, required ACP countercyclical is zero. Solvency Ratios 1Q19 4Q18 In R$ millions, end of period Main changes in the quarter: Consolidated stockholders’ equity (BACEN) 132,322 144,131 Deductions from Core Capital Referential Equity: Decrease of 10.2%, driven by the payment of (23,166) (20,773) dividends and interest on capital. Core Capital 109,156 123,358 Additional Capital 10,968 7,796 RWA: Increased by R$5,746 million due to the higher exposure of Tier I 120,124 131,154 operational risk-weighted assets (RWAOPAD), mainly driven by Tier II negotiation and sales, and the higher exposure of market risk- 11,932 15,874 weighted assets (RWAMINT), driven by the increase in the portion Referential Equity (Tier I and Tier II) 132,056 147,028 related to exposures in interest rate variation. Required Referential Equity 65,905 7 0,559 ACPRequired 28,834 19,429 BIS ratio: Decrease of 200 basis points, mainly driven by the effect of Total Risk-weighted Exposure (RWA) 823,818 818,072 payment of dividends and interest on capital related to the 2018 Credit Risk-weighted Assets (RWAC PAD) 705,894 714,969 results. Operational Risk-weighted Assets (RWAOPAD) 81,341 72,833 MI NT Market Risk-weighted Assets (RWA ) 36,583 30,270 Tier I (Core Capital + Additional Capital) 14.6% 16.0% Tier II 1.4% 1.9% BIS (Referential Equity / Total Risk-weighted Exposure) 16.0%18.0% Note: Includes financial institutions, consortium managers, payment institutions, companies that acquire operations or directly or indirectly assume credit risk and investment funds in which the conglomerate substantially retains risks and benefits. Capital Ratio according to Full Basel III Rules On March 31, 2019, our Tier I capital ratio considering the 30 basis points impact of the additional tier 1 capital approved in February 2019 reached 14.6% and our CET1 ratio reached 13.3%. 15.9% 14.6% -2.4% 13.5% -0.1% 0.3% 0.8% 0.1% 1.0% 1.3% 1.0% 14.9% 13.3% 12.5% Tier I Additional dividends Tier I 1Q19 net income Prudential RWA Additional Tier I Tier I (1) (2) Dec-18 and IOC from 2018 Dec-18 after and other equity adjustments capital approved in Mar-19 additional dividends changes February 2019 and IOC Common Equity Tier I (CET I) Additional Tier I (AT1) (1) The multiplier of the amounts of market risk, operational risk and certain credit risk accounts was 11,6 in 2018 and is 12,5 in 2019. (2) Additional dividends and IOC in the amount of R$17.5 billion before taxes. Itaú Unibanco Holding S.A. 34
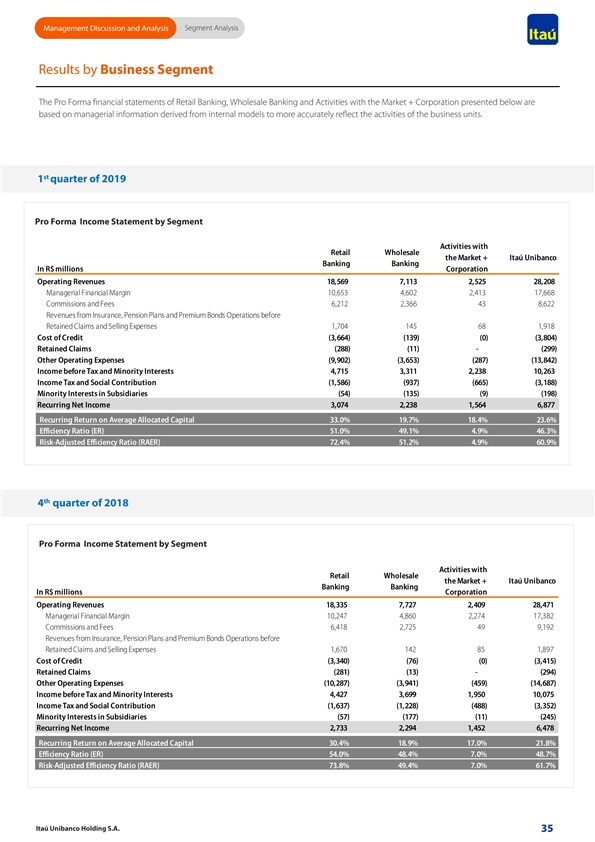
Segment Analysis Management Discussion and Analysis Results by Business Segment The Pro Forma financial statements of Retail Banking, Wholesale Banking and Activities with the Market + Corporation presented below are based on managerial information derived from internal models to more accurately reflect the activities of the business units. st 1 quarter of 2019 Pro Forma Income Statement by Segment Activities with Retail Wholesale the Market + Itaú Unibanco Banking Banking In R$ millions Corporation Operating Revenues 18,569 7,113 2,525 28,208 Managerial Financial Margin 10,653 4,602 2,413 17,668 Commissions and Fees 6,212 2,366 43 8,622 Revenues from Insurance, Pension Plans and Premium Bonds Operations before Retained Claims and Selling Expenses 1,704 145 68 1,918 Cost of Credit (3,664) (139) (0) (3,804) Retained Claims (288) (11) - (299) Other Operating Expenses (9,902) (3,653) (287) (13,842) Income before Tax and Minority Interests 4,715 3,311 2,238 10,263 Income Tax and Social Contribution (1,586) (937) (665) (3,188) Minority Interests in Subsidiaries (54) (135) (9) (198) Recurring Net Income 3,074 2,238 1,564 6,877 Recurring Return on Average Allocated Capital 33.0% 19.7% 18.4% 23.6% Efficiency Ratio (ER) 51.0% 49.1% 4.9% 46.3% Risk-Adjusted Efficiency Ratio (RAER) 72.4% 51.2% 4.9% 60.9% th 4 quarter of 2018 Pro Forma Income Statement by Segment Activities with Retail Wholesale the Market + Itaú Unibanco Banking Banking In R$ millions Corporation Operating Revenues 18,335 7,727 2,409 28,471 Managerial Financial Margin 10,247 4,860 2,274 17,382 Commissions and Fees 6,418 2,725 49 9,192 Revenues from Insurance, Pension Plans and Premium Bonds Operations before Retained Claims and Selling Expenses 1,670 142 85 1,897 Cost of Credit (3,340) (76) (0) (3,415) Retained Claims (281) (13) - (294) Other Operating Expenses (10,287) (3,941) (459) (14,687) Income before Tax and Minority Interests 4,427 3,699 1,950 10,075 Income Tax and Social Contribution (1,637) (1,228) (488) (3,352) Minority Interests in Subsidiaries (57) (177) (11) (245) Recurring Net Income 2,733 2,294 1,452 6,478 Recurring Return on Average Allocated Capital 30.4% 18.9% 17.0% 21.8% Efficiency Ratio (ER) 54.0% 48.4% 7.0% 48.7% Risk-Adjusted Efficiency Ratio (RAER) 73.8% 49.4% 7.0% 61.7% Itaú Unibanco Holding S.A. 35 Segment Analysis Management Discussion and Analysis Results by Business Segment The Pro Forma financial statements of Retail Banking, Wholesale Banking and Activities with the Market + Corporation presented below are based on managerial information derived from internal models to more accurately reflect the activities of the business units. st 1 quarter of 2019 Pro Forma Income Statement by Segment Activities with Retail Wholesale the Market + Itaú Unibanco Banking Banking In R$ millions Corporation Operating Revenues 18,569 7,113 2,525 28,208 Managerial Financial Margin 10,653 4,602 2,413 17,668 Commissions and Fees 6,212 2,366 43 8,622 Revenues from Insurance, Pension Plans and Premium Bonds Operations before Retained Claims and Selling Expenses 1,704 145 68 1,918 Cost of Credit (3,664) (139) (0) (3,804) Retained Claims (288) (11) - (299) Other Operating Expenses (9,902) (3,653) (287) (13,842) Income before Tax and Minority Interests 4,715 3,311 2,238 10,263 Income Tax and Social Contribution (1,586) (937) (665) (3,188) Minority Interests in Subsidiaries (54) (135) (9) (198) Recurring Net Income 3,074 2,238 1,564 6,877 Recurring Return on Average Allocated Capital 33.0% 19.7% 18.4% 23.6% Efficiency Ratio (ER) 51.0% 49.1% 4.9% 46.3% Risk-Adjusted Efficiency Ratio (RAER) 72.4% 51.2% 4.9% 60.9% th 4 quarter of 2018 Pro Forma Income Statement by Segment Activities with Retail Wholesale the Market + Itaú Unibanco Banking Banking In R$ millions Corporation Operating Revenues 18,335 7,727 2,409 28,471 Managerial Financial Margin 10,247 4,860 2,274 17,382 Commissions and Fees 6,418 2,725 49 9,192 Revenues from Insurance, Pension Plans and Premium Bonds Operations before Retained Claims and Selling Expenses 1,670 142 85 1,897 Cost of Credit (3,340) (76) (0) (3,415) Retained Claims (281) (13) - (294) Other Operating Expenses (10,287) (3,941) (459) (14,687) Income before Tax and Minority Interests 4,427 3,699 1,950 10,075 Income Tax and Social Contribution (1,637) (1,228) (488) (3,352) Minority Interests in Subsidiaries (57) (177) (11) (245) Recurring Net Income 2,733 2,294 1,452 6,478 Recurring Return on Average Allocated Capital 30.4% 18.9% 17.0% 21.8% Efficiency Ratio (ER) 54.0% 48.4% 7.0% 48.7% Risk-Adjusted Efficiency Ratio (RAER) 73.8% 49.4% 7.0% 61.7% Itaú Unibanco Holding S.A. 35
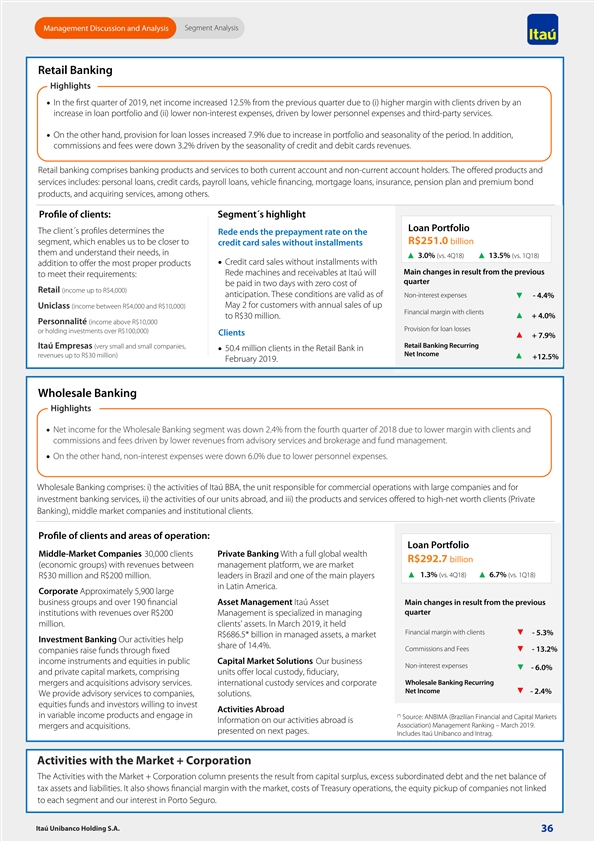
Segment Analysis Management Discussion and Analysis Retail Banking Highlights · In the first quarter of 2019, net income increased 12.5% from the previous quarter due to (i) higher margin with clients driven by an increase in loan portfolio and (ii) lower non-interest expenses, driven by lower personnel expenses and third-party services. · On the other hand, provision for loan losses increased 7.9% due to increase in portfolio and seasonality of the period. In addition, commissions and fees were down 3.2% driven by the seasonality of credit and debit cards revenues. Retail banking comprises banking products and services to both current account and non-current account holders. The offered products and services includes: personal loans, credit cards, payroll loans, vehicle financing, mortgage loans, insurance, pension plan and premium bond products, and acquiring services, among others. Profile of clients: Segment´s highlight Loan Portfolio The client´s profiles determines the Rede ends the prepayment rate on the R$251.0 billion segment, which enables us to be closer to credit card sales without installments them and understand their needs, in 3.0% (vs. 4Q18) 13.5% (vs. 1Q18) · Credit card sales without installments with addition to offer the most proper products Rede machines and receivables at Itaú will Main changes in result from the previous to meet their requirements: quarter be paid in two days with zero cost of Retail (income up to R$4,000) anticipation. These conditions are valid as of Non-interest expenses - 4.4% May 2 for customers with annual sales of up Uniclass (income between R$4,000 and R$10,000) Financial margin with clients + 4.0% to R$30 million. Personnalité (income above R$10,000 Provision for loan losses or holding investments over R$100,000) Clients + 7.9% Retail Banking Recurring Itaú Empresas (very small and small companies, · 50.4 million clients in the Retail Bank in Net Income revenues up to R$30 million) +12.5% February 2019. Wholesale Banking Highlights · Net income for the Wholesale Banking segment was down 2.4% from the fourth quarter of 2018 due to lower margin with clients and commissions and fees driven by lower revenues from advisory services and brokerage and fund management. · On the other hand, non-interest expenses were down 6.0% due to lower personnel expenses. Wholesale Banking comprises: i) the activities of Itaú BBA, the unit responsible for commercial operations with large companies and for investment banking services, ii) the activities of our units abroad, and iii) the products and services offered to high-net worth clients (Private Banking), middle market companies and institutional clients. Profile of clients and areas of operation: Loan Portfolio Middle-Market Companies 30,000 clients Private Banking With a full global wealth R$292.7 billion (economic groups) with revenues between management platform, we are market 1.3% (vs. 4Q18) 6.7% (vs. 1Q18) R$30 million and R$200 million. leaders in Brazil and one of the main players in Latin America. Corporate Approximately 5,900 large business groups and over 190 financial Asset Management Itaú Asset Main changes in result from the previous quarter institutions with revenues over R$200 Management is specialized in managing million. clients’ assets. In March 2019, it held Financial margin with clients - 5.3% R$686.5* billion in managed assets, a market Investment Banking Our activities help share of 14.4%. Commissions and Fees - 13.2% companies raise funds through fixed income instruments and equities in public Capital Market Solutions Our business Non-interest expenses - 6.0% and private capital markets, comprising units offer local custody, fiduciary, Wholesale Banking Recurring mergers and acquisitions advisory services. international custody services and corporate Net Income - 2.4% We provide advisory services to companies, solutions. equities funds and investors willing to invest Activities Abroad (*) in variable income products and engage in Source: ANBIMA (Brazilian Financial and Capital Markets Information on our activities abroad is Association) Management Ranking – March 2019. mergers and acquisitions. presented on next pages. Includes Itaú Unibanco and Intrag. Activities with the Market + Corporation The Activities with the Market + Corporation column presents the result from capital surplus, excess subordinated debt and the net balance of tax assets and liabilities. It also shows financial margin with the market, costs of Treasury operations, the equity pickup of companies not linked to each segment and our interest in Porto Seguro. Itaú Unibanco Holding S.A. 36 Segment Analysis Management Discussion and Analysis Retail Banking Highlights · In the first quarter of 2019, net income increased 12.5% from the previous quarter due to (i) higher margin with clients driven by an increase in loan portfolio and (ii) lower non-interest expenses, driven by lower personnel expenses and third-party services. · On the other hand, provision for loan losses increased 7.9% due to increase in portfolio and seasonality of the period. In addition, commissions and fees were down 3.2% driven by the seasonality of credit and debit cards revenues. Retail banking comprises banking products and services to both current account and non-current account holders. The offered products and services includes: personal loans, credit cards, payroll loans, vehicle financing, mortgage loans, insurance, pension plan and premium bond products, and acquiring services, among others. Profile of clients: Segment´s highlight Loan Portfolio The client´s profiles determines the Rede ends the prepayment rate on the R$251.0 billion segment, which enables us to be closer to credit card sales without installments them and understand their needs, in 3.0% (vs. 4Q18) 13.5% (vs. 1Q18) · Credit card sales without installments with addition to offer the most proper products Rede machines and receivables at Itaú will Main changes in result from the previous to meet their requirements: quarter be paid in two days with zero cost of Retail (income up to R$4,000) anticipation. These conditions are valid as of Non-interest expenses - 4.4% May 2 for customers with annual sales of up Uniclass (income between R$4,000 and R$10,000) Financial margin with clients + 4.0% to R$30 million. Personnalité (income above R$10,000 Provision for loan losses or holding investments over R$100,000) Clients + 7.9% Retail Banking Recurring Itaú Empresas (very small and small companies, · 50.4 million clients in the Retail Bank in Net Income revenues up to R$30 million) +12.5% February 2019. Wholesale Banking Highlights · Net income for the Wholesale Banking segment was down 2.4% from the fourth quarter of 2018 due to lower margin with clients and commissions and fees driven by lower revenues from advisory services and brokerage and fund management. · On the other hand, non-interest expenses were down 6.0% due to lower personnel expenses. Wholesale Banking comprises: i) the activities of Itaú BBA, the unit responsible for commercial operations with large companies and for investment banking services, ii) the activities of our units abroad, and iii) the products and services offered to high-net worth clients (Private Banking), middle market companies and institutional clients. Profile of clients and areas of operation: Loan Portfolio Middle-Market Companies 30,000 clients Private Banking With a full global wealth R$292.7 billion (economic groups) with revenues between management platform, we are market 1.3% (vs. 4Q18) 6.7% (vs. 1Q18) R$30 million and R$200 million. leaders in Brazil and one of the main players in Latin America. Corporate Approximately 5,900 large business groups and over 190 financial Asset Management Itaú Asset Main changes in result from the previous quarter institutions with revenues over R$200 Management is specialized in managing million. clients’ assets. In March 2019, it held Financial margin with clients - 5.3% R$686.5* billion in managed assets, a market Investment Banking Our activities help share of 14.4%. Commissions and Fees - 13.2% companies raise funds through fixed income instruments and equities in public Capital Market Solutions Our business Non-interest expenses - 6.0% and private capital markets, comprising units offer local custody, fiduciary, Wholesale Banking Recurring mergers and acquisitions advisory services. international custody services and corporate Net Income - 2.4% We provide advisory services to companies, solutions. equities funds and investors willing to invest Activities Abroad (*) in variable income products and engage in Source: ANBIMA (Brazilian Financial and Capital Markets Information on our activities abroad is Association) Management Ranking – March 2019. mergers and acquisitions. presented on next pages. Includes Itaú Unibanco and Intrag. Activities with the Market + Corporation The Activities with the Market + Corporation column presents the result from capital surplus, excess subordinated debt and the net balance of tax assets and liabilities. It also shows financial margin with the market, costs of Treasury operations, the equity pickup of companies not linked to each segment and our interest in Porto Seguro. Itaú Unibanco Holding S.A. 36
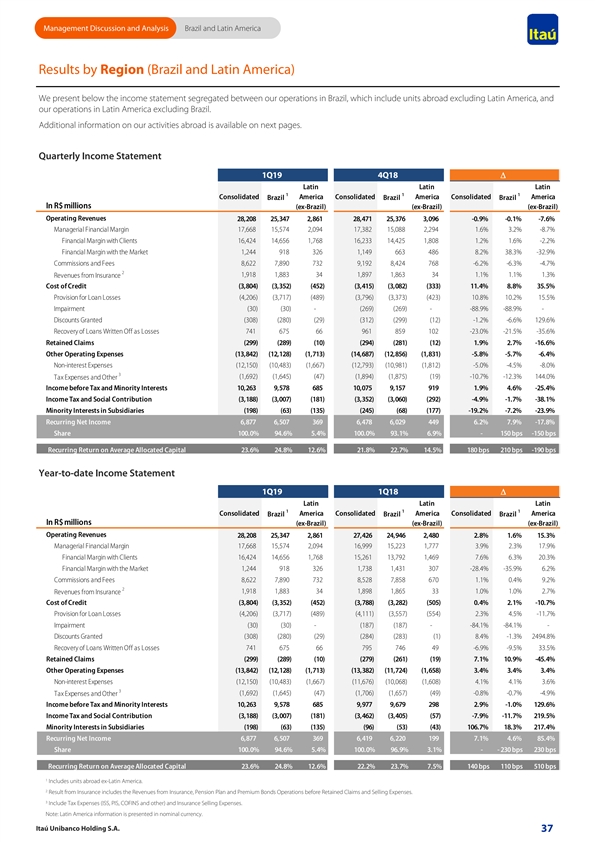
Management Discussion and Analysis Brazil and Latin America Results by Region (Brazil and Latin America) We present below the income statement segregated between our operations in Brazil, which include units abroad excluding Latin America, and our operations in Latin America excluding Brazil. Additional information on our activities abroad is available on next pages. Quarterly Income Statement 1Q19 4Q18 D Latin Latin Latin 1 1 1 Consolidated America Consolidated America Consolidated America Brazil Brazil Brazil In R$ millions (ex-Brazil) (ex-Brazil) (ex-Brazil) Operating Revenues 28,208 25,347 2,861 28,471 25,376 3,096 -0.9% -0.1% -7.6% Managerial Financial Margin 1 7,668 15,574 2,094 17,382 15,088 2,294 1.6% 3.2% -8.7% Financial Margin with Clients 1 6,424 14,656 1,768 16,233 14,425 1,808 1.2% 1.6% -2.2% Financial Margin with the Market 1,244 918 326 1,149 663 486 8.2% 38.3% -32.9% Commissions and Fees 8,622 7,890 732 9,192 8,424 768 -6.2% -6.3% -4.7% 2 1,918 1,883 34 1,897 1,863 34 1.1% 1.1% 1.3% Revenues from Insurance Cost of Credit (3,804) (3,352) (452) (3,415) (3,082) (333) 11.4% 8.8% 35.5% Provision for Loan Losses (4,206) (3,717) (489) (3,796) (3,373) (423) 10.8% 10.2% 15.5% Impairment (30) (30) - (269) (269) - -88.9% -88.9% - Discounts Granted (308) (280) (29) (312) (299) (12) -1.2% -6.6% 129.6% Recovery of Loans Written Off as Losses 741 675 66 961 8 59 102 -23.0% -21.5% -35.6% Retained Claims (299) (289) (10) (294) (281) (12) 1.9% 2.7% -16.6% Other Operating Expenses (13,842) (1 2,128) (1,713) (14,687) (12,856) (1,831) -5.8% -5.7% -6.4% Non-interest Expenses (12,150) (10,483) (1,667) (12,793) (10,981) (1,812) -5.0% -4.5% -8.0% 3 (1,692) (1,645) (47) (1,894) ( 1,875) (19) -10.7% -12.3% 144.0% Tax Expenses and Other Income before Tax and Minority Interests 10,263 9,578 685 10,075 9,157 919 1.9% 4.6% -25.4% Income Tax and Social Contribution (3,188) (3,007) (181) (3,352) (3,060) (292) -4.9% -1.7% -38.1% Minority Interests in Subsidiaries (198) (63) (135) (245) (68) (177) -19.2% -7.2% -23.9% Recurring Net Income 6,877 6 ,507 369 6,478 6,029 449 6.2% 7.9% -17.8% Share 100.0% 94.6% 5.4% 100.0% 93.1% 6.9% - 150 bps -150 bps Recurring Return on Average Allocated Capital 23.6% 24.8% 12.6% 21.8% 22.7% 14.5% 180 bps 210 bps -190 bps Year-to-date Income Statement 1Q19 1Q18 D Latin Latin Latin 1 1 1 Consolidated Brazil America Consolidated Brazil America Consolidated Brazil America In R$ millions (ex-Brazil) (ex-Brazil) (ex-Brazil) Operating Revenues 28,208 25,347 2,861 27,426 24,946 2,480 2.8% 1.6% 15.3% Managerial Financial Margin 17,668 1 5,574 2,094 16,999 1 5,223 1,777 3.9% 2.3% 17.9% Financial Margin with Clients 16,424 1 4,656 1,768 15,261 1 3,792 1,469 7.6% 6.3% 20.3% Financial Margin with the Market 1,244 918 326 1,738 1,431 307 -28.4% -35.9% 6.2% Commissions and Fees 8,622 7,890 732 8,528 7,858 670 1.1% 0.4% 9.2% 2 Revenues from Insurance 1,918 1,883 34 1,898 1,865 33 1.0% 1.0% 2.7% Cost of Credit (3,804) (3,352) (452) (3,788) (3,282) (505) 0.4% 2.1% -10.7% Provision for Loan Losses (4,206) (3,717) (489) (4,111) (3,557) (554) 2.3% 4.5% -11.7% Impairment (30) (30) - (187) (187) - -84.1% -84.1% - Discounts Granted (308) (280) (29) (284) (283) (1) 8.4% -1.3% 2494.8% Recovery of Loans Written Off as Losses 741 675 66 795 746 49 -6.9% -9.5% 33.5% Retained Claims (299) (289) (1 0) (279) (261) (19) 7.1% 10.9% -45.4% Other Operating Expenses (13,842) (12,128) (1,713) (13,382) (11,724) (1,658) 3.4% 3.4% 3.4% Non-interest Expenses (12,150) (10,483) (1,667) (11,676) (10,068) (1,608) 4.1% 4.1% 3.6% 3 (1,692) (1,645) (47) (1,706) (1,657) (49) -0.8% -0.7% -4.9% Tax Expenses and Other Income before Tax and Minority Interests 10,263 9,578 685 9,977 9,679 298 2.9% -1.0% 129.6% Income Tax and Social Contribution (3,188) (3,007) (181) (3,462) (3,405) (57) -7.9% -11.7% 219.5% Minority Interests in Subsidiaries (198) (63) (135) (96) (53) (43) 106.7% 18.3% 217.4% Recurring Net Income 6,877 6,507 369 6,419 6,220 199 7.1% 4.6% 85.4% Share 100.0% 94.6% 5.4% 100.0% 96.9% 3.1% - - 230 bps 230 bps Recurring Return on Average Allocated Capital 23.6% 24.8% 12.6% 22.2% 23.7% 7.5% 140 bps 110 bps 510 bps 1 Includes units abroad ex-Latin America. 2 Result from Insurance includes the Revenues from Insurance, Pension Plan and Premium Bonds Operations before Retained Claims and Selling Expenses. 3 Include Tax Expenses (ISS, PIS, COFINS and other) and Insurance Selling Expenses. Note: Latin America information is presented in nominal currency. Itaú Unibanco Holding S.A. 37 Management Discussion and Analysis Brazil and Latin America Results by Region (Brazil and Latin America) We present below the income statement segregated between our operations in Brazil, which include units abroad excluding Latin America, and our operations in Latin America excluding Brazil. Additional information on our activities abroad is available on next pages. Quarterly Income Statement 1Q19 4Q18 D Latin Latin Latin 1 1 1 Consolidated America Consolidated America Consolidated America Brazil Brazil Brazil In R$ millions (ex-Brazil) (ex-Brazil) (ex-Brazil) Operating Revenues 28,208 25,347 2,861 28,471 25,376 3,096 -0.9% -0.1% -7.6% Managerial Financial Margin 1 7,668 15,574 2,094 17,382 15,088 2,294 1.6% 3.2% -8.7% Financial Margin with Clients 1 6,424 14,656 1,768 16,233 14,425 1,808 1.2% 1.6% -2.2% Financial Margin with the Market 1,244 918 326 1,149 663 486 8.2% 38.3% -32.9% Commissions and Fees 8,622 7,890 732 9,192 8,424 768 -6.2% -6.3% -4.7% 2 1,918 1,883 34 1,897 1,863 34 1.1% 1.1% 1.3% Revenues from Insurance Cost of Credit (3,804) (3,352) (452) (3,415) (3,082) (333) 11.4% 8.8% 35.5% Provision for Loan Losses (4,206) (3,717) (489) (3,796) (3,373) (423) 10.8% 10.2% 15.5% Impairment (30) (30) - (269) (269) - -88.9% -88.9% - Discounts Granted (308) (280) (29) (312) (299) (12) -1.2% -6.6% 129.6% Recovery of Loans Written Off as Losses 741 675 66 961 8 59 102 -23.0% -21.5% -35.6% Retained Claims (299) (289) (10) (294) (281) (12) 1.9% 2.7% -16.6% Other Operating Expenses (13,842) (1 2,128) (1,713) (14,687) (12,856) (1,831) -5.8% -5.7% -6.4% Non-interest Expenses (12,150) (10,483) (1,667) (12,793) (10,981) (1,812) -5.0% -4.5% -8.0% 3 (1,692) (1,645) (47) (1,894) ( 1,875) (19) -10.7% -12.3% 144.0% Tax Expenses and Other Income before Tax and Minority Interests 10,263 9,578 685 10,075 9,157 919 1.9% 4.6% -25.4% Income Tax and Social Contribution (3,188) (3,007) (181) (3,352) (3,060) (292) -4.9% -1.7% -38.1% Minority Interests in Subsidiaries (198) (63) (135) (245) (68) (177) -19.2% -7.2% -23.9% Recurring Net Income 6,877 6 ,507 369 6,478 6,029 449 6.2% 7.9% -17.8% Share 100.0% 94.6% 5.4% 100.0% 93.1% 6.9% - 150 bps -150 bps Recurring Return on Average Allocated Capital 23.6% 24.8% 12.6% 21.8% 22.7% 14.5% 180 bps 210 bps -190 bps Year-to-date Income Statement 1Q19 1Q18 D Latin Latin Latin 1 1 1 Consolidated Brazil America Consolidated Brazil America Consolidated Brazil America In R$ millions (ex-Brazil) (ex-Brazil) (ex-Brazil) Operating Revenues 28,208 25,347 2,861 27,426 24,946 2,480 2.8% 1.6% 15.3% Managerial Financial Margin 17,668 1 5,574 2,094 16,999 1 5,223 1,777 3.9% 2.3% 17.9% Financial Margin with Clients 16,424 1 4,656 1,768 15,261 1 3,792 1,469 7.6% 6.3% 20.3% Financial Margin with the Market 1,244 918 326 1,738 1,431 307 -28.4% -35.9% 6.2% Commissions and Fees 8,622 7,890 732 8,528 7,858 670 1.1% 0.4% 9.2% 2 Revenues from Insurance 1,918 1,883 34 1,898 1,865 33 1.0% 1.0% 2.7% Cost of Credit (3,804) (3,352) (452) (3,788) (3,282) (505) 0.4% 2.1% -10.7% Provision for Loan Losses (4,206) (3,717) (489) (4,111) (3,557) (554) 2.3% 4.5% -11.7% Impairment (30) (30) - (187) (187) - -84.1% -84.1% - Discounts Granted (308) (280) (29) (284) (283) (1) 8.4% -1.3% 2494.8% Recovery of Loans Written Off as Losses 741 675 66 795 746 49 -6.9% -9.5% 33.5% Retained Claims (299) (289) (1 0) (279) (261) (19) 7.1% 10.9% -45.4% Other Operating Expenses (13,842) (12,128) (1,713) (13,382) (11,724) (1,658) 3.4% 3.4% 3.4% Non-interest Expenses (12,150) (10,483) (1,667) (11,676) (10,068) (1,608) 4.1% 4.1% 3.6% 3 (1,692) (1,645) (47) (1,706) (1,657) (49) -0.8% -0.7% -4.9% Tax Expenses and Other Income before Tax and Minority Interests 10,263 9,578 685 9,977 9,679 298 2.9% -1.0% 129.6% Income Tax and Social Contribution (3,188) (3,007) (181) (3,462) (3,405) (57) -7.9% -11.7% 219.5% Minority Interests in Subsidiaries (198) (63) (135) (96) (53) (43) 106.7% 18.3% 217.4% Recurring Net Income 6,877 6,507 369 6,419 6,220 199 7.1% 4.6% 85.4% Share 100.0% 94.6% 5.4% 100.0% 96.9% 3.1% - - 230 bps 230 bps Recurring Return on Average Allocated Capital 23.6% 24.8% 12.6% 22.2% 23.7% 7.5% 140 bps 110 bps 510 bps 1 Includes units abroad ex-Latin America. 2 Result from Insurance includes the Revenues from Insurance, Pension Plan and Premium Bonds Operations before Retained Claims and Selling Expenses. 3 Include Tax Expenses (ISS, PIS, COFINS and other) and Insurance Selling Expenses. Note: Latin America information is presented in nominal currency. Itaú Unibanco Holding S.A. 37
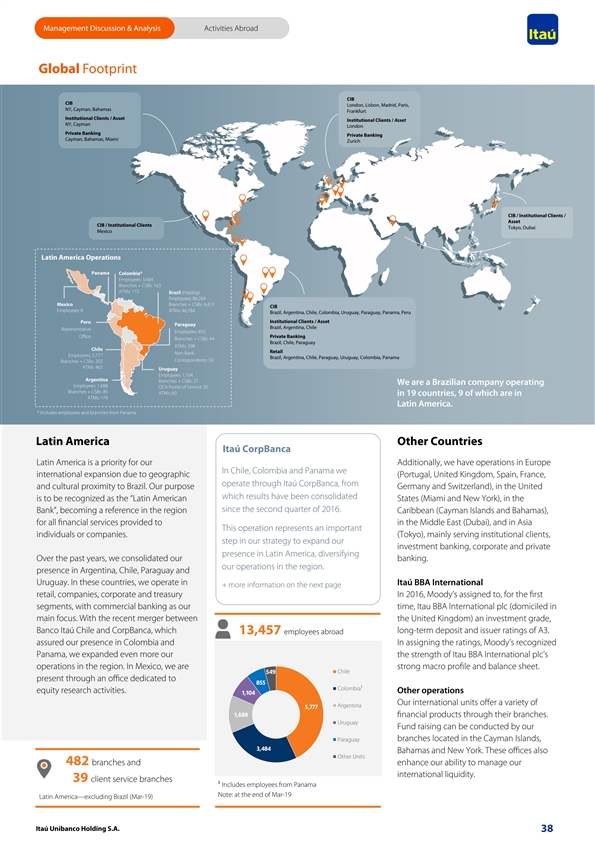
Management Discussion & Analysis Activities Abroad Global Footprint CIB CIB London, Lisbon, Madrid, Paris, NY, Cayman, Bahamas Frankfurt Institutional Clients / Asset Institutional Clients / Asset NY, Cayman London Private Banking Private Banking Cayman, Bahamas, Miami Zurich CIB / Institutional Clients / Asset CIB / Institutional Clients Tokyo, Dubai Mexico Latin America Operations Panama Colombia* Employees: 3,484 Branches + CSBs: 163 ATMs: 172 Brazil (Holding) Employees: 86,204 Mexico Branches + CSBs: 4,413 CIB Employees: 8 ATMs: 46,784 Brazil, Argentina, Chile, Colombia, Uruguay, Paraguay, Panama, Peru Institutional Clients / Asset Peru Paraguay Brazil, Argentina, Chile Representative Employees: 855 Office Private Banking Branches + CSBs: 44 Brazil, Chile, Paraguay ATMs: 298 Chile Retail Non-Bank Employees: 5,777 Brazil, Argentina, Chile, Paraguay, Uruguay, Colombia, Panama Correspondents: 59 Branches + CSBs: 202 ATMs: 463 Uruguay Employees: 1,104 Argentina Branches + CSBs: 27 We are a Brazilian company operating Employees: 1,688 OCA Points of Service: 35 Branches + CSBs: 85 ATMs: 60 in 19 countries, 9 of which are in ATMs: 176 Latin America. * Includes employees and branches from Panama Latin America Other Countries Itaú CorpBanca Latin America is a priority for our Additionally, we have operations in Europe In Chile, Colombia and Panama we international expansion due to geographic (Portugal, United Kingdom, Spain, France, operate through Itaú CorpBanca, from and cultural proximity to Brazil. Our purpose Germany and Switzerland), in the United which results have been consolidated is to be recognized as the “Latin American States (Miami and New York), in the since the second quarter of 2016. Bank”, becoming a reference in the region Caribbean (Cayman Islands and Bahamas), for all financial services provided to in the Middle East (Dubai), and in Asia This operation represents an important individuals or companies. (Tokyo), mainly serving institutional clients, step in our strategy to expand our investment banking, corporate and private presence in Latin America, diversifying Over the past years, we consolidated our banking. our operations in the region. presence in Argentina, Chile, Paraguay and Uruguay. In these countries, we operate in Itaú BBA International + more information on the next page retail, companies, corporate and treasury In 2016, Moody’s assigned to, for the first segments, with commercial banking as our time, Itau BBA International plc (domiciled in main focus. With the recent merger between the United Kingdom) an investment grade, Banco Itaú Chile and CorpBanca, which long-term deposit and issuer ratings of A3. 13,457 employees abroad assured our presence in Colombia and In assigning the ratings, Moody’s recognized Panama, we expanded even more our the strength of Itau BBA International plc’s operations in the region. In Mexico, we are strong macro profile and balance sheet. Chile 549 present through an office dedicated to 855 1 Colombia¹ equity research activities. Other operations 1,104 Our international units offer a variety of Argentina 5,777 1,688 financial products through their branches. Uruguay Fund raising can be conducted by our branches located in the Cayman Islands, Paraguay 3,484 Bahamas and New York. These offices also Other Units 482 branches and enhance our ability to manage our international liquidity. 39 client service branches 1 Includes employees from Panama Note: at the end of Mar-19 Latin America—excluding Brazil (Mar-19) Itaú Unibanco Holding S.A. 38 Management Discussion & Analysis Activities Abroad Global Footprint CIB CIB London, Lisbon, Madrid, Paris, NY, Cayman, Bahamas Frankfurt Institutional Clients / Asset Institutional Clients / Asset NY, Cayman London Private Banking Private Banking Cayman, Bahamas, Miami Zurich CIB / Institutional Clients / Asset CIB / Institutional Clients Tokyo, Dubai Mexico Latin America Operations Panama Colombia* Employees: 3,484 Branches + CSBs: 163 ATMs: 172 Brazil (Holding) Employees: 86,204 Mexico Branches + CSBs: 4,413 CIB Employees: 8 ATMs: 46,784 Brazil, Argentina, Chile, Colombia, Uruguay, Paraguay, Panama, Peru Institutional Clients / Asset Peru Paraguay Brazil, Argentina, Chile Representative Employees: 855 Office Private Banking Branches + CSBs: 44 Brazil, Chile, Paraguay ATMs: 298 Chile Retail Non-Bank Employees: 5,777 Brazil, Argentina, Chile, Paraguay, Uruguay, Colombia, Panama Correspondents: 59 Branches + CSBs: 202 ATMs: 463 Uruguay Employees: 1,104 Argentina Branches + CSBs: 27 We are a Brazilian company operating Employees: 1,688 OCA Points of Service: 35 Branches + CSBs: 85 ATMs: 60 in 19 countries, 9 of which are in ATMs: 176 Latin America. * Includes employees and branches from Panama Latin America Other Countries Itaú CorpBanca Latin America is a priority for our Additionally, we have operations in Europe In Chile, Colombia and Panama we international expansion due to geographic (Portugal, United Kingdom, Spain, France, operate through Itaú CorpBanca, from and cultural proximity to Brazil. Our purpose Germany and Switzerland), in the United which results have been consolidated is to be recognized as the “Latin American States (Miami and New York), in the since the second quarter of 2016. Bank”, becoming a reference in the region Caribbean (Cayman Islands and Bahamas), for all financial services provided to in the Middle East (Dubai), and in Asia This operation represents an important individuals or companies. (Tokyo), mainly serving institutional clients, step in our strategy to expand our investment banking, corporate and private presence in Latin America, diversifying Over the past years, we consolidated our banking. our operations in the region. presence in Argentina, Chile, Paraguay and Uruguay. In these countries, we operate in Itaú BBA International + more information on the next page retail, companies, corporate and treasury In 2016, Moody’s assigned to, for the first segments, with commercial banking as our time, Itau BBA International plc (domiciled in main focus. With the recent merger between the United Kingdom) an investment grade, Banco Itaú Chile and CorpBanca, which long-term deposit and issuer ratings of A3. 13,457 employees abroad assured our presence in Colombia and In assigning the ratings, Moody’s recognized Panama, we expanded even more our the strength of Itau BBA International plc’s operations in the region. In Mexico, we are strong macro profile and balance sheet. Chile 549 present through an office dedicated to 855 1 Colombia¹ equity research activities. Other operations 1,104 Our international units offer a variety of Argentina 5,777 1,688 financial products through their branches. Uruguay Fund raising can be conducted by our branches located in the Cayman Islands, Paraguay 3,484 Bahamas and New York. These offices also Other Units 482 branches and enhance our ability to manage our international liquidity. 39 client service branches 1 Includes employees from Panama Note: at the end of Mar-19 Latin America—excluding Brazil (Mar-19) Itaú Unibanco Holding S.A. 38
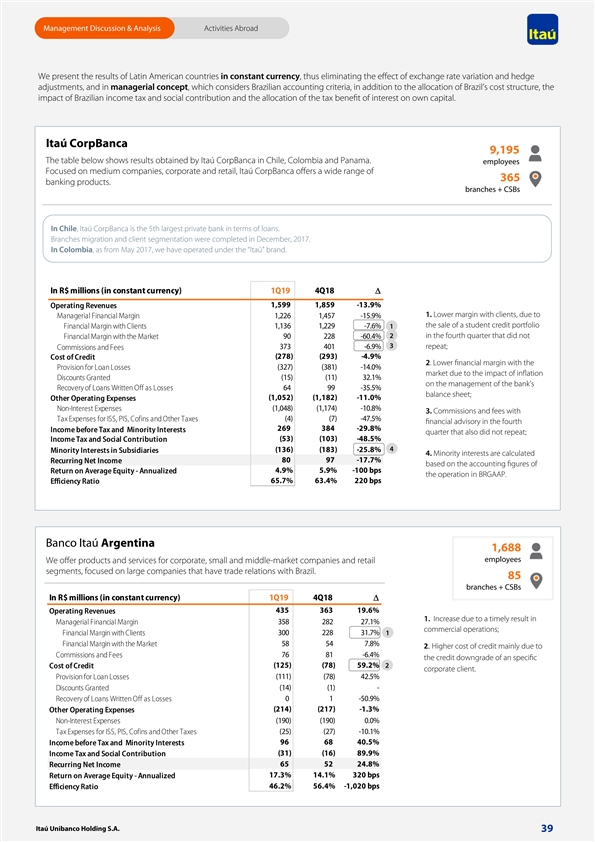
Management Discussion & Analysis Activities Abroad We present the results of Latin American countries in constant currency, thus eliminating the effect of exchange rate variation and hedge adjustments, and in managerial concept, which considers Brazilian accounting criteria, in addition to the allocation of Brazil’s cost structure, the impact of Brazilian income tax and social contribution and the allocation of the tax benefit of interest on own capital. Itaú CorpBanca 9,195 The table below shows results obtained by Itaú CorpBanca in Chile, Colombia and Panama. employees Focused on medium companies, corporate and retail, Itaú CorpBanca offers a wide range of 365 banking products. branches + CSBs In Chile, Itaú CorpBanca is the 5th largest private bank in terms of loans. Branches migration and client segmentation were completed in December, 2017. In Colombia, as from May 2017, we have operated under the “Itaú” brand. In R$ millions (in constant currency) 1Q19 4Q18D Operating Revenues 1,599 1,859 -13.9% 1. Lower margin with clients, due to Managerial Financial Margin 1,226 1,457 -15.9% the sale of a student credit portfolio Financial Margin with Clients 1,136 1,229 -7.6% 1 2 in the fourth quarter that did not Financial Margin with the Market 90 228 -60.4% 3 373 401 -6.9% repeat; Commissions and Fees (278) (293) -4.9% Cost of Credit 2. Lower financial margin with the Provision for Loan Losses (327) (381) -14.0% market due to the impact of inflation Discounts Granted (15) (11) 32.1% on the management of the bank’s Recovery of Loans Written Off as Losses 64 99 -35.5% balance sheet; (1,052) (1,182) -11.0% Other Operating Expenses Non-Interest Expenses (1 ,048) (1,174) -10.8% 3. Commissions and fees with Tax Expenses for ISS, PIS, Cofins and Other Taxes (4) (7) -47.5% financial advisory in the fourth 269 384 -29.8% Income before Tax and Minority Interests quarter that also did not repeat; (53) ( 103) -48.5% Income Tax and Social Contribution 4 (1 36) (183) -25.8% Minority Interests in Subsidiaries 4. Minority interests are calculated Recurring Net Income 80 97 -17.7% based on the accounting figures of 4.9% 5.9% -100 bps Return on Average Equity - Annualized the operation in BRGAAP. 65.7% 63.4% 220 bps Efficiency Ratio Banco Itaú Argentina 1,688 employees We offer products and services for corporate, small and middle-market companies and retail segments, focused on large companies that have trade relations with Brazil. 85 branches + CSBs In R$ millions (in constant currency) 1Q19 4Q18 D 435 363 19.6% Operating Revenues 1. Increase due to a timely result in Managerial Financial Margin 358 282 27.1% commercial operations; Financial Margin with Clients 300 228 31.7% 1 Financial Margin with the Market 58 54 7.8% 2. Higher cost of credit mainly due to Commissions and Fees 76 81 -6.4% the credit downgrade of an specific Cost of Credit (125) (78) 59.2% 2 corporate client. Provision for Loan Losses (111) (78) 42.5% Discounts Granted (14) (1) - Recovery of Loans Written Off as Losses 0 1 -50.9% Other Operating Expenses (214) (217) -1.3% Non-Interest Expenses (190) (190) 0.0% Tax Expenses for ISS, PIS, Cofins and Other Taxes (25) (27) -10.1% Income before Tax and Minority Interests 96 68 40.5% Income Tax and Social Contribution (31) (16) 89.9% Recurring Net Income 65 52 24.8% Return on Average Equity - Annualized 17.3% 14.1% 320 bps Efficiency Ratio 46.2% 56.4% -1,020 bps Itaú Unibanco Holding S.A. 39 Management Discussion & Analysis Activities Abroad We present the results of Latin American countries in constant currency, thus eliminating the effect of exchange rate variation and hedge adjustments, and in managerial concept, which considers Brazilian accounting criteria, in addition to the allocation of Brazil’s cost structure, the impact of Brazilian income tax and social contribution and the allocation of the tax benefit of interest on own capital. Itaú CorpBanca 9,195 The table below shows results obtained by Itaú CorpBanca in Chile, Colombia and Panama. employees Focused on medium companies, corporate and retail, Itaú CorpBanca offers a wide range of 365 banking products. branches + CSBs In Chile, Itaú CorpBanca is the 5th largest private bank in terms of loans. Branches migration and client segmentation were completed in December, 2017. In Colombia, as from May 2017, we have operated under the “Itaú” brand. In R$ millions (in constant currency) 1Q19 4Q18D Operating Revenues 1,599 1,859 -13.9% 1. Lower margin with clients, due to Managerial Financial Margin 1,226 1,457 -15.9% the sale of a student credit portfolio Financial Margin with Clients 1,136 1,229 -7.6% 1 2 in the fourth quarter that did not Financial Margin with the Market 90 228 -60.4% 3 373 401 -6.9% repeat; Commissions and Fees (278) (293) -4.9% Cost of Credit 2. Lower financial margin with the Provision for Loan Losses (327) (381) -14.0% market due to the impact of inflation Discounts Granted (15) (11) 32.1% on the management of the bank’s Recovery of Loans Written Off as Losses 64 99 -35.5% balance sheet; (1,052) (1,182) -11.0% Other Operating Expenses Non-Interest Expenses (1 ,048) (1,174) -10.8% 3. Commissions and fees with Tax Expenses for ISS, PIS, Cofins and Other Taxes (4) (7) -47.5% financial advisory in the fourth 269 384 -29.8% Income before Tax and Minority Interests quarter that also did not repeat; (53) ( 103) -48.5% Income Tax and Social Contribution 4 (1 36) (183) -25.8% Minority Interests in Subsidiaries 4. Minority interests are calculated Recurring Net Income 80 97 -17.7% based on the accounting figures of 4.9% 5.9% -100 bps Return on Average Equity - Annualized the operation in BRGAAP. 65.7% 63.4% 220 bps Efficiency Ratio Banco Itaú Argentina 1,688 employees We offer products and services for corporate, small and middle-market companies and retail segments, focused on large companies that have trade relations with Brazil. 85 branches + CSBs In R$ millions (in constant currency) 1Q19 4Q18 D 435 363 19.6% Operating Revenues 1. Increase due to a timely result in Managerial Financial Margin 358 282 27.1% commercial operations; Financial Margin with Clients 300 228 31.7% 1 Financial Margin with the Market 58 54 7.8% 2. Higher cost of credit mainly due to Commissions and Fees 76 81 -6.4% the credit downgrade of an specific Cost of Credit (125) (78) 59.2% 2 corporate client. Provision for Loan Losses (111) (78) 42.5% Discounts Granted (14) (1) - Recovery of Loans Written Off as Losses 0 1 -50.9% Other Operating Expenses (214) (217) -1.3% Non-Interest Expenses (190) (190) 0.0% Tax Expenses for ISS, PIS, Cofins and Other Taxes (25) (27) -10.1% Income before Tax and Minority Interests 96 68 40.5% Income Tax and Social Contribution (31) (16) 89.9% Recurring Net Income 65 52 24.8% Return on Average Equity - Annualized 17.3% 14.1% 320 bps Efficiency Ratio 46.2% 56.4% -1,020 bps Itaú Unibanco Holding S.A. 39
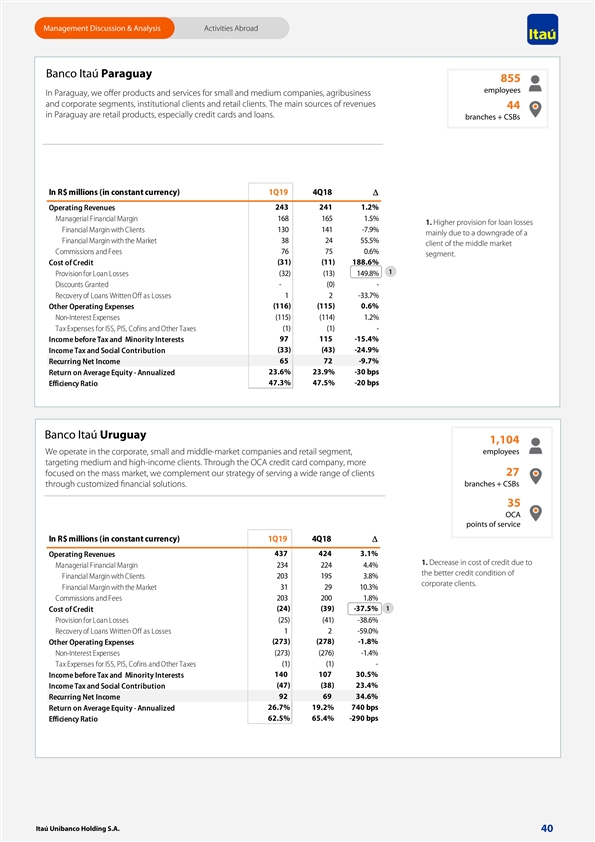
Management Discussion & Analysis Activities Abroad Banco Itaú Paraguay 855 employees In Paraguay, we offer products and services for small and medium companies, agribusiness and corporate segments, institutional clients and retail clients. The main sources of revenues 44 in Paraguay are retail products, especially credit cards and loans. branches + CSBs In R$ millions (in constant currency) 1Q19 4Q18D Operating Revenues 243 241 1.2% Managerial Financial Margin 168 165 1.5% 1. Higher provision for loan losses Financial Margin with Clients 130 141 -7.9% mainly due to a downgrade of a Financial Margin with the Market 38 24 55.5% client of the middle market Commissions and Fees 76 75 0.6% segment. Cost of Credit ( 31) (11) 188.6% 1 Provision for Loan Losses (32) ( 13) 149.8% Discounts Granted - (0) - Recovery of Loans Written Off as Losses 1 2 -33.7% Other Operating Expenses ( 116) (115) 0.6% Non-Interest Expenses (115) (114) 1.2% Tax Expenses for ISS, PIS, Cofins and Other Taxes (1) (1) - Income before Tax and Minority Interests 97 115 -15.4% Income Tax and Social Contribution ( 33) (43) -24.9% Recurring Net Income 65 72 -9.7% 23.6% 23.9% -30 bps Return on Average Equity - Annualized 47.3% 47.5% -20 bps Efficiency Ratio Banco Itaú Uruguay 1,104 employees We operate in the corporate, small and middle-market companies and retail segment, targeting medium and high-income clients. Through the OCA credit card company, more focused on the mass market, we complement our strategy of serving a wide range of clients 27 branches + CSBs through customized financial solutions. 35 OCA points of service In R$ millions (in constant currency) 1Q19 4Q18D 437 424 3.1% Operating Revenues 1. Decrease in cost of credit due to Managerial Financial Margin 234 224 4.4% the better credit condition of Financial Margin with Clients 203 195 3.8% corporate clients. Financial Margin with the Market 31 29 10.3% Commissions and Fees 203 200 1.8% (24) (39) -37.5% 1 Cost of Credit Provision for Loan Losses (25) (41) -38.6% Recovery of Loans Written Off as Losses 1 2 -59.0% ( 273) ( 278) -1.8% Other Operating Expenses Non-Interest Expenses (273) (276) -1.4% Tax Expenses for ISS, PIS, Cofins and Other Taxes (1) (1) - 140 107 30.5% Income before Tax and Minority Interests (47) (38) 23.4% Income Tax and Social Contribution 92 69 34.6% Recurring Net Income 26.7% 19.2% 740 bps Return on Average Equity - Annualized 62.5% 65.4% -290 bps Efficiency Ratio Itaú Unibanco Holding S.A. 40 Management Discussion & Analysis Activities Abroad Banco Itaú Paraguay 855 employees In Paraguay, we offer products and services for small and medium companies, agribusiness and corporate segments, institutional clients and retail clients. The main sources of revenues 44 in Paraguay are retail products, especially credit cards and loans. branches + CSBs In R$ millions (in constant currency) 1Q19 4Q18D Operating Revenues 243 241 1.2% Managerial Financial Margin 168 165 1.5% 1. Higher provision for loan losses Financial Margin with Clients 130 141 -7.9% mainly due to a downgrade of a Financial Margin with the Market 38 24 55.5% client of the middle market Commissions and Fees 76 75 0.6% segment. Cost of Credit ( 31) (11) 188.6% 1 Provision for Loan Losses (32) ( 13) 149.8% Discounts Granted - (0) - Recovery of Loans Written Off as Losses 1 2 -33.7% Other Operating Expenses ( 116) (115) 0.6% Non-Interest Expenses (115) (114) 1.2% Tax Expenses for ISS, PIS, Cofins and Other Taxes (1) (1) - Income before Tax and Minority Interests 97 115 -15.4% Income Tax and Social Contribution ( 33) (43) -24.9% Recurring Net Income 65 72 -9.7% 23.6% 23.9% -30 bps Return on Average Equity - Annualized 47.3% 47.5% -20 bps Efficiency Ratio Banco Itaú Uruguay 1,104 employees We operate in the corporate, small and middle-market companies and retail segment, targeting medium and high-income clients. Through the OCA credit card company, more focused on the mass market, we complement our strategy of serving a wide range of clients 27 branches + CSBs through customized financial solutions. 35 OCA points of service In R$ millions (in constant currency) 1Q19 4Q18D 437 424 3.1% Operating Revenues 1. Decrease in cost of credit due to Managerial Financial Margin 234 224 4.4% the better credit condition of Financial Margin with Clients 203 195 3.8% corporate clients. Financial Margin with the Market 31 29 10.3% Commissions and Fees 203 200 1.8% (24) (39) -37.5% 1 Cost of Credit Provision for Loan Losses (25) (41) -38.6% Recovery of Loans Written Off as Losses 1 2 -59.0% ( 273) ( 278) -1.8% Other Operating Expenses Non-Interest Expenses (273) (276) -1.4% Tax Expenses for ISS, PIS, Cofins and Other Taxes (1) (1) - 140 107 30.5% Income before Tax and Minority Interests (47) (38) 23.4% Income Tax and Social Contribution 92 69 34.6% Recurring Net Income 26.7% 19.2% 740 bps Return on Average Equity - Annualized 62.5% 65.4% -290 bps Efficiency Ratio Itaú Unibanco Holding S.A. 40
Additional Information Management Discussion & Analysis and Complete Financial Statements Additional Information Management Discussion & Analysis and Complete Financial Statements
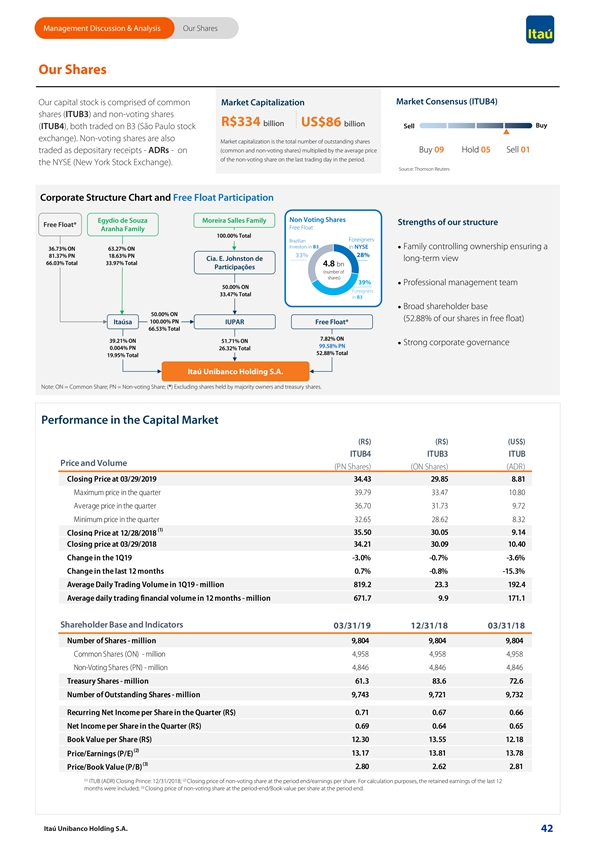
Management Discussion & Analysis Our Shares Our Shares Our capital stock is comprised of common Market Capitalization Market Consensus (ITUB4) shares (ITUB3) and non-voting shares R$334 billion US$86 billion Sell Buy (ITUB4), both traded on B3 (São Paulo stock exchange). Non-voting shares are also Market capitalization is the total number of outstanding shares (common and non-voting shares) multiplied by the average price Buy 09 Hold 05 Sell 01 traded as depositary receipts - ADRs - on of the non-voting share on the last trading day in the period. the NYSE (New York Stock Exchange). Source: Thomson Reuters Corporate Structure Chart and Free Float Participation Non Voting Shares Egydio de Souza Moreira Salles Family Strengths of our structure Free Float* Free Float Aranha Family 100.00% Total Foreigners Brazilian Investors in B3 in NYSE · Family controlling ownership ensuring a 36.73% ON 63.27% ON 33% 28% 81.37% PN 18.63% PN Cia. E. Johnston de long-term view 66.03% Total 33.97% Total 4.8 bn Participações (number of shares) 39%· Professional management team 50.00% ON Foreigners 33.47% Total in B3 · Broad shareholder base 50.00% ON (52.88% of our shares in free float) Itaúsa 100.00% PN IUPAR Free Float* 66.53% Total 7.82% ON 39.21% ON 51.71% ON · Strong corporate governance 99.58% PN 0.004% PN 26.32% Total 52.88% Total 19.95% Total Itaú Unibanco Holding S.A. Note: ON = Common Share; PN = Non-voting Share; (*) Excluding shares held by majority owners and treasury shares. Performance in the Capital Market (R$) (R$) (US$) ITUB4 ITUB3 ITUB Price and Volume (PN Shares) (ON Shares) (ADR) Closing Price at 03/29/2019 34.43 29.85 8.81 Maximum price in the quarter 39.79 33.47 10.80 Average price in the quarter 36.70 31.73 9.72 Minimum price in the quarter 32.65 28.62 8.32 (1) 35.50 30.05 9.14 Closing Price at 12/28/2018 Closing price at 03/29/2018 34.21 30.09 10.40 Change in the 1Q19 -3.0% -0.7% -3.6% Change in the last 12 months 0.7% -0.8% -15.3% Average Daily Trading Volume in 1Q19 - million 819.2 23.3 192.4 Average daily trading financial volume in 12 months - million 671.7 9.9 171.1 Shareholder Base and Indicators 03/31/19 12/31/18 03/31/18 Number of Shares - million 9,804 9,804 9,804 Common Shares (ON) - million 4,958 4,958 4,958 Non-Voting Shares (PN) - million 4,846 4 ,846 4,846 Treasury Shares - million 61.3 83.6 72.6 Number of Outstanding Shares - million 9,743 9,721 9,732 Recurring Net Income per Share in the Quarter (R$) 0.71 0.67 0.66 Net Income per Share in the Quarter (R$) 0.69 0.64 0.65 Book Value per Share (R$) 12.30 13.55 12.18 (2) Price/Earnings (P/E) 13.17 13.81 13.78 (3) 2.80 2.62 2.81 Price/Book Value (P/B) (1) (2) ITUB (ADR) Closing Prince: 12/31/2018; Closing price of non-voting share at the period end/earnings per share. For calculation purposes, the retained earnings of the last 12 (3) months were included; Closing price of non-voting share at the period-end/Book value per share at the period end. Itaú Unibanco Holding S.A. 42 Management Discussion & Analysis Our Shares Our Shares Our capital stock is comprised of common Market Capitalization Market Consensus (ITUB4) shares (ITUB3) and non-voting shares R$334 billion US$86 billion Sell Buy (ITUB4), both traded on B3 (São Paulo stock exchange). Non-voting shares are also Market capitalization is the total number of outstanding shares (common and non-voting shares) multiplied by the average price Buy 09 Hold 05 Sell 01 traded as depositary receipts - ADRs - on of the non-voting share on the last trading day in the period. the NYSE (New York Stock Exchange). Source: Thomson Reuters Corporate Structure Chart and Free Float Participation Non Voting Shares Egydio de Souza Moreira Salles Family Strengths of our structure Free Float* Free Float Aranha Family 100.00% Total Foreigners Brazilian Investors in B3 in NYSE · Family controlling ownership ensuring a 36.73% ON 63.27% ON 33% 28% 81.37% PN 18.63% PN Cia. E. Johnston de long-term view 66.03% Total 33.97% Total 4.8 bn Participações (number of shares) 39%· Professional management team 50.00% ON Foreigners 33.47% Total in B3 · Broad shareholder base 50.00% ON (52.88% of our shares in free float) Itaúsa 100.00% PN IUPAR Free Float* 66.53% Total 7.82% ON 39.21% ON 51.71% ON · Strong corporate governance 99.58% PN 0.004% PN 26.32% Total 52.88% Total 19.95% Total Itaú Unibanco Holding S.A. Note: ON = Common Share; PN = Non-voting Share; (*) Excluding shares held by majority owners and treasury shares. Performance in the Capital Market (R$) (R$) (US$) ITUB4 ITUB3 ITUB Price and Volume (PN Shares) (ON Shares) (ADR) Closing Price at 03/29/2019 34.43 29.85 8.81 Maximum price in the quarter 39.79 33.47 10.80 Average price in the quarter 36.70 31.73 9.72 Minimum price in the quarter 32.65 28.62 8.32 (1) 35.50 30.05 9.14 Closing Price at 12/28/2018 Closing price at 03/29/2018 34.21 30.09 10.40 Change in the 1Q19 -3.0% -0.7% -3.6% Change in the last 12 months 0.7% -0.8% -15.3% Average Daily Trading Volume in 1Q19 - million 819.2 23.3 192.4 Average daily trading financial volume in 12 months - million 671.7 9.9 171.1 Shareholder Base and Indicators 03/31/19 12/31/18 03/31/18 Number of Shares - million 9,804 9,804 9,804 Common Shares (ON) - million 4,958 4,958 4,958 Non-Voting Shares (PN) - million 4,846 4 ,846 4,846 Treasury Shares - million 61.3 83.6 72.6 Number of Outstanding Shares - million 9,743 9,721 9,732 Recurring Net Income per Share in the Quarter (R$) 0.71 0.67 0.66 Net Income per Share in the Quarter (R$) 0.69 0.64 0.65 Book Value per Share (R$) 12.30 13.55 12.18 (2) Price/Earnings (P/E) 13.17 13.81 13.78 (3) 2.80 2.62 2.81 Price/Book Value (P/B) (1) (2) ITUB (ADR) Closing Prince: 12/31/2018; Closing price of non-voting share at the period end/earnings per share. For calculation purposes, the retained earnings of the last 12 (3) months were included; Closing price of non-voting share at the period-end/Book value per share at the period end. Itaú Unibanco Holding S.A. 42
Management Discussion & Analysis Disclosure Criteria Disclosure Criteria General Itaú Insurance, Pension Plan and Premium Bonds Managerial financial statements relating to prior periods may have been reclassified for The combined ratio is the sum of retained Allocated Capital - The economic allocated comparison purposes. claims, selling expenses, administrative capital model (EAC) was adopted for the Pro expenses, other operating income and Forma financial statements by segment and, The tables in this report show the figures in expenses, tax expenses for ISS, PIS and as of 2015, we changed our calculation millions or billions. Variations and totals, Cofins and other taxes divided by earned methodology. In addition to the Tier I however, are calculated in units. Therefore, premiums. allocated capital, the EAC model includes there may be differences due to rounding. the effects of the calculated expected loan The extended combined ratio is the sum of losses, complementary to that required by Future expectations arising from the these same expenses divided by the sum of the Brazilian Central Bank through CMN reading of this analysis should take into earned premiums, managerial financial Circular No. 2,682/99. consideration the risks and uncertainties margin and commissions and fees. that involve any activities and that are Accordingly, the allocated capital includes outside the control of the companies of the the following components: credit risk VaR (Value at Risk) conglomerate (political and economic (including expected losses), operational risk, changes, volatility in interest and foreign The Consolidated VaR of Itaú Unibanco is market risk, and insurance underwriting risk. exchange rates, technological changes, calculated based on the Historical Simulation inflation, financial disintermediation, methodology, which fully reprices all its Based on Tier I capital measure we competitive pressures on products, prices positions based on historical series of asset determined the Return on Allocated Capital, and changes in tax legislation, among prices. In the third quarter of 2016, we which corresponds to an operational others). started to calculate VaR of the regulatory performance ratio consistently adjusted to portfolio based on internal models approved the required capital needed to support the by the Brazilian Central Bank. Therefore, the risks of the financial positions assumed in Managerial Financial Margin breakdown of risk factors was standardized accordance with our risk appetite. to comply with Circular No. 3,646 of the Spread-Sensitive Operations: consists of Brazilian Central Bank. As of the first quarter of 2016, we have the results from credit assets, non-credit adopted the Basel III rules in our managerial interest-bearing assets and liabilities. capital allocation model. Business Analysis Financial Margin with the market: Income Tax Rate ‐ We adopt the full consists basically of treasury transactions Pro Forma Adjustments - Adjustments income tax rate, net of the tax effect of that include Asset and Liability made to the balance sheet and income payment of interest on capital, for the Retail Management (ALM) and proprietary trading statement for the year are based on Banking, Wholesale Banking and Activities operations. managerial information from the business with the Market + Corporation segments. units. The difference between the income tax amount determined for each segment and Coverage and Extended The financial statements were adjusted in the effective income tax amount, as stated Coverage Ratio order to replace the accounting in the consolidated financial statements, is stockholders’ equity with funding at market allocated in the column Activities with the Coverage ratio is calculated by dividing the prices. Subsequently, the financial Market + Corporation. total allowance balance by the balance of statements were adjusted to include operations more than 90 days overdue. The revenues linked to allocated capital at each extended coverage ratio is calculated by segment. The cost of subordinated debt dividing the total allowance balance by the and the respective remuneration at market balance of operations more than 90 days prices were allocated to segments on a pro overdue and renegotiated operations, rata basis, in accordance with the economic excluding double counting of renegotiated allocated capital. operations more than 90 days overdue. Total allowance includes the allowance for Impacts related to capital allocation are financial guarantees provided, which included in the Pro Forma financial totaled R$1,158 million in March 2019 and is statements. To this end, adjustments were recorded in liabilities in accordance with made to the financial statements, using a CMN Resolution No. 4,512/16. proprietary model. Itaú Unibanco Holding S.A. 43 Management Discussion & Analysis Disclosure Criteria Disclosure Criteria General Itaú Insurance, Pension Plan and Premium Bonds Managerial financial statements relating to prior periods may have been reclassified for The combined ratio is the sum of retained Allocated Capital - The economic allocated comparison purposes. claims, selling expenses, administrative capital model (EAC) was adopted for the Pro expenses, other operating income and Forma financial statements by segment and, The tables in this report show the figures in expenses, tax expenses for ISS, PIS and as of 2015, we changed our calculation millions or billions. Variations and totals, Cofins and other taxes divided by earned methodology. In addition to the Tier I however, are calculated in units. Therefore, premiums. allocated capital, the EAC model includes there may be differences due to rounding. the effects of the calculated expected loan The extended combined ratio is the sum of losses, complementary to that required by Future expectations arising from the these same expenses divided by the sum of the Brazilian Central Bank through CMN reading of this analysis should take into earned premiums, managerial financial Circular No. 2,682/99. consideration the risks and uncertainties margin and commissions and fees. that involve any activities and that are Accordingly, the allocated capital includes outside the control of the companies of the the following components: credit risk VaR (Value at Risk) conglomerate (political and economic (including expected losses), operational risk, changes, volatility in interest and foreign The Consolidated VaR of Itaú Unibanco is market risk, and insurance underwriting risk. exchange rates, technological changes, calculated based on the Historical Simulation inflation, financial disintermediation, methodology, which fully reprices all its Based on Tier I capital measure we competitive pressures on products, prices positions based on historical series of asset determined the Return on Allocated Capital, and changes in tax legislation, among prices. In the third quarter of 2016, we which corresponds to an operational others). started to calculate VaR of the regulatory performance ratio consistently adjusted to portfolio based on internal models approved the required capital needed to support the by the Brazilian Central Bank. Therefore, the risks of the financial positions assumed in Managerial Financial Margin breakdown of risk factors was standardized accordance with our risk appetite. to comply with Circular No. 3,646 of the Spread-Sensitive Operations: consists of Brazilian Central Bank. As of the first quarter of 2016, we have the results from credit assets, non-credit adopted the Basel III rules in our managerial interest-bearing assets and liabilities. capital allocation model. Business Analysis Financial Margin with the market: Income Tax Rate ‐ We adopt the full consists basically of treasury transactions Pro Forma Adjustments - Adjustments income tax rate, net of the tax effect of that include Asset and Liability made to the balance sheet and income payment of interest on capital, for the Retail Management (ALM) and proprietary trading statement for the year are based on Banking, Wholesale Banking and Activities operations. managerial information from the business with the Market + Corporation segments. units. The difference between the income tax amount determined for each segment and Coverage and Extended The financial statements were adjusted in the effective income tax amount, as stated Coverage Ratio order to replace the accounting in the consolidated financial statements, is stockholders’ equity with funding at market allocated in the column Activities with the Coverage ratio is calculated by dividing the prices. Subsequently, the financial Market + Corporation. total allowance balance by the balance of statements were adjusted to include operations more than 90 days overdue. The revenues linked to allocated capital at each extended coverage ratio is calculated by segment. The cost of subordinated debt dividing the total allowance balance by the and the respective remuneration at market balance of operations more than 90 days prices were allocated to segments on a pro overdue and renegotiated operations, rata basis, in accordance with the economic excluding double counting of renegotiated allocated capital. operations more than 90 days overdue. Total allowance includes the allowance for Impacts related to capital allocation are financial guarantees provided, which included in the Pro Forma financial totaled R$1,158 million in March 2019 and is statements. To this end, adjustments were recorded in liabilities in accordance with made to the financial statements, using a CMN Resolution No. 4,512/16. proprietary model. Itaú Unibanco Holding S.A. 43
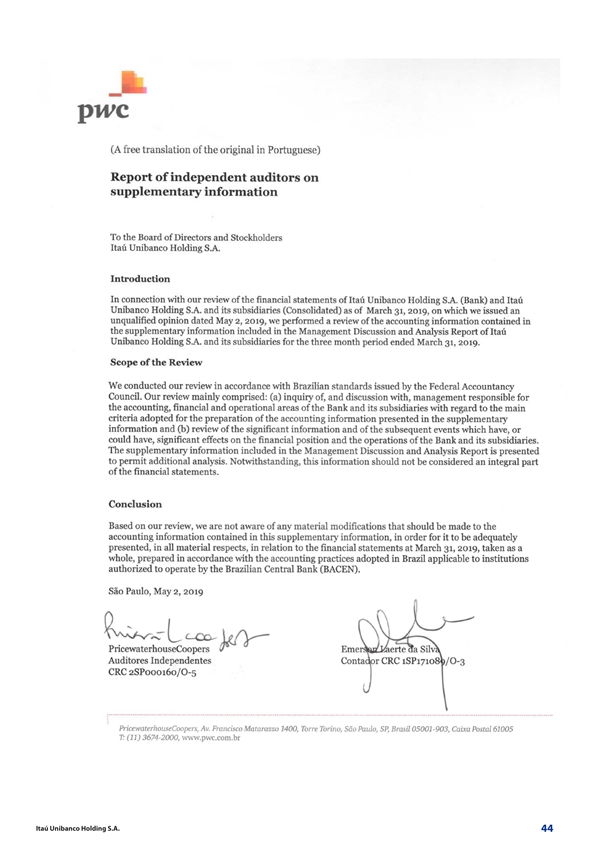
Itaú Unibanco Holding S.A. 44 Itaú Unibanco Holding S.A. 44
Complete Financial Statements March 31, 2018 Management Discussion & Analysis and Complete Financial Statements Complete Financial Statements March 31, 2018 Management Discussion & Analysis and Complete Financial Statements
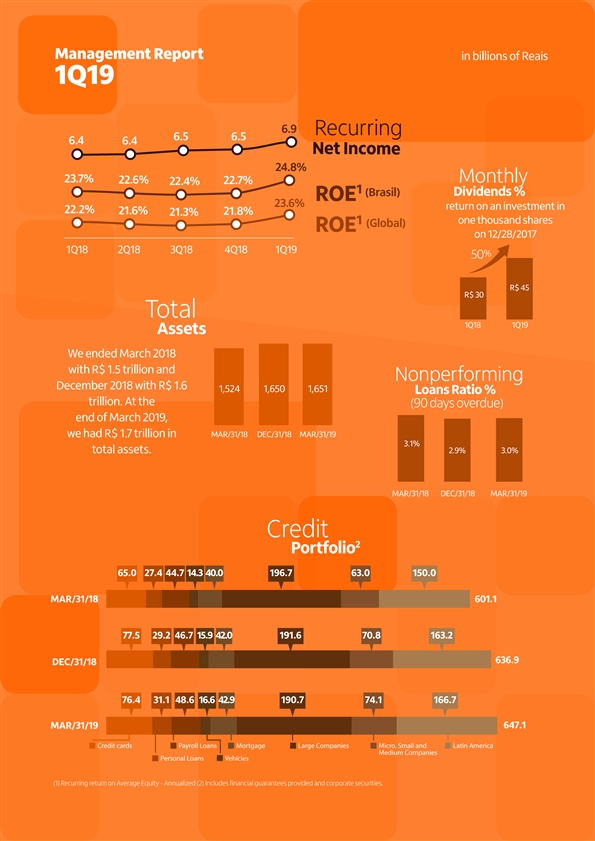
Vehicles Net Income Management Report in billions of Reais 1Q19 6.9 Recurring 6.5 6.5 6.4 6.4 24.8% 23.7% Monthly 22.6% 22.7% 22.4% 1 Dividends % (Brasil) ROE 23.6% return on an investment in 22.2% 21.6% 21.8% 21.3% one thousand shares 1 (Global) ROE on 12/28/2017 1Q18 2Q18 3Q18 4Q18 1Q19 % 50 R$ 45 R$ 30 Total 1Q18 1Q19 Assets We ended March 2018 with R$ 1.5 trillion and Nonperforming December 2018 with R$ 1.6 1,524 1,650 1,651 Loans Ratio % trillion. At the (90 days overdue) end of March 2019, we had R$ 1.7 trillion in MAR/31/18 DEC/31/18 MAR/31/19 3.1% total assets. 2.9% 3.0% MAR/31/18 DEC/31/18 MAR/31/19 Credit 2 Portfolio 65.0 27.4 44.7 14.3 40.0 196.7 63.0 150.0 MAR/31/18 601.1 77.5 29.2 46.7 15.9 42.0 191.6 70.8 163.2 636.9 DEC/31/18 76.4 31.1 48.6 16.6 42.9 190.7 74.1 166.7 647.1 MAR/31/19 Credit cards Payroll Loans Mortgage Large Companies Micro, Small and Latin America Medium Companies Personal Loans (1) Recurring return on Average Equity - Annualized (2) Includes financial guarantees provided and corporate securities.Vehicles Net Income Management Report in billions of Reais 1Q19 6.9 Recurring 6.5 6.5 6.4 6.4 24.8% 23.7% Monthly 22.6% 22.7% 22.4% 1 Dividends % (Brasil) ROE 23.6% return on an investment in 22.2% 21.6% 21.8% 21.3% one thousand shares 1 (Global) ROE on 12/28/2017 1Q18 2Q18 3Q18 4Q18 1Q19 % 50 R$ 45 R$ 30 Total 1Q18 1Q19 Assets We ended March 2018 with R$ 1.5 trillion and Nonperforming December 2018 with R$ 1.6 1,524 1,650 1,651 Loans Ratio % trillion. At the (90 days overdue) end of March 2019, we had R$ 1.7 trillion in MAR/31/18 DEC/31/18 MAR/31/19 3.1% total assets. 2.9% 3.0% MAR/31/18 DEC/31/18 MAR/31/19 Credit 2 Portfolio 65.0 27.4 44.7 14.3 40.0 196.7 63.0 150.0 MAR/31/18 601.1 77.5 29.2 46.7 15.9 42.0 191.6 70.8 163.2 636.9 DEC/31/18 76.4 31.1 48.6 16.6 42.9 190.7 74.1 166.7 647.1 MAR/31/19 Credit cards Payroll Loans Mortgage Large Companies Micro, Small and Latin America Medium Companies Personal Loans (1) Recurring return on Average Equity - Annualized (2) Includes financial guarantees provided and corporate securities.

Dear Reader, In the 2018 Management Report, we described the history and results of the 10-year period since the merger of Itaú and Unibanco. We covered the 2012 review of our business model, describing how it affected our value creation, profitability and risk indicators. Lastly, we analyzed in depth the six strategic fronts announced in 2017. During the first quarter of 2019, we reiterated the importance of customer centricity on all strategic fronts in order to achieve our objective of changing leagues: to be among the world’s best companies in customer satisfaction. We have set up a regular forum with the management of the bank to discuss the customer’s all-round experience and to understand how we can improve that experience. In this respect, our actions are allocated priority according to their potential for improving customer service. We take into account both the volume of transactions and the number of customers affected regarding how the customer feels in their relationship with the bank. 1. Getting to know and understanding our customer. W E W A N T T O 2. Customer priority in decision making. change leagues 3. The customer’s problem is my problem. AND THE 7 PRINCIPLES 4. Captivating the customer is everyone’s responsibility. 5. We innovate, test with the customer and quickly learn from our what we are of customer doing wrong and right. centricity 6. Clear, simple and transparent communication with the customer. will take us there 7. We recognize and reward customer satisfaction. Based on the 7 Principles, we have created rituals within our work environment to meet the customer’s requirements and create mechanisms for enhancing their journey. The rituals consist of Listening to the Customers, Engaging the Team and Transforming Experiences. Thanks to this feedback, our employees Customers who respond to the NPS ¹ will be recognized for their proper survey are contacted by the attitudes and behavior involving commercial team to obtain in-depth customer satisfaction. Additionally, feedback, whether positive or there will be team discussions about negative. After the call, the lessons what the group’s commitments should learned are shared with the teams 01 be for improving the customer’s and we reflect on what we do well all-round experience. and what can be improved. Listen to the Engage Customer customers the Team Centricity Rituals Use all the information received to 02 re-design the customers’ all-round 03 experience. At certain times during the Transform re-design, we invite the customer to experiences participate in creating it. They give their opinion and they validate what we are doing, ensuring that we approaching it from their perspective. 1 NPS – Net Promoter Score. Measures the degree of customer satisfaction and loyalty. 47Dear Reader, In the 2018 Management Report, we described the history and results of the 10-year period since the merger of Itaú and Unibanco. We covered the 2012 review of our business model, describing how it affected our value creation, profitability and risk indicators. Lastly, we analyzed in depth the six strategic fronts announced in 2017. During the first quarter of 2019, we reiterated the importance of customer centricity on all strategic fronts in order to achieve our objective of changing leagues: to be among the world’s best companies in customer satisfaction. We have set up a regular forum with the management of the bank to discuss the customer’s all-round experience and to understand how we can improve that experience. In this respect, our actions are allocated priority according to their potential for improving customer service. We take into account both the volume of transactions and the number of customers affected regarding how the customer feels in their relationship with the bank. 1. Getting to know and understanding our customer. W E W A N T T O 2. Customer priority in decision making. change leagues 3. The customer’s problem is my problem. AND THE 7 PRINCIPLES 4. Captivating the customer is everyone’s responsibility. 5. We innovate, test with the customer and quickly learn from our what we are of customer doing wrong and right. centricity 6. Clear, simple and transparent communication with the customer. will take us there 7. We recognize and reward customer satisfaction. Based on the 7 Principles, we have created rituals within our work environment to meet the customer’s requirements and create mechanisms for enhancing their journey. The rituals consist of Listening to the Customers, Engaging the Team and Transforming Experiences. Thanks to this feedback, our employees Customers who respond to the NPS ¹ will be recognized for their proper survey are contacted by the attitudes and behavior involving commercial team to obtain in-depth customer satisfaction. Additionally, feedback, whether positive or there will be team discussions about negative. After the call, the lessons what the group’s commitments should learned are shared with the teams 01 be for improving the customer’s and we reflect on what we do well all-round experience. and what can be improved. Listen to the Engage Customer customers the Team Centricity Rituals Use all the information received to 02 re-design the customers’ all-round 03 experience. At certain times during the Transform re-design, we invite the customer to experiences participate in creating it. They give their opinion and they validate what we are doing, ensuring that we approaching it from their perspective. 1 NPS – Net Promoter Score. Measures the degree of customer satisfaction and loyalty. 47

In the beginning of 2019, we embarked on several initiatives to enhance our customers’ experience. Google Pay Minhas Finanças - the Itaú Unibanco financial Customers of Itaú, Credicard and Itaucard can now organization tool make payments using the platform. Integration with A tool available on the Itaú app and used by 40% of credit cards issued by Itaú Unibanco now allows mobile customers. payment by proximity using Android-equipped Reduction in the minimum amount for investing in smartphones. CDBs of other institutions and selected funds Partnership with the Latin America Development After you zeroing he custody fee to invest in these Bank to finance small and medium companies run products, we have reduced the minimum by women entrepreneurs in Brazil investment amount. Besides CDBs of other The aim is to foster the inclusive growth of institutions, around 50 fixed income and equity companies, in addition to affording the benefits of products are available to a larger customer base. social and economic development arising from a wider offer of credit for women entrepreneurs. The amount raised was US$150 million. As time goes by, we have noted an increasing number of customers operating on our digital channels. Therefore, in addition to enhancing their experience in their relationship with Itaú Unibanco, we invest in cybersecurity to ensure the protection of our customers’ data. Our information security strategy was designed taking into account the global scenario, regulations and best market practices and standards. Our structure and governance are resilient and appropriate for identifying, detecting and reacting to threats, in addition to establishing recovery procedures for situations that require us to defend ourselves from cyberattacks. Furthermore, we invest in awareness campaigns for employees and customers, so that they are always alert to identify and deal with risks and threats. Besides the actions of Itaú Unibanco, we are seeing measures in the banking sector that benefit customers while encouraging access to credit products. In April 2019, a law was passed for automatic inclusion of customer data in the Positive Register. The automatic Positive Register is an important step for making credit cheaper in Brazil. By having access to the customer’s payment history over time, financial institutions, retail stores and other businesses will be in a better position to evaluate each consumer, thereby extending cheaper loans to good payers. In this respect, in 2017 we incorporated, with other banks, Quod, a company whose purpose is to create, reconcile and deal with Positive Register information. This measure is part of the Agenda BC+, led by the Central Bank in partnership with Febraban, to promote more financial citizenship, modernize legislation, enhance the efficiency of the National Financial System and offer cheaper credit. Zero cost on advances against single-installment credit card sales Clients of Rede with annual sales of up to R$ 30 million who use the Rede equipment, and receive their payments at Unibanco, will now receive the proceeds of their credit card sales in two days, free of charge for the advance as of May 2, 2019. This initiative applies to both current and new customers and aims to benefit small and medium companies, as well as the self-employed and micro entrepreneurs, and users of any model of the Rede device are eligible. To change leagues, we need to put people at the center of everything we do. Thus, looking after our employees and ensuring a healthy working environment is fundamental. As part of our commitment to move forward with the Realizamos nossa Assembleia Geral Ordinária no dia 24 de abril, na qual nossos acionistas puderam participar presencialmente, por bank’s health agenda, we now have an official partnership with Hospital Sírio-Libanês. meio do boletim de voto à distância ou por um procurador. Through this partnership, we offer our employees the Family Health program, a model that brings doctors closer to patients, Na assembleia, nossos acionistas votaram sobre (i) as demonstrações financeiras de 31 de dezembro de 2018, sendo aprovada a creating bonds in order to accompany them at every instant of their lives. destinação do lucro do ano. (ii) A reeleição dos membros do Conselho de Administração (CA) para o próximo mandato anual. (iii) A eleição dos membros do Conselho Fiscal (CF), que é um órgão independente da administração e que fiscaliza a administração e as contas. (iv) A verba destinada à remuneração global da diretoria e do CA, bem como a remuneração dos membros do CF. LinkedIn Top Companies: For the second consecutive year, we took first place in the ranking of companies for which Brazilians wants to work. 48In the beginning of 2019, we embarked on several initiatives to enhance our customers’ experience. Google Pay Minhas Finanças - the Itaú Unibanco financial Customers of Itaú, Credicard and Itaucard can now organization tool make payments using the platform. Integration with A tool available on the Itaú app and used by 40% of credit cards issued by Itaú Unibanco now allows mobile customers. payment by proximity using Android-equipped Reduction in the minimum amount for investing in smartphones. CDBs of other institutions and selected funds Partnership with the Latin America Development After you zeroing he custody fee to invest in these Bank to finance small and medium companies run products, we have reduced the minimum by women entrepreneurs in Brazil investment amount. Besides CDBs of other The aim is to foster the inclusive growth of institutions, around 50 fixed income and equity companies, in addition to affording the benefits of products are available to a larger customer base. social and economic development arising from a wider offer of credit for women entrepreneurs. The amount raised was US$150 million. As time goes by, we have noted an increasing number of customers operating on our digital channels. Therefore, in addition to enhancing their experience in their relationship with Itaú Unibanco, we invest in cybersecurity to ensure the protection of our customers’ data. Our information security strategy was designed taking into account the global scenario, regulations and best market practices and standards. Our structure and governance are resilient and appropriate for identifying, detecting and reacting to threats, in addition to establishing recovery procedures for situations that require us to defend ourselves from cyberattacks. Furthermore, we invest in awareness campaigns for employees and customers, so that they are always alert to identify and deal with risks and threats. Besides the actions of Itaú Unibanco, we are seeing measures in the banking sector that benefit customers while encouraging access to credit products. In April 2019, a law was passed for automatic inclusion of customer data in the Positive Register. The automatic Positive Register is an important step for making credit cheaper in Brazil. By having access to the customer’s payment history over time, financial institutions, retail stores and other businesses will be in a better position to evaluate each consumer, thereby extending cheaper loans to good payers. In this respect, in 2017 we incorporated, with other banks, Quod, a company whose purpose is to create, reconcile and deal with Positive Register information. This measure is part of the Agenda BC+, led by the Central Bank in partnership with Febraban, to promote more financial citizenship, modernize legislation, enhance the efficiency of the National Financial System and offer cheaper credit. Zero cost on advances against single-installment credit card sales Clients of Rede with annual sales of up to R$ 30 million who use the Rede equipment, and receive their payments at Unibanco, will now receive the proceeds of their credit card sales in two days, free of charge for the advance as of May 2, 2019. This initiative applies to both current and new customers and aims to benefit small and medium companies, as well as the self-employed and micro entrepreneurs, and users of any model of the Rede device are eligible. To change leagues, we need to put people at the center of everything we do. Thus, looking after our employees and ensuring a healthy working environment is fundamental. As part of our commitment to move forward with the Realizamos nossa Assembleia Geral Ordinária no dia 24 de abril, na qual nossos acionistas puderam participar presencialmente, por bank’s health agenda, we now have an official partnership with Hospital Sírio-Libanês. meio do boletim de voto à distância ou por um procurador. Through this partnership, we offer our employees the Family Health program, a model that brings doctors closer to patients, Na assembleia, nossos acionistas votaram sobre (i) as demonstrações financeiras de 31 de dezembro de 2018, sendo aprovada a creating bonds in order to accompany them at every instant of their lives. destinação do lucro do ano. (ii) A reeleição dos membros do Conselho de Administração (CA) para o próximo mandato anual. (iii) A eleição dos membros do Conselho Fiscal (CF), que é um órgão independente da administração e que fiscaliza a administração e as contas. (iv) A verba destinada à remuneração global da diretoria e do CA, bem como a remuneração dos membros do CF. LinkedIn Top Companies: For the second consecutive year, we took first place in the ranking of companies for which Brazilians wants to work. 48
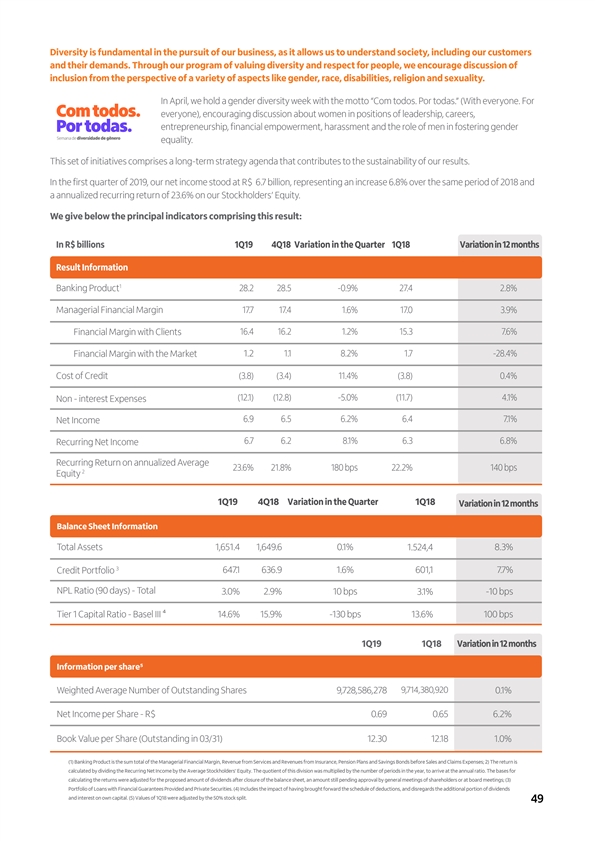
Diversity is fundamental in the pursuit of our business, as it allows us to understand society, including our customers and their demands. Through our program of valuing diversity and respect for people, we encourage discussion of inclusion from the perspective of a variety of aspects like gender, race, disabilities, religion and sexuality. In April, we hold a gender diversity week with the motto “Com todos. Por todas.” (With everyone. For Com todos. everyone), encouraging discussion about women in positions of leadership, careers, entrepreneurship, financial empowerment, harassment and the role of men in fostering gender Por todas. Semana de diversidade de gênero equality. This set of initiatives comprises a long-term strategy agenda that contributes to the sustainability of our results. In the first quarter of 2019, our net income stood at R$ 6.7 billion, representing an increase 6.8% over the same period of 2018 and a annualized recurring return of 23.6% on our Stockholders’ Equity. We give below the principal indicators comprising this result: In R$ billions 1Q19 4Q18 Variation in the Quarter 1Q18 Variation in 12 months Result Information 1 Banking Product 28.2 28.5 -0.9% 27.4 2.8% Managerial Financial Margin 17.7 17.4 1.6% 17.0 3.9% 16.4 16.2 1.2% 15.3 7.6% Financial Margin with Clients Financial Margin with the Market 1.2 1.1 8.2% 1.7 -28.4% Cost of Credit (3.8) (3.4) 11.4% (3.8) 0.4% (12.1) (12.8) -5.0% (11.7) 4.1% Non - interest Expenses 6.9 6.5 6.2% 6.4 7.1% Net Income 6.7 6.2 8.1% 6.3 6.8% Recurring Net Income Recurring Return on annualized Average 23.6% 21.8% 180 bps 22.2% 140 bps 2 Equity 1Q19 4Q18 Variation in the Quarter 1Q18 Variation in 12 months Balance Sheet Information Total Assets 1,651.4 1,649.6 0.1% 1.524,4 8.3% 3 Credit Portfolio 647.1 636.9 1.6% 601,1 7.7% NPL Ratio (90 days) - Total 3.0% 2.9% 10 bps -10 bps 3.1% Tier 1 Capital Ratio - Basel III ⁴ 14.6% 15.9% -130 bps 13.6% 100 bps 1Q19 1Q18 Variation in 12 months Information per share5 Weighted Average Number of Outstanding Shares 9,728,586,278 9,714,380,920 0.1% Net Income per Share - R$ 0.69 0.65 6.2% Book Value per Share (Outstanding in 03/31) 12.30 12.18 1.0% (1) Banking Product is the sum total of the Managerial Financial Margin, Revenue from Services and Revenues from Insurance, Pension Plans and Savings Bonds before Sales and Claims Expenses; 2) The return is calculated by dividing the Recurring Net Income by the Average Stockholders’ Equity. The quotient of this division was multiplied by the number of periods in the year, to arrive at the annual ratio. The bases for calculating the returns were adjusted for the proposed amount of dividends after closure of the balance sheet, an amount still pending approval by general meetings of shareholders or at board meetings; (3) Portfolio of Loans with Financial Guarantees Provided and Private Securities. (4) Includes the impact of having brought forward the schedule of deductions, and disregards the additional portion of dividends and interest on own capital. (5) Values of 1Q18 were adjusted by the 50% stock split. 49Diversity is fundamental in the pursuit of our business, as it allows us to understand society, including our customers and their demands. Through our program of valuing diversity and respect for people, we encourage discussion of inclusion from the perspective of a variety of aspects like gender, race, disabilities, religion and sexuality. In April, we hold a gender diversity week with the motto “Com todos. Por todas.” (With everyone. For Com todos. everyone), encouraging discussion about women in positions of leadership, careers, entrepreneurship, financial empowerment, harassment and the role of men in fostering gender Por todas. Semana de diversidade de gênero equality. This set of initiatives comprises a long-term strategy agenda that contributes to the sustainability of our results. In the first quarter of 2019, our net income stood at R$ 6.7 billion, representing an increase 6.8% over the same period of 2018 and a annualized recurring return of 23.6% on our Stockholders’ Equity. We give below the principal indicators comprising this result: In R$ billions 1Q19 4Q18 Variation in the Quarter 1Q18 Variation in 12 months Result Information 1 Banking Product 28.2 28.5 -0.9% 27.4 2.8% Managerial Financial Margin 17.7 17.4 1.6% 17.0 3.9% 16.4 16.2 1.2% 15.3 7.6% Financial Margin with Clients Financial Margin with the Market 1.2 1.1 8.2% 1.7 -28.4% Cost of Credit (3.8) (3.4) 11.4% (3.8) 0.4% (12.1) (12.8) -5.0% (11.7) 4.1% Non - interest Expenses 6.9 6.5 6.2% 6.4 7.1% Net Income 6.7 6.2 8.1% 6.3 6.8% Recurring Net Income Recurring Return on annualized Average 23.6% 21.8% 180 bps 22.2% 140 bps 2 Equity 1Q19 4Q18 Variation in the Quarter 1Q18 Variation in 12 months Balance Sheet Information Total Assets 1,651.4 1,649.6 0.1% 1.524,4 8.3% 3 Credit Portfolio 647.1 636.9 1.6% 601,1 7.7% NPL Ratio (90 days) - Total 3.0% 2.9% 10 bps -10 bps 3.1% Tier 1 Capital Ratio - Basel III ⁴ 14.6% 15.9% -130 bps 13.6% 100 bps 1Q19 1Q18 Variation in 12 months Information per share5 Weighted Average Number of Outstanding Shares 9,728,586,278 9,714,380,920 0.1% Net Income per Share - R$ 0.69 0.65 6.2% Book Value per Share (Outstanding in 03/31) 12.30 12.18 1.0% (1) Banking Product is the sum total of the Managerial Financial Margin, Revenue from Services and Revenues from Insurance, Pension Plans and Savings Bonds before Sales and Claims Expenses; 2) The return is calculated by dividing the Recurring Net Income by the Average Stockholders’ Equity. The quotient of this division was multiplied by the number of periods in the year, to arrive at the annual ratio. The bases for calculating the returns were adjusted for the proposed amount of dividends after closure of the balance sheet, an amount still pending approval by general meetings of shareholders or at board meetings; (3) Portfolio of Loans with Financial Guarantees Provided and Private Securities. (4) Includes the impact of having brought forward the schedule of deductions, and disregards the additional portion of dividends and interest on own capital. (5) Values of 1Q18 were adjusted by the 50% stock split. 49

Recurring net income for the first quarter of 2019 was R$6.9 billion up 6.2% from the previous quarter with a return on average equity of 23.6%. The main positive highlight was the 5.0% decrease in non-interest expenses. The reduction was due to personnel expenses that are seasonally lower in the first quarter and expenses on third-party services. The financial margin with clients grew 1.2% as a result of the growth of the portfolios of individuals and very small, small and middle-market companies. These effects were partially offset by lower commissions and fees and higher cost of credit. Recurring net income increased 7 .1% when compared to the same period of the previous year. Financial margin with clients increased 7.6% driven by the growths in the portfolios of individuals and very small, small and middle-market companies. The 28.4% decrease in the financial margin with the market and the 4.1% increase in non-interest expenses partially offset the positive performance of the financial margin with clients. Higher non-interest expenses were driven by the impact of the collective bargaining labor agreement on our personnel expenses, by higher administrative expenses and by the foreign exchange rate variation impact on our expenses in Latin America (ex-Brazil). Our credit portfolio, including financial guarantees provided and corporate securities, stood at R$647 .1 billion at the end of March 2019, representing an increase of 7.7% over the same period of 2018. Worthy of note our Individuals portfolio, which rose by 12.7% and the Very Small, Small and Middle-Market Companies, with growth of 17.6%. Capital management is an essential component of our management model, because we use it to optimize the allocation of the shareholder’s funds and guaratee the solidess of the bank. These objectives are reflected in our policies on capital ratios and distribution of dividends that stipulate a minimum Full Tier I capital ratio of 13.5%. Thus, the distribution of dividends is conditional on this limit, the outlook for the growth of the business, the profitability for the year, mergers and acquisitions, changes in the market, and taxation and regulatory changes that could alter capital requirements. During 2018, our Full Tier I capital ratio continued to exceed the minimum limit, reaching 15.9% in December 2018, while in the first quarter of 2019 it stood at 14.6%. During this period, worthy of note is the generation of capital from income and the issuance of R$ 3.05 billion in Perpetual Subordinated Financial Notes, negotiated with professional investors, and approved by the Brazilian Central Bank as part of our supplementary capital, commencing February 2019. For Itaú Unibanco, the transparency of the results and the strategies discussed here are fundamental. Thus, on April 30, 2019 we published our Integrated Annual Report for 2018, in IFRS (International Financial Reporting Standards) the document in which we describe who we are, what we do and how we seek to create long-term value. We emphasize how our corporate governance drives our business, defines strategies and manages the main risks and opportunities. The 2018 Integrated Annual Report incorporates material changes in comparison with previous editions, notably: messages from the Co-chairmen of the Board of Directors and the Executive Committee; Management’s comments about the results; and integration with the Financial Statements. 50Recurring net income for the first quarter of 2019 was R$6.9 billion up 6.2% from the previous quarter with a return on average equity of 23.6%. The main positive highlight was the 5.0% decrease in non-interest expenses. The reduction was due to personnel expenses that are seasonally lower in the first quarter and expenses on third-party services. The financial margin with clients grew 1.2% as a result of the growth of the portfolios of individuals and very small, small and middle-market companies. These effects were partially offset by lower commissions and fees and higher cost of credit. Recurring net income increased 7 .1% when compared to the same period of the previous year. Financial margin with clients increased 7.6% driven by the growths in the portfolios of individuals and very small, small and middle-market companies. The 28.4% decrease in the financial margin with the market and the 4.1% increase in non-interest expenses partially offset the positive performance of the financial margin with clients. Higher non-interest expenses were driven by the impact of the collective bargaining labor agreement on our personnel expenses, by higher administrative expenses and by the foreign exchange rate variation impact on our expenses in Latin America (ex-Brazil). Our credit portfolio, including financial guarantees provided and corporate securities, stood at R$647 .1 billion at the end of March 2019, representing an increase of 7.7% over the same period of 2018. Worthy of note our Individuals portfolio, which rose by 12.7% and the Very Small, Small and Middle-Market Companies, with growth of 17.6%. Capital management is an essential component of our management model, because we use it to optimize the allocation of the shareholder’s funds and guaratee the solidess of the bank. These objectives are reflected in our policies on capital ratios and distribution of dividends that stipulate a minimum Full Tier I capital ratio of 13.5%. Thus, the distribution of dividends is conditional on this limit, the outlook for the growth of the business, the profitability for the year, mergers and acquisitions, changes in the market, and taxation and regulatory changes that could alter capital requirements. During 2018, our Full Tier I capital ratio continued to exceed the minimum limit, reaching 15.9% in December 2018, while in the first quarter of 2019 it stood at 14.6%. During this period, worthy of note is the generation of capital from income and the issuance of R$ 3.05 billion in Perpetual Subordinated Financial Notes, negotiated with professional investors, and approved by the Brazilian Central Bank as part of our supplementary capital, commencing February 2019. For Itaú Unibanco, the transparency of the results and the strategies discussed here are fundamental. Thus, on April 30, 2019 we published our Integrated Annual Report for 2018, in IFRS (International Financial Reporting Standards) the document in which we describe who we are, what we do and how we seek to create long-term value. We emphasize how our corporate governance drives our business, defines strategies and manages the main risks and opportunities. The 2018 Integrated Annual Report incorporates material changes in comparison with previous editions, notably: messages from the Co-chairmen of the Board of Directors and the Executive Committee; Management’s comments about the results; and integration with the Financial Statements. 50
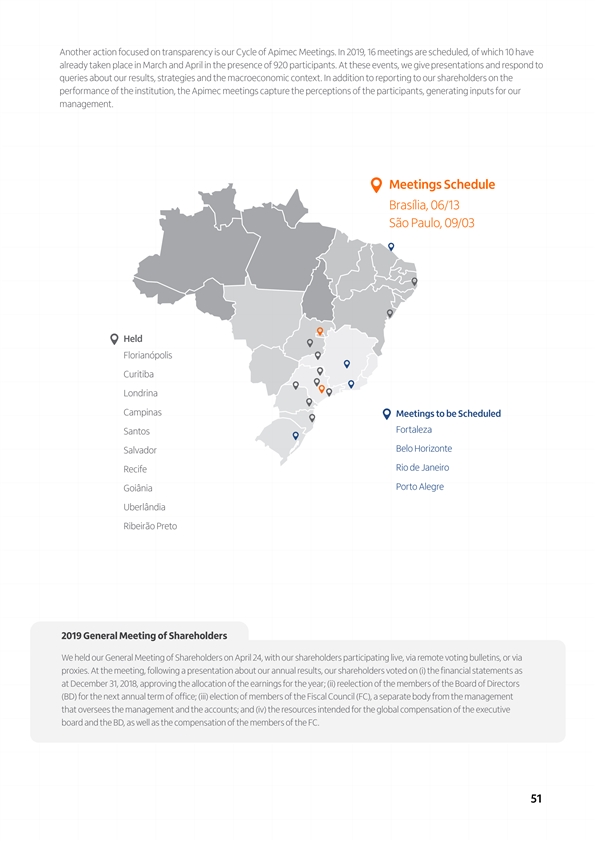
Another action focused on transparency is our Cycle of Apimec Meetings. In 2019, 16 meetings are scheduled, of which 10 have already taken place in March and April in the presence of 920 participants. At these events, we give presentations and respond to queries about our results, strategies and the macroeconomic context. In addition to reporting to our shareholders on the performance of the institution, the Apimec meetings capture the perceptions of the participants, generating inputs for our management. Meetings Schedule Brasília, 06/13 São Paulo, 09/03 Held Florianópolis Curitiba Londrina Campinas Meetings to be Scheduled Fortaleza Santos Belo Horizonte Salvador Rio de Janeiro Recife Porto Alegre Goiânia Uberlândia Ribeirão Preto 2019 General Meeting of Shareholders We held our General Meeting of Shareholders on April 24, with our shareholders participating live, via remote voting bulletins, or via proxies. At the meeting, following a presentation about our annual results, our shareholders voted on (i) the financial statements as at December 31, 2018, approving the allocation of the earnings for the year; (ii) reelection of the members of the Board of Directors (BD) for the next annual term of office; (iii) election of members of the Fiscal Council (FC), a separate body from the management that oversees the management and the accounts; and (iv) the resources intended for the global compensation of the executive board and the BD, as well as the compensation of the members of the FC. 5 1Another action focused on transparency is our Cycle of Apimec Meetings. In 2019, 16 meetings are scheduled, of which 10 have already taken place in March and April in the presence of 920 participants. At these events, we give presentations and respond to queries about our results, strategies and the macroeconomic context. In addition to reporting to our shareholders on the performance of the institution, the Apimec meetings capture the perceptions of the participants, generating inputs for our management. Meetings Schedule Brasília, 06/13 São Paulo, 09/03 Held Florianópolis Curitiba Londrina Campinas Meetings to be Scheduled Fortaleza Santos Belo Horizonte Salvador Rio de Janeiro Recife Porto Alegre Goiânia Uberlândia Ribeirão Preto 2019 General Meeting of Shareholders We held our General Meeting of Shareholders on April 24, with our shareholders participating live, via remote voting bulletins, or via proxies. At the meeting, following a presentation about our annual results, our shareholders voted on (i) the financial statements as at December 31, 2018, approving the allocation of the earnings for the year; (ii) reelection of the members of the Board of Directors (BD) for the next annual term of office; (iii) election of members of the Fiscal Council (FC), a separate body from the management that oversees the management and the accounts; and (iv) the resources intended for the global compensation of the executive board and the BD, as well as the compensation of the members of the FC. 5 1
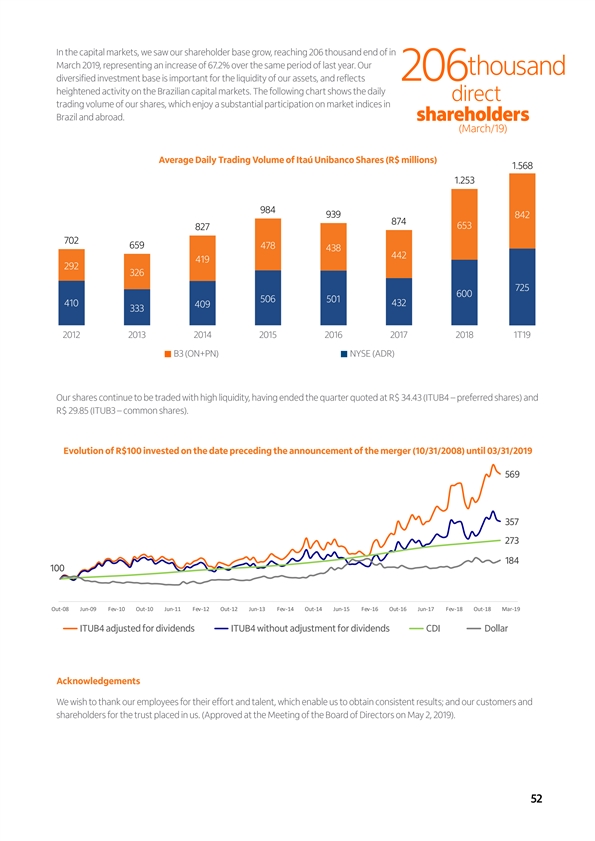
In the capital markets, we saw our shareholder base grow, reaching 206 thousand end of in March 2019, representing an increase of 67.2% over the same period of last year. Our thousand 206 diversified investment base is important for the liquidity of our assets, and reflects heightened activity on the Brazilian capital markets. The following chart shows the daily direct trading volume of our shares, which enjoy a substantial participation on market indices in Brazil and abroad. shareholders (March/19) Average Daily Trading Volume of Itaú Unibanco Shares (R$ millions) 1.568 1.253 984 939 842 874 653 827 702 659 478 438 442 419 292 326 725 600 506 501 410 432 409 333 2012 2013 2014 2015 2016 2017 2018 1T19 B3 (ON+PN) NYSE (ADR) Our shares continue to be traded with high liquidity, having ended the quarter quoted at R$ 34.43 (ITUB4 – preferred shares) and R$ 29.85 (ITUB3 – common shares). Evolution of R$100 invested on the date preceding the announcement of the merger (10/31/2008) until 03/31/2019 569 357 273 184 100 Out-08 Jun-09 Fev-10 Out-10 Jun-11 Fev-12 Out-12 Jun-13 Fev-14 Out-14 Jun-15 Fev-16 Out-16 Jun-17 Fev-18 Out-18 Mar-19 ITUB4 adjusted for dividends ITUB4 without adjustment for dividends CDI Dollar Acknowledgements We wish to thank our employees for their effort and talent, which enable us to obtain consistent results; and our customers and shareholders for the trust placed in us. (Approved at the Meeting of the Board of Directors on May 2, 2019). 5 2In the capital markets, we saw our shareholder base grow, reaching 206 thousand end of in March 2019, representing an increase of 67.2% over the same period of last year. Our thousand 206 diversified investment base is important for the liquidity of our assets, and reflects heightened activity on the Brazilian capital markets. The following chart shows the daily direct trading volume of our shares, which enjoy a substantial participation on market indices in Brazil and abroad. shareholders (March/19) Average Daily Trading Volume of Itaú Unibanco Shares (R$ millions) 1.568 1.253 984 939 842 874 653 827 702 659 478 438 442 419 292 326 725 600 506 501 410 432 409 333 2012 2013 2014 2015 2016 2017 2018 1T19 B3 (ON+PN) NYSE (ADR) Our shares continue to be traded with high liquidity, having ended the quarter quoted at R$ 34.43 (ITUB4 – preferred shares) and R$ 29.85 (ITUB3 – common shares). Evolution of R$100 invested on the date preceding the announcement of the merger (10/31/2008) until 03/31/2019 569 357 273 184 100 Out-08 Jun-09 Fev-10 Out-10 Jun-11 Fev-12 Out-12 Jun-13 Fev-14 Out-14 Jun-15 Fev-16 Out-16 Jun-17 Fev-18 Out-18 Mar-19 ITUB4 adjusted for dividends ITUB4 without adjustment for dividends CDI Dollar Acknowledgements We wish to thank our employees for their effort and talent, which enable us to obtain consistent results; and our customers and shareholders for the trust placed in us. (Approved at the Meeting of the Board of Directors on May 2, 2019). 5 2
Independent Audit - CVM Instruction No. 381 Procedures Adopted by the Company: our operating policy, including subsidiaries, when contracting non-external audit-related services from our independent auditors, is based on applicable regulations and internationally accepted principles that protect the independence of the auditors. These principles state that: (a) the auditors must not audit their own work, (b) the auditors must not hold managerial positions at their clients and (c) the auditors must not promote their clients’ interests. In the period from January to March 2019, we did not contract from the independent auditors or their related parties services unrelated to the external audit in an amount exceeding 5% of the total fees regarding external audit services. As per CVM Instruction No. 381, we list below the other services provided and the dates on which they were contracted: - January 03 – issuance of the report of the review of income tax calculation and settlement; - January 18 – review of compliance with the regulations applicable to transfer pricing; - January 31 – review of the Tax Accounting Books; and - March 08 – acquisition of technical materials. Justification of the Independent Auditors PricewaterhouseCoopers: The provision of non-external audit-related services described above does not affect either independence or objectivity in conducting external audit examinations at Itaú Unibanco e and its subsidiaries. The policy for providing Itaú Unibanco with non-external audit-related services is based on principles that protect the independent auditors’ independence, all of which were observed in providing said services, including their approval by the Audit Committee of Itaú Unibanco. Central Bank – Circular No. 3.068/01 We declare having the financial capacity and the intention to hold until maturity the securities classified in the category “Held to Maturity”, amounting to de R$ 39.9 billion, accounting for 8.6% of total securities and derivative financial instruments in March 2019. International Financial Reporting Standards (IFRS) We are disclosing the full accounting statements in accordance with the international financial reporting standards (IFRS) on the same date as this publication, as per Official Circular CVM/SEP 01/13. The full accounting statements are available on the Investor Relations site at (www.itau.com.br/investor-relations > Results Center). The Management Report and the Full Accounting Statements of Itaú Unibanco Holding S.A. and those of its subsidiaries, for the period January to March 2019, abide by the rules established in Brazilian Company Law, the National Monetary Council (CMN), the Brazilian Central Bank (BACEN), the Brazilian Securities Exchange Commission (CVM), the National Council for Private Insurance (CNSP), the Superintendence for Private Insurance (SUSEP), the National Superintendence for Supplementary Pensions (PREVIC) and the recommendations of the International Accounting Standards Board (IASB). The information presented herein is available on the Investor Relations site (IR) of Itaú Unibanco, at: www.itau.com.br/investor-relations > Results Center. 53Independent Audit - CVM Instruction No. 381 Procedures Adopted by the Company: our operating policy, including subsidiaries, when contracting non-external audit-related services from our independent auditors, is based on applicable regulations and internationally accepted principles that protect the independence of the auditors. These principles state that: (a) the auditors must not audit their own work, (b) the auditors must not hold managerial positions at their clients and (c) the auditors must not promote their clients’ interests. In the period from January to March 2019, we did not contract from the independent auditors or their related parties services unrelated to the external audit in an amount exceeding 5% of the total fees regarding external audit services. As per CVM Instruction No. 381, we list below the other services provided and the dates on which they were contracted: - January 03 – issuance of the report of the review of income tax calculation and settlement; - January 18 – review of compliance with the regulations applicable to transfer pricing; - January 31 – review of the Tax Accounting Books; and - March 08 – acquisition of technical materials. Justification of the Independent Auditors PricewaterhouseCoopers: The provision of non-external audit-related services described above does not affect either independence or objectivity in conducting external audit examinations at Itaú Unibanco e and its subsidiaries. The policy for providing Itaú Unibanco with non-external audit-related services is based on principles that protect the independent auditors’ independence, all of which were observed in providing said services, including their approval by the Audit Committee of Itaú Unibanco. Central Bank – Circular No. 3.068/01 We declare having the financial capacity and the intention to hold until maturity the securities classified in the category “Held to Maturity”, amounting to de R$ 39.9 billion, accounting for 8.6% of total securities and derivative financial instruments in March 2019. International Financial Reporting Standards (IFRS) We are disclosing the full accounting statements in accordance with the international financial reporting standards (IFRS) on the same date as this publication, as per Official Circular CVM/SEP 01/13. The full accounting statements are available on the Investor Relations site at (www.itau.com.br/investor-relations > Results Center). The Management Report and the Full Accounting Statements of Itaú Unibanco Holding S.A. and those of its subsidiaries, for the period January to March 2019, abide by the rules established in Brazilian Company Law, the National Monetary Council (CMN), the Brazilian Central Bank (BACEN), the Brazilian Securities Exchange Commission (CVM), the National Council for Private Insurance (CNSP), the Superintendence for Private Insurance (SUSEP), the National Superintendence for Supplementary Pensions (PREVIC) and the recommendations of the International Accounting Standards Board (IASB). The information presented herein is available on the Investor Relations site (IR) of Itaú Unibanco, at: www.itau.com.br/investor-relations > Results Center. 53
ITAÚ UNIBANCO HOLDING S.A. BOARD OF DIRECTORS BOARD OF EXECUTIVE OFFICERS Co-Chairmen Chief Executive Officer Pedro Moreira Salles Candido Botelho Bracher Roberto Egydio Setubal Director Generals Members Caio Ibrahim David Alfredo Egydio Setubal Márcio de Andrade Schettini (1) Amos Genish Ana Lúcia de Mattos Barretto Villela Executive Vice-Presidents Fábio Colletti Barbosa André Sapoznik Gustavo Jorge Laboissière Loyola Claudia Politanski João Moreira Salles Milton Maluhy Filho José Galló Marco Ambrogio Crespi Bonomi Pedro Luiz Bodin de Moraes Executive Officers Ricardo Villela Marino Alexsandro Broedel Lopes (*) Fernando Barçante Tostes Malta Leila Cristiane Barboza Braga de Melo Paulo Sergio Miron AUDIT COMMITTEE Chairman Officers Gustavo Jorge Laboissière Loyola Adriano Cabral Volpini Álvaro Felipe Rizzi Rodrigues Andre Balestrin Cestare Members Emerson Macedo Bortoloto Antonio Carlos Barbosa de Oliveira Gilberto Frussa Antonio Francisco de Lima Neto José Virgilio Vita Neto Diego Fresco Gutierrez Renato Barbosa do Nascimento Maria Helena dos Santos Fernandes de Santana Rodrigo Luís Rosa Couto Rogério Paulo Calderón Peres Sergio Mychkis Goldstein Tatiana Grecco Tom Gouvêa Gerth FISCAL COUNCIL Chairman José Caruso Cruz Henriques Members Alkimar Ribeiro Moura Carlos Roberto de Albuquerque Sá (*) Group Executive Finance Director and Head of Investor Relations. (1) On April 16, 2019, Mr. Amos Genish, presented his letter of resignation to the position of member of the Company’s Board of Directors, in accordance with the notice to the market disseminated on April 17, 2019. Accountant Arnaldo Alves dos Santos CRC - 1SP - 210.058/O-3 Itaú Unibanco Holding S.A. – Complete Financial Statements – March 31, 2019 54 ITAÚ UNIBANCO HOLDING S.A. BOARD OF DIRECTORS BOARD OF EXECUTIVE OFFICERS Co-Chairmen Chief Executive Officer Pedro Moreira Salles Candido Botelho Bracher Roberto Egydio Setubal Director Generals Members Caio Ibrahim David Alfredo Egydio Setubal Márcio de Andrade Schettini (1) Amos Genish Ana Lúcia de Mattos Barretto Villela Executive Vice-Presidents Fábio Colletti Barbosa André Sapoznik Gustavo Jorge Laboissière Loyola Claudia Politanski João Moreira Salles Milton Maluhy Filho José Galló Marco Ambrogio Crespi Bonomi Pedro Luiz Bodin de Moraes Executive Officers Ricardo Villela Marino Alexsandro Broedel Lopes (*) Fernando Barçante Tostes Malta Leila Cristiane Barboza Braga de Melo Paulo Sergio Miron AUDIT COMMITTEE Chairman Officers Gustavo Jorge Laboissière Loyola Adriano Cabral Volpini Álvaro Felipe Rizzi Rodrigues Andre Balestrin Cestare Members Emerson Macedo Bortoloto Antonio Carlos Barbosa de Oliveira Gilberto Frussa Antonio Francisco de Lima Neto José Virgilio Vita Neto Diego Fresco Gutierrez Renato Barbosa do Nascimento Maria Helena dos Santos Fernandes de Santana Rodrigo Luís Rosa Couto Rogério Paulo Calderón Peres Sergio Mychkis Goldstein Tatiana Grecco Tom Gouvêa Gerth FISCAL COUNCIL Chairman José Caruso Cruz Henriques Members Alkimar Ribeiro Moura Carlos Roberto de Albuquerque Sá (*) Group Executive Finance Director and Head of Investor Relations. (1) On April 16, 2019, Mr. Amos Genish, presented his letter of resignation to the position of member of the Company’s Board of Directors, in accordance with the notice to the market disseminated on April 17, 2019. Accountant Arnaldo Alves dos Santos CRC - 1SP - 210.058/O-3 Itaú Unibanco Holding S.A. – Complete Financial Statements – March 31, 2019 54

ITAÚ UNIBANCO S.A. Director Generals Officers (continued) Caio Ibrahim David Eduardo Cardoso Armonia Márcio de Andrade Schettini Eduardo Corsetti Eduardo Esteban Mato Amorin Eduardo Estefan Ventura Eduardo Hiroyuki Miyaki Executive Vice-Presidents Eduardo Queiroz Tracanella André Sapoznik Emerson Savi Junqueira Claudia Politanski Emilio Pedro Borsari Filho Milton Maluhy Filho Eric André Altafim Estevão Carcioffi Lazanha Fabiana Pascon Bastos (1) Fábio Napoli Felipe de Souza Wey Felipe Weil Wilberg Executive Officers Alexsandro Broedel Lopes Fernando Della Torre Chagas André Luís Teixeira Rodrigues Fernando Julião de Souza Amaral (1) Carlos Eduardo Monico Fernando Kontopp de Oliveira Carlos Fernando Rossi Constantini Flávio Delfino Júnior Carlos Orestes Vanzo Flavio Ribeiro Iglesias Christian George Egan Francisco Vieira Cordeiro Neto Fernando Barçante Tostes Malta Gabriel Guedes Pinto Teixeira Fernando Marsella Chacon Ruiz Gabriela Rodrigues Ferreira Flávio Augusto Aguiar de Souza Gilberto Frussa João Marcos Pequeno de Biase Gustavo Trovisco Lopes Leila Cristiane Barboza Braga de Melo João Antonio Dantas Bezerra Leite Luís Eduardo Gross Siqueira Cunha Jorge Luiz Viegas Ramalho Luiz Eduardo Loureiro Veloso José de Castro Araújo Rudge Filho Marcelo Kopel José Virgilio Vita Neto Marcos Antônio Vaz de Magalhães Laila Regina de Oliveira Pena de Antonio Ricardo Ribeiro Mandacaru Guerra Leon Gottlieb Sergio Guillinet Fajerman Lineu Carlos Ferraz de Andrade Wagner Bettini Sanches Livia Martines Chanes Luís Fernando Staub Luiz Felipe Monteiro Arcuri Trevisan Officers Luiz Fernando Butori Reis Santos Adriana Maria dos Santos Luiz Severiano Ribeiro Adriano Cabral Volpini Manoela Varanda Adriano Maciel Pedroti Marcello Siniscalchi Alessandro Anastasi Marcio Luis Domingues da Silva Álvaro Felipe Rizzi Rodrigues Marco Antonio Sudano Ana Lúcia Gomes De Sá Drumond Pardo Mário Lúcio Gurgel Pires Andre Balestrin Cestare Mario Magalhães Carvalho Mesquita André Carvalho Whyte Gailey Matias Granata André Henrique Caldeira Daré Milena de Castilho Lefon Martins (1) Andrea Carpes Blanco Moisés João do Nascimento Andréa Matteucci Pinotti Pedro Barros Barreto Fernandes Atilio Luiz Magila Albiero Junior Renato Cesar Mansur Badi Maani Shaikhzadeh Ricardo Nuno Delgado Gonçalves Bruno Machado Ferreira Ricardo Urquijo Lazcano Carlos Augusto Salamonde Rodnei Bernardino de Souza Carlos Eduardo Mori Peyser Rodrigo Jorge Dantas de Oliveira Carlos Henrique Donegá Aidar Rodrigo Luís Rosa Couto Carlos Rodrigo Formigari Rodrigo Rodrigues Baia Cesar Ming Pereira da Silva Rogerio Narle Elmais Cesar Padovan Rogerio Vasconcelos Costa Cícero Marcus de Araújo Rubens Luiz dos Santos Henriques Cintia Carbonieri Fleury de Camargo Sergio Mychkis Goldstein Claudio César Sanches Tatiana Grecco Cláudio José Coutinho Arromatte Thales Ferreira Silva Cristiane Magalhães Teixeira Portella Thiago Luiz Charnet Ellero Cristiano Guimarães Duarte Valéria Aparecida Marretto Vanessa Lopes Reisner (1) Elected at the ESM of 03/25/2019, awaiting approval from BACEN. Itaú Unibanco Holding S.A. – Complete Financial Statements – March 31, 2019 55 ITAÚ UNIBANCO S.A. Director Generals Officers (continued) Caio Ibrahim David Eduardo Cardoso Armonia Márcio de Andrade Schettini Eduardo Corsetti Eduardo Esteban Mato Amorin Eduardo Estefan Ventura Eduardo Hiroyuki Miyaki Executive Vice-Presidents Eduardo Queiroz Tracanella André Sapoznik Emerson Savi Junqueira Claudia Politanski Emilio Pedro Borsari Filho Milton Maluhy Filho Eric André Altafim Estevão Carcioffi Lazanha Fabiana Pascon Bastos (1) Fábio Napoli Felipe de Souza Wey Felipe Weil Wilberg Executive Officers Alexsandro Broedel Lopes Fernando Della Torre Chagas André Luís Teixeira Rodrigues Fernando Julião de Souza Amaral (1) Carlos Eduardo Monico Fernando Kontopp de Oliveira Carlos Fernando Rossi Constantini Flávio Delfino Júnior Carlos Orestes Vanzo Flavio Ribeiro Iglesias Christian George Egan Francisco Vieira Cordeiro Neto Fernando Barçante Tostes Malta Gabriel Guedes Pinto Teixeira Fernando Marsella Chacon Ruiz Gabriela Rodrigues Ferreira Flávio Augusto Aguiar de Souza Gilberto Frussa João Marcos Pequeno de Biase Gustavo Trovisco Lopes Leila Cristiane Barboza Braga de Melo João Antonio Dantas Bezerra Leite Luís Eduardo Gross Siqueira Cunha Jorge Luiz Viegas Ramalho Luiz Eduardo Loureiro Veloso José de Castro Araújo Rudge Filho Marcelo Kopel José Virgilio Vita Neto Marcos Antônio Vaz de Magalhães Laila Regina de Oliveira Pena de Antonio Ricardo Ribeiro Mandacaru Guerra Leon Gottlieb Sergio Guillinet Fajerman Lineu Carlos Ferraz de Andrade Wagner Bettini Sanches Livia Martines Chanes Luís Fernando Staub Luiz Felipe Monteiro Arcuri Trevisan Officers Luiz Fernando Butori Reis Santos Adriana Maria dos Santos Luiz Severiano Ribeiro Adriano Cabral Volpini Manoela Varanda Adriano Maciel Pedroti Marcello Siniscalchi Alessandro Anastasi Marcio Luis Domingues da Silva Álvaro Felipe Rizzi Rodrigues Marco Antonio Sudano Ana Lúcia Gomes De Sá Drumond Pardo Mário Lúcio Gurgel Pires Andre Balestrin Cestare Mario Magalhães Carvalho Mesquita André Carvalho Whyte Gailey Matias Granata André Henrique Caldeira Daré Milena de Castilho Lefon Martins (1) Andrea Carpes Blanco Moisés João do Nascimento Andréa Matteucci Pinotti Pedro Barros Barreto Fernandes Atilio Luiz Magila Albiero Junior Renato Cesar Mansur Badi Maani Shaikhzadeh Ricardo Nuno Delgado Gonçalves Bruno Machado Ferreira Ricardo Urquijo Lazcano Carlos Augusto Salamonde Rodnei Bernardino de Souza Carlos Eduardo Mori Peyser Rodrigo Jorge Dantas de Oliveira Carlos Henrique Donegá Aidar Rodrigo Luís Rosa Couto Carlos Rodrigo Formigari Rodrigo Rodrigues Baia Cesar Ming Pereira da Silva Rogerio Narle Elmais Cesar Padovan Rogerio Vasconcelos Costa Cícero Marcus de Araújo Rubens Luiz dos Santos Henriques Cintia Carbonieri Fleury de Camargo Sergio Mychkis Goldstein Claudio César Sanches Tatiana Grecco Cláudio José Coutinho Arromatte Thales Ferreira Silva Cristiane Magalhães Teixeira Portella Thiago Luiz Charnet Ellero Cristiano Guimarães Duarte Valéria Aparecida Marretto Vanessa Lopes Reisner (1) Elected at the ESM of 03/25/2019, awaiting approval from BACEN. Itaú Unibanco Holding S.A. – Complete Financial Statements – March 31, 2019 55
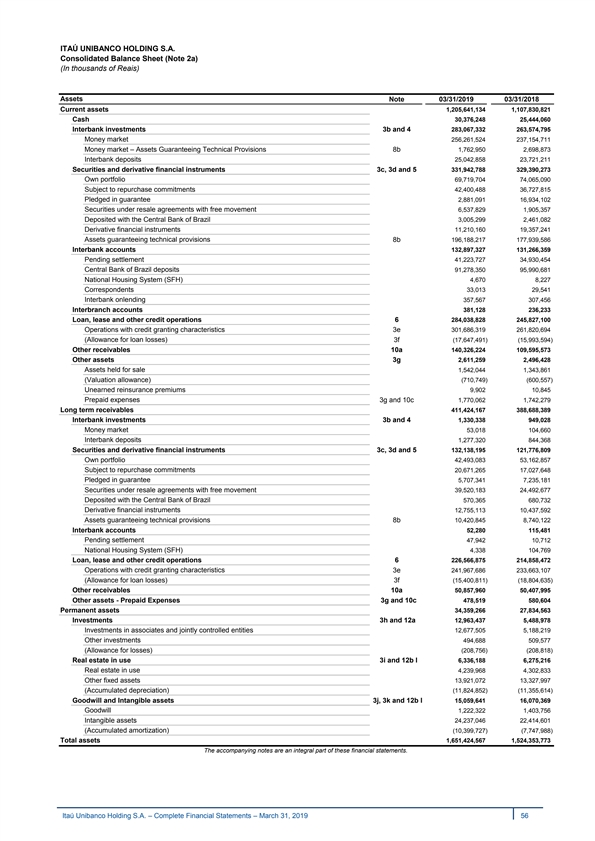
ITAÚ UNIBANCO HOLDING S.A. Consolidated Balance Sheet (Note 2a) (In thousands of Reais) Assets Note 03/31/2019 03/31/2018 Current assets 1 ,205,641,134 1,107,830,821 Cash 0 30,376,248 25,444,060 Interbank investments 3b and 4 2 83,067,332 2 63,574,795 Money market 0 2 56,261,524 237,154,711 Money market – Assets Guaranteeing Technical Provisions 8b 1,762,950 2,698,873 Interbank deposits 0 2 5,042,858 23,721,211 Securities and derivative financial instruments 3c, 3d and 5 3 31,942,788 3 29,390,273 Own portfolio 0 69,719,704 74,065,090 Subject to repurchase commitments 0 4 2,400,488 3 6,727,815 Pledged in guarantee 0 2 ,881,091 16,934,102 Securities under resale agreements with free movement 0 6 ,537,829 1 ,905,357 Deposited with the Central Bank of Brazil 0 3,005,299 2,461,082 Derivative financial instruments 0 1 1,210,160 19,357,241 Assets guaranteeing technical provisions 8b 1 96,188,217 1 77,939,586 Interbank accounts 0 132,897,327 1 31,266,359 Pending settlement 0 4 1,223,727 34,930,454 Central Bank of Brazil deposits 0 9 1,278,350 9 5,990,681 National Housing System (SFH) 0 4 ,670 8,227 Correspondents 0 33,013 29,541 Interbank onlending 0 357,567 307,456 Interbranch accounts 0 381,128 2 36,233 Loan, lease and other credit operations 6 284,038,828 2 45,827,100 Operations with credit granting characteristics 3e 3 01,686,319 261,820,694 (Allowance for loan losses) 3f (17,647,491) (15,993,594) Other receivables 10a 140,326,224 1 09,595,573 Other assets 3g 2,611,259 2,496,428 Assets held for sale 0 1 ,542,044 1,343,861 (Valuation allowance) 0 (710,749) (600,557) Unearned reinsurance premiums 9,902 1 0,845 Prepaid expenses 3g and 10c 1 ,770,062 1 ,742,279 Long term receivables 0 411,424,167 3 88,688,389 Interbank investments 3b and 4 1,330,338 949,028 Money market 0 53,018 1 04,660 Interbank deposits 0 1,277,320 8 44,368 Securities and derivative financial instruments 3c, 3d and 5 1 32,138,195 121,776,809 Own portfolio 0 4 2,493,083 5 3,162,857 Subject to repurchase commitments 0 2 0,671,265 17,027,648 Pledged in guarantee 0 5 ,707,341 7 ,235,181 Securities under resale agreements with free movement 0 3 9,520,183 24,492,677 Deposited with the Central Bank of Brazil 570,365 680,732 Derivative financial instruments 0 12,755,113 10,437,592 Assets guaranteeing technical provisions 8b 1 0,420,845 8,740,122 Interbank accounts 0 52,280 115,481 Pending settlement 4 7,942 10,712 National Housing System (SFH) 4 ,338 1 04,769 Loan, lease and other credit operations 6 2 26,566,875 214,858,472 Operations with credit granting characteristics 3e 2 41,967,686 233,663,107 (Allowance for loan losses) 3f (15,400,811) (18,804,635) Other receivables 10a 5 0,857,960 50,407,995 Other assets - Prepaid Expenses 3g and 10c 478,519 5 80,604 Permanent assets 0 34,359,266 2 7,834,563 Investments 3h and 12a 12,963,437 5,488,978 Investments in associates and jointly controlled entities 0 1 2,677,505 5,188,219 Other investments 0 4 94,688 5 09,577 (Allowance for losses) 0 ( 208,756) (208,818) Real estate in use 3i and 12b l 6 ,336,188 6,275,216 Real estate in use 0 4 ,239,968 4,302,833 Other fixed assets 0 13,921,072 13,327,997 (Accumulated depreciation) 0 ( 11,824,852) ( 11,355,614) Goodwill and Intangible assets 3j, 3k and 12b ll 1 5,059,641 16,070,369 Goodwill 0 1 ,222,322 1 ,403,756 Intangible assets 0 2 4,237,046 22,414,601 (Accumulated amortization) 0 (10,399,727) (7,747,988) Total assets 1,651,424,567 1 ,524,353,773 The accompanying notes are an integral part of these financial statements. Itaú Unibanco Holding S.A. – Complete Financial Statements – March 31, 2019 56 ITAÚ UNIBANCO HOLDING S.A. Consolidated Balance Sheet (Note 2a) (In thousands of Reais) Assets Note 03/31/2019 03/31/2018 Current assets 1 ,205,641,134 1,107,830,821 Cash 0 30,376,248 25,444,060 Interbank investments 3b and 4 2 83,067,332 2 63,574,795 Money market 0 2 56,261,524 237,154,711 Money market – Assets Guaranteeing Technical Provisions 8b 1,762,950 2,698,873 Interbank deposits 0 2 5,042,858 23,721,211 Securities and derivative financial instruments 3c, 3d and 5 3 31,942,788 3 29,390,273 Own portfolio 0 69,719,704 74,065,090 Subject to repurchase commitments 0 4 2,400,488 3 6,727,815 Pledged in guarantee 0 2 ,881,091 16,934,102 Securities under resale agreements with free movement 0 6 ,537,829 1 ,905,357 Deposited with the Central Bank of Brazil 0 3,005,299 2,461,082 Derivative financial instruments 0 1 1,210,160 19,357,241 Assets guaranteeing technical provisions 8b 1 96,188,217 1 77,939,586 Interbank accounts 0 132,897,327 1 31,266,359 Pending settlement 0 4 1,223,727 34,930,454 Central Bank of Brazil deposits 0 9 1,278,350 9 5,990,681 National Housing System (SFH) 0 4 ,670 8,227 Correspondents 0 33,013 29,541 Interbank onlending 0 357,567 307,456 Interbranch accounts 0 381,128 2 36,233 Loan, lease and other credit operations 6 284,038,828 2 45,827,100 Operations with credit granting characteristics 3e 3 01,686,319 261,820,694 (Allowance for loan losses) 3f (17,647,491) (15,993,594) Other receivables 10a 140,326,224 1 09,595,573 Other assets 3g 2,611,259 2,496,428 Assets held for sale 0 1 ,542,044 1,343,861 (Valuation allowance) 0 (710,749) (600,557) Unearned reinsurance premiums 9,902 1 0,845 Prepaid expenses 3g and 10c 1 ,770,062 1 ,742,279 Long term receivables 0 411,424,167 3 88,688,389 Interbank investments 3b and 4 1,330,338 949,028 Money market 0 53,018 1 04,660 Interbank deposits 0 1,277,320 8 44,368 Securities and derivative financial instruments 3c, 3d and 5 1 32,138,195 121,776,809 Own portfolio 0 4 2,493,083 5 3,162,857 Subject to repurchase commitments 0 2 0,671,265 17,027,648 Pledged in guarantee 0 5 ,707,341 7 ,235,181 Securities under resale agreements with free movement 0 3 9,520,183 24,492,677 Deposited with the Central Bank of Brazil 570,365 680,732 Derivative financial instruments 0 12,755,113 10,437,592 Assets guaranteeing technical provisions 8b 1 0,420,845 8,740,122 Interbank accounts 0 52,280 115,481 Pending settlement 4 7,942 10,712 National Housing System (SFH) 4 ,338 1 04,769 Loan, lease and other credit operations 6 2 26,566,875 214,858,472 Operations with credit granting characteristics 3e 2 41,967,686 233,663,107 (Allowance for loan losses) 3f (15,400,811) (18,804,635) Other receivables 10a 5 0,857,960 50,407,995 Other assets - Prepaid Expenses 3g and 10c 478,519 5 80,604 Permanent assets 0 34,359,266 2 7,834,563 Investments 3h and 12a 12,963,437 5,488,978 Investments in associates and jointly controlled entities 0 1 2,677,505 5,188,219 Other investments 0 4 94,688 5 09,577 (Allowance for losses) 0 ( 208,756) (208,818) Real estate in use 3i and 12b l 6 ,336,188 6,275,216 Real estate in use 0 4 ,239,968 4,302,833 Other fixed assets 0 13,921,072 13,327,997 (Accumulated depreciation) 0 ( 11,824,852) ( 11,355,614) Goodwill and Intangible assets 3j, 3k and 12b ll 1 5,059,641 16,070,369 Goodwill 0 1 ,222,322 1 ,403,756 Intangible assets 0 2 4,237,046 22,414,601 (Accumulated amortization) 0 (10,399,727) (7,747,988) Total assets 1,651,424,567 1 ,524,353,773 The accompanying notes are an integral part of these financial statements. Itaú Unibanco Holding S.A. – Complete Financial Statements – March 31, 2019 56
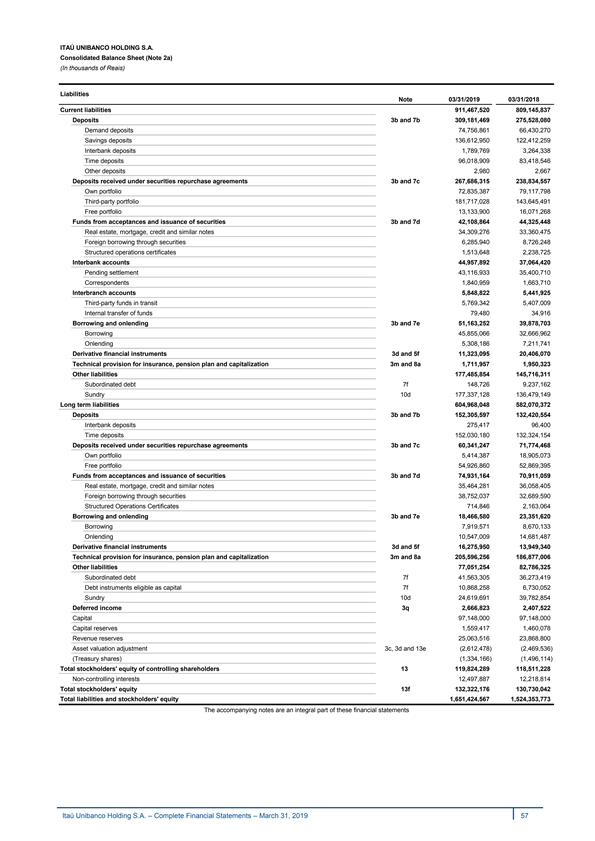
ITAÚ UNIBANCO HOLDING S.A. Consolidated Balance Sheet (Note 2a) (In thousands of Reais) Liabilities Note 03/31/2019 03/31/2018 Current liabilities 9 11,467,520 8 09,145,837 Deposits 3b and 7b 3 09,181,469 2 75,528,080 Demand deposits - 7 4,756,861 66,430,270 Savings deposits - 1 36,612,950 122,412,259 Interbank deposits - 1 ,789,769 3 ,264,338 Time deposits - 96,018,909 83,418,546 Other deposits - 2 ,980 2 ,667 Deposits received under securities repurchase agreements 3b and 7c 2 67,686,315 2 38,834,557 Own portfolio - 72,835,387 79,117,798 Third-party portfolio - 181,717,028 1 43,645,491 Free portfolio - 13,133,900 1 6,071,268 Funds from acceptances and issuance of securities 3b and 7d 4 2,108,864 44,325,448 Real estate, mortgage, credit and similar notes - 34,309,276 3 3,360,475 Foreign borrowing through securities - 6 ,285,940 8 ,726,248 Structured operations certificates 1,513,648 2 ,238,725 Interbank accounts - 44,957,892 37,064,420 Pending settlement - 4 3,116,933 35,400,710 Correspondents - 1,840,959 1 ,663,710 Interbranch accounts - 5 ,848,822 5,441,925 Third-party funds in transit - 5,769,342 5,407,009 Internal transfer of funds - 7 9,480 3 4,916 Borrowing and onlending 3b and 7e 51,163,252 39,878,703 Borrowing - 4 5,855,066 3 2,666,962 Onlending - 5 ,308,186 7,211,741 Derivative financial instruments 3d and 5f 1 1,323,095 2 0,406,070 Technical provision for insurance, pension plan and capitalization 3m and 8a 1 ,711,957 1 ,950,323 Other liabilities - 1 77,485,854 1 45,716,311 Subordinated debt 7f 148,726 9 ,237,162 Sundry 10d 1 77,337,128 1 36,479,149 Long term liabilities - 604,968,048 582,070,372 Deposits 3b and 7b 152,305,597 1 32,420,554 Interbank deposits - 2 75,417 9 6,400 Time deposits - 152,030,180 1 32,324,154 Deposits received under securities repurchase agreements 3b and 7c 60,341,247 71,774,468 Own portfolio - 5 ,414,387 1 8,905,073 Free portfolio - 54,926,860 52,869,395 Funds from acceptances and issuance of securities 3b and 7d 7 4,931,164 7 0,911,059 Real estate, mortgage, credit and similar notes - 3 5,464,281 36,058,405 Foreign borrowing through securities - 3 8,752,037 3 2,689,590 Structured Operations Certificates 7 14,846 2 ,163,064 Borrowing and onlending 3b and 7e 18,466,580 23,351,620 Borrowing - 7 ,919,571 8 ,670,133 Onlending - 1 0,547,009 14,681,487 Derivative financial instruments 3d and 5f 1 6,275,950 1 3,949,340 Technical provision for insurance, pension plan and capitalization 3m and 8a 2 05,596,256 186,877,006 Other liabilities - 77,051,254 82,786,325 Subordinated debt 7f 41,563,305 36,273,419 Debt instruments eligible as capital 7f 10,868,258 6,730,052 Sundry 10d 2 4,619,691 3 9,782,854 Deferred income 3q 2,666,823 2 ,407,522 Capital - 9 7,148,000 97,148,000 Capital reserves - 1,559,417 1,460,078 Revenue reserves - 25,063,516 2 3,868,800 Asset valuation adjustment 3c, 3d and 13e ( 2,612,478) (2,469,536) (Treasury shares) - ( 1,334,166) ( 1,496,114) Total stockholders' equity of controlling shareholders 13 119,824,289 118,511,228 Non-controlling interests 1 2,497,887 1 2,218,814 Total stockholders' equity 13f 132,322,176 1 30,730,042 Total liabilities and stockholders' equity 1 ,651,424,567 1,524,353,773 The accompanying notes are an integral part of these financial statements Itaú Unibanco Holding S.A. – Complete Financial Statements – March 31, 2019 57 ITAÚ UNIBANCO HOLDING S.A. Consolidated Balance Sheet (Note 2a) (In thousands of Reais) Liabilities Note 03/31/2019 03/31/2018 Current liabilities 9 11,467,520 8 09,145,837 Deposits 3b and 7b 3 09,181,469 2 75,528,080 Demand deposits - 7 4,756,861 66,430,270 Savings deposits - 1 36,612,950 122,412,259 Interbank deposits - 1 ,789,769 3 ,264,338 Time deposits - 96,018,909 83,418,546 Other deposits - 2 ,980 2 ,667 Deposits received under securities repurchase agreements 3b and 7c 2 67,686,315 2 38,834,557 Own portfolio - 72,835,387 79,117,798 Third-party portfolio - 181,717,028 1 43,645,491 Free portfolio - 13,133,900 1 6,071,268 Funds from acceptances and issuance of securities 3b and 7d 4 2,108,864 44,325,448 Real estate, mortgage, credit and similar notes - 34,309,276 3 3,360,475 Foreign borrowing through securities - 6 ,285,940 8 ,726,248 Structured operations certificates 1,513,648 2 ,238,725 Interbank accounts - 44,957,892 37,064,420 Pending settlement - 4 3,116,933 35,400,710 Correspondents - 1,840,959 1 ,663,710 Interbranch accounts - 5 ,848,822 5,441,925 Third-party funds in transit - 5,769,342 5,407,009 Internal transfer of funds - 7 9,480 3 4,916 Borrowing and onlending 3b and 7e 51,163,252 39,878,703 Borrowing - 4 5,855,066 3 2,666,962 Onlending - 5 ,308,186 7,211,741 Derivative financial instruments 3d and 5f 1 1,323,095 2 0,406,070 Technical provision for insurance, pension plan and capitalization 3m and 8a 1 ,711,957 1 ,950,323 Other liabilities - 1 77,485,854 1 45,716,311 Subordinated debt 7f 148,726 9 ,237,162 Sundry 10d 1 77,337,128 1 36,479,149 Long term liabilities - 604,968,048 582,070,372 Deposits 3b and 7b 152,305,597 1 32,420,554 Interbank deposits - 2 75,417 9 6,400 Time deposits - 152,030,180 1 32,324,154 Deposits received under securities repurchase agreements 3b and 7c 60,341,247 71,774,468 Own portfolio - 5 ,414,387 1 8,905,073 Free portfolio - 54,926,860 52,869,395 Funds from acceptances and issuance of securities 3b and 7d 7 4,931,164 7 0,911,059 Real estate, mortgage, credit and similar notes - 3 5,464,281 36,058,405 Foreign borrowing through securities - 3 8,752,037 3 2,689,590 Structured Operations Certificates 7 14,846 2 ,163,064 Borrowing and onlending 3b and 7e 18,466,580 23,351,620 Borrowing - 7 ,919,571 8 ,670,133 Onlending - 1 0,547,009 14,681,487 Derivative financial instruments 3d and 5f 1 6,275,950 1 3,949,340 Technical provision for insurance, pension plan and capitalization 3m and 8a 2 05,596,256 186,877,006 Other liabilities - 77,051,254 82,786,325 Subordinated debt 7f 41,563,305 36,273,419 Debt instruments eligible as capital 7f 10,868,258 6,730,052 Sundry 10d 2 4,619,691 3 9,782,854 Deferred income 3q 2,666,823 2 ,407,522 Capital - 9 7,148,000 97,148,000 Capital reserves - 1,559,417 1,460,078 Revenue reserves - 25,063,516 2 3,868,800 Asset valuation adjustment 3c, 3d and 13e ( 2,612,478) (2,469,536) (Treasury shares) - ( 1,334,166) ( 1,496,114) Total stockholders' equity of controlling shareholders 13 119,824,289 118,511,228 Non-controlling interests 1 2,497,887 1 2,218,814 Total stockholders' equity 13f 132,322,176 1 30,730,042 Total liabilities and stockholders' equity 1 ,651,424,567 1,524,353,773 The accompanying notes are an integral part of these financial statements Itaú Unibanco Holding S.A. – Complete Financial Statements – March 31, 2019 57
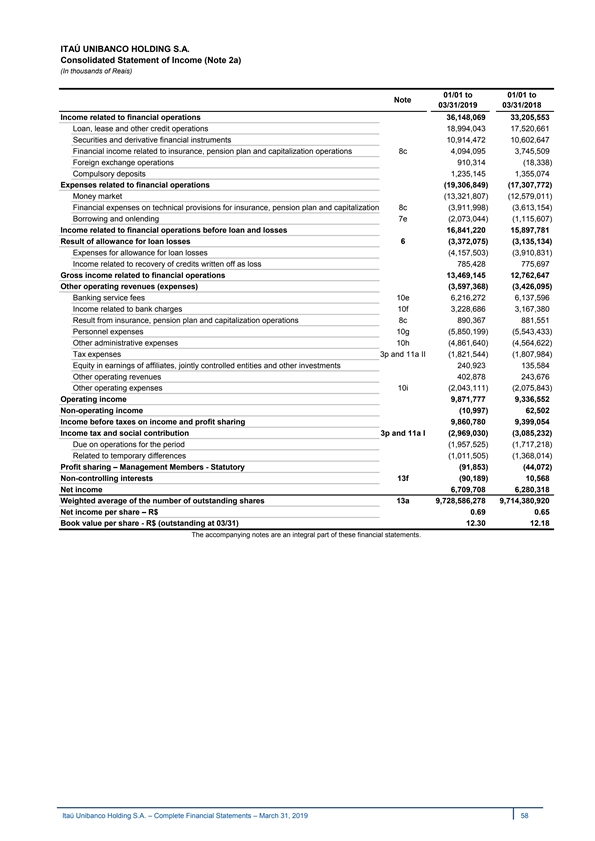
ITAÚ UNIBANCO HOLDING S.A. Consolidated Statement of Income (Note 2a) (In thousands of Reais) 01/01 to 01/01 to Note 03/31/2019 03/31/2018 Income related to financial operations 36,148,069 33,205,553 Loan, lease and other credit operations - 18,994,043 1 7,520,661 Securities and derivative financial instruments - 1 0,914,472 1 0,602,647 Financial income related to insurance, pension plan and capitalization operations 8c 4 ,094,095 3 ,745,509 Foreign exchange operations - 9 10,314 (1 8,338) Compulsory deposits - 1 ,235,145 1 ,355,074 Expenses related to financial operations - (19,306,849) (17,307,772) Money market - (1 3,321,807) (1 2,579,011) Financial expenses on technical provisions for insurance, pension plan and capitalization 8c (3 ,911,998) (3,613,154) Borrowing and onlending 7e (2 ,073,044) (1,115,607) Income related to financial operations before loan and losses - 16,841,220 15,897,781 Result of allowance for loan losses 6 (3,372,075) (3,135,134) Expenses for allowance for loan losses - (4 ,157,503) (3,910,831) Income related to recovery of credits written off as loss - 785,428 775,697 Gross income related to financial operations - 13,469,145 12,762,647 Other operating revenues (expenses) - (3,597,368) (3,426,095) Banking service fees 10e 6,216,272 6,137,596 Income related to bank charges 10f 3 ,228,686 3 ,167,380 Result from insurance, pension plan and capitalization operations 8c 890,367 881,551 Personnel expenses 10g (5,850,199) (5 ,543,433) Other administrative expenses 10h (4,861,640) (4,564,622) Tax expenses 3p and 11a II (1 ,821,544) (1 ,807,984) Equity in earnings of affiliates, jointly controlled entities and other investments 240,923 1 35,584 Other operating revenues 4 02,878 2 43,676 Other operating expenses 10i (2,043,111) (2 ,075,843) Operating income - 9,871,777 9,336,552 Non-operating income (1 0,997) 62,502 Income before taxes on income and profit sharing - 9,860,780 9,399,054 Income tax and social contribution 3p and 11a I (2,969,030) (3,085,232) Due on operations for the period - (1,957,525) (1 ,717,218) Related to temporary differences - (1,011,505) (1,368,014) Profit sharing – Management Members - Statutory - (91,853) (44,072) Non-controlling interests 13f (9 0,189) 1 0,568 Net income 6,709,708 6,280,318 Weighted average of the number of outstanding shares 13a 9,728,586,278 9,714,380,920 Net income per share – R$ 0 .69 0.65 Book value per share - R$ (outstanding at 03/31) 12.30 1 2.18 The accompanying notes are an integral part of these financial statements. Itaú Unibanco Holding S.A. – Complete Financial Statements – March 31, 2019 58 ITAÚ UNIBANCO HOLDING S.A. Consolidated Statement of Income (Note 2a) (In thousands of Reais) 01/01 to 01/01 to Note 03/31/2019 03/31/2018 Income related to financial operations 36,148,069 33,205,553 Loan, lease and other credit operations - 18,994,043 1 7,520,661 Securities and derivative financial instruments - 1 0,914,472 1 0,602,647 Financial income related to insurance, pension plan and capitalization operations 8c 4 ,094,095 3 ,745,509 Foreign exchange operations - 9 10,314 (1 8,338) Compulsory deposits - 1 ,235,145 1 ,355,074 Expenses related to financial operations - (19,306,849) (17,307,772) Money market - (1 3,321,807) (1 2,579,011) Financial expenses on technical provisions for insurance, pension plan and capitalization 8c (3 ,911,998) (3,613,154) Borrowing and onlending 7e (2 ,073,044) (1,115,607) Income related to financial operations before loan and losses - 16,841,220 15,897,781 Result of allowance for loan losses 6 (3,372,075) (3,135,134) Expenses for allowance for loan losses - (4 ,157,503) (3,910,831) Income related to recovery of credits written off as loss - 785,428 775,697 Gross income related to financial operations - 13,469,145 12,762,647 Other operating revenues (expenses) - (3,597,368) (3,426,095) Banking service fees 10e 6,216,272 6,137,596 Income related to bank charges 10f 3 ,228,686 3 ,167,380 Result from insurance, pension plan and capitalization operations 8c 890,367 881,551 Personnel expenses 10g (5,850,199) (5 ,543,433) Other administrative expenses 10h (4,861,640) (4,564,622) Tax expenses 3p and 11a II (1 ,821,544) (1 ,807,984) Equity in earnings of affiliates, jointly controlled entities and other investments 240,923 1 35,584 Other operating revenues 4 02,878 2 43,676 Other operating expenses 10i (2,043,111) (2 ,075,843) Operating income - 9,871,777 9,336,552 Non-operating income (1 0,997) 62,502 Income before taxes on income and profit sharing - 9,860,780 9,399,054 Income tax and social contribution 3p and 11a I (2,969,030) (3,085,232) Due on operations for the period - (1,957,525) (1 ,717,218) Related to temporary differences - (1,011,505) (1,368,014) Profit sharing – Management Members - Statutory - (91,853) (44,072) Non-controlling interests 13f (9 0,189) 1 0,568 Net income 6,709,708 6,280,318 Weighted average of the number of outstanding shares 13a 9,728,586,278 9,714,380,920 Net income per share – R$ 0 .69 0.65 Book value per share - R$ (outstanding at 03/31) 12.30 1 2.18 The accompanying notes are an integral part of these financial statements. Itaú Unibanco Holding S.A. – Complete Financial Statements – March 31, 2019 58
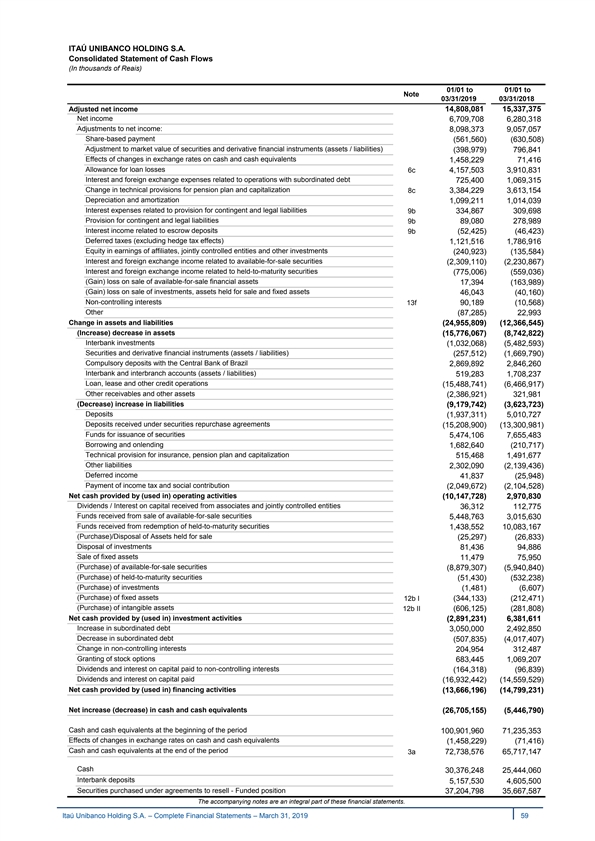
ITAÚ UNIBANCO HOLDING S.A. Consolidated Statement of Cash Flows (In thousands of Reais) 01/01 to 01/01 to Note 03/31/2019 03/31/2018 Adjusted net income 14,808,081 15,337,375 Net income 6,709,708 6,280,318 Adjustments to net income: 8,098,373 9,057,057 Share-based payment (561,560) (630,508) Adjustment to market value of securities and derivative financial instruments (assets / liabilities) (398,979) 796,841 Effects of changes in exchange rates on cash and cash equivalents 1,458,229 71,416 Allowance for loan losses 6c 4,157,503 3,910,831 Interest and foreign exchange expenses related to operations with subordinated debt 725,400 1,069,315 Change in technical provisions for pension plan and capitalization 8c 3,384,229 3,613,154 Depreciation and amortization 1,099,211 1,014,039 Interest expenses related to provision for contingent and legal liabilities 9b 334,867 309,698 Provision for contingent and legal liabilities 9b 89,080 278,989 Interest income related to escrow deposits 9b (52,425) (46,423) Deferred taxes (excluding hedge tax effects) 1,121,516 1,786,916 Equity in earnings of affiliates, jointly controlled entities and other investments (240,923) (135,584) Interest and foreign exchange income related to available-for-sale securities (2,309,110) (2,230,867) Interest and foreign exchange income related to held-to-maturity securities (775,006) (559,036) (Gain) loss on sale of available-for-sale financial assets 17,394 (163,989) (Gain) loss on sale of investments, assets held for sale and fixed assets 46,043 (40,160) Non-controlling interests 13f 90,189 (10,568) Other (87,285) 22,993 Change in assets and liabilities (24,955,809) (12,366,545) (Increase) decrease in assets (15,776,067) (8,742,822) Interbank investments (1,032,068) (5,482,593) Securities and derivative financial instruments (assets / liabilities) (257,512) (1,669,790) Compulsory deposits with the Central Bank of Brazil 2,869,892 2,846,260 Interbank and interbranch accounts (assets / liabilities) 519,283 1,708,237 Loan, lease and other credit operations (15,488,741) (6,466,917) Other receivables and other assets (2,386,921) 321,981 (Decrease) increase in liabilities (9,179,742) (3,623,723) Deposits (1,937,311) 5,010,727 Deposits received under securities repurchase agreements (15,208,900) (13,300,981) Funds for issuance of securities 5,474,106 7,655,483 Borrowing and onlending 1,682,640 (210,717) Technical provision for insurance, pension plan and capitalization 515,468 1,491,677 Other liabilities 2,302,090 (2,139,436) Deferred income 41,837 (25,948) Payment of income tax and social contribution (2,049,672) (2,104,528) Net cash provided by (used in) operating activities ( 10,147,728) 2,970,830 Dividends / Interest on capital received from associates and jointly controlled entities 36,312 112,775 Funds received from sale of available-for-sale securities 5,448,763 3,015,630 Funds received from redemption of held-to-maturity securities 1,438,552 10,083,167 (Purchase)/Disposal of Assets held for sale (25,297) (26,833) Disposal of investments 81,436 94,886 Sale of fixed assets 11,479 75,950 (Purchase) of available-for-sale securities (8,879,307) (5,940,840) (Purchase) of held-to-maturity securities (51,430) (532,238) (Purchase) of investments (1,481) (6,607) (Purchase) of fixed assets 12b I (344,133) (212,471) (Purchase) of intangible assets 12b II (606,125) (281,808) Net cash provided by (used in) investment activities (2,891,231) 6,381,611 Increase in subordinated debt 3,050,000 2,492,850 Decrease in subordinated debt (507,835) (4,017,407) Change in non-controlling interests 204,954 312,487 Granting of stock options 683,445 1,069,207 Dividends and interest on capital paid to non-controlling interests (164,318) (96,839) Dividends and interest on capital paid (16,932,442) (14,559,529) Net cash provided by (used in) financing activities (13,666,196) (14,799,231) Net increase (decrease) in cash and cash equivalents (26,705,155) (5,446,790) Cash and cash equivalents at the beginning of the period 100,901,960 71,235,353 Effects of changes in exchange rates on cash and cash equivalents (1,458,229) (71,416) Cash and cash equivalents at the end of the period 3a 72,738,576 65,717,147 Cash 30,376,248 25,444,060 Interbank deposits 5,157,530 4,605,500 Securities purchased under agreements to resell - Funded position 37,204,798 35,667,587 The accompanying notes are an integral part of these financial statements. Itaú Unibanco Holding S.A. – Complete Financial Statements – March 31, 2019 59 ITAÚ UNIBANCO HOLDING S.A. Consolidated Statement of Cash Flows (In thousands of Reais) 01/01 to 01/01 to Note 03/31/2019 03/31/2018 Adjusted net income 14,808,081 15,337,375 Net income 6,709,708 6,280,318 Adjustments to net income: 8,098,373 9,057,057 Share-based payment (561,560) (630,508) Adjustment to market value of securities and derivative financial instruments (assets / liabilities) (398,979) 796,841 Effects of changes in exchange rates on cash and cash equivalents 1,458,229 71,416 Allowance for loan losses 6c 4,157,503 3,910,831 Interest and foreign exchange expenses related to operations with subordinated debt 725,400 1,069,315 Change in technical provisions for pension plan and capitalization 8c 3,384,229 3,613,154 Depreciation and amortization 1,099,211 1,014,039 Interest expenses related to provision for contingent and legal liabilities 9b 334,867 309,698 Provision for contingent and legal liabilities 9b 89,080 278,989 Interest income related to escrow deposits 9b (52,425) (46,423) Deferred taxes (excluding hedge tax effects) 1,121,516 1,786,916 Equity in earnings of affiliates, jointly controlled entities and other investments (240,923) (135,584) Interest and foreign exchange income related to available-for-sale securities (2,309,110) (2,230,867) Interest and foreign exchange income related to held-to-maturity securities (775,006) (559,036) (Gain) loss on sale of available-for-sale financial assets 17,394 (163,989) (Gain) loss on sale of investments, assets held for sale and fixed assets 46,043 (40,160) Non-controlling interests 13f 90,189 (10,568) Other (87,285) 22,993 Change in assets and liabilities (24,955,809) (12,366,545) (Increase) decrease in assets (15,776,067) (8,742,822) Interbank investments (1,032,068) (5,482,593) Securities and derivative financial instruments (assets / liabilities) (257,512) (1,669,790) Compulsory deposits with the Central Bank of Brazil 2,869,892 2,846,260 Interbank and interbranch accounts (assets / liabilities) 519,283 1,708,237 Loan, lease and other credit operations (15,488,741) (6,466,917) Other receivables and other assets (2,386,921) 321,981 (Decrease) increase in liabilities (9,179,742) (3,623,723) Deposits (1,937,311) 5,010,727 Deposits received under securities repurchase agreements (15,208,900) (13,300,981) Funds for issuance of securities 5,474,106 7,655,483 Borrowing and onlending 1,682,640 (210,717) Technical provision for insurance, pension plan and capitalization 515,468 1,491,677 Other liabilities 2,302,090 (2,139,436) Deferred income 41,837 (25,948) Payment of income tax and social contribution (2,049,672) (2,104,528) Net cash provided by (used in) operating activities ( 10,147,728) 2,970,830 Dividends / Interest on capital received from associates and jointly controlled entities 36,312 112,775 Funds received from sale of available-for-sale securities 5,448,763 3,015,630 Funds received from redemption of held-to-maturity securities 1,438,552 10,083,167 (Purchase)/Disposal of Assets held for sale (25,297) (26,833) Disposal of investments 81,436 94,886 Sale of fixed assets 11,479 75,950 (Purchase) of available-for-sale securities (8,879,307) (5,940,840) (Purchase) of held-to-maturity securities (51,430) (532,238) (Purchase) of investments (1,481) (6,607) (Purchase) of fixed assets 12b I (344,133) (212,471) (Purchase) of intangible assets 12b II (606,125) (281,808) Net cash provided by (used in) investment activities (2,891,231) 6,381,611 Increase in subordinated debt 3,050,000 2,492,850 Decrease in subordinated debt (507,835) (4,017,407) Change in non-controlling interests 204,954 312,487 Granting of stock options 683,445 1,069,207 Dividends and interest on capital paid to non-controlling interests (164,318) (96,839) Dividends and interest on capital paid (16,932,442) (14,559,529) Net cash provided by (used in) financing activities (13,666,196) (14,799,231) Net increase (decrease) in cash and cash equivalents (26,705,155) (5,446,790) Cash and cash equivalents at the beginning of the period 100,901,960 71,235,353 Effects of changes in exchange rates on cash and cash equivalents (1,458,229) (71,416) Cash and cash equivalents at the end of the period 3a 72,738,576 65,717,147 Cash 30,376,248 25,444,060 Interbank deposits 5,157,530 4,605,500 Securities purchased under agreements to resell - Funded position 37,204,798 35,667,587 The accompanying notes are an integral part of these financial statements. Itaú Unibanco Holding S.A. – Complete Financial Statements – March 31, 2019 59
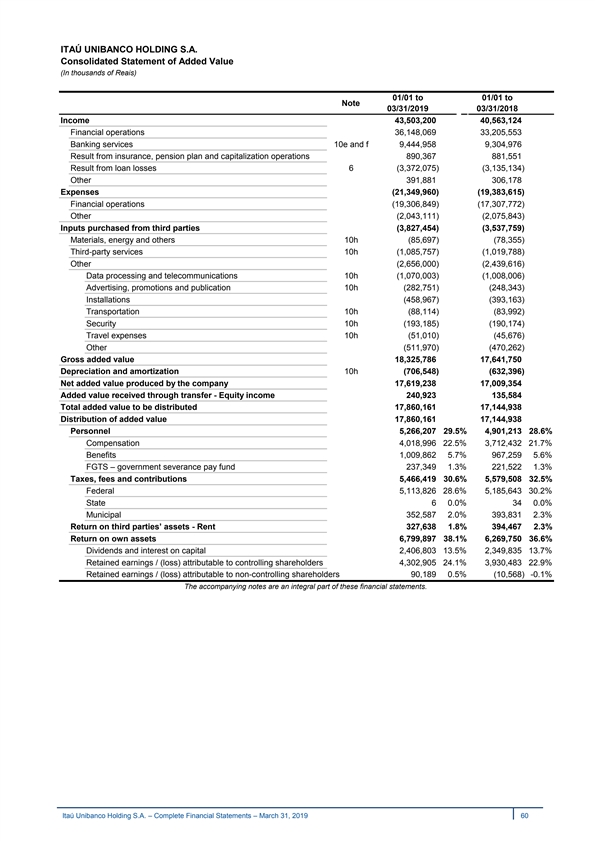
ITAÚ UNIBANCO HOLDING S.A. Consolidated Statement of Added Value (In thousands of Reais) 01/01 to 01/01 to Note 03/31/2019 03/31/2018 Income 4 3,503,200 40,563,124 Financial operations 36,148,069 33,205,553 Banking services 10e and f 9,444,958 9 ,304,976 Result from insurance, pension plan and capitalization operations 8 90,367 881,551 Result from loan losses 6 (3,372,075) (3,135,134) Other 391,881 306,178 Expenses (2 1,349,960) (1 9,383,615) Financial operations (1 9,306,849) (1 7,307,772) Other (2,043,111) (2,075,843) Inputs purchased from third parties (3,827,454) (3 ,537,759) Materials, energy and others 10h (8 5,697) (78,355) Third-party services 10h (1,085,757) (1,019,788) Other (2 ,656,000) (2 ,439,616) Data processing and telecommunications 10h (1,070,003) (1 ,008,006) Advertising, promotions and publication 10h (282,751) (2 48,343) Installations (458,967) (393,163) Transportation 10h (88,114) (8 3,992) Security 10h (1 93,185) (190,174) Travel expenses 10h (51,010) (4 5,676) Other (511,970) (4 70,262) Gross added value 1 8,325,786 17,641,750 Depreciation and amortization 10h (706,548) (632,396) Net added value produced by the company 17,619,238 1 7,009,354 Added value received through transfer - Equity income 240,923 1 35,584 Total added value to be distributed 1 7,860,161 1 7,144,938 Distribution of added value 17,860,161 17,144,938 Personnel 5 ,266,207 29.5% 4,901,213 28.6% Compensation 4,018,996 22.5% 3,712,432 21.7% Benefits 1 ,009,862 5.7% 967,259 5.6% FGTS – government severance pay fund 237,349 1.3% 2 21,522 1.3% Taxes, fees and contributions 5,466,419 30.6% 5,579,508 32.5% Federal 5 ,113,826 28.6% 5 ,185,643 30.2% State 6 0.0% 34 0.0% Municipal 352,587 2.0% 393,831 2.3% Return on third parties’ assets - Rent 327,638 1.8% 3 94,467 2.3% Return on own assets 6 ,799,897 38.1% 6,269,750 36.6% Dividends and interest on capital 2 ,406,803 13.5% 2 ,349,835 13.7% Retained earnings / (loss) attributable to controlling shareholders 4,302,905 24.1% 3,930,483 22.9% Retained earnings / (loss) attributable to non-controlling shareholders 90,189 0.5% (10,568) -0.1% The accompanying notes are an integral part of these financial statements. Itaú Unibanco Holding S.A. – Complete Financial Statements – March 31, 2019 60 ITAÚ UNIBANCO HOLDING S.A. Consolidated Statement of Added Value (In thousands of Reais) 01/01 to 01/01 to Note 03/31/2019 03/31/2018 Income 4 3,503,200 40,563,124 Financial operations 36,148,069 33,205,553 Banking services 10e and f 9,444,958 9 ,304,976 Result from insurance, pension plan and capitalization operations 8 90,367 881,551 Result from loan losses 6 (3,372,075) (3,135,134) Other 391,881 306,178 Expenses (2 1,349,960) (1 9,383,615) Financial operations (1 9,306,849) (1 7,307,772) Other (2,043,111) (2,075,843) Inputs purchased from third parties (3,827,454) (3 ,537,759) Materials, energy and others 10h (8 5,697) (78,355) Third-party services 10h (1,085,757) (1,019,788) Other (2 ,656,000) (2 ,439,616) Data processing and telecommunications 10h (1,070,003) (1 ,008,006) Advertising, promotions and publication 10h (282,751) (2 48,343) Installations (458,967) (393,163) Transportation 10h (88,114) (8 3,992) Security 10h (1 93,185) (190,174) Travel expenses 10h (51,010) (4 5,676) Other (511,970) (4 70,262) Gross added value 1 8,325,786 17,641,750 Depreciation and amortization 10h (706,548) (632,396) Net added value produced by the company 17,619,238 1 7,009,354 Added value received through transfer - Equity income 240,923 1 35,584 Total added value to be distributed 1 7,860,161 1 7,144,938 Distribution of added value 17,860,161 17,144,938 Personnel 5 ,266,207 29.5% 4,901,213 28.6% Compensation 4,018,996 22.5% 3,712,432 21.7% Benefits 1 ,009,862 5.7% 967,259 5.6% FGTS – government severance pay fund 237,349 1.3% 2 21,522 1.3% Taxes, fees and contributions 5,466,419 30.6% 5,579,508 32.5% Federal 5 ,113,826 28.6% 5 ,185,643 30.2% State 6 0.0% 34 0.0% Municipal 352,587 2.0% 393,831 2.3% Return on third parties’ assets - Rent 327,638 1.8% 3 94,467 2.3% Return on own assets 6 ,799,897 38.1% 6,269,750 36.6% Dividends and interest on capital 2 ,406,803 13.5% 2 ,349,835 13.7% Retained earnings / (loss) attributable to controlling shareholders 4,302,905 24.1% 3,930,483 22.9% Retained earnings / (loss) attributable to non-controlling shareholders 90,189 0.5% (10,568) -0.1% The accompanying notes are an integral part of these financial statements. Itaú Unibanco Holding S.A. – Complete Financial Statements – March 31, 2019 60

ITAÚ UNIBANCO HOLDING S.A. Balance Sheet (In thousands of Reais) Assets Note 03/31/2019 03/31/2018 Current assets 20,059,187 16,104,361 Cash - 5 8,415 597,941 Interbank investments 3b and 4 4 ,315,162 3,614,196 Money market - 4,315,162 99,002 Interbank deposits - - 3,515,194 Securities and derivative financial instruments 3c,3d and 5 11,069,883 10,510,936 Own portfolio - 11,012,837 10,510,936 Derivative Financial Instruments - 5 7,046 - Other receivables - 4,594,507 1,359,802 Income receivable 3,331,012 609,642 Deferred tax assets 11b I 260,143 102,536 Deposits in guarantee for contingent, provisions and legal obrigations 108 92 Sundry 1,003,244 647,532 Other assets – prepaid expenses 3g 2 1,220 21,486 Long term receivables - 45,949,494 76,873,959 Interbank investments – interbank deposits 3b and 4 4 1,826,724 73,875,967 Securities and derivative financial instruments 3c, 3d and 5 1 ,246,375 51,832 Own portfolio - - 2,308 Derivative Financial Instruments - 1,246,375 49,524 Other receivables 2,876,395 2,946,160 Deferred tax assets 11b I 474,861 1,157,927 Deposits in guarantee for contingent, provisions and legal obrigations 1 6,559 17,121 Sundry 2 ,384,975 1,771,112 Permanent assets - 1 14,849,507 92,323,480 Investments - Investments in subsidiaries 3h and 12a 1 14,849,284 92,323,437 Real estate in use 3i 223 43 Total assets 1 80,858,188 185,301,800 Liabilities Current liabilities 1 3,137,315 25,570,227 Deposits 3b and 7b 1 1,346,587 16,686,350 Demand deposits 9 ,295,633 - Interbank deposits 2 ,050,954 16,686,350 Funds from acceptance and issuance of securities 3b and 7d 4,781 3,580,468 Derivative Financial Instruments 3d and 5f 1 ,669 3,722,890 Other liabilities - 1,784,278 1,580,519 Social and statutory 14b II 1 ,543,601 1,442,297 Tax and social security contributions 3n, 3p and 11c 2 13,533 125,407 Sundry 2 7,144 12,815 Long term liabilities 4 7,824,210 39,996,360 Deposits - Interbank deposits 3b and 7b 5,513,718 6,423,326 Derivative Financial Instruments 3d and 5f 33,260 200,571 Other liabilities 42,277,232 33,372,463 Tax and social security contributions 3n, 3p and 11c 306,438 187,202 Subordinated debt 7f 30,892,106 26,236,815 Provisions civies and labor 2 01,066 198,231 Debt instruments eligible as capital 7f 1 0,868,258 6,730,052 Sundry 9,364 20,163 Stockholders' equity 13 119,896,663 119,735,213 Capital - 9 7,148,000 97,148,000 Capital reserves 1 ,559,417 1,460,078 Revenue reserves - 2 2,849,665 23,719,695 Asset valuation adjustment 3c and 3d (3 26,253) ( 1,096,446) (Treasury shares) - (1,334,166) (1,496,114) Total liabilities - 1 80,858,188 185,301,800 The accompanying notes are an integral part of these financial statements. Itaú Unibanco Holding S.A. – Complete Financial Statements – March 31, 2019 61 ITAÚ UNIBANCO HOLDING S.A. Balance Sheet (In thousands of Reais) Assets Note 03/31/2019 03/31/2018 Current assets 20,059,187 16,104,361 Cash - 5 8,415 597,941 Interbank investments 3b and 4 4 ,315,162 3,614,196 Money market - 4,315,162 99,002 Interbank deposits - - 3,515,194 Securities and derivative financial instruments 3c,3d and 5 11,069,883 10,510,936 Own portfolio - 11,012,837 10,510,936 Derivative Financial Instruments - 5 7,046 - Other receivables - 4,594,507 1,359,802 Income receivable 3,331,012 609,642 Deferred tax assets 11b I 260,143 102,536 Deposits in guarantee for contingent, provisions and legal obrigations 108 92 Sundry 1,003,244 647,532 Other assets – prepaid expenses 3g 2 1,220 21,486 Long term receivables - 45,949,494 76,873,959 Interbank investments – interbank deposits 3b and 4 4 1,826,724 73,875,967 Securities and derivative financial instruments 3c, 3d and 5 1 ,246,375 51,832 Own portfolio - - 2,308 Derivative Financial Instruments - 1,246,375 49,524 Other receivables 2,876,395 2,946,160 Deferred tax assets 11b I 474,861 1,157,927 Deposits in guarantee for contingent, provisions and legal obrigations 1 6,559 17,121 Sundry 2 ,384,975 1,771,112 Permanent assets - 1 14,849,507 92,323,480 Investments - Investments in subsidiaries 3h and 12a 1 14,849,284 92,323,437 Real estate in use 3i 223 43 Total assets 1 80,858,188 185,301,800 Liabilities Current liabilities 1 3,137,315 25,570,227 Deposits 3b and 7b 1 1,346,587 16,686,350 Demand deposits 9 ,295,633 - Interbank deposits 2 ,050,954 16,686,350 Funds from acceptance and issuance of securities 3b and 7d 4,781 3,580,468 Derivative Financial Instruments 3d and 5f 1 ,669 3,722,890 Other liabilities - 1,784,278 1,580,519 Social and statutory 14b II 1 ,543,601 1,442,297 Tax and social security contributions 3n, 3p and 11c 2 13,533 125,407 Sundry 2 7,144 12,815 Long term liabilities 4 7,824,210 39,996,360 Deposits - Interbank deposits 3b and 7b 5,513,718 6,423,326 Derivative Financial Instruments 3d and 5f 33,260 200,571 Other liabilities 42,277,232 33,372,463 Tax and social security contributions 3n, 3p and 11c 306,438 187,202 Subordinated debt 7f 30,892,106 26,236,815 Provisions civies and labor 2 01,066 198,231 Debt instruments eligible as capital 7f 1 0,868,258 6,730,052 Sundry 9,364 20,163 Stockholders' equity 13 119,896,663 119,735,213 Capital - 9 7,148,000 97,148,000 Capital reserves 1 ,559,417 1,460,078 Revenue reserves - 2 2,849,665 23,719,695 Asset valuation adjustment 3c and 3d (3 26,253) ( 1,096,446) (Treasury shares) - (1,334,166) (1,496,114) Total liabilities - 1 80,858,188 185,301,800 The accompanying notes are an integral part of these financial statements. Itaú Unibanco Holding S.A. – Complete Financial Statements – March 31, 2019 61
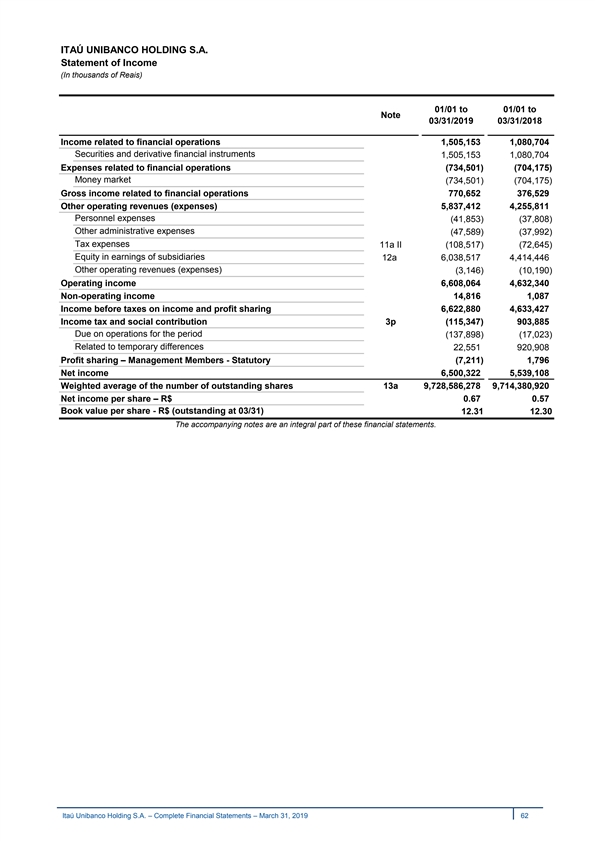
ITAÚ UNIBANCO HOLDING S.A. Statement of Income (In thousands of Reais) 01/01 to 01/01 to Note 03/31/2019 03/31/2018 Income related to financial operations 1,505,153 1,080,704 Securities and derivative financial instruments 0 1,505,153 1 ,080,704 Expenses related to financial operations 0 (734,501) (7 04,175) Money market (7 34,501) (7 04,175) Gross income related to financial operations 7 70,652 376,529 Other operating revenues (expenses) 0 5,837,412 4,255,811 Personnel expenses 0 (4 1,853) (37,808) Other administrative expenses 0 (4 7,589) (3 7,992) Tax expenses 11a II (1 08,517) (7 2,645) Equity in earnings of subsidiaries 12a 6 ,038,517 4 ,414,446 Other operating revenues (expenses) 0 (3,146) (1 0,190) Operating income 0 6,608,064 4,632,340 Non-operating income 0 1 4,816 1 ,087 Income before taxes on income and profit sharing 0 6 ,622,880 4,633,427 Income tax and social contribution 3p (1 15,347) 903,885 Due on operations for the period (137,898) (1 7,023) Related to temporary differences 22,551 9 20,908 Profit sharing – Management Members - Statutory (7 ,211) 1 ,796 Net income 6,500,322 5,539,108 Weighted average of the number of outstanding shares 13a 9,728,586,278 9,714,380,920 Net income per share – R$ 0 .67 0.57 Book value per share - R$ (outstanding at 03/31) 12.31 12.30 The accompanying notes are an integral part of these financial statements. Itaú Unibanco Holding S.A. – Complete Financial Statements – March 31, 2019 62 ITAÚ UNIBANCO HOLDING S.A. Statement of Income (In thousands of Reais) 01/01 to 01/01 to Note 03/31/2019 03/31/2018 Income related to financial operations 1,505,153 1,080,704 Securities and derivative financial instruments 0 1,505,153 1 ,080,704 Expenses related to financial operations 0 (734,501) (7 04,175) Money market (7 34,501) (7 04,175) Gross income related to financial operations 7 70,652 376,529 Other operating revenues (expenses) 0 5,837,412 4,255,811 Personnel expenses 0 (4 1,853) (37,808) Other administrative expenses 0 (4 7,589) (3 7,992) Tax expenses 11a II (1 08,517) (7 2,645) Equity in earnings of subsidiaries 12a 6 ,038,517 4 ,414,446 Other operating revenues (expenses) 0 (3,146) (1 0,190) Operating income 0 6,608,064 4,632,340 Non-operating income 0 1 4,816 1 ,087 Income before taxes on income and profit sharing 0 6 ,622,880 4,633,427 Income tax and social contribution 3p (1 15,347) 903,885 Due on operations for the period (137,898) (1 7,023) Related to temporary differences 22,551 9 20,908 Profit sharing – Management Members - Statutory (7 ,211) 1 ,796 Net income 6,500,322 5,539,108 Weighted average of the number of outstanding shares 13a 9,728,586,278 9,714,380,920 Net income per share – R$ 0 .67 0.57 Book value per share - R$ (outstanding at 03/31) 12.31 12.30 The accompanying notes are an integral part of these financial statements. Itaú Unibanco Holding S.A. – Complete Financial Statements – March 31, 2019 62
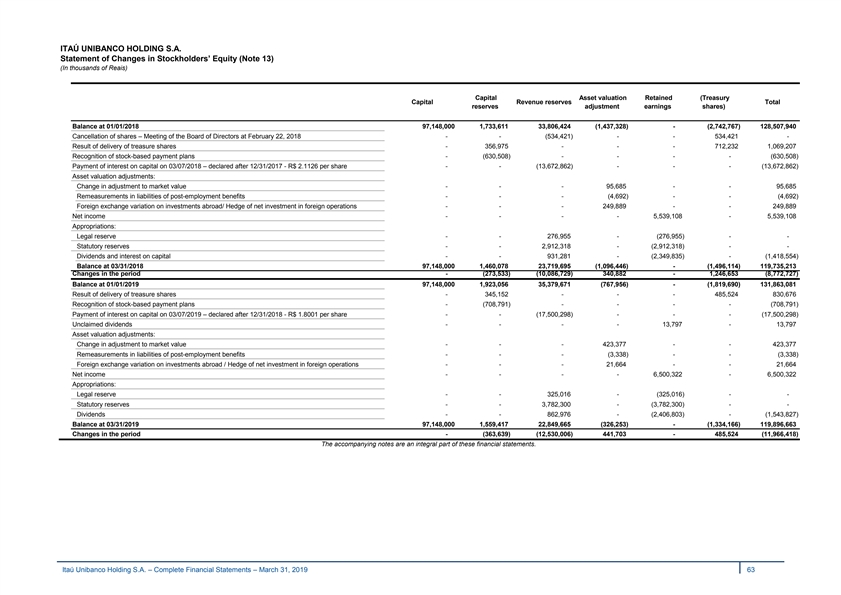
ITAÚ UNIBANCO HOLDING S.A. Statement of Changes in Stockholders’ Equity (Note 13) (In thousands of Reais) Capital Asset valuation Retained (Treasury Capital Revenue reserves Total reserves adjustment earnings shares) Balance at 01/01/2018 9 7,148,000 1 ,733,611 3 3,806,424 (1,437,328) - ( 2,742,767) 128,507,940 Cancellation of shares – Meeting of the Board of Directors at February 22, 2018 - - (534,421) - - 5 34,421 - Result of delivery of treasure shares - 3 56,975 - - - 712,232 1,069,207 Recognition of stock-based payment plans - (630,508) - - - - (630,508) Payment of interest on capital on 03/07/2018 – declared after 12/31/2017 - R$ 2.1126 per share - - (13,672,862) - - - ( 13,672,862) Asset valuation adjustments: Change in adjustment to market value - - - 95,685 - - 95,685 Remeasurements in liabilities of post-employment benefits - - - (4,692) - - ( 4,692) Foreign exchange variation on investments abroad/ Hedge of net investment in foreign operations - - - 2 49,889 - - 249,889 Net income - - - - 5,539,108 - 5,539,108 Appropriations: Legal reserve - - 276,955 - (276,955) - - Statutory reserves - - 2 ,912,318 - ( 2,912,318) - - Dividends and interest on capital - - 9 31,281 - ( 2,349,835) - ( 1,418,554) Balance at 03/31/2018 9 7,148,000 1 ,460,078 23,719,695 ( 1,096,446) - ( 1,496,114) 119,735,213 Changes in the period - ( 273,533) ( 10,086,729) 340,882 - 1,246,653 ( 8,772,727) Balance at 01/01/2019 97,148,000 1 ,923,056 35,379,671 ( 767,956) - (1,819,690) 131,863,081 Result of delivery of treasure shares - 3 45,152 - - - 485,524 8 30,676 Recognition of stock-based payment plans - ( 708,791) - - - - ( 708,791) Payment of interest on capital on 03/07/2019 – declared after 12/31/2018 - R$ 1.8001 per share - - (17,500,298) - - - (17,500,298) Unclaimed dividends - - - - 1 3,797 - 13,797 Asset valuation adjustments: Change in adjustment to market value - - - 423,377 - - 423,377 Remeasurements in liabilities of post-employment benefits - - - ( 3,338) - - ( 3,338) Foreign exchange variation on investments abroad / Hedge of net investment in foreign operations - - - 21,664 - - 2 1,664 Net income - - - - 6,500,322 - 6 ,500,322 Appropriations: Legal reserve - - 325,016 - (325,016) - - Statutory reserves - - 3 ,782,300 - (3,782,300) - - Dividends - - 862,976 - (2,406,803) - ( 1,543,827) Balance at 03/31/2019 9 7,148,000 1,559,417 22,849,665 ( 326,253) - ( 1,334,166) 1 19,896,663 Changes in the period - ( 363,639) (12,530,006) 441,703 - 4 85,524 (11,966,418) The accompanying notes are an integral part of these financial statements. Itaú Unibanco Holding S.A. – Complete Financial Statements – March 31, 2019 63 ITAÚ UNIBANCO HOLDING S.A. Statement of Changes in Stockholders’ Equity (Note 13) (In thousands of Reais) Capital Asset valuation Retained (Treasury Capital Revenue reserves Total reserves adjustment earnings shares) Balance at 01/01/2018 9 7,148,000 1 ,733,611 3 3,806,424 (1,437,328) - ( 2,742,767) 128,507,940 Cancellation of shares – Meeting of the Board of Directors at February 22, 2018 - - (534,421) - - 5 34,421 - Result of delivery of treasure shares - 3 56,975 - - - 712,232 1,069,207 Recognition of stock-based payment plans - (630,508) - - - - (630,508) Payment of interest on capital on 03/07/2018 – declared after 12/31/2017 - R$ 2.1126 per share - - (13,672,862) - - - ( 13,672,862) Asset valuation adjustments: Change in adjustment to market value - - - 95,685 - - 95,685 Remeasurements in liabilities of post-employment benefits - - - (4,692) - - ( 4,692) Foreign exchange variation on investments abroad/ Hedge of net investment in foreign operations - - - 2 49,889 - - 249,889 Net income - - - - 5,539,108 - 5,539,108 Appropriations: Legal reserve - - 276,955 - (276,955) - - Statutory reserves - - 2 ,912,318 - ( 2,912,318) - - Dividends and interest on capital - - 9 31,281 - ( 2,349,835) - ( 1,418,554) Balance at 03/31/2018 9 7,148,000 1 ,460,078 23,719,695 ( 1,096,446) - ( 1,496,114) 119,735,213 Changes in the period - ( 273,533) ( 10,086,729) 340,882 - 1,246,653 ( 8,772,727) Balance at 01/01/2019 97,148,000 1 ,923,056 35,379,671 ( 767,956) - (1,819,690) 131,863,081 Result of delivery of treasure shares - 3 45,152 - - - 485,524 8 30,676 Recognition of stock-based payment plans - ( 708,791) - - - - ( 708,791) Payment of interest on capital on 03/07/2019 – declared after 12/31/2018 - R$ 1.8001 per share - - (17,500,298) - - - (17,500,298) Unclaimed dividends - - - - 1 3,797 - 13,797 Asset valuation adjustments: Change in adjustment to market value - - - 423,377 - - 423,377 Remeasurements in liabilities of post-employment benefits - - - ( 3,338) - - ( 3,338) Foreign exchange variation on investments abroad / Hedge of net investment in foreign operations - - - 21,664 - - 2 1,664 Net income - - - - 6,500,322 - 6 ,500,322 Appropriations: Legal reserve - - 325,016 - (325,016) - - Statutory reserves - - 3 ,782,300 - (3,782,300) - - Dividends - - 862,976 - (2,406,803) - ( 1,543,827) Balance at 03/31/2019 9 7,148,000 1,559,417 22,849,665 ( 326,253) - ( 1,334,166) 1 19,896,663 Changes in the period - ( 363,639) (12,530,006) 441,703 - 4 85,524 (11,966,418) The accompanying notes are an integral part of these financial statements. Itaú Unibanco Holding S.A. – Complete Financial Statements – March 31, 2019 63
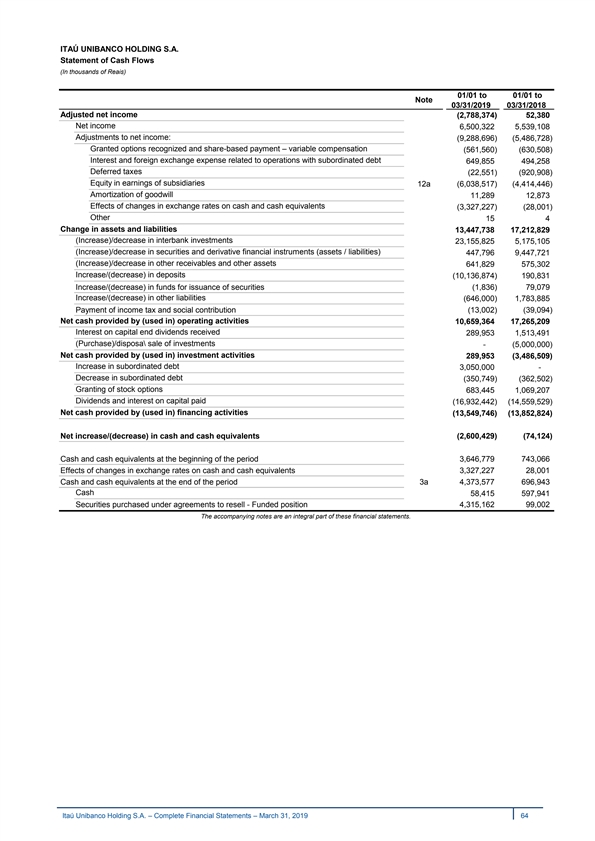
ITAÚ UNIBANCO HOLDING S.A. Statement of Cash Flows (In thousands of Reais) 01/01 to 01/01 to Note 03/31/2019 03/31/2018 Adjusted net income (2,788,374) 52,380 Net income 6,500,322 5,539,108 Adjustments to net income: (9,288,696) (5,486,728) Granted options recognized and share-based payment – variable compensation (561,560) (630,508) Interest and foreign exchange expense related to operations with subordinated debt 649,855 494,258 Deferred taxes (22,551) (920,908) Equity in earnings of subsidiaries 12a (6,038,517) (4,414,446) Amortization of goodwill 11,289 12,873 Effects of changes in exchange rates on cash and cash equivalents (3,327,227) (28,001) Other 15 4 Change in assets and liabilities 13,447,738 17,212,829 (Increase)/decrease in interbank investments 23,155,825 5,175,105 (Increase)/decrease in securities and derivative financial instruments (assets / liabilities) 447,796 9,447,721 (Increase)/decrease in other receivables and other assets 641,829 575,302 Increase/(decrease) in deposits (10,136,874) 190,831 Increase/(decrease) in funds for issuance of securities (1,836) 79,079 Increase/(decrease) in other liabilities (646,000) 1,783,885 Payment of income tax and social contribution (13,002) (39,094) Net cash provided by (used in) operating activities 10,659,364 17,265,209 Interest on capital end dividends received 289,953 1,513,491 (Purchase)/disposa\ sale of investments - (5,000,000) Net cash provided by (used in) investment activities 289,953 (3,486,509) Increase in subordinated debt 3,050,000 - Decrease in subordinated debt (350,749) (362,502) Granting of stock options 683,445 1,069,207 Dividends and interest on capital paid (16,932,442) (14,559,529) Net cash provided by (used in) financing activities ( 13,549,746) ( 13,852,824) Net increase/(decrease) in cash and cash equivalents (2,600,429) (74,124) Cash and cash equivalents at the beginning of the period 3,646,779 743,066 Effects of changes in exchange rates on cash and cash equivalents 3,327,227 28,001 Cash and cash equivalents at the end of the period 3a 4,373,577 696,943 Cash 58,415 597,941 Securities purchased under agreements to resell - Funded position 4,315,162 99,002 The accompanying notes are an integral part of these financial statements. Itaú Unibanco Holding S.A. – Complete Financial Statements – March 31, 2019 64 ITAÚ UNIBANCO HOLDING S.A. Statement of Cash Flows (In thousands of Reais) 01/01 to 01/01 to Note 03/31/2019 03/31/2018 Adjusted net income (2,788,374) 52,380 Net income 6,500,322 5,539,108 Adjustments to net income: (9,288,696) (5,486,728) Granted options recognized and share-based payment – variable compensation (561,560) (630,508) Interest and foreign exchange expense related to operations with subordinated debt 649,855 494,258 Deferred taxes (22,551) (920,908) Equity in earnings of subsidiaries 12a (6,038,517) (4,414,446) Amortization of goodwill 11,289 12,873 Effects of changes in exchange rates on cash and cash equivalents (3,327,227) (28,001) Other 15 4 Change in assets and liabilities 13,447,738 17,212,829 (Increase)/decrease in interbank investments 23,155,825 5,175,105 (Increase)/decrease in securities and derivative financial instruments (assets / liabilities) 447,796 9,447,721 (Increase)/decrease in other receivables and other assets 641,829 575,302 Increase/(decrease) in deposits (10,136,874) 190,831 Increase/(decrease) in funds for issuance of securities (1,836) 79,079 Increase/(decrease) in other liabilities (646,000) 1,783,885 Payment of income tax and social contribution (13,002) (39,094) Net cash provided by (used in) operating activities 10,659,364 17,265,209 Interest on capital end dividends received 289,953 1,513,491 (Purchase)/disposa\ sale of investments - (5,000,000) Net cash provided by (used in) investment activities 289,953 (3,486,509) Increase in subordinated debt 3,050,000 - Decrease in subordinated debt (350,749) (362,502) Granting of stock options 683,445 1,069,207 Dividends and interest on capital paid (16,932,442) (14,559,529) Net cash provided by (used in) financing activities ( 13,549,746) ( 13,852,824) Net increase/(decrease) in cash and cash equivalents (2,600,429) (74,124) Cash and cash equivalents at the beginning of the period 3,646,779 743,066 Effects of changes in exchange rates on cash and cash equivalents 3,327,227 28,001 Cash and cash equivalents at the end of the period 3a 4,373,577 696,943 Cash 58,415 597,941 Securities purchased under agreements to resell - Funded position 4,315,162 99,002 The accompanying notes are an integral part of these financial statements. Itaú Unibanco Holding S.A. – Complete Financial Statements – March 31, 2019 64
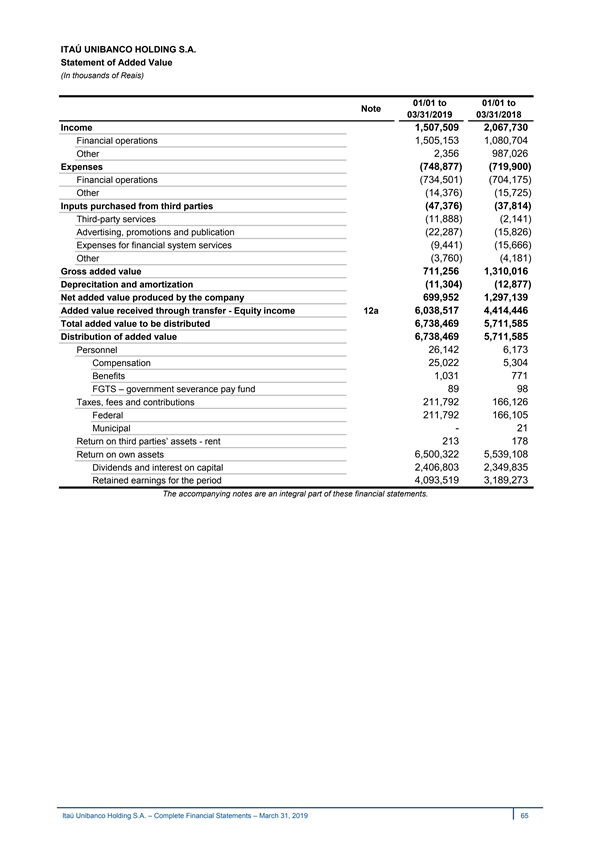
ITAÚ UNIBANCO HOLDING S.A. Statement of Added Value (In thousands of Reais) 01/01 to 01/01 to Note 03/31/2019 03/31/2018 Income 1,507,509 2,067,730 Financial operations 1,505,153 1,080,704 Other 2,356 987,026 Expenses ( 748,877) ( 719,900) Financial operations (734,501) ( 704,175) Other (14,376) ( 15,725) Inputs purchased from third parties ( 47,376) (37,814) Third-party services ( 11,888) ( 2,141) Advertising, promotions and publication (22,287) ( 15,826) Expenses for financial system services ( 9,441) (15,666) Other ( 3,760) (4,181) Gross added value 711,256 1,310,016 Deprecitation and amortization (11,304) (12,877) Net added value produced by the company 699,952 1,297,139 Added value received through transfer - Equity income 12a 6,038,517 4,414,446 Total added value to be distributed 6,738,469 5,711,585 Distribution of added value 6,738,469 5,711,585 Personnel 26,142 6,173 Compensation 25,022 5,304 Benefits 1,031 771 FGTS – government severance pay fund 89 98 Taxes, fees and contributions 211,792 166,126 Federal 211,792 166,105 Municipal - 21 Return on third parties’ assets - rent 213 178 Return on own assets 6,500,322 5,539,108 Dividends and interest on capital 2,406,803 2,349,835 Retained earnings for the period 4,093,519 3,189,273 The accompanying notes are an integral part of these financial statements. Itaú Unibanco Holding S.A. – Complete Financial Statements – March 31, 2019 65 ITAÚ UNIBANCO HOLDING S.A. Statement of Added Value (In thousands of Reais) 01/01 to 01/01 to Note 03/31/2019 03/31/2018 Income 1,507,509 2,067,730 Financial operations 1,505,153 1,080,704 Other 2,356 987,026 Expenses ( 748,877) ( 719,900) Financial operations (734,501) ( 704,175) Other (14,376) ( 15,725) Inputs purchased from third parties ( 47,376) (37,814) Third-party services ( 11,888) ( 2,141) Advertising, promotions and publication (22,287) ( 15,826) Expenses for financial system services ( 9,441) (15,666) Other ( 3,760) (4,181) Gross added value 711,256 1,310,016 Deprecitation and amortization (11,304) (12,877) Net added value produced by the company 699,952 1,297,139 Added value received through transfer - Equity income 12a 6,038,517 4,414,446 Total added value to be distributed 6,738,469 5,711,585 Distribution of added value 6,738,469 5,711,585 Personnel 26,142 6,173 Compensation 25,022 5,304 Benefits 1,031 771 FGTS – government severance pay fund 89 98 Taxes, fees and contributions 211,792 166,126 Federal 211,792 166,105 Municipal - 21 Return on third parties’ assets - rent 213 178 Return on own assets 6,500,322 5,539,108 Dividends and interest on capital 2,406,803 2,349,835 Retained earnings for the period 4,093,519 3,189,273 The accompanying notes are an integral part of these financial statements. Itaú Unibanco Holding S.A. – Complete Financial Statements – March 31, 2019 65
ITAÚ UNIBANCO HOLDING S.A. Notes to the Financial Statements Period from 01/01 to 03/31 of 2019 and 2018 (In thousands of Reais) Note 1 - Operations Itaú Unibanco Holding S.A. (ITAÚ UNIBANCO HOLDING) is a publicly-held company, organized and existing under the Laws of Brazil. The head office is located at Praça Alfredo Egydio de Souza Aranha, n° 100, in the city of São Paulo, state of São Paulo, Brazil. ITAÚ UNIBANCO HOLDING is present in 19 countries and offers a wide variety of financial products and services to individual and corporate clients in Brazil and abroad, whether or not these clients are related to Brazil, through its branches, subsidiaries and international affiliates. It operates in all modalities of banking activities, by means of its portfolios: commercial; investment; mortgage loans; loans, financing and investment; lease and foreign exchange transactions. ITAÚ UNIBANCO HOLDING is a holding company controlled by Itaú Unibanco Participações S.A. (“IUPAR”), a holding company which owns 51.71% of our common shares, and which is jointly controlled by (i) Itaúsa Investimentos Itaú S.A. (“Itaúsa”), a holding company controlled by members of the Egydio de Souza Aranha family, and (ii) Companhia E. Johnston de Participações (“E. Johnston”), a holding company controlled by the Moreira Salles family. Itaúsa also directly holds 39.21% of ITAÚ UNIBANCO HOLDING common shares. These consolidated financial statements were approved by the Executive Board on May 02, 2019. Itaú Unibanco Holding S.A. – Complete Financial Statements – March 31, 2019 66 ITAÚ UNIBANCO HOLDING S.A. Notes to the Financial Statements Period from 01/01 to 03/31 of 2019 and 2018 (In thousands of Reais) Note 1 - Operations Itaú Unibanco Holding S.A. (ITAÚ UNIBANCO HOLDING) is a publicly-held company, organized and existing under the Laws of Brazil. The head office is located at Praça Alfredo Egydio de Souza Aranha, n° 100, in the city of São Paulo, state of São Paulo, Brazil. ITAÚ UNIBANCO HOLDING is present in 19 countries and offers a wide variety of financial products and services to individual and corporate clients in Brazil and abroad, whether or not these clients are related to Brazil, through its branches, subsidiaries and international affiliates. It operates in all modalities of banking activities, by means of its portfolios: commercial; investment; mortgage loans; loans, financing and investment; lease and foreign exchange transactions. ITAÚ UNIBANCO HOLDING is a holding company controlled by Itaú Unibanco Participações S.A. (“IUPAR”), a holding company which owns 51.71% of our common shares, and which is jointly controlled by (i) Itaúsa Investimentos Itaú S.A. (“Itaúsa”), a holding company controlled by members of the Egydio de Souza Aranha family, and (ii) Companhia E. Johnston de Participações (“E. Johnston”), a holding company controlled by the Moreira Salles family. Itaúsa also directly holds 39.21% of ITAÚ UNIBANCO HOLDING common shares. These consolidated financial statements were approved by the Executive Board on May 02, 2019. Itaú Unibanco Holding S.A. – Complete Financial Statements – March 31, 2019 66
Note 2 – Presentation of the Consolidated Financial Statements a) Presentation The financial statements of ITAÚ UNIBANCO HOLDING and of its subsidiaries (ITAÚ UNIBANCO HOLDING CONSOLIDATED) have been prepared in accordance with the accounting principles established by the Brazilian Corporate Law, including the amendments introduced by Laws nº. 11,638, of December 28, 2007, and nº. 11,941, of May 27, 2009 and in conformity, when applicable, with instructions issued by the National Monetary Council (CMN), Central Bank of Brazil (BACEN), the Brazilian Securities and Exchange Commission (CVM), the National Council of Private Insurance (CNSP), the Superintendence of Private Insurance (SUSEP) and the National Superintendence of Supplementary Pension – (PREVIC),which include the use of practices and estimates deemed necessary to calculate the accounting provisions and the valuation of financial assets. Information in the financial statements and respective notes evidence all relevant information inherent in the financial statements, and only them, which are consistent with information used by management in its administration. As set forth in the sole paragraph of article 7 of BACEN Circular nº. 3,068, of November 8, 2001, securities classified as trading securities (Note 3c) are presented in the Consolidated Balance Sheet under Current Assets, regardless of their maturity dates. Lease Operations are presented at present value in the Consolidated Balance Sheet, being that the related income and expenses, which represent the financial results of these operations, are presented, grouped together, under Loan, Lease and Other Credit Operations in the Statement of Income. Advances on exchange contracts are reclassified from Other Liabilities – Foreign exchange portfolio to Loan operations. The foreign exchange result is represented by variation and difference in rates on the balance sheet accounts denominated in foreign currencies. b) Consolidation The consolidated financial statements of ITAÚ UNIBANCO HOLDING comprise operations carried out by its branches and subsidiaries in Brazil and abroad, operations of its controlled entities and operations of Specific Purpose Entities and investment funds controlled by the entity. Balances of result and balance sheet accounts, and consolidated intercompany transactions have been eliminated. Controlled entities are all entities to which ITAÚ UNIBANCO HOLDING is exposed, or is entitled to variable returns of involvement with the entity and that can affect these returns through its power on the entity. Control assessment is conducted on a continuous basis. Controlled entities are consolidated from the date control is established to the date on which control ceases to exist. The consolidated financial statements are prepared using consistent accounting policies. In ITAÚ UNIBANCO HOLDING, the goodwill recorded in subsidiaries is amortized based on the expected future profitability and appraisal reports, or upon realization of the investment, according to the rules and guidance of CMN and BACEN. The difference in Net Income and Stockholders’ Equity between ITAÚ UNIBANCO HOLDING and ITAÚ UNIBANCO HOLDING CONSOLIDATED (Note 13d) results substantially from the adoption of different criteria in the amortization of goodwill originated in acquisitions of investments, recognition of transaction with non-controlling stockholders where there is no change in control (Note 3I) and recognition of exchange variation on foreign investments and hedge of these investments, which functional currency is different from the controlling company, net of respective deferred tax assets. The effects of foreign exchange variations on investments abroad are classified under the heading Securities and derivative financial instruments in the Statement of Income for subsidiaries with the same functional currency as the parent company, and in Asset valuation adjustment for subsidiaries with a functional currency different from that of the parent company. Itaú Unibanco Holding S.A. – Complete Financial Statements – March 31, 2019 67 Note 2 – Presentation of the Consolidated Financial Statements a) Presentation The financial statements of ITAÚ UNIBANCO HOLDING and of its subsidiaries (ITAÚ UNIBANCO HOLDING CONSOLIDATED) have been prepared in accordance with the accounting principles established by the Brazilian Corporate Law, including the amendments introduced by Laws nº. 11,638, of December 28, 2007, and nº. 11,941, of May 27, 2009 and in conformity, when applicable, with instructions issued by the National Monetary Council (CMN), Central Bank of Brazil (BACEN), the Brazilian Securities and Exchange Commission (CVM), the National Council of Private Insurance (CNSP), the Superintendence of Private Insurance (SUSEP) and the National Superintendence of Supplementary Pension – (PREVIC),which include the use of practices and estimates deemed necessary to calculate the accounting provisions and the valuation of financial assets. Information in the financial statements and respective notes evidence all relevant information inherent in the financial statements, and only them, which are consistent with information used by management in its administration. As set forth in the sole paragraph of article 7 of BACEN Circular nº. 3,068, of November 8, 2001, securities classified as trading securities (Note 3c) are presented in the Consolidated Balance Sheet under Current Assets, regardless of their maturity dates. Lease Operations are presented at present value in the Consolidated Balance Sheet, being that the related income and expenses, which represent the financial results of these operations, are presented, grouped together, under Loan, Lease and Other Credit Operations in the Statement of Income. Advances on exchange contracts are reclassified from Other Liabilities – Foreign exchange portfolio to Loan operations. The foreign exchange result is represented by variation and difference in rates on the balance sheet accounts denominated in foreign currencies. b) Consolidation The consolidated financial statements of ITAÚ UNIBANCO HOLDING comprise operations carried out by its branches and subsidiaries in Brazil and abroad, operations of its controlled entities and operations of Specific Purpose Entities and investment funds controlled by the entity. Balances of result and balance sheet accounts, and consolidated intercompany transactions have been eliminated. Controlled entities are all entities to which ITAÚ UNIBANCO HOLDING is exposed, or is entitled to variable returns of involvement with the entity and that can affect these returns through its power on the entity. Control assessment is conducted on a continuous basis. Controlled entities are consolidated from the date control is established to the date on which control ceases to exist. The consolidated financial statements are prepared using consistent accounting policies. In ITAÚ UNIBANCO HOLDING, the goodwill recorded in subsidiaries is amortized based on the expected future profitability and appraisal reports, or upon realization of the investment, according to the rules and guidance of CMN and BACEN. The difference in Net Income and Stockholders’ Equity between ITAÚ UNIBANCO HOLDING and ITAÚ UNIBANCO HOLDING CONSOLIDATED (Note 13d) results substantially from the adoption of different criteria in the amortization of goodwill originated in acquisitions of investments, recognition of transaction with non-controlling stockholders where there is no change in control (Note 3I) and recognition of exchange variation on foreign investments and hedge of these investments, which functional currency is different from the controlling company, net of respective deferred tax assets. The effects of foreign exchange variations on investments abroad are classified under the heading Securities and derivative financial instruments in the Statement of Income for subsidiaries with the same functional currency as the parent company, and in Asset valuation adjustment for subsidiaries with a functional currency different from that of the parent company. Itaú Unibanco Holding S.A. – Complete Financial Statements – March 31, 2019 67
The consolidated financial statements cover ITAÚ UNIBANCO HOLDING and its direct and indirect subsidiaries. We present below the main companies which together represent over 95% of total consolidated assets: Interest in total Interest in voting Country of (1) capital at Functional currency Activity capital at Incorporation 03/31/2019 03/31/2018 03/31/2019 03/31/2018 Domestic Banco Itaú BBA S.A. Brazil Financial institution 100.00% 100.00% 100.00% 100.00% Banco Itaú Consignado S.A. Brazil Financial institution 100.00% 100.00% 100.00% 100.00% Banco Itaucard S.A. Brazil Financial institution 100.00% 100.00% 100.00% 100.00% Banco Itauleasing S.A. Brazil Financial institution 100.00% 100.00% 100.00% 100.00% Cia. Itaú de Capitalização Brazil Capitalization 100.00% 100.00% 100.00% 100.00% Dibens Leasing S.A. - Arrendamento Mercantil Brazil Leasing 100.00% 100.00% 100.00% 100.00% Financeira Itaú CBD S.A. Crédito, Financiamento e Investimento Brazil Consumer Finance Credit 50.00% 50.00% 50.00% 50.00% Hipercard Banco Múltiplo S.A. Brazil Financial institution 100.00% 100.00% 100.00% 100.00% Itauseg Seguradora S.A. Brazil Insurance 100.00% 99.99% 100.00% 99.99% Itaú Corretora de Valores S.A. Brazil Broker 100.00% 100.00% 100.00% 100.00% Itaú Seguros S.A. Brazil Insurance 100.00% 100.00% 100.00% 100.00% Itaú Unibanco S.A. Brazil Financial institution 100.00% 100.00% 100.00% 100.00% Itaú Vida e Previdência S.A. Brazil Pension Plan 100.00% 100.00% 100.00% 100.00% Luizacred S.A. Sociedade de Crédito, Financiamento e Investimento Brazil Consumer Finance Credit 50.00% 50.00% 50.00% 50.00% Redecard S.A. Brazil Acquier 100.00% 100.00% 100.00% 100.00% Foreign Itaú CorpBanca Colombia S.A. (Note 2c) Colombian Peso Colombia Financial institution 25.28% 23.90% 25.28% 23.90% Banco Itaú (Suisse) S.A. Swiss Franc Switzerland Financial institution 100.00% 100.00% 100.00% 100.00% Banco Itaú Argentina S.A. Argentine Peso Argentina Financial institution 100.00% 100.00% 100.00% 100.00% Banco Itaú Paraguay S.A. Guarani Paraguay Financial institution 100.00% 100.00% 100.00% 100.00% Banco Itaú Uruguay S.A. Uruguayan peso Uruguay Financial institution 100.00% 100.00% 100.00% 100.00% Itau Bank, Ltd. Real Cayman Islands Financial institution 100.00% 100.00% 100.00% 100.00% Itaú BBA Colombia S.A. Corporación Financiera Colombian Peso Colombia Financial institution 100.00% 100.00% 100.00% 100.00% Itau BBA International plc Dollar United Kingdom Financial institution 100.00% 100.00% 100.00% 100.00% Itau BBA USA Securities Inc. Real United States Broker 100.00% 100.00% 100.00% 100.00% (2) (Note 2c) Chilean Peso Chile Financial institution 38.14% 36.06% 38.14% 36.06% Itaú CorpBanca (1) All foreign branches and subsidiaries of ITAÚ UNIBANCO HOLDING CONSOLIDATED have functional currency equal to that of the controlling entity, except for CorpBanca New York Branch, which functional currency is the dollar. (2) ITAÚ UNIBANCO HOLDING controls ITAÚ CORPBANCA due to the shareholders’ agreement. Itaú Unibanco Holding S.A. – Complete Financial Statements – March 31, 2019 68 The consolidated financial statements cover ITAÚ UNIBANCO HOLDING and its direct and indirect subsidiaries. We present below the main companies which together represent over 95% of total consolidated assets: Interest in total Interest in voting Country of (1) capital at Functional currency Activity capital at Incorporation 03/31/2019 03/31/2018 03/31/2019 03/31/2018 Domestic Banco Itaú BBA S.A. Brazil Financial institution 100.00% 100.00% 100.00% 100.00% Banco Itaú Consignado S.A. Brazil Financial institution 100.00% 100.00% 100.00% 100.00% Banco Itaucard S.A. Brazil Financial institution 100.00% 100.00% 100.00% 100.00% Banco Itauleasing S.A. Brazil Financial institution 100.00% 100.00% 100.00% 100.00% Cia. Itaú de Capitalização Brazil Capitalization 100.00% 100.00% 100.00% 100.00% Dibens Leasing S.A. - Arrendamento Mercantil Brazil Leasing 100.00% 100.00% 100.00% 100.00% Financeira Itaú CBD S.A. Crédito, Financiamento e Investimento Brazil Consumer Finance Credit 50.00% 50.00% 50.00% 50.00% Hipercard Banco Múltiplo S.A. Brazil Financial institution 100.00% 100.00% 100.00% 100.00% Itauseg Seguradora S.A. Brazil Insurance 100.00% 99.99% 100.00% 99.99% Itaú Corretora de Valores S.A. Brazil Broker 100.00% 100.00% 100.00% 100.00% Itaú Seguros S.A. Brazil Insurance 100.00% 100.00% 100.00% 100.00% Itaú Unibanco S.A. Brazil Financial institution 100.00% 100.00% 100.00% 100.00% Itaú Vida e Previdência S.A. Brazil Pension Plan 100.00% 100.00% 100.00% 100.00% Luizacred S.A. Sociedade de Crédito, Financiamento e Investimento Brazil Consumer Finance Credit 50.00% 50.00% 50.00% 50.00% Redecard S.A. Brazil Acquier 100.00% 100.00% 100.00% 100.00% Foreign Itaú CorpBanca Colombia S.A. (Note 2c) Colombian Peso Colombia Financial institution 25.28% 23.90% 25.28% 23.90% Banco Itaú (Suisse) S.A. Swiss Franc Switzerland Financial institution 100.00% 100.00% 100.00% 100.00% Banco Itaú Argentina S.A. Argentine Peso Argentina Financial institution 100.00% 100.00% 100.00% 100.00% Banco Itaú Paraguay S.A. Guarani Paraguay Financial institution 100.00% 100.00% 100.00% 100.00% Banco Itaú Uruguay S.A. Uruguayan peso Uruguay Financial institution 100.00% 100.00% 100.00% 100.00% Itau Bank, Ltd. Real Cayman Islands Financial institution 100.00% 100.00% 100.00% 100.00% Itaú BBA Colombia S.A. Corporación Financiera Colombian Peso Colombia Financial institution 100.00% 100.00% 100.00% 100.00% Itau BBA International plc Dollar United Kingdom Financial institution 100.00% 100.00% 100.00% 100.00% Itau BBA USA Securities Inc. Real United States Broker 100.00% 100.00% 100.00% 100.00% (2) (Note 2c) Chilean Peso Chile Financial institution 38.14% 36.06% 38.14% 36.06% Itaú CorpBanca (1) All foreign branches and subsidiaries of ITAÚ UNIBANCO HOLDING CONSOLIDATED have functional currency equal to that of the controlling entity, except for CorpBanca New York Branch, which functional currency is the dollar. (2) ITAÚ UNIBANCO HOLDING controls ITAÚ CORPBANCA due to the shareholders’ agreement. Itaú Unibanco Holding S.A. – Complete Financial Statements – March 31, 2019 68
c) Business development Itaú CorpBanca st The ITAÚ CORPBANCA is controlled as of April 1 , 2016 by ITAÚ UNIBANCO HOLDING CONSOLIDATED. On the same date, ITAU UNIBANCO HOLDING entered into a shareholders’ agreement with CORP GROUP, which sets forth, among others, the right of ITAÚ UNIBANCO HOLDING and CORP GROUP to appoint members for the Board of Directors of ITAÚ CORPBANCA in accordance to their interests in capital stock, and this group of shareholders will have the right to appoint the majority of members of the Board of Directors of ITAÚ CORPBANCA and ITAÚ UNIBANCO HOLDING will be entitled to appoint the majority of members elected by this block. On October 12, 2018, ITAÚ UNIBANCO HOLDING CONSOLIDATED, through its subsidiary ITB Holding Brasil Participações Ltda., indirectly acquired additional interest of 2.08% (10.651.555.020 shares) in the capital of ITAÚ CORPBANCA, for the amount of R$ 362.9 million then holding 38.14%. Acquisition of minority interest in XP Investimentos S.A. On May 11, 2017, ITAÚ UNIBANCO HOLDING, through its subsidiary ITAÚ UNIBANCO, entered into an agreement for purchase and sale of shares with XP Controle Participações S.A. (XP CONTROLE), G.A. Brasil IV Fundo de Investimento em Participações, Dyna III Fundo de Investimento em Participações, among other parties (SELLERS), for acquisition of 49.9% of total capital (of which 30.1% of common shares) of XP Investimentos S.A. (XP HOLDING), through capital contribution in the amount of R$ 600 milions and acquisition of shares issued by XP HOLDING held by the SELLERS in the amount of R$ 5,700 milions, and such amounts were restated pursuant to contractual provision, totaling R$ 6,650 milions (FIRST ACQUISITION). A portion of this amount was withheld as a guarantee for possible future obligations of XP CONTROLE, for a 10-year period, and possible remaining balance will be paid to XP CONTROLE at the end of this term. In addition to the FIRST ACQUISITION, the agreement sets forth only one additional acquisition in 2022, subject to future BACEN’s approval. Should it be approved, it will enable ITAÚ UNIBANCO to hold up to 62.4% of XP HOLDING’s total capital (equivalent to 40.0% of common shares) based on a multiple of result (19 times) of XP HOLDING, therefore being clear that the control over XP Group will remain unchanged, with XP CONTROLE’s shareholders. ITAÚ UNIBANCO will act as minority partner. Effective acquisitions and financial settlements occurred on August 31, 2018, after the satisfaction of certain contractual conditions and obtainment of regulatory and government authorizations required. Itaú Unibanco Holding S.A. – Complete Financial Statements – March 31, 2019 69 c) Business development Itaú CorpBanca st The ITAÚ CORPBANCA is controlled as of April 1 , 2016 by ITAÚ UNIBANCO HOLDING CONSOLIDATED. On the same date, ITAU UNIBANCO HOLDING entered into a shareholders’ agreement with CORP GROUP, which sets forth, among others, the right of ITAÚ UNIBANCO HOLDING and CORP GROUP to appoint members for the Board of Directors of ITAÚ CORPBANCA in accordance to their interests in capital stock, and this group of shareholders will have the right to appoint the majority of members of the Board of Directors of ITAÚ CORPBANCA and ITAÚ UNIBANCO HOLDING will be entitled to appoint the majority of members elected by this block. On October 12, 2018, ITAÚ UNIBANCO HOLDING CONSOLIDATED, through its subsidiary ITB Holding Brasil Participações Ltda., indirectly acquired additional interest of 2.08% (10.651.555.020 shares) in the capital of ITAÚ CORPBANCA, for the amount of R$ 362.9 million then holding 38.14%. Acquisition of minority interest in XP Investimentos S.A. On May 11, 2017, ITAÚ UNIBANCO HOLDING, through its subsidiary ITAÚ UNIBANCO, entered into an agreement for purchase and sale of shares with XP Controle Participações S.A. (XP CONTROLE), G.A. Brasil IV Fundo de Investimento em Participações, Dyna III Fundo de Investimento em Participações, among other parties (SELLERS), for acquisition of 49.9% of total capital (of which 30.1% of common shares) of XP Investimentos S.A. (XP HOLDING), through capital contribution in the amount of R$ 600 milions and acquisition of shares issued by XP HOLDING held by the SELLERS in the amount of R$ 5,700 milions, and such amounts were restated pursuant to contractual provision, totaling R$ 6,650 milions (FIRST ACQUISITION). A portion of this amount was withheld as a guarantee for possible future obligations of XP CONTROLE, for a 10-year period, and possible remaining balance will be paid to XP CONTROLE at the end of this term. In addition to the FIRST ACQUISITION, the agreement sets forth only one additional acquisition in 2022, subject to future BACEN’s approval. Should it be approved, it will enable ITAÚ UNIBANCO to hold up to 62.4% of XP HOLDING’s total capital (equivalent to 40.0% of common shares) based on a multiple of result (19 times) of XP HOLDING, therefore being clear that the control over XP Group will remain unchanged, with XP CONTROLE’s shareholders. ITAÚ UNIBANCO will act as minority partner. Effective acquisitions and financial settlements occurred on August 31, 2018, after the satisfaction of certain contractual conditions and obtainment of regulatory and government authorizations required. Itaú Unibanco Holding S.A. – Complete Financial Statements – March 31, 2019 69
Note 3 – Summary of the main accounting practices a) Cash and cash equivalents - Is defined as cash and current accounts in banks, considered in the Consolidated Balance Sheet in the heading Cash, Interbank Deposits and Money market that have original maturities of up to 90 days or less. b) Interbank investments, remunerated restricted credits – Brazilian Central Bank, remunerated deposits, deposits received under securities repurchase agreements, funds from acceptance and issuance of securities, borrowing and onlending, subordinated debt and other receivables and payables – Operations with fixed remuneration and charges are accounted for at present value. Operations with post-fixed or floating remuneration and charges are accounted for at the adjusted principal amount. Operations subject to foreign exchange variation are accounted for at the corresponding amount in local currency. Liabilities are presented net of the transaction costs incurred, when relevant, calculated pro rate die. c) Securities - Recorded at the cost of acquisition restated by the index and/or effective interest rate and presented in the Balance Sheet, according to BACEN Circular nº. 3,068, of November 8, 2001. Securities are classified into the following categories: · Trading securities – Securities acquired to be actively and frequently traded, and adjusted to market value, with a counter-entry to the results for the period; · Available-for-sale securities – Securities that can be negotiated but are not acquired for the purposes of active and frequent trading. They are adjusted to their market value, with a counter-entry to an account disclosed in stockholders’ equity; · Held-to-maturity securities – Securities, except for non-redeemable shares, which the bank has the financial condition and intend, or is required to hold in the portfolio to maturity, are recorded at the cost of acquisition, or market value, whenever these are transferred from another category. The securities are adjusted using the accrual method through maturity, and are not adjusted to market value. Gains and losses on available-for-sale securities, when realized, are recognized on the trade date in the statement of income, with a counter-entry to a specific stockholders’ equity account. Decreases in the market value of available-for-sale and held-to-maturity securities below their related costs, resulting from non-temporary causes, are recorded in the results as realized losses. d) Derivative financial instruments - These are classified on the date of their acquisition, according to whether or not management intends to use them either as a hedge, according to BACEN Circular nº. 3,082, of January 30, 2002. Transactions involving financial instruments, carried out at the client’s request, on their own account, or which do not comply with the hedging criteria (mainly derivatives used to manage the overall risk exposure), are stated at market value, including realized and unrealized gains and losses, which are recorded directly in the statement of income. The derivatives that are used for protection against risk exposure or to modify the characteristics of financial assets and liabilities, which have changes in market value closely related with those of the items being protected at the beginning and throughout the duration of the contract, and which are found to be effective reducing the risk related to the exposure being protected against, are classified as hedges, in accordance with their nature: · Market Risk Hedge – Financial assets and liabilities, as well as their related financial instruments, are accounted for at their market value, plus realized and unrealized gains and losses, which are recorded directly in the statement of income; · Cash Flow Hedge - The effective amounts of the hedge of financial assets and liabilities, as well as their related financial instruments, are accounted for at their market value plus realized and unrealized gains and losses, net of tax effects, when applicable, and recorded in a specific account in stockholders’ equity. The ineffective portion is recorded directly in the statement of income; Itaú Unibanco Holding S.A. – Complete Financial Statements – March 31, 2019 70 Note 3 – Summary of the main accounting practices a) Cash and cash equivalents - Is defined as cash and current accounts in banks, considered in the Consolidated Balance Sheet in the heading Cash, Interbank Deposits and Money market that have original maturities of up to 90 days or less. b) Interbank investments, remunerated restricted credits – Brazilian Central Bank, remunerated deposits, deposits received under securities repurchase agreements, funds from acceptance and issuance of securities, borrowing and onlending, subordinated debt and other receivables and payables – Operations with fixed remuneration and charges are accounted for at present value. Operations with post-fixed or floating remuneration and charges are accounted for at the adjusted principal amount. Operations subject to foreign exchange variation are accounted for at the corresponding amount in local currency. Liabilities are presented net of the transaction costs incurred, when relevant, calculated pro rate die. c) Securities - Recorded at the cost of acquisition restated by the index and/or effective interest rate and presented in the Balance Sheet, according to BACEN Circular nº. 3,068, of November 8, 2001. Securities are classified into the following categories: · Trading securities – Securities acquired to be actively and frequently traded, and adjusted to market value, with a counter-entry to the results for the period; · Available-for-sale securities – Securities that can be negotiated but are not acquired for the purposes of active and frequent trading. They are adjusted to their market value, with a counter-entry to an account disclosed in stockholders’ equity; · Held-to-maturity securities – Securities, except for non-redeemable shares, which the bank has the financial condition and intend, or is required to hold in the portfolio to maturity, are recorded at the cost of acquisition, or market value, whenever these are transferred from another category. The securities are adjusted using the accrual method through maturity, and are not adjusted to market value. Gains and losses on available-for-sale securities, when realized, are recognized on the trade date in the statement of income, with a counter-entry to a specific stockholders’ equity account. Decreases in the market value of available-for-sale and held-to-maturity securities below their related costs, resulting from non-temporary causes, are recorded in the results as realized losses. d) Derivative financial instruments - These are classified on the date of their acquisition, according to whether or not management intends to use them either as a hedge, according to BACEN Circular nº. 3,082, of January 30, 2002. Transactions involving financial instruments, carried out at the client’s request, on their own account, or which do not comply with the hedging criteria (mainly derivatives used to manage the overall risk exposure), are stated at market value, including realized and unrealized gains and losses, which are recorded directly in the statement of income. The derivatives that are used for protection against risk exposure or to modify the characteristics of financial assets and liabilities, which have changes in market value closely related with those of the items being protected at the beginning and throughout the duration of the contract, and which are found to be effective reducing the risk related to the exposure being protected against, are classified as hedges, in accordance with their nature: · Market Risk Hedge – Financial assets and liabilities, as well as their related financial instruments, are accounted for at their market value, plus realized and unrealized gains and losses, which are recorded directly in the statement of income; · Cash Flow Hedge - The effective amounts of the hedge of financial assets and liabilities, as well as their related financial instruments, are accounted for at their market value plus realized and unrealized gains and losses, net of tax effects, when applicable, and recorded in a specific account in stockholders’ equity. The ineffective portion is recorded directly in the statement of income; Itaú Unibanco Holding S.A. – Complete Financial Statements – March 31, 2019 70
· Net Investment Hedge of Foreign Operations - Accounted for similarly to cash flow hedge, i.e. the portion of gains or losses on a hedging instrument that is determined to be an effective hedge is recognized in stockholders’ equity, and reclassified to income for the period in the event of the disposal of the foreign operation. The ineffective portion is recognized in income for the period. e) Loan, lease and other credit operations (operations with credit granting characteristics) – These transactions are recorded at present value and calculated pro rata die based on the variation of the contracted index and interest rate, and are recorded on basis until the 60th day overdue in financial companies, according to the estimates of receipt. After the 60th day, income is recognized upon the effective receipt of installments. Credit card operations include receivables arising from the purchases made by cardholders. Funds corresponding to these amounts to be paid to the accrediting organization are in liabilities, in the heading Interbank Accounts – Receipts and Payments Pending Settlement. f) Allowance for loan losses - The balance of the allowance for loan losses was recorded based on a credit risk analysis, at an amount considered sufficient to cover loan losses in accordance with the rules determined by CMN Resolution nº. 2,682 of December 21, 1999, which are as follows are: · Provisions are recorded from the date on which loans are granted, based on the client’s risk rating and on the periodic quality evaluation of clients and industries, and not only in the event of default; · Taking into account default exclusively, the write-off as losses occurs 360 days after the credits have matured or after 540 days for operations that mature after a period of 36 months. The criterion adopted for recognition of a provision for Financial Guarantees pledged was based on the Expected Loss model. g) Other assets –They are comprised of Assets Held for Sale, relating to real estate vehicles and other assets available for sale (own and not in use, received as payment in kind or resulting from enforcement of guarantees). These assets are adjusted to market value by setting up a provision in accordance with standards in force. In addition, are recorded unearned reinsurance premiums (Note 3m); and prepaid expenses, corresponding to disbursements, the benefits of which will be felt in future exercises. h) Investments – Include goodwill identified in the acquisition of associates and joint ventures, net of any accumulated impairment loss. They are initially recognized at acquisition cost and are subsequently accounted for under the equity method. · Associates: are companies in which ITAÚ UNIBANCO HOLDING CONSOLIDATED has significant influence, but it does not hold control over them. · Joint Ventures: ITAÚ UNIBANCO HOLDING CONSOLIDATED defines joint venture when it is entitled to rights and obligations for related liabilities. i) Fixed assets - Are account for at their acquisition cost less accumulated depreciation and adjusted for impairment, as applicable. Depreciation is calculated under the straight-line method using rates based on the estimated useful lives of these assets. Such rates and other details are presented in Note 12b I. Residual values and useful lives of assets are reviewed and adjusted, if appropriate, at the end of each period. ITAÚ UNIBANCO HOLDING CONSOLIDATED reviews its assets in order to identify indications of impairment in their recoverable amounts. The recoverable amount of an asset is defined as the higher of its fair value less costs to sell and its value in use. For assessment purposes, assets are grouped at the lowest level for which independent cash flows can be identified (cash-generating units). Assessment may be made at an individual asset level when the fair value less its cost to sell may be reliably determined. Itaú Unibanco Holding S.A. – Complete Financial Statements – March 31, 2019 71 · Net Investment Hedge of Foreign Operations - Accounted for similarly to cash flow hedge, i.e. the portion of gains or losses on a hedging instrument that is determined to be an effective hedge is recognized in stockholders’ equity, and reclassified to income for the period in the event of the disposal of the foreign operation. The ineffective portion is recognized in income for the period. e) Loan, lease and other credit operations (operations with credit granting characteristics) – These transactions are recorded at present value and calculated pro rata die based on the variation of the contracted index and interest rate, and are recorded on basis until the 60th day overdue in financial companies, according to the estimates of receipt. After the 60th day, income is recognized upon the effective receipt of installments. Credit card operations include receivables arising from the purchases made by cardholders. Funds corresponding to these amounts to be paid to the accrediting organization are in liabilities, in the heading Interbank Accounts – Receipts and Payments Pending Settlement. f) Allowance for loan losses - The balance of the allowance for loan losses was recorded based on a credit risk analysis, at an amount considered sufficient to cover loan losses in accordance with the rules determined by CMN Resolution nº. 2,682 of December 21, 1999, which are as follows are: · Provisions are recorded from the date on which loans are granted, based on the client’s risk rating and on the periodic quality evaluation of clients and industries, and not only in the event of default; · Taking into account default exclusively, the write-off as losses occurs 360 days after the credits have matured or after 540 days for operations that mature after a period of 36 months. The criterion adopted for recognition of a provision for Financial Guarantees pledged was based on the Expected Loss model. g) Other assets –They are comprised of Assets Held for Sale, relating to real estate vehicles and other assets available for sale (own and not in use, received as payment in kind or resulting from enforcement of guarantees). These assets are adjusted to market value by setting up a provision in accordance with standards in force. In addition, are recorded unearned reinsurance premiums (Note 3m); and prepaid expenses, corresponding to disbursements, the benefits of which will be felt in future exercises. h) Investments – Include goodwill identified in the acquisition of associates and joint ventures, net of any accumulated impairment loss. They are initially recognized at acquisition cost and are subsequently accounted for under the equity method. · Associates: are companies in which ITAÚ UNIBANCO HOLDING CONSOLIDATED has significant influence, but it does not hold control over them. · Joint Ventures: ITAÚ UNIBANCO HOLDING CONSOLIDATED defines joint venture when it is entitled to rights and obligations for related liabilities. i) Fixed assets - Are account for at their acquisition cost less accumulated depreciation and adjusted for impairment, as applicable. Depreciation is calculated under the straight-line method using rates based on the estimated useful lives of these assets. Such rates and other details are presented in Note 12b I. Residual values and useful lives of assets are reviewed and adjusted, if appropriate, at the end of each period. ITAÚ UNIBANCO HOLDING CONSOLIDATED reviews its assets in order to identify indications of impairment in their recoverable amounts. The recoverable amount of an asset is defined as the higher of its fair value less costs to sell and its value in use. For assessment purposes, assets are grouped at the lowest level for which independent cash flows can be identified (cash-generating units). Assessment may be made at an individual asset level when the fair value less its cost to sell may be reliably determined. Itaú Unibanco Holding S.A. – Complete Financial Statements – March 31, 2019 71
j) Goodwill – Corresponds to the amount paid in excess for the purchase of investments and is amortized based on expected future profitability or as realized. It is tested semiannually for impairment. k) Intangible assets – It is composed of: (i) Goodwill amount paid upon acquisition of the company, transferred to intangible assets due to merger of the acquired company’s equity into the acquirer company; (ii) Right-of- use, as well as rights on the acquisition of payrolls and association agreements, amortized according to agreement terms or as economic benefits flow to the company; and (iii) Software amortized over five years and customer portfolios amortized within ten years. . Intangible assets with definite useful lives are amortized under the straight-line method at their estimated useful lives and those with indefinite useful lives are tested on a half-yearly basis to identify possible impairment losses. l) Capital Transactions with Non-Controlling Stockholders - Changes in the interest in a subsidiary not giving rise to loss of control are accounted for as capital transactions, and any difference between the amount paid and the amount corresponding to the non-controlling stockholders is directly recognized in Consolidated Stockholders’ Equity. m) Insurance, pension plan and capitalization operations – Technical provisions are liabilities arising from obligations of ITAÚ UNIBANCO HOLDING CONSOLIDATED to its policyholders and participants. These obligations may be short term liabilities (property and casualty insurance) or medium and long term liabilities (life insurance and pension plans). The determination of the actuarial liability is subject to several uncertainties inherent in the coverage of insurance and pension contracts, such as assumptions of persistence, mortality, disability, life expectancy, morbidity, expenses, frequency and severity of claims, conversion of benefits into annuities, redemptions and return on assets. The estimates for these assumptions are based on the historical experience of ITAÚ UNIBANCO HOLDING CONSOLIDATED, benchmarks and experience of the actuary, in order to comply with best market practices and the continuous review of the actuarial liability. The adjustments resulting from these continuous improvements, when necessary, are recognized in the statement of income for the corresponding period. Insurance contracts establish, for one of the parties, upon payment (premium) by the other party, the obligation to pay it a certain amount in case of a claim. Insurance risk is defined when a future and uncertain event, of sudden and unforeseeable nature, independent from the insured’s will, may cause losses of economic occurrence when it occurs. Since the contract is classified as an insurance contract, it remains as such until the end of its life, even if the insurance risk is significantly reduced during such period, unless all rights and obligations are extinguished or expire. Insurance premiums, acceptance coinsurance and selling expenses are accounted for upon issue of the insurance policy or in accordance with the insurance effectiveness term, through the recognition and reversal of a provision for unearned premiums and deferred selling expenses. Interest arising from fractioning of insurance premiums is accounted for as incurred. Revenues from social security contributions, gross revenue from capitalization certificates and respective technical provisions are recognized upon receipt. A detailed description of all products classified as insurance contracts can be found in Note 8. Private pension plans Contracts that contemplate retirement benefits after an accumulation period (known as PGBL, VGBL and FGB) assure, at the commencement date of the contract, the basis for calculating the retirement benefit (mortality table and minimum interest). The contracts specify the annuity fees and, therefore, the contract transfers the insurance risk to the issuer at the commencement date, and they are classified as insurance contracts. Insurance premiums Insurance premiums are recognized by issuing an insurance policy or over the period of the contracts in proportion to the amount of the insurance coverage. Itaú Unibanco Holding S.A. – Complete Financial Statements – March 31, 2019 72 j) Goodwill – Corresponds to the amount paid in excess for the purchase of investments and is amortized based on expected future profitability or as realized. It is tested semiannually for impairment. k) Intangible assets – It is composed of: (i) Goodwill amount paid upon acquisition of the company, transferred to intangible assets due to merger of the acquired company’s equity into the acquirer company; (ii) Right-of- use, as well as rights on the acquisition of payrolls and association agreements, amortized according to agreement terms or as economic benefits flow to the company; and (iii) Software amortized over five years and customer portfolios amortized within ten years. . Intangible assets with definite useful lives are amortized under the straight-line method at their estimated useful lives and those with indefinite useful lives are tested on a half-yearly basis to identify possible impairment losses. l) Capital Transactions with Non-Controlling Stockholders - Changes in the interest in a subsidiary not giving rise to loss of control are accounted for as capital transactions, and any difference between the amount paid and the amount corresponding to the non-controlling stockholders is directly recognized in Consolidated Stockholders’ Equity. m) Insurance, pension plan and capitalization operations – Technical provisions are liabilities arising from obligations of ITAÚ UNIBANCO HOLDING CONSOLIDATED to its policyholders and participants. These obligations may be short term liabilities (property and casualty insurance) or medium and long term liabilities (life insurance and pension plans). The determination of the actuarial liability is subject to several uncertainties inherent in the coverage of insurance and pension contracts, such as assumptions of persistence, mortality, disability, life expectancy, morbidity, expenses, frequency and severity of claims, conversion of benefits into annuities, redemptions and return on assets. The estimates for these assumptions are based on the historical experience of ITAÚ UNIBANCO HOLDING CONSOLIDATED, benchmarks and experience of the actuary, in order to comply with best market practices and the continuous review of the actuarial liability. The adjustments resulting from these continuous improvements, when necessary, are recognized in the statement of income for the corresponding period. Insurance contracts establish, for one of the parties, upon payment (premium) by the other party, the obligation to pay it a certain amount in case of a claim. Insurance risk is defined when a future and uncertain event, of sudden and unforeseeable nature, independent from the insured’s will, may cause losses of economic occurrence when it occurs. Since the contract is classified as an insurance contract, it remains as such until the end of its life, even if the insurance risk is significantly reduced during such period, unless all rights and obligations are extinguished or expire. Insurance premiums, acceptance coinsurance and selling expenses are accounted for upon issue of the insurance policy or in accordance with the insurance effectiveness term, through the recognition and reversal of a provision for unearned premiums and deferred selling expenses. Interest arising from fractioning of insurance premiums is accounted for as incurred. Revenues from social security contributions, gross revenue from capitalization certificates and respective technical provisions are recognized upon receipt. A detailed description of all products classified as insurance contracts can be found in Note 8. Private pension plans Contracts that contemplate retirement benefits after an accumulation period (known as PGBL, VGBL and FGB) assure, at the commencement date of the contract, the basis for calculating the retirement benefit (mortality table and minimum interest). The contracts specify the annuity fees and, therefore, the contract transfers the insurance risk to the issuer at the commencement date, and they are classified as insurance contracts. Insurance premiums Insurance premiums are recognized by issuing an insurance policy or over the period of the contracts in proportion to the amount of the insurance coverage. Itaú Unibanco Holding S.A. – Complete Financial Statements – March 31, 2019 72
If there is evidence of impairment losses with respect to receivables for insurance premiums, ITAÚ UNIBANCO HOLDING CONSOLIDATED recognizes a provision, sufficient to cover this loss, based on the risk analysis of realization of insurance premiums receivable with installments overdue for over 60 days. Reinsurance In the ordinary course of business, ITAÚ UNIBANCO HOLDING CONSOLIDATED reinsures a portion of the risks underwritten, particularly property and casualty risks that exceed the maximum limits of responsibility that we determine to be appropriate for each segment and product (after a study which considers size, experience, specificities, and the necessary capital to support these limits). These reinsurance agreements allow the recovery of a portion of the losses from the reinsurer, although they do not release the insurer from the main obligation as direct insurer of the risks contemplated in the reinsurance. Acquisition Costs Acquisition costs include direct and indirect costs related to the origination of insurance. These costs and recorded directly in result as incurred, expect for deferred acquisition costs (commissions paid for brokerage services, agency and prospecting efforts), which are recorded proportionally to the recognition of premium revenues, i.e. for the term corresponding to the insurance contract. Insurance Contract Liabilities Reserves for claims are established based on historical experience, claims in process of payment, estimated amounts of claims incurred but not yet reported, and other factors relevant to the required reserve levels. A liability for premium deficiencies is recognized if the estimated amount of premium deficiencies exceeds deferred acquisition costs. Liability Adequacy Test ITAÚ UNIBANCO HOLDING CONSOLIDATED conducts the liability adequacy test by adopting current actuarial assumptions for future cash flows of all insurance contracts in force at the balance sheet date. Should the analysis show insufficiency, any deficiency identified will be accounted for in income for the period. The assumptions used to conduct the liability adequacy test are detailed in Note 8. n) Contingent Assets and Liabilities and Legal Liabilities, Tax and Social Security - are potential rights and obligations arising from past events for which materialization depends on uncertain future events. They are measured using best estimates through the use of models and criteria which allow their appropriate measurement even if there is uncertainty as to their ultimate timing and amount, and the criteria are detailed in Note 9. These contingencies are evaluated based on Management’s best estimates, and are classified as: · Probable: in which liabilities are recognized in the consolidated balance sheet under Other Liabilities; · Possible: which are disclosed in the Consolidated Financial Statements, but no provision is recorded; · Remote: which require neither a provision nor disclosure. Contingent assets are not recognized in the Consolidated Statement of Income, except when Management of ITAÚ UNIBANCO HOLDING CONSOLIDATED understands that its realization is practically certain and, in general corresponds to lawsuits with favorable sentences in final and unappealable judgments and by the withdrawal of lawsuits as a result of a settlement payment that has been received as a result of an agreement to offset against an existing liability. The amount of escrow deposits is updated in compliance with current legislation. Contingencies guaranteed by indemnity clauses in privatization processes and with liquidity are only recognized upon judicial notification with the simultaneous recognition of receivables, without any effect on results. Legal Liabilities, Tax and Social Security Represented by amounts payable related to tax liabilities, the legality or constitutionality of which are subject to judicial challenge, recognized at the full amount under discussion. Itaú Unibanco Holding S.A. – Complete Financial Statements – March 31, 2019 73 If there is evidence of impairment losses with respect to receivables for insurance premiums, ITAÚ UNIBANCO HOLDING CONSOLIDATED recognizes a provision, sufficient to cover this loss, based on the risk analysis of realization of insurance premiums receivable with installments overdue for over 60 days. Reinsurance In the ordinary course of business, ITAÚ UNIBANCO HOLDING CONSOLIDATED reinsures a portion of the risks underwritten, particularly property and casualty risks that exceed the maximum limits of responsibility that we determine to be appropriate for each segment and product (after a study which considers size, experience, specificities, and the necessary capital to support these limits). These reinsurance agreements allow the recovery of a portion of the losses from the reinsurer, although they do not release the insurer from the main obligation as direct insurer of the risks contemplated in the reinsurance. Acquisition Costs Acquisition costs include direct and indirect costs related to the origination of insurance. These costs and recorded directly in result as incurred, expect for deferred acquisition costs (commissions paid for brokerage services, agency and prospecting efforts), which are recorded proportionally to the recognition of premium revenues, i.e. for the term corresponding to the insurance contract. Insurance Contract Liabilities Reserves for claims are established based on historical experience, claims in process of payment, estimated amounts of claims incurred but not yet reported, and other factors relevant to the required reserve levels. A liability for premium deficiencies is recognized if the estimated amount of premium deficiencies exceeds deferred acquisition costs. Liability Adequacy Test ITAÚ UNIBANCO HOLDING CONSOLIDATED conducts the liability adequacy test by adopting current actuarial assumptions for future cash flows of all insurance contracts in force at the balance sheet date. Should the analysis show insufficiency, any deficiency identified will be accounted for in income for the period. The assumptions used to conduct the liability adequacy test are detailed in Note 8. n) Contingent Assets and Liabilities and Legal Liabilities, Tax and Social Security - are potential rights and obligations arising from past events for which materialization depends on uncertain future events. They are measured using best estimates through the use of models and criteria which allow their appropriate measurement even if there is uncertainty as to their ultimate timing and amount, and the criteria are detailed in Note 9. These contingencies are evaluated based on Management’s best estimates, and are classified as: · Probable: in which liabilities are recognized in the consolidated balance sheet under Other Liabilities; · Possible: which are disclosed in the Consolidated Financial Statements, but no provision is recorded; · Remote: which require neither a provision nor disclosure. Contingent assets are not recognized in the Consolidated Statement of Income, except when Management of ITAÚ UNIBANCO HOLDING CONSOLIDATED understands that its realization is practically certain and, in general corresponds to lawsuits with favorable sentences in final and unappealable judgments and by the withdrawal of lawsuits as a result of a settlement payment that has been received as a result of an agreement to offset against an existing liability. The amount of escrow deposits is updated in compliance with current legislation. Contingencies guaranteed by indemnity clauses in privatization processes and with liquidity are only recognized upon judicial notification with the simultaneous recognition of receivables, without any effect on results. Legal Liabilities, Tax and Social Security Represented by amounts payable related to tax liabilities, the legality or constitutionality of which are subject to judicial challenge, recognized at the full amount under discussion. Itaú Unibanco Holding S.A. – Complete Financial Statements – March 31, 2019 73
o) Provision for Financial Guarantees Provided – Recognized based on the expected loss model, in an amount sufficient to cover any probable losses over the whole guarantee period. p) Income tax and social contribution – There are two components of the provision for income tax and social contribution: current and deferred. Current income tax expense approximates taxes to be paid or recovered for the applicable period. Deferred income tax and social contribution represented by deferred tax assets and liabilities are obtained based on the differences between the tax bases of assets and liabilities and the amounts reported in the financial statements at each year end. Deferred tax assets are only recognized when it is probable that future taxable income will be available for offsetting. The Income Tax and Social Contribution expense is recognized in the Consolidated Statement of Income under Income Tax and Social Contribution, except when it refers to items directly recognized in Stockholders’ Equity, such as: tax on market value measurement of available-for-sale financial assets, post- employment benefits and tax on cash flow hedges and hedge of net investment in foreign operations. Subsequently, these items are recognized in income together with the recognition of the gain/loss originally deferred. Changes in tax legislation and rates are recognized in the Consolidated statement of income under Income tax and social contribution in the period in which they are enacted. Interest and fines are recognized in the consolidated statement of income under General and administrative expenses. Tax rates, as well as their calculation bases, are detailed in Note 11. q) Deferred income – this refers to: (i) unexpired interest received in advance that is recognized in income as earned, and (ii) the negative goodwill on acquisition of investments arising from expected future losses, which has not been absorbed in the consolidation process. r) Post-employments benefits Pension plans - defined benefit plans The liability (or asset, as the case may be) recognized in the consolidated balance sheet with respect to the defined benefit plan corresponds to the present value of the defined benefit obligations on the balance sheet date less the fair value of the plan assets. The defined benefit obligation is annually calculated by an independent actuarial consulting company using the projected unit credit method. The present value of the defined benefit obligation is determined by discounting the estimated amount of future cash flows of benefit payments based on the Brazilian treasury long term securities denominated in Reais and with maturity periods similar to the term of the pension plan liabilities. Pension plans - defined contribution For defined contribution plans, contributions to plans made by ITAÚ UNIBANCO HOLDING CONSOLIDATED, through pension plan funds, are recognized as expenses when due. Other post-employment benefit obligations These obligations are assessed annually by independent and qualified actuaries, and the costs expected from these benefits are accrued during the length of service. Gains and losses arising from adjustments and changes in actuarial assumptions are debited from or credited to stockholders’ equity in Equity asset valuation adjustment in the period in which they occur. s) Foreign currency translation I- Functional and presentation currency The Financial Statements of ITAÚ UNIBANCO HOLDING CONSOLIDATED are presented in Brazilian Reais, which is its functional and presentation currency. For each subsidiary and investment in associates and joint ventures, ITAÚ UNIBANCO HOLDING CONSOLIDATED defined the functional currency as the currency of the primary economic environment in which the entity operates. II - Foreign Currency Transactions Foreign currency transactions are translated using the exchange rates prevailing at the dates of the transactions. Foreign exchange gains and losses are recognized in the Consolidated Statement of Income, unless they are related to cash flow hedges, which are recognized in Stockholders' Equity. Itaú Unibanco Holding S.A. – Complete Financial Statements – March 31, 2019 74 o) Provision for Financial Guarantees Provided – Recognized based on the expected loss model, in an amount sufficient to cover any probable losses over the whole guarantee period. p) Income tax and social contribution – There are two components of the provision for income tax and social contribution: current and deferred. Current income tax expense approximates taxes to be paid or recovered for the applicable period. Deferred income tax and social contribution represented by deferred tax assets and liabilities are obtained based on the differences between the tax bases of assets and liabilities and the amounts reported in the financial statements at each year end. Deferred tax assets are only recognized when it is probable that future taxable income will be available for offsetting. The Income Tax and Social Contribution expense is recognized in the Consolidated Statement of Income under Income Tax and Social Contribution, except when it refers to items directly recognized in Stockholders’ Equity, such as: tax on market value measurement of available-for-sale financial assets, post- employment benefits and tax on cash flow hedges and hedge of net investment in foreign operations. Subsequently, these items are recognized in income together with the recognition of the gain/loss originally deferred. Changes in tax legislation and rates are recognized in the Consolidated statement of income under Income tax and social contribution in the period in which they are enacted. Interest and fines are recognized in the consolidated statement of income under General and administrative expenses. Tax rates, as well as their calculation bases, are detailed in Note 11. q) Deferred income – this refers to: (i) unexpired interest received in advance that is recognized in income as earned, and (ii) the negative goodwill on acquisition of investments arising from expected future losses, which has not been absorbed in the consolidation process. r) Post-employments benefits Pension plans - defined benefit plans The liability (or asset, as the case may be) recognized in the consolidated balance sheet with respect to the defined benefit plan corresponds to the present value of the defined benefit obligations on the balance sheet date less the fair value of the plan assets. The defined benefit obligation is annually calculated by an independent actuarial consulting company using the projected unit credit method. The present value of the defined benefit obligation is determined by discounting the estimated amount of future cash flows of benefit payments based on the Brazilian treasury long term securities denominated in Reais and with maturity periods similar to the term of the pension plan liabilities. Pension plans - defined contribution For defined contribution plans, contributions to plans made by ITAÚ UNIBANCO HOLDING CONSOLIDATED, through pension plan funds, are recognized as expenses when due. Other post-employment benefit obligations These obligations are assessed annually by independent and qualified actuaries, and the costs expected from these benefits are accrued during the length of service. Gains and losses arising from adjustments and changes in actuarial assumptions are debited from or credited to stockholders’ equity in Equity asset valuation adjustment in the period in which they occur. s) Foreign currency translation I- Functional and presentation currency The Financial Statements of ITAÚ UNIBANCO HOLDING CONSOLIDATED are presented in Brazilian Reais, which is its functional and presentation currency. For each subsidiary and investment in associates and joint ventures, ITAÚ UNIBANCO HOLDING CONSOLIDATED defined the functional currency as the currency of the primary economic environment in which the entity operates. II - Foreign Currency Transactions Foreign currency transactions are translated using the exchange rates prevailing at the dates of the transactions. Foreign exchange gains and losses are recognized in the Consolidated Statement of Income, unless they are related to cash flow hedges, which are recognized in Stockholders' Equity. Itaú Unibanco Holding S.A. – Complete Financial Statements – March 31, 2019 74
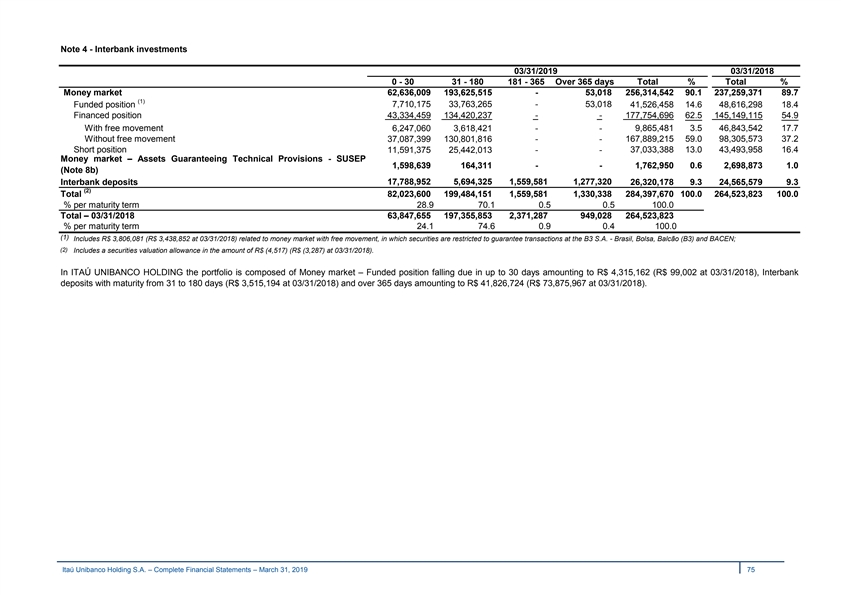
Note 4 - Interbank investments 03/31/2019 03/31/2018 0 - 30 31 - 180 181 - 365 Over 365 days Total % Total % Money market 62,636,009 193,625,515 - 53,018 256,314,542 90.1 237,259,371 89.7 (1) Funded position 7,710,175 33,763,265 - 53,018 41,526,458 14.6 48,616,298 18.4 Financed position 43,334,459 134,420,237 - - 177,754,696 62.5 145,149,115 54.9 With free movement 6,247,060 3,618,421 - - 9,865,481 3.5 46,843,542 17.7 Without free movement 37,087,399 130,801,816 - - 167,889,215 59.0 98,305,573 37.2 Short position 37,033,388 13.0 43,493,958 16.4 11,591,375 25,442,013 - - Money market – Assets Guaranteeing Technical Provisions - SUSEP 1,598,639 164,311 - - 1,762,950 0.6 2,698,873 1.0 (Note 8b) 17,788,952 5,694,325 1,559,581 1,277,320 Interbank deposits 26,320,178 9.3 24,565,579 9.3 (2) Total 82,023,600 199,484,151 1,559,581 1,330,338 284,397,670 100.0 264,523,823 100.0 % per maturity term 28.9 70.1 0.5 0.5 100.0 Total – 03/31/2018 63,847,655 197,355,853 2,371,287 949,028 264,523,823 % per maturity term 24.1 74.6 0.9 0.4 100.0 (1) Includes R$ 3,806,081 (R$ 3,438,852 at 03/31/2018) related to money market with free movement, in which securities are restricted to guarantee transactions at the B3 S.A. - Brasil, Bolsa, Balcão (B3) and BACEN; (2) Includes a securities valuation allowance in the amount of R$ (4,517) (R$ (3,287) at 03/31/2018). In ITAÚ UNIBANCO HOLDING the portfolio is composed of Money market – Funded position falling due in up to 30 days amounting to R$ 4,315,162 (R$ 99,002 at 03/31/2018), Interbank deposits with maturity from 31 to 180 days (R$ 3,515,194 at 03/31/2018) and over 365 days amounting to R$ 41,826,724 (R$ 73,875,967 at 03/31/2018). Itaú Unibanco Holding S.A. – Complete Financial Statements – March 31, 2019 75 Note 4 - Interbank investments 03/31/2019 03/31/2018 0 - 30 31 - 180 181 - 365 Over 365 days Total % Total % Money market 62,636,009 193,625,515 - 53,018 256,314,542 90.1 237,259,371 89.7 (1) Funded position 7,710,175 33,763,265 - 53,018 41,526,458 14.6 48,616,298 18.4 Financed position 43,334,459 134,420,237 - - 177,754,696 62.5 145,149,115 54.9 With free movement 6,247,060 3,618,421 - - 9,865,481 3.5 46,843,542 17.7 Without free movement 37,087,399 130,801,816 - - 167,889,215 59.0 98,305,573 37.2 Short position 37,033,388 13.0 43,493,958 16.4 11,591,375 25,442,013 - - Money market – Assets Guaranteeing Technical Provisions - SUSEP 1,598,639 164,311 - - 1,762,950 0.6 2,698,873 1.0 (Note 8b) 17,788,952 5,694,325 1,559,581 1,277,320 Interbank deposits 26,320,178 9.3 24,565,579 9.3 (2) Total 82,023,600 199,484,151 1,559,581 1,330,338 284,397,670 100.0 264,523,823 100.0 % per maturity term 28.9 70.1 0.5 0.5 100.0 Total – 03/31/2018 63,847,655 197,355,853 2,371,287 949,028 264,523,823 % per maturity term 24.1 74.6 0.9 0.4 100.0 (1) Includes R$ 3,806,081 (R$ 3,438,852 at 03/31/2018) related to money market with free movement, in which securities are restricted to guarantee transactions at the B3 S.A. - Brasil, Bolsa, Balcão (B3) and BACEN; (2) Includes a securities valuation allowance in the amount of R$ (4,517) (R$ (3,287) at 03/31/2018). In ITAÚ UNIBANCO HOLDING the portfolio is composed of Money market – Funded position falling due in up to 30 days amounting to R$ 4,315,162 (R$ 99,002 at 03/31/2018), Interbank deposits with maturity from 31 to 180 days (R$ 3,515,194 at 03/31/2018) and over 365 days amounting to R$ 41,826,724 (R$ 73,875,967 at 03/31/2018). Itaú Unibanco Holding S.A. – Complete Financial Statements – March 31, 2019 75
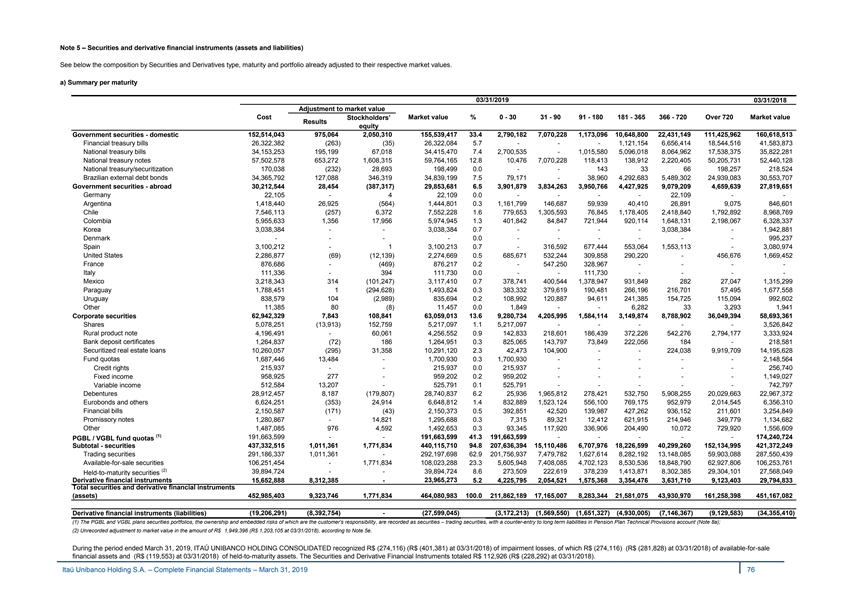
Note 5 – Securities and derivative financial instruments (assets and liabilities) See below the composition by Securities and Derivatives type, maturity and portfolio already adjusted to their respective market values. a) Summary per maturity 03/31/2019 03/31/2018 Adjustment to market value Cost Market value % 0 - 30 31 - 90 91 - 180 181 - 365 366 - 720 Over 720 Market value Stockholders’ Results equity Government securities - domestic 152,514,043 975,064 2,050,310 155,539,417 33.4 2,790,182 7,070,228 1,173,096 10,648,800 22,431,149 111,425,962 160,618,513 Financial treasury bills 26,322,382 ( 263) (35) 26,322,084 5.7 - - - 1,121,154 6,656,414 18,544,516 41,583,873 National treasury bills 34,153,253 195,199 67,018 34,415,470 7.4 2,700,535 - 1,015,580 5,096,018 8,064,962 17,538,375 35,822,281 National treasury notes 57,502,578 653,272 1,608,315 59,764,165 12.8 10,476 7,070,228 118,413 138,912 2,220,405 50,205,731 52,440,128 National treasury/securitization 170,038 ( 232) 28,693 198,499 0.0 - - 143 33 66 198,257 218,524 Brazilian external debt bonds 34,365,792 127,088 346,319 34,839,199 7.5 79,171 - 38,960 4,292,683 5,489,302 24,939,083 30,553,707 30,212,544 28,454 ( 387,317) 29,853,681 6.5 3,901,879 3,834,263 3,950,766 4,427,925 9,079,209 4,659,639 27,819,651 Government securities - abroad Germany 22,105 - 4 22,109 0.0 - - - - 22,109 - - Argentina 1,418,440 26,925 ( 564) 1,444,801 0.3 1,161,799 146,687 59,939 40,410 26,891 9,075 846,601 Chile 7,546,113 (257) 6,372 7,552,228 1.6 779,653 1,305,593 76,845 1,178,405 2,418,840 1,792,892 8,968,769 Colombia 5,955,633 1,356 17,956 5,974,945 1.3 401,842 84,847 721,944 920,114 1,648,131 2,198,067 6,328,337 Korea 3,038,384 - - 3,038,384 0.7 - - - - 3,038,384 - 1,942,881 Denmark - - - - 0.0 - - - - - - 995,237 Spain 3,100,212 - 1 3,100,213 0.7 - 316,592 677,444 553,064 1,553,113 - 3,080,974 United States 2,286,877 ( 69) (12,139) 2,274,669 0.5 685,671 532,244 309,858 290,220 - 456,676 1,669,452 France 876,686 - (469) 876,217 0.2 - 547,250 328,967 - - - - Italy 111,336 - 394 111,730 0.0 - - 111,730 - - - - Mexico 3,218,343 314 ( 101,247) 3,117,410 0.7 378,741 400,544 1,378,947 931,849 282 27,047 1,315,299 Paraguay 1,788,451 1 ( 294,628) 1,493,824 0.3 383,332 379,619 190,481 266,196 216,701 57,495 1,677,558 Uruguay 838,579 104 ( 2,989) 835,694 0.2 108,992 120,887 94,611 241,385 154,725 115,094 992,602 Other 11,385 80 ( 8) 11,457 0.0 1,849 - - 6,282 33 3,293 1,941 Corporate securities 62,942,329 7,843 108,841 63,059,013 13.6 9,280,734 4,205,995 1,584,114 3,149,874 8,788,902 36,049,394 58,693,361 Shares 5,078,251 ( 13,913) 152,759 5,217,097 1.1 5,217,097 - - - - - 3,526,842 Rural product note 4,196,491 - 60,061 4,256,552 0.9 142,833 218,601 186,439 372,226 542,276 2,794,177 3,333,924 Bank deposit certificates 1,264,837 (72) 186 1,264,951 0.3 825,065 143,797 73,849 222,056 184 - 218,581 Securitized real estate loans 10,260,057 (295) 31,358 10,291,120 2.3 42,473 104,900 - - 224,038 9,919,709 14,195,628 Fund quotas 1,687,446 13,484 - 1,700,930 0.3 1,700,930 - - - - - 2,148,564 Credit rights 215,937 - - 215,937 0.0 215,937 - - - - - 256,740 Fixed income 958,925 277 - 959,202 0.2 959,202 - - - - - 1,149,027 Variable income 512,584 13,207 - 525,791 0.1 525,791 - - - - - 742,797 Debentures 28,912,457 8,187 ( 179,807) 28,740,837 6.2 25,936 1,965,812 278,421 532,750 5,908,255 20,029,663 22,967,372 Eurobonds and others 6,624,251 ( 353) 24,914 6,648,812 1.4 832,889 1,523,124 556,100 769,175 952,979 2,014,545 6,356,310 Financial bills 2,150,587 (171) ( 43) 2,150,373 0.5 392,851 42,520 139,987 427,262 936,152 211,601 3,254,849 Promissory notes 1,280,867 - 14,821 1,295,688 0.3 7,315 89,321 12,412 621,915 214,946 349,779 1,134,682 Other 1,487,085 976 4,592 1,492,653 0.3 93,345 117,920 336,906 204,490 10,072 729,920 1,556,609 (1) 191,663,599 - - 191,663,599 41.3 191,663,599 - - - - - 174,240,724 PGBL / VGBL fund quotas Subtotal - securities 437,332,515 1,011,361 1,771,834 440,115,710 94.8 207,636,394 15,110,486 6,707,976 18,226,599 40,299,260 152,134,995 421,372,249 Trading securities 291,186,337 1,011,361 - 292,197,698 62.9 201,756,937 7,479,782 1,627,614 8,282,192 13,148,085 59,903,088 287,550,439 Available-for-sale securities 106,251,454 - 1,771,834 108,023,288 23.3 5,605,948 7,408,085 4,702,123 8,530,536 18,848,790 62,927,806 106,253,761 (2) 39,894,724 - - 39,894,724 8.6 273,509 222,619 378,239 1,413,871 8,302,385 29,304,101 27,568,049 Held-to-maturity securities Derivative financial instruments 23,965,273 15,652,888 8,312,385 - 5.2 4,225,795 2,054,521 1,575,368 3,354,476 3,631,710 9,123,403 29,794,833 Total securities and derivative financial instruments (assets) 452,985,403 9,323,746 1,771,834 464,080,983 100.0 211,862,189 17,165,007 8,283,344 21,581,075 43,930,970 161,258,398 451,167,082 Derivative financial instruments (liabilities) (19,206,291) (8,392,754) - ( 27,599,045) (3,172,213) ( 1,569,550) (1,651,327) (4,930,005) (7,146,367) ( 9,129,583) (34,355,410) (1) The PGBL and VGBL plans securities portfolios, the ownership and embedded risks of which are the customer’s responsibility, are recorded as securities – trading securities, with a counter-entry to long term liabilities in Pension Plan Technical Provisions account (Note 8a); (2) Unrecorded adjustment to market value in the amount of R$ 1,949,396 (R$ 1,203,105 at 03/31/2018), according to Note 5e. During the period ended March 31, 2019, ITAÚ UNIBANCO HOLDING CONSOLIDATED recognized R$ (274,116) (R$ (401,381) at 03/31/2018) of impairment losses, of which R$ (274,116) (R$ (281,828) at 03/31/2018) of available-for-sale financial assets and (R$ (119,553) at 03/31/2018) of held-to-maturity assets. The Securities and Derivative Financial Instruments totaled R$ 112,926 (R$ (228,292) at 03/31/2018). Itaú Unibanco Holding S.A. – Complete Financial Statements – March 31, 2019 76 Note 5 – Securities and derivative financial instruments (assets and liabilities) See below the composition by Securities and Derivatives type, maturity and portfolio already adjusted to their respective market values. a) Summary per maturity 03/31/2019 03/31/2018 Adjustment to market value Cost Market value % 0 - 30 31 - 90 91 - 180 181 - 365 366 - 720 Over 720 Market value Stockholders’ Results equity Government securities - domestic 152,514,043 975,064 2,050,310 155,539,417 33.4 2,790,182 7,070,228 1,173,096 10,648,800 22,431,149 111,425,962 160,618,513 Financial treasury bills 26,322,382 ( 263) (35) 26,322,084 5.7 - - - 1,121,154 6,656,414 18,544,516 41,583,873 National treasury bills 34,153,253 195,199 67,018 34,415,470 7.4 2,700,535 - 1,015,580 5,096,018 8,064,962 17,538,375 35,822,281 National treasury notes 57,502,578 653,272 1,608,315 59,764,165 12.8 10,476 7,070,228 118,413 138,912 2,220,405 50,205,731 52,440,128 National treasury/securitization 170,038 ( 232) 28,693 198,499 0.0 - - 143 33 66 198,257 218,524 Brazilian external debt bonds 34,365,792 127,088 346,319 34,839,199 7.5 79,171 - 38,960 4,292,683 5,489,302 24,939,083 30,553,707 30,212,544 28,454 ( 387,317) 29,853,681 6.5 3,901,879 3,834,263 3,950,766 4,427,925 9,079,209 4,659,639 27,819,651 Government securities - abroad Germany 22,105 - 4 22,109 0.0 - - - - 22,109 - - Argentina 1,418,440 26,925 ( 564) 1,444,801 0.3 1,161,799 146,687 59,939 40,410 26,891 9,075 846,601 Chile 7,546,113 (257) 6,372 7,552,228 1.6 779,653 1,305,593 76,845 1,178,405 2,418,840 1,792,892 8,968,769 Colombia 5,955,633 1,356 17,956 5,974,945 1.3 401,842 84,847 721,944 920,114 1,648,131 2,198,067 6,328,337 Korea 3,038,384 - - 3,038,384 0.7 - - - - 3,038,384 - 1,942,881 Denmark - - - - 0.0 - - - - - - 995,237 Spain 3,100,212 - 1 3,100,213 0.7 - 316,592 677,444 553,064 1,553,113 - 3,080,974 United States 2,286,877 ( 69) (12,139) 2,274,669 0.5 685,671 532,244 309,858 290,220 - 456,676 1,669,452 France 876,686 - (469) 876,217 0.2 - 547,250 328,967 - - - - Italy 111,336 - 394 111,730 0.0 - - 111,730 - - - - Mexico 3,218,343 314 ( 101,247) 3,117,410 0.7 378,741 400,544 1,378,947 931,849 282 27,047 1,315,299 Paraguay 1,788,451 1 ( 294,628) 1,493,824 0.3 383,332 379,619 190,481 266,196 216,701 57,495 1,677,558 Uruguay 838,579 104 ( 2,989) 835,694 0.2 108,992 120,887 94,611 241,385 154,725 115,094 992,602 Other 11,385 80 ( 8) 11,457 0.0 1,849 - - 6,282 33 3,293 1,941 Corporate securities 62,942,329 7,843 108,841 63,059,013 13.6 9,280,734 4,205,995 1,584,114 3,149,874 8,788,902 36,049,394 58,693,361 Shares 5,078,251 ( 13,913) 152,759 5,217,097 1.1 5,217,097 - - - - - 3,526,842 Rural product note 4,196,491 - 60,061 4,256,552 0.9 142,833 218,601 186,439 372,226 542,276 2,794,177 3,333,924 Bank deposit certificates 1,264,837 (72) 186 1,264,951 0.3 825,065 143,797 73,849 222,056 184 - 218,581 Securitized real estate loans 10,260,057 (295) 31,358 10,291,120 2.3 42,473 104,900 - - 224,038 9,919,709 14,195,628 Fund quotas 1,687,446 13,484 - 1,700,930 0.3 1,700,930 - - - - - 2,148,564 Credit rights 215,937 - - 215,937 0.0 215,937 - - - - - 256,740 Fixed income 958,925 277 - 959,202 0.2 959,202 - - - - - 1,149,027 Variable income 512,584 13,207 - 525,791 0.1 525,791 - - - - - 742,797 Debentures 28,912,457 8,187 ( 179,807) 28,740,837 6.2 25,936 1,965,812 278,421 532,750 5,908,255 20,029,663 22,967,372 Eurobonds and others 6,624,251 ( 353) 24,914 6,648,812 1.4 832,889 1,523,124 556,100 769,175 952,979 2,014,545 6,356,310 Financial bills 2,150,587 (171) ( 43) 2,150,373 0.5 392,851 42,520 139,987 427,262 936,152 211,601 3,254,849 Promissory notes 1,280,867 - 14,821 1,295,688 0.3 7,315 89,321 12,412 621,915 214,946 349,779 1,134,682 Other 1,487,085 976 4,592 1,492,653 0.3 93,345 117,920 336,906 204,490 10,072 729,920 1,556,609 (1) 191,663,599 - - 191,663,599 41.3 191,663,599 - - - - - 174,240,724 PGBL / VGBL fund quotas Subtotal - securities 437,332,515 1,011,361 1,771,834 440,115,710 94.8 207,636,394 15,110,486 6,707,976 18,226,599 40,299,260 152,134,995 421,372,249 Trading securities 291,186,337 1,011,361 - 292,197,698 62.9 201,756,937 7,479,782 1,627,614 8,282,192 13,148,085 59,903,088 287,550,439 Available-for-sale securities 106,251,454 - 1,771,834 108,023,288 23.3 5,605,948 7,408,085 4,702,123 8,530,536 18,848,790 62,927,806 106,253,761 (2) 39,894,724 - - 39,894,724 8.6 273,509 222,619 378,239 1,413,871 8,302,385 29,304,101 27,568,049 Held-to-maturity securities Derivative financial instruments 23,965,273 15,652,888 8,312,385 - 5.2 4,225,795 2,054,521 1,575,368 3,354,476 3,631,710 9,123,403 29,794,833 Total securities and derivative financial instruments (assets) 452,985,403 9,323,746 1,771,834 464,080,983 100.0 211,862,189 17,165,007 8,283,344 21,581,075 43,930,970 161,258,398 451,167,082 Derivative financial instruments (liabilities) (19,206,291) (8,392,754) - ( 27,599,045) (3,172,213) ( 1,569,550) (1,651,327) (4,930,005) (7,146,367) ( 9,129,583) (34,355,410) (1) The PGBL and VGBL plans securities portfolios, the ownership and embedded risks of which are the customer’s responsibility, are recorded as securities – trading securities, with a counter-entry to long term liabilities in Pension Plan Technical Provisions account (Note 8a); (2) Unrecorded adjustment to market value in the amount of R$ 1,949,396 (R$ 1,203,105 at 03/31/2018), according to Note 5e. During the period ended March 31, 2019, ITAÚ UNIBANCO HOLDING CONSOLIDATED recognized R$ (274,116) (R$ (401,381) at 03/31/2018) of impairment losses, of which R$ (274,116) (R$ (281,828) at 03/31/2018) of available-for-sale financial assets and (R$ (119,553) at 03/31/2018) of held-to-maturity assets. The Securities and Derivative Financial Instruments totaled R$ 112,926 (R$ (228,292) at 03/31/2018). Itaú Unibanco Holding S.A. – Complete Financial Statements – March 31, 2019 76
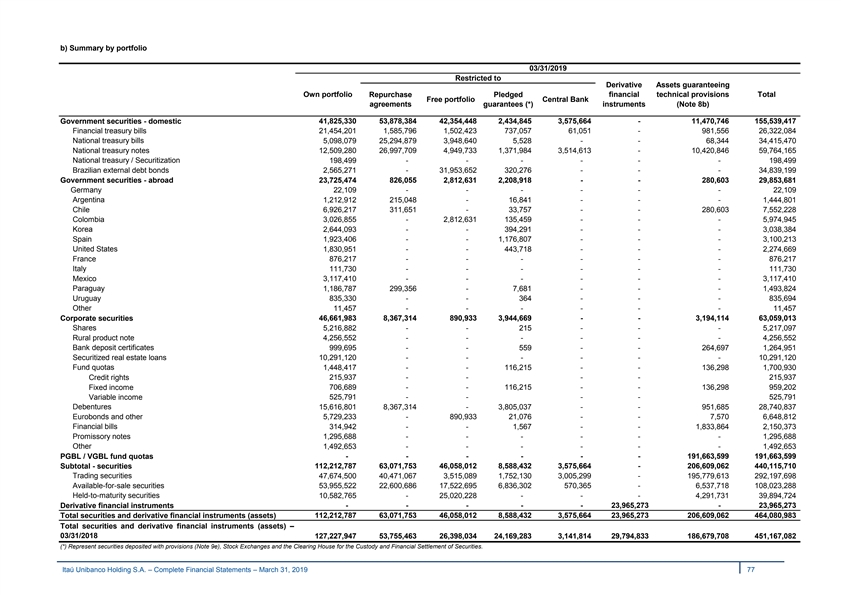
b) Summary by portfolio 03/31/2019 Restricted to Derivative Assets guaranteeing Own portfolio Repurchase Pledged financial technical provisions Total Free portfolio Central Bank instruments (Note 8b) agreements guarantees (*) 41,825,330 53,878,384 42,354,448 2,434,845 3,575,664 - 11,470,746 155,539,417 Government securities - domestic Financial treasury bills 21,454,201 1,585,796 1,502,423 737,057 61,051 - 981,556 26,322,084 National treasury bills 5,098,079 25,294,879 3,948,640 5,528 - - 68,344 34,415,470 National treasury notes 12,509,280 26,997,709 4,949,733 1,371,984 3,514,613 - 10,420,846 59,764,165 National treasury / Securitization 198,499 - - - - - - 198,499 Brazilian external debt bonds 2,565,271 - 31,953,652 320,276 - - - 34,839,199 23,725,474 826,055 2,812,631 2,208,918 - - 280,603 29,853,681 Government securities - abroad Germany 22,109 - - - - - - 22,109 Argentina 1,212,912 215,048 - 16,841 - - - 1,444,801 Chile 6,926,217 311,651 - 33,757 - - 280,603 7,552,228 Colombia 3,026,855 - 2,812,631 135,459 - - - 5,974,945 Korea 2,644,093 - - 394,291 - - - 3,038,384 Spain 1,923,406 - - 1,176,807 - - - 3,100,213 United States 1,830,951 - - 443,718 - - - 2,274,669 France 876,217 - - - - - - 876,217 Italy 111,730 - - - - - - 111,730 Mexico 3,117,410 - - - - - - 3,117,410 Paraguay 1,186,787 299,356 - 7,681 - - - 1,493,824 Uruguay 835,330 - - 364 - - - 835,694 Other 11,457 - - - - - - 11,457 Corporate securities 46,661,983 8,367,314 890,933 3,944,669 - - 3,194,114 63,059,013 Shares 5,216,882 - - 215 - - - 5,217,097 Rural product note 4,256,552 - - - - - - 4,256,552 Bank deposit certificates 999,695 - - 559 - - 264,697 1,264,951 Securitized real estate loans 10,291,120 - - - - - - 10,291,120 Fund quotas 1,448,417 - - 116,215 - - 136,298 1,700,930 Credit rights 215,937 - - - - 215,937 Fixed income 706,689 - - 116,215 - - 136,298 959,202 Variable income 525,791 - - - - 525,791 Debentures 15,616,801 8,367,314 - 3,805,037 - - 951,685 28,740,837 Eurobonds and other 5,729,233 - 890,933 21,076 - - 7,570 6,648,812 Financial bills 314,942 - - 1,567 - - 1,833,864 2,150,373 Promissory notes 1,295,688 - - - - - - 1,295,688 Other 1,492,653 - - - - - - 1,492,653 PGBL / VGBL fund quotas - - - - - - 191,663,599 191,663,599 Subtotal - securities 112,212,787 63,071,753 46,058,012 8,588,432 3,575,664 - 206,609,062 440,115,710 Trading securities 47,674,500 40,471,067 3,515,089 1,752,130 3,005,299 - 195,779,613 292,197,698 Available-for-sale securities 53,955,522 22,600,686 17,522,695 6,836,302 570,365 - 6,537,718 108,023,288 Held-to-maturity securities 10,582,765 - 25,020,228 - - - 4,291,731 39,894,724 Derivative financial instruments - - - - - 23,965,273 - 23,965,273 Total securities and derivative financial instruments (assets) 112,212,787 63,071,753 46,058,012 8,588,432 3,575,664 23,965,273 206,609,062 464,080,983 Total securities and derivative financial instruments (assets) – 03/31/2018 127,227,947 53,755,463 26,398,034 24,169,283 3,141,814 29,794,833 186,679,708 451,167,082 (*) Represent securities deposited with provisions (Note 9e), Stock Exchanges and the Clearing House for the Custody and Financial Settlement of Securities. Itaú Unibanco Holding S.A. – Complete Financial Statements – March 31, 2019 77 b) Summary by portfolio 03/31/2019 Restricted to Derivative Assets guaranteeing Own portfolio Repurchase Pledged financial technical provisions Total Free portfolio Central Bank instruments (Note 8b) agreements guarantees (*) 41,825,330 53,878,384 42,354,448 2,434,845 3,575,664 - 11,470,746 155,539,417 Government securities - domestic Financial treasury bills 21,454,201 1,585,796 1,502,423 737,057 61,051 - 981,556 26,322,084 National treasury bills 5,098,079 25,294,879 3,948,640 5,528 - - 68,344 34,415,470 National treasury notes 12,509,280 26,997,709 4,949,733 1,371,984 3,514,613 - 10,420,846 59,764,165 National treasury / Securitization 198,499 - - - - - - 198,499 Brazilian external debt bonds 2,565,271 - 31,953,652 320,276 - - - 34,839,199 23,725,474 826,055 2,812,631 2,208,918 - - 280,603 29,853,681 Government securities - abroad Germany 22,109 - - - - - - 22,109 Argentina 1,212,912 215,048 - 16,841 - - - 1,444,801 Chile 6,926,217 311,651 - 33,757 - - 280,603 7,552,228 Colombia 3,026,855 - 2,812,631 135,459 - - - 5,974,945 Korea 2,644,093 - - 394,291 - - - 3,038,384 Spain 1,923,406 - - 1,176,807 - - - 3,100,213 United States 1,830,951 - - 443,718 - - - 2,274,669 France 876,217 - - - - - - 876,217 Italy 111,730 - - - - - - 111,730 Mexico 3,117,410 - - - - - - 3,117,410 Paraguay 1,186,787 299,356 - 7,681 - - - 1,493,824 Uruguay 835,330 - - 364 - - - 835,694 Other 11,457 - - - - - - 11,457 Corporate securities 46,661,983 8,367,314 890,933 3,944,669 - - 3,194,114 63,059,013 Shares 5,216,882 - - 215 - - - 5,217,097 Rural product note 4,256,552 - - - - - - 4,256,552 Bank deposit certificates 999,695 - - 559 - - 264,697 1,264,951 Securitized real estate loans 10,291,120 - - - - - - 10,291,120 Fund quotas 1,448,417 - - 116,215 - - 136,298 1,700,930 Credit rights 215,937 - - - - 215,937 Fixed income 706,689 - - 116,215 - - 136,298 959,202 Variable income 525,791 - - - - 525,791 Debentures 15,616,801 8,367,314 - 3,805,037 - - 951,685 28,740,837 Eurobonds and other 5,729,233 - 890,933 21,076 - - 7,570 6,648,812 Financial bills 314,942 - - 1,567 - - 1,833,864 2,150,373 Promissory notes 1,295,688 - - - - - - 1,295,688 Other 1,492,653 - - - - - - 1,492,653 PGBL / VGBL fund quotas - - - - - - 191,663,599 191,663,599 Subtotal - securities 112,212,787 63,071,753 46,058,012 8,588,432 3,575,664 - 206,609,062 440,115,710 Trading securities 47,674,500 40,471,067 3,515,089 1,752,130 3,005,299 - 195,779,613 292,197,698 Available-for-sale securities 53,955,522 22,600,686 17,522,695 6,836,302 570,365 - 6,537,718 108,023,288 Held-to-maturity securities 10,582,765 - 25,020,228 - - - 4,291,731 39,894,724 Derivative financial instruments - - - - - 23,965,273 - 23,965,273 Total securities and derivative financial instruments (assets) 112,212,787 63,071,753 46,058,012 8,588,432 3,575,664 23,965,273 206,609,062 464,080,983 Total securities and derivative financial instruments (assets) – 03/31/2018 127,227,947 53,755,463 26,398,034 24,169,283 3,141,814 29,794,833 186,679,708 451,167,082 (*) Represent securities deposited with provisions (Note 9e), Stock Exchanges and the Clearing House for the Custody and Financial Settlement of Securities. Itaú Unibanco Holding S.A. – Complete Financial Statements – March 31, 2019 77

c) Trading securities See below the composition of the portfolio of trading securities by type, stated at cost and market value and by maturity term. 03/31/2019 03/31/2018 Adjustment to Cost market value Market value % 0 - 30 31 - 90 91 - 180 181 - 365 366 - 720 Over 720 days Market value (in results) Government securities - domestic 86,343,525 975,064 87,318,589 29.8 2,711,011 6,976,866 1,134,136 7,261,513 11,313,646 57,921,417 101,785,976 Financial treasury bills 26,083,038 ( 263) 26,082,775 8.9 - - - 898,755 6,655,572 18,528,448 41,358,855 National treasury bills 23,098,284 195,199 23,293,483 8.0 2,700,535 - 1,015,580 3,950,796 2,414,401 13,212,171 23,549,036 National treasury notes 32,800,750 653,272 33,454,022 11.4 10,476 6,976,866 118,413 138,912 2,154,729 24,054,626 31,425,273 National treasury / Securitization 573 ( 232) 341 0.0 - - 143 33 66 99 577 Brazilian external debt bonds 4,360,880 127,088 4,487,968 1.5 - - - 2,273,017 88,878 2,126,073 5,452,235 Government securities - abroad 2,637,728 28,454 2,666,182 0.9 1,270,702 36,704 220,689 334,205 339,537 464,345 1,256,432 Argentina 1,274,949 26,925 1,301,874 0.5 1,161,565 3,994 59,939 40,410 26,891 9,075 812,781 Chile 539,427 ( 257) 539,170 0.2 36,723 8,015 15,659 - 281,703 197,070 121,418 Colombia 562,309 1,356 563,665 0.2 48,537 - - 276,502 17,565 221,061 28,773 United States 117,226 (69) 117,157 0.0 - - 117,157 - - - 100,092 Mexico 27,040 314 27,354 0.0 - - - 25 282 27,047 6,917 Paraguay 1,261 1 1,262 0.0 - - - - - 1,262 4,954 Uruguay 104,393 104 104,497 0.0 22,028 24,695 27,934 10,986 13,096 5,758 179,770 Other 11,123 80 11,203 0.0 1,849 - - 6,282 - 3,072 1,727 Corporate securities 10,541,485 7,843 10,549,328 3.7 6,111,625 466,212 272,789 686,474 1,494,902 1,517,326 10,267,307 Shares 3,859,639 (13,913) 3,845,726 1.4 3,845,726 - - - - - 3,030,799 Bank deposit certificates 280,931 ( 72) 280,859 0.1 128,924 2,728 70,319 78,704 184 - 61,114 Securitized real estate loans 13,126 ( 295) 12,831 0.0 - - - - - 12,831 56,904 Fund quotas 1,487,182 13,484 1,500,666 0.6 1,500,666 - - - - - 1,851,878 Credit rights 215,937 - 215,937 0.1 215,937 - - - - - 256,740 Fixed income 758,661 277 758,938 0.3 758,938 - - - - - 852,341 Variable income 512,584 13,207 525,791 0.2 525,791 - - - - - 742,797 Debentures 1,558,039 8,187 1,566,226 0.5 - 23,314 69,814 72,260 497,720 903,118 1,721,718 Eurobonds and other 1,275,619 ( 353) 1,275,266 0.4 242,246 397,449 20,973 106,777 55,117 452,704 748,122 Financial bills 2,022,184 (171) 2,022,013 0.7 392,851 42,520 111,633 427,262 936,152 111,595 2,657,156 Promissory notes - - - 0.0 - - - - - - 38,309 Other 44,765 976 45,741 0.0 1,212 201 50 1,471 5,729 37,078 101,307 PGBL / VGBL fund quotas 191,663,599 - 191,663,599 65.6 191,663,599 - - - - - 174,240,724 Total 291,186,337 1,011,361 292,197,698 100.0 201,756,937 7,479,782 1,627,614 8,282,192 13,148,085 59,903,088 287,550,439 % per maturity term 69.0 2.6 0.6 2.8 4.5 20.5 Total – 03/31/2018 286,941,331 609,108 287,550,439 100.0 181,784,637 628,673 10,708,788 4,243,450 5,401,452 84,783,439 % per maturity term 63.2 0.2 3.7 1.5 1.9 29.5 At 03/31/2019, ITAÚ UNIBANCO HOLDING’s portfolio is composed of Fund quotas fixed income without maturity (R$ 5,547 at 03/31/2018), National treasury bills in the amount of R$ 4,143,893 over 365 days (R$ 3,748,617 at 03/31/2018) and National trasury notes in the amount of R$ 6,868,214 over 365 days (R$ 6,756,772 at 03/31/2018). Itaú Unibanco Holding S.A. – Complete Financial Statements – March 31, 2019 78 c) Trading securities See below the composition of the portfolio of trading securities by type, stated at cost and market value and by maturity term. 03/31/2019 03/31/2018 Adjustment to Cost market value Market value % 0 - 30 31 - 90 91 - 180 181 - 365 366 - 720 Over 720 days Market value (in results) Government securities - domestic 86,343,525 975,064 87,318,589 29.8 2,711,011 6,976,866 1,134,136 7,261,513 11,313,646 57,921,417 101,785,976 Financial treasury bills 26,083,038 ( 263) 26,082,775 8.9 - - - 898,755 6,655,572 18,528,448 41,358,855 National treasury bills 23,098,284 195,199 23,293,483 8.0 2,700,535 - 1,015,580 3,950,796 2,414,401 13,212,171 23,549,036 National treasury notes 32,800,750 653,272 33,454,022 11.4 10,476 6,976,866 118,413 138,912 2,154,729 24,054,626 31,425,273 National treasury / Securitization 573 ( 232) 341 0.0 - - 143 33 66 99 577 Brazilian external debt bonds 4,360,880 127,088 4,487,968 1.5 - - - 2,273,017 88,878 2,126,073 5,452,235 Government securities - abroad 2,637,728 28,454 2,666,182 0.9 1,270,702 36,704 220,689 334,205 339,537 464,345 1,256,432 Argentina 1,274,949 26,925 1,301,874 0.5 1,161,565 3,994 59,939 40,410 26,891 9,075 812,781 Chile 539,427 ( 257) 539,170 0.2 36,723 8,015 15,659 - 281,703 197,070 121,418 Colombia 562,309 1,356 563,665 0.2 48,537 - - 276,502 17,565 221,061 28,773 United States 117,226 (69) 117,157 0.0 - - 117,157 - - - 100,092 Mexico 27,040 314 27,354 0.0 - - - 25 282 27,047 6,917 Paraguay 1,261 1 1,262 0.0 - - - - - 1,262 4,954 Uruguay 104,393 104 104,497 0.0 22,028 24,695 27,934 10,986 13,096 5,758 179,770 Other 11,123 80 11,203 0.0 1,849 - - 6,282 - 3,072 1,727 Corporate securities 10,541,485 7,843 10,549,328 3.7 6,111,625 466,212 272,789 686,474 1,494,902 1,517,326 10,267,307 Shares 3,859,639 (13,913) 3,845,726 1.4 3,845,726 - - - - - 3,030,799 Bank deposit certificates 280,931 ( 72) 280,859 0.1 128,924 2,728 70,319 78,704 184 - 61,114 Securitized real estate loans 13,126 ( 295) 12,831 0.0 - - - - - 12,831 56,904 Fund quotas 1,487,182 13,484 1,500,666 0.6 1,500,666 - - - - - 1,851,878 Credit rights 215,937 - 215,937 0.1 215,937 - - - - - 256,740 Fixed income 758,661 277 758,938 0.3 758,938 - - - - - 852,341 Variable income 512,584 13,207 525,791 0.2 525,791 - - - - - 742,797 Debentures 1,558,039 8,187 1,566,226 0.5 - 23,314 69,814 72,260 497,720 903,118 1,721,718 Eurobonds and other 1,275,619 ( 353) 1,275,266 0.4 242,246 397,449 20,973 106,777 55,117 452,704 748,122 Financial bills 2,022,184 (171) 2,022,013 0.7 392,851 42,520 111,633 427,262 936,152 111,595 2,657,156 Promissory notes - - - 0.0 - - - - - - 38,309 Other 44,765 976 45,741 0.0 1,212 201 50 1,471 5,729 37,078 101,307 PGBL / VGBL fund quotas 191,663,599 - 191,663,599 65.6 191,663,599 - - - - - 174,240,724 Total 291,186,337 1,011,361 292,197,698 100.0 201,756,937 7,479,782 1,627,614 8,282,192 13,148,085 59,903,088 287,550,439 % per maturity term 69.0 2.6 0.6 2.8 4.5 20.5 Total – 03/31/2018 286,941,331 609,108 287,550,439 100.0 181,784,637 628,673 10,708,788 4,243,450 5,401,452 84,783,439 % per maturity term 63.2 0.2 3.7 1.5 1.9 29.5 At 03/31/2019, ITAÚ UNIBANCO HOLDING’s portfolio is composed of Fund quotas fixed income without maturity (R$ 5,547 at 03/31/2018), National treasury bills in the amount of R$ 4,143,893 over 365 days (R$ 3,748,617 at 03/31/2018) and National trasury notes in the amount of R$ 6,868,214 over 365 days (R$ 6,756,772 at 03/31/2018). Itaú Unibanco Holding S.A. – Complete Financial Statements – March 31, 2019 78
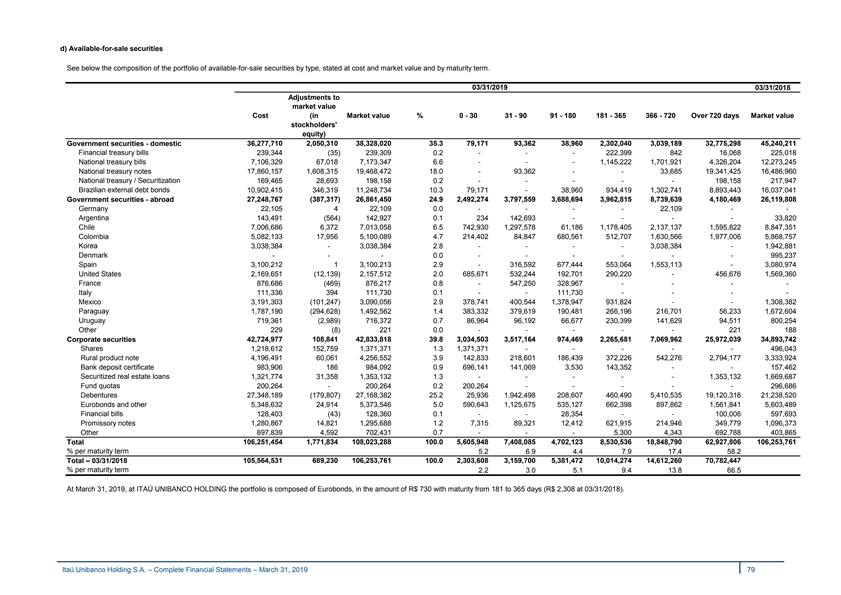
d) Available-for-sale securities See below the composition of the portfolio of available-for-sale securities by type, stated at cost and market value and by maturity term. 03/31/2019 03/31/2018 Adjustments to market value Cost (in Market value % 0 - 30 31 - 90 91 - 180 181 - 365 366 - 720 Over 720 days Market value stockholders' equity) Government securities - domestic 36,277,710 2,050,310 38,328,020 35.3 79,171 93,362 38,960 2,302,040 3,039,189 32,775,298 45,240,211 Financial treasury bills 239,344 ( 35) 239,309 0.2 - - - 222,399 842 16,068 225,018 National treasury bills 7,106,329 67,018 7,173,347 6.6 - - - 1,145,222 1,701,921 4,326,204 12,273,245 National treasury notes 17,860,157 1,608,315 19,468,472 18.0 - 93,362 - - 33,685 19,341,425 16,486,960 National treasury / Securitization 169,465 28,693 198,158 0.2 - - - - - 198,158 217,947 Brazilian external debt bonds 10,902,415 346,319 11,248,734 10.3 79,171 - 38,960 934,419 1,302,741 8,893,443 16,037,041 Government securities - abroad 27,248,767 ( 387,317) 26,861,450 24.9 2,492,274 3,797,559 3,688,694 3,962,815 8,739,639 4,180,469 26,119,808 Germany 22,105 4 22,109 0.0 - - - - 22,109 - - Argentina 143,491 ( 564) 142,927 0.1 234 142,693 - - - - 33,820 Chile 7,006,686 6,372 7,013,058 6.5 742,930 1,297,578 61,186 1,178,405 2,137,137 1,595,822 8,847,351 Colombia 5,082,133 17,956 5,100,089 4.7 214,402 84,847 680,561 512,707 1,630,566 1,977,006 5,868,757 Korea 3,038,384 - 3,038,384 2.8 - - - - 3,038,384 - 1,942,881 Denmark - - - 0.0 - - - - - - 995,237 Spain 3,100,212 1 3,100,213 2.9 - 316,592 677,444 553,064 1,553,113 - 3,080,974 United States 2,169,651 (12,139) 2,157,512 2.0 685,671 532,244 192,701 290,220 - 456,676 1,569,360 France 876,686 ( 469) 876,217 0.8 - 547,250 328,967 - - - - Italy 111,336 394 111,730 0.1 - - 111,730 - - - - Mexico 3,191,303 ( 101,247) 3,090,056 2.9 378,741 400,544 1,378,947 931,824 - - 1,308,382 Paraguay 1,787,190 ( 294,628) 1,492,562 1.4 383,332 379,619 190,481 266,196 216,701 56,233 1,672,604 Uruguay 719,361 (2,989) 716,372 0.7 86,964 96,192 66,677 230,399 141,629 94,511 800,254 Other 229 ( 8) 221 0.0 - - - - - 221 188 Corporate securities 42,724,977 108,841 42,833,818 39.8 3,034,503 3,517,164 974,469 2,265,681 7,069,962 25,972,039 34,893,742 Shares 1,218,612 152,759 1,371,371 1.3 1,371,371 - - - - - 496,043 Rural product note 4,196,491 60,061 4,256,552 3.9 142,833 218,601 186,439 372,226 542,276 2,794,177 3,333,924 Bank deposit certificate 983,906 186 984,092 0.9 696,141 141,069 3,530 143,352 - - 157,462 Securitized real estate loans 1,321,774 31,358 1,353,132 1.3 - - - - - 1,353,132 1,669,687 Fund quotas 200,264 - 200,264 0.2 200,264 - - - - - 296,686 Debentures 27,348,189 (179,807) 27,168,382 25.2 25,936 1,942,498 208,607 460,490 5,410,535 19,120,316 21,238,520 Eurobonds and other 5,348,632 24,914 5,373,546 5.0 590,643 1,125,675 535,127 662,398 897,862 1,561,841 5,603,489 Financial bills 128,403 (43) 128,360 0.1 - - 28,354 - - 100,006 597,693 Promissory notes 1,280,867 14,821 1,295,688 1.2 7,315 89,321 12,412 621,915 214,946 349,779 1,096,373 Other 697,839 4,592 702,431 0.7 - - - 5,300 4,343 692,788 403,865 Total 106,251,454 1,771,834 108,023,288 100.0 5,605,948 7,408,085 4,702,123 8,530,536 18,848,790 62,927,806 106,253,761 % per maturity term 5.2 6.9 4.4 7.9 17.4 58.2 Total – 03/31/2018 105,564,531 689,230 106,253,761 100.0 2,303,608 3,159,700 5,381,472 10,014,274 14,612,260 70,782,447 % per maturity term 2.2 3.0 5.1 9.4 13.8 66.5 At March 31, 2019, at ITAÚ UNIBANCO HOLDING the portfolio is composed of Eurobonds, in the amount of R$ 730 with maturity from 181 to 365 days (R$ 2,308 at 03/31/2018). Itaú Unibanco Holding S.A. – Complete Financial Statements – March 31, 2019 79 d) Available-for-sale securities See below the composition of the portfolio of available-for-sale securities by type, stated at cost and market value and by maturity term. 03/31/2019 03/31/2018 Adjustments to market value Cost (in Market value % 0 - 30 31 - 90 91 - 180 181 - 365 366 - 720 Over 720 days Market value stockholders' equity) Government securities - domestic 36,277,710 2,050,310 38,328,020 35.3 79,171 93,362 38,960 2,302,040 3,039,189 32,775,298 45,240,211 Financial treasury bills 239,344 ( 35) 239,309 0.2 - - - 222,399 842 16,068 225,018 National treasury bills 7,106,329 67,018 7,173,347 6.6 - - - 1,145,222 1,701,921 4,326,204 12,273,245 National treasury notes 17,860,157 1,608,315 19,468,472 18.0 - 93,362 - - 33,685 19,341,425 16,486,960 National treasury / Securitization 169,465 28,693 198,158 0.2 - - - - - 198,158 217,947 Brazilian external debt bonds 10,902,415 346,319 11,248,734 10.3 79,171 - 38,960 934,419 1,302,741 8,893,443 16,037,041 Government securities - abroad 27,248,767 ( 387,317) 26,861,450 24.9 2,492,274 3,797,559 3,688,694 3,962,815 8,739,639 4,180,469 26,119,808 Germany 22,105 4 22,109 0.0 - - - - 22,109 - - Argentina 143,491 ( 564) 142,927 0.1 234 142,693 - - - - 33,820 Chile 7,006,686 6,372 7,013,058 6.5 742,930 1,297,578 61,186 1,178,405 2,137,137 1,595,822 8,847,351 Colombia 5,082,133 17,956 5,100,089 4.7 214,402 84,847 680,561 512,707 1,630,566 1,977,006 5,868,757 Korea 3,038,384 - 3,038,384 2.8 - - - - 3,038,384 - 1,942,881 Denmark - - - 0.0 - - - - - - 995,237 Spain 3,100,212 1 3,100,213 2.9 - 316,592 677,444 553,064 1,553,113 - 3,080,974 United States 2,169,651 (12,139) 2,157,512 2.0 685,671 532,244 192,701 290,220 - 456,676 1,569,360 France 876,686 ( 469) 876,217 0.8 - 547,250 328,967 - - - - Italy 111,336 394 111,730 0.1 - - 111,730 - - - - Mexico 3,191,303 ( 101,247) 3,090,056 2.9 378,741 400,544 1,378,947 931,824 - - 1,308,382 Paraguay 1,787,190 ( 294,628) 1,492,562 1.4 383,332 379,619 190,481 266,196 216,701 56,233 1,672,604 Uruguay 719,361 (2,989) 716,372 0.7 86,964 96,192 66,677 230,399 141,629 94,511 800,254 Other 229 ( 8) 221 0.0 - - - - - 221 188 Corporate securities 42,724,977 108,841 42,833,818 39.8 3,034,503 3,517,164 974,469 2,265,681 7,069,962 25,972,039 34,893,742 Shares 1,218,612 152,759 1,371,371 1.3 1,371,371 - - - - - 496,043 Rural product note 4,196,491 60,061 4,256,552 3.9 142,833 218,601 186,439 372,226 542,276 2,794,177 3,333,924 Bank deposit certificate 983,906 186 984,092 0.9 696,141 141,069 3,530 143,352 - - 157,462 Securitized real estate loans 1,321,774 31,358 1,353,132 1.3 - - - - - 1,353,132 1,669,687 Fund quotas 200,264 - 200,264 0.2 200,264 - - - - - 296,686 Debentures 27,348,189 (179,807) 27,168,382 25.2 25,936 1,942,498 208,607 460,490 5,410,535 19,120,316 21,238,520 Eurobonds and other 5,348,632 24,914 5,373,546 5.0 590,643 1,125,675 535,127 662,398 897,862 1,561,841 5,603,489 Financial bills 128,403 (43) 128,360 0.1 - - 28,354 - - 100,006 597,693 Promissory notes 1,280,867 14,821 1,295,688 1.2 7,315 89,321 12,412 621,915 214,946 349,779 1,096,373 Other 697,839 4,592 702,431 0.7 - - - 5,300 4,343 692,788 403,865 Total 106,251,454 1,771,834 108,023,288 100.0 5,605,948 7,408,085 4,702,123 8,530,536 18,848,790 62,927,806 106,253,761 % per maturity term 5.2 6.9 4.4 7.9 17.4 58.2 Total – 03/31/2018 105,564,531 689,230 106,253,761 100.0 2,303,608 3,159,700 5,381,472 10,014,274 14,612,260 70,782,447 % per maturity term 2.2 3.0 5.1 9.4 13.8 66.5 At March 31, 2019, at ITAÚ UNIBANCO HOLDING the portfolio is composed of Eurobonds, in the amount of R$ 730 with maturity from 181 to 365 days (R$ 2,308 at 03/31/2018). Itaú Unibanco Holding S.A. – Complete Financial Statements – March 31, 2019 79
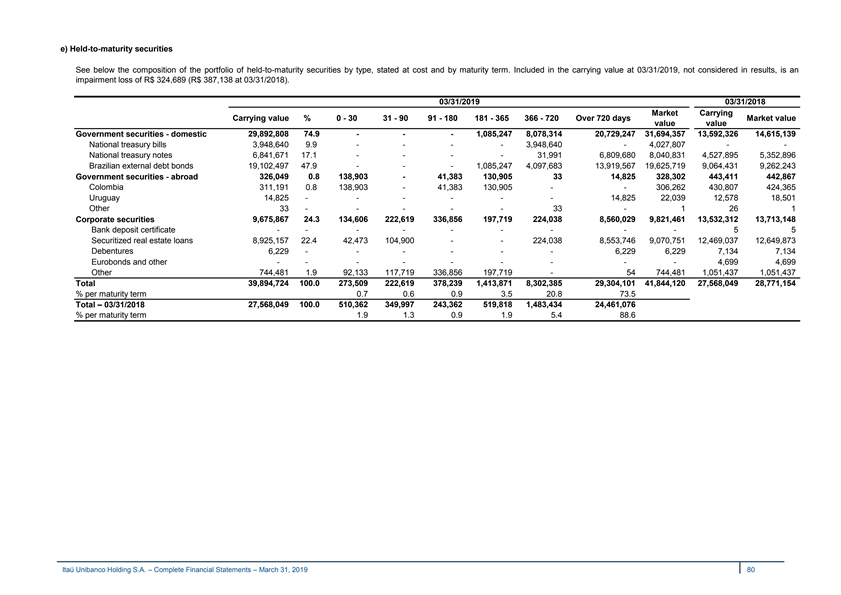
e) Held-to-maturity securities See below the composition of the portfolio of held-to-maturity securities by type, stated at cost and by maturity term. Included in the carrying value at 03/31/2019, not considered in results, is an impairment loss of R$ 324,689 (R$ 387,138 at 03/31/2018). 03/31/2019 03/31/2018 Market Carrying Carrying value % 0 - 30 31 - 90 91 - 180 181 - 365 366 - 720 Over 720 days Market value value value 29,892,808 74.9 - - - 1,085,247 8,078,314 20,729,247 31,694,357 13,592,326 14,615,139 Government securities - domestic National treasury bills 3,948,640 9.9 - - - - 3,948,640 - 4,027,807 - - National treasury notes 6,841,671 17.1 - - - - 31,991 6,809,680 8,040,831 4,527,895 5,352,896 Brazilian external debt bonds 19,102,497 47.9 - - - 1,085,247 4,097,683 13,919,567 19,625,719 9,064,431 9,262,243 Government securities - abroad 326,049 0.8 138,903 - 41,383 130,905 33 14,825 328,302 443,411 442,867 Colombia 311,191 0.8 138,903 - 41,383 130,905 - - 306,262 430,807 424,365 Uruguay 14,825 - - - - - - 14,825 22,039 12,578 18,501 Other 33 - - - - - 33 - 1 26 1 Corporate securities 9,675,867 24.3 134,606 222,619 336,856 197,719 224,038 8,560,029 9,821,461 13,532,312 13,713,148 Bank deposit certificate - - - - - - - - - 5 5 Securitized real estate loans 8,925,157 22.4 42,473 104,900 - - 224,038 8,553,746 9,070,751 12,469,037 12,649,873 Debentures 6,229 - - - - - - 6,229 6,229 7,134 7,134 Eurobonds and other - - - - - - - - - 4,699 4,699 Other 744,481 1.9 92,133 117,719 336,856 197,719 - 54 744,481 1,051,437 1,051,437 Total 39,894,724 100.0 273,509 222,619 378,239 1,413,871 8,302,385 29,304,101 41,844,120 27,568,049 28,771,154 % per maturity term 0.7 0.6 0.9 3.5 20.8 73.5 Total – 03/31/2018 27,568,049 100.0 510,362 349,997 243,362 519,818 1,483,434 24,461,076 % per maturity term 1.9 1.3 0.9 1.9 5.4 88.6 Itaú Unibanco Holding S.A. – Complete Financial Statements – March 31, 2019 80 e) Held-to-maturity securities See below the composition of the portfolio of held-to-maturity securities by type, stated at cost and by maturity term. Included in the carrying value at 03/31/2019, not considered in results, is an impairment loss of R$ 324,689 (R$ 387,138 at 03/31/2018). 03/31/2019 03/31/2018 Market Carrying Carrying value % 0 - 30 31 - 90 91 - 180 181 - 365 366 - 720 Over 720 days Market value value value 29,892,808 74.9 - - - 1,085,247 8,078,314 20,729,247 31,694,357 13,592,326 14,615,139 Government securities - domestic National treasury bills 3,948,640 9.9 - - - - 3,948,640 - 4,027,807 - - National treasury notes 6,841,671 17.1 - - - - 31,991 6,809,680 8,040,831 4,527,895 5,352,896 Brazilian external debt bonds 19,102,497 47.9 - - - 1,085,247 4,097,683 13,919,567 19,625,719 9,064,431 9,262,243 Government securities - abroad 326,049 0.8 138,903 - 41,383 130,905 33 14,825 328,302 443,411 442,867 Colombia 311,191 0.8 138,903 - 41,383 130,905 - - 306,262 430,807 424,365 Uruguay 14,825 - - - - - - 14,825 22,039 12,578 18,501 Other 33 - - - - - 33 - 1 26 1 Corporate securities 9,675,867 24.3 134,606 222,619 336,856 197,719 224,038 8,560,029 9,821,461 13,532,312 13,713,148 Bank deposit certificate - - - - - - - - - 5 5 Securitized real estate loans 8,925,157 22.4 42,473 104,900 - - 224,038 8,553,746 9,070,751 12,469,037 12,649,873 Debentures 6,229 - - - - - - 6,229 6,229 7,134 7,134 Eurobonds and other - - - - - - - - - 4,699 4,699 Other 744,481 1.9 92,133 117,719 336,856 197,719 - 54 744,481 1,051,437 1,051,437 Total 39,894,724 100.0 273,509 222,619 378,239 1,413,871 8,302,385 29,304,101 41,844,120 27,568,049 28,771,154 % per maturity term 0.7 0.6 0.9 3.5 20.8 73.5 Total – 03/31/2018 27,568,049 100.0 510,362 349,997 243,362 519,818 1,483,434 24,461,076 % per maturity term 1.9 1.3 0.9 1.9 5.4 88.6 Itaú Unibanco Holding S.A. – Complete Financial Statements – March 31, 2019 80
f) Derivative financial instruments ITAÚ UNIBANCO HOLDING CONSOLIDATED enters into derivative financial instruments with various counterparties to manage its overall exposures and to assist its customers in managing their own exposures. Futures – Interest rate and foreign currency futures contracts are commitments to buy or sell a financial instrument at a future date, at a contracted price or yield and may be settled in cash or through delivery. The notional amount represents the face value of the underlying instrument. Commodity futures contracts or financial instruments are commitments to buy or sell commodities (mainly gold, coffee and orange juice), at a future date, at a contracted price, which are settled in cash. The notional amount represents the quantity of such commodities multiplied by the future price at the contract date. Daily cash settlements of price movements are made for all instruments. Forwards – Interest forward contracts are agreements to exchange payments on a specified future date, based on a market change in interest rates from trade date to contract settlement date. Foreign exchange forward contracts represent agreements to exchange the currency of one country for the currency of another country at an agreed price, at an agreed settlement date. Financial instrument forward contracts are commitments to buy or sell a financial instrument on a future date at a contracted price and are settled in cash. Swaps – Interest rate and foreign exchange swap contracts are commitments to settle in cash at a future date or dates, based on differentials between specified financial indices (either two different interest rates in a single currency or two different rates each in a different currency), as applied to a notional principal amount. Swap contracts presented in Other in the table below correspond substantially to inflation rate swap contracts. Options – Option contracts give the purchaser, for a fee, the right, but not the obligation, to buy or sell within a limited time a financial instrument including a flow of interest, foreign currencies, commodities, or financial instruments at a contracted price that may also be settled in cash, based on differentials between specific indices. Credit Derivatives – Credit derivatives are financial instruments with value relating to the credit risk associated to the debt issued by a third party (the reference entity), which permits that one party (the purchaser of the hedge) transfers the risk to the counterparty (the seller of the hedge). The seller of the hedge should make payments as set forth in the contract when the reference entity undergoes a credit event, such as bankruptcy, default or debt restructuring. The seller of the hedge receives a premium for the hedge, but, on the other hand, assumes the risk that the underlying asset referenced in the contract undergoes a credit event, and the seller would have to make the payment to the purchaser of the hedge, which could be the notional amount of the credit derivative. ITAÚ UNIBANCO HOLDING CONSOLIDATED buys and sells credit protection in order to meet the needs of its customers, management and mitigation of its portfolios' risk. CDS (credit default swap) is credit derivative in which, upon a default related to the reference entity, the protection buyer is entitled to receive, from the protection seller, the amount equivalent to the difference between the face value of the CDS contract and the fair value of the liability on the date the contract was settled, also known as the recovered amount. The protection buyer does not need to hold the debt instrument of the reference entity for it to receive the amounts due pursuant to the CDS contract terms when a credit event occurs. TRS (total return swap) is a transaction in which a party swaps the total return of an asset or of a basket of assets for regular cash flows, usually interest and a guarantee against capital loss. In a TRS contract, the parties do not transfer the ownership of the assets. The total value of margins pledged in guarantee by ITAÚ UNIBANCO HOLDING CONSOLIDATED was R$ 10,620,308 (R$ 20,820,076 at 03/31/2018) and was basically comprised of government securities. Further information on internal controls and parameters used to management risks, may be accessed in Note 18 - Risk, Capital Management and Fixed Assets Limits. Itaú Unibanco Holding S.A. – Complete Financial Statements – March 31, 2019 81 f) Derivative financial instruments ITAÚ UNIBANCO HOLDING CONSOLIDATED enters into derivative financial instruments with various counterparties to manage its overall exposures and to assist its customers in managing their own exposures. Futures – Interest rate and foreign currency futures contracts are commitments to buy or sell a financial instrument at a future date, at a contracted price or yield and may be settled in cash or through delivery. The notional amount represents the face value of the underlying instrument. Commodity futures contracts or financial instruments are commitments to buy or sell commodities (mainly gold, coffee and orange juice), at a future date, at a contracted price, which are settled in cash. The notional amount represents the quantity of such commodities multiplied by the future price at the contract date. Daily cash settlements of price movements are made for all instruments. Forwards – Interest forward contracts are agreements to exchange payments on a specified future date, based on a market change in interest rates from trade date to contract settlement date. Foreign exchange forward contracts represent agreements to exchange the currency of one country for the currency of another country at an agreed price, at an agreed settlement date. Financial instrument forward contracts are commitments to buy or sell a financial instrument on a future date at a contracted price and are settled in cash. Swaps – Interest rate and foreign exchange swap contracts are commitments to settle in cash at a future date or dates, based on differentials between specified financial indices (either two different interest rates in a single currency or two different rates each in a different currency), as applied to a notional principal amount. Swap contracts presented in Other in the table below correspond substantially to inflation rate swap contracts. Options – Option contracts give the purchaser, for a fee, the right, but not the obligation, to buy or sell within a limited time a financial instrument including a flow of interest, foreign currencies, commodities, or financial instruments at a contracted price that may also be settled in cash, based on differentials between specific indices. Credit Derivatives – Credit derivatives are financial instruments with value relating to the credit risk associated to the debt issued by a third party (the reference entity), which permits that one party (the purchaser of the hedge) transfers the risk to the counterparty (the seller of the hedge). The seller of the hedge should make payments as set forth in the contract when the reference entity undergoes a credit event, such as bankruptcy, default or debt restructuring. The seller of the hedge receives a premium for the hedge, but, on the other hand, assumes the risk that the underlying asset referenced in the contract undergoes a credit event, and the seller would have to make the payment to the purchaser of the hedge, which could be the notional amount of the credit derivative. ITAÚ UNIBANCO HOLDING CONSOLIDATED buys and sells credit protection in order to meet the needs of its customers, management and mitigation of its portfolios' risk. CDS (credit default swap) is credit derivative in which, upon a default related to the reference entity, the protection buyer is entitled to receive, from the protection seller, the amount equivalent to the difference between the face value of the CDS contract and the fair value of the liability on the date the contract was settled, also known as the recovered amount. The protection buyer does not need to hold the debt instrument of the reference entity for it to receive the amounts due pursuant to the CDS contract terms when a credit event occurs. TRS (total return swap) is a transaction in which a party swaps the total return of an asset or of a basket of assets for regular cash flows, usually interest and a guarantee against capital loss. In a TRS contract, the parties do not transfer the ownership of the assets. The total value of margins pledged in guarantee by ITAÚ UNIBANCO HOLDING CONSOLIDATED was R$ 10,620,308 (R$ 20,820,076 at 03/31/2018) and was basically comprised of government securities. Further information on internal controls and parameters used to management risks, may be accessed in Note 18 - Risk, Capital Management and Fixed Assets Limits. Itaú Unibanco Holding S.A. – Complete Financial Statements – March 31, 2019 81
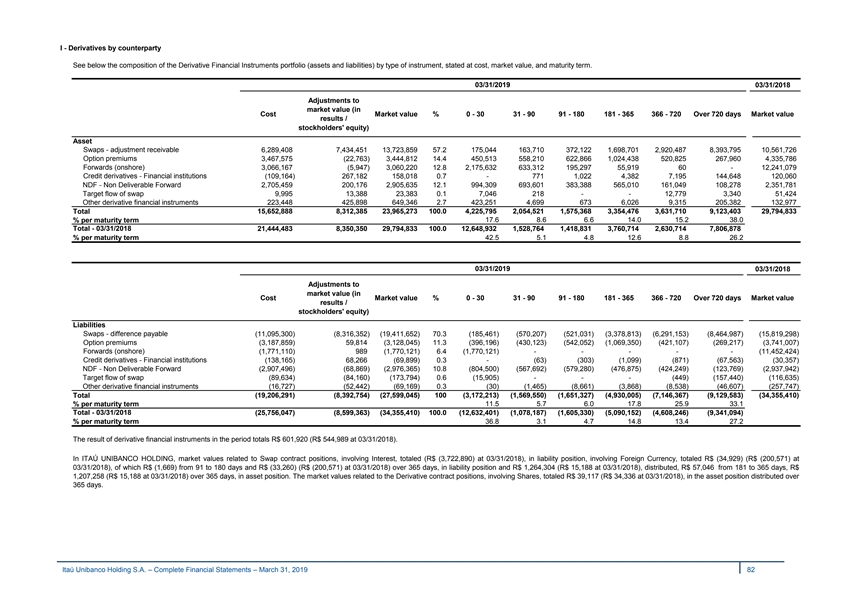
I - Derivatives by counterparty See below the composition of the Derivative Financial Instruments portfolio (assets and liabilities) by type of instrument, stated at cost, market value, and maturity term. 03/31/2019 03/31/2018 Adjustments to market value (in Cost Market value % 0 - 30 31 - 90 91 - 180 181 - 365 366 - 720 Over 720 days Market value results / stockholders' equity) Asset Swaps - adjustment receivable 6,289,408 7,434,451 13,723,859 57.2 175,044 163,710 372,122 1,698,701 2,920,487 8,393,795 10,561,726 Option premiums 3,467,575 ( 22,763) 3,444,812 14.4 450,513 558,210 622,866 1,024,438 520,825 267,960 4,335,786 Forwards (onshore) 3,066,167 ( 5,947) 3,060,220 12.8 2,175,632 633,312 195,297 55,919 60 - 12,241,079 Credit derivatives - Financial institutions (109,164) 267,182 158,018 0.7 - 771 1,022 4,382 7,195 144,648 120,060 NDF - Non Deliverable Forward 2,705,459 200,176 2,905,635 12.1 994,309 693,601 383,388 565,010 161,049 108,278 2,351,781 Target flow of swap 9,995 13,388 23,383 0.1 7,046 218 - - 12,779 3,340 51,424 Other derivative financial instruments 223,448 425,898 649,346 2.7 423,251 4,699 673 6,026 9,315 205,382 132,977 15,652,888 8,312,385 23,965,273 100.0 4,225,795 2,054,521 1,575,368 3,354,476 3,631,710 9,123,403 29,794,833 Total % per maturity term 17.6 8.6 6.6 14.0 15.2 38.0 Total - 03/31/2018 21,444,483 8,350,350 29,794,833 100.0 12,648,932 1,528,764 1,418,831 3,760,714 2,630,714 7,806,878 % per maturity term 42.5 5.1 4.8 12.6 8.8 26.2 03/31/2019 03/31/2018 Adjustments to market value (in Cost Market value % 0 - 30 31 - 90 91 - 180 181 - 365 366 - 720 Over 720 days Market value results / stockholders' equity) Liabilities Swaps - difference payable (11,095,300) ( 8,316,352) ( 19,411,652) 70.3 (185,461) (570,207) (521,031) ( 3,378,813) (6,291,153) (8,464,987) ( 15,819,298) Option premiums (3,187,859) 59,814 ( 3,128,045) 11.3 (396,196) (430,123) (542,052) (1,069,350) (421,107) ( 269,217) ( 3,741,007) Forwards (onshore) (1,771,110) 989 (1,770,121) 6.4 ( 1,770,121) - - - - - ( 11,452,424) Credit derivatives - Financial institutions ( 138,165) 68,266 (69,899) 0.3 - (63) (303) (1,099) ( 871) ( 67,563) ( 30,357) NDF - Non Deliverable Forward (2,907,496) (68,869) ( 2,976,365) 10.8 (804,500) (567,692) (579,280) (476,875) ( 424,249) (123,769) (2,937,942) Target flow of swap ( 89,634) ( 84,160) ( 173,794) 0.6 (15,905) - - - (449) ( 157,440) (116,635) Other derivative financial instruments ( 16,727) ( 52,442) ( 69,169) 0.3 ( 30) ( 1,465) (8,661) ( 3,868) ( 8,538) ( 46,607) (257,747) Total (19,206,291) (8,392,754) (27,599,045) 100 (3,172,213) (1,569,550) (1,651,327) (4,930,005) (7,146,367) ( 9,129,583) (34,355,410) % per maturity term 11.5 5.7 6.0 17.8 25.9 33.1 Total - 03/31/2018 (25,756,047) (8,599,363) (34,355,410) 100.0 (12,632,401) (1,078,187) (1,605,330) (5,090,152) (4,608,246) ( 9,341,094) % per maturity term 36.8 3.1 4.7 14.8 13.4 27.2 The result of derivative financial instruments in the period totals R$ 601,920 (R$ 544,989 at 03/31/2018). In ITAÚ UNIBANCO HOLDING, market values related to Swap contract positions, involving Interest, totaled (R$ (3,722,890) at 03/31/2018), in liability position, involving Foreign Currency, totaled R$ (34,929) (R$ (200,571) at 03/31/2018), of which R$ (1,669) from 91 to 180 days and R$ (33,260) (R$ (200,571) at 03/31/2018) over 365 days, in liability position and R$ 1,264,304 (R$ 15,188 at 03/31/2018), distributed, R$ 57,046 from 181 to 365 days, R$ 1,207,258 (R$ 15,188 at 03/31/2018) over 365 days, in asset position. The market values related to the Derivative contract positions, involving Shares, totaled R$ 39,117 (R$ 34,336 at 03/31/2018), in the asset position distributed over 365 days. Itaú Unibanco Holding S.A. – Complete Financial Statements – March 31, 2019 82 I - Derivatives by counterparty See below the composition of the Derivative Financial Instruments portfolio (assets and liabilities) by type of instrument, stated at cost, market value, and maturity term. 03/31/2019 03/31/2018 Adjustments to market value (in Cost Market value % 0 - 30 31 - 90 91 - 180 181 - 365 366 - 720 Over 720 days Market value results / stockholders' equity) Asset Swaps - adjustment receivable 6,289,408 7,434,451 13,723,859 57.2 175,044 163,710 372,122 1,698,701 2,920,487 8,393,795 10,561,726 Option premiums 3,467,575 ( 22,763) 3,444,812 14.4 450,513 558,210 622,866 1,024,438 520,825 267,960 4,335,786 Forwards (onshore) 3,066,167 ( 5,947) 3,060,220 12.8 2,175,632 633,312 195,297 55,919 60 - 12,241,079 Credit derivatives - Financial institutions (109,164) 267,182 158,018 0.7 - 771 1,022 4,382 7,195 144,648 120,060 NDF - Non Deliverable Forward 2,705,459 200,176 2,905,635 12.1 994,309 693,601 383,388 565,010 161,049 108,278 2,351,781 Target flow of swap 9,995 13,388 23,383 0.1 7,046 218 - - 12,779 3,340 51,424 Other derivative financial instruments 223,448 425,898 649,346 2.7 423,251 4,699 673 6,026 9,315 205,382 132,977 15,652,888 8,312,385 23,965,273 100.0 4,225,795 2,054,521 1,575,368 3,354,476 3,631,710 9,123,403 29,794,833 Total % per maturity term 17.6 8.6 6.6 14.0 15.2 38.0 Total - 03/31/2018 21,444,483 8,350,350 29,794,833 100.0 12,648,932 1,528,764 1,418,831 3,760,714 2,630,714 7,806,878 % per maturity term 42.5 5.1 4.8 12.6 8.8 26.2 03/31/2019 03/31/2018 Adjustments to market value (in Cost Market value % 0 - 30 31 - 90 91 - 180 181 - 365 366 - 720 Over 720 days Market value results / stockholders' equity) Liabilities Swaps - difference payable (11,095,300) ( 8,316,352) ( 19,411,652) 70.3 (185,461) (570,207) (521,031) ( 3,378,813) (6,291,153) (8,464,987) ( 15,819,298) Option premiums (3,187,859) 59,814 ( 3,128,045) 11.3 (396,196) (430,123) (542,052) (1,069,350) (421,107) ( 269,217) ( 3,741,007) Forwards (onshore) (1,771,110) 989 (1,770,121) 6.4 ( 1,770,121) - - - - - ( 11,452,424) Credit derivatives - Financial institutions ( 138,165) 68,266 (69,899) 0.3 - (63) (303) (1,099) ( 871) ( 67,563) ( 30,357) NDF - Non Deliverable Forward (2,907,496) (68,869) ( 2,976,365) 10.8 (804,500) (567,692) (579,280) (476,875) ( 424,249) (123,769) (2,937,942) Target flow of swap ( 89,634) ( 84,160) ( 173,794) 0.6 (15,905) - - - (449) ( 157,440) (116,635) Other derivative financial instruments ( 16,727) ( 52,442) ( 69,169) 0.3 ( 30) ( 1,465) (8,661) ( 3,868) ( 8,538) ( 46,607) (257,747) Total (19,206,291) (8,392,754) (27,599,045) 100 (3,172,213) (1,569,550) (1,651,327) (4,930,005) (7,146,367) ( 9,129,583) (34,355,410) % per maturity term 11.5 5.7 6.0 17.8 25.9 33.1 Total - 03/31/2018 (25,756,047) (8,599,363) (34,355,410) 100.0 (12,632,401) (1,078,187) (1,605,330) (5,090,152) (4,608,246) ( 9,341,094) % per maturity term 36.8 3.1 4.7 14.8 13.4 27.2 The result of derivative financial instruments in the period totals R$ 601,920 (R$ 544,989 at 03/31/2018). In ITAÚ UNIBANCO HOLDING, market values related to Swap contract positions, involving Interest, totaled (R$ (3,722,890) at 03/31/2018), in liability position, involving Foreign Currency, totaled R$ (34,929) (R$ (200,571) at 03/31/2018), of which R$ (1,669) from 91 to 180 days and R$ (33,260) (R$ (200,571) at 03/31/2018) over 365 days, in liability position and R$ 1,264,304 (R$ 15,188 at 03/31/2018), distributed, R$ 57,046 from 181 to 365 days, R$ 1,207,258 (R$ 15,188 at 03/31/2018) over 365 days, in asset position. The market values related to the Derivative contract positions, involving Shares, totaled R$ 39,117 (R$ 34,336 at 03/31/2018), in the asset position distributed over 365 days. Itaú Unibanco Holding S.A. – Complete Financial Statements – March 31, 2019 82
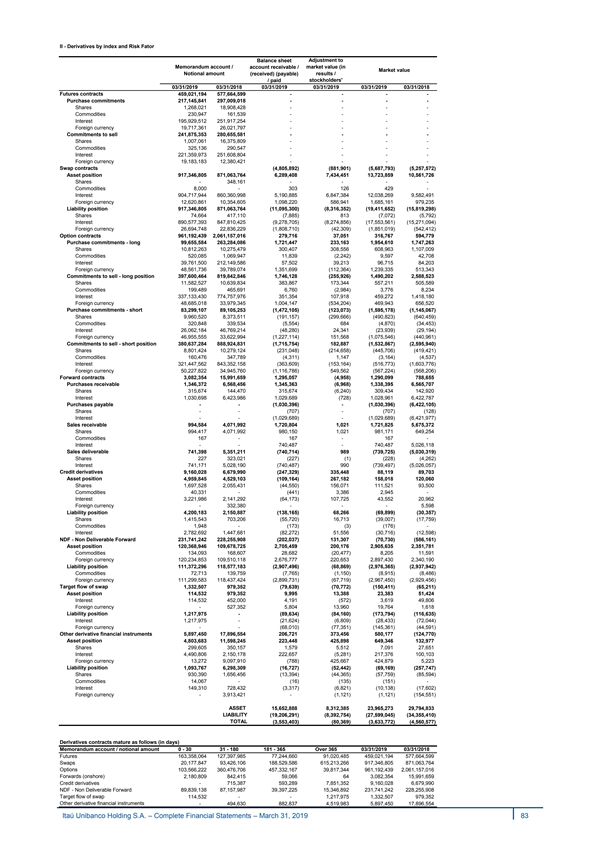
II - Derivatives by index and Risk Fator Balance sheet Adjustment to Memorandum account / account receivable / market value (in Market value Notional amount results / (received) (payable) / paid stockholders' 03/31/2019 03/31/2018 03/31/2019 03/31/2019 equity) 03/31/2019 03/31/2018 Futures contracts 459,021,194 577,664,599 - - - - Purchase commitments 217,145,841 297,009,018 - - - - Shares 1,268,021 18,908,428 - - - - Commodities 230,947 161,539 - - - - Interest 195,929,512 251,917,254 - - - - Foreign currency 19,717,361 26,021,797 - - - - Commitments to sell 241,875,353 280,655,581 - - - - Shares 1,007,061 16,375,809 - - - - Commodities 325,136 290,547 - - - - Interest 221,359,973 251,608,804 - - - - Foreign currency 19,183,183 12,380,421 - - - - Swap contracts ( 4,805,892) (881,901) ( 5,687,793) ( 5,257,572) Asset position 917,346,805 871,063,764 6,289,408 7,434,451 13,723,859 10,561,726 Shares - 348,161 - - - - Commodities 8,000 - 303 126 429 - Interest 904,717,944 860,360,998 5,190,885 6,847,384 12,038,269 9,582,491 Foreign currency 12,620,861 10,354,605 1,098,220 586,941 1,685,161 979,235 Liability position 917,346,805 871,063,764 (11,095,300) ( 8,316,352) (19,411,652) (15,819,298) Shares 74,664 417,110 (7,885) 813 (7,072) (5,792) Interest 890,577,393 847,810,425 (9,278,705) (8,274,856) ( 17,553,561) ( 15,271,094) Foreign currency 26,694,748 22,836,229 ( 1,808,710) ( 42,309) (1,851,019) (542,412) Option contracts 961,192,439 2,061,157,016 279,716 37,051 316,767 594,779 Purchase commitments - long 99,655,584 263,284,086 1,721,447 233,163 1,954,610 1,747,263 Shares 10,812,263 10,275,479 300,407 308,556 608,963 1,107,009 Commodities 520,085 1,069,947 11,839 ( 2,242) 9,597 42,708 Interest 39,761,500 212,149,586 57,502 39,213 96,715 84,203 Foreign currency 48,561,736 39,789,074 1,351,699 (112,364) 1,239,335 513,343 Commitments to sell - long position 397,600,464 819,842,846 1,746,128 ( 255,926) 1,490,202 2,588,523 Shares 11,582,527 10,639,834 383,867 173,344 557,211 505,589 Commodities 199,489 465,691 6,760 (2,984) 3,776 8,234 Interest 337,133,430 774,757,976 351,354 107,918 459,272 1,418,180 Foreign currency 48,685,018 33,979,345 1,004,147 (534,204) 469,943 656,520 Purchase commitments - short 83,299,107 89,105,253 (1,472,105) (123,073) ( 1,595,178) ( 1,145,067) Shares 9,960,520 8,373,511 (191,157) (299,666) ( 490,823) (640,459) Commodities 320,848 339,534 (5,554) 684 (4,870) (34,453) Interest 26,062,184 46,769,214 ( 48,280) 24,341 ( 23,939) ( 29,194) Foreign currency 46,955,555 33,622,994 (1,227,114) 151,568 ( 1,075,546) ( 440,961) Commitments to sell - short position 380,637,284 888,924,831 (1,715,754) 182,887 ( 1,532,867) (2,595,940) Shares 8,801,424 10,279,124 (231,048) ( 214,658) ( 445,706) (419,421) Commodities 160,476 347,789 (4,311) 1,147 ( 3,164) ( 4,537) Interest 321,447,562 843,352,158 (363,609) ( 153,164) ( 516,773) (1,603,776) Foreign currency 50,227,822 34,945,760 (1,116,786) 549,562 ( 567,224) (568,206) Forward contracts 3,082,354 15,991,659 1,295,057 (4,958) 1,290,099 788,655 Purchases receivable 1,346,372 6,568,456 1,345,363 ( 6,968) 1,338,395 6,565,707 Shares 315,674 144,470 315,674 ( 6,240) 309,434 142,920 Interest 1,030,698 6,423,986 1,029,689 ( 728) 1,028,961 6,422,787 Purchases payable - - (1,030,396) - (1,030,396) (6,422,105) Shares - - (707) - (707) (128) Interest - - ( 1,029,689) - (1,029,689) (6,421,977) Sales receivable 994,584 4,071,992 1,720,804 1,021 1,721,825 5,675,372 Shares 994,417 4,071,992 980,150 1,021 981,171 649,254 Commodities 167 - 167 - 167 - Interest - - 740,487 - 740,487 5,026,118 Sales deliverable 741,398 5,351,211 (740,714) 989 (739,725) ( 5,030,319) Shares 227 323,021 (227) (1) ( 228) ( 4,262) Interest 741,171 5,028,190 (740,487) 990 (739,497) ( 5,026,057) Credit derivatives 9,160,028 6,679,990 ( 247,329) 335,448 88,119 89,703 Asset position 4,959,845 4,529,103 ( 109,164) 267,182 158,018 120,060 Shares 1,697,528 2,055,431 ( 44,550) 156,071 111,521 93,500 Commodities 40,331 - (441) 3,386 2,945 - Interest 3,221,986 2,141,292 ( 64,173) 107,725 43,552 20,962 Foreign currency - 332,380 - - - 5,598 Liability position 4,200,183 2,150,887 ( 138,165) 68,266 ( 69,899) (30,357) Shares 1,415,543 703,206 ( 55,720) 16,713 ( 39,007) (17,759) Commodities 1,948 - ( 173) (3) (176) - Interest 2,782,692 1,447,681 (82,272) 51,556 (30,716) ( 12,598) NDF - Non Deliverable Forward 231,741,242 228,255,908 ( 202,037) 131,307 ( 70,730) (586,161) Asset position 120,368,946 109,678,725 2,705,459 200,176 2,905,635 2,351,781 Commodities 134,093 168,607 28,682 (20,477) 8,205 11,591 Foreign currency 120,234,853 109,510,118 2,676,777 220,653 2,897,430 2,340,190 Liability position 111,372,296 118,577,183 ( 2,907,496) ( 68,869) ( 2,976,365) (2,937,942) Commodities 72,713 139,759 (7,765) (1,150) ( 8,915) (8,486) Foreign currency 111,299,583 118,437,424 (2,899,731) (67,719) ( 2,967,450) ( 2,929,456) Target flow of swap 1,332,507 979,352 ( 79,639) ( 70,772) ( 150,411) (65,211) Asset position 114,532 979,352 9,995 13,388 23,383 51,424 Interest 114,532 452,000 4,191 ( 572) 3,619 49,806 Foreign currency - 527,352 5,804 13,960 19,764 1,618 Liability position 1,217,975 - ( 89,634) ( 84,160) ( 173,794) (116,635) Interest 1,217,975 - (21,624) (6,809) ( 28,433) ( 72,044) Foreign currency - - ( 68,010) ( 77,351) ( 145,361) (44,591) Other derivative financial instruments 5,897,450 17,896,554 206,721 373,456 580,177 (124,770) Asset position 4,803,683 11,598,245 223,448 425,898 649,346 132,977 Shares 299,605 350,157 1,579 5,512 7,091 27,651 Interest 4,490,806 2,150,178 222,657 (5,281) 217,376 100,103 Foreign currency 13,272 9,097,910 ( 788) 425,667 424,879 5,223 Liability position 1,093,767 6,298,309 ( 16,727) ( 52,442) ( 69,169) (257,747) Shares 930,390 1,656,456 ( 13,394) (44,365) ( 57,759) (85,594) Commodities 14,067 - (16) (135) (151) - Interest 149,310 728,432 ( 3,317) ( 6,821) ( 10,138) ( 17,602) Foreign currency - 3,913,421 - ( 1,121) (1,121) ( 154,551) ASSET 15,652,888 8,312,385 23,965,273 29,794,833 LIABILITY ( 19,206,291) ( 8,392,754) ( 27,599,045) (34,355,410) TOTAL (3,553,403) ( 80,369) ( 3,633,772) ( 4,560,577) Derivatives contracts mature as follows (in days) Memorandum account / notional amount 0 - 30 31 - 180 181 - 365 Over 365 03/31/2019 03/31/2018 Futures 163,358,064 127,397,985 77,244,660 91,020,485 459,021,194 577,664,599 Swaps 20,177,847 93,426,106 188,529,586 615,213,266 917,346,805 871,063,764 Options 103,566,222 360,476,706 457,332,167 39,817,344 961,192,439 2,061,157,016 Forwards (onshore) 2,180,809 842,415 59,066 64 3,082,354 15,991,659 Credit derivatives - 715,387 593,289 7,851,352 9,160,028 6,679,990 NDF - Non Deliverable Forward 89,839,138 87,157,987 39,397,225 15,346,892 231,741,242 228,255,908 Target flow of swap 114,532 - - 1,217,975 1,332,507 979,352 Other derivative financial instruments - 494,630 882,837 4,519,983 5,897,450 17,896,554 Itaú Unibanco Holding S.A. – Complete Financial Statements – March 31, 2019 83 II - Derivatives by index and Risk Fator Balance sheet Adjustment to Memorandum account / account receivable / market value (in Market value Notional amount results / (received) (payable) / paid stockholders' 03/31/2019 03/31/2018 03/31/2019 03/31/2019 equity) 03/31/2019 03/31/2018 Futures contracts 459,021,194 577,664,599 - - - - Purchase commitments 217,145,841 297,009,018 - - - - Shares 1,268,021 18,908,428 - - - - Commodities 230,947 161,539 - - - - Interest 195,929,512 251,917,254 - - - - Foreign currency 19,717,361 26,021,797 - - - - Commitments to sell 241,875,353 280,655,581 - - - - Shares 1,007,061 16,375,809 - - - - Commodities 325,136 290,547 - - - - Interest 221,359,973 251,608,804 - - - - Foreign currency 19,183,183 12,380,421 - - - - Swap contracts ( 4,805,892) (881,901) ( 5,687,793) ( 5,257,572) Asset position 917,346,805 871,063,764 6,289,408 7,434,451 13,723,859 10,561,726 Shares - 348,161 - - - - Commodities 8,000 - 303 126 429 - Interest 904,717,944 860,360,998 5,190,885 6,847,384 12,038,269 9,582,491 Foreign currency 12,620,861 10,354,605 1,098,220 586,941 1,685,161 979,235 Liability position 917,346,805 871,063,764 (11,095,300) ( 8,316,352) (19,411,652) (15,819,298) Shares 74,664 417,110 (7,885) 813 (7,072) (5,792) Interest 890,577,393 847,810,425 (9,278,705) (8,274,856) ( 17,553,561) ( 15,271,094) Foreign currency 26,694,748 22,836,229 ( 1,808,710) ( 42,309) (1,851,019) (542,412) Option contracts 961,192,439 2,061,157,016 279,716 37,051 316,767 594,779 Purchase commitments - long 99,655,584 263,284,086 1,721,447 233,163 1,954,610 1,747,263 Shares 10,812,263 10,275,479 300,407 308,556 608,963 1,107,009 Commodities 520,085 1,069,947 11,839 ( 2,242) 9,597 42,708 Interest 39,761,500 212,149,586 57,502 39,213 96,715 84,203 Foreign currency 48,561,736 39,789,074 1,351,699 (112,364) 1,239,335 513,343 Commitments to sell - long position 397,600,464 819,842,846 1,746,128 ( 255,926) 1,490,202 2,588,523 Shares 11,582,527 10,639,834 383,867 173,344 557,211 505,589 Commodities 199,489 465,691 6,760 (2,984) 3,776 8,234 Interest 337,133,430 774,757,976 351,354 107,918 459,272 1,418,180 Foreign currency 48,685,018 33,979,345 1,004,147 (534,204) 469,943 656,520 Purchase commitments - short 83,299,107 89,105,253 (1,472,105) (123,073) ( 1,595,178) ( 1,145,067) Shares 9,960,520 8,373,511 (191,157) (299,666) ( 490,823) (640,459) Commodities 320,848 339,534 (5,554) 684 (4,870) (34,453) Interest 26,062,184 46,769,214 ( 48,280) 24,341 ( 23,939) ( 29,194) Foreign currency 46,955,555 33,622,994 (1,227,114) 151,568 ( 1,075,546) ( 440,961) Commitments to sell - short position 380,637,284 888,924,831 (1,715,754) 182,887 ( 1,532,867) (2,595,940) Shares 8,801,424 10,279,124 (231,048) ( 214,658) ( 445,706) (419,421) Commodities 160,476 347,789 (4,311) 1,147 ( 3,164) ( 4,537) Interest 321,447,562 843,352,158 (363,609) ( 153,164) ( 516,773) (1,603,776) Foreign currency 50,227,822 34,945,760 (1,116,786) 549,562 ( 567,224) (568,206) Forward contracts 3,082,354 15,991,659 1,295,057 (4,958) 1,290,099 788,655 Purchases receivable 1,346,372 6,568,456 1,345,363 ( 6,968) 1,338,395 6,565,707 Shares 315,674 144,470 315,674 ( 6,240) 309,434 142,920 Interest 1,030,698 6,423,986 1,029,689 ( 728) 1,028,961 6,422,787 Purchases payable - - (1,030,396) - (1,030,396) (6,422,105) Shares - - (707) - (707) (128) Interest - - ( 1,029,689) - (1,029,689) (6,421,977) Sales receivable 994,584 4,071,992 1,720,804 1,021 1,721,825 5,675,372 Shares 994,417 4,071,992 980,150 1,021 981,171 649,254 Commodities 167 - 167 - 167 - Interest - - 740,487 - 740,487 5,026,118 Sales deliverable 741,398 5,351,211 (740,714) 989 (739,725) ( 5,030,319) Shares 227 323,021 (227) (1) ( 228) ( 4,262) Interest 741,171 5,028,190 (740,487) 990 (739,497) ( 5,026,057) Credit derivatives 9,160,028 6,679,990 ( 247,329) 335,448 88,119 89,703 Asset position 4,959,845 4,529,103 ( 109,164) 267,182 158,018 120,060 Shares 1,697,528 2,055,431 ( 44,550) 156,071 111,521 93,500 Commodities 40,331 - (441) 3,386 2,945 - Interest 3,221,986 2,141,292 ( 64,173) 107,725 43,552 20,962 Foreign currency - 332,380 - - - 5,598 Liability position 4,200,183 2,150,887 ( 138,165) 68,266 ( 69,899) (30,357) Shares 1,415,543 703,206 ( 55,720) 16,713 ( 39,007) (17,759) Commodities 1,948 - ( 173) (3) (176) - Interest 2,782,692 1,447,681 (82,272) 51,556 (30,716) ( 12,598) NDF - Non Deliverable Forward 231,741,242 228,255,908 ( 202,037) 131,307 ( 70,730) (586,161) Asset position 120,368,946 109,678,725 2,705,459 200,176 2,905,635 2,351,781 Commodities 134,093 168,607 28,682 (20,477) 8,205 11,591 Foreign currency 120,234,853 109,510,118 2,676,777 220,653 2,897,430 2,340,190 Liability position 111,372,296 118,577,183 ( 2,907,496) ( 68,869) ( 2,976,365) (2,937,942) Commodities 72,713 139,759 (7,765) (1,150) ( 8,915) (8,486) Foreign currency 111,299,583 118,437,424 (2,899,731) (67,719) ( 2,967,450) ( 2,929,456) Target flow of swap 1,332,507 979,352 ( 79,639) ( 70,772) ( 150,411) (65,211) Asset position 114,532 979,352 9,995 13,388 23,383 51,424 Interest 114,532 452,000 4,191 ( 572) 3,619 49,806 Foreign currency - 527,352 5,804 13,960 19,764 1,618 Liability position 1,217,975 - ( 89,634) ( 84,160) ( 173,794) (116,635) Interest 1,217,975 - (21,624) (6,809) ( 28,433) ( 72,044) Foreign currency - - ( 68,010) ( 77,351) ( 145,361) (44,591) Other derivative financial instruments 5,897,450 17,896,554 206,721 373,456 580,177 (124,770) Asset position 4,803,683 11,598,245 223,448 425,898 649,346 132,977 Shares 299,605 350,157 1,579 5,512 7,091 27,651 Interest 4,490,806 2,150,178 222,657 (5,281) 217,376 100,103 Foreign currency 13,272 9,097,910 ( 788) 425,667 424,879 5,223 Liability position 1,093,767 6,298,309 ( 16,727) ( 52,442) ( 69,169) (257,747) Shares 930,390 1,656,456 ( 13,394) (44,365) ( 57,759) (85,594) Commodities 14,067 - (16) (135) (151) - Interest 149,310 728,432 ( 3,317) ( 6,821) ( 10,138) ( 17,602) Foreign currency - 3,913,421 - ( 1,121) (1,121) ( 154,551) ASSET 15,652,888 8,312,385 23,965,273 29,794,833 LIABILITY ( 19,206,291) ( 8,392,754) ( 27,599,045) (34,355,410) TOTAL (3,553,403) ( 80,369) ( 3,633,772) ( 4,560,577) Derivatives contracts mature as follows (in days) Memorandum account / notional amount 0 - 30 31 - 180 181 - 365 Over 365 03/31/2019 03/31/2018 Futures 163,358,064 127,397,985 77,244,660 91,020,485 459,021,194 577,664,599 Swaps 20,177,847 93,426,106 188,529,586 615,213,266 917,346,805 871,063,764 Options 103,566,222 360,476,706 457,332,167 39,817,344 961,192,439 2,061,157,016 Forwards (onshore) 2,180,809 842,415 59,066 64 3,082,354 15,991,659 Credit derivatives - 715,387 593,289 7,851,352 9,160,028 6,679,990 NDF - Non Deliverable Forward 89,839,138 87,157,987 39,397,225 15,346,892 231,741,242 228,255,908 Target flow of swap 114,532 - - 1,217,975 1,332,507 979,352 Other derivative financial instruments - 494,630 882,837 4,519,983 5,897,450 17,896,554 Itaú Unibanco Holding S.A. – Complete Financial Statements – March 31, 2019 83
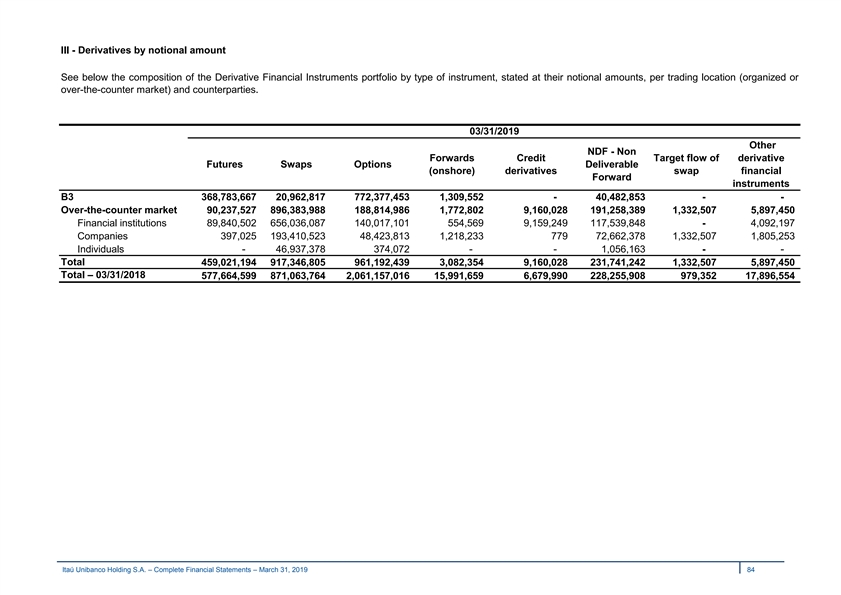
III - Derivatives by notional amount See below the composition of the Derivative Financial Instruments portfolio by type of instrument, stated at their notional amounts, per trading location (organized or over-the-counter market) and counterparties. 03/31/2019 Other NDF - Non Forwards Credit Target flow of derivative Futures Swaps Options Deliverable (onshore) derivatives swap financial Forward instruments B3 368,783,667 20,962,817 772,377,453 1,309,552 - 40,482,853 - - Over-the-counter market 90,237,527 896,383,988 188,814,986 1,772,802 9,160,028 191,258,389 1,332,507 5,897,450 Financial institutions 89,840,502 656,036,087 140,017,101 554,569 9,159,249 117,539,848 - 4,092,197 Companies 397,025 193,410,523 48,423,813 1,218,233 779 72,662,378 1,332,507 1,805,253 Individuals - 46,937,378 374,072 - - 1,056,163 - - Total 459,021,194 917,346,805 961,192,439 3,082,354 9,160,028 231,741,242 1,332,507 5,897,450 Total – 03/31/2018 577,664,599 871,063,764 2,061,157,016 15,991,659 6,679,990 228,255,908 979,352 17,896,554 Itaú Unibanco Holding S.A. – Complete Financial Statements – March 31, 2019 84 III - Derivatives by notional amount See below the composition of the Derivative Financial Instruments portfolio by type of instrument, stated at their notional amounts, per trading location (organized or over-the-counter market) and counterparties. 03/31/2019 Other NDF - Non Forwards Credit Target flow of derivative Futures Swaps Options Deliverable (onshore) derivatives swap financial Forward instruments B3 368,783,667 20,962,817 772,377,453 1,309,552 - 40,482,853 - - Over-the-counter market 90,237,527 896,383,988 188,814,986 1,772,802 9,160,028 191,258,389 1,332,507 5,897,450 Financial institutions 89,840,502 656,036,087 140,017,101 554,569 9,159,249 117,539,848 - 4,092,197 Companies 397,025 193,410,523 48,423,813 1,218,233 779 72,662,378 1,332,507 1,805,253 Individuals - 46,937,378 374,072 - - 1,056,163 - - Total 459,021,194 917,346,805 961,192,439 3,082,354 9,160,028 231,741,242 1,332,507 5,897,450 Total – 03/31/2018 577,664,599 871,063,764 2,061,157,016 15,991,659 6,679,990 228,255,908 979,352 17,896,554 Itaú Unibanco Holding S.A. – Complete Financial Statements – March 31, 2019 84
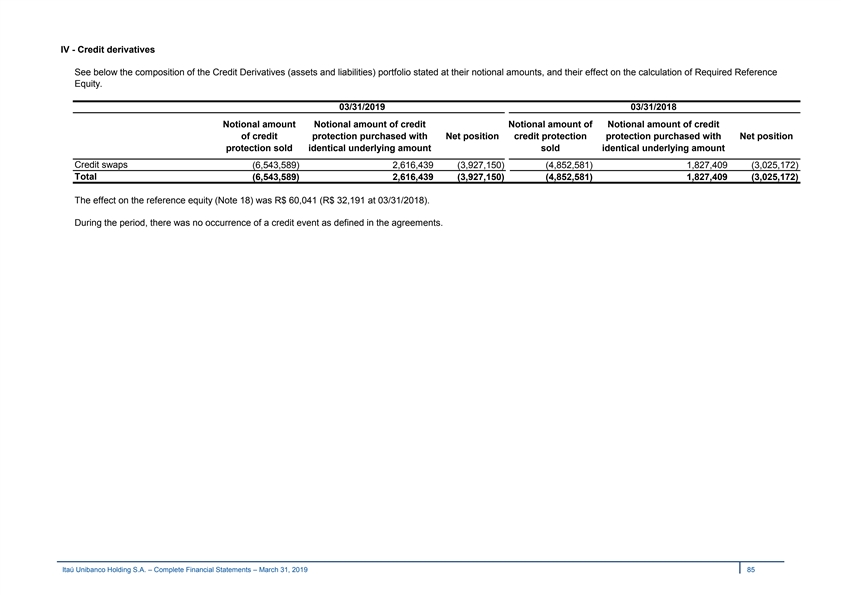
IV - Credit derivatives See below the composition of the Credit Derivatives (assets and liabilities) portfolio stated at their notional amounts, and their effect on the calculation of Required Reference Equity. 03/31/2019 03/31/2018 Notional amount Notional amount of credit Notional amount of Notional amount of credit of credit protection purchased with Net position credit protection protection purchased with Net position protection sold identical underlying amount sold identical underlying amount Credit swaps (6,543,589) 2,616,439 (3,927,150) (4,852,581) 1,827,409 (3,025,172) Total (6,543,589) 2,616,439 (3,927,150) (4,852,581) 1,827,409 (3,025,172) The effect on the reference equity (Note 18) was R$ 60,041 (R$ 32,191 at 03/31/2018). During the period, there was no occurrence of a credit event as defined in the agreements. Itaú Unibanco Holding S.A. – Complete Financial Statements – March 31, 2019 85 IV - Credit derivatives See below the composition of the Credit Derivatives (assets and liabilities) portfolio stated at their notional amounts, and their effect on the calculation of Required Reference Equity. 03/31/2019 03/31/2018 Notional amount Notional amount of credit Notional amount of Notional amount of credit of credit protection purchased with Net position credit protection protection purchased with Net position protection sold identical underlying amount sold identical underlying amount Credit swaps (6,543,589) 2,616,439 (3,927,150) (4,852,581) 1,827,409 (3,025,172) Total (6,543,589) 2,616,439 (3,927,150) (4,852,581) 1,827,409 (3,025,172) The effect on the reference equity (Note 18) was R$ 60,041 (R$ 32,191 at 03/31/2018). During the period, there was no occurrence of a credit event as defined in the agreements. Itaú Unibanco Holding S.A. – Complete Financial Statements – March 31, 2019 85
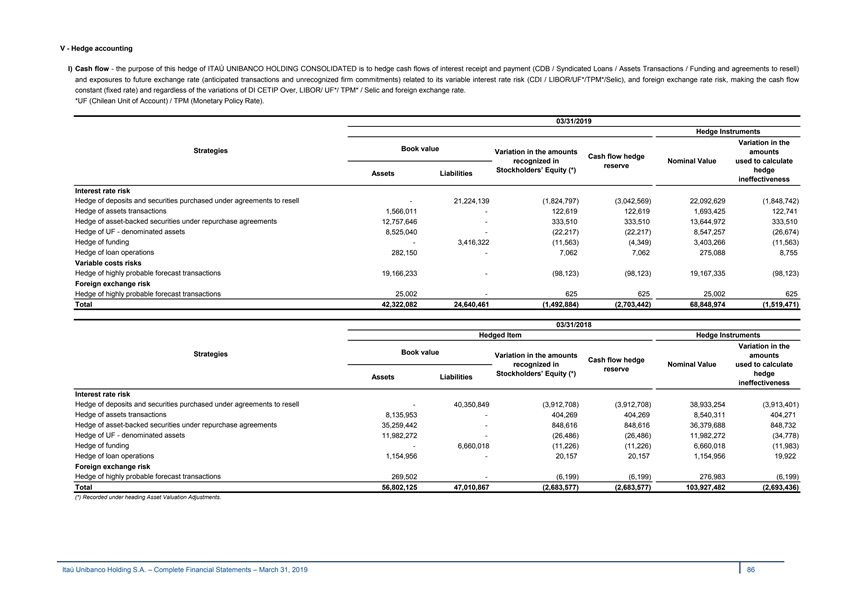
V - Hedge accounting I) Cash flow - the purpose of this hedge of ITAÚ UNIBANCO HOLDING CONSOLIDATED is to hedge cash flows of interest receipt and payment (CDB / Syndicated Loans / Assets Transactions / Funding and agreements to resell) and exposures to future exchange rate (anticipated transactions and unrecognized firm commitments) related to its variable interest rate risk (CDI / LIBOR/UF*/TPM*/Selic), and foreign exchange rate risk, making the cash flow constant (fixed rate) and regardless of the variations of DI CETIP Over, LIBOR/ UF*/ TPM* / Selic and foreign exchange rate. *UF (Chilean Unit of Account) / TPM (Monetary Policy Rate). 03/31/2019 Hedge Instruments Variation in the Book value Strategies Variation in the amounts amounts Cash flow hedge recognized in Nominal Value used to calculate reserve Stockholders’ Equity (*) hedge Assets Liabilities ineffectiveness Interest rate risk Hedge of deposits and securities purchased under agreements to resell - 21,224,139 (1,824,797) (3,042,569) 22,092,629 (1,848,742) Hedge of assets transactions 1,566,011 - 122,619 122,619 1,693,425 122,741 Hedge of asset-backed securities under repurchase agreements 12,757,646 - 333,510 333,510 13,644,972 333,510 Hedge of UF - denominated assets 8,525,040 - (22,217) (22,217) 8,547,257 (26,674) Hedge of funding - 3,416,322 (11,563) (4,349) 3,403,266 (11,563) Hedge of loan operations 282,150 - 7,062 7,062 275,088 8,755 Variable costs risks Hedge of highly probable forecast transactions 19,166,233 - (98,123) (98,123) 19,167,335 (98,123) Foreign exchange risk Hedge of highly probable forecast transactions 25,002 - 625 625 25,002 625 Total 42,322,082 24,640,461 (1,492,884) (2,703,442) 68,848,974 (1,519,471) 03/31/2018 Hedged Item Hedge Instruments Variation in the Book value Strategies Variation in the amounts amounts Cash flow hedge recognized in Nominal Value used to calculate reserve Stockholders’ Equity (*) hedge Assets Liabilities ineffectiveness Interest rate risk Hedge of deposits and securities purchased under agreements to resell - 40,350,849 (3,912,708) (3,912,708) 38,933,254 (3,913,401) Hedge of assets transactions 8,135,953 - 404,269 404,269 8,540,311 404,271 Hedge of asset-backed securities under repurchase agreements 35,259,442 - 848,616 848,616 36,379,688 848,732 Hedge of UF - denominated assets 11,982,272 - (26,486) (26,486) 11,982,272 (34,778) Hedge of funding - 6,660,018 (11,226) (11,226) 6,660,018 (11,983) Hedge of loan operations 1,154,956 - 20,157 20,157 1,154,956 19,922 Foreign exchange risk Hedge of highly probable forecast transactions 269,502 - (6,199) (6,199) 276,983 (6,199) Total 56,802,125 47,010,867 (2,683,577) (2,683,577) 103,927,482 (2,693,436) (*) Recorded under heading Asset Valuation Adjustments. Itaú Unibanco Holding S.A. – Complete Financial Statements – March 31, 2019 86 V - Hedge accounting I) Cash flow - the purpose of this hedge of ITAÚ UNIBANCO HOLDING CONSOLIDATED is to hedge cash flows of interest receipt and payment (CDB / Syndicated Loans / Assets Transactions / Funding and agreements to resell) and exposures to future exchange rate (anticipated transactions and unrecognized firm commitments) related to its variable interest rate risk (CDI / LIBOR/UF*/TPM*/Selic), and foreign exchange rate risk, making the cash flow constant (fixed rate) and regardless of the variations of DI CETIP Over, LIBOR/ UF*/ TPM* / Selic and foreign exchange rate. *UF (Chilean Unit of Account) / TPM (Monetary Policy Rate). 03/31/2019 Hedge Instruments Variation in the Book value Strategies Variation in the amounts amounts Cash flow hedge recognized in Nominal Value used to calculate reserve Stockholders’ Equity (*) hedge Assets Liabilities ineffectiveness Interest rate risk Hedge of deposits and securities purchased under agreements to resell - 21,224,139 (1,824,797) (3,042,569) 22,092,629 (1,848,742) Hedge of assets transactions 1,566,011 - 122,619 122,619 1,693,425 122,741 Hedge of asset-backed securities under repurchase agreements 12,757,646 - 333,510 333,510 13,644,972 333,510 Hedge of UF - denominated assets 8,525,040 - (22,217) (22,217) 8,547,257 (26,674) Hedge of funding - 3,416,322 (11,563) (4,349) 3,403,266 (11,563) Hedge of loan operations 282,150 - 7,062 7,062 275,088 8,755 Variable costs risks Hedge of highly probable forecast transactions 19,166,233 - (98,123) (98,123) 19,167,335 (98,123) Foreign exchange risk Hedge of highly probable forecast transactions 25,002 - 625 625 25,002 625 Total 42,322,082 24,640,461 (1,492,884) (2,703,442) 68,848,974 (1,519,471) 03/31/2018 Hedged Item Hedge Instruments Variation in the Book value Strategies Variation in the amounts amounts Cash flow hedge recognized in Nominal Value used to calculate reserve Stockholders’ Equity (*) hedge Assets Liabilities ineffectiveness Interest rate risk Hedge of deposits and securities purchased under agreements to resell - 40,350,849 (3,912,708) (3,912,708) 38,933,254 (3,913,401) Hedge of assets transactions 8,135,953 - 404,269 404,269 8,540,311 404,271 Hedge of asset-backed securities under repurchase agreements 35,259,442 - 848,616 848,616 36,379,688 848,732 Hedge of UF - denominated assets 11,982,272 - (26,486) (26,486) 11,982,272 (34,778) Hedge of funding - 6,660,018 (11,226) (11,226) 6,660,018 (11,983) Hedge of loan operations 1,154,956 - 20,157 20,157 1,154,956 19,922 Foreign exchange risk Hedge of highly probable forecast transactions 269,502 - (6,199) (6,199) 276,983 (6,199) Total 56,802,125 47,010,867 (2,683,577) (2,683,577) 103,927,482 (2,693,436) (*) Recorded under heading Asset Valuation Adjustments. Itaú Unibanco Holding S.A. – Complete Financial Statements – March 31, 2019 86
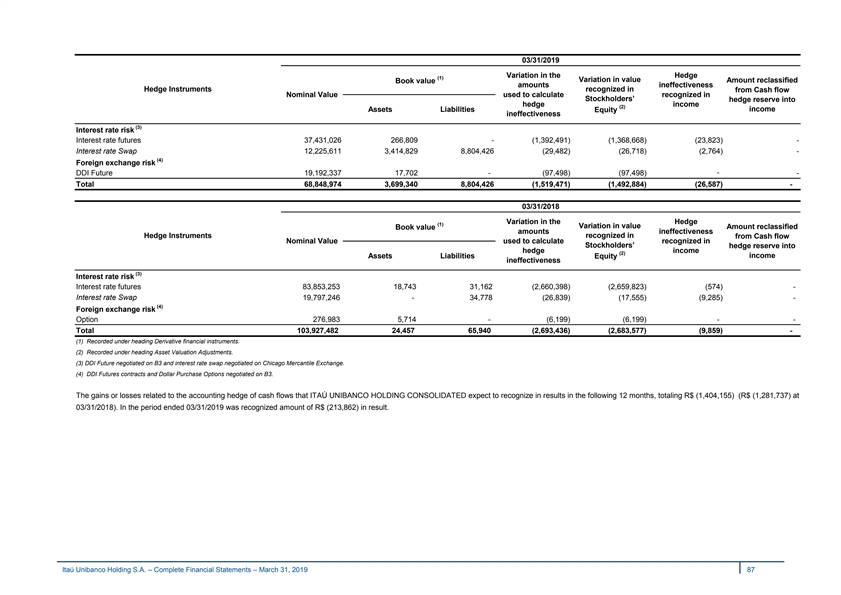
03/31/2019 Variation in the Hedge (1) Variation in value Amount reclassified Book value amounts ineffectiveness Hedge Instruments recognized in from Cash flow Nominal Value used to calculate recognized in Stockholders’ hedge reserve into hedge income (2) income Assets Liabilities Equity ineffectiveness (3) Interest rate risk Interest rate futures 37,431,026 266,809 - (1,392,491) (1,368,668) (23,823) - Interest rate Swap 12,225,611 3,414,829 8,804,426 (29,482) (26,718) (2,764) - (4) Foreign exchange risk DDI Future 19,192,337 17,702 - (97,498) (97,498) - - Total 68,848,974 3,699,340 8,804,426 (1,519,471) (1,492,884) (26,587) - 03/31/2018 Variation in the Hedge (1) Variation in value Amount reclassified Book value amounts ineffectiveness Hedge Instruments recognized in from Cash flow Nominal Value used to calculate recognized in Stockholders’ hedge reserve into hedge income (2) Assets Liabilities Equity income ineffectiveness (3) Interest rate risk Interest rate futures 83,853,253 18,743 31,162 (2,660,398) (2,659,823) (574) - Interest rate Swap 19,797,246 - 34,778 (26,839) (17,555) (9,285) - (4) Foreign exchange risk Option 276,983 5,714 - (6,199) (6,199) - - Total 103,927,482 24,457 65,940 (2,693,436) (2,683,577) (9,859) - (1) Recorded under heading Derivative financial instruments. (2) Recorded under heading Asset Valuation Adjustments. (3) DDI Future negotiated on B3 and interest rate swap negotiated on Chicago Mercantile Exchange. (4) DDI Futures contracts and Dollar Purchase Options negotiated on B3. The gains or losses related to the accounting hedge of cash flows that ITAÚ UNIBANCO HOLDING CONSOLIDATED expect to recognize in results in the following 12 months, totaling R$ (1,404,155) (R$ (1,281,737) at 03/31/2018). In the period ended 03/31/2019 was recognized amount of R$ (213,862) in result. Itaú Unibanco Holding S.A. – Complete Financial Statements – March 31, 2019 87 03/31/2019 Variation in the Hedge (1) Variation in value Amount reclassified Book value amounts ineffectiveness Hedge Instruments recognized in from Cash flow Nominal Value used to calculate recognized in Stockholders’ hedge reserve into hedge income (2) income Assets Liabilities Equity ineffectiveness (3) Interest rate risk Interest rate futures 37,431,026 266,809 - (1,392,491) (1,368,668) (23,823) - Interest rate Swap 12,225,611 3,414,829 8,804,426 (29,482) (26,718) (2,764) - (4) Foreign exchange risk DDI Future 19,192,337 17,702 - (97,498) (97,498) - - Total 68,848,974 3,699,340 8,804,426 (1,519,471) (1,492,884) (26,587) - 03/31/2018 Variation in the Hedge (1) Variation in value Amount reclassified Book value amounts ineffectiveness Hedge Instruments recognized in from Cash flow Nominal Value used to calculate recognized in Stockholders’ hedge reserve into hedge income (2) Assets Liabilities Equity income ineffectiveness (3) Interest rate risk Interest rate futures 83,853,253 18,743 31,162 (2,660,398) (2,659,823) (574) - Interest rate Swap 19,797,246 - 34,778 (26,839) (17,555) (9,285) - (4) Foreign exchange risk Option 276,983 5,714 - (6,199) (6,199) - - Total 103,927,482 24,457 65,940 (2,693,436) (2,683,577) (9,859) - (1) Recorded under heading Derivative financial instruments. (2) Recorded under heading Asset Valuation Adjustments. (3) DDI Future negotiated on B3 and interest rate swap negotiated on Chicago Mercantile Exchange. (4) DDI Futures contracts and Dollar Purchase Options negotiated on B3. The gains or losses related to the accounting hedge of cash flows that ITAÚ UNIBANCO HOLDING CONSOLIDATED expect to recognize in results in the following 12 months, totaling R$ (1,404,155) (R$ (1,281,737) at 03/31/2018). In the period ended 03/31/2019 was recognized amount of R$ (213,862) in result. Itaú Unibanco Holding S.A. – Complete Financial Statements – March 31, 2019 87

II) Market risk – The hedging strategies against market risk of ITAÚ UNIBANCO HOLDING CONSOLIDATED consist of hedge of exposure to variation in market risk, in interest receipts, which are attributable to changes in interest rates related to recognized assets and liabilities. 03/31/2019 Hedged Item Hedge Instruments Variation in the Book value Fair value adjustments Strategies Variation in value amounts recognized in used to calculate Nominal Value (*) hedge income Assets Liabilities Assets Liabilities ineffectiveness Interest rate risk Hedge of loan operations 6,891,750 - 7,005,065 - 113,315 6,891,750 (114,525) Hedge of funding - 9,216,817 - 9,010,732 (206,085) 9,216,817 205,162 Hedge of available-for-sale securities 10,155,010 - 10,430,935 - 275,925 10,491,721 (280,788) Total 17,046,760 9,216,817 17,436,000 9,010,732 183,155 26,600,288 (190,151) 03/31/2018 Hedged Item Hedge Instruments Variation in the Book value Fair value adjustments Strategies Variation in value amounts used to calculate Nominal Value recognized in (*) hedge income Assets Liabilities Assets Liabilities ineffectiveness Interest rate risk Hedge of loan operations 6,515,899 - 6,506,253 - (9,646) 6,515,899 12,553 Hedge of funding - 10,950,238 - 11,027,815 77,577 10,950,238 (75,487) Hedge of syndicated loan - 794,102 - 792,683 (1,419) 794,102 1,229 Hedge of available-for-sale securities 517,650 - 553,661 - 36,011 517,650 (39,645) Total 7,033,549 11,744,340 7,059,914 11,820,498 102,523 18,777,889 (101,350) (*) Recorded under heading Results from Securities and Derivative Financial Instruments. Itaú Unibanco Holding S.A. – Complete Financial Statements – March 31, 2019 88 II) Market risk – The hedging strategies against market risk of ITAÚ UNIBANCO HOLDING CONSOLIDATED consist of hedge of exposure to variation in market risk, in interest receipts, which are attributable to changes in interest rates related to recognized assets and liabilities. 03/31/2019 Hedged Item Hedge Instruments Variation in the Book value Fair value adjustments Strategies Variation in value amounts recognized in used to calculate Nominal Value (*) hedge income Assets Liabilities Assets Liabilities ineffectiveness Interest rate risk Hedge of loan operations 6,891,750 - 7,005,065 - 113,315 6,891,750 (114,525) Hedge of funding - 9,216,817 - 9,010,732 (206,085) 9,216,817 205,162 Hedge of available-for-sale securities 10,155,010 - 10,430,935 - 275,925 10,491,721 (280,788) Total 17,046,760 9,216,817 17,436,000 9,010,732 183,155 26,600,288 (190,151) 03/31/2018 Hedged Item Hedge Instruments Variation in the Book value Fair value adjustments Strategies Variation in value amounts used to calculate Nominal Value recognized in (*) hedge income Assets Liabilities Assets Liabilities ineffectiveness Interest rate risk Hedge of loan operations 6,515,899 - 6,506,253 - (9,646) 6,515,899 12,553 Hedge of funding - 10,950,238 - 11,027,815 77,577 10,950,238 (75,487) Hedge of syndicated loan - 794,102 - 792,683 (1,419) 794,102 1,229 Hedge of available-for-sale securities 517,650 - 553,661 - 36,011 517,650 (39,645) Total 7,033,549 11,744,340 7,059,914 11,820,498 102,523 18,777,889 (101,350) (*) Recorded under heading Results from Securities and Derivative Financial Instruments. Itaú Unibanco Holding S.A. – Complete Financial Statements – March 31, 2019 88
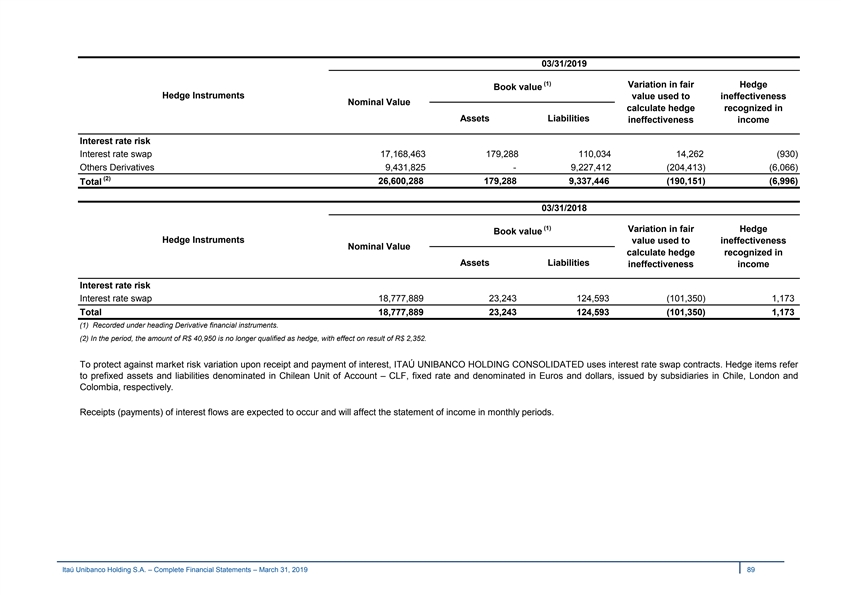
03/31/2019 (1) Variation in fair Hedge Book value Hedge Instruments value used to ineffectiveness Nominal Value calculate hedge recognized in Assets Liabilities ineffectiveness income Interest rate risk Interest rate swap 17,168,463 179,288 110,034 14,262 (930) Others Derivatives 9,431,825 - 9,227,412 (204,413) (6,066) (2) 26,600,288 179,288 9,337,446 (190,151) (6,996) Total 03/31/2018 (1) Variation in fair Hedge Book value Hedge Instruments value used to ineffectiveness Nominal Value calculate hedge recognized in Assets Liabilities ineffectiveness income Interest rate risk Interest rate swap 18,777,889 23,243 124,593 (101,350) 1,173 Total 18,777,889 23,243 124,593 (101,350) 1,173 (1) Recorded under heading Derivative financial instruments. (2) In the period, the amount of R$ 40,950 is no longer qualified as hedge, with effect on result of R$ 2,352. To protect against market risk variation upon receipt and payment of interest, ITAÚ UNIBANCO HOLDING CONSOLIDATED uses interest rate swap contracts. Hedge items refer to prefixed assets and liabilities denominated in Chilean Unit of Account – CLF, fixed rate and denominated in Euros and dollars, issued by subsidiaries in Chile, London and Colombia, respectively. Receipts (payments) of interest flows are expected to occur and will affect the statement of income in monthly periods. Itaú Unibanco Holding S.A. – Complete Financial Statements – March 31, 2019 89 03/31/2019 (1) Variation in fair Hedge Book value Hedge Instruments value used to ineffectiveness Nominal Value calculate hedge recognized in Assets Liabilities ineffectiveness income Interest rate risk Interest rate swap 17,168,463 179,288 110,034 14,262 (930) Others Derivatives 9,431,825 - 9,227,412 (204,413) (6,066) (2) 26,600,288 179,288 9,337,446 (190,151) (6,996) Total 03/31/2018 (1) Variation in fair Hedge Book value Hedge Instruments value used to ineffectiveness Nominal Value calculate hedge recognized in Assets Liabilities ineffectiveness income Interest rate risk Interest rate swap 18,777,889 23,243 124,593 (101,350) 1,173 Total 18,777,889 23,243 124,593 (101,350) 1,173 (1) Recorded under heading Derivative financial instruments. (2) In the period, the amount of R$ 40,950 is no longer qualified as hedge, with effect on result of R$ 2,352. To protect against market risk variation upon receipt and payment of interest, ITAÚ UNIBANCO HOLDING CONSOLIDATED uses interest rate swap contracts. Hedge items refer to prefixed assets and liabilities denominated in Chilean Unit of Account – CLF, fixed rate and denominated in Euros and dollars, issued by subsidiaries in Chile, London and Colombia, respectively. Receipts (payments) of interest flows are expected to occur and will affect the statement of income in monthly periods. Itaú Unibanco Holding S.A. – Complete Financial Statements – March 31, 2019 89
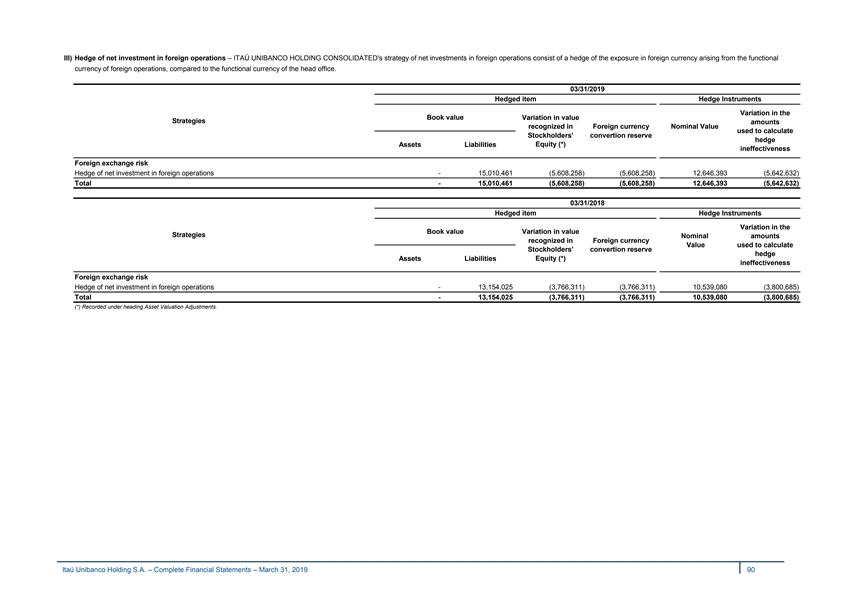
III) Hedge of net investment in foreign operations – ITAÚ UNIBANCO HOLDING CONSOLIDATED's strategy of net investments in foreign operations consist of a hedge of the exposure in foreign currency arising from the functional currency of foreign operations, compared to the functional currency of the head office. 03/31/2019 Hedged item Hedge Instruments Variation in the Book value Variation in value Strategies amounts recognized in Foreign currency Nominal Value used to calculate Stockholders’ convertion reserve hedge Equity (*) Assets Liabilities ineffectiveness Foreign exchange risk Hedge of net investment in foreign operations - 15,010,461 (5,608,258) (5,608,258) 12,646,393 (5,642,632) Total - 15,010,461 (5,608,258) (5,608,258) 12,646,393 (5,642,632) 03/31/2018 Hedged item Hedge Instruments Variation in the Book value Variation in value Strategies Nominal amounts recognized in Foreign currency Value used to calculate Stockholders’ convertion reserve hedge Assets Liabilities Equity (*) ineffectiveness Foreign exchange risk Hedge of net investment in foreign operations - 13,154,025 (3,766,311) (3,766,311) 10,539,080 (3,800,685) Total - 13,154,025 (3,766,311) (3,766,311) 10,539,080 (3,800,685) (*) Recorded under heading Asset Valuation Adjustments. Itaú Unibanco Holding S.A. – Complete Financial Statements – March 31, 2019 90 III) Hedge of net investment in foreign operations – ITAÚ UNIBANCO HOLDING CONSOLIDATED's strategy of net investments in foreign operations consist of a hedge of the exposure in foreign currency arising from the functional currency of foreign operations, compared to the functional currency of the head office. 03/31/2019 Hedged item Hedge Instruments Variation in the Book value Variation in value Strategies amounts recognized in Foreign currency Nominal Value used to calculate Stockholders’ convertion reserve hedge Equity (*) Assets Liabilities ineffectiveness Foreign exchange risk Hedge of net investment in foreign operations - 15,010,461 (5,608,258) (5,608,258) 12,646,393 (5,642,632) Total - 15,010,461 (5,608,258) (5,608,258) 12,646,393 (5,642,632) 03/31/2018 Hedged item Hedge Instruments Variation in the Book value Variation in value Strategies Nominal amounts recognized in Foreign currency Value used to calculate Stockholders’ convertion reserve hedge Assets Liabilities Equity (*) ineffectiveness Foreign exchange risk Hedge of net investment in foreign operations - 13,154,025 (3,766,311) (3,766,311) 10,539,080 (3,800,685) Total - 13,154,025 (3,766,311) (3,766,311) 10,539,080 (3,800,685) (*) Recorded under heading Asset Valuation Adjustments. Itaú Unibanco Holding S.A. – Complete Financial Statements – March 31, 2019 90
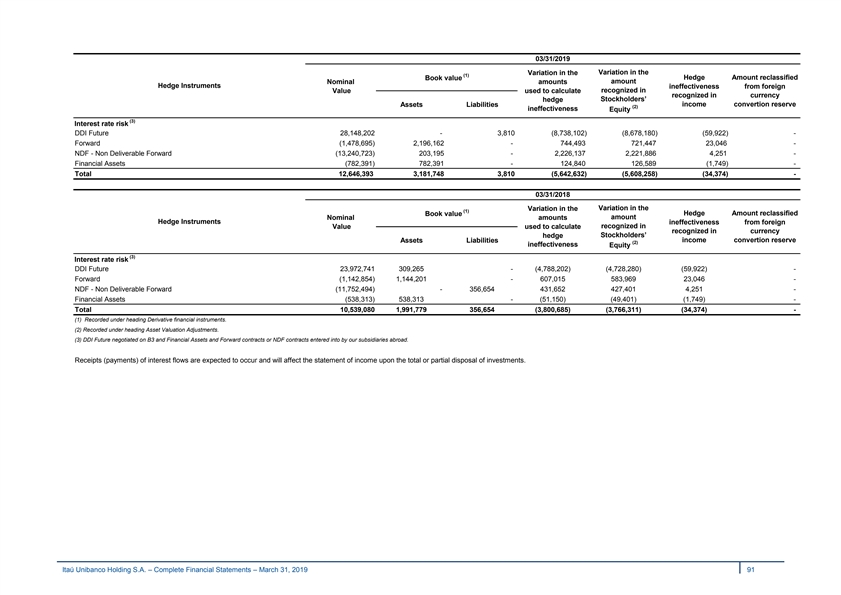
03/31/2019 Variation in the Variation in the (1) Hedge Amount reclassified Book value amount Nominal amounts Hedge Instruments ineffectiveness from foreign recognized in Value used to calculate recognized in currency Stockholders’ hedge income convertion reserve Assets Liabilities (2) ineffectiveness Equity (3) Interest rate risk DDI Future 28,148,202 - 3,810 (8,738,102) (8,678,180) (59,922) - Forward (1,478,695) 2,196,162 - 744,493 721,447 23,046 - NDF - Non Deliverable Forward (13,240,723) 203,195 - 2,226,137 2,221,886 4,251 - Financial Assets (782,391) 782,391 - 124,840 126,589 (1,749) - Total 12,646,393 3,181,748 3,810 (5,642,632) (5,608,258) (34,374) - 03/31/2018 Variation in the Variation in the (1) Hedge Amount reclassified Book value amount Nominal amounts Hedge Instruments ineffectiveness from foreign recognized in Value used to calculate recognized in currency Stockholders’ hedge income convertion reserve Assets Liabilities (2) ineffectiveness Equity (3) Interest rate risk DDI Future 23,972,741 309,265 - (4,788,202) (4,728,280) (59,922) - Forward (1,142,854) 1,144,201 - 607,015 583,969 23,046 - NDF - Non Deliverable Forward (11,752,494) - 356,654 431,652 427,401 4,251 - Financial Assets (538,313) 538,313 - (51,150) (49,401) (1,749) - Total 10,539,080 1,991,779 356,654 (3,800,685) (3,766,311) (34,374) - (1) Recorded under heading Derivative financial instruments. (2) Recorded under heading Asset Valuation Adjustments. (3) DDI Future negotiated on B3 and Financial Assets and Forward contracts or NDF contracts entered into by our subsidiaries abroad. Receipts (payments) of interest flows are expected to occur and will affect the statement of income upon the total or partial disposal of investments. Itaú Unibanco Holding S.A. – Complete Financial Statements – March 31, 2019 91 03/31/2019 Variation in the Variation in the (1) Hedge Amount reclassified Book value amount Nominal amounts Hedge Instruments ineffectiveness from foreign recognized in Value used to calculate recognized in currency Stockholders’ hedge income convertion reserve Assets Liabilities (2) ineffectiveness Equity (3) Interest rate risk DDI Future 28,148,202 - 3,810 (8,738,102) (8,678,180) (59,922) - Forward (1,478,695) 2,196,162 - 744,493 721,447 23,046 - NDF - Non Deliverable Forward (13,240,723) 203,195 - 2,226,137 2,221,886 4,251 - Financial Assets (782,391) 782,391 - 124,840 126,589 (1,749) - Total 12,646,393 3,181,748 3,810 (5,642,632) (5,608,258) (34,374) - 03/31/2018 Variation in the Variation in the (1) Hedge Amount reclassified Book value amount Nominal amounts Hedge Instruments ineffectiveness from foreign recognized in Value used to calculate recognized in currency Stockholders’ hedge income convertion reserve Assets Liabilities (2) ineffectiveness Equity (3) Interest rate risk DDI Future 23,972,741 309,265 - (4,788,202) (4,728,280) (59,922) - Forward (1,142,854) 1,144,201 - 607,015 583,969 23,046 - NDF - Non Deliverable Forward (11,752,494) - 356,654 431,652 427,401 4,251 - Financial Assets (538,313) 538,313 - (51,150) (49,401) (1,749) - Total 10,539,080 1,991,779 356,654 (3,800,685) (3,766,311) (34,374) - (1) Recorded under heading Derivative financial instruments. (2) Recorded under heading Asset Valuation Adjustments. (3) DDI Future negotiated on B3 and Financial Assets and Forward contracts or NDF contracts entered into by our subsidiaries abroad. Receipts (payments) of interest flows are expected to occur and will affect the statement of income upon the total or partial disposal of investments. Itaú Unibanco Holding S.A. – Complete Financial Statements – March 31, 2019 91
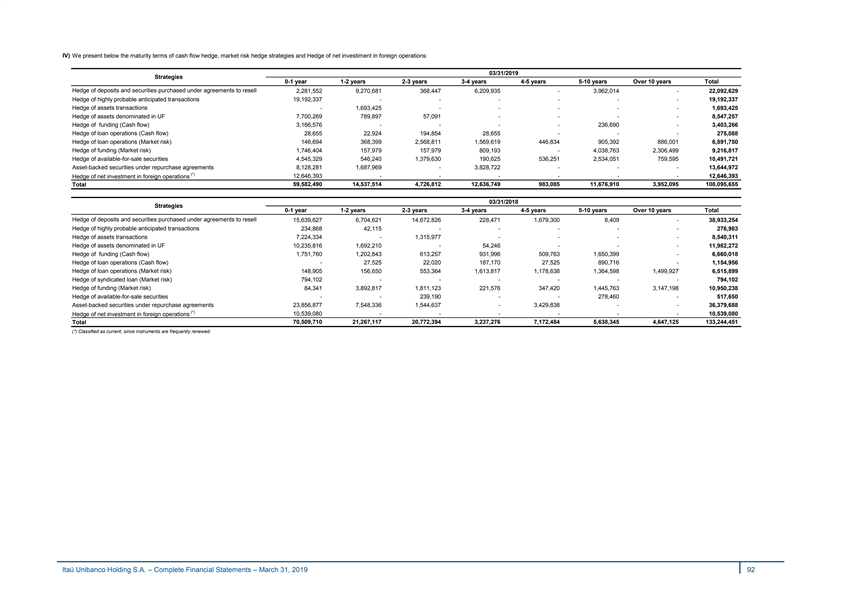
IV) We present below the maturity terms of cash flow hedge, market risk hedge strategies and Hedge of net investiment in foreign operations: 03/31/2019 Strategies 0-1 year 1-2 years 2-3 years 3-4 years 4-5 years 5-10 years Over 10 years Total Hedge of deposits and securities purchased under agreements to resell 2,281,552 9,270,681 368,447 6,209,935 - 3,962,014 - 22,092,629 Hedge of highly probable anticipated transactions 19,192,337 - - - - - - 19,192,337 Hedge of assets transactions - 1,693,425 - - - - - 1,693,425 Hedge of assets denominated in UF 7,700,269 789,897 57,091 - - - - 8,547,257 Hedge of funding (Cash flow) 3,166,576 - - - - 236,690 - 3,403,266 Hedge of loan operations (Cash flow) 28,655 22,924 194,854 28,655 - - - 275,088 Hedge of loan operations (Market risk) 146,694 368,399 2,568,811 1,569,619 446,834 905,392 886,001 6,891,750 Hedge of funding (Market risk) 1,746,404 157,979 157,979 809,193 - 4,038,763 2,306,499 9,216,817 Hedge of available-for-sale securities 4,545,329 546,240 1,379,630 190,625 536,251 2,534,051 759,595 10,491,721 Asset-backed securities under repurchase agreements 8,128,281 1,687,969 - 3,828,722 - - - 13,644,972 (*) Hedge of net investment in foreign operations 12,646,393 - - - - - - 12,646,393 Total 59,582,490 14,537,514 4,726,812 12,636,749 983,085 11,676,910 3,952,095 108,095,655 03/31/2018 Strategies 0-1 year 1-2 years 2-3 years 3-4 years 4-5 years 5-10 years Over 10 years Total Hedge of deposits and securities purchased under agreements to resell 15,639,627 6,704,621 14,672,826 228,471 1,679,300 8,409 - 38,933,254 Hedge of highly probable anticipated transactions 234,868 42,115 - - - - - 276,983 Hedge of assets transactions 7,224,334 - 1,315,977 - - - - 8,540,311 Hedge of assets denominated in UF 10,235,816 1,692,210 - 54,246 - - - 11,982,272 Hedge of funding (Cash flow) 1,751,760 1,202,843 613,257 931,996 509,763 1,650,399 - 6,660,018 Hedge of loan operations (Cash flow) - 27,525 22,020 187,170 27,525 890,716 - 1,154,956 Hedge of loan operations (Market risk) 148,905 156,650 553,364 1,613,817 1,178,638 1,364,598 1,499,927 6,515,899 Hedge of syndicated loan (Market risk) 794,102 - - - - - - 794,102 Hedge of funding (Market risk) 84,341 3,892,817 1,811,123 221,576 347,420 1,445,763 3,147,198 10,950,238 Hedge of available-for-sale securities - - 239,190 - - 278,460 - 517,650 Asset-backed securities under repurchase agreements 23,856,877 7,548,336 1,544,637 - 3,429,838 - - 36,379,688 (*) Hedge of net investment in foreign operations 10,539,080 - - - - - - 10,539,080 Total 70,509,710 21,267,117 20,772,394 3,237,276 7,172,484 5,638,345 4,647,125 133,244,451 (*) Classified as current, since instruments are frequently renewed. Itaú Unibanco Holding S.A. – Complete Financial Statements – March 31, 2019 92 IV) We present below the maturity terms of cash flow hedge, market risk hedge strategies and Hedge of net investiment in foreign operations: 03/31/2019 Strategies 0-1 year 1-2 years 2-3 years 3-4 years 4-5 years 5-10 years Over 10 years Total Hedge of deposits and securities purchased under agreements to resell 2,281,552 9,270,681 368,447 6,209,935 - 3,962,014 - 22,092,629 Hedge of highly probable anticipated transactions 19,192,337 - - - - - - 19,192,337 Hedge of assets transactions - 1,693,425 - - - - - 1,693,425 Hedge of assets denominated in UF 7,700,269 789,897 57,091 - - - - 8,547,257 Hedge of funding (Cash flow) 3,166,576 - - - - 236,690 - 3,403,266 Hedge of loan operations (Cash flow) 28,655 22,924 194,854 28,655 - - - 275,088 Hedge of loan operations (Market risk) 146,694 368,399 2,568,811 1,569,619 446,834 905,392 886,001 6,891,750 Hedge of funding (Market risk) 1,746,404 157,979 157,979 809,193 - 4,038,763 2,306,499 9,216,817 Hedge of available-for-sale securities 4,545,329 546,240 1,379,630 190,625 536,251 2,534,051 759,595 10,491,721 Asset-backed securities under repurchase agreements 8,128,281 1,687,969 - 3,828,722 - - - 13,644,972 (*) Hedge of net investment in foreign operations 12,646,393 - - - - - - 12,646,393 Total 59,582,490 14,537,514 4,726,812 12,636,749 983,085 11,676,910 3,952,095 108,095,655 03/31/2018 Strategies 0-1 year 1-2 years 2-3 years 3-4 years 4-5 years 5-10 years Over 10 years Total Hedge of deposits and securities purchased under agreements to resell 15,639,627 6,704,621 14,672,826 228,471 1,679,300 8,409 - 38,933,254 Hedge of highly probable anticipated transactions 234,868 42,115 - - - - - 276,983 Hedge of assets transactions 7,224,334 - 1,315,977 - - - - 8,540,311 Hedge of assets denominated in UF 10,235,816 1,692,210 - 54,246 - - - 11,982,272 Hedge of funding (Cash flow) 1,751,760 1,202,843 613,257 931,996 509,763 1,650,399 - 6,660,018 Hedge of loan operations (Cash flow) - 27,525 22,020 187,170 27,525 890,716 - 1,154,956 Hedge of loan operations (Market risk) 148,905 156,650 553,364 1,613,817 1,178,638 1,364,598 1,499,927 6,515,899 Hedge of syndicated loan (Market risk) 794,102 - - - - - - 794,102 Hedge of funding (Market risk) 84,341 3,892,817 1,811,123 221,576 347,420 1,445,763 3,147,198 10,950,238 Hedge of available-for-sale securities - - 239,190 - - 278,460 - 517,650 Asset-backed securities under repurchase agreements 23,856,877 7,548,336 1,544,637 - 3,429,838 - - 36,379,688 (*) Hedge of net investment in foreign operations 10,539,080 - - - - - - 10,539,080 Total 70,509,710 21,267,117 20,772,394 3,237,276 7,172,484 5,638,345 4,647,125 133,244,451 (*) Classified as current, since instruments are frequently renewed. Itaú Unibanco Holding S.A. – Complete Financial Statements – March 31, 2019 92
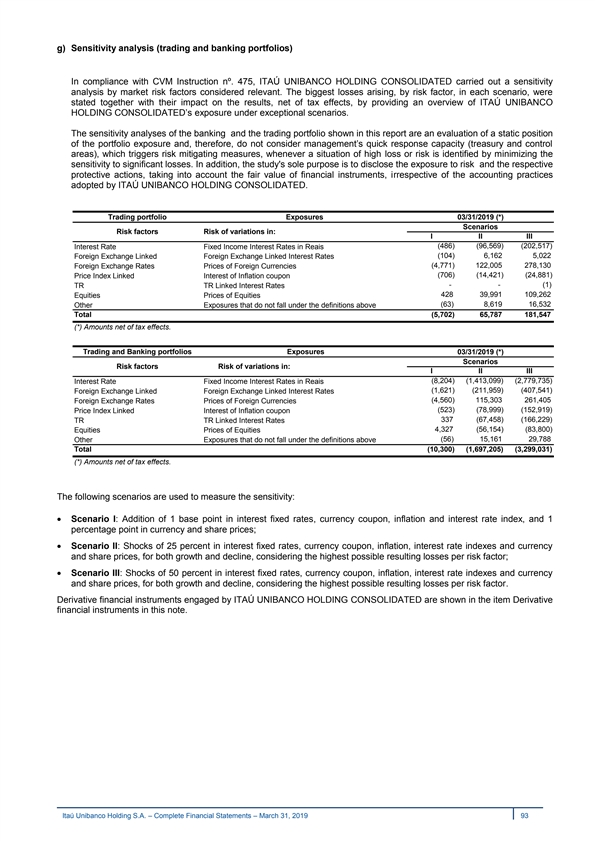
g) Sensitivity analysis (trading and banking portfolios) In compliance with CVM Instruction nº. 475, ITAÚ UNIBANCO HOLDING CONSOLIDATED carried out a sensitivity analysis by market risk factors considered relevant. The biggest losses arising, by risk factor, in each scenario, were stated together with their impact on the results, net of tax effects, by providing an overview of ITAÚ UNIBANCO HOLDING CONSOLIDATED’s exposure under exceptional scenarios. The sensitivity analyses of the banking and the trading portfolio shown in this report are an evaluation of a static position of the portfolio exposure and, therefore, do not consider management’s quick response capacity (treasury and control areas), which triggers risk mitigating measures, whenever a situation of high loss or risk is identified by minimizing the sensitivity to significant losses. In addition, the study's sole purpose is to disclose the exposure to risk and the respective protective actions, taking into account the fair value of financial instruments, irrespective of the accounting practices adopted by ITAÚ UNIBANCO HOLDING CONSOLIDATED. Trading portfolio Exposures 03/31/2019 (*) Scenarios Risk factors Risk of variations in: I II III (486) (96,569) (202,517) Interest Rate Fixed Income Interest Rates in Reais (104) 6,162 5,022 Foreign Exchange Linked Foreign Exchange Linked Interest Rates (4,771) 122,005 278,130 Foreign Exchange Rates Prices of Foreign Currencies (706) (14,421) (24,881) Price Index Linked Interest of Inflation coupon - - (1) TR TR Linked Interest Rates 428 39,991 109,262 Equities Prices of Equities (63) 8,619 16,532 Other Exposures that do not fall under the definitions above Total (5,702) 65,787 181,547 (*) Amounts net of tax effects. Trading and Banking portfolios Exposures 03/31/2019 (*) Scenarios Risk factors Risk of variations in: I II III Interest Rate Fixed Income Interest Rates in Reais (8,204) (1,413,099) (2,779,735) (1,621) (211,959) (407,541) Foreign Exchange Linked Foreign Exchange Linked Interest Rates (4,560) 115,303 261,405 Foreign Exchange Rates Prices of Foreign Currencies (523) (78,999) (152,919) Price Index Linked Interest of Inflation coupon TR TR Linked Interest Rates 337 (67,458) (166,229) 4,327 (56,154) (83,800) Equities Prices of Equities (56) 15,161 29,788 Other Exposures that do not fall under the definitions above Total (10,300) (1,697,205) (3,299,031) (*) Amounts net of tax effects. The following scenarios are used to measure the sensitivity: · Scenario I: Addition of 1 base point in interest fixed rates, currency coupon, inflation and interest rate index, and 1 percentage point in currency and share prices; · Scenario II: Shocks of 25 percent in interest fixed rates, currency coupon, inflation, interest rate indexes and currency and share prices, for both growth and decline, considering the highest possible resulting losses per risk factor; · Scenario III: Shocks of 50 percent in interest fixed rates, currency coupon, inflation, interest rate indexes and currency and share prices, for both growth and decline, considering the highest possible resulting losses per risk factor. Derivative financial instruments engaged by ITAÚ UNIBANCO HOLDING CONSOLIDATED are shown in the item Derivative financial instruments in this note. Itaú Unibanco Holding S.A. – Complete Financial Statements – March 31, 2019 93 g) Sensitivity analysis (trading and banking portfolios) In compliance with CVM Instruction nº. 475, ITAÚ UNIBANCO HOLDING CONSOLIDATED carried out a sensitivity analysis by market risk factors considered relevant. The biggest losses arising, by risk factor, in each scenario, were stated together with their impact on the results, net of tax effects, by providing an overview of ITAÚ UNIBANCO HOLDING CONSOLIDATED’s exposure under exceptional scenarios. The sensitivity analyses of the banking and the trading portfolio shown in this report are an evaluation of a static position of the portfolio exposure and, therefore, do not consider management’s quick response capacity (treasury and control areas), which triggers risk mitigating measures, whenever a situation of high loss or risk is identified by minimizing the sensitivity to significant losses. In addition, the study's sole purpose is to disclose the exposure to risk and the respective protective actions, taking into account the fair value of financial instruments, irrespective of the accounting practices adopted by ITAÚ UNIBANCO HOLDING CONSOLIDATED. Trading portfolio Exposures 03/31/2019 (*) Scenarios Risk factors Risk of variations in: I II III (486) (96,569) (202,517) Interest Rate Fixed Income Interest Rates in Reais (104) 6,162 5,022 Foreign Exchange Linked Foreign Exchange Linked Interest Rates (4,771) 122,005 278,130 Foreign Exchange Rates Prices of Foreign Currencies (706) (14,421) (24,881) Price Index Linked Interest of Inflation coupon - - (1) TR TR Linked Interest Rates 428 39,991 109,262 Equities Prices of Equities (63) 8,619 16,532 Other Exposures that do not fall under the definitions above Total (5,702) 65,787 181,547 (*) Amounts net of tax effects. Trading and Banking portfolios Exposures 03/31/2019 (*) Scenarios Risk factors Risk of variations in: I II III Interest Rate Fixed Income Interest Rates in Reais (8,204) (1,413,099) (2,779,735) (1,621) (211,959) (407,541) Foreign Exchange Linked Foreign Exchange Linked Interest Rates (4,560) 115,303 261,405 Foreign Exchange Rates Prices of Foreign Currencies (523) (78,999) (152,919) Price Index Linked Interest of Inflation coupon TR TR Linked Interest Rates 337 (67,458) (166,229) 4,327 (56,154) (83,800) Equities Prices of Equities (56) 15,161 29,788 Other Exposures that do not fall under the definitions above Total (10,300) (1,697,205) (3,299,031) (*) Amounts net of tax effects. The following scenarios are used to measure the sensitivity: · Scenario I: Addition of 1 base point in interest fixed rates, currency coupon, inflation and interest rate index, and 1 percentage point in currency and share prices; · Scenario II: Shocks of 25 percent in interest fixed rates, currency coupon, inflation, interest rate indexes and currency and share prices, for both growth and decline, considering the highest possible resulting losses per risk factor; · Scenario III: Shocks of 50 percent in interest fixed rates, currency coupon, inflation, interest rate indexes and currency and share prices, for both growth and decline, considering the highest possible resulting losses per risk factor. Derivative financial instruments engaged by ITAÚ UNIBANCO HOLDING CONSOLIDATED are shown in the item Derivative financial instruments in this note. Itaú Unibanco Holding S.A. – Complete Financial Statements – March 31, 2019 93
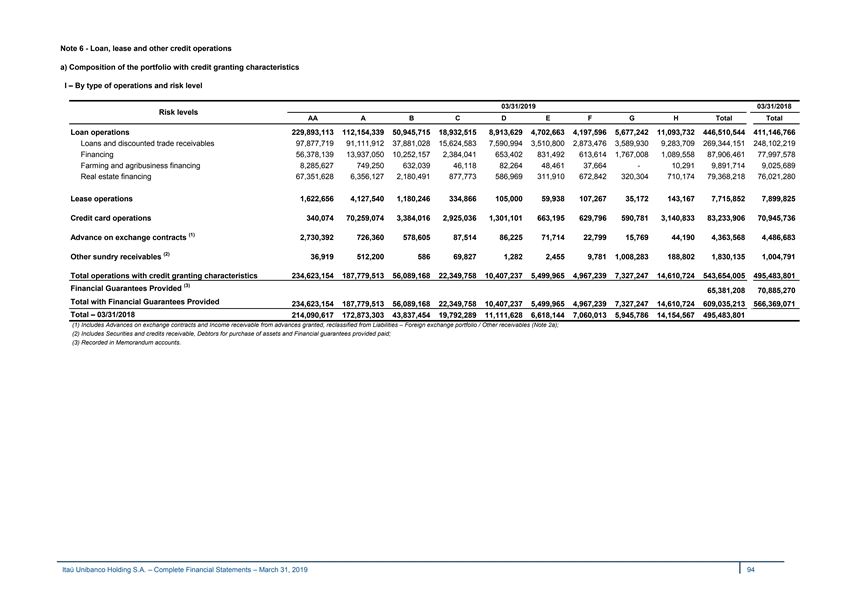
Note 6 - Loan, lease and other credit operations a) Composition of the portfolio with credit granting characteristics I – By type of operations and risk level 03/31/2019 03/31/2018 Risk levels AA A B C D E F G H Total Total Loan operations 229,893,113 112,154,339 50,945,715 18,932,515 8,913,629 4,702,663 4,197,596 5,677,242 11,093,732 446,510,544 411,146,766 Loans and discounted trade receivables 97,877,719 91,111,912 37,881,028 15,624,583 7,590,994 3,510,800 2,873,476 3,589,930 9,283,709 269,344,151 248,102,219 Financing 56,378,139 13,937,050 10,252,157 2,384,041 653,402 831,492 613,614 1,767,008 1,089,558 87,906,461 77,997,578 Farming and agribusiness financing 8,285,627 749,250 632,039 46,118 82,264 48,461 37,664 - 10,291 9,891,714 9,025,689 Real estate financing 67,351,628 6,356,127 2,180,491 877,773 586,969 311,910 672,842 320,304 710,174 79,368,218 76,021,280 Lease operations 1,622,656 4,127,540 1,180,246 334,866 105,000 59,938 107,267 35,172 143,167 7,715,852 7,899,825 Credit card operations 340,074 70,259,074 3,384,016 2,925,036 1,301,101 663,195 629,796 590,781 3,140,833 83,233,906 70,945,736 (1) Advance on exchange contracts 2,730,392 726,360 578,605 87,514 86,225 71,714 22,799 15,769 44,190 4,363,568 4,486,683 (2) Other sundry receivables 36,919 512,200 586 69,827 1,282 2,455 9,781 1,008,283 188,802 1,830,135 1,004,791 Total operations with credit granting characteristics 234,623,154 187,779,513 56,089,168 22,349,758 10,407,237 5,499,965 4,967,239 7,327,247 14,610,724 543,654,005 495,483,801 (3) Financial Guarantees Provided 65,381,208 70,885,270 Total with Financial Guarantees Provided 234,623,154 187,779,513 56,089,168 22,349,758 10,407,237 5,499,965 4,967,239 7,327,247 14,610,724 609,035,213 566,369,071 Total – 03/31/2018 214,090,617 172,873,303 43,837,454 19,792,289 11,111,628 6,618,144 7,060,013 5,945,786 14,154,567 495,483,801 (1) Includes Advances on exchange contracts and Income receivable from advances granted, reclassified from Liabilities – Foreign exchange portfolio / Other receivables (Note 2a); (2) Includes Securities and credits receivable, Debtors for purchase of assets and Financial guarantees provided paid; (3) Recorded in Memorandum accounts. Itaú Unibanco Holding S.A. – Complete Financial Statements – March 31, 2019 94 Note 6 - Loan, lease and other credit operations a) Composition of the portfolio with credit granting characteristics I – By type of operations and risk level 03/31/2019 03/31/2018 Risk levels AA A B C D E F G H Total Total Loan operations 229,893,113 112,154,339 50,945,715 18,932,515 8,913,629 4,702,663 4,197,596 5,677,242 11,093,732 446,510,544 411,146,766 Loans and discounted trade receivables 97,877,719 91,111,912 37,881,028 15,624,583 7,590,994 3,510,800 2,873,476 3,589,930 9,283,709 269,344,151 248,102,219 Financing 56,378,139 13,937,050 10,252,157 2,384,041 653,402 831,492 613,614 1,767,008 1,089,558 87,906,461 77,997,578 Farming and agribusiness financing 8,285,627 749,250 632,039 46,118 82,264 48,461 37,664 - 10,291 9,891,714 9,025,689 Real estate financing 67,351,628 6,356,127 2,180,491 877,773 586,969 311,910 672,842 320,304 710,174 79,368,218 76,021,280 Lease operations 1,622,656 4,127,540 1,180,246 334,866 105,000 59,938 107,267 35,172 143,167 7,715,852 7,899,825 Credit card operations 340,074 70,259,074 3,384,016 2,925,036 1,301,101 663,195 629,796 590,781 3,140,833 83,233,906 70,945,736 (1) Advance on exchange contracts 2,730,392 726,360 578,605 87,514 86,225 71,714 22,799 15,769 44,190 4,363,568 4,486,683 (2) Other sundry receivables 36,919 512,200 586 69,827 1,282 2,455 9,781 1,008,283 188,802 1,830,135 1,004,791 Total operations with credit granting characteristics 234,623,154 187,779,513 56,089,168 22,349,758 10,407,237 5,499,965 4,967,239 7,327,247 14,610,724 543,654,005 495,483,801 (3) Financial Guarantees Provided 65,381,208 70,885,270 Total with Financial Guarantees Provided 234,623,154 187,779,513 56,089,168 22,349,758 10,407,237 5,499,965 4,967,239 7,327,247 14,610,724 609,035,213 566,369,071 Total – 03/31/2018 214,090,617 172,873,303 43,837,454 19,792,289 11,111,628 6,618,144 7,060,013 5,945,786 14,154,567 495,483,801 (1) Includes Advances on exchange contracts and Income receivable from advances granted, reclassified from Liabilities – Foreign exchange portfolio / Other receivables (Note 2a); (2) Includes Securities and credits receivable, Debtors for purchase of assets and Financial guarantees provided paid; (3) Recorded in Memorandum accounts. Itaú Unibanco Holding S.A. – Complete Financial Statements – March 31, 2019 94

II – By maturity and risk level 03/31/2019 03/31/2018 AA A B C D E F G H Total Total (1) (2) Overdue Operations Falling due installments - - 2,030,843 1,801,107 1,398,357 1,152,513 1,442,155 1,450,917 3,699,595 12,975,487 13,067,465 01 to 30 - - 75,984 93,000 72,162 54,572 55,999 55,770 199,981 607,468 559,196 31 to 60 - - 70,623 78,938 64,676 52,205 52,973 42,911 187,355 549,681 442,076 61 to 90 - - 62,579 75,324 71,731 45,605 52,384 47,528 169,257 524,408 405,671 91 to 180 - - 194,846 198,916 163,013 132,169 139,158 117,878 458,989 1,404,969 1,120,490 181 to 365 - - 262,960 323,022 257,820 209,895 226,402 209,543 773,735 2,263,377 2,153,899 Over 365 - - 1,363,851 1,031,907 768,955 658,067 915,239 977,287 1,910,278 7,625,584 8,386,133 Overdue installments - - 1,050,385 1,217,892 1,231,087 1,057,758 1,263,115 1,513,413 7,227,624 14,561,274 13,474,389 01 to 14 - - 9,695 37,199 27,886 22,690 23,127 19,932 81,489 222,018 211,612 15 to 30 - - 832,966 117,030 118,220 101,203 114,553 64,753 134,143 1,482,868 1,679,094 31 to 60 - - 207,724 911,312 209,795 173,356 148,762 95,835 325,437 2,072,221 1,910,186 61 to 90 - - - 125,579 813,077 128,363 158,779 308,377 309,836 1,844,011 1,496,188 91 to 180 - - - 26,772 62,109 586,550 733,459 903,293 1,946,510 4,258,693 3,862,315 181 to 365 - - - - - 45,596 84,435 121,223 4,170,495 4,421,749 4,121,258 Over 365 - - - - - - - - 259,714 259,714 193,736 Subtotal (a) - - 3,081,228 3,018,999 2,629,444 2,210,271 2,705,270 2,964,330 10,927,219 27,536,761 26,541,854 Specific allowance (b) - - (30,812) (90,570) (262,944) ( 663,082) (1,352,635) ( 2,075,031) (10,927,219) (15,402,293) ( 14,418,375) Subtotal - 03/31/2018 - - 3,282,932 2,866,570 2,595,608 2,169,538 3,092,091 2,306,781 10,228,334 26,541,854 Non-overdue operations Falling due installments 233,269,428 185,767,585 52,465,594 19,056,127 7,447,572 3,224,568 2,203,794 4,205,778 3,602,520 511,242,966 465,075,012 01 to 30 28,399,525 41,839,857 8,565,268 3,423,933 1,308,322 375,165 198,358 220,970 504,652 84,836,050 74,809,584 31 to 60 12,148,693 17,890,337 3,728,587 1,346,173 424,048 154,571 133,086 77,957 386,848 36,290,300 30,494,360 61 to 90 11,370,499 12,897,150 3,254,470 1,016,739 377,102 153,950 109,094 276,495 182,416 29,637,915 25,470,351 91 to 180 22,695,521 24,968,638 5,805,515 2,193,807 794,674 329,376 310,282 214,603 324,560 57,636,976 48,546,161 181 to 365 28,601,006 26,581,667 7,643,128 3,041,058 1,057,006 381,263 379,452 226,126 588,917 68,499,623 60,477,582 Over 365 130,054,184 61,589,936 23,468,626 8,034,417 3,486,420 1,830,243 1,073,522 3,189,627 1,615,127 234,342,102 225,276,974 Overdue up to 14 days 1,353,726 2,011,928 542,346 274,632 330,221 65,126 58,175 157,139 80,985 4,874,278 3,866,935 Subtotal (c) 234,623,154 187,779,513 53,007,940 19,330,759 7,777,793 3,289,694 2,261,969 4,362,917 3,683,505 516,117,244 468,941,947 Generic allowance (d) - (938,898) ( 530,079) ( 579,923) ( 777,779) (986,907) (1,130,985) (3,054,042) (3,683,505) (11,682,118) ( 12,421,365) Subtotal - 03/31/2018 214,090,617 172,873,303 40,554,522 16,925,719 8,516,020 4,448,606 3,967,922 3,639,005 3,926,233 468,941,947 234,623,154 187,779,513 56,089,168 22,349,758 10,407,237 5,499,965 4,967,239 7,327,247 14,610,724 543,654,005 495,483,801 Portfolio total (a + c) Existing allowance - ( 938,898) ( 560,891) (670,493) ( 1,040,723) ( 2,933,316) ( 4,966,743) ( 7,326,514) (14,610,724) (34,205,818) (36,660,820) Minimum required (b + d) - ( 938,898) (560,891) (670,493) (1,040,723) (1,649,989) ( 2,483,620) ( 5,129,073) ( 14,610,724) (27,084,411) (26,839,740) Additional - - - - - (1,283,327) ( 2,483,123) ( 2,197,441) - (7,121,407) (9,821,080) (3) Financial Guarantees - - - - - - - - - (1,157,516) (1,862,591) (4) Additional - - - - - (1,283,327) ( 2,483,123) (2,197,441) - (5,963,891) (7,958,489) Portfolio total at 03/31/2018 214,090,617 172,873,303 43,837,454 19,792,289 11,111,628 6,618,144 7,060,013 5,945,786 14,154,567 495,483,801 Existing allowance at 03/31/2018 - (864,367) (438,374) ( 593,769) ( 1,111,163) ( 4,631,491) ( 7,059,307) (5,945,191) ( 14,154,567) ( 36,660,820) Minimum required - (864,367) ( 438,374) (593,769) (1,111,163) (1,985,443) ( 3,530,007) ( 4,162,050) (14,154,567) ( 26,839,740) Additional - - - - - (2,646,048) ( 3,529,300) (1,783,141) - (9,821,080) (3) Financial Guarantees - - - - - - - - - (1,862,591) (4) Additional - - - - - (2,646,048) (3,529,300) (1,783,141) - (7,958,489) (1) Operations with overdue installments for more than 14 days or under control of administrators or in companies in the process of declaring bankruptcy; (2) The balance of non-accrual operations amounts to R$19,696,540 (R$ 18,526,432 at 03/31/2018); (3) Provision for financial guarantees provided, recorded in Other liabilities - Sundry, in the Consolidated Balance Sheet; (4) Related to expected and potential loss. Itaú Unibanco Holding S.A. – Complete Financial Statements – March 31, 2019 95 II – By maturity and risk level 03/31/2019 03/31/2018 AA A B C D E F G H Total Total (1) (2) Overdue Operations Falling due installments - - 2,030,843 1,801,107 1,398,357 1,152,513 1,442,155 1,450,917 3,699,595 12,975,487 13,067,465 01 to 30 - - 75,984 93,000 72,162 54,572 55,999 55,770 199,981 607,468 559,196 31 to 60 - - 70,623 78,938 64,676 52,205 52,973 42,911 187,355 549,681 442,076 61 to 90 - - 62,579 75,324 71,731 45,605 52,384 47,528 169,257 524,408 405,671 91 to 180 - - 194,846 198,916 163,013 132,169 139,158 117,878 458,989 1,404,969 1,120,490 181 to 365 - - 262,960 323,022 257,820 209,895 226,402 209,543 773,735 2,263,377 2,153,899 Over 365 - - 1,363,851 1,031,907 768,955 658,067 915,239 977,287 1,910,278 7,625,584 8,386,133 Overdue installments - - 1,050,385 1,217,892 1,231,087 1,057,758 1,263,115 1,513,413 7,227,624 14,561,274 13,474,389 01 to 14 - - 9,695 37,199 27,886 22,690 23,127 19,932 81,489 222,018 211,612 15 to 30 - - 832,966 117,030 118,220 101,203 114,553 64,753 134,143 1,482,868 1,679,094 31 to 60 - - 207,724 911,312 209,795 173,356 148,762 95,835 325,437 2,072,221 1,910,186 61 to 90 - - - 125,579 813,077 128,363 158,779 308,377 309,836 1,844,011 1,496,188 91 to 180 - - - 26,772 62,109 586,550 733,459 903,293 1,946,510 4,258,693 3,862,315 181 to 365 - - - - - 45,596 84,435 121,223 4,170,495 4,421,749 4,121,258 Over 365 - - - - - - - - 259,714 259,714 193,736 Subtotal (a) - - 3,081,228 3,018,999 2,629,444 2,210,271 2,705,270 2,964,330 10,927,219 27,536,761 26,541,854 Specific allowance (b) - - (30,812) (90,570) (262,944) ( 663,082) (1,352,635) ( 2,075,031) (10,927,219) (15,402,293) ( 14,418,375) Subtotal - 03/31/2018 - - 3,282,932 2,866,570 2,595,608 2,169,538 3,092,091 2,306,781 10,228,334 26,541,854 Non-overdue operations Falling due installments 233,269,428 185,767,585 52,465,594 19,056,127 7,447,572 3,224,568 2,203,794 4,205,778 3,602,520 511,242,966 465,075,012 01 to 30 28,399,525 41,839,857 8,565,268 3,423,933 1,308,322 375,165 198,358 220,970 504,652 84,836,050 74,809,584 31 to 60 12,148,693 17,890,337 3,728,587 1,346,173 424,048 154,571 133,086 77,957 386,848 36,290,300 30,494,360 61 to 90 11,370,499 12,897,150 3,254,470 1,016,739 377,102 153,950 109,094 276,495 182,416 29,637,915 25,470,351 91 to 180 22,695,521 24,968,638 5,805,515 2,193,807 794,674 329,376 310,282 214,603 324,560 57,636,976 48,546,161 181 to 365 28,601,006 26,581,667 7,643,128 3,041,058 1,057,006 381,263 379,452 226,126 588,917 68,499,623 60,477,582 Over 365 130,054,184 61,589,936 23,468,626 8,034,417 3,486,420 1,830,243 1,073,522 3,189,627 1,615,127 234,342,102 225,276,974 Overdue up to 14 days 1,353,726 2,011,928 542,346 274,632 330,221 65,126 58,175 157,139 80,985 4,874,278 3,866,935 Subtotal (c) 234,623,154 187,779,513 53,007,940 19,330,759 7,777,793 3,289,694 2,261,969 4,362,917 3,683,505 516,117,244 468,941,947 Generic allowance (d) - (938,898) ( 530,079) ( 579,923) ( 777,779) (986,907) (1,130,985) (3,054,042) (3,683,505) (11,682,118) ( 12,421,365) Subtotal - 03/31/2018 214,090,617 172,873,303 40,554,522 16,925,719 8,516,020 4,448,606 3,967,922 3,639,005 3,926,233 468,941,947 234,623,154 187,779,513 56,089,168 22,349,758 10,407,237 5,499,965 4,967,239 7,327,247 14,610,724 543,654,005 495,483,801 Portfolio total (a + c) Existing allowance - ( 938,898) ( 560,891) (670,493) ( 1,040,723) ( 2,933,316) ( 4,966,743) ( 7,326,514) (14,610,724) (34,205,818) (36,660,820) Minimum required (b + d) - ( 938,898) (560,891) (670,493) (1,040,723) (1,649,989) ( 2,483,620) ( 5,129,073) ( 14,610,724) (27,084,411) (26,839,740) Additional - - - - - (1,283,327) ( 2,483,123) ( 2,197,441) - (7,121,407) (9,821,080) (3) Financial Guarantees - - - - - - - - - (1,157,516) (1,862,591) (4) Additional - - - - - (1,283,327) ( 2,483,123) (2,197,441) - (5,963,891) (7,958,489) Portfolio total at 03/31/2018 214,090,617 172,873,303 43,837,454 19,792,289 11,111,628 6,618,144 7,060,013 5,945,786 14,154,567 495,483,801 Existing allowance at 03/31/2018 - (864,367) (438,374) ( 593,769) ( 1,111,163) ( 4,631,491) ( 7,059,307) (5,945,191) ( 14,154,567) ( 36,660,820) Minimum required - (864,367) ( 438,374) (593,769) (1,111,163) (1,985,443) ( 3,530,007) ( 4,162,050) (14,154,567) ( 26,839,740) Additional - - - - - (2,646,048) ( 3,529,300) (1,783,141) - (9,821,080) (3) Financial Guarantees - - - - - - - - - (1,862,591) (4) Additional - - - - - (2,646,048) (3,529,300) (1,783,141) - (7,958,489) (1) Operations with overdue installments for more than 14 days or under control of administrators or in companies in the process of declaring bankruptcy; (2) The balance of non-accrual operations amounts to R$19,696,540 (R$ 18,526,432 at 03/31/2018); (3) Provision for financial guarantees provided, recorded in Other liabilities - Sundry, in the Consolidated Balance Sheet; (4) Related to expected and potential loss. Itaú Unibanco Holding S.A. – Complete Financial Statements – March 31, 2019 95
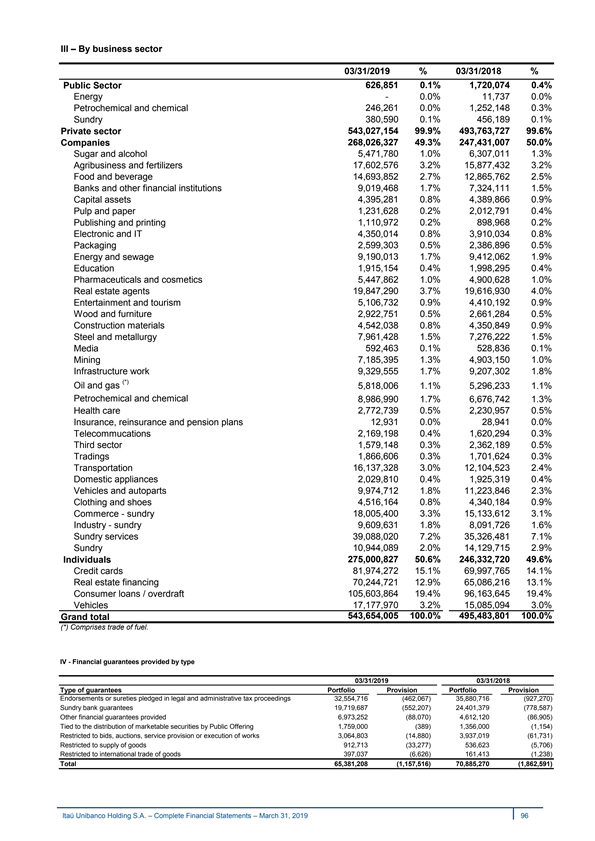
III – By business sector 03/31/2019 % 03/31/2018 % 626,851 0.1% 1,720,074 0.4% Public Sector Energy - 0.0% 11,737 0.0% Petrochemical and chemical 246,261 0.0% 1,252,148 0.3% Sundry 380,590 0.1% 456,189 0.1% 543,027,154 99.9% 493,763,727 99.6% Private sector Companies 268,026,327 49.3% 247,431,007 50.0% Sugar and alcohol 5,471,780 1.0% 6,307,011 1.3% Agribusiness and fertilizers 17,602,576 3.2% 15,877,432 3.2% Food and beverage 14,693,852 2.7% 12,865,762 2.5% 9,019,468 1.7% 7,324,111 1.5% Banks and other financial institutions Capital assets 4,395,281 0.8% 4,389,866 0.9% 1,231,628 0.2% 2,012,791 0.4% Pulp and paper Publishing and printing 1,110,972 0.2% 898,968 0.2% Electronic and IT 4,350,014 0.8% 3,910,034 0.8% Packaging 2,599,303 0.5% 2,386,896 0.5% Energy and sewage 9,190,013 1.7% 9,412,062 1.9% Education 1,915,154 0.4% 1,998,295 0.4% Pharmaceuticals and cosmetics 5,447,862 1.0% 4,900,628 1.0% Real estate agents 19,847,290 3.7% 19,616,930 4.0% Entertainment and tourism 5,106,732 0.9% 4,410,192 0.9% Wood and furniture 2,922,751 0.5% 2,661,284 0.5% Construction materials 4,542,038 0.8% 4,350,849 0.9% 7,961,428 1.5% 7,276,222 1.5% Steel and metallurgy Media 592,463 0.1% 528,836 0.1% Mining 7,185,395 1.3% 4,903,150 1.0% Infrastructure work 9,329,555 1.7% 9,207,302 1.8% (*) Oil and gas 5,818,006 1.1% 5,296,233 1.1% Petrochemical and chemical 8,986,990 1.7% 6,676,742 1.3% Health care 2,772,739 0.5% 2,230,957 0.5% Insurance, reinsurance and pension plans 12,931 0.0% 28,941 0.0% Telecommucations 2,169,198 0.4% 1,620,294 0.3% Third sector 1,579,148 0.3% 2,362,189 0.5% Tradings 1,866,606 0.3% 1,701,624 0.3% Transportation 16,137,328 3.0% 12,104,523 2.4% Domestic appliances 2,029,810 0.4% 1,925,319 0.4% 9,974,712 1.8% 11,223,846 2.3% Vehicles and autoparts Clothing and shoes 4,516,164 0.8% 4,340,184 0.9% Commerce - sundry 18,005,400 3.3% 15,133,612 3.1% Industry - sundry 9,609,631 1.8% 8,091,726 1.6% Sundry services 39,088,020 7.2% 35,326,481 7.1% Sundry 10,944,089 2.0% 14,129,715 2.9% 275,000,827 50.6% 246,332,720 49.6% Individuals Credit cards 81,974,272 15.1% 69,997,765 14.1% Real estate financing 70,244,721 12.9% 65,086,216 13.1% Consumer loans / overdraft 105,603,864 19.4% 96,163,645 19.4% Vehicles 17,177,970 3.2% 15,085,094 3.0% 543,654,005 100.0% 495,483,801 100.0% Grand total (*) Comprises trade of fuel. IV - Financial guarantees provided by type 03/31/2019 03/31/2018 Type of guarantees Portfolio Provision Portfolio Provision Endorsements or sureties pledged in legal and administrative tax proceedings 32,554,716 (462,067) 35,880,716 (927,270) Sundry bank guarantees 19,719,687 (552,207) 24,401,379 (778,587) Other financial guarantees provided 6,973,252 (88,070) 4,612,120 (86,905) Tied to the distribution of marketable securities by Public Offering 1,759,000 (389) 1,356,000 (1,154) Restricted to bids, auctions, service provision or execution of works 3,064,803 (14,880) 3,937,019 (61,731) Restricted to supply of goods 912,713 (33,277) 536,623 (5,706) Restricted to international trade of goods 397,037 (6,626) 161,413 (1,238) Total 65,381,208 (1,157,516) 70,885,270 (1,862,591) Itaú Unibanco Holding S.A. – Complete Financial Statements – March 31, 2019 96 III – By business sector 03/31/2019 % 03/31/2018 % 626,851 0.1% 1,720,074 0.4% Public Sector Energy - 0.0% 11,737 0.0% Petrochemical and chemical 246,261 0.0% 1,252,148 0.3% Sundry 380,590 0.1% 456,189 0.1% 543,027,154 99.9% 493,763,727 99.6% Private sector Companies 268,026,327 49.3% 247,431,007 50.0% Sugar and alcohol 5,471,780 1.0% 6,307,011 1.3% Agribusiness and fertilizers 17,602,576 3.2% 15,877,432 3.2% Food and beverage 14,693,852 2.7% 12,865,762 2.5% 9,019,468 1.7% 7,324,111 1.5% Banks and other financial institutions Capital assets 4,395,281 0.8% 4,389,866 0.9% 1,231,628 0.2% 2,012,791 0.4% Pulp and paper Publishing and printing 1,110,972 0.2% 898,968 0.2% Electronic and IT 4,350,014 0.8% 3,910,034 0.8% Packaging 2,599,303 0.5% 2,386,896 0.5% Energy and sewage 9,190,013 1.7% 9,412,062 1.9% Education 1,915,154 0.4% 1,998,295 0.4% Pharmaceuticals and cosmetics 5,447,862 1.0% 4,900,628 1.0% Real estate agents 19,847,290 3.7% 19,616,930 4.0% Entertainment and tourism 5,106,732 0.9% 4,410,192 0.9% Wood and furniture 2,922,751 0.5% 2,661,284 0.5% Construction materials 4,542,038 0.8% 4,350,849 0.9% 7,961,428 1.5% 7,276,222 1.5% Steel and metallurgy Media 592,463 0.1% 528,836 0.1% Mining 7,185,395 1.3% 4,903,150 1.0% Infrastructure work 9,329,555 1.7% 9,207,302 1.8% (*) Oil and gas 5,818,006 1.1% 5,296,233 1.1% Petrochemical and chemical 8,986,990 1.7% 6,676,742 1.3% Health care 2,772,739 0.5% 2,230,957 0.5% Insurance, reinsurance and pension plans 12,931 0.0% 28,941 0.0% Telecommucations 2,169,198 0.4% 1,620,294 0.3% Third sector 1,579,148 0.3% 2,362,189 0.5% Tradings 1,866,606 0.3% 1,701,624 0.3% Transportation 16,137,328 3.0% 12,104,523 2.4% Domestic appliances 2,029,810 0.4% 1,925,319 0.4% 9,974,712 1.8% 11,223,846 2.3% Vehicles and autoparts Clothing and shoes 4,516,164 0.8% 4,340,184 0.9% Commerce - sundry 18,005,400 3.3% 15,133,612 3.1% Industry - sundry 9,609,631 1.8% 8,091,726 1.6% Sundry services 39,088,020 7.2% 35,326,481 7.1% Sundry 10,944,089 2.0% 14,129,715 2.9% 275,000,827 50.6% 246,332,720 49.6% Individuals Credit cards 81,974,272 15.1% 69,997,765 14.1% Real estate financing 70,244,721 12.9% 65,086,216 13.1% Consumer loans / overdraft 105,603,864 19.4% 96,163,645 19.4% Vehicles 17,177,970 3.2% 15,085,094 3.0% 543,654,005 100.0% 495,483,801 100.0% Grand total (*) Comprises trade of fuel. IV - Financial guarantees provided by type 03/31/2019 03/31/2018 Type of guarantees Portfolio Provision Portfolio Provision Endorsements or sureties pledged in legal and administrative tax proceedings 32,554,716 (462,067) 35,880,716 (927,270) Sundry bank guarantees 19,719,687 (552,207) 24,401,379 (778,587) Other financial guarantees provided 6,973,252 (88,070) 4,612,120 (86,905) Tied to the distribution of marketable securities by Public Offering 1,759,000 (389) 1,356,000 (1,154) Restricted to bids, auctions, service provision or execution of works 3,064,803 (14,880) 3,937,019 (61,731) Restricted to supply of goods 912,713 (33,277) 536,623 (5,706) Restricted to international trade of goods 397,037 (6,626) 161,413 (1,238) Total 65,381,208 (1,157,516) 70,885,270 (1,862,591) Itaú Unibanco Holding S.A. – Complete Financial Statements – March 31, 2019 96
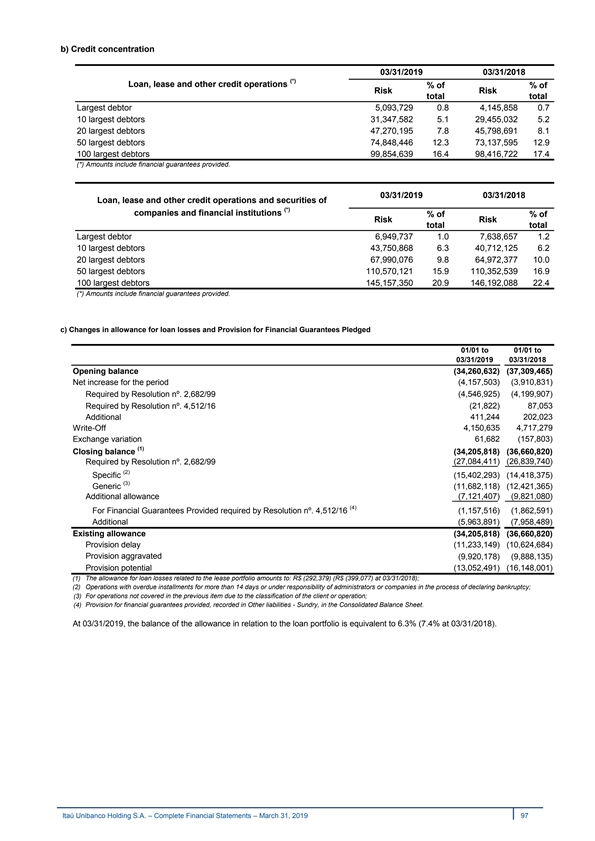
b) Credit concentration 03/31/2019 03/31/2018 (*) Loan, lease and other credit operations % of % of Risk Risk total total Largest debtor 5,093,729 0.8 4,145,858 0.7 10 largest debtors 31,347,582 5.1 29,455,032 5.2 20 largest debtors 47,270,195 7.8 45,798,691 8.1 50 largest debtors 74,848,446 12.3 73,137,595 12.9 100 largest debtors 99,854,639 16.4 98,416,722 17.4 (*) Amounts include financial guarantees provided. 03/31/2019 03/31/2018 Loan, lease and other credit operations and securities of (*) companies and financial institutions % of % of Risk Risk total total Largest debtor 6,949,737 1.0 7,638,657 1.2 10 largest debtors 43,750,868 6.3 40,712,125 6.2 20 largest debtors 67,990,076 9.8 64,972,377 10.0 50 largest debtors 110,570,121 15.9 110,352,539 16.9 100 largest debtors 145,157,350 20.9 146,192,088 22.4 (*) Amounts include financial guarantees provided. c) Changes in allowance for loan losses and Provision for Financial Guarantees Pledged 01/01 to 01/01 to 03/31/2019 03/31/2018 Opening balance (34,260,632) (37,309,465) (4,157,503) (3,910,831) Net increase for the period Required by Resolution nº. 2,682/99 (4,546,925) (4,199,907) Required by Resolution nº. 4,512/16 (21,822) 87,053 Additional 411,244 202,023 Write-Off 4,150,635 4,717,279 61,682 (157,803) Exchange variation (1) Closing balance (34,205,818) (36,660,820) Required by Resolution nº. 2,682/99 (27,084,411) (26,839,740) (2) Specific (15,402,293) (14,418,375) (3) Generic (11,682,118) (12,421,365) Additional allowance (7,121,407) (9,821,080) (4) For Financial Guarantees Provided required by Resolution nº. 4,512/16 (1,157,516) (1,862,591) Additional (5,963,891) (7,958,489) Existing allowance (34,205,818) (36,660,820) Provision delay (11,233,149) (10,624,684) Provision aggravated (9,920,178) (9,888,135) Provision potential (13,052,491) (16,148,001) (1) The allowance for loan losses related to the lease portfolio amounts to: R$ (292,379) (R$ (399,077) at 03/31/2018); (2) Operations with overdue installments for more than 14 days or under responsibility of administrators or companies in the process of declaring bankruptcy; (3) For operations not covered in the previous item due to the classification of the client or operation; (4) Provision for financial guarantees provided, recorded in Other liabilities - Sundry, in the Consolidated Balance Sheet. At 03/31/2019, the balance of the allowance in relation to the loan portfolio is equivalent to 6.3% (7.4% at 03/31/2018). Itaú Unibanco Holding S.A. – Complete Financial Statements – March 31, 2019 97 b) Credit concentration 03/31/2019 03/31/2018 (*) Loan, lease and other credit operations % of % of Risk Risk total total Largest debtor 5,093,729 0.8 4,145,858 0.7 10 largest debtors 31,347,582 5.1 29,455,032 5.2 20 largest debtors 47,270,195 7.8 45,798,691 8.1 50 largest debtors 74,848,446 12.3 73,137,595 12.9 100 largest debtors 99,854,639 16.4 98,416,722 17.4 (*) Amounts include financial guarantees provided. 03/31/2019 03/31/2018 Loan, lease and other credit operations and securities of (*) companies and financial institutions % of % of Risk Risk total total Largest debtor 6,949,737 1.0 7,638,657 1.2 10 largest debtors 43,750,868 6.3 40,712,125 6.2 20 largest debtors 67,990,076 9.8 64,972,377 10.0 50 largest debtors 110,570,121 15.9 110,352,539 16.9 100 largest debtors 145,157,350 20.9 146,192,088 22.4 (*) Amounts include financial guarantees provided. c) Changes in allowance for loan losses and Provision for Financial Guarantees Pledged 01/01 to 01/01 to 03/31/2019 03/31/2018 Opening balance (34,260,632) (37,309,465) (4,157,503) (3,910,831) Net increase for the period Required by Resolution nº. 2,682/99 (4,546,925) (4,199,907) Required by Resolution nº. 4,512/16 (21,822) 87,053 Additional 411,244 202,023 Write-Off 4,150,635 4,717,279 61,682 (157,803) Exchange variation (1) Closing balance (34,205,818) (36,660,820) Required by Resolution nº. 2,682/99 (27,084,411) (26,839,740) (2) Specific (15,402,293) (14,418,375) (3) Generic (11,682,118) (12,421,365) Additional allowance (7,121,407) (9,821,080) (4) For Financial Guarantees Provided required by Resolution nº. 4,512/16 (1,157,516) (1,862,591) Additional (5,963,891) (7,958,489) Existing allowance (34,205,818) (36,660,820) Provision delay (11,233,149) (10,624,684) Provision aggravated (9,920,178) (9,888,135) Provision potential (13,052,491) (16,148,001) (1) The allowance for loan losses related to the lease portfolio amounts to: R$ (292,379) (R$ (399,077) at 03/31/2018); (2) Operations with overdue installments for more than 14 days or under responsibility of administrators or companies in the process of declaring bankruptcy; (3) For operations not covered in the previous item due to the classification of the client or operation; (4) Provision for financial guarantees provided, recorded in Other liabilities - Sundry, in the Consolidated Balance Sheet. At 03/31/2019, the balance of the allowance in relation to the loan portfolio is equivalent to 6.3% (7.4% at 03/31/2018). Itaú Unibanco Holding S.A. – Complete Financial Statements – March 31, 2019 97

d) Renegotiation of credits 03/31/2019 03/31/2018 Allowance for Allowance for (1) (1) % % Portfolio Portfolio Loan Losses Loan Losses Total renegotiated loans 27,635,981 ( 11,438,352) 41.4% 27,585,198 (11,106,507) 40.3% (2) ( 10,867,635) 2,978,178 27.4% (9,603,347) 2,165,041 22.5% (-) Renegotiated loans overdue up to 30 days (2) 16,768,346 ( 8,460,174) 50.5% 17,981,851 (8,941,466) 49.7% Renegotiated loans overdue over 30 days (1) The amounts related to renegotiated loans up to 30 days of the Lease Portfolio are: R$ 115,939 (R$ 135,932 at 03/31/2018); (2) Delays determined upon renegotiation. e) Restricted operations on assets See below the information related to the restricted operations involving assets, in accordance with CMN Resolution nº. 2,921, of January 17, 2002. 01/01 to 01/01 to 03/31/2019 03/31/2018 03/31/2019 03/31/2018 Over 365 Income Income 0 - 30 31 - 180 Total Total days (expenses) (expenses) Restricted operations on assets Loan operations 254,535 536,935 8,495,220 9,286,690 6,547,340 134,295 109,535 Liabilities - restricted operations on assets 422,074 848,741 8,492,181 9,762,996 6,339,966 (125,977) (103,346) Foreign borrowing through securities Net revenue from restricted operations 8,318 6,189 At 03/31/2019 and 03/31/2018 there were no balances in default. Itaú Unibanco Holding S.A. – Complete Financial Statements – March 31, 2019 98 d) Renegotiation of credits 03/31/2019 03/31/2018 Allowance for Allowance for (1) (1) % % Portfolio Portfolio Loan Losses Loan Losses Total renegotiated loans 27,635,981 ( 11,438,352) 41.4% 27,585,198 (11,106,507) 40.3% (2) ( 10,867,635) 2,978,178 27.4% (9,603,347) 2,165,041 22.5% (-) Renegotiated loans overdue up to 30 days (2) 16,768,346 ( 8,460,174) 50.5% 17,981,851 (8,941,466) 49.7% Renegotiated loans overdue over 30 days (1) The amounts related to renegotiated loans up to 30 days of the Lease Portfolio are: R$ 115,939 (R$ 135,932 at 03/31/2018); (2) Delays determined upon renegotiation. e) Restricted operations on assets See below the information related to the restricted operations involving assets, in accordance with CMN Resolution nº. 2,921, of January 17, 2002. 01/01 to 01/01 to 03/31/2019 03/31/2018 03/31/2019 03/31/2018 Over 365 Income Income 0 - 30 31 - 180 Total Total days (expenses) (expenses) Restricted operations on assets Loan operations 254,535 536,935 8,495,220 9,286,690 6,547,340 134,295 109,535 Liabilities - restricted operations on assets 422,074 848,741 8,492,181 9,762,996 6,339,966 (125,977) (103,346) Foreign borrowing through securities Net revenue from restricted operations 8,318 6,189 At 03/31/2019 and 03/31/2018 there were no balances in default. Itaú Unibanco Holding S.A. – Complete Financial Statements – March 31, 2019 98
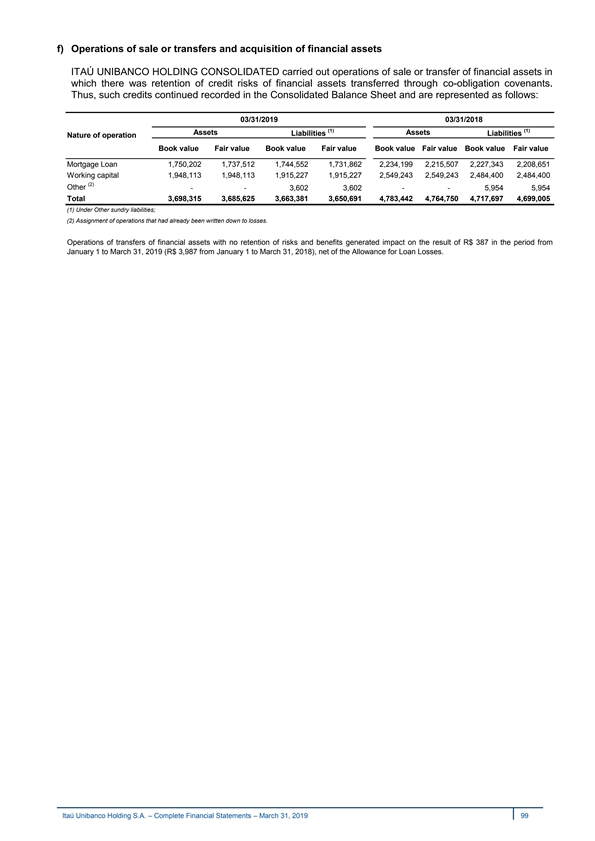
f) Operations of sale or transfers and acquisition of financial assets ITAÚ UNIBANCO HOLDING CONSOLIDATED carried out operations of sale or transfer of financial assets in which there was retention of credit risks of financial assets transferred through co-obligation covenants. Thus, such credits continued recorded in the Consolidated Balance Sheet and are represented as follows: 03/31/2019 03/31/2018 (1) (1) Assets Assets Liabilities Liabilities Nature of operation Book value Fair value Book value Fair value Book value Fair value Book value Fair value Mortgage Loan 1,750,202 1,737,512 1,744,552 1,731,862 2,234,199 2,215,507 2,227,343 2,208,651 Working capital 1,948,113 1,948,113 1,915,227 1,915,227 2,549,243 2,549,243 2,484,400 2,484,400 (2) Other - - 3,602 3,602 - - 5,954 5,954 Total 3,698,315 3,685,625 3,663,381 3,650,691 4,783,442 4,764,750 4,717,697 4,699,005 (1) Under Other sundry liabilities; (2) Assignment of operations that had already been written down to losses. Operations of transfers of financial assets with no retention of risks and benefits generated impact on the result of R$ 387 in the period from January 1 to March 31, 2019 (R$ 3,987 from January 1 to March 31, 2018), net of the Allowance for Loan Losses. Itaú Unibanco Holding S.A. – Complete Financial Statements – March 31, 2019 99 f) Operations of sale or transfers and acquisition of financial assets ITAÚ UNIBANCO HOLDING CONSOLIDATED carried out operations of sale or transfer of financial assets in which there was retention of credit risks of financial assets transferred through co-obligation covenants. Thus, such credits continued recorded in the Consolidated Balance Sheet and are represented as follows: 03/31/2019 03/31/2018 (1) (1) Assets Assets Liabilities Liabilities Nature of operation Book value Fair value Book value Fair value Book value Fair value Book value Fair value Mortgage Loan 1,750,202 1,737,512 1,744,552 1,731,862 2,234,199 2,215,507 2,227,343 2,208,651 Working capital 1,948,113 1,948,113 1,915,227 1,915,227 2,549,243 2,549,243 2,484,400 2,484,400 (2) Other - - 3,602 3,602 - - 5,954 5,954 Total 3,698,315 3,685,625 3,663,381 3,650,691 4,783,442 4,764,750 4,717,697 4,699,005 (1) Under Other sundry liabilities; (2) Assignment of operations that had already been written down to losses. Operations of transfers of financial assets with no retention of risks and benefits generated impact on the result of R$ 387 in the period from January 1 to March 31, 2019 (R$ 3,987 from January 1 to March 31, 2018), net of the Allowance for Loan Losses. Itaú Unibanco Holding S.A. – Complete Financial Statements – March 31, 2019 99
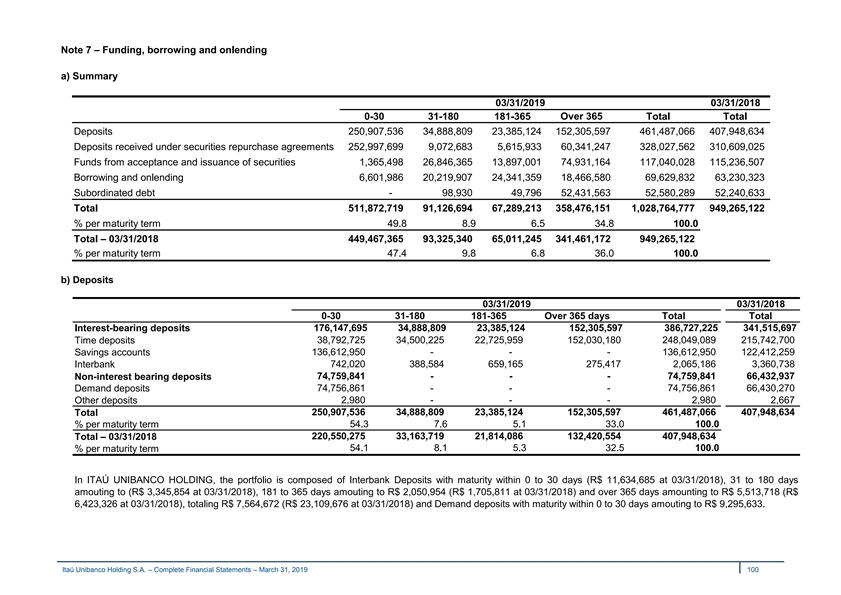
Note 7 – Funding, borrowing and onlending a) Summary 03/31/2019 03/31/2018 Over 365 0-30 31-180 181-365 Total Total days Deposits 250,907,536 34,888,809 23,385,124 152,305,597 461,487,066 407,948,634 Deposits received under securities repurchase agreements 252,997,699 9,072,683 5,615,933 60,341,247 328,027,562 310,609,025 Funds from acceptance and issuance of securities 1,365,498 26,846,365 13,897,001 74,931,164 117,040,028 115,236,507 Borrowing and onlending 6,601,986 20,219,907 24,341,359 18,466,580 69,629,832 63,230,323 Subordinated debt - 98,930 49,796 52,431,563 52,580,289 52,240,633 Total 511,872,719 91,126,694 67,289,213 358,476,151 1,028,764,777 949,265,122 % per maturity term 49.8 8.9 6.5 34.8 100.0 Total – 03/31/2018 449,467,365 93,325,340 65,011,245 341,461,172 949,265,122 % per maturity term 47.4 9.8 6.8 36.0 100.0 b) Deposits 03/31/2019 03/31/2018 0-30 31-180 181-365 Over 365 days Total Total Interest-bearing deposits 176,147,695 34,888,809 23,385,124 152,305,597 386,727,225 341,515,697 Time deposits 38,792,725 34,500,225 22,725,959 152,030,180 248,049,089 215,742,700 Savings accounts 136,612,950 - - - 136,612,950 122,412,259 Interbank 742,020 388,584 659,165 275,417 2,065,186 3,360,738 74,759,841 - - - 74,759,841 66,432,937 Non-interest bearing deposits 74,756,861 - - - 74,756,861 66,430,270 Demand deposits 2,980 - - - 2,980 2,667 Other deposits 250,907,536 34,888,809 23,385,124 152,305,597 461,487,066 407,948,634 Total 54.3 7.6 5.1 33.0 100.0 % per maturity term 220,550,275 33,163,719 21,814,086 132,420,554 407,948,634 Total – 03/31/2018 54.1 8.1 5.3 32.5 100.0 % per maturity term In ITAÚ UNIBANCO HOLDING, the portfolio is composed of Interbank Deposits with maturity within 0 to 30 days (R$ 11,634,685 at 03/31/2018), 31 to 180 days amouting to (R$ 3,345,854 at 03/31/2018), 181 to 365 days amouting to R$ 2,050,954 (R$ 1,705,811 at 03/31/2018) and over 365 days amounting to R$ 5,513,718 (R$ 6,423,326 at 03/31/2018), totaling R$ 7,564,672 (R$ 23,109,676 at 03/31/2018) and Demand deposits with maturity within 0 to 30 days amouting to R$ 9,295,633. Itaú Unibanco Holding S.A. – Complete Financial Statements – March 31, 2019 100 Note 7 – Funding, borrowing and onlending a) Summary 03/31/2019 03/31/2018 Over 365 0-30 31-180 181-365 Total Total days Deposits 250,907,536 34,888,809 23,385,124 152,305,597 461,487,066 407,948,634 Deposits received under securities repurchase agreements 252,997,699 9,072,683 5,615,933 60,341,247 328,027,562 310,609,025 Funds from acceptance and issuance of securities 1,365,498 26,846,365 13,897,001 74,931,164 117,040,028 115,236,507 Borrowing and onlending 6,601,986 20,219,907 24,341,359 18,466,580 69,629,832 63,230,323 Subordinated debt - 98,930 49,796 52,431,563 52,580,289 52,240,633 Total 511,872,719 91,126,694 67,289,213 358,476,151 1,028,764,777 949,265,122 % per maturity term 49.8 8.9 6.5 34.8 100.0 Total – 03/31/2018 449,467,365 93,325,340 65,011,245 341,461,172 949,265,122 % per maturity term 47.4 9.8 6.8 36.0 100.0 b) Deposits 03/31/2019 03/31/2018 0-30 31-180 181-365 Over 365 days Total Total Interest-bearing deposits 176,147,695 34,888,809 23,385,124 152,305,597 386,727,225 341,515,697 Time deposits 38,792,725 34,500,225 22,725,959 152,030,180 248,049,089 215,742,700 Savings accounts 136,612,950 - - - 136,612,950 122,412,259 Interbank 742,020 388,584 659,165 275,417 2,065,186 3,360,738 74,759,841 - - - 74,759,841 66,432,937 Non-interest bearing deposits 74,756,861 - - - 74,756,861 66,430,270 Demand deposits 2,980 - - - 2,980 2,667 Other deposits 250,907,536 34,888,809 23,385,124 152,305,597 461,487,066 407,948,634 Total 54.3 7.6 5.1 33.0 100.0 % per maturity term 220,550,275 33,163,719 21,814,086 132,420,554 407,948,634 Total – 03/31/2018 54.1 8.1 5.3 32.5 100.0 % per maturity term In ITAÚ UNIBANCO HOLDING, the portfolio is composed of Interbank Deposits with maturity within 0 to 30 days (R$ 11,634,685 at 03/31/2018), 31 to 180 days amouting to (R$ 3,345,854 at 03/31/2018), 181 to 365 days amouting to R$ 2,050,954 (R$ 1,705,811 at 03/31/2018) and over 365 days amounting to R$ 5,513,718 (R$ 6,423,326 at 03/31/2018), totaling R$ 7,564,672 (R$ 23,109,676 at 03/31/2018) and Demand deposits with maturity within 0 to 30 days amouting to R$ 9,295,633. Itaú Unibanco Holding S.A. – Complete Financial Statements – March 31, 2019 100

c) Deposits received under securities repurchase agreements 03/31/2019 03/31/2018 Over 365 0 - 30 31 - 180 181 - 365 Total Total days 63,928,181 6,828,625 2,078,581 5,414,387 78,249,774 98,022,871 Own portfolio Government securities 53,542,971 - 4,505 - 53,547,476 45,277,834 Corporate Securities 8,355,108 - - - 8,355,108 7,265,747 1,498,475 6,812,896 1,977,469 5,047,228 15,336,068 45,029,883 Own issue Foreign 531,627 15,729 96,607 367,159 1,011,122 449,407 181,717,028 - - - 181,717,028 143,645,491 Third-party portfolio 7,352,490 2,244,058 3,537,352 54,926,860 68,060,760 68,940,663 Free portfolio Total 252,997,699 9,072,683 5,615,933 60,341,247 328,027,562 310,609,025 % per maturity term 77.1 2.8 1.7 18.4 100.0 Total – 03/31/2018 213,479,703 9,598,055 15,756,799 71,774,468 310,609,025 % per maturity term 68.7 3.1 5.1 23.1 100.0 Itaú Unibanco Holding S.A. – Complete Financial Statements – March 31, 2019 101 c) Deposits received under securities repurchase agreements 03/31/2019 03/31/2018 Over 365 0 - 30 31 - 180 181 - 365 Total Total days 63,928,181 6,828,625 2,078,581 5,414,387 78,249,774 98,022,871 Own portfolio Government securities 53,542,971 - 4,505 - 53,547,476 45,277,834 Corporate Securities 8,355,108 - - - 8,355,108 7,265,747 1,498,475 6,812,896 1,977,469 5,047,228 15,336,068 45,029,883 Own issue Foreign 531,627 15,729 96,607 367,159 1,011,122 449,407 181,717,028 - - - 181,717,028 143,645,491 Third-party portfolio 7,352,490 2,244,058 3,537,352 54,926,860 68,060,760 68,940,663 Free portfolio Total 252,997,699 9,072,683 5,615,933 60,341,247 328,027,562 310,609,025 % per maturity term 77.1 2.8 1.7 18.4 100.0 Total – 03/31/2018 213,479,703 9,598,055 15,756,799 71,774,468 310,609,025 % per maturity term 68.7 3.1 5.1 23.1 100.0 Itaú Unibanco Holding S.A. – Complete Financial Statements – March 31, 2019 101
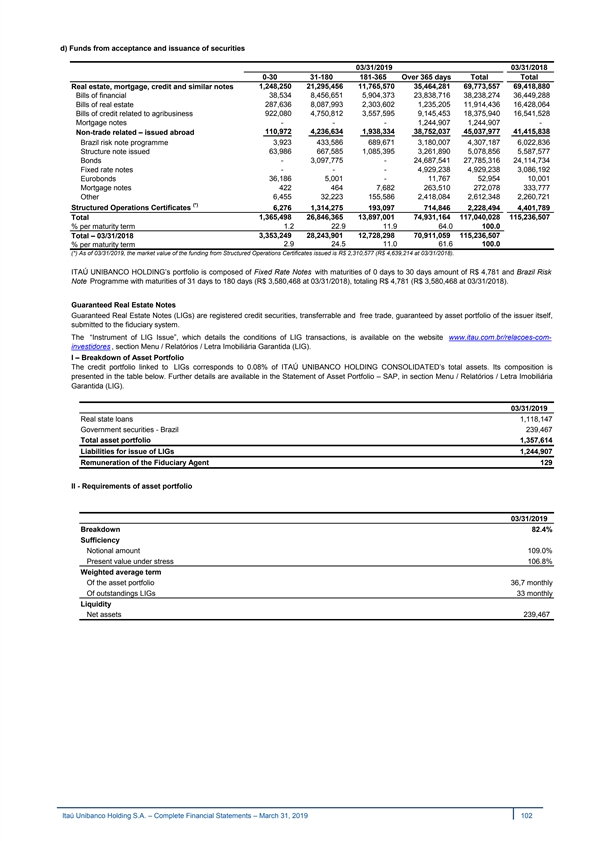
d) Funds from acceptance and issuance of securities 03/31/2019 03/31/2018 0-30 31-180 181-365 Over 365 days Total Total Real estate, mortgage, credit and similar notes 1,248,250 21,295,456 11,765,570 35,464,281 69,773,557 69,418,880 Bills of financial 38,534 8,456,651 5,904,373 23,838,716 38,238,274 36,449,288 Bills of real estate 287,636 8,087,993 2,303,602 1,235,205 11,914,436 16,428,064 Bills of credit related to agribusiness 922,080 4,750,812 3,557,595 9,145,453 18,375,940 16,541,528 Mortgage notes - - - 1,244,907 1,244,907 - 110,972 4,236,634 1,938,334 38,752,037 45,037,977 41,415,838 Non-trade related – issued abroad Brazil risk note programme 3,923 433,586 689,671 3,180,007 4,307,187 6,022,836 Structure note issued 63,986 667,585 1,085,395 3,261,890 5,078,856 5,587,577 Bonds - 3,097,775 - 24,687,541 27,785,316 24,114,734 - - - 4,929,238 4,929,238 3,086,192 Fixed rate notes 36,186 5,001 - 11,767 52,954 10,001 Eurobonds Mortgage notes 422 464 7,682 263,510 272,078 333,777 Other 6,455 32,223 155,586 2,418,084 2,612,348 2,260,721 (*) Structured Operations Certificates 6,276 1,314,275 193,097 714,846 2,228,494 4,401,789 Total 1,365,498 26,846,365 13,897,001 74,931,164 117,040,028 115,236,507 % per maturity term 1.2 22.9 11.9 64.0 100.0 3,353,249 28,243,901 12,728,298 70,911,059 115,236,507 Total – 03/31/2018 2.9 24.5 11.0 61.6 100.0 % per maturity term (*) As of 03/31/2019, the market value of the funding from Structured Operations Certificates issued is R$ 2,310,577 (R$ 4,639,214 at 03/31/2018). ITAÚ UNIBANCO HOLDING’s portfolio is composed of Fixed Rate Notes with maturities of 0 days to 30 days amount of R$ 4,781 and Brazil Risk Note Programme with maturities of 31 days to 180 days (R$ 3,580,468 at 03/31/2018), totaling R$ 4,781 (R$ 3,580,468 at 03/31/2018). Guaranteed Real Estate Notes Guaranteed Real Estate Notes (LIGs) are registered credit securities, transferrable and free trade, guaranteed by asset portfolio of the issuer itself, submitted to the fiduciary system. The “Instrument of LIG Issue”, which details the conditions of LIG transactions, is available on the website www.itau.com.br/relacoes-com- investidores , section Menu / Relatórios / Letra Imobiliária Garantida (LIG). I – Breakdown of Asset Portfolio The credit portfolio linked to LIGs corresponds to 0.08% of ITAÚ UNIBANCO HOLDING CONSOLIDATED’s total assets. Its composition is presented in the table below. Further details are available in the Statement of Asset Portfolio – SAP, in section Menu / Relatórios / Letra Imobiliária Garantida (LIG). 03/31/2019 Real state loans 1,118,147 Government securities - Brazil 239,467 Total asset portfolio 1,357,614 Liabilities for issue of LIGs 1,244,907 Remuneration of the Fiduciary Agent 129 II - Requirements of asset portfolio 03/31/2019 Breakdown 82.4% Sufficiency Notional amount 109.0% Present value under stress 106.8% Weighted average term Of the asset portfolio 36,7 monthly Of outstandings LIGs 33 monthly Liquidity Net assets 239,467 Itaú Unibanco Holding S.A. – Complete Financial Statements – March 31, 2019 102 d) Funds from acceptance and issuance of securities 03/31/2019 03/31/2018 0-30 31-180 181-365 Over 365 days Total Total Real estate, mortgage, credit and similar notes 1,248,250 21,295,456 11,765,570 35,464,281 69,773,557 69,418,880 Bills of financial 38,534 8,456,651 5,904,373 23,838,716 38,238,274 36,449,288 Bills of real estate 287,636 8,087,993 2,303,602 1,235,205 11,914,436 16,428,064 Bills of credit related to agribusiness 922,080 4,750,812 3,557,595 9,145,453 18,375,940 16,541,528 Mortgage notes - - - 1,244,907 1,244,907 - 110,972 4,236,634 1,938,334 38,752,037 45,037,977 41,415,838 Non-trade related – issued abroad Brazil risk note programme 3,923 433,586 689,671 3,180,007 4,307,187 6,022,836 Structure note issued 63,986 667,585 1,085,395 3,261,890 5,078,856 5,587,577 Bonds - 3,097,775 - 24,687,541 27,785,316 24,114,734 - - - 4,929,238 4,929,238 3,086,192 Fixed rate notes 36,186 5,001 - 11,767 52,954 10,001 Eurobonds Mortgage notes 422 464 7,682 263,510 272,078 333,777 Other 6,455 32,223 155,586 2,418,084 2,612,348 2,260,721 (*) Structured Operations Certificates 6,276 1,314,275 193,097 714,846 2,228,494 4,401,789 Total 1,365,498 26,846,365 13,897,001 74,931,164 117,040,028 115,236,507 % per maturity term 1.2 22.9 11.9 64.0 100.0 3,353,249 28,243,901 12,728,298 70,911,059 115,236,507 Total – 03/31/2018 2.9 24.5 11.0 61.6 100.0 % per maturity term (*) As of 03/31/2019, the market value of the funding from Structured Operations Certificates issued is R$ 2,310,577 (R$ 4,639,214 at 03/31/2018). ITAÚ UNIBANCO HOLDING’s portfolio is composed of Fixed Rate Notes with maturities of 0 days to 30 days amount of R$ 4,781 and Brazil Risk Note Programme with maturities of 31 days to 180 days (R$ 3,580,468 at 03/31/2018), totaling R$ 4,781 (R$ 3,580,468 at 03/31/2018). Guaranteed Real Estate Notes Guaranteed Real Estate Notes (LIGs) are registered credit securities, transferrable and free trade, guaranteed by asset portfolio of the issuer itself, submitted to the fiduciary system. The “Instrument of LIG Issue”, which details the conditions of LIG transactions, is available on the website www.itau.com.br/relacoes-com- investidores , section Menu / Relatórios / Letra Imobiliária Garantida (LIG). I – Breakdown of Asset Portfolio The credit portfolio linked to LIGs corresponds to 0.08% of ITAÚ UNIBANCO HOLDING CONSOLIDATED’s total assets. Its composition is presented in the table below. Further details are available in the Statement of Asset Portfolio – SAP, in section Menu / Relatórios / Letra Imobiliária Garantida (LIG). 03/31/2019 Real state loans 1,118,147 Government securities - Brazil 239,467 Total asset portfolio 1,357,614 Liabilities for issue of LIGs 1,244,907 Remuneration of the Fiduciary Agent 129 II - Requirements of asset portfolio 03/31/2019 Breakdown 82.4% Sufficiency Notional amount 109.0% Present value under stress 106.8% Weighted average term Of the asset portfolio 36,7 monthly Of outstandings LIGs 33 monthly Liquidity Net assets 239,467 Itaú Unibanco Holding S.A. – Complete Financial Statements – March 31, 2019 102
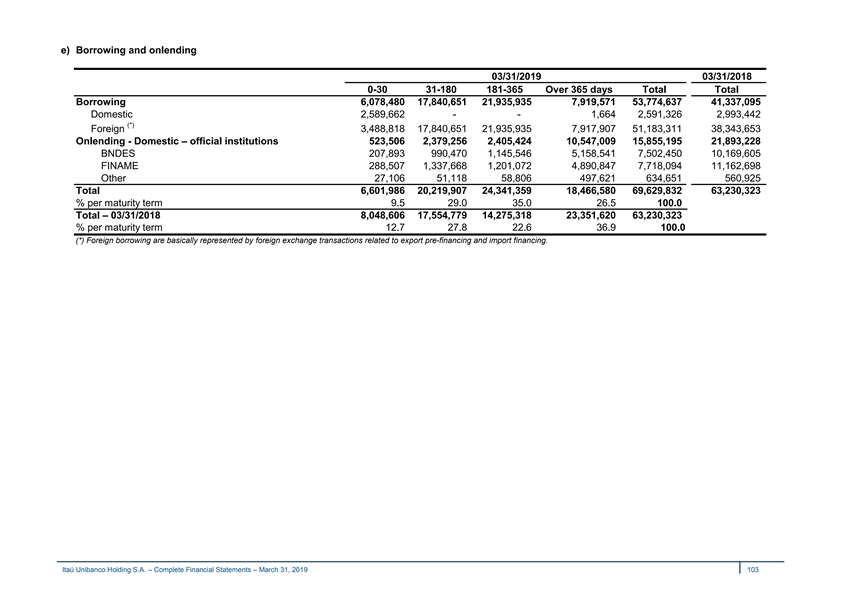
e) Borrowing and onlending 03/31/2019 03/31/2018 0-30 31-180 181-365 Over 365 days Total Total Borrowing 6,078,480 17,840,651 21,935,935 7,919,571 53,774,637 41,337,095 Domestic 2,589,662 - - 1,664 2,591,326 2,993,442 (*) Foreign 3,488,818 17,840,651 21,935,935 7,917,907 51,183,311 38,343,653 Onlending - Domestic – official institutions 523,506 2,379,256 2,405,424 10,547,009 15,855,195 21,893,228 BNDES 207,893 990,470 1,145,546 5,158,541 7,502,450 10,169,605 FINAME 288,507 1,337,668 1,201,072 4,890,847 7,718,094 11,162,698 Other 27,106 51,118 58,806 497,621 634,651 560,925 Total 6,601,986 20,219,907 24,341,359 18,466,580 69,629,832 63,230,323 % per maturity term 9.5 29.0 35.0 26.5 100.0 Total – 03/31/2018 8,048,606 17,554,779 14,275,318 23,351,620 63,230,323 % per maturity term 12.7 27.8 22.6 36.9 100.0 (*) Foreign borrowing are basically represented by foreign exchange transactions related to export pre-financing and import financing. Itaú Unibanco Holding S.A. – Complete Financial Statements – March 31, 2019 103 e) Borrowing and onlending 03/31/2019 03/31/2018 0-30 31-180 181-365 Over 365 days Total Total Borrowing 6,078,480 17,840,651 21,935,935 7,919,571 53,774,637 41,337,095 Domestic 2,589,662 - - 1,664 2,591,326 2,993,442 (*) Foreign 3,488,818 17,840,651 21,935,935 7,917,907 51,183,311 38,343,653 Onlending - Domestic – official institutions 523,506 2,379,256 2,405,424 10,547,009 15,855,195 21,893,228 BNDES 207,893 990,470 1,145,546 5,158,541 7,502,450 10,169,605 FINAME 288,507 1,337,668 1,201,072 4,890,847 7,718,094 11,162,698 Other 27,106 51,118 58,806 497,621 634,651 560,925 Total 6,601,986 20,219,907 24,341,359 18,466,580 69,629,832 63,230,323 % per maturity term 9.5 29.0 35.0 26.5 100.0 Total – 03/31/2018 8,048,606 17,554,779 14,275,318 23,351,620 63,230,323 % per maturity term 12.7 27.8 22.6 36.9 100.0 (*) Foreign borrowing are basically represented by foreign exchange transactions related to export pre-financing and import financing. Itaú Unibanco Holding S.A. – Complete Financial Statements – March 31, 2019 103
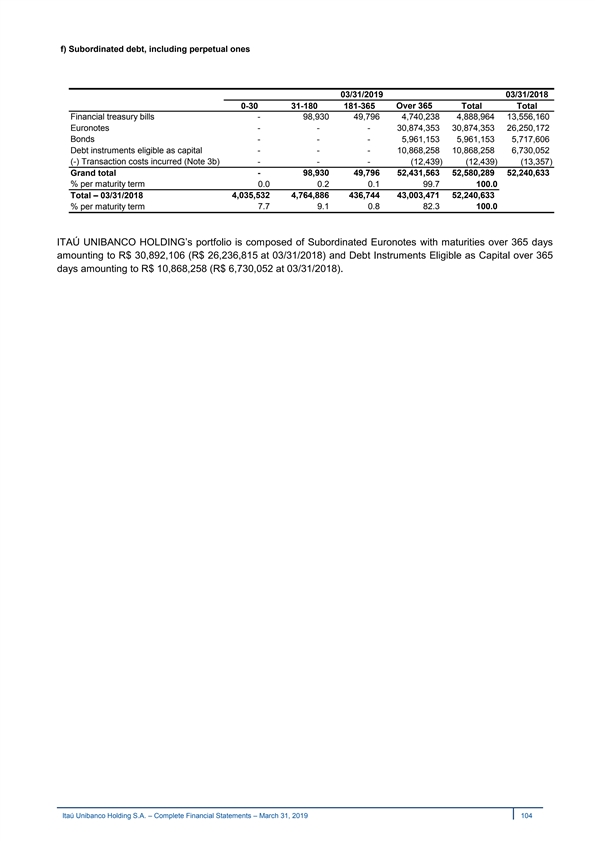
f) Subordinated debt, including perpetual ones 03/31/2019 03/31/2018 0-30 31-180 181-365 Over 365 Total Total Financial treasury bills - 98,930 49,796 4,740,238 days 4,888,964 13,556,160 Euronotes - - - 30,874,353 30,874,353 26,250,172 Bonds - - - 5,961,153 5,961,153 5,717,606 Debt instruments eligible as capital - - - 10,868,258 10,868,258 6,730,052 (-) Transaction costs incurred (Note 3b) - - - ( 12,439) ( 12,439) ( 13,357) Grand total - 98,930 49,796 52,431,563 52,580,289 52,240,633 % per maturity term 0.0 0.2 0.1 99.7 100.0 4,035,532 4,764,886 436,744 43,003,471 52,240,633 Total – 03/31/2018 % per maturity term 7.7 9.1 0.8 82.3 100.0 ITAÚ UNIBANCO HOLDING’s portfolio is composed of Subordinated Euronotes with maturities over 365 days amounting to R$ 30,892,106 (R$ 26,236,815 at 03/31/2018) and Debt Instruments Eligible as Capital over 365 days amounting to R$ 10,868,258 (R$ 6,730,052 at 03/31/2018). Itaú Unibanco Holding S.A. – Complete Financial Statements – March 31, 2019 104 f) Subordinated debt, including perpetual ones 03/31/2019 03/31/2018 0-30 31-180 181-365 Over 365 Total Total Financial treasury bills - 98,930 49,796 4,740,238 days 4,888,964 13,556,160 Euronotes - - - 30,874,353 30,874,353 26,250,172 Bonds - - - 5,961,153 5,961,153 5,717,606 Debt instruments eligible as capital - - - 10,868,258 10,868,258 6,730,052 (-) Transaction costs incurred (Note 3b) - - - ( 12,439) ( 12,439) ( 13,357) Grand total - 98,930 49,796 52,431,563 52,580,289 52,240,633 % per maturity term 0.0 0.2 0.1 99.7 100.0 4,035,532 4,764,886 436,744 43,003,471 52,240,633 Total – 03/31/2018 % per maturity term 7.7 9.1 0.8 82.3 100.0 ITAÚ UNIBANCO HOLDING’s portfolio is composed of Subordinated Euronotes with maturities over 365 days amounting to R$ 30,892,106 (R$ 26,236,815 at 03/31/2018) and Debt Instruments Eligible as Capital over 365 days amounting to R$ 10,868,258 (R$ 6,730,052 at 03/31/2018). Itaú Unibanco Holding S.A. – Complete Financial Statements – March 31, 2019 104
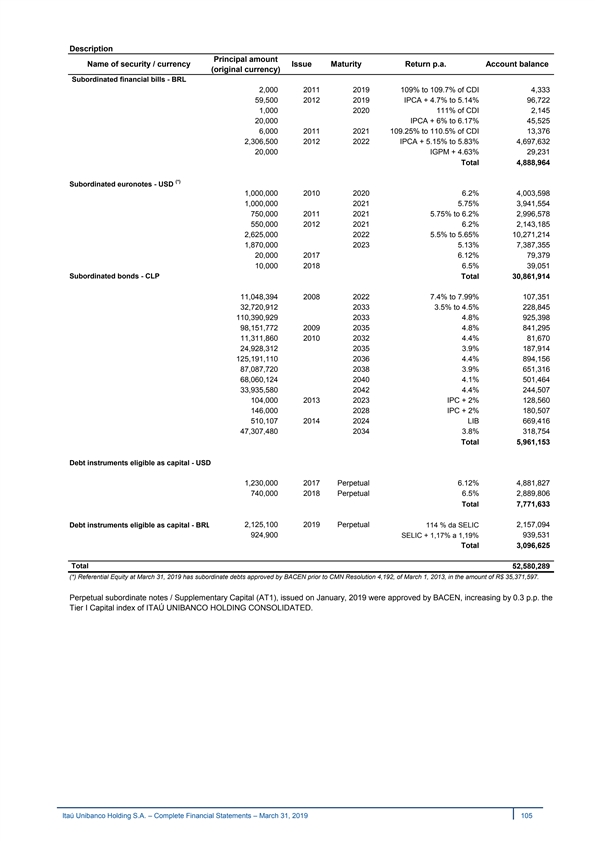
Description Principal amount Name of security / currency Issue Maturity Return p.a. Account balance (original currency) Subordinated financial bills - BRL 2,000 2011 2019 109% to 109.7% of CDI 4,333 59,500 2012 2019 IPCA + 4.7% to 5.14% 96,722 1,000 2020 111% of CDI 2,145 20,000 IPCA + 6% to 6.17% 45,525 6,000 2011 2021 109.25% to 110.5% of CDI 13,376 2,306,500 2012 2022 IPCA + 5.15% to 5.83% 4,697,632 20,000 IGPM + 4.63% 29,231 Total 4,888,964 (*) Subordinated euronotes - USD 1,000,000 2010 2020 6.2% 4,003,598 1,000,000 2021 5.75% 3,941,554 750,000 2011 2021 5.75% to 6.2% 2,996,578 550,000 2012 2021 6.2% 2,143,185 2,625,000 2022 5.5% to 5.65% 10,271,214 1,870,000 2023 5.13% 7,387,355 20,000 2017 6.12% 79,379 10,000 2018 6.5% 39,051 Subordinated bonds - CLP Total 30,861,914 11,048,394 2008 2022 7.4% to 7.99% 107,351 32,720,912 2033 3.5% to 4.5% 228,845 110,390,929 2033 4.8% 925,398 98,151,772 2009 2035 4.8% 841,295 11,311,860 2010 2032 4.4% 81,670 24,928,312 2035 3.9% 187,914 125,191,110 2036 4.4% 894,156 87,087,720 2038 3.9% 651,316 68,060,124 2040 4.1% 501,464 33,935,580 2042 4.4% 244,507 104,000 2013 2023 IPC + 2% 128,560 146,000 2028 IPC + 2% 180,507 510,107 2014 2024 LIB 669,416 47,307,480 2034 3.8% 318,754 Total 5,961,153 Debt instruments eligible as capital - USD 1,230,000 2017 Perpetual 6.12% 4,881,827 740,000 2018 Perpetual 6.5% 2,889,806 Total 7,771,633 Debt instruments eligible as capital - BRL 2,125,100 2019 Perpetual 114 % da SELIC 2,157,094 924,900 939,531 SELIC + 1,17% a 1,19% Total 3,096,625 Total 52,580,289 (*) Referential Equity at March 31, 2019 has subordinate debts approved by BACEN prior to CMN Resolution 4,192, of March 1, 2013, in the amount of R$ 35,371,597. Perpetual subordinate notes / Supplementary Capital (AT1), issued on January, 2019 were approved by BACEN, increasing by 0.3 p.p. the Tier I Capital index of ITAÚ UNIBANCO HOLDING CONSOLIDATED. Itaú Unibanco Holding S.A. – Complete Financial Statements – March 31, 2019 105 Description Principal amount Name of security / currency Issue Maturity Return p.a. Account balance (original currency) Subordinated financial bills - BRL 2,000 2011 2019 109% to 109.7% of CDI 4,333 59,500 2012 2019 IPCA + 4.7% to 5.14% 96,722 1,000 2020 111% of CDI 2,145 20,000 IPCA + 6% to 6.17% 45,525 6,000 2011 2021 109.25% to 110.5% of CDI 13,376 2,306,500 2012 2022 IPCA + 5.15% to 5.83% 4,697,632 20,000 IGPM + 4.63% 29,231 Total 4,888,964 (*) Subordinated euronotes - USD 1,000,000 2010 2020 6.2% 4,003,598 1,000,000 2021 5.75% 3,941,554 750,000 2011 2021 5.75% to 6.2% 2,996,578 550,000 2012 2021 6.2% 2,143,185 2,625,000 2022 5.5% to 5.65% 10,271,214 1,870,000 2023 5.13% 7,387,355 20,000 2017 6.12% 79,379 10,000 2018 6.5% 39,051 Subordinated bonds - CLP Total 30,861,914 11,048,394 2008 2022 7.4% to 7.99% 107,351 32,720,912 2033 3.5% to 4.5% 228,845 110,390,929 2033 4.8% 925,398 98,151,772 2009 2035 4.8% 841,295 11,311,860 2010 2032 4.4% 81,670 24,928,312 2035 3.9% 187,914 125,191,110 2036 4.4% 894,156 87,087,720 2038 3.9% 651,316 68,060,124 2040 4.1% 501,464 33,935,580 2042 4.4% 244,507 104,000 2013 2023 IPC + 2% 128,560 146,000 2028 IPC + 2% 180,507 510,107 2014 2024 LIB 669,416 47,307,480 2034 3.8% 318,754 Total 5,961,153 Debt instruments eligible as capital - USD 1,230,000 2017 Perpetual 6.12% 4,881,827 740,000 2018 Perpetual 6.5% 2,889,806 Total 7,771,633 Debt instruments eligible as capital - BRL 2,125,100 2019 Perpetual 114 % da SELIC 2,157,094 924,900 939,531 SELIC + 1,17% a 1,19% Total 3,096,625 Total 52,580,289 (*) Referential Equity at March 31, 2019 has subordinate debts approved by BACEN prior to CMN Resolution 4,192, of March 1, 2013, in the amount of R$ 35,371,597. Perpetual subordinate notes / Supplementary Capital (AT1), issued on January, 2019 were approved by BACEN, increasing by 0.3 p.p. the Tier I Capital index of ITAÚ UNIBANCO HOLDING CONSOLIDATED. Itaú Unibanco Holding S.A. – Complete Financial Statements – March 31, 2019 105
Note 8 - Insurance, private pension plan and capitalization operations In ITAÚ UNIBANCO HOLDING CONSOLIDATED, insurance premiums, accepted coinsurances and selling expenses are accounted for by issuing an insurance policy or in accordance with the insurance effectiveness term, through the recognition and reversal of the provision for unearned premiums and deferred selling expenses. Interest arising from insurance premiums installments is accounted for as incurred. Revenues from social security contributions, gross revenue from premium bonds and respective technical provisions are recognized upon receipt. The technical provisions aim at reducing risks involved in insurance contracts, private pension plans and capitalization, and are recognized according to the technical notes approved by SUSEP. I - Insurance and private pension plan: · Provision for unearned premiums (PPNG) – this provision is recognized, based on insurance premiums, for the coverage of amounts payable related to claims and expenses to be incurred. In the calculation, term to maturity of risks assumed and issued and risks in effect but not issued (PPNG- RVNE) in the policies or endorsements of contracts in force are considered, on a pro rata-die basis; · Provision for unsettled claims (PSL) - this provision is recognized for the coverage of expected amounts related reported and unpaid claims, including administrative and judicial claims. It includes amounts related to indemnities, reserve funds and income past-due, all gross of reinsurance operations and net of coinsurance operations. When required, it should contemplate IBNER (claims incurred but not sufficiently reported) adjustments for the aggregate development of claims reported but not paid, which mounts may be changed throughout the process up to final settlement; · Provision for claims incurred and not reported (IBNR) - this provision is recognized for the coverage of expected unsettled amounts related to claims incurred but not reported up to the calculation base date, including administrative and judicial claims. It includes amounts related to indemnities, reserve funds and income, all gross of reinsurance operations and net of coinsurance operations; · Mathematical provisions for benefits to be granted (PMBAC) - recognized for the coverage of commitments assumed to participants or policyholders, based on the assumptions set forth in the contract, while the event that gave rise to the benefit and/or indemnity has not occurred; · Mathematical provisions for granted benefits (PMBC) - recognized for the coverage of commitments to payment of indemnities and/or benefits assumed with participants or insured parties, based on the assumptions established in the agreement, after the event has occurred; · Provision for financial surplus (PEF) - it is recognized to ensure the amounts intended for distribution of financial surplus, if the event is stated in the agreement. Corresponds to the financial income exceeding the minimum return guaranteed in the product; · Supplemental Coverage Reserve (PCC) - recognized when technical reserves are found to be insufficient, as shown by the Liability Adequacy Test, which follows specific provisions in the prevailing regulation; · Provision for redemptions and other amounts to be regularize (PVR) - this provision is recognized for the coverage of amounts related to redemptions to regularize, returns on premiums or funds, transfers requested but, for any reason, not yet transferred to the insurance company or open private pension entity beneficiary, and where premiums have been received but not quoted; · Provision for related expenses (PDR) - recognized for the coverage of expected amounts related to expenses on benefits and indemnities, due to events which have occurred and will occur. Itaú Unibanco Holding S.A. – Complete Financial Statements – March 31, 2019 106 Note 8 - Insurance, private pension plan and capitalization operations In ITAÚ UNIBANCO HOLDING CONSOLIDATED, insurance premiums, accepted coinsurances and selling expenses are accounted for by issuing an insurance policy or in accordance with the insurance effectiveness term, through the recognition and reversal of the provision for unearned premiums and deferred selling expenses. Interest arising from insurance premiums installments is accounted for as incurred. Revenues from social security contributions, gross revenue from premium bonds and respective technical provisions are recognized upon receipt. The technical provisions aim at reducing risks involved in insurance contracts, private pension plans and capitalization, and are recognized according to the technical notes approved by SUSEP. I - Insurance and private pension plan: · Provision for unearned premiums (PPNG) – this provision is recognized, based on insurance premiums, for the coverage of amounts payable related to claims and expenses to be incurred. In the calculation, term to maturity of risks assumed and issued and risks in effect but not issued (PPNG- RVNE) in the policies or endorsements of contracts in force are considered, on a pro rata-die basis; · Provision for unsettled claims (PSL) - this provision is recognized for the coverage of expected amounts related reported and unpaid claims, including administrative and judicial claims. It includes amounts related to indemnities, reserve funds and income past-due, all gross of reinsurance operations and net of coinsurance operations. When required, it should contemplate IBNER (claims incurred but not sufficiently reported) adjustments for the aggregate development of claims reported but not paid, which mounts may be changed throughout the process up to final settlement; · Provision for claims incurred and not reported (IBNR) - this provision is recognized for the coverage of expected unsettled amounts related to claims incurred but not reported up to the calculation base date, including administrative and judicial claims. It includes amounts related to indemnities, reserve funds and income, all gross of reinsurance operations and net of coinsurance operations; · Mathematical provisions for benefits to be granted (PMBAC) - recognized for the coverage of commitments assumed to participants or policyholders, based on the assumptions set forth in the contract, while the event that gave rise to the benefit and/or indemnity has not occurred; · Mathematical provisions for granted benefits (PMBC) - recognized for the coverage of commitments to payment of indemnities and/or benefits assumed with participants or insured parties, based on the assumptions established in the agreement, after the event has occurred; · Provision for financial surplus (PEF) - it is recognized to ensure the amounts intended for distribution of financial surplus, if the event is stated in the agreement. Corresponds to the financial income exceeding the minimum return guaranteed in the product; · Supplemental Coverage Reserve (PCC) - recognized when technical reserves are found to be insufficient, as shown by the Liability Adequacy Test, which follows specific provisions in the prevailing regulation; · Provision for redemptions and other amounts to be regularize (PVR) - this provision is recognized for the coverage of amounts related to redemptions to regularize, returns on premiums or funds, transfers requested but, for any reason, not yet transferred to the insurance company or open private pension entity beneficiary, and where premiums have been received but not quoted; · Provision for related expenses (PDR) - recognized for the coverage of expected amounts related to expenses on benefits and indemnities, due to events which have occurred and will occur. Itaú Unibanco Holding S.A. – Complete Financial Statements – March 31, 2019 106
II - Capitalization: · Mathematical provision for capitalization (PMC) - recognized until the event triggering the benefit occurs, and comprised of the portion of the amounts collected for capitalization; · Provision for redemption (PR) - recognized from the date of the event triggering the redemption of the certificate and/or the event triggering the distribution of the bonus until the date of financial settlement, or the date on which the evidence of payment of the obligation is received; · Provision for raffles unrealized (PSR) - recognized for each bond which raffles were funded, but that, on the recognition date, had not been realized yet; · Provision for raffles payable (PSP) - recognized from the date when the raffle is drawn until the date of financial settlement, or the date when the evidence of payment of the obligation is received; · Supplementary provision for raffles (PCS) - recognized to supplement the provision for raffles unrealized. Used for coverage of possible shortfall related to the expected amount of raffles to be drawn; · Provision for administrative expenses (PDA) - recognized for the coverage of the expected amounts of administrative expenses for the capitalization plans. Itaú Unibanco Holding S.A. – Complete Financial Statements – March 31, 2019 107 II - Capitalization: · Mathematical provision for capitalization (PMC) - recognized until the event triggering the benefit occurs, and comprised of the portion of the amounts collected for capitalization; · Provision for redemption (PR) - recognized from the date of the event triggering the redemption of the certificate and/or the event triggering the distribution of the bonus until the date of financial settlement, or the date on which the evidence of payment of the obligation is received; · Provision for raffles unrealized (PSR) - recognized for each bond which raffles were funded, but that, on the recognition date, had not been realized yet; · Provision for raffles payable (PSP) - recognized from the date when the raffle is drawn until the date of financial settlement, or the date when the evidence of payment of the obligation is received; · Supplementary provision for raffles (PCS) - recognized to supplement the provision for raffles unrealized. Used for coverage of possible shortfall related to the expected amount of raffles to be drawn; · Provision for administrative expenses (PDA) - recognized for the coverage of the expected amounts of administrative expenses for the capitalization plans. Itaú Unibanco Holding S.A. – Complete Financial Statements – March 31, 2019 107
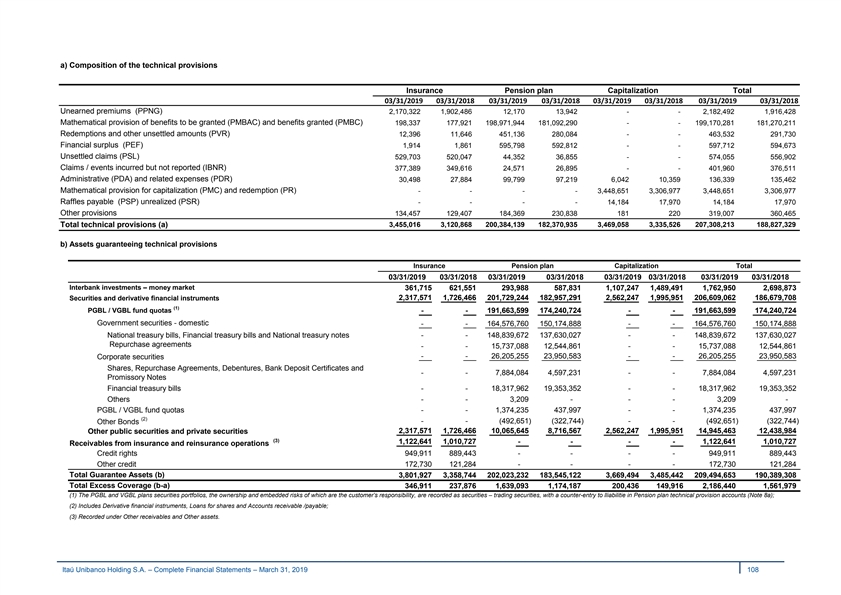
a) Composition of the technical provisions Insurance Pension plan Capitalization Total 03/31/2019 03/31/2018 03/31/2019 03/31/2018 03/31/2019 03/31/2018 03/31/2019 03/31/2018 Unearned premiums (PPNG) 2,170,322 1,902,486 12,170 13,942 - - 2,182,492 1,916,428 Mathematical provision of benefits to be granted (PMBAC) and benefits granted (PMBC) 198,337 177,921 198,971,944 181,092,290 - - 199,170,281 181,270,211 Redemptions and other unsettled amounts (PVR) 12,396 11,646 451,136 280,084 - - 463,532 291,730 Financial surplus (PEF) 1,914 1,861 595,798 592,812 - - 597,712 594,673 Unsettled claims (PSL) 529,703 520,047 44,352 36,855 - - 574,055 556,902 Claims / events incurred but not reported (IBNR) 377,389 349,616 24,571 26,895 - - 401,960 376,511 Administrative (PDA) and related expenses (PDR) 30,498 27,884 99,799 97,219 6,042 10,359 136,339 135,462 Mathematical provision for capitalization (PMC) and redemption (PR) - - - - 3,448,651 3,306,977 3,448,651 3,306,977 Raffles payable (PSP) unrealized (PSR) - - - - 14,184 17,970 14,184 17,970 Other provisions 134,457 129,407 184,369 230,838 181 220 319,007 360,465 Total technical provisions (a) 3,455,016 3,120,868 200,384,139 182,370,935 3,469,058 3,335,526 207,308,213 188,827,329 b) Assets guaranteeing technical provisions Insurance Pension plan Capitalization Total 03/31/2019 03/31/2018 03/31/2019 03/31/2018 03/31/2019 03/31/2018 03/31/2019 03/31/2018 Interbank investments – money market 361,715 621,551 293,988 587,831 1,107,247 1,489,491 1,762,950 2,698,873 2,317,571 1,726,466 201,729,244 182,957,291 2,562,247 1,995,951 206,609,062 186,679,708 Securities and derivative financial instruments (1) PGBL / VGBL fund quotas - - 191,663,599 174,240,724 - - 191,663,599 174,240,724 Government securities - domestic - - 164,576,760 150,174,888 - - 164,576,760 150,174,888 National treasury bills, Financial treasury bills and National treasury notes - - 148,839,672 137,630,027 - - 148,839,672 137,630,027 Repurchase agreements - - 15,737,088 12,544,861 - - 15,737,088 12,544,861 Corporate securities - - 26,205,255 23,950,583 - - 26,205,255 23,950,583 Shares, Repurchase Agreements, Debentures, Bank Deposit Certificates and - - 7,884,084 4,597,231 - - 7,884,084 4,597,231 Promissory Notes Financial treasury bills - - 18,317,962 19,353,352 - - 18,317,962 19,353,352 Others - - 3,209 - - - 3,209 - PGBL / VGBL fund quotas - - 1,374,235 437,997 - - 1,374,235 437,997 (2) - - (492,651) (322,744) - - (492,651) (322,744) Other Bonds 2,317,571 1,726,466 10,065,645 8,716,567 2,562,247 1,995,951 14,945,463 12,438,984 Other public securities and private securities (3) 1,122,641 1,010,727 - - - - 1,122,641 1,010,727 Receivables from insurance and reinsurance operations Credit rights 949,911 889,443 - - - - 949,911 889,443 Other credit 172,730 121,284 - - - - 172,730 121,284 Total Guarantee Assets (b) 3,801,927 3,358,744 202,023,232 183,545,122 3,669,494 3,485,442 209,494,653 190,389,308 Total Excess Coverage (b-a) 346,911 237,876 1,639,093 1,174,187 200,436 149,916 2,186,440 1,561,979 (1) The PGBL and VGBL plans securities portfolios, the ownership and embedded risks of which are the customer’s responsibility, are recorded as securities – trading securities, with a counter-entry to lliabilitie in Pension plan technical provision accounts (Note 8a); (2) Includes Derivative financial instruments, Loans for shares and Accounts receivable /payable; (3) Recorded under Other receivables and Other assets. Itaú Unibanco Holding S.A. – Complete Financial Statements – March 31, 2019 108 a) Composition of the technical provisions Insurance Pension plan Capitalization Total 03/31/2019 03/31/2018 03/31/2019 03/31/2018 03/31/2019 03/31/2018 03/31/2019 03/31/2018 Unearned premiums (PPNG) 2,170,322 1,902,486 12,170 13,942 - - 2,182,492 1,916,428 Mathematical provision of benefits to be granted (PMBAC) and benefits granted (PMBC) 198,337 177,921 198,971,944 181,092,290 - - 199,170,281 181,270,211 Redemptions and other unsettled amounts (PVR) 12,396 11,646 451,136 280,084 - - 463,532 291,730 Financial surplus (PEF) 1,914 1,861 595,798 592,812 - - 597,712 594,673 Unsettled claims (PSL) 529,703 520,047 44,352 36,855 - - 574,055 556,902 Claims / events incurred but not reported (IBNR) 377,389 349,616 24,571 26,895 - - 401,960 376,511 Administrative (PDA) and related expenses (PDR) 30,498 27,884 99,799 97,219 6,042 10,359 136,339 135,462 Mathematical provision for capitalization (PMC) and redemption (PR) - - - - 3,448,651 3,306,977 3,448,651 3,306,977 Raffles payable (PSP) unrealized (PSR) - - - - 14,184 17,970 14,184 17,970 Other provisions 134,457 129,407 184,369 230,838 181 220 319,007 360,465 Total technical provisions (a) 3,455,016 3,120,868 200,384,139 182,370,935 3,469,058 3,335,526 207,308,213 188,827,329 b) Assets guaranteeing technical provisions Insurance Pension plan Capitalization Total 03/31/2019 03/31/2018 03/31/2019 03/31/2018 03/31/2019 03/31/2018 03/31/2019 03/31/2018 Interbank investments – money market 361,715 621,551 293,988 587,831 1,107,247 1,489,491 1,762,950 2,698,873 2,317,571 1,726,466 201,729,244 182,957,291 2,562,247 1,995,951 206,609,062 186,679,708 Securities and derivative financial instruments (1) PGBL / VGBL fund quotas - - 191,663,599 174,240,724 - - 191,663,599 174,240,724 Government securities - domestic - - 164,576,760 150,174,888 - - 164,576,760 150,174,888 National treasury bills, Financial treasury bills and National treasury notes - - 148,839,672 137,630,027 - - 148,839,672 137,630,027 Repurchase agreements - - 15,737,088 12,544,861 - - 15,737,088 12,544,861 Corporate securities - - 26,205,255 23,950,583 - - 26,205,255 23,950,583 Shares, Repurchase Agreements, Debentures, Bank Deposit Certificates and - - 7,884,084 4,597,231 - - 7,884,084 4,597,231 Promissory Notes Financial treasury bills - - 18,317,962 19,353,352 - - 18,317,962 19,353,352 Others - - 3,209 - - - 3,209 - PGBL / VGBL fund quotas - - 1,374,235 437,997 - - 1,374,235 437,997 (2) - - (492,651) (322,744) - - (492,651) (322,744) Other Bonds 2,317,571 1,726,466 10,065,645 8,716,567 2,562,247 1,995,951 14,945,463 12,438,984 Other public securities and private securities (3) 1,122,641 1,010,727 - - - - 1,122,641 1,010,727 Receivables from insurance and reinsurance operations Credit rights 949,911 889,443 - - - - 949,911 889,443 Other credit 172,730 121,284 - - - - 172,730 121,284 Total Guarantee Assets (b) 3,801,927 3,358,744 202,023,232 183,545,122 3,669,494 3,485,442 209,494,653 190,389,308 Total Excess Coverage (b-a) 346,911 237,876 1,639,093 1,174,187 200,436 149,916 2,186,440 1,561,979 (1) The PGBL and VGBL plans securities portfolios, the ownership and embedded risks of which are the customer’s responsibility, are recorded as securities – trading securities, with a counter-entry to lliabilitie in Pension plan technical provision accounts (Note 8a); (2) Includes Derivative financial instruments, Loans for shares and Accounts receivable /payable; (3) Recorded under Other receivables and Other assets. Itaú Unibanco Holding S.A. – Complete Financial Statements – March 31, 2019 108
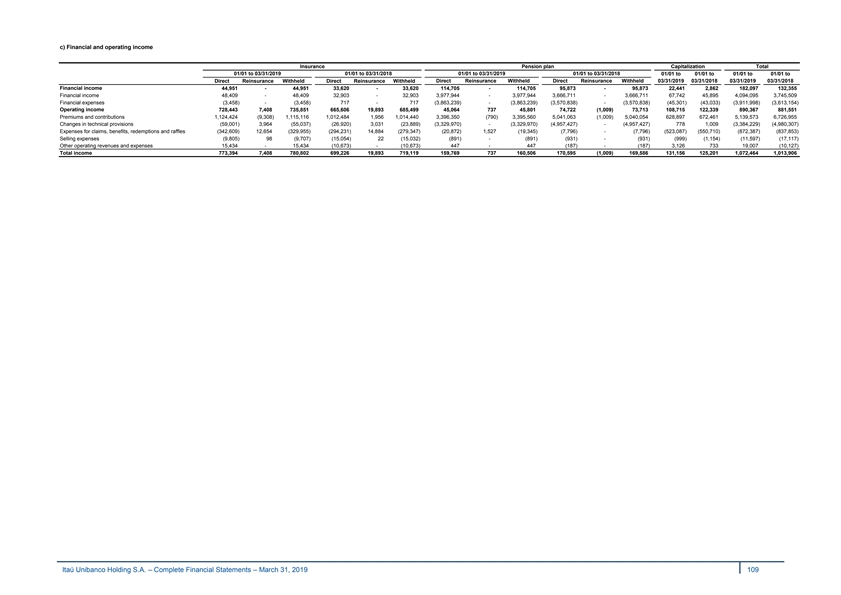
c) Financial and operating income Insurance Pension plan Capitalization Total 01/01 to 03/31/2019 01/01 to 03/31/2018 01/01 to 03/31/2019 01/01 to 03/31/2018 01/01 to 01/01 to 01/01 to 01/01 to Direct Reinsurance Withheld Direct Reinsurance Withheld 03/31/2019 03/31/2018 03/31/2019 03/31/2018 Direct Reinsurance Withheld Direct Reinsurance Withheld Financial income 44,951 - 44,951 33,620 - 33,620 114,705 - 114,705 95,873 - 95,873 22,441 2,862 182,097 132,355 Financial income 48,409 - 48,409 32,903 - 32,903 3,977,944 - 3,977,944 3,666,711 - 3,666,711 67,742 45,895 4,094,095 3,745,509 Financial expenses (3 ,458) - (3,458) 717 - 717 (3 ,863,239) - (3,863,239) (3,570,838) - (3,570,838) (45,301) (43,033) (3,911,998) (3,613,154) Operating income 728,443 7,408 735,851 665,606 19,893 685,499 45,064 737 45,801 74,722 (1,009) 73,713 108,715 122,339 890,367 881,551 Premiums and contributions 1,124,424 (9,308) 1,115,116 1,012,484 1,956 1,014,440 3,396,350 (790) 3,395,560 5,041,063 (1,009) 5,040,054 628,897 672,461 5,139,573 6,726,955 Changes in technical provisions (5 9,001) 3,964 (55,037) (26,920) 3,031 (2 3,889) (3 ,329,970) - (3,329,970) (4,957,427) - (4,957,427) 778 1,009 (3,384,229) (4,980,307) Expenses for claims, benefits, redemptions and raffles (3 42,609) 12,654 (329,955) (294,231) 14,884 (279,347) (2 0,872) 1,527 (19,345) (7,796) - (7,796) (523,087) (5 50,710) (872,387) (837,853) Selling expenses (9 ,805) 98 (9,707) (15,054) 22 (15,032) (8 91) - (891) (931) - (931) (9 99) (1 ,154) (11,597) (17,117) Other operating revenues and expenses 15,434 - 15,434 (10,673) - (10,673) 447 - 447 (187) - (187) 3,126 733 19,007 (10,127) Total income 773,394 7,408 780,802 699,226 19,893 719,119 159,769 737 160,506 170,595 (1,009) 169,586 131,156 125,201 1,072,464 1,013,906 Itaú Unibanco Holding S.A. – Complete Financial Statements – March 31, 2019 109 c) Financial and operating income Insurance Pension plan Capitalization Total 01/01 to 03/31/2019 01/01 to 03/31/2018 01/01 to 03/31/2019 01/01 to 03/31/2018 01/01 to 01/01 to 01/01 to 01/01 to Direct Reinsurance Withheld Direct Reinsurance Withheld 03/31/2019 03/31/2018 03/31/2019 03/31/2018 Direct Reinsurance Withheld Direct Reinsurance Withheld Financial income 44,951 - 44,951 33,620 - 33,620 114,705 - 114,705 95,873 - 95,873 22,441 2,862 182,097 132,355 Financial income 48,409 - 48,409 32,903 - 32,903 3,977,944 - 3,977,944 3,666,711 - 3,666,711 67,742 45,895 4,094,095 3,745,509 Financial expenses (3 ,458) - (3,458) 717 - 717 (3 ,863,239) - (3,863,239) (3,570,838) - (3,570,838) (45,301) (43,033) (3,911,998) (3,613,154) Operating income 728,443 7,408 735,851 665,606 19,893 685,499 45,064 737 45,801 74,722 (1,009) 73,713 108,715 122,339 890,367 881,551 Premiums and contributions 1,124,424 (9,308) 1,115,116 1,012,484 1,956 1,014,440 3,396,350 (790) 3,395,560 5,041,063 (1,009) 5,040,054 628,897 672,461 5,139,573 6,726,955 Changes in technical provisions (5 9,001) 3,964 (55,037) (26,920) 3,031 (2 3,889) (3 ,329,970) - (3,329,970) (4,957,427) - (4,957,427) 778 1,009 (3,384,229) (4,980,307) Expenses for claims, benefits, redemptions and raffles (3 42,609) 12,654 (329,955) (294,231) 14,884 (279,347) (2 0,872) 1,527 (19,345) (7,796) - (7,796) (523,087) (5 50,710) (872,387) (837,853) Selling expenses (9 ,805) 98 (9,707) (15,054) 22 (15,032) (8 91) - (891) (931) - (931) (9 99) (1 ,154) (11,597) (17,117) Other operating revenues and expenses 15,434 - 15,434 (10,673) - (10,673) 447 - 447 (187) - (187) 3,126 733 19,007 (10,127) Total income 773,394 7,408 780,802 699,226 19,893 719,119 159,769 737 160,506 170,595 (1,009) 169,586 131,156 125,201 1,072,464 1,013,906 Itaú Unibanco Holding S.A. – Complete Financial Statements – March 31, 2019 109
Note 9 – Contingent assets and liabilities and legal liabilities – tax and social security ITAÚ UNIBANCO HOLDING CONSOLIDATED, as a result of the ordinary course of its business, may be a party to legal lawsuits of labor, civil and tax nature. The contingencies related to these lawsuits are classified as follows: a) Contingent Assets: There are no contingent assets recorded. b) Provisions and contingencies: The criteria to quantify of provisions for contingencies are adequate in relation to the specific characteristics of civil, labor and tax lawsuits portfolios, as well as other risks, taking into consideration the opinion of its legal advisors, the nature of the lawsuits, the similarity with previous lawsuits and the prevailing previous court decisions. A provision is recognized whenever the loss is classified as probable. Legal liabilities arise from lawsuits filed to discuss the legality and unconstitutionality of the legislation in force, being subject to an accounting provision, regardless of the probability of loss. I- Civil lawsuits: In general, provisions for contingencies arise from claims related to the revision of contracts and compensation for damages and pain and suffering and the lawsuits are classified as follows: Collective lawsuits: Related to claims of a similar nature and with individual amounts that are not considered significant. Provisions are determined on a monthly basis and the expected amount of losses is accrued according to statistical references that take into account the nature of the lawsuit and the characteristics of the court (Small Claims Court or Regular Court). Contingencies and provisions are adjusted to reflect the amounts deposited as guarantee for their execution when realized. Individual lawsuits: Related to claims with unusual characteristics or involving significant amounts. These are periodically calculated based on the calculation of the amount claimed. The amounts considered as probable losses are recorded as provisions. ITAÚ UNIBANCO HOLDING CONSOLIDATED, despite having complied with the rules in force at the time, is a defendant in lawsuits filed by individuals referring to collection of inflation adjustments to savings accounts resulting from economic plants implemented in the decades of 1980 and 1990, as well as in collective lawsuits filed by: (i) consumer protection associations; and (ii) the Public Attorney’s Office, on behalf of the savings accounts holders. ITAÚ UNIBANCO HOLDING CONSOLIDATED recognizes provisions upon receipt of summons, as well as at the time individuals demand the enforcement of the decision rendered by the Judiciary power, using the same criteria adopted to determine provisions for individual lawsuits. The Federal Supreme Court (STF) has issued some decisions favorable to savings account holders, but it has not established its understanding with respect to the constitutionality of the economic plans and their applicability to savings accounts. Currently, the appeals involving these matters are suspended, as determined by the STF, until it pronounces a final decision. In December 2017, through mediation of the Federal Attorney’s Office (AGU) and supervision of the BACEN, savers (represented by two civil associations, FEBRAPO and IDEC) and FEBRABAN entered into an instrument of agreement aiming at resolving lawsuits related to economic plans, and ITAÚ UNIBANCO HOLDING CONSOLIDATED has already adhered to its terms. Said agreement was approved on March 1, 2018, by the Plenary Session of the Federal Supreme Court (STF) and, savers may adhere to their terms for a 24-month period, counted as from May 22, 2018 with the subsequent conclusion of lawsuits. Itaú Unibanco Holding S.A. – Complete Financial Statements – March 31, 2019 110 Note 9 – Contingent assets and liabilities and legal liabilities – tax and social security ITAÚ UNIBANCO HOLDING CONSOLIDATED, as a result of the ordinary course of its business, may be a party to legal lawsuits of labor, civil and tax nature. The contingencies related to these lawsuits are classified as follows: a) Contingent Assets: There are no contingent assets recorded. b) Provisions and contingencies: The criteria to quantify of provisions for contingencies are adequate in relation to the specific characteristics of civil, labor and tax lawsuits portfolios, as well as other risks, taking into consideration the opinion of its legal advisors, the nature of the lawsuits, the similarity with previous lawsuits and the prevailing previous court decisions. A provision is recognized whenever the loss is classified as probable. Legal liabilities arise from lawsuits filed to discuss the legality and unconstitutionality of the legislation in force, being subject to an accounting provision, regardless of the probability of loss. I- Civil lawsuits: In general, provisions for contingencies arise from claims related to the revision of contracts and compensation for damages and pain and suffering and the lawsuits are classified as follows: Collective lawsuits: Related to claims of a similar nature and with individual amounts that are not considered significant. Provisions are determined on a monthly basis and the expected amount of losses is accrued according to statistical references that take into account the nature of the lawsuit and the characteristics of the court (Small Claims Court or Regular Court). Contingencies and provisions are adjusted to reflect the amounts deposited as guarantee for their execution when realized. Individual lawsuits: Related to claims with unusual characteristics or involving significant amounts. These are periodically calculated based on the calculation of the amount claimed. The amounts considered as probable losses are recorded as provisions. ITAÚ UNIBANCO HOLDING CONSOLIDATED, despite having complied with the rules in force at the time, is a defendant in lawsuits filed by individuals referring to collection of inflation adjustments to savings accounts resulting from economic plants implemented in the decades of 1980 and 1990, as well as in collective lawsuits filed by: (i) consumer protection associations; and (ii) the Public Attorney’s Office, on behalf of the savings accounts holders. ITAÚ UNIBANCO HOLDING CONSOLIDATED recognizes provisions upon receipt of summons, as well as at the time individuals demand the enforcement of the decision rendered by the Judiciary power, using the same criteria adopted to determine provisions for individual lawsuits. The Federal Supreme Court (STF) has issued some decisions favorable to savings account holders, but it has not established its understanding with respect to the constitutionality of the economic plans and their applicability to savings accounts. Currently, the appeals involving these matters are suspended, as determined by the STF, until it pronounces a final decision. In December 2017, through mediation of the Federal Attorney’s Office (AGU) and supervision of the BACEN, savers (represented by two civil associations, FEBRAPO and IDEC) and FEBRABAN entered into an instrument of agreement aiming at resolving lawsuits related to economic plans, and ITAÚ UNIBANCO HOLDING CONSOLIDATED has already adhered to its terms. Said agreement was approved on March 1, 2018, by the Plenary Session of the Federal Supreme Court (STF) and, savers may adhere to their terms for a 24-month period, counted as from May 22, 2018 with the subsequent conclusion of lawsuits. Itaú Unibanco Holding S.A. – Complete Financial Statements – March 31, 2019 110

II- Labor claims Provisions for Contingencies arise from lawsuits in which labor rights provided for in labor legislation specific to the related profession are discussed, such as: overtime, salary equalization, reinstatement, transfer allowance, pension plan supplement, among others, are discussed. These lawsuits are classified as follows: Collective lawsuits: related to claims considered similar and with individual amounts that are not considered relevant. The expected amount of loss is determined and accrued on a monthly basis in accordance with a statistical share pricing model and is reassessed taking into account the court rulings. Provisions for contingencies are adjusted to the amounts deposited as guarantee for their execution when realized. Individual lawsuits: related to claims with unusual characteristics or involving significant amounts. These are periodically calculated based on the calculation of the amount claimed. Probability of loss which, in turn, is estimated in accordance with the actual and legal characteristics related to that lawsuit. III- Other Risks These are quantified and accrued mainly based on the evaluation of rural credit transactions with joint liability and FCVS (salary variations compensation fund) credits assigned to Banco Nacional. Itaú Unibanco Holding S.A. – Complete Financial Statements – March 31, 2019 111 II- Labor claims Provisions for Contingencies arise from lawsuits in which labor rights provided for in labor legislation specific to the related profession are discussed, such as: overtime, salary equalization, reinstatement, transfer allowance, pension plan supplement, among others, are discussed. These lawsuits are classified as follows: Collective lawsuits: related to claims considered similar and with individual amounts that are not considered relevant. The expected amount of loss is determined and accrued on a monthly basis in accordance with a statistical share pricing model and is reassessed taking into account the court rulings. Provisions for contingencies are adjusted to the amounts deposited as guarantee for their execution when realized. Individual lawsuits: related to claims with unusual characteristics or involving significant amounts. These are periodically calculated based on the calculation of the amount claimed. Probability of loss which, in turn, is estimated in accordance with the actual and legal characteristics related to that lawsuit. III- Other Risks These are quantified and accrued mainly based on the evaluation of rural credit transactions with joint liability and FCVS (salary variations compensation fund) credits assigned to Banco Nacional. Itaú Unibanco Holding S.A. – Complete Financial Statements – March 31, 2019 111

Below are the changes in civil, labor and other Risks provisions: 01/01 to 01/01 to 03/31/2019 03/31/2018 Other Civil Labor Total Total Opening balance 4,426,020 6,820,919 573,198 11,820,137 12,732,945 (-) Guaranteed Provisions by indemnity clauses (Note 3n) (226,179) ( 956,819) - (1,182,998) (1,240,767) Subtotal 4,199,841 5,864,100 573,198 10,637,139 11,492,178 Monetary restatement/charges 43,943 124,968 - 168,911 173,326 ( 31,173) 316,708 ( 82,206) 203,329 326,054 Changes in the period reflected in results (Notes 10g and 10i) Increase 77,698 343,261 73,053 494,012 497,635 Reversal (108,871) (26,553) (155,259) ( 290,683) (171,581) Payment (313,096) (457,441) - (770,537) (716,320) Subtotal 3,899,515 5,848,335 490,992 10,238,842 11,275,238 (+) Guaranteed Provisions by indemnity clauses (Note 3n) 221,715 989,404 - 1,211,119 1,229,926 Closing balance 4,121,230 6,837,739 490,992 11,449,961 12,505,164 Closing balance at 03/31/2018 5,066,182 7,298,868 140,114 12,505,164 Escrow deposits at 03/31/2019 1,549,381 2,369,836 - 3,919,217 Escrow deposits at 03/31/2018 1,497,758 2,183,784 - 3,681,542 Itaú Unibanco Holding S.A. – Complete Financial Statements – March 31, 2019 112 Below are the changes in civil, labor and other Risks provisions: 01/01 to 01/01 to 03/31/2019 03/31/2018 Other Civil Labor Total Total Opening balance 4,426,020 6,820,919 573,198 11,820,137 12,732,945 (-) Guaranteed Provisions by indemnity clauses (Note 3n) (226,179) ( 956,819) - (1,182,998) (1,240,767) Subtotal 4,199,841 5,864,100 573,198 10,637,139 11,492,178 Monetary restatement/charges 43,943 124,968 - 168,911 173,326 ( 31,173) 316,708 ( 82,206) 203,329 326,054 Changes in the period reflected in results (Notes 10g and 10i) Increase 77,698 343,261 73,053 494,012 497,635 Reversal (108,871) (26,553) (155,259) ( 290,683) (171,581) Payment (313,096) (457,441) - (770,537) (716,320) Subtotal 3,899,515 5,848,335 490,992 10,238,842 11,275,238 (+) Guaranteed Provisions by indemnity clauses (Note 3n) 221,715 989,404 - 1,211,119 1,229,926 Closing balance 4,121,230 6,837,739 490,992 11,449,961 12,505,164 Closing balance at 03/31/2018 5,066,182 7,298,868 140,114 12,505,164 Escrow deposits at 03/31/2019 1,549,381 2,369,836 - 3,919,217 Escrow deposits at 03/31/2018 1,497,758 2,183,784 - 3,681,542 Itaú Unibanco Holding S.A. – Complete Financial Statements – March 31, 2019 112
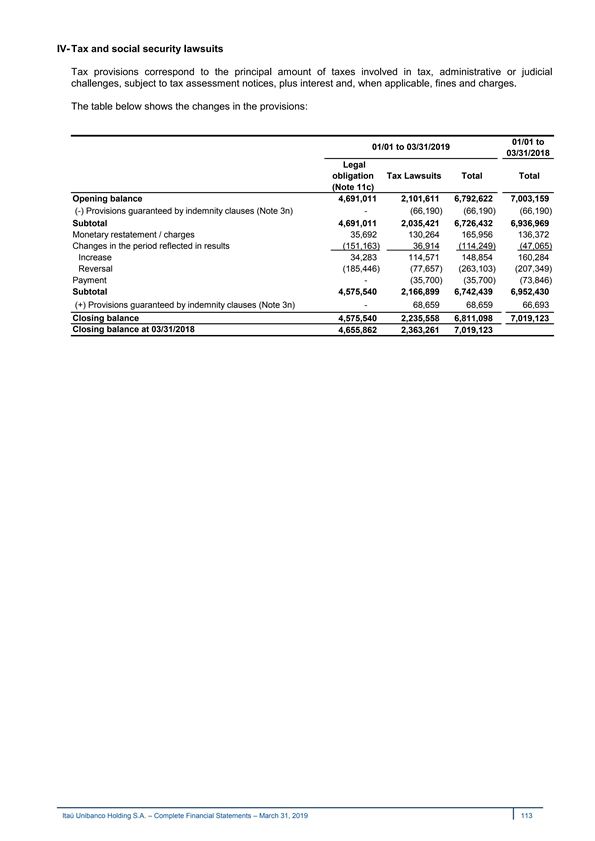
IV- Tax and social security lawsuits Tax provisions correspond to the principal amount of taxes involved in tax, administrative or judicial challenges, subject to tax assessment notices, plus interest and, when applicable, fines and charges. The table below shows the changes in the provisions: 01/01 to 01/01 to 03/31/2019 03/31/2018 Legal obligation Tax Lawsuits Total Total (Note 11c) Opening balance 4,691,011 2,101,611 6,792,622 7,003,159 (-) Provisions guaranteed by indemnity clauses (Note 3n) - (66,190) (66,190) ( 66,190) Subtotal 4,691,011 2,035,421 6,726,432 6,936,969 Monetary restatement / charges 35,692 130,264 165,956 136,372 Changes in the period reflected in results (151,163) 36,914 (114,249) (47,065) Increase 34,283 114,571 148,854 160,284 Reversal (185,446) (77,657) (263,103) (207,349) Payment - (35,700) (35,700) (73,846) Subtotal 4,575,540 2,166,899 6,742,439 6,952,430 (+) Provisions guaranteed by indemnity clauses (Note 3n) - 68,659 68,659 66,693 Closing balance 4,575,540 2,235,558 6,811,098 7,019,123 Closing balance at 03/31/2018 4,655,862 2,363,261 7,019,123 Itaú Unibanco Holding S.A. – Complete Financial Statements – March 31, 2019 113 IV- Tax and social security lawsuits Tax provisions correspond to the principal amount of taxes involved in tax, administrative or judicial challenges, subject to tax assessment notices, plus interest and, when applicable, fines and charges. The table below shows the changes in the provisions: 01/01 to 01/01 to 03/31/2019 03/31/2018 Legal obligation Tax Lawsuits Total Total (Note 11c) Opening balance 4,691,011 2,101,611 6,792,622 7,003,159 (-) Provisions guaranteed by indemnity clauses (Note 3n) - (66,190) (66,190) ( 66,190) Subtotal 4,691,011 2,035,421 6,726,432 6,936,969 Monetary restatement / charges 35,692 130,264 165,956 136,372 Changes in the period reflected in results (151,163) 36,914 (114,249) (47,065) Increase 34,283 114,571 148,854 160,284 Reversal (185,446) (77,657) (263,103) (207,349) Payment - (35,700) (35,700) (73,846) Subtotal 4,575,540 2,166,899 6,742,439 6,952,430 (+) Provisions guaranteed by indemnity clauses (Note 3n) - 68,659 68,659 66,693 Closing balance 4,575,540 2,235,558 6,811,098 7,019,123 Closing balance at 03/31/2018 4,655,862 2,363,261 7,019,123 Itaú Unibanco Holding S.A. – Complete Financial Statements – March 31, 2019 113
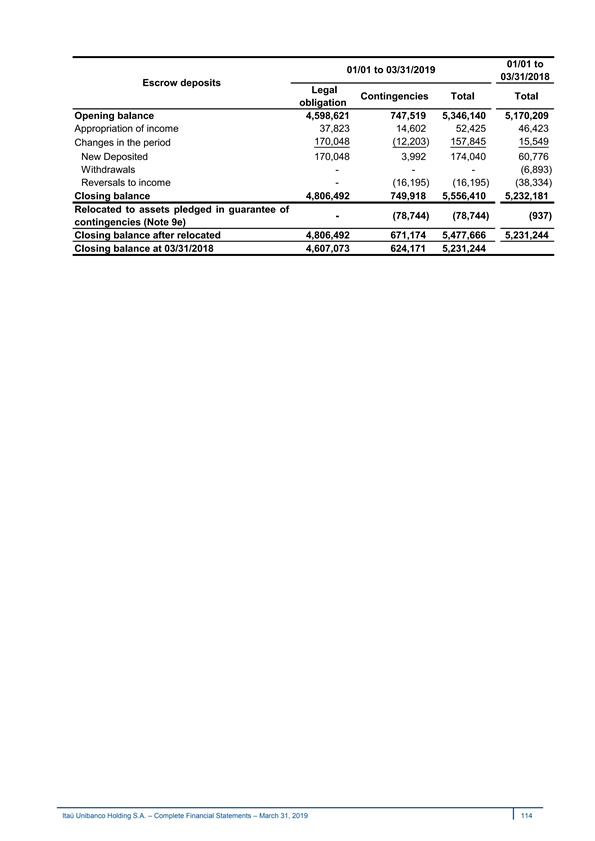
01/01 to 01/01 to 03/31/2019 03/31/2018 Escrow deposits Legal Contingencies Total Total obligation Opening balance 4,598,621 747,519 5,346,140 5,170,209 Appropriation of income 37,823 14,602 52,425 46,423 170,048 (12,203) 157,845 15,549 Changes in the period New Deposited 170,048 3,992 174,040 60,776 Withdrawals - - - (6,893) Reversals to income - (16,195) (16,195) (38,334) Closing balance 4,806,492 749,918 5,556,410 5,232,181 Relocated to assets pledged in guarantee of - (78,744) (78,744) (937) contingencies (Note 9e) Closing balance after relocated 4,806,492 671,174 5,477,666 5,231,244 Closing balance at 03/31/2018 4,607,073 624,171 5,231,244 Itaú Unibanco Holding S.A. – Complete Financial Statements – March 31, 2019 114 01/01 to 01/01 to 03/31/2019 03/31/2018 Escrow deposits Legal Contingencies Total Total obligation Opening balance 4,598,621 747,519 5,346,140 5,170,209 Appropriation of income 37,823 14,602 52,425 46,423 170,048 (12,203) 157,845 15,549 Changes in the period New Deposited 170,048 3,992 174,040 60,776 Withdrawals - - - (6,893) Reversals to income - (16,195) (16,195) (38,334) Closing balance 4,806,492 749,918 5,556,410 5,232,181 Relocated to assets pledged in guarantee of - (78,744) (78,744) (937) contingencies (Note 9e) Closing balance after relocated 4,806,492 671,174 5,477,666 5,231,244 Closing balance at 03/31/2018 4,607,073 624,171 5,231,244 Itaú Unibanco Holding S.A. – Complete Financial Statements – March 31, 2019 114
The main discussions related to Tax and Tax Lawsuits and Legal Obligations are described below: · CSLL – Isonomy – R$ 1,352,541: discussing the lack of constitutional support for the increase, established by law nº 11,727/08, of the CSLL rate for financial and insurance companies from 9% to 15%. The balance of the deposit in court totals R$ 1,367,510; · INSS – Non-compensatory amounts – R$ 666,345: the non-levy of social security contribution on amounts paid as profit sharing is defended; · PIS and COFINS – Calculation basis – R$ 631,957: defending the levy of PIS and COFINS on revenue, a tax on revenue from the sales of assets and services. The balance of the deposit in court totals R$ 615,733. Itaú Unibanco Holding S.A. – Complete Financial Statements – March 31, 2019 115 The main discussions related to Tax and Tax Lawsuits and Legal Obligations are described below: · CSLL – Isonomy – R$ 1,352,541: discussing the lack of constitutional support for the increase, established by law nº 11,727/08, of the CSLL rate for financial and insurance companies from 9% to 15%. The balance of the deposit in court totals R$ 1,367,510; · INSS – Non-compensatory amounts – R$ 666,345: the non-levy of social security contribution on amounts paid as profit sharing is defended; · PIS and COFINS – Calculation basis – R$ 631,957: defending the levy of PIS and COFINS on revenue, a tax on revenue from the sales of assets and services. The balance of the deposit in court totals R$ 615,733. Itaú Unibanco Holding S.A. – Complete Financial Statements – March 31, 2019 115
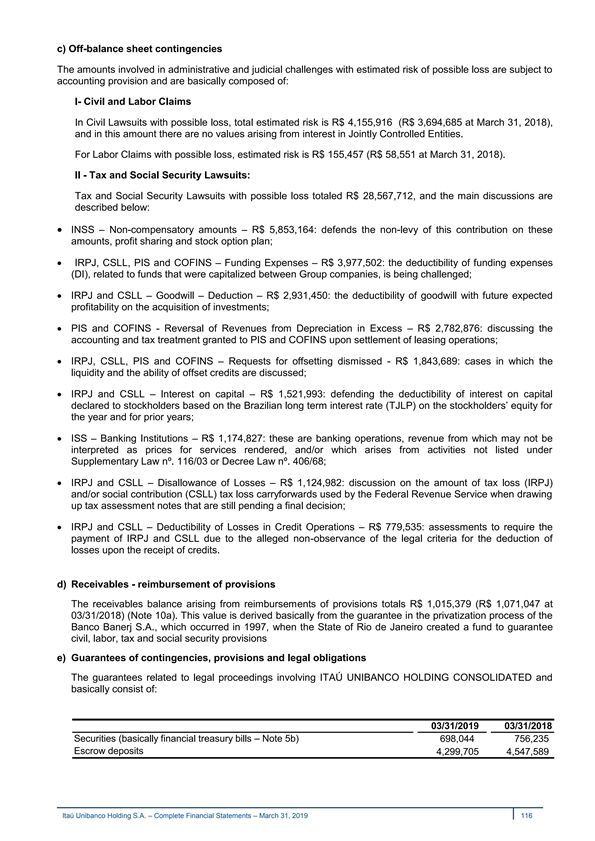
c) Off-balance sheet contingencies The amounts involved in administrative and judicial challenges with estimated risk of possible loss are subject to accounting provision and are basically composed of: I- Civil and Labor Claims In Civil Lawsuits with possible loss, total estimated risk is R$ 4,155,916 (R$ 3,694,685 at March 31, 2018), and in this amount there are no values arising from interest in Jointly Controlled Entities. For Labor Claims with possible loss, estimated risk is R$ 155,457 (R$ 58,551 at March 31, 2018). II - Tax and Social Security Lawsuits: Tax and Social Security Lawsuits with possible loss totaled R$ 28,567,712, and the main discussions are described below: · INSS – Non-compensatory amounts – R$ 5,853,164: defends the non-levy of this contribution on these amounts, profit sharing and stock option plan; · IRPJ, CSLL, PIS and COFINS – Funding Expenses – R$ 3,977,502: the deductibility of funding expenses (DI), related to funds that were capitalized between Group companies, is being challenged; · IRPJ and CSLL – Goodwill – Deduction – R$ 2,931,450: the deductibility of goodwill with future expected profitability on the acquisition of investments; · PIS and COFINS - Reversal of Revenues from Depreciation in Excess – R$ 2,782,876: discussing the accounting and tax treatment granted to PIS and COFINS upon settlement of leasing operations; · IRPJ, CSLL, PIS and COFINS – Requests for offsetting dismissed - R$ 1,843,689: cases in which the liquidity and the ability of offset credits are discussed; · IRPJ and CSLL – Interest on capital – R$ 1,521,993: defending the deductibility of interest on capital declared to stockholders based on the Brazilian long term interest rate (TJLP) on the stockholders’ equity for the year and for prior years; · ISS – Banking Institutions – R$ 1,174,827: these are banking operations, revenue from which may not be interpreted as prices for services rendered, and/or which arises from activities not listed under Supplementary Law nº. 116/03 or Decree Law nº. 406/68; · IRPJ and CSLL – Disallowance of Losses – R$ 1,124,982: discussion on the amount of tax loss (IRPJ) and/or social contribution (CSLL) tax loss carryforwards used by the Federal Revenue Service when drawing up tax assessment notes that are still pending a final decision; · IRPJ and CSLL – Deductibility of Losses in Credit Operations – R$ 779,535: assessments to require the payment of IRPJ and CSLL due to the alleged non-observance of the legal criteria for the deduction of losses upon the receipt of credits. d) Receivables - reimbursement of provisions The receivables balance arising from reimbursements of provisions totals R$ 1,015,379 (R$ 1,071,047 at 03/31/2018) (Note 10a). This value is derived basically from the guarantee in the privatization process of the Banco Banerj S.A., which occurred in 1997, when the State of Rio de Janeiro created a fund to guarantee civil, labor, tax and social security provisions e) Guarantees of contingencies, provisions and legal obligations The guarantees related to legal proceedings involving ITAÚ UNIBANCO HOLDING CONSOLIDATED and basically consist of: 03/31/2019 03/31/2018 Securities (basically financial treasury bills – Note 5b) 698,044 756,235 Escrow deposits 4,299,705 4,547,589 Itaú Unibanco Holding S.A. – Complete Financial Statements – March 31, 2019 116 c) Off-balance sheet contingencies The amounts involved in administrative and judicial challenges with estimated risk of possible loss are subject to accounting provision and are basically composed of: I- Civil and Labor Claims In Civil Lawsuits with possible loss, total estimated risk is R$ 4,155,916 (R$ 3,694,685 at March 31, 2018), and in this amount there are no values arising from interest in Jointly Controlled Entities. For Labor Claims with possible loss, estimated risk is R$ 155,457 (R$ 58,551 at March 31, 2018). II - Tax and Social Security Lawsuits: Tax and Social Security Lawsuits with possible loss totaled R$ 28,567,712, and the main discussions are described below: · INSS – Non-compensatory amounts – R$ 5,853,164: defends the non-levy of this contribution on these amounts, profit sharing and stock option plan; · IRPJ, CSLL, PIS and COFINS – Funding Expenses – R$ 3,977,502: the deductibility of funding expenses (DI), related to funds that were capitalized between Group companies, is being challenged; · IRPJ and CSLL – Goodwill – Deduction – R$ 2,931,450: the deductibility of goodwill with future expected profitability on the acquisition of investments; · PIS and COFINS - Reversal of Revenues from Depreciation in Excess – R$ 2,782,876: discussing the accounting and tax treatment granted to PIS and COFINS upon settlement of leasing operations; · IRPJ, CSLL, PIS and COFINS – Requests for offsetting dismissed - R$ 1,843,689: cases in which the liquidity and the ability of offset credits are discussed; · IRPJ and CSLL – Interest on capital – R$ 1,521,993: defending the deductibility of interest on capital declared to stockholders based on the Brazilian long term interest rate (TJLP) on the stockholders’ equity for the year and for prior years; · ISS – Banking Institutions – R$ 1,174,827: these are banking operations, revenue from which may not be interpreted as prices for services rendered, and/or which arises from activities not listed under Supplementary Law nº. 116/03 or Decree Law nº. 406/68; · IRPJ and CSLL – Disallowance of Losses – R$ 1,124,982: discussion on the amount of tax loss (IRPJ) and/or social contribution (CSLL) tax loss carryforwards used by the Federal Revenue Service when drawing up tax assessment notes that are still pending a final decision; · IRPJ and CSLL – Deductibility of Losses in Credit Operations – R$ 779,535: assessments to require the payment of IRPJ and CSLL due to the alleged non-observance of the legal criteria for the deduction of losses upon the receipt of credits. d) Receivables - reimbursement of provisions The receivables balance arising from reimbursements of provisions totals R$ 1,015,379 (R$ 1,071,047 at 03/31/2018) (Note 10a). This value is derived basically from the guarantee in the privatization process of the Banco Banerj S.A., which occurred in 1997, when the State of Rio de Janeiro created a fund to guarantee civil, labor, tax and social security provisions e) Guarantees of contingencies, provisions and legal obligations The guarantees related to legal proceedings involving ITAÚ UNIBANCO HOLDING CONSOLIDATED and basically consist of: 03/31/2019 03/31/2018 Securities (basically financial treasury bills – Note 5b) 698,044 756,235 Escrow deposits 4,299,705 4,547,589 Itaú Unibanco Holding S.A. – Complete Financial Statements – March 31, 2019 116
ITAÚ UNIBANCO HOLDING CONSOLIDATED litigation provisions are long-term, considering the time required to conclude legal cases through the court system in Brazil, which prevents the disclosure of a deadline for their conclusion. The legal advisors believe that ITAÚ UNIBANCO HOLDING CONSOLIDATED is not a party to this or any other administrative proceedings or lawsuits that could significantly affect the results of its operations. Itaú Unibanco Holding S.A. – Complete Financial Statements – March 31, 2019 117 ITAÚ UNIBANCO HOLDING CONSOLIDATED litigation provisions are long-term, considering the time required to conclude legal cases through the court system in Brazil, which prevents the disclosure of a deadline for their conclusion. The legal advisors believe that ITAÚ UNIBANCO HOLDING CONSOLIDATED is not a party to this or any other administrative proceedings or lawsuits that could significantly affect the results of its operations. Itaú Unibanco Holding S.A. – Complete Financial Statements – March 31, 2019 117
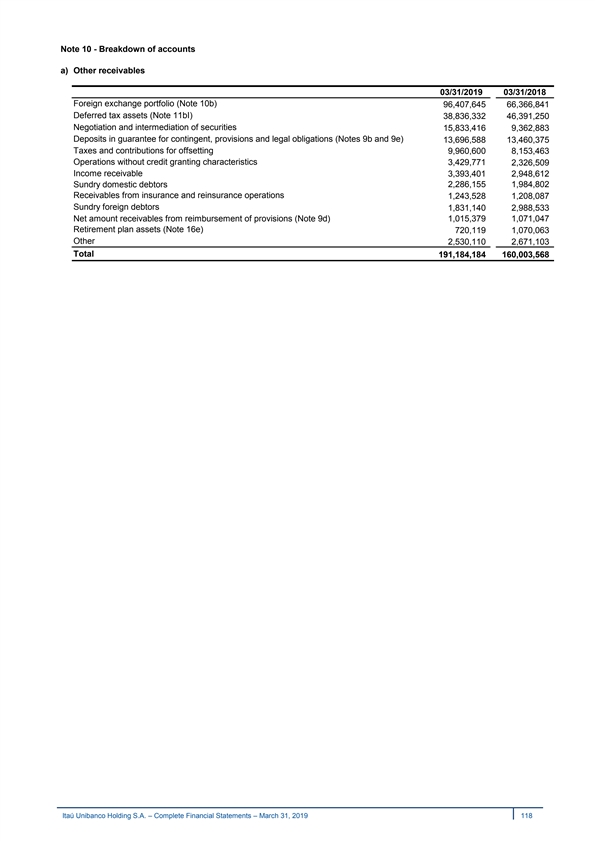
Note 10 - Breakdown of accounts a) Other receivables 03/31/2019 03/31/2018 Foreign exchange portfolio (Note 10b) 96,407,645 66,366,841 Deferred tax assets (Note 11bI) 38,836,332 46,391,250 Negotiation and intermediation of securities 15,833,416 9,362,883 Deposits in guarantee for contingent, provisions and legal obligations (Notes 9b and 9e) 13,696,588 13,460,375 Taxes and contributions for offsetting 9,960,600 8,153,463 Operations without credit granting characteristics 3,429,771 2,326,509 Income receivable 3,393,401 2,948,612 Sundry domestic debtors 2,286,155 1,984,802 Receivables from insurance and reinsurance operations 1,243,528 1,208,087 Sundry foreign debtors 1,831,140 2,988,533 Net amount receivables from reimbursement of provisions (Note 9d) 1,015,379 1,071,047 Retirement plan assets (Note 16e) 720,119 1,070,063 Other 2,530,110 2,671,103 Total 191,184,184 160,003,568 Itaú Unibanco Holding S.A. – Complete Financial Statements – March 31, 2019 118 Note 10 - Breakdown of accounts a) Other receivables 03/31/2019 03/31/2018 Foreign exchange portfolio (Note 10b) 96,407,645 66,366,841 Deferred tax assets (Note 11bI) 38,836,332 46,391,250 Negotiation and intermediation of securities 15,833,416 9,362,883 Deposits in guarantee for contingent, provisions and legal obligations (Notes 9b and 9e) 13,696,588 13,460,375 Taxes and contributions for offsetting 9,960,600 8,153,463 Operations without credit granting characteristics 3,429,771 2,326,509 Income receivable 3,393,401 2,948,612 Sundry domestic debtors 2,286,155 1,984,802 Receivables from insurance and reinsurance operations 1,243,528 1,208,087 Sundry foreign debtors 1,831,140 2,988,533 Net amount receivables from reimbursement of provisions (Note 9d) 1,015,379 1,071,047 Retirement plan assets (Note 16e) 720,119 1,070,063 Other 2,530,110 2,671,103 Total 191,184,184 160,003,568 Itaú Unibanco Holding S.A. – Complete Financial Statements – March 31, 2019 118
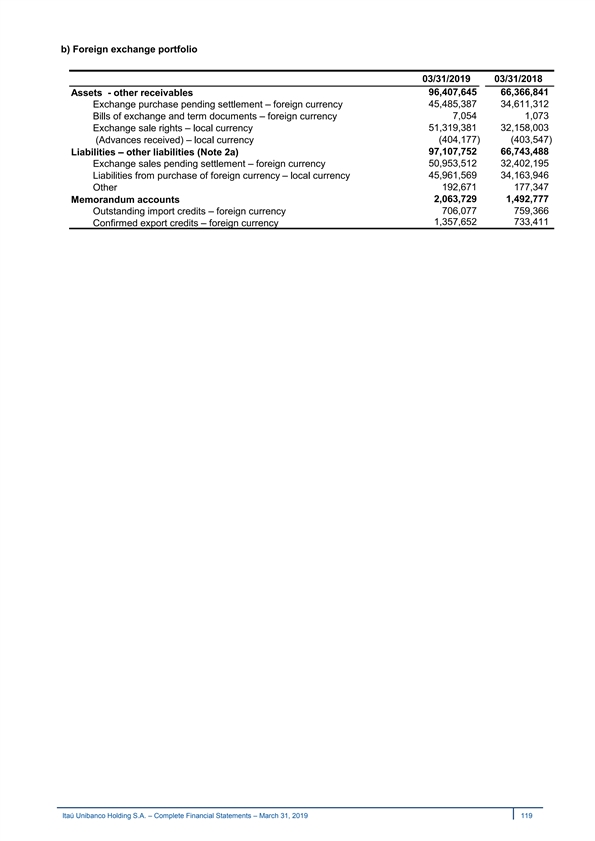
b) Foreign exchange portfolio 03/31/2019 03/31/2018 Assets - other receivables 96,407,645 66,366,841 45,485,387 34,611,312 Exchange purchase pending settlement – foreign currency 7,054 1,073 Bills of exchange and term documents – foreign currency 51,319,381 32,158,003 Exchange sale rights – local currency (Advances received) – local currency ( 404,177) ( 403,547) 97,107,752 66,743,488 Liabilities – other liabilities (Note 2a) Exchange sales pending settlement – foreign currency 50,953,512 32,402,195 Liabilities from purchase of foreign currency – local currency 45,961,569 34,163,946 Other 192,671 177,347 Memorandum accounts 2,063,729 1,492,777 706,077 759,366 Outstanding import credits – foreign currency 1,357,652 733,411 Confirmed export credits – foreign currency Itaú Unibanco Holding S.A. – Complete Financial Statements – March 31, 2019 119 b) Foreign exchange portfolio 03/31/2019 03/31/2018 Assets - other receivables 96,407,645 66,366,841 45,485,387 34,611,312 Exchange purchase pending settlement – foreign currency 7,054 1,073 Bills of exchange and term documents – foreign currency 51,319,381 32,158,003 Exchange sale rights – local currency (Advances received) – local currency ( 404,177) ( 403,547) 97,107,752 66,743,488 Liabilities – other liabilities (Note 2a) Exchange sales pending settlement – foreign currency 50,953,512 32,402,195 Liabilities from purchase of foreign currency – local currency 45,961,569 34,163,946 Other 192,671 177,347 Memorandum accounts 2,063,729 1,492,777 706,077 759,366 Outstanding import credits – foreign currency 1,357,652 733,411 Confirmed export credits – foreign currency Itaú Unibanco Holding S.A. – Complete Financial Statements – March 31, 2019 119
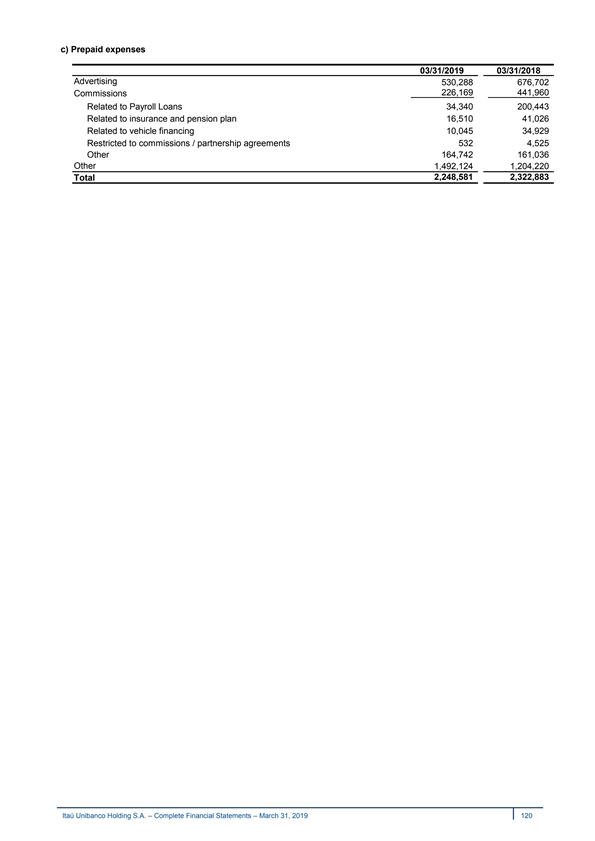
c) Prepaid expenses 03/31/2019 03/31/2018 Advertising 530,288 676,702 226,169 441,960 Commissions Related to Payroll Loans 34,340 200,443 Related to insurance and pension plan 16,510 41,026 Related to vehicle financing 10,045 34,929 Restricted to commissions / partnership agreements 532 4,525 Other 164,742 161,036 Other 1,492,124 1,204,220 2,248,581 2,322,883 Total Itaú Unibanco Holding S.A. – Complete Financial Statements – March 31, 2019 120 c) Prepaid expenses 03/31/2019 03/31/2018 Advertising 530,288 676,702 226,169 441,960 Commissions Related to Payroll Loans 34,340 200,443 Related to insurance and pension plan 16,510 41,026 Related to vehicle financing 10,045 34,929 Restricted to commissions / partnership agreements 532 4,525 Other 164,742 161,036 Other 1,492,124 1,204,220 2,248,581 2,322,883 Total Itaú Unibanco Holding S.A. – Complete Financial Statements – March 31, 2019 120
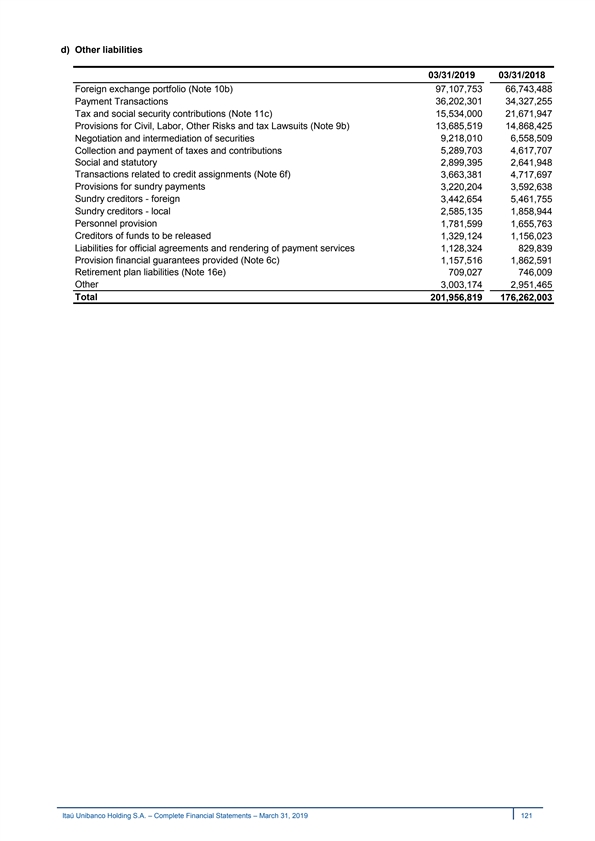
d) Other liabilities 03/31/2019 03/31/2018 97,107,753 66,743,488 Foreign exchange portfolio (Note 10b) Payment Transactions 36,202,301 34,327,255 Tax and social security contributions (Note 11c) 15,534,000 21,671,947 13,685,519 14,868,425 Provisions for Civil, Labor, Other Risks and tax Lawsuits (Note 9b) Negotiation and intermediation of securities 9,218,010 6,558,509 Collection and payment of taxes and contributions 5,289,703 4,617,707 Social and statutory 2,899,395 2,641,948 Transactions related to credit assignments (Note 6f) 3,663,381 4,717,697 Provisions for sundry payments 3,220,204 3,592,638 Sundry creditors - foreign 3,442,654 5,461,755 Sundry creditors - local 2,585,135 1,858,944 Personnel provision 1,781,599 1,655,763 Creditors of funds to be released 1,329,124 1,156,023 Liabilities for official agreements and rendering of payment services 1,128,324 829,839 Provision financial guarantees provided (Note 6c) 1,157,516 1,862,591 Retirement plan liabilities (Note 16e) 709,027 746,009 Other 3,003,174 2,951,465 Total 201,956,819 176,262,003 Itaú Unibanco Holding S.A. – Complete Financial Statements – March 31, 2019 121 d) Other liabilities 03/31/2019 03/31/2018 97,107,753 66,743,488 Foreign exchange portfolio (Note 10b) Payment Transactions 36,202,301 34,327,255 Tax and social security contributions (Note 11c) 15,534,000 21,671,947 13,685,519 14,868,425 Provisions for Civil, Labor, Other Risks and tax Lawsuits (Note 9b) Negotiation and intermediation of securities 9,218,010 6,558,509 Collection and payment of taxes and contributions 5,289,703 4,617,707 Social and statutory 2,899,395 2,641,948 Transactions related to credit assignments (Note 6f) 3,663,381 4,717,697 Provisions for sundry payments 3,220,204 3,592,638 Sundry creditors - foreign 3,442,654 5,461,755 Sundry creditors - local 2,585,135 1,858,944 Personnel provision 1,781,599 1,655,763 Creditors of funds to be released 1,329,124 1,156,023 Liabilities for official agreements and rendering of payment services 1,128,324 829,839 Provision financial guarantees provided (Note 6c) 1,157,516 1,862,591 Retirement plan liabilities (Note 16e) 709,027 746,009 Other 3,003,174 2,951,465 Total 201,956,819 176,262,003 Itaú Unibanco Holding S.A. – Complete Financial Statements – March 31, 2019 121

e) Banking service fees 01/01 to 01/01 to 03/31/2019 03/31/2018 Credit and debit cards 2,862,845 2,814,572 Asset management 1,594,986 1,541,743 Funds 1,416,179 1,385,838 Cons Consorti ora tia management fee 178,807 155,905 Fees for guarantees issued and credit lines 426,730 457,362 Loan operations 92,703 84,543 Guarantees provided 334,027 372,819 Receipt services 442,205 425,808 Collection fees 368,879 356,596 Collection services 73,326 69,212 Current account 177,270 170,432 Other 712,236 727,679 Custody and management of portfolio 117,103 102,706 Economic and financial advisory 130,890 117,424 Other services 464,243 507,549 Total 6,216,272 6,137,596 f) Income related to bank charges 01/01 to 01/01 to 03/31/2019 03/31/2018 Service package fees 1,636,079 1,656,789 Credit cards – annual fees and other services 992,708 925,674 Income related to securities brokerage 215,366 216,685 Loan operations / registration 229,268 224,281 Transfer of funds 98,322 93,760 Deposit account 56,943 50,191 Total 3,228,686 3,167,380 Itaú Unibanco Holding S.A. – Complete Financial Statements – March 31, 2019 122 e) Banking service fees 01/01 to 01/01 to 03/31/2019 03/31/2018 Credit and debit cards 2,862,845 2,814,572 Asset management 1,594,986 1,541,743 Funds 1,416,179 1,385,838 Cons Consorti ora tia management fee 178,807 155,905 Fees for guarantees issued and credit lines 426,730 457,362 Loan operations 92,703 84,543 Guarantees provided 334,027 372,819 Receipt services 442,205 425,808 Collection fees 368,879 356,596 Collection services 73,326 69,212 Current account 177,270 170,432 Other 712,236 727,679 Custody and management of portfolio 117,103 102,706 Economic and financial advisory 130,890 117,424 Other services 464,243 507,549 Total 6,216,272 6,137,596 f) Income related to bank charges 01/01 to 01/01 to 03/31/2019 03/31/2018 Service package fees 1,636,079 1,656,789 Credit cards – annual fees and other services 992,708 925,674 Income related to securities brokerage 215,366 216,685 Loan operations / registration 229,268 224,281 Transfer of funds 98,322 93,760 Deposit account 56,943 50,191 Total 3,228,686 3,167,380 Itaú Unibanco Holding S.A. – Complete Financial Statements – March 31, 2019 122
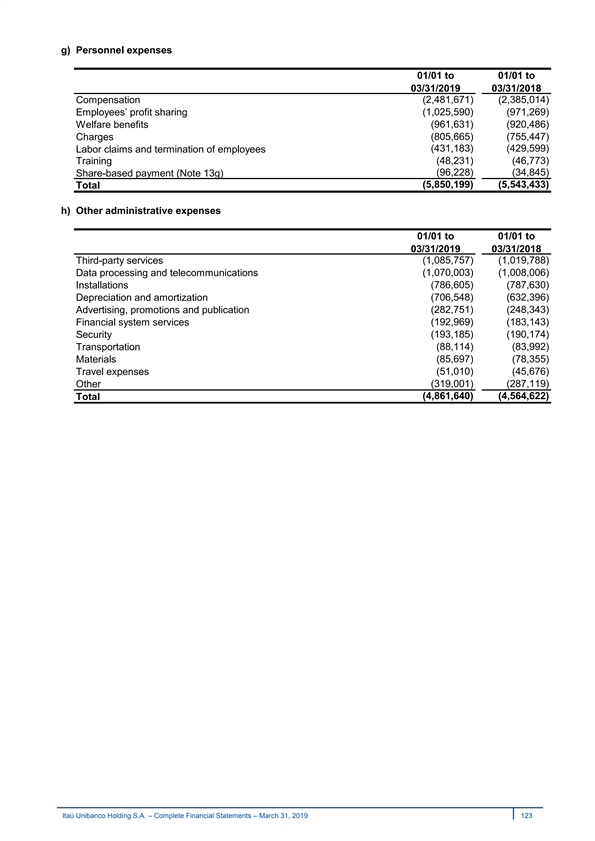
g) Personnel expenses 01/01 to 01/01 to 03/31/2019 03/31/2018 Compensation (2,481,671) (2,385,014) Employees’ profit sharing (1,025,590) (971,269) Welfare benefits (961,631) (920,486) (805,665) (755,447) Charges (431,183) (429,599) Labor claims and termination of employees (48,231) (46,773) Training (96,228) (34,845) Share-based payment (Note 13g) (5,850,199) (5,543,433) Total h) Other administrative expenses 01/01 to 01/01 to 03/31/2019 03/31/2018 Third-party services (1,085,757) (1,019,788) (1,070,003) (1,008,006) Data processing and telecommunications Installations (786,605) (787,630) Depreciation and amortization (706,548) (632,396) (282,751) (248,343) Advertising, promotions and publication Financial system services (192,969) (183,143) Security (193,185) (190,174) Transportation (88,114) (83,992) Materials (85,697) (78,355) (51,010) (45,676) Travel expenses Other (319,001) (287,119) ( 4,861,640) ( 4,564,622) Total Itaú Unibanco Holding S.A. – Complete Financial Statements – March 31, 2019 123 g) Personnel expenses 01/01 to 01/01 to 03/31/2019 03/31/2018 Compensation (2,481,671) (2,385,014) Employees’ profit sharing (1,025,590) (971,269) Welfare benefits (961,631) (920,486) (805,665) (755,447) Charges (431,183) (429,599) Labor claims and termination of employees (48,231) (46,773) Training (96,228) (34,845) Share-based payment (Note 13g) (5,850,199) (5,543,433) Total h) Other administrative expenses 01/01 to 01/01 to 03/31/2019 03/31/2018 Third-party services (1,085,757) (1,019,788) (1,070,003) (1,008,006) Data processing and telecommunications Installations (786,605) (787,630) Depreciation and amortization (706,548) (632,396) (282,751) (248,343) Advertising, promotions and publication Financial system services (192,969) (183,143) Security (193,185) (190,174) Transportation (88,114) (83,992) Materials (85,697) (78,355) (51,010) (45,676) Travel expenses Other (319,001) (287,119) ( 4,861,640) ( 4,564,622) Total Itaú Unibanco Holding S.A. – Complete Financial Statements – March 31, 2019 123
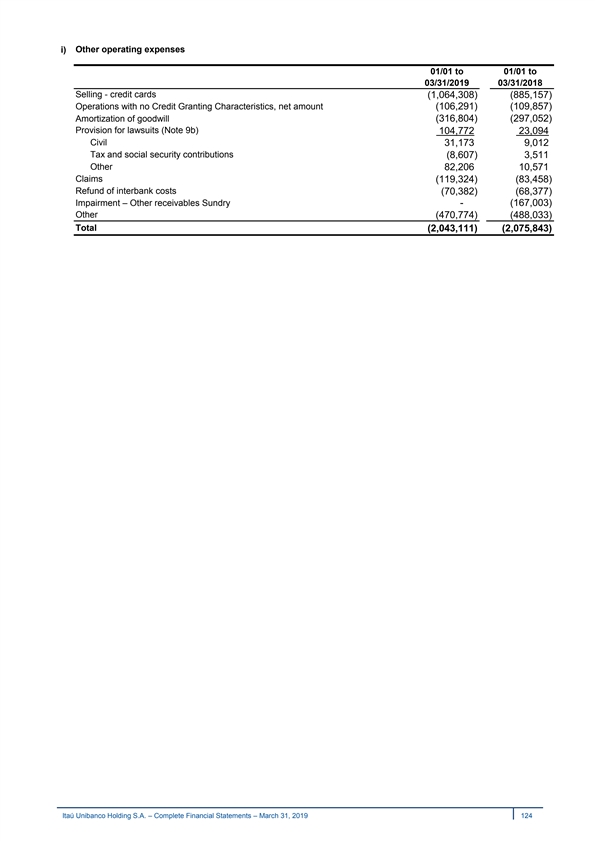
i) Other operating expenses 01/01 to 01/01 to 03/31/2019 03/31/2018 Selling - credit cards (1,064,308) (885,157) Operations with no Credit Granting Characteristics, net amount (106,291) (109,857) Amortization of goodwill (316,804) (297,052) Provision for lawsuits (Note 9b) 104,772 23,094 Civil 31,173 9,012 Tax and social security contributions (8,607) 3,511 Other 82,206 10,571 Claims (119,324) (83,458) Refund of interbank costs (70,382) (68,377) Impairment – Other receivables Sundry - (167,003) Other (470,774) (488,033) Total (2,043,111) (2,075,843) Itaú Unibanco Holding S.A. – Complete Financial Statements – March 31, 2019 124 i) Other operating expenses 01/01 to 01/01 to 03/31/2019 03/31/2018 Selling - credit cards (1,064,308) (885,157) Operations with no Credit Granting Characteristics, net amount (106,291) (109,857) Amortization of goodwill (316,804) (297,052) Provision for lawsuits (Note 9b) 104,772 23,094 Civil 31,173 9,012 Tax and social security contributions (8,607) 3,511 Other 82,206 10,571 Claims (119,324) (83,458) Refund of interbank costs (70,382) (68,377) Impairment – Other receivables Sundry - (167,003) Other (470,774) (488,033) Total (2,043,111) (2,075,843) Itaú Unibanco Holding S.A. – Complete Financial Statements – March 31, 2019 124
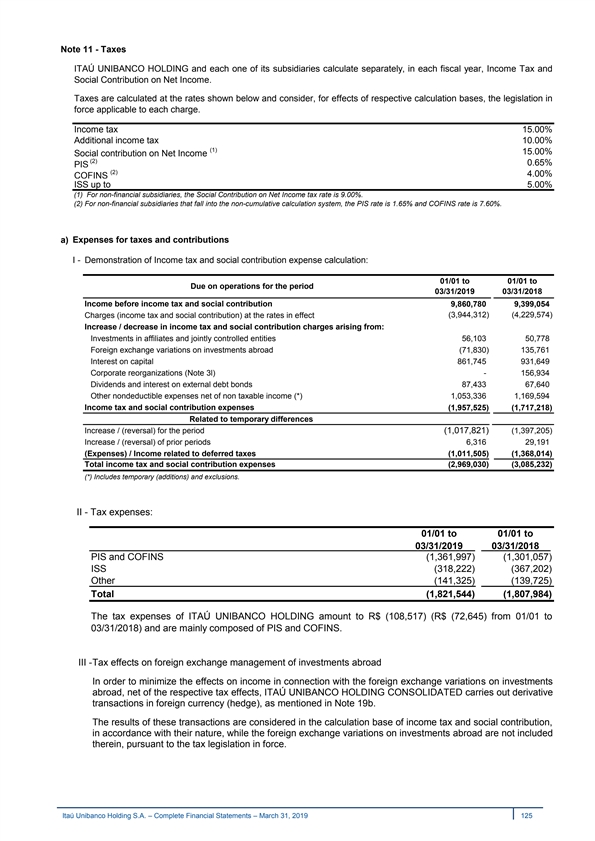
Note 11 - Taxes ITAÚ UNIBANCO HOLDING and each one of its subsidiaries calculate separately, in each fiscal year, Income Tax and Social Contribution on Net Income. Taxes are calculated at the rates shown below and consider, for effects of respective calculation bases, the legislation in force applicable to each charge. Income tax 15.00% Additional income tax 10.00% (1) 15.00% Social contribution on Net Income (2) 0.65% PIS (2) 4.00% COFINS ISS up to 5.00% (1) For non-financial subsidiaries, the Social Contribution on Net Income tax rate is 9.00%. (2) For non-financial subsidiaries that fall into the non-cumulative calculation system, the PIS rate is 1.65% and COFINS rate is 7.60%. a) Expenses for taxes and contributions I - Demonstration of Income tax and social contribution expense calculation: 01/01 to 01/01 to Due on operations for the period 03/31/2019 03/31/2018 Income before income tax and social contribution 9 ,860,780 9,399,054 (3,944,312) (4,229,574) Charges (income tax and social contribution) at the rates in effect Increase / decrease in income tax and social contribution charges arising from: Investments in affiliates and jointly controlled entities 5 6,103 50,778 Foreign exchange variations on investments abroad (7 1,830) 135,761 Interest on capital 8 61,745 931,649 Corporate reorganizations (Note 3l) - 156,934 Dividends and interest on external debt bonds 8 7,433 67,640 Other nondeductible expenses net of non taxable income (*) 1,053,336 1,169,594 Income tax and social contribution expenses (1 ,957,525) (1 ,717,218) Related to temporary differences Increase / (reversal) for the period (1,017,821) (1,397,205) Increase / (reversal) of prior periods 6,316 2 9,191 (Expenses) / Income related to deferred taxes (1 ,011,505) (1 ,368,014) Total income tax and social contribution expenses (2 ,969,030) (3 ,085,232) (*) Includes temporary (additions) and exclusions. II - Tax expenses: 01/01 to 01/01 to 03/31/2019 03/31/2018 PIS and COFINS (1,361,997) (1,301,057) ISS (318,222) ( 367,202) Other (141,325) ( 139,725) Total ( 1,821,544) (1,807,984) The tax expenses of ITAÚ UNIBANCO HOLDING amount to R$ (108,517) (R$ (72,645) from 01/01 to 03/31/2018) and are mainly composed of PIS and COFINS. III - Tax effects on foreign exchange management of investments abroad In order to minimize the effects on income in connection with the foreign exchange variations on investments abroad, net of the respective tax effects, ITAÚ UNIBANCO HOLDING CONSOLIDATED carries out derivative transactions in foreign currency (hedge), as mentioned in Note 19b. The results of these transactions are considered in the calculation base of income tax and social contribution, in accordance with their nature, while the foreign exchange variations on investments abroad are not included therein, pursuant to the tax legislation in force. Itaú Unibanco Holding S.A. – Complete Financial Statements – March 31, 2019 125 Note 11 - Taxes ITAÚ UNIBANCO HOLDING and each one of its subsidiaries calculate separately, in each fiscal year, Income Tax and Social Contribution on Net Income. Taxes are calculated at the rates shown below and consider, for effects of respective calculation bases, the legislation in force applicable to each charge. Income tax 15.00% Additional income tax 10.00% (1) 15.00% Social contribution on Net Income (2) 0.65% PIS (2) 4.00% COFINS ISS up to 5.00% (1) For non-financial subsidiaries, the Social Contribution on Net Income tax rate is 9.00%. (2) For non-financial subsidiaries that fall into the non-cumulative calculation system, the PIS rate is 1.65% and COFINS rate is 7.60%. a) Expenses for taxes and contributions I - Demonstration of Income tax and social contribution expense calculation: 01/01 to 01/01 to Due on operations for the period 03/31/2019 03/31/2018 Income before income tax and social contribution 9 ,860,780 9,399,054 (3,944,312) (4,229,574) Charges (income tax and social contribution) at the rates in effect Increase / decrease in income tax and social contribution charges arising from: Investments in affiliates and jointly controlled entities 5 6,103 50,778 Foreign exchange variations on investments abroad (7 1,830) 135,761 Interest on capital 8 61,745 931,649 Corporate reorganizations (Note 3l) - 156,934 Dividends and interest on external debt bonds 8 7,433 67,640 Other nondeductible expenses net of non taxable income (*) 1,053,336 1,169,594 Income tax and social contribution expenses (1 ,957,525) (1 ,717,218) Related to temporary differences Increase / (reversal) for the period (1,017,821) (1,397,205) Increase / (reversal) of prior periods 6,316 2 9,191 (Expenses) / Income related to deferred taxes (1 ,011,505) (1 ,368,014) Total income tax and social contribution expenses (2 ,969,030) (3 ,085,232) (*) Includes temporary (additions) and exclusions. II - Tax expenses: 01/01 to 01/01 to 03/31/2019 03/31/2018 PIS and COFINS (1,361,997) (1,301,057) ISS (318,222) ( 367,202) Other (141,325) ( 139,725) Total ( 1,821,544) (1,807,984) The tax expenses of ITAÚ UNIBANCO HOLDING amount to R$ (108,517) (R$ (72,645) from 01/01 to 03/31/2018) and are mainly composed of PIS and COFINS. III - Tax effects on foreign exchange management of investments abroad In order to minimize the effects on income in connection with the foreign exchange variations on investments abroad, net of the respective tax effects, ITAÚ UNIBANCO HOLDING CONSOLIDATED carries out derivative transactions in foreign currency (hedge), as mentioned in Note 19b. The results of these transactions are considered in the calculation base of income tax and social contribution, in accordance with their nature, while the foreign exchange variations on investments abroad are not included therein, pursuant to the tax legislation in force. Itaú Unibanco Holding S.A. – Complete Financial Statements – March 31, 2019 125
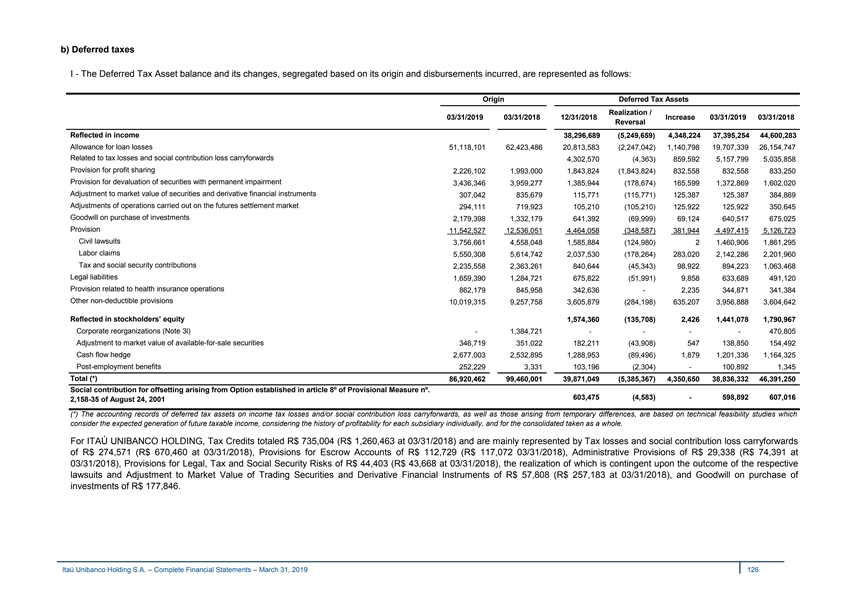
b) Deferred taxes I - The Deferred Tax Asset balance and its changes, segregated based on its origin and disbursements incurred, are represented as follows: Origin Deferred Tax Assets Realization / 03/31/2019 03/31/2018 12/31/2018 Increase 03/31/2019 03/31/2018 Reversal Reflected in income 38,296,689 (5,249,659) 4,348,224 37,395,254 44,600,283 Allowance for loan losses 51,118,101 62,423,486 20,813,583 (2,247,042) 1,140,798 19,707,339 26,154,747 Related to tax losses and social contribution loss carryforwards 4,302,570 (4,363) 859,592 5,157,799 5,035,858 Provision for profit sharing 2,226,102 1,993,000 1,843,824 (1,843,824) 832,558 832,558 833,250 Provision for devaluation of securities with permanent impairment 3,436,346 3,959,277 1,385,944 (178,674) 165,599 1,372,869 1,602,020 Adjustment to market value of securities and derivative financial instruments 307,042 835,679 115,771 (115,771) 125,387 125,387 384,869 Adjustments of operations carried out on the futures settlement market 294,111 719,923 105,210 (105,210) 125,922 125,922 350,645 Goodwill on purchase of investments 2,179,398 1,332,179 641,392 (69,999) 69,124 640,517 675,025 Provision 11,542,527 12,536,051 4,464,058 (348,587) 381,944 4,497,415 5,126,723 Civil lawsuits 3,756,661 4,558,048 1,585,884 (124,980) 2 1,460,906 1,861,295 Labor claims 5,550,308 5,614,742 2,037,530 (178,264) 283,020 2,142,286 2,201,960 Tax and social security contributions 2,235,558 2,363,261 840,644 (45,343) 98,922 894,223 1,063,468 Legal liabilities 1,659,390 1,284,721 675,822 (51,991) 9,858 633,689 491,120 Provision related to health insurance operations 862,179 845,958 342,636 - 2,235 344,871 341,384 Other non-deductible provisions 10,019,315 9,257,758 3,605,879 (284,198) 635,207 3,956,888 3,604,642 Reflected in stockholders’ equity 1,574,360 (135,708) 2,426 1,441,078 1,790,967 Corporate reorganizations (Note 3l) - 1,384,721 - - - - 470,805 Adjustment to market value of available-for-sale securities 346,719 351,022 182,211 (43,908) 547 138,850 154,492 Cash flow hedge 2,677,003 2,532,895 1,288,953 (89,496) 1,879 1,201,336 1,164,325 Post-employment benefits 252,229 3,331 103,196 (2,304) - 100,892 1,345 Total (*) 8 6,920,462 9 9,460,001 39,871,049 (5,385,367) 4,350,650 38,836,332 46,391,250 Social contribution for offsetting arising from Option established in article 8º of Provisional Measure nº. 603,475 (4,583) - 5 98,892 6 07,016 2,158-35 of August 24, 2001 (*) The accounting records of deferred tax assets on income tax losses and/or social contribution loss carryforwards, as well as those arising from temporary differences, are based on technical feasibility studies which consider the expected generation of future taxable income, considering the history of profitability for each subsidiary individually, and for the consolidated taken as a whole. For ITAÚ UNIBANCO HOLDING, Tax Credits totaled R$ 735,004 (R$ 1,260,463 at 03/31/2018) and are mainly represented by Tax losses and social contribution loss carryforwards of R$ 274,571 (R$ 670,460 at 03/31/2018), Provisions for Escrow Accounts of R$ 112,729 (R$ 117,072 03/31/2018), Administrative Provisions of R$ 29,338 (R$ 74,391 at 03/31/2018), Provisions for Legal, Tax and Social Security Risks of R$ 44,403 (R$ 43,668 at 03/31/2018), the realization of which is contingent upon the outcome of the respective lawsuits and Adjustment to Market Value of Trading Securities and Derivative Financial Instruments of R$ 57,808 (R$ 257,183 at 03/31/2018), and Goodwill on purchase of investments of R$ 177,846. Itaú Unibanco Holding S.A. – Complete Financial Statements – March 31, 2019 126 b) Deferred taxes I - The Deferred Tax Asset balance and its changes, segregated based on its origin and disbursements incurred, are represented as follows: Origin Deferred Tax Assets Realization / 03/31/2019 03/31/2018 12/31/2018 Increase 03/31/2019 03/31/2018 Reversal Reflected in income 38,296,689 (5,249,659) 4,348,224 37,395,254 44,600,283 Allowance for loan losses 51,118,101 62,423,486 20,813,583 (2,247,042) 1,140,798 19,707,339 26,154,747 Related to tax losses and social contribution loss carryforwards 4,302,570 (4,363) 859,592 5,157,799 5,035,858 Provision for profit sharing 2,226,102 1,993,000 1,843,824 (1,843,824) 832,558 832,558 833,250 Provision for devaluation of securities with permanent impairment 3,436,346 3,959,277 1,385,944 (178,674) 165,599 1,372,869 1,602,020 Adjustment to market value of securities and derivative financial instruments 307,042 835,679 115,771 (115,771) 125,387 125,387 384,869 Adjustments of operations carried out on the futures settlement market 294,111 719,923 105,210 (105,210) 125,922 125,922 350,645 Goodwill on purchase of investments 2,179,398 1,332,179 641,392 (69,999) 69,124 640,517 675,025 Provision 11,542,527 12,536,051 4,464,058 (348,587) 381,944 4,497,415 5,126,723 Civil lawsuits 3,756,661 4,558,048 1,585,884 (124,980) 2 1,460,906 1,861,295 Labor claims 5,550,308 5,614,742 2,037,530 (178,264) 283,020 2,142,286 2,201,960 Tax and social security contributions 2,235,558 2,363,261 840,644 (45,343) 98,922 894,223 1,063,468 Legal liabilities 1,659,390 1,284,721 675,822 (51,991) 9,858 633,689 491,120 Provision related to health insurance operations 862,179 845,958 342,636 - 2,235 344,871 341,384 Other non-deductible provisions 10,019,315 9,257,758 3,605,879 (284,198) 635,207 3,956,888 3,604,642 Reflected in stockholders’ equity 1,574,360 (135,708) 2,426 1,441,078 1,790,967 Corporate reorganizations (Note 3l) - 1,384,721 - - - - 470,805 Adjustment to market value of available-for-sale securities 346,719 351,022 182,211 (43,908) 547 138,850 154,492 Cash flow hedge 2,677,003 2,532,895 1,288,953 (89,496) 1,879 1,201,336 1,164,325 Post-employment benefits 252,229 3,331 103,196 (2,304) - 100,892 1,345 Total (*) 8 6,920,462 9 9,460,001 39,871,049 (5,385,367) 4,350,650 38,836,332 46,391,250 Social contribution for offsetting arising from Option established in article 8º of Provisional Measure nº. 603,475 (4,583) - 5 98,892 6 07,016 2,158-35 of August 24, 2001 (*) The accounting records of deferred tax assets on income tax losses and/or social contribution loss carryforwards, as well as those arising from temporary differences, are based on technical feasibility studies which consider the expected generation of future taxable income, considering the history of profitability for each subsidiary individually, and for the consolidated taken as a whole. For ITAÚ UNIBANCO HOLDING, Tax Credits totaled R$ 735,004 (R$ 1,260,463 at 03/31/2018) and are mainly represented by Tax losses and social contribution loss carryforwards of R$ 274,571 (R$ 670,460 at 03/31/2018), Provisions for Escrow Accounts of R$ 112,729 (R$ 117,072 03/31/2018), Administrative Provisions of R$ 29,338 (R$ 74,391 at 03/31/2018), Provisions for Legal, Tax and Social Security Risks of R$ 44,403 (R$ 43,668 at 03/31/2018), the realization of which is contingent upon the outcome of the respective lawsuits and Adjustment to Market Value of Trading Securities and Derivative Financial Instruments of R$ 57,808 (R$ 257,183 at 03/31/2018), and Goodwill on purchase of investments of R$ 177,846. Itaú Unibanco Holding S.A. – Complete Financial Statements – March 31, 2019 126

II - Provision for Deferred Income Tax and Social Contribution balance and the changes therein changes are shown as follows: Realization / 12/31/2018 Increase 03/31/2019 03/31/2018 Reversal Reflected in income 5,532,962 ( 3,094,448) 3,213,731 5,652,245 12,429,870 Depreciation in excess – leasing 345,754 ( 19,374) - 326,380 565,895 Restatement of escrow deposits for legal obligations and provision 1,348,337 - 8,900 1,357,237 1,314,307 Post-employment benefits 287,361 ( 10,542) 2,287 279,106 296,500 Adjustments to market value of trading securities and derivative financial 2,007,291 ( 2,007,291) 1,873,058 1,873,058 7,922,246 instruments Adjustments of operations carried out on the future settlement market 1,020,024 ( 1,020,024) 1,278,716 1,278,716 1,765,590 Taxation of results abroad – capital gains 1,330 (36) - 1,294 2,364 Other 522,865 (37,181) 50,770 536,454 562,968 Reflected in stockholders’ equity 336,833 (1,434) 159,281 494,680 380,780 Adjustments to market value of available-for-sale securities 330,028 ( 582) 159,237 488,683 362,970 Post-employment benefits 6,805 ( 852) 44 5,997 17,810 Total 5,869,795 ( 3,095,882) 3,373,012 6,146,925 12,810,650 At ITAÚ UNIBANCO HOLDING, the Provisions for Deferred Taxes and Contributions total R$ 146,875 (R$ 25,755 at 03/31/2018) and are basically comprised of Restatement of escrow deposits for legal obligations and contingent liabilities of R$ 3,826 (R$ 3,846 at 03/31/2018) and Adjustments to market value of trading securities and serivative financial instruments of R$ 120,961 (R$ 21,909 at 03/31/2018). Itaú Unibanco Holding S.A. – Complete Financial Statements – March 31, 2019 127 II - Provision for Deferred Income Tax and Social Contribution balance and the changes therein changes are shown as follows: Realization / 12/31/2018 Increase 03/31/2019 03/31/2018 Reversal Reflected in income 5,532,962 ( 3,094,448) 3,213,731 5,652,245 12,429,870 Depreciation in excess – leasing 345,754 ( 19,374) - 326,380 565,895 Restatement of escrow deposits for legal obligations and provision 1,348,337 - 8,900 1,357,237 1,314,307 Post-employment benefits 287,361 ( 10,542) 2,287 279,106 296,500 Adjustments to market value of trading securities and derivative financial 2,007,291 ( 2,007,291) 1,873,058 1,873,058 7,922,246 instruments Adjustments of operations carried out on the future settlement market 1,020,024 ( 1,020,024) 1,278,716 1,278,716 1,765,590 Taxation of results abroad – capital gains 1,330 (36) - 1,294 2,364 Other 522,865 (37,181) 50,770 536,454 562,968 Reflected in stockholders’ equity 336,833 (1,434) 159,281 494,680 380,780 Adjustments to market value of available-for-sale securities 330,028 ( 582) 159,237 488,683 362,970 Post-employment benefits 6,805 ( 852) 44 5,997 17,810 Total 5,869,795 ( 3,095,882) 3,373,012 6,146,925 12,810,650 At ITAÚ UNIBANCO HOLDING, the Provisions for Deferred Taxes and Contributions total R$ 146,875 (R$ 25,755 at 03/31/2018) and are basically comprised of Restatement of escrow deposits for legal obligations and contingent liabilities of R$ 3,826 (R$ 3,846 at 03/31/2018) and Adjustments to market value of trading securities and serivative financial instruments of R$ 120,961 (R$ 21,909 at 03/31/2018). Itaú Unibanco Holding S.A. – Complete Financial Statements – March 31, 2019 127
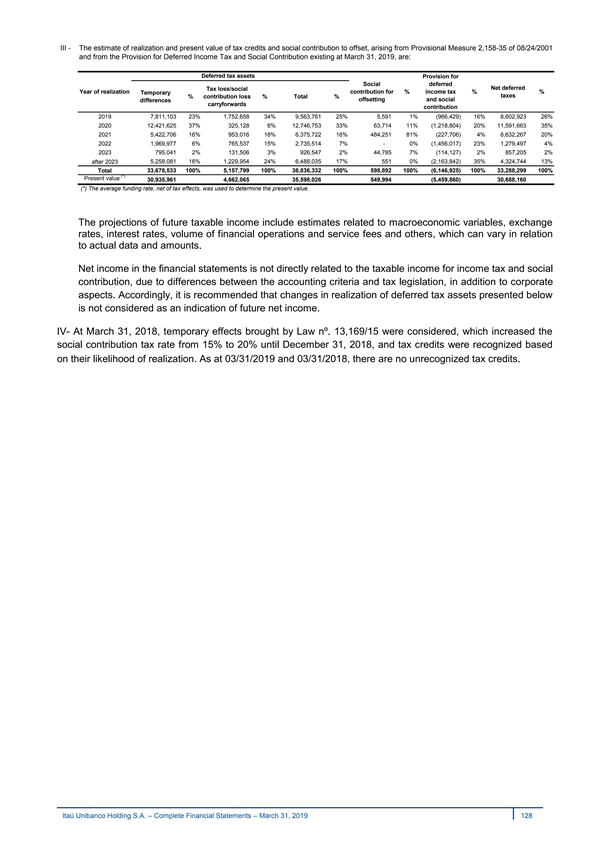
III - The estimate of realization and present value of tax credits and social contribution to offset, arising from Provisional Measure 2,158-35 of 08/24/2001 and from the Provision for Deferred Income Tax and Social Contribution existing at March 31, 2019, are: Deferred tax assets Provision for Social deferred Net deferred Tax loss/social Year of realization contribution for % income tax % % Temporary taxes % contribution loss % Total % offsetting and social differences carryforwards contribution 2019 7 ,811,103 23% 1 ,752,658 34% 9,563,761 25% 5,591 1% ( 966,429) 16% 8,602,923 26% 2020 12,421,625 37% 3 25,128 6% 12,746,753 33% 63,714 11% (1,218,804) 20% 11,591,663 35% 2021 5,422,706 16% 953,016 18% 6,375,722 16% 484,251 81% (227,706) 4% 6,632,267 20% 2022 1,969,977 6% 765,537 15% 2,735,514 7% - 0% ( 1,456,017) 23% 1,279,497 4% 2023 795,041 2% 131,506 3% 926,547 2% 4 4,785 7% (114,127) 2% 857,205 2% after 2023 5 ,258,081 16% 1 ,229,954 24% 6 ,488,035 17% 551 0% ( 2,163,842) 35% 4 ,324,744 13% Total 3 3,678,533 100% 5 ,157,799 100% 3 8,836,332 100% 598,892 100% ( 6,146,925) 100% 3 3,288,299 100% (*) Present value 3 0,935,961 4,662,065 35,598,026 549,994 (5,459,860) 3 0,688,160 (*) The average funding rate, net of tax effects, was used to determine the present value. The projections of future taxable income include estimates related to macroeconomic variables, exchange rates, interest rates, volume of financial operations and service fees and others, which can vary in relation to actual data and amounts. Net income in the financial statements is not directly related to the taxable income for income tax and social contribution, due to differences between the accounting criteria and tax legislation, in addition to corporate aspects. Accordingly, it is recommended that changes in realization of deferred tax assets presented below is not considered as an indication of future net income. IV- At March 31, 2018, temporary effects brought by Law nº. 13,169/15 were considered, which increased the social contribution tax rate from 15% to 20% until December 31, 2018, and tax credits were recognized based on their likelihood of realization. As at 03/31/2019 and 03/31/2018, there are no unrecognized tax credits. Itaú Unibanco Holding S.A. – Complete Financial Statements – March 31, 2019 128 III - The estimate of realization and present value of tax credits and social contribution to offset, arising from Provisional Measure 2,158-35 of 08/24/2001 and from the Provision for Deferred Income Tax and Social Contribution existing at March 31, 2019, are: Deferred tax assets Provision for Social deferred Net deferred Tax loss/social Year of realization contribution for % income tax % % Temporary taxes % contribution loss % Total % offsetting and social differences carryforwards contribution 2019 7 ,811,103 23% 1 ,752,658 34% 9,563,761 25% 5,591 1% ( 966,429) 16% 8,602,923 26% 2020 12,421,625 37% 3 25,128 6% 12,746,753 33% 63,714 11% (1,218,804) 20% 11,591,663 35% 2021 5,422,706 16% 953,016 18% 6,375,722 16% 484,251 81% (227,706) 4% 6,632,267 20% 2022 1,969,977 6% 765,537 15% 2,735,514 7% - 0% ( 1,456,017) 23% 1,279,497 4% 2023 795,041 2% 131,506 3% 926,547 2% 4 4,785 7% (114,127) 2% 857,205 2% after 2023 5 ,258,081 16% 1 ,229,954 24% 6 ,488,035 17% 551 0% ( 2,163,842) 35% 4 ,324,744 13% Total 3 3,678,533 100% 5 ,157,799 100% 3 8,836,332 100% 598,892 100% ( 6,146,925) 100% 3 3,288,299 100% (*) Present value 3 0,935,961 4,662,065 35,598,026 549,994 (5,459,860) 3 0,688,160 (*) The average funding rate, net of tax effects, was used to determine the present value. The projections of future taxable income include estimates related to macroeconomic variables, exchange rates, interest rates, volume of financial operations and service fees and others, which can vary in relation to actual data and amounts. Net income in the financial statements is not directly related to the taxable income for income tax and social contribution, due to differences between the accounting criteria and tax legislation, in addition to corporate aspects. Accordingly, it is recommended that changes in realization of deferred tax assets presented below is not considered as an indication of future net income. IV- At March 31, 2018, temporary effects brought by Law nº. 13,169/15 were considered, which increased the social contribution tax rate from 15% to 20% until December 31, 2018, and tax credits were recognized based on their likelihood of realization. As at 03/31/2019 and 03/31/2018, there are no unrecognized tax credits. Itaú Unibanco Holding S.A. – Complete Financial Statements – March 31, 2019 128
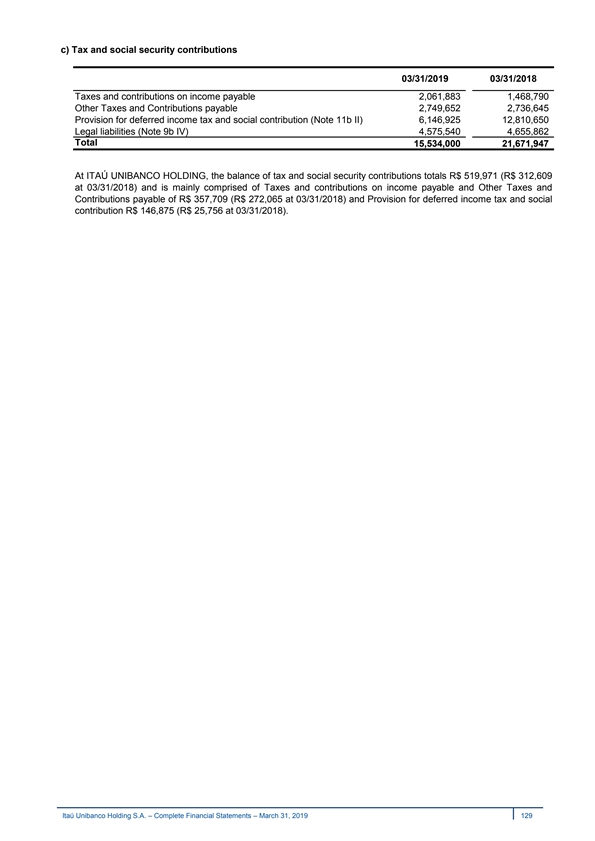
c) Tax and social security contributions 03/31/2019 03/31/2018 Taxes and contributions on income payable 2,061,883 1,468,790 Other Taxes and Contributions payable 2,749,652 2,736,645 Provision for deferred income tax and social contribution (Note 11b II) 6,146,925 12,810,650 Legal liabilities (Note 9b IV) 4,575,540 4,655,862 Total 15,534,000 21,671,947 At ITAÚ UNIBANCO HOLDING, the balance of tax and social security contributions totals R$ 519,971 (R$ 312,609 at 03/31/2018) and is mainly comprised of Taxes and contributions on income payable and Other Taxes and Contributions payable of R$ 357,709 (R$ 272,065 at 03/31/2018) and Provision for deferred income tax and social contribution R$ 146,875 (R$ 25,756 at 03/31/2018). Itaú Unibanco Holding S.A. – Complete Financial Statements – March 31, 2019 129 c) Tax and social security contributions 03/31/2019 03/31/2018 Taxes and contributions on income payable 2,061,883 1,468,790 Other Taxes and Contributions payable 2,749,652 2,736,645 Provision for deferred income tax and social contribution (Note 11b II) 6,146,925 12,810,650 Legal liabilities (Note 9b IV) 4,575,540 4,655,862 Total 15,534,000 21,671,947 At ITAÚ UNIBANCO HOLDING, the balance of tax and social security contributions totals R$ 519,971 (R$ 312,609 at 03/31/2018) and is mainly comprised of Taxes and contributions on income payable and Other Taxes and Contributions payable of R$ 357,709 (R$ 272,065 at 03/31/2018) and Provision for deferred income tax and social contribution R$ 146,875 (R$ 25,756 at 03/31/2018). Itaú Unibanco Holding S.A. – Complete Financial Statements – March 31, 2019 129
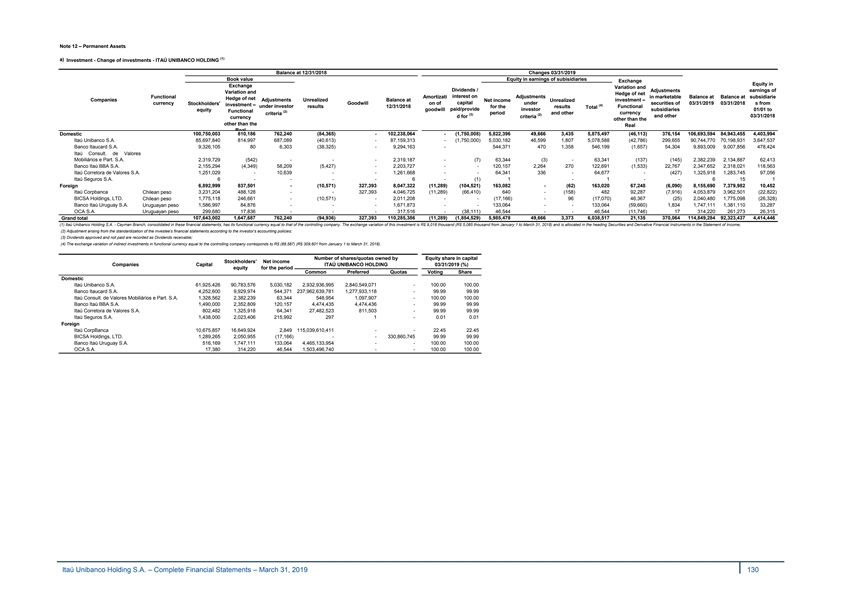
Note 12 – Permanent Assets (1) a) Investment - Change of investments - ITAÚ UNIBANCO HOLDING Balance at 12/31/2018 Changes 03/31/2019 Book value Equity in earnings of subisidiaries Exchange Equity in Exchange Variation and Dividends / Adjustments earnings of Variation and Hedge of net Functional Amortizati interest on Adjustments in marketable Balance at Balance at subsidiarie Hedge of net Companies Adjustments Unrealized Balance at investment – Net income Unrealized capital under currency Stockholders' Goodwill on of securities of 03/31/2019 03/31/2018 s from investment – (4) under investor results 12/31/2018 for the results Functional Total equity goodwill paid/provide investor subsidiaries 01/01 to (2) Functional period and other currency criteria (3) (2) and other 03/31/2018 d for criteria currency other than the other than the Real Real 100,750,003 810,186 762,240 (84,365) - 102,238,064 - (1,750,008) 5,822,396 49,666 3,435 5,875,497 ( 46,113) 376,154 106,693,594 84,943,455 4,403,994 Domestic Itaú Unibanco S.A. 85,697,840 814,997 687,089 ( 40,613) - 87,159,313 - ( 1,750,000) 5,030,182 46,599 1,807 5,078,588 (42,786) 299,655 90,744,770 70,198,931 3,647,537 Banco Itaucard S.A. 9,326,105 80 6,303 (38,325) - 9,294,163 - 544,371 470 1,358 546,199 (1,657) 54,304 9,893,009 9,007,856 478,424 Itaú Consult. de Valores Mobiliários e Part. S.A. 2,319,729 ( 542) - - - 2,319,187 - (7) 63,344 (3) - 63,341 ( 137) ( 145) 2,382,239 2,134,887 62,413 Banco Itaú BBA S.A. 2,155,294 (4,349) 58,209 ( 5,427) - 2,203,727 - - 120,157 2,264 270 122,691 ( 1,533) 22,767 2,347,652 2,318,021 118,563 Itaú Corretora de Valores S.A. 1,251,029 - 10,639 - - 1,261,668 - - 64,341 336 - 64,677 - (427) 1,325,918 1,283,745 97,056 Itaú Seguros S.A. 6 - - - - 6 - ( 1) 1 - 1 - - 6 15 1 Foreign 6,892,999 837,501 - (10,571) 327,393 8,047,322 ( 11,289) ( 104,521) 163,082 - ( 62) 163,020 67,248 ( 6,090) 8,155,690 7,379,982 10,452 Itaú Corpbanca Chilean peso 3,231,204 488,128 - - 327,393 4,046,725 ( 11,289) ( 66,410) 640 - (158) 482 92,287 ( 7,916) 4,053,879 3,962,501 ( 22,822) BICSA Holdings, LTD. Chilean peso 1,775,118 246,661 - ( 10,571) - 2,011,208 - - ( 17,166) - 96 (17,070) 46,367 (25) 2,040,480 1,775,098 (26,328) Banco Itaú Uruguay S.A. Uruguayan peso 1,586,997 84,876 - - - 1,671,873 - - 133,064 - - 133,064 ( 59,660) 1,834 1,747,111 1,381,110 33,287 OCA S.A. Uruguayan peso 299,680 17,836 - - - 317,516 - (38,111) 46,544 - - 46,544 ( 11,746) 17 314,220 261,273 26,315 107,643,002 1,647,687 762,240 (94,936) 327,393 110,285,386 (11,289) (1,854,529) 5,985,478 49,666 3,373 6,038,517 21,135 370,064 114,849,284 92,323,437 4,414,446 Grand total (1) Itaú Unibanco Holding S.A. - Cayman Branch, consolidated in these financial statements, has its functional currency equal to that of the controlling company. The exchange variation of this investment is R$ 9,018 thousand (R$ 5,085 thousand from January 1 to March 31, 2018) and is allocated in the heading Securities and Derivative Financial Instruments in the Statement of Income; (2) Adjustment arising from the standardization of the investee’s financial statements according to the investor’s accounting policies; (3) Dividends approved and not paid are recorded as Dividends receivable; (4) The exchange variation of indirect investments in functional currency equal to the controlling company corresponds to R$ (88,587) (R$ 309,601 from January 1 to March 31, 2018). Number of shares/quotas owned by Equity share in capital Stockholders’ Net income Companies Capital ITAÚ UNIBANCO HOLDING 03/31/2019 (%) equity for the period Common Preferred Quotas Voting Share Domestic Itaú Unibanco S.A. 61,925,426 90,783,576 5,030,182 2,932,936,995 2,840,549,071 - 100.00 100.00 Banco Itaucard S.A. 4,252,600 9,929,974 544,371 237,962,639,781 1,277,933,118 - 99.99 99.99 Itaú Consult. de Valores Mobiliários e Part. S.A. 1,328,562 2,382,239 63,344 548,954 1,097,907 - 100.00 100.00 Banco Itaú BBA S.A. 1,490,000 2,352,809 120,157 4,474,435 4,474,436 - 99.99 99.99 Itaú Corretora de Valores S.A. 802,482 1,325,918 64,341 27,482,523 811,503 - 99.99 99.99 Itaú Seguros S.A. 1,438,000 2,023,406 215,992 297 1 - 0.01 0.01 Foreign Itaú CorpBanca 10,675,857 16,649,924 2,849 115,039,610,411 - - 22.45 22.45 BICSA Holdings, LTD. 1,289,265 2,050,955 (17,166) - - 330,860,745 99.99 99.99 Banco Itaú Uruguay S.A. 516,169 1,747,111 133,064 4,465,133,954 - - 100.00 100.00 OCA S.A. 17,380 314,220 46,544 1,503,496,740 - - 100.00 100.00 Itaú Unibanco Holding S.A. – Complete Financial Statements – March 31, 2019 130 Note 12 – Permanent Assets (1) a) Investment - Change of investments - ITAÚ UNIBANCO HOLDING Balance at 12/31/2018 Changes 03/31/2019 Book value Equity in earnings of subisidiaries Exchange Equity in Exchange Variation and Dividends / Adjustments earnings of Variation and Hedge of net Functional Amortizati interest on Adjustments in marketable Balance at Balance at subsidiarie Hedge of net Companies Adjustments Unrealized Balance at investment – Net income Unrealized capital under currency Stockholders' Goodwill on of securities of 03/31/2019 03/31/2018 s from investment – (4) under investor results 12/31/2018 for the results Functional Total equity goodwill paid/provide investor subsidiaries 01/01 to (2) Functional period and other currency criteria (3) (2) and other 03/31/2018 d for criteria currency other than the other than the Real Real 100,750,003 810,186 762,240 (84,365) - 102,238,064 - (1,750,008) 5,822,396 49,666 3,435 5,875,497 ( 46,113) 376,154 106,693,594 84,943,455 4,403,994 Domestic Itaú Unibanco S.A. 85,697,840 814,997 687,089 ( 40,613) - 87,159,313 - ( 1,750,000) 5,030,182 46,599 1,807 5,078,588 (42,786) 299,655 90,744,770 70,198,931 3,647,537 Banco Itaucard S.A. 9,326,105 80 6,303 (38,325) - 9,294,163 - 544,371 470 1,358 546,199 (1,657) 54,304 9,893,009 9,007,856 478,424 Itaú Consult. de Valores Mobiliários e Part. S.A. 2,319,729 ( 542) - - - 2,319,187 - (7) 63,344 (3) - 63,341 ( 137) ( 145) 2,382,239 2,134,887 62,413 Banco Itaú BBA S.A. 2,155,294 (4,349) 58,209 ( 5,427) - 2,203,727 - - 120,157 2,264 270 122,691 ( 1,533) 22,767 2,347,652 2,318,021 118,563 Itaú Corretora de Valores S.A. 1,251,029 - 10,639 - - 1,261,668 - - 64,341 336 - 64,677 - (427) 1,325,918 1,283,745 97,056 Itaú Seguros S.A. 6 - - - - 6 - ( 1) 1 - 1 - - 6 15 1 Foreign 6,892,999 837,501 - (10,571) 327,393 8,047,322 ( 11,289) ( 104,521) 163,082 - ( 62) 163,020 67,248 ( 6,090) 8,155,690 7,379,982 10,452 Itaú Corpbanca Chilean peso 3,231,204 488,128 - - 327,393 4,046,725 ( 11,289) ( 66,410) 640 - (158) 482 92,287 ( 7,916) 4,053,879 3,962,501 ( 22,822) BICSA Holdings, LTD. Chilean peso 1,775,118 246,661 - ( 10,571) - 2,011,208 - - ( 17,166) - 96 (17,070) 46,367 (25) 2,040,480 1,775,098 (26,328) Banco Itaú Uruguay S.A. Uruguayan peso 1,586,997 84,876 - - - 1,671,873 - - 133,064 - - 133,064 ( 59,660) 1,834 1,747,111 1,381,110 33,287 OCA S.A. Uruguayan peso 299,680 17,836 - - - 317,516 - (38,111) 46,544 - - 46,544 ( 11,746) 17 314,220 261,273 26,315 107,643,002 1,647,687 762,240 (94,936) 327,393 110,285,386 (11,289) (1,854,529) 5,985,478 49,666 3,373 6,038,517 21,135 370,064 114,849,284 92,323,437 4,414,446 Grand total (1) Itaú Unibanco Holding S.A. - Cayman Branch, consolidated in these financial statements, has its functional currency equal to that of the controlling company. The exchange variation of this investment is R$ 9,018 thousand (R$ 5,085 thousand from January 1 to March 31, 2018) and is allocated in the heading Securities and Derivative Financial Instruments in the Statement of Income; (2) Adjustment arising from the standardization of the investee’s financial statements according to the investor’s accounting policies; (3) Dividends approved and not paid are recorded as Dividends receivable; (4) The exchange variation of indirect investments in functional currency equal to the controlling company corresponds to R$ (88,587) (R$ 309,601 from January 1 to March 31, 2018). Number of shares/quotas owned by Equity share in capital Stockholders’ Net income Companies Capital ITAÚ UNIBANCO HOLDING 03/31/2019 (%) equity for the period Common Preferred Quotas Voting Share Domestic Itaú Unibanco S.A. 61,925,426 90,783,576 5,030,182 2,932,936,995 2,840,549,071 - 100.00 100.00 Banco Itaucard S.A. 4,252,600 9,929,974 544,371 237,962,639,781 1,277,933,118 - 99.99 99.99 Itaú Consult. de Valores Mobiliários e Part. S.A. 1,328,562 2,382,239 63,344 548,954 1,097,907 - 100.00 100.00 Banco Itaú BBA S.A. 1,490,000 2,352,809 120,157 4,474,435 4,474,436 - 99.99 99.99 Itaú Corretora de Valores S.A. 802,482 1,325,918 64,341 27,482,523 811,503 - 99.99 99.99 Itaú Seguros S.A. 1,438,000 2,023,406 215,992 297 1 - 0.01 0.01 Foreign Itaú CorpBanca 10,675,857 16,649,924 2,849 115,039,610,411 - - 22.45 22.45 BICSA Holdings, LTD. 1,289,265 2,050,955 (17,166) - - 330,860,745 99.99 99.99 Banco Itaú Uruguay S.A. 516,169 1,747,111 133,064 4,465,133,954 - - 100.00 100.00 OCA S.A. 17,380 314,220 46,544 1,503,496,740 - - 100.00 100.00 Itaú Unibanco Holding S.A. – Complete Financial Statements – March 31, 2019 130
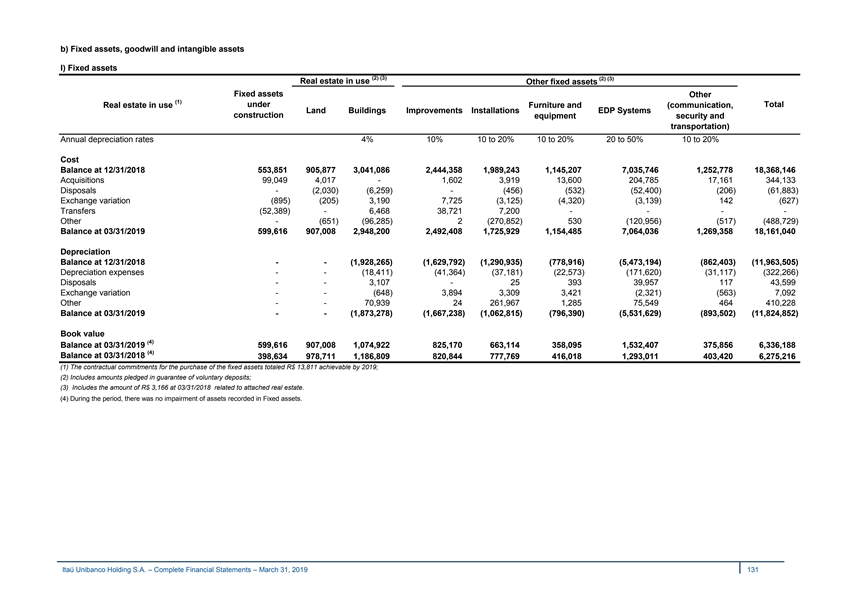
b) Fixed assets, goodwill and intangible assets I) Fixed assets (2) (3) (2) (3) Real estate in use Other fixed assets Fixed assets Other (1) under Total Real estate in use Furniture and (communication, Land Buildings Improvements Installations EDP Systems construction equipment security and transportation) Annual depreciation rates 4% 10% 10 to 20% 10 to 20% 20 to 50% 10 to 20% Cost Balance at 12/31/2018 553,851 905,877 3,041,086 2,444,358 1,989,243 1,145,207 7,035,746 1,252,778 18,368,146 Acquisitions 99,049 4,017 - 1,602 3,919 13,600 204,785 17,161 344,133 Disposals - (2,030) (6,259) - (456) (532) (52,400) (206) (61,883) Exchange variation (895) (205) 3,190 7,725 (3,125) (4,320) (3,139) 142 (627) Transfers (52,389) - 6,468 38,721 7,200 - - - - Other - (651) (96,285) 2 (270,852) 530 (120,956) (517) (488,729) Balance at 03/31/2019 599,616 907,008 2,948,200 2,492,408 1,725,929 1,154,485 7,064,036 1,269,358 18,161,040 Depreciation Balance at 12/31/2018 - - (1,928,265) (1,629,792) (1,290,935) (778,916) (5,473,194) (862,403) (11,963,505) Depreciation expenses - - (18,411) (41,364) (37,181) (22,573) (171,620) (31,117) (322,266) Disposals - - 3,107 - 25 393 39,957 117 43,599 Exchange variation - - (648) 3,894 3,309 3,421 (2,321) (563) 7,092 Other - - 70,939 24 261,967 1,285 75,549 464 410,228 Balance at 03/31/2019 - - (1,873,278) (1,667,238) (1,062,815) (796,390) (5,531,629) (893,502) (11,824,852) Book value (4) Balance at 03/31/2019 599,616 907,008 1,074,922 825,170 663,114 358,095 1,532,407 375,856 6,336,188 (4) Balance at 03/31/2018 398,634 978,711 1,186,809 820,844 777,769 416,018 1,293,011 403,420 6,275,216 (1) The contractual commitments for the purchase of the fixed assets totaled R$ 13,811 achievable by 2019; (2) Includes amounts pledged in guarantee of voluntary deposits; (3) Includes the amount of R$ 3,166 at 03/31/2018 related to attached real estate. (4) During the period, there was no impairment of assets recorded in Fixed assets. Itaú Unibanco Holding S.A. – Complete Financial Statements – March 31, 2019 131 b) Fixed assets, goodwill and intangible assets I) Fixed assets (2) (3) (2) (3) Real estate in use Other fixed assets Fixed assets Other (1) under Total Real estate in use Furniture and (communication, Land Buildings Improvements Installations EDP Systems construction equipment security and transportation) Annual depreciation rates 4% 10% 10 to 20% 10 to 20% 20 to 50% 10 to 20% Cost Balance at 12/31/2018 553,851 905,877 3,041,086 2,444,358 1,989,243 1,145,207 7,035,746 1,252,778 18,368,146 Acquisitions 99,049 4,017 - 1,602 3,919 13,600 204,785 17,161 344,133 Disposals - (2,030) (6,259) - (456) (532) (52,400) (206) (61,883) Exchange variation (895) (205) 3,190 7,725 (3,125) (4,320) (3,139) 142 (627) Transfers (52,389) - 6,468 38,721 7,200 - - - - Other - (651) (96,285) 2 (270,852) 530 (120,956) (517) (488,729) Balance at 03/31/2019 599,616 907,008 2,948,200 2,492,408 1,725,929 1,154,485 7,064,036 1,269,358 18,161,040 Depreciation Balance at 12/31/2018 - - (1,928,265) (1,629,792) (1,290,935) (778,916) (5,473,194) (862,403) (11,963,505) Depreciation expenses - - (18,411) (41,364) (37,181) (22,573) (171,620) (31,117) (322,266) Disposals - - 3,107 - 25 393 39,957 117 43,599 Exchange variation - - (648) 3,894 3,309 3,421 (2,321) (563) 7,092 Other - - 70,939 24 261,967 1,285 75,549 464 410,228 Balance at 03/31/2019 - - (1,873,278) (1,667,238) (1,062,815) (796,390) (5,531,629) (893,502) (11,824,852) Book value (4) Balance at 03/31/2019 599,616 907,008 1,074,922 825,170 663,114 358,095 1,532,407 375,856 6,336,188 (4) Balance at 03/31/2018 398,634 978,711 1,186,809 820,844 777,769 416,018 1,293,011 403,420 6,275,216 (1) The contractual commitments for the purchase of the fixed assets totaled R$ 13,811 achievable by 2019; (2) Includes amounts pledged in guarantee of voluntary deposits; (3) Includes the amount of R$ 3,166 at 03/31/2018 related to attached real estate. (4) During the period, there was no impairment of assets recorded in Fixed assets. Itaú Unibanco Holding S.A. – Complete Financial Statements – March 31, 2019 131

II) Goodwill and Intangible assets (1) Intangible assets Goodwill and Association for the intagible from Total Other intangible promotion and offer Internally developed Software Acquired (2) acquisition of financial products software assets and services Annual amortization rates Up to 20% 8% 20% 20% 10% to 20% Cost Balance at 12/31/2018 11,207,941 2,498,530 5,051,918 4,528,509 2,306,861 25,593,759 Acquisitions - 1,500 239,723 189,484 175,418 606,125 Disposals (28,904) ( 3,893) (55,025) - (24,551) (112,373) Exchange variation 172,063 26,322 45,724 - 10,398 254,507 Other (21,482) 10,704 74,933 - (12,871) 51,284 Balance at 03/31/2019 11,329,618 2,533,163 5,357,273 4,717,993 2,455,255 26,393,302 Amortization Balance at 12/31/2018 (3,904,790) ( 842,708) (2,426,963) (1,822,651) (1,004,531) (10,001,643) (3) Amortization expenses (320,730) ( 54,262) (159,362) (168,672) (73,919) (776,945) Disposals 28,904 3,893 - - 24,551 57,348 Exchange variation (50,054) ( 14,880) (17,772) - (4,511) (87,217) Other 22,985 3,016 (37,373) - (250) (11,622) Balance at 03/31/2019 (4,223,685) ( 904,941) (2,641,470) (1,991,323) (1,058,660) (10,820,079) Impairment (Note 10i) Balance at 12/31/2018 - - (225,751) (342,835) - (568,586) Disposals - - 55,025 - - 55,025 Exchange variation - - (21) - - (21) Balance at 03/31/2019 - - (170,747) (342,835) - (513,582) Book value Balance at 03/31/2019 7,105,933 1,628,222 2,545,056 2,383,835 1,396,595 15,059,641 Balance at 03/31/2018 8,135,217 1,814,290 2,274,884 2,670,365 1,175,613 16,070,369 (1) The contractual commitments for the purchase of the new intangible assets totaled R$ 545,709 achievable by 2020; (2) Includes of amounts paid for acquisition of rights to provide services of payment of salaries, proceeds, retirement and pension benefits and similar benefits; (3) Amortization expenses related to the rights for acquisition of payrolls and associations, in the amount of R$ (120,964) (R$ (107,456) from 01/01 to 03/31/2018) are disclosed in the expenses on financial operation. Itaú Unibanco Holding S.A. – Complete Financial Statements – March 31, 2019 132 II) Goodwill and Intangible assets (1) Intangible assets Goodwill and Association for the intagible from Total Other intangible promotion and offer Internally developed Software Acquired (2) acquisition of financial products software assets and services Annual amortization rates Up to 20% 8% 20% 20% 10% to 20% Cost Balance at 12/31/2018 11,207,941 2,498,530 5,051,918 4,528,509 2,306,861 25,593,759 Acquisitions - 1,500 239,723 189,484 175,418 606,125 Disposals (28,904) ( 3,893) (55,025) - (24,551) (112,373) Exchange variation 172,063 26,322 45,724 - 10,398 254,507 Other (21,482) 10,704 74,933 - (12,871) 51,284 Balance at 03/31/2019 11,329,618 2,533,163 5,357,273 4,717,993 2,455,255 26,393,302 Amortization Balance at 12/31/2018 (3,904,790) ( 842,708) (2,426,963) (1,822,651) (1,004,531) (10,001,643) (3) Amortization expenses (320,730) ( 54,262) (159,362) (168,672) (73,919) (776,945) Disposals 28,904 3,893 - - 24,551 57,348 Exchange variation (50,054) ( 14,880) (17,772) - (4,511) (87,217) Other 22,985 3,016 (37,373) - (250) (11,622) Balance at 03/31/2019 (4,223,685) ( 904,941) (2,641,470) (1,991,323) (1,058,660) (10,820,079) Impairment (Note 10i) Balance at 12/31/2018 - - (225,751) (342,835) - (568,586) Disposals - - 55,025 - - 55,025 Exchange variation - - (21) - - (21) Balance at 03/31/2019 - - (170,747) (342,835) - (513,582) Book value Balance at 03/31/2019 7,105,933 1,628,222 2,545,056 2,383,835 1,396,595 15,059,641 Balance at 03/31/2018 8,135,217 1,814,290 2,274,884 2,670,365 1,175,613 16,070,369 (1) The contractual commitments for the purchase of the new intangible assets totaled R$ 545,709 achievable by 2020; (2) Includes of amounts paid for acquisition of rights to provide services of payment of salaries, proceeds, retirement and pension benefits and similar benefits; (3) Amortization expenses related to the rights for acquisition of payrolls and associations, in the amount of R$ (120,964) (R$ (107,456) from 01/01 to 03/31/2018) are disclosed in the expenses on financial operation. Itaú Unibanco Holding S.A. – Complete Financial Statements – March 31, 2019 132
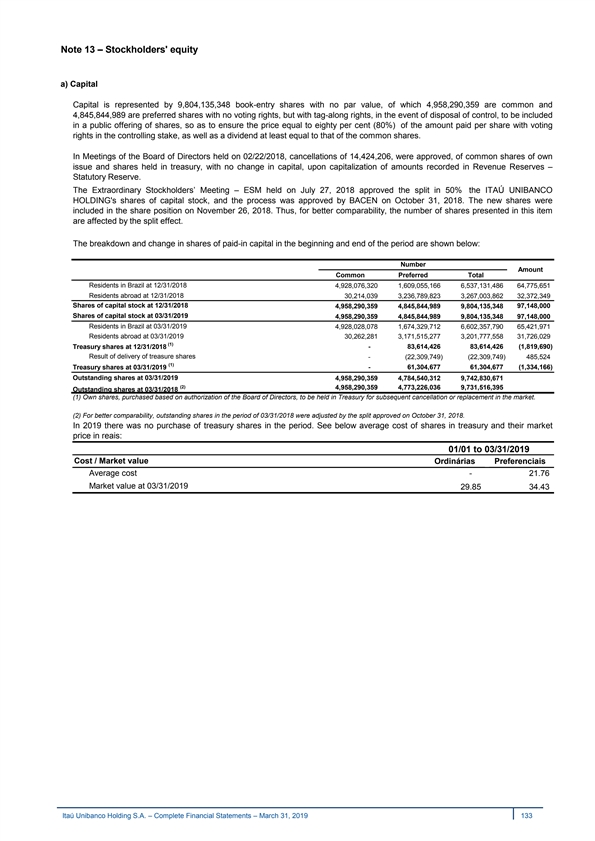
Note 13 – Stockholders' equity a) Capital Capital is represented by 9,804,135,348 book-entry shares with no par value, of which 4,958,290,359 are common and 4,845,844,989 are preferred shares with no voting rights, but with tag-along rights, in the event of disposal of control, to be included in a public offering of shares, so as to ensure the price equal to eighty per cent (80%) of the amount paid per share with voting rights in the controlling stake, as well as a dividend at least equal to that of the common shares. In Meetings of the Board of Directors held on 02/22/2018, cancellations of 14,424,206, were approved, of common shares of own issue and shares held in treasury, with no change in capital, upon capitalization of amounts recorded in Revenue Reserves – Statutory Reserve. The Extraordinary Stockholders’ Meeting – ESM held on July 27, 2018 approved the split in 50% the ITAÚ UNIBANCO HOLDING's shares of capital stock, and the process was approved by BACEN on October 31, 2018. The new shares were included in the share position on November 26, 2018. Thus, for better comparability, the number of shares presented in this item are affected by the split effect. The breakdown and change in shares of paid-in capital in the beginning and end of the period are shown below: Number Amount Common Preferred Total Residents in Brazil at 12/31/2018 4 ,928,076,320 1 ,609,055,166 6 ,537,131,486 6 4,775,651 Residents abroad at 12/31/2018 3 0,214,039 3 ,236,789,823 3 ,267,003,862 32,372,349 Shares of capital stock at 12/31/2018 4,958,290,359 4 ,845,844,989 9,804,135,348 9 7,148,000 Shares of capital stock at 03/31/2019 4,958,290,359 4,845,844,989 9,804,135,348 97,148,000 Residents in Brazil at 03/31/2019 4,928,028,078 1 ,674,329,712 6,602,357,790 6 5,421,971 Residents abroad at 03/31/2019 30,262,281 3,171,515,277 3,201,777,558 31,726,029 (1) - 8 3,614,426 83,614,426 ( 1,819,690) Treasury shares at 12/31/2018 Result of delivery of treasure shares - (22,309,749) (22,309,749) 485,524 (1) Treasury shares at 03/31/2019 - 61,304,677 6 1,304,677 ( 1,334,166) Outstanding shares at 03/31/2019 4 ,958,290,359 4,784,540,312 9 ,742,830,671 (2) 4 ,958,290,359 4 ,773,226,036 9,731,516,395 Outstanding shares at 03/31/2018 (1) Own shares, purchased based on authorization of the Board of Directors, to be held in Treasury for subsequent cancellation or replacement in the market. (2) For better comparability, outstanding shares in the period of 03/31/2018 were adjusted by the split approved on October 31, 2018. In 2019 there was no purchase of treasury shares in the period. See below average cost of shares in treasury and their market price in reais: 01/01 to 03/31/2019 Cost / Market value Ordinárias Preferenciais Average cost - 21 .76 Market value at 03/31/2019 29.85 34 .43 Itaú Unibanco Holding S.A. – Complete Financial Statements – March 31, 2019 133 Note 13 – Stockholders' equity a) Capital Capital is represented by 9,804,135,348 book-entry shares with no par value, of which 4,958,290,359 are common and 4,845,844,989 are preferred shares with no voting rights, but with tag-along rights, in the event of disposal of control, to be included in a public offering of shares, so as to ensure the price equal to eighty per cent (80%) of the amount paid per share with voting rights in the controlling stake, as well as a dividend at least equal to that of the common shares. In Meetings of the Board of Directors held on 02/22/2018, cancellations of 14,424,206, were approved, of common shares of own issue and shares held in treasury, with no change in capital, upon capitalization of amounts recorded in Revenue Reserves – Statutory Reserve. The Extraordinary Stockholders’ Meeting – ESM held on July 27, 2018 approved the split in 50% the ITAÚ UNIBANCO HOLDING's shares of capital stock, and the process was approved by BACEN on October 31, 2018. The new shares were included in the share position on November 26, 2018. Thus, for better comparability, the number of shares presented in this item are affected by the split effect. The breakdown and change in shares of paid-in capital in the beginning and end of the period are shown below: Number Amount Common Preferred Total Residents in Brazil at 12/31/2018 4 ,928,076,320 1 ,609,055,166 6 ,537,131,486 6 4,775,651 Residents abroad at 12/31/2018 3 0,214,039 3 ,236,789,823 3 ,267,003,862 32,372,349 Shares of capital stock at 12/31/2018 4,958,290,359 4 ,845,844,989 9,804,135,348 9 7,148,000 Shares of capital stock at 03/31/2019 4,958,290,359 4,845,844,989 9,804,135,348 97,148,000 Residents in Brazil at 03/31/2019 4,928,028,078 1 ,674,329,712 6,602,357,790 6 5,421,971 Residents abroad at 03/31/2019 30,262,281 3,171,515,277 3,201,777,558 31,726,029 (1) - 8 3,614,426 83,614,426 ( 1,819,690) Treasury shares at 12/31/2018 Result of delivery of treasure shares - (22,309,749) (22,309,749) 485,524 (1) Treasury shares at 03/31/2019 - 61,304,677 6 1,304,677 ( 1,334,166) Outstanding shares at 03/31/2019 4 ,958,290,359 4,784,540,312 9 ,742,830,671 (2) 4 ,958,290,359 4 ,773,226,036 9,731,516,395 Outstanding shares at 03/31/2018 (1) Own shares, purchased based on authorization of the Board of Directors, to be held in Treasury for subsequent cancellation or replacement in the market. (2) For better comparability, outstanding shares in the period of 03/31/2018 were adjusted by the split approved on October 31, 2018. In 2019 there was no purchase of treasury shares in the period. See below average cost of shares in treasury and their market price in reais: 01/01 to 03/31/2019 Cost / Market value Ordinárias Preferenciais Average cost - 21 .76 Market value at 03/31/2019 29.85 34 ..43 Itaú Unibanco Holding S.A. – Complete Financial Statements – March 31, 2019 133

b) Dividends Shareholders are entitled mandatory minimum dividends in each fiscal year, corresponding to 25% of adjusted net income, as set forth in the Bylaws. Common and preferred shares participate equally of income distributed, after common shares have received dividends equal to the annual minimum priority dividend to be paid to preferred shares (R$ 0.022 non-cumulative per share). The calculation of the monthly advance of mandatory minimum dividend is based on the share position on the last day of the prior month, taking into consideration that the payment is made on the first business day of the subsequent month, amounting to R$ 0.015 per share. I - Calculation of dividends and interest on capital 03/31/2019 Statutory net income 6 ,500,322 Adjustments: (-) Legal reserve - 5% (325,016) Dividend calculation basis 6,175,306 Mandatory dividend - 25% 1,543,827 Dividends and Interest on Capital Paid/ Provided for/ Identified 2 ,406,803 II – Stockholders' compensation Gross value per Gross WTS Net share (R$) Paid / Prepaid - Dividends - 2 monthly installments paid in February to March 2019 0.0150 291,622 - 291,622 Provided for (recorded in Other liabilities – Social and statutory) 1,252,205 - 1,252,205 Dividends - 1 monthly installment paid on 04/01/2019 0.0150 145,828 - 145,828 Dividends declared 0.1136 1,106,377 - 1,106,377 Identified in Revenue Reserve In Stockholders’ Equity 0.0886 862,976 - 862,976 Total from 01/01 to 03/31/2019 2,406,803 - 2 ,406,803 Total from 01/01 to 03/31/2018 2,349,835 (103,015) 2,246,820 Itaú Unibanco Holding S.A. – Complete Financial Statements – March 31, 2019 134 b) Dividends Shareholders are entitled mandatory minimum dividends in each fiscal year, corresponding to 25% of adjusted net income, as set forth in the Bylaws. Common and preferred shares participate equally of income distributed, after common shares have received dividends equal to the annual minimum priority dividend to be paid to preferred shares (R$ 0.022 non-cumulative per share). The calculation of the monthly advance of mandatory minimum dividend is based on the share position on the last day of the prior month, taking into consideration that the payment is made on the first business day of the subsequent month, amounting to R$ 0.015 per share. I - Calculation of dividends and interest on capital 03/31/2019 Statutory net income 6 ,500,322 Adjustments: (-) Legal reserve - 5% (325,016) Dividend calculation basis 6,175,306 Mandatory dividend - 25% 1,543,827 Dividends and Interest on Capital Paid/ Provided for/ Identified 2 ,406,803 II – Stockholders' compensation Gross value per Gross WTS Net share (R$) Paid / Prepaid - Dividends - 2 monthly installments paid in February to March 2019 0.0150 291,622 - 291,622 Provided for (recorded in Other liabilities – Social and statutory) 1,252,205 - 1,252,205 Dividends - 1 monthly installment paid on 04/01/2019 0.0150 145,828 - 145,828 Dividends declared 0.1136 1,106,377 - 1,106,377 Identified in Revenue Reserve In Stockholders’ Equity 0.0886 862,976 - 862,976 Total from 01/01 to 03/31/2019 2,406,803 - 2 ,406,803 Total from 01/01 to 03/31/2018 2,349,835 (103,015) 2,246,820 Itaú Unibanco Holding S.A. – Complete Financial Statements – March 31, 2019 134
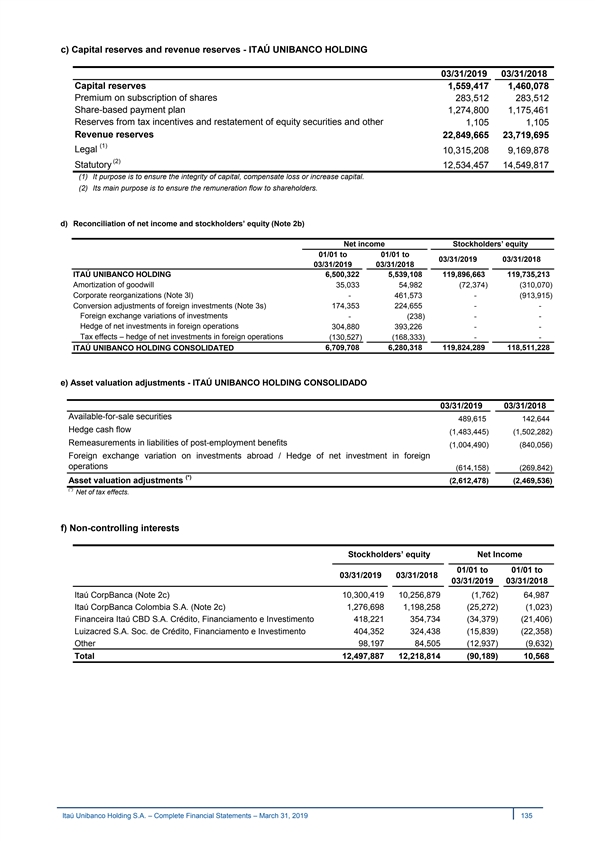
c) Capital reserves and revenue reserves - ITAÚ UNIBANCO HOLDING 03/31/2019 03/31/2018 Capital reserves 1,559,417 1,460,078 Premium on subscription of shares 283,512 283,512 Share-based payment plan 1,274,800 1,175,461 Reserves from tax incentives and restatement of equity securities and other 1,105 1,105 Revenue reserves 22,849,665 23,719,695 (1) Legal 10,315,208 9,169,878 (2) Statutory 12,534,457 14,549,817 (1) It purpose is to ensure the integrity of capital, compensate loss or increase capital. (2) Its main purpose is to ensure the remuneration flow to shareholders. d) Reconciliation of net income and stockholders’ equity (Note 2b) Net income Stockholders’ equity 01/01 to 01/01 to 03/31/2019 03/31/2018 03/31/2019 03/31/2018 ITAÚ UNIBANCO HOLDING 6 ,500,322 5,539,108 1 19,896,663 119,735,213 Amortization of goodwill 3 5,033 5 4,982 (7 2,374) (310,070) Corporate reorganizations (Note 3l) - 4 61,573 - (913,915) Conversion adjustments of foreign investments (Note 3s) 1 74,353 2 24,655 - - Foreign exchange variations of investments - (2 38) - - Hedge of net investments in foreign operations 3 04,880 393,226 - - Tax effects – hedge of net investments in foreign operations (130,527) (1 68,333) - - ITAÚ UNIBANCO HOLDING CONSOLIDATED 6,709,708 6,280,318 119,824,289 1 18,511,228 e) Asset valuation adjustments - ITAÚ UNIBANCO HOLDING CONSOLIDADO 03/31/2019 03/31/2018 Available-for-sale securities 489,615 142,644 Hedge cash flow (1 ,483,445) (1,502,282) Remeasurements in liabilities of post-employment benefits (1 ,004,490) (8 40,056) Foreign exchange variation on investments abroad / Hedge of net investment in foreign operations (614,158) (2 69,842) (*) Asset valuation adjustments (2 ,612,478) (2,469,536) (*) Net of tax effects. f) Non-controlling interests Stockholders’ equity Net Income 01/01 to 01/01 to 03/31/2019 03/31/2018 03/31/2019 03/31/2018 Itaú CorpBanca (Note 2c) 10,300,419 10,256,879 (1,762) 64,987 Itaú CorpBanca Colombia S.A. (Note 2c) 1,276,698 1,198,258 (25,272) (1,023) Financeira Itaú CBD S.A. Crédito, Financiamento e Investimento 418,221 354,734 (34,379) (21,406) Luizacred S.A. Soc. de Crédito, Financiamento e Investimento 404,352 324,438 (15,839) (22,358) Other 98,197 84,505 (12,937) (9,632) Total 12,497,887 12,218,814 (90,189) 10,568 Itaú Unibanco Holding S.A. – Complete Financial Statements – March 31, 2019 135 c) Capital reserves and revenue reserves - ITAÚ UNIBANCO HOLDING 03/31/2019 03/31/2018 Capital reserves 1,559,417 1,460,078 Premium on subscription of shares 283,512 283,512 Share-based payment plan 1,274,800 1,175,461 Reserves from tax incentives and restatement of equity securities and other 1,105 1,105 Revenue reserves 22,849,665 23,719,695 (1) Legal 10,315,208 9,169,878 (2) Statutory 12,534,457 14,549,817 (1) It purpose is to ensure the integrity of capital, compensate loss or increase capital. (2) Its main purpose is to ensure the remuneration flow to shareholders. d) Reconciliation of net income and stockholders’ equity (Note 2b) Net income Stockholders’ equity 01/01 to 01/01 to 03/31/2019 03/31/2018 03/31/2019 03/31/2018 ITAÚ UNIBANCO HOLDING 6 ,500,322 5,539,108 1 19,896,663 119,735,213 Amortization of goodwill 3 5,033 5 4,982 (7 2,374) (310,070) Corporate reorganizations (Note 3l) - 4 61,573 - (913,915) Conversion adjustments of foreign investments (Note 3s) 1 74,353 2 24,655 - - Foreign exchange variations of investments - (2 38) - - Hedge of net investments in foreign operations 3 04,880 393,226 - - Tax effects – hedge of net investments in foreign operations (130,527) (1 68,333) - - ITAÚ UNIBANCO HOLDING CONSOLIDATED 6,709,708 6,280,318 119,824,289 1 18,511,228 e) Asset valuation adjustments - ITAÚ UNIBANCO HOLDING CONSOLIDADO 03/31/2019 03/31/2018 Available-for-sale securities 489,615 142,644 Hedge cash flow (1 ,483,445) (1,502,282) Remeasurements in liabilities of post-employment benefits (1 ,004,490) (8 40,056) Foreign exchange variation on investments abroad / Hedge of net investment in foreign operations (614,158) (2 69,842) (*) Asset valuation adjustments (2 ,612,478) (2,469,536) (*) Net of tax effects. f) Non-controlling interests Stockholders’ equity Net Income 01/01 to 01/01 to 03/31/2019 03/31/2018 03/31/2019 03/31/2018 Itaú CorpBanca (Note 2c) 10,300,419 10,256,879 (1,762) 64,987 Itaú CorpBanca Colombia S.A. (Note 2c) 1,276,698 1,198,258 (25,272) (1,023) Financeira Itaú CBD S.A. Crédito, Financiamento e Investimento 418,221 354,734 (34,379) (21,406) Luizacred S.A. Soc. de Crédito, Financiamento e Investimento 404,352 324,438 (15,839) (22,358) Other 98,197 84,505 (12,937) (9,632) Total 12,497,887 12,218,814 (90,189) 10,568 Itaú Unibanco Holding S.A. – Complete Financial Statements – March 31, 2019 135
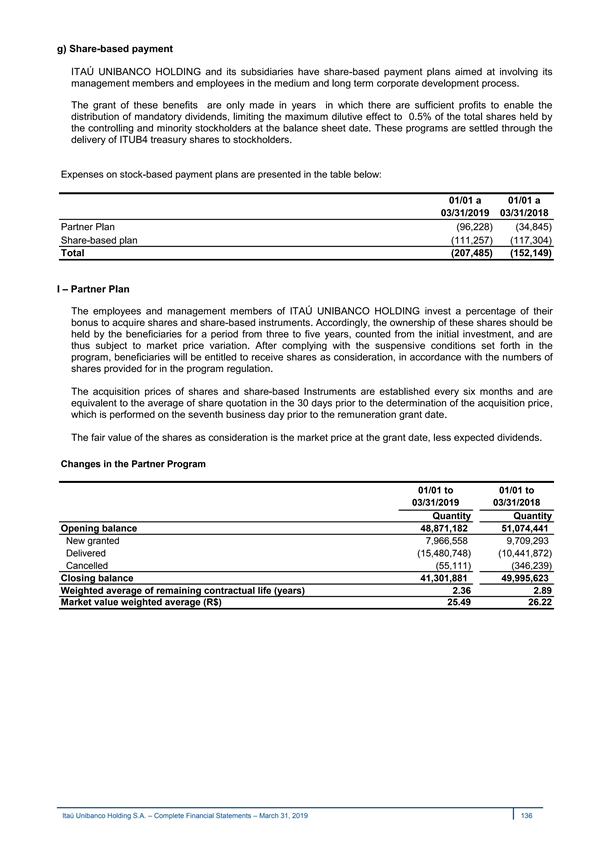
g) Share-based payment ITAÚ UNIBANCO HOLDING and its subsidiaries have share-based payment plans aimed at involving its management members and employees in the medium and long term corporate development process. The grant of these benefits are only made in years in which there are sufficient profits to enable the distribution of mandatory dividends, limiting the maximum dilutive effect to 0.5% of the total shares held by the controlling and minority stockholders at the balance sheet date. These programs are settled through the delivery of ITUB4 treasury shares to stockholders. Expenses on stock-based payment plans are presented in the table below: 01/01 a 01/01 a 03/31/2019 03/31/2018 Partner Plan (96,228) (34,845) Share-based plan (111,257) (117,304) Total (207,485) (152,149) l – Partner Plan The employees and management members of ITAÚ UNIBANCO HOLDING invest a percentage of their bonus to acquire shares and share-based instruments. Accordingly, the ownership of these shares should be held by the beneficiaries for a period from three to five years, counted from the initial investment, and are thus subject to market price variation. After complying with the suspensive conditions set forth in the program, beneficiaries will be entitled to receive shares as consideration, in accordance with the numbers of shares provided for in the program regulation. The acquisition prices of shares and share-based Instruments are established every six months and are equivalent to the average of share quotation in the 30 days prior to the determination of the acquisition price, which is performed on the seventh business day prior to the remuneration grant date. The fair value of the shares as consideration is the market price at the grant date, less expected dividends. Changes in the Partner Program 01/01 to 01/01 to 03/31/2019 03/31/2018 Quantity Quantity Opening balance 48,871,182 51,074,441 New granted 7,966,558 9,709,293 Delivered (15,480,748) (10,441,872) Cancelled (55,111) (346,239) Closing balance 41,301,881 49,995,623 Weighted average of remaining contractual life (years) 2.36 2.89 Market value weighted average (R$) 25.49 26.22 Itaú Unibanco Holding S.A. – Complete Financial Statements – March 31, 2019 136 g) Share-based payment ITAÚ UNIBANCO HOLDING and its subsidiaries have share-based payment plans aimed at involving its management members and employees in the medium and long term corporate development process. The grant of these benefits are only made in years in which there are sufficient profits to enable the distribution of mandatory dividends, limiting the maximum dilutive effect to 0.5% of the total shares held by the controlling and minority stockholders at the balance sheet date. These programs are settled through the delivery of ITUB4 treasury shares to stockholders. Expenses on stock-based payment plans are presented in the table below: 01/01 a 01/01 a 03/31/2019 03/31/2018 Partner Plan (96,228) (34,845) Share-based plan (111,257) (117,304) Total (207,485) (152,149) l – Partner Plan The employees and management members of ITAÚ UNIBANCO HOLDING invest a percentage of their bonus to acquire shares and share-based instruments. Accordingly, the ownership of these shares should be held by the beneficiaries for a period from three to five years, counted from the initial investment, and are thus subject to market price variation. After complying with the suspensive conditions set forth in the program, beneficiaries will be entitled to receive shares as consideration, in accordance with the numbers of shares provided for in the program regulation. The acquisition prices of shares and share-based Instruments are established every six months and are equivalent to the average of share quotation in the 30 days prior to the determination of the acquisition price, which is performed on the seventh business day prior to the remuneration grant date. The fair value of the shares as consideration is the market price at the grant date, less expected dividends. Changes in the Partner Program 01/01 to 01/01 to 03/31/2019 03/31/2018 Quantity Quantity Opening balance 48,871,182 51,074,441 New granted 7,966,558 9,709,293 Delivered (15,480,748) (10,441,872) Cancelled (55,111) (346,239) Closing balance 41,301,881 49,995,623 Weighted average of remaining contractual life (years) 2.36 2.89 Market value weighted average (R$) 25.49 26.22 Itaú Unibanco Holding S.A. – Complete Financial Statements – March 31, 2019 136
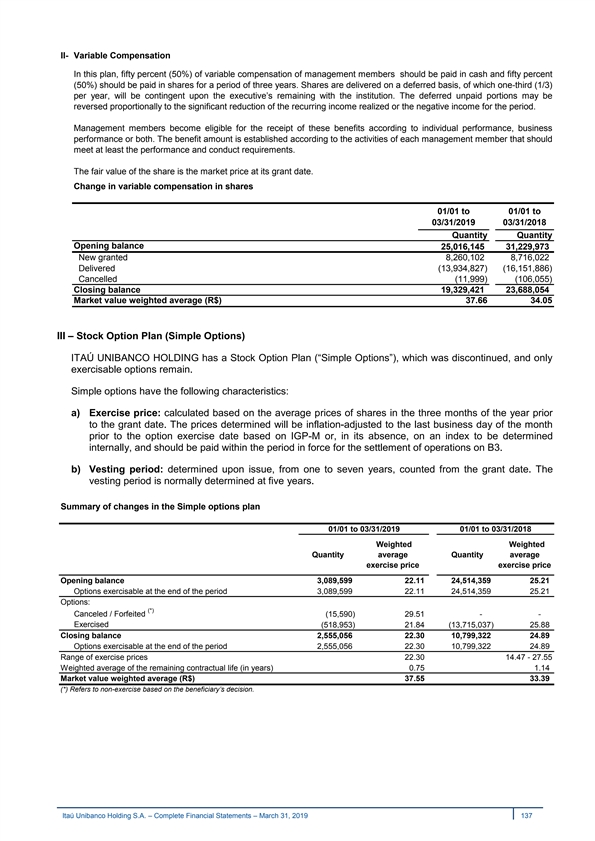
II- Variable Compensation In this plan, fifty percent (50%) of variable compensation of management members should be paid in cash and fifty percent (50%) should be paid in shares for a period of three years. Shares are delivered on a deferred basis, of which one-third (1/3) per year, will be contingent upon the executive’s remaining with the institution. The deferred unpaid portions may be reversed proportionally to the significant reduction of the recurring income realized or the negative income for the period. Management members become eligible for the receipt of these benefits according to individual performance, business performance or both. The benefit amount is established according to the activities of each management member that should meet at least the performance and conduct requirements. The fair value of the share is the market price at its grant date. Change in variable compensation in shares 01/01 to 01/01 to 03/31/2019 03/31/2018 Quantity Quantity Opening balance 25,016,145 31,229,973 New granted 8,260,102 8,716,022 Delivered (13,934,827) (16,151,886) Cancelled (11,999) (106,055) Closing balance 19,329,421 23,688,054 Market value weighted average (R$) 37.66 34.05 Ill – Stock Option Plan (Simple Options) ITAÚ UNIBANCO HOLDING has a Stock Option Plan (“Simple Options”), which was discontinued, and only exercisable options remain. Simple options have the following characteristics: a) Exercise price: calculated based on the average prices of shares in the three months of the year prior to the grant date. The prices determined will be inflation-adjusted to the last business day of the month prior to the option exercise date based on IGP-M or, in its absence, on an index to be determined internally, and should be paid within the period in force for the settlement of operations on B3. b) Vesting period: determined upon issue, from one to seven years, counted from the grant date. The vesting period is normally determined at five years. Summary of changes in the Simple options plan 01/01 to 03/31/2019 01/01 to 03/31/2018 Weighted Weighted Quantity average Quantity average exercise price exercise price Opening balance 3,089,599 22.11 24,514,359 25.21 Options exercisable at the end of the period 3,089,599 22.11 24,514,359 25.21 Options: (*) Canceled / Forfeited (15,590) 29.51 - - Exercised (5 18,953) 21.84 (13,715,037) 25.88 Closing balance 2,555,056 22.30 10,799,322 24.89 Options exercisable at the end of the period 2,555,056 22.30 10,799,322 24.89 Range of exercise prices 22.30 14.47 - 27.55 Weighted average of the remaining contractual life (in years) 0 .75 1 .14 Market value weighted average (R$) 37.55 33.39 (*) Refers to non-exercise based on the beneficiary’s decision. Itaú Unibanco Holding S.A. – Complete Financial Statements – March 31, 2019 137 II- Variable Compensation In this plan, fifty percent (50%) of variable compensation of management members should be paid in cash and fifty percent (50%) should be paid in shares for a period of three years. Shares are delivered on a deferred basis, of which one-third (1/3) per year, will be contingent upon the executive’s remaining with the institution. The deferred unpaid portions may be reversed proportionally to the significant reduction of the recurring income realized or the negative income for the period. Management members become eligible for the receipt of these benefits according to individual performance, business performance or both. The benefit amount is established according to the activities of each management member that should meet at least the performance and conduct requirements. The fair value of the share is the market price at its grant date. Change in variable compensation in shares 01/01 to 01/01 to 03/31/2019 03/31/2018 Quantity Quantity Opening balance 25,016,145 31,229,973 New granted 8,260,102 8,716,022 Delivered (13,934,827) (16,151,886) Cancelled (11,999) (106,055) Closing balance 19,329,421 23,688,054 Market value weighted average (R$) 37.66 34.05 Ill – Stock Option Plan (Simple Options) ITAÚ UNIBANCO HOLDING has a Stock Option Plan (“Simple Options”), which was discontinued, and only exercisable options remain. Simple options have the following characteristics: a) Exercise price: calculated based on the average prices of shares in the three months of the year prior to the grant date. The prices determined will be inflation-adjusted to the last business day of the month prior to the option exercise date based on IGP-M or, in its absence, on an index to be determined internally, and should be paid within the period in force for the settlement of operations on B3. b) Vesting period: determined upon issue, from one to seven years, counted from the grant date. The vesting period is normally determined at five years. Summary of changes in the Simple options plan 01/01 to 03/31/2019 01/01 to 03/31/2018 Weighted Weighted Quantity average Quantity average exercise price exercise price Opening balance 3,089,599 22.11 24,514,359 25.21 Options exercisable at the end of the period 3,089,599 22.11 24,514,359 25.21 Options: (*) Canceled / Forfeited (15,590) 29.51 - - Exercised (5 18,953) 21.84 (13,715,037) 25.88 Closing balance 2,555,056 22.30 10,799,322 24.89 Options exercisable at the end of the period 2,555,056 22.30 10,799,322 24.89 Range of exercise prices 22.30 14.47 - 27.55 Weighted average of the remaining contractual life (in years) 0 .75 1 .14 Market value weighted average (R$) 37.55 33.39 (*) Refers to non-exercise based on the beneficiary’s decision. Itaú Unibanco Holding S.A. – Complete Financial Statements – March 31, 2019 137
Note 14 – Related parties Transactions between related parties are carried out at amounts, terms and average rates in accordance with normal market practices during the period, as well as under reciprocal conditions. Transactions between companies and investment funds, included in consolidation (Note 2b), were eliminated and do not have effects on the consolidated statements. The main unconsolidated related parties are as follows: · Itaú Unibanco Participações S.A. (IUPAR), Companhia E.Johnston de Participações S.A. (shareholder of IUPAR) and ITAÚSA, direct and indirect shareholders of ITAÚ UNIBANCO HOLDING; · The non-financial subsidiaries and joint-controlled entities of ITAÚSA, specially: Itautec S.A., Duratex S.A., Itaúsa Empreendimentos S.A. and Alpargatas S.A.; · Investments in associates and jointly-controlled entities, and the main ones are: Porto Seguro Itaú Unibanco Participações S.A., BSF Holding S.A., IRB-Brasil Resseguros S.A. and XP Investimentos S.A.; · Fundação Itaú Unibanco - Previdência Complementar and FUNBEP – Fundo de Pensão Multipatrocinado, closed-end supplementary pension entities, that administer retirement plans sponsored by ITAÚ UNIBANCO HOLDING CONSOLIDATED, created exclusively for employees; · Foundations and Institutes maintained by ITAÚ UNIBANCO HOLDING’s donations and by the proceedings generated by its assets to accomplish its purposed, as well as to maintain the operational and administrative structure: Fundação Itaú Social – manages the “Itaú Social Program”, which aims at coordinating the organization’s role in projects of interest to the community by supporting or developing social, scientific and cultural projects, mainly in the elementary education and health areas and supports projects or initiatives in progress, supported or sponsored by entities qualified to work in the ”Programa Itaú Social” (Itaú Social Program). Instituto Itaú Cultural – promotes and disseminates Brazilian culture in the country and abroad. Instituto Unibanco – supports projects focused on social assistance, particularly education, culture, promotion of integration to labor market, and environmental protection, on a direct and/or supplementary basis, through the civil society’s institutions. Instituto Unibanco de Cinema – promotes culture in general and provides access of low-income population to cinematography, videography and similar productions, for which it should maintain movie theaters and movie clubs owned or managed by itself, and theaters to screen films, videos, video-laser discs and other related activities, as well as to screen and divulge movies in general, especially those produced in Brazil. Associação Itaú Viver Mais – provides social services for the welfare of beneficiaries, in the way and under conditions established by its Internal Rules, and according to the funds available. These services may include, among others, the promotion of cultural, educational, sports, entertainment and health care activities. · Associação Cubo Coworking Itaú – partner entity of ITAÚ UNIBANCO HOLDING CONSOLIDATED which purpose is to encourage and promote: discussions, the development of alternative and innovative technologies, business models and solutions; the production and dissemination of the resulting technical and scientific knowledge; the attraction and gathering of new information technology talents that may be characterized as startups; research, development and establishment of ecosystems for entrepreneurship and startups. Itaú Unibanco Holding S.A. – Complete Financial Statements – March 31, 2019 138 Note 14 – Related parties Transactions between related parties are carried out at amounts, terms and average rates in accordance with normal market practices during the period, as well as under reciprocal conditions. Transactions between companies and investment funds, included in consolidation (Note 2b), were eliminated and do not have effects on the consolidated statements. The main unconsolidated related parties are as follows: · Itaú Unibanco Participações S.A. (IUPAR), Companhia E.Johnston de Participações S.A. (shareholder of IUPAR) and ITAÚSA, direct and indirect shareholders of ITAÚ UNIBANCO HOLDING; · The non-financial subsidiaries and joint-controlled entities of ITAÚSA, specially: Itautec S.A., Duratex S.A., Itaúsa Empreendimentos S.A. and Alpargatas S.A.; · Investments in associates and jointly-controlled entities, and the main ones are: Porto Seguro Itaú Unibanco Participações S.A., BSF Holding S.A., IRB-Brasil Resseguros S.A. and XP Investimentos S.A.; · Fundação Itaú Unibanco - Previdência Complementar and FUNBEP – Fundo de Pensão Multipatrocinado, closed-end supplementary pension entities, that administer retirement plans sponsored by ITAÚ UNIBANCO HOLDING CONSOLIDATED, created exclusively for employees; · Foundations and Institutes maintained by ITAÚ UNIBANCO HOLDING’s donations and by the proceedings generated by its assets to accomplish its purposed, as well as to maintain the operational and administrative structure: Fundação Itaú Social – manages the “Itaú Social Program”, which aims at coordinating the organization’s role in projects of interest to the community by supporting or developing social, scientific and cultural projects, mainly in the elementary education and health areas and supports projects or initiatives in progress, supported or sponsored by entities qualified to work in the ”Programa Itaú Social” (Itaú Social Program). Instituto Itaú Cultural – promotes and disseminates Brazilian culture in the country and abroad. Instituto Unibanco – supports projects focused on social assistance, particularly education, culture, promotion of integration to labor market, and environmental protection, on a direct and/or supplementary basis, through the civil society’s institutions. Instituto Unibanco de Cinema – promotes culture in general and provides access of low-income population to cinematography, videography and similar productions, for which it should maintain movie theaters and movie clubs owned or managed by itself, and theaters to screen films, videos, video-laser discs and other related activities, as well as to screen and divulge movies in general, especially those produced in Brazil. Associação Itaú Viver Mais – provides social services for the welfare of beneficiaries, in the way and under conditions established by its Internal Rules, and according to the funds available. These services may include, among others, the promotion of cultural, educational, sports, entertainment and health care activities. · Associação Cubo Coworking Itaú – partner entity of ITAÚ UNIBANCO HOLDING CONSOLIDATED which purpose is to encourage and promote: discussions, the development of alternative and innovative technologies, business models and solutions; the production and dissemination of the resulting technical and scientific knowledge; the attraction and gathering of new information technology talents that may be characterized as startups; research, development and establishment of ecosystems for entrepreneurship and startups. Itaú Unibanco Holding S.A. – Complete Financial Statements – March 31, 2019 138
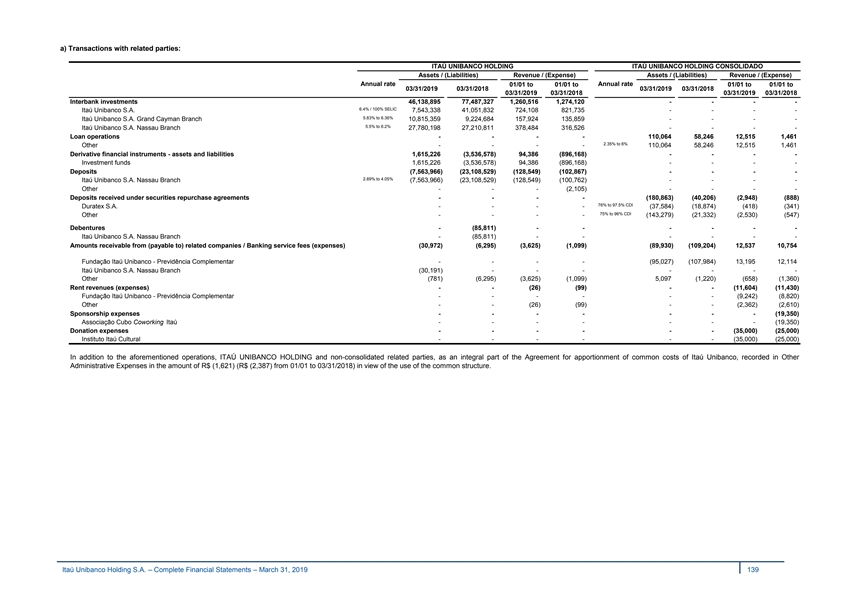
a) Transactions with related parties: ITAÚ UNIBANCO HOLDING ITAÚ UNIBANCO HOLDING CONSOLIDADO Assets / (Liabilities) Revenue / (Expense) Assets / (Liabilities) Revenue / (Expense) Annual rate 01/01 to 01/01 to Annual rate 01/01 to 01/01 to 03/31/2019 03/31/2018 03/31/2019 03/31/2018 03/31/2019 03/31/2018 03/31/2019 03/31/2018 Interbank investments 46,138,895 77,487,327 1,260,516 1,274,120 - - - - 6.4% / 100% SELIC Itaú Unibanco S.A. 7 ,543,338 41,051,832 724,108 821,735 - - - - 5.83% to 6.36% Itaú Unibanco S.A. Grand Cayman Branch 10,815,359 9 ,224,684 1 57,924 1 35,859 - - - - 5.5% to 6.2% Itaú Unibanco S.A. Nassau Branch 27,780,198 27,210,811 378,484 316,526 - - - - Loan operations - - - - 110,064 5 8,246 1 2,515 1,461 2.35% to 6% Other - - - - 110,064 58,246 12,515 1 ,461 Derivative financial instruments - assets and liabilities 1,615,226 (3,536,578) 9 4,386 (8 96,168) - - - - Investment funds 1 ,615,226 (3 ,536,578) 94,386 (8 96,168) - - - - Deposits (7 ,563,966) (23,108,529) (1 28,549) (102,867) - - - - 2.89% to 4.05% Itaú Unibanco S.A. Nassau Branch (7 ,563,966) (23,108,529) (1 28,549) (100,762) - - - - Other - - - (2,105) - - - - Deposits received under securities repurchase agreements - - - - (180,863) (40,206) (2,948) (888) 76% to 97.5% CDI Duratex S.A. - - - - (3 7,584) (18,874) (4 18) (3 41) 75% to 96% CDI Other - - - - (1 43,279) (21,332) (2 ,530) (547) Debentures - (85,811) - - - - - - Itaú Unibanco S.A. Nassau Branch - (85,811) - - - - - - Amounts receivable from (payable to) related companies / Banking service fees (expenses) (3 0,972) (6,295) (3,625) (1 ,099) (8 9,930) (109,204) 12,537 10,754 Fundação Itaú Unibanco - Previdência Complementar - - - - (9 5,027) (107,984) 13,195 12,114 Itaú Unibanco S.A. Nassau Branch (3 0,191) - - - - - - - Other (7 81) (6,295) (3 ,625) (1,099) 5 ,097 (1 ,220) (6 58) (1,360) Rent revenues (expenses) - - (26) (99) - - (1 1,604) (1 1,430) Fundação Itaú Unibanco - Previdência Complementar - - - - - - (9,242) (8,820) Other - - (2 6) (9 9) - - (2,362) (2,610) Sponsorship expenses - - - - - - - (1 9,350) Associação Cubo Coworking Itaú - - - - - - - (1 9,350) Donation expenses - - - - - - (3 5,000) (25,000) Instituto Itaú Cultural - - - - - - (35,000) (25,000) In addition to the aforementioned operations, ITAÚ UNIBANCO HOLDING and non-consolidated related parties, as an integral part of the Agreement for apportionment of common costs of Itaú Unibanco, recorded in Other Administrative Expenses in the amount of R$ (1,621) (R$ (2,387) from 01/01 to 03/31/2018) in view of the use of the common structure. Itaú Unibanco Holding S.A. – Complete Financial Statements – March 31, 2019 139 a) Transactions with related parties: ITAÚ UNIBANCO HOLDING ITAÚ UNIBANCO HOLDING CONSOLIDADO Assets / (Liabilities) Revenue / (Expense) Assets / (Liabilities) Revenue / (Expense) Annual rate 01/01 to 01/01 to Annual rate 01/01 to 01/01 to 03/31/2019 03/31/2018 03/31/2019 03/31/2018 03/31/2019 03/31/2018 03/31/2019 03/31/2018 Interbank investments 46,138,895 77,487,327 1,260,516 1,274,120 - - - - 6.4% / 100% SELIC Itaú Unibanco S.A. 7 ,543,338 41,051,832 724,108 821,735 - - - - 5.83% to 6.36% Itaú Unibanco S.A. Grand Cayman Branch 10,815,359 9 ,224,684 1 57,924 1 35,859 - - - - 5.5% to 6.2% Itaú Unibanco S.A. Nassau Branch 27,780,198 27,210,811 378,484 316,526 - - - - Loan operations - - - - 110,064 5 8,246 1 2,515 1,461 2.35% to 6% Other - - - - 110,064 58,246 12,515 1 ,461 Derivative financial instruments - assets and liabilities 1,615,226 (3,536,578) 9 4,386 (8 96,168) - - - - Investment funds 1 ,615,226 (3 ,536,578) 94,386 (8 96,168) - - - - Deposits (7 ,563,966) (23,108,529) (1 28,549) (102,867) - - - - 2.89% to 4.05% Itaú Unibanco S.A. Nassau Branch (7 ,563,966) (23,108,529) (1 28,549) (100,762) - - - - Other - - - (2,105) - - - - Deposits received under securities repurchase agreements - - - - (180,863) (40,206) (2,948) (888) 76% to 97.5% CDI Duratex S.A. - - - - (3 7,584) (18,874) (4 18) (3 41) 75% to 96% CDI Other - - - - (1 43,279) (21,332) (2 ,530) (547) Debentures - (85,811) - - - - - - Itaú Unibanco S.A. Nassau Branch - (85,811) - - - - - - Amounts receivable from (payable to) related companies / Banking service fees (expenses) (3 0,972) (6,295) (3,625) (1 ,099) (8 9,930) (109,204) 12,537 10,754 Fundação Itaú Unibanco - Previdência Complementar - - - - (9 5,027) (107,984) 13,195 12,114 Itaú Unibanco S.A. Nassau Branch (3 0,191) - - - - - - - Other (7 81) (6,295) (3 ,625) (1,099) 5 ,097 (1 ,220) (6 58) (1,360) Rent revenues (expenses) - - (26) (99) - - (1 1,604) (1 1,430) Fundação Itaú Unibanco - Previdência Complementar - - - - - - (9,242) (8,820) Other - - (2 6) (9 9) - - (2,362) (2,610) Sponsorship expenses - - - - - - - (1 9,350) Associação Cubo Coworking Itaú - - - - - - - (1 9,350) Donation expenses - - - - - - (3 5,000) (25,000) Instituto Itaú Cultural - - - - - - (35,000) (25,000) In addition to the aforementioned operations, ITAÚ UNIBANCO HOLDING and non-consolidated related parties, as an integral part of the Agreement for apportionment of common costs of Itaú Unibanco, recorded in Other Administrative Expenses in the amount of R$ (1,621) (R$ (2,387) from 01/01 to 03/31/2018) in view of the use of the common structure. Itaú Unibanco Holding S.A. – Complete Financial Statements – March 31, 2019 139
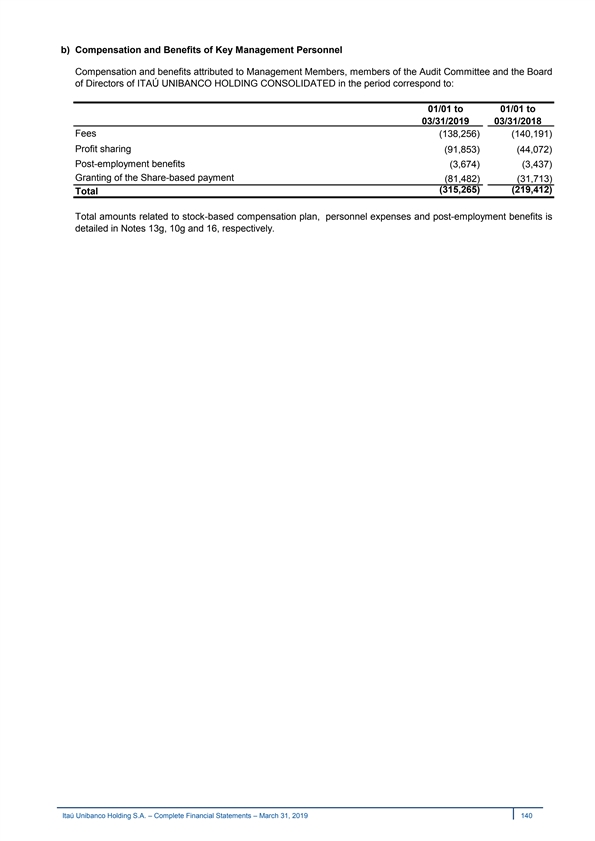
b) Compensation and Benefits of Key Management Personnel Compensation and benefits attributed to Management Members, members of the Audit Committee and the Board of Directors of ITAÚ UNIBANCO HOLDING CONSOLIDATED in the period correspond to: 01/01 to 01/01 to 03/31/2019 03/31/2018 Fees (138,256) (140,191) Profit sharing (91,853) (44,072) Post-employment benefits (3,674) (3,437) Granting of the Share-based payment (81,482) (31,713) (315,265) (219,412) Total Total amounts related to stock-based compensation plan, personnel expenses and post-employment benefits is detailed in Notes 13g, 10g and 16, respectively. Itaú Unibanco Holding S.A. – Complete Financial Statements – March 31, 2019 140 b) Compensation and Benefits of Key Management Personnel Compensation and benefits attributed to Management Members, members of the Audit Committee and the Board of Directors of ITAÚ UNIBANCO HOLDING CONSOLIDATED in the period correspond to: 01/01 to 01/01 to 03/31/2019 03/31/2018 Fees (138,256) (140,191) Profit sharing (91,853) (44,072) Post-employment benefits (3,674) (3,437) Granting of the Share-based payment (81,482) (31,713) (315,265) (219,412) Total Total amounts related to stock-based compensation plan, personnel expenses and post-employment benefits is detailed in Notes 13g, 10g and 16, respectively. Itaú Unibanco Holding S.A. – Complete Financial Statements – March 31, 2019 140
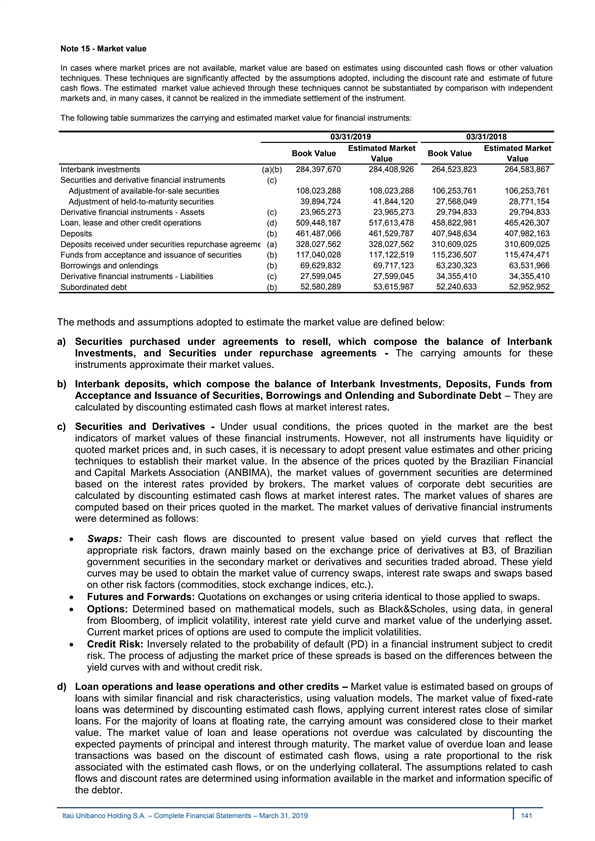
Note 15 - Market value In cases where market prices are not available, market value are based on estimates using discounted cash flows or other valuation techniques. These techniques are significantly affected by the assumptions adopted, including the discount rate and estimate of future cash flows. The estimated market value achieved through these techniques cannot be substantiated by comparison with independent markets and, in many cases, it cannot be realized in the immediate settlement of the instrument. The following table summarizes the carrying and estimated market value for financial instruments: 03/31/2019 03/31/2018 Estimated Market Estimated Market Book Value Book Value Value Value 284,397,670 284,408,926 264,523,823 264,583,867 Interbank investments (a)(b) Securities and derivative financial instruments (c) Adjustment of available-for-sale securities 108,023,288 108,023,288 106,253,761 106,253,761 Adjustment of held-to-maturity securities 39,894,724 41,844,120 27,568,049 28,771,154 Derivative financial instruments - Assets (c) 23,965,273 23,965,273 29,794,833 29,794,833 Loan, lease and other credit operations (d) 509,448,187 517,613,478 458,822,981 465,426,307 Deposits (b) 461,487,066 461,529,787 407,948,634 407,982,163 Deposits received under securities repurchase agreements (a) 328,027,562 328,027,562 310,609,025 310,609,025 Funds from acceptance and issuance of securities (b) 117,040,028 117,122,519 115,236,507 115,474,471 Borrowings and onlendings (b) 69,629,832 69,717,123 63,230,323 63,531,966 27,599,045 27,599,045 34,355,410 34,355,410 Derivative financial instruments - Liabilities (c) 52,580,289 53,615,987 52,240,633 52,952,952 Subordinated debt (b) The methods and assumptions adopted to estimate the market value are defined below: a) Securities purchased under agreements to resell, which compose the balance of Interbank Investments, and Securities under repurchase agreements - The carrying amounts for these instruments approximate their market values. b) Interbank deposits, which compose the balance of Interbank Investments, Deposits, Funds from Acceptance and Issuance of Securities, Borrowings and Onlending and Subordinate Debt – They are calculated by discounting estimated cash flows at market interest rates. c) Securities and Derivatives - Under usual conditions, the prices quoted in the market are the best indicators of market values of these financial instruments. However, not all instruments have liquidity or quoted market prices and, in such cases, it is necessary to adopt present value estimates and other pricing techniques to establish their market value. In the absence of the prices quoted by the Brazilian Financial and Capital Markets Association (ANBIMA), the market values of government securities are determined based on the interest rates provided by brokers. The market values of corporate debt securities are calculated by discounting estimated cash flows at market interest rates. The market values of shares are computed based on their prices quoted in the market. The market values of derivative financial instruments were determined as follows: · Swaps: Their cash flows are discounted to present value based on yield curves that reflect the appropriate risk factors, drawn mainly based on the exchange price of derivatives at B3, of Brazilian government securities in the secondary market or derivatives and securities traded abroad. These yield curves may be used to obtain the market value of currency swaps, interest rate swaps and swaps based on other risk factors (commodities, stock exchange indices, etc.). · Futures and Forwards: Quotations on exchanges or using criteria identical to those applied to swaps. · Options: Determined based on mathematical models, such as Black&Scholes, using data, in general from Bloomberg, of implicit volatility, interest rate yield curve and market value of the underlying asset. Current market prices of options are used to compute the implicit volatilities. · Credit Risk: Inversely related to the probability of default (PD) in a financial instrument subject to credit risk. The process of adjusting the market price of these spreads is based on the differences between the yield curves with and without credit risk. d) Loan operations and lease operations and other credits – Market value is estimated based on groups of loans with similar financial and risk characteristics, using valuation models. The market value of fixed-rate loans was determined by discounting estimated cash flows, applying current interest rates close of similar loans. For the majority of loans at floating rate, the carrying amount was considered close to their market value. The market value of loan and lease operations not overdue was calculated by discounting the expected payments of principal and interest through maturity. The market value of overdue loan and lease transactions was based on the discount of estimated cash flows, using a rate proportional to the risk associated with the estimated cash flows, or on the underlying collateral. The assumptions related to cash flows and discount rates are determined using information available in the market and information specific of the debtor. Itaú Unibanco Holding S.A. – Complete Financial Statements – March 31, 2019 141 Note 15 - Market value In cases where market prices are not available, market value are based on estimates using discounted cash flows or other valuation techniques. These techniques are significantly affected by the assumptions adopted, including the discount rate and estimate of future cash flows. The estimated market value achieved through these techniques cannot be substantiated by comparison with independent markets and, in many cases, it cannot be realized in the immediate settlement of the instrument. The following table summarizes the carrying and estimated market value for financial instruments: 03/31/2019 03/31/2018 Estimated Market Estimated Market Book Value Book Value Value Value 284,397,670 284,408,926 264,523,823 264,583,867 Interbank investments (a)(b) Securities and derivative financial instruments (c) Adjustment of available-for-sale securities 108,023,288 108,023,288 106,253,761 106,253,761 Adjustment of held-to-maturity securities 39,894,724 41,844,120 27,568,049 28,771,154 Derivative financial instruments - Assets (c) 23,965,273 23,965,273 29,794,833 29,794,833 Loan, lease and other credit operations (d) 509,448,187 517,613,478 458,822,981 465,426,307 Deposits (b) 461,487,066 461,529,787 407,948,634 407,982,163 Deposits received under securities repurchase agreements (a) 328,027,562 328,027,562 310,609,025 310,609,025 Funds from acceptance and issuance of securities (b) 117,040,028 117,122,519 115,236,507 115,474,471 Borrowings and onlendings (b) 69,629,832 69,717,123 63,230,323 63,531,966 27,599,045 27,599,045 34,355,410 34,355,410 Derivative financial instruments - Liabilities (c) 52,580,289 53,615,987 52,240,633 52,952,952 Subordinated debt (b) The methods and assumptions adopted to estimate the market value are defined below: a) Securities purchased under agreements to resell, which compose the balance of Interbank Investments, and Securities under repurchase agreements - The carrying amounts for these instruments approximate their market values. b) Interbank deposits, which compose the balance of Interbank Investments, Deposits, Funds from Acceptance and Issuance of Securities, Borrowings and Onlending and Subordinate Debt – They are calculated by discounting estimated cash flows at market interest rates. c) Securities and Derivatives - Under usual conditions, the prices quoted in the market are the best indicators of market values of these financial instruments. However, not all instruments have liquidity or quoted market prices and, in such cases, it is necessary to adopt present value estimates and other pricing techniques to establish their market value. In the absence of the prices quoted by the Brazilian Financial and Capital Markets Association (ANBIMA), the market values of government securities are determined based on the interest rates provided by brokers. The market values of corporate debt securities are calculated by discounting estimated cash flows at market interest rates. The market values of shares are computed based on their prices quoted in the market. The market values of derivative financial instruments were determined as follows: · Swaps: Their cash flows are discounted to present value based on yield curves that reflect the appropriate risk factors, drawn mainly based on the exchange price of derivatives at B3, of Brazilian government securities in the secondary market or derivatives and securities traded abroad. These yield curves may be used to obtain the market value of currency swaps, interest rate swaps and swaps based on other risk factors (commodities, stock exchange indices, etc.). · Futures and Forwards: Quotations on exchanges or using criteria identical to those applied to swaps. · Options: Determined based on mathematical models, such as Black&Scholes, using data, in general from Bloomberg, of implicit volatility, interest rate yield curve and market value of the underlying asset. Current market prices of options are used to compute the implicit volatilities. · Credit Risk: Inversely related to the probability of default (PD) in a financial instrument subject to credit risk. The process of adjusting the market price of these spreads is based on the differences between the yield curves with and without credit risk. d) Loan operations and lease operations and other credits – Market value is estimated based on groups of loans with similar financial and risk characteristics, using valuation models. The market value of fixed-rate loans was determined by discounting estimated cash flows, applying current interest rates close of similar loans. For the majority of loans at floating rate, the carrying amount was considered close to their market value. The market value of loan and lease operations not overdue was calculated by discounting the expected payments of principal and interest through maturity. The market value of overdue loan and lease transactions was based on the discount of estimated cash flows, using a rate proportional to the risk associated with the estimated cash flows, or on the underlying collateral. The assumptions related to cash flows and discount rates are determined using information available in the market and information specific of the debtor. Itaú Unibanco Holding S.A. – Complete Financial Statements – March 31, 2019 141
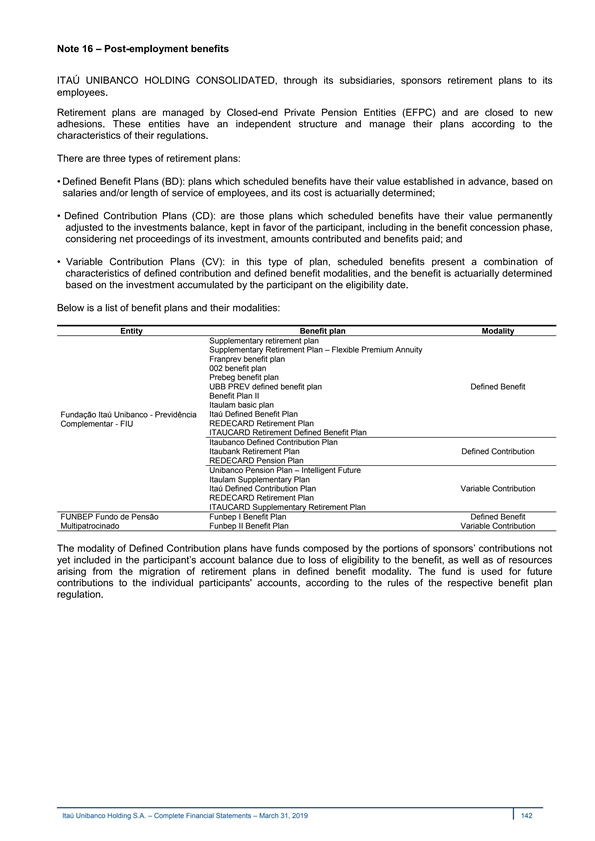
Note 16 – Post-employment benefits ITAÚ UNIBANCO HOLDING CONSOLIDATED, through its subsidiaries, sponsors retirement plans to its employees. Retirement plans are managed by Closed-end Private Pension Entities (EFPC) and are closed to new adhesions. These entities have an independent structure and manage their plans according to the characteristics of their regulations. There are three types of retirement plans: • Defined Benefit Plans (BD): plans which scheduled benefits have their value established in advance, based on salaries and/or length of service of employees, and its cost is actuarially determined; • Defined Contribution Plans (CD): are those plans which scheduled benefits have their value permanently adjusted to the investments balance, kept in favor of the participant, including in the benefit concession phase, considering net proceedings of its investment, amounts contributed and benefits paid; and • Variable Contribution Plans (CV): in this type of plan, scheduled benefits present a combination of characteristics of defined contribution and defined benefit modalities, and the benefit is actuarially determined based on the investment accumulated by the participant on the eligibility date. Below is a list of benefit plans and their modalities: Entity Benefit plan Modality Supplementary retirement plan Supplementary Retirement Plan – Flexible Premium Annuity Franprev benefit plan 002 benefit plan Prebeg benefit plan UBB PREV defined benefit plan Defined Benefit Benefit Plan II Itaulam basic plan Fundação Itaú Unibanco - Previdência Itaú Defined Benefit Plan Complementar - FIU REDECARD Retirement Plan ITAUCARD Retirement Defined Benefit Plan Itaubanco Defined Contribution Plan Itaubank Retirement Plan Defined Contribution REDECARD Pension Plan Unibanco Pension Plan – Intelligent Future Itaulam Supplementary Plan Itaú Defined Contribution Plan Variable Contribution REDECARD Retirement Plan ITAUCARD Supplementary Retirement Plan FUNBEP Fundo de Pensão Funbep I Benefit Plan Defined Benefit Multipatrocinado Funbep II Benefit Plan Variable Contribution The modality of Defined Contribution plans have funds composed by the portions of sponsors’ contributions not yet included in the participant’s account balance due to loss of eligibility to the benefit, as well as of resources arising from the migration of retirement plans in defined benefit modality. The fund is used for future contributions to the individual participants' accounts, according to the rules of the respective benefit plan regulation. Itaú Unibanco Holding S.A. – Complete Financial Statements – March 31, 2019 142 Note 16 – Post-employment benefits ITAÚ UNIBANCO HOLDING CONSOLIDATED, through its subsidiaries, sponsors retirement plans to its employees. Retirement plans are managed by Closed-end Private Pension Entities (EFPC) and are closed to new adhesions. These entities have an independent structure and manage their plans according to the characteristics of their regulations. There are three types of retirement plans: • Defined Benefit Plans (BD): plans which scheduled benefits have their value established in advance, based on salaries and/or length of service of employees, and its cost is actuarially determined; • Defined Contribution Plans (CD): are those plans which scheduled benefits have their value permanently adjusted to the investments balance, kept in favor of the participant, including in the benefit concession phase, considering net proceedings of its investment, amounts contributed and benefits paid; and • Variable Contribution Plans (CV): in this type of plan, scheduled benefits present a combination of characteristics of defined contribution and defined benefit modalities, and the benefit is actuarially determined based on the investment accumulated by the participant on the eligibility date. Below is a list of benefit plans and their modalities: Entity Benefit plan Modality Supplementary retirement plan Supplementary Retirement Plan – Flexible Premium Annuity Franprev benefit plan 002 benefit plan Prebeg benefit plan UBB PREV defined benefit plan Defined Benefit Benefit Plan II Itaulam basic plan Fundação Itaú Unibanco - Previdência Itaú Defined Benefit Plan Complementar - FIU REDECARD Retirement Plan ITAUCARD Retirement Defined Benefit Plan Itaubanco Defined Contribution Plan Itaubank Retirement Plan Defined Contribution REDECARD Pension Plan Unibanco Pension Plan – Intelligent Future Itaulam Supplementary Plan Itaú Defined Contribution Plan Variable Contribution REDECARD Retirement Plan ITAUCARD Supplementary Retirement Plan FUNBEP Fundo de Pensão Funbep I Benefit Plan Defined Benefit Multipatrocinado Funbep II Benefit Plan Variable Contribution The modality of Defined Contribution plans have funds composed by the portions of sponsors’ contributions not yet included in the participant’s account balance due to loss of eligibility to the benefit, as well as of resources arising from the migration of retirement plans in defined benefit modality. The fund is used for future contributions to the individual participants' accounts, according to the rules of the respective benefit plan regulation. Itaú Unibanco Holding S.A. – Complete Financial Statements – March 31, 2019 142

a) Main Actuarial Assumptions Actuarial assumptions of demographic and financial nature should reflect the best estimated about the variables that determine the post-employment benefit amounts. The main demographic assumptions comprise: mortality table and turnover of active participants and the main financial assumptions include: discount rate, future salary increases, growth of plan benefits and inflation. 03/31/2019 03/31/2018 (1) Discount rate 9.72% p.a. 9.98% p.a. (2) Mortality table AT-2000 AT-2000 (3) Turnover Itaú Experience 2008/2010 Itaú Experience 2008/2010 Future salary growth 4.00% to 7.12 % p.a. 5.04% to 7.12 % p.a. Growth of plan benefits 4.00 % p.a. 4.00 % p.a. Inflation 4.00 % p.a. 4.00 % p.a. Actuarial method Projected Unit Credit Projected Unit Credit (1) Determined based on market yield related to National Treasury Notes (NTN-B) and compatible with the economic scenario observed on the balance sheet closing date, considering the volatility of interest market and models used. (2) Correspond to those disclosed by SOA – Society of Actuaries , that reflect a 10% increase in the probabilities of survival regarding the respective basic tables. (3) Updated to the new expectation of mass behavior. Retired plans sponsored by foreign subsidiaries - Banco Itaú (Suisse) S.A., Itaú CorpBanca Colombia S.A. and PROSERV - Promociones y Servicios S.A. de C.V. - are structured as Defined Benefit modality and adopt actual assumptions adequate to masses of participants and the economic scenario of each country. b) Risk Management The EFPCs sponsored by ITAÚ UNIBANCO HOLDING are regulated by the National Council for Complementary Pension (CNPC) and PREVIC, has an Executive Board, Advisory and Tax Councils. Benefits offered have long-tem characteristics and the main factors involved in the management and measurement of their risks are financial risk, inflation risk and biometric risk. - Financial Risk – the actuarial liability is calculated by adopting a discount rate different from rates earned in investments. If real income from plan investments is lower than yield expected, this may give rise to a deficit. To mitigate this risk and assure the capacity to pay long-term benefits, the plans have a significant percentage of fixed-income securities pegged to the plan commitments, aiming at minimizing volatility and risk of mismatch between assets and liabilities. Additionally, adherence tests are carried out in financial assumptions to ensure their adequacy to obligations of respective plans. - Inflation risk – a large part of liabilities is pegged to inflation risk, making actuarial liabilities sensitive to increase in rates. To mitigate this risk, the same financial risks mitigation strategies are used. - Biometric Risk – plans that have any obligation actuarially assessed are exposed to biometric risk. In the event the mortality tables used are not adherent to the mass of plan participants, a deficit or surplus may arise in actuarial evaluation. To mitigate this risk, adherence tests to biometric assumptions are conducted to ensure their adequacy to liabilities of respective plans. For purposes of registering in the balance sheet the EFPCs that manage them, actuarial liabilities of plans use discount rate adherent to its asset portfolio and income and expense flows, according to a study preparedby an independent consulting company. The actuarial method used is the aggregate method, through which the plan costing Is defined by the difference between its equity coverage and the current value of its future liabilities. Observing the methodology established in the respective actuarial technical note. In the event deficit is verified in the concession period above the settlement limits set forth by the legislation in force, a debt agreement is entered into with the sponsor with financial guarantees. Itaú Unibanco Holding S.A. – Complete Financial Statements – March 31, 2019 143 a) Main Actuarial Assumptions Actuarial assumptions of demographic and financial nature should reflect the best estimated about the variables that determine the post-employment benefit amounts. The main demographic assumptions comprise: mortality table and turnover of active participants and the main financial assumptions include: discount rate, future salary increases, growth of plan benefits and inflation. 03/31/2019 03/31/2018 (1) Discount rate 9.72% p.a. 9.98% p.a. (2) Mortality table AT-2000 AT-2000 (3) Turnover Itaú Experience 2008/2010 Itaú Experience 2008/2010 Future salary growth 4.00% to 7.12 % p.a. 5.04% to 7.12 % p.a. Growth of plan benefits 4.00 % p.a. 4.00 % p.a. Inflation 4.00 % p.a. 4.00 % p.a. Actuarial method Projected Unit Credit Projected Unit Credit (1) Determined based on market yield related to National Treasury Notes (NTN-B) and compatible with the economic scenario observed on the balance sheet closing date, considering the volatility of interest market and models used. (2) Correspond to those disclosed by SOA – Society of Actuaries , that reflect a 10% increase in the probabilities of survival regarding the respective basic tables. (3) Updated to the new expectation of mass behavior. Retired plans sponsored by foreign subsidiaries - Banco Itaú (Suisse) S.A., Itaú CorpBanca Colombia S.A. and PROSERV - Promociones y Servicios S.A. de C.V. - are structured as Defined Benefit modality and adopt actual assumptions adequate to masses of participants and the economic scenario of each country. b) Risk Management The EFPCs sponsored by ITAÚ UNIBANCO HOLDING are regulated by the National Council for Complementary Pension (CNPC) and PREVIC, has an Executive Board, Advisory and Tax Councils. Benefits offered have long-tem characteristics and the main factors involved in the management and measurement of their risks are financial risk, inflation risk and biometric risk. - Financial Risk – the actuarial liability is calculated by adopting a discount rate different from rates earned in investments. If real income from plan investments is lower than yield expected, this may give rise to a deficit. To mitigate this risk and assure the capacity to pay long-term benefits, the plans have a significant percentage of fixed-income securities pegged to the plan commitments, aiming at minimizing volatility and risk of mismatch between assets and liabilities. Additionally, adherence tests are carried out in financial assumptions to ensure their adequacy to obligations of respective plans. - Inflation risk – a large part of liabilities is pegged to inflation risk, making actuarial liabilities sensitive to increase in rates. To mitigate this risk, the same financial risks mitigation strategies are used. - Biometric Risk – plans that have any obligation actuarially assessed are exposed to biometric risk. In the event the mortality tables used are not adherent to the mass of plan participants, a deficit or surplus may arise in actuarial evaluation. To mitigate this risk, adherence tests to biometric assumptions are conducted to ensure their adequacy to liabilities of respective plans. For purposes of registering in the balance sheet the EFPCs that manage them, actuarial liabilities of plans use discount rate adherent to its asset portfolio and income and expense flows, according to a study preparedby an independent consulting company. The actuarial method used is the aggregate method, through which the plan costing Is defined by the difference between its equity coverage and the current value of its future liabilities. Observing the methodology established in the respective actuarial technical note. In the event deficit is verified in the concession period above the settlement limits set forth by the legislation in force, a debt agreement is entered into with the sponsor with financial guarantees. Itaú Unibanco Holding S.A. – Complete Financial Statements – March 31, 2019 143
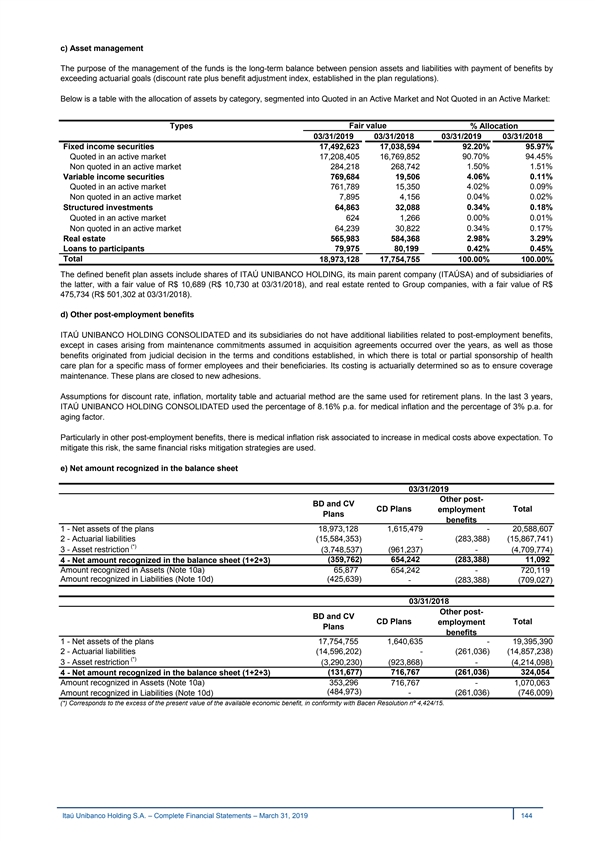
c) Asset management The purpose of the management of the funds is the long-term balance between pension assets and liabilities with payment of benefits by exceeding actuarial goals (discount rate plus benefit adjustment index, established in the plan regulations). Below is a table with the allocation of assets by category, segmented into Quoted in an Active Market and Not Quoted in an Active Market: Types Fair value % Allocation 03/31/2019 03/31/2018 03/31/2019 03/31/2018 92.20% 95.97% Fixed income securities 17,492,623 17,038,594 90.70% 94.45% Quoted in an active market 17,208,405 16,769,852 Non quoted in an active market 284,218 268,742 1.50% 1.51% Variable income securities 769,684 19,506 4.06% 0.11% Quoted in an active market 761,789 15,350 4.02% 0.09% Non quoted in an active market 7,895 4,156 0.04% 0.02% 0.34% 0.18% Structured investments 64,863 32,088 Quoted in an active market 624 1,266 0.00% 0.01% 0.34% 0.17% Non quoted in an active market 64,239 30,822 Real estate 565,983 584,368 2.98% 3.29% Loans to participants 79,975 80,199 0.42% 0.45% Total 18,973,128 17,754,755 100.00% 100.00% The defined benefit plan assets include shares of ITAÚ UNIBANCO HOLDING, its main parent company (ITAÚSA) and of subsidiaries of the latter, with a fair value of R$ 10,689 (R$ 10,730 at 03/31/2018), and real estate rented to Group companies, with a fair value of R$ 475,734 (R$ 501,302 at 03/31/2018). d) Other post-employment benefits ITAÚ UNIBANCO HOLDING CONSOLIDATED and its subsidiaries do not have additional liabilities related to post-employment benefits, except in cases arising from maintenance commitments assumed in acquisition agreements occurred over the years, as well as those benefits originated from judicial decision in the terms and conditions established, in which there is total or partial sponsorship of health care plan for a specific mass of former employees and their beneficiaries. Its costing is actuarially determined so as to ensure coverage maintenance. These plans are closed to new adhesions. Assumptions for discount rate, inflation, mortality table and actuarial method are the same used for retirement plans. In the last 3 years, ITAÚ UNIBANCO HOLDING CONSOLIDATED used the percentage of 8.16% p.a. for medical inflation and the percentage of 3% p.a. for aging factor. Particularly in other post-employment benefits, there is medical inflation risk associated to increase in medical costs above expectation. To mitigate this risk, the same financial risks mitigation strategies are used. e) Net amount recognized in the balance sheet 03/31/2019 Other post- BD and CV CD Plans Total employment Plans benefits 1 - Net assets of the plans 18,973,128 1,615,479 - 20,588,607 2 - Actuarial liabilities (15,584,353) - (283,388) (15,867,741) (*) 3 - Asset restriction (3,748,537) (961,237) - (4,709,774) (359,762) 654,242 (283,388) 11,092 4 - Net amount recognized in the balance sheet (1+2+3) Amount recognized in Assets (Note 10a) 65,877 654,242 - 720,119 Amount recognized in Liabilities (Note 10d) (425,639) - (283,388) (709,027) 03/31/2018 Other post- BD and CV CD Plans Total employment Plans benefits 1 - Net assets of the plans 17,754,755 1,640,635 - 19,395,390 2 - Actuarial liabilities (14,596,202) - (261,036) (14,857,238) (*) 3 - Asset restriction (3,290,230) (923,868) - (4,214,098) 4 - Net amount recognized in the balance sheet (1+2+3) (131,677) 716,767 (261,036) 324,054 Amount recognized in Assets (Note 10a) 353,296 716,767 - 1,070,063 (484,973) - (261,036) (746,009) Amount recognized in Liabilities (Note 10d) (*) Corresponds to the excess of the present value of the available economic benefit, in conformity with Bacen Resolution nº 4,424/15. Itaú Unibanco Holding S.A. – Complete Financial Statements – March 31, 2019 144 c) Asset management The purpose of the management of the funds is the long-term balance between pension assets and liabilities with payment of benefits by exceeding actuarial goals (discount rate plus benefit adjustment index, established in the plan regulations). Below is a table with the allocation of assets by category, segmented into Quoted in an Active Market and Not Quoted in an Active Market: Types Fair value % Allocation 03/31/2019 03/31/2018 03/31/2019 03/31/2018 92.20% 95.97% Fixed income securities 17,492,623 17,038,594 90.70% 94.45% Quoted in an active market 17,208,405 16,769,852 Non quoted in an active market 284,218 268,742 1.50% 1.51% Variable income securities 769,684 19,506 4.06% 0.11% Quoted in an active market 761,789 15,350 4.02% 0.09% Non quoted in an active market 7,895 4,156 0.04% 0.02% 0.34% 0.18% Structured investments 64,863 32,088 Quoted in an active market 624 1,266 0.00% 0.01% 0.34% 0.17% Non quoted in an active market 64,239 30,822 Real estate 565,983 584,368 2.98% 3.29% Loans to participants 79,975 80,199 0.42% 0.45% Total 18,973,128 17,754,755 100.00% 100.00% The defined benefit plan assets include shares of ITAÚ UNIBANCO HOLDING, its main parent company (ITAÚSA) and of subsidiaries of the latter, with a fair value of R$ 10,689 (R$ 10,730 at 03/31/2018), and real estate rented to Group companies, with a fair value of R$ 475,734 (R$ 501,302 at 03/31/2018). d) Other post-employment benefits ITAÚ UNIBANCO HOLDING CONSOLIDATED and its subsidiaries do not have additional liabilities related to post-employment benefits, except in cases arising from maintenance commitments assumed in acquisition agreements occurred over the years, as well as those benefits originated from judicial decision in the terms and conditions established, in which there is total or partial sponsorship of health care plan for a specific mass of former employees and their beneficiaries. Its costing is actuarially determined so as to ensure coverage maintenance. These plans are closed to new adhesions. Assumptions for discount rate, inflation, mortality table and actuarial method are the same used for retirement plans. In the last 3 years, ITAÚ UNIBANCO HOLDING CONSOLIDATED used the percentage of 8.16% p.a. for medical inflation and the percentage of 3% p.a. for aging factor. Particularly in other post-employment benefits, there is medical inflation risk associated to increase in medical costs above expectation. To mitigate this risk, the same financial risks mitigation strategies are used. e) Net amount recognized in the balance sheet 03/31/2019 Other post- BD and CV CD Plans Total employment Plans benefits 1 - Net assets of the plans 18,973,128 1,615,479 - 20,588,607 2 - Actuarial liabilities (15,584,353) - (283,388) (15,867,741) (*) 3 - Asset restriction (3,748,537) (961,237) - (4,709,774) (359,762) 654,242 (283,388) 11,092 4 - Net amount recognized in the balance sheet (1+2+3) Amount recognized in Assets (Note 10a) 65,877 654,242 - 720,119 Amount recognized in Liabilities (Note 10d) (425,639) - (283,388) (709,027) 03/31/2018 Other post- BD and CV CD Plans Total employment Plans benefits 1 - Net assets of the plans 17,754,755 1,640,635 - 19,395,390 2 - Actuarial liabilities (14,596,202) - (261,036) (14,857,238) (*) 3 - Asset restriction (3,290,230) (923,868) - (4,214,098) 4 - Net amount recognized in the balance sheet (1+2+3) (131,677) 716,767 (261,036) 324,054 Amount recognized in Assets (Note 10a) 353,296 716,767 - 1,070,063 (484,973) - (261,036) (746,009) Amount recognized in Liabilities (Note 10d) (*) Corresponds to the excess of the present value of the available economic benefit, in conformity with Bacen Resolution nº 4,424/15. Itaú Unibanco Holding S.A. – Complete Financial Statements – March 31, 2019 144
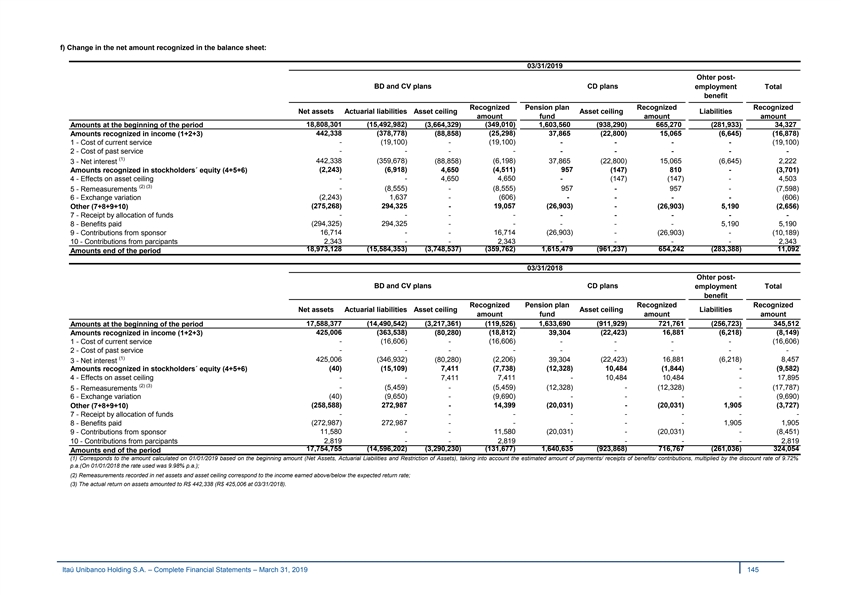
f) Change in the net amount recognized in the balance sheet: 03/31/2019 Ohter post- BD and CV plans CD plans employment Total benefit Recognized Pension plan Recognized Recognized Net assets Actuarial liabilities Asset ceiling Asset ceiling Liabilities amount fund amount amount Amounts at the beginning of the period 18,808,301 (15,492,982) (3,664,329) (349,010) 1,603,560 (938,290) 665,270 (281,933) 34,327 Amounts recognized in income (1+2+3) 442,338 (378,778) (88,858) (25,298) 37,865 (22,800) 15,065 (6,645) (16,878) - (19,100) - (19,100) - - - - (19,100) 1 - Cost of current service 2 - Cost of past service - - - - - - - - - (1) 442,338 (359,678) (88,858) (6,198) 37,865 (22,800) 15,065 (6,645) 2,222 3 - Net interest Amounts recognized in stockholders´ equity (4+5+6) (2,243) (6,918) 4,650 (4,511) 957 (147) 810 - (3,701) 4 - Effects on asset ceiling - - 4,650 4,650 - (147) (147) - 4,503 (2) (3) 5 - Remeasurements - (8,555) - (8,555) 957 - 957 - (7,598) (2,243) 1,637 (606) - 6 - Exchange variation - - - - (606) (275,268) 294,325 - 19,057 (26,903) - (26,903) 5,190 (2,656) Other (7+8+9+10) 7 - Receipt by allocation of funds - - - - - - - - - 8 - Benefits paid (294,325) 294,325 - - - - - 5,190 5,190 9 - Contributions from sponsor 16,714 - - 16,714 (26,903) - (26,903) - (10,189) 10 - Contributions from parcipants 2,343 - - 2,343 - - - - 2,343 18,973,128 (15,584,353) (3,748,537) (359,762) 1,615,479 (961,237) 654,242 (283,388) 11,092 Amounts end of the period 03/31/2018 Ohter post- BD and CV plans CD plans employment Total benefit Recognized Pension plan Recognized Recognized Net assets Actuarial liabilities Asset ceiling Asset ceiling Liabilities amount fund amount amount Amounts at the beginning of the period 17,588,377 (14,490,542) (3,217,361) (119,526) 1,633,690 (911,929) 721,761 (256,723) 345,512 Amounts recognized in income (1+2+3) 425,006 (363,538) (80,280) (18,812) 39,304 (22,423) 16,881 (6,218) (8,149) 1 - Cost of current service - (16,606) - (16,606) - - - - (16,606) - - - 2 - Cost of past service - - - - - - (1) 425,006 (346,932) (80,280) (2,206) 39,304 (22,423) 16,881 (6,218) 8,457 3 - Net interest Amounts recognized in stockholders´ equity (4+5+6) (40) (15,109) 7,411 (7,738) (12,328) 10,484 (1,844) - (9,582) 4 - Effects on asset ceiling - - 7,411 7,411 - 10,484 10,484 - 17,895 (2) (3) - (5,459) - (5,459) (12,328) - (12,328) - (17,787) 5 - Remeasurements 6 - Exchange variation (40) (9,650) - (9,690) - - - - (9,690) Other (7+8+9+10) (258,588) 272,987 - 14,399 (20,031) - (20,031) 1,905 (3,727) - - - - - - - - 7 - Receipt by allocation of funds - (272,987) 272,987 - - - - - 1,905 1,905 8 - Benefits paid 9 - Contributions from sponsor 11,580 - - 11,580 (20,031) - (20,031) - (8,451) 10 - Contributions from parcipants 2,819 - 2,819 - - - - 2,819 - 17,754,755 (14,596,202) (3,290,230) (131,677) 1,640,635 (923,868) 716,767 (261,036) 324,054 Amounts end of the period (1) Corresponds to the amount calculated on 01/01/2019 based on the beginning amount (Net Assets, Actuarial Liabilities and Restriction of Assets), taking into account the estimated amount of payments/ receipts of benefits/ contributions, multiplied by the discount rate of 9.72% p.a.(On 01/01/2018 the rate used was 9.98% p.a.); (2) Remeasurements recorded in net assets and asset ceiling correspond to the income earned above/below the expected return rate; (3) The actual return on assets amounted to R$ 442,338 (R$ 425,006 at 03/31/2018). Itaú Unibanco Holding S.A. – Complete Financial Statements – March 31, 2019 145 f) Change in the net amount recognized in the balance sheet: 03/31/2019 Ohter post- BD and CV plans CD plans employment Total benefit Recognized Pension plan Recognized Recognized Net assets Actuarial liabilities Asset ceiling Asset ceiling Liabilities amount fund amount amount Amounts at the beginning of the period 18,808,301 (15,492,982) (3,664,329) (349,010) 1,603,560 (938,290) 665,270 (281,933) 34,327 Amounts recognized in income (1+2+3) 442,338 (378,778) (88,858) (25,298) 37,865 (22,800) 15,065 (6,645) (16,878) - (19,100) - (19,100) - - - - (19,100) 1 - Cost of current service 2 - Cost of past service - - - - - - - - - (1) 442,338 (359,678) (88,858) (6,198) 37,865 (22,800) 15,065 (6,645) 2,222 3 - Net interest Amounts recognized in stockholders´ equity (4+5+6) (2,243) (6,918) 4,650 (4,511) 957 (147) 810 - (3,701) 4 - Effects on asset ceiling - - 4,650 4,650 - (147) (147) - 4,503 (2) (3) 5 - Remeasurements - (8,555) - (8,555) 957 - 957 - (7,598) (2,243) 1,637 (606) - 6 - Exchange variation - - - - (606) (275,268) 294,325 - 19,057 (26,903) - (26,903) 5,190 (2,656) Other (7+8+9+10) 7 - Receipt by allocation of funds - - - - - - - - - 8 - Benefits paid (294,325) 294,325 - - - - - 5,190 5,190 9 - Contributions from sponsor 16,714 - - 16,714 (26,903) - (26,903) - (10,189) 10 - Contributions from parcipants 2,343 - - 2,343 - - - - 2,343 18,973,128 (15,584,353) (3,748,537) (359,762) 1,615,479 (961,237) 654,242 (283,388) 11,092 Amounts end of the period 03/31/2018 Ohter post- BD and CV plans CD plans employment Total benefit Recognized Pension plan Recognized Recognized Net assets Actuarial liabilities Asset ceiling Asset ceiling Liabilities amount fund amount amount Amounts at the beginning of the period 17,588,377 (14,490,542) (3,217,361) (119,526) 1,633,690 (911,929) 721,761 (256,723) 345,512 Amounts recognized in income (1+2+3) 425,006 (363,538) (80,280) (18,812) 39,304 (22,423) 16,881 (6,218) (8,149) 1 - Cost of current service - (16,606) - (16,606) - - - - (16,606) - - - 2 - Cost of past service - - - - - - (1) 425,006 (346,932) (80,280) (2,206) 39,304 (22,423) 16,881 (6,218) 8,457 3 - Net interest Amounts recognized in stockholders´ equity (4+5+6) (40) (15,109) 7,411 (7,738) (12,328) 10,484 (1,844) - (9,582) 4 - Effects on asset ceiling - - 7,411 7,411 - 10,484 10,484 - 17,895 (2) (3) - (5,459) - (5,459) (12,328) - (12,328) - (17,787) 5 - Remeasurements 6 - Exchange variation (40) (9,650) - (9,690) - - - - (9,690) Other (7+8+9+10) (258,588) 272,987 - 14,399 (20,031) - (20,031) 1,905 (3,727) - - - - - - - - 7 - Receipt by allocation of funds - (272,987) 272,987 - - - - - 1,905 1,905 8 - Benefits paid 9 - Contributions from sponsor 11,580 - - 11,580 (20,031) - (20,031) - (8,451) 10 - Contributions from parcipants 2,819 - 2,819 - - - - 2,819 - 17,754,755 (14,596,202) (3,290,230) (131,677) 1,640,635 (923,868) 716,767 (261,036) 324,054 Amounts end of the period (1) Corresponds to the amount calculated on 01/01/2019 based on the beginning amount (Net Assets, Actuarial Liabilities and Restriction of Assets), taking into account the estimated amount of payments/ receipts of benefits/ contributions, multiplied by the discount rate of 9.72% p.a.(On 01/01/2018 the rate used was 9.98% p.a.); (2) Remeasurements recorded in net assets and asset ceiling correspond to the income earned above/below the expected return rate; (3) The actual return on assets amounted to R$ 442,338 (R$ 425,006 at 03/31/2018). Itaú Unibanco Holding S.A. – Complete Financial Statements – March 31, 2019 145
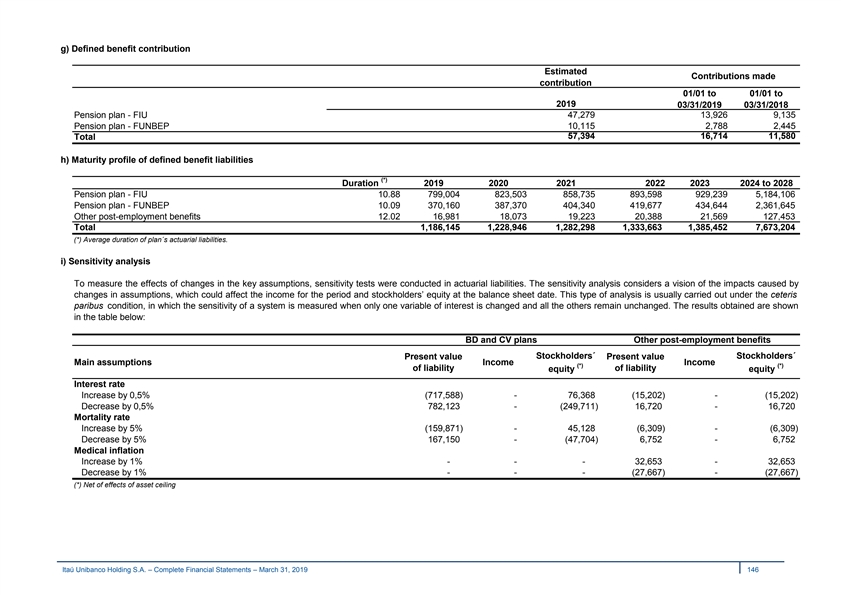
g) Defined benefit contribution Estimated Contributions made contribution 01/01 to 01/01 to 2019 03/31/2019 03/31/2018 Pension plan - FIU 47,279 13,926 9,135 Pension plan - FUNBEP 10,115 2,788 2,445 57,394 16,714 11,580 Total h) Maturity profile of defined benefit liabilities (*) Duration 2019 2020 2021 2022 2023 2024 to 2028 Pension plan - FIU 10.88 799,004 823,503 858,735 893,598 929,239 5,184,106 Pension plan - FUNBEP 10.09 370,160 387,370 404,340 419,677 434,644 2,361,645 Other post-employment benefits 12.02 16,981 18,073 19,223 20,388 21,569 127,453 Total 1,186,145 1,228,946 1,282,298 1,333,663 1,385,452 7,673,204 (*) Average duration of plan´s actuarial liabilities. i) Sensitivity analysis To measure the effects of changes in the key assumptions, sensitivity tests were conducted in actuarial liabilities. The sensitivity analysis considers a vision of the impacts caused by changes in assumptions, which could affect the income for the period and stockholders’ equity at the balance sheet date. This type of analysis is usually carried out under the ceteris paribus condition, in which the sensitivity of a system is measured when only one variable of interest is changed and all the others remain unchanged. The results obtained are shown in the table below: BD and CV plans Other post-employment benefits Present value Stockholders´ Present value Stockholders´ Main assumptions Income Income (*) (*) of liability of liability equity equity Interest rate Increase by 0,5% (717,588) - 76,368 (15,202) - (15,202) Decrease by 0,5% 782,123 - (249,711) 16,720 - 16,720 Mortality rate Increase by 5% (159,871) - 45,128 (6,309) - (6,309) Decrease by 5% 167,150 - (47,704) 6,752 - 6,752 Medical inflation Increase by 1% - - - 32,653 - 32,653 Decrease by 1% - - - (27,667) - (27,667) (*) Net of effects of asset ceiling Itaú Unibanco Holding S.A. – Complete Financial Statements – March 31, 2019 146 g) Defined benefit contribution Estimated Contributions made contribution 01/01 to 01/01 to 2019 03/31/2019 03/31/2018 Pension plan - FIU 47,279 13,926 9,135 Pension plan - FUNBEP 10,115 2,788 2,445 57,394 16,714 11,580 Total h) Maturity profile of defined benefit liabilities (*) Duration 2019 2020 2021 2022 2023 2024 to 2028 Pension plan - FIU 10.88 799,004 823,503 858,735 893,598 929,239 5,184,106 Pension plan - FUNBEP 10.09 370,160 387,370 404,340 419,677 434,644 2,361,645 Other post-employment benefits 12.02 16,981 18,073 19,223 20,388 21,569 127,453 Total 1,186,145 1,228,946 1,282,298 1,333,663 1,385,452 7,673,204 (*) Average duration of plan´s actuarial liabilities. i) Sensitivity analysis To measure the effects of changes in the key assumptions, sensitivity tests were conducted in actuarial liabilities. The sensitivity analysis considers a vision of the impacts caused by changes in assumptions, which could affect the income for the period and stockholders’ equity at the balance sheet date. This type of analysis is usually carried out under the ceteris paribus condition, in which the sensitivity of a system is measured when only one variable of interest is changed and all the others remain unchanged. The results obtained are shown in the table below: BD and CV plans Other post-employment benefits Present value Stockholders´ Present value Stockholders´ Main assumptions Income Income (*) (*) of liability of liability equity equity Interest rate Increase by 0,5% (717,588) - 76,368 (15,202) - (15,202) Decrease by 0,5% 782,123 - (249,711) 16,720 - 16,720 Mortality rate Increase by 5% (159,871) - 45,128 (6,309) - (6,309) Decrease by 5% 167,150 - (47,704) 6,752 - 6,752 Medical inflation Increase by 1% - - - 32,653 - 32,653 Decrease by 1% - - - (27,667) - (27,667) (*) Net of effects of asset ceiling Itaú Unibanco Holding S.A. – Complete Financial Statements – March 31, 2019 146
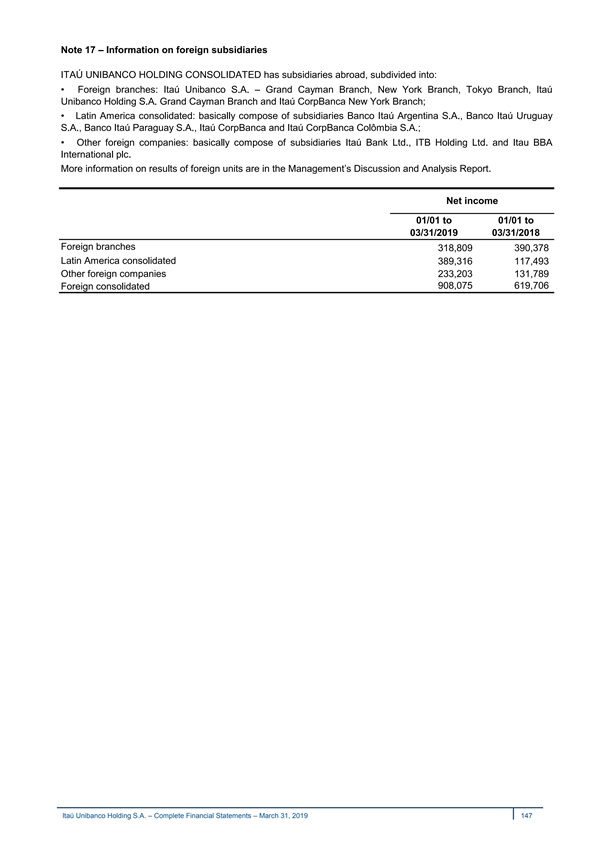
Note 17 – Information on foreign subsidiaries ITAÚ UNIBANCO HOLDING CONSOLIDATED has subsidiaries abroad, subdivided into: • Foreign branches: Itaú Unibanco S.A. – Grand Cayman Branch, New York Branch, Tokyo Branch, Itaú Unibanco Holding S.A. Grand Cayman Branch and Itaú CorpBanca New York Branch; • Latin America consolidated: basically compose of subsidiaries Banco Itaú Argentina S.A., Banco Itaú Uruguay S.A., Banco Itaú Paraguay S.A., Itaú CorpBanca and Itaú CorpBanca Colômbia S.A.; • Other foreign companies: basically compose of subsidiaries Itaú Bank Ltd., ITB Holding Ltd. and Itau BBA International plc. More information on results of foreign units are in the Management’s Discussion and Analysis Report. Net income 01/01 to 01/01 to 03/31/2019 03/31/2018 Foreign branches 318,809 390,378 Latin America consolidated 389,316 117,493 Other foreign companies 233,203 131,789 908,075 619,706 Foreign consolidated Itaú Unibanco Holding S.A. – Complete Financial Statements – March 31, 2019 147 Note 17 – Information on foreign subsidiaries ITAÚ UNIBANCO HOLDING CONSOLIDATED has subsidiaries abroad, subdivided into: • Foreign branches: Itaú Unibanco S.A. – Grand Cayman Branch, New York Branch, Tokyo Branch, Itaú Unibanco Holding S.A. Grand Cayman Branch and Itaú CorpBanca New York Branch; • Latin America consolidated: basically compose of subsidiaries Banco Itaú Argentina S.A., Banco Itaú Uruguay S.A., Banco Itaú Paraguay S.A., Itaú CorpBanca and Itaú CorpBanca Colômbia S.A.; • Other foreign companies: basically compose of subsidiaries Itaú Bank Ltd., ITB Holding Ltd. and Itau BBA International plc. More information on results of foreign units are in the Management’s Discussion and Analysis Report. Net income 01/01 to 01/01 to 03/31/2019 03/31/2018 Foreign branches 318,809 390,378 Latin America consolidated 389,316 117,493 Other foreign companies 233,203 131,789 908,075 619,706 Foreign consolidated Itaú Unibanco Holding S.A. – Complete Financial Statements – March 31, 2019 147
Note 18 – Risk, Capital Management and Fixed Assets Limits a) Corporate Governance ITAÚ UNIBANCO HOLDING CONSOLIDATED invests in sound processes for risk and capital management that permeates the whole institution and are the basis of all strategic decisions to ensure business sustainability. These processes are aligned with the guidelines of the Board of Directors and Executives that, through corporate bodies, define the global objectives that are measured as goals and limits to the risk management units. Control and capital management units, in turn, support the ITAÚ UNIBANCO HOLDING CONSOLIDATED’s management by monitoring and analyzing risk and capital. The Board of Directors is the main body responsible for establishing guidelines, policies, and approval levels for risk and capital management. The Capital and Risk Management Committee (CGRC), in turn, is responsible for supporting the Board of Directors in the performance of its assignments related to capital and risk management. In the executive level, collegiate bodies, presided over by the Chief Executive Officer (CEO) of ITAÚ UNIBANCO HOLDING CONSOLIDATED, are responsible for capital and risk management and which decisions are monitored in the scope of CGRC. Additionally, ITAÚ UNIBANCO HOLDING CONSOLIDATED has panels collegiate bodies, which exercise the responsibilities delegated in capital and risk management, presided over by the Executive Vice-President of the Risk and Finance Department (ARF). To support this structure, ARF has specialized executive boards to ensure, on an independent and centralized basis, that the institution’s risks and capital are managed in compliance with policies and procedures established. b) Risk Management Risk Appetite The risk appetite of ITAÚ UNIBANCO HOLDING CONSOLIDATED is based on the Board of Director’s statement: “We are a universal bank, operating mainly in Latin America. Supported by our risk culture, we act with strict ethical standard and regulatory compliance, in search for high and increasing results, with low volatility, through long-lasting relationship with the client, correct risk pricing, pulverized funding and proper use of capital.” Based on this statement, five dimensions have been established (Capitalization, Liquidity, Composition of results, Operational Risk and Reputation). Each dimension is made up of a set of metrics associated with the main risks involved, combining supplementary measurement methods, in search for a comprehensive vision of our exposures. The Board of Directors is responsible for approving guidelines and limits for risk appetite, exercising its activities with the support of CGRC and CRO - Chief Risk Officer. The limits for risk appetite are frequently monitored and reported to risk committees and to the Board of Directors, which will guide the preventive measures to be taken to ensure that exposures are aligned with the strategies of ITAÚ UNIBANCO HOLDING CONSOLIDATED. Among BACEN’s requirement for proper risk and capital management, noteworthy are the Risk Appetite Statement” (RAS) and the implementation of continuous and integrated risk management structure, the stress test program, the organization of the Risk Committee and nomination, before BACEN, of the Chief Risk Officer (CRO), with assignment of roles, responsibilities and independence requirements. Substantiation for risk appetite, risk management and guidelines for activities of employees of ITAÚ UNIBANCO HOLDING CONSOLIDATED the day-to-day for decision-making purposes are: · Sustainability and client satisfaction: ITAÚ UNIBANCO HOLDING CONSOLIDATED’s vision is to be the leading bank in sustainable performance and client satisfaction and, therefore, it is committed to creating shared value to employees, clients, stockholders, and society, ensuring the continuity of business. ITAÚ UNIBANCO HOLDING CONSOLIDATED’s is committed to do business that is good both for the client and the institution itself; Itaú Unibanco Holding S.A. – Complete Financial Statements – March 31, 2019 148 Note 18 – Risk, Capital Management and Fixed Assets Limits a) Corporate Governance ITAÚ UNIBANCO HOLDING CONSOLIDATED invests in sound processes for risk and capital management that permeates the whole institution and are the basis of all strategic decisions to ensure business sustainability. These processes are aligned with the guidelines of the Board of Directors and Executives that, through corporate bodies, define the global objectives that are measured as goals and limits to the risk management units. Control and capital management units, in turn, support the ITAÚ UNIBANCO HOLDING CONSOLIDATED’s management by monitoring and analyzing risk and capital. The Board of Directors is the main body responsible for establishing guidelines, policies, and approval levels for risk and capital management. The Capital and Risk Management Committee (CGRC), in turn, is responsible for supporting the Board of Directors in the performance of its assignments related to capital and risk management. In the executive level, collegiate bodies, presided over by the Chief Executive Officer (CEO) of ITAÚ UNIBANCO HOLDING CONSOLIDATED, are responsible for capital and risk management and which decisions are monitored in the scope of CGRC. Additionally, ITAÚ UNIBANCO HOLDING CONSOLIDATED has panels collegiate bodies, which exercise the responsibilities delegated in capital and risk management, presided over by the Executive Vice-President of the Risk and Finance Department (ARF). To support this structure, ARF has specialized executive boards to ensure, on an independent and centralized basis, that the institution’s risks and capital are managed in compliance with policies and procedures established. b) Risk Management Risk Appetite The risk appetite of ITAÚ UNIBANCO HOLDING CONSOLIDATED is based on the Board of Director’s statement: “We are a universal bank, operating mainly in Latin America. Supported by our risk culture, we act with strict ethical standard and regulatory compliance, in search for high and increasing results, with low volatility, through long-lasting relationship with the client, correct risk pricing, pulverized funding and proper use of capital.” Based on this statement, five dimensions have been established (Capitalization, Liquidity, Composition of results, Operational Risk and Reputation). Each dimension is made up of a set of metrics associated with the main risks involved, combining supplementary measurement methods, in search for a comprehensive vision of our exposures. The Board of Directors is responsible for approving guidelines and limits for risk appetite, exercising its activities with the support of CGRC and CRO - Chief Risk Officer. The limits for risk appetite are frequently monitored and reported to risk committees and to the Board of Directors, which will guide the preventive measures to be taken to ensure that exposures are aligned with the strategies of ITAÚ UNIBANCO HOLDING CONSOLIDATED. Among BACEN’s requirement for proper risk and capital management, noteworthy are the Risk Appetite Statement” (RAS) and the implementation of continuous and integrated risk management structure, the stress test program, the organization of the Risk Committee and nomination, before BACEN, of the Chief Risk Officer (CRO), with assignment of roles, responsibilities and independence requirements. Substantiation for risk appetite, risk management and guidelines for activities of employees of ITAÚ UNIBANCO HOLDING CONSOLIDATED the day-to-day for decision-making purposes are: · Sustainability and client satisfaction: ITAÚ UNIBANCO HOLDING CONSOLIDATED’s vision is to be the leading bank in sustainable performance and client satisfaction and, therefore, it is committed to creating shared value to employees, clients, stockholders, and society, ensuring the continuity of business. ITAÚ UNIBANCO HOLDING CONSOLIDATED’s is committed to do business that is good both for the client and the institution itself; Itaú Unibanco Holding S.A. – Complete Financial Statements – March 31, 2019 148
· Risk Culture: ITAÚ UNIBANCO HOLDING CONSOLIDATED’s risk culture goes beyond policies, procedures or processes, as it strengthens the individual and collective responsibility of all employees so they do the right thing at the right moment and on the proper way, by respecting the ethical way of doing business; · Risk pricing: ITAÚ UNIBANCO HOLDING CONSOLIDATED’s acts and assumes risks in business it knows and understands, avoiding risks that are unknown to the institution or that do not have a competitive edge, therefore carefully assessing the risk-return ratio; · Diversification: ITAÚ UNIBANCO HOLDING CONSOLIDATED has low appetite to volatility in results and, therefore, it operates with a diversified base of clients, products and business, seeking to diversify risks and giving priority to lower risk business; · Operational excellence: It is the wish of ITAÚ UNIBANCO HOLDING CONSOLIDATED to be an agile bank, with a robust and stable infrastructure to offer top services; · Ethics and respect for regulation: for ITAÚ UNIBANCO HOLDING CONSOLIDATED, ethics is non- negotiable, and, therefore, the institute promotes an institutional environment that has integrity, guiding employees to cultivate ethics in relationships and business, and the respect for rules, as it cultivates the care for the institution’s reputation. ITAÚ UNIBANCO HOLDING CONSOLIDATED adopts several initiatives to disseminate risk culture, based on four principles: conscious risk-taking, discussion of the risks the institution faces, the corresponding action taken, and the responsibility of everyone to manage risks. These principles lay down the basis for ITAÚ UNIBANCO HOLDING CONSOLIDATED’s guidelines by helping employees to consciously understand, identify, measure, manage and mitigate risks. I – Credit risk Possibility of losses arising from the breach by the borrower, issuer or counterparty of the respective agreed- upon financial obligations, the devaluation of loan agreement due to downgrading of the borrower’s, the issuer’s, the counterparty’s risk rating, the reduction in gains or compensation, the advantages given upon posterior renegotiation and the recovery costs. There is a credit risk control and management structure, centralized and independent from the business units, that provides for operational limits and risk mitigating mechanisms, in addition for establishing processes and tools to measure, monitor and control the credit risk inherent in all products, portfolio concentrations and the impacts from potential changes in the economic environment. The credit policy of ITAÚ UNIBANCO HOLDING CONSOLIDATED is based on internal criteria such as: classification of clients, performance and portfolio evolution, default levels, return rate and economic capital allocated, among other external factors, such as: interest rates, market default indicators, inflation, consumption variation, among others. In compliance with CMN Resolution 4,557, of February 2017, 23, the document “Public Access Report – Credit Risk“, which includes the guidelines established by the institutional credit risk control policy can be viewed at www.itau.com.br/investor-relations, under Itaú Unibanco, Corporate Governance, Regulations and Policies. II - Market risk Possibility of incurring financial losses arising from the changes in the market value of positions held by a financial institution, including the risks of transactions subject to foreign exchange variation, interest rates, share prices, price indexes and commodity prices. ITAÚ UNIBANCO HOLDING CONSOLIDATED’s market risk management strategy is aimed at balancing corporate business goals, taking into account, among other things: political, economic and market conditions; portfolio profile of ITAÚ UNIBANCO HOLDING CONSOLIDATED and expertise within the group to support operations in specific markets. The market risk is controlled by an area independent from the business areas, which is responsible for the daily activities of: (i) risk measurement and assessment, (ii) monitoring of stress scenarios, limits and warnings, (iii) application, analysis and tests of stress scenarios, (iv) risk reporting for individuals responsible within the business areas, in compliance with governance of ITAÚ UNIBANCO HOLDING CONSOLIDATED, (v) monitoring of actions required for adjustment of positions and/or risk levels to make them feasible, and (vi) support to the launch of new financial products with security. Itaú Unibanco Holding S.A. – Complete Financial Statements – March 31, 2019 149 · Risk Culture: ITAÚ UNIBANCO HOLDING CONSOLIDATED’s risk culture goes beyond policies, procedures or processes, as it strengthens the individual and collective responsibility of all employees so they do the right thing at the right moment and on the proper way, by respecting the ethical way of doing business; · Risk pricing: ITAÚ UNIBANCO HOLDING CONSOLIDATED’s acts and assumes risks in business it knows and understands, avoiding risks that are unknown to the institution or that do not have a competitive edge, therefore carefully assessing the risk-return ratio; · Diversification: ITAÚ UNIBANCO HOLDING CONSOLIDATED has low appetite to volatility in results and, therefore, it operates with a diversified base of clients, products and business, seeking to diversify risks and giving priority to lower risk business; · Operational excellence: It is the wish of ITAÚ UNIBANCO HOLDING CONSOLIDATED to be an agile bank, with a robust and stable infrastructure to offer top services; · Ethics and respect for regulation: for ITAÚ UNIBANCO HOLDING CONSOLIDATED, ethics is non- negotiable, and, therefore, the institute promotes an institutional environment that has integrity, guiding employees to cultivate ethics in relationships and business, and the respect for rules, as it cultivates the care for the institution’s reputation. ITAÚ UNIBANCO HOLDING CONSOLIDATED adopts several initiatives to disseminate risk culture, based on four principles: conscious risk-taking, discussion of the risks the institution faces, the corresponding action taken, and the responsibility of everyone to manage risks. These principles lay down the basis for ITAÚ UNIBANCO HOLDING CONSOLIDATED’s guidelines by helping employees to consciously understand, identify, measure, manage and mitigate risks. I – Credit risk Possibility of losses arising from the breach by the borrower, issuer or counterparty of the respective agreed- upon financial obligations, the devaluation of loan agreement due to downgrading of the borrower’s, the issuer’s, the counterparty’s risk rating, the reduction in gains or compensation, the advantages given upon posterior renegotiation and the recovery costs. There is a credit risk control and management structure, centralized and independent from the business units, that provides for operational limits and risk mitigating mechanisms, in addition for establishing processes and tools to measure, monitor and control the credit risk inherent in all products, portfolio concentrations and the impacts from potential changes in the economic environment. The credit policy of ITAÚ UNIBANCO HOLDING CONSOLIDATED is based on internal criteria such as: classification of clients, performance and portfolio evolution, default levels, return rate and economic capital allocated, among other external factors, such as: interest rates, market default indicators, inflation, consumption variation, among others. In compliance with CMN Resolution 4,557, of February 2017, 23, the document “Public Access Report – Credit Risk“, which includes the guidelines established by the institutional credit risk control policy can be viewed at www.itau.com.br/investor-relations, under Itaú Unibanco, Corporate Governance, Regulations and Policies. II - Market risk Possibility of incurring financial losses arising from the changes in the market value of positions held by a financial institution, including the risks of transactions subject to foreign exchange variation, interest rates, share prices, price indexes and commodity prices. ITAÚ UNIBANCO HOLDING CONSOLIDATED’s market risk management strategy is aimed at balancing corporate business goals, taking into account, among other things: political, economic and market conditions; portfolio profile of ITAÚ UNIBANCO HOLDING CONSOLIDATED and expertise within the group to support operations in specific markets. The market risk is controlled by an area independent from the business areas, which is responsible for the daily activities of: (i) risk measurement and assessment, (ii) monitoring of stress scenarios, limits and warnings, (iii) application, analysis and tests of stress scenarios, (iv) risk reporting for individuals responsible within the business areas, in compliance with governance of ITAÚ UNIBANCO HOLDING CONSOLIDATED, (v) monitoring of actions required for adjustment of positions and/or risk levels to make them feasible, and (vi) support to the launch of new financial products with security. Itaú Unibanco Holding S.A. – Complete Financial Statements – March 31, 2019 149
The National Monetary Council (CMN) has regulations that establish the segregation of exposure to market risk at least in the following categories: interest rate, exchange rate, shares and commodities. Brazilian inflation indexes are treated as a group of risk indicators and receive the same treatment given to other risk indicators. The structure of limits and warnings is in line with the Board of Directors’ guidelines, and it is reviewed and approved on an annual basis. This structure has specific limits aiming at improving the risk monitoring and understanding process, and at avoiding concentration. These limits are quantified by assessing the forecasted results of the balance sheet, size of stockholders’ equity, liquidity, market complexity and volatility, as well as the institution’s appetite for risk. In order to set up operations within the defined limits, ITAÚ UNIBANCO HOLDING CONSOLIDATED hedges transactions with clients and proprietary positions, including its foreign investments. Derivatives are commonly used for these hedging activities, and can be characterized as accounting or economic hedge, both governed by the institutional polices of ITAÚ UNIBANCO HOLDING CONSOLIDATED (Note 5 - Securities and derivative financial instruments). The market risk structure categorizes transactions as part of either the banking portfolio or the trading portfolio, in accordance with general criteria established by CMN Resolution nº. 4,557, of February 2017, 23, and BACEN Circular nº. 3,354, of June 2007, 27. The trading portfolio consists of all transactions involving financial instruments and goods, including derivatives, which are carried out with the intention of trading. The banking portfolio is basically characterized by transactions from the banking business, and transactions related to the management of the balance sheet of the institution, it has the no-intention of resale and medium and long term time horizons as general guidelines. Market risk management analyses is conducted based on the following metrics: · Value at risk (VaR): statistical measure that estimates the expected maximum potential economic loss under normal market conditions, considering a certain time horizon and confidence level; · Losses in stress scenarios: simulation technique to assess the behavior of assets, liabilities and derivatives of a portfolio when several risk factors are taken to extreme market situations (based on prospective and historical scenarios); · Stop loss: metrics which purpose is to review positions, should losses accumulated in a certain period reach a certain amount; · Concentration: cumulative exposure of a certain financial instrument or risk factor, calculated at market value (“MtM – Mark to Market”); and · Stressed VaR: statistical metric arising from VaR calculation, which purpose is to capture higher risk in simulations for the trading portfolio, considering returns that can be seen in historical scenarios of extreme volatility. Management of interest rate risk in the Banking Book (IRRBB) is performed based on the following metrics: · ΔEVE: difference between the present value of sum of repricing flows instruments subject to IRRBB in a base scenario and present value of sum of repricing flows of these instruments in a scenario of shock in interest rates; · ΔNII: difference between the result of financial intermediation of instruments subject to IRRBB in a base scenario and the result of financial intermediation of these instruments in a scenario of shock in interest rates. In addition to the aforementioned risk measures, sensitivity and loss control measures are also analyzed. They comprise: · Mismatching analysis (GAPS): accumulated exposure by risk factor of cash flows expressed at market value, allocated at the maturity dates; · Sensitivity (DV01- Delta Variation): impact on the market value of cash flows, when submitted to an one annual basis point increase in the current interest rates or index rate; · Sensitivity to several risk factors (Greeks): partial derivatives of an option portfolio in relation to the prices of underlying assets, implied volatilities, interest rates and time. ITAÚ UNIBANCO HOLDING CONSOLIDATED uses proprietary systems to measure the consolidated market risk. The processing of these systems occurs in an access-controlled environment, being highly available, which has data safekeeping and recovery processes and counts on such an infrastructure to ensure the continuity of business in contingency (disaster recovery) situations. Itaú Unibanco Holding S.A. – Complete Financial Statements – March 31, 2019 150 The National Monetary Council (CMN) has regulations that establish the segregation of exposure to market risk at least in the following categories: interest rate, exchange rate, shares and commodities. Brazilian inflation indexes are treated as a group of risk indicators and receive the same treatment given to other risk indicators. The structure of limits and warnings is in line with the Board of Directors’ guidelines, and it is reviewed and approved on an annual basis. This structure has specific limits aiming at improving the risk monitoring and understanding process, and at avoiding concentration. These limits are quantified by assessing the forecasted results of the balance sheet, size of stockholders’ equity, liquidity, market complexity and volatility, as well as the institution’s appetite for risk. In order to set up operations within the defined limits, ITAÚ UNIBANCO HOLDING CONSOLIDATED hedges transactions with clients and proprietary positions, including its foreign investments. Derivatives are commonly used for these hedging activities, and can be characterized as accounting or economic hedge, both governed by the institutional polices of ITAÚ UNIBANCO HOLDING CONSOLIDATED (Note 5 - Securities and derivative financial instruments). The market risk structure categorizes transactions as part of either the banking portfolio or the trading portfolio, in accordance with general criteria established by CMN Resolution nº. 4,557, of February 2017, 23, and BACEN Circular nº. 3,354, of June 2007, 27. The trading portfolio consists of all transactions involving financial instruments and goods, including derivatives, which are carried out with the intention of trading. The banking portfolio is basically characterized by transactions from the banking business, and transactions related to the management of the balance sheet of the institution, it has the no-intention of resale and medium and long term time horizons as general guidelines. Market risk management analyses is conducted based on the following metrics: · Value at risk (VaR): statistical measure that estimates the expected maximum potential economic loss under normal market conditions, considering a certain time horizon and confidence level; · Losses in stress scenarios: simulation technique to assess the behavior of assets, liabilities and derivatives of a portfolio when several risk factors are taken to extreme market situations (based on prospective and historical scenarios); · Stop loss: metrics which purpose is to review positions, should losses accumulated in a certain period reach a certain amount; · Concentration: cumulative exposure of a certain financial instrument or risk factor, calculated at market value (“MtM – Mark to Market”); and · Stressed VaR: statistical metric arising from VaR calculation, which purpose is to capture higher risk in simulations for the trading portfolio, considering returns that can be seen in historical scenarios of extreme volatility. Management of interest rate risk in the Banking Book (IRRBB) is performed based on the following metrics: · ΔEVE: difference between the present value of sum of repricing flows instruments subject to IRRBB in a base scenario and present value of sum of repricing flows of these instruments in a scenario of shock in interest rates; · ΔNII: difference between the result of financial intermediation of instruments subject to IRRBB in a base scenario and the result of financial intermediation of these instruments in a scenario of shock in interest rates. In addition to the aforementioned risk measures, sensitivity and loss control measures are also analyzed. They comprise: · Mismatching analysis (GAPS): accumulated exposure by risk factor of cash flows expressed at market value, allocated at the maturity dates; · Sensitivity (DV01- Delta Variation): impact on the market value of cash flows, when submitted to an one annual basis point increase in the current interest rates or index rate; · Sensitivity to several risk factors (Greeks): partial derivatives of an option portfolio in relation to the prices of underlying assets, implied volatilities, interest rates and time. ITAÚ UNIBANCO HOLDING CONSOLIDATED uses proprietary systems to measure the consolidated market risk. The processing of these systems occurs in an access-controlled environment, being highly available, which has data safekeeping and recovery processes and counts on such an infrastructure to ensure the continuity of business in contingency (disaster recovery) situations. Itaú Unibanco Holding S.A. – Complete Financial Statements – March 31, 2019 150
As of March 31, 2019, ITAÚ UNIBANCO HOLDING CONSOLIDATED presented a Total VaR of R$ 373.6 million, without significant changes in relation to the same period of the previous year (R$ 383.9 million at March 31, 2018). The document “Public Access Report – Market Risk“, which includes the guidelines established by the institutional credit risk control policy, which is not an integral part of the financial statements, can be viewed at www.itau.com.br/investor-relations, under Itaú Unibanco, Corporate Governance, Regulations and Policies. III – Liquidity risk The institution’s possibility of not being able to efficiently meet its expected and unexpected obligations, both current and future, including those arising from the pledged guarantees, without affecting its daily operations and without incurring significant losses. The control over liquidity risk is carried out by an area independent from the business area and responsible for establishing the reserve composition, estimating the cash flow and exposure to liquidity risk in different horizons of time, and monitoring the minimum limits to absorb losses in stress scenarios for each country where ITAÚ UNIBANCO HOLDING CONSOLIDATED operates. All activities are subject to verification by the independent validation, internal control and audit areas. The document Public Access Report - Liquidity Risk, that expresses the guidelines set forth by the internal policy on liquidity risk, that is not part of the financial statements, may be viewed on the website www.itau.com.br/investor-relations, in the section Itaú Unibanco, Corporate Governance, Rules and Policies. IV – Operational risk The possibility of losses from failure of, insufficient or inadequate internal processes, people and systems, or from external events impacting the realization of strategic, tactical or operational objectives. It includes the legal risk, associated with the inadequacy or deficiency in agreements signed by the institution, as well as sanctions for failing to meet legal provisions and compensation for damages to third parties arising from activities performed by the institution. The managers of executive areas adopt corporate methodologies developed and made available by the internal controls, compliance and operational risk area. As part of governance of risk management process, consolidated reports on risk monitoring, controls, action plans and operating losses are periodically presented to the business areas’ executives. In line with the principles of CMN Resolution No. 4,557, of February 2017, 23, the document entitled “Public Access Report – Integrated Management of Operational Risk/ Internal Controls/ Compliance“, a summarized version of the institutional operational risk management policy, may be accessed on the website www.itau.com.br/investor-relations, section Itaú Unibanco, “Corporate Governance”, Rules and Policies. Itaú Unibanco Holding S.A. – Complete Financial Statements – March 31, 2019 151 As of March 31, 2019, ITAÚ UNIBANCO HOLDING CONSOLIDATED presented a Total VaR of R$ 373.6 million, without significant changes in relation to the same period of the previous year (R$ 383.9 million at March 31, 2018). The document “Public Access Report – Market Risk“, which includes the guidelines established by the institutional credit risk control policy, which is not an integral part of the financial statements, can be viewed at www.itau.com.br/investor-relations, under Itaú Unibanco, Corporate Governance, Regulations and Policies. III – Liquidity risk The institution’s possibility of not being able to efficiently meet its expected and unexpected obligations, both current and future, including those arising from the pledged guarantees, without affecting its daily operations and without incurring significant losses. The control over liquidity risk is carried out by an area independent from the business area and responsible for establishing the reserve composition, estimating the cash flow and exposure to liquidity risk in different horizons of time, and monitoring the minimum limits to absorb losses in stress scenarios for each country where ITAÚ UNIBANCO HOLDING CONSOLIDATED operates. All activities are subject to verification by the independent validation, internal control and audit areas. The document Public Access Report - Liquidity Risk, that expresses the guidelines set forth by the internal policy on liquidity risk, that is not part of the financial statements, may be viewed on the website www.itau.com.br/investor-relations, in the section Itaú Unibanco, Corporate Governance, Rules and Policies. IV – Operational risk The possibility of losses from failure of, insufficient or inadequate internal processes, people and systems, or from external events impacting the realization of strategic, tactical or operational objectives. It includes the legal risk, associated with the inadequacy or deficiency in agreements signed by the institution, as well as sanctions for failing to meet legal provisions and compensation for damages to third parties arising from activities performed by the institution. The managers of executive areas adopt corporate methodologies developed and made available by the internal controls, compliance and operational risk area. As part of governance of risk management process, consolidated reports on risk monitoring, controls, action plans and operating losses are periodically presented to the business areas’ executives. In line with the principles of CMN Resolution No. 4,557, of February 2017, 23, the document entitled “Public Access Report – Integrated Management of Operational Risk/ Internal Controls/ Compliance“, a summarized version of the institutional operational risk management policy, may be accessed on the website www.itau.com.br/investor-relations, section Itaú Unibanco, “Corporate Governance”, Rules and Policies. Itaú Unibanco Holding S.A. – Complete Financial Statements – March 31, 2019 151
V - Insurance, private pension and capitalization risks The main risk related to Insurance, Private Pension and Capitalization portfolios are described below and their definitions are presented in their respective chapters. · Underwriting risk: possibility of losses arising from insurance, pension plan and capitalization operations contrary to the institution’s expectations of ITAÚ UNIBANCO HOLDING CONSOLIDATED, directly or indirectly associated with technical and actuarial bases adopted to calculate premiums, contributions and provisions; · Credit risk; · Market risk; · Liquidity risk; · Operational risk. The management process of these risks is independent and focused on the specifics of each risk. VI - Social and environmental risk Risk of potential losses due to exposure to social and environmental damages arising from the performance of its activities. The social and environmental risk management is carried out by the first line of defense in its daily operations, with the technical assessment of the legal and risk areas, which have a technical dedicated team. Business units also have governance for approval of new products, which includes the assessment of the social and environmental risk, therefore ensuring compliance with this requirement for all new products approved by the institution. Governance still has the Social and Environmental Risk Committee, which main duty is to guide the institutional understanding related to exposure to social and environmental risk for the institution’s activities. Mitigation actions concerning the social and environmental risk are carried out by mapping processes, risks and controls, monitoring new regulations on the subject, and recording any occurrences in internal databases. In addition to identification, the phases of prioritization, response, monitoring and reporting of assessed risks supplement this risk monitoring at ITAÚ UNIBANCO HOLDING CONSOLIDATED. Further details on the Social and environmental risk, which is not an integral part of the financial statements, can be viewed at www.itau.com.br/investor-relations, under “Reports” / Pillar 3 and Global Systemically Important Banks / Risk and Capital Management Report. Itaú Unibanco Holding S.A. – Complete Financial Statements – March 31, 2019 152 V - Insurance, private pension and capitalization risks The main risk related to Insurance, Private Pension and Capitalization portfolios are described below and their definitions are presented in their respective chapters. · Underwriting risk: possibility of losses arising from insurance, pension plan and capitalization operations contrary to the institution’s expectations of ITAÚ UNIBANCO HOLDING CONSOLIDATED, directly or indirectly associated with technical and actuarial bases adopted to calculate premiums, contributions and provisions; · Credit risk; · Market risk; · Liquidity risk; · Operational risk. The management process of these risks is independent and focused on the specifics of each risk. VI - Social and environmental risk Risk of potential losses due to exposure to social and environmental damages arising from the performance of its activities. The social and environmental risk management is carried out by the first line of defense in its daily operations, with the technical assessment of the legal and risk areas, which have a technical dedicated team. Business units also have governance for approval of new products, which includes the assessment of the social and environmental risk, therefore ensuring compliance with this requirement for all new products approved by the institution. Governance still has the Social and Environmental Risk Committee, which main duty is to guide the institutional understanding related to exposure to social and environmental risk for the institution’s activities. Mitigation actions concerning the social and environmental risk are carried out by mapping processes, risks and controls, monitoring new regulations on the subject, and recording any occurrences in internal databases. In addition to identification, the phases of prioritization, response, monitoring and reporting of assessed risks supplement this risk monitoring at ITAÚ UNIBANCO HOLDING CONSOLIDATED. Further details on the Social and environmental risk, which is not an integral part of the financial statements, can be viewed at www.itau.com.br/investor-relations, under “Reports” / Pillar 3 and Global Systemically Important Banks / Risk and Capital Management Report. Itaú Unibanco Holding S.A. – Complete Financial Statements – March 31, 2019 152
c) Capital management governance ITAÚ UNIBANCO HOLDING CONSOLIDATED is subject to the requirements of BACEN, which determines minimum capital requirements, procedures to assess information on globally systemic important banks (G-SIB), fixed asset limits, loan limits, accounting practices and require banks to conform to the regulation based on the Basel Accord for capital adequacy purposes. Additionally, the CNSP and SUSEP issue regulations on capital requirements that impact our insurance operations, and private pension and capitalization plans. The capital statements were prepared in accordance with BACEN’s regulatory requirements and with internationally accepted minimum requirements according to the Bank for International Settlements (BIS). I - Composition of capital The Referential Equity (PR) used to monitor the compliance with the operational limits imposed by BACEN is the sum of three items, namely: · Common Equity Tier I: the sum of capital, reserves and retained earnings, less deductions and prudential adjustments. · Additional Tier I Capital: consists of instruments of a perpetual nature, which meet eligibility requirements. Together with Common Equity Tier I it makes up Tier I; · Tier II: consists of subordinated debt instruments with defined maturity dates that meet eligibility requirements. Together with the Common Equity Tier I and the Additional Tier I Capital, it makes up the Total Capital. Composition of Referential Equity 03/31/2019 03/31/2018 Stockholders’ equity attributable to controlling interests 119,824,289 118,511,228 Non-controlling interests 12,427,480 12,155,210 Change in interest in subsidiaries in a capital transaction 71,025 1,145,733 Consolidated stockholders’ equity (BACEN) 132,322,794 131,812,171 Common Equity Tier I prudential adjustments (23,166,416) (21,476,500) Common Equity Tier I 109,156,378 110,335,671 Instruments Eligible to comprise Additional Tier I 10,868,258 - Additional Tier I Prudential Adjustments 99,590 74,791 Additional Tier I Capital 10,967,848 74,791 Tier I (Common Equity Tier I + Additional Tier I Capital) 120,124,226 110,410,462 Instruments Eligible to comprise Tier II 11,833,538 15,778,051 Tier II Prudential Adjustments 98,572 89,710 Tier II 11,932,110 15,867,761 Referential Equity (Tier I + Tier II) 132,056,336 126,278,223 Itaú Unibanco Holding S.A. – Complete Financial Statements – March 31, 2019 153 c) Capital management governance ITAÚ UNIBANCO HOLDING CONSOLIDATED is subject to the requirements of BACEN, which determines minimum capital requirements, procedures to assess information on globally systemic important banks (G-SIB), fixed asset limits, loan limits, accounting practices and require banks to conform to the regulation based on the Basel Accord for capital adequacy purposes. Additionally, the CNSP and SUSEP issue regulations on capital requirements that impact our insurance operations, and private pension and capitalization plans. The capital statements were prepared in accordance with BACEN’s regulatory requirements and with internationally accepted minimum requirements according to the Bank for International Settlements (BIS). I - Composition of capital The Referential Equity (PR) used to monitor the compliance with the operational limits imposed by BACEN is the sum of three items, namely: · Common Equity Tier I: the sum of capital, reserves and retained earnings, less deductions and prudential adjustments. · Additional Tier I Capital: consists of instruments of a perpetual nature, which meet eligibility requirements. Together with Common Equity Tier I it makes up Tier I; · Tier II: consists of subordinated debt instruments with defined maturity dates that meet eligibility requirements. Together with the Common Equity Tier I and the Additional Tier I Capital, it makes up the Total Capital. Composition of Referential Equity 03/31/2019 03/31/2018 Stockholders’ equity attributable to controlling interests 119,824,289 118,511,228 Non-controlling interests 12,427,480 12,155,210 Change in interest in subsidiaries in a capital transaction 71,025 1,145,733 Consolidated stockholders’ equity (BACEN) 132,322,794 131,812,171 Common Equity Tier I prudential adjustments (23,166,416) (21,476,500) Common Equity Tier I 109,156,378 110,335,671 Instruments Eligible to comprise Additional Tier I 10,868,258 - Additional Tier I Prudential Adjustments 99,590 74,791 Additional Tier I Capital 10,967,848 74,791 Tier I (Common Equity Tier I + Additional Tier I Capital) 120,124,226 110,410,462 Instruments Eligible to comprise Tier II 11,833,538 15,778,051 Tier II Prudential Adjustments 98,572 89,710 Tier II 11,932,110 15,867,761 Referential Equity (Tier I + Tier II) 132,056,336 126,278,223 Itaú Unibanco Holding S.A. – Complete Financial Statements – March 31, 2019 153
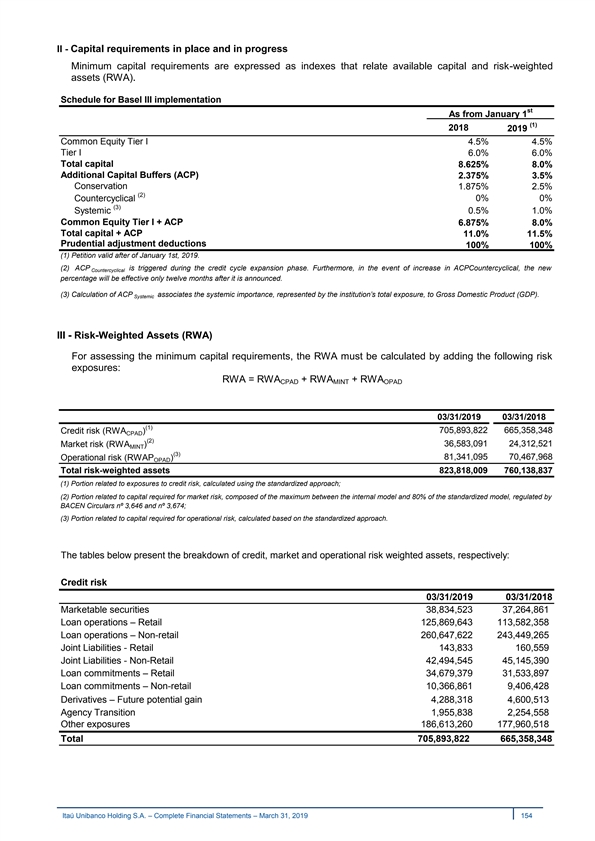
II - Capital requirements in place and in progress Minimum capital requirements are expressed as indexes that relate available capital and risk-weighted assets (RWA). Schedule for Basel III implementation st As from January 1 (1) 2018 2019 Common Equity Tier I 4.5% 4.5% Tier I 6.0% 6.0% Total capital 8.625% 8.0% Additional Capital Buffers (ACP) 2.375% 3.5% Conservation 1.875% 2.5% (2) Countercyclical 0% 0% (3) Systemic 0.5% 1.0% Common Equity Tier I + ACP 6.875% 8.0% Total capital + ACP 11.0% 11.5% Prudential adjustment deductions 100% 100% (1) Petition valid after of January 1st, 2019. (2) ACP is triggered during the credit cycle expansion phase. Furthermore, in the event of increase in ACPCountercyclical, the new Countercyclical percentage will be effective only twelve months after it is announced. (3) Calculation of ACP associates the systemic importance, represented by the institution’s total exposure, to Gross Domestic Product (GDP). Systemic III - Risk-Weighted Assets (RWA) For assessing the minimum capital requirements, the RWA must be calculated by adding the following risk exposures: RWA = RWA + RWA + RWA CPAD MINT OPAD 03/31/2019 03/31/2018 (1) Credit risk (RWA ) 705,893,822 665,358,348 CPAD (2) 36,583,091 24,312,521 Market risk (RWA ) MINT (3) 81,341,095 70,467,968 Operational risk (RWAP ) OPAD Total risk-weighted assets 823,818,009 760,138,837 (1) Portion related to exposures to credit risk, calculated using the standardized approach; (2) Portion related to capital required for market risk, composed of the maximum between the internal model and 80% of the standardized model, regulated by BACEN Circulars nº 3,646 and nº 3,674; (3) Portion related to capital required for operational risk, calculated based on the standardized approach. The tables below present the breakdown of credit, market and operational risk weighted assets, respectively: Credit risk 03/31/2019 03/31/2018 Marketable securities 38,834,523 37,264,861 Loan operations – Retail 125,869,643 113,582,358 Loan operations – Non-retail 260,647,622 243,449,265 Joint Liabilities - Retail 143,833 160,559 Joint Liabilities - Non-Retail 42,494,545 45,145,390 Loan commitments – Retail 34,679,379 31,533,897 Loan commitments – Non-retail 10,366,861 9,406,428 Derivatives – Future potential gain 4,288,318 4,600,513 Agency Transition 1,955,838 2,254,558 Other exposures 186,613,260 177,960,518 Total 705,893,822 665,358,348 Itaú Unibanco Holding S.A. – Complete Financial Statements – March 31, 2019 154 II - Capital requirements in place and in progress Minimum capital requirements are expressed as indexes that relate available capital and risk-weighted assets (RWA). Schedule for Basel III implementation st As from January 1 (1) 2018 2019 Common Equity Tier I 4.5% 4.5% Tier I 6.0% 6.0% Total capital 8.625% 8.0% Additional Capital Buffers (ACP) 2.375% 3.5% Conservation 1.875% 2.5% (2) Countercyclical 0% 0% (3) Systemic 0.5% 1.0% Common Equity Tier I + ACP 6.875% 8.0% Total capital + ACP 11.0% 11.5% Prudential adjustment deductions 100% 100% (1) Petition valid after of January 1st, 2019. (2) ACP is triggered during the credit cycle expansion phase. Furthermore, in the event of increase in ACPCountercyclical, the new Countercyclical percentage will be effective only twelve months after it is announced. (3) Calculation of ACP associates the systemic importance, represented by the institution’s total exposure, to Gross Domestic Product (GDP). Systemic III - Risk-Weighted Assets (RWA) For assessing the minimum capital requirements, the RWA must be calculated by adding the following risk exposures: RWA = RWA + RWA + RWA CPAD MINT OPAD 03/31/2019 03/31/2018 (1) Credit risk (RWA ) 705,893,822 665,358,348 CPAD (2) 36,583,091 24,312,521 Market risk (RWA ) MINT (3) 81,341,095 70,467,968 Operational risk (RWAP ) OPAD Total risk-weighted assets 823,818,009 760,138,837 (1) Portion related to exposures to credit risk, calculated using the standardized approach; (2) Portion related to capital required for market risk, composed of the maximum between the internal model and 80% of the standardized model, regulated by BACEN Circulars nº 3,646 and nº 3,674; (3) Portion related to capital required for operational risk, calculated based on the standardized approach. The tables below present the breakdown of credit, market and operational risk weighted assets, respectively: Credit risk 03/31/2019 03/31/2018 Marketable securities 38,834,523 37,264,861 Loan operations – Retail 125,869,643 113,582,358 Loan operations – Non-retail 260,647,622 243,449,265 Joint Liabilities - Retail 143,833 160,559 Joint Liabilities - Non-Retail 42,494,545 45,145,390 Loan commitments – Retail 34,679,379 31,533,897 Loan commitments – Non-retail 10,366,861 9,406,428 Derivatives – Future potential gain 4,288,318 4,600,513 Agency Transition 1,955,838 2,254,558 Other exposures 186,613,260 177,960,518 Total 705,893,822 665,358,348 Itaú Unibanco Holding S.A. – Complete Financial Statements – March 31, 2019 154
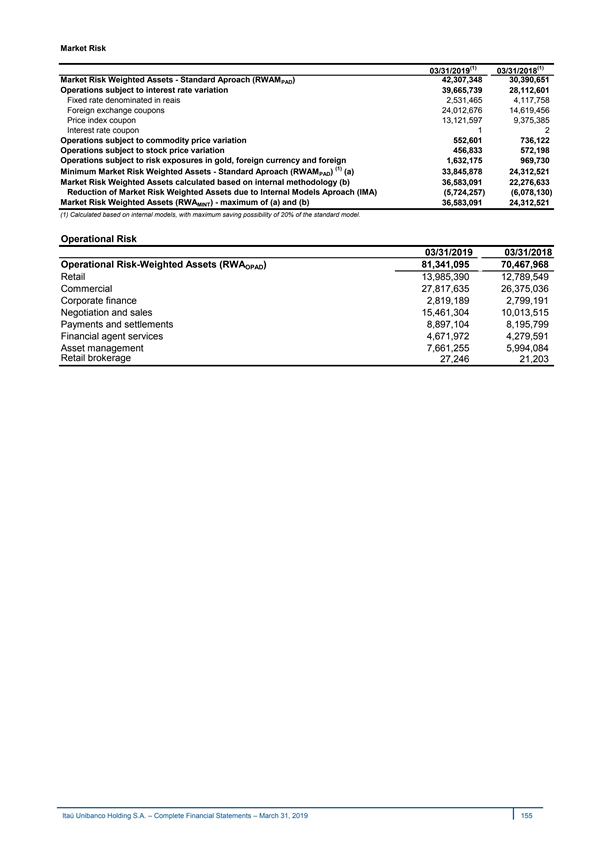
Market Risk (1) (1) 03/31/2019 03/31/2018 Market Risk Weighted Assets - Standard Aproach (RWAM ) 42,307,348 30,390,651 PAD Operations subject to interest rate variation 39,665,739 28,112,601 Fixed rate denominated in reais 2,531,465 4,117,758 Foreign exchange coupons 24,012,676 14,619,456 Price index coupon 13,121,597 9,375,385 Interest rate coupon 1 2 Operations subject to commodity price variation 552,601 736,122 Operations subject to stock price variation 456,833 572,198 Operations subject to risk exposures in gold, foreign currency and foreign 1,632,175 969,730 (1) Minimum Market Risk Weighted Assets - Standard Aproach (RWAM ) (a) 33,845,878 24,312,521 PAD Market Risk Weighted Assets calculated based on internal methodology (b) 36,583,091 22,276,633 Reduction of Market Risk Weighted Assets due to Internal Models Aproach (IMA) ( 5,724,257) ( 6,078,130) Market Risk Weighted Assets (RWA ) - maximum of (a) and (b) 36,583,091 24,312,521 MINT (1) Calculated based on internal models, with maximum saving possibility of 20% of the standard model. Operational Risk 03/31/2019 03/31/2018 Operational Risk-Weighted Assets (RWA ) 81,341,095 70,467,968 OPAD Retail 13,985,390 12,789,549 Commercial 27,817,635 26,375,036 Corporate finance 2,819,189 2,799,191 Negotiation and sales 15,461,304 10,013,515 Payments and settlements 8,897,104 8,195,799 Financial agent services 4,671,972 4,279,591 Asset management 7,661,255 5,994,084 Retail brokerage 27,246 21,203 Itaú Unibanco Holding S.A. – Complete Financial Statements – March 31, 2019 155 Market Risk (1) (1) 03/31/2019 03/31/2018 Market Risk Weighted Assets - Standard Aproach (RWAM ) 42,307,348 30,390,651 PAD Operations subject to interest rate variation 39,665,739 28,112,601 Fixed rate denominated in reais 2,531,465 4,117,758 Foreign exchange coupons 24,012,676 14,619,456 Price index coupon 13,121,597 9,375,385 Interest rate coupon 1 2 Operations subject to commodity price variation 552,601 736,122 Operations subject to stock price variation 456,833 572,198 Operations subject to risk exposures in gold, foreign currency and foreign 1,632,175 969,730 (1) Minimum Market Risk Weighted Assets - Standard Aproach (RWAM ) (a) 33,845,878 24,312,521 PAD Market Risk Weighted Assets calculated based on internal methodology (b) 36,583,091 22,276,633 Reduction of Market Risk Weighted Assets due to Internal Models Aproach (IMA) ( 5,724,257) ( 6,078,130) Market Risk Weighted Assets (RWA ) - maximum of (a) and (b) 36,583,091 24,312,521 MINT (1) Calculated based on internal models, with maximum saving possibility of 20% of the standard model. Operational Risk 03/31/2019 03/31/2018 Operational Risk-Weighted Assets (RWA ) 81,341,095 70,467,968 OPAD Retail 13,985,390 12,789,549 Commercial 27,817,635 26,375,036 Corporate finance 2,819,189 2,799,191 Negotiation and sales 15,461,304 10,013,515 Payments and settlements 8,897,104 8,195,799 Financial agent services 4,671,972 4,279,591 Asset management 7,661,255 5,994,084 Retail brokerage 27,246 21,203 Itaú Unibanco Holding S.A. – Complete Financial Statements – March 31, 2019 155
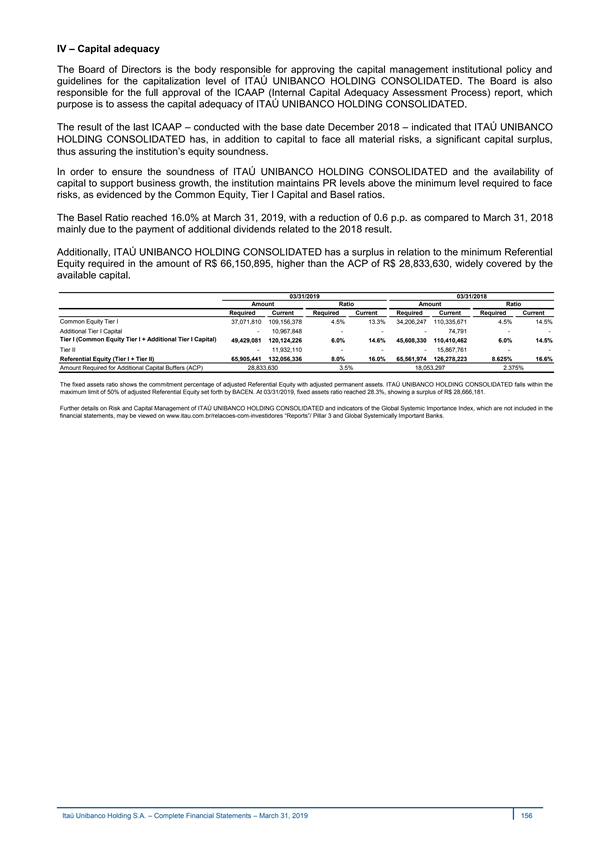
IV – Capital adequacy The Board of Directors is the body responsible for approving the capital management institutional policy and guidelines for the capitalization level of ITAÚ UNIBANCO HOLDING CONSOLIDATED. The Board is also responsible for the full approval of the ICAAP (Internal Capital Adequacy Assessment Process) report, which purpose is to assess the capital adequacy of ITAÚ UNIBANCO HOLDING CONSOLIDATED. The result of the last ICAAP – conducted with the base date December 2018 – indicated that ITAÚ UNIBANCO HOLDING CONSOLIDATED has, in addition to capital to face all material risks, a significant capital surplus, thus assuring the institution’s equity soundness. In order to ensure the soundness of ITAÚ UNIBANCO HOLDING CONSOLIDATED and the availability of capital to support business growth, the institution maintains PR levels above the minimum level required to face risks, as evidenced by the Common Equity, Tier I Capital and Basel ratios. The Basel Ratio reached 16.0% at March 31, 2019, with a reduction of 0.6 p.p. as compared to March 31, 2018 mainly due to the payment of additional dividends related to the 2018 result. Additionally, ITAÚ UNIBANCO HOLDING CONSOLIDATED has a surplus in relation to the minimum Referential Equity required in the amount of R$ 66,150,895, higher than the ACP of R$ 28,833,630, widely covered by the available capital. 03/31/2019 03/31/2018 Amount Ratio Amount Ratio Required Current Required Current Required Current Required Current Common Equity Tier I 37,071,810 109,156,378 4.5% 13.3% 34,206,247 110,335,671 4.5% 14.5% Additional Tier I Capital - 10,967,848 - - - 74,791 - - Tier I (Common Equity Tier I + Additional Tier I Capital) 49,429,081 120,124,226 6.0% 14.6% 45,608,330 110,410,462 6.0% 14.5% Tier II - 11,932,110 - - - 15,867,761 - - Referential Equity (Tier I + Tier II) 65,905,441 132,056,336 8.0% 16.0% 65,561,974 126,278,223 8.625% 16.6% Amount Required for Additional Capital Buffers (ACP) 28,833,630 3.5% 18,053,297 2.375% The fixed assets ratio shows the commitment percentage of adjusted Referential Equity with adjusted permanent assets. ITAÚ UNIBANCO HOLDING CONSOLIDATED falls within the maximum limit of 50% of adjusted Referential Equity set forth by BACEN. At 03/31/2019, fixed assets ratio reached 28.3%, showing a surplus of R$ 28,666,181. Further details on Risk and Capital Management of ITAÚ UNIBANCO HOLDING CONSOLIDATED and indicators of the Global Systemic Importance Index, which are not included in the financial statements, may be viewed on www.itau.com.br/relacoes-com-investidores “Reports”/ Pillar 3 and Global Systemically Important Banks. Itaú Unibanco Holding S.A. – Complete Financial Statements – March 31, 2019 156 IV – Capital adequacy The Board of Directors is the body responsible for approving the capital management institutional policy and guidelines for the capitalization level of ITAÚ UNIBANCO HOLDING CONSOLIDATED. The Board is also responsible for the full approval of the ICAAP (Internal Capital Adequacy Assessment Process) report, which purpose is to assess the capital adequacy of ITAÚ UNIBANCO HOLDING CONSOLIDATED. The result of the last ICAAP – conducted with the base date December 2018 – indicated that ITAÚ UNIBANCO HOLDING CONSOLIDATED has, in addition to capital to face all material risks, a significant capital surplus, thus assuring the institution’s equity soundness. In order to ensure the soundness of ITAÚ UNIBANCO HOLDING CONSOLIDATED and the availability of capital to support business growth, the institution maintains PR levels above the minimum level required to face risks, as evidenced by the Common Equity, Tier I Capital and Basel ratios. The Basel Ratio reached 16.0% at March 31, 2019, with a reduction of 0.6 p.p. as compared to March 31, 2018 mainly due to the payment of additional dividends related to the 2018 result. Additionally, ITAÚ UNIBANCO HOLDING CONSOLIDATED has a surplus in relation to the minimum Referential Equity required in the amount of R$ 66,150,895, higher than the ACP of R$ 28,833,630, widely covered by the available capital. 03/31/2019 03/31/2018 Amount Ratio Amount Ratio Required Current Required Current Required Current Required Current Common Equity Tier I 37,071,810 109,156,378 4.5% 13.3% 34,206,247 110,335,671 4.5% 14.5% Additional Tier I Capital - 10,967,848 - - - 74,791 - - Tier I (Common Equity Tier I + Additional Tier I Capital) 49,429,081 120,124,226 6.0% 14.6% 45,608,330 110,410,462 6.0% 14.5% Tier II - 11,932,110 - - - 15,867,761 - - Referential Equity (Tier I + Tier II) 65,905,441 132,056,336 8.0% 16.0% 65,561,974 126,278,223 8.625% 16.6% Amount Required for Additional Capital Buffers (ACP) 28,833,630 3.5% 18,053,297 2.375% The fixed assets ratio shows the commitment percentage of adjusted Referential Equity with adjusted permanent assets. ITAÚ UNIBANCO HOLDING CONSOLIDATED falls within the maximum limit of 50% of adjusted Referential Equity set forth by BACEN. At 03/31/2019, fixed assets ratio reached 28.3%, showing a surplus of R$ 28,666,181. Further details on Risk and Capital Management of ITAÚ UNIBANCO HOLDING CONSOLIDATED and indicators of the Global Systemic Importance Index, which are not included in the financial statements, may be viewed on www.itau.com.br/relacoes-com-investidores “Reports”/ Pillar 3 and Global Systemically Important Banks. Itaú Unibanco Holding S.A. – Complete Financial Statements – March 31, 2019 156
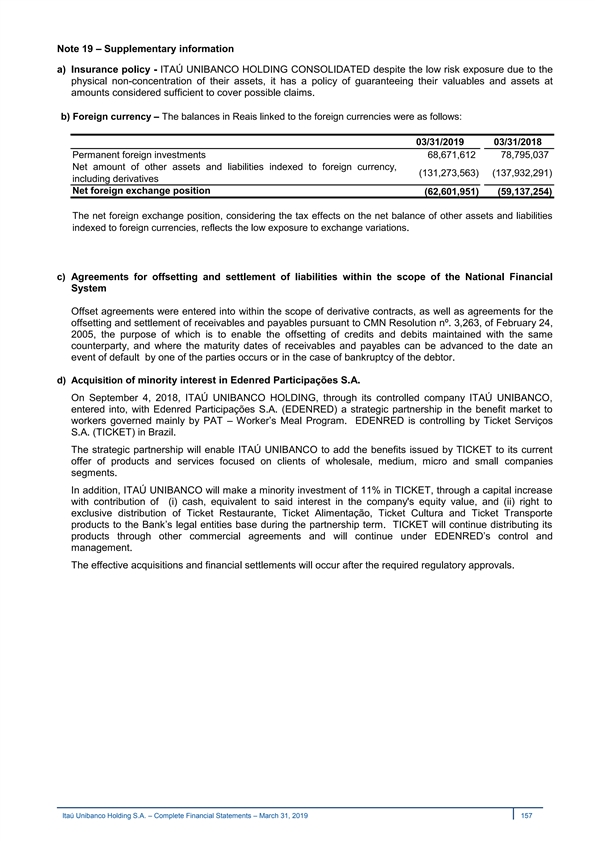
Note 19 – Supplementary information a) Insurance policy - ITAÚ UNIBANCO HOLDING CONSOLIDATED despite the low risk exposure due to the physical non-concentration of their assets, it has a policy of guaranteeing their valuables and assets at amounts considered sufficient to cover possible claims. b) Foreign currency – The balances in Reais linked to the foreign currencies were as follows: 03/31/2019 03/31/2018 Permanent foreign investments 68,671,612 78,795,037 Net amount of other assets and liabilities indexed to foreign currency, (131,273,563) (137,932,291) including derivatives Net foreign exchange position (62,601,951) (59,137,254) The net foreign exchange position, considering the tax effects on the net balance of other assets and liabilities indexed to foreign currencies, reflects the low exposure to exchange variations. c) Agreements for offsetting and settlement of liabilities within the scope of the National Financial System Offset agreements were entered into within the scope of derivative contracts, as well as agreements for the offsetting and settlement of receivables and payables pursuant to CMN Resolution nº. 3,263, of February 24, 2005, the purpose of which is to enable the offsetting of credits and debits maintained with the same counterparty, and where the maturity dates of receivables and payables can be advanced to the date an event of default by one of the parties occurs or in the case of bankruptcy of the debtor. d) Acquisition of minority interest in Edenred Participações S.A. On September 4, 2018, ITAÚ UNIBANCO HOLDING, through its controlled company ITAÚ UNIBANCO, entered into, with Edenred Participações S.A. (EDENRED) a strategic partnership in the benefit market to workers governed mainly by PAT – Worker’s Meal Program. EDENRED is controlling by Ticket Serviços S.A. (TICKET) in Brazil. The strategic partnership will enable ITAÚ UNIBANCO to add the benefits issued by TICKET to its current offer of products and services focused on clients of wholesale, medium, micro and small companies segments. In addition, ITAÚ UNIBANCO will make a minority investment of 11% in TICKET, through a capital increase with contribution of (i) cash, equivalent to said interest in the company's equity value, and (ii) right to exclusive distribution of Ticket Restaurante, Ticket Alimentação, Ticket Cultura and Ticket Transporte products to the Bank’s legal entities base during the partnership term. TICKET will continue distributing its products through other commercial agreements and will continue under EDENRED’s control and management. The effective acquisitions and financial settlements will occur after the required regulatory approvals. Itaú Unibanco Holding S.A. – Complete Financial Statements – March 31, 2019 157 Note 19 – Supplementary information a) Insurance policy - ITAÚ UNIBANCO HOLDING CONSOLIDATED despite the low risk exposure due to the physical non-concentration of their assets, it has a policy of guaranteeing their valuables and assets at amounts considered sufficient to cover possible claims. b) Foreign currency – The balances in Reais linked to the foreign currencies were as follows: 03/31/2019 03/31/2018 Permanent foreign investments 68,671,612 78,795,037 Net amount of other assets and liabilities indexed to foreign currency, (131,273,563) (137,932,291) including derivatives Net foreign exchange position (62,601,951) (59,137,254) The net foreign exchange position, considering the tax effects on the net balance of other assets and liabilities indexed to foreign currencies, reflects the low exposure to exchange variations. c) Agreements for offsetting and settlement of liabilities within the scope of the National Financial System Offset agreements were entered into within the scope of derivative contracts, as well as agreements for the offsetting and settlement of receivables and payables pursuant to CMN Resolution nº. 3,263, of February 24, 2005, the purpose of which is to enable the offsetting of credits and debits maintained with the same counterparty, and where the maturity dates of receivables and payables can be advanced to the date an event of default by one of the parties occurs or in the case of bankruptcy of the debtor. d) Acquisition of minority interest in Edenred Participações S.A. On September 4, 2018, ITAÚ UNIBANCO HOLDING, through its controlled company ITAÚ UNIBANCO, entered into, with Edenred Participações S.A. (EDENRED) a strategic partnership in the benefit market to workers governed mainly by PAT – Worker’s Meal Program. EDENRED is controlling by Ticket Serviços S.A. (TICKET) in Brazil. The strategic partnership will enable ITAÚ UNIBANCO to add the benefits issued by TICKET to its current offer of products and services focused on clients of wholesale, medium, micro and small companies segments. In addition, ITAÚ UNIBANCO will make a minority investment of 11% in TICKET, through a capital increase with contribution of (i) cash, equivalent to said interest in the company's equity value, and (ii) right to exclusive distribution of Ticket Restaurante, Ticket Alimentação, Ticket Cultura and Ticket Transporte products to the Bank’s legal entities base during the partnership term. TICKET will continue distributing its products through other commercial agreements and will continue under EDENRED’s control and management. The effective acquisitions and financial settlements will occur after the required regulatory approvals. Itaú Unibanco Holding S.A. – Complete Financial Statements – March 31, 2019 157
Report on review of financial statements To the Board of Directors and Stockholders Itaú Unibanco Holding S.A. Introduction We have reviewed the accompanying parent company financial statements of Itaú Unibanco Holding S.A. (“Bank”), which comprise the balance sheet as at March 31, 2019 and the related statements of income, changes in stockholders´ equity and cash flows for the three-month period then ended, as well as the accompanying consolidated financial statements of Itaú Unibanco Holding S.A. and its subsidiaries (“Consolidated”), which comprise the consolidated balance sheet as at March 31, 2019 and the related consolidated statements of income and cash flows for the three-month period then ended, and a summary of significant accounting policies and other explanatory information. Management is responsible for the preparation and fair presentation of these financial statements in accordance with accounting practices adopted in Brazil, applicable to institutions authorized to operate by the Brazilian Central Bank. Our responsibility is to express a conclusion on these financial statements based on our review. Scope of review We conducted our review in accordance with Brazilian and International Standards on Reviews of Interim Financial Information (NBC TR 2410 - Review of Interim Financial Information Performed by the Independent Auditor of the Entity and ISRE 2410 - Review of Interim Financial Information Performed by the Independent Auditor of the Entity , respectively). A review of interim information consists of making inquiries, primarily of persons responsible for financial and accounting matters, and applying analytical and other review procedures. A review is substantially less in scope than an audit conducted in accordance with Brazilian and International Standards on Auditing and consequently does not enable us to obtain assurance that we would become aware of all significant matters that might be identified in an audit. Accordingly, we do not express an audit opinion. Conclusion on the parent and consolidated financial statements Based on our review, nothing has come to our attention that causes us to believe that the parent company and the consolidated financial statements referred to above do not present fairly, in all material respects, the financial position of Itaú Unibanco Holding S.A. and Itaú Unibanco Holding S.A. and its subsidiaries as at March 31, 2019 and the parent financial performance and cash flows for the three-month period then ended, as well as the consolidated financial performance and the consolidated cash flows, for the three-month period then ended, in accordance with accounting practices adopted in Brazil, applicable to institutions authorized to operate by the Brazilian Central Bank. Itaú Unibanco Holding S.A. – Complete Financial Statements – March 31, 2019 158 Report on review of financial statements To the Board of Directors and Stockholders Itaú Unibanco Holding S.A. Introduction We have reviewed the accompanying parent company financial statements of Itaú Unibanco Holding S.A. (“Bank”), which comprise the balance sheet as at March 31, 2019 and the related statements of income, changes in stockholders´ equity and cash flows for the three-month period then ended, as well as the accompanying consolidated financial statements of Itaú Unibanco Holding S.A. and its subsidiaries (“Consolidated”), which comprise the consolidated balance sheet as at March 31, 2019 and the related consolidated statements of income and cash flows for the three-month period then ended, and a summary of significant accounting policies and other explanatory information. Management is responsible for the preparation and fair presentation of these financial statements in accordance with accounting practices adopted in Brazil, applicable to institutions authorized to operate by the Brazilian Central Bank. Our responsibility is to express a conclusion on these financial statements based on our review. Scope of review We conducted our review in accordance with Brazilian and International Standards on Reviews of Interim Financial Information (NBC TR 2410 - Review of Interim Financial Information Performed by the Independent Auditor of the Entity and ISRE 2410 - Review of Interim Financial Information Performed by the Independent Auditor of the Entity , respectively). A review of interim information consists of making inquiries, primarily of persons responsible for financial and accounting matters, and applying analytical and other review procedures. A review is substantially less in scope than an audit conducted in accordance with Brazilian and International Standards on Auditing and consequently does not enable us to obtain assurance that we would become aware of all significant matters that might be identified in an audit. Accordingly, we do not express an audit opinion. Conclusion on the parent and consolidated financial statements Based on our review, nothing has come to our attention that causes us to believe that the parent company and the consolidated financial statements referred to above do not present fairly, in all material respects, the financial position of Itaú Unibanco Holding S.A. and Itaú Unibanco Holding S.A. and its subsidiaries as at March 31, 2019 and the parent financial performance and cash flows for the three-month period then ended, as well as the consolidated financial performance and the consolidated cash flows, for the three-month period then ended, in accordance with accounting practices adopted in Brazil, applicable to institutions authorized to operate by the Brazilian Central Bank. Itaú Unibanco Holding S.A. – Complete Financial Statements – March 31, 2019 158
Other matters Statements of added value We have also reviewed the parent company and consolidated statements of added value for the three-month period ended March 31, 2019, prepared under the responsibility of the Bank's management and presented as supplementary information. These statements have been submitted to the same review procedures described above and, based on our review, nothing has come to our attention that causes us to believe that they are not properly prepared, in all material respects, in relation to the financial statements taken as a whole. São Paulo, May 2, 2019 PricewaterhouseCoopers Auditores Independentes CRC 2SP000160/O-5 Emerson Laerte da Silva Contador CRC 1SP171089/O-3 Itaú Unibanco Holding S.A. – Complete Financial Statements – March 31, 2019 159 Other matters Statements of added value We have also reviewed the parent company and consolidated statements of added value for the three-month period ended March 31, 2019, prepared under the responsibility of the Bank's management and presented as supplementary information. These statements have been submitted to the same review procedures described above and, based on our review, nothing has come to our attention that causes us to believe that they are not properly prepared, in all material respects, in relation to the financial statements taken as a whole. São Paulo, May 2, 2019 PricewaterhouseCoopers Auditores Independentes CRC 2SP000160/O-5 Emerson Laerte da Silva Contador CRC 1SP171089/O-3 Itaú Unibanco Holding S.A. – Complete Financial Statements – March 31, 2019 159
ITAÚ UNIBANCO HOLDING S.A. CNPJ. 60.872.504/0001-23 Listed Company NIRE. 35300010230 OPINION OF THE FISCAL COUNCIL The effective members of the Fiscal Council of ITAÚ UNIBANCO HOLDING S.A., after having examined the financial statements for the period from January to March 2019 and verified the accuracy of all items examined, and in view of the unqualified opinion of PricewaterhouseCoopers Auditores Independentes, understand that these documents adequately reflect the company’s capital structure, financial position and the activities conducted during the period, and they have the conditions to be submitted to the appreciation and approval of the Stockholders. São Paulo (SP), May 02, 2019. JOSÉ CARUSO CRUZ HENRIQUES President ALKIMAR RIBEIRO MOURA CARLOS ROBERTO DE ALBUQUERQUE SÁ Member Member Itaú Unibanco Holding S.A. – Complete Financial Statements – March 31, 2019 160 ITAÚ UNIBANCO HOLDING S.A. CNPJ. 60.872.504/0001-23 Listed Company NIRE. 35300010230 OPINION OF THE FISCAL COUNCIL The effective members of the Fiscal Council of ITAÚ UNIBANCO HOLDING S.A., after having examined the financial statements for the period from January to March 2019 and verified the accuracy of all items examined, and in view of the unqualified opinion of PricewaterhouseCoopers Auditores Independentes, understand that these documents adequately reflect the company’s capital structure, financial position and the activities conducted during the period, and they have the conditions to be submitted to the appreciation and approval of the Stockholders. São Paulo (SP), May 02, 2019. JOSÉ CARUSO CRUZ HENRIQUES President ALKIMAR RIBEIRO MOURA CARLOS ROBERTO DE ALBUQUERQUE SÁ Member Member Itaú Unibanco Holding S.A. – Complete Financial Statements – March 31, 2019 160
ITAÚ UNIBANCO HOLDING S.A. CNPJ 60.872.504/0001-23 A Publicly Listed Company NIRE 35300010230 DECLARATION The Officers responsible for the preparation of the financial statements, in compliance with the provisions in Article 29, paragraph 1, item II, and Article 25, paragraph 1, items V and VI, of Instruction No. 480/2009 of the Brazilian Securities and Exchange Commission (CVM), declare that they: a) read, discussed e agree with the opinions expressed in the independent auditor’s report on the Company’s financial statements for the period from January to March 2019; b) read, discussed and agree with the Company’s financial statements for the period from January to March 2019 and with the Management Discussion and Analysis (MD&A) Report. São Paulo (SP), May 2, 2019. MILTON MALUHY FILHO ALEXSANDRO BROEDEL LOPES Vice President Executive Director Itaú Unibanco Holding S.A. – Complete Financial Statements – March 31, 2019 161 ITAÚ UNIBANCO HOLDING S.A. CNPJ 60.872.504/0001-23 A Publicly Listed Company NIRE 35300010230 DECLARATION The Officers responsible for the preparation of the financial statements, in compliance with the provisions in Article 29, paragraph 1, item II, and Article 25, paragraph 1, items V and VI, of Instruction No. 480/2009 of the Brazilian Securities and Exchange Commission (CVM), declare that they: a) read, discussed e agree with the opinions expressed in the independent auditor’s report on the Company’s financial statements for the period from January to March 2019; b) read, discussed and agree with the Company’s financial statements for the period from January to March 2019 and with the Management Discussion and Analysis (MD&A) Report. São Paulo (SP), May 2, 2019. MILTON MALUHY FILHO ALEXSANDRO BROEDEL LOPES Vice President Executive Director Itaú Unibanco Holding S.A. – Complete Financial Statements – March 31, 2019 161