
Exhibit 99.1 ITAÚ UNIBANCO HOLDING S.A. CNPJ 60.872.504/0001-23 A Publicly-Listed Company NIRE 35300010230 ANNOUNCEMENT TO THE MARKET Itaú Unibanco Holding S.A. st 1 Quarter 2019 Result Itaú Unibanco Holding S.A. (“Company”) announces to its stockholders and the market at large that the Complete Financial Statements for the year ended March 31, 2019 and the st Management Discussion & Analysis for the 1 quarter of 2019 are already available on the Company’s Investor Relations website (www.itau.com.br/investor-relations). Additionally, we forward the information described below: st • Institutional Presentation of the 1 quarter of 2019 (Attachment 01); • Presentation to be used at the conference call with the press on the quarterly result, to be held on May 3, 2019 at 8:30 am (Brasília official time) (Attachment 02); • Press release (Attachment 03); • Presentation to be used at public conference calls on the quarterly result, to be held on May 3, Thursday, in English at 10:00 am (Brasília official time) and in Portuguese at 11:30 pm (Brasília official time) (Attachment 04). The expectations presented are based on information available up to the moment and involve risks, uncertainties, and assumptions that may be beyond our control. These disclosures strengthen our commitment to transparency in our disclosures to the many strategic audiences we have. São Paulo ‐ SP, May 2, 2019. Alexsandro Broedel Group Executive Finance Director and Head of Investor Relations Exhibit 99.1 ITAÚ UNIBANCO HOLDING S.A. CNPJ 60.872.504/0001-23 A Publicly-Listed Company NIRE 35300010230 ANNOUNCEMENT TO THE MARKET Itaú Unibanco Holding S.A. st 1 Quarter 2019 Result Itaú Unibanco Holding S.A. (“Company”) announces to its stockholders and the market at large that the Complete Financial Statements for the year ended March 31, 2019 and the st Management Discussion & Analysis for the 1 quarter of 2019 are already available on the Company’s Investor Relations website (www.itau.com.br/investor-relations). Additionally, we forward the information described below: st • Institutional Presentation of the 1 quarter of 2019 (Attachment 01); • Presentation to be used at the conference call with the press on the quarterly result, to be held on May 3, 2019 at 8:30 am (Brasília official time) (Attachment 02); • Press release (Attachment 03); • Presentation to be used at public conference calls on the quarterly result, to be held on May 3, Thursday, in English at 10:00 am (Brasília official time) and in Portuguese at 11:30 pm (Brasília official time) (Attachment 04). The expectations presented are based on information available up to the moment and involve risks, uncertainties, and assumptions that may be beyond our control. These disclosures strengthen our commitment to transparency in our disclosures to the many strategic audiences we have. São Paulo ‐ SP, May 2, 2019. Alexsandro Broedel Group Executive Finance Director and Head of Investor Relations

Attachment 01 Attachment 01

1Q19 Institutional Information1Q19 Institutional Information

1Q19 This presentation contains forward-looking statements regarding Itaú Unibanco Holding, its subsidiaries and affiliates - anticipated synergies, growth plans, projected results and future strategies. Although these forward-looking statements reflect management’s good faith beliefs, they involve known and unknown risks and uncertainties that may cause the Company’s actual results or outcomes to be materially different from those anticipated and discussed herein. These statements are not guarantees of future performance. These risks and uncertainties include, but are not limited to our ability to realize the amount of the projected synergies and the timetable projected, as well as economic, competitive, governmental and technological factors affecting Itaú Unibanco Holding’s operations, markets, products and prices, and other factors detailed in Itaú Unibanco Holding’s filings with the Securities and Exchange Commission which readers are urged to read carefully in assessing the forward-looking statements contained herein. Itaú Unibanco Holding undertakes in duty to update any of the projections contained herein. This presentation contains managerial numbers that may be different from those presented in our financial statements. The calculation methodology for those managerial numbers is presented in Itaú Unibanco Holding’s quarterly earnings report. To obtain further information on factors that may give rise to results different from those forecast by Itaú Unibanco Holding, please consult the reports filed with the Brazilian Securities and Exchange Commission (Comissão de Valores Mobiliários - CVM) and with the U.S. Securities and Exchange Commission (SEC), including Itaú Unibanco Holding’s most recent Annual Report on Form 20F.1Q19 This presentation contains forward-looking statements regarding Itaú Unibanco Holding, its subsidiaries and affiliates - anticipated synergies, growth plans, projected results and future strategies. Although these forward-looking statements reflect management’s good faith beliefs, they involve known and unknown risks and uncertainties that may cause the Company’s actual results or outcomes to be materially different from those anticipated and discussed herein. These statements are not guarantees of future performance. These risks and uncertainties include, but are not limited to our ability to realize the amount of the projected synergies and the timetable projected, as well as economic, competitive, governmental and technological factors affecting Itaú Unibanco Holding’s operations, markets, products and prices, and other factors detailed in Itaú Unibanco Holding’s filings with the Securities and Exchange Commission which readers are urged to read carefully in assessing the forward-looking statements contained herein. Itaú Unibanco Holding undertakes in duty to update any of the projections contained herein. This presentation contains managerial numbers that may be different from those presented in our financial statements. The calculation methodology for those managerial numbers is presented in Itaú Unibanco Holding’s quarterly earnings report. To obtain further information on factors that may give rise to results different from those forecast by Itaú Unibanco Holding, please consult the reports filed with the Brazilian Securities and Exchange Commission (Comissão de Valores Mobiliários - CVM) and with the U.S. Securities and Exchange Commission (SEC), including Itaú Unibanco Holding’s most recent Annual Report on Form 20F.
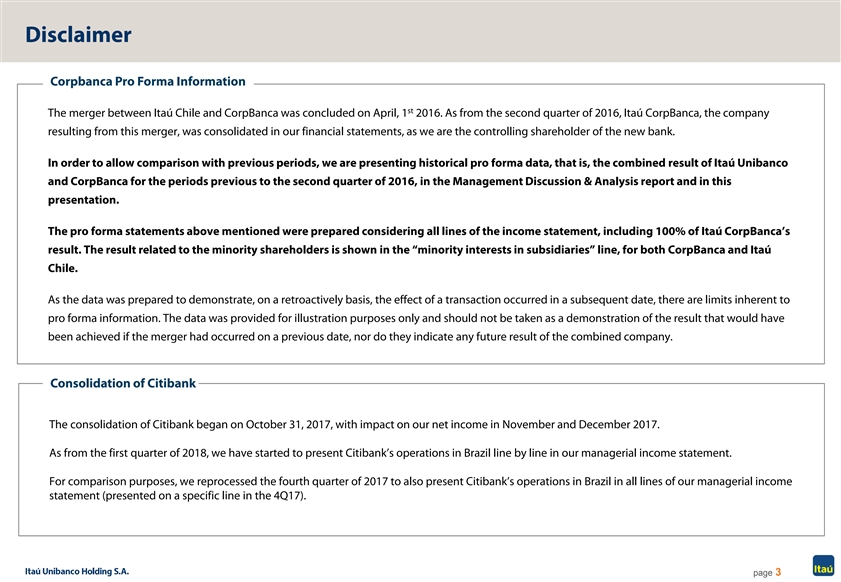
Disclaimer Corpbanca Pro Forma Information st The merger between Itaú Chile and CorpBanca was concluded on April, 1 2016. As from the second quarter of 2016, Itaú CorpBanca, the company resulting from this merger, was consolidated in our financial statements, as we are the controlling shareholder of the new bank. In order to allow comparison with previous periods, we are presenting historical pro forma data, that is, the combined result of Itaú Unibanco and CorpBanca for the periods previous to the second quarter of 2016, in the Management Discussion & Analysis report and in this presentation. The pro forma statements above mentioned were prepared considering all lines of the income statement, including 100% of Itaú CorpBanca’s result. The result related to the minority shareholders is shown in the “minority interests in subsidiaries” line, for both CorpBanca and Itaú Chile. As the data was prepared to demonstrate, on a retroactively basis, the effect of a transaction occurred in a subsequent date, there are limits inherent to pro forma information. The data was provided for illustration purposes only and should not be taken as a demonstration of the result that would have been achieved if the merger had occurred on a previous date, nor do they indicate any future result of the combined company. Consolidation of Citibank The consolidation of Citibank began on October 31, 2017, with impact on our net income in November and December 2017. As from the first quarter of 2018, we have started to present Citibank’s operations in Brazil line by line in our managerial income statement. For comparison purposes, we reprocessed the fourth quarter of 2017 to also present Citibank’s operations in Brazil in all lines of our managerial income statement (presented on a specific line in the 4Q17). page 3Disclaimer Corpbanca Pro Forma Information st The merger between Itaú Chile and CorpBanca was concluded on April, 1 2016. As from the second quarter of 2016, Itaú CorpBanca, the company resulting from this merger, was consolidated in our financial statements, as we are the controlling shareholder of the new bank. In order to allow comparison with previous periods, we are presenting historical pro forma data, that is, the combined result of Itaú Unibanco and CorpBanca for the periods previous to the second quarter of 2016, in the Management Discussion & Analysis report and in this presentation. The pro forma statements above mentioned were prepared considering all lines of the income statement, including 100% of Itaú CorpBanca’s result. The result related to the minority shareholders is shown in the “minority interests in subsidiaries” line, for both CorpBanca and Itaú Chile. As the data was prepared to demonstrate, on a retroactively basis, the effect of a transaction occurred in a subsequent date, there are limits inherent to pro forma information. The data was provided for illustration purposes only and should not be taken as a demonstration of the result that would have been achieved if the merger had occurred on a previous date, nor do they indicate any future result of the combined company. Consolidation of Citibank The consolidation of Citibank began on October 31, 2017, with impact on our net income in November and December 2017. As from the first quarter of 2018, we have started to present Citibank’s operations in Brazil line by line in our managerial income statement. For comparison purposes, we reprocessed the fourth quarter of 2017 to also present Citibank’s operations in Brazil in all lines of our managerial income statement (presented on a specific line in the 4Q17). page 3

Agenda 1. Our Profile 2. Corporate Governance 3. Business Overview 4. Financial Highlights 5. Information Technology 6. Itaú Unibanco in Capital Markets 7. Sustainability As of May 02, 2019Agenda 1. Our Profile 2. Corporate Governance 3. Business Overview 4. Financial Highlights 5. Information Technology 6. Itaú Unibanco in Capital Markets 7. Sustainability As of May 02, 2019

Our Profile 1Our Profile 1

Itaú Unibanco at a Glance Financial Highlights and Ratios Leading position in Brazil As of and for the quarter ended March 2019 (1) § US$85.8 billion market cap Highlights § 99,661 employees in Brazil and abroad Total Assets R$1651.4 Bi § 4,934 branches and CSBs in Brazil and abroad (1) Total Loans R$647.1 Bi 47,953 ATMs in Brazil and abroad § Stockholders’ Equity R$119.8 Bi (2) § Around 50.4 million clients in the Retail Bank in Feb/19 R$25.7 Bi Recurring Net Income 2018 (3) R$6.9 Bi Recurring Net Income 1Q19 § Brazilian multinational bank Long Term Foreign Currency Moody´s: Ba3 § Major provider of finance for the expansion of Brazilian companies (Itaú Unibanco Holding) Fitch: BB In 2017 Itaú Unibanco was elected the The Best Company in People Management (by “Valor § S&P: BB- Carreira” magazine) and also recognized as a pro-ethics company (Pró-Ética), an initiative Financial Ratios (2) between the Office of the Comptroller General with the private sector, which encourages the voluntary adoption of integrity measures and corruption prevention in the business sector, (4) Recurring ROE 2018 21.9% being the only financial institution among the companies approved. (5) Global Footprint of Brazil’s Top Private Sector Bank | as of March 31, 2019 Recurring ROE 1Q19 23.6% (6) Efficiency Ratio 2018 47.6% (6) Efficiency Ratio 1Q19 46.3% Liquidity Coverage Ratio 164% (7) Tier I Capital - BIS III 14.6% (1) Includes financial guarantees provided and corporate securities. (2) Represents Net Income adjusted for certain non recurring events described in the 4Q18 MD&A – Executive Summary. (3) Represents Net Income adjusted for certain non recurring events described in the 1Q19 MD&A – Executive Summary. (4) Calculated using Recurring Net Income / Average Equity. For annualized calculation method, please refer to Historical Series Spreadsheet. (5) Calculated using Recurring Net Income / Average Equity. For annualized calculation method, please refer to the 1Q19 MD&A – Executive Summary. (6) See “Efficiency Ratio” slides in this presentation for criteria. (7) Includes impacts from schedule anticipation of deductions and does not consider the additional dividend and interest on own capital. (1) As of March 31, 2019. Source: Economatica. (2) Controladoria-Geral da União (CGU). page 6Itaú Unibanco at a Glance Financial Highlights and Ratios Leading position in Brazil As of and for the quarter ended March 2019 (1) § US$85.8 billion market cap Highlights § 99,661 employees in Brazil and abroad Total Assets R$1651.4 Bi § 4,934 branches and CSBs in Brazil and abroad (1) Total Loans R$647.1 Bi 47,953 ATMs in Brazil and abroad § Stockholders’ Equity R$119.8 Bi (2) § Around 50.4 million clients in the Retail Bank in Feb/19 R$25.7 Bi Recurring Net Income 2018 (3) R$6.9 Bi Recurring Net Income 1Q19 § Brazilian multinational bank Long Term Foreign Currency Moody´s: Ba3 § Major provider of finance for the expansion of Brazilian companies (Itaú Unibanco Holding) Fitch: BB In 2017 Itaú Unibanco was elected the The Best Company in People Management (by “Valor § S&P: BB- Carreira” magazine) and also recognized as a pro-ethics company (Pró-Ética), an initiative Financial Ratios (2) between the Office of the Comptroller General with the private sector, which encourages the voluntary adoption of integrity measures and corruption prevention in the business sector, (4) Recurring ROE 2018 21.9% being the only financial institution among the companies approved. (5) Global Footprint of Brazil’s Top Private Sector Bank | as of March 31, 2019 Recurring ROE 1Q19 23.6% (6) Efficiency Ratio 2018 47.6% (6) Efficiency Ratio 1Q19 46.3% Liquidity Coverage Ratio 164% (7) Tier I Capital - BIS III 14.6% (1) Includes financial guarantees provided and corporate securities. (2) Represents Net Income adjusted for certain non recurring events described in the 4Q18 MD&A – Executive Summary. (3) Represents Net Income adjusted for certain non recurring events described in the 1Q19 MD&A – Executive Summary. (4) Calculated using Recurring Net Income / Average Equity. For annualized calculation method, please refer to Historical Series Spreadsheet. (5) Calculated using Recurring Net Income / Average Equity. For annualized calculation method, please refer to the 1Q19 MD&A – Executive Summary. (6) See “Efficiency Ratio” slides in this presentation for criteria. (7) Includes impacts from schedule anticipation of deductions and does not consider the additional dividend and interest on own capital. (1) As of March 31, 2019. Source: Economatica. (2) Controladoria-Geral da União (CGU). page 6

Our Vision Vision: To be the leading bank in sustainable performance and customer satisfaction • Implement a customer satisfaction-oriented culture, that is business-driven, through a simplified operational structure • Maximize shareholder returns, aiming at firm-wide growth • We aspire to be the preferred bank for top talents at every level • Attract and retain committed professionals with high ethical standards and strong organizational pride • Shared leadership, conquered through talent and commitment to excellence, focused on meritocracy • Create an atmosphere that inspires creativity, entrepreneurialism and the exchange of ideas • Pursue a cutting-edge technology, striving to best serve our client needs, ultimately creating value • Uphold the highest ethical standards in the relationship with clients, employees, regulators, society and the markets page 7Our Vision Vision: To be the leading bank in sustainable performance and customer satisfaction • Implement a customer satisfaction-oriented culture, that is business-driven, through a simplified operational structure • Maximize shareholder returns, aiming at firm-wide growth • We aspire to be the preferred bank for top talents at every level • Attract and retain committed professionals with high ethical standards and strong organizational pride • Shared leadership, conquered through talent and commitment to excellence, focused on meritocracy • Create an atmosphere that inspires creativity, entrepreneurialism and the exchange of ideas • Pursue a cutting-edge technology, striving to best serve our client needs, ultimately creating value • Uphold the highest ethical standards in the relationship with clients, employees, regulators, society and the markets page 7

Our Way 1. It’s only good for us if it’s good for the client We are people providing service to people, with passion and excellence. We work with the client and for the client – because they are the main reason behind why we do what we do. 2. We’re passionate about performance Generating sustainable results is in our DNA. The continuous challenge of seeking leadership in performance has brought us to where we are – and will continue guiding our company towards our objectives. 3. People mean everything to us Everything we do is carried out by people. Talented people who enjoy working in a collaborative atmosphere, based on meritocracy and high performance. 4. The best argument is the one that matters We encourage a challenging work environment, which is open to questioning and constructive discussion. For us, the hierarchy which counts is the hierarchy of the best idea. 5. Simple. Always We believe that simplicity is the best path to efficiency. That’s why we strive not to mistake depth for complexity, and simplicity for simplism. 6. We think and act like owners We always think like business owners, leading by example and putting collective objectives before personal ambition. 7. Ethics are non-negotiable We do what is right, without using shortcuts or devious ways to do business. We exercise leadership in a transparent and responsible way, fully committed to society and the best governance and management practices. page 8Our Way 1. It’s only good for us if it’s good for the client We are people providing service to people, with passion and excellence. We work with the client and for the client – because they are the main reason behind why we do what we do. 2. We’re passionate about performance Generating sustainable results is in our DNA. The continuous challenge of seeking leadership in performance has brought us to where we are – and will continue guiding our company towards our objectives. 3. People mean everything to us Everything we do is carried out by people. Talented people who enjoy working in a collaborative atmosphere, based on meritocracy and high performance. 4. The best argument is the one that matters We encourage a challenging work environment, which is open to questioning and constructive discussion. For us, the hierarchy which counts is the hierarchy of the best idea. 5. Simple. Always We believe that simplicity is the best path to efficiency. That’s why we strive not to mistake depth for complexity, and simplicity for simplism. 6. We think and act like owners We always think like business owners, leading by example and putting collective objectives before personal ambition. 7. Ethics are non-negotiable We do what is right, without using shortcuts or devious ways to do business. We exercise leadership in a transparent and responsible way, fully committed to society and the best governance and management practices. page 8

Medium and Long-Term Strategic Agenda CORPORATE GOVERNANCE AND SUSTAINABILITY PERMEATE ALL EFFORTS ON KEY STRATEGIC OBJECTIVES Commitment to permanently improve corporate governance plays a vital role in protecting stakeholders’ interests. We incorporate sustainability into our strategy through a consolidated governance structure that is integrated with our business, thus making environmental and social issues part of our everyday activities, by incorporating variables on these issues into diverse processes, such as credit granting, investments, insurance activities, contracting of suppliers, and wealth management. We aim at creating a virtuous cycle on the path towards sustainable performance, which can only be met by collaborative work involving our main stakeholders: employees; clients; shareholders and society. TRANSFORMATION CONTINUOUS IMPROVEMENT Risk Management Client Centricity to endeavor our efforts to fully comply with the Risk Appetite to embrace this concept to the fullest in order to always develop products and a “service culture” focused on guidelines. Managing risks is the essence of our activity and a client satisfaction and long-term relationships. responsibility of all employees. Internationalization Digital moving forward in the internationalization process does to speed up our digital transformation process to increase the productivity of IT area and spread a not necessarily mean to take activities to new countries, digital mindset throughout the bank to improve but to reach, in the countries we are present in, the same efficiency, user experience and client satisfaction. management quality and results we have in Brazil. Sustainable Profitability People Management to continuously increase the efficiency of our to improve our incentive model and evaluation tools to contemplate the new dynamics of cooperative operations, having the ability to identify work, making them effective to fairly assess opportunities to reduce costs, managing investments to gain agility, in addition to individual deliveries within efficiently managing capital allocation cross-functional teams. through adequate cost of equity. page 9Medium and Long-Term Strategic Agenda CORPORATE GOVERNANCE AND SUSTAINABILITY PERMEATE ALL EFFORTS ON KEY STRATEGIC OBJECTIVES Commitment to permanently improve corporate governance plays a vital role in protecting stakeholders’ interests. We incorporate sustainability into our strategy through a consolidated governance structure that is integrated with our business, thus making environmental and social issues part of our everyday activities, by incorporating variables on these issues into diverse processes, such as credit granting, investments, insurance activities, contracting of suppliers, and wealth management. We aim at creating a virtuous cycle on the path towards sustainable performance, which can only be met by collaborative work involving our main stakeholders: employees; clients; shareholders and society. TRANSFORMATION CONTINUOUS IMPROVEMENT Risk Management Client Centricity to endeavor our efforts to fully comply with the Risk Appetite to embrace this concept to the fullest in order to always develop products and a “service culture” focused on guidelines. Managing risks is the essence of our activity and a client satisfaction and long-term relationships. responsibility of all employees. Internationalization Digital moving forward in the internationalization process does to speed up our digital transformation process to increase the productivity of IT area and spread a not necessarily mean to take activities to new countries, digital mindset throughout the bank to improve but to reach, in the countries we are present in, the same efficiency, user experience and client satisfaction. management quality and results we have in Brazil. Sustainable Profitability People Management to continuously increase the efficiency of our to improve our incentive model and evaluation tools to contemplate the new dynamics of cooperative operations, having the ability to identify work, making them effective to fairly assess opportunities to reduce costs, managing investments to gain agility, in addition to individual deliveries within efficiently managing capital allocation cross-functional teams. through adequate cost of equity. page 9

Itaú Unibanco Global Footprint Itaú Unibanco has an important presence in key financial centers supported by a unique recognition and reputation. We want to be recognized as: The Latin American Bank CIB London, Lisbon, Madrid, Paris, Frankfurt Institutional Clients / Asset London Private Banking Zurich CIB NY, Cayman, Bahamas Institutional Clients / Asset CIB / Institutional Clients / Asset NY, Cayman Tokyo, Dubai Private Banking Cayman, Bahamas, Miami CIB / Institutional Clients Mexico CIB Brazil, Argentina, Chile, Peru, Colombia, Uruguay, Paraguay, Panama Institutional Clients / Asset Brazil, Argentina, Chile Private Banking Brazil, Chile, Paraguay Retail Banking Brazil, Argentina, Chile, Paraguay, Uruguay, Colombia, Panama page 10Itaú Unibanco Global Footprint Itaú Unibanco has an important presence in key financial centers supported by a unique recognition and reputation. We want to be recognized as: The Latin American Bank CIB London, Lisbon, Madrid, Paris, Frankfurt Institutional Clients / Asset London Private Banking Zurich CIB NY, Cayman, Bahamas Institutional Clients / Asset CIB / Institutional Clients / Asset NY, Cayman Tokyo, Dubai Private Banking Cayman, Bahamas, Miami CIB / Institutional Clients Mexico CIB Brazil, Argentina, Chile, Peru, Colombia, Uruguay, Paraguay, Panama Institutional Clients / Asset Brazil, Argentina, Chile Private Banking Brazil, Chile, Paraguay Retail Banking Brazil, Argentina, Chile, Paraguay, Uruguay, Colombia, Panama page 10

1 A History of Successful Strategic Deals Acquisition of the remaining 50% of: Retail - Brazil Uruguay NACIONAL Acquisition of the Banco Itaú BMG Consignado minority interest of: Casa Moreira Salles Acquisition of a 1924 minority interest in: Unibanco 1995 - 1998 2000 - 2003 2004 - 2007 Merger 2008 2009 - 2018 Itaú 1943 Foundation of Banco Itaú Alliance with: BEG Banco del Buen Ayre (1) Includes mergers, acquisitions, joint-ventures and partnerships. page 111 A History of Successful Strategic Deals Acquisition of the remaining 50% of: Retail - Brazil Uruguay NACIONAL Acquisition of the Banco Itaú BMG Consignado minority interest of: Casa Moreira Salles Acquisition of a 1924 minority interest in: Unibanco 1995 - 1998 2000 - 2003 2004 - 2007 Merger 2008 2009 - 2018 Itaú 1943 Foundation of Banco Itaú Alliance with: BEG Banco del Buen Ayre (1) Includes mergers, acquisitions, joint-ventures and partnerships. page 11

Corporate Governance 2Corporate Governance 2

Corporate Governance at Itaú Unibanco Strengths of our structure Family ownership ensuring a long-term view • • Professional management team • Strong corporate governance • Broad shareholder base (52.88% of our shares in free float) Egydio de Souza Free Float* Moreira Salles Family Non Voting Shares Aranha Family Free Float Foreigners Brazilian 100.00% Total in NYSE investors in B3 33% 28% Cia. E. Johnston de 36.73% ON 63.27% ON 81.37% PN Participações 4.8 bn 18.63% PN 66.03% Total (number of 33.97% Total shares) 39% 50.00% ON 33.47% Total Foreigners in B3 50.00% ON 100.00% PN IUPAR Itaúsa Free Float* 66.53% Total 39.21% ON 7.82% ON 51.71% ON 0.004% PN 99.58% PN 26.32% Total 19.95% Total 52.88% Total Itaú Unibanco Holding S.A. Note: ON = Common Shares; PN = Non-voting Shares; (*) Excluding shares held by majority owners and treasury shares. page 13Corporate Governance at Itaú Unibanco Strengths of our structure Family ownership ensuring a long-term view • • Professional management team • Strong corporate governance • Broad shareholder base (52.88% of our shares in free float) Egydio de Souza Free Float* Moreira Salles Family Non Voting Shares Aranha Family Free Float Foreigners Brazilian 100.00% Total in NYSE investors in B3 33% 28% Cia. E. Johnston de 36.73% ON 63.27% ON 81.37% PN Participações 4.8 bn 18.63% PN 66.03% Total (number of 33.97% Total shares) 39% 50.00% ON 33.47% Total Foreigners in B3 50.00% ON 100.00% PN IUPAR Itaúsa Free Float* 66.53% Total 39.21% ON 7.82% ON 51.71% ON 0.004% PN 99.58% PN 26.32% Total 19.95% Total 52.88% Total Itaú Unibanco Holding S.A. Note: ON = Common Shares; PN = Non-voting Shares; (*) Excluding shares held by majority owners and treasury shares. page 13
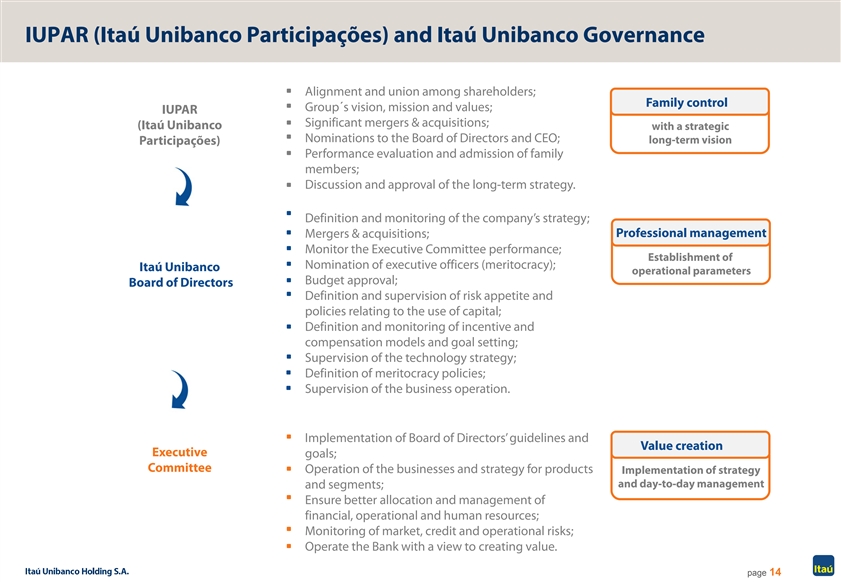
IUPAR (Itaú Unibanco Participações) and Itaú Unibanco Governance Alignment and union among shareholders; Family control Group´s vision, mission and values; IUPAR Significant mergers & acquisitions; (Itaú Unibanco with a strategic Nominations to the Board of Directors and CEO; long-term vision Participações) Performance evaluation and admission of family members; Discussion and approval of the long-term strategy. Definition and monitoring of the company’s strategy; Mergers & acquisitions; Professional management Monitor the Executive Committee performance; Establishment of Nomination of executive officers (meritocracy); Itaú Unibanco operational parameters Budget approval; Board of Directors Definition and supervision of risk appetite and policies relating to the use of capital; Definition and monitoring of incentive and compensation models and goal setting; Supervision of the technology strategy; Definition of meritocracy policies; Supervision of the business operation. Implementation of Board of Directors’ guidelines and Value creation Executive goals; Committee Operation of the businesses and strategy for products Implementation of strategy and day-to-day management and segments; Ensure better allocation and management of financial, operational and human resources; Monitoring of market, credit and operational risks; Operate the Bank with a view to creating value. page 14IUPAR (Itaú Unibanco Participações) and Itaú Unibanco Governance Alignment and union among shareholders; Family control Group´s vision, mission and values; IUPAR Significant mergers & acquisitions; (Itaú Unibanco with a strategic Nominations to the Board of Directors and CEO; long-term vision Participações) Performance evaluation and admission of family members; Discussion and approval of the long-term strategy. Definition and monitoring of the company’s strategy; Mergers & acquisitions; Professional management Monitor the Executive Committee performance; Establishment of Nomination of executive officers (meritocracy); Itaú Unibanco operational parameters Budget approval; Board of Directors Definition and supervision of risk appetite and policies relating to the use of capital; Definition and monitoring of incentive and compensation models and goal setting; Supervision of the technology strategy; Definition of meritocracy policies; Supervision of the business operation. Implementation of Board of Directors’ guidelines and Value creation Executive goals; Committee Operation of the businesses and strategy for products Implementation of strategy and day-to-day management and segments; Ensure better allocation and management of financial, operational and human resources; Monitoring of market, credit and operational risks; Operate the Bank with a view to creating value. page 14
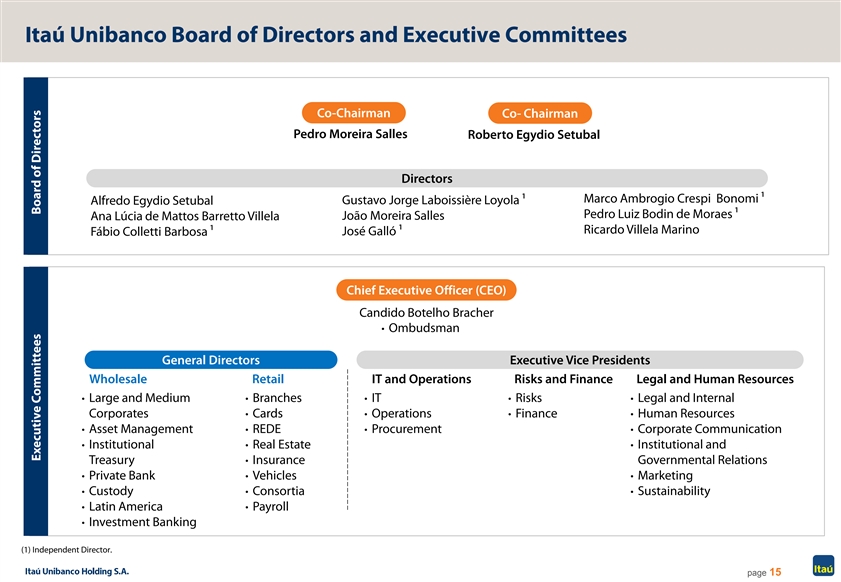
Itaú Unibanco Board of Directors and Executive Committees Co-Chairman Co- Chairman Pedro Moreira Salles Roberto Egydio Setubal . Directors Marco Ambrogio Crespi Bonomi 1 Alfredo Egydio Setubal Gustavo Jorge Laboissière Loyola 1 Pedro Luiz Bodin de Moraes 1 João Moreira Salles Ana Lúcia de Mattos Barretto Villela Ricardo Villela Marino Fábio Colletti Barbosa 1 José Galló 1 Chief Executive Officer (CEO) Candido Botelho Bracher • Ombudsman General Directors Executive Vice Presidents Wholesale Retail IT and Operations Risks and Finance Legal and Human Resources • Large and Medium • Branches • IT • Risks • Legal and Internal Corporates • Cards • Operations • Finance • Human Resources • Asset Management • REDE • Procurement • Corporate Communication • Institutional • Real Estate • Institutional and Treasury • Insurance Governmental Relations • Private Bank • Vehicles • Marketing • Custody • Consortia • Sustainability • Latin America • Payroll • Investment Banking (1) Independent Director. page 15 Executive Committees Board of DirectorsItaú Unibanco Board of Directors and Executive Committees Co-Chairman Co- Chairman Pedro Moreira Salles Roberto Egydio Setubal . Directors Marco Ambrogio Crespi Bonomi 1 Alfredo Egydio Setubal Gustavo Jorge Laboissière Loyola 1 Pedro Luiz Bodin de Moraes 1 João Moreira Salles Ana Lúcia de Mattos Barretto Villela Ricardo Villela Marino Fábio Colletti Barbosa 1 José Galló 1 Chief Executive Officer (CEO) Candido Botelho Bracher • Ombudsman General Directors Executive Vice Presidents Wholesale Retail IT and Operations Risks and Finance Legal and Human Resources • Large and Medium • Branches • IT • Risks • Legal and Internal Corporates • Cards • Operations • Finance • Human Resources • Asset Management • REDE • Procurement • Corporate Communication • Institutional • Real Estate • Institutional and Treasury • Insurance Governmental Relations • Private Bank • Vehicles • Marketing • Custody • Consortia • Sustainability • Latin America • Payroll • Investment Banking (1) Independent Director. page 15 Executive Committees Board of Directors
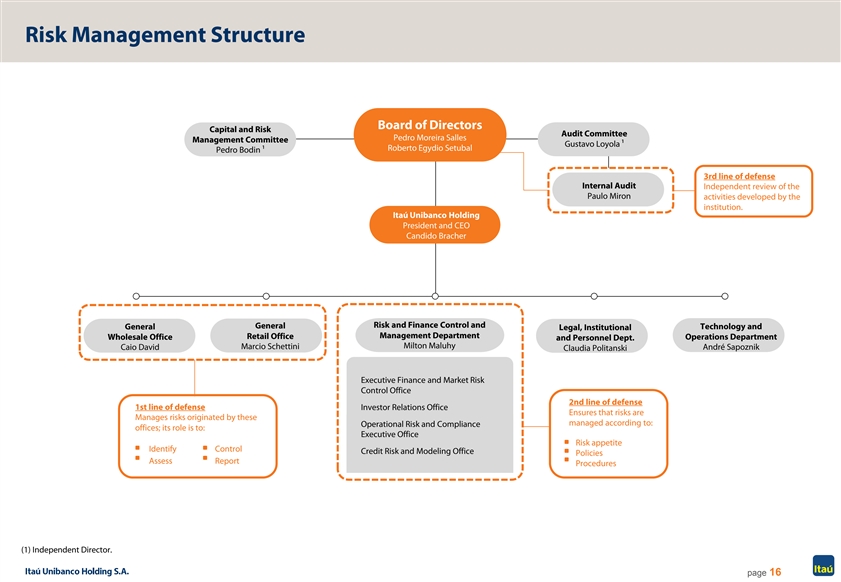
Risk Management Structure Board of Directors Capital and Risk Audit Committee Pedro Moreira Salles Management Committee Gustavo Loyola 1 Roberto Egydio Setubal Pedro Bodin 1 3rd line of defense Internal Audit Independent review of the Paulo Miron activities developed by the institution. Itaú Unibanco Holding President and CEO Candido Bracher Risk and Finance Control and General General Technology and Legal, Institutional Retail Office Management Department Wholesale Office Operations Department and Personnel Dept. Milton Maluhy Marcio Schettini André Sapoznik Caio David Claudia Politanski Executive Finance and Market Risk Control Office 2nd line of defense 1st line of defense Investor Relations Office Ensures that risks are Manages risks originated by these managed according to: Operational Risk and Compliance offices; its role is to: Executive Office Risk appetite Identify Control Credit Risk and Modeling Office Policies Assess Report Procedures (1) Independent Director. page 16Risk Management Structure Board of Directors Capital and Risk Audit Committee Pedro Moreira Salles Management Committee Gustavo Loyola 1 Roberto Egydio Setubal Pedro Bodin 1 3rd line of defense Internal Audit Independent review of the Paulo Miron activities developed by the institution. Itaú Unibanco Holding President and CEO Candido Bracher Risk and Finance Control and General General Technology and Legal, Institutional Retail Office Management Department Wholesale Office Operations Department and Personnel Dept. Milton Maluhy Marcio Schettini André Sapoznik Caio David Claudia Politanski Executive Finance and Market Risk Control Office 2nd line of defense 1st line of defense Investor Relations Office Ensures that risks are Manages risks originated by these managed according to: Operational Risk and Compliance offices; its role is to: Executive Office Risk appetite Identify Control Credit Risk and Modeling Office Policies Assess Report Procedures (1) Independent Director. page 16

Governance Structure at Itaú Unibanco Shareholder’s Meeting Fiscal Council Board of Directors Digital Audit Personnel Related Nomination Risk and Capital Strategy Compensation LATAM Committee Committee Parties and Corporate Management Committee Committee Strategy Advisory Board Committee Governance Committee Council Committee Internal Audit Social Responsibility Independent Committee Audit Board of Officers Disclosure and Trading Committee page 17Governance Structure at Itaú Unibanco Shareholder’s Meeting Fiscal Council Board of Directors Digital Audit Personnel Related Nomination Risk and Capital Strategy Compensation LATAM Committee Committee Parties and Corporate Management Committee Committee Strategy Advisory Board Committee Governance Committee Council Committee Internal Audit Social Responsibility Independent Committee Audit Board of Officers Disclosure and Trading Committee page 17
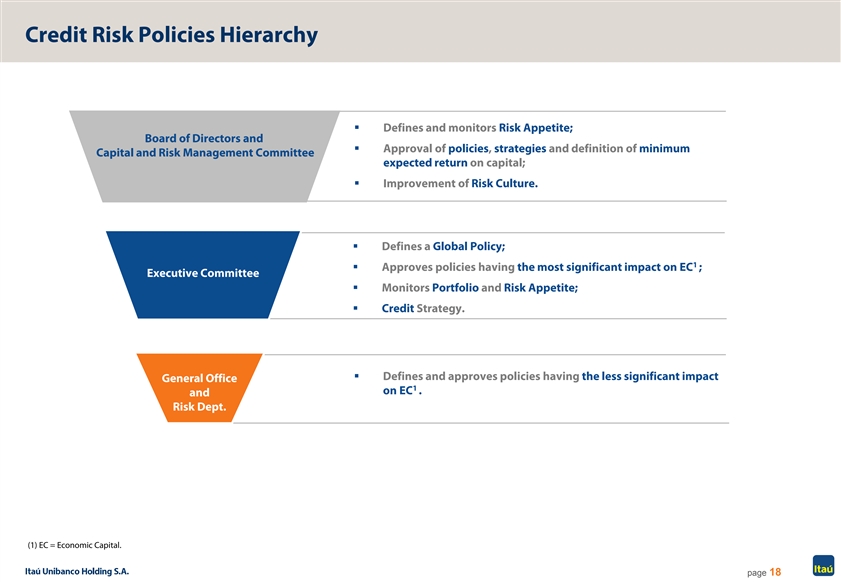
Credit Risk Policies Hierarchy § Defines and monitors Risk Appetite; Board of Directors and § Approval of policies, strategies and definition of minimum Capital and Risk Management Committee expected return on capital; § Improvement of Risk Culture. § Defines a Global Policy; 1 § Approves policies having the most significant impact on EC ; Executive Committee § Monitors Portfolio and Risk Appetite; § Credit Strategy. § Defines and approves policies having the less significant impact General Office 1 on EC . and Risk Dept. (1) EC = Economic Capital. page 18Credit Risk Policies Hierarchy § Defines and monitors Risk Appetite; Board of Directors and § Approval of policies, strategies and definition of minimum Capital and Risk Management Committee expected return on capital; § Improvement of Risk Culture. § Defines a Global Policy; 1 § Approves policies having the most significant impact on EC ; Executive Committee § Monitors Portfolio and Risk Appetite; § Credit Strategy. § Defines and approves policies having the less significant impact General Office 1 on EC . and Risk Dept. (1) EC = Economic Capital. page 18
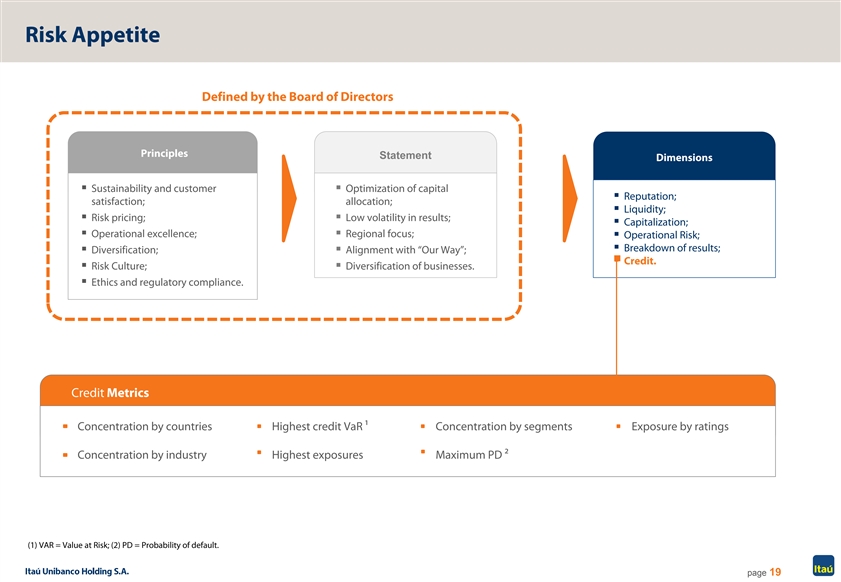
Risk Appetite Defined by the Board of Directors Principles Statement Dimensions § Sustainability and customer § Optimization of capital § Reputation; satisfaction; allocation; § Liquidity; § Risk pricing;§ Low volatility in results; § Capitalization; § Operational excellence;§ Regional focus; § Operational Risk; § Breakdown of results; § Diversification;§ Alignment with “Our Way”; § Credit. § Risk Culture;§ Diversification of businesses. § Ethics and regulatory compliance. Credit Metrics Concentration by countries Highest credit VaR 1 Concentration by segments Exposure by ratings Concentration by industry Highest exposures Maximum PD 2 (1) VAR = Value at Risk; (2) PD = Probability of default. page 19Risk Appetite Defined by the Board of Directors Principles Statement Dimensions § Sustainability and customer § Optimization of capital § Reputation; satisfaction; allocation; § Liquidity; § Risk pricing;§ Low volatility in results; § Capitalization; § Operational excellence;§ Regional focus; § Operational Risk; § Breakdown of results; § Diversification;§ Alignment with “Our Way”; § Credit. § Risk Culture;§ Diversification of businesses. § Ethics and regulatory compliance. Credit Metrics Concentration by countries Highest credit VaR 1 Concentration by segments Exposure by ratings Concentration by industry Highest exposures Maximum PD 2 (1) VAR = Value at Risk; (2) PD = Probability of default. page 19
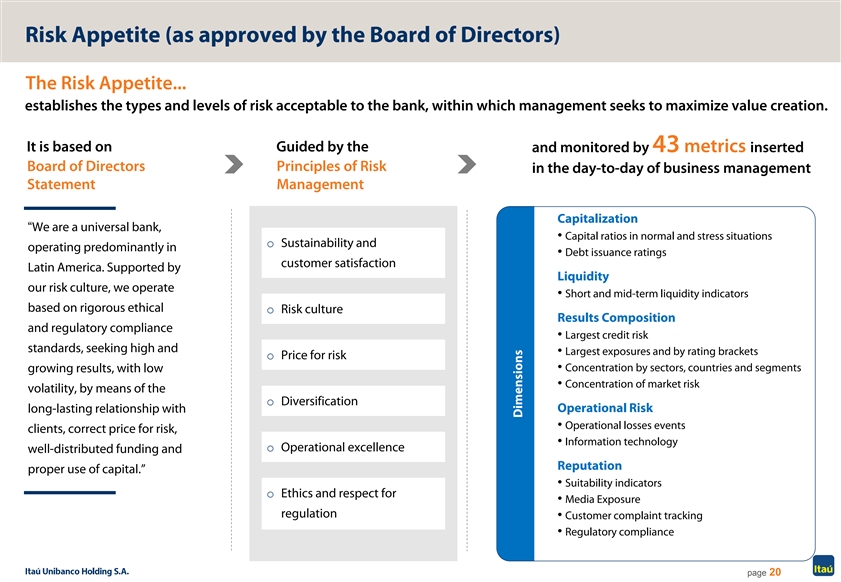
Risk Appetite (as approved by the Board of Directors) The Risk Appetite... establishes the types and levels of risk acceptable to the bank, within which management seeks to maximize value creation. It is based on Guided by the and monitored by 43 metrics inserted Board of Directors Principles of Risk in the day-to-day of business management Statement Management Capitalization “We are a universal bank, • Capital ratios in normal and stress situations o Sustainability and operating predominantly in • Debt issuance ratings customer satisfaction Latin America. Supported by Liquidity our risk culture, we operate • Short and mid-term liquidity indicators based on rigorous ethical o Risk culture Results Composition and regulatory compliance • Largest credit risk standards, seeking high and • Largest exposures and by rating brackets o Price for risk • Concentration by sectors, countries and segments growing results, with low • Concentration of market risk volatility, by means of the o Diversification long-lasting relationship with Operational Risk • Operational losses events clients, correct price for risk, • Information technology o Operational excellence well-distributed funding and Reputation proper use of capital.” • Suitability indicators o Ethics and respect for • Media Exposure regulation • Customer complaint tracking • Regulatory compliance page 20 DimensionsRisk Appetite (as approved by the Board of Directors) The Risk Appetite... establishes the types and levels of risk acceptable to the bank, within which management seeks to maximize value creation. It is based on Guided by the and monitored by 43 metrics inserted Board of Directors Principles of Risk in the day-to-day of business management Statement Management Capitalization “We are a universal bank, • Capital ratios in normal and stress situations o Sustainability and operating predominantly in • Debt issuance ratings customer satisfaction Latin America. Supported by Liquidity our risk culture, we operate • Short and mid-term liquidity indicators based on rigorous ethical o Risk culture Results Composition and regulatory compliance • Largest credit risk standards, seeking high and • Largest exposures and by rating brackets o Price for risk • Concentration by sectors, countries and segments growing results, with low • Concentration of market risk volatility, by means of the o Diversification long-lasting relationship with Operational Risk • Operational losses events clients, correct price for risk, • Information technology o Operational excellence well-distributed funding and Reputation proper use of capital.” • Suitability indicators o Ethics and respect for • Media Exposure regulation • Customer complaint tracking • Regulatory compliance page 20 Dimensions
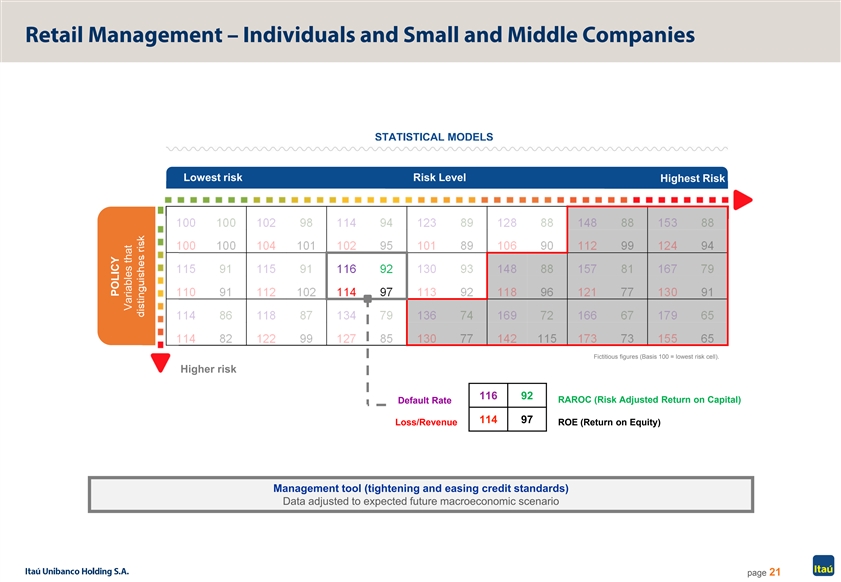
Retail Management – Individuals and Small and Middle Companies STATISTICAL MODELS Lowest risk Risk Level Highest Risk 100 100 102 98 114 94 123 89 128 88 148 88 153 88 100 100 104 101 102 95 101 89 106 90 112 99 124 94 115 91 115 91 116 92 130 93 148 88 157 81 167 79 v 110 91 112 102 114 97 113 92 118 96 121 77 130 91 114 86 118 87 134 79 136 74 169 72 166 67 179 65 114 82 122 99 127 85 130 77 142 115 173 73 155 65 Fictitious figures (Basis 100 = lowest risk cell). Higher risk 116 92 RAROC (Risk Adjusted Return on Capital) Default Rate 114 97 Loss/Revenue ROE (Return on Equity) Management tool (tightening and easing credit standards) Data adjusted to expected future macroeconomic scenario page 21 POLICY Variables that distinguishes riskRetail Management – Individuals and Small and Middle Companies STATISTICAL MODELS Lowest risk Risk Level Highest Risk 100 100 102 98 114 94 123 89 128 88 148 88 153 88 100 100 104 101 102 95 101 89 106 90 112 99 124 94 115 91 115 91 116 92 130 93 148 88 157 81 167 79 v 110 91 112 102 114 97 113 92 118 96 121 77 130 91 114 86 118 87 134 79 136 74 169 72 166 67 179 65 114 82 122 99 127 85 130 77 142 115 173 73 155 65 Fictitious figures (Basis 100 = lowest risk cell). Higher risk 116 92 RAROC (Risk Adjusted Return on Capital) Default Rate 114 97 Loss/Revenue ROE (Return on Equity) Management tool (tightening and easing credit standards) Data adjusted to expected future macroeconomic scenario page 21 POLICY Variables that distinguishes risk

Credit Offer Based on Future Scenario STATISTICAL MODELS Highest Lowest Risk Level risk risk Credit Available Base Scenario Credit Not Available Credit Not Available Highest risk Positive future expectation Negative future expectation Risk Level Risk Level Credit Available Credit Available Credit Not Available Credit Not Available Tightening of credit, maintaining the same Easing of credit, maintaining the same appetite appetite page 22 POLICY POLICYCredit Offer Based on Future Scenario STATISTICAL MODELS Highest Lowest Risk Level risk risk Credit Available Base Scenario Credit Not Available Credit Not Available Highest risk Positive future expectation Negative future expectation Risk Level Risk Level Credit Available Credit Available Credit Not Available Credit Not Available Tightening of credit, maintaining the same Easing of credit, maintaining the same appetite appetite page 22 POLICY POLICY

Business Overview 3Business Overview 3

Universal Bank 1 RETAIL BANKING WHOLESALE BANKING RETAIL AND REAL ESTATE CREDIT ITAÚ BBA 4,413 branches and client service branches and 46,784 ATMs in Brazil; Full coverage of corporate clients with RETAIL annual sales above R$ 200 million; AND REAL Premier banking brand in Brazil; ESTATE Leadership in IB products with top Strategically positioned for growth in mortgage market CREDIT ITAÚ BBA CREDIT positions in major league tables; (partnerships with Lopes). CARD AND (CORPORATE, Treasury operations for the CONSUMER IB AND conglomerate. CREDIT CARD AND CONSUMER FINANCE TREASURY) FINANCE Approximately 33.1 million credit card accounts LATAM and 28.6 million debit card accounts; Purpose: to be recognized as Leader in Brazilian credit card market, extensive “The Latin American Bank”; number of joint ventures and partnerships VEHICLES LATAM Retail presence in Latin America with retailers. (ex-Brazil): Argentina, Chile, Paraguay, Uruguay, VEHICLES Colombia, Panama. Total portfolio for individuals of R$16.6 billion; UNIVERSAL BANK Lease and finance through over 10 thousand dealers. WEALTH MANAGEMENT WEALTH AND SERVICES INSURANCE² MANAGEMENT INSURANCE OPERATIONS SERVICES Total assets under administration One of the largest players in Brazil based of approximately R$1,159 billion; on direct premiums; Leader in Private banking Association with Porto Seguro for auto and residential insurance; SMALL MIDDLE services in Latin America. COMPANY COMPANY 1Q19 net income: R$661 million MIDDLE COMPANY SMALL COMPANY Corporate clients with annual sales Small and Medium Enterprises with annual sales up to R$30 million. from R$30 million to R$200 million. (1) March 31, 2019 figures; (2) Includes Insurance, Pension Plan and Premium Bond operations. page 24Universal Bank 1 RETAIL BANKING WHOLESALE BANKING RETAIL AND REAL ESTATE CREDIT ITAÚ BBA 4,413 branches and client service branches and 46,784 ATMs in Brazil; Full coverage of corporate clients with RETAIL annual sales above R$ 200 million; AND REAL Premier banking brand in Brazil; ESTATE Leadership in IB products with top Strategically positioned for growth in mortgage market CREDIT ITAÚ BBA CREDIT positions in major league tables; (partnerships with Lopes). CARD AND (CORPORATE, Treasury operations for the CONSUMER IB AND conglomerate. CREDIT CARD AND CONSUMER FINANCE TREASURY) FINANCE Approximately 33.1 million credit card accounts LATAM and 28.6 million debit card accounts; Purpose: to be recognized as Leader in Brazilian credit card market, extensive “The Latin American Bank”; number of joint ventures and partnerships VEHICLES LATAM Retail presence in Latin America with retailers. (ex-Brazil): Argentina, Chile, Paraguay, Uruguay, VEHICLES Colombia, Panama. Total portfolio for individuals of R$16.6 billion; UNIVERSAL BANK Lease and finance through over 10 thousand dealers. WEALTH MANAGEMENT WEALTH AND SERVICES INSURANCE² MANAGEMENT INSURANCE OPERATIONS SERVICES Total assets under administration One of the largest players in Brazil based of approximately R$1,159 billion; on direct premiums; Leader in Private banking Association with Porto Seguro for auto and residential insurance; SMALL MIDDLE services in Latin America. COMPANY COMPANY 1Q19 net income: R$661 million MIDDLE COMPANY SMALL COMPANY Corporate clients with annual sales Small and Medium Enterprises with annual sales up to R$30 million. from R$30 million to R$200 million. (1) March 31, 2019 figures; (2) Includes Insurance, Pension Plan and Premium Bond operations. page 24
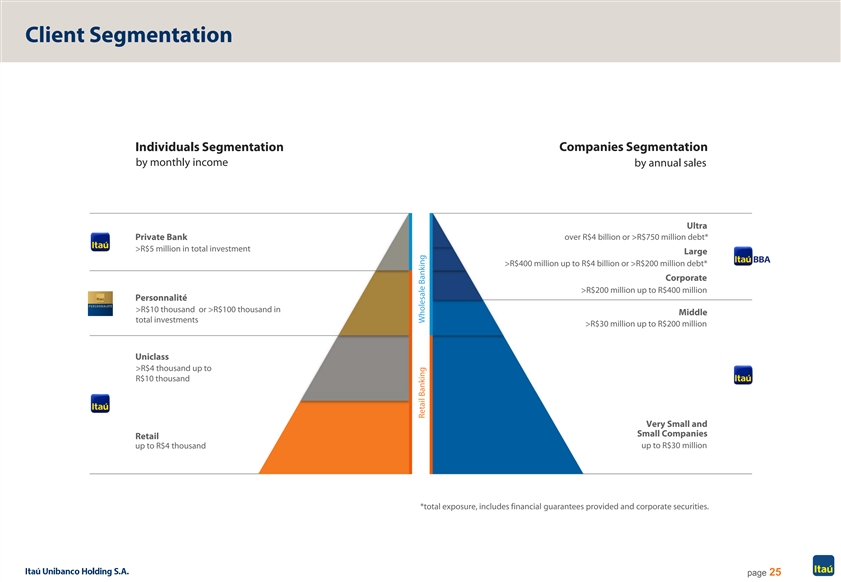
Client Segmentation Individuals Segmentation Companies Segmentation by monthly income by annual sales Ultra Private Bank over R$4 billion or >R$750 million debt* >R$5 million in total investment Large >R$400 million up to R$4 billion or >R$200 million debt* Corporate >R$200 million up to R$400 million Personnalité >R$10 thousand or >R$100 thousand in Middle total investments >R$30 million up to R$200 million Uniclass >R$4 thousand up to R$10 thousand Very Small and Small Companies Retail up to R$4 thousand up to R$30 million *total exposure, includes financial guarantees provided and corporate securities. page 25 Retail Banking Wholesale BankingClient Segmentation Individuals Segmentation Companies Segmentation by monthly income by annual sales Ultra Private Bank over R$4 billion or >R$750 million debt* >R$5 million in total investment Large >R$400 million up to R$4 billion or >R$200 million debt* Corporate >R$200 million up to R$400 million Personnalité >R$10 thousand or >R$100 thousand in Middle total investments >R$30 million up to R$200 million Uniclass >R$4 thousand up to R$10 thousand Very Small and Small Companies Retail up to R$4 thousand up to R$30 million *total exposure, includes financial guarantees provided and corporate securities. page 25 Retail Banking Wholesale Banking
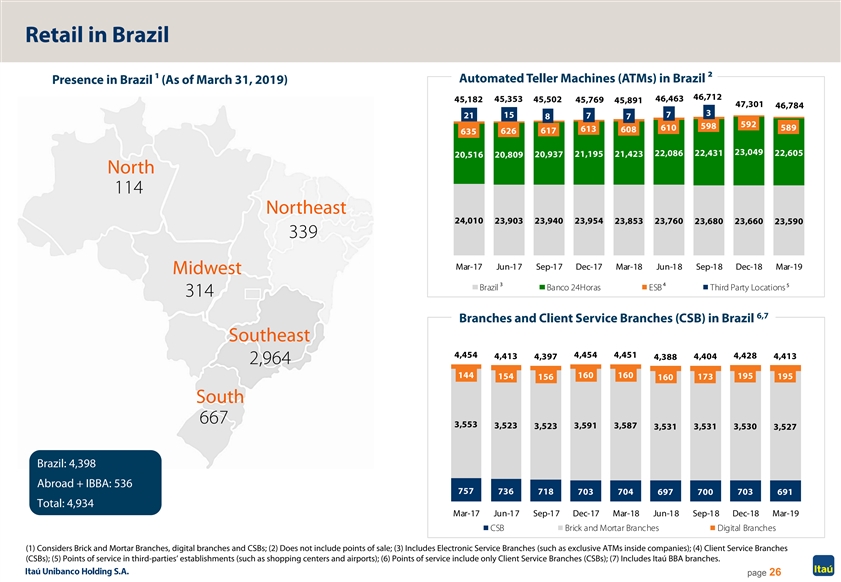
Retail in Brazil Automated Teller Machines (ATMs) in Brazil 2 Presence in Brazil 1 (As of March 31, 2019) 46,712 45,353 46,463 45,182 45,502 45,769 45,891 47,301 46,784 3 15 7 21 7 8 7 592 598 610 589 613 608 626 617 635 23,049 22,086 22,431 22,605 21,195 21,423 20,516 20,809 20,937 North 114 Northeast 24,010 23,903 23,940 23,954 23,853 23,760 23,680 23,660 23,590 339 Mar-17 Jun-17 Sep-17 Dec-17 Mar-18 Jun-18 Sep-18 Dec-18 Mar-19 Midwest 3 4 5 Brazil Banco 24Horas ESB Third Party Locations 314 6,7 Branches and Client Service Branches (CSB) in Brazil Southeast 4,454 4,454 4,451 4,428 4,413 4,397 4,388 4,404 4,413 2,964 144 160 160 195 154 156 173 195 160 South 667 3,553 3,523 3,591 3,587 3,523 3,531 3,531 3,530 3,527 Brazil: 4,398 Abroad + IBBA: 536 757 736 718 703 704 697 700 703 691 Total: 4,934 Mar-17 Jun-17 Sep-17 Dec-17 Mar-18 Jun-18 Sep-18 Dec-18 Mar-19 CSB Brick and Mortar Branches Digital Branches (1) Considers Brick and Mortar Branches, digital branches and CSBs; (2) Does not include points of sale; (3) Includes Electronic Service Branches (such as exclusive ATMs inside companies); (4) Client Service Branches (CSBs); (5) Points of service in third-parties’ establishments (such as shopping centers and airports); (6) Points of service include only Client Service Branches (CSBs); (7) Includes Itaú BBA branches. page 26Retail in Brazil Automated Teller Machines (ATMs) in Brazil 2 Presence in Brazil 1 (As of March 31, 2019) 46,712 45,353 46,463 45,182 45,502 45,769 45,891 47,301 46,784 3 15 7 21 7 8 7 592 598 610 589 613 608 626 617 635 23,049 22,086 22,431 22,605 21,195 21,423 20,516 20,809 20,937 North 114 Northeast 24,010 23,903 23,940 23,954 23,853 23,760 23,680 23,660 23,590 339 Mar-17 Jun-17 Sep-17 Dec-17 Mar-18 Jun-18 Sep-18 Dec-18 Mar-19 Midwest 3 4 5 Brazil Banco 24Horas ESB Third Party Locations 314 6,7 Branches and Client Service Branches (CSB) in Brazil Southeast 4,454 4,454 4,451 4,428 4,413 4,397 4,388 4,404 4,413 2,964 144 160 160 195 154 156 173 195 160 South 667 3,553 3,523 3,591 3,587 3,523 3,531 3,531 3,530 3,527 Brazil: 4,398 Abroad + IBBA: 536 757 736 718 703 704 697 700 703 691 Total: 4,934 Mar-17 Jun-17 Sep-17 Dec-17 Mar-18 Jun-18 Sep-18 Dec-18 Mar-19 CSB Brick and Mortar Branches Digital Branches (1) Considers Brick and Mortar Branches, digital branches and CSBs; (2) Does not include points of sale; (3) Includes Electronic Service Branches (such as exclusive ATMs inside companies); (4) Client Service Branches (CSBs); (5) Points of service in third-parties’ establishments (such as shopping centers and airports); (6) Points of service include only Client Service Branches (CSBs); (7) Includes Itaú BBA branches. page 26

Retail - Credit Cards, Joint Ventures and Partnerships with Retailers in Brazil Highlights Highlights JVs and Partnerships • Brazilian market leader in credit card transactions; • Focus on credit card instruments; • Qualification of the client base: proprietary channel x partnerships; • Long term agreements; • Credit card business comprises: • Alignment of incentives. • Issuance of cards; • Acquiring: REDE; • JVs and partnership with retailers; • Own brand: Hiper; • Approximately 61.7 million card accounts (1Q19): • 33.1 million credit card accounts; • 28.6 million debit card accounts; • R$ 119.5 billion in card transactions (1Q19): • R$ 89.3 billion in credit card transactions; • R$ 30.3 billion in debit card transactions; • High growth potential in credit card usage in Brazil. page 27Retail - Credit Cards, Joint Ventures and Partnerships with Retailers in Brazil Highlights Highlights JVs and Partnerships • Brazilian market leader in credit card transactions; • Focus on credit card instruments; • Qualification of the client base: proprietary channel x partnerships; • Long term agreements; • Credit card business comprises: • Alignment of incentives. • Issuance of cards; • Acquiring: REDE; • JVs and partnership with retailers; • Own brand: Hiper; • Approximately 61.7 million card accounts (1Q19): • 33.1 million credit card accounts; • 28.6 million debit card accounts; • R$ 119.5 billion in card transactions (1Q19): • R$ 89.3 billion in credit card transactions; • R$ 30.3 billion in debit card transactions; • High growth potential in credit card usage in Brazil. page 27

Retail - Cards in Brazil | Growing Penetration in Household Consumption Expenditure Credit and Debit Cards Billed Volume % at Household Consumption Expenditure 38.0% 35.1% 34.9% 34.1% 33.8% 32.4% 32.1% 31.4% 30.8% 14.6% 13.0% 13.3% 12.5% 12.7% 12.1% 12.4% 11.7% 11.6% 23.4% 22.1% 21.6% 21.6% 21.1% 20.3% 19.7% 19.7% 19.2% 4Q16 1Q17 2Q17 3Q17 4Q17 1Q18 2Q18 3Q18 4Q18 Credit Card Debit Card Sources: ABECS (Brazilian Credit Card Companies Association) and IBGE (Statistics and Geography Brazilian Institute) brand view in Dec/18. Only the purchase volume is considered in the cards billing. page 28Retail - Cards in Brazil | Growing Penetration in Household Consumption Expenditure Credit and Debit Cards Billed Volume % at Household Consumption Expenditure 38.0% 35.1% 34.9% 34.1% 33.8% 32.4% 32.1% 31.4% 30.8% 14.6% 13.0% 13.3% 12.5% 12.7% 12.1% 12.4% 11.7% 11.6% 23.4% 22.1% 21.6% 21.6% 21.1% 20.3% 19.7% 19.7% 19.2% 4Q16 1Q17 2Q17 3Q17 4Q17 1Q18 2Q18 3Q18 4Q18 Credit Card Debit Card Sources: ABECS (Brazilian Credit Card Companies Association) and IBGE (Statistics and Geography Brazilian Institute) brand view in Dec/18. Only the purchase volume is considered in the cards billing. page 28
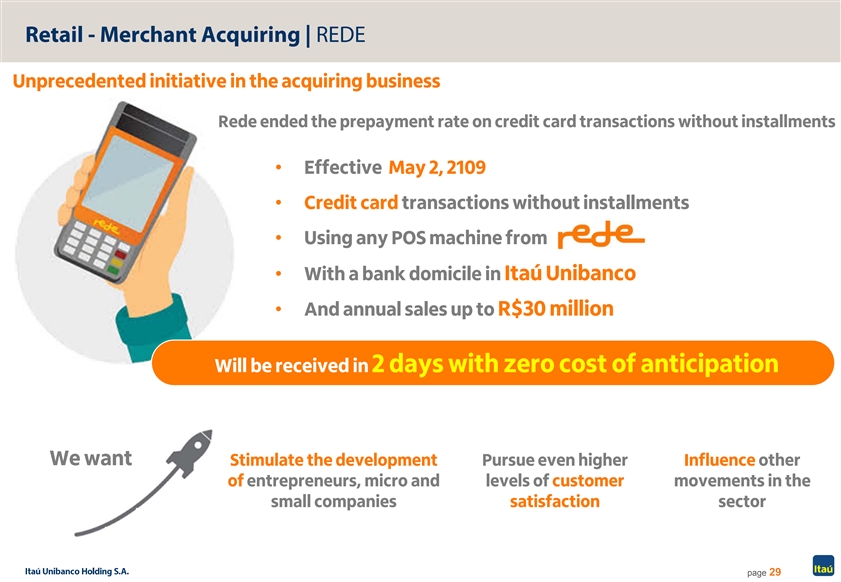
Retail - Merchant Acquiring | REDE Unprecedented initiative in the acquiring business Rede ended the prepayment rate on credit card transactions without installments • Effective May 2, 2109 • Credit card transactions without installments • Using any POS machine from • With a bank domicile in Itaú Unibanco • And annual sales up to R$30 million Will be received in 2 days with zero cost of anticipation We want Stimulate the development Pursue even higher Influence other of entrepreneurs, micro and levels of customer movements in the small companies satisfaction sector page 29Retail - Merchant Acquiring | REDE Unprecedented initiative in the acquiring business Rede ended the prepayment rate on credit card transactions without installments • Effective May 2, 2109 • Credit card transactions without installments • Using any POS machine from • With a bank domicile in Itaú Unibanco • And annual sales up to R$30 million Will be received in 2 days with zero cost of anticipation We want Stimulate the development Pursue even higher Influence other of entrepreneurs, micro and levels of customer movements in the small companies satisfaction sector page 29
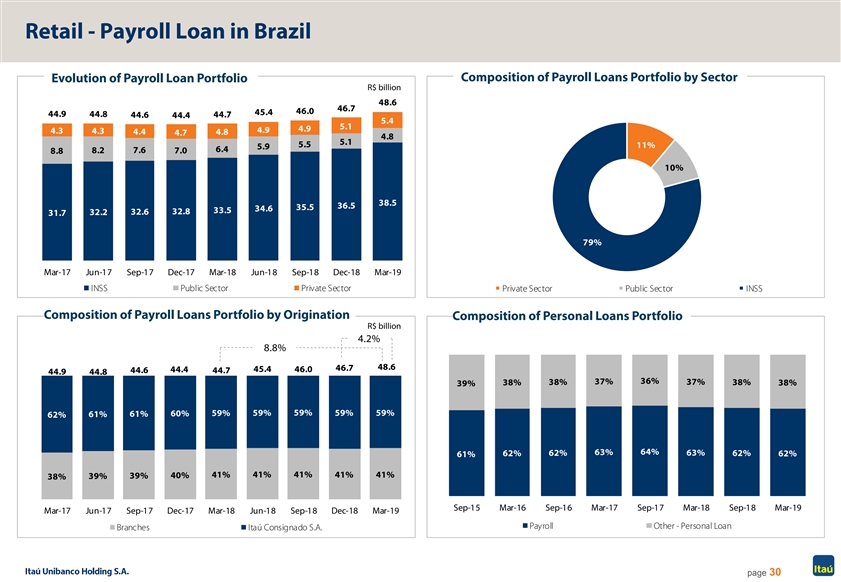
Retail - Payroll Loan in Brazil Composition of Payroll Loans Portfolio by Sector Evolution of Payroll Loan Portfolio R$ billion 48.6 46.7 46.0 45.4 44.9 44.8 44.6 44.4 44.7 5.4 5.1 4.9 4.9 4.3 4.3 4.4 4.8 4.7 4.8 5.1 5.5 11% 5.9 6.4 7.6 8.8 8.2 7.0 10% 38.5 36.5 35.5 34.6 33.5 32.6 32.8 31.7 32.2 79% Mar-17 Jun-17 Sep-17 Dec-17 Mar-18 Jun-18 Sep-18 Dec-18 Mar-19 INSS Public Sector Private Sector Private Sector Public Sector INSS Composition of Payroll Loans Portfolio by Origination Composition of Personal Loans Portfolio R$ billion 4.2% 8.8% 48.6 46.7 44.4 45.4 46.0 44.6 44.7 44.9 44.8 37% 36% 37% 38% 38% 38% 38% 39% 59% 59% 59% 60% 59% 59% 62% 61% 61% 64% 63% 63% 62% 62% 62% 62% 61% 41% 41% 41% 41% 39% 40% 41% 38% 39% Sep-15 Mar-16 Sep-16 Mar-17 Sep-17 Mar-18 Sep-18 Mar-19 Mar-17 Jun-17 Sep-17 Dec-17 Mar-18 Jun-18 Sep-18 Dec-18 Mar-19 Payroll Other - Personal Loan Branches Itaú Consignado S.A. page 30Retail - Payroll Loan in Brazil Composition of Payroll Loans Portfolio by Sector Evolution of Payroll Loan Portfolio R$ billion 48.6 46.7 46.0 45.4 44.9 44.8 44.6 44.4 44.7 5.4 5.1 4.9 4.9 4.3 4.3 4.4 4.8 4.7 4.8 5.1 5.5 11% 5.9 6.4 7.6 8.8 8.2 7.0 10% 38.5 36.5 35.5 34.6 33.5 32.6 32.8 31.7 32.2 79% Mar-17 Jun-17 Sep-17 Dec-17 Mar-18 Jun-18 Sep-18 Dec-18 Mar-19 INSS Public Sector Private Sector Private Sector Public Sector INSS Composition of Payroll Loans Portfolio by Origination Composition of Personal Loans Portfolio R$ billion 4.2% 8.8% 48.6 46.7 44.4 45.4 46.0 44.6 44.7 44.9 44.8 37% 36% 37% 38% 38% 38% 38% 39% 59% 59% 59% 60% 59% 59% 62% 61% 61% 64% 63% 63% 62% 62% 62% 62% 61% 41% 41% 41% 41% 39% 40% 41% 38% 39% Sep-15 Mar-16 Sep-16 Mar-17 Sep-17 Mar-18 Sep-18 Mar-19 Mar-17 Jun-17 Sep-17 Dec-17 Mar-18 Jun-18 Sep-18 Dec-18 Mar-19 Payroll Other - Personal Loan Branches Itaú Consignado S.A. page 30

Retail - Mortgage Market in Brazil Mortgage Loans Evolution Distribution Channels for Individuals Balance As of March 2019 R$ million 1.7% 47,754 48,337 48,544 Partnerships 13.0% 11.7% 16.3% 13% Real Estate Regular Brokers Branches 30% 11% 88.3% 87.0% 83.7% Developers 15% High Income Branches Mar-18 Dec-18 Mar-19 31% Individuals Companies Collaterals (LTV) Average Ticket and Average Origination Term (Loan to value ratio) 58.4% 58.6% 57.4% 1Q19 40.0% 38.7% 38.8% Average operation period ¹ 320 months Average value of the Property ² R$553 thousand Financing Average Ticket R$325 thousand Mar-18 Dec-18 Mar-19 Vintage (quarterly average) Portfolio (1) Average Operation Period for new developers contracts; (2) Value determined using monthly financing average ticket and quarterly average LTV. Production source: ABECIP. page 31Retail - Mortgage Market in Brazil Mortgage Loans Evolution Distribution Channels for Individuals Balance As of March 2019 R$ million 1.7% 47,754 48,337 48,544 Partnerships 13.0% 11.7% 16.3% 13% Real Estate Regular Brokers Branches 30% 11% 88.3% 87.0% 83.7% Developers 15% High Income Branches Mar-18 Dec-18 Mar-19 31% Individuals Companies Collaterals (LTV) Average Ticket and Average Origination Term (Loan to value ratio) 58.4% 58.6% 57.4% 1Q19 40.0% 38.7% 38.8% Average operation period ¹ 320 months Average value of the Property ² R$553 thousand Financing Average Ticket R$325 thousand Mar-18 Dec-18 Mar-19 Vintage (quarterly average) Portfolio (1) Average Operation Period for new developers contracts; (2) Value determined using monthly financing average ticket and quarterly average LTV. Production source: ABECIP. page 31
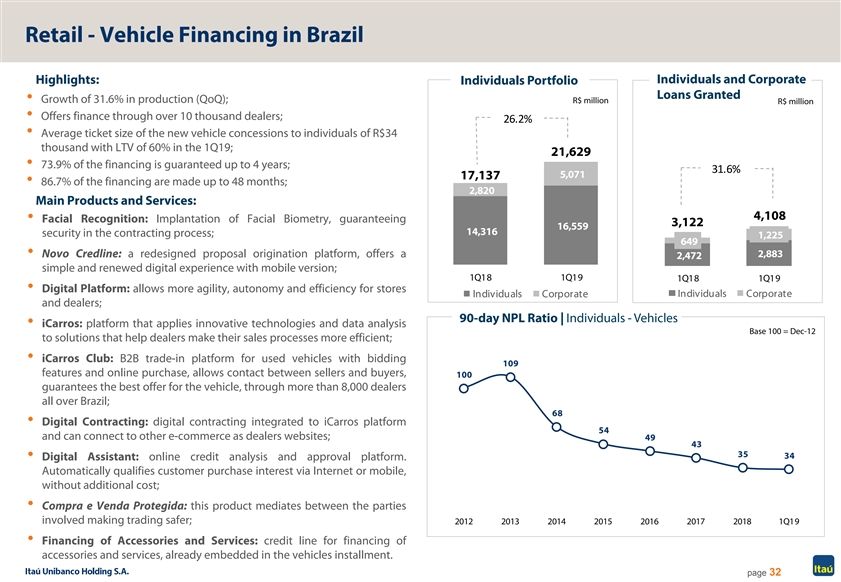
Retail - Vehicle Financing in Brazil Highlights: Individuals and Corporate Individuals Portfolio Loans Granted • Growth of 31.6% in production (QoQ); R$ million R$ million • Offers finance through over 10 thousand dealers; 26.2% • Average ticket size of the new vehicle concessions to individuals of R$34 thousand with LTV of 60% in the 1Q19; 21,629 • 73.9% of the financing is guaranteed up to 4 years; 31.6% 5,071 17,137 • 86.7% of the financing are made up to 48 months; 2,820 Main Products and Services: 4,108 • Facial Recognition: Implantation of Facial Biometry, guaranteeing 3,122 16,559 14,316 security in the contracting process; 1,225 649 • Novo Credline: a redesigned proposal origination platform, offers a 2,883 2,472 simple and renewed digital experience with mobile version; 1Q18 1Q19 1Q18 1Q19 • Digital Platform: allows more agility, autonomy and efficiency for stores Individuals Corporate Individuals Corporate and dealers; 90-day NPL Ratio | Individuals - Vehicles • iCarros: platform that applies innovative technologies and data analysis Base 100 = Dec-12 to solutions that help dealers make their sales processes more efficient; • iCarros Club: B2B trade-in platform for used vehicles with bidding 109 features and online purchase, allows contact between sellers and buyers, 100 guarantees the best offer for the vehicle, through more than 8,000 dealers all over Brazil; 68 • Digital Contracting: digital contracting integrated to iCarros platform 54 and can connect to other e-commerce as dealers websites; 49 43 35 34 • Digital Assistant: online credit analysis and approval platform. Automatically qualifies customer purchase interest via Internet or mobile, without additional cost; • Compra e Venda Protegida: this product mediates between the parties involved making trading safer; 2012 2013 2014 2015 2016 2017 2018 1Q19 • Financing of Accessories and Services: credit line for financing of accessories and services, already embedded in the vehicles installment. page 32Retail - Vehicle Financing in Brazil Highlights: Individuals and Corporate Individuals Portfolio Loans Granted • Growth of 31.6% in production (QoQ); R$ million R$ million • Offers finance through over 10 thousand dealers; 26.2% • Average ticket size of the new vehicle concessions to individuals of R$34 thousand with LTV of 60% in the 1Q19; 21,629 • 73.9% of the financing is guaranteed up to 4 years; 31.6% 5,071 17,137 • 86.7% of the financing are made up to 48 months; 2,820 Main Products and Services: 4,108 • Facial Recognition: Implantation of Facial Biometry, guaranteeing 3,122 16,559 14,316 security in the contracting process; 1,225 649 • Novo Credline: a redesigned proposal origination platform, offers a 2,883 2,472 simple and renewed digital experience with mobile version; 1Q18 1Q19 1Q18 1Q19 • Digital Platform: allows more agility, autonomy and efficiency for stores Individuals Corporate Individuals Corporate and dealers; 90-day NPL Ratio | Individuals - Vehicles • iCarros: platform that applies innovative technologies and data analysis Base 100 = Dec-12 to solutions that help dealers make their sales processes more efficient; • iCarros Club: B2B trade-in platform for used vehicles with bidding 109 features and online purchase, allows contact between sellers and buyers, 100 guarantees the best offer for the vehicle, through more than 8,000 dealers all over Brazil; 68 • Digital Contracting: digital contracting integrated to iCarros platform 54 and can connect to other e-commerce as dealers websites; 49 43 35 34 • Digital Assistant: online credit analysis and approval platform. Automatically qualifies customer purchase interest via Internet or mobile, without additional cost; • Compra e Venda Protegida: this product mediates between the parties involved making trading safer; 2012 2013 2014 2015 2016 2017 2018 1Q19 • Financing of Accessories and Services: credit line for financing of accessories and services, already embedded in the vehicles installment. page 32
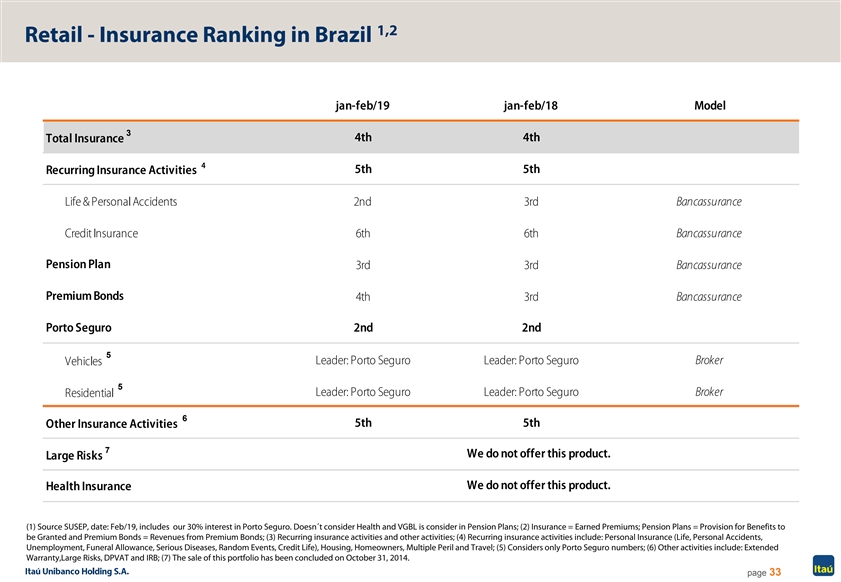
1,2 Retail - Insurance Ranking in Brazil jan-feb/19 jan-feb/18 Model 3 4th 4th Total Insurance 4 5th 5th Recurring Insurance Activities Life & Personal Accidents 2nd 3rd Bancassurance Credit Insurance 6th 6th Bancassurance Pension Plan Bancassurance 3rd 3rd Premium Bonds 4th 3rd Bancassurance Porto Seguro 2nd 2nd 5 Leader: Porto Seguro Leader: Porto Seguro Broker Vehicles 5 Broker Leader: Porto Seguro Leader: Porto Seguro Residential 6 5th 5th Other Insurance Activities 7 We do not offer this product. Large Risks We do not offer this product. Health Insurance (1) Source SUSEP, date: Feb/19, includes our 30% interest in Porto Seguro. Doesn´t consider Health and VGBL is consider in Pension Plans; (2) Insurance = Earned Premiums; Pension Plans = Provision for Benefits to be Granted and Premium Bonds = Revenues from Premium Bonds; (3) Recurring insurance activities and other activities; (4) Recurring insurance activities include: Personal Insurance (Life, Personal Accidents, Unemployment, Funeral Allowance, Serious Diseases, Random Events, Credit Life), Housing, Homeowners, Multiple Peril and Travel; (5) Considers only Porto Seguro numbers; (6) Other activities include: Extended Warranty,Large Risks, DPVAT and IRB; (7) The sale of this portfolio has been concluded on October 31, 2014. page 331,2 Retail - Insurance Ranking in Brazil jan-feb/19 jan-feb/18 Model 3 4th 4th Total Insurance 4 5th 5th Recurring Insurance Activities Life & Personal Accidents 2nd 3rd Bancassurance Credit Insurance 6th 6th Bancassurance Pension Plan Bancassurance 3rd 3rd Premium Bonds 4th 3rd Bancassurance Porto Seguro 2nd 2nd 5 Leader: Porto Seguro Leader: Porto Seguro Broker Vehicles 5 Broker Leader: Porto Seguro Leader: Porto Seguro Residential 6 5th 5th Other Insurance Activities 7 We do not offer this product. Large Risks We do not offer this product. Health Insurance (1) Source SUSEP, date: Feb/19, includes our 30% interest in Porto Seguro. Doesn´t consider Health and VGBL is consider in Pension Plans; (2) Insurance = Earned Premiums; Pension Plans = Provision for Benefits to be Granted and Premium Bonds = Revenues from Premium Bonds; (3) Recurring insurance activities and other activities; (4) Recurring insurance activities include: Personal Insurance (Life, Personal Accidents, Unemployment, Funeral Allowance, Serious Diseases, Random Events, Credit Life), Housing, Homeowners, Multiple Peril and Travel; (5) Considers only Porto Seguro numbers; (6) Other activities include: Extended Warranty,Large Risks, DPVAT and IRB; (7) The sale of this portfolio has been concluded on October 31, 2014. page 33
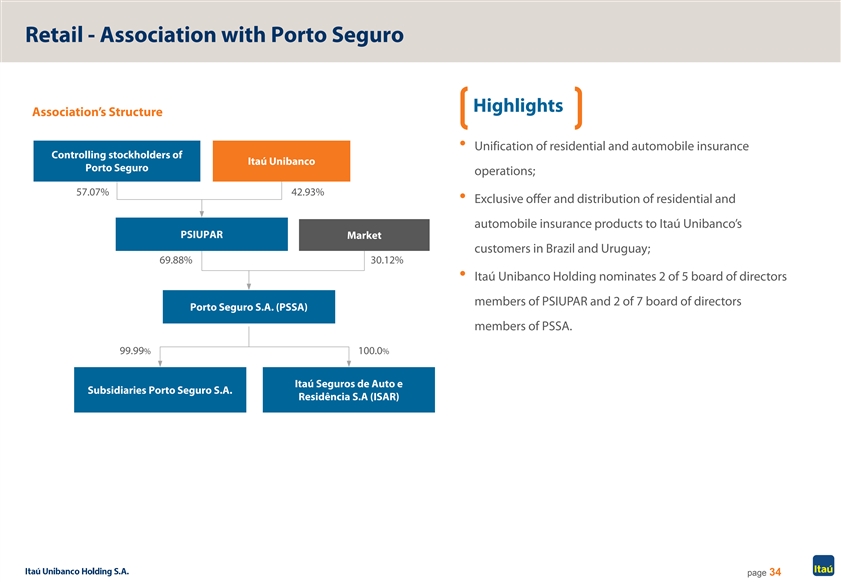
Retail - Association with Porto Seguro Highlights Association’s Structure • Unification of residential and automobile insurance Controlling stockholders of Itaú Unibanco Porto Seguro operations; 57.07% 42.93% • Exclusive offer and distribution of residential and automobile insurance products to Itaú Unibanco’s PSIUPAR Market customers in Brazil and Uruguay; 69.88% 30.12% • Itaú Unibanco Holding nominates 2 of 5 board of directors members of PSIUPAR and 2 of 7 board of directors Porto Seguro S.A. (PSSA) members of PSSA. 99.99% 100.0% Itaú Seguros de Auto e Subsidiaries Porto Seguro S.A. Residência S.A (ISAR) page 34Retail - Association with Porto Seguro Highlights Association’s Structure • Unification of residential and automobile insurance Controlling stockholders of Itaú Unibanco Porto Seguro operations; 57.07% 42.93% • Exclusive offer and distribution of residential and automobile insurance products to Itaú Unibanco’s PSIUPAR Market customers in Brazil and Uruguay; 69.88% 30.12% • Itaú Unibanco Holding nominates 2 of 5 board of directors members of PSIUPAR and 2 of 7 board of directors Porto Seguro S.A. (PSSA) members of PSSA. 99.99% 100.0% Itaú Seguros de Auto e Subsidiaries Porto Seguro S.A. Residência S.A (ISAR) page 34
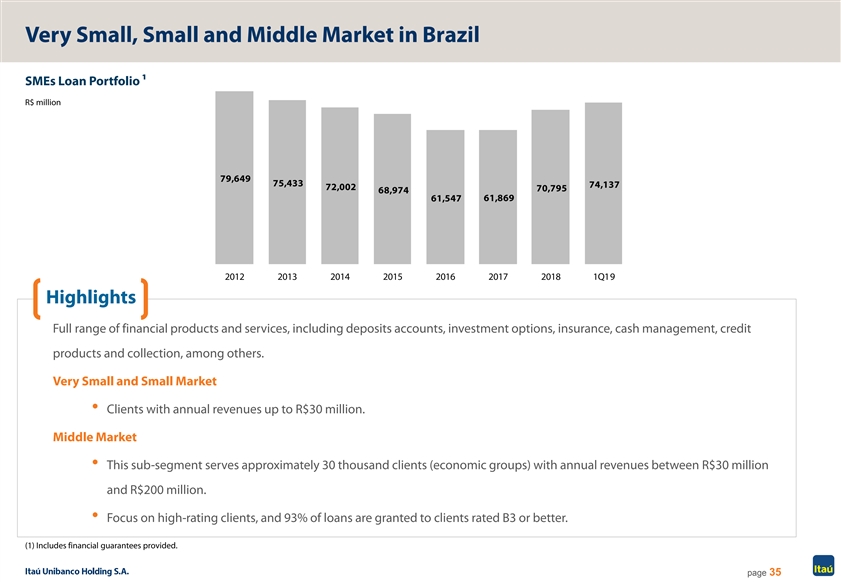
Very Small, Small and Middle Market in Brazil SMEs Loan Portfolio 1 R$ million 79,649 75,433 74,137 72,002 70,795 68,974 61,869 61,547 2012 2013 2014 2015 2016 2017 2018 1Q19 Highlights Full range of financial products and services, including deposits accounts, investment options, insurance, cash management, credit products and collection, among others. Very Small and Small Market • Clients with annual revenues up to R$30 million. Middle Market • This sub-segment serves approximately 30 thousand clients (economic groups) with annual revenues between R$30 million and R$200 million. • Focus on high-rating clients, and 93% of loans are granted to clients rated B3 or better. (1) Includes financial guarantees provided. page 35Very Small, Small and Middle Market in Brazil SMEs Loan Portfolio 1 R$ million 79,649 75,433 74,137 72,002 70,795 68,974 61,869 61,547 2012 2013 2014 2015 2016 2017 2018 1Q19 Highlights Full range of financial products and services, including deposits accounts, investment options, insurance, cash management, credit products and collection, among others. Very Small and Small Market • Clients with annual revenues up to R$30 million. Middle Market • This sub-segment serves approximately 30 thousand clients (economic groups) with annual revenues between R$30 million and R$200 million. • Focus on high-rating clients, and 93% of loans are granted to clients rated B3 or better. (1) Includes financial guarantees provided. page 35
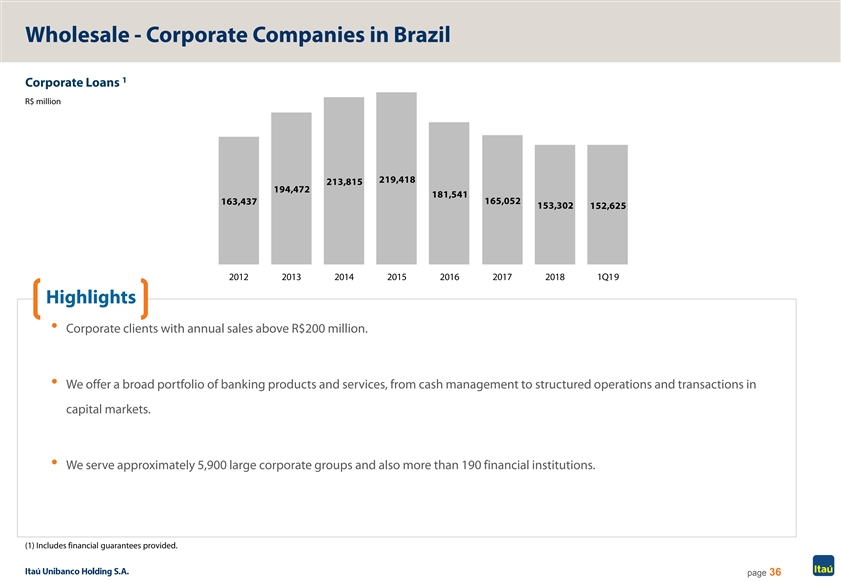
Wholesale - Corporate Companies in Brazil 1 Corporate Loans R$ million 219,418 213,815 194,472 181,541 165,052 163,437 153,302 152,625 2012 2013 2014 2015 2016 2017 2018 1Q19 Highlights • Corporate clients with annual sales above R$200 million. • We offer a broad portfolio of banking products and services, from cash management to structured operations and transactions in capital markets. • We serve approximately 5,900 large corporate groups and also more than 190 financial institutions. (1) Includes financial guarantees provided. page 36Wholesale - Corporate Companies in Brazil 1 Corporate Loans R$ million 219,418 213,815 194,472 181,541 165,052 163,437 153,302 152,625 2012 2013 2014 2015 2016 2017 2018 1Q19 Highlights • Corporate clients with annual sales above R$200 million. • We offer a broad portfolio of banking products and services, from cash management to structured operations and transactions in capital markets. • We serve approximately 5,900 large corporate groups and also more than 190 financial institutions. (1) Includes financial guarantees provided. page 36
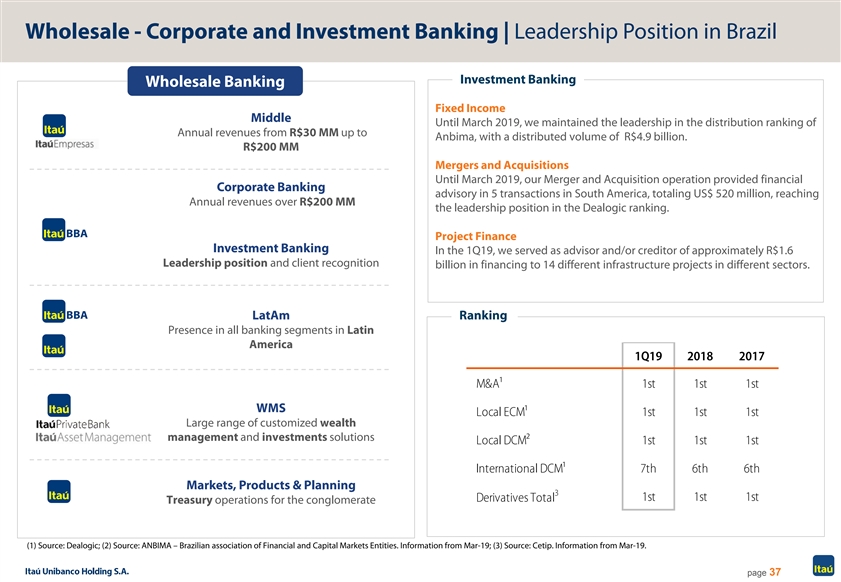
Wholesale - Corporate and Investment Banking | Leadership Position in Brazil Investment Banking Wholesale Banking Fixed Income Middle Until March 2019, we maintained the leadership in the distribution ranking of Annual revenues from R$30 MM up to Anbima, with a distributed volume of R$4.9 billion. R$200 MM Mergers and Acquisitions Until March 2019, our Merger and Acquisition operation provided financial Corporate Banking advisory in 5 transactions in South America, totaling US$ 520 million, reaching Annual revenues over R$200 MM the leadership position in the Dealogic ranking. Project Finance Investment Banking In the 1Q19, we served as advisor and/or creditor of approximately R$1.6 Leadership position and client recognition billion in financing to 14 different infrastructure projects in different sectors. LatAm Ranking Presence in all banking segments in Latin America 1Q19 2018 2017 M&A¹ 1st 1st 1st WMS Local ECM¹ 1st 1st 1st Large range of customized wealth management and investments solutions Local DCM² 1st 1st 1st International DCM¹ 7th 6th 6th Markets, Products & Planning 3 Derivatives Total 1st 1st 1st Treasury operations for the conglomerate (1) Source: Dealogic; (2) Source: ANBIMA – Brazilian association of Financial and Capital Markets Entities. Information from Mar-19; (3) Source: Cetip. Information from Mar-19. page 37Wholesale - Corporate and Investment Banking | Leadership Position in Brazil Investment Banking Wholesale Banking Fixed Income Middle Until March 2019, we maintained the leadership in the distribution ranking of Annual revenues from R$30 MM up to Anbima, with a distributed volume of R$4.9 billion. R$200 MM Mergers and Acquisitions Until March 2019, our Merger and Acquisition operation provided financial Corporate Banking advisory in 5 transactions in South America, totaling US$ 520 million, reaching Annual revenues over R$200 MM the leadership position in the Dealogic ranking. Project Finance Investment Banking In the 1Q19, we served as advisor and/or creditor of approximately R$1.6 Leadership position and client recognition billion in financing to 14 different infrastructure projects in different sectors. LatAm Ranking Presence in all banking segments in Latin America 1Q19 2018 2017 M&A¹ 1st 1st 1st WMS Local ECM¹ 1st 1st 1st Large range of customized wealth management and investments solutions Local DCM² 1st 1st 1st International DCM¹ 7th 6th 6th Markets, Products & Planning 3 Derivatives Total 1st 1st 1st Treasury operations for the conglomerate (1) Source: Dealogic; (2) Source: ANBIMA – Brazilian association of Financial and Capital Markets Entities. Information from Mar-19; (3) Source: Cetip. Information from Mar-19. page 37

Wholesale - Wealth Management Services | Brazil Asset Management Evolution of Assets Under Administration Investment Product management for the conglomerate and a full range of Asset Management investment options to Retail Banking. In March 2019, we reached R$686.51 bi llion in assets under management, 1,135 1,107 accounting for 14.4% of the market. 1,068 1,025 R$ billion 1,002 946 922 883 Kinea 849 It is an independent platform of management of differentiated investments. With R$56.5 billion in assets in March 2019, it operates in the segments of Multi-Markets, Real Estate, Pension Plan and Private Equity, Stock and Infrastructure. Private Banking With a full global wealth management platform, leadership position in Brazil. We have been recognized by the world’s top international Private Banking market publications: Mar-17 Jun-17 Sep-17 Dec-17 Mar-18 Jun-18 Sep-18 Dec-18 Mar-19 Private Banker International • Outstanding Global Private Bank - Latin America, 2018 Securities Services The Banker Local Custody: we ended March with R$1,368 billion under custody • Best Private Bank in Brazil, 2018 (+10.0% from the same period of 2018). International Custody: we ended March with R$284.0 billion under custody (+43.7% from the volume under custody in the same period of 2018). Corporate Solutions: we are leaders in the bookkeeping of shares, providing services to 195 companies listed on B3, representing 58.4% of the total market, and in the bookkeeping of debentures, acting as the bookkeeper of 362 (35.4%) issues. (1) Source: ANBIMA (Brazilian Financial and Capital Markets Association) – March 2019. Considers Itaú Unibanco and Intrag. page 38Wholesale - Wealth Management Services | Brazil Asset Management Evolution of Assets Under Administration Investment Product management for the conglomerate and a full range of Asset Management investment options to Retail Banking. In March 2019, we reached R$686.51 bi llion in assets under management, 1,135 1,107 accounting for 14.4% of the market. 1,068 1,025 R$ billion 1,002 946 922 883 Kinea 849 It is an independent platform of management of differentiated investments. With R$56.5 billion in assets in March 2019, it operates in the segments of Multi-Markets, Real Estate, Pension Plan and Private Equity, Stock and Infrastructure. Private Banking With a full global wealth management platform, leadership position in Brazil. We have been recognized by the world’s top international Private Banking market publications: Mar-17 Jun-17 Sep-17 Dec-17 Mar-18 Jun-18 Sep-18 Dec-18 Mar-19 Private Banker International • Outstanding Global Private Bank - Latin America, 2018 Securities Services The Banker Local Custody: we ended March with R$1,368 billion under custody • Best Private Bank in Brazil, 2018 (+10.0% from the same period of 2018). International Custody: we ended March with R$284.0 billion under custody (+43.7% from the volume under custody in the same period of 2018). Corporate Solutions: we are leaders in the bookkeeping of shares, providing services to 195 companies listed on B3, representing 58.4% of the total market, and in the bookkeeping of debentures, acting as the bookkeeper of 362 (35.4%) issues. (1) Source: ANBIMA (Brazilian Financial and Capital Markets Association) – March 2019. Considers Itaú Unibanco and Intrag. page 38

Retail Footprint in Latin America | March 2019 Mexico | CIB Employees: 8 Panama Colombia1 Employees: 3,484 Branches + CSBs: 163 ATMs: 172 Brazil Employees: 86,204 Peru Branches + CSBs: 4,413 Representative ATMs: 46,784 Office Paraguay Chile Employees: 855 Employees: 5,777 Branches + CSBs: 44 Branches + CSBs: 202 ATMs: 298 ATMs: 463 Non-Bank Correspondents : 59 Uruguay Argentina CIB Employees: 1,104 Employees: 1,688 Retail and Wholesale Branches + CSBs: 27 Branches + CSBs: 85 Points of Service OCA: 35 ATMs: 176 ATMs: 60 (1) Considers employees and branches from Panama. page 39Retail Footprint in Latin America | March 2019 Mexico | CIB Employees: 8 Panama Colombia1 Employees: 3,484 Branches + CSBs: 163 ATMs: 172 Brazil Employees: 86,204 Peru Branches + CSBs: 4,413 Representative ATMs: 46,784 Office Paraguay Chile Employees: 855 Employees: 5,777 Branches + CSBs: 44 Branches + CSBs: 202 ATMs: 298 ATMs: 463 Non-Bank Correspondents : 59 Uruguay Argentina CIB Employees: 1,104 Employees: 1,688 Retail and Wholesale Branches + CSBs: 27 Branches + CSBs: 85 Points of Service OCA: 35 ATMs: 176 ATMs: 60 (1) Considers employees and branches from Panama. page 39
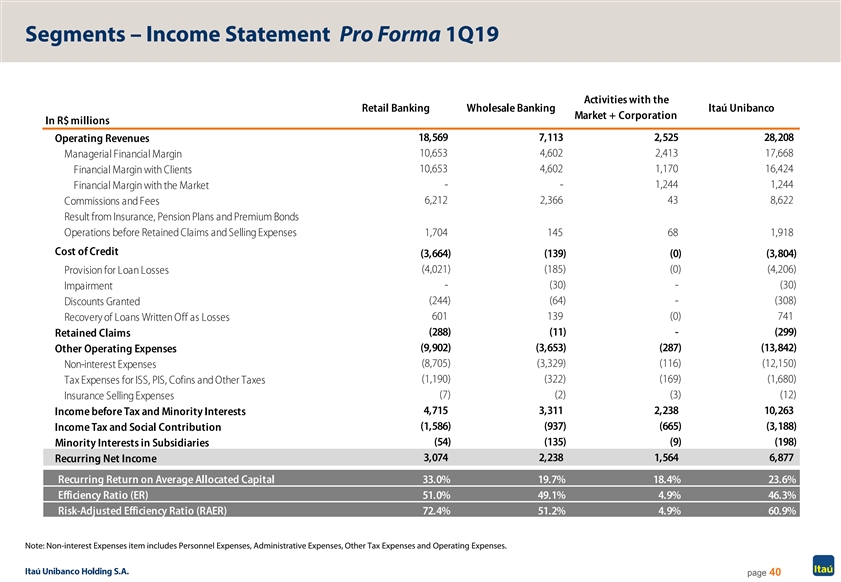
Segments – Income Statement Pro Forma 1Q19 Activities with the Retail Banking Wholesale Banking Itaú Unibanco Market + Corporation In R$ millions 18,569 7,113 2,525 28,208 Operating Revenues 10,653 4,602 2,413 17,668 Managerial Financial Margin 10,653 4,602 1,170 16,424 Financial Margin with Clients - - 1,244 1,244 Financial Margin with the Market 6,212 2,366 43 8,622 Commissions and Fees Result from Insurance, Pension Plans and Premium Bonds Operations before Retained Claims and Selling Expenses 1,704 145 68 1,918 Cost of Credit (3,664) (139) (0) (3,804) (4,021) (185) (0) (4,206) Provision for Loan Losses - (30) - (30) Impairment (244) (64) - (308) Discounts Granted 601 139 (0) 741 Recovery of Loans Written Off as Losses (288) (11) - (299) Retained Claims (9,902) (3,653) (287) (13,842) Other Operating Expenses (8,705) (3,329) (116) (12,150) Non-interest Expenses (1,190) (322) (169) (1,680) Tax Expenses for ISS, PIS, Cofins and Other Taxes (7) (2) (3) (12) Insurance Selling Expenses 4,715 3,311 2,238 10,263 Income before Tax and Minority Interests (1,586) (937) (665) (3,188) Income Tax and Social Contribution (54) (135) (9) (198) Minority Interests in Subsidiaries 3,074 2,238 1,564 6,877 Recurring Net Income Recurring Return on Average Allocated Capital 33.0% 19.7% 18.4% 23.6% Efficiency Ratio (ER) 51.0% 49.1% 4.9% 46.3% Risk-Adjusted Efficiency Ratio (RAER) 72.4% 51.2% 4.9% 60.9% Note: Non-interest Expenses item includes Personnel Expenses, Administrative Expenses, Other Tax Expenses and Operating Expenses. page 40Segments – Income Statement Pro Forma 1Q19 Activities with the Retail Banking Wholesale Banking Itaú Unibanco Market + Corporation In R$ millions 18,569 7,113 2,525 28,208 Operating Revenues 10,653 4,602 2,413 17,668 Managerial Financial Margin 10,653 4,602 1,170 16,424 Financial Margin with Clients - - 1,244 1,244 Financial Margin with the Market 6,212 2,366 43 8,622 Commissions and Fees Result from Insurance, Pension Plans and Premium Bonds Operations before Retained Claims and Selling Expenses 1,704 145 68 1,918 Cost of Credit (3,664) (139) (0) (3,804) (4,021) (185) (0) (4,206) Provision for Loan Losses - (30) - (30) Impairment (244) (64) - (308) Discounts Granted 601 139 (0) 741 Recovery of Loans Written Off as Losses (288) (11) - (299) Retained Claims (9,902) (3,653) (287) (13,842) Other Operating Expenses (8,705) (3,329) (116) (12,150) Non-interest Expenses (1,190) (322) (169) (1,680) Tax Expenses for ISS, PIS, Cofins and Other Taxes (7) (2) (3) (12) Insurance Selling Expenses 4,715 3,311 2,238 10,263 Income before Tax and Minority Interests (1,586) (937) (665) (3,188) Income Tax and Social Contribution (54) (135) (9) (198) Minority Interests in Subsidiaries 3,074 2,238 1,564 6,877 Recurring Net Income Recurring Return on Average Allocated Capital 33.0% 19.7% 18.4% 23.6% Efficiency Ratio (ER) 51.0% 49.1% 4.9% 46.3% Risk-Adjusted Efficiency Ratio (RAER) 72.4% 51.2% 4.9% 60.9% Note: Non-interest Expenses item includes Personnel Expenses, Administrative Expenses, Other Tax Expenses and Operating Expenses. page 40

Financial Highlights 4Financial Highlights 4

Highlights Recurring Net Income Recurring ROE Credit1 NPL 90 days Consolidated Consolidated Consolidated Consolidated 140 bps 7.7 % 7.1 % 10 bps R$647.1 bi R$6.9 bn 1Q19 vs. 1Q18 1Q19 vs. 1Q18 23.6% 1Q19 vs. 1Q18 3.0% 1Q19 vs. 1Q18 Brazil Brasil Brazil Brasil 110 bps 6.5 % 0.0 bp 4.6 % 1Q19 vs. 1Q18 R$480.4 bi 1Q19 vs. 1Q18 R$6.5 bn 24.8% 3.7% 1Q19 vs. 1Q18 1Q19 vs. 1Q18 6.9 23.6 647.1 3.0 6.4 6.4 6.5 6.5 22.2 21.6 21.3 21.8 601.1 623.3 636.4 636.9 3.1 2.8 2.9 2.9 1Q18 2Q18 3Q18 4Q18 1Q19 1Q18 2Q18 3Q18 4Q18 1Q19 1Q18 2Q18 3Q18 4Q18 1Q19 1Q18 2Q18 3Q18 4Q18 1Q19 Comission, Fees and Insurance Results2 Cost of Credit Financial Margin with Clients Non-Interest Expenses Consolidated Consolidated Consolidated Consolidated 1.0 % 0.4 % 4.1 % 7.6 % R$16.4 bn 1Q19 vs. 1Q18 R$10.2 bn 1Q19 vs. 1Q18 R$3.8 bn 1Q19 vs. 1Q18 R$12.1 bn 1Q19 vs. 1Q18 Brazil Brazil Brazil Brazil 6.3 % 0.3 % 2.1 % 4.1 % R$14.7 bn 1Q19 vs. 1Q18 R$9.5 bn 1Q19 vs. 1Q18 R$3.4 bn 1Q19 vs. 1Q18 R$10.5 bn 1Q19 vs. 1Q18 16.4 10.2 3.8 12.1 15.3 16.0 16.2 16.2 10.1 10.4 10.2 10.8 3.8 3.6 3.3 3.4 11.7 12.3 12.6 12.8 1Q18 2Q18 3Q18 4Q18 1Q19 1Q18 2Q18 3Q18 4Q18 1Q19 1Q18 2Q18 3Q18 4Q18 1Q19 1Q18 2Q18 3Q18 4Q18 1Q19 (1) Total with Financial Guarantees provided and Corporate Securities. (2) Results from Insurance (-) Claims Expenses (-) Insurance Selling Expenses. page 42Highlights Recurring Net Income Recurring ROE Credit1 NPL 90 days Consolidated Consolidated Consolidated Consolidated 140 bps 7.7 % 7.1 % 10 bps R$647.1 bi R$6.9 bn 1Q19 vs. 1Q18 1Q19 vs. 1Q18 23.6% 1Q19 vs. 1Q18 3.0% 1Q19 vs. 1Q18 Brazil Brasil Brazil Brasil 110 bps 6.5 % 0.0 bp 4.6 % 1Q19 vs. 1Q18 R$480.4 bi 1Q19 vs. 1Q18 R$6.5 bn 24.8% 3.7% 1Q19 vs. 1Q18 1Q19 vs. 1Q18 6.9 23.6 647.1 3.0 6.4 6.4 6.5 6.5 22.2 21.6 21.3 21.8 601.1 623.3 636.4 636.9 3.1 2.8 2.9 2.9 1Q18 2Q18 3Q18 4Q18 1Q19 1Q18 2Q18 3Q18 4Q18 1Q19 1Q18 2Q18 3Q18 4Q18 1Q19 1Q18 2Q18 3Q18 4Q18 1Q19 Comission, Fees and Insurance Results2 Cost of Credit Financial Margin with Clients Non-Interest Expenses Consolidated Consolidated Consolidated Consolidated 1.0 % 0.4 % 4.1 % 7.6 % R$16.4 bn 1Q19 vs. 1Q18 R$10.2 bn 1Q19 vs. 1Q18 R$3.8 bn 1Q19 vs. 1Q18 R$12.1 bn 1Q19 vs. 1Q18 Brazil Brazil Brazil Brazil 6.3 % 0.3 % 2.1 % 4.1 % R$14.7 bn 1Q19 vs. 1Q18 R$9.5 bn 1Q19 vs. 1Q18 R$3.4 bn 1Q19 vs. 1Q18 R$10.5 bn 1Q19 vs. 1Q18 16.4 10.2 3.8 12.1 15.3 16.0 16.2 16.2 10.1 10.4 10.2 10.8 3.8 3.6 3.3 3.4 11.7 12.3 12.6 12.8 1Q18 2Q18 3Q18 4Q18 1Q19 1Q18 2Q18 3Q18 4Q18 1Q19 1Q18 2Q18 3Q18 4Q18 1Q19 1Q18 2Q18 3Q18 4Q18 1Q19 (1) Total with Financial Guarantees provided and Corporate Securities. (2) Results from Insurance (-) Claims Expenses (-) Insurance Selling Expenses. page 42

2019 Forecast Consolidated Brazil ¹ Previous Revised Previous Revised Total Credit Portfolio ² Unchanged 8.0% Unchanged 8.0% 11.0% 11.0% Financial Margin with Clients 9.5% 9.0% 9.5% 9.0% 12.5% 12.0% 12.5% 12.0% Financial Margin with the Market R$4.6 bn R$5.6 bn R$3.6 bn R$4.6 bn Unchanged Unchanged Cost of Credit ³ Unchanged Unchanged R$17.5 bn R$15.5 bn R$14.5 bn R$12.5 bn Commissions and Fees and Results 4 3.0% 6.0% 2.0% 5.0% 3.0% 6.0% 2.0% 5.0% from Insurance Operations Non-Interest Expenses 5.0% 8.0% 3.0% 6.0% 5.5% 8.5% 3.5% 6.5% Effective Tax Rate 31.0% 33.0% Unchanged 32.0% 34.0% Unchanged (1) Includes units abroad ex-Latin America; (2) Includes financial guarantees provided and corporate securities; (3) Composed of Result from Loan Losses, Impairment and Discounts Granted; (4) Commissions and Fees (+) Income from Insurance, Pension Plan and Premium Bonds Operations (-) Expenses for Claims (-) Insurance, Pension Plan and Premium Bonds Selling Expenses. pg. 432019 Forecast Consolidated Brazil ¹ Previous Revised Previous Revised Total Credit Portfolio ² Unchanged 8.0% Unchanged 8.0% 11.0% 11.0% Financial Margin with Clients 9.5% 9.0% 9.5% 9.0% 12.5% 12.0% 12.5% 12.0% Financial Margin with the Market R$4.6 bn R$5.6 bn R$3.6 bn R$4.6 bn Unchanged Unchanged Cost of Credit ³ Unchanged Unchanged R$17.5 bn R$15.5 bn R$14.5 bn R$12.5 bn Commissions and Fees and Results 4 3.0% 6.0% 2.0% 5.0% 3.0% 6.0% 2.0% 5.0% from Insurance Operations Non-Interest Expenses 5.0% 8.0% 3.0% 6.0% 5.5% 8.5% 3.5% 6.5% Effective Tax Rate 31.0% 33.0% Unchanged 32.0% 34.0% Unchanged (1) Includes units abroad ex-Latin America; (2) Includes financial guarantees provided and corporate securities; (3) Composed of Result from Loan Losses, Impairment and Discounts Granted; (4) Commissions and Fees (+) Income from Insurance, Pension Plan and Premium Bonds Operations (-) Expenses for Claims (-) Insurance, Pension Plan and Premium Bonds Selling Expenses. pg. 43

Recurring Net Income and Value Creation 23.6% 22.2% 21.9% 21.8% 21.6% 21.3% ROE Average Cost of Capital 14.5% 14.5% 14.0% 13.5% 13.5% 13.5% Recurring Net Income 6.9 6.5 6.5 6.4 6.4 6.3 2.0 Value Creation 2.9 2.2 2.0 2.5 2.5 4.5 4.3 4.3 Cost of Capital 4.0 3.9 3.9 4Q17 1Q18 2Q18 3Q18 4Q18 1Q19 page 44 In R$ billionRecurring Net Income and Value Creation 23.6% 22.2% 21.9% 21.8% 21.6% 21.3% ROE Average Cost of Capital 14.5% 14.5% 14.0% 13.5% 13.5% 13.5% Recurring Net Income 6.9 6.5 6.5 6.4 6.4 6.3 2.0 Value Creation 2.9 2.2 2.0 2.5 2.5 4.5 4.3 4.3 Cost of Capital 4.0 3.9 3.9 4Q17 1Q18 2Q18 3Q18 4Q18 1Q19 page 44 In R$ billion
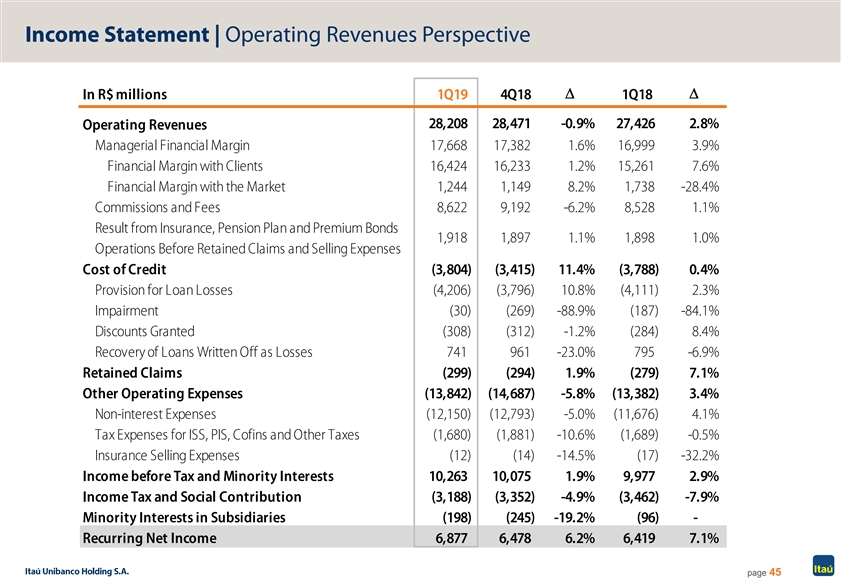
Income Statement | Operating Revenues Perspective DD In R$ millions 1Q19 4Q18 1Q18 28,208 28,471 -0.9% 27,426 2.8% Operating Revenues Managerial Financial Margin 17,668 17,382 1.6% 16,999 3.9% Financial Margin with Clients 16,424 16,233 1.2% 15,261 7.6% Financial Margin with the Market 1,244 1,149 8.2% 1,738 -28.4% Commissions and Fees 8,622 9,192 -6.2% 8,528 1.1% Result from Insurance, Pension Plan and Premium Bonds 1,918 1,897 1.1% 1,898 1.0% Operations Before Retained Claims and Selling Expenses Cost of Credit (3,804) (3,415) 11.4% (3,788) 0.4% Provision for Loan Losses (4,206) (3,796) 10.8% (4,111) 2.3% Impairment (30) (269) -88.9% (187) -84.1% Discounts Granted (308) (312) -1.2% (284) 8.4% Recovery of Loans Written Off as Losses 741 961 -23.0% 795 -6.9% Retained Claims (299) (294) 1.9% (279) 7.1% Other Operating Expenses (13,842) (14,687) -5.8% (13,382) 3.4% Non-interest Expenses (12,150) (12,793) -5.0% (11,676) 4.1% Tax Expenses for ISS, PIS, Cofins and Other Taxes (1,680) (1,881) -10.6% (1,689) -0.5% Insurance Selling Expenses (12) (14) -14.5% (17) -32.2% Income before Tax and Minority Interests 10,263 10,075 1.9% 9,977 2.9% Income Tax and Social Contribution (3,188) (3,352) -4.9% (3,462) -7.9% Minority Interests in Subsidiaries (198) (245) -19.2% (96) - Recurring Net Income 6,877 6,478 6.2% 6,419 7.1% page 45Income Statement | Operating Revenues Perspective DD In R$ millions 1Q19 4Q18 1Q18 28,208 28,471 -0.9% 27,426 2.8% Operating Revenues Managerial Financial Margin 17,668 17,382 1.6% 16,999 3.9% Financial Margin with Clients 16,424 16,233 1.2% 15,261 7.6% Financial Margin with the Market 1,244 1,149 8.2% 1,738 -28.4% Commissions and Fees 8,622 9,192 -6.2% 8,528 1.1% Result from Insurance, Pension Plan and Premium Bonds 1,918 1,897 1.1% 1,898 1.0% Operations Before Retained Claims and Selling Expenses Cost of Credit (3,804) (3,415) 11.4% (3,788) 0.4% Provision for Loan Losses (4,206) (3,796) 10.8% (4,111) 2.3% Impairment (30) (269) -88.9% (187) -84.1% Discounts Granted (308) (312) -1.2% (284) 8.4% Recovery of Loans Written Off as Losses 741 961 -23.0% 795 -6.9% Retained Claims (299) (294) 1.9% (279) 7.1% Other Operating Expenses (13,842) (14,687) -5.8% (13,382) 3.4% Non-interest Expenses (12,150) (12,793) -5.0% (11,676) 4.1% Tax Expenses for ISS, PIS, Cofins and Other Taxes (1,680) (1,881) -10.6% (1,689) -0.5% Insurance Selling Expenses (12) (14) -14.5% (17) -32.2% Income before Tax and Minority Interests 10,263 10,075 1.9% 9,977 2.9% Income Tax and Social Contribution (3,188) (3,352) -4.9% (3,462) -7.9% Minority Interests in Subsidiaries (198) (245) -19.2% (96) - Recurring Net Income 6,877 6,478 6.2% 6,419 7.1% page 45
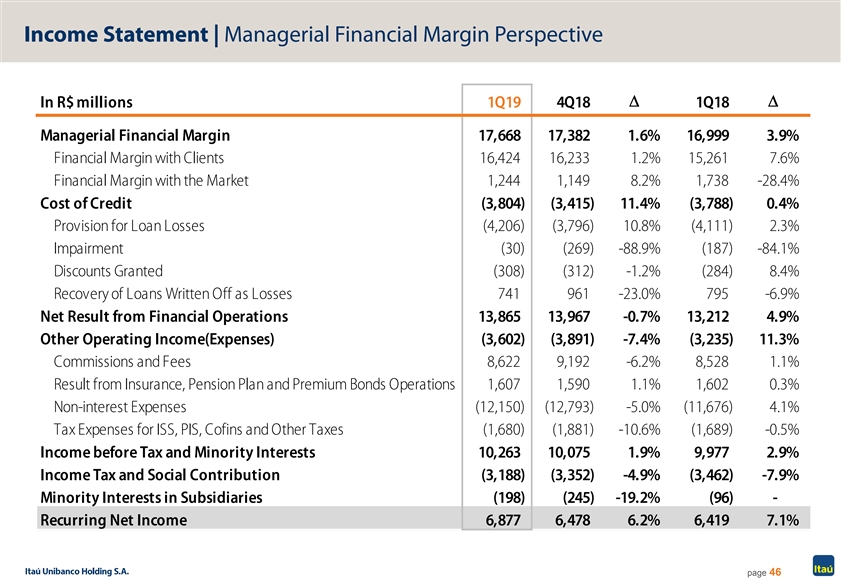
Income Statement | Managerial Financial Margin Perspective DD In R$ millions 1Q19 4Q18 1Q18 Managerial Financial Margin 17,668 17,382 1.6% 16,999 3.9% Financial Margin with Clients 16,424 16,233 1.2% 15,261 7.6% Financial Margin with the Market 1,244 1,149 8.2% 1,738 -28.4% Cost of Credit (3,804) (3,415) 11.4% (3,788) 0.4% Provision for Loan Losses (4,206) (3,796) 10.8% (4,111) 2.3% Impairment (30) (269) -88.9% (187) -84.1% Discounts Granted (308) (312) -1.2% (284) 8.4% Recovery of Loans Written Off as Losses 741 961 -23.0% 795 -6.9% Net Result from Financial Operations 13,865 13,967 -0.7% 13,212 4.9% Other Operating Income(Expenses) (3,602) (3,891) -7.4% (3,235) 11.3% Commissions and Fees 8,622 9,192 -6.2% 8,528 1.1% Result from Insurance, Pension Plan and Premium Bonds Operations 1,607 1,590 1.1% 1,602 0.3% Non-interest Expenses (12,150) (12,793) -5.0% (11,676) 4.1% Tax Expenses for ISS, PIS, Cofins and Other Taxes (1,680) (1,881) -10.6% (1,689) -0.5% Income before Tax and Minority Interests 10,263 10,075 1.9% 9,977 2.9% Income Tax and Social Contribution (3,188) (3,352) -4.9% (3,462) -7.9% Minority Interests in Subsidiaries (198) (245) -19.2% (96) - Recurring Net Income 6,877 6,478 6.2% 6,419 7.1% page 46Income Statement | Managerial Financial Margin Perspective DD In R$ millions 1Q19 4Q18 1Q18 Managerial Financial Margin 17,668 17,382 1.6% 16,999 3.9% Financial Margin with Clients 16,424 16,233 1.2% 15,261 7.6% Financial Margin with the Market 1,244 1,149 8.2% 1,738 -28.4% Cost of Credit (3,804) (3,415) 11.4% (3,788) 0.4% Provision for Loan Losses (4,206) (3,796) 10.8% (4,111) 2.3% Impairment (30) (269) -88.9% (187) -84.1% Discounts Granted (308) (312) -1.2% (284) 8.4% Recovery of Loans Written Off as Losses 741 961 -23.0% 795 -6.9% Net Result from Financial Operations 13,865 13,967 -0.7% 13,212 4.9% Other Operating Income(Expenses) (3,602) (3,891) -7.4% (3,235) 11.3% Commissions and Fees 8,622 9,192 -6.2% 8,528 1.1% Result from Insurance, Pension Plan and Premium Bonds Operations 1,607 1,590 1.1% 1,602 0.3% Non-interest Expenses (12,150) (12,793) -5.0% (11,676) 4.1% Tax Expenses for ISS, PIS, Cofins and Other Taxes (1,680) (1,881) -10.6% (1,689) -0.5% Income before Tax and Minority Interests 10,263 10,075 1.9% 9,977 2.9% Income Tax and Social Contribution (3,188) (3,352) -4.9% (3,462) -7.9% Minority Interests in Subsidiaries (198) (245) -19.2% (96) - Recurring Net Income 6,877 6,478 6.2% 6,419 7.1% page 46
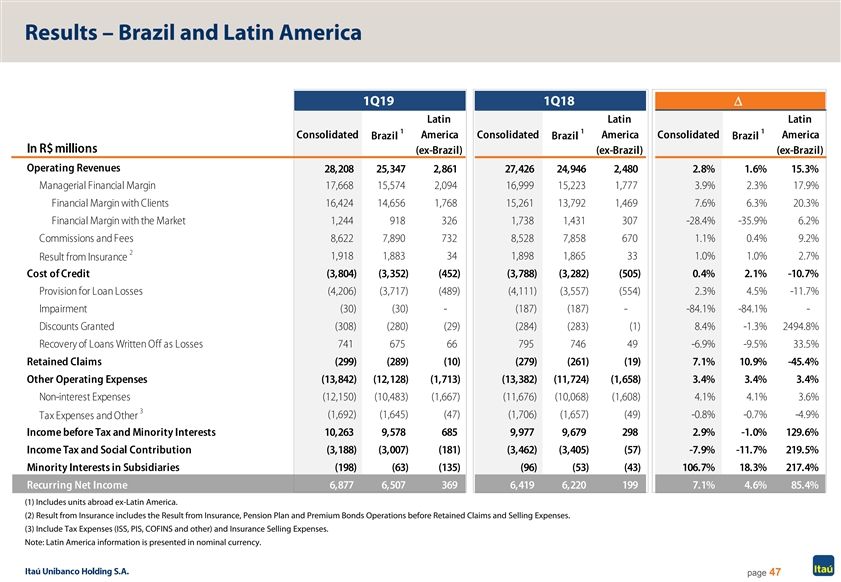
Results – Brazil and Latin America 1Q19 1Q18 D Latin Latin Latin 1 1 1 Consolidated America Consolidated America Consolidated America Brazil Brazil Brazil In R$ millions (ex-Brazil) (ex-Brazil) (ex-Brazil) Operating Revenues 28,208 25,347 2,861 27,426 24,946 2 ,480 2.8% 1.6% 15.3% Managerial Financial Margin 1 7,668 15,574 2,094 16,999 15,223 1,777 3.9% 2.3% 17.9% Financial Margin with Clients 16,424 14,656 1,768 15,261 13,792 1,469 7.6% 6.3% 20.3% Financial Margin with the Market 1,244 918 326 1,738 1,431 307 -28.4% -35.9% 6.2% Commissions and Fees 8,622 7,890 732 8,528 7,858 670 1.1% 0.4% 9.2% 2 1,918 1,883 34 1,898 1,865 33 1.0% 1.0% 2.7% Result from Insurance Cost of Credit (3,804) (3,352) (452) (3,788) (3,282) (505) 0.4% 2.1% -10.7% Provision for Loan Losses (4,206) (3,717) (489) (4,111) (3,557) (554) 2.3% 4.5% -11.7% Impairment (30) (30) - (187) (187) - -84.1% -84.1% - Discounts Granted (308) (280) (29) (284) (283) (1) 8.4% -1.3% 2494.8% Recovery of Loans Written Off as Losses 741 675 66 795 746 49 -6.9% -9.5% 33.5% Retained Claims (299) (289) (10) (279) (261) ( 19) 7.1% 10.9% -45.4% Other Operating Expenses (13,842) (12,128) (1,713) (13,382) (11,724) (1,658) 3.4% 3.4% 3.4% Non-interest Expenses (12,150) (10,483) (1 ,667) (11,676) (10,068) (1,608) 4.1% 4.1% 3.6% 3 (1,692) (1,645) (47) (1,706) (1,657) ( 49) -0.8% -0.7% -4.9% Tax Expenses and Other Income before Tax and Minority Interests 10,263 9,578 685 9,977 9 ,679 298 2.9% -1.0% 129.6% Income Tax and Social Contribution (3,188) (3,007) (181) (3,462) (3,405) ( 57) -7.9% -11.7% 219.5% Minority Interests in Subsidiaries (198) (63) (135) (96) ( 53) ( 43) 106.7% 18.3% 217.4% Recurring Net Income 6,877 6,507 369 6 ,419 6 ,220 199 7.1% 4.6% 85.4% (1) Includes units abroad ex-Latin America. (2) Result from Insurance includes the Result from Insurance, Pension Plan and Premium Bonds Operations before Retained Claims and Selling Expenses. (3) Include Tax Expenses (ISS, PIS, COFINS and other) and Insurance Selling Expenses. Note: Latin America information is presented in nominal currency. page 47Results – Brazil and Latin America 1Q19 1Q18 D Latin Latin Latin 1 1 1 Consolidated America Consolidated America Consolidated America Brazil Brazil Brazil In R$ millions (ex-Brazil) (ex-Brazil) (ex-Brazil) Operating Revenues 28,208 25,347 2,861 27,426 24,946 2 ,480 2.8% 1.6% 15.3% Managerial Financial Margin 1 7,668 15,574 2,094 16,999 15,223 1,777 3.9% 2.3% 17.9% Financial Margin with Clients 16,424 14,656 1,768 15,261 13,792 1,469 7.6% 6.3% 20.3% Financial Margin with the Market 1,244 918 326 1,738 1,431 307 -28.4% -35.9% 6.2% Commissions and Fees 8,622 7,890 732 8,528 7,858 670 1.1% 0.4% 9.2% 2 1,918 1,883 34 1,898 1,865 33 1.0% 1.0% 2.7% Result from Insurance Cost of Credit (3,804) (3,352) (452) (3,788) (3,282) (505) 0.4% 2.1% -10.7% Provision for Loan Losses (4,206) (3,717) (489) (4,111) (3,557) (554) 2.3% 4.5% -11.7% Impairment (30) (30) - (187) (187) - -84.1% -84.1% - Discounts Granted (308) (280) (29) (284) (283) (1) 8.4% -1.3% 2494.8% Recovery of Loans Written Off as Losses 741 675 66 795 746 49 -6.9% -9.5% 33.5% Retained Claims (299) (289) (10) (279) (261) ( 19) 7.1% 10.9% -45.4% Other Operating Expenses (13,842) (12,128) (1,713) (13,382) (11,724) (1,658) 3.4% 3.4% 3.4% Non-interest Expenses (12,150) (10,483) (1 ,667) (11,676) (10,068) (1,608) 4.1% 4.1% 3.6% 3 (1,692) (1,645) (47) (1,706) (1,657) ( 49) -0.8% -0.7% -4.9% Tax Expenses and Other Income before Tax and Minority Interests 10,263 9,578 685 9,977 9 ,679 298 2.9% -1.0% 129.6% Income Tax and Social Contribution (3,188) (3,007) (181) (3,462) (3,405) ( 57) -7.9% -11.7% 219.5% Minority Interests in Subsidiaries (198) (63) (135) (96) ( 53) ( 43) 106.7% 18.3% 217.4% Recurring Net Income 6,877 6,507 369 6 ,419 6 ,220 199 7.1% 4.6% 85.4% (1) Includes units abroad ex-Latin America. (2) Result from Insurance includes the Result from Insurance, Pension Plan and Premium Bonds Operations before Retained Claims and Selling Expenses. (3) Include Tax Expenses (ISS, PIS, COFINS and other) and Insurance Selling Expenses. Note: Latin America information is presented in nominal currency. page 47
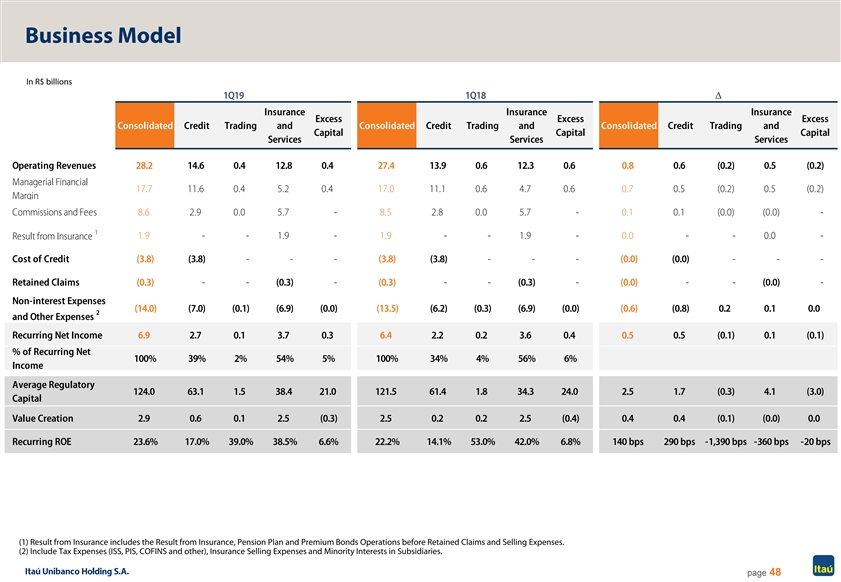
Business Model In R$ billions 1Q19 1Q18D Insurance Insurance Insurance Excess Excess Excess Consolidated Credit Trading and Consolidated Credit Trading and Consolidated Credit Trading and Capital Capital Capital Services Services Services Operating Revenues 28.2 14.6 0.4 12.8 0.4 27.4 13.9 0.6 12.3 0.6 0.8 0.6 (0.2) 0.5 (0.2) Managerial Financial 17.7 11.6 0.4 5.2 0.4 17.0 11.1 0.6 4.7 0.6 0.7 0.5 (0.2) 0.5 (0.2) Margin Commissions and Fees 8.6 2.9 0.0 5.7 - 8.5 2.8 0.0 5.7 - 0.1 0.1 (0.0) (0.0) - 1 1.9 - - 1.9 - 1.9 - - 1.9 - 0.0 - - 0.0 - Result from Insurance Cost of Credit (3.8) (3.8) - - - (3.8) (3.8) - - - (0.0) (0.0) - - - Retained Claims (0.3) - - (0.3) - (0.3) - - (0.3) - (0.0) - - (0.0) - Non-interest Expenses (14.0) (7.0) (0.1) (6.9) (0.0) (13.5) (6.2) (0.3) (6.9) (0.0) (0.6) (0.8) 0.2 0.1 0.0 2 and Other Expenses Recurring Net Income 6.9 2.7 0.1 3.7 0.3 6.4 2.2 0.2 3.6 0.4 0.5 0.5 (0.1) 0.1 (0.1) % of Recurring Net 100% 39% 2% 54% 5% 100% 34% 4% 56% 6% Income Average Regulatory 124.0 63.1 1.5 38.4 21.0 121.5 61.4 1.8 34.3 24.0 2.5 1.7 (0.3) 4.1 (3.0) Capital Value Creation 2.9 0.6 0.1 2.5 (0.3) 2.5 0.2 0.2 2.5 (0.4) 0.4 0.4 (0.1) (0.0) 0.0 Recurring ROE 23.6% 17.0% 39.0% 38.5% 6.6% 22.2% 14.1% 53.0% 42.0% 6.8% 140 bps 290 bps -1,390 bps -360 bps -20 bps (1) Result from Insurance includes the Result from Insurance, Pension Plan and Premium Bonds Operations before Retained Claims and Selling Expenses. (2) Include Tax Expenses (ISS, PIS, COFINS and other), Insurance Selling Expenses and Minority Interests in Subsidiaries. page 48Business Model In R$ billions 1Q19 1Q18D Insurance Insurance Insurance Excess Excess Excess Consolidated Credit Trading and Consolidated Credit Trading and Consolidated Credit Trading and Capital Capital Capital Services Services Services Operating Revenues 28.2 14.6 0.4 12.8 0.4 27.4 13.9 0.6 12.3 0.6 0.8 0.6 (0.2) 0.5 (0.2) Managerial Financial 17.7 11.6 0.4 5.2 0.4 17.0 11.1 0.6 4.7 0.6 0.7 0.5 (0.2) 0.5 (0.2) Margin Commissions and Fees 8.6 2.9 0.0 5.7 - 8.5 2.8 0.0 5.7 - 0.1 0.1 (0.0) (0.0) - 1 1.9 - - 1.9 - 1.9 - - 1.9 - 0.0 - - 0.0 - Result from Insurance Cost of Credit (3.8) (3.8) - - - (3.8) (3.8) - - - (0.0) (0.0) - - - Retained Claims (0.3) - - (0.3) - (0.3) - - (0.3) - (0.0) - - (0.0) - Non-interest Expenses (14.0) (7.0) (0.1) (6.9) (0.0) (13.5) (6.2) (0.3) (6.9) (0.0) (0.6) (0.8) 0.2 0.1 0.0 2 and Other Expenses Recurring Net Income 6.9 2.7 0.1 3.7 0.3 6.4 2.2 0.2 3.6 0.4 0.5 0.5 (0.1) 0.1 (0.1) % of Recurring Net 100% 39% 2% 54% 5% 100% 34% 4% 56% 6% Income Average Regulatory 124.0 63.1 1.5 38.4 21.0 121.5 61.4 1.8 34.3 24.0 2.5 1.7 (0.3) 4.1 (3.0) Capital Value Creation 2.9 0.6 0.1 2.5 (0.3) 2.5 0.2 0.2 2.5 (0.4) 0.4 0.4 (0.1) (0.0) 0.0 Recurring ROE 23.6% 17.0% 39.0% 38.5% 6.6% 22.2% 14.1% 53.0% 42.0% 6.8% 140 bps 290 bps -1,390 bps -360 bps -20 bps (1) Result from Insurance includes the Result from Insurance, Pension Plan and Premium Bonds Operations before Retained Claims and Selling Expenses. (2) Include Tax Expenses (ISS, PIS, COFINS and other), Insurance Selling Expenses and Minority Interests in Subsidiaries. page 48
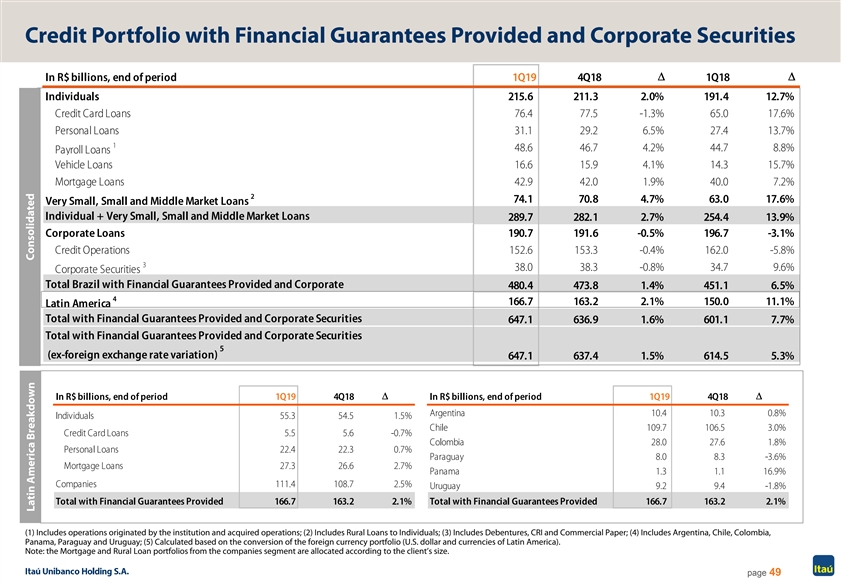
Credit Portfolio with Financial Guarantees Provided and Corporate Securities DD In R$ billions, end of period 1Q19 4Q18 1Q18 Individuals 215.6 211.3 2.0% 191.4 12.7% Credit Card Loans 76.4 77.5 -1.3% 65.0 17.6% Personal Loans 31.1 29.2 6.5% 27.4 13.7% 1 48.6 46.7 4.2% 44.7 8.8% Payroll Loans Vehicle Loans 16.6 15.9 4.1% 14.3 15.7% Mortgage Loans 42.9 42.0 1.9% 40.0 7.2% 2 74 .1 70.8 4.7% 63.0 17.6% Very Small, Small and Middle Market Loans Individual + Very Small, Small and Middle Market Loans 289.7 282.1 2.7% 254.4 13.9% Corporate Loans 190.7 191.6 -0.5% 196.7 -3.1% Credit Operations 152.6 1 53.3 -0.4% 162.0 -5.8% 3 38.0 38.3 -0.8% 34.7 9.6% Corporate Securities Total Brazil with Financial Guarantees Provided and Corporate 480.4 473.8 1.4% 451.1 6.5% 4 166.7 163.2 2.1% 150.0 11.1% Latin America Total with Financial Guarantees Provided and Corporate Securities 647.1 636.9 1.6% 601.1 7.7% Total with Financial Guarantees Provided and Corporate Securities 5 (ex-foreign exchange rate variation) 647.1 637.4 1.5% 614.5 5.3% DD In R$ billions, end of period 1Q19 4Q18 In R$ billions, end of period 1Q19 4Q18 Argentina 10.4 1 0.3 0.8% Individuals 55.3 54.5 1.5% Chile 109.7 106.5 3.0% Credit Card Loans 5.5 5.6 -0.7% Colombia 28.0 27.6 1.8% Personal Loans 22.4 22.3 0.7% Paraguay 8.0 8.3 -3.6% Mortgage Loans 27.3 26.6 2.7% Panama 1.3 1 .1 16.9% Companies 111.4 108.7 2.5% Uruguay 9 .2 9.4 -1.8% Total with Financial Guarantees Provided 166.7 163.2 2.1% Total with Financial Guarantees Provided 166.7 163.2 2.1% (1) Includes operations originated by the institution and acquired operations; (2) Includes Rural Loans to Individuals; (3) Includes Debentures, CRI and Commercial Paper; (4) Includes Argentina, Chile, Colombia, Panama, Paraguay and Uruguay; (5) Calculated based on the conversion of the foreign currency portfolio (U.S. dollar and currencies of Latin America). Note: the Mortgage and Rural Loan portfolios from the companies segment are allocated according to the client’s size. page 49 Consolidated Latin America BreakdownCredit Portfolio with Financial Guarantees Provided and Corporate Securities DD In R$ billions, end of period 1Q19 4Q18 1Q18 Individuals 215.6 211.3 2.0% 191.4 12.7% Credit Card Loans 76.4 77.5 -1.3% 65.0 17.6% Personal Loans 31.1 29.2 6.5% 27.4 13.7% 1 48.6 46.7 4.2% 44.7 8.8% Payroll Loans Vehicle Loans 16.6 15.9 4.1% 14.3 15.7% Mortgage Loans 42.9 42.0 1.9% 40.0 7.2% 2 74 .1 70.8 4.7% 63.0 17.6% Very Small, Small and Middle Market Loans Individual + Very Small, Small and Middle Market Loans 289.7 282.1 2.7% 254.4 13.9% Corporate Loans 190.7 191.6 -0.5% 196.7 -3.1% Credit Operations 152.6 1 53.3 -0.4% 162.0 -5.8% 3 38.0 38.3 -0.8% 34.7 9.6% Corporate Securities Total Brazil with Financial Guarantees Provided and Corporate 480.4 473.8 1.4% 451.1 6.5% 4 166.7 163.2 2.1% 150.0 11.1% Latin America Total with Financial Guarantees Provided and Corporate Securities 647.1 636.9 1.6% 601.1 7.7% Total with Financial Guarantees Provided and Corporate Securities 5 (ex-foreign exchange rate variation) 647.1 637.4 1.5% 614.5 5.3% DD In R$ billions, end of period 1Q19 4Q18 In R$ billions, end of period 1Q19 4Q18 Argentina 10.4 1 0.3 0.8% Individuals 55.3 54.5 1.5% Chile 109.7 106.5 3.0% Credit Card Loans 5.5 5.6 -0.7% Colombia 28.0 27.6 1.8% Personal Loans 22.4 22.3 0.7% Paraguay 8.0 8.3 -3.6% Mortgage Loans 27.3 26.6 2.7% Panama 1.3 1 .1 16.9% Companies 111.4 108.7 2.5% Uruguay 9 .2 9.4 -1.8% Total with Financial Guarantees Provided 166.7 163.2 2.1% Total with Financial Guarantees Provided 166.7 163.2 2.1% (1) Includes operations originated by the institution and acquired operations; (2) Includes Rural Loans to Individuals; (3) Includes Debentures, CRI and Commercial Paper; (4) Includes Argentina, Chile, Colombia, Panama, Paraguay and Uruguay; (5) Calculated based on the conversion of the foreign currency portfolio (U.S. dollar and currencies of Latin America). Note: the Mortgage and Rural Loan portfolios from the companies segment are allocated according to the client’s size. page 49 Consolidated Latin America Breakdown
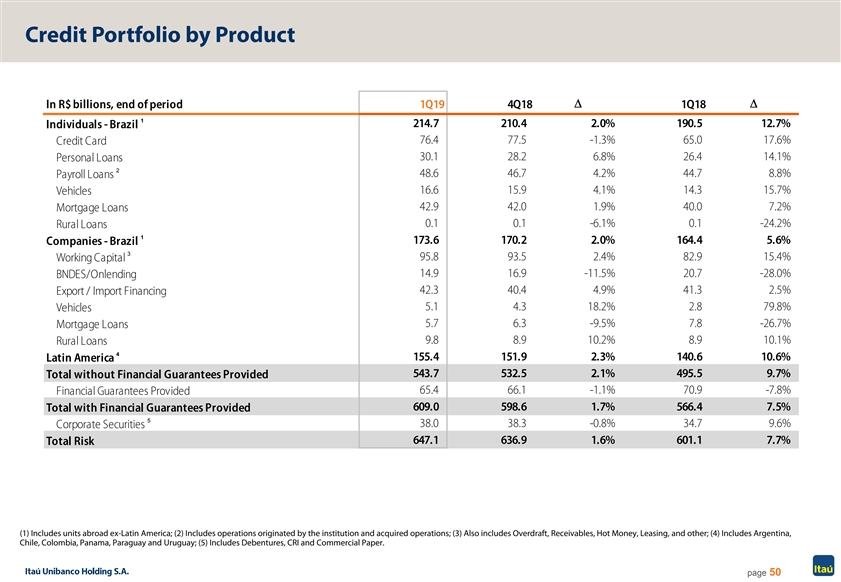
Credit Portfolio by Product In R$ billions, end of period 1Q19 4Q18D 1Q18 D 1 214.7 210.4 2.0% 190.5 12.7% Individuals - Brazil 76.4 77.5 -1.3% 65.0 17.6% Credit Card 30.1 28.2 6.8% 26.4 14.1% Personal Loans 2 48.6 46.7 4.2% 44.7 8.8% Payroll Loans 16.6 15.9 4.1% 14.3 15.7% Vehicles 42.9 42.0 1.9% 40.0 7.2% Mortgage Loans 0.1 0.1 -6.1% 0.1 -24.2% Rural Loans 1 173.6 170.2 2.0% 164.4 5.6% Companies - Brazil 3 95.8 93.5 2.4% 82.9 15.4% Working Capital 14.9 16.9 -11.5% 20.7 -28.0% BNDES/Onlending 42.3 40.4 4.9% 41.3 2.5% Export / Import Financing 5.1 4.3 18.2% 2.8 79.8% Vehicles 5.7 6.3 -9.5% 7.8 -26.7% Mortgage Loans 9.8 8.9 10.2% 8.9 10.1% Rural Loans 4 155.4 151.9 2.3% 140.6 10.6% Latin America 543.7 532.5 2.1% 495.5 9.7% Total without Financial Guarantees Provided 65.4 66.1 -1.1% 70.9 -7.8% Financial Guarantees Provided 609.0 598.6 1.7% 566.4 7.5% Total with Financial Guarantees Provided 5 38.0 38.3 -0.8% 34.7 9.6% Corporate Securities 647.1 636.9 1.6% 601.1 7.7% Total Risk (1) Includes units abroad ex-Latin America; (2) Includes operations originated by the institution and acquired operations; (3) Also includes Overdraft, Receivables, Hot Money, Leasing, and other; (4) Includes Argentina, Chile, Colombia, Panama, Paraguay and Uruguay; (5) Includes Debentures, CRI and Commercial Paper. page 50Credit Portfolio by Product In R$ billions, end of period 1Q19 4Q18D 1Q18 D 1 214.7 210.4 2.0% 190.5 12.7% Individuals - Brazil 76.4 77.5 -1.3% 65.0 17.6% Credit Card 30.1 28.2 6.8% 26.4 14.1% Personal Loans 2 48.6 46.7 4.2% 44.7 8.8% Payroll Loans 16.6 15.9 4.1% 14.3 15.7% Vehicles 42.9 42.0 1.9% 40.0 7.2% Mortgage Loans 0.1 0.1 -6.1% 0.1 -24.2% Rural Loans 1 173.6 170.2 2.0% 164.4 5.6% Companies - Brazil 3 95.8 93.5 2.4% 82.9 15.4% Working Capital 14.9 16.9 -11.5% 20.7 -28.0% BNDES/Onlending 42.3 40.4 4.9% 41.3 2.5% Export / Import Financing 5.1 4.3 18.2% 2.8 79.8% Vehicles 5.7 6.3 -9.5% 7.8 -26.7% Mortgage Loans 9.8 8.9 10.2% 8.9 10.1% Rural Loans 4 155.4 151.9 2.3% 140.6 10.6% Latin America 543.7 532.5 2.1% 495.5 9.7% Total without Financial Guarantees Provided 65.4 66.1 -1.1% 70.9 -7.8% Financial Guarantees Provided 609.0 598.6 1.7% 566.4 7.5% Total with Financial Guarantees Provided 5 38.0 38.3 -0.8% 34.7 9.6% Corporate Securities 647.1 636.9 1.6% 601.1 7.7% Total Risk (1) Includes units abroad ex-Latin America; (2) Includes operations originated by the institution and acquired operations; (3) Also includes Overdraft, Receivables, Hot Money, Leasing, and other; (4) Includes Argentina, Chile, Colombia, Panama, Paraguay and Uruguay; (5) Includes Debentures, CRI and Commercial Paper. page 50
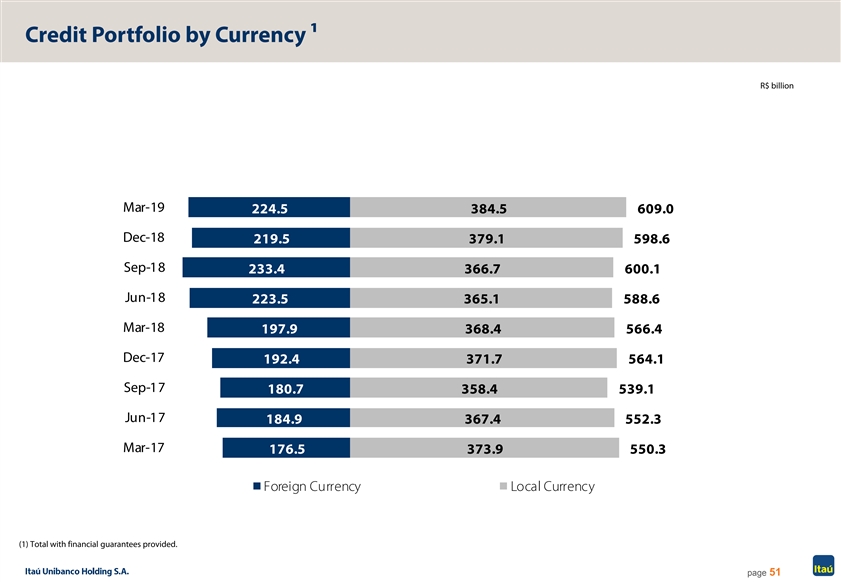
Credit Portfolio by Currency 1 R$ billion Mar-19 224.5 384.5 609.0 Dec-18 219.5 379.1 598.6 Sep-18 233.4 366.7 600.1 Jun-18 223.5 365.1 588.6 Mar-18 197.9 368.4 566.4 Dec-17 192.4 371.7 564.1 Sep-17 180.7 358.4 539.1 Jun-17 184.9 367.4 552.3 Mar-17 176.5 373.9 550.3 Foreign Currency Local Currency (1) Total with financial guarantees provided. page 51Credit Portfolio by Currency 1 R$ billion Mar-19 224.5 384.5 609.0 Dec-18 219.5 379.1 598.6 Sep-18 233.4 366.7 600.1 Jun-18 223.5 365.1 588.6 Mar-18 197.9 368.4 566.4 Dec-17 192.4 371.7 564.1 Sep-17 180.7 358.4 539.1 Jun-17 184.9 367.4 552.3 Mar-17 176.5 373.9 550.3 Foreign Currency Local Currency (1) Total with financial guarantees provided. page 51
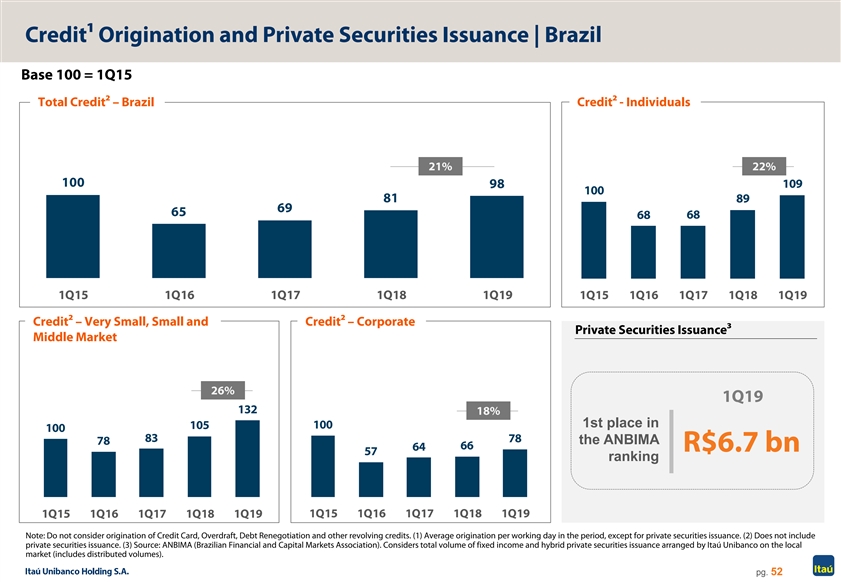
Credit1 Origination and Private Securities Issuance | Brazil Base 100 = 1Q15 Total Credit2 – Brazil Credit2 - Individuals 21% 22% 100 98 109 100 81 89 69 65 68 68 1Q15 1Q16 1Q17 1Q18 1Q19 1Q15 1Q16 1Q17 1Q18 1Q19 Credit2 – Very Small, Small and Credit2 – Corporate Private Securities Issuance3 Middle Market 26% 1Q19 132 18% 1st place in 100 105 100 83 78 78 the ANBIMA 66 64 R$6.7 bn 57 ranking 1Q15 1Q16 1Q17 1Q18 1Q19 1Q15 1Q16 1Q17 1Q18 1Q19 Note: Do not consider origination of Credit Card, Overdraft, Debt Renegotiation and other revolving credits. (1) Average origination per working day in the period, except for private securities issuance. (2) Does not include private securities issuance. (3) Source: ANBIMA (Brazilian Financial and Capital Markets Association). Considers total volume of fixed income and hybrid private securities issuance arranged by Itaú Unibanco on the local market (includes distributed volumes). pg. 52Credit1 Origination and Private Securities Issuance | Brazil Base 100 = 1Q15 Total Credit2 – Brazil Credit2 - Individuals 21% 22% 100 98 109 100 81 89 69 65 68 68 1Q15 1Q16 1Q17 1Q18 1Q19 1Q15 1Q16 1Q17 1Q18 1Q19 Credit2 – Very Small, Small and Credit2 – Corporate Private Securities Issuance3 Middle Market 26% 1Q19 132 18% 1st place in 100 105 100 83 78 78 the ANBIMA 66 64 R$6.7 bn 57 ranking 1Q15 1Q16 1Q17 1Q18 1Q19 1Q15 1Q16 1Q17 1Q18 1Q19 Note: Do not consider origination of Credit Card, Overdraft, Debt Renegotiation and other revolving credits. (1) Average origination per working day in the period, except for private securities issuance. (2) Does not include private securities issuance. (3) Source: ANBIMA (Brazilian Financial and Capital Markets Association). Considers total volume of fixed income and hybrid private securities issuance arranged by Itaú Unibanco on the local market (includes distributed volumes). pg. 52
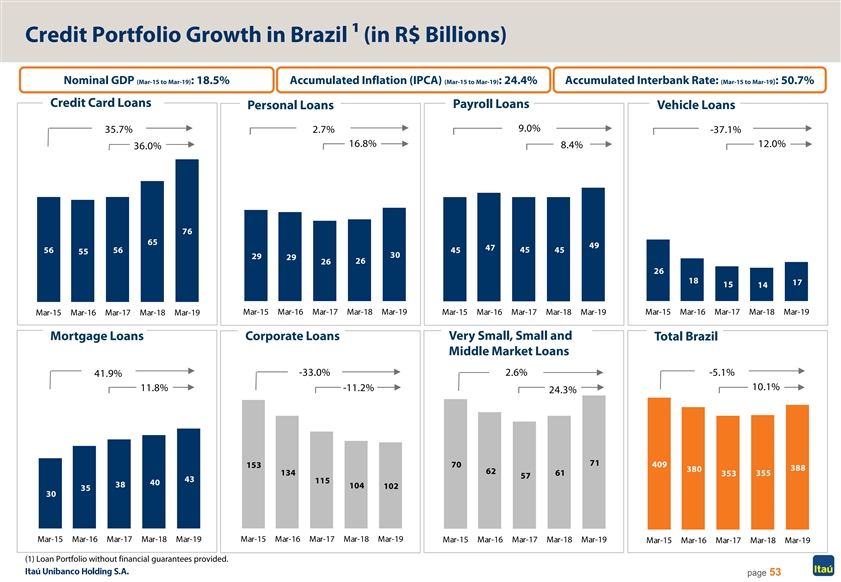
Credit Portfolio Growth in Brazil 1 (in R$ Billions) Nominal GDP (Mar-15 to Mar-19): 18.5% Accumulated Inflation (IPCA) (Mar-15 to Mar-19): 24.4% Accumulated Interbank Rate: (Mar-15 to Mar-19): 50.7% Credit Card Loans Payroll Loans Vehicle Loans Personal Loans 9.0% 35.7% 2.7% -37.1% 16.8% 12.0% 8.4% 36.0% 76 65 49 47 56 45 45 45 56 55 30 29 29 26 26 26 18 17 15 14 Mar-15 Mar-16 Mar-17 Mar-18 Mar-19 Mar-15 Mar-16 Mar-17 Mar-18 Mar-19 Mar-15 Mar-16 Mar-17 Mar-18 Mar-19 Mar-15 Mar-16 Mar-17 Mar-18 Mar-19 Very Small, Small and Mortgage Loans Corporate Loans Total Brazil Middle Market Loans -33.0% 2.6% -5.1% 41.9% 10.1% 11.8% -11.2% 24.3% 71 70 409 153 388 380 62 134 61 353 355 57 43 115 40 38 104 102 35 30 Mar-15 Mar-16 Mar-17 Mar-18 Mar-19 Mar-15 Mar-16 Mar-17 Mar-18 Mar-19 Mar-15 Mar-16 Mar-17 Mar-18 Mar-19 Mar-15 Mar-16 Mar-17 Mar-18 Mar-19 (1) Loan Portfolio without financial guarantees provided. page 53Credit Portfolio Growth in Brazil 1 (in R$ Billions) Nominal GDP (Mar-15 to Mar-19): 18.5% Accumulated Inflation (IPCA) (Mar-15 to Mar-19): 24.4% Accumulated Interbank Rate: (Mar-15 to Mar-19): 50.7% Credit Card Loans Payroll Loans Vehicle Loans Personal Loans 9.0% 35.7% 2.7% -37.1% 16.8% 12.0% 8.4% 36.0% 76 65 49 47 56 45 45 45 56 55 30 29 29 26 26 26 18 17 15 14 Mar-15 Mar-16 Mar-17 Mar-18 Mar-19 Mar-15 Mar-16 Mar-17 Mar-18 Mar-19 Mar-15 Mar-16 Mar-17 Mar-18 Mar-19 Mar-15 Mar-16 Mar-17 Mar-18 Mar-19 Very Small, Small and Mortgage Loans Corporate Loans Total Brazil Middle Market Loans -33.0% 2.6% -5.1% 41.9% 10.1% 11.8% -11.2% 24.3% 71 70 409 153 388 380 62 134 61 353 355 57 43 115 40 38 104 102 35 30 Mar-15 Mar-16 Mar-17 Mar-18 Mar-19 Mar-15 Mar-16 Mar-17 Mar-18 Mar-19 Mar-15 Mar-16 Mar-17 Mar-18 Mar-19 Mar-15 Mar-16 Mar-17 Mar-18 Mar-19 (1) Loan Portfolio without financial guarantees provided. page 53
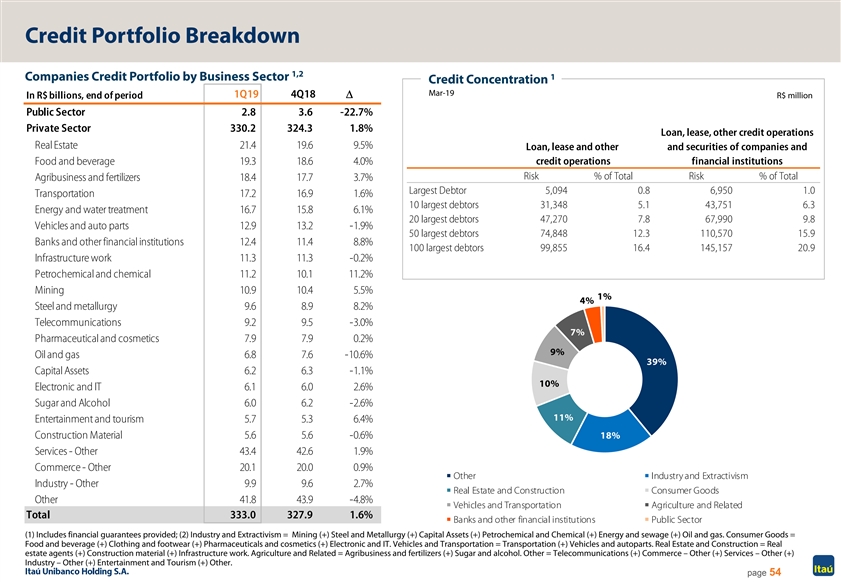
Credit Portfolio Breakdown 1,2 1 Companies Credit Portfolio by Business Sector Credit Concentration Mar-19 1Q19 4Q18D R$ million In R$ billions, end of period Public Sector 2 .8 3.6 -22.7% Private Sector 330.2 324.3 1.8% Loan, lease, other credit operations Real Estate 21.4 19.6 9.5% Loan, lease and other and securities of companies and Food and beverage 19.3 18.6 4.0% credit operations financial institutions Risk % of Total Risk % of Total Agribusiness and fertilizers 18.4 17.7 3.7% Largest Debtor 5,094 0.8 6,950 1.0 Transportation 17.2 16.9 1.6% 10 largest debtors 31,348 5.1 43,751 6.3 Energy and water treatment 16.7 15.8 6.1% 20 largest debtors 47,270 7.8 67,990 9.8 Vehicles and auto parts 12.9 13.2 -1.9% 50 largest debtors 74,848 12.3 110,570 15.9 Banks and other financial institutions 12.4 11.4 8.8% 100 largest debtors 99,855 16.4 145,157 20.9 Infrastructure work 11.3 11.3 -0.2% Petrochemical and chemical 11.2 10.1 11.2% Mining 10.9 10.4 5.5% 1% 4% Steel and metallurgy 9.6 8.9 8.2% Telecommunications 9.2 9.5 -3.0% 7% Pharmaceutical and cosmetics 7.9 7.9 0.2% 9% Oil and gas 6.8 7.6 -10.6% 39% Capital Assets 6.2 6.3 -1.1% 10% Electronic and IT 6.1 6.0 2.6% Sugar and Alcohol 6.0 6.2 -2.6% 11% Entertainment and tourism 5.7 5.3 6.4% Construction Material 5.6 5.6 -0.6% 18% Services - Other 43.4 42.6 1.9% Commerce - Other 20.1 20.0 0.9% Other Industry and Extractivism Industry - Other 9.9 9.6 2.7% Real Estate and Construction Consumer Goods Other 41.8 43.9 -4.8% Vehicles and Transportation Agriculture and Related Total 333.0 327.9 1.6% Banks and other financial institutions Public Sector (1) Includes financial guarantees provided; (2) Industry and Extractivism = Mining (+) Steel and Metallurgy (+) Capital Assets (+) Petrochemical and Chemical (+) Energy and sewage (+) Oil and gas. Consumer Goods = Food and beverage (+) Clothing and footwear (+) Pharmaceuticals and cosmetics (+) Electronic and IT. Vehicles and Transportation = Transportation (+) Vehicles and autoparts. Real Estate and Construction = Real estate agents (+) Construction material (+) Infrastructure work. Agriculture and Related = Agribusiness and fertilizers (+) Sugar and alcohol. Other = Telecommunications (+) Commerce – Other (+) Services – Other (+) Industry – Other (+) Entertainment and Tourism (+) Other. page 54Credit Portfolio Breakdown 1,2 1 Companies Credit Portfolio by Business Sector Credit Concentration Mar-19 1Q19 4Q18D R$ million In R$ billions, end of period Public Sector 2 .8 3.6 -22.7% Private Sector 330.2 324.3 1.8% Loan, lease, other credit operations Real Estate 21.4 19.6 9.5% Loan, lease and other and securities of companies and Food and beverage 19.3 18.6 4.0% credit operations financial institutions Risk % of Total Risk % of Total Agribusiness and fertilizers 18.4 17.7 3.7% Largest Debtor 5,094 0.8 6,950 1.0 Transportation 17.2 16.9 1.6% 10 largest debtors 31,348 5.1 43,751 6.3 Energy and water treatment 16.7 15.8 6.1% 20 largest debtors 47,270 7.8 67,990 9.8 Vehicles and auto parts 12.9 13.2 -1.9% 50 largest debtors 74,848 12.3 110,570 15.9 Banks and other financial institutions 12.4 11.4 8.8% 100 largest debtors 99,855 16.4 145,157 20.9 Infrastructure work 11.3 11.3 -0.2% Petrochemical and chemical 11.2 10.1 11.2% Mining 10.9 10.4 5.5% 1% 4% Steel and metallurgy 9.6 8.9 8.2% Telecommunications 9.2 9.5 -3.0% 7% Pharmaceutical and cosmetics 7.9 7.9 0.2% 9% Oil and gas 6.8 7.6 -10.6% 39% Capital Assets 6.2 6.3 -1.1% 10% Electronic and IT 6.1 6.0 2.6% Sugar and Alcohol 6.0 6.2 -2.6% 11% Entertainment and tourism 5.7 5.3 6.4% Construction Material 5.6 5.6 -0.6% 18% Services - Other 43.4 42.6 1.9% Commerce - Other 20.1 20.0 0.9% Other Industry and Extractivism Industry - Other 9.9 9.6 2.7% Real Estate and Construction Consumer Goods Other 41.8 43.9 -4.8% Vehicles and Transportation Agriculture and Related Total 333.0 327.9 1.6% Banks and other financial institutions Public Sector (1) Includes financial guarantees provided; (2) Industry and Extractivism = Mining (+) Steel and Metallurgy (+) Capital Assets (+) Petrochemical and Chemical (+) Energy and sewage (+) Oil and gas. Consumer Goods = Food and beverage (+) Clothing and footwear (+) Pharmaceuticals and cosmetics (+) Electronic and IT. Vehicles and Transportation = Transportation (+) Vehicles and autoparts. Real Estate and Construction = Real estate agents (+) Construction material (+) Infrastructure work. Agriculture and Related = Agribusiness and fertilizers (+) Sugar and alcohol. Other = Telecommunications (+) Commerce – Other (+) Services – Other (+) Industry – Other (+) Entertainment and Tourism (+) Other. page 54
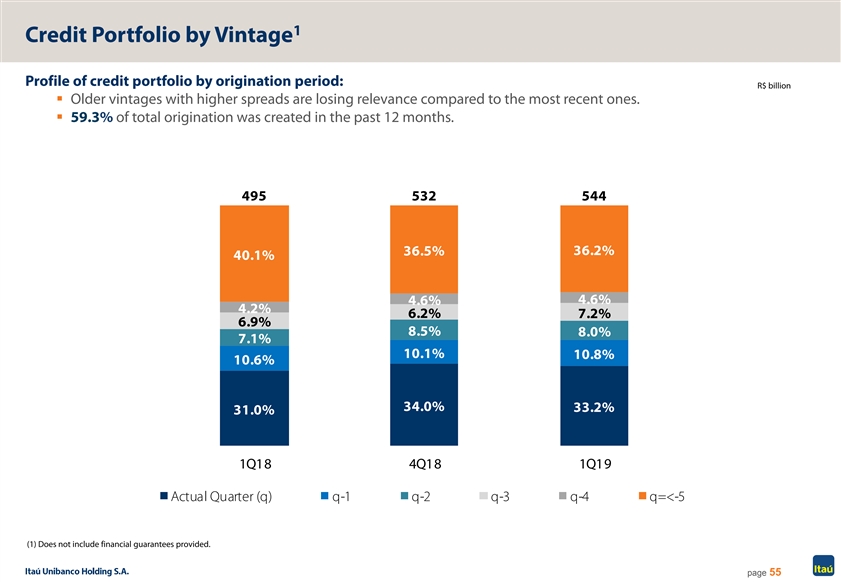
1 Credit Portfolio by Vintage Profile of credit portfolio by origination period: R$ billion § Older vintages with higher spreads are losing relevance compared to the most recent ones. § 59.3% of total origination was created in the past 12 months. 495 532 544 36.5% 36.2% 40.1% 4.6% 4.6% 4.2% 6.2% 7.2% 6.9% 8.5% 8.0% 7.1% 10.1% 10.8% 10.6% 34.0% 33.2% 31.0% 1Q18 4Q18 1Q19 Actual Quarter (q) q-1 q-2 q-3 q-4 q=<-5 (1) Does not include financial guarantees provided. page 551 Credit Portfolio by Vintage Profile of credit portfolio by origination period: R$ billion § Older vintages with higher spreads are losing relevance compared to the most recent ones. § 59.3% of total origination was created in the past 12 months. 495 532 544 36.5% 36.2% 40.1% 4.6% 4.6% 4.2% 6.2% 7.2% 6.9% 8.5% 8.0% 7.1% 10.1% 10.8% 10.6% 34.0% 33.2% 31.0% 1Q18 4Q18 1Q19 Actual Quarter (q) q-1 q-2 q-3 q-4 q=<-5 (1) Does not include financial guarantees provided. page 55
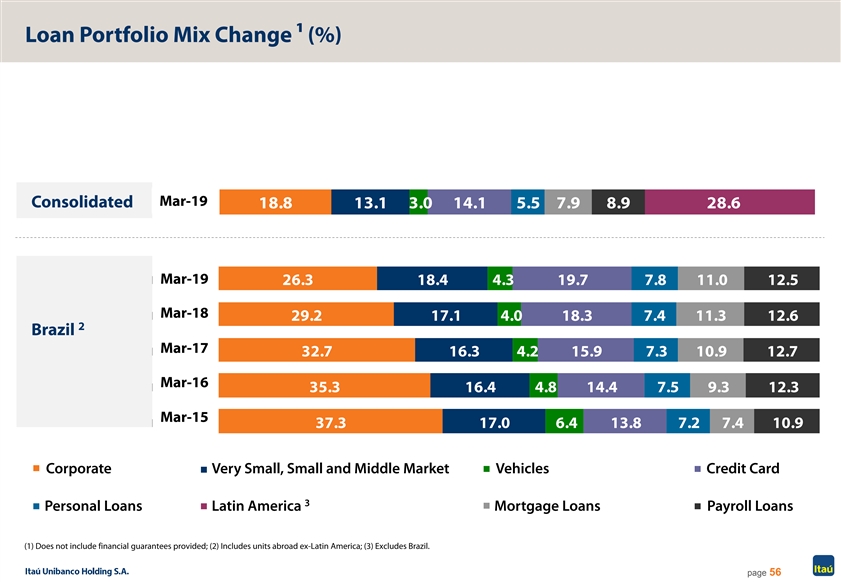
Loan Portfolio Mix Change 1 (%) Mar-19 Consolidated mar/19 18.8 13.1 3.0 14.1 5.5 7.9 8.9 28.6 ma Mar-19 r/19 26.3 18.4 4.3 19.7 7.8 11.0 12.5 Mar-18 mar/18 29.2 17.1 4.0 18.3 7.4 11.3 12.6 2 Brazil Mar-17 mar/17 32.7 16.3 4.2 15.9 7.3 10.9 12.7 Mar-16 mar/16 35.3 16.4 4.8 14.4 7.5 9.3 12.3 Mar-15 mar/15 37.3 17.0 6.4 13.8 7.2 7.4 10.9 Corporate Very Small, Small and Middle Market Vehicles Credit Card 3 Personal Loans Latin America Mortgage Loans Payroll Loans (1) Does not include financial guarantees provided; (2) Includes units abroad ex-Latin America; (3) Excludes Brazil. page 56Loan Portfolio Mix Change 1 (%) Mar-19 Consolidated mar/19 18.8 13.1 3.0 14.1 5.5 7.9 8.9 28.6 ma Mar-19 r/19 26.3 18.4 4.3 19.7 7.8 11.0 12.5 Mar-18 mar/18 29.2 17.1 4.0 18.3 7.4 11.3 12.6 2 Brazil Mar-17 mar/17 32.7 16.3 4.2 15.9 7.3 10.9 12.7 Mar-16 mar/16 35.3 16.4 4.8 14.4 7.5 9.3 12.3 Mar-15 mar/15 37.3 17.0 6.4 13.8 7.2 7.4 10.9 Corporate Very Small, Small and Middle Market Vehicles Credit Card 3 Personal Loans Latin America Mortgage Loans Payroll Loans (1) Does not include financial guarantees provided; (2) Includes units abroad ex-Latin America; (3) Excludes Brazil. page 56

Financial Margin with Clients Annualized Average Rate Brazil Consolidated 12.3% 12.6% 12.2% 12.1% 12.1% 12.0% 12.0% 11.8% 10.3% 10.1% 10.0% 9.9% 9.9% 9.9% 9.6% 9.8% 9.8% 9.5% 9.2% 9.2% 9.2% 10.9% 9.0% 8.9% 9.2% 8.9% 7.6% 7.7% 7.6% 7.6% 7.5% 7.4% 7.4% 7.3% 7.1% 6.4% 6.4% 6.7% 6.4% 6.4% 2Q17 3Q17 4Q17 1Q18 2Q18 3Q18 4Q18 1Q19 2Q17 3Q17 4Q17 1Q18 2Q18 3Q18 4Q18 1Q19 Financial Margin with Clients Risk-adjusted Financial Margin with Clients CDI (annualized quarterly rate) Financial Margin with Clients Breakdown R$ billion Brazil 1.3 (0.3) 0.3 (0.1) 15.3 (0.1) 16.4 1 1Q18 Mix of products Asset Spreads, Average Structured operations Working Capital and Latin America Financial 1Q19 Asset Portfolio and from the Wholesale other Margin with clients 2 Liabilities Margin segment (1) Change in the compostion of assets with credit risk between periods; (2) Considers credit and private securities portfolio net of more than 60 days overdue balance and balances do not include the effects of foreign exchange rate variations and spreads variation of assets with credit risk between periods. page 57Financial Margin with Clients Annualized Average Rate Brazil Consolidated 12.3% 12.6% 12.2% 12.1% 12.1% 12.0% 12.0% 11.8% 10.3% 10.1% 10.0% 9.9% 9.9% 9.9% 9.6% 9.8% 9.8% 9.5% 9.2% 9.2% 9.2% 10.9% 9.0% 8.9% 9.2% 8.9% 7.6% 7.7% 7.6% 7.6% 7.5% 7.4% 7.4% 7.3% 7.1% 6.4% 6.4% 6.7% 6.4% 6.4% 2Q17 3Q17 4Q17 1Q18 2Q18 3Q18 4Q18 1Q19 2Q17 3Q17 4Q17 1Q18 2Q18 3Q18 4Q18 1Q19 Financial Margin with Clients Risk-adjusted Financial Margin with Clients CDI (annualized quarterly rate) Financial Margin with Clients Breakdown R$ billion Brazil 1.3 (0.3) 0.3 (0.1) 15.3 (0.1) 16.4 1 1Q18 Mix of products Asset Spreads, Average Structured operations Working Capital and Latin America Financial 1Q19 Asset Portfolio and from the Wholesale other Margin with clients 2 Liabilities Margin segment (1) Change in the compostion of assets with credit risk between periods; (2) Considers credit and private securities portfolio net of more than 60 days overdue balance and balances do not include the effects of foreign exchange rate variations and spreads variation of assets with credit risk between periods. page 57

Financial Margin with the Market R$ billion 1.8 1.8 1.7 1.6 1.5 1.4 1.4 1.3 1.2 1.9 1.7 1.6 1.4 1.4 1.3 1.3 1.1 1.2 0.1 0.2 1.7 1.3 1.3 0.9 1.2 1.1 0.9 1.0 0.5 0.5 0.2 0.2 0.5 0.2 0.3 0.3 0.3 0.3 1Q17 2Q17 3Q17 4Q17 1Q18 2Q18 3Q18 4Q18 1Q19 Financial Margin with Sale of shares - B3 Financial Margin with 1 year moving average of 1 2 the Market – Brazil the Market– Latin America Financial Margin with the Market (1) Includes units abroad ex-Latin America; (2) Excludes Brazil. page 58Financial Margin with the Market R$ billion 1.8 1.8 1.7 1.6 1.5 1.4 1.4 1.3 1.2 1.9 1.7 1.6 1.4 1.4 1.3 1.3 1.1 1.2 0.1 0.2 1.7 1.3 1.3 0.9 1.2 1.1 0.9 1.0 0.5 0.5 0.2 0.2 0.5 0.2 0.3 0.3 0.3 0.3 1Q17 2Q17 3Q17 4Q17 1Q18 2Q18 3Q18 4Q18 1Q19 Financial Margin with Sale of shares - B3 Financial Margin with 1 year moving average of 1 2 the Market – Brazil the Market– Latin America Financial Margin with the Market (1) Includes units abroad ex-Latin America; (2) Excludes Brazil. page 58

Provision for Loan Losses and Cost of Credit Provision for Loan Losses by Segment R$ million 5.8% 5.0% 5.0% 4.7% 4.6% 4.4% 4.5% 4.3% 4.3% 4.1% 3.7% 3.6% 3.4% 3.3% 3.1% 3.0% 2.9% 7,824 6,337 5,997 6,366 5,768 6,169 5,823 5,714 5,392 772 4,948 4,483 4,111 4,282 4,271 383 399 396 412 392 358 757 432 4,206 2,728 598 3,904 3,796 1,362 701 1,546 554 621 514 1,295 1,825 1,629 1,070 1,892 1,410 489 619 514 423 248 532 168 393 4,621 4,395 4,302 4,323 4,021 3,932 3,996 3,747 3,732 3,688 3,726 3,550 3,534 3,482 3,464 3,236 3,165 -298 -354 -304 1Q15 2Q15 3Q15 4Q15 1Q16 2Q16 3Q16 4Q16 1Q17 2Q17 3Q17 4Q17 1Q18 2Q18 3Q18 4Q18 1Q19 Retail Banking - Brazil Wholesale Banking - Brazil Latin America ex-Brazil Provision for Loan Losses / Loan Portfolio (*) - Annualized (*) Average balance of the loan portfolio, considering the last two quarters. Cost of Credit R$ million (Provision for Loan Losses + Recovery of Loans Written Off as Losses + Impairment + Discounts Granted) 4.4% 4.2% 4.1% 3.7% 3.6% 3.1% 3.0% 3.0% 3.0% 2.9% 2.9% 2.7% 2.5% 2.4% 2.4% 2.1% 2.1% 7,211 6,335 6,352 5,582 5,281 5,075 5,135 4,800 4,795 4,474 4,257 3,990 3,788 3,804 3,601 3,415 3,263 1Q15 2Q15 3Q15 4Q15 1Q16 2Q16 3Q16 4Q16 1Q17 2Q17 3Q17 4Q17 1Q18 2Q18 3Q18 4Q18 1Q19 Cost of Credit Cost of Credit / Total Risk (*) - Annualized (*) Average balance of the loan portfolio with financial guarantees provided and corporate securities, considering the last two quarters. Note: Includes the consolidation of Citibank as of 4Q17. page 59Provision for Loan Losses and Cost of Credit Provision for Loan Losses by Segment R$ million 5.8% 5.0% 5.0% 4.7% 4.6% 4.4% 4.5% 4.3% 4.3% 4.1% 3.7% 3.6% 3.4% 3.3% 3.1% 3.0% 2.9% 7,824 6,337 5,997 6,366 5,768 6,169 5,823 5,714 5,392 772 4,948 4,483 4,111 4,282 4,271 383 399 396 412 392 358 757 432 4,206 2,728 598 3,904 3,796 1,362 701 1,546 554 621 514 1,295 1,825 1,629 1,070 1,892 1,410 489 619 514 423 248 532 168 393 4,621 4,395 4,302 4,323 4,021 3,932 3,996 3,747 3,732 3,688 3,726 3,550 3,534 3,482 3,464 3,236 3,165 -298 -354 -304 1Q15 2Q15 3Q15 4Q15 1Q16 2Q16 3Q16 4Q16 1Q17 2Q17 3Q17 4Q17 1Q18 2Q18 3Q18 4Q18 1Q19 Retail Banking - Brazil Wholesale Banking - Brazil Latin America ex-Brazil Provision for Loan Losses / Loan Portfolio (*) - Annualized (*) Average balance of the loan portfolio, considering the last two quarters. Cost of Credit R$ million (Provision for Loan Losses + Recovery of Loans Written Off as Losses + Impairment + Discounts Granted) 4.4% 4.2% 4.1% 3.7% 3.6% 3.1% 3.0% 3.0% 3.0% 2.9% 2.9% 2.7% 2.5% 2.4% 2.4% 2.1% 2.1% 7,211 6,335 6,352 5,582 5,281 5,075 5,135 4,800 4,795 4,474 4,257 3,990 3,788 3,804 3,601 3,415 3,263 1Q15 2Q15 3Q15 4Q15 1Q16 2Q16 3Q16 4Q16 1Q17 2Q17 3Q17 4Q17 1Q18 2Q18 3Q18 4Q18 1Q19 Cost of Credit Cost of Credit / Total Risk (*) - Annualized (*) Average balance of the loan portfolio with financial guarantees provided and corporate securities, considering the last two quarters. Note: Includes the consolidation of Citibank as of 4Q17. page 59

Allowance for Loan Losses by Risk– Consolidated R$ million Regulatory (*) Allocation of Total Allowance by Type of Risk - Consolidated Breakdown 34,260 36,661 Complementary 34,261 Allowance Expected and/or 34,206 Potential Loss Retail - Brazil1 6,661 5,964 Related to expected Allowance for Financial Guarantees Provided Wholesale - Brazil1 loss in Retail segment 4,233 and potential loss in 1,158 16,148 Latin America2 2,158 Wholesale segment 13,053 13,527 Potential³ Generic Allowance Renegotiations (non-overdue / aggravated) Renegotiation and 11,682 overdue loans 1,021 Retail - Brazil1 3,905 4,926 Related to aggravated risk Wholesale - Brazil1 200 3,500 3,700 rating of overdue 9,920 9,888 10,399 and renegotiated Aggravated Latin America2 441 853 1,294 operations Specific Overdue operations Allowance Fully Provisioned according to the Brazilian Central Bank Retail - Brazil1 2,601 5,482 8,083 11,233 Related to minimum 10,625 10,335 Overdue 15,402 provision required for 1,836 Wholesale - Brazil1 1,087 749 overdue operations 1,314 Latin America2 540 774 according to CMN Resolution 2,682/1999 Mar-18 Dec-18 Mar-19 (1) Includes units abroad ex-Latin America; (2) Excludes Brazil; (3) Allowance for potential losses includes the provision for financial guarantees provided. (*) Total allowance includes allowance for financial guarantees provided, which is recorded in liabilities as from March 2017, in accordance with CMN Resolution No. 4,512/16. Mar-19 page 60Allowance for Loan Losses by Risk– Consolidated R$ million Regulatory (*) Allocation of Total Allowance by Type of Risk - Consolidated Breakdown 34,260 36,661 Complementary 34,261 Allowance Expected and/or 34,206 Potential Loss Retail - Brazil1 6,661 5,964 Related to expected Allowance for Financial Guarantees Provided Wholesale - Brazil1 loss in Retail segment 4,233 and potential loss in 1,158 16,148 Latin America2 2,158 Wholesale segment 13,053 13,527 Potential³ Generic Allowance Renegotiations (non-overdue / aggravated) Renegotiation and 11,682 overdue loans 1,021 Retail - Brazil1 3,905 4,926 Related to aggravated risk Wholesale - Brazil1 200 3,500 3,700 rating of overdue 9,920 9,888 10,399 and renegotiated Aggravated Latin America2 441 853 1,294 operations Specific Overdue operations Allowance Fully Provisioned according to the Brazilian Central Bank Retail - Brazil1 2,601 5,482 8,083 11,233 Related to minimum 10,625 10,335 Overdue 15,402 provision required for 1,836 Wholesale - Brazil1 1,087 749 overdue operations 1,314 Latin America2 540 774 according to CMN Resolution 2,682/1999 Mar-18 Dec-18 Mar-19 (1) Includes units abroad ex-Latin America; (2) Excludes Brazil; (3) Allowance for potential losses includes the provision for financial guarantees provided. (*) Total allowance includes allowance for financial guarantees provided, which is recorded in liabilities as from March 2017, in accordance with CMN Resolution No. 4,512/16. Mar-19 page 60
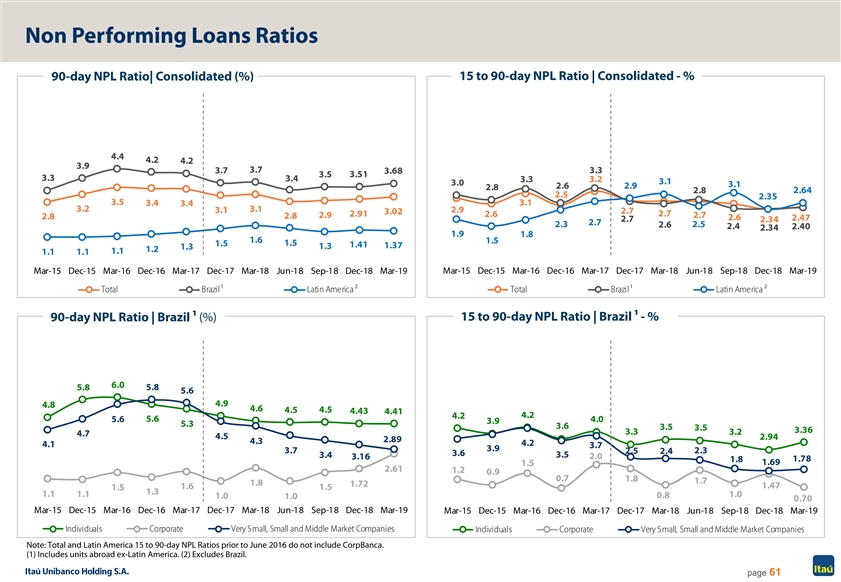
Non Performing Loans Ratios 15 to 90-day NPL Ratio | Consolidated - % 90-day NPL Ratio| Consolidated (%) 4.4 4.2 4.2 3.9 3.7 3.3 3.7 3.68 3.5 3.51 3.3 3.4 3.3 3.2 3.1 3.0 3.1 2.6 2.9 2.8 2.8 2.64 2.5 2.35 3.5 3.4 3.1 3.4 3.2 3.1 3.1 2.9 2.7 3.02 2.91 2.6 2.7 2.9 2.7 2.8 2.8 2.6 2.47 2.7 2.34 2.7 2.3 2.6 2.5 2.4 2.40 2.34 1.9 1.8 1.6 1.5 1.5 1.5 1.41 1.3 1.37 1.3 1.2 1.1 1.1 1.1 Mar-15 Dec-15 Mar-16 Dec-16 Mar-17 Dec-17 Mar-18 Jun-18 Sep-18 Dec-18 Mar-19 Mar-15 Dec-15 Mar-16 Dec-16 Mar-17 Dec-17 Mar-18 Jun-18 Sep-18 Dec-18 Mar-19 Total Brazil ¹ Latin America ² Total Brazil ¹ Latin America ² 15 to 90-day NPL Ratio | Brazil 1 - % 90-day NPL Ratio | Brazil 1(%) 6.0 5.8 5.8 5.6 4.9 4.8 4.6 4.5 4.5 4.43 4.41 4.2 4.2 5.6 5.6 4.0 3.9 5.3 3.6 3.5 3.5 3.36 3.3 3.2 4.7 4.5 2.94 2.89 4.3 4.2 4.1 3.7 3.9 3.7 2.5 2.3 2.4 3.6 3.5 3.4 3.16 2.0 1.78 1.8 1.69 1.5 2.61 1.2 0.9 0.7 1.8 1.7 1.8 1.72 1.47 1.6 1.5 1.5 1.3 1.1 1.1 1.0 0.8 1.0 1.0 0.70 Mar-15 Dec-15 Mar-16 Dec-16 Mar-17 Dec-17 Mar-18 Jun-18 Sep-18 Dec-18 Mar-19 Mar-15 Dec-15 Mar-16 Dec-16 Mar-17 Dec-17 Mar-18 Jun-18 Sep-18 Dec-18 Mar-19 Individuals Corporate Very Small, Small and Middle Market Companies Individuals Corporate Very Small, Small and Middle Market Companies Note: Total and Latin America 15 to 90-day NPL Ratios prior to June 2016 do not include CorpBanca. (1) Includes units abroad ex-Latin America. (2) Excludes Brazil. page 61Non Performing Loans Ratios 15 to 90-day NPL Ratio | Consolidated - % 90-day NPL Ratio| Consolidated (%) 4.4 4.2 4.2 3.9 3.7 3.3 3.7 3.68 3.5 3.51 3.3 3.4 3.3 3.2 3.1 3.0 3.1 2.6 2.9 2.8 2.8 2.64 2.5 2.35 3.5 3.4 3.1 3.4 3.2 3.1 3.1 2.9 2.7 3.02 2.91 2.6 2.7 2.9 2.7 2.8 2.8 2.6 2.47 2.7 2.34 2.7 2.3 2.6 2.5 2.4 2.40 2.34 1.9 1.8 1.6 1.5 1.5 1.5 1.41 1.3 1.37 1.3 1.2 1.1 1.1 1.1 Mar-15 Dec-15 Mar-16 Dec-16 Mar-17 Dec-17 Mar-18 Jun-18 Sep-18 Dec-18 Mar-19 Mar-15 Dec-15 Mar-16 Dec-16 Mar-17 Dec-17 Mar-18 Jun-18 Sep-18 Dec-18 Mar-19 Total Brazil ¹ Latin America ² Total Brazil ¹ Latin America ² 15 to 90-day NPL Ratio | Brazil 1 - % 90-day NPL Ratio | Brazil 1(%) 6.0 5.8 5.8 5.6 4.9 4.8 4.6 4.5 4.5 4.43 4.41 4.2 4.2 5.6 5.6 4.0 3.9 5.3 3.6 3.5 3.5 3.36 3.3 3.2 4.7 4.5 2.94 2.89 4.3 4.2 4.1 3.7 3.9 3.7 2.5 2.3 2.4 3.6 3.5 3.4 3.16 2.0 1.78 1.8 1.69 1.5 2.61 1.2 0.9 0.7 1.8 1.7 1.8 1.72 1.47 1.6 1.5 1.5 1.3 1.1 1.1 1.0 0.8 1.0 1.0 0.70 Mar-15 Dec-15 Mar-16 Dec-16 Mar-17 Dec-17 Mar-18 Jun-18 Sep-18 Dec-18 Mar-19 Mar-15 Dec-15 Mar-16 Dec-16 Mar-17 Dec-17 Mar-18 Jun-18 Sep-18 Dec-18 Mar-19 Individuals Corporate Very Small, Small and Middle Market Companies Individuals Corporate Very Small, Small and Middle Market Companies Note: Total and Latin America 15 to 90-day NPL Ratios prior to June 2016 do not include CorpBanca. (1) Includes units abroad ex-Latin America. (2) Excludes Brazil. page 61

Coverage Ratio (90-day NPL) Coverage Ratio and Expanded Coverage Ratio1 Coverage Ratio 618% 517% 248% 246% 245% 243% 236% 235% 231% 338% 221% 208% 223% 221% 204% 172% 169% 169% 104% 101% 100% 100% 96% 95% 92% 90% 88% Mar-18 Dec-18 Mar-19 Mar-17 Jun-17 Sep-17 Dec-17 Mar-18 Jun-18 Sep-18 Dec-18 Mar-19 Total Total (Expanded) Latin America ex-Brazil Retail Banking - Brazil 1 Expanded Coverage Ratio is calculated from the division of the total a llowance balance* by the sum of 90 days overdue operations and of renegotiated loan portfolio excluding the double counting of 90 days overdue renegotiated loans. Wholesale Banking - Brazil (*) Total allowance used for calculation of the coverage and expanded coverage ratios includes the provision for financial guarantees provided, which is recorded in liabilities as from March 2017, in accordance with CMN Resolution No. 4,512/16. page 62Coverage Ratio (90-day NPL) Coverage Ratio and Expanded Coverage Ratio1 Coverage Ratio 618% 517% 248% 246% 245% 243% 236% 235% 231% 338% 221% 208% 223% 221% 204% 172% 169% 169% 104% 101% 100% 100% 96% 95% 92% 90% 88% Mar-18 Dec-18 Mar-19 Mar-17 Jun-17 Sep-17 Dec-17 Mar-18 Jun-18 Sep-18 Dec-18 Mar-19 Total Total (Expanded) Latin America ex-Brazil Retail Banking - Brazil 1 Expanded Coverage Ratio is calculated from the division of the total a llowance balance* by the sum of 90 days overdue operations and of renegotiated loan portfolio excluding the double counting of 90 days overdue renegotiated loans. Wholesale Banking - Brazil (*) Total allowance used for calculation of the coverage and expanded coverage ratios includes the provision for financial guarantees provided, which is recorded in liabilities as from March 2017, in accordance with CMN Resolution No. 4,512/16. page 62

NPL Creation R$ billion 5.1 5.0 5.0 4.9 4.4 4.4 4.4 4.4 3.8 3.8 3.6 3.6 3.5 3.5 3.5 3.5 3.3 3.2 1.2 1.0 1.1 1.0 0.7 0.5 0.5 0.5 0.4 0.7 0.5 0.5 0.4 0.4 0.2 0.3 0.2 -0.3 1Q17 2Q17 3Q17 4Q17 1Q18 2Q18 3Q18 4Q18 1Q19 Total Retail Banking - Brazil Whosale Banking - Brazil Latin America ex-Brazil page 63NPL Creation R$ billion 5.1 5.0 5.0 4.9 4.4 4.4 4.4 4.4 3.8 3.8 3.6 3.6 3.5 3.5 3.5 3.5 3.3 3.2 1.2 1.0 1.1 1.0 0.7 0.5 0.5 0.5 0.4 0.7 0.5 0.5 0.4 0.4 0.2 0.3 0.2 -0.3 1Q17 2Q17 3Q17 4Q17 1Q18 2Q18 3Q18 4Q18 1Q19 Total Retail Banking - Brazil Whosale Banking - Brazil Latin America ex-Brazil page 63

Provision for Loan Losses and NPL Creation by Segment Retail Banking - Brazil R$ billion 113% 107% 108% 102% 104% 99% 100% 98% 89% 3.7 3.5 4.0 3.6 3.5 3.3 3.5 3.5 3.8 3.5 3.5 3.7 3.2 3.6 3.2 3.2 3.5 3.7 1Q17 2Q17 3Q17 4Q17 1Q18 2Q18 3Q18 4Q18 1Q19 Wholesale Banking - Brazil R$ billion 263% 230% 148% 48% 34% -26% -29% -53% -66% 1.4 1.1 1.2 1.0 0.5 0.5 1.0 0.7 0.2 0.6 0.2 0.2 0.4 0.2 -0.3 -0.3 -0.4 -0.3 1Q17 2Q17 3Q17 4Q17 1Q18 2Q18 3Q18 4Q18 1Q19 Latin America ex–Brazil R$ billion 154% 128% 130% 133% 136% 97% 114% 86% 79% 0.4 0.5 0.6 0.4 0.5 0.5 0.7 0.5 0.6 0.7 0.6 0.5 0.5 0.4 0.4 0.3 0.5 0.4 1Q17 2Q17 3Q17 4Q17 1Q18 2Q18 3Q18 4Q18 1Q19 Total R$ billion 112% 113% 109% 102% 98% 82% 85% 83% 79% 5.44 4.9 .9 4.44.34 4.4 .5 4.4 5.0 5.0 3.8 4.4 4.2 5.1 4.1 4.3 3.9 3.8 1Q17 2Q17 3Q17 4Q17 1Q18 2Q18 3Q18 4Q18 1Q19 Provision for Loan Losses NPL Creation Provision for Loan Losses / NPL Creation page 64Provision for Loan Losses and NPL Creation by Segment Retail Banking - Brazil R$ billion 113% 107% 108% 102% 104% 99% 100% 98% 89% 3.7 3.5 4.0 3.6 3.5 3.3 3.5 3.5 3.8 3.5 3.5 3.7 3.2 3.6 3.2 3.2 3.5 3.7 1Q17 2Q17 3Q17 4Q17 1Q18 2Q18 3Q18 4Q18 1Q19 Wholesale Banking - Brazil R$ billion 263% 230% 148% 48% 34% -26% -29% -53% -66% 1.4 1.1 1.2 1.0 0.5 0.5 1.0 0.7 0.2 0.6 0.2 0.2 0.4 0.2 -0.3 -0.3 -0.4 -0.3 1Q17 2Q17 3Q17 4Q17 1Q18 2Q18 3Q18 4Q18 1Q19 Latin America ex–Brazil R$ billion 154% 128% 130% 133% 136% 97% 114% 86% 79% 0.4 0.5 0.6 0.4 0.5 0.5 0.7 0.5 0.6 0.7 0.6 0.5 0.5 0.4 0.4 0.3 0.5 0.4 1Q17 2Q17 3Q17 4Q17 1Q18 2Q18 3Q18 4Q18 1Q19 Total R$ billion 112% 113% 109% 102% 98% 82% 85% 83% 79% 5.44 4.9 .9 4.44.34 4.4 .5 4.4 5.0 5.0 3.8 4.4 4.2 5.1 4.1 4.3 3.9 3.8 1Q17 2Q17 3Q17 4Q17 1Q18 2Q18 3Q18 4Q18 1Q19 Provision for Loan Losses NPL Creation Provision for Loan Losses / NPL Creation page 64
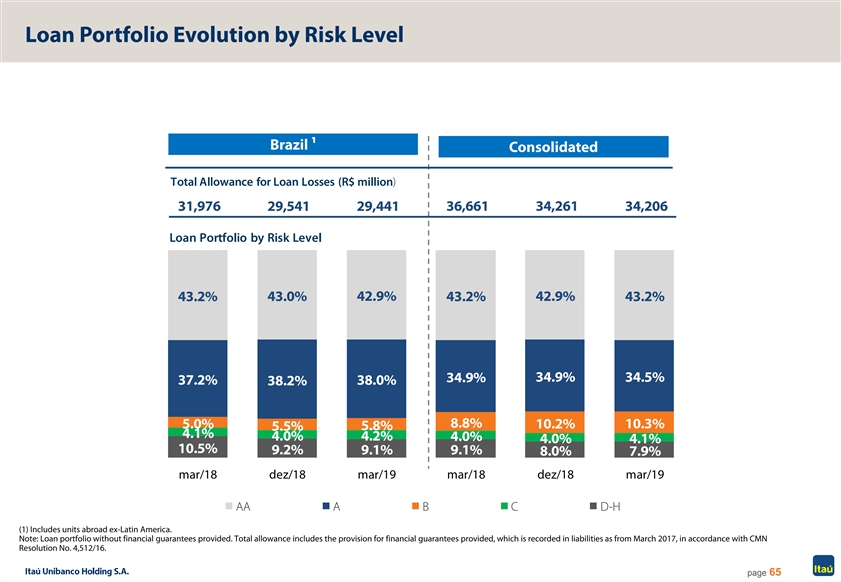
Loan Portfolio Evolution by Risk Level Brazil 1 Consolidated Total Allowance for Loan Losses (R$ million) 31,976 29,541 29,441 36,661 34,261 34,206 Loan Portfolio by Risk Level 42.9% 42.9% 43.2% 43.0% 43.2% 43.2% 34.9% 34.5% 34.9% 37.2% 38.0% 38.2% 8.8% 5.0% 10.2% 10.3% 5.5% 5.8% 4.1% 4.0% 4.2% 4.0% 4.0% 4.1% 10.5% 9.2% 9.1% 9.1% 8.0% 7.9% mar/18 dez/18 mar/19 mar/18 dez/18 mar/19 AA A B C D-H (1) Includes units abroad ex-Latin America. Note: Loan portfolio without financial guarantees provided. Total allowance includes the provision for financial guarantees provided, which is recorded in liabilities as from March 2017, in accordance with CMN Resolution No. 4,512/16. page 65Loan Portfolio Evolution by Risk Level Brazil 1 Consolidated Total Allowance for Loan Losses (R$ million) 31,976 29,541 29,441 36,661 34,261 34,206 Loan Portfolio by Risk Level 42.9% 42.9% 43.2% 43.0% 43.2% 43.2% 34.9% 34.5% 34.9% 37.2% 38.0% 38.2% 8.8% 5.0% 10.2% 10.3% 5.5% 5.8% 4.1% 4.0% 4.2% 4.0% 4.0% 4.1% 10.5% 9.2% 9.1% 9.1% 8.0% 7.9% mar/18 dez/18 mar/19 mar/18 dez/18 mar/19 AA A B C D-H (1) Includes units abroad ex-Latin America. Note: Loan portfolio without financial guarantees provided. Total allowance includes the provision for financial guarantees provided, which is recorded in liabilities as from March 2017, in accordance with CMN Resolution No. 4,512/16. page 65
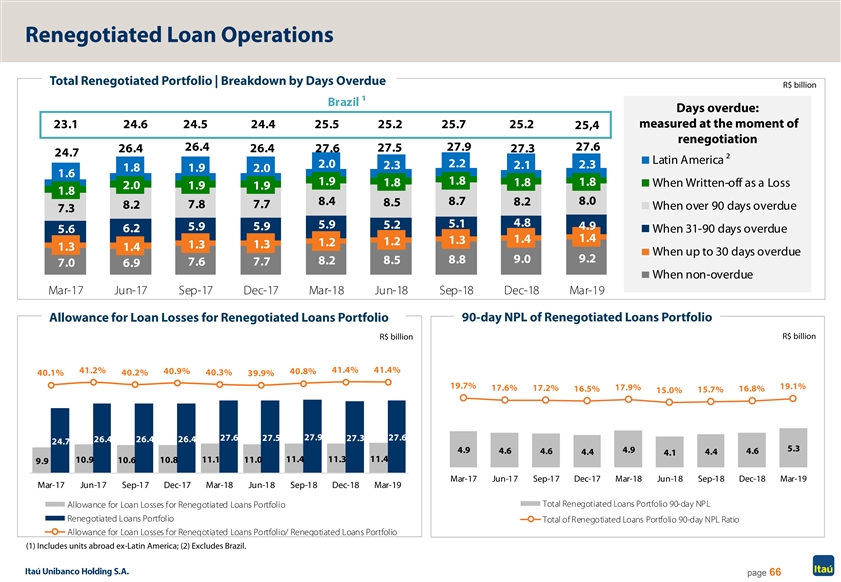
Renegotiated Loan Operations Total Renegotiated Portfolio | Breakdown by Days Overdue R$ billion Brazil 1 Days overdue: 23.1 24.6 24.5 24.4 25.5 25.2 25.7 25.2 measured at the moment of 25,4 renegotiation 26.4 27.9 27.6 27.5 26.4 26.4 27.6 27.3 24.7 Latin America 2 2.0 2.2 2.3 2.1 2.3 1.8 1.9 2.0 1.6 1.8 1.9 1.8 1.8 1.8 When Written-off as a Loss 2.0 1.9 1.9 1.8 8.4 8.7 8.0 8.2 8.5 7.7 8.2 7.8 When over 90 days overdue 7.3 4.8 5.1 5.9 5.2 4.9 5.9 5.9 5.6 6.2 When 31-90 days overdue 1.4 1.4 1.3 1.2 1.2 1.3 1.3 1.3 1.4 When up to 30 days overdue 9.0 9.2 8.5 8.8 8.2 7.6 7.7 7.0 6.9 When non-overdue Mar-17 Jun-17 Sep-17 Dec-17 Mar-18 Jun-18 Sep-18 Dec-18 Mar-19 Allowance for Loan Losses for Renegotiated Loans Portfolio 90-day NPL of Renegotiated Loans Portfolio R$ billion R$ billion 41.2% 41.4% 41.4% 40.9% 40.8% 40.1% 40.2% 40.3% 39.9% 19.7% 19.1% 17.6% 17.9% 17.2% 16.5% 16.8% 15.7% 15.0% 27.6 27.9 27.6 27.5 27.3 26.4 26.4 26.4 24.7 5.3 4.9 4.9 4.6 4.6 4.4 4.6 4.4 4.1 11.1 11.0 11.4 11.3 11.4 10.9 10.6 10.8 9.9 Mar-17 Jun-17 Sep-17 Dec-17 Mar-18 Jun-18 Sep-18 Dec-18 Mar-19 Mar-17 Jun-17 Sep-17 Dec-17 Mar-18 Jun-18 Sep-18 Dec-18 Mar-19 Total Renegotiated Loans Portfolio 90-day NPL Allowance for Loan Losses for Renegotiated Loans Portfolio Renegotiated Loans Portfolio Total of Renegotiated Loans Portfolio 90-day NPL Ratio Allowance for Loan Losses for Renegotiated Loans Portfolio/ Renegotiated Loans Portfolio (1) Includes units abroad ex-Latin America; (2) Excludes Brazil. page 66Renegotiated Loan Operations Total Renegotiated Portfolio | Breakdown by Days Overdue R$ billion Brazil 1 Days overdue: 23.1 24.6 24.5 24.4 25.5 25.2 25.7 25.2 measured at the moment of 25,4 renegotiation 26.4 27.9 27.6 27.5 26.4 26.4 27.6 27.3 24.7 Latin America 2 2.0 2.2 2.3 2.1 2.3 1.8 1.9 2.0 1.6 1.8 1.9 1.8 1.8 1.8 When Written-off as a Loss 2.0 1.9 1.9 1.8 8.4 8.7 8.0 8.2 8.5 7.7 8.2 7.8 When over 90 days overdue 7.3 4.8 5.1 5.9 5.2 4.9 5.9 5.9 5.6 6.2 When 31-90 days overdue 1.4 1.4 1.3 1.2 1.2 1.3 1.3 1.3 1.4 When up to 30 days overdue 9.0 9.2 8.5 8.8 8.2 7.6 7.7 7.0 6.9 When non-overdue Mar-17 Jun-17 Sep-17 Dec-17 Mar-18 Jun-18 Sep-18 Dec-18 Mar-19 Allowance for Loan Losses for Renegotiated Loans Portfolio 90-day NPL of Renegotiated Loans Portfolio R$ billion R$ billion 41.2% 41.4% 41.4% 40.9% 40.8% 40.1% 40.2% 40.3% 39.9% 19.7% 19.1% 17.6% 17.9% 17.2% 16.5% 16.8% 15.7% 15.0% 27.6 27.9 27.6 27.5 27.3 26.4 26.4 26.4 24.7 5.3 4.9 4.9 4.6 4.6 4.4 4.6 4.4 4.1 11.1 11.0 11.4 11.3 11.4 10.9 10.6 10.8 9.9 Mar-17 Jun-17 Sep-17 Dec-17 Mar-18 Jun-18 Sep-18 Dec-18 Mar-19 Mar-17 Jun-17 Sep-17 Dec-17 Mar-18 Jun-18 Sep-18 Dec-18 Mar-19 Total Renegotiated Loans Portfolio 90-day NPL Allowance for Loan Losses for Renegotiated Loans Portfolio Renegotiated Loans Portfolio Total of Renegotiated Loans Portfolio 90-day NPL Ratio Allowance for Loan Losses for Renegotiated Loans Portfolio/ Renegotiated Loans Portfolio (1) Includes units abroad ex-Latin America; (2) Excludes Brazil. page 66
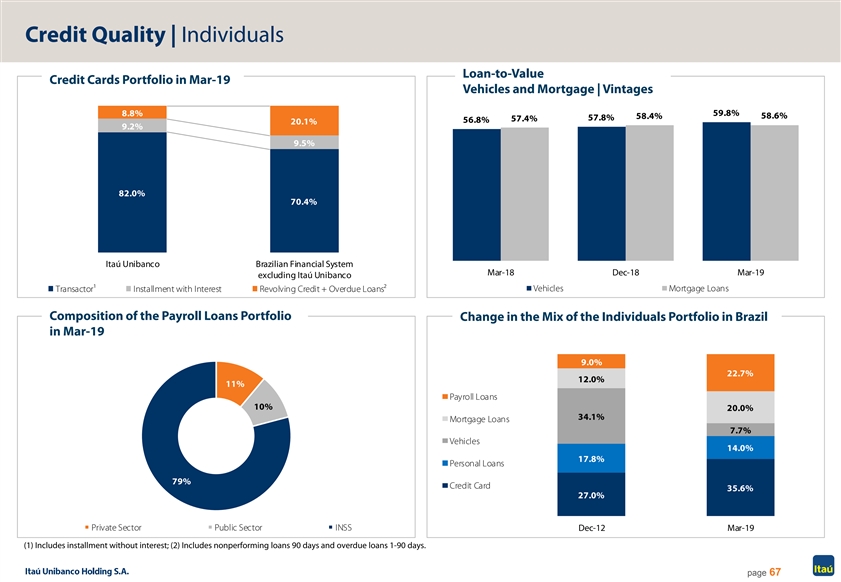
Credit Quality | Individuals Loan-to-Value Credit Cards Portfolio in Mar-19 Vehicles and Mortgage | Vintages 59.8% 8.8% 58.4% 58.6% 57.8% 57.4% 56.8% 20.1% 9.2% 9.5% 82.0% 70.4% Itaú Unibanco Brazilian Financial System Mar-18 Dec-18 Mar-19 excluding Itaú Unibanco Transactor¹ Installment with Interest Revolving Credit + Overdue Loans² Vehicles Mortgage Loans Composition of the Payroll Loans Portfolio Change in the Mix of the Individuals Portfolio in Brazil in Mar-19 9.0% 22.7% 12.0% 11% Payroll Loans 10% 20.0% 34.1% Mortgage Loans 7.7% Vehicles 14.0% 17.8% Personal Loans 79% Credit Card 35.6% 27.0% Private Sector Public Sector INSS Dec-12 Mar-19 (1) Includes installment without interest; (2) Includes nonperforming loans 90 days and overdue loans 1-90 days. page 67Credit Quality | Individuals Loan-to-Value Credit Cards Portfolio in Mar-19 Vehicles and Mortgage | Vintages 59.8% 8.8% 58.4% 58.6% 57.8% 57.4% 56.8% 20.1% 9.2% 9.5% 82.0% 70.4% Itaú Unibanco Brazilian Financial System Mar-18 Dec-18 Mar-19 excluding Itaú Unibanco Transactor¹ Installment with Interest Revolving Credit + Overdue Loans² Vehicles Mortgage Loans Composition of the Payroll Loans Portfolio Change in the Mix of the Individuals Portfolio in Brazil in Mar-19 9.0% 22.7% 12.0% 11% Payroll Loans 10% 20.0% 34.1% Mortgage Loans 7.7% Vehicles 14.0% 17.8% Personal Loans 79% Credit Card 35.6% 27.0% Private Sector Public Sector INSS Dec-12 Mar-19 (1) Includes installment without interest; (2) Includes nonperforming loans 90 days and overdue loans 1-90 days. page 67
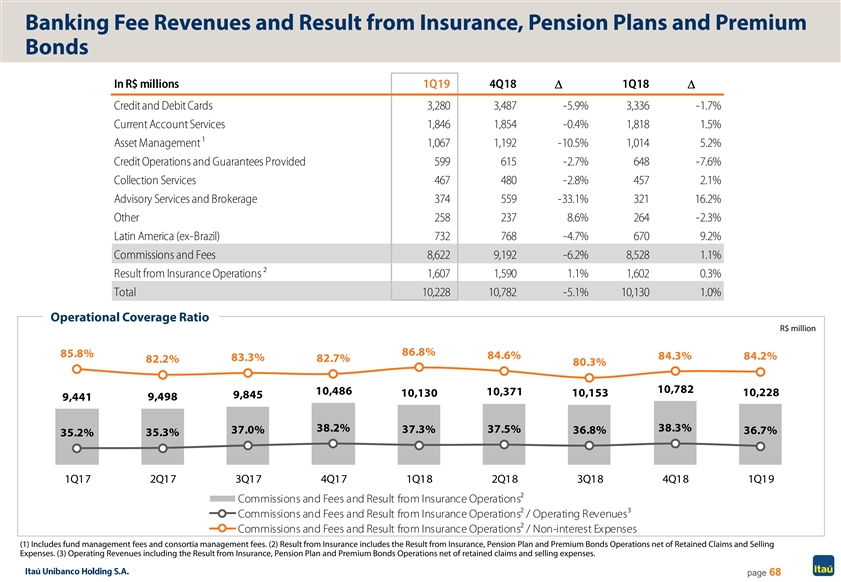
Banking Fee Revenues and Result from Insurance, Pension Plans and Premium Bonds In R$ millions 1Q19 4Q18 1Q18 D D Credit and Debit Cards 3,280 3,487 -5.9% 3,336 -1.7% Current Account Services 1,846 1,854 -0.4% 1,818 1.5% Asset Management ¹ 1,067 1,192 -10.5% 1,014 5.2% Credit Operations and Guarantees Provided 599 615 -2.7% 648 -7.6% Collection Services 467 480 -2.8% 457 2.1% Advisory Services and Brokerage 374 559 -33.1% 321 16.2% Other 258 237 8.6% 264 -2.3% Latin America (ex-Brazil) 732 768 -4.7% 670 9.2% Commissions and Fees 8,622 9,192 -6.2% 8,528 1.1% Result from Insurance Operations ² 1,607 1,590 1.1% 1,602 0.3% Total 10, 228 10,782 -5.1% 10,130 1.0% Operational Coverage Ratio R$ million 86.8% 85.8% 84.6% 84.3% 84.2% 83.3% 82.2% 82.7% 80.3% 10,782 10,486 10,371 10,130 10,153 10,228 9,845 9,441 9,498 38.2% 38.3% 37.5% 37.0% 37.3% 36.8% 36.7% 35.2% 35.3% 1Q17 2Q17 3Q17 4Q17 1Q18 2Q18 3Q18 4Q18 1Q19 Commissions and Fees and Result from Insurance Operations² Commissions and Fees and Result from Insurance Operations² / Operating Revenues³ Commissions and Fees and Result from Insurance Operations² / Non-interest Expenses (1) Includes fund management fees and consortia management fees. (2) Result from Insurance includes the Result from Insurance, Pension Plan and Premium Bonds Operations net of Retained Claims and Selling Expenses. (3) Operating Revenues including the Result from Insurance, Pension Plan and Premium Bonds Operations net of retained claims and selling expenses. page 68Banking Fee Revenues and Result from Insurance, Pension Plans and Premium Bonds In R$ millions 1Q19 4Q18 1Q18 D D Credit and Debit Cards 3,280 3,487 -5.9% 3,336 -1.7% Current Account Services 1,846 1,854 -0.4% 1,818 1.5% Asset Management ¹ 1,067 1,192 -10.5% 1,014 5.2% Credit Operations and Guarantees Provided 599 615 -2.7% 648 -7.6% Collection Services 467 480 -2.8% 457 2.1% Advisory Services and Brokerage 374 559 -33.1% 321 16.2% Other 258 237 8.6% 264 -2.3% Latin America (ex-Brazil) 732 768 -4.7% 670 9.2% Commissions and Fees 8,622 9,192 -6.2% 8,528 1.1% Result from Insurance Operations ² 1,607 1,590 1.1% 1,602 0.3% Total 10, 228 10,782 -5.1% 10,130 1.0% Operational Coverage Ratio R$ million 86.8% 85.8% 84.6% 84.3% 84.2% 83.3% 82.2% 82.7% 80.3% 10,782 10,486 10,371 10,130 10,153 10,228 9,845 9,441 9,498 38.2% 38.3% 37.5% 37.0% 37.3% 36.8% 36.7% 35.2% 35.3% 1Q17 2Q17 3Q17 4Q17 1Q18 2Q18 3Q18 4Q18 1Q19 Commissions and Fees and Result from Insurance Operations² Commissions and Fees and Result from Insurance Operations² / Operating Revenues³ Commissions and Fees and Result from Insurance Operations² / Non-interest Expenses (1) Includes fund management fees and consortia management fees. (2) Result from Insurance includes the Result from Insurance, Pension Plan and Premium Bonds Operations net of Retained Claims and Selling Expenses. (3) Operating Revenues including the Result from Insurance, Pension Plan and Premium Bonds Operations net of retained claims and selling expenses. page 68
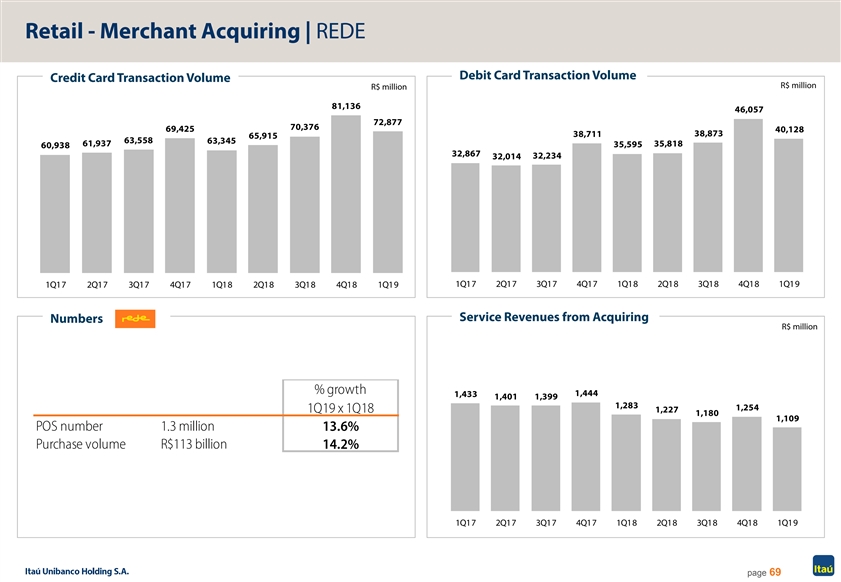
Retail - Merchant Acquiring | REDE Debit Card Transaction Volume Credit Card Transaction Volume R$ million R$ million 81,136 46,057 72,877 70,376 69,425 40,128 38,711 38,873 65,915 63,558 63,345 61,937 35,818 35,595 60,938 32,867 32,234 32,014 1Q17 2Q17 3Q17 4Q17 1Q18 2Q18 3Q18 4Q18 1Q19 1Q17 2Q17 3Q17 4Q17 1Q18 2Q18 3Q18 4Q18 1Q19 Service Revenues from Acquiring Numbers R$ million % growth 1,444 1,433 1,401 1,399 1,283 1,254 1Q19 x 1Q18 1,227 1,180 1,109 POS number 1.3 million 13.6% Purchase volume R$113 billion 14.2% 1Q17 2Q17 3Q17 4Q17 1Q18 2Q18 3Q18 4Q18 1Q19 page 69Retail - Merchant Acquiring | REDE Debit Card Transaction Volume Credit Card Transaction Volume R$ million R$ million 81,136 46,057 72,877 70,376 69,425 40,128 38,711 38,873 65,915 63,558 63,345 61,937 35,818 35,595 60,938 32,867 32,234 32,014 1Q17 2Q17 3Q17 4Q17 1Q18 2Q18 3Q18 4Q18 1Q19 1Q17 2Q17 3Q17 4Q17 1Q18 2Q18 3Q18 4Q18 1Q19 Service Revenues from Acquiring Numbers R$ million % growth 1,444 1,433 1,401 1,399 1,283 1,254 1Q19 x 1Q18 1,227 1,180 1,109 POS number 1.3 million 13.6% Purchase volume R$113 billion 14.2% 1Q17 2Q17 3Q17 4Q17 1Q18 2Q18 3Q18 4Q18 1Q19 page 69
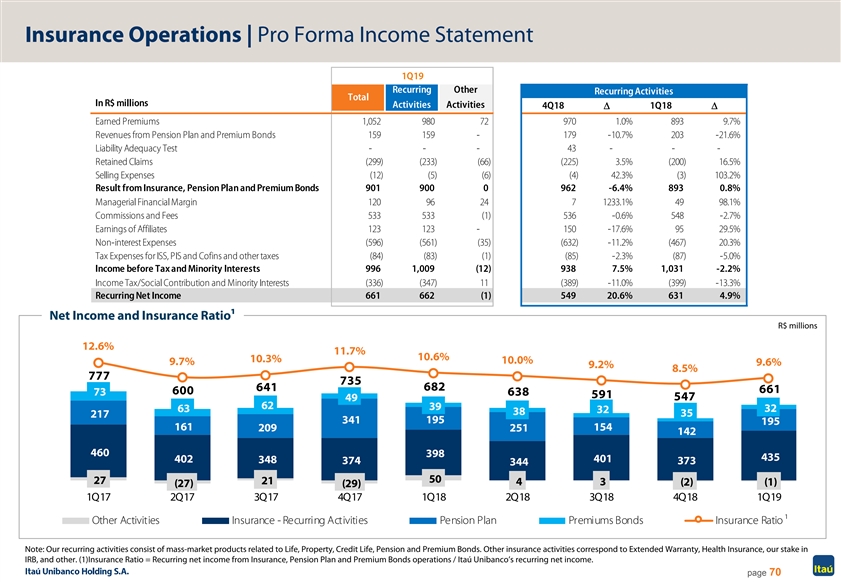
Insurance Operations | Pro Forma Income Statement 1Q19 Recurring Other Recurring Activities Total In R$ millions Activities Activities 4Q18D 1Q18D Earned Premiums 1,052 980 72 970 1.0% 893 9.7% Revenues from Pension Plan and Premium Bonds 159 159 - 179 -10.7% 203 -21.6% Liability Adequacy Test - - - 43 - - - Retained Claims (299) (233) (66) (225) 3.5% (200) 16.5% Selling Expenses (12) (5) (6) (4) 42.3% (3) 103.2% Result from Insurance, Pension Plan and Premium Bonds 901 900 0 962 -6.4% 893 0.8% Managerial Financial Margin 120 96 24 7 1233.1% 49 98.1% Commissions and Fees 533 533 (1) 536 -0.6% 548 -2.7% Earnings of Affiliates 123 123 - 150 -17.6% 95 29.5% Non-interest Expenses (596) (561) (35) (632) -11.2% (467) 20.3% Tax Expenses for ISS, PIS and Cofins and other taxes (84) (83) (1) (85) -2.3% (87) -5.0% Income before Tax and Minority Interests 996 1,009 (12) 938 7.5% 1,031 -2.2% Income Tax/Social Contribution and Minority Interests (336) (347) 11 (389) -11.0% (399) -13.3% Recurring Net Income 661 662 (1) 549 20.6% 631 4.9% Net Income and Insurance Ratio1 R$ millions 12.6% 11.7% 10.6% 10.3% 10.0% 9.7% 9.6% 9.2% 8.5% 777 735 682 641 661 600 73 638 591 547 49 62 39 63 32 32 38 35 217 341 195 195 161 154 209 251 142 460 398 435 402 401 348 374 373 344 50 27 21 4 3 (2) (1) (27) (29) 1Q17 2Q17 3Q17 4Q17 1Q18 2Q18 3Q18 4Q18 1Q19 Other Activities Insurance - Recurring Activities Pension Plan Premiums Bonds Insurance Ratio ¹ Note: Our recurring activities consist of mass-market products related to Life, Property, Credit Life, Pension and Premium Bonds. Other insurance activities correspond to Extended Warranty, Health Insurance, our stake in IRB, and other. (1)Insurance Ratio = Recurring net income from Insurance, Pension Plan and Premium Bonds operations / Itaú Unibanco’s recurring net income. page 70Insurance Operations | Pro Forma Income Statement 1Q19 Recurring Other Recurring Activities Total In R$ millions Activities Activities 4Q18D 1Q18D Earned Premiums 1,052 980 72 970 1.0% 893 9.7% Revenues from Pension Plan and Premium Bonds 159 159 - 179 -10.7% 203 -21.6% Liability Adequacy Test - - - 43 - - - Retained Claims (299) (233) (66) (225) 3.5% (200) 16.5% Selling Expenses (12) (5) (6) (4) 42.3% (3) 103.2% Result from Insurance, Pension Plan and Premium Bonds 901 900 0 962 -6.4% 893 0.8% Managerial Financial Margin 120 96 24 7 1233.1% 49 98.1% Commissions and Fees 533 533 (1) 536 -0.6% 548 -2.7% Earnings of Affiliates 123 123 - 150 -17.6% 95 29.5% Non-interest Expenses (596) (561) (35) (632) -11.2% (467) 20.3% Tax Expenses for ISS, PIS and Cofins and other taxes (84) (83) (1) (85) -2.3% (87) -5.0% Income before Tax and Minority Interests 996 1,009 (12) 938 7.5% 1,031 -2.2% Income Tax/Social Contribution and Minority Interests (336) (347) 11 (389) -11.0% (399) -13.3% Recurring Net Income 661 662 (1) 549 20.6% 631 4.9% Net Income and Insurance Ratio1 R$ millions 12.6% 11.7% 10.6% 10.3% 10.0% 9.7% 9.6% 9.2% 8.5% 777 735 682 641 661 600 73 638 591 547 49 62 39 63 32 32 38 35 217 341 195 195 161 154 209 251 142 460 398 435 402 401 348 374 373 344 50 27 21 4 3 (2) (1) (27) (29) 1Q17 2Q17 3Q17 4Q17 1Q18 2Q18 3Q18 4Q18 1Q19 Other Activities Insurance - Recurring Activities Pension Plan Premiums Bonds Insurance Ratio ¹ Note: Our recurring activities consist of mass-market products related to Life, Property, Credit Life, Pension and Premium Bonds. Other insurance activities correspond to Extended Warranty, Health Insurance, our stake in IRB, and other. (1)Insurance Ratio = Recurring net income from Insurance, Pension Plan and Premium Bonds operations / Itaú Unibanco’s recurring net income. page 70
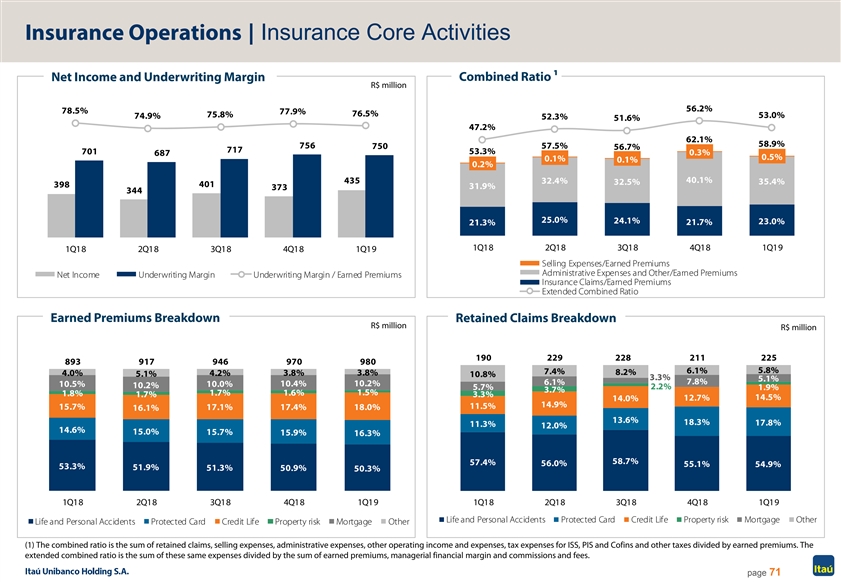
Insurance Operations | Insurance Core Activities Net Income and Underwriting Margin Combined Ratio 1 R$ million 56.2% 78.5% 77.9% 76.5% 75.8% 53.0% 74.9% 52.3% 51.6% 47.2% 62.1% 58.9% 756 750 57.5% 56.7% 717 701 53.3% 687 0.3% 0.5% 0.1% 0.1% 0.2% 40.1% 435 32.4% 32.5% 35.4% 398 401 31.9% 373 344 25.0% 24.1% 21.7% 23.0% 21.3% 1Q18 2Q18 3Q18 4Q18 1Q19 1Q18 2Q18 3Q18 4Q18 1Q19 Selling Expenses/Earned Premiums Administrative Expenses and Other/Earned Premiums Net Income Underwriting Margin Underwriting Margin / Earned Premiums Insurance Claims/Earned Premiums Extended Combined Ratio Earned Premiums Breakdown Retained Claims Breakdown R$ million R$ million 190 229 228 211 225 893 917 946 970 980 6.1% 5.8% 7.4% 3.8% 3.8% 8.2% 4.0% 5.1% 4.2% 10.8% 3.3% 5.1% 7.8% 6.1% 10.4% 10.2% 10.5% 10.0% 10.2% 2.2% 5.7% 1.9% 3.7% 1.7% 1.6% 1.5% 1.8% 1.7% 3.3% 12.7% 14.5% 14.0% 14.9% 15.7% 11.5% 17.1% 17.4% 18.0% 16.1% 13.6% 18.3% 17.8% 11.3% 12.0% 14.6% 15.0% 15.7% 15.9% 16.3% 58.7% 57.4% 56.0% 55.1% 54.9% 53.3% 51.9% 51.3% 50.9% 50.3% 1Q18 2Q18 3Q18 4Q18 1Q19 1Q18 2Q18 3Q18 4Q18 1Q19 Life and Personal Accidents Protected Card Credit Life Property risk Mortgage Other Life and Personal Accidents Protected Card Credit Life Property risk Mortgage Other (1) The combined ratio is the sum of retained claims, selling expenses, administrative expenses, other operating income and expenses, tax expenses for ISS, PIS and Cofins and other taxes divided by earned premiums. The extended combined ratio is the sum of these same expenses divided by the sum of earned premiums, managerial financial margin and commissions and fees. page 71Insurance Operations | Insurance Core Activities Net Income and Underwriting Margin Combined Ratio 1 R$ million 56.2% 78.5% 77.9% 76.5% 75.8% 53.0% 74.9% 52.3% 51.6% 47.2% 62.1% 58.9% 756 750 57.5% 56.7% 717 701 53.3% 687 0.3% 0.5% 0.1% 0.1% 0.2% 40.1% 435 32.4% 32.5% 35.4% 398 401 31.9% 373 344 25.0% 24.1% 21.7% 23.0% 21.3% 1Q18 2Q18 3Q18 4Q18 1Q19 1Q18 2Q18 3Q18 4Q18 1Q19 Selling Expenses/Earned Premiums Administrative Expenses and Other/Earned Premiums Net Income Underwriting Margin Underwriting Margin / Earned Premiums Insurance Claims/Earned Premiums Extended Combined Ratio Earned Premiums Breakdown Retained Claims Breakdown R$ million R$ million 190 229 228 211 225 893 917 946 970 980 6.1% 5.8% 7.4% 3.8% 3.8% 8.2% 4.0% 5.1% 4.2% 10.8% 3.3% 5.1% 7.8% 6.1% 10.4% 10.2% 10.5% 10.0% 10.2% 2.2% 5.7% 1.9% 3.7% 1.7% 1.6% 1.5% 1.8% 1.7% 3.3% 12.7% 14.5% 14.0% 14.9% 15.7% 11.5% 17.1% 17.4% 18.0% 16.1% 13.6% 18.3% 17.8% 11.3% 12.0% 14.6% 15.0% 15.7% 15.9% 16.3% 58.7% 57.4% 56.0% 55.1% 54.9% 53.3% 51.9% 51.3% 50.9% 50.3% 1Q18 2Q18 3Q18 4Q18 1Q19 1Q18 2Q18 3Q18 4Q18 1Q19 Life and Personal Accidents Protected Card Credit Life Property risk Mortgage Other Life and Personal Accidents Protected Card Credit Life Property risk Mortgage Other (1) The combined ratio is the sum of retained claims, selling expenses, administrative expenses, other operating income and expenses, tax expenses for ISS, PIS and Cofins and other taxes divided by earned premiums. The extended combined ratio is the sum of these same expenses divided by the sum of earned premiums, managerial financial margin and commissions and fees. page 71

Pension Plan Segment Recurring Net Income Focus on Client Experience R$ million 7 Reasons to Invest 341 Plan your retirement 1 251 217 209 195 195 Pay your future health expenses 2 161 154 142 Invest in your kids’ education 3 Plan your taxes expenses 4 1Q17 2Q17 3Q17 4Q17 1Q18 2Q18 3Q18 4Q18 1Q19 Improve your investment return 5 Technical Provisions R$ billion Flexibility to change pension plan 6 200.4 196.6 190.0 Succession planning 185.2 7 182.4 177.3 170.7 163.0 157.4 Concept 1,3,6,9: How much do the client have to save to enjoy a peaceful retirement? Years of salary accumulated Age 135 345 655 965 1Q17 2Q17 3Q17 4Q17 1Q18 2Q18 3Q18 4Q18 1Q19 page 72Pension Plan Segment Recurring Net Income Focus on Client Experience R$ million 7 Reasons to Invest 341 Plan your retirement 1 251 217 209 195 195 Pay your future health expenses 2 161 154 142 Invest in your kids’ education 3 Plan your taxes expenses 4 1Q17 2Q17 3Q17 4Q17 1Q18 2Q18 3Q18 4Q18 1Q19 Improve your investment return 5 Technical Provisions R$ billion Flexibility to change pension plan 6 200.4 196.6 190.0 Succession planning 185.2 7 182.4 177.3 170.7 163.0 157.4 Concept 1,3,6,9: How much do the client have to save to enjoy a peaceful retirement? Years of salary accumulated Age 135 345 655 965 1Q17 2Q17 3Q17 4Q17 1Q18 2Q18 3Q18 4Q18 1Q19 page 72
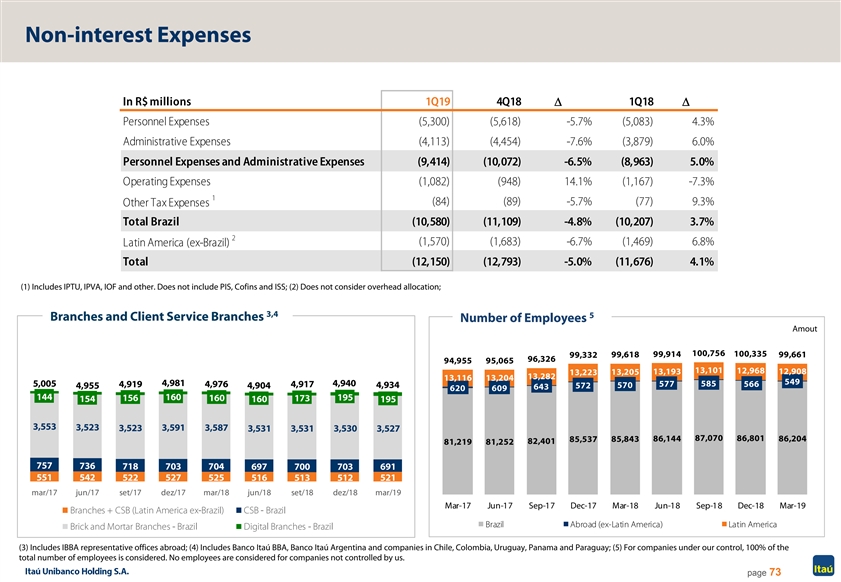
Non-interest Expenses In R$ millions 1Q19 4Q18D 1Q18D Personnel Expenses (5,300) (5,618) -5.7% (5,083) 4.3% Administrative Expenses (4,113) (4,454) -7.6% (3,879) 6.0% Personnel Expenses and Administrative Expenses (9,414) (10,072) -6.5% (8,963) 5.0% Operating Expenses (1,082) (948) 14.1% (1,167) -7.3% 1 (84) (89) -5.7% (77) 9.3% Other Tax Expenses Total Brazil (10,580) (11,109) -4.8% (10,207) 3.7% 2 (1,570) (1,683) -6.7% (1,469) 6.8% Latin America (ex-Brazil) Total (12,150) (12,793) -5.0% (11,676) 4.1% (1) Includes IPTU, IPVA, IOF and other. Does not include PIS, Cofins and ISS; (2) Does not consider overhead allocation; 3,4 5 Branches and Client Service Branches Number of Employees Amout 100,756 100,335 99,332 99,618 99,914 99,661 96,326 94,955 95,065 13,101 12,968 13,205 13,193 12,908 13,223 13,282 13,116 13,204 549 5,005 4,981 4,940 577 585 566 4,919 4,976 4,917 4,955 4,904 4,934 572 570 643 620 609 144 160 195 156 160 173 154 160 195 3,553 3,523 3,591 3,587 3,523 3,531 3,531 3,530 3,527 86,144 87,070 86,801 86,204 85,537 85,843 82,401 81,219 81,252 757 736 718 703 704 697 700 703 691 551 542 527 522 525 516 513 512 521 mar/17 jun/17 set/17 dez/17 mar/18 jun/18 set/18 dez/18 mar/19 Mar-17 Jun-17 Sep-17 Dec-17 Mar-18 Jun-18 Sep-18 Dec-18 Mar-19 Branches + CSB (Latin America ex-Brazil) CSB - Brazil Brazil Abroad (ex-Latin America) Latin America Brick and Mortar Branches - Brazil Digital Branches - Brazil (3) Includes IBBA representative offices abroad; (4) Includes Banco Itaú BBA, Banco Itaú Argentina and companies in Chile, Colombia, Uruguay, Panama and Paraguay; (5) For companies under our control, 100% of the total number of employees is considered. No employees are considered for companies not controlled by us. page 73Non-interest Expenses In R$ millions 1Q19 4Q18D 1Q18D Personnel Expenses (5,300) (5,618) -5.7% (5,083) 4.3% Administrative Expenses (4,113) (4,454) -7.6% (3,879) 6.0% Personnel Expenses and Administrative Expenses (9,414) (10,072) -6.5% (8,963) 5.0% Operating Expenses (1,082) (948) 14.1% (1,167) -7.3% 1 (84) (89) -5.7% (77) 9.3% Other Tax Expenses Total Brazil (10,580) (11,109) -4.8% (10,207) 3.7% 2 (1,570) (1,683) -6.7% (1,469) 6.8% Latin America (ex-Brazil) Total (12,150) (12,793) -5.0% (11,676) 4.1% (1) Includes IPTU, IPVA, IOF and other. Does not include PIS, Cofins and ISS; (2) Does not consider overhead allocation; 3,4 5 Branches and Client Service Branches Number of Employees Amout 100,756 100,335 99,332 99,618 99,914 99,661 96,326 94,955 95,065 13,101 12,968 13,205 13,193 12,908 13,223 13,282 13,116 13,204 549 5,005 4,981 4,940 577 585 566 4,919 4,976 4,917 4,955 4,904 4,934 572 570 643 620 609 144 160 195 156 160 173 154 160 195 3,553 3,523 3,591 3,587 3,523 3,531 3,531 3,530 3,527 86,144 87,070 86,801 86,204 85,537 85,843 82,401 81,219 81,252 757 736 718 703 704 697 700 703 691 551 542 527 522 525 516 513 512 521 mar/17 jun/17 set/17 dez/17 mar/18 jun/18 set/18 dez/18 mar/19 Mar-17 Jun-17 Sep-17 Dec-17 Mar-18 Jun-18 Sep-18 Dec-18 Mar-19 Branches + CSB (Latin America ex-Brazil) CSB - Brazil Brazil Abroad (ex-Latin America) Latin America Brick and Mortar Branches - Brazil Digital Branches - Brazil (3) Includes IBBA representative offices abroad; (4) Includes Banco Itaú BBA, Banco Itaú Argentina and companies in Chile, Colombia, Uruguay, Panama and Paraguay; (5) For companies under our control, 100% of the total number of employees is considered. No employees are considered for companies not controlled by us. page 73
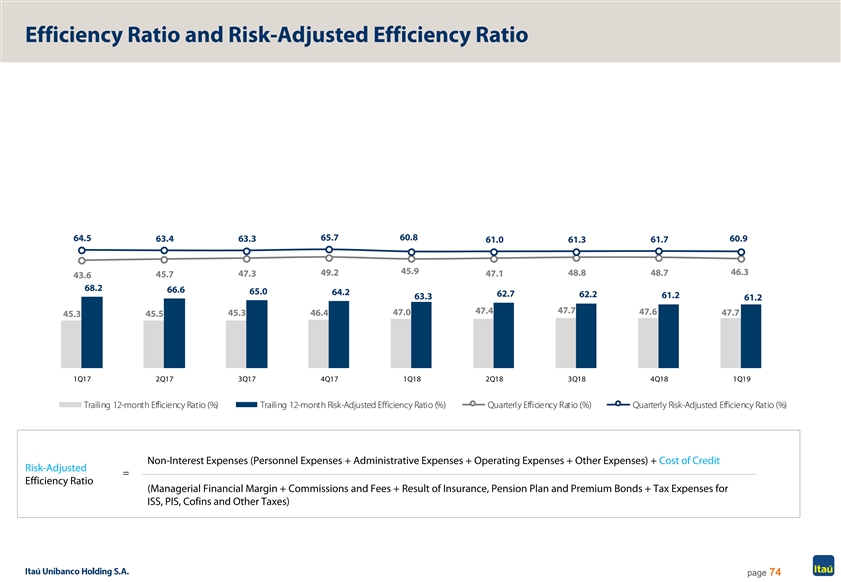
Efficiency Ratio and Risk-Adjusted Efficiency Ratio 65.7 60.8 64.5 63.4 63.3 60.9 61.0 61.3 61.7 45.9 46.3 49.2 48.8 48.7 47.3 47.1 45.7 43.6 68.2 66.6 65.0 64.2 62.7 62.2 61.2 63.3 61.2 47.4 47.7 47.6 45.3 46.4 47.0 47.7 45.5 45.3 1Q17 2Q17 3Q17 4Q17 1Q18 2Q18 3Q18 4Q18 1Q19 Trailing 12-month Efficiency Ratio (%) Trailing 12-month Risk-Adjusted Efficiency Ratio (%) Quarterly Efficiency Ratio (%) Quarterly Risk-Adjusted Efficiency Ratio (%) Non-Interest Expenses (Personnel Expenses + Administrative Expenses + Operating Expenses + Other Expenses) + Cost of Credit Risk-Adjusted = Efficiency Ratio (Managerial Financial Margin + Commissions and Fees + Result of Insurance, Pension Plan and Premium Bonds + Tax Expenses for ISS, PIS, Cofins and Other Taxes) page 74Efficiency Ratio and Risk-Adjusted Efficiency Ratio 65.7 60.8 64.5 63.4 63.3 60.9 61.0 61.3 61.7 45.9 46.3 49.2 48.8 48.7 47.3 47.1 45.7 43.6 68.2 66.6 65.0 64.2 62.7 62.2 61.2 63.3 61.2 47.4 47.7 47.6 45.3 46.4 47.0 47.7 45.5 45.3 1Q17 2Q17 3Q17 4Q17 1Q18 2Q18 3Q18 4Q18 1Q19 Trailing 12-month Efficiency Ratio (%) Trailing 12-month Risk-Adjusted Efficiency Ratio (%) Quarterly Efficiency Ratio (%) Quarterly Risk-Adjusted Efficiency Ratio (%) Non-Interest Expenses (Personnel Expenses + Administrative Expenses + Operating Expenses + Other Expenses) + Cost of Credit Risk-Adjusted = Efficiency Ratio (Managerial Financial Margin + Commissions and Fees + Result of Insurance, Pension Plan and Premium Bonds + Tax Expenses for ISS, PIS, Cofins and Other Taxes) page 74
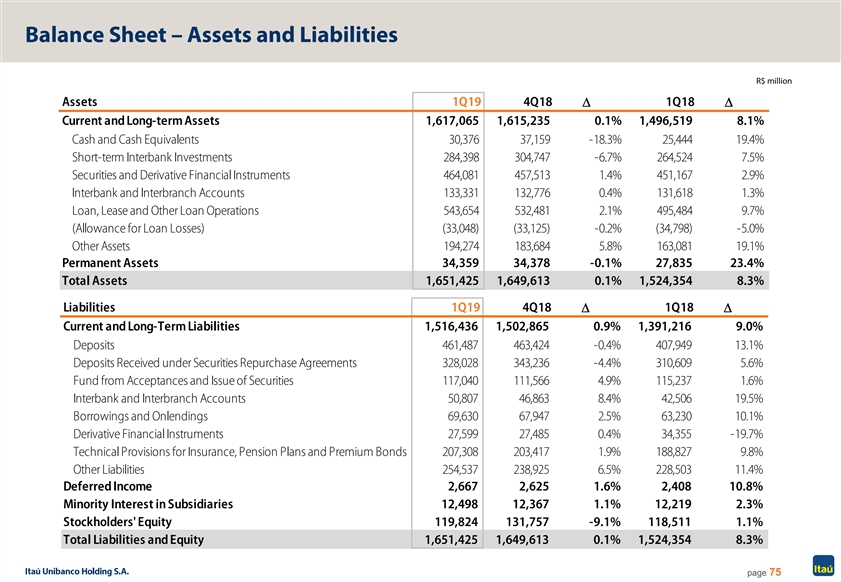
Balance Sheet – Assets and Liabilities R$ million Assets 1Q19 4Q18 1Q18 D'D' Current and Long-term Assets 1,617,065 1,615,235 0.1% 1,496,519 8.1% Cash and Cash Equivalents 30,376 37,159 -18.3% 25,444 19.4% Short-term Interbank Investments 284,398 304,747 -6.7% 264,524 7.5% Securities and Derivative Financial Instruments 464,081 457,513 1.4% 451,167 2.9% Interbank and Interbranch Accounts 133,331 132,776 0.4% 131,618 1.3% Loan, Lease and Other Loan Operations 543,654 532,481 2.1% 495,484 9.7% (Allowance for Loan Losses) (33,048) (33,125) -0.2% (34,798) -5.0% Other Assets 194,274 183,684 5.8% 163,081 19.1% Permanent Assets 34,359 34,378 -0.1% 27,835 23.4% Total Assets 1,651,425 1,649,613 0.1% 1,524,354 8.3% Liabilities 1Q19 4Q18 1Q18 D'D' Current and Long-Term Liabilities 1,516,436 1,502,865 0.9% 1,391,216 9.0% Deposits 461,487 463,424 -0.4% 407,949 13.1% Deposits Received under Securities Repurchase Agreements 328,028 343,236 -4.4% 310,609 5.6% Fund from Acceptances and Issue of Securities 117,040 111,566 4.9% 115,237 1.6% Interbank and Interbranch Accounts 50,807 46,863 8.4% 42,506 19.5% Borrowings and Onlendings 69,630 67,947 2.5% 63,230 10.1% Derivative Financial Instruments 27,599 27,485 0.4% 34,355 -19.7% Technical Provisions for Insurance, Pension Plans and Premium Bonds 207,308 203,417 1.9% 188,827 9.8% Other Liabilities 254,537 238,925 6.5% 228,503 11.4% Deferred Income 2,667 2,625 1.6% 2,408 10.8% Minority Interest in Subsidiaries 12,498 12,367 1.1% 12,219 2.3% Stockholders' Equity 119,824 131,757 -9.1% 118,511 1.1% Total Liabilities and Equity 1,651,425 1,649,613 0.1% 1,524,354 8.3% page 75Balance Sheet – Assets and Liabilities R$ million Assets 1Q19 4Q18 1Q18 D'D' Current and Long-term Assets 1,617,065 1,615,235 0.1% 1,496,519 8.1% Cash and Cash Equivalents 30,376 37,159 -18.3% 25,444 19.4% Short-term Interbank Investments 284,398 304,747 -6.7% 264,524 7.5% Securities and Derivative Financial Instruments 464,081 457,513 1.4% 451,167 2.9% Interbank and Interbranch Accounts 133,331 132,776 0.4% 131,618 1.3% Loan, Lease and Other Loan Operations 543,654 532,481 2.1% 495,484 9.7% (Allowance for Loan Losses) (33,048) (33,125) -0.2% (34,798) -5.0% Other Assets 194,274 183,684 5.8% 163,081 19.1% Permanent Assets 34,359 34,378 -0.1% 27,835 23.4% Total Assets 1,651,425 1,649,613 0.1% 1,524,354 8.3% Liabilities 1Q19 4Q18 1Q18 D'D' Current and Long-Term Liabilities 1,516,436 1,502,865 0.9% 1,391,216 9.0% Deposits 461,487 463,424 -0.4% 407,949 13.1% Deposits Received under Securities Repurchase Agreements 328,028 343,236 -4.4% 310,609 5.6% Fund from Acceptances and Issue of Securities 117,040 111,566 4.9% 115,237 1.6% Interbank and Interbranch Accounts 50,807 46,863 8.4% 42,506 19.5% Borrowings and Onlendings 69,630 67,947 2.5% 63,230 10.1% Derivative Financial Instruments 27,599 27,485 0.4% 34,355 -19.7% Technical Provisions for Insurance, Pension Plans and Premium Bonds 207,308 203,417 1.9% 188,827 9.8% Other Liabilities 254,537 238,925 6.5% 228,503 11.4% Deferred Income 2,667 2,625 1.6% 2,408 10.8% Minority Interest in Subsidiaries 12,498 12,367 1.1% 12,219 2.3% Stockholders' Equity 119,824 131,757 -9.1% 118,511 1.1% Total Liabilities and Equity 1,651,425 1,649,613 0.1% 1,524,354 8.3% page 75
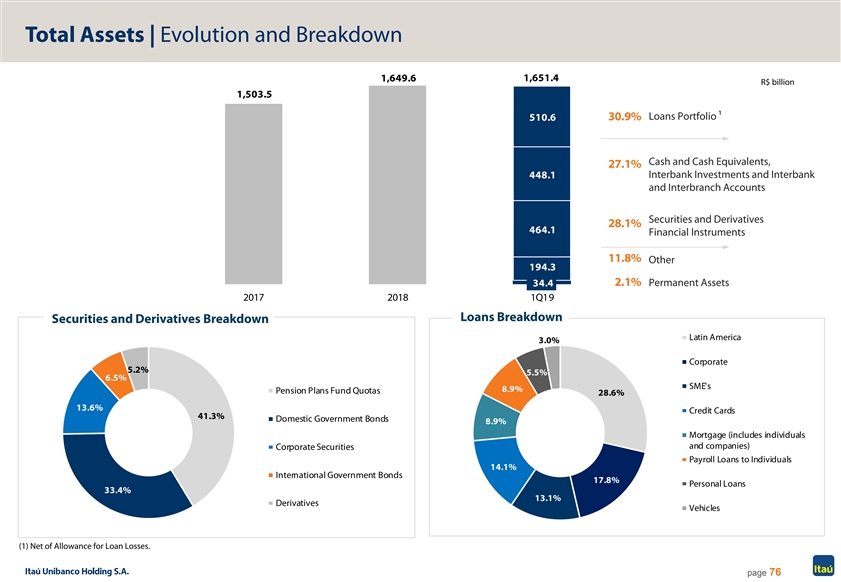
Total Assets | Evolution and Breakdown 1,651.4 1,649.6 R$ billion 1,503.5 Loans Portfolio 1 510.6 30.9% Cash and Cash Equivalents, 27.1% Interbank Investments and Interbank 448.1 and Interbranch Accounts Securities and Derivatives 28.1% 464.1 Financial Instruments 11.8% Other 194.3 2.1% 34.4 Permanent Assets 2017 2018 1Q19 Loans Breakdown Securities and Derivatives Breakdown Latin America 3.0% Corporate 5.2% 5.5% 6.5% SME's 8.9% Pension Plans Fund Quotas 28.6% 13.6% Credit Cards 41.3% Domestic Government Bonds 8.9% Mortgage (includes individuals and companies) Corporate Securities Payroll Loans to Individuals 14.1% International Government Bonds 17.8% Personal Loans 33.4% 13.1% Derivatives Vehicles (1) Net of Allowance for Loan Losses. page 76Total Assets | Evolution and Breakdown 1,651.4 1,649.6 R$ billion 1,503.5 Loans Portfolio 1 510.6 30.9% Cash and Cash Equivalents, 27.1% Interbank Investments and Interbank 448.1 and Interbranch Accounts Securities and Derivatives 28.1% 464.1 Financial Instruments 11.8% Other 194.3 2.1% 34.4 Permanent Assets 2017 2018 1Q19 Loans Breakdown Securities and Derivatives Breakdown Latin America 3.0% Corporate 5.2% 5.5% 6.5% SME's 8.9% Pension Plans Fund Quotas 28.6% 13.6% Credit Cards 41.3% Domestic Government Bonds 8.9% Mortgage (includes individuals and companies) Corporate Securities Payroll Loans to Individuals 14.1% International Government Bonds 17.8% Personal Loans 33.4% 13.1% Derivatives Vehicles (1) Net of Allowance for Loan Losses. page 76
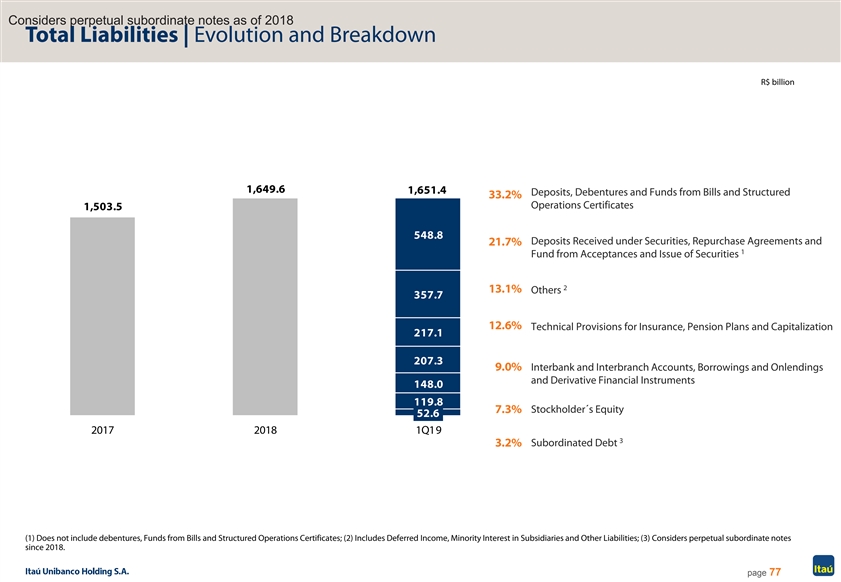
Considers perpetual subordinate notes as of 2018 Total Liabilities | Evolution and Breakdown R$ billion 1,649.6 1,651.4 Deposits, Debentures and Funds from Bills and Structured 33.2% Operations Certificates 1,503.5 548.8 Deposits Received under Securities, Repurchase Agreements and 21.7% 1 Fund from Acceptances and Issue of Securities 2 13.1% Others 357.7 12.6% Technical Provisions for Insurance, Pension Plans and Capitalization 217.1 207.3 9.0% Interbank and Interbranch Accounts, Borrowings and Onlendings and Derivative Financial Instruments 148.0 119.8 Stockholder´s Equity 7.3% 52.6 2017 2018 1Q19 3 3.2% Subordinated Debt (1) Does not include debentures, Funds from Bills and Structured Operations Certificates; (2) Includes Deferred Income, Minority Interest in Subsidiaries and Other Liabilities; (3) Considers perpetual subordinate notes since 2018. page 77Considers perpetual subordinate notes as of 2018 Total Liabilities | Evolution and Breakdown R$ billion 1,649.6 1,651.4 Deposits, Debentures and Funds from Bills and Structured 33.2% Operations Certificates 1,503.5 548.8 Deposits Received under Securities, Repurchase Agreements and 21.7% 1 Fund from Acceptances and Issue of Securities 2 13.1% Others 357.7 12.6% Technical Provisions for Insurance, Pension Plans and Capitalization 217.1 207.3 9.0% Interbank and Interbranch Accounts, Borrowings and Onlendings and Derivative Financial Instruments 148.0 119.8 Stockholder´s Equity 7.3% 52.6 2017 2018 1Q19 3 3.2% Subordinated Debt (1) Does not include debentures, Funds from Bills and Structured Operations Certificates; (2) Includes Deferred Income, Minority Interest in Subsidiaries and Other Liabilities; (3) Considers perpetual subordinate notes since 2018. page 77
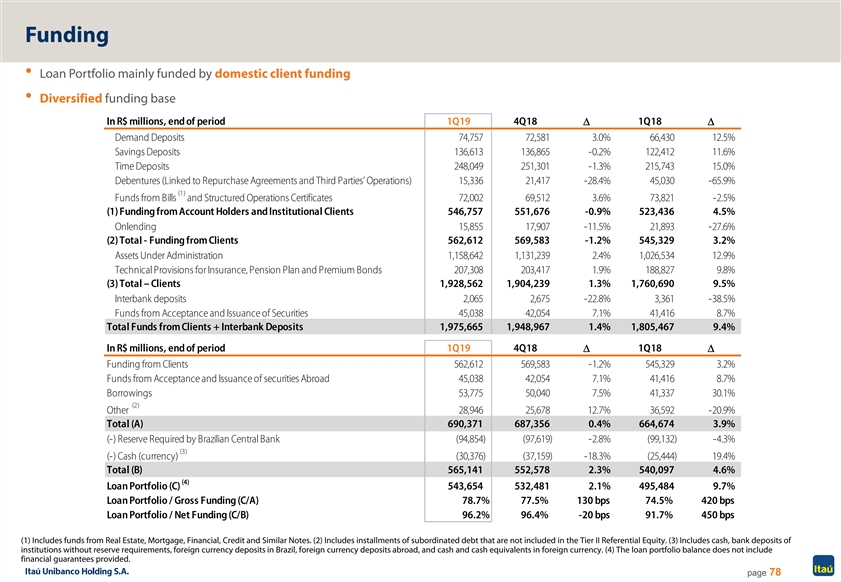
Funding • Loan Portfolio mainly funded by domestic client funding • Diversified funding base In R$ millions, end of period 1Q19 4Q18D 1Q18D Demand Deposits 74,757 72,581 3.0% 66,430 12.5% Savings Deposits 136,613 136,865 -0.2% 122,412 11.6% Time Deposits 248,049 251,301 -1.3% 215,743 15.0% Debentures (Linked to Repurchase Agreements and Third Parties’ Operations) 15,336 21,417 -28.4% 45,030 -65.9% (1) Funds from Bills and Structured Operations Certificates 72,002 69,512 3.6% 73,821 -2.5% (1) Funding from Account Holders and Institutional Clients 546,757 551,676 -0.9% 523,436 4.5% Onlending 15,855 17,907 -11.5% 21,893 -27.6% (2) Total - Funding from Clients 562,612 569,583 -1.2% 545,329 3.2% Assets Under Administration 1,158,642 1,131,239 2.4% 1,026,534 12.9% Technical Provisions for Insurance, Pension Plan and Premium Bonds 207,308 203,417 1.9% 188,827 9.8% (3) Total – Clients 1,928,562 1,904,239 1.3% 1,760,690 9.5% Interbank deposits 2,065 2,675 -22.8% 3,361 -38.5% Funds from Acceptance and Issuance of Securities 45,038 42,054 7.1% 41,416 8.7% Total Funds from Clients + Interbank Deposits 1,975,665 1,948,967 1.4% 1,805,467 9.4% In R$ millions, end of period 1Q19 4Q18D 1Q18D Funding from Clients 562,612 569,583 -1.2% 545,329 3.2% Funds from Acceptance and Issuance of securities Abroad 45,038 42,054 7.1% 41,416 8.7% Borrowings 53,775 50,040 7.5% 41,337 30.1% (2) Other 28,946 25,678 12.7% 36,592 -20.9% Total (A) 690,371 687,356 0.4% 664,674 3.9% (-) Reserve Required by Brazilian Central Bank (94,854) (97,619) -2.8% (99,132) -4.3% (3) (-) Cash (currency) (30,376) (37,159) -18.3% (25,444) 19.4% Total (B) 565,141 552,578 2.3% 540,097 4.6% (4) Loan Portfolio (C) 543,654 532,481 2.1% 495,484 9.7% Loan Portfolio / Gross Funding (C/A) 78.7% 77.5% 130 bps 74.5% 420 bps Loan Portfolio / Net Funding (C/B) 96.2% 96.4% -20 bps 91.7% 450 bps (1) Includes funds from Real Estate, Mortgage, Financial, Credit and Similar Notes. (2) Includes installments of subordinated debt that are not included in the Tier II Referential Equity. (3) Includes cash, bank deposits of institutions without reserve requirements, foreign currency deposits in Brazil, foreign currency deposits abroad, and cash and cash equivalents in foreign currency. (4) The loan portfolio balance does not include financial guarantees provided. page 78Funding • Loan Portfolio mainly funded by domestic client funding • Diversified funding base In R$ millions, end of period 1Q19 4Q18D 1Q18D Demand Deposits 74,757 72,581 3.0% 66,430 12.5% Savings Deposits 136,613 136,865 -0.2% 122,412 11.6% Time Deposits 248,049 251,301 -1.3% 215,743 15.0% Debentures (Linked to Repurchase Agreements and Third Parties’ Operations) 15,336 21,417 -28.4% 45,030 -65.9% (1) Funds from Bills and Structured Operations Certificates 72,002 69,512 3.6% 73,821 -2.5% (1) Funding from Account Holders and Institutional Clients 546,757 551,676 -0.9% 523,436 4.5% Onlending 15,855 17,907 -11.5% 21,893 -27.6% (2) Total - Funding from Clients 562,612 569,583 -1.2% 545,329 3.2% Assets Under Administration 1,158,642 1,131,239 2.4% 1,026,534 12.9% Technical Provisions for Insurance, Pension Plan and Premium Bonds 207,308 203,417 1.9% 188,827 9.8% (3) Total – Clients 1,928,562 1,904,239 1.3% 1,760,690 9.5% Interbank deposits 2,065 2,675 -22.8% 3,361 -38.5% Funds from Acceptance and Issuance of Securities 45,038 42,054 7.1% 41,416 8.7% Total Funds from Clients + Interbank Deposits 1,975,665 1,948,967 1.4% 1,805,467 9.4% In R$ millions, end of period 1Q19 4Q18D 1Q18D Funding from Clients 562,612 569,583 -1.2% 545,329 3.2% Funds from Acceptance and Issuance of securities Abroad 45,038 42,054 7.1% 41,416 8.7% Borrowings 53,775 50,040 7.5% 41,337 30.1% (2) Other 28,946 25,678 12.7% 36,592 -20.9% Total (A) 690,371 687,356 0.4% 664,674 3.9% (-) Reserve Required by Brazilian Central Bank (94,854) (97,619) -2.8% (99,132) -4.3% (3) (-) Cash (currency) (30,376) (37,159) -18.3% (25,444) 19.4% Total (B) 565,141 552,578 2.3% 540,097 4.6% (4) Loan Portfolio (C) 543,654 532,481 2.1% 495,484 9.7% Loan Portfolio / Gross Funding (C/A) 78.7% 77.5% 130 bps 74.5% 420 bps Loan Portfolio / Net Funding (C/B) 96.2% 96.4% -20 bps 91.7% 450 bps (1) Includes funds from Real Estate, Mortgage, Financial, Credit and Similar Notes. (2) Includes installments of subordinated debt that are not included in the Tier II Referential Equity. (3) Includes cash, bank deposits of institutions without reserve requirements, foreign currency deposits in Brazil, foreign currency deposits abroad, and cash and cash equivalents in foreign currency. (4) The loan portfolio balance does not include financial guarantees provided. page 78
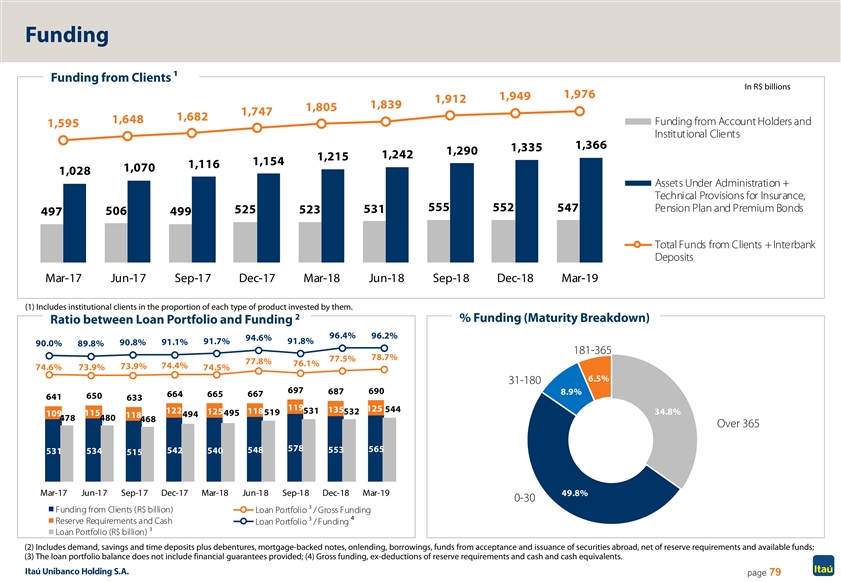
Funding Funding from Clients 1 In R$ billions 1,976 1,949 1,912 1,839 1,805 1,747 1,682 1,648 Funding from Account Holders and 1,595 Institutional Clients 1,366 1,335 1,290 1,242 1,215 1,154 1,116 1,070 1,028 Assets Under Administration + Technical Provisions for Insurance, 555 552 547 Pension Plan and Premium Bonds 531 525 523 506 497 499 Total Funds from Clients + Interbank Deposits Mar-17 Jun-17 Sep-17 Dec-17 Mar-18 Jun-18 Sep-18 Dec-18 Mar-19 (1) Includes institutional clients in the proportion of each type of product invested by them. 2 % Funding (Maturity Breakdown) Ratio between Loan Portfolio and Funding 96.4% 96.2% 94.6% 91.7% 91.8% 90.8% 91.1% 90.0% 89.8% 181-365 78.7% 77.5% 77.8% 76.1% 74.4% 73.9% 74.6% 73.9% 74.5% 6.5% 31-180 697 687 690 8.9% 667 664 665 650 641 633 119 125 135 544 122 531 125 118 532 34.8% 115 519 109 495 494 118 480 478 468 Over 365 578 553 565 542 540 548 531 534 515 Mar-17 Jun-17 Sep-17 Dec-17 Mar-18 Jun-18 Sep-18 Dec-18 Mar-19 49.8% 0-30 Funding from Clients (R$ billion) Loan Portfolio ³ / Gross Funding 4 Reserve Requirements and Cash Loan Portfolio ³ / Funding Loan Portfolio (R$ billion) ³ (2) Includes demand, savings and time deposits plus debentures, mortgage-backed notes, onlending, borrowings, funds from acceptance and issuance of securities abroad, net of reserve requirements and available funds; (3) The loan portfolio balance does not include financial guarantees provided; (4) Gross funding, ex-deductions of reserve requirements and cash and cash equivalents. page 79Funding Funding from Clients 1 In R$ billions 1,976 1,949 1,912 1,839 1,805 1,747 1,682 1,648 Funding from Account Holders and 1,595 Institutional Clients 1,366 1,335 1,290 1,242 1,215 1,154 1,116 1,070 1,028 Assets Under Administration + Technical Provisions for Insurance, 555 552 547 Pension Plan and Premium Bonds 531 525 523 506 497 499 Total Funds from Clients + Interbank Deposits Mar-17 Jun-17 Sep-17 Dec-17 Mar-18 Jun-18 Sep-18 Dec-18 Mar-19 (1) Includes institutional clients in the proportion of each type of product invested by them. 2 % Funding (Maturity Breakdown) Ratio between Loan Portfolio and Funding 96.4% 96.2% 94.6% 91.7% 91.8% 90.8% 91.1% 90.0% 89.8% 181-365 78.7% 77.5% 77.8% 76.1% 74.4% 73.9% 74.6% 73.9% 74.5% 6.5% 31-180 697 687 690 8.9% 667 664 665 650 641 633 119 125 135 544 122 531 125 118 532 34.8% 115 519 109 495 494 118 480 478 468 Over 365 578 553 565 542 540 548 531 534 515 Mar-17 Jun-17 Sep-17 Dec-17 Mar-18 Jun-18 Sep-18 Dec-18 Mar-19 49.8% 0-30 Funding from Clients (R$ billion) Loan Portfolio ³ / Gross Funding 4 Reserve Requirements and Cash Loan Portfolio ³ / Funding Loan Portfolio (R$ billion) ³ (2) Includes demand, savings and time deposits plus debentures, mortgage-backed notes, onlending, borrowings, funds from acceptance and issuance of securities abroad, net of reserve requirements and available funds; (3) The loan portfolio balance does not include financial guarantees provided; (4) Gross funding, ex-deductions of reserve requirements and cash and cash equivalents. page 79
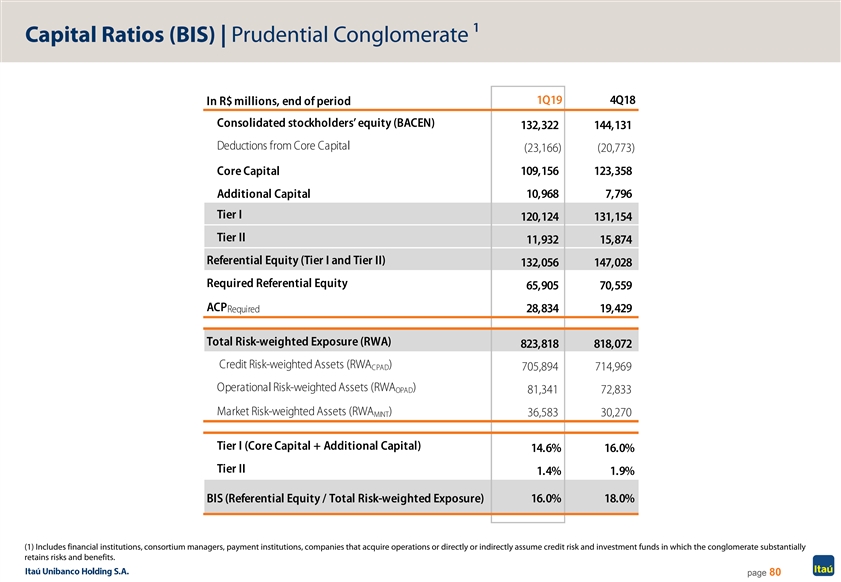
Capital Ratios (BIS) | Prudential Conglomerate 1 1Q19 4Q18 In R$ millions, end of period Consolidated stockholders’ equity (BACEN) 132,322 144,131 Deductions from Core Capital (23,166) (20,773) Core Capital 109,156 123,358 Additional Capital 10,968 7,796 Tier I 120,124 131,154 Tier II 11,932 15,874 Referential Equity (Tier I and Tier II) 132,056 147,028 Required Referential Equity 65,905 70,559 ACP Required 28,834 19,429 Total Risk-weighted Exposure (RWA) 823,818 818,072 Credit Risk-weighted Assets (RWA ) CPAD 705,894 714,969 Operational Risk-weighted Assets (RWA ) OPAD 81,341 72,833 Market Risk-weighted Assets (RWA ) 36,583 30,270 MINT Tier I (Core Capital + Additional Capital) 14.6% 16.0% Tier II 1.4% 1.9% BIS (Referential Equity / Total Risk-weighted Exposure) 16.0% 18.0% (1) Includes financial institutions, consortium managers, payment institutions, companies that acquire operations or directly or indirectly assume credit risk and investment funds in which the conglomerate substantially retains risks and benefits. page 80Capital Ratios (BIS) | Prudential Conglomerate 1 1Q19 4Q18 In R$ millions, end of period Consolidated stockholders’ equity (BACEN) 132,322 144,131 Deductions from Core Capital (23,166) (20,773) Core Capital 109,156 123,358 Additional Capital 10,968 7,796 Tier I 120,124 131,154 Tier II 11,932 15,874 Referential Equity (Tier I and Tier II) 132,056 147,028 Required Referential Equity 65,905 70,559 ACP Required 28,834 19,429 Total Risk-weighted Exposure (RWA) 823,818 818,072 Credit Risk-weighted Assets (RWA ) CPAD 705,894 714,969 Operational Risk-weighted Assets (RWA ) OPAD 81,341 72,833 Market Risk-weighted Assets (RWA ) 36,583 30,270 MINT Tier I (Core Capital + Additional Capital) 14.6% 16.0% Tier II 1.4% 1.9% BIS (Referential Equity / Total Risk-weighted Exposure) 16.0% 18.0% (1) Includes financial institutions, consortium managers, payment institutions, companies that acquire operations or directly or indirectly assume credit risk and investment funds in which the conglomerate substantially retains risks and benefits. page 80

Capital Ratios Full aplication of Basel III rules│ March 31, 2019 15.9% 14.6% 13.5% 1.0% -2.4% 0.3% 0.1% -0.1% 0.8% 1.3% 1.0% 14.9% 13.3% 12.5% Tier I 2018 additional Tier I Dec-18 1Q19 net income and Prudential Adjustments RWA Additional Tier I capital Tier I Dec-18 dividends and I OC after additional other equity changes approved in Mar-19 dividends and I OC February 2019 Common Equity Tier I (CET I) Additional Tier I (AT1) page 81Capital Ratios Full aplication of Basel III rules│ March 31, 2019 15.9% 14.6% 13.5% 1.0% -2.4% 0.3% 0.1% -0.1% 0.8% 1.3% 1.0% 14.9% 13.3% 12.5% Tier I 2018 additional Tier I Dec-18 1Q19 net income and Prudential Adjustments RWA Additional Tier I capital Tier I Dec-18 dividends and I OC after additional other equity changes approved in Mar-19 dividends and I OC February 2019 Common Equity Tier I (CET I) Additional Tier I (AT1) page 81
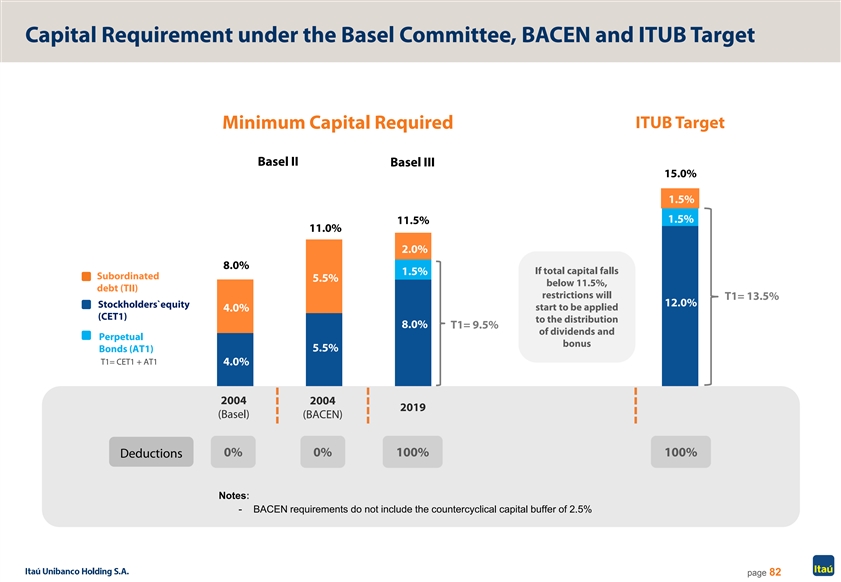
Capital Requirement under the Basel Committee, BACEN and ITUB Target ITUB Target Minimum Capital Required Basel II Basel III 15.0% 1.5% 1.5% 11.5% 11.0% 2.0% 8.0% If total capital falls 1.5% Subordinated 5.5% below 11.5%, debt (TII) restrictions will T1= 13.5% 12.0% Stockholders`equity start to be applied 4.0% (CET1) to the distribution 8.0% T1= 9.5% of dividends and Perpetual bonus 5.5% Bonds (AT1) T1= CET1 + AT1 4.0% 2004 2004 2019 (Basel) (BACEN) 0% 0% 100% 100% Deductions Notes: - BACEN requirements do not include the countercyclical capital buffer of 2.5% page 82Capital Requirement under the Basel Committee, BACEN and ITUB Target ITUB Target Minimum Capital Required Basel II Basel III 15.0% 1.5% 1.5% 11.5% 11.0% 2.0% 8.0% If total capital falls 1.5% Subordinated 5.5% below 11.5%, debt (TII) restrictions will T1= 13.5% 12.0% Stockholders`equity start to be applied 4.0% (CET1) to the distribution 8.0% T1= 9.5% of dividends and Perpetual bonus 5.5% Bonds (AT1) T1= CET1 + AT1 4.0% 2004 2004 2019 (Basel) (BACEN) 0% 0% 100% 100% Deductions Notes: - BACEN requirements do not include the countercyclical capital buffer of 2.5% page 82

Payout Practice In order to manage capital efficiently, aiming at creating value to our shareholders, we announced through a Material Fact disclosed on September 26, 2017, that we intend to: § Maintain the practice of paying dividends and interest on own capital at 35% of net income, however we excluded the maximum limit previously determined at 45%. § Set forth, through the Board of Directors, the total amount to be distributed each year considering: • the company’s capitalization level, according to rules issued by the Brazilian Central Bank; • the minimum Tier 1 Capital* of 13.5% determined by the Board of Directors. We highlight that this ratio must be composed of at least 12% of Core Capital; • the profitability in the year; • the expectations of capital use based on the expected business growth, share buyback programs, mergers and acquisitions and regulatory changes that may change capital requirement; • changes in tax legislation. Therefore, the percentage to be distributed may change every year based on the company’s profitability and capital demands, always considering the minimum distribution set forth in the Bylaws. 1 Total Payout simulation to keep Tier I Capital* at 13.5% under different return and growth scenarios: 3 ROE 15.00% 17.50% 20.00% 22.50% 25.00% 65 – 70% 70 – 75% 75 – 80% 80 – 85% 85 - 90% 5.00% 2 RWA 10.00% 40 – 45% 45 – 50% 50 – 55% 55 – 60% 60 – 65% Growth 15.00% 35% 35% 35 – 40% 40 – 45% 45 – 50% * Taking into consideration the full application of Basel III rules, in addition to the impact from the acquisition of the minority interest of 49.9% in XP Investimentos. (1) Includes total amounts of dividends and share buyback. Simulations include the June 2017 base and Citibank’s Brazilian retail business and the 49.9% minority interest in XP Investimentos transactions; (2) Risk-Weighted Assets; (3) Return on Equity. page 83Payout Practice In order to manage capital efficiently, aiming at creating value to our shareholders, we announced through a Material Fact disclosed on September 26, 2017, that we intend to: § Maintain the practice of paying dividends and interest on own capital at 35% of net income, however we excluded the maximum limit previously determined at 45%. § Set forth, through the Board of Directors, the total amount to be distributed each year considering: • the company’s capitalization level, according to rules issued by the Brazilian Central Bank; • the minimum Tier 1 Capital* of 13.5% determined by the Board of Directors. We highlight that this ratio must be composed of at least 12% of Core Capital; • the profitability in the year; • the expectations of capital use based on the expected business growth, share buyback programs, mergers and acquisitions and regulatory changes that may change capital requirement; • changes in tax legislation. Therefore, the percentage to be distributed may change every year based on the company’s profitability and capital demands, always considering the minimum distribution set forth in the Bylaws. 1 Total Payout simulation to keep Tier I Capital* at 13.5% under different return and growth scenarios: 3 ROE 15.00% 17.50% 20.00% 22.50% 25.00% 65 – 70% 70 – 75% 75 – 80% 80 – 85% 85 - 90% 5.00% 2 RWA 10.00% 40 – 45% 45 – 50% 50 – 55% 55 – 60% 60 – 65% Growth 15.00% 35% 35% 35 – 40% 40 – 45% 45 – 50% * Taking into consideration the full application of Basel III rules, in addition to the impact from the acquisition of the minority interest of 49.9% in XP Investimentos. (1) Includes total amounts of dividends and share buyback. Simulations include the June 2017 base and Citibank’s Brazilian retail business and the 49.9% minority interest in XP Investimentos transactions; (2) Risk-Weighted Assets; (3) Return on Equity. page 83

Ratings FitchRatings International National Viability Support Local Currency Foreign Currency Long Term Short Term Long Term Short Term Long Term Short Term bb+ 4 BB B BB B AAA (bra) F1+ (bra) Moody’s International National Subordinated Debt Senior Unsecured Debt Issuer Issuer Foreign Currency Foreign Currency Local Currency Long Term Long Term Long Term Short Term Long Term Short Term (P) Ba3 (P) Ba3 Ba3 NP A1. br BR-1 Standard &Poor’s International National Local Currency Foreign Currency Long Term Short Term Long Term Short Term Long Term Short Term BB- B BB- B brAAA brA-1+ page 84Ratings FitchRatings International National Viability Support Local Currency Foreign Currency Long Term Short Term Long Term Short Term Long Term Short Term bb+ 4 BB B BB B AAA (bra) F1+ (bra) Moody’s International National Subordinated Debt Senior Unsecured Debt Issuer Issuer Foreign Currency Foreign Currency Local Currency Long Term Long Term Long Term Short Term Long Term Short Term (P) Ba3 (P) Ba3 Ba3 NP A1. br BR-1 Standard &Poor’s International National Local Currency Foreign Currency Long Term Short Term Long Term Short Term Long Term Short Term BB- B BB- B brAAA brA-1+ page 84

Information Technology 5Information Technology 5

Digital Transformation Use of Digital Channels¹ number of current account holders (in millions) Share of Transactions through digital channels Companies Individuals 1Q17 1Q19 11.5 Credit 16% 18% 1.2 10.0 1.1 1.0 8.8 37% 46% Investments Payments 64% 80% Note: Share of digital channels in the total volume Mar-17 Mar-18 Mar-19 Mar-17 Mar-18 Mar-19 (R$) of transactions in the Retail Bank segment ¹ Internet, mobile or SMS in the Retail Bank. New Accounts Share of Digital Operations on the Retail Operating Revenues individuals accounts (in thousands) 1Q17 1Q19 1,108 1Q19 1,073 1,066 1,037 1,007 Efficiency Ratio Brick and Mortar 27% 225 221 32% 165 Branches 127 91 70% 68% 73% vs Digital Branches 1Q18 2Q18 3Q18 4Q18 1Q19 27% Digital Branches Brick and Mortar Branches Abreconta App Brick and Mortar Branches page 86Digital Transformation Use of Digital Channels¹ number of current account holders (in millions) Share of Transactions through digital channels Companies Individuals 1Q17 1Q19 11.5 Credit 16% 18% 1.2 10.0 1.1 1.0 8.8 37% 46% Investments Payments 64% 80% Note: Share of digital channels in the total volume Mar-17 Mar-18 Mar-19 Mar-17 Mar-18 Mar-19 (R$) of transactions in the Retail Bank segment ¹ Internet, mobile or SMS in the Retail Bank. New Accounts Share of Digital Operations on the Retail Operating Revenues individuals accounts (in thousands) 1Q17 1Q19 1,108 1Q19 1,073 1,066 1,037 1,007 Efficiency Ratio Brick and Mortar 27% 225 221 32% 165 Branches 127 91 70% 68% 73% vs Digital Branches 1Q18 2Q18 3Q18 4Q18 1Q19 27% Digital Branches Brick and Mortar Branches Abreconta App Brick and Mortar Branches page 86

Itaú Unibanco in Capital Markets 6Itaú Unibanco in Capital Markets 6

Non-voting Shares Appreciation | ITUB4 and ITUB Evolution of R$100 invested on the day before the announcement of the merger (October 31, 2008) to March 29, 2019 569 357 273 256 Mar-19 Oct-08 Oct-09 Oct-10 Oct-11 Oct-12 Oct-13 Oct-14 Oct-15 Oct-16 Oct-17 Oct-18 ITUB4 - Without dividend reinvestiment ITUB4 - With dividend reinvestiment IBOVESPA Index CDI 297 192 148 139 Oct-08 Oct-09 Oct-10 Oct-11 Oct-12 Oct-13 Oct-14 Oct-15 Oct-16 Oct-17 O Ma ct- r- 11 89 ITUB - Without dividend reinvestiment ITUB - With dividend reinvestiment IBOVESPA Index (in USD) CDI (in USD) Fonte: Economatica page 88Non-voting Shares Appreciation | ITUB4 and ITUB Evolution of R$100 invested on the day before the announcement of the merger (October 31, 2008) to March 29, 2019 569 357 273 256 Mar-19 Oct-08 Oct-09 Oct-10 Oct-11 Oct-12 Oct-13 Oct-14 Oct-15 Oct-16 Oct-17 Oct-18 ITUB4 - Without dividend reinvestiment ITUB4 - With dividend reinvestiment IBOVESPA Index CDI 297 192 148 139 Oct-08 Oct-09 Oct-10 Oct-11 Oct-12 Oct-13 Oct-14 Oct-15 Oct-16 Oct-17 O Ma ct- r- 11 89 ITUB - Without dividend reinvestiment ITUB - With dividend reinvestiment IBOVESPA Index (in USD) CDI (in USD) Fonte: Economatica page 88

Sustainability 7Sustainability 7

Sustainability Timeline First cell for analysis Sustainability Sustainability of environmental Committee Governance and social risks (officers level) (executive level) 2000 2005 2007 Sustainable performance in corporate vision Creation of Itaú Unibanco operating Merger committees 2013 2010 2008 Positive Impact Commitment Based on interviews and research, we will create Sustainability at the commitments, indicators and goals, aligned with board of directors’ SDG. Theses commitments will be released in 2019. Strategy Superior Ethics and Central Bank Committee Sustainability Regulation Committee 2014 2016 2018 2017 2019 Definition of our Revision of the Sustainable sustainability Financial Drivers strategy pg. 90Sustainability Timeline First cell for analysis Sustainability Sustainability of environmental Committee Governance and social risks (officers level) (executive level) 2000 2005 2007 Sustainable performance in corporate vision Creation of Itaú Unibanco operating Merger committees 2013 2010 2008 Positive Impact Commitment Based on interviews and research, we will create Sustainability at the commitments, indicators and goals, aligned with board of directors’ SDG. Theses commitments will be released in 2019. Strategy Superior Ethics and Central Bank Committee Sustainability Regulation Committee 2014 2016 2018 2017 2019 Definition of our Revision of the Sustainable sustainability Financial Drivers strategy pg. 90

Estratégia de Sustentabilidade The strategy defined in 2011 consisted of a sustainability map that determined three strategic focuses for our activities: SOCIAL-ENVIRONMENTAL RISKS DIALOG AND TRANSPARENCY FINANCIAL EDUCATION AND Understand people´s needs to offer Build long-term relations based on trust to Search business opportunities and manage knowledge and appropriate financial improve our business and generate shared environmental risk, considering market solutions, contributing for individuals and value. trends, regulations, customer demands and companies to have a healthy relationship society. with money. Strategy review Sustainable Financial Drivers We understand that our current positioning has matured and started a process to review our strategic sustainability guidelines: The review process of the strategic sustainability guidelines was divided into three main stages: • Access and Financial Inclusion 1. Issue development, which comprises the timely analysis of the corporate • Suitability with Financial Guidance sustainability concept in the world; • Capital for Infrastructure 2. Analysis of the competition and major world trends, and an internal and external • Technological-Financial Innovation diagnosis; • Intelligence and Risk Management 3. Strategy Build-Up, with a new positioning and strategic model. • Integrity Transparency and Market Resilience Currently, the review has already enabled the creation of Sustainable Financial Drivers, • Inclusive and Responsible Management which seek to translate the main impacts generated through our core activity. pg. 91Estratégia de Sustentabilidade The strategy defined in 2011 consisted of a sustainability map that determined three strategic focuses for our activities: SOCIAL-ENVIRONMENTAL RISKS DIALOG AND TRANSPARENCY FINANCIAL EDUCATION AND Understand people´s needs to offer Build long-term relations based on trust to Search business opportunities and manage knowledge and appropriate financial improve our business and generate shared environmental risk, considering market solutions, contributing for individuals and value. trends, regulations, customer demands and companies to have a healthy relationship society. with money. Strategy review Sustainable Financial Drivers We understand that our current positioning has matured and started a process to review our strategic sustainability guidelines: The review process of the strategic sustainability guidelines was divided into three main stages: • Access and Financial Inclusion 1. Issue development, which comprises the timely analysis of the corporate • Suitability with Financial Guidance sustainability concept in the world; • Capital for Infrastructure 2. Analysis of the competition and major world trends, and an internal and external • Technological-Financial Innovation diagnosis; • Intelligence and Risk Management 3. Strategy Build-Up, with a new positioning and strategic model. • Integrity Transparency and Market Resilience Currently, the review has already enabled the creation of Sustainable Financial Drivers, • Inclusive and Responsible Management which seek to translate the main impacts generated through our core activity. pg. 91

Corporate Sustainability Governance Board level Definition and monitoring of the sustainability strategy Board of Directors Board of Directors Members Members of of the Board the Board of Directors of Directors Strategy Committee Strategy Committee Members Members of of the Board the Board of Directors of Directors Executive level Periodicity: annual Integration of challenges and trends into businesses Superior Ethics and Superior Ethics and Sustainability C Sustainability Co ommittee mmittee Periodicity: semi-annual Members Members of of the the Executive Executive Committee Committee Officers level Decision on and prioritization Sustainability Sustainability of projects Committee Committee Periodicity: bimonthly Members Members:: Officers Officers of areas involved of areas involved in in the sustainability the sustainability agenda agenda Operating level Management of projects by Internal Responsible specific topics Worki Workin ng Group g Groups s Reporting Management Investment Members Members:: Executives Executives of areas involved of areas involved Ecoefficiency in sustainability in sustainability projects projects integrity and Foundations Diversity ethics and Institute Environmental and Social Risk Committee Environmental and Social Risk Meets on a quarterly basis and is responsible for suggesting Comittee institutional positions on internal procedures and exposure to the environmental and social risk. page 92Corporate Sustainability Governance Board level Definition and monitoring of the sustainability strategy Board of Directors Board of Directors Members Members of of the Board the Board of Directors of Directors Strategy Committee Strategy Committee Members Members of of the Board the Board of Directors of Directors Executive level Periodicity: annual Integration of challenges and trends into businesses Superior Ethics and Superior Ethics and Sustainability C Sustainability Co ommittee mmittee Periodicity: semi-annual Members Members of of the the Executive Executive Committee Committee Officers level Decision on and prioritization Sustainability Sustainability of projects Committee Committee Periodicity: bimonthly Members Members:: Officers Officers of areas involved of areas involved in in the sustainability the sustainability agenda agenda Operating level Management of projects by Internal Responsible specific topics Worki Workin ng Group g Groups s Reporting Management Investment Members Members:: Executives Executives of areas involved of areas involved Ecoefficiency in sustainability in sustainability projects projects integrity and Foundations Diversity ethics and Institute Environmental and Social Risk Committee Environmental and Social Risk Meets on a quarterly basis and is responsible for suggesting Comittee institutional positions on internal procedures and exposure to the environmental and social risk. page 92
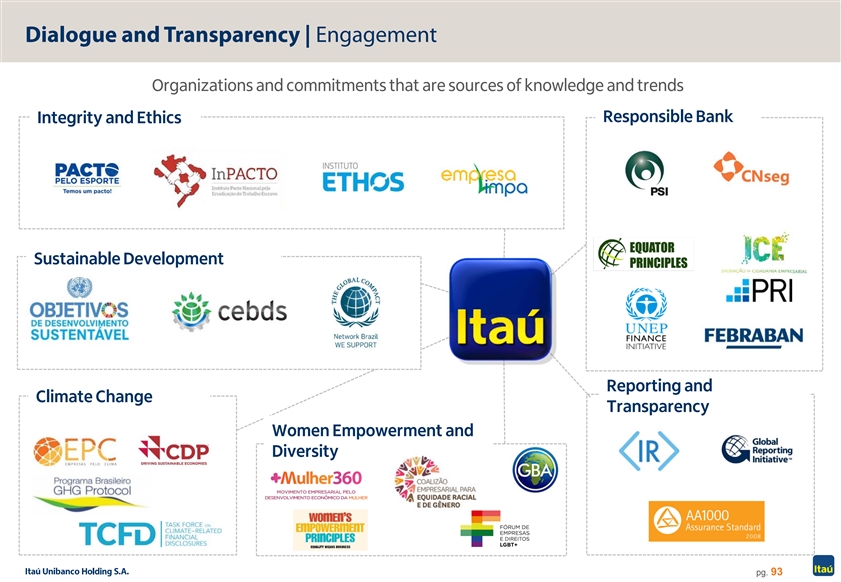
Dialogue and Transparency | Engagement Organizations and commitments that are sources of knowledge and trends Responsible Bank Integrity and Ethics Sustainable Development Reporting and Climate Change Transparency Women Empowerment and Diversity pg. 93Dialogue and Transparency | Engagement Organizations and commitments that are sources of knowledge and trends Responsible Bank Integrity and Ethics Sustainable Development Reporting and Climate Change Transparency Women Empowerment and Diversity pg. 93

Transparency with the Market | Reporting Integrated Report Integrated Annual Report • First Brazilian financial institution to Integrated publish it voluntarily. Report(20F Sustainability + IIRC) Report + • Presentation of the results from 6 + GRI capitals: financial, social and Financial relationship, human, intellectual, Demonstrations manufactured and natural. Recognitions Part of the index Only Latin American bank Part of the since its creation to be part of the index index since in 2005. since its creation (1999). 2015. Part of the Index Leader in Transparency portfolio since its Part of the ICO2 since 2014. second edition in portfolio since its 2016. inception in 2010. page 94Transparency with the Market | Reporting Integrated Report Integrated Annual Report • First Brazilian financial institution to Integrated publish it voluntarily. Report(20F Sustainability + IIRC) Report + • Presentation of the results from 6 + GRI capitals: financial, social and Financial relationship, human, intellectual, Demonstrations manufactured and natural. Recognitions Part of the index Only Latin American bank Part of the since its creation to be part of the index index since in 2005. since its creation (1999). 2015. Part of the Index Leader in Transparency portfolio since its Part of the ICO2 since 2014. second edition in portfolio since its 2016. inception in 2010. page 94
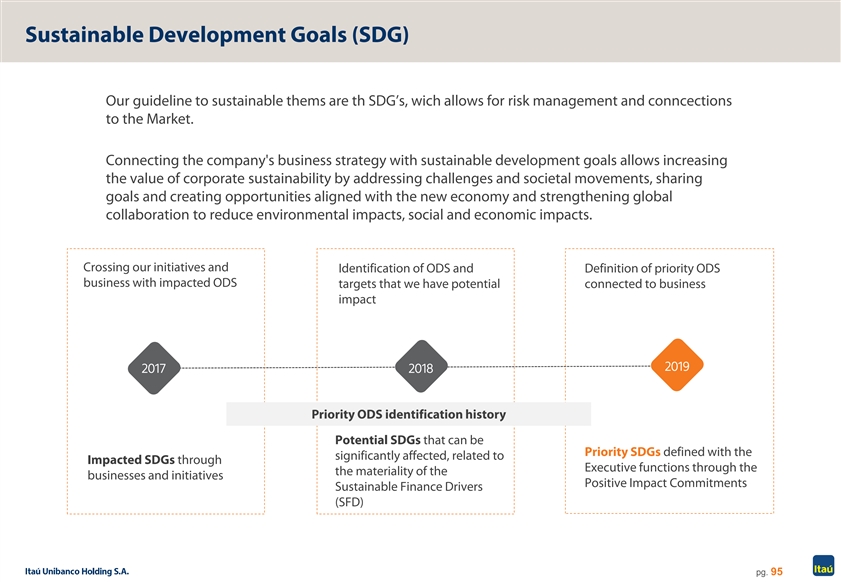
Sustainable Development Goals (SDG) Our guideline to sustainable thems are th SDG’s, wich allows for risk management and conncections to the Market. Connecting the company's business strategy with sustainable development goals allows increasing the value of corporate sustainability by addressing challenges and societal movements, sharing goals and creating opportunities aligned with the new economy and strengthening global collaboration to reduce environmental impacts, social and economic impacts. Crossing our initiatives and Identification of ODS and Definition of priority ODS business with impacted ODS targets that we have potential connected to business impact 2019 2017 2018 Priority ODS identification history Potential SDGs that can be Priority SDGs defined with the significantly affected, related to Impacted SDGs through Executive functions through the the materiality of the businesses and initiatives Positive Impact Commitments Sustainable Finance Drivers (SFD) pg. 95Sustainable Development Goals (SDG) Our guideline to sustainable thems are th SDG’s, wich allows for risk management and conncections to the Market. Connecting the company's business strategy with sustainable development goals allows increasing the value of corporate sustainability by addressing challenges and societal movements, sharing goals and creating opportunities aligned with the new economy and strengthening global collaboration to reduce environmental impacts, social and economic impacts. Crossing our initiatives and Identification of ODS and Definition of priority ODS business with impacted ODS targets that we have potential connected to business impact 2019 2017 2018 Priority ODS identification history Potential SDGs that can be Priority SDGs defined with the significantly affected, related to Impacted SDGs through Executive functions through the the materiality of the businesses and initiatives Positive Impact Commitments Sustainable Finance Drivers (SFD) pg. 95

Employees | Profile 1 100,335 Employees Organizational Climate Thinking about the best way to measure and monitor our employees’ satisfaction, in 2018 we redesigned our survey strategy, by 60% 40% discontinuing the Fale Francamente (Speak Frankly) survey, which was replaced by Pulse 51.5%2 of management 22%2of employees are Overall 2016 2017 2018* positions are held by blacks Satisfaction women 84% 85% 87% Rate *Results from 2018’s second semestre. 4.8%2 of employees are It is an internally-developed survey that measures the employees’ 2.73%2 are apprentices disabled persons level of agreement with 17 statements divided into four evaluation blocks: Individual, Team, Management and Company. (1) Employees who were active in December 2018, in Brazil and abroad from companies managed by the human resources department.. (2) Values regarding Brazil + Latam Communities: a new working dynamic Employees’ Well-Being and Health We seek to develop dynamics that place people from different areas Beyond accomplishing the commitments and collective conventions we signed, and with different backgrounds to think about solutions focused on we seek to value our employeess well-being through an array of benefits to the client; therefore, we work based on the rationale that the best provide them a better life. Some examples of the benefits are: solutions come from the multiplicity of visions. Fique Ok: A personal support program to our employees and their family Accordingly, we established a new work format, known as members, with a multidisciplinary team available 24/7, offering a free and Communities of Delivery, with which we form interdisciplinary teams confidential service; that are not governed by hierarchy, with the application of an Agile Psychosocial Services: Psychological and Social Work care at our administrative and Lean Framework in the solution of challenges and with more and technologic buildings; independence and collaboration. Parental Support Policy: Sets benefits for pregnant women and homosexual couples after the birth or adoption of children, also providing special readaptation Currently, we have more than 30 communities where more than 6,000 conditions to women returning from their maternity license employees work, with an increase of 20% in productivity. page 96Employees | Profile 1 100,335 Employees Organizational Climate Thinking about the best way to measure and monitor our employees’ satisfaction, in 2018 we redesigned our survey strategy, by 60% 40% discontinuing the Fale Francamente (Speak Frankly) survey, which was replaced by Pulse 51.5%2 of management 22%2of employees are Overall 2016 2017 2018* positions are held by blacks Satisfaction women 84% 85% 87% Rate *Results from 2018’s second semestre. 4.8%2 of employees are It is an internally-developed survey that measures the employees’ 2.73%2 are apprentices disabled persons level of agreement with 17 statements divided into four evaluation blocks: Individual, Team, Management and Company. (1) Employees who were active in December 2018, in Brazil and abroad from companies managed by the human resources department.. (2) Values regarding Brazil + Latam Communities: a new working dynamic Employees’ Well-Being and Health We seek to develop dynamics that place people from different areas Beyond accomplishing the commitments and collective conventions we signed, and with different backgrounds to think about solutions focused on we seek to value our employeess well-being through an array of benefits to the client; therefore, we work based on the rationale that the best provide them a better life. Some examples of the benefits are: solutions come from the multiplicity of visions. Fique Ok: A personal support program to our employees and their family Accordingly, we established a new work format, known as members, with a multidisciplinary team available 24/7, offering a free and Communities of Delivery, with which we form interdisciplinary teams confidential service; that are not governed by hierarchy, with the application of an Agile Psychosocial Services: Psychological and Social Work care at our administrative and Lean Framework in the solution of challenges and with more and technologic buildings; independence and collaboration. Parental Support Policy: Sets benefits for pregnant women and homosexual couples after the birth or adoption of children, also providing special readaptation Currently, we have more than 30 communities where more than 6,000 conditions to women returning from their maternity license employees work, with an increase of 20% in productivity. page 96
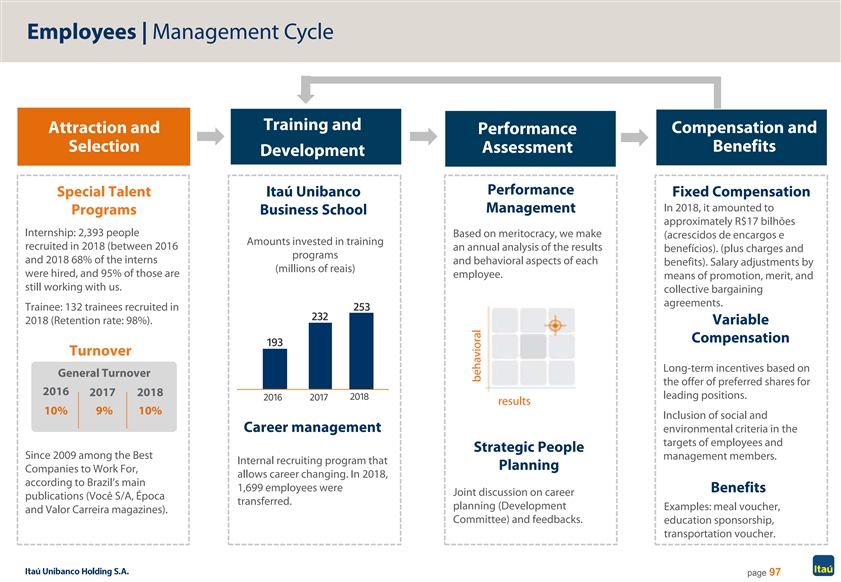
Employees | Management Cycle Training and Attraction and Compensation and Performance Selection Benefits Assessment Development Performance Special Talent Itaú Unibanco Fixed Compensation In 2018, it amounted to Management Programs Business School approximately R$17 bilhões Internship: 2,393 people Based on meritocracy, we make (acrescidos de encargos e Amounts invested in training recruited in 2018 (between 2016 an annual analysis of the results benefícios). (plus charges and programs and 2018 68% of the interns and behavioral aspects of each benefits). Salary adjustments by (millions of reais) were hired, and 95% of those are employee. means of promotion, merit, and still working with us. collective bargaining agreements. Trainee: 132 trainees recruited in 253 232 2018 (Retention rate: 98%). Variable Compensation 193 Turnover Long-term incentives based on General Turnover the offer of preferred shares for 2016 2017 2018 2018 leading positions. 2016 2017 results 10% 9% 10% Inclusion of social and Career management environmental criteria in the targets of employees and Strategic People Since 2009 among the Best management members. Internal recruiting program that Planning Companies to Work For, allows career changing. In 2018, according to Brazil’s main 1,699 employees were Benefits Joint discussion on career publications (Você S/A, Época transferred. planning (Development Examples: meal voucher, and Valor Carreira magazines). Committee) and feedbacks. education sponsorship, transportation voucher. page 97 behavioralEmployees | Management Cycle Training and Attraction and Compensation and Performance Selection Benefits Assessment Development Performance Special Talent Itaú Unibanco Fixed Compensation In 2018, it amounted to Management Programs Business School approximately R$17 bilhões Internship: 2,393 people Based on meritocracy, we make (acrescidos de encargos e Amounts invested in training recruited in 2018 (between 2016 an annual analysis of the results benefícios). (plus charges and programs and 2018 68% of the interns and behavioral aspects of each benefits). Salary adjustments by (millions of reais) were hired, and 95% of those are employee. means of promotion, merit, and still working with us. collective bargaining agreements. Trainee: 132 trainees recruited in 253 232 2018 (Retention rate: 98%). Variable Compensation 193 Turnover Long-term incentives based on General Turnover the offer of preferred shares for 2016 2017 2018 2018 leading positions. 2016 2017 results 10% 9% 10% Inclusion of social and Career management environmental criteria in the targets of employees and Strategic People Since 2009 among the Best management members. Internal recruiting program that Planning Companies to Work For, allows career changing. In 2018, according to Brazil’s main 1,699 employees were Benefits Joint discussion on career publications (Você S/A, Época transferred. planning (Development Examples: meal voucher, and Valor Carreira magazines). Committee) and feedbacks. education sponsorship, transportation voucher. page 97 behavioral
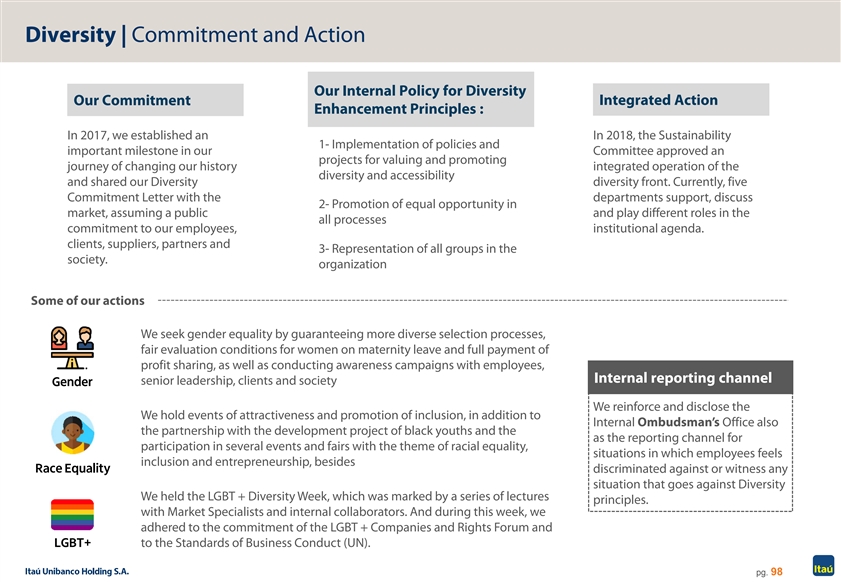
Diversity | Commitment and Action Our Internal Policy for Diversity Our Commitment Integrated Action Enhancement Principles : In 2017, we established an In 2018, the Sustainability 1- Implementation of policies and important milestone in our Committee approved an projects for valuing and promoting journey of changing our history integrated operation of the diversity and accessibility and shared our Diversity diversity front. Currently, five Commitment Letter with the departments support, discuss 2- Promotion of equal opportunity in market, assuming a public and play different roles in the all processes commitment to our employees, institutional agenda. clients, suppliers, partners and 3- Representation of all groups in the society. organization Some of our actions We seek gender equality by guaranteeing more diverse selection processes, fair evaluation conditions for women on maternity leave and full payment of profit sharing, as well as conducting awareness campaigns with employees, Internal reporting channel senior leadership, clients and society Gender We reinforce and disclose the We hold events of attractiveness and promotion of inclusion, in addition to Internal Ombudsman’s Office also the partnership with the development project of black youths and the as the reporting channel for participation in several events and fairs with the theme of racial equality, situations in which employees feels inclusion and entrepreneurship, besides Race Equality discriminated against or witness any situation that goes against Diversity We held the LGBT + Diversity Week, which was marked by a series of lectures principles. with Market Specialists and internal collaborators. And during this week, we adhered to the commitment of the LGBT + Companies and Rights Forum and LGBT+ to the Standards of Business Conduct (UN). pg. 98Diversity | Commitment and Action Our Internal Policy for Diversity Our Commitment Integrated Action Enhancement Principles : In 2017, we established an In 2018, the Sustainability 1- Implementation of policies and important milestone in our Committee approved an projects for valuing and promoting journey of changing our history integrated operation of the diversity and accessibility and shared our Diversity diversity front. Currently, five Commitment Letter with the departments support, discuss 2- Promotion of equal opportunity in market, assuming a public and play different roles in the all processes commitment to our employees, institutional agenda. clients, suppliers, partners and 3- Representation of all groups in the society. organization Some of our actions We seek gender equality by guaranteeing more diverse selection processes, fair evaluation conditions for women on maternity leave and full payment of profit sharing, as well as conducting awareness campaigns with employees, Internal reporting channel senior leadership, clients and society Gender We reinforce and disclose the We hold events of attractiveness and promotion of inclusion, in addition to Internal Ombudsman’s Office also the partnership with the development project of black youths and the as the reporting channel for participation in several events and fairs with the theme of racial equality, situations in which employees feels inclusion and entrepreneurship, besides Race Equality discriminated against or witness any situation that goes against Diversity We held the LGBT + Diversity Week, which was marked by a series of lectures principles. with Market Specialists and internal collaborators. And during this week, we adhered to the commitment of the LGBT + Companies and Rights Forum and LGBT+ to the Standards of Business Conduct (UN). pg. 98
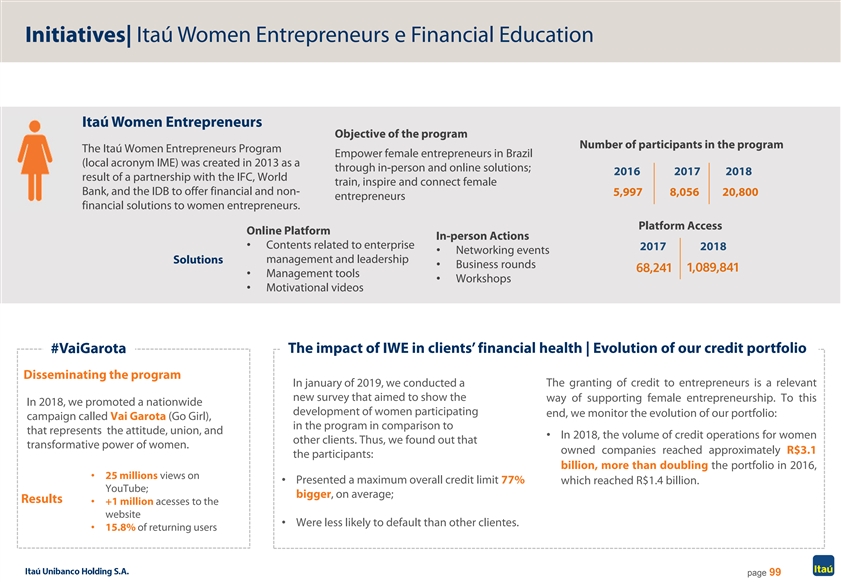
Initiatives| Itaú Women Entrepreneurs e Financial Education Itaú Women Entrepreneurs Objective of the program Number of participants in the program The Itaú Women Entrepreneurs Program Empower female entrepreneurs in Brazil (local acronym IME) was created in 2013 as a through in-person and online solutions; 2016 2017 2018 result of a partnership with the IFC, World train, inspire and connect female Bank, and the IDB to offer financial and non- 5,997 8,056 20,800 entrepreneurs financial solutions to women entrepreneurs. Platform Access Online Platform In-person Actions • Contents related to enterprise 2017 2018 • Networking events management and leadership Solutions • Business rounds 68,241 1,089,841 • Management tools • Workshops • Motivational videos The impact of IWE in clients’ financial health | Evolution of our credit portfolio #VaiGarota Disseminating the program In january of 2019, we conducted a The granting of credit to entrepreneurs is a relevant new survey that aimed to show the way of supporting female entrepreneurship. To this In 2018, we promoted a nationwide development of women participating end, we monitor the evolution of our portfolio: campaign called Vai Garota (Go Girl), in the program in comparison to that represents the attitude, union, and • In 2018, the volume of credit operations for women other clients. Thus, we found out that transformative power of women. owned companies reached approximately R$3.1 the participants: billion, more than doubling the portfolio in 2016, • 25 millions views on • Presented a maximum overall credit limit 77% which reached R$1.4 billion. YouTube; bigger, on average; Results • +1 million acesses to the website • Were less likely to default than other clientes. • 15.8% of returning users page 99Initiatives| Itaú Women Entrepreneurs e Financial Education Itaú Women Entrepreneurs Objective of the program Number of participants in the program The Itaú Women Entrepreneurs Program Empower female entrepreneurs in Brazil (local acronym IME) was created in 2013 as a through in-person and online solutions; 2016 2017 2018 result of a partnership with the IFC, World train, inspire and connect female Bank, and the IDB to offer financial and non- 5,997 8,056 20,800 entrepreneurs financial solutions to women entrepreneurs. Platform Access Online Platform In-person Actions • Contents related to enterprise 2017 2018 • Networking events management and leadership Solutions • Business rounds 68,241 1,089,841 • Management tools • Workshops • Motivational videos The impact of IWE in clients’ financial health | Evolution of our credit portfolio #VaiGarota Disseminating the program In january of 2019, we conducted a The granting of credit to entrepreneurs is a relevant new survey that aimed to show the way of supporting female entrepreneurship. To this In 2018, we promoted a nationwide development of women participating end, we monitor the evolution of our portfolio: campaign called Vai Garota (Go Girl), in the program in comparison to that represents the attitude, union, and • In 2018, the volume of credit operations for women other clients. Thus, we found out that transformative power of women. owned companies reached approximately R$3.1 the participants: billion, more than doubling the portfolio in 2016, • 25 millions views on • Presented a maximum overall credit limit 77% which reached R$1.4 billion. YouTube; bigger, on average; Results • +1 million acesses to the website • Were less likely to default than other clientes. • 15.8% of returning users page 99
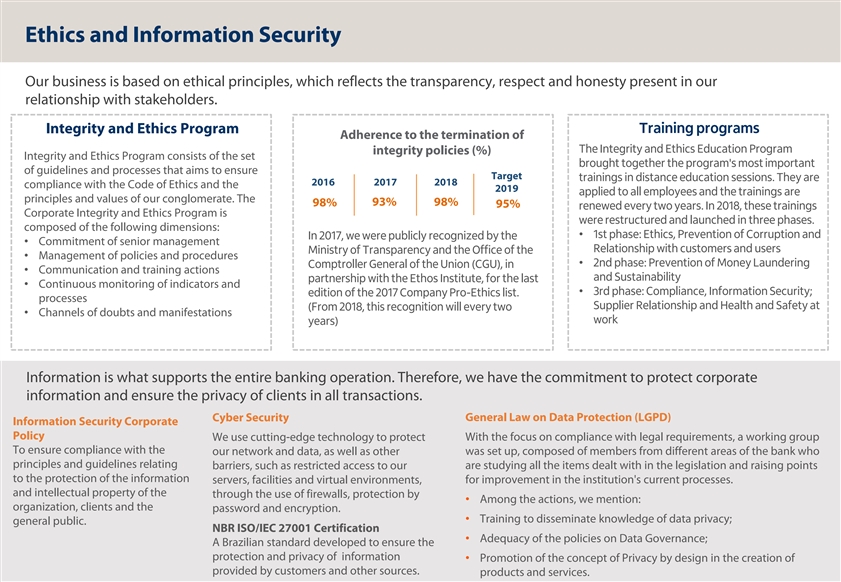
Ethics and Information Security Our business is based on ethical principles, which reflects the transparency, respect and honesty present in our relationship with stakeholders. Training programs Integrity and Ethics Program Adherence to the termination of The Integrity and Ethics Education Program integrity policies (%) Integrity and Ethics Program consists of the set brought together the program's most important of guidelines and processes that aims to ensure Target trainings in distance education sessions. They are 2016 2017 2018 compliance with the Code of Ethics and the 2019 applied to all employees and the trainings are principles and values of our conglomerate. The 93% 98% 98% 95% renewed every two years. In 2018, these trainings Corporate Integrity and Ethics Program is were restructured and launched in three phases. composed of the following dimensions: • 1st phase: Ethics, Prevention of Corruption and In 2017, we were publicly recognized by the • Commitment of senior management Relationship with customers and users Ministry of Transparency and the Office of the • Management of policies and procedures • 2nd phase: Prevention of Money Laundering Comptroller General of the Union (CGU), in • Communication and training actions and Sustainability partnership with the Ethos Institute, for the last • Continuous monitoring of indicators and • 3rd phase: Compliance, Information Security; edition of the 2017 Company Pro-Ethics list. processes Supplier Relationship and Health and Safety at (From 2018, this recognition will every two • Channels of doubts and manifestations work years) Information is what supports the entire banking operation. Therefore, we have the commitment to protect corporate information and ensure the privacy of clients in all transactions. Cyber Security General Law on Data Protection (LGPD) Information Security Corporate Policy With the focus on compliance with legal requirements, a working group We use cutting-edge technology to protect To ensure compliance with the our network and data, as well as other was set up, composed of members from different areas of the bank who principles and guidelines relating barriers, such as restricted access to our are studying all the items dealt with in the legislation and raising points to the protection of the information servers, facilities and virtual environments, for improvement in the institution's current processes. and intellectual property of the through the use of firewalls, protection by • Among the actions, we mention: organization, clients and the password and encryption. • Training to disseminate knowledge of data privacy; general public. NBR ISO/IEC 27001 Certification • Adequacy of the policies on Data Governance; A Brazilian standard developed to ensure the protection and privacy of information • Promotion of the concept of Privacy by design in the creation of provided by customers and other sources. pg. 100 products and services.Ethics and Information Security Our business is based on ethical principles, which reflects the transparency, respect and honesty present in our relationship with stakeholders. Training programs Integrity and Ethics Program Adherence to the termination of The Integrity and Ethics Education Program integrity policies (%) Integrity and Ethics Program consists of the set brought together the program's most important of guidelines and processes that aims to ensure Target trainings in distance education sessions. They are 2016 2017 2018 compliance with the Code of Ethics and the 2019 applied to all employees and the trainings are principles and values of our conglomerate. The 93% 98% 98% 95% renewed every two years. In 2018, these trainings Corporate Integrity and Ethics Program is were restructured and launched in three phases. composed of the following dimensions: • 1st phase: Ethics, Prevention of Corruption and In 2017, we were publicly recognized by the • Commitment of senior management Relationship with customers and users Ministry of Transparency and the Office of the • Management of policies and procedures • 2nd phase: Prevention of Money Laundering Comptroller General of the Union (CGU), in • Communication and training actions and Sustainability partnership with the Ethos Institute, for the last • Continuous monitoring of indicators and • 3rd phase: Compliance, Information Security; edition of the 2017 Company Pro-Ethics list. processes Supplier Relationship and Health and Safety at (From 2018, this recognition will every two • Channels of doubts and manifestations work years) Information is what supports the entire banking operation. Therefore, we have the commitment to protect corporate information and ensure the privacy of clients in all transactions. Cyber Security General Law on Data Protection (LGPD) Information Security Corporate Policy With the focus on compliance with legal requirements, a working group We use cutting-edge technology to protect To ensure compliance with the our network and data, as well as other was set up, composed of members from different areas of the bank who principles and guidelines relating barriers, such as restricted access to our are studying all the items dealt with in the legislation and raising points to the protection of the information servers, facilities and virtual environments, for improvement in the institution's current processes. and intellectual property of the through the use of firewalls, protection by • Among the actions, we mention: organization, clients and the password and encryption. • Training to disseminate knowledge of data privacy; general public. NBR ISO/IEC 27001 Certification • Adequacy of the policies on Data Governance; A Brazilian standard developed to ensure the protection and privacy of information • Promotion of the concept of Privacy by design in the creation of provided by customers and other sources. pg. 100 products and services.

ESG Integration on Business Responsible Credit Analysis Investments The Environmental and Social Risk Policy contains the criteria for Proprietary methodology to include ESG issues in the valuation of the analysis of clients and projects and the establishment of real fixed income securities and the pricing of active management estate guarantees and the inclusion of covenants. To this end, we funds, taking into account: materiality, relevance for the industry, must consider: risks e opportunity rating, metrics, and management List of prohibited activities Company Coverage: We do not carry out new loan operations with companies • 99% of the companies listed on the Ibovespa; involved in: • 98% of IBrX-100 • Labor in conditions similar to slave labor; • 97% of the Corporate Sustainability Index (ISE)); • Child labor in violation of legislation; • 95% of the assets under management of Itaú Asset • Encouragement of prostitution. Management List of restricted activities We have specific guidelines for making an environmental and social risk analysis in the following segments: • Firearms and ammunition; • Activities of extraction and production of wood, firewood and charcoal from native forests; • Fishing activities; • Extraction and industrialization of asbestos; • Cold storage plants and cattle slaughterhouses. Client analysis (small and medium businesses): (A – High Risk; B – Medium Risk and C – Low Risk) Project financing: We follow the criteria determined in accordance with the type of operation/project. Guarantees and Covenants pg. 101ESG Integration on Business Responsible Credit Analysis Investments The Environmental and Social Risk Policy contains the criteria for Proprietary methodology to include ESG issues in the valuation of the analysis of clients and projects and the establishment of real fixed income securities and the pricing of active management estate guarantees and the inclusion of covenants. To this end, we funds, taking into account: materiality, relevance for the industry, must consider: risks e opportunity rating, metrics, and management List of prohibited activities Company Coverage: We do not carry out new loan operations with companies • 99% of the companies listed on the Ibovespa; involved in: • 98% of IBrX-100 • Labor in conditions similar to slave labor; • 97% of the Corporate Sustainability Index (ISE)); • Child labor in violation of legislation; • 95% of the assets under management of Itaú Asset • Encouragement of prostitution. Management List of restricted activities We have specific guidelines for making an environmental and social risk analysis in the following segments: • Firearms and ammunition; • Activities of extraction and production of wood, firewood and charcoal from native forests; • Fishing activities; • Extraction and industrialization of asbestos; • Cold storage plants and cattle slaughterhouses. Client analysis (small and medium businesses): (A – High Risk; B – Medium Risk and C – Low Risk) Project financing: We follow the criteria determined in accordance with the type of operation/project. Guarantees and Covenants pg. 101
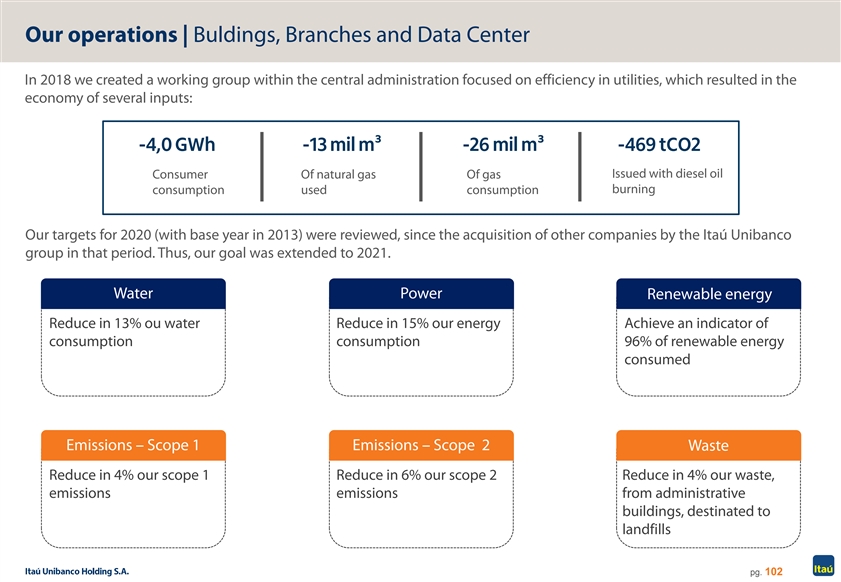
Our operations | Buldings, Branches and Data Center In 2018 we created a working group within the central administration focused on efficiency in utilities, which resulted in the economy of several inputs: -4,0 GWh -13 mil m³ -26 mil m³ -469 tCO2 Issued with diesel oil Consumer Of natural gas Of gas consumption used consumption burning Our targets for 2020 (with base year in 2013) were reviewed, since the acquisition of other companies by the Itaú Unibanco group in that period. Thus, our goal was extended to 2021. Water Power Renewable energy Reduce in 13% ou water Reduce in 15% our energy Achieve an indicator of consumption consumption 96% of renewable energy consumed Emissions – Scope 1 Emissions – Scope 2 Waste Reduce in 4% our scope 1 Reduce in 6% our scope 2 Reduce in 4% our waste, emissions emissions from administrative buildings, destinated to landfills pg. 102Our operations | Buldings, Branches and Data Center In 2018 we created a working group within the central administration focused on efficiency in utilities, which resulted in the economy of several inputs: -4,0 GWh -13 mil m³ -26 mil m³ -469 tCO2 Issued with diesel oil Consumer Of natural gas Of gas consumption used consumption burning Our targets for 2020 (with base year in 2013) were reviewed, since the acquisition of other companies by the Itaú Unibanco group in that period. Thus, our goal was extended to 2021. Water Power Renewable energy Reduce in 13% ou water Reduce in 15% our energy Achieve an indicator of consumption consumption 96% of renewable energy consumed Emissions – Scope 1 Emissions – Scope 2 Waste Reduce in 4% our scope 1 Reduce in 6% our scope 2 Reduce in 4% our waste, emissions emissions from administrative buildings, destinated to landfills pg. 102
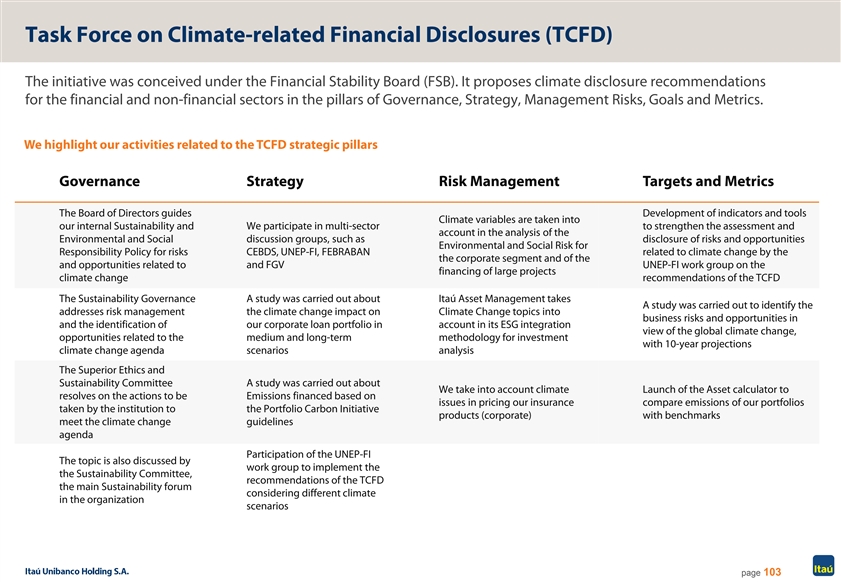
Task Force on Climate-related Financial Disclosures (TCFD) The initiative was conceived under the Financial Stability Board (FSB). It proposes climate disclosure recommendations for the financial and non-financial sectors in the pillars of Governance, Strategy, Management Risks, Goals and Metrics. We highlight our activities related to the TCFD strategic pillars Governance Strategy Risk Management Targets and Metrics The Board of Directors guides Development of indicators and tools Climate variables are taken into our internal Sustainability and We participate in multi-sector to strengthen the assessment and account in the analysis of the Environmental and Social discussion groups, such as disclosure of risks and opportunities Environmental and Social Risk for Responsibility Policy for risks CEBDS, UNEP-FI, FEBRABAN related to climate change by the the corporate segment and of the and opportunities related to and FGV UNEP-FI work group on the financing of large projects climate change recommendations of the TCFD The Sustainability Governance A study was carried out about Itaú Asset Management takes A study was carried out to identify the addresses risk management the climate change impact on Climate Change topics into business risks and opportunities in and the identification of our corporate loan portfolio in account in its ESG integration view of the global climate change, opportunities related to the medium and long-term methodology for investment with 10-year projections climate change agenda scenarios analysis The Superior Ethics and Sustainability Committee A study was carried out about We take into account climate Launch of the Asset calculator to resolves on the actions to be Emissions financed based on issues in pricing our insurance compare emissions of our portfolios taken by the institution to the Portfolio Carbon Initiative products (corporate) with benchmarks meet the climate change guidelines agenda Participation of the UNEP-FI The topic is also discussed by work group to implement the the Sustainability Committee, recommendations of the TCFD the main Sustainability forum considering different climate in the organization scenarios page 103Task Force on Climate-related Financial Disclosures (TCFD) The initiative was conceived under the Financial Stability Board (FSB). It proposes climate disclosure recommendations for the financial and non-financial sectors in the pillars of Governance, Strategy, Management Risks, Goals and Metrics. We highlight our activities related to the TCFD strategic pillars Governance Strategy Risk Management Targets and Metrics The Board of Directors guides Development of indicators and tools Climate variables are taken into our internal Sustainability and We participate in multi-sector to strengthen the assessment and account in the analysis of the Environmental and Social discussion groups, such as disclosure of risks and opportunities Environmental and Social Risk for Responsibility Policy for risks CEBDS, UNEP-FI, FEBRABAN related to climate change by the the corporate segment and of the and opportunities related to and FGV UNEP-FI work group on the financing of large projects climate change recommendations of the TCFD The Sustainability Governance A study was carried out about Itaú Asset Management takes A study was carried out to identify the addresses risk management the climate change impact on Climate Change topics into business risks and opportunities in and the identification of our corporate loan portfolio in account in its ESG integration view of the global climate change, opportunities related to the medium and long-term methodology for investment with 10-year projections climate change agenda scenarios analysis The Superior Ethics and Sustainability Committee A study was carried out about We take into account climate Launch of the Asset calculator to resolves on the actions to be Emissions financed based on issues in pricing our insurance compare emissions of our portfolios taken by the institution to the Portfolio Carbon Initiative products (corporate) with benchmarks meet the climate change guidelines agenda Participation of the UNEP-FI The topic is also discussed by work group to implement the the Sustainability Committee, recommendations of the TCFD the main Sustainability forum considering different climate in the organization scenarios page 103

Attachment 02 (portuguese only) Attachment 02 (portuguese only)

Teleconferência - Imprensa Resultados do 1° trimestre de 2019 Candido Botelho Bracher Presidente e CEO Milton Maluhy Filho Vice-Presidente Executivo, CFO e CRO Alexsandro Broedel Diretor Executivo de Finanças e Relações com Investidores Marcos Magalhães Diretor Executivo de Adquirência 1Teleconferência - Imprensa Resultados do 1° trimestre de 2019 Candido Botelho Bracher Presidente e CEO Milton Maluhy Filho Vice-Presidente Executivo, CFO e CRO Alexsandro Broedel Diretor Executivo de Finanças e Relações com Investidores Marcos Magalhães Diretor Executivo de Adquirência 1

Destaques do resultado 1º trimestre de 2019 Lucro Líquido Recorrente ROE Recorrente Carteira de Crédito ¹ Índice de Inadimplência 90 dias Consolidado Consolidado Consolidado Consolidado 0,1 p.p. 7,7 % 7,1 % 1,4 p.p. R$ 647,1 bi 1T19 vs. 1T18 R$ 6,9 bi 23,6% 3,0% 1T19 vs. 1T18 1T19 vs. 1T18 1T19 vs. 1T18 Brasil Brasil Brasil Brasil 6,5 % 4,6 % 1,1 p.p. 0,0 p.p. R$ 480,4 bi R$ 6,5 bi 1T19 vs. 1T18 1T19 vs. 1T18 24,8% 1T19 vs. 1T18 3,7% 1T19 vs. 1T18 6,4 6,4 6,5 6,5 6,9 22,2 21,6 21,3 21,8 23,6 601,1 623,3 636,4 636,9 647,1 3,1 2,8 2,9 2,9 3,0 1T18 2T18 3T18 4T18 1T19 1T18 2T18 3T18 4T18 1T19 1T18 2T18 3T18 4T18 1T19 1T18 2T18 3T18 4T18 1T19 Margem com Clientes Receita de Serviços e Seguros ² Custo do Crédito Despesas não Decorrentes de Juros Consolidado Consolidado Consolidado Consolidado 1,0 % 7,6 % 0,4 % 4,1% R$ 10,2 bi R$ 16,4 bi 1T19 vs. 1T18 1T19 vs. 1T18 R$ 3,8 bi 1T19 vs. 1T18 R$ 12,1 bi 1T19 vs. 1T18 Brasil Brasil Brasil Brasil 0,3 % 2,1% 4,1% 6,3% 1T19 vs. 1T18 R$ 9,5 bi 1T19 vs. 1T18 1T19 vs. 1T18 1T19 vs. 1T18 R$ 14,7 bi R$ 3,4 bi R$ 10,5 bi 15,3 16,0 16,2 16,2 16,4 10,1 10,4 10,2 10,8 10,2 3,8 3,6 3,3 3,4 3,8 11,7 12,3 12,6 12,8 12,1 1T18 2T18 3T18 4T18 1T19 1T18 2T18 3T18 4T18 1T19 1T18 2T18 3T18 4T18 1T19 1T18 2T18 3T18 4T18 1T19 2 (1) Total com Garantias Financeiras Prestadas e Títulos Privados; (2) Receitas de Seguros (-) Despesas com Sinistros (-) Despesas de Comercialização de Seguros.Destaques do resultado 1º trimestre de 2019 Lucro Líquido Recorrente ROE Recorrente Carteira de Crédito ¹ Índice de Inadimplência 90 dias Consolidado Consolidado Consolidado Consolidado 0,1 p.p. 7,7 % 7,1 % 1,4 p.p. R$ 647,1 bi 1T19 vs. 1T18 R$ 6,9 bi 23,6% 3,0% 1T19 vs. 1T18 1T19 vs. 1T18 1T19 vs. 1T18 Brasil Brasil Brasil Brasil 6,5 % 4,6 % 1,1 p.p. 0,0 p.p. R$ 480,4 bi R$ 6,5 bi 1T19 vs. 1T18 1T19 vs. 1T18 24,8% 1T19 vs. 1T18 3,7% 1T19 vs. 1T18 6,4 6,4 6,5 6,5 6,9 22,2 21,6 21,3 21,8 23,6 601,1 623,3 636,4 636,9 647,1 3,1 2,8 2,9 2,9 3,0 1T18 2T18 3T18 4T18 1T19 1T18 2T18 3T18 4T18 1T19 1T18 2T18 3T18 4T18 1T19 1T18 2T18 3T18 4T18 1T19 Margem com Clientes Receita de Serviços e Seguros ² Custo do Crédito Despesas não Decorrentes de Juros Consolidado Consolidado Consolidado Consolidado 1,0 % 7,6 % 0,4 % 4,1% R$ 10,2 bi R$ 16,4 bi 1T19 vs. 1T18 1T19 vs. 1T18 R$ 3,8 bi 1T19 vs. 1T18 R$ 12,1 bi 1T19 vs. 1T18 Brasil Brasil Brasil Brasil 0,3 % 2,1% 4,1% 6,3% 1T19 vs. 1T18 R$ 9,5 bi 1T19 vs. 1T18 1T19 vs. 1T18 1T19 vs. 1T18 R$ 14,7 bi R$ 3,4 bi R$ 10,5 bi 15,3 16,0 16,2 16,2 16,4 10,1 10,4 10,2 10,8 10,2 3,8 3,6 3,3 3,4 3,8 11,7 12,3 12,6 12,8 12,1 1T18 2T18 3T18 4T18 1T19 1T18 2T18 3T18 4T18 1T19 1T18 2T18 3T18 4T18 1T19 1T18 2T18 3T18 4T18 1T19 2 (1) Total com Garantias Financeiras Prestadas e Títulos Privados; (2) Receitas de Seguros (-) Despesas com Sinistros (-) Despesas de Comercialização de Seguros.

Crédito por perfil de Cliente ou por tipo de produto Originação de crédito¹ 1T19 vs. 1T18 Em R$ bilhões, ao final do período 1T19 4T18 D 1T18 D Total Pessoas Físicas 215,6 211,3 2,0% 191,4 12,7% Brasil ² 21% Cartão de Crédito 76,4 7 7,5 -1,3% 65,0 17,6% Crédito Pessoal 3 1,1 29,2 6,5% 27,4 13,7% Pessoas físicas Crédito Consignado 48,6 46 ,7 4,2% 44,7 8,8% 22% Veículos 16,6 1 5,9 4,1% 1 4,3 15,7% Micro, Pequenas Crédito Imobiliário 42,9 42 ,0 1,9% 40 ,0 7,2% e Médias 26% Micro, Pequenas e Médias Empresas 74,1 70,8 4,7% 63,0 17,6% empresas Total Pessoas Físicas + Micro, Pequenas e Médias Empresas 2 89,7 2 82,1 2,7% 254,4 13,9% Grandes Grandes Empresas 1 90,7 191,6 -0,5% 1 96,7 -3,1% empresas 18% Operações de Crédito 1 52,6 153,3 -0,4% 162,0 -5,8% Títulos Privados 3 8,0 38,3 -0,8% 3 4,7 9,6% 3 Emissão de títulos privados América Latina 1 66,7 163,2 2,1% 1 50,0 11,1% 1T19 Total com Garantias Financeiras Prestadas e Títulos Privados 6 47,1 6 36,9 1,6% 601,1 7,7% 1° lugar no ranking da R$ 6,7 bi ANBIMA Nota: Não considera originação de Cartão de Crédito, Cheque Especial, Renegociação de Dívida e outros créditos rotativos; (1) Média por dia útil no período, exceto para emissão de títulos privados. (2) Não inclui emissão de títulos privados; (3) Fonte: ANBIMA. Considera o volume total das emissões de títulos privados de renda fixa e híbridos, coordenadas pelo Itaú Unibanco no mercado local (inclui volume distribuído). 3Crédito por perfil de Cliente ou por tipo de produto Originação de crédito¹ 1T19 vs. 1T18 Em R$ bilhões, ao final do período 1T19 4T18 D 1T18 D Total Pessoas Físicas 215,6 211,3 2,0% 191,4 12,7% Brasil ² 21% Cartão de Crédito 76,4 7 7,5 -1,3% 65,0 17,6% Crédito Pessoal 3 1,1 29,2 6,5% 27,4 13,7% Pessoas físicas Crédito Consignado 48,6 46 ,7 4,2% 44,7 8,8% 22% Veículos 16,6 1 5,9 4,1% 1 4,3 15,7% Micro, Pequenas Crédito Imobiliário 42,9 42 ,0 1,9% 40 ,0 7,2% e Médias 26% Micro, Pequenas e Médias Empresas 74,1 70,8 4,7% 63,0 17,6% empresas Total Pessoas Físicas + Micro, Pequenas e Médias Empresas 2 89,7 2 82,1 2,7% 254,4 13,9% Grandes Grandes Empresas 1 90,7 191,6 -0,5% 1 96,7 -3,1% empresas 18% Operações de Crédito 1 52,6 153,3 -0,4% 162,0 -5,8% Títulos Privados 3 8,0 38,3 -0,8% 3 4,7 9,6% 3 Emissão de títulos privados América Latina 1 66,7 163,2 2,1% 1 50,0 11,1% 1T19 Total com Garantias Financeiras Prestadas e Títulos Privados 6 47,1 6 36,9 1,6% 601,1 7,7% 1° lugar no ranking da R$ 6,7 bi ANBIMA Nota: Não considera originação de Cartão de Crédito, Cheque Especial, Renegociação de Dívida e outros créditos rotativos; (1) Média por dia útil no período, exceto para emissão de títulos privados. (2) Não inclui emissão de títulos privados; (3) Fonte: ANBIMA. Considera o volume total das emissões de títulos privados de renda fixa e híbridos, coordenadas pelo Itaú Unibanco no mercado local (inclui volume distribuído). 3
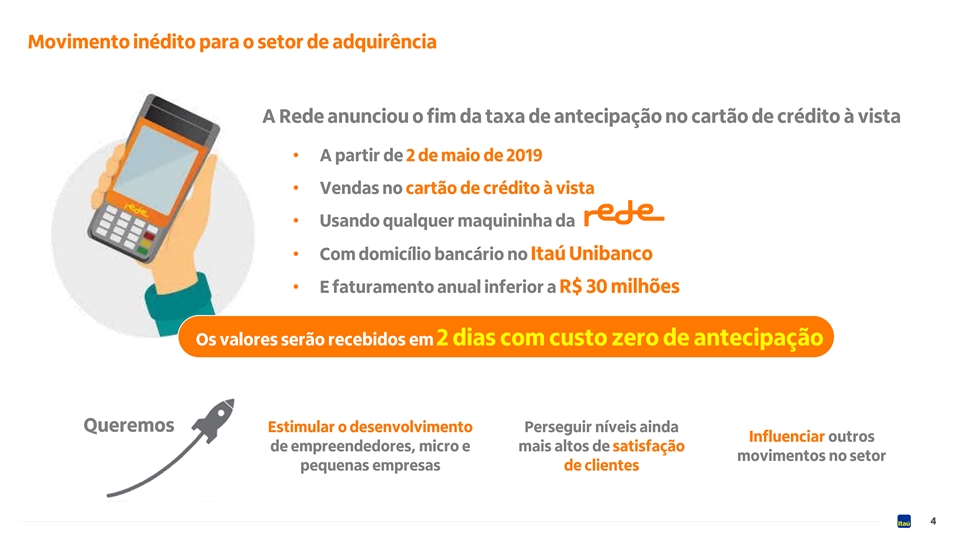
Movimento inédito para o setor de adquirência A Rede anunciou o fim da taxa de antecipação no cartão de crédito à vista • A partir de 2 de maio de 2019 • Vendas no cartão de crédito à vista • Usando qualquer maquininha da • Com domicílio bancário no Itaú Unibanco • E faturamento anual inferior a R$ 30 milhões Os valores serão recebidos em 2 dias com custo zero de antecipação Queremos Estimular o desenvolvimento Perseguir níveis ainda Influenciar outros de empreendedores, micro e mais altos de satisfação movimentos no setor pequenas empresas de clientes 4Movimento inédito para o setor de adquirência A Rede anunciou o fim da taxa de antecipação no cartão de crédito à vista • A partir de 2 de maio de 2019 • Vendas no cartão de crédito à vista • Usando qualquer maquininha da • Com domicílio bancário no Itaú Unibanco • E faturamento anual inferior a R$ 30 milhões Os valores serão recebidos em 2 dias com custo zero de antecipação Queremos Estimular o desenvolvimento Perseguir níveis ainda Influenciar outros de empreendedores, micro e mais altos de satisfação movimentos no setor pequenas empresas de clientes 4

Projeções 2019 Consolidado Brasil ¹ Anteriores Revisadas Anteriores Revisadas Carteira de Crédito Total ² 8,0% 11,0% 8,0% 11,0% Mantida Mantida Margem Financeira com Clientes 9,5% 12,5% 9,0% 12,0% 9,5% 12,5% 9,0% 12,0% Margem Financeira com o Mercado R$ 4,6 bi R$ 5,6 bi Mantida R$ 3,6 bi R$ 4,6 bi Mantida Custo do Crédito³ Mantida Mantida R$ 14,5 bi R$ 17,5 bi R$ 12,5 bi R$ 15,5 bi Receita de Prestação de Serviços e 3,0% 6,0% 2,0% 5,0% 3,0% 6,0% 2,0% 5,0% 4 Resultado de Seguros Despesas não Decorrentes de Juros 5,0% 8,0% 3,0% 6,0% 5,5% 8,5% 3,5% 6,5% Alíquota Efetiva de IR/CS 31,0% 33,0% Mantida 32,0% 34,0% Mantida (1) Considera unidades externas ex-América Latina; (2) Inclui garantias financeiras prestadas e títulos privados; (3) Composto pelo Resultado de Créditos de Liquidação Duvidosa, Impairment e Descontos Concedidos; (4) Receitas de Prestação de Serviços (+) Receitas de Operações de Seguros, Previdência e Capitalização (-) Despesas com Sinistros (-) Despesas de Comercialização de Seguros, Previdência e Capitalização. 5Projeções 2019 Consolidado Brasil ¹ Anteriores Revisadas Anteriores Revisadas Carteira de Crédito Total ² 8,0% 11,0% 8,0% 11,0% Mantida Mantida Margem Financeira com Clientes 9,5% 12,5% 9,0% 12,0% 9,5% 12,5% 9,0% 12,0% Margem Financeira com o Mercado R$ 4,6 bi R$ 5,6 bi Mantida R$ 3,6 bi R$ 4,6 bi Mantida Custo do Crédito³ Mantida Mantida R$ 14,5 bi R$ 17,5 bi R$ 12,5 bi R$ 15,5 bi Receita de Prestação de Serviços e 3,0% 6,0% 2,0% 5,0% 3,0% 6,0% 2,0% 5,0% 4 Resultado de Seguros Despesas não Decorrentes de Juros 5,0% 8,0% 3,0% 6,0% 5,5% 8,5% 3,5% 6,5% Alíquota Efetiva de IR/CS 31,0% 33,0% Mantida 32,0% 34,0% Mantida (1) Considera unidades externas ex-América Latina; (2) Inclui garantias financeiras prestadas e títulos privados; (3) Composto pelo Resultado de Créditos de Liquidação Duvidosa, Impairment e Descontos Concedidos; (4) Receitas de Prestação de Serviços (+) Receitas de Operações de Seguros, Previdência e Capitalização (-) Despesas com Sinistros (-) Despesas de Comercialização de Seguros, Previdência e Capitalização. 5

Anexos 6Anexos 6

Lucro Líquido Recorrente e Criação de Valor 23,6% 22,2% 21,9% 21,8% 21,6% 21,3% ROE Custo de capital médio 14,5% 14,5% 14,0% 13,5% 13,5% 13,5% Lucro líquido recorrente 6,9 6,5 6,4 6,5 6,4 6,3 Criação de valor 2,0 2,9 2,2 2,0 2,5 2,5 Custo de capital 4,5 4,3 4,3 4,0 3,9 3,9 4T17 1T18 2T18 3T18 4T18 1T19 7 Em R$ bilhõesLucro Líquido Recorrente e Criação de Valor 23,6% 22,2% 21,9% 21,8% 21,6% 21,3% ROE Custo de capital médio 14,5% 14,5% 14,0% 13,5% 13,5% 13,5% Lucro líquido recorrente 6,9 6,5 6,4 6,5 6,4 6,3 Criação de valor 2,0 2,9 2,2 2,0 2,5 2,5 Custo de capital 4,5 4,3 4,3 4,0 3,9 3,9 4T17 1T18 2T18 3T18 4T18 1T19 7 Em R$ bilhões
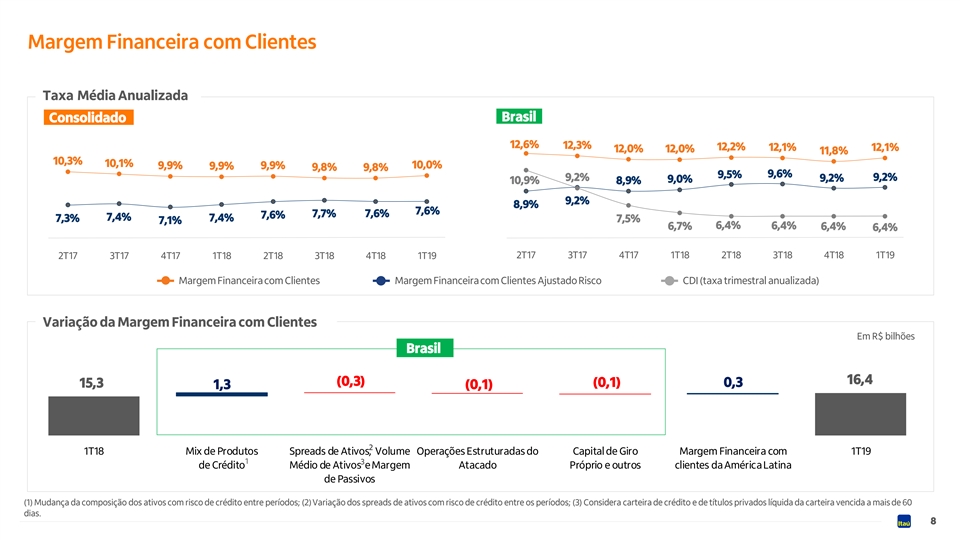
Margem Financeira com Clientes Taxa Média Anualizada Brasil Consolidado 12,6% 12,3% 12,2% 12,1% 12,1% 12,0% 12,0% 11,8% 10,3% 10,1% 10,0% 9,9% 9,9% 9,9% 9,8% 9,8% 9,6% 9,5% 9,2% 9,2% 9,2% 9,0% 10,9% 8,9% 9,2% 8,9% 7,6% 7,7% 7,6% 7,6% 7,4% 7,4% 7,3% 7,5% 7,1% 6,4% 6,4% 6,7% 6,4% 6,4% 2T17 3T17 4T17 1T18 2T18 3T18 4T18 1T19 2T17 3T17 4T17 1T18 2T18 3T18 4T18 1T19 Margem Financeira com Clientes Margem Financeira com Clientes Ajustado Risco CDI (taxa trimestral anualizada) Variação da Margem Financeira com Clientes Em R$ bilhões Brasil 16,4 (0,3) (0,1) 0,3 15,3 1,3 (0,1) 2 1T18 Mix de Produtos Spreads de Ativos, Volume Operações Estruturadas do Capital de Giro Margem Financeira com 1T19 1 3 de Crédito Médio de Ativos e Margem Atacado Próprio e outros clientes da América Latina de Passivos (1) Mudança da composição dos ativos com risco de crédito entre períodos; (2) Variação dos spreads de ativos com risco de crédito entre os períodos; (3) Considera carteira de crédito e de títulos privados líquida da carteira vencida a mais de 60 dias. 8Margem Financeira com Clientes Taxa Média Anualizada Brasil Consolidado 12,6% 12,3% 12,2% 12,1% 12,1% 12,0% 12,0% 11,8% 10,3% 10,1% 10,0% 9,9% 9,9% 9,9% 9,8% 9,8% 9,6% 9,5% 9,2% 9,2% 9,2% 9,0% 10,9% 8,9% 9,2% 8,9% 7,6% 7,7% 7,6% 7,6% 7,4% 7,4% 7,3% 7,5% 7,1% 6,4% 6,4% 6,7% 6,4% 6,4% 2T17 3T17 4T17 1T18 2T18 3T18 4T18 1T19 2T17 3T17 4T17 1T18 2T18 3T18 4T18 1T19 Margem Financeira com Clientes Margem Financeira com Clientes Ajustado Risco CDI (taxa trimestral anualizada) Variação da Margem Financeira com Clientes Em R$ bilhões Brasil 16,4 (0,3) (0,1) 0,3 15,3 1,3 (0,1) 2 1T18 Mix de Produtos Spreads de Ativos, Volume Operações Estruturadas do Capital de Giro Margem Financeira com 1T19 1 3 de Crédito Médio de Ativos e Margem Atacado Próprio e outros clientes da América Latina de Passivos (1) Mudança da composição dos ativos com risco de crédito entre períodos; (2) Variação dos spreads de ativos com risco de crédito entre os períodos; (3) Considera carteira de crédito e de títulos privados líquida da carteira vencida a mais de 60 dias. 8
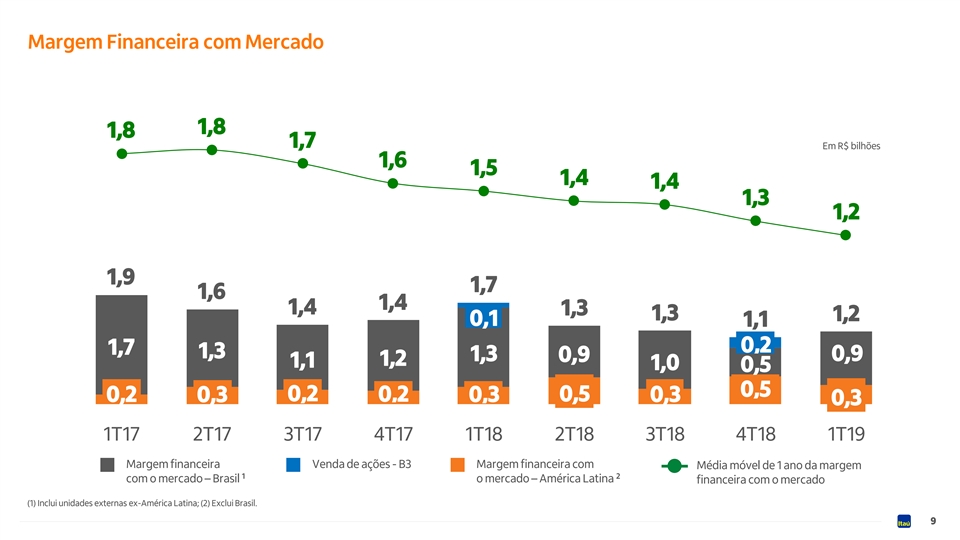
Margem Financeira com Mercado 1,8 1,8 1,7 Em R$ bilhões 1,6 1,5 1,4 1,4 1,3 1,2 1,9 1,7 1,6 1,4 1,4 1,3 1,3 1,2 0,1 1,1 0,2 1,7 1,3 1,3 0,9 0,9 1,2 1,1 1,0 0,5 0,5 0,2 0,5 0,2 0,3 0,2 0,3 0,3 0,3 1T17 2T17 3T17 4T17 1T18 2T18 3T18 4T18 1T19 Margem financeira Venda de ações - B3 Margem financeira com Média móvel de 1 ano da margem 1 2 com o mercado – Brasil o mercado – América Latina financeira com o mercado (1) Inclui unidades externas ex-América Latina; (2) Exclui Brasil. 9Margem Financeira com Mercado 1,8 1,8 1,7 Em R$ bilhões 1,6 1,5 1,4 1,4 1,3 1,2 1,9 1,7 1,6 1,4 1,4 1,3 1,3 1,2 0,1 1,1 0,2 1,7 1,3 1,3 0,9 0,9 1,2 1,1 1,0 0,5 0,5 0,2 0,5 0,2 0,3 0,2 0,3 0,3 0,3 1T17 2T17 3T17 4T17 1T18 2T18 3T18 4T18 1T19 Margem financeira Venda de ações - B3 Margem financeira com Média móvel de 1 ano da margem 1 2 com o mercado – Brasil o mercado – América Latina financeira com o mercado (1) Inclui unidades externas ex-América Latina; (2) Exclui Brasil. 9

Custo e Qualidade do Crédito Índices de Inadimplência Consolidado (90 dias) - % Brasil (90 dias) - % Consolidado (15-90 dias) - % Brasil (15-90 dias) - % 3,5 3,5 3,1 3,36 3,7 3,3 3,2 3,7 3,68 4,9 3,5 3,51 4,6 2,94 3,4 4,5 4,5 3,1 4,43 4,41 2,9 2,8 2,5 2,4 2,7 2,3 4,5 3,4 2,64 3,16 4,3 2,6 3,1 3,1 2,89 3,02 3,7 1,8 2,7 1,78 2,91 2,9 2,7 1,69 2,8 2,35 2,47 2,7 1,8 2,34 1,72 2,6 1,5 1,8 2,5 2,61 1,7 1,0 1,0 1,0 2,40 0,8 1,47 1,6 2,4 0,70 1,5 2,34 1,5 1,41 1,37 1,3 dez/17 mar/18 jun/18 set/18 dez/18 mar/19 dez/17 mar/18 jun/18 set/18 dez/18 mar/19 dez/17 mar/18 jun/18 set/18 dez/18 mar/19 dez/17 mar/18 jun/18 set/18 dez/18 mar/19 PF Grandes Emp. Micro, Peq. e Médias Emp. PF Grandes Emp. Micro, Peq. e Médias Emp. Total Brasil¹ América Latina² Total Brasil¹ América Latina² (1) Inclui unidades externas ex-América Latina; (2) Exclui Brasil. Custo do Crédito¹ Cobertura Em R$ bilhões 639% 952% 517% 908% 338% 618% 2,9% 2,5% 248% 2,4% 2,4% 245% 2,1% 236% 2,1% 235% 223% 221% 235% 220% 4,3 219% 221% 3,8 3,6 3,4 3,8 3,3 204% 208% 172% 169% 169% 169% 168% 166% 4T17 1T18 2T18 3T18 4T18 1T19 dez/17 mar/18 jun/18 set/18 dez/18 mar/19 2 Custo do Crédito Custo do Crédito / Carteira de Crédito - Anualizado Total América Latina ex-Brasil Varejo - Brasil Atacado - Brasil (1) Despesa de Provisão para Créditos de Liquidação Duvidosa + Recuperação de Créditos + Impairment + Descontos Concedidos; (2) Saldo médio da carteira de crédito com avais, fianças e títulos privados considerando-se os dois últimos trimestres. 10Custo e Qualidade do Crédito Índices de Inadimplência Consolidado (90 dias) - % Brasil (90 dias) - % Consolidado (15-90 dias) - % Brasil (15-90 dias) - % 3,5 3,5 3,1 3,36 3,7 3,3 3,2 3,7 3,68 4,9 3,5 3,51 4,6 2,94 3,4 4,5 4,5 3,1 4,43 4,41 2,9 2,8 2,5 2,4 2,7 2,3 4,5 3,4 2,64 3,16 4,3 2,6 3,1 3,1 2,89 3,02 3,7 1,8 2,7 1,78 2,91 2,9 2,7 1,69 2,8 2,35 2,47 2,7 1,8 2,34 1,72 2,6 1,5 1,8 2,5 2,61 1,7 1,0 1,0 1,0 2,40 0,8 1,47 1,6 2,4 0,70 1,5 2,34 1,5 1,41 1,37 1,3 dez/17 mar/18 jun/18 set/18 dez/18 mar/19 dez/17 mar/18 jun/18 set/18 dez/18 mar/19 dez/17 mar/18 jun/18 set/18 dez/18 mar/19 dez/17 mar/18 jun/18 set/18 dez/18 mar/19 PF Grandes Emp. Micro, Peq. e Médias Emp. PF Grandes Emp. Micro, Peq. e Médias Emp. Total Brasil¹ América Latina² Total Brasil¹ América Latina² (1) Inclui unidades externas ex-América Latina; (2) Exclui Brasil. Custo do Crédito¹ Cobertura Em R$ bilhões 639% 952% 517% 908% 338% 618% 2,9% 2,5% 248% 2,4% 2,4% 245% 2,1% 236% 2,1% 235% 223% 221% 235% 220% 4,3 219% 221% 3,8 3,6 3,4 3,8 3,3 204% 208% 172% 169% 169% 169% 168% 166% 4T17 1T18 2T18 3T18 4T18 1T19 dez/17 mar/18 jun/18 set/18 dez/18 mar/19 2 Custo do Crédito Custo do Crédito / Carteira de Crédito - Anualizado Total América Latina ex-Brasil Varejo - Brasil Atacado - Brasil (1) Despesa de Provisão para Créditos de Liquidação Duvidosa + Recuperação de Créditos + Impairment + Descontos Concedidos; (2) Saldo médio da carteira de crédito com avais, fianças e títulos privados considerando-se os dois últimos trimestres. 10
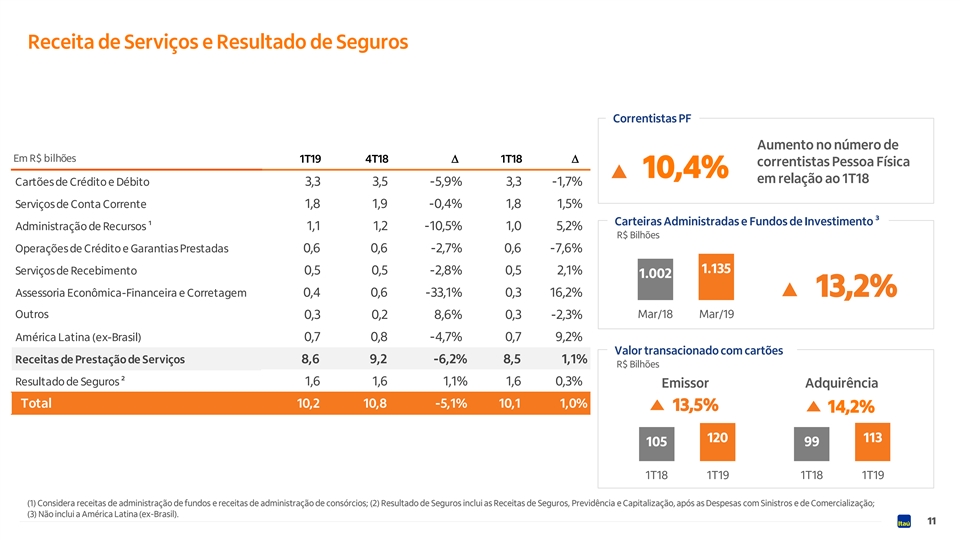
Receita de Serviços e Resultado de Seguros Correntistas PF Aumento no número de Em R$ bilhões 1T19 4T 3T 18 18 D 1T18 D correntistas Pessoa Física 10,4% em relação ao 1T18 Cartões de Crédito e Débito 3 ,3 3 ,5 -5,9% 3,3 -1,7% Serviços de Conta Corrente 1 ,8 1,9 -0,4% 1,8 1,5% Carteiras Administradas e Fundos de Investimento ³ Administração de Recursos ¹ 1,1 1,2 -10,5% 1,0 5,2% R$ Bilhões Operações de Crédito e Garantias Prestadas 0,6 0,6 -2,7% 0,6 -7,6% 1.135 Serviços de Recebimento 0,5 0,5 -2,8% 0,5 2,1% 1.002 13,2% Assessoria Econômica-Financeira e Corretagem 0,4 0,6 -33,1% 0 ,3 16,2% Outros Mar/18 Mar/19 0,3 0,2 8,6% 0 ,3 -2,3% América Latina (ex-Brasil) 0,7 0,8 -4,7% 0 ,7 9,2% Valor transacionado com cartões Receitas de Prestação de Serviços 8,6 9,2 -6,2% 8, 5 1,1% R$ Bilhões Resultado de Seguros ² 1,6 1,6 1,1% 1,6 0,3% Emissor Adquirência Total 10,2 10,8 -5,1% 10,1 1,0% 13,5% 14,2% 120 113 105 99 1T18 1T19 1T18 1T19 (1) Considera receitas de administração de fundos e receitas de administração de consórcios; (2) Resultado de Seguros inclui as Receitas de Seguros, Previdência e Capitalização, após as Despesas com Sinistros e de Comercialização; (3) Não inclui a América Latina (ex-Brasil). 11Receita de Serviços e Resultado de Seguros Correntistas PF Aumento no número de Em R$ bilhões 1T19 4T 3T 18 18 D 1T18 D correntistas Pessoa Física 10,4% em relação ao 1T18 Cartões de Crédito e Débito 3 ,3 3 ,5 -5,9% 3,3 -1,7% Serviços de Conta Corrente 1 ,8 1,9 -0,4% 1,8 1,5% Carteiras Administradas e Fundos de Investimento ³ Administração de Recursos ¹ 1,1 1,2 -10,5% 1,0 5,2% R$ Bilhões Operações de Crédito e Garantias Prestadas 0,6 0,6 -2,7% 0,6 -7,6% 1.135 Serviços de Recebimento 0,5 0,5 -2,8% 0,5 2,1% 1.002 13,2% Assessoria Econômica-Financeira e Corretagem 0,4 0,6 -33,1% 0 ,3 16,2% Outros Mar/18 Mar/19 0,3 0,2 8,6% 0 ,3 -2,3% América Latina (ex-Brasil) 0,7 0,8 -4,7% 0 ,7 9,2% Valor transacionado com cartões Receitas de Prestação de Serviços 8,6 9,2 -6,2% 8, 5 1,1% R$ Bilhões Resultado de Seguros ² 1,6 1,6 1,1% 1,6 0,3% Emissor Adquirência Total 10,2 10,8 -5,1% 10,1 1,0% 13,5% 14,2% 120 113 105 99 1T18 1T19 1T18 1T19 (1) Considera receitas de administração de fundos e receitas de administração de consórcios; (2) Resultado de Seguros inclui as Receitas de Seguros, Previdência e Capitalização, após as Despesas com Sinistros e de Comercialização; (3) Não inclui a América Latina (ex-Brasil). 11
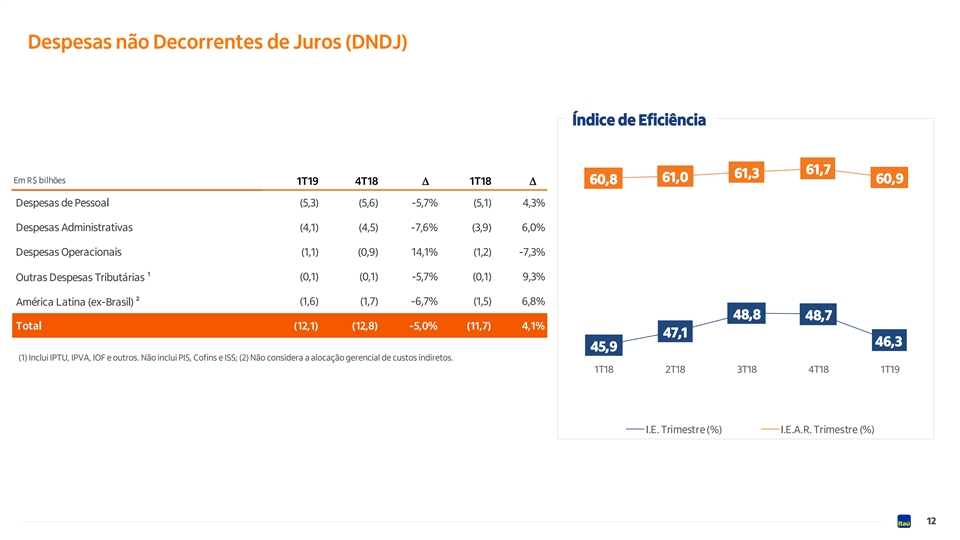
Despesas não Decorrentes de Juros (DNDJ) Índice de Eficiência 61,7 61,3 61,0 Em R$ bilhões 60,9 60,8 1T19 4T18 D 1T18 D Despesas de Pessoal (5,3) (5,6) -5,7% (5,1) 4,3% Despesas Administrativas ( 4,1) (4,5) -7,6% (3,9) 6,0% Despesas Operacionais ( 1,1) (0,9) 14,1% ( 1,2) -7,3% (0,1) ( 0,1) -5,7% (0,1) 9,3% Outras Despesas Tributárias ¹ ( 1,6) ( 1,7) -6,7% ( 1,5) 6,8% América Latina (ex-Brasil) ² 48,8 48,7 Total (12,1) (12,8) -5,0% (11,7) 4,1% 47,1 46,3 45,9 (1) Inclui IPTU, IPVA, IOF e outros. Não inclui PIS, Cofins e ISS; (2) Não considera a alocação gerencial de custos indiretos. 1T18 2T18 3T18 4T18 1T19 I.E. Trimestre (%) I.E.A.R. Trimestre (%) 12Despesas não Decorrentes de Juros (DNDJ) Índice de Eficiência 61,7 61,3 61,0 Em R$ bilhões 60,9 60,8 1T19 4T18 D 1T18 D Despesas de Pessoal (5,3) (5,6) -5,7% (5,1) 4,3% Despesas Administrativas ( 4,1) (4,5) -7,6% (3,9) 6,0% Despesas Operacionais ( 1,1) (0,9) 14,1% ( 1,2) -7,3% (0,1) ( 0,1) -5,7% (0,1) 9,3% Outras Despesas Tributárias ¹ ( 1,6) ( 1,7) -6,7% ( 1,5) 6,8% América Latina (ex-Brasil) ² 48,8 48,7 Total (12,1) (12,8) -5,0% (11,7) 4,1% 47,1 46,3 45,9 (1) Inclui IPTU, IPVA, IOF e outros. Não inclui PIS, Cofins e ISS; (2) Não considera a alocação gerencial de custos indiretos. 1T18 2T18 3T18 4T18 1T19 I.E. Trimestre (%) I.E.A.R. Trimestre (%) 12
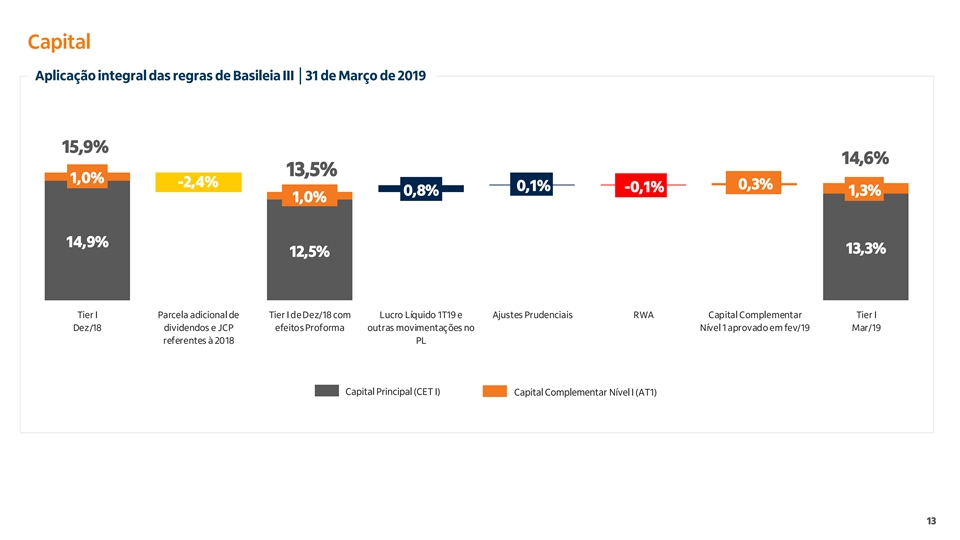
Capital Aplicação integral das regras de Basileia III │31 de Março de 2019 15,9% 14,6% 13,5% 1,0% -2,4% 0,3% 0,1% -0,1% 0,8% 1,3% 1,0% 14,9% 13,3% 12,5% Tier I Parcela adicional de Tier I de Dez/18 com Lucro Líquido 1T19 e Ajustes Prudenciais RWA Capital Complementar Tier I Dez/18 dividendos e JCP efeitos Proforma outras movimentações no Nível 1 aprovado em fev/19 Mar/19 referentes à 2018 PL Capital Principal (CET I) Capital Complementar Nível I (AT1) 13Capital Aplicação integral das regras de Basileia III │31 de Março de 2019 15,9% 14,6% 13,5% 1,0% -2,4% 0,3% 0,1% -0,1% 0,8% 1,3% 1,0% 14,9% 13,3% 12,5% Tier I Parcela adicional de Tier I de Dez/18 com Lucro Líquido 1T19 e Ajustes Prudenciais RWA Capital Complementar Tier I Dez/18 dividendos e JCP efeitos Proforma outras movimentações no Nível 1 aprovado em fev/19 Mar/19 referentes à 2018 PL Capital Principal (CET I) Capital Complementar Nível I (AT1) 13
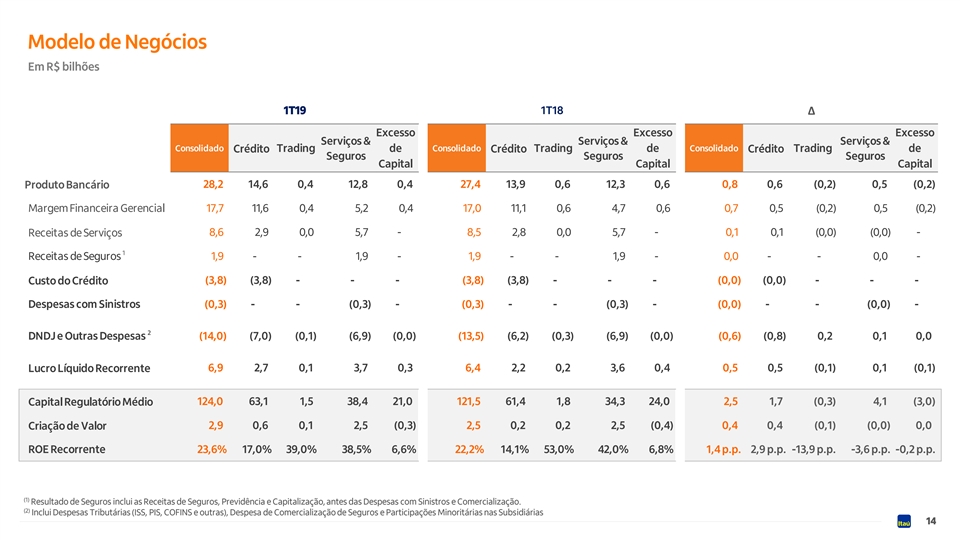
Modelo de Negócios Em R$ bilhões 1T19 1T18 Δ Excesso Excesso Excesso Serviços & Serviços & Serviços & Consolidado Consolidado Consolidado Trading de Trading de Trading de Crédito Crédito Crédito Seguros Seguros Seguros Capital Capital Capital 2 8,2 14,6 0 ,4 12,8 0,4 2 7,4 13,9 0 ,6 12,3 0 ,6 0 ,8 0 ,6 (0,2) 0,5 ( 0,2) Produto Bancário Margem Financeira Gerencial 1 7,7 1 1,6 0 ,4 5,2 0 ,4 17,0 11,1 0 ,6 4 ,7 0 ,6 0 ,7 0,5 (0,2) 0 ,5 (0,2) 8,6 2,9 0,0 5,7 - 8 ,5 2,8 0,0 5,7 - 0,1 0 ,1 ( 0,0) ( 0,0) - Receitas de Serviços 1 Receitas de Seguros 1,9 - - 1,9 - 1,9 - - 1,9 - 0,0 - - 0,0 - ( 3,8) (3,8) - - - (3,8) (3,8) - - - (0,0) (0,0) - - - Custo do Crédito Despesas com Sinistros (0,3) - - (0,3) - (0,3) - - (0,3) - ( 0,0) - - (0,0) - 2 DNDJ e Outras Despesas (14,0) ( 7,0) (0,1) (6,9) (0,0) (13,5) (6,2) (0,3) (6,9) (0,0) ( 0,6) (0,8) 0 ,2 0 ,1 0,0 Lucro Líquido Recorrente 6,9 2 ,7 0,1 3,7 0,3 6,4 2 ,2 0,2 3,6 0 ,4 0,5 0 ,5 ( 0,1) 0 ,1 (0,1) 124,0 63,1 1,5 38,4 21,0 121,5 61,4 1,8 34,3 24,0 2,5 1,7 (0,3) 4,1 (3,0) Capital Regulatório Médio 2 ,9 0 ,6 0,1 2,5 ( 0,3) 2,5 0,2 0,2 2,5 (0,4) 0 ,4 0,4 (0,1) ( 0,0) 0,0 Criação de Valor ROE Recorrente 23,6% 17,0% 39,0% 38,5% 6,6% 22,2% 14,1% 53,0% 42,0% 6,8% 1,4 p.p. 2,9 p.p. -13,9 p.p. -3,6 p.p. -0,2 p.p. (1) Resultado de Seguros inclui as Receitas de Seguros, Previdência e Capitalização, antes das Despesas com Sinistros e Comercialização. (2) Inclui Despesas Tributárias (ISS, PIS, COFINS e outras), Despesa de Comercialização de Seguros e Participações Minoritárias nas Subsidiárias 14Modelo de Negócios Em R$ bilhões 1T19 1T18 Δ Excesso Excesso Excesso Serviços & Serviços & Serviços & Consolidado Consolidado Consolidado Trading de Trading de Trading de Crédito Crédito Crédito Seguros Seguros Seguros Capital Capital Capital 2 8,2 14,6 0 ,4 12,8 0,4 2 7,4 13,9 0 ,6 12,3 0 ,6 0 ,8 0 ,6 (0,2) 0,5 ( 0,2) Produto Bancário Margem Financeira Gerencial 1 7,7 1 1,6 0 ,4 5,2 0 ,4 17,0 11,1 0 ,6 4 ,7 0 ,6 0 ,7 0,5 (0,2) 0 ,5 (0,2) 8,6 2,9 0,0 5,7 - 8 ,5 2,8 0,0 5,7 - 0,1 0 ,1 ( 0,0) ( 0,0) - Receitas de Serviços 1 Receitas de Seguros 1,9 - - 1,9 - 1,9 - - 1,9 - 0,0 - - 0,0 - ( 3,8) (3,8) - - - (3,8) (3,8) - - - (0,0) (0,0) - - - Custo do Crédito Despesas com Sinistros (0,3) - - (0,3) - (0,3) - - (0,3) - ( 0,0) - - (0,0) - 2 DNDJ e Outras Despesas (14,0) ( 7,0) (0,1) (6,9) (0,0) (13,5) (6,2) (0,3) (6,9) (0,0) ( 0,6) (0,8) 0 ,2 0 ,1 0,0 Lucro Líquido Recorrente 6,9 2 ,7 0,1 3,7 0,3 6,4 2 ,2 0,2 3,6 0 ,4 0,5 0 ,5 ( 0,1) 0 ,1 (0,1) 124,0 63,1 1,5 38,4 21,0 121,5 61,4 1,8 34,3 24,0 2,5 1,7 (0,3) 4,1 (3,0) Capital Regulatório Médio 2 ,9 0 ,6 0,1 2,5 ( 0,3) 2,5 0,2 0,2 2,5 (0,4) 0 ,4 0,4 (0,1) ( 0,0) 0,0 Criação de Valor ROE Recorrente 23,6% 17,0% 39,0% 38,5% 6,6% 22,2% 14,1% 53,0% 42,0% 6,8% 1,4 p.p. 2,9 p.p. -13,9 p.p. -3,6 p.p. -0,2 p.p. (1) Resultado de Seguros inclui as Receitas de Seguros, Previdência e Capitalização, antes das Despesas com Sinistros e Comercialização. (2) Inclui Despesas Tributárias (ISS, PIS, COFINS e outras), Despesa de Comercialização de Seguros e Participações Minoritárias nas Subsidiárias 14

Resultados 1T19 4T18 Δ 1T18 Δ Em R$ bilhões Produto Bancário 28,2 28,5 -0,9% 27,4 2,8% Margem Financeira Gerencial 17,7 17,4 1,6% 1 7,0 3,9% Margem Financeira com Clientes 1 6,4 1 6,2 1,2% 15,3 7,6% Margem Financeira com o Mercado 1,2 1,1 8,2% 1 ,7 -28,4% 8 ,6 9,2 -6,2% 8 ,5 1,1% Receitas de Prestação de Serviços 1,9 1,9 1,1% 1,9 1,0% Receitas de Operações de Seguro ¹ (3,8) (3,4) 11,4% (3,8) 0,4% Custo do Crédito (4,2) (3,8) 10,8% ( 4,1) 2,3% Despesa de Provisão para Créditos de Liquidação Duvidosa Impairment (0,0) ( 0,3) -88,9% ( 0,2) -84,1% Descontos Concedidos ( 0,3) ( 0,3) -1,2% ( 0,3) 8,4% 0,7 1,0 -23,0% 0,8 -6,9% Recuperação de Créditos Baixados como Prejuízo Despesas com Sinistros (0,3) (0,3) 1,9% (0,3) 7,1% Outras Despesas Operacionais (13,8) (14,7) -5,8% (13,4) 3,4% (12,1) (12,8) -5,0% (11,7) 4,1% Despesas não Decorrentes de Juros (1,7) ( 1,9) -10,7% (1,7) -0,8% Despesas Tributárias e Outras ² 10,3 10,1 1,9% 10,0 2,9% Resultado antes da Tributação e Part. Minoritárias (3,2) (3,4) -4,9% (3,5) -7,9% Imposto de Renda e Contribuição Social ( 0,2) (0,2) -19,2% (0,1) 106,7% Participações Minoritárias nas Subsidiárias 6,9 6 ,5 6,2% 6,4 7,1% Lucro Líquido Recorrente (1) Receitas de Seguros inclui as Receitas de Seguros, Previdência e Capitalização, antes das Despesas com Sinistros e Comercialização. (2) Inclui Despesas Tributárias (ISS, PIS, COFINS e outras) e Despesa de Comercialização de Seguros. 15Resultados 1T19 4T18 Δ 1T18 Δ Em R$ bilhões Produto Bancário 28,2 28,5 -0,9% 27,4 2,8% Margem Financeira Gerencial 17,7 17,4 1,6% 1 7,0 3,9% Margem Financeira com Clientes 1 6,4 1 6,2 1,2% 15,3 7,6% Margem Financeira com o Mercado 1,2 1,1 8,2% 1 ,7 -28,4% 8 ,6 9,2 -6,2% 8 ,5 1,1% Receitas de Prestação de Serviços 1,9 1,9 1,1% 1,9 1,0% Receitas de Operações de Seguro ¹ (3,8) (3,4) 11,4% (3,8) 0,4% Custo do Crédito (4,2) (3,8) 10,8% ( 4,1) 2,3% Despesa de Provisão para Créditos de Liquidação Duvidosa Impairment (0,0) ( 0,3) -88,9% ( 0,2) -84,1% Descontos Concedidos ( 0,3) ( 0,3) -1,2% ( 0,3) 8,4% 0,7 1,0 -23,0% 0,8 -6,9% Recuperação de Créditos Baixados como Prejuízo Despesas com Sinistros (0,3) (0,3) 1,9% (0,3) 7,1% Outras Despesas Operacionais (13,8) (14,7) -5,8% (13,4) 3,4% (12,1) (12,8) -5,0% (11,7) 4,1% Despesas não Decorrentes de Juros (1,7) ( 1,9) -10,7% (1,7) -0,8% Despesas Tributárias e Outras ² 10,3 10,1 1,9% 10,0 2,9% Resultado antes da Tributação e Part. Minoritárias (3,2) (3,4) -4,9% (3,5) -7,9% Imposto de Renda e Contribuição Social ( 0,2) (0,2) -19,2% (0,1) 106,7% Participações Minoritárias nas Subsidiárias 6,9 6 ,5 6,2% 6,4 7,1% Lucro Líquido Recorrente (1) Receitas de Seguros inclui as Receitas de Seguros, Previdência e Capitalização, antes das Despesas com Sinistros e Comercialização. (2) Inclui Despesas Tributárias (ISS, PIS, COFINS e outras) e Despesa de Comercialização de Seguros. 15
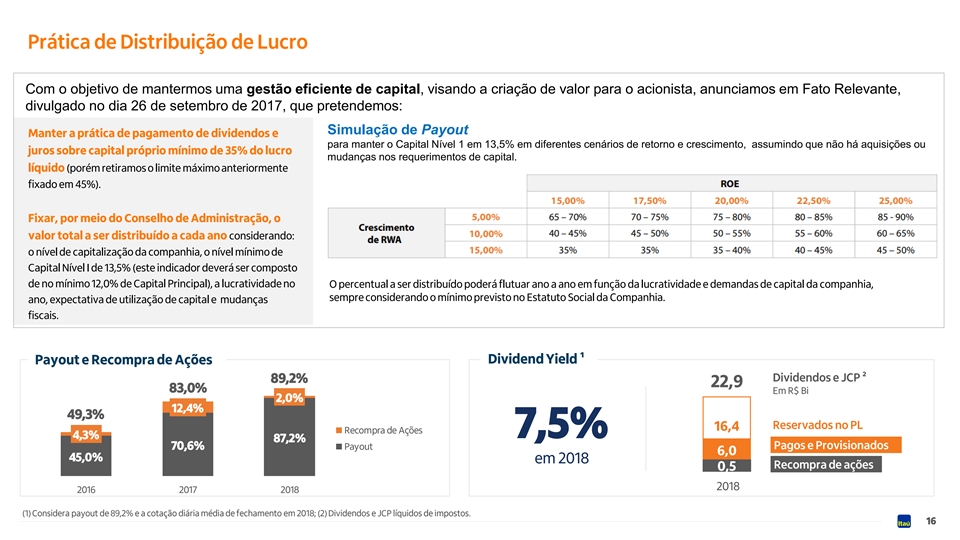
Prática de Distribuição de Lucro Com o objetivo de mantermos uma gestão eficiente de capital, visando a criação de valor para o acionista, anunciamos em Fato Relevante, divulgado no dia 26 de setembro de 2017, que pretendemos: Simulação de Payout Manter a prática de pagamento de dividendos e para manter o Capital Nível 1 em 13,5% em diferentes cenários de retorno e crescimento, assumindo que não há aquisições ou juros sobre capital próprio mínimo de 35% do lucro mudanças nos requerimentos de capital. líquido (porém retiramos o limite máximo anteriormente fixado em 45%). Fixar, por meio do Conselho de Administração, o valor total a ser distribuído a cada ano considerando: o nível de capitalização da companhia, o nível mínimo de Capital Nível I de 13,5% (este indicador deverá ser composto de no mínimo 12,0% de Capital Principal), a lucratividade no O percentual a ser distribuído poderá flutuar ano a ano em função da lucratividade e demandas de capital da companhia, sempre considerando o mínimo previsto no Estatuto Social da Companhia. ano, expectativa de utilização de capital e mudanças fiscais. Payout e Recompra de Ações Dividend Yield ¹ Dividendos e JCP ² 89,2% 100,0% 22,9 83,0% Em R$ Bi 2,0% 80,0% 12,4% 49,3% 60,0% Reservados no PL 16,4 Recompra de Ações 7,5% 4,3% 40,0% 87,2% Pagos e Provisionados 70,6% Payout 6,0 20,0% 45,0% em 2018 Recompra de ações 0,5 0,0% 2018 2016 2017 2018 (1) Considera payout de 89,2% e a cotação diária média de fechamento em 2018; (2) Dividendos e JCP líquidos de impostos. 16Prática de Distribuição de Lucro Com o objetivo de mantermos uma gestão eficiente de capital, visando a criação de valor para o acionista, anunciamos em Fato Relevante, divulgado no dia 26 de setembro de 2017, que pretendemos: Simulação de Payout Manter a prática de pagamento de dividendos e para manter o Capital Nível 1 em 13,5% em diferentes cenários de retorno e crescimento, assumindo que não há aquisições ou juros sobre capital próprio mínimo de 35% do lucro mudanças nos requerimentos de capital. líquido (porém retiramos o limite máximo anteriormente fixado em 45%). Fixar, por meio do Conselho de Administração, o valor total a ser distribuído a cada ano considerando: o nível de capitalização da companhia, o nível mínimo de Capital Nível I de 13,5% (este indicador deverá ser composto de no mínimo 12,0% de Capital Principal), a lucratividade no O percentual a ser distribuído poderá flutuar ano a ano em função da lucratividade e demandas de capital da companhia, sempre considerando o mínimo previsto no Estatuto Social da Companhia. ano, expectativa de utilização de capital e mudanças fiscais. Payout e Recompra de Ações Dividend Yield ¹ Dividendos e JCP ² 89,2% 100,0% 22,9 83,0% Em R$ Bi 2,0% 80,0% 12,4% 49,3% 60,0% Reservados no PL 16,4 Recompra de Ações 7,5% 4,3% 40,0% 87,2% Pagos e Provisionados 70,6% Payout 6,0 20,0% 45,0% em 2018 Recompra de ações 0,5 0,0% 2018 2016 2017 2018 (1) Considera payout de 89,2% e a cotação diária média de fechamento em 2018; (2) Dividendos e JCP líquidos de impostos. 16
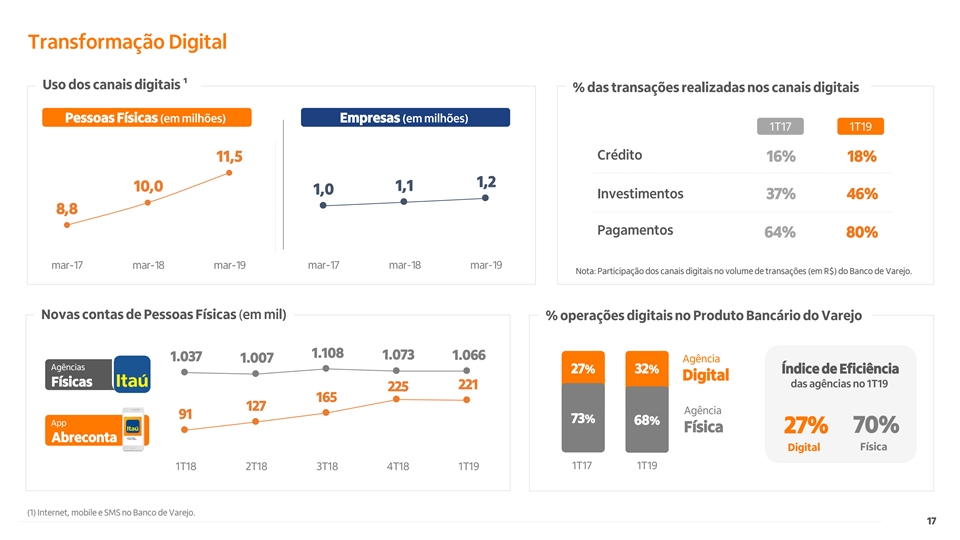
Transformação Digital Uso dos canais digitais ¹ % das transações realizadas nos canais digitais Pessoas Físicas (em milhões) Empresas (em milhões) 1T17 1T19 Crédito 11,5 16% 18% 1,2 10,0 1,1 1,0 Investimentos 37% 46% 8,8 Pagamentos 64% 80% mar-17 mar-18 mar-19 mar-17 mar-18 mar-19 Nota: Participação dos canais digitais no volume de transações (em R$) do Banco de Varejo. Novas contas de Pessoas Físicas (em mil) % operações digitais no Produto Bancário do Varejo 1.108 1.073 1.066 1.037 Agência 1.007 Agências 27% 32% Índice de Eficiência Digital Físicas das agências no 1T19 221 225 165 127 Agência 91 73% 68% App Física 27% 70% Abreconta Física Digital 1T17 1T19 1T18 2T18 3T18 4T18 1T19 (1) Internet, mobile e SMS no Banco de Varejo. 17Transformação Digital Uso dos canais digitais ¹ % das transações realizadas nos canais digitais Pessoas Físicas (em milhões) Empresas (em milhões) 1T17 1T19 Crédito 11,5 16% 18% 1,2 10,0 1,1 1,0 Investimentos 37% 46% 8,8 Pagamentos 64% 80% mar-17 mar-18 mar-19 mar-17 mar-18 mar-19 Nota: Participação dos canais digitais no volume de transações (em R$) do Banco de Varejo. Novas contas de Pessoas Físicas (em mil) % operações digitais no Produto Bancário do Varejo 1.108 1.073 1.066 1.037 Agência 1.007 Agências 27% 32% Índice de Eficiência Digital Físicas das agências no 1T19 221 225 165 127 Agência 91 73% 68% App Física 27% 70% Abreconta Física Digital 1T17 1T19 1T18 2T18 3T18 4T18 1T19 (1) Internet, mobile e SMS no Banco de Varejo. 17

Teleconferência - Imprensa Resultados do 1° trimestre de 2019 Candido Botelho Bracher Presidente e CEO Milton Maluhy Filho Vice-Presidente Executivo, CFO e CRO Alexsandro Broedel Diretor Executivo de Finanças e Relações com Investidores Marcos Magalhães Diretor Executivo de Adquirência 18Teleconferência - Imprensa Resultados do 1° trimestre de 2019 Candido Botelho Bracher Presidente e CEO Milton Maluhy Filho Vice-Presidente Executivo, CFO e CRO Alexsandro Broedel Diretor Executivo de Finanças e Relações com Investidores Marcos Magalhães Diretor Executivo de Adquirência 18

Attachment 03 Attachment 03
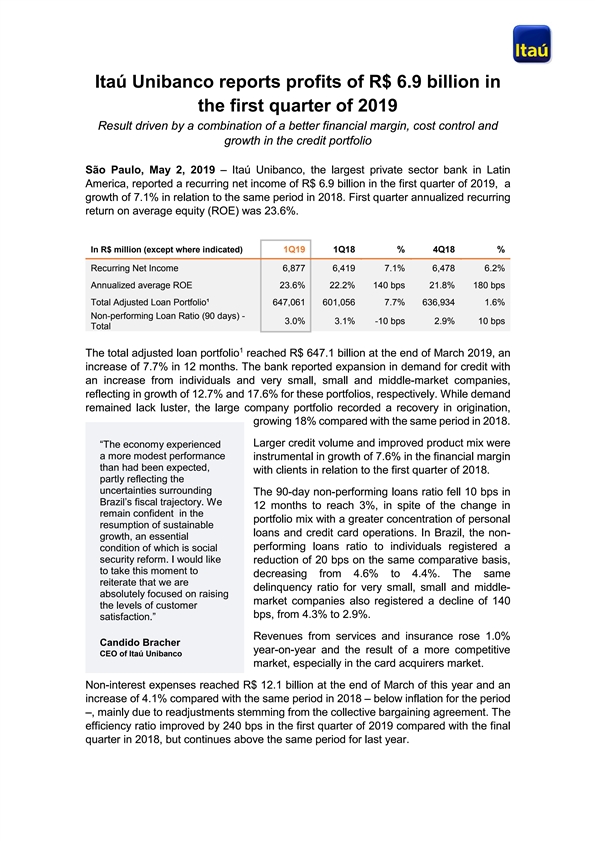
Itaú Unibanco reports profits of R$ 6.9 billion in the first quarter of 2019 Result driven by a combination of a better financial margin, cost control and growth in the credit portfolio São Paulo, May 2, 2019 – Itaú Unibanco, the largest private sector bank in Latin America, reported a recurring net income of R$ 6.9 billion in the first quarter of 2019, a growth of 7.1% in relation to the same period in 2018. First quarter annualized recurring return on average equity (ROE) was 23.6%. In R$ million (except where indicated) 1Q19 1Q18 % 4Q18 % Recurring Net Income 6,877 6,419 7.1% 6,478 6.2% Annualized average ROE 23.6% 22.2% 140 bps 21.8% 180 bps Total Adjusted Loan Portfolio¹ 647,061 601,056 7.7% 636,934 1.6% Non-performing Loan Ratio (90 days) - 3.0% 3.1% -10 bps 2.9% 10 bps Total 1 The total adjusted loan portfolio reached R$ 647.1 billion at the end of March 2019, an increase of 7.7% in 12 months. The bank reported expansion in demand for credit with an increase from individuals and very small, small and middle-market companies, reflecting in growth of 12.7% and 17.6% for these portfolios, respectively. While demand remained lack luster, the large company portfolio recorded a recovery in origination, growing 18% compared with the same period in 2018. Larger credit volume and improved product mix were “The economy experienced a more modest performance instrumental in growth of 7.6% in the financial margin than had been expected, with clients in relation to the first quarter of 2018. partly reflecting the uncertainties surrounding The 90-day non-performing loans ratio fell 10 bps in Brazil’s fiscal trajectory. We 12 months to reach 3%, in spite of the change in remain confident in the portfolio mix with a greater concentration of personal resumption of sustainable loans and credit card operations. In Brazil, the non- growth, an essential performing loans ratio to individuals registered a condition of which is social security reform. I would like reduction of 20 bps on the same comparative basis, to take this moment to decreasing from 4.6% to 4.4%. The same reiterate that we are delinquency ratio for very small, small and middle- absolutely focused on raising market companies also registered a decline of 140 the levels of customer bps, from 4.3% to 2.9%. satisfaction.” Revenues from services and insurance rose 1.0% Candido Bracher year-on-year and the result of a more competitive CEO of Itaú Unibanco market, especially in the card acquirers market. Non-interest expenses reached R$ 12.1 billion at the end of March of this year and an increase of 4.1% compared with the same period in 2018 – below inflation for the period –, mainly due to readjustments stemming from the collective bargaining agreement. The effi ciency ratio improved by 240 bps in the first quarter of 2019 compared with the final quarter in 2018, but continues above the same period for last year. Itaú Unibanco reports profits of R$ 6.9 billion in the first quarter of 2019 Result driven by a combination of a better financial margin, cost control and growth in the credit portfolio São Paulo, May 2, 2019 – Itaú Unibanco, the largest private sector bank in Latin America, reported a recurring net income of R$ 6.9 billion in the first quarter of 2019, a growth of 7.1% in relation to the same period in 2018. First quarter annualized recurring return on average equity (ROE) was 23.6%. In R$ million (except where indicated) 1Q19 1Q18 % 4Q18 % Recurring Net Income 6,877 6,419 7.1% 6,478 6.2% Annualized average ROE 23.6% 22.2% 140 bps 21.8% 180 bps Total Adjusted Loan Portfolio¹ 647,061 601,056 7.7% 636,934 1.6% Non-performing Loan Ratio (90 days) - 3.0% 3.1% -10 bps 2.9% 10 bps Total 1 The total adjusted loan portfolio reached R$ 647.1 billion at the end of March 2019, an increase of 7.7% in 12 months. The bank reported expansion in demand for credit with an increase from individuals and very small, small and middle-market companies, reflecting in growth of 12.7% and 17.6% for these portfolios, respectively. While demand remained lack luster, the large company portfolio recorded a recovery in origination, growing 18% compared with the same period in 2018. Larger credit volume and improved product mix were “The economy experienced a more modest performance instrumental in growth of 7.6% in the financial margin than had been expected, with clients in relation to the first quarter of 2018. partly reflecting the uncertainties surrounding The 90-day non-performing loans ratio fell 10 bps in Brazil’s fiscal trajectory. We 12 months to reach 3%, in spite of the change in remain confident in the portfolio mix with a greater concentration of personal resumption of sustainable loans and credit card operations. In Brazil, the non- growth, an essential performing loans ratio to individuals registered a condition of which is social security reform. I would like reduction of 20 bps on the same comparative basis, to take this moment to decreasing from 4.6% to 4.4%. The same reiterate that we are delinquency ratio for very small, small and middle- absolutely focused on raising market companies also registered a decline of 140 the levels of customer bps, from 4.3% to 2.9%. satisfaction.” Revenues from services and insurance rose 1.0% Candido Bracher year-on-year and the result of a more competitive CEO of Itaú Unibanco market, especially in the card acquirers market. Non-interest expenses reached R$ 12.1 billion at the end of March of this year and an increase of 4.1% compared with the same period in 2018 – below inflation for the period –, mainly due to readjustments stemming from the collective bargaining agreement. The effi ciency ratio improved by 240 bps in the first quarter of 2019 compared with the final quarter in 2018, but continues above the same period for last year.

In the first quarter of 2019, the bank surpassed 11.5 million individual account holders that use the digital “Since last year, we have seen growth in demand from channels via internet or mobile applications. In the individuals and small and case of business accounts, this figure has already middle-market companies reached the 1.2 million mark. Over 221 thousand for credit. In the first quarter digital accounts were opened using the Abreconta app of 2019, especially in March, at the beginning of the year, an increase of 144% we have also noticed an compared with the same period in 2018. improvement in demand from large companies, Another milestone during the quarter was the which has reflected in a progressive increase in the bank’s shareholder base, significant boost in which has now exceeded 200 thousand individual origination, that increased investors and surpassing the growth on the B3. 18% compared with the same period in 2018.” The value added³ to the economy by Itaú Unibanco totaled R$ 18.3 billion between January and March Milton Maluhy 2019. The amount was distributed among several Executive Vice President, CFO segments of society: R$ 5.3 billion in employee and CRO of Itaú Unibanco compensation, R$ 5.6 billion in tax payments, R$ 4.5 billion for reinvestment of profits in the operation, R$ 2.6 billion for remuneration of the more than 200 thousand direct shareholders and approximately 1 million indirect 4 shareholders and R$ 0.3 billion for other parties. Further information on results can be obtained from the Itaú Unibanco Investor Relations website: www.itau.com.br/relacoes-com-investidores. (1) Includes financial guarantees rendered and corporate securities. (2) Cost of credit includes result from loan losses, net of recoveries, impairment and discounts granted. (3) The statement of value added adopts the managerial criteria. (4) Indirect shareholders are individuals or institutional investors in Brazil that have indirectly acquired Itaú Unibanco shares through investment or pension funds. Corporate Communication – Itaú Unibanco (11) 5019-8880/8881 imprensa@itau-unibanco.com.br In the first quarter of 2019, the bank surpassed 11.5 million individual account holders that use the digital “Since last year, we have seen growth in demand from channels via internet or mobile applications. In the individuals and small and case of business accounts, this figure has already middle-market companies reached the 1.2 million mark. Over 221 thousand for credit. In the first quarter digital accounts were opened using the Abreconta app of 2019, especially in March, at the beginning of the year, an increase of 144% we have also noticed an compared with the same period in 2018. improvement in demand from large companies, Another milestone during the quarter was the which has reflected in a progressive increase in the bank’s shareholder base, significant boost in which has now exceeded 200 thousand individual origination, that increased investors and surpassing the growth on the B3. 18% compared with the same period in 2018.” The value added³ to the economy by Itaú Unibanco totaled R$ 18.3 billion between January and March Milton Maluhy 2019. The amount was distributed among several Executive Vice President, CFO segments of society: R$ 5.3 billion in employee and CRO of Itaú Unibanco compensation, R$ 5.6 billion in tax payments, R$ 4.5 billion for reinvestment of profits in the operation, R$ 2.6 billion for remuneration of the more than 200 thousand direct shareholders and approximately 1 million indirect 4 shareholders and R$ 0.3 billion for other parties. Further information on results can be obtained from the Itaú Unibanco Investor Relations website: www.itau.com.br/relacoes-com-investidores. (1) Includes financial guarantees rendered and corporate securities. (2) Cost of credit includes result from loan losses, net of recoveries, impairment and discounts granted. (3) The statement of value added adopts the managerial criteria. (4) Indirect shareholders are individuals or institutional investors in Brazil that have indirectly acquired Itaú Unibanco shares through investment or pension funds. Corporate Communication – Itaú Unibanco (11) 5019-8880/8881 imprensa@itau-unibanco.com.br

Attachment 04 Attachment 04

Conference Call st 1 quarter 2019 Earnings Review Candido Botelho Bracher President and CEO Milton Maluhy Filho Executive Vice-President, CFO and CRO Alexsandro Broedel Executive Finance Director and Head of Investor Relations Marcos Magalhães Merchant Acquirer Executive Director 1Conference Call st 1 quarter 2019 Earnings Review Candido Botelho Bracher President and CEO Milton Maluhy Filho Executive Vice-President, CFO and CRO Alexsandro Broedel Executive Finance Director and Head of Investor Relations Marcos Magalhães Merchant Acquirer Executive Director 1

Highlights st 1 quarter 2019 Recurring Net Income Recurring ROE Credit ¹ NPL 90 days Consolidated Consolidated Consolidated Consolidated 7.7 % 7.1 % 140 bps 10 bps R$647.1 bn 1Q19 vs. 1Q18 R$6.9 bn 23.6% 3.0% 1Q19 vs. 1Q18 1Q19 vs. 1Q18 1Q19 vs. 1Q18 Brazil Brazil Brazil Brazil 6.5 % 4.6 % 110 bps 0.0 bp R$480.4 bn R$6.5 bn 1Q19 vs. 1Q18 1Q19 vs.1Q18 24.8% 1Q19 vs. 1Q18 3.7% 1Q19 vs. 1Q18 6.4 6.4 6.5 6.5 6.9 22.2 21.6 21.3 21.8 23.6 601.1 623.3 636.4 636.9 647.1 3.1 2.8 2.9 2.9 3.0 1Q18 2Q18 3Q18 4Q18 1Q19 1Q18 2Q18 3Q18 4Q18 1Q19 1Q18 2Q18 3Q18 4Q18 1Q19 1Q18 2Q18 3Q18 4Q18 1Q19 Financial Margin with Clients Commission, Fees and Insurance Results ² Cost of Credit Non-Interest Expenses Consolidated Consolidated Consolidated Consolidated 1.0 % 7.6 % 0.4 % 4.1 % R$10.2 bn R$16.4 bn 1Q19 vs. 1Q18 1Q19 vs. 1Q18 R$3.8 bn 1Q19 vs. 1Q18 R$12.1 bn 1Q19 vs. 1Q18 Brazil Brazil Brazil Brazil 0.3 % 2.1 % 4.1 % 6.3 % 1Q19 vs. 1Q18 R$9.5 bn 1Q19 vs. 1Q18 1Q19 vs. 1Q18 1Q19 vs. 1Q18 R$14.7 bn R$3.4 bn R$10.5 bn 15.3 16.0 16.2 16.2 16.4 10.1 10.4 10.2 10.8 10.2 3.8 3.6 3.3 3.4 3.8 11.7 12.3 12.6 12.8 12.1 1Q18 2Q18 3Q18 4Q18 1Q19 1Q18 2Q18 3Q18 4Q18 1Q19 1Q18 2Q18 3Q18 4Q18 1Q19 1Q18 2Q18 3Q18 4Q18 1Q19 2 (1) Total with Financial Guarantees provided and Corporate Securities; (2) Revenues from Insurance (-) Claims Expenses (-) Insurance Selling Expenses.Highlights st 1 quarter 2019 Recurring Net Income Recurring ROE Credit ¹ NPL 90 days Consolidated Consolidated Consolidated Consolidated 7.7 % 7.1 % 140 bps 10 bps R$647.1 bn 1Q19 vs. 1Q18 R$6.9 bn 23.6% 3.0% 1Q19 vs. 1Q18 1Q19 vs. 1Q18 1Q19 vs. 1Q18 Brazil Brazil Brazil Brazil 6.5 % 4.6 % 110 bps 0.0 bp R$480.4 bn R$6.5 bn 1Q19 vs. 1Q18 1Q19 vs.1Q18 24.8% 1Q19 vs. 1Q18 3.7% 1Q19 vs. 1Q18 6.4 6.4 6.5 6.5 6.9 22.2 21.6 21.3 21.8 23.6 601.1 623.3 636.4 636.9 647.1 3.1 2.8 2.9 2.9 3.0 1Q18 2Q18 3Q18 4Q18 1Q19 1Q18 2Q18 3Q18 4Q18 1Q19 1Q18 2Q18 3Q18 4Q18 1Q19 1Q18 2Q18 3Q18 4Q18 1Q19 Financial Margin with Clients Commission, Fees and Insurance Results ² Cost of Credit Non-Interest Expenses Consolidated Consolidated Consolidated Consolidated 1.0 % 7.6 % 0.4 % 4.1 % R$10.2 bn R$16.4 bn 1Q19 vs. 1Q18 1Q19 vs. 1Q18 R$3.8 bn 1Q19 vs. 1Q18 R$12.1 bn 1Q19 vs. 1Q18 Brazil Brazil Brazil Brazil 0.3 % 2.1 % 4.1 % 6.3 % 1Q19 vs. 1Q18 R$9.5 bn 1Q19 vs. 1Q18 1Q19 vs. 1Q18 1Q19 vs. 1Q18 R$14.7 bn R$3.4 bn R$10.5 bn 15.3 16.0 16.2 16.2 16.4 10.1 10.4 10.2 10.8 10.2 3.8 3.6 3.3 3.4 3.8 11.7 12.3 12.6 12.8 12.1 1Q18 2Q18 3Q18 4Q18 1Q19 1Q18 2Q18 3Q18 4Q18 1Q19 1Q18 2Q18 3Q18 4Q18 1Q19 1Q18 2Q18 3Q18 4Q18 1Q19 2 (1) Total with Financial Guarantees provided and Corporate Securities; (2) Revenues from Insurance (-) Claims Expenses (-) Insurance Selling Expenses.

Recurring Net Income and Value Creation 23.6% 22.2% 21.9% 21.8% 21.6% 21.3% ROE Average Cost of Capital 14.5% 14.5% 14.0% 13.5% 13.5% 13.5% Recurring Net Income 6.9 6.5 6.5 6.4 6.4 6.3 Value Creation 2.0 2.9 2.2 2.0 2.5 2.5 Cost of Capital 4.5 4.3 4.3 4.0 3.9 3.9 4Q17 1Q18 2Q18 3Q18 4Q18 1Q19 3 In R$ billionRecurring Net Income and Value Creation 23.6% 22.2% 21.9% 21.8% 21.6% 21.3% ROE Average Cost of Capital 14.5% 14.5% 14.0% 13.5% 13.5% 13.5% Recurring Net Income 6.9 6.5 6.5 6.4 6.4 6.3 Value Creation 2.0 2.9 2.2 2.0 2.5 2.5 Cost of Capital 4.5 4.3 4.3 4.0 3.9 3.9 4Q17 1Q18 2Q18 3Q18 4Q18 1Q19 3 In R$ billion

Credit by Client profile or Product Credit origination¹ 1Q19 vs. 1Q18 In R$ billions, end of period 1Q19 4Q18 D 1Q18 D Total Individuals 2 15.6 211.3 2.0% 1 91.4 12.7% Brazil ² 21% Credit Card Loans 76.4 7 7.5 -1.3% 6 5.0 17.6% Personal Loans 3 1.1 2 9.2 6.5% 27.4 13.7% Individuals Payroll Loans 48.6 46 .7 4.2% 44.7 8.8% 22% Vehicle Loans 1 6.6 15.9 4.1% 1 4.3 15.7% Very Small, Mortgage Loans 42.9 42.0 1.9% 40 .0 7.2% Small and 26% Very Small, Small and Middle Market Loans 74.1 70 .8 4.7% 63.0 17.6% Middle Market Individuals + Very Small, Small and Middle Market Loans 2 89.7 282.1 2.7% 254.4 13.9% Corporate Loans 190.7 191.6 -0.5% 196.7 -3.1% Corporate 18% Credit Operations 152.6 1 53.3 -0.4% 162.0 -5.8% Corporate Securities 3 8.0 3 8.3 -0.8% 34.7 9.6% 3 Private securities issuance Latin America 1 66.7 1 63.2 2.1% 1 50.0 11.1% 1Q19 st 1 place in Total with Financial Guarantees provided and Corporate Securities 6 47.1 636.9 1.6% 601.1 7.7% the ANBIMA R$6.7 bn ranking Note: Does not consider origination of Credit Card, Overdraft, Debt Renegotiation and other revolving credits. (1) Average origination per working day in the period, except for private securities issuance. (2) Does not include private securities issuance. (3) Source: ANBIMA (Brazilian Financial and Capital Markets Association). Considers total volume of fixed income and hybrid private securities issuance arranged by Itaú Unibanco on the local market (includes distributed volumes). 4Credit by Client profile or Product Credit origination¹ 1Q19 vs. 1Q18 In R$ billions, end of period 1Q19 4Q18 D 1Q18 D Total Individuals 2 15.6 211.3 2.0% 1 91.4 12.7% Brazil ² 21% Credit Card Loans 76.4 7 7.5 -1.3% 6 5.0 17.6% Personal Loans 3 1.1 2 9.2 6.5% 27.4 13.7% Individuals Payroll Loans 48.6 46 .7 4.2% 44.7 8.8% 22% Vehicle Loans 1 6.6 15.9 4.1% 1 4.3 15.7% Very Small, Mortgage Loans 42.9 42.0 1.9% 40 .0 7.2% Small and 26% Very Small, Small and Middle Market Loans 74.1 70 .8 4.7% 63.0 17.6% Middle Market Individuals + Very Small, Small and Middle Market Loans 2 89.7 282.1 2.7% 254.4 13.9% Corporate Loans 190.7 191.6 -0.5% 196.7 -3.1% Corporate 18% Credit Operations 152.6 1 53.3 -0.4% 162.0 -5.8% Corporate Securities 3 8.0 3 8.3 -0.8% 34.7 9.6% 3 Private securities issuance Latin America 1 66.7 1 63.2 2.1% 1 50.0 11.1% 1Q19 st 1 place in Total with Financial Guarantees provided and Corporate Securities 6 47.1 636.9 1.6% 601.1 7.7% the ANBIMA R$6.7 bn ranking Note: Does not consider origination of Credit Card, Overdraft, Debt Renegotiation and other revolving credits. (1) Average origination per working day in the period, except for private securities issuance. (2) Does not include private securities issuance. (3) Source: ANBIMA (Brazilian Financial and Capital Markets Association). Considers total volume of fixed income and hybrid private securities issuance arranged by Itaú Unibanco on the local market (includes distributed volumes). 4
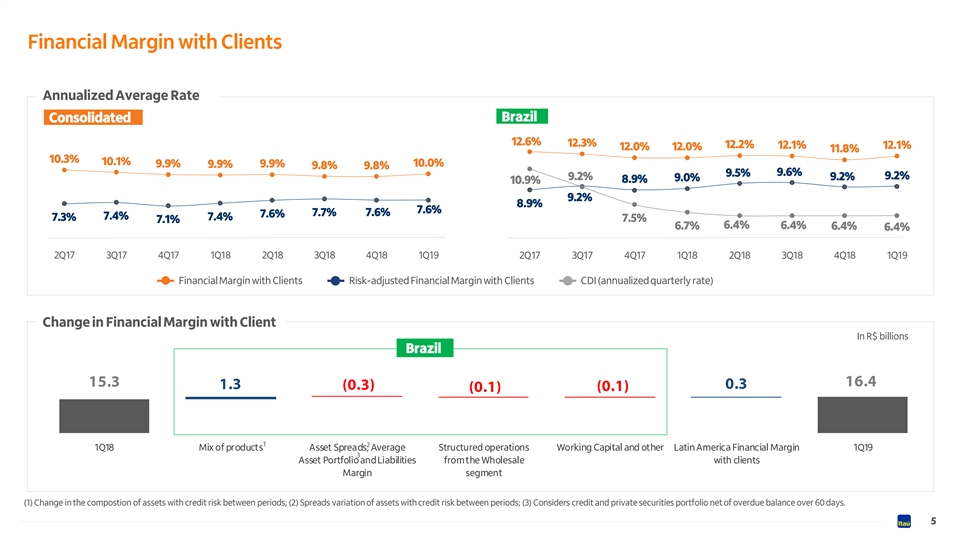
Financial Margin with Clients Annualized Average Rate Brazil Consolidated 12.6% 12.3% 12.2% 12.1% 12.1% 12.0% 12.0% 11.8% 10.3% 10.1% 9.9% 9.9% 10.0% 9.9% 9.8% 9.8% 9.6% 9.5% 9.2% 9.2% 9.2% 9.0% 8.9% 10.9% 9.2% 8.9% 7.6% 7.7% 7.6% 7.6% 7.4% 7.4% 7.3% 7.5% 7.1% 6.7% 6.4% 6.4% 6.4% 6.4% 2Q17 3Q17 4Q17 1Q18 2Q18 3Q18 4Q18 1Q19 2Q17 3Q17 4Q17 1Q18 2Q18 3Q18 4Q18 1Q19 Financial Margin with Clients Risk-adjusted Financial Margin with Clients CDI (annualized quarterly rate) Change in Financial Margin with Client In R$ billions Brazil 1 2 1Q18 Mix of products Asset Spreads, Average Structured operations Working Capital and other Latin America Financial Margin 1Q19 3 Asset Portfolio and Liabilities from the Wholesale with clients Margin segment (1) Change in the compostion of assets with credit risk between periods; (2) Spreads variation of assets with credit risk between periods; (3) Considers credit and private securities portfolio net of overdue balance over 60 days. 5Financial Margin with Clients Annualized Average Rate Brazil Consolidated 12.6% 12.3% 12.2% 12.1% 12.1% 12.0% 12.0% 11.8% 10.3% 10.1% 9.9% 9.9% 10.0% 9.9% 9.8% 9.8% 9.6% 9.5% 9.2% 9.2% 9.2% 9.0% 8.9% 10.9% 9.2% 8.9% 7.6% 7.7% 7.6% 7.6% 7.4% 7.4% 7.3% 7.5% 7.1% 6.7% 6.4% 6.4% 6.4% 6.4% 2Q17 3Q17 4Q17 1Q18 2Q18 3Q18 4Q18 1Q19 2Q17 3Q17 4Q17 1Q18 2Q18 3Q18 4Q18 1Q19 Financial Margin with Clients Risk-adjusted Financial Margin with Clients CDI (annualized quarterly rate) Change in Financial Margin with Client In R$ billions Brazil 1 2 1Q18 Mix of products Asset Spreads, Average Structured operations Working Capital and other Latin America Financial Margin 1Q19 3 Asset Portfolio and Liabilities from the Wholesale with clients Margin segment (1) Change in the compostion of assets with credit risk between periods; (2) Spreads variation of assets with credit risk between periods; (3) Considers credit and private securities portfolio net of overdue balance over 60 days. 5

Financial Margin with the Market 1.8 1.8 1.7 In R$ billions 1.6 1.5 1.4 1.4 1.3 1.2 1.9 1.7 1.6 1.4 1.4 1.3 1.3 1.1 0.1 1.2 0.2 1.7 1.3 1.3 0.9 1.2 1.1 0.9 1.0 0.5 0.5 0.2 0.2 0.5 0.2 0.3 0.3 0.3 0.3 1Q17 2Q17 3Q17 4Q17 1Q18 2Q18 3Q18 4Q18 1Q19 Financial Margin with Sale of shares - B3 Financial Margin with 1 year moving average of 1 2 the Market – Brazil the Market– Latin America Financial Margin with the Market (1) Includes units abroad ex-Latin America; (2) Excludes Brazil. 6Financial Margin with the Market 1.8 1.8 1.7 In R$ billions 1.6 1.5 1.4 1.4 1.3 1.2 1.9 1.7 1.6 1.4 1.4 1.3 1.3 1.1 0.1 1.2 0.2 1.7 1.3 1.3 0.9 1.2 1.1 0.9 1.0 0.5 0.5 0.2 0.2 0.5 0.2 0.3 0.3 0.3 0.3 1Q17 2Q17 3Q17 4Q17 1Q18 2Q18 3Q18 4Q18 1Q19 Financial Margin with Sale of shares - B3 Financial Margin with 1 year moving average of 1 2 the Market – Brazil the Market– Latin America Financial Margin with the Market (1) Includes units abroad ex-Latin America; (2) Excludes Brazil. 6
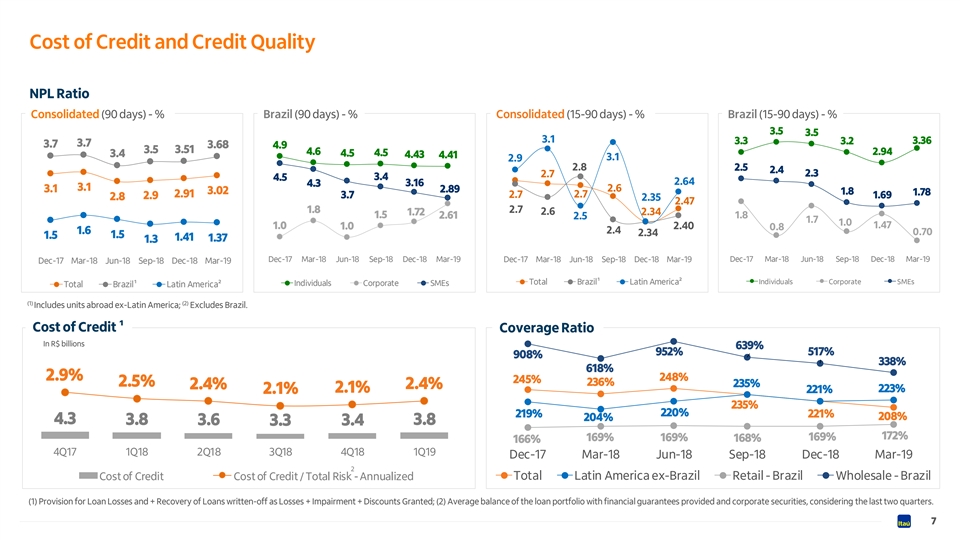
Cost of Credit and Credit Quality NPL Ratio Consolidated (90 days) - % Brazil (90 days) - % Consolidated (15-90 days) - % Brazil (15-90 days) - % 3.5 3.5 3.1 3.3 3.2 3.36 3.7 3.7 3.68 4.9 3.5 3.51 4.6 2.94 4.5 3.4 4.5 4.43 4.41 3.1 2.9 2.8 2.5 2.4 2.7 2.3 3.4 4.5 2.64 3.16 4.3 3.1 3.1 2.89 2.6 3.02 1.8 1.78 2.91 3.7 2.7 2.7 1.69 2.9 2.8 2.35 2.47 1.8 2.7 1.72 2.6 2.34 1.5 1.8 2.61 2.5 1.7 1.0 1.47 1.0 1.0 2.40 0.8 1.6 2.4 0.70 2.34 1.5 1.5 1.41 1.37 1.3 Dec-17 Mar-18 Jun-18 Sep-18 Dec-18 Mar-19 Dec-17 Mar-18 Jun-18 Sep-18 Dec-18 Mar-19 Dec-17 Mar-18 Jun-18 Sep-18 Dec-18 Mar-19 Dec-17 Mar-18 Jun-18 Sep-18 Dec-18 Mar-19 Individuals Corporate SMEs Total Brazil¹ Latin America² Individuals Corporate SMEs Total Brazil¹ Latin America² (1) (2) Includes units abroad ex-Latin America; Excludes Brazil. Cost of Credit ¹ Coverage Ratio In R$ billions 639% 952% 517% 908% 338% 618% 2.9% 248% 245% 236% 2.5% 235% 2.4% 2.4% 223% 2.1% 221% 2.1% 235% 220% 219% 221% 208% 204% 4.3 3.8 3.6 3.4 3.8 3.3 172% 169% 169% 169% 168% 166% 4Q17 1Q18 2Q18 3Q18 4Q18 1Q19 Dec-17 Mar-18 Jun-18 Sep-18 Dec-18 Mar-19 2 Cost of Credit Cost of Credit / Total Risk - Annualized Total Latin America ex-Brazil Retail - Brazil Wholesale - Brazil (1) Provision for Loan Losses and + Recovery of Loans written-off as Losses + Impairment + Discounts Granted; (2) Average balance of the loan portfolio with financial guarantees provided and corporate securities, considering the last two quarters. 7Cost of Credit and Credit Quality NPL Ratio Consolidated (90 days) - % Brazil (90 days) - % Consolidated (15-90 days) - % Brazil (15-90 days) - % 3.5 3.5 3.1 3.3 3.2 3.36 3.7 3.7 3.68 4.9 3.5 3.51 4.6 2.94 4.5 3.4 4.5 4.43 4.41 3.1 2.9 2.8 2.5 2.4 2.7 2.3 3.4 4.5 2.64 3.16 4.3 3.1 3.1 2.89 2.6 3.02 1.8 1.78 2.91 3.7 2.7 2.7 1.69 2.9 2.8 2.35 2.47 1.8 2.7 1.72 2.6 2.34 1.5 1.8 2.61 2.5 1.7 1.0 1.47 1.0 1.0 2.40 0.8 1.6 2.4 0.70 2.34 1.5 1.5 1.41 1.37 1.3 Dec-17 Mar-18 Jun-18 Sep-18 Dec-18 Mar-19 Dec-17 Mar-18 Jun-18 Sep-18 Dec-18 Mar-19 Dec-17 Mar-18 Jun-18 Sep-18 Dec-18 Mar-19 Dec-17 Mar-18 Jun-18 Sep-18 Dec-18 Mar-19 Individuals Corporate SMEs Total Brazil¹ Latin America² Individuals Corporate SMEs Total Brazil¹ Latin America² (1) (2) Includes units abroad ex-Latin America; Excludes Brazil. Cost of Credit ¹ Coverage Ratio In R$ billions 639% 952% 517% 908% 338% 618% 2.9% 248% 245% 236% 2.5% 235% 2.4% 2.4% 223% 2.1% 221% 2.1% 235% 220% 219% 221% 208% 204% 4.3 3.8 3.6 3.4 3.8 3.3 172% 169% 169% 169% 168% 166% 4Q17 1Q18 2Q18 3Q18 4Q18 1Q19 Dec-17 Mar-18 Jun-18 Sep-18 Dec-18 Mar-19 2 Cost of Credit Cost of Credit / Total Risk - Annualized Total Latin America ex-Brazil Retail - Brazil Wholesale - Brazil (1) Provision for Loan Losses and + Recovery of Loans written-off as Losses + Impairment + Discounts Granted; (2) Average balance of the loan portfolio with financial guarantees provided and corporate securities, considering the last two quarters. 7

Commissions and Fees and Result From Insurance Operations Current Account Holders Increase in the number of In R$ billions 1Q19 4Q1 3T 8 18 D 1Q18 D Individuals account 10.4% holders compared to 1Q18. Credit and Debit Cards 3.3 3 .5 -5.9% 3.3 -1.7% Current Account Services 1.8 1 .9 -0.4% 1.8 1.5% Assets Under Administration ³ Asset Management ¹ 1.1 1.2 -10.5% 1.0 5.2% In R$ billions Credit Operations and Guarantees Provided 0.6 0.6 -2.7% 0.6 -7.6% Collection Services 1,135 0.5 0.5 -2.8% 0.5 2.1% 1,002 Advisory Services and Brokerage 13.2% 0.4 0.6 -33.1% 0 .3 16.2% Other Mar-18 Mar-19 0.3 0.2 8.6% 0 .3 -2.3% Latin America (ex-Brazil) 0.7 0.8 -4.7% 0.7 9.2% Transactions with Cards - Value Commissions and Fees 8.6 9.2 -6.2% 8.5 1.1% In R$ billions Result from Insurance Operations ² 1.6 1 .6 1.1% 1.6 0.3% Issuer Acquiring: Total 10.2 10.8 -5.1% 10.1 1.0% 13.5% 14.2% 120 113 105 99 1Q18 1Q19 1Q18 1Q19 (1) Includes fund management fees and consortia management fees; (2) Result from Insurance includes the Revenues from Insurance, Pension Plan and Premium Bonds Operations net of Retained Claims and Selling Expenses; (3) Does not include Latin America (ex-Brazil) 8Commissions and Fees and Result From Insurance Operations Current Account Holders Increase in the number of In R$ billions 1Q19 4Q1 3T 8 18 D 1Q18 D Individuals account 10.4% holders compared to 1Q18. Credit and Debit Cards 3.3 3 .5 -5.9% 3.3 -1.7% Current Account Services 1.8 1 .9 -0.4% 1.8 1.5% Assets Under Administration ³ Asset Management ¹ 1.1 1.2 -10.5% 1.0 5.2% In R$ billions Credit Operations and Guarantees Provided 0.6 0.6 -2.7% 0.6 -7.6% Collection Services 1,135 0.5 0.5 -2.8% 0.5 2.1% 1,002 Advisory Services and Brokerage 13.2% 0.4 0.6 -33.1% 0 .3 16.2% Other Mar-18 Mar-19 0.3 0.2 8.6% 0 .3 -2.3% Latin America (ex-Brazil) 0.7 0.8 -4.7% 0.7 9.2% Transactions with Cards - Value Commissions and Fees 8.6 9.2 -6.2% 8.5 1.1% In R$ billions Result from Insurance Operations ² 1.6 1 .6 1.1% 1.6 0.3% Issuer Acquiring: Total 10.2 10.8 -5.1% 10.1 1.0% 13.5% 14.2% 120 113 105 99 1Q18 1Q19 1Q18 1Q19 (1) Includes fund management fees and consortia management fees; (2) Result from Insurance includes the Revenues from Insurance, Pension Plan and Premium Bonds Operations net of Retained Claims and Selling Expenses; (3) Does not include Latin America (ex-Brazil) 8
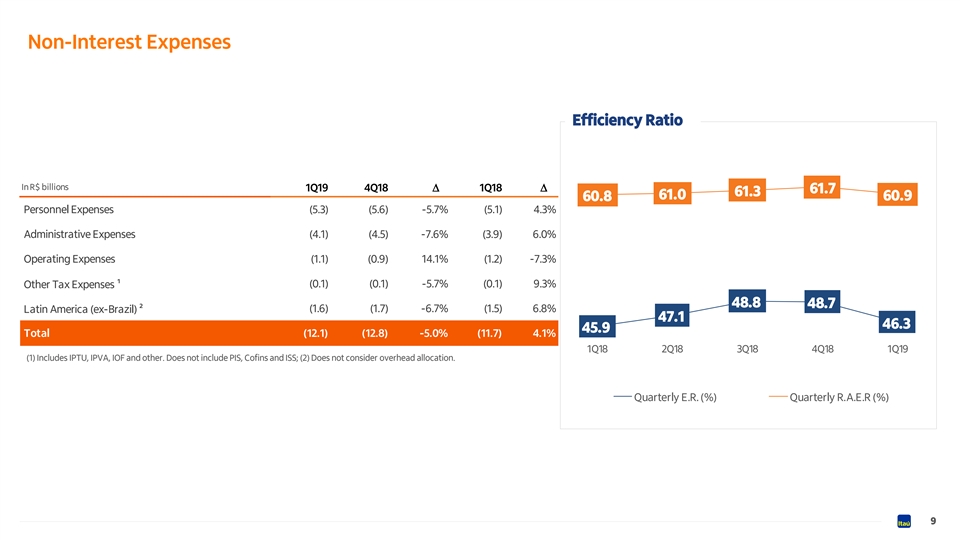
Non-Interest Expenses Efficiency Ratio In R$ billions 1Q19 4Q18 D 1Q18 D 61.7 61.3 61.0 60.9 60.8 Personnel Expenses ( 5.3) ( 5.6) -5.7% (5.1) 4.3% Administrative Expenses ( 4.1) (4.5) -7.6% (3.9) 6.0% Operating Expenses (1.1) (0.9) 14.1% ( 1.2) -7.3% (0.1) (0.1) -5.7% (0.1) 9.3% Other Tax Expenses ¹ 48.8 48.7 (1.6) ( 1.7) -6.7% ( 1.5) 6.8% Latin America (ex-Brazil) ² 47.1 46.3 45.9 Total (12.1) (12.8) -5.0% ( 11.7) 4.1% 1Q18 2Q18 3Q18 4Q18 1Q19 (1) Includes IPTU, IPVA, IOF and other. Does not include PIS, Cofins and ISS; (2) Does not consider overhead allocation. Quarterly E.R. (%) Quarterly R.A.E.R (%) 9Non-Interest Expenses Efficiency Ratio In R$ billions 1Q19 4Q18 D 1Q18 D 61.7 61.3 61.0 60.9 60.8 Personnel Expenses ( 5.3) ( 5.6) -5.7% (5.1) 4.3% Administrative Expenses ( 4.1) (4.5) -7.6% (3.9) 6.0% Operating Expenses (1.1) (0.9) 14.1% ( 1.2) -7.3% (0.1) (0.1) -5.7% (0.1) 9.3% Other Tax Expenses ¹ 48.8 48.7 (1.6) ( 1.7) -6.7% ( 1.5) 6.8% Latin America (ex-Brazil) ² 47.1 46.3 45.9 Total (12.1) (12.8) -5.0% ( 11.7) 4.1% 1Q18 2Q18 3Q18 4Q18 1Q19 (1) Includes IPTU, IPVA, IOF and other. Does not include PIS, Cofins and ISS; (2) Does not consider overhead allocation. Quarterly E.R. (%) Quarterly R.A.E.R (%) 9
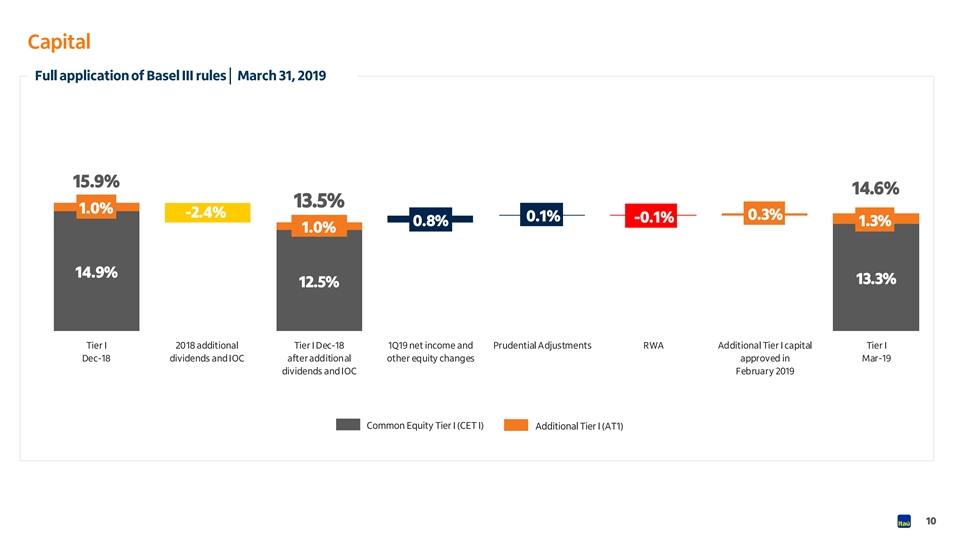
Capital Full application of Basel III rules│ March 31, 2019 15.9% 14.6% 13.5% 1.0% -2.4% 0.3% 0.1% -0.1% 0.8% 1.3% 1.0% 14.9% 13.3% 12.5% Tier I 2018 additional Tier I Dec-18 1Q19 net income and Prudential Adjustments RWA Additional Tier I capital Tier I Dec-18 dividends and IOC after additional other equity changes approved in Mar-19 dividends and IOC February 2019 Common Equity Tier I (CET I) Additional Tier I (AT1) 10Capital Full application of Basel III rules│ March 31, 2019 15.9% 14.6% 13.5% 1.0% -2.4% 0.3% 0.1% -0.1% 0.8% 1.3% 1.0% 14.9% 13.3% 12.5% Tier I 2018 additional Tier I Dec-18 1Q19 net income and Prudential Adjustments RWA Additional Tier I capital Tier I Dec-18 dividends and IOC after additional other equity changes approved in Mar-19 dividends and IOC February 2019 Common Equity Tier I (CET I) Additional Tier I (AT1) 10

Unprecedented initiative in the acquiring business Rede ended the prepayment rate on credit card transactions without installments • Effective May 2, 2109 • Credit card transactions without installments • Using any POS machine from • With a bank domicile in Itaú Unibanco • And annual sales up to R$30 million Will be received in 2 days with zero cost of anticipation We want Stimulate the development Pursue even higher Influence other of entrepreneurs, micro and levels of customer movements in the small companies satisfaction sector 11Unprecedented initiative in the acquiring business Rede ended the prepayment rate on credit card transactions without installments • Effective May 2, 2109 • Credit card transactions without installments • Using any POS machine from • With a bank domicile in Itaú Unibanco • And annual sales up to R$30 million Will be received in 2 days with zero cost of anticipation We want Stimulate the development Pursue even higher Influence other of entrepreneurs, micro and levels of customer movements in the small companies satisfaction sector 11
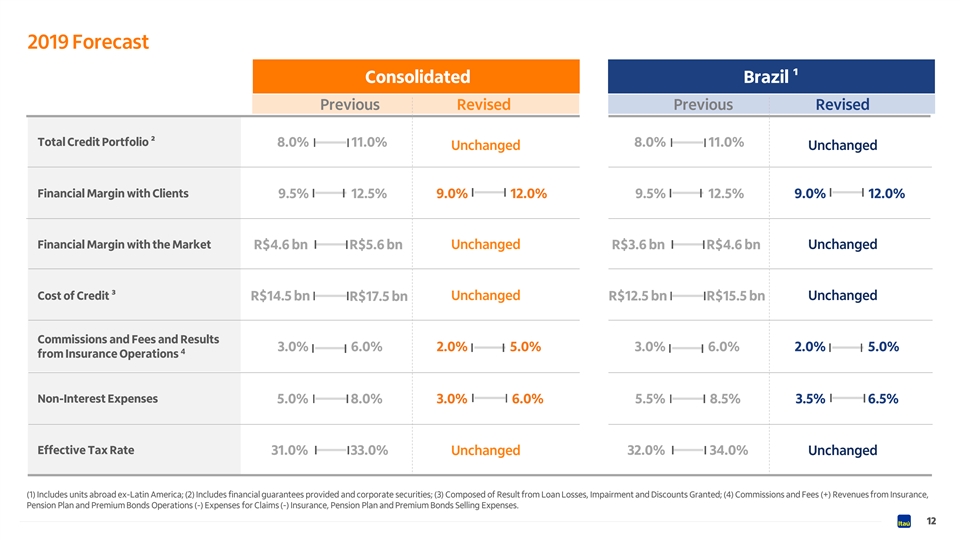
2019 Forecast Consolidated Brazil ¹ Previous Revised Previous Revised Total Credit Portfolio ² 8.0% 11.0% 8.0% 11.0% Unchanged Unchanged Financial Margin with Clients 9.5% 12.5% 9.0% 12.0% 9.5% 12.5% 9.0% 12.0% Financial Margin with the Market R$4.6 bn R$5.6 bn Unchanged R$3.6 bn R$4.6 bn Unchanged Cost of Credit ³ Unchanged Unchanged R$14.5 bn R$17.5 bn R$12.5 bn R$15.5 bn Commissions and Fees and Results 3.0% 6.0% 2.0% 5.0% 3.0% 6.0% 2.0% 5.0% 4 from Insurance Operations Non-Interest Expenses 5.0% 8.0% 3.0% 6.0% 5.5% 8.5% 3.5% 6.5% Effective Tax Rate 31.0% 33.0% Unchanged 32.0% 34.0% Unchanged (1) Includes units abroad ex-Latin America; (2) Includes financial guarantees provided and corporate securities; (3) Composed of Result from Loan Losses, Impairment and Discounts Granted; (4) Commissions and Fees (+) Revenues from Insurance, Pension Plan and Premium Bonds Operations (-) Expenses for Claims (-) Insurance, Pension Plan and Premium Bonds Selling Expenses. 122019 Forecast Consolidated Brazil ¹ Previous Revised Previous Revised Total Credit Portfolio ² 8.0% 11.0% 8.0% 11.0% Unchanged Unchanged Financial Margin with Clients 9.5% 12.5% 9.0% 12.0% 9.5% 12.5% 9.0% 12.0% Financial Margin with the Market R$4.6 bn R$5.6 bn Unchanged R$3.6 bn R$4.6 bn Unchanged Cost of Credit ³ Unchanged Unchanged R$14.5 bn R$17.5 bn R$12.5 bn R$15.5 bn Commissions and Fees and Results 3.0% 6.0% 2.0% 5.0% 3.0% 6.0% 2.0% 5.0% 4 from Insurance Operations Non-Interest Expenses 5.0% 8.0% 3.0% 6.0% 5.5% 8.5% 3.5% 6.5% Effective Tax Rate 31.0% 33.0% Unchanged 32.0% 34.0% Unchanged (1) Includes units abroad ex-Latin America; (2) Includes financial guarantees provided and corporate securities; (3) Composed of Result from Loan Losses, Impairment and Discounts Granted; (4) Commissions and Fees (+) Revenues from Insurance, Pension Plan and Premium Bonds Operations (-) Expenses for Claims (-) Insurance, Pension Plan and Premium Bonds Selling Expenses. 12

Appendix 13Appendix 13
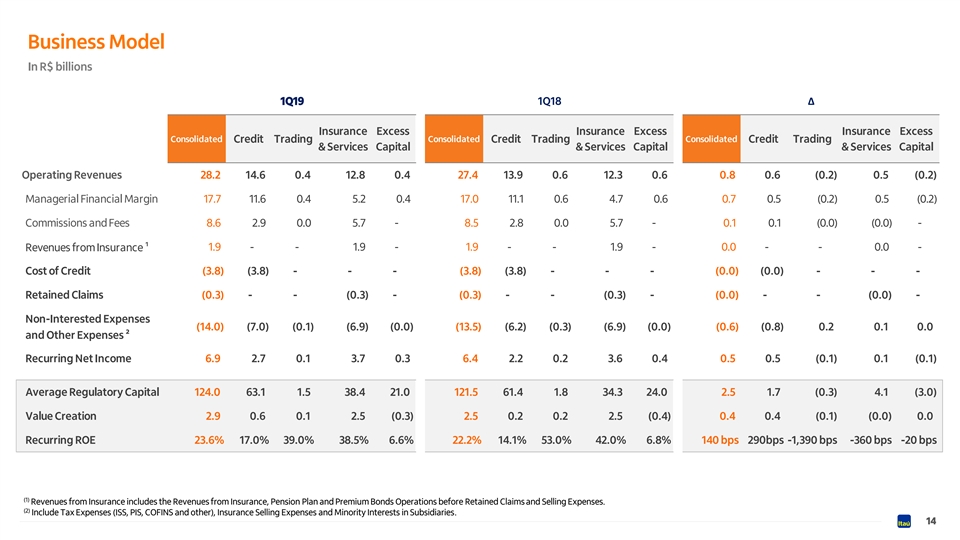
Business Model In R$ billions 1Q19 1Q18Δ Insurance Excess Insurance Excess Insurance Excess Consolidated Consolidated Consolidated Credit Trading Credit Trading Credit Trading & Services Capital & Services Capital & Services Capital Operating Revenues 2 8.2 14.6 0 .4 1 2.8 0 .4 2 7.4 1 3.9 0 .6 12.3 0.6 0.8 0.6 (0.2) 0.5 (0.2) Managerial Financial Margin 1 7.7 1 1.6 0 .4 5.2 0 .4 17.0 1 1.1 0.6 4.7 0 .6 0 .7 0.5 (0.2) 0 .5 ( 0.2) Commissions and Fees 8.6 2.9 0.0 5.7 - 8 .5 2.8 0.0 5.7 - 0.1 0.1 (0.0) (0.0) - Revenues from Insurance ¹ 1.9 - - 1.9 - 1.9 - - 1.9 - 0.0 - - 0.0 - Cost of Credit ( 3.8) (3.8) - - - ( 3.8) (3.8) - - - (0.0) (0.0) - - - Retained Claims (0.3) - - (0.3) - (0.3) - - (0.3) - ( 0.0) - - (0.0) - Non-Interested Expenses (14.0) (7.0) (0.1) (6.9) (0.0) (13.5) (6.2) (0.3) (6.9) (0.0) (0.6) (0.8) 0.2 0.1 0.0 and Other Expenses ² Recurring Net Income 6.9 2 .7 0.1 3 .7 0 .3 6.4 2 .2 0.2 3 .6 0 .4 0.5 0 .5 ( 0.1) 0.1 (0.1) Average Regulatory Capital 124.0 63 .1 1.5 38.4 21.0 121.5 61.4 1.8 34.3 24.0 2.5 1.7 ( 0.3) 4.1 (3.0) Value Creation 2.9 0 .6 0.1 2.5 (0.3) 2.5 0.2 0.2 2.5 ( 0.4) 0 .4 0 .4 (0.1) ( 0.0) 0.0 Recurring ROE 23.6% 17.0% 39.0% 38.5% 6.6% 22.2% 14.1% 53.0% 42.0% 6.8% 140 bps 290bps -1,390 bps -360 bps -20 bps (1) Revenues from Insurance includes the Revenues from Insurance, Pension Plan and Premium Bonds Operations before Retained Claims and Selling Expenses. (2) Include Tax Expenses (ISS, PIS, COFINS and other), Insurance Selling Expenses and Minority Interests in Subsidiaries. 14Business Model In R$ billions 1Q19 1Q18Δ Insurance Excess Insurance Excess Insurance Excess Consolidated Consolidated Consolidated Credit Trading Credit Trading Credit Trading & Services Capital & Services Capital & Services Capital Operating Revenues 2 8.2 14.6 0 .4 1 2.8 0 .4 2 7.4 1 3.9 0 .6 12.3 0.6 0.8 0.6 (0.2) 0.5 (0.2) Managerial Financial Margin 1 7.7 1 1.6 0 .4 5.2 0 .4 17.0 1 1.1 0.6 4.7 0 .6 0 .7 0.5 (0.2) 0 .5 ( 0.2) Commissions and Fees 8.6 2.9 0.0 5.7 - 8 .5 2.8 0.0 5.7 - 0.1 0.1 (0.0) (0.0) - Revenues from Insurance ¹ 1.9 - - 1.9 - 1.9 - - 1.9 - 0.0 - - 0.0 - Cost of Credit ( 3.8) (3.8) - - - ( 3.8) (3.8) - - - (0.0) (0.0) - - - Retained Claims (0.3) - - (0.3) - (0.3) - - (0.3) - ( 0.0) - - (0.0) - Non-Interested Expenses (14.0) (7.0) (0.1) (6.9) (0.0) (13.5) (6.2) (0.3) (6.9) (0.0) (0.6) (0.8) 0.2 0.1 0.0 and Other Expenses ² Recurring Net Income 6.9 2 .7 0.1 3 .7 0 .3 6.4 2 .2 0.2 3 .6 0 .4 0.5 0 .5 ( 0.1) 0.1 (0.1) Average Regulatory Capital 124.0 63 .1 1.5 38.4 21.0 121.5 61.4 1.8 34.3 24.0 2.5 1.7 ( 0.3) 4.1 (3.0) Value Creation 2.9 0 .6 0.1 2.5 (0.3) 2.5 0.2 0.2 2.5 ( 0.4) 0 .4 0 .4 (0.1) ( 0.0) 0.0 Recurring ROE 23.6% 17.0% 39.0% 38.5% 6.6% 22.2% 14.1% 53.0% 42.0% 6.8% 140 bps 290bps -1,390 bps -360 bps -20 bps (1) Revenues from Insurance includes the Revenues from Insurance, Pension Plan and Premium Bonds Operations before Retained Claims and Selling Expenses. (2) Include Tax Expenses (ISS, PIS, COFINS and other), Insurance Selling Expenses and Minority Interests in Subsidiaries. 14

Results In R$ Billions 1Q19 4Q18 Δ 1Q18 Δ Operating Revenues 28.2 28.5 -0.9% 27.4 2.8% Managerial Financial Margin 17.7 17.4 1.6% 17.0 3.9% Financial Margin with Clients 16.4 1 6.2 1.2% 15.3 7.6% Financial Margin with the Market 1.2 1.1 8.2% 1 .7 -28.4% Commissions and Fees 8.6 9 .2 -6.2% 8.5 1.1% 1.9 1.9 1.1% 1.9 1.0% Revenues from Insurance ¹ Cost of Credit (3.8) (3.4) 11.4% (3.8) 0.4% Provision for Loan Losses (4.2) (3.8) 10.8% (4.1) 2.3% Impairment (0.0) (0.3) -88.9% ( 0.2) -84.1% Discounts Granted (0.3) ( 0.3) -1.2% (0.3) 8.4% Recovery of Loans Written Off as Losses 0 .7 1.0 -23.0% 0.8 -6.9% Retained Claims (0.3) (0.3) 1.9% (0.3) 7.1% Other Operating Expenses (13.8) (14.7) -5.8% ( 13.4) 3.4% Non-Interest Expenses (12.1) (12.8) -5.0% (11.7) 4.1% (1.7) (1.9) -10.7% (1.7) -0.8% Tax Expenses and Other ² Income before Tax and Minority Interests 10.3 10.1 1.9% 10.0 2.9% Income Tax and Social Contribution (3.2) (3.4) -4.9% (3.5) -7.9% Minority Interests in Subsidiaries (0.2) (0.2) -19.2% (0.1) 106.7% Recurring Net Income 6 .9 6 .5 6.2% 6.4 7.1% (1) Revenues from Insurance includes the Revenues from Insurance, Pension Plan and Premium Bonds Operations before Retained Claims and Selling Expenses. (2) Include Tax Expenses (ISS, PIS, COFINS and other) and Insurance Selling Expenses. 15Results In R$ Billions 1Q19 4Q18 Δ 1Q18 Δ Operating Revenues 28.2 28.5 -0.9% 27.4 2.8% Managerial Financial Margin 17.7 17.4 1.6% 17.0 3.9% Financial Margin with Clients 16.4 1 6.2 1.2% 15.3 7.6% Financial Margin with the Market 1.2 1.1 8.2% 1 .7 -28.4% Commissions and Fees 8.6 9 .2 -6.2% 8.5 1.1% 1.9 1.9 1.1% 1.9 1.0% Revenues from Insurance ¹ Cost of Credit (3.8) (3.4) 11.4% (3.8) 0.4% Provision for Loan Losses (4.2) (3.8) 10.8% (4.1) 2.3% Impairment (0.0) (0.3) -88.9% ( 0.2) -84.1% Discounts Granted (0.3) ( 0.3) -1.2% (0.3) 8.4% Recovery of Loans Written Off as Losses 0 .7 1.0 -23.0% 0.8 -6.9% Retained Claims (0.3) (0.3) 1.9% (0.3) 7.1% Other Operating Expenses (13.8) (14.7) -5.8% ( 13.4) 3.4% Non-Interest Expenses (12.1) (12.8) -5.0% (11.7) 4.1% (1.7) (1.9) -10.7% (1.7) -0.8% Tax Expenses and Other ² Income before Tax and Minority Interests 10.3 10.1 1.9% 10.0 2.9% Income Tax and Social Contribution (3.2) (3.4) -4.9% (3.5) -7.9% Minority Interests in Subsidiaries (0.2) (0.2) -19.2% (0.1) 106.7% Recurring Net Income 6 .9 6 .5 6.2% 6.4 7.1% (1) Revenues from Insurance includes the Revenues from Insurance, Pension Plan and Premium Bonds Operations before Retained Claims and Selling Expenses. (2) Include Tax Expenses (ISS, PIS, COFINS and other) and Insurance Selling Expenses. 15

Payout Practice Maintain the practice of paying dividends and interest on own capital at 35% of net income (however we excluded the maximum limit previously determined at 45%). Set forth, through the Board of Directors, the total amount to be distributed each year considering: our capitalization level, the minimum Tier 1 Capital of 13.5% (this ratio must be composed of at least 12% of Core Capital), the profitability in the year, expectations of capital The percentage to be distributed may change every year based on the company’s profitability and capital demands, always considering the minimum set forth in the Bylaws. use and changes in tax legislation. Payout and Shares Buyback Dividend Yield ¹ Dividends and IOC ² 89.2% 22.9 83.0% In R$ billions 2.0% 12.4% 49.3% Reserved in Equity 16.4 Shares Buyback 7.5% 4.3% 87.2% 70.6% Payout Paid and provisioned 6.0 45.0% in 2018 Shares Buyback 0.5 2018 2016 2017 2018 (1) Considers the payout of 89.2% and the average daily closing price in 2018; (2) Dividends and IOC net of taxes. 16Payout Practice Maintain the practice of paying dividends and interest on own capital at 35% of net income (however we excluded the maximum limit previously determined at 45%). Set forth, through the Board of Directors, the total amount to be distributed each year considering: our capitalization level, the minimum Tier 1 Capital of 13.5% (this ratio must be composed of at least 12% of Core Capital), the profitability in the year, expectations of capital The percentage to be distributed may change every year based on the company’s profitability and capital demands, always considering the minimum set forth in the Bylaws. use and changes in tax legislation. Payout and Shares Buyback Dividend Yield ¹ Dividends and IOC ² 89.2% 22.9 83.0% In R$ billions 2.0% 12.4% 49.3% Reserved in Equity 16.4 Shares Buyback 7.5% 4.3% 87.2% 70.6% Payout Paid and provisioned 6.0 45.0% in 2018 Shares Buyback 0.5 2018 2016 2017 2018 (1) Considers the payout of 89.2% and the average daily closing price in 2018; (2) Dividends and IOC net of taxes. 16
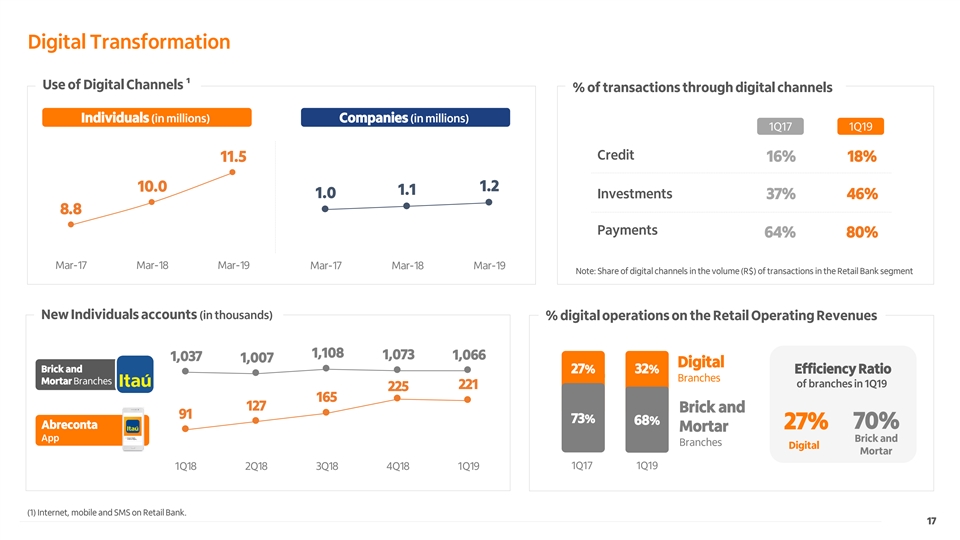
Digital Transformation Use of Digital Channels ¹ % of transactions through digital channels Individuals (in millions) Companies (in millions) 1Q17 1Q19 Credit 11.5 16% 18% 1.2 10.0 1.1 1.0 Investments 37% 46% 8.8 Payments 64% 80% Mar-17 Mar-18 Mar-19 Mar-17 Mar-18 Mar-19 Note: Share of digital channels in the volume (R$) of transactions in the Retail Bank segment New Individuals accounts (in thousands) % digital operations on the Retail Operating Revenues 1,108 1,073 1,066 1,037 1,007 Digital Brick and 27% 32% Efficiency Ratio Branches Mortar Branches of branches in 1Q19 221 225 165 127 Brick and 91 73% 68% Abreconta 27% 70% Mortar App Brick and Branches Digital Mortar 1Q17 1Q19 1Q18 2Q18 3Q18 4Q18 1Q19 (1) Internet, mobile and SMS on Retail Bank. 17Digital Transformation Use of Digital Channels ¹ % of transactions through digital channels Individuals (in millions) Companies (in millions) 1Q17 1Q19 Credit 11.5 16% 18% 1.2 10.0 1.1 1.0 Investments 37% 46% 8.8 Payments 64% 80% Mar-17 Mar-18 Mar-19 Mar-17 Mar-18 Mar-19 Note: Share of digital channels in the volume (R$) of transactions in the Retail Bank segment New Individuals accounts (in thousands) % digital operations on the Retail Operating Revenues 1,108 1,073 1,066 1,037 1,007 Digital Brick and 27% 32% Efficiency Ratio Branches Mortar Branches of branches in 1Q19 221 225 165 127 Brick and 91 73% 68% Abreconta 27% 70% Mortar App Brick and Branches Digital Mortar 1Q17 1Q19 1Q18 2Q18 3Q18 4Q18 1Q19 (1) Internet, mobile and SMS on Retail Bank. 17

Conference Call st 1 quarter 2019 Earnings Review Candido Botelho Bracher President and CEO Milton Maluhy Filho Executive Vice-President, CFO and CRO Alexsandro Broedel Executive Finance Director and Head of Investor Relations Marcos Magalhães Merchant Acquirer Executive Director 18Conference Call st 1 quarter 2019 Earnings Review Candido Botelho Bracher President and CEO Milton Maluhy Filho Executive Vice-President, CFO and CRO Alexsandro Broedel Executive Finance Director and Head of Investor Relations Marcos Magalhães Merchant Acquirer Executive Director 18